VirtuWind Deliverable D1.5: Year 1 project report Deliverable D1.8 ...
AFTER (G.A n°245025) – Deliverable 5.4.2.3 Report on near-market consumer testing of new improved products in Europe for
Group 3
1
African Food Tradition rEvisited by Research
FP7 n°245025
Start date of project: 01/09/2010
Duration: 51 months
Contractual date of delivery: October 2014
Actual date of delivery: January 2015
Work-package contributing to the deliverable: WP5
Organisation name of lead contractor for this deliverable: ESB/NRI
Authors in Baobab and Bissap: M.J.P. Monteiro, A.I.E., Pintado, M. Cisse, A.I. Costa, G. Fliedel, A. Bechoff, I. Maraval, M. Boucher, D. Pallet, K.Tomlins , Pintado, M.M.
This document has been sent to:
* PU: Public; PP: Restricted to other programme participants (including the Commission Services); RE:
Restricted to a group specified by the consortium (including the Commission Services); CO: Confidential,
only for members of the consortium (including the Commission Services)
The coordinator by WP Leader Date: January 2015
To the Commission by the Coordinator Date: January 2015
Deliverable number: D 5.4.2.3
Title of deliverable: Report on near-market consumer testing of new
improved products in Europe for Group 3
Deliverable type (Report, Prototype, Demonstration, Other): Report
Dissemination level (PU, PP, RE, CO)*: PU
The research leading to these results has received
funding from the European Union’s Seventh Framework Programme for research, technological development and
demonstration under grant agreement n° 245-025

AFTER (G.A n°245025) – Deliverable 5.4.2.3 Report on near-market consumer testing of new improved products in Europe for
Group 3
2
Table of Contents
Executive summary ..................................................................................... 3
General approach ........................................................................................ 4
1. Consumer preference study of Baobab reengineering products in
Europe .......................................................................................................... 6
1.1. Summary .................................................................................................................. 6 1.2. Introduction .............................................................................................................. 7 1.3 Material and methods .................................................................................................. 8
1.3.1. Baobab samples and sample preparation ...................................................... 8 1.3.2. Ethical assessment and consent ..................................................................... 9 1.3.3. Participants .................................................................................................. 10 1.3.4. Tasting sessions ............................................................................................ 10
1.3.5. Consumer acceptance measures .................................................................. 11
1.3.6. Statistical analysis ........................................................................................ 12 1.4. Results ...................................................................................................................... 13 1.4.1. Consumer study ..................................................................................................... 13
1.5 Conclusion ................................................................................................................. 20
2. Consumer preference study of Bissap reengineering products in
Europe ........................................................................................................ 22
2.1. Summary ................................................................................................................ 22
2.2. Introduction ............................................................................................................ 23
2.3. Material and Methods ............................................................................................ 24
2.3.1. Samples and sample preparation ............................................................ 24 2.3.2. Ethical assessment and consent ............................................................... 25
2.3.3. Participants ............................................................................................. 25 2.3.4. Tasting sessions ....................................................................................... 26 2.3.5. Consumer acceptance measures .............................................................. 27 2.3.6. Consumer sensory profiling .................................................................... 27
2.3.7. Statistical analysis ................................................................................... 28 2.4.2. Evaluation of Intensity of sensory attributes relatively to participants’
ideal level, using JAR scales : colour, sweet taste and acid taste ......................... 33 2.4.3. CATA profiling ........................................................................................ 34 2.4.4. Relationship between CATA, JAR and Hedonic Overall appreciation ... 38
2.5. Conclusions ............................................................................................................ 39 2.6. Acknowledgement.................................................................................................. 41
2.7. References .............................................................................................................. 41
Annex 1. Baobab consumer questionnaire ............................................. 44

AFTER (G.A n°245025) – Deliverable 5.4.2.3 Report on near-market consumer testing of new improved products in Europe for
Group 3
3
Executive summary
This deliverable describe the main results concerning the studies of European consumer
acceptance of reengineered products from group 3 (plant based extracts for functional
foods) in order to understand acceptance in EU markets and facilitate their promotion
and introduction in these markets.
The products belonging to this group were Bissap - Hibiscus sabdariffa L., Baobab -
Adansonia digitata L. and Jaabi - Ziziphus mauritiana Lam, but only Bissap and Baobab
were submitted to European consumers testing. The methodological approach
performed to establish consumer’s acceptance and sensory profile included consumer
hedonic acceptance, Just-About-Right intensity evaluation of specific descriptors (JAR)
and Check-All-That-Apply questions (CATA).
Results on 4 reengineered Baobab fruit juices used in this consumer test showed that all
fruit juices were evaluated as very sweet and slightly fruity flavour and very light colour
and were in the acceptable range since the average scores were between 5 (neither like
nor dislike) and 7 (like moderately), which can be considered satisfactory taking into
account that the Baobab is not commonly consumed in Europe and even unknown to the
public. For all the samples assessed the diluted from Syrup from Baobab fruit pulp
(BSFP) showed to be the most appreciated and obtained a positive value on the
consumption probability, possibly because this sample showed the highest values in the
fruit odour and intensity and colour hue.
Results on 2 reengineered bissap drinks - an ultra-vacuum concentrate and a syrup
evaluated in Europe by comparable consumers’ samples in France, Portugal and United
Kingdom, along with a hibiscus infusion prepared freshly from ground dried calyces,
showed that all the hibiscus drinks evaluated were in average positively appreciated by
consumers, however new drinks were significantly more appreciated then the traditional
infusion. Similar preference profiles were observed across countries although French
participants were those that most appreciated the drinks. Clusters analysis performed
showed new hibiscus drinks were liked slightly too moderately by participants in
Clusters C1 (Overall likers) and C2 (New drinks’ likers), representing about 75% of
participants in the study. The evaluation of the intensity of three sensory attributes -
colour, sweet taste and acid taste -, relatively to participants’ ideal level and it’s relation
with overall liking ratings, showed for reengineered syrup a significant negative impact
of the high sweetness on the drink overall liking. Oppositely for ultra-vacuum
AFTER (G.A n°245025) – Deliverable 5.4.2.3 Report on near-market consumer testing of new improved products in Europe for
Group 3
4
concentrate the strong colour and acidity and weak sweetness led to a significant
decrease in overall liking. CATA profiles were similar in the three countries, concerning
both the actual drinks tested and an ideal theoretical drink. Reengineered syrup was
perceived to have a highly distinct sensory profile when compared with the others, and
these with the described ideal drink.
In the case of reengineered syrup although being the most appreciated drink, its high
sweetness was an important penalizing factor in consumers acceptance as a drink,
nevertheless other uses for this syrup can be foreseen. In the case of ultra-vacuum
concentrate drink where the strong character, robust colour and strong acidity was not
so appreciated in Europe as in Senegal, could benefit European consumers’ acceptance
if we increase the dilution of the concentrate with an equilibrated degree of added sugar.
Besides exploring further opportunities for enhancing the sensory profiles of the new
drinks of group 3 in line with European taste, future studies should also investigate the
levels of marketing activities (pricing, distribution and promotional information –
including nutritional and healthiness attributes) which will best support their successful
introduction in European markets.
General approach
The work encompassed in this deliverable had as main objective the evaluation of
European consumer acceptance of products from group 3 (plant based extracts for
functional foods) that were submitted to reengineering process to overcome food safety
and product quality issues (identified in the first stage of the project in traditional food)
to facilitate their promotion and introduction to EU markets.
The products belonging to this group were Bissap - Hibiscus sabdariffa L., Baobab -
Adansonia digitata L. and Jaabi - Ziziphus mauritiana Lam.
Bissap or Karkadé is obtained from the flower of Red Sorrel (Hibiscus sabdariffa L.).
Dry calyx of the flower is used in Senegal and other Western African countries for the
preparation of beverages and other products with high anthocyanins content.
Baobab or Bouye is a juice obtained from the fruit of the baobab (Adansonia digitata
L.). The baobab is a tree that grows wild in all semi-arid and dry sub-humid areas
throughout Africa and Madagascar. The fruit of the baobab or monkey bread, called
Bouye in Senegal (Buy in wolof), is widely consumed in various forms.

AFTER (G.A n°245025) – Deliverable 5.4.2.3 Report on near-market consumer testing of new improved products in Europe for
Group 3
5
Jaabi also called Jujube (Ziziphus mauritiana Lam.) is the fruit of the jujube tree, widely
spread in the Soudano-Sahelian savannas of Africa, particularly in North-Cameroon.
The fruit is locally used fresh or dried for food purpose. It is consumed as snack food or
processed into flour for the preparation of pancakes, or also associated with pastry or
drinks. The dried and processed fruit has a pleasant biscuit taste and a plain aromatic
flavour.
The products selected for European studies of reengineered products at this stage were
Bissap - Hibiscus sabdariffa L. and Baobab - Adansonia digitata L.. drinks. The
consumer acceptance testing of the reengineering of product from Jaabi - Ziziphus
mauritiana was performed in Cameroon and reported in Deliverable D5.5.2.3, but could
not be tested in Europe since it is a very local product, with reduced processing
expression, with reduced acceptability and with high seasonality, constraining
commercial transference to Europe, and consequently from all the products from group
3 Jabbi was that with minor chances and interest in Europe, and for that no study was
performed at this stage in Europe. In previous study in Europe sensory evaluation of the
cake samples was carried out by 5 semi-trained panellists from CIRAD Montpellier
(paper under submission), and sensory aspect of jaabi was not well accepted by the
European consumer. For that reason, and because the reengineered product was only
improved in terms of nutritional value with no sensory improvement, we did not
reached conditions to test this product in Europe.
In this deliverable are reported results concerning consumer preference studies that
instead of a trained panel used a large number (60 or more) of consumers, who scored
the product only for liking or acceptance. This method assesses personal responses
(acceptance or preference) of consumers regarding to a product, idea or specific product
characteristics. In this deliverable are reported the reengineered product.
In order to efficiently assess the European consumer preference and perception of the
products from group 3, the study was structured according the product, as follows:
Baobab study: Consumer preference study was performed with Portuguese consumers
for reengineered Baobab products
Bissap study: Consumer preference study was performed as a cross study in Europe
including Portuguese, English and French consumers.

AFTER (G.A n°245025) – Deliverable 5.4.2.3 Report on near-market consumer testing of new improved products in Europe for
Group 3
6
These results helped to understand the perception of European consumers about these
re-engineering products in order to promote its consumption in both European and
African markets.
The studies will be presented by product in the following sections in order to easily
show the particularities of each one.
1. Consumer preference study of Baobab reengineering
products in Europe
1.1. Summary
The Baobab tree has an Arabic history, and belongs to the Bombacaceae family and
Adansonia gender and the most common name of baobab fruit pulp in Senegal is
“Monkey bread” or "Bouy".
Baobab samples for consumer test included Baobab traditional products submitted to
reengineering processing under the AFTER project scope and resulted in four different
samples: two syrups that were obtained from Baobab powder by two different
processes: hot dissolution and cold dissolution and other two syrups produced from
Baobab fruit (Esteval) and syrup from Baobab fruit pulp. All samples were diluted with
potable water prior to tasting in order to standardize the Brix in the range of the sample
used for comparison in sensory tests (commercial pear nectar) that corresponded to 11.1
ºB also used in sensory evaluation.
The study included a group of 73 Portuguese consumers with ages ranging 17 and 50
years old. Sample acceptability was assessed by overall liking ratings provided on a 9-
point hedonic scale. Hierarchical cluster analysis (Ward’s method) was used to segment
consumers accordingly. Sensory attributes– colour, sweet taste acid taste and fruity
flavour, relatively to participants’ ideal level were measured by attribute ratings
provided on a 3-point JAR scale.
The main results showed that for Baobab fruit juices used in this consumer test, all fruit
juices were in the acceptable range since the average scores were between 5 (neither
like nor dislike) and 7 (like moderately), which can be considered satisfactory taking
into account that the Baobab is not commonly consumed in Portugal and even unknown

AFTER (G.A n°245025) – Deliverable 5.4.2.3 Report on near-market consumer testing of new improved products in Europe for
Group 3
7
to the public. Syrup from Baobab fruit pulp (BSFP) was the most appreciated and
obtained a positive value on the consumption probability.
1.2. Introduction
The Baobab tree has an Arabic history, and belongs to the Bombacaceae family and
Adansonia gender.
There are eight species in the world including Adansonia digitata L.which is found in
Senegal. This species is encountered in many African zones and has a long life. In many
parts of Africa tubers, fruits, seeds, leaves and flowers of this plant are identified as
common ingredients in traditional dishes in rural and urban areas. African baobab is a
very long-living tree. It normally lives for about 500 years, but it is believed that some
trees are up to 5000 years old (Gruenwald and Galizia, 2005)
The most common name of baobab fruit pulp in Senegal is “Monkey bread” or "Bouy".
The baobab pulp is economically the most important food stuff, and is recognized by
the EU commission as an additive and exported in many countries.
The fruit pulp is commonly sucked, chewed or made into a drink when mixed with
water or milk, either with or without sugar, or as a supplement to mix with staple food
such as corn meal and cassava. Other uses for baobab pulp include sauces for food, hair
rinse, milk curdling agent and a substitute for cream of tartar, among other things.
The pulp is very nutritious. Arnold et al. (1985) reported that with na average of 8.7%
moisture, the pulp contains about 74% carbohydrates, 3% proteins, 9% fibers, 6% ash
and only 0.2% fat. The content of pectin is approximately 56% (Nour et al., 1980),
which is why the pulp is traditionally used as a base for jam making. It is also
characterized by a high vitamin C (ascorbic acid), calcium, phosphorus and potassium
content. The acidulous taste is attributed to the presence of organic acids, such as citric
acid, tartaric acid, malic acid and succinic acids.
Baobab fruit pulp has a particularly high antioxidant capability mainly because of its
high natural vitamin C content, which is equivalent to 6 oranges per 100 g. If we
consider that baobab has an ascorbic acid content of 300 mg per 100 g pulp, the oral
intake of 25 and 30 g, respectively is able to provide the daily vitamin C allowance
required by humans. Additionally, vitamin C aids the bodily uptake of iron and calcium,

AFTER (G.A n°245025) – Deliverable 5.4.2.3 Report on near-market consumer testing of new improved products in Europe for
Group 3
8
of which the fruit pulp contains more than double than the same amount of milk.
Therefore, in some areas, it is used as a milk substitute for babies.
Baobab fruit pulp, due to the combination of health claims (such as prebiotic and
antioxidant functions, the high calcium content, and the anti-inflammatory properties)
and food technological functions (because of its high pectin and fiber content, baobab
fruit pulp gives beverages a thicker consistency and can be also used as filler), is a very
interesting candidate for a new generation of functional foods and drinks. Baobab fruit
pulp can be particularly interesting as an ingredient for smoothies, which are a kind of
thick fruit juice with a high content of fruit pulp. From July 2008, "An exotic fruit with
six times the vitamin C of an orange can be sold in Britain after an EU ruling.
In studies carried out under the project reengineering technologies were applied for
optimization of a dried powder from Baobab pulp, which can be reconstituted when
necessary for the production of Baobab drinks. Drying contributes to the shelf-life
stability for the export market. From the dried powder Baobab syrups were produced
using a new technology for improving these products.
The main objective of this research effort was to study the acceptability by Portuguese
consumers of four Baobab samples (n=4), two syrups obtained from Baobab powder by
two different processes: hot dissolution and cold dissolution. The other two samples
were syrup produced from Baobab fruit (Esteval) and syrup from Baobab fruit pulp.
Consumer hedonic acceptance, Just-About-Right intensity evaluation of specific
descriptors (JAR) were used to establish consumers acceptance.
1.3 Material and methods
1.3.1. Baobab samples and sample preparation
Baobab samples for consumer test were new Baobab syrups developed under the
AFTER project scope and prepared according different protocols of Senegalese recipes.
The Baobab samples were four different samples: two syrups were obtained from
Baobab powder by two different processes: hot dissolution and cold dissolution. The
other two samples were syrup produced from Baobab fruit (Esteval) and syrup from
Baobab fruit pulp.

AFTER (G.A n°245025) – Deliverable 5.4.2.3 Report on near-market consumer testing of new improved products in Europe for
Group 3
9
All samples were diluted with potable water prior to tasting in order to standardize the
Brix in the range of the control sample already used for comparison in sensory tests
(commercial pear nectar) corresponding to ca. 11.1 ºB.
Four different samples were presented to consumers as the following (Figure 1):
1. Syrup from Baobab power cold dissolution (BSCD)
2. Syrup from Baobab power hot dissolution(BSHD)
3. Syrup from Baobab fruit pulp (BSFP)
4. Syrup from Baobab fruit (Esteval) (BSFE)
Figure 1 – A - Baobab syrups samples; B - Baobab syrups samples diluted for presentation to
consumers.
Common to all of the methodologies is the Ethical assessment and consent which is
listed as
follows:
1.3.2. Ethical assessment and consent
The study was reviewed by project AFTER’s Ethics Committee. Participants were
informed about the study’s general aim and procedures for handling personal data, and
gave written informed consent prior to participating in the tasting sessions. Interviewers
informed participants about the study and explained that their participation was entirely
A B
AFTER (G.A n°245025) – Deliverable 5.4.2.3 Report on near-market consumer testing of new improved products in Europe for
Group 3
10
voluntary, that they could stop the interview at any point/time and that the responses
would be anonymous.
All tested samples were produced and prepared according to good hygiene and
manufacturing practices. The new drinks tested resulted mainly from incremental
changes in the traditional manufacturing processes, with the aim of better extracting and
preserving its nutritional value while increasing its eco-efficiency. No safety or health
concerns were introduced by such changes.
1.3.3. Participants
Participants were non-probabilistically recruited in Portugal (Porto, n=75), according to
their willingness and availability to participate in the study, however atypical overall
liking ratings were observed for two participants and consequently they were excluded
from further analysis (n=73).
All participants consumed fruit beverages and (62%) consumed fruit juice one or more
times per week, (19%) consumed these types of juices daily and (19%) one or more
times per month, 99% were European or European residents, and their ages ranged
between 17 and 50 years old (average 28,8, standard deviation 10.2) and 74% were
women.
1.3.4. Tasting sessions
Tasting session was conducted in the building of Escola superior de Biotecnologia
(ESB) – Universidade Católica Portuguesa (UCP) in a room equipped with computers,
since the questionnaire were conducted in portable computers. The questionnaire was
written in Portuguese and was introduced in Qualtrics (Qualtrics, LLC) online survey
software in order to simplify the collection of the information. Qualtrics is a software
platform used by ESB – UCP.
Thirty millilitre samples of each of the Baobab drinks tested were served in clear plastic
glasses, following a complete balanced experimental plan. The four Baobab samples for
consumer tasting were the same as those used for sensory evaluation: Syrup from
Baobab power cold dissolution (BSCD); Syrup from Baobab power hot dissolution
(BSHD); Syrup from Baobab fruit pulp (BSFP) and Syrup from Baobab fruit (Esteval)
AFTER (G.A n°245025) – Deliverable 5.4.2.3 Report on near-market consumer testing of new improved products in Europe for
Group 3
11
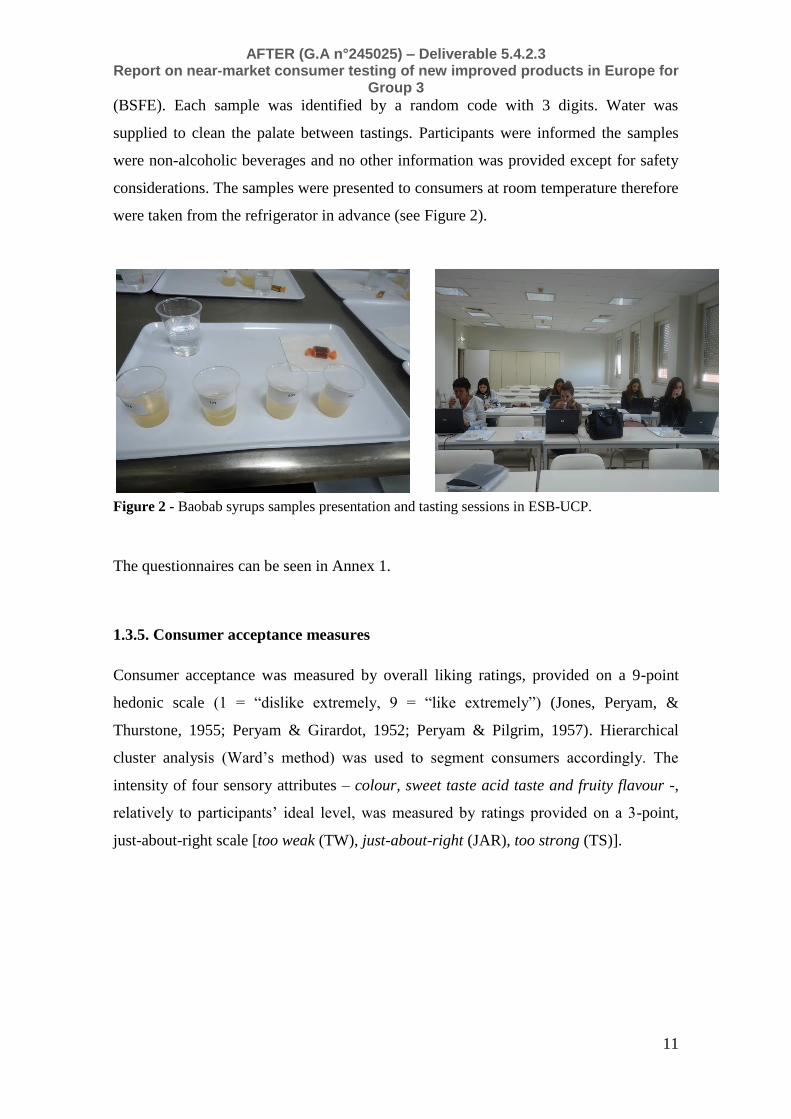
(BSFE). Each sample was identified by a random code with 3 digits. Water was
supplied to clean the palate between tastings. Participants were informed the samples
were non-alcoholic beverages and no other information was provided except for safety
considerations. The samples were presented to consumers at room temperature therefore
were taken from the refrigerator in advance (see Figure 2).
Figure 2 - Baobab syrups samples presentation and tasting sessions in ESB-UCP.
The questionnaires can be seen in Annex 1.
1.3.5. Consumer acceptance measures
Consumer acceptance was measured by overall liking ratings, provided on a 9-point
hedonic scale (1 = “dislike extremely, 9 = “like extremely”) (Jones, Peryam, &
Thurstone, 1955; Peryam & Girardot, 1952; Peryam & Pilgrim, 1957). Hierarchical
cluster analysis (Ward’s method) was used to segment consumers accordingly. The
intensity of four sensory attributes – colour, sweet taste acid taste and fruity flavour -,
relatively to participants’ ideal level, was measured by ratings provided on a 3-point,
just-about-right scale [too weak (TW), just-about-right (JAR), too strong (TS)].

AFTER (G.A n°245025) – Deliverable 5.4.2.3 Report on near-market consumer testing of new improved products in Europe for
Group 3
12
1.3.6. Statistical analysis
XLSTAT software (Addinsoft SARL, France) and IBM SPPS Statistics, Version 22.0
(IBM Corp., USA) were used to carry out all statistical analyses. The significance of
statistical tests was evaluated at p<0.05, unless otherwise mentioned.
1.3.6.1. Consumer acceptance measures
Analysis of Variance (ANOVA) was performed on overall liking ratings for the three
samples, considering participants and samples as sources of variation. Mean sample
ratings were calculated and significant differences between them tested post-hoc using
Tukey’s HSD (Honest Significant Difference) tests. Pair-wise Pearson correlations
between samples’ overall liking ratings were then computed to assess their degree of
association.
Hierarchical cluster analysis (Euclidean distances and complete linkage agglomeration
method) was subsequently performed to identify groups of participants with dissimilar
patterns of sample liking. Analysis of Variance (ANOVA) was performed on within-
clusters’ overall liking ratings for the four samples, considering participants and
samples as sources of variation. Within-cluster mean sample ratings were calculated and
significant differences between them tested post-hoc using Tukey’s HSD tests. The
existence of significant differences between clusters’ mean ages was assessed using
Student’s t-tests. Finally, the existence of significant differences between clusters’
gender proportions was evaluated by Pearson's chi-square tests with Monte Carlo
procedure.
The frequency of intensity ratings (TW, JAR, TS) for each of the three sensory
attributes evaluated by participants was determined for each sample, and the
corresponding proportions calculated. A Correspondence Analysis (CA) was then
performed on the contingency table of proportions for all samples and attributes
(Popper, 2014). The frequency of intensity ratings for each sample and attribute was
finally tallied for each cluster of participants based on overall liking ratings.
A penalty analysis (Popper, 2014) was employed to relate attribute intensity ratings to
overall liking ratings for each participant and sample. To this end, participants were
grouped according to their intensity ratings for each sample and attribute, and mean
overall liking ratings for each group were computed. The overall liking mean drops, or

AFTER (G.A n°245025) – Deliverable 5.4.2.3 Report on near-market consumer testing of new improved products in Europe for
Group 3
13
penalties, obtained when comparing the TW and the TS group with JAR participants
were then calculated. Weighted penalties (Popper, 2014) were equally computed by
taking both the mean drops and the proportion of participants in each group.
1.4. Results
1.4.1. Consumer study
1.4.1.1. Consumer Overall liking scores
The overall acceptability for the four Baobab samples showed that there were
significant differences between the syrup from Baobab fruit pulp (BSFP) sample and
the other three samples: syrup from Baobab power cold dissolution (BSCD), syrup from
Baobab power hot dissolution (BSHD) and syrup from Baobab fruit (Esteval) (BSFE) at
a significant level of p ≤ 0,01 (one-way ANOVA) (Table 1), however there were not
significant differences (P>0,05) for the samples BSCD,BSHD and BSFP.
Regarding all samples used during consumer study it was possible to verify that samples
were on the positive range since the mean scores were between 5 (neither like or
dislike) and 7 (like moderately).
Syrup from Baobab fruit pulp (BSFP) was the most preferred followed by syrup from
Baobab power cold dissolution (BSCD), and syrup from Baobab power hot dissolution
(BSHD) and the syrup from Baobab fruit (Esteval) (BSFE) obtained the lowest score, in
a decrease order of magnitude.
Table 1 - Mean overall acceptability scores for Baobab samples tested.
* Means with the same letter are not significantly different Tukey test (p<0.01).
Samples Averages
BSFP 6,644 A 5 Neither like or dislike
BSCD 6,055 B 6 Like slightly
BSHD 5,918 B 7 Like moderately
BSFE 5,726 B
Groups

AFTER (G.A n°245025) – Deliverable 5.4.2.3 Report on near-market consumer testing of new improved products in Europe for
Group 3
14
1.4.1.2 Consumer Probability Consumption scores
The probability of consumption was also assessed in a consumer test. To the question
"Would consume this drink, if it is available in the market?" consumer responses
obtained for the four Baobab samples showed that were significant differences (p ≤
0,01) between the pulp of fruit syrup Baobab (BSFP) sample and the other three
samples: syrup Baobab power of cold dissolution (BCSD), Baobab power syrup hot
dissolution (BSHD) and fruit syrup Baobab (Esteval) (BSFE) (Table 2), but there were
no significant differences (P> 0.05 ) for the BCSD samples, BSHD and BSFP. These
results were similar to those obtained for the Consumer Overall liking, once as expected
the Probability consumption and the Overall liking are directly related.
The scores obtained for Baobab samples were in the range from the mean values
between 4 (medium probability) and 6 (a good probability). In similarity of the results
obtained for Overall liking, the syrup Baobab fruit pulp (BSFP) obtained higher
probability consumption scores, between reasonably and good probability of
consumption, followed syrup Baobab power of cold dissolution (BCSD ) and syrup
Baobab power of hot dissolution (BSHD) and fruit syrup Baobab (Esteval) (BSFE) got
the lowest score in a magnitude of reduction of order.
Table 2 - Mean overall probability consumption scores for Baobab samples tested.
1.4.1.3. Consumers segmentation using Hierarchical cluster analysis
1.4.1.3.1. Consumer Overall liking
The hierarchical cluster analysis (Ward method) identified two groups of consumers
that scored the overall liking scores of the samples differently, as depicted in Figures 3
and 4. Segmentation gives a more complex variation in acceptability among the
consumers and is helpful to understand differences in consumer behaviour. The clusters
Samples Averages Groups
BSFP 5,315 A 4 Medium probability
BSCD 4,247 B 5 Reasonably probability
BSHD 4,233 B 6 Good probability
BSFE 4,205 B

AFTER (G.A n°245025) – Deliverable 5.4.2.3 Report on near-market consumer testing of new improved products in Europe for
Group 3
15
identified were: Cluster 1 (C1) - Overall likers (53%), Cluster 2 (C2) - Syrup from
Baobab fruit pulp likers (47%). 53% of consumers (Cluster C1) considered like all the
samples, whereas syrup from Baobab fruit pulp (BSFP) was liked by 100% of
participants (clusters C1 and C2), however the syrup from Baobab fruit (Esteval)
(BSFE) was the sample dislikers by 47% of participants (Cluster C2). Mean overall
liking ratings showed that syrup from Baobab fruit pulp was better appreciated than the
other samples assessed.
Figure 3 – Hierarchical clustering dendogram segmenting participants according to their overall
liking patterns of Baobab samples (n=73; C1= 39 and C2=34).
0
50
100
150
200
250
Diss
imila
rity
Dendrogram
C1
C2

AFTER (G.A n°245025) – Deliverable 5.4.2.3 Report on near-market consumer testing of new improved products in Europe for
Group 3
16
*Error bars represent the confidence interval of the mean (p=0,95). Different superscripts within
acluster indicate significant differences according Tukey’s HSD (p ≤ 0,05).
Figure 4 – Mean consumer Overall liking of Baobab samples: syrup from Baobab power cold
dissolution (BSCD); syrup from Baobab power hot dissolution (BSHD); syrup from Baobab
fruit pulp (BSFP); syrup from Baobab fruit (Esteval) (BSFE).
1.4.1.3.2. Consumer Probability Consumption
The hierarchical cluster analysis (Ward method) identified two groups of consumers
that scored the Probability Consumption scores of the Baobab samples differently, as
depicted in Figures 5. The clusters identified were: Cluster 1 (C1) - Overall probability
consumption (53%), Cluster 2 (C2) - Syrup from Baobab fruit pulp (BSFP) probability
consumption (47%). The results were similar to those shown above for Overall linking
with 53% of consumers (Cluster C1) considered probably consumption the Baobab
drinks assessed, whereas syrup from Baobab fruit pulp (BSFP) was the sample that
obtained the highest probability consumption (clusters C2) when compared with others
Baobab samples
5,92 b
6,64 a
5,73 b6,05 b
6,62 b7,00 a 6,85 ab 6,77 ab
5,12 b
6,24 a
4,44 b
5,24 b
1
2
3
4
5
6
7
8
9
BSHD BSFP BSFE BSCD BSHD BSFP BSFE BSCD BSHD BSFP BSFE BSCD
Ove
rall
liki
ng
All consumers C2 (47%) Syrup from
Baobab fruit pulp (BSFP) likers
C1 (53 %) Overall
likers

AFTER (G.A n°245025) – Deliverable 5.4.2.3 Report on near-market consumer testing of new improved products in Europe for
Group 3
17
Figure 5 – Mean consumer Probability consumption of Baobab samples: syrup from Baobab
power cold dissolution (BSCD); syrup from Baobab power hot dissolution (BSHD); syrup from
Baobab fruit pulp (BSFP); syrup from Baobab fruit (Esteval) (BSFE).
*Error bars represent the confidence interval of the mean (p=0,95). Different superscripts within acluster
indicate significant differences according Tukey’s HSD (p ≤ 0,05).
1.4.1.4 Evaluation of Intensity of sensory attributes relatively to participants’
ideal level, using JAR scales: colour, sweet taste, acid taste and fruity taste.
Figure 6 shows the frequencies of intensity ratings, measured on a 3-point JAR scale,
for each Baobab samples and sensory attribute evaluated (colour, sweet taste, acid taste
and fruity taste).
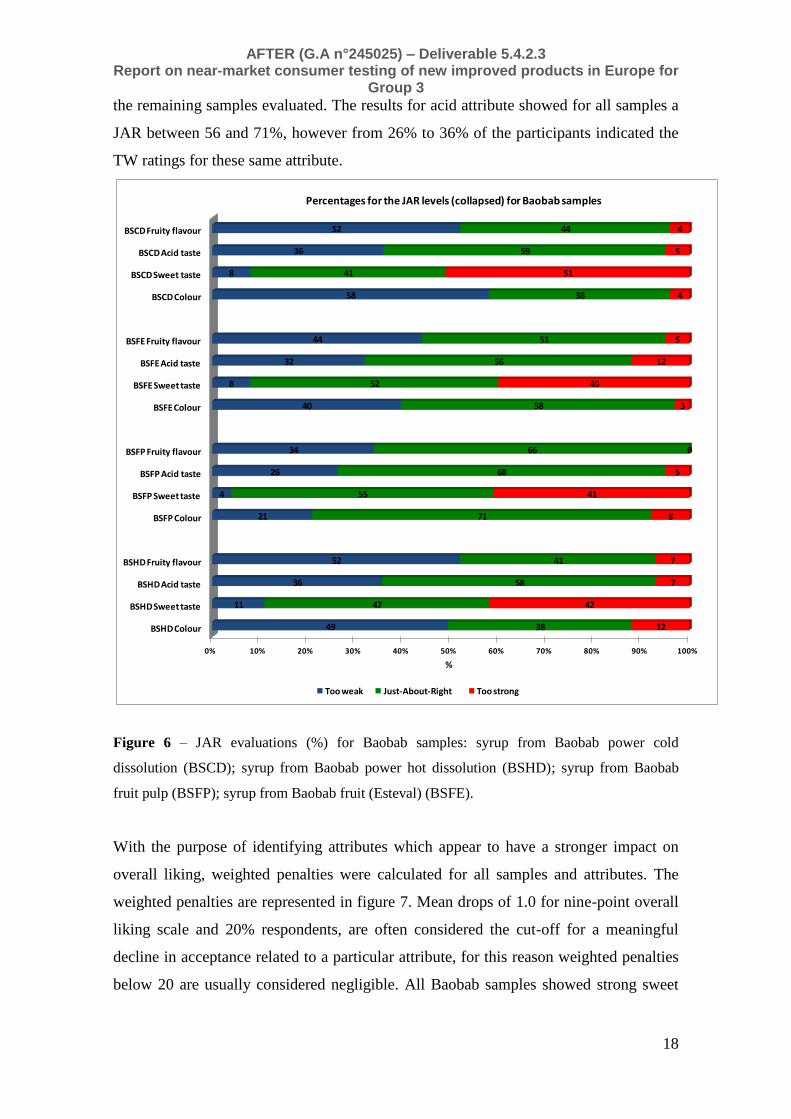
A preponderance of JAR (Just-About-Right) ratings was observed for syrup from
Baobab fruit pulp (BSFP) for the four attributes evaluated, with their frequencies
ranging from 55% to 71%. This is well in line with overall liking results, which showed
that BSFP was the preferred sample.
For all samples the sweet taste showed TS (Too strong) ratings above 40%, the sample
considered more sweetness was syrup from Baobab power cold dissolution (BSCD)
(51%). Respect to the fruity flavour and colour, the BSCD and syrup from Baobab
power hot dissolution (BSHD) the TW (Too weak) ratings dominated for these two
attributes, indicating that these samples have a lighter colour and less fruity flavour than
4,21
5,32
4,25 4,23
4,872
5,7185,436
5,051
3,441
4,853
2,882
3,294
1
2
3
4
5
6
7
8
9
BSHD BSFP BSFE BSCD BSHD BSFP BSFE BSCD BSHD BSFP BSFE BSCD
Prob
abili
ty c
onsu
mpt
ion
All consumers C2 (47%) Syrup from
Baobab fruit pulp (BSFP)
Probability consumption
C1 (53 %) Overall
probability consumption
AFTER (G.A n°245025) – Deliverable 5.4.2.3 Report on near-market consumer testing of new improved products in Europe for
Group 3
18
the remaining samples evaluated. The results for acid attribute showed for all samples a
JAR between 56 and 71%, however from 26% to 36% of the participants indicated the
TW ratings for these same attribute.
Figure 6 – JAR evaluations (%) for Baobab samples: syrup from Baobab power cold
dissolution (BSCD); syrup from Baobab power hot dissolution (BSHD); syrup from Baobab
fruit pulp (BSFP); syrup from Baobab fruit (Esteval) (BSFE).
With the purpose of identifying attributes which appear to have a stronger impact on
overall liking, weighted penalties were calculated for all samples and attributes. The
weighted penalties are represented in figure 7. Mean drops of 1.0 for nine-point overall
liking scale and 20% respondents, are often considered the cut-off for a meaningful
decline in acceptance related to a particular attribute, for this reason weighted penalties
below 20 are usually considered negligible. All Baobab samples showed strong sweet
0% 10% 20% 30% 40% 50% 60% 70% 80% 90% 100%
BSHD Colour
BSHD Sweet taste
BSHD Acid taste
BSHD Fruity flavour
BSFP Colour
BSFP Sweet taste
BSFP Acid taste
BSFP Fruity flavour
BSFE Colour
BSFE Sweet taste
BSFE Acid taste
BSFE Fruity flavour
BSCD Colour
BSCD Sweet taste
BSCD Acid taste
BSCD Fruity flavour
49
11
36
52
21
4
26
34
40
8
32
44
58
8
36
52
38
47
58
41
71
55
68
66
58
52
56
51
38
41
59
44
12
42
7
7
8
41
5
0
3
40
12
5
4
51
5
4
%
Percentages for the JAR levels (collapsed) for Baobab samples
Too weak Just-About-Right Too strong

AFTER (G.A n°245025) – Deliverable 5.4.2.3 Report on near-market consumer testing of new improved products in Europe for
Group 3
19
taste, however the sample that stood out was BSCD sample. For BSCD and BSHD a
weak fruity flavour and colour were observed.
For the weighted penalty observed that the weak acid has a marked weight for all
samples is in agreement with the results obtained for sweetness.
Figure 7 - Representation of the weighted penalty values relating overall liking ratings drops
for each Baobab samples and attribute in relation with JAR attribute intensity ratings for all
participants (n=73) for Baobab samples: syrup from Baobab power cold dissolution (BSCD);
syrup from Baobab power hot dissolution (BSHD); syrup from Baobab fruit pulp (BSFP); syrup
from Baobab fruit (Esteval) (BSFE).
1.4.1.5. Relating consumer acceptance measures and sensory profiling results
Principal component analysis (PCA) was performed considering the frequency of
intensity ratings of the sensory attributes evaluated as active variables and overall liking
and probability consumption ratings as supplementary variables.
-100 -80 -60 -40 -20 0 20 40 60 80 100
BSHD Colour
BSHD Sweet taste
BSHD Acid taste
BSHD Fruity flavour
BSFP Colour
BSFP Sweet taste
BSFP Acid taste
BSFP Fruity flavour
BSFE Colour
BSFE Sweet taste
BSFE Acid taste
BSFE Fruity flavour
BSCD Colour
BSCD Sweet taste
BSCD Acid taste
BSCD Fruity flavour
Weighted penalties ( %)
Too weak Too strong

AFTER (G.A n°245025) – Deliverable 5.4.2.3 Report on near-market consumer testing of new improved products in Europe for
Group 3
20
The biplot represented in Figure 8 shows as syrup from Baobab fruit pulp (BSFP) was
highly correlated to Overall liking and probability consumption, which reflects the
results obtained in consumers test where consumers proved to be the preferred sample.
Figure 8 - Representation of the Baobab drinks and sensory attributes evaluated and overall
liking and probability consumption in the two dimensions of a GPA analysis, performed on
discriminating attributes. BSCD = Syrup from Baobab power cold dissolution; BSHD = Syrup
from Baobab power hot dissolution; BSFP = Baobab fruit pulp (syrup); BSFE = Syrup from
Baobab fruit (Esteval);
1.5 Conclusion
For Baobab fruit juices used in this consumer test, it was possible verify that all fruit
juices were in the acceptable range since the average scores were between 5 (neither
like nor dislike) and 7 (like moderately), which can be considered satisfactory taking
into account that the Baobab is not commonly consumed in Portugal (and in Europe)
and even unknown to the public. This type of drink due to its composition can be a great
potential to be considered as functional beverage, which probably increases the interests
of the consumer and market acceptance.
For the group of Baobab samples assessed the diluted from Syrup from Baobab fruit
pulp (BSFP) showed to be most appreciated and obtained a positive value on the
consumption probability. These results probably can be explained by the fact that
BSHD
BSFP
BSFEBSCD
Turbidity
Color hue
Odour Intensity
Fruit Odour
Straw odour
Viscosity
Sweetness
Fruit flavour
Overall Linking
Consumption probability
-4
-2
0
2
4
6
-8 -6 -4 -2 0 2 4 6 8F2 (3
3.95
%)
F1 (52.46 %)
Biplot (axes F1 and F2: 86.41 %)
Active Active variables Supplementary variables

AFTER (G.A n°245025) – Deliverable 5.4.2.3 Report on near-market consumer testing of new improved products in Europe for
Group 3
21
consumers associated more this sample with own Baobab fruit, since it has been the
highest values in the fruit odour and intensity and colour hue. For all Baobab samples
some common characteristics were observed namely very sweet and slightly fruity
flavour and very light colour.
In the same questionnaires, some other marketing questions were included to
understand the opportunity of Baobab in European market. These results were related
with consumption habits of fruit juices, and were included in the report D.5.4.1 (Report
on near-market consumer testing of new improved products and substitutes in Europe)
where may be consulted. Moreover, the employment of overall liking assessments and
JAR technique allow also to find important drivers for further sensory optimization of
the Baobab samples to European market. Probably, for the European consumers these
reengineering Baobab drinks should also be adjusted in terms of sweetness and acidity,
as for the European habits are considered excessively sweet and low acidity.
AFTER (G.A n°245025) – Deliverable 5.4.2.3 Report on near-market consumer testing of new improved products in Europe for
Group 3
22
2. Consumer preference study of Bissap reengineering
products in Europe
2.1. Summary
Hibiscus calyces are fleshy, high on vitamin C, minerals, pectins, organic acids,
polyphenols and anthocyanins and have a tart, cranberry-like flavour with high potential
as functional drink prone to be accepted in Europe. In this deliverable the ultra-vacuum
concentrate and the syrup obtained from reengineering were evaluated in Europe by
comparable consumers’ samples in France, Portugal and United Kingdom, along with a
hibiscus infusion prepared freshly from ground dried calyces for baseline comparison.
Consumer hedonic acceptance, Just-About-Right intensity evaluation of specific
descriptors (JAR) and Check-All-That-Apply questions (CATA) were used to establish
consumer’s acceptance and sensory profile. In general, despite de high diversity of
sensory characteristics, all the hibiscus drinks evaluated were in average positively
appreciated by consumers, however new drinks were significantly more appreciated
then the traditional infusion. Similar preference profiles were observed across countries
although French participants were those that most appreciated the drinks. Clusters
analysis performed showed new hibiscus drinks were liked slightly too moderately by
participants in Clusters C1 (Overall likers) and C2 (New drinks’ likers), which
represented about 75% of participants in the study. Overall liking assessments were
complemented by attribute intensity evaluations and sensory profiling to provide
important insights about hibiscus drinks’ perception and acceptability. The evaluation of
the intensity of three sensory attributes - colour, sweet taste and acid taste -, relatively to
participants’ ideal level and it’s relation with overall liking ratings, showed for REs a
significant negative impact of the high sweetness on the drink overall liking. Oppositely
for UVc the strong colour and acidity and weak sweetness led to a significant decrease
in overall liking. CATA profiles were similar in the three countries, concerning both the
actual drinks tested and an ideal theoretical drink. REs was perceived to have a highly
distinct sensory profile when compared with FTi and UVc, and these with the described
ideal drink.
In the case of REs although being the most appreciated drink, its high sweetness was an
important penalizing factor in consumers acceptance as a drink, nevertheless other uses
for this syrup can be foreseen. In the case of UVc drink where the strong character,

AFTER (G.A n°245025) – Deliverable 5.4.2.3 Report on near-market consumer testing of new improved products in Europe for
Group 3
23
robust colour and strong acidity not so appreciated in Europe as in Senegal, could
benefit European consumers’ acceptance if we increase the dilution of the concentrate
with an equilibrated degree of added sugar.
2.2. Introduction
The edible, deep crimson- or deep magenta-coloured calyces of the flowers of the H.
sabdariffa var. sabdariffa race ruber (hereinafter referred to as hibiscus) are employed
around the world in the (artisanal and industrial) production of foods, drinks,
pharmaceuticals and cosmetics (Da-Costa-Rocha, Bonnlaender, Sievers, Pischel, &
Heinrich, 2014; Ross, 2003). The fresh or dried hibiscus sepals have mainly culinary
uses in traditional cuisines (e.g., in the preparation of hot and cold beverages, fermented
drinks, jams, confectionary and desserts) (Cisse et al., 2009a; Ramírez-Rodrigues,
Balaban, Marshall, & Rouseff, 2011; Sáyago-Ayerdi, Arranz, Serrano, & Goñi, 2007).
Hibiscus calyces are fleshy, high on vitamin C, minerals, pectins, organic acids,
polyphenols and anthocyanins (Cisse et al., 2009b; Sáyago-Ayerdi et al., 2007) and
have a tart, cranberry-like flavour (Plotto, Mazaud, Röttger, & Steffel, 2004; Ross,
2003), being thus used around the world to prepare non-alcoholic drinks according to
local recipes (Ramírez-Rodrigues et al., 2011). The consumption of sweetened, hot or
cold hibiscus infusions – either as refreshment or folk remedy -, is very common in
Asia, North-America and North-Africa (e.g., Sudan, Egypt) (Cisse et al., 2009a;
Mohamed, Sulaiman, & Dahab, 2012; Morton, 1987). Still, it is nowhere more
widespread that in West Africa, where dried hibiscus calices are found in every market
and variations of ready-made or bottled hibiscus infusions are commonly sold on the
streets (Bolade, Oluwalana, & Ojo, 2009; Cisse et al., 2009b; Plotto et al., 2004), as in
Senegal where Hibiscus drinks are known as jus de bissap (Bolade et al., 2009; Cisse et
al., 2009b).
Previous AFTER studies on the acceptability of traditional hibiscus drinks by
Senegalese and European consumers’ uncovered significant effects of plant variety and
processing method, highlighting the importance of harmonizing the sensory profile of
these drinks as part of the product re-engineering process and improving the product
acceptability for Senegalese and European consumers. In view of this, three new
hibiscus (50% Kor and 50% Vinto) drinks – an infusion, a syrup and a vacuum-
concentrate were developed under AFTER project scope. These drinks were developed

AFTER (G.A n°245025) – Deliverable 5.4.2.3 Report on near-market consumer testing of new improved products in Europe for
Group 3
24
at the Laboratoire de Formation Continue en Industrie Agroalimentaire of the Ecole
Supérieure Polytechnique of Univeersité Cheikh Anta Diop (UCAD), in Dakar. Their
manufacturing process was subsequently tested and scaled-up in the pilot plant of
Centre Sectoriel de Formation Professionnelle aux Métiers des Industries
Agroalimentaires (CSFP IAA), also in Dakar. The new drinks were prepared following
an eco-efficient process, design to improve the preservation of nutritional quality and
colour of the products while diminishing the production costs, by maximizing hibiscus
calyces’ s extraction efficiency and diminishing pasteurization temperature and
production time.
The sensory quality of these three new drinks was evaluated, alongside a traditional
infusion prepared by a local producer (baseline), by Senegalese consumers in Dakar in
the fall of 2013 (Deliverable D5.5.2.3). The most appreciated drinks, the ultra-vacum
concentrate and the syrup, were later evaluated in Europe by comparable consumers’
samples in France, Portugal and United Kingdom, along with a hibiscus infusion
prepared freshly from ground dried calyces for baseline comparison. Consumer hedonic
acceptance, Just-About-Right intensity evaluation of specific descriptors (JAR) and
Check-All-That-Apply questions (CATA) were used to establish consumer’s acceptance
and sensory profile.
2.3. Material and Methods
2.3.1. Samples and sample preparation
Three hibiscus drinks were tested, a hibiscus infusion prepared freshly from dried
calyces according to Senegalese recipe for baseline comparison (FTi) and two new
hibiscus drinks developed under the AFTER project scope – an ultra-vacuum
concentrate (UVc) and improved syrup (REs). All drinks were produced from ground
dried calyces of the local ‘Koor’ and the Sudanese ‘Vimto’ H. var. sabdariffa cultivars
(50:50), purchased at Latmingue – Kaolack.
The hibiscus infusion (FTi) was freshly prepared with 30 g of calyces soaked in 1 liter
of boiling water. After 20 minutes the resulting extract was filtered, sweetened with
sucrose (130 gL-1
and kept refrigerated until used.

AFTER (G.A n°245025) – Deliverable 5.4.2.3 Report on near-market consumer testing of new improved products in Europe for
Group 3
25
The new syrup (REs) was obtained using a ratio of 1/10 dried hibiscus calices/water and
30 min extraction time at ambient temperature. The resulting infusion was filtered at
0.45 µm and pasteurized at 75ºC during 20min. Sucrose was added (1.2 kg/L, until
approximately 65°Brix), the syrup was cooled down immediately, it was bottled as the
product reached a temperature of 70°C and stored at room temperature.
The Under-vacuum concentrate (UVc) was obtained employing a similar process of
REs, using a ratio of ground calices/water of 1/5 (w/v) and 30 min extraction time at
ambient temperature. The filtered extract (0.45 µm) was pasteurized at 75ºC for 20
minutes, subsequently evaporated under-vacuum at 75 °C and remained unsweetened.
Upon cooling to ambient temperature, the concentrate was stored at 4 to 8°C.
The REs sample was diluted 4 times with potable water prior to tasting. The UVc
concentrate was diluted 40 times with potable water and sweetened with sucrose (130
gL-1
).
2.3.2. Ethical assessment and consent
The study was reviewed by project AFTER’s Ethics Committee. Participants were
informed about the study’s general aim and procedures for handling personal data, and
gave written informed consent prior to participating in the tasting sessions. All tested
samples were produced and prepared according to good hygiene and manufacturing
practices. The new drinks tested resulted mainly from incremental changes in the
traditional manufacturing processes, with the aim of better extracting and preserving its
nutritional value while increasing its eco-efficiency. No safety or health concerns were
introduced by such changes.
2.3.3. Participants
Participants were non-probabilistically recruited in France (Montpellier, n=143,
Portugal (Porto, n=134) and United Kingdom (Rochester, n=128), according to their
willingness and availability to participate in the study. All participants consumed fruit
beverages and 95% consumed fruit beverages or cold tisanes at least monthly, 98%
were European or European residents, their ages ranged between 18 and 72 years old
(average 31.1, standard deviation 12.2) and 52% were women. Less than 3% of
participants were frequent hibiscus products consumers, 19% of participants consumed

AFTER (G.A n°245025) – Deliverable 5.4.2.3 Report on near-market consumer testing of new improved products in Europe for
Group 3
26
hibiscus products occasionally and 22% seldom, 56% of participants stated they had
never consumed hibiscus products or were not sure to have ever consumed them.
2.3.4. Tasting sessions
Tasting sessions took place at each of the three aforementioned cities. The questionnaire
was written in French, Portuguese and English and included questions about
consumption of fruit beverages and tisanes, socio-demographic and attitudinal variables.
Qualtrics online survey software was used (Qualtrics, LLC.) To gather evaluative
relevant information and maximize the equivalence between questionnaires, exploratory
local focus groups were performed.
Thirty millilitre samples of each of the hibiscus drinks tested were served in clear
plastic glasses, following a complete balanced experimental plan. Each sample was
identified by a random code with 3 digits. Water was supplied to clean the palate
between tastings. Participants were informed the samples were non-alcoholic beverages
and no other information was provided except for safety considerations. Questions
related with hibiscus products consumption and red fruits beverages consumption were
asked to participants only after the completion of the sensory related questions.
Figure 1 – Tasting sessions in NRI

AFTER (G.A n°245025) – Deliverable 5.4.2.3 Report on near-market consumer testing of new improved products in Europe for
Group 3
27
Figure 2 – Tasting sessions in CIRAD
Figure 3 – Sample presentation
2.3.5. Consumer acceptance measures
Consumer acceptance was measured by overall liking ratings, provided on a 9-point
hedonic scale (Jones, Peryam, & Thurstone, 1955; Peryam & Girardot, 1952; Peryam &
Pilgrim, 1957). The intensity of three sensory attributes – colour, sweet taste and acid
taste -, relatively to participants’ ideal level, was measured by ratings provided on a 3-
point, just-about-right scale [too weak (TW), just-about-right (JAR), too strong (TS)].
2.3.6. Consumer sensory profiling
Sensory profiles were obtained for each sample by employing check-all-that-apply
(CATA) questions (Adams, Williams, Lancaster, & Foley, 2007; Ares, Barreiro, Deliza,
Giménez, & Gámbaro, 2010). These entailed 24 sensory or hedonic-oriented descriptors
– light red, dark red, red fruits, simple, antioxidant, tisane, acidic, bitter, sweet,
astringent, syrup, floral, invigorating, watery, balanced flavour, strong taste, fruity,
natural, different/unknown, refreshing, artificial, healthy, high calorie and new -, drawn

AFTER (G.A n°245025) – Deliverable 5.4.2.3 Report on near-market consumer testing of new improved products in Europe for
Group 3
28
from previous focus groups held in Senegal (n=20, 55% men, 18-70 years old) and
Portugal (n=22, 54% men, 18-75 years old). The order of presentation of descriptors
was randomized across subjects. Additionally, participants were asked to use CATA
question to describe their ideal beverage (ID).
2.3.7. Statistical analysis
XLSTAT software (Addinsoft SARL, France) and IBM SPPS Statistics, Version 22.0
(IBM Corp., USA) were used to carry out all statistical analyses. The significance of
statistical tests was evaluated at p<0.05, unless otherwise mentioned.
2.3.7.1.Preliminary data analysis
For this study were considered participants within the range of 18 years to 75 years old.
Responses from participants with very low frequencies of consumption of fruit
beverages and cold beverages from plant extracts (below rarely) were excluded from
further analysis.
In France, atypical overall liking ratings were observed for two participants for FTi
sample (p< 0.005) and one participant for UVc sample (p< 0.001). The responses of
these three participants were hence excluded from further analysis.
The resulting number of participants was 133 for Portugal, 124 for United Kingdom and
133 for France.
2.3.7.2.Consumer acceptance measures
Analysis of Variance (ANOVA) was performed on overall liking ratings for the three
samples, considering participants and samples as sources of variation. Mean sample
ratings were calculated and significant differences between them tested post-hoc using
Tukey’s HSD (Honest Significant Difference) tests. Pair-wise Pearson correlations
between samples’ overall liking ratings were then computed to assess their degree of
association.
Hierarchical cluster analysis (Euclidean distances and Complete linkage agglomeration
method) was subsequently performed to identify groups of participants with dissimilar
patterns of sample liking. Analysis of Variance (ANOVA) was performed on within-
clusters’ overall liking ratings for the four samples, considering participants and
samples as sources of variation. Within-cluster mean sample ratings were calculated and

AFTER (G.A n°245025) – Deliverable 5.4.2.3 Report on near-market consumer testing of new improved products in Europe for
Group 3
29
significant differences between them tested post-hoc using Tukey’s HSD tests. The
existence of significant differences between clusters’ mean ages was assessed using
Student’s t-tests. Finally, the existence of significant differences between clusters’
gender proportions was evaluated by Pearson's chi-square tests with Monte Carlo
procedure.
The frequency of intensity ratings (TW, JAR, TS) for each of the three sensory
attributes evaluated by participants was determined for each sample, and the
corresponding proportions calculated. A Correspondence Analysis (CA) was then
performed on the contingency table of proportions for all samples and attributes
(Popper, 2014). The frequency of intensity ratings for each sample and attribute was
finally tallied for each cluster of participants based on overall liking ratings.
A penalty analysis (Popper, 2014) was employed to relate attribute intensity ratings to
overall liking ratings for each participant and sample. To this end, participants were
grouped according to their intensity ratings for each sample and attribute, and mean
overall liking ratings for each group were computed. The overall liking mean drops, or
penalties, obtained when comparing the TW and the TS group with JAR participants
were then calculated. Weighted penalties (Popper, 2014) were equally computed by
taking both the mean drops and the proportion of participants in each group.
2.3.7.3.Consumer Sensory profiling
The frequency with which each of the 24 descriptors was checked by participants for
each sample plus the ideal drink was tallied and the corresponding proportions
calculated. To investigate which descriptors were more frequently co-elicited across
samples, a Multidimensional Scaling (MDS) procedure were applied to the chi-square
distances’ matrix of descriptors (Meyners & Castura, 2014). A Cochran’s Q test was
performed for each descriptor, followed by the computation of multiple pair-wise
comparisons with the Marascuilo procedure, to assess the extent to which it
discriminated between samples (Meyners & Castura, 2014; Meyners, Castura, & Carr,
2013). To obtain a bi-dimensional representation of CATA results a CA was performed
(Meyners & Castura, 2014) for descriptors discriminating significantly (p<0.05)
between samples, ideal drink included.
A penalty-lift analysis (Williams, 2011) was employed to relate participants’ choices of
descriptors for each hibiscus drink evaluated to the corresponding overall liking ratings.
AFTER (G.A n°245025) – Deliverable 5.4.2.3 Report on near-market consumer testing of new improved products in Europe for
Group 3
30
To this end, sample overall liking ratings were averaged across all participants for
which the descriptor under consideration was elicited and for which it was not. A
positive penalty-lift was obtained when the former was higher than the later and
negative penalty-lift when the reversed occurred.
2.3.7.4.Relating consumer acceptance measures and sensory profiling
results
A multiple factor analysis (MFA) was performed (Ares, Varela, Rado, & Giménez,
2011), considering overall liking ratings, the frequency of intensity ratings of the
sensory attributes evaluated and the frequency of choice of discriminating CATA
descriptors, across all samples and participants, as active variables.
2.4. Results and discussion
2.4.1. Consumer acceptance, overall liking ratings
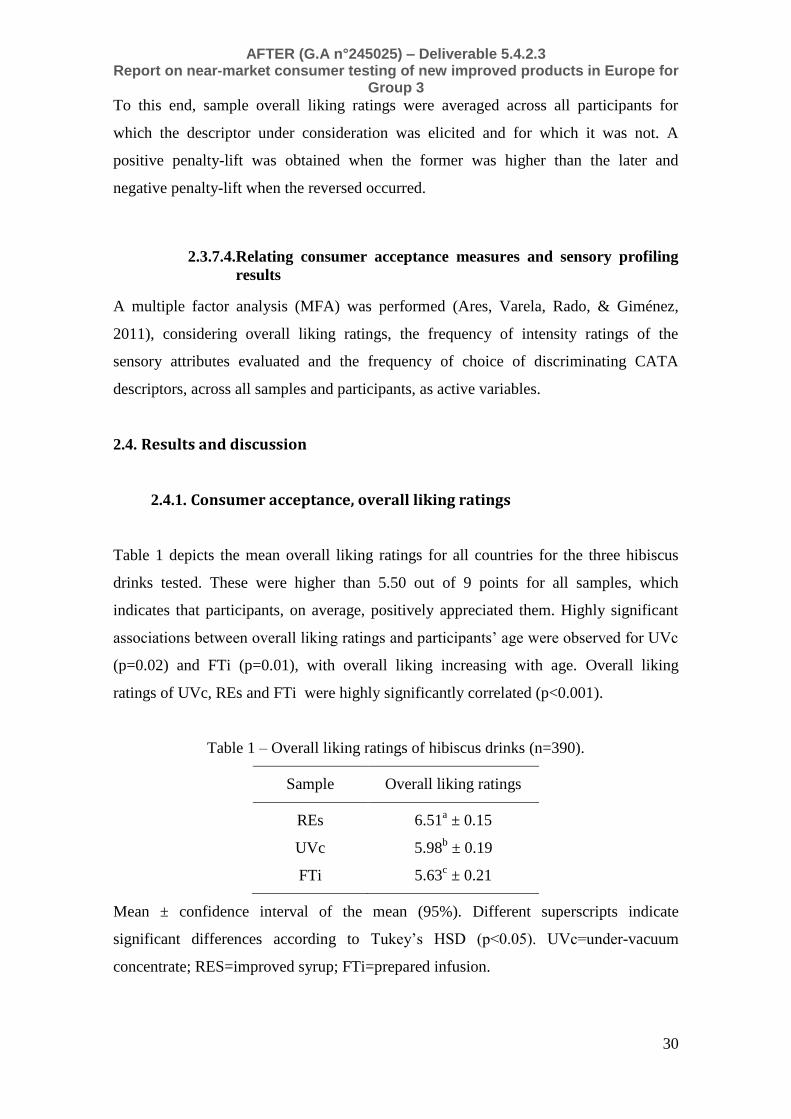
Table 1 depicts the mean overall liking ratings for all countries for the three hibiscus
drinks tested. These were higher than 5.50 out of 9 points for all samples, which
indicates that participants, on average, positively appreciated them. Highly significant
associations between overall liking ratings and participants’ age were observed for UVc
(p=0.02) and FTi (p=0.01), with overall liking increasing with age. Overall liking
ratings of UVc, REs and FTi were highly significantly correlated (p<0.001).
Table 1 – Overall liking ratings of hibiscus drinks (n=390).
Sample Overall liking ratings
REs 6.51a ± 0.15
UVc 5.98b ± 0.19
FTi 5.63c ± 0.21
Mean ± confidence interval of the mean (95%). Different superscripts indicate
significant differences according to Tukey’s HSD (p<0.05). UVc=under-vacuum
concentrate; RES=improved syrup; FTi=prepared infusion.

AFTER (G.A n°245025) – Deliverable 5.4.2.3 Report on near-market consumer testing of new improved products in Europe for
Group 3
31
Similar preference profiles were observed across countries as shown in Figure 4,
however slightly higher results were obtained in France. Mean overall liking ratings of
5.5 out of 9 were obtained for all countries for the improved hibiscus drinks (UVc and
FTi) but not for the traditional infusion.
Figure 4 - Means of the overall liking ratings of hibiscus drinks per country. Different
superscripts within a cluster indicate significant differences according Tukey’s HSD
(p<0.05). UVc=under-vacuum concentrate; RES=improved syrup; FTi= prepared
infusion.
Hierarchical clustering yielded three clusters of participants with distinct overall liking
patterns of hibiscus drinks, as depicted in Figures 5 and 6. The clusters identified were:
Overall likers (C1;51%) - who liked all the tested drinks slightly to moderately, New
drinks likers (C2;24%) who liked the new concentrate and syrup slightly to moderately
but disliked the prepared infusion and finally the Syrup likers (C3;25%) who slightly
liked REs but disliked both UVc and FTi. No significant differences between clusters
related with countries and gender were observed. However significant differences were
detected for age (p<0.01), with participants of cluster 3 (Syrup likers) being younger
than participants in the other clusters (Mean age - C1:�̅�=32.2, C2:�̅�=32.5.
C3:�̅�=27.4). Cluster analysis per country yielded similar patterns of acceptance across
countries
6.43a 5.86b
5.46b
6.84a 6.21b 6.21b 6.26a
5.87a 5.23b
1
2
3
4
5
6
7
8
9
REs UVc FTi REs UVc FTi REs UVc FTi
Ov
era
ll l
ikin
g
U.Kingdon (n=124) France (n=133) Portugal (n=133)

AFTER (G.A n°245025) – Deliverable 5.4.2.3 Report on near-market consumer testing of new improved products in Europe for
Group 3
32
Figure 5 – Hierarchical clustering dendogram segmenting participants according to their
overall liking patterns of hibiscus drinks (n=390).
Figure 6 - Means of the overall liking ratings of hibiscus drinks per cluster for all
participants (n=390). Error bars represent confidence intervals of means (p=0.95).
Different superscripts within a cluster indicate significant differences according Tukey’s
HSD (p<0.05). UVc=under-vacuum concentrate; RES=improved syrup; REi=improved
infusion; FTi=prepared infusion.
6.63 b 7.06a
7.11a
6.42a 6.52a
3.79b
6.34a
3.35c
4.41b
1
2
3
4
5
6
7
8
9
REs UVc FTi REs UVc FTi REs UVc FTi
Ove
rall
likin
g
C1 (51%) Overall likers
C3 (25%) Syrup likers
C2 (24%) New drinks likers
AFTER (G.A n°245025) – Deliverable 5.4.2.3 Report on near-market consumer testing of new improved products in Europe for
Group 3
33
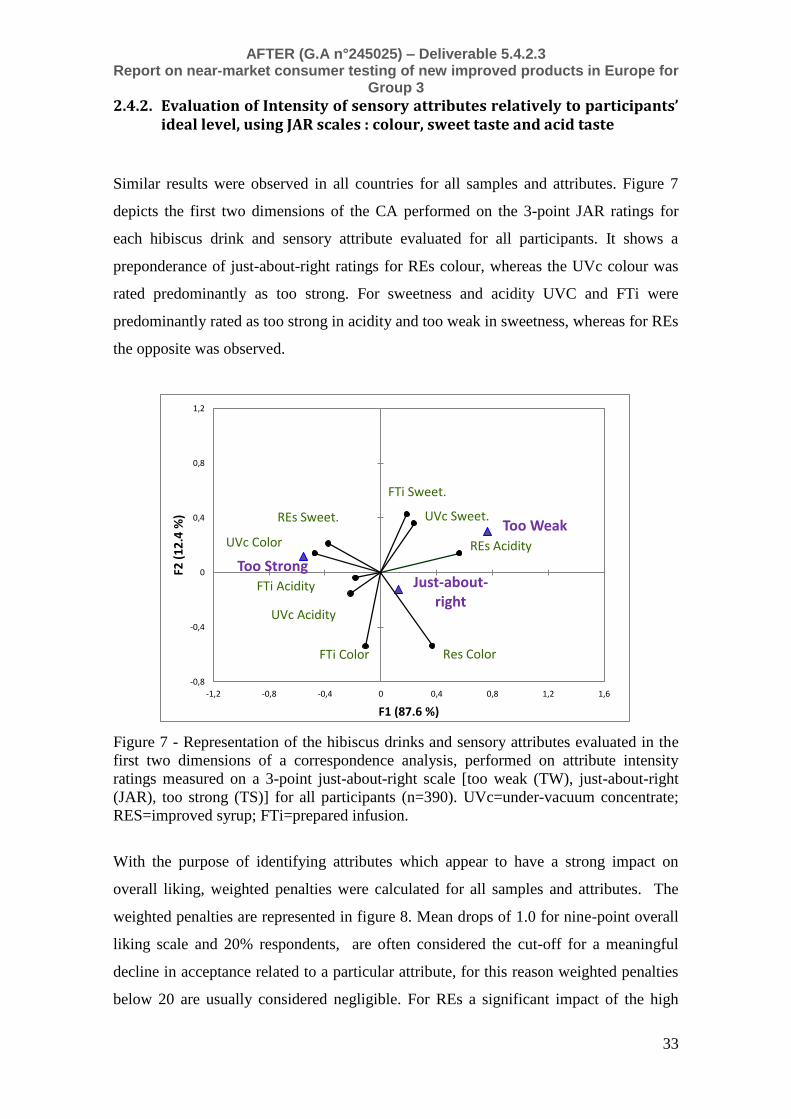
2.4.2. Evaluation of Intensity of sensory attributes relatively to participants’ ideal level, using JAR scales : colour, sweet taste and acid taste
Similar results were observed in all countries for all samples and attributes. Figure 7
depicts the first two dimensions of the CA performed on the 3-point JAR ratings for
each hibiscus drink and sensory attribute evaluated for all participants. It shows a
preponderance of just-about-right ratings for REs colour, whereas the UVc colour was
rated predominantly as too strong. For sweetness and acidity UVC and FTi were
predominantly rated as too strong in acidity and too weak in sweetness, whereas for REs
the opposite was observed.
Figure 7 - Representation of the hibiscus drinks and sensory attributes evaluated in the
first two dimensions of a correspondence analysis, performed on attribute intensity
ratings measured on a 3-point just-about-right scale [too weak (TW), just-about-right
(JAR), too strong (TS)] for all participants (n=390). UVc=under-vacuum concentrate;
RES=improved syrup; FTi=prepared infusion.
With the purpose of identifying attributes which appear to have a strong impact on
overall liking, weighted penalties were calculated for all samples and attributes. The
weighted penalties are represented in figure 8. Mean drops of 1.0 for nine-point overall
liking scale and 20% respondents, are often considered the cut-off for a meaningful
decline in acceptance related to a particular attribute, for this reason weighted penalties
below 20 are usually considered negligible. For REs a significant impact of the high
Too Weak
Just-about-right
Too Strong
Res Color
REs Sweet.
REs Acidity UVc Color
UVc Sweet.
UVc Acidity
FTi Color
FTi Sweet.
FTi Acidity
-0,8
-0,4
0
0,4
0,8
1,2
-1,2 -0,8 -0,4 0 0,4 0,8 1,2 1,6
F2 (
12
.4 %
)
F1 (87.6 %)

AFTER (G.A n°245025) – Deliverable 5.4.2.3 Report on near-market consumer testing of new improved products in Europe for
Group 3
34
sweetness was observed. Oppositely for UVc and the FTi strong colour acidity and
weak sweetness led to a significant decrease in overall liking.
Figure 8 - Representation of the weighted penalty values relating overall liking ratings
drops for each sample and attribute in relation with JAR attribute intensity ratings for all
participants (n=390). UVc=under-vacuum concentrate; RES=improved syrup;
FTi=prepared infusion.
2.4.3. CATA profiling
The CATA terms used were: acid, bitter, astringent, strong taste, balanced flavour
natural, fruity, syrup, light red, dark red, tisane, floral, sweet, artificial, refreshing, new,
healthy, invigorating, red fruits, simple, watery, different/unknown, high calorie,
antioxidant.
Participants used between 1 and 15 CATA question terms to describe the three
evaluated drinks and their ideal beverage with an average of five terms per drink.
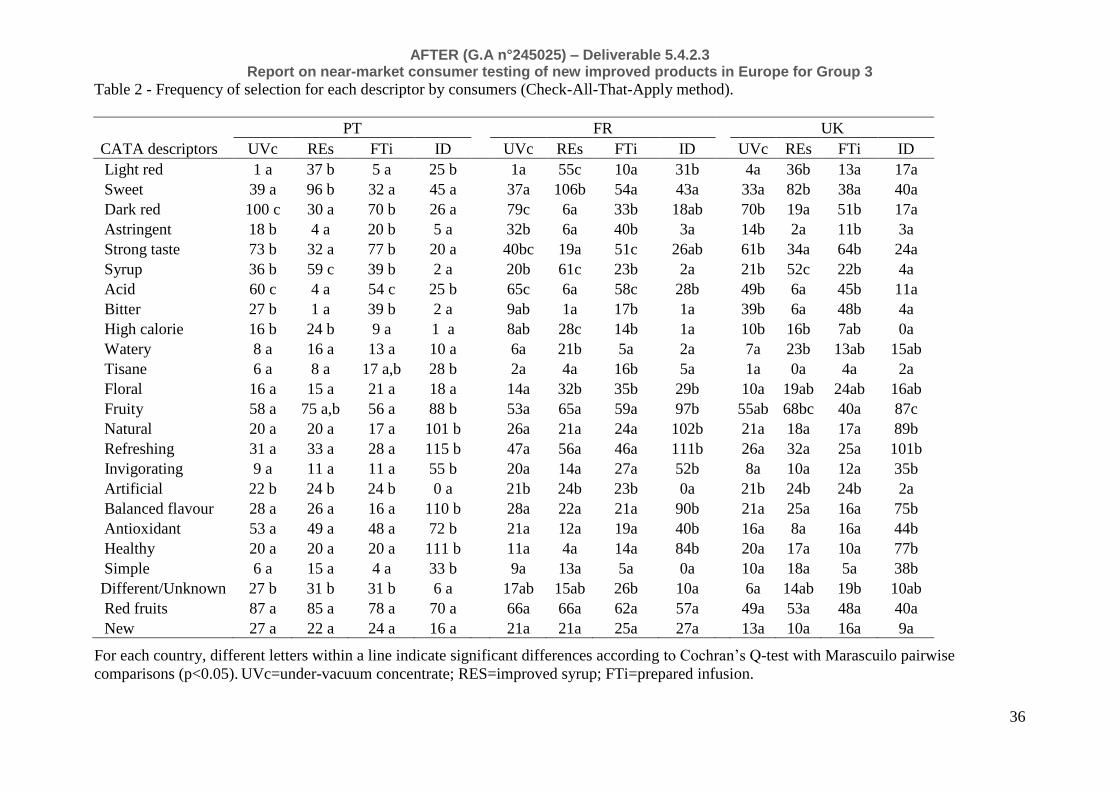
Significant differences in descriptors’ frequencies between hibiscus samples were found
for 9 descriptors in PT, 11 for UK and 12 in FR (p<0.05), as shown in table 2. The
terms red fruits and new were non-discriminating in all countries for all drinks including
the ideal drink. The terms balanced flavor, artificial, healthy, natural, refreshing,
invigorating, antioxidant and simple were non-discriminating for the three evaluated
drinks but significant frequencies of elicitation were used to describe the ideal drink.
Tisane and new were among the less frequently chosen terms, suggesting consumers in
-100 -80 -60 -40 -20 0 20 40 60 80 100
FTi Acidity
FTi Sweetness
FTi Color
UVc Acidity
UVc Sweetness
UVc Color
REs Acidity
REs Sweetness
Res Color
Weighted penalties Too Weak Too Strong
AFTER (G.A n°245025) – Deliverable 5.4.2.3 Report on near-market consumer testing of new improved products in Europe for
Group 3
35
general did not recognize the drink as an extract of an unknown plant. Oppositely the
most frequently chosen terms were fruity and red fruits suggesting participants
misidentified the drinks as red fruits beverages.
The first three dimensions of the Multidimensional scaling (MDS) representation
determined on chi-square distances of CATA descriptors for all participants is
represented in figure 9 uncovering relationships between descriptors and indirectly with
samples’ profiles. It shows that attributes astringent, bitter, acid, dark red and strong
taste were frequently co-elicited by participants, in a smaller degree they were also co-
elicited with the attributes new, red fruits and different/unknown. Natural, invigorating
and healthy were also frequently coelicited as were high calorie and syrup and finally
watery and sweet. As expected, contrasting attributes like healthy and artificial or
healthy and high calorie seemed to be rarely selected together.
AFTER (G.A n°245025) – Deliverable 5.4.2.3 Report on near-market consumer testing of new improved products in Europe for Group 3
36
Table 2 - Frequency of selection for each descriptor by consumers (Check-All-That-Apply method).
CATA descriptors
PT FR UK
UVc REs FTi ID UVc REs FTi ID UVc REs FTi ID
Light red 1 a 37 b 5 a 25 b 1a 55c 10a 31b 4a 36b 13a 17a
Sweet 39 a 96 b 32 a 45 a 37a 106b 54a 43a 33a 82b 38a 40a
Dark red 100 c 30 a 70 b 26 a 79c 6a 33b 18ab 70b 19a 51b 17a
Astringent 18 b 4 a 20 b 5 a 32b 6a 40b 3a 14b 2a 11b 3a
Strong taste 73 b 32 a 77 b 20 a 40bc 19a 51c 26ab 61b 34a 64b 24a
Syrup 36 b 59 c 39 b 2 a 20b 61c 23b 2a 21b 52c 22b 4a
Acid 60 c 4 a 54 c 25 b 65c 6a 58c 28b 49b 6a 45b 11a
Bitter 27 b 1 a 39 b 2 a 9ab 1a 17b 1a 39b 6a 48b 4a
High calorie 16 b 24 b 9 a 1 a 8ab 28c 14b 1a 10b 16b 7ab 0a
Watery 8 a 16 a 13 a 10 a 6a 21b 5a 2a 7a 23b 13ab 15ab
Tisane 6 a 8 a 17 a,b 28 b 2a 4a 16b 5a 1a 0a 4a 2a
Floral 16 a 15 a 21 a 18 a 14a 32b 35b 29b 10a 19ab 24ab 16ab
Fruity 58 a 75 a,b 56 a 88 b 53a 65a 59a 97b 55ab 68bc 40a 87c
Natural 20 a 20 a 17 a 101 b 26a 21a 24a 102b 21a 18a 17a 89b
Refreshing 31 a 33 a 28 a 115 b 47a 56a 46a 111b 26a 32a 25a 101b
Invigorating 9 a 11 a 11 a 55 b 20a 14a 27a 52b 8a 10a 12a 35b
Artificial 22 b 24 b 24 b 0 a 21b 24b 23b 0a 21b 24b 24b 2a
Balanced flavour 28 a 26 a 16 a 110 b 28a 22a 21a 90b 21a 25a 16a 75b
Antioxidant 53 a 49 a 48 a 72 b 21a 12a 19a 40b 16a 8a 16a 44b
Healthy 20 a 20 a 20 a 111 b 11a 4a 14a 84b 20a 17a 10a 77b
Simple 6 a 15 a 4 a 33 b 9a 13a 5a 0a 10a 18a 5a 38b
Different/Unknown 27 b 31 b 31 b 6 a 17ab 15ab 26b 10a 6a 14ab 19b 10ab
Red fruits 87 a 85 a 78 a 70 a 66a 66a 62a 57a 49a 53a 48a 40a
New 27 a 22 a 24 a 16 a 21a 21a 25a 27a 13a 10a 16a 9a
For each country, different letters within a line indicate significant differences according to Cochran’s Q-test with Marascuilo pairwise
comparisons (p<0.05). UVc=under-vacuum concentrate; RES=improved syrup; FTi=prepared infusion.

AFTER (G.A n°245025) – Deliverable D5.4.2.3
Report on near-market consumer testing in Europe for Group3
37
Figure 9 – Representation of the multidimensional scaling of all CATA descriptors
frequencies for all participants (n=390) and drinks (UVc, REs, FTi, ID) based on chi-square
distances.
The first two dimensions of the Correspondence Analysis performed on discriminating terms
explained 96.3% of the variability as shown in figure 10. CA biplot showed that REs was
perceived to have a highly distinct sensory profile when compared with FTi and UVc. While
REs was attributed with mild descriptors (sweet, watery, syrupy and light red), UVc and FTi
were related to more aggressive ones (strong taste, acidic, bitter, astringent, dark red). ID was
mainly described using non-sensory descriptors, emotional and hedonic terms like healthy,
natural, refreshing, invigorating and antioxidant and balanced flavour. The descriptors tisane,
simple and fruity although not well represented in the CA biplot were, nevertheless, mainly
associated with ID.
Bitter
Astringent
Acid
Strong taste Dark red
Different/Unknown
Artificial
Tisane
Floral New
Red fruits
Syrup High calorie
Watery
Antioxydant
Fruity
Sweet
Invigorating
Refreshing
Natural
Balanced flavour
simple
Healthy
Light red
-0,8
-0,6
-0,4
-0,2
0
0,2
0,4
0,6
0,8
-0,6 -0,4 -0,2 0 0,2 0,4 0,6Dim
2
Dim1

AFTER (G.A n°245025) – Deliverable D5.4.2.3
Report on near-market consumer testing in Europe for Group3
38
Figure 10 - Representation of the hibiscus drinks and sensory attributes evaluated in the first
two dimensions of a correspondence analysis, performed on CATA discriminating terms for
all participants (n=390). UVc=under-vacuum concentrate; RES=improved syrup;
FTi=prepared infusion; ID=ideal drink.
2.4.4. Relationship between CATA, JAR and Hedonic Overall appreciation
A Multiple Factor Analysis (MFA) was used to relate consumer’s overall liking ratings, JAR
ratings and CATA terms frequency of elicitation, for the three evaluated drinks and all
consumers. The two first dimensions of the MFA projective mapping data of the samples and
centroids are represented in Figure 11, corresponding to 94.3% of the explained variability. It
shows a good differentiation among drinks and good agreement between appropriateness
evaluations using JAR scales and CATA evaluations for all Hibiscus drinks.
REs
UVc
FTi
ID
Light red Sweet
simple
Dark red
Antioxydant
Healthy
Tisane
Floral
Invigorating
Artificial
Balanced flavour
Astringent Strong taste
Syrup
High calorie
Different / Unknown
Watery
Acid
Refreshing
Bitter
Fruity
Natural
-0,7
0
-0,7 0 0,7
F2 (
35
.1 %
)
F1 (61.2 %)
Contribution biplot (96.3 %)

AFTER (G.A n°245025) – Deliverable D5.4.2.3
Report on near-market consumer testing in Europe for Group3
39
Figure 11 – Partial representation of Hibiscus drinks in the first two dimensions of MFA
analysis of CATA descriptors, attribute intensity ratings measured on a 3-point just-about-
right scale and overall liking scores. UVc=under-vacuum concentrate; RES=improved syrup;
FTi=prepared infusion.
2.5. Conclusions
In spite of their varying sensory characteristics, all the hibiscus drinks evaluated were in
average positively appreciated by consumers. Similar preference profiles were observed
across countries although French participants were the ones that appreciated the drinks the
most. The new drinks developed under AFTER scope were significantly more appreciated
then the traditional infusion freshly prepared from dried hibiscus calices used as baseline
comparison. Clusters analysis performed showed new hibiscus drinks were liked slightly too
moderately by participants in Clusters C1 (Overall likers) and C2 (New drinks’ likers), which
represented about 75% of participants in the study. Overall liking assessments were
complemented by attribute intensity evaluations and sensory profiling to provide important
insights about hibiscus drinks’ perception and acceptability. The evaluation of the intensity of
three sensory attributes - colour, sweet taste and acid taste -, relatively to participants’ ideal
REs.PT
REs.FR
REs.UK UVc.PT
UVc.FR
UVc.UK
FTi.PT
FTi.FR
FTi.UK
ID.PT
ID.FR
ID.UK
-2,5
-1,5
-0,5
0,5
1,5
-3 0 3
F2 (
29
,3 %
)
F1 (65,0 %)

AFTER (G.A n°245025) – Deliverable D5.4.2.3
Report on near-market consumer testing in Europe for Group3
40
level and it’s relation with overall liking ratings, showed for REs a significant negative impact
of the high sweetness on the drink overall liking. Oppositely for UVc the strong colour and
acidity and weak sweetness led to a significant decrease in overall liking. These results were
in accordance with the ones obtained on CATA-derived sensory profiles. CATA profiles were
similar in the three countries, concerning both the actual drinks tested and an ideal theoretical
drink. REs was perceived to have a highly distinct sensory profile when compared with FTi
and UVc, and these with the described ideal drink. CATA results also suggested also that
most consumers did not recognize the tested drink as an extract of an unknown plant, hibiscus
and misidentified it as a red fruits beverage.
Important drivers for further sensory optimization of the new hibiscus drinks were uncovered
through the employment of JAR, CATA and overall liking assessments.
In the case of REs although being the most appreciated drink, its high sweetness was an
important penalizing factor in consumers acceptance as a drink, nevertheless other uses for
this syrup can be foreseen (flavoring hot and cold teas, cocktails, yogurts and other fermented
dairy and non-dairy products, smoothies, frozen desserts and others) where it’s strong
sweetness might have a positive impact on consumers evaluation. UVc drink was prepared
following the same dilution used in the previous study held in Senegal, where hibiscus drinks
are very popular and consumers are used to their strong character, robust colour and strong
acidity, therefore the usage of a bigger dilution of the concentrate to prepare the drink while
maintaining an equilibrated degree of added sugar can lead to a significant improvement of
consumers’ acceptance.
Besides exploring further opportunities for enhancing the sensory profiles of the new drinks
in line with European taste, future studies should also investigate the levels of marketing
activities (pricing, distribution and promotional information – including nutritional and
healthiness attributes) which will best support their successful introduction in European
markets.

AFTER (G.A n°245025) – Deliverable D5.4.2.3
Report on near-market consumer testing in Europe for Group3
41
2.6. Acknowledgement
This publication is an output from a research project funded by the European Union
(FP7 245–025) called African Food Revisited by Research (AFTER - http://www.after-
fp7.eu/),with additional financial support and FCT (Fundação para a Ciência e a Tecnologia)
– PEst OE/EQB/LA0016/2013.The views expressed are not necessarily those of the European
Union.
2.7. References
Arnold, T.H., Wells, M.J., Wehmeyer, A.S. Khoisan food plants: taxa with potential for
future economic exploitation. In: Plants for Arid Lands, Wickens, G.E.; Goodin, J.R.;
Field, D.V. (eds.), Allen and Unwin, London, UK, 69-86: 1985.
Adams, J., Williams, A., Lancaster, B., & Foley, M. (2007). Advantages and uses of
check-all-that-apply response compared to traditional scaling of attributes for salty snacks.
Paper presented at the 7th Rose-Marie Pangborn Sensory Science symposium,
Minneapolis, MN, USA.
Ares, G., Barreiro, C., Deliza, R., Giménez, A. N. A., & Gámbaro, A. (2010). Application
of a check-all-that-apply question to the development of chocolate milk desserts. Journal of
Sensory Studies, 25(Ss1), 67-86. doi: 10.1111/j.1745-459X.2010.00290.x
Ares, G., Varela, P., Rado, G., & Giménez, A. (2011). Are consumer profiling techniques
equivalent for some product categories? The case of orange-flavoured powdered drinks.
International Journal of Food Science & Technology, 46(8), 1600-1608. doi:
10.1111/j.1365-2621.2011.02657.x
Bolade, M. K., Oluwalana, I. B., & Ojo, O. (2009). Commercial practice of roselle
(Hibiscus sabdariffa L.) beverage production: Optimization of hot water extraction and
sweetness level. World Journal of Agricultural Sciences, 5(1), 126-131.
Cisse, M., Dornier, M., Sakho, M., MarDiop, C., Reynes, M., & Sock, O. (2009a). La
production du bissap (Hibiscus sabdariffa L.) au Sénégal. Fruits, 64(2), 111-124. doi:
10.1051/fruits/2009006

AFTER (G.A n°245025) – Deliverable D5.4.2.3
Report on near-market consumer testing in Europe for Group3
42
Cisse, M., Dornier, M., Sakho, M., Ndiaye, A., Reynes, M., & Sock, O. (2009b). Le bissap
(Hibiscus sabdariffa L.) : composition et principales utilisations. Fruits, 64(3), 179-193.
doi: 10.1051/fruits/2009013
Da-Costa-Rocha, I., Bonnlaender, B., Sievers, H., Pischel, I., & Heinrich, M. (2014).
Hibiscus sabdariffa L. – A phytochemical and pharmacological review. Food Chemistry,
165, 424-443. doi: 10.1016/j.foodchem.2014.05.002
Jones, L. V., Peryam, D. R., & Thurstone, L. L. (1955). Development of a scale for
measuring soldiers' food preferences. Journal of Food Science, 20(5), 512-520. doi:
10.1111/j.1365-2621.1955.tb16862.x
Gruenwald, J.; Galizia, M. In Adansonia digitata L. Baobab, United Nations Conference
on trade and development, 2005; UNCTAD /DITC/TED: 2005.
Jones, L. V., Peryam, D. R., & Thurstone, L. L. (1955). Development of a scale for
measuring soldiers' food preferences. Journal of Food Science, 20(5), 512-520. doi:
10.1111/j.1365-2621.1955.tb16862.x
Meyners, M., & Castura, J. C. (2014). Check-All-That-Apply questions. In P. Varela & G.
Ares (Eds.), Novel Techniques in Sensory Characterization and Consumer Profiling (pp.
271-305). Boca Raton: CRC Press
Meyners, M., Castura, J. C., & Carr, B. T. (2013). Existing and new approaches for the
analysis of CATA data. Food Quality and Preference, 30(2), 309-319. doi:
10.1016/j.foodqual.2013.06.010
Mohamed, B. B., Sulaiman, A. A., & Dahab, A. A. (2012). Roselle (Hibiscus sabdariffa
L.) in Sudan, cultivation and their uses. Bulletin of Environment, Pharmacology and Life
Sciences 1(6), 48-54.
AFTER (G.A n°245025) – Deliverable D5.4.2.3
Report on near-market consumer testing in Europe for Group3
43
Morton, J. F. (1987). Roselle. In C. F. Dowling (Ed.), Fruits of warm climates (pp. 281-
286). Greensborough, NC: Media Incorporated
Nour, A. A.; Magboul, B. I.; Kheiri, N. H., Chemical composition of baobab fruit
(Adansonia digitata L.). Tropical Sciences 1980, 22, 383-388.
Peryam, D. R., & Girardot, N. F. (1952). Advanced taste-test method. Food Engineering,
24(7), 58-61.
Peryam, D. R., & Pilgrim, F. J. (1957). Hedonic scale method of measuring food
preferences. Food Technology, 11(Suppl.), 9-14.
Plotto, A., Mazaud, F., Röttger, A., & Steffel, K. (2004). Hibiscus: Post-production
management for improved market access organisation: Food and Agriculture Organization
of the United Nations (FAO), AGST.
Popper, R. (2014). Use of Just-About-Right scales in consumer research. In P. Varela & G.
Ares (Eds.), Novel Techniques in Sensory Characterization and Consumer Profiling (pp.
137-155). Boca Raton: CRC Press
Ramírez-Rodrigues, M. M., Balaban, M. O., Marshall, M. R., & Rouseff, R. L. (2011). Hot
and cold water infusion aroma profilesof Hibiscus sabdariffa: fresh compared with dried.
Journal of Food Science, 76(2), C212-C217. doi: 10.1111/j.1750-3841.2010.01989.x
Ross, I. A. (2003). Medicinal plants of the world (Vol. 1). Totowa, NJ: Humana Press.
Sáyago-Ayerdi, S. G., Arranz, S., Serrano, J., & Goñi, I. (2007). Dietary fiber content and
associated antioxidant compounds in roselle flower (Hibiscus sabdariffa L.) beverage.
Journal of Agricultural and Food Chemistry, 55(19), 7886-7890. doi: 10.1021/jf070485b
Williams, A., Carr, B.T., & Popper, R. (2011). Exploring analysis options for check-all-
that-apply (CATA) questions. Paper presented at the 9th Rose-Marie Sensory Science
symposium, Toronto, Canada.

AFTER (G.A n°245025) – Deliverable D5.4.2.3
Report on near-market consumer testing in Europe for Group3
44
Annex 1. Baobab consumer questionnaire
AFTER PT OUT14 BAOBAB
Q49
Q37 Muito obrigada por participar nesta sessão de avaliação de bebidas, que terá uma duração
aproximada de 10 minutos. Ser-lhe-à pedido que prove 4 bebidas, uma de cada vez, por uma
ordem predeterminada, e que responda a algumas questões. Leia cuidadosamente as
instruções à medida que forem aparecendo no ecrã do seu computador. Por favor não troque
impressões com os outros provadores. Não existem respostas certas ou erradas, o importante é
podermos obter a sua opinião pessoal. Note que, uma vez respondidas as questões, o software
não lhe permitirá retornar aos ecrãs precedentes. Não hesite em solicitar ajuda se tiver alguma
dúvida ou se precisar de qualquer tipo de assistência. Dê agora início à sua participação
clicando em >>. Obrigada!
Q5 POR FAVOR INDIQUE Sexo:
Feminino (1)
Maculino (2)

AFTER (G.A n°245025) – Deliverable D5.4.2.3
Report on near-market consumer testing in Europe for Group3
45
Q7 Ano de nascimento:
1935 (1)
1936 (2)
1937 (3)
1938 (4)
1939 (5)
1940 (6)
1941 (7)
1942 (8)
1943 (9)
1944 (10)
1945 (11)
1946 (12)
1947 (13)
1948 (14)
1949 (15)
1950 (16)
1951 (17)
1952 (18)
1953 (19)
1954 (20)
1955 (21)
1956 (22)
1957 (23)
1958 (24)
1959 (25)
1960 (26)
1961 (27)
1962 (28)
1963 (29)
1964 (30)
1965 (31)
1966 (32)
1967 (33)
1968 (34)
1969 (35)
1970 (36)
1971 (37)
1972 (38)
1973 (39)
1974 (40)
1975 (41)
1976 (42)
1977 (43)
AFTER (G.A n°245025) – Deliverable D5.4.2.3
Report on near-market consumer testing in Europe for Group3
46
1978 (44)
1979 (45)
1980 (46)
1981 (47)
1982 (48)
1983 (49)
1984 (50)
1985 (51)
1986 (52)
1987 (53)
1988 (54)
1989 (55)
1990 (56)
1991 (57)
1992 (58)
1993 (59)
1994 (60)
1995 (61)
1996 (62)
1997 (63)
1998 (64)
1999 (65)
2000 (66)
Q15 Nacionalidade:
Portuguesa (1)
Outra, por favor especifique: (2) ____________________
Q12 País de residência
Portugal (1)
Outra, por favor especifique: (2) ____________________
Q39 Nível de estudos
9º ano ou menos (1)
10º, 11º ou 12º ano (2)
Bacharelato ou licenciatura (3)
Mestrado ou doutoramento (4)
Q17 Costuma consumir bebidas ou sumos à base de fruta?
Sim, diariamente (1)
Sim, uma ou mais vezes por semana (2)
Sim, uma ou mais vezes por mês (3)
Raramente (4)
Nunca (5)

AFTER (G.A n°245025) – Deliverable D5.4.2.3
Report on near-market consumer testing in Europe for Group3
47
Q18 Porque consome bebidas ou sumos à base de fruta? (Assinale todas as razões que se
apliquem)
Sabor (1)
Saúde (2)
Energia (3)
Matar a sede/refrescar (4)
Nutrição (5)
Preço acessível (6)
Hábito (7)
Q23 Por favor prove agora a bebida 243
Q25 GLOBALMENTE, QUANTO GOSTOU da bebida 243?
Gostei extremamente (1)
Gostei muito (2)
Gostei moderadamente (3)
Gostei ligeiramente (4)
Não gostei nem desgostei (5)
Desgostei ligeiramente (6)
Desgostei moderadamente (7)
Desgostei muito (8)
Desgostei extremamente (9)
Q26 Para si, a COR da bebida 243 é:
Demasiado clara (1)
Como gosto (2)
Demasiado escura (3)
Q27 Para si, a DOÇURA da bebida 243 é:
Insuficiente (1)
Como gosto (2)
Excessiva (3)

AFTER (G.A n°245025) – Deliverable D5.4.2.3
Report on near-market consumer testing in Europe for Group3
48
Q54 Para si, a ACIDEZ da bebida 243 é:
Insuficiente (1)
Como gosto (2)
Excessiva (3)
Q60 Para si, o SABOR A FRUTA da bebida 243 é:
Insuficiente (1)
Como gosto (2)
Excessivo (3)
Q30 CONSUMIRIA a bebida 243, se ela estivesse disponivel no mercado?
10- Sim (1)
9- É quase certo (2)
8- Muito provavelmente (3)
7- Provavelmente (4)
6- Boa possibilidade (5)
5- Possibilidade média (6)
4- Possibilidade razoável (7)
3- Alguma possibilidade (8)
2- Possibilidade ligeira (9)
1- Possibilidade muito ligeira (10)
0- Não (11)
Q69 Por favor prove agora a bebida 171.
Q52 GLOBALMENTE, QUANTO GOSTOU da bebida 171?
Gostei extremamente (1)
Gostei muito (2)
Gostei moderadamente (3)
Gostei ligeiramente (4)
Não gostei nem desgostei (5)
Desgostei ligeiramente (6)
Desgostei moderadamente (7)
Desgostei muito (8)
Desgostei extremamente (9)
Q57 Para si, a COR da bebida 171 é:
Demasiado clara (1)
Como gosto (2)
Demasiado escura (3)

AFTER (G.A n°245025) – Deliverable D5.4.2.3
Report on near-market consumer testing in Europe for Group3
49
Q56 Para si, a DOÇURA da bebida 171 é:
Insuficiente (1)
Como gosto (2)
Excessiva (3)
Q55 Para si, a ACIDEZ da bebida 171 é:
Insuficiente (1)
Como gosto (2)
Excessiva (3)
Q61 Para si, o SABOR A FRUTA da bebida 171 é:
Insuficiente (1)
Como gosto (2)
Excessivo (3)
Q53 CONSUMIRIA a bebida 171, se ela estivesse disponivel no mercado?
10- Sim (1)
9- É quase certo (2)
8- Muito provavelmente (3)
7- Provavelmente (4)
6- Boa possibilidade (5)
5- Possibilidade média (6)
4- Possibilidade razoável (7)
3- Alguma possibilidade (8)
2- Possibilidade ligeira (9)
1- Possibilidade muito ligeira (10)
0- Não (11)
Q76 Por favor prove agora a bebida 514.
Q63 GLOBALMENTE, QUANTO GOSTOU da bebida 514?
Gostei extremamente (1)
Gostei muito (2)
Gostei moderadamente (3)
Gostei ligeiramente (4)
Não gostei nem desgostei (5)
Desgostei ligeiramente (6)
Desgostei moderadamente (7)
Desgostei muito (8)
Desgostei extremamente (9)
Q62 Para si, a COR da bebida 514 é:
Demasiado clara (1)
Como gosto (2)
Demasiado escura (3)

AFTER (G.A n°245025) – Deliverable D5.4.2.3
Report on near-market consumer testing in Europe for Group3
50
Q61 Para si, a DOÇURA da bebida 514 é:
Insuficiente (1)
Como gosto (2)
Excessiva (3)
Q60 Para si, a ACIDEZ da bebida 514 é:
Insuficiente (1)
Como gosto (2)
Excessiva (3)
Q62 Para si, o SABOR A FRUTA da bebida 514 é:
Insuficiente (1)
Como gosto (2)
Excessiva (3)
Q58 CONSUMIRIA a bebida 514, se ela estivesse disponivel no mercado?
10- Sim (1)
9- É quase certo (2)
8- Muito provavelmente (3)
7- Provavelmente (4)
6- Boa possibilidade (5)
5- Possibilidade média (6)
4- Possibilidade razoável (7)
3- Alguma possibilidade (8)
2- Possibilidade ligeira (9)
1- Possibilidade muito ligeira (10)
0- Não (11)
Q161 Por favor prove agora a bebida 663.

AFTER (G.A n°245025) – Deliverable D5.4.2.3
Report on near-market consumer testing in Europe for Group3
51
Q162 GLOBALMENTE, QUANTO GOSTOU da bebida 663?
Gostei extremamente (1)
Gostei muito (2)
Gostei moderadamente (3)
Gostei ligeiramente (4)
Não gostei nem desgostei (5)
Desgostei ligeiramente (6)
Desgostei moderadamente (7)
Desgostei muito (8)
Desgostei extremamente (9)
Q163 Para si, a COR da bebida 663 é:
Demasiado clara (1)
Como gosto (2)
Demasiado escura (3)
Q164 Para si, a DOÇURA da bebida 663 é:
Insuficiente (1)
Como gosto (2)
Excessiva (3)
Q165 Para si, a ACIDEZ da bebida 663 é:
Insuficiente (1)
Como gosto (2)
Excessiva (3)
Q166 Para si, o SABOR A FRUTA da bebida 663 é:
Insuficiente (1)
Como gosto (2)
Excessiva (3)
Q167 CONSUMIRIA a bebida 663, se ela estivesse disponivel no mercado?
10- Sim (1)
9- É quase certo (2)
8- Muito provavelmente (3)
7- Provavelmente (4)
6- Boa possibilidade (5)
5- Possibilidade média (6)
4- Possibilidade razoável (7)
3- Alguma possibilidade (8)
2- Possibilidade ligeira (9)
1- Possibilidade muito ligeira (10)
0- Não (11)
Q53 Muito obrigada pela sua participação