
Cytokine Profiles in Nasal Secretions of Patients with ...
53
Cytokine Profiles in Nasal Secretions of Patients with Allergic Rhinitis and Chronic Rhinosinusitis Katrin Elisabeth König Dissertation
Transcript of Cytokine Profiles in Nasal Secretions of Patients with ...

Cytokine Profiles in Nasal Secretions of Patients with
Allergic Rhinitis and Chronic Rhinosinusitis
Katrin Elisabeth König
Dissertation


Aus der Klinik und Poliklinik für Hals-Nasen-Ohrenheilkunde
der Ludwig-Maximilians-Universität München
Direktor: Prof. Dr. med. M. Canis
Cytokine Profiles in Nasal Secretions of Patients with Allergic
Rhinitis and Chronic Rhinosinusitis
Dissertation
zum Erwerb des Doktorgrades der Medizin
an der Medizinischen Fakultät
der Ludwig-Maximilians-Universität
zu München
vorgelegt von
Katrin Elisabeth König
aus
Waiblingen
2017

Mit Genehmigung der Medizinischen Fakultät
der Universität München
Berichterstatter: PD Dr. med. Moritz Gröger
Mitberichterstatter: PD Dr. med. Jesus Bujia
Prof. Dr. med. Carola Berking
Mitbetreuung durch den
promovierten Mitarbeiter: PD Dr. med. Moritz Gröger
Dekan: Prof. Dr. med. dent. Reinhard Hickel
Tag der mündlichen Prüfung: 26.10.2017

I
I Contents
I� Contents ........................................................................................................................ I�
II� Abbreviations............................................................................................................... II�
III� Publications ............................................................................................................. III�
1� Introduction .................................................................................................................. 1�
1.1� Disease characteristics........................................................................................... 1�
1.2� Cytokines ............................................................................................................... 2�
1.3� Pathophysiology of AR ......................................................................................... 4�
1.4� Pathophysiology of CRS ....................................................................................... 5�
1.5� Methodological approach ...................................................................................... 6�
1.6� Current therapy options ......................................................................................... 7�
2� Abstract ......................................................................................................................... 9�
2.1� Background ........................................................................................................... 9�
2.2� Objective ............................................................................................................... 9�
2.3� Methods ................................................................................................................. 9�
2.4� Results ................................................................................................................. 10�
2.5� Conclusions ......................................................................................................... 11�
3� Zusammenfassung ...................................................................................................... 13�
3.1� Hintergrund ......................................................................................................... 13�
3.2� Zielsetzung .......................................................................................................... 13�
3.3� Methoden ............................................................................................................. 13�
3.4� Ergebnisse ........................................................................................................... 14�
3.5� Fazit ..................................................................................................................... 15�
4� Prospects ..................................................................................................................... 17�
5� References .................................................................................................................. 19�
6� Acknowledgements .................................................................................................... 23�
7� Appendix .................................................................................................................... 25�
A� Publications ......................................................................................................... 25�
B� Eidesstattliche Versicherung ............................................................................... 46�

II
II Abbreviations
AR allergic rhinitis
CD cluster of differentiation
CRS chronic rhinosinusitis
CRSsNP chronic rhinosinusitis without nasal polyps
CRSwNP chronic rhinosinusitis with nasal polyps
ECP eosinophil cationic protein
eotaxin eosinophil chemotactic protein
G-CSF granulocyte colony-stimulating factor
GM-CSF granulocyte-macrophage colony-stimulating factor
IFN-� interferon-�
Ig immunoglobulin
IL interleukin
MCP-1 monocyte chemotactic protein
MIP macrophage inflammatory protein
PAR perennial allergic rhinitis
RANTES regulated on activation, normal T cell expressed and secreted
SAR seasonal allergic rhinitis
TH T-helper cell
TNF tumour necrosis factor
Treg regulatory T cells

III
III Publications
K. Konig et al., Cytokine profiles in nasal fluid of patients with seasonal or persistent
allergic rhinitis. Allergy Asthma Clin Immunol 11, 26 (2015); doi: 10.1186/s13223-015-
0093-x
K. Konig et al., Cytokine patterns in nasal secretion of non-atopic patients distinguish
between chronic rhinosinusitis with or without polyps. Allergy Asthma Clin Immunol 12,
19 (2016); doi: 10.1186/s13223-016-0123-3


1
1 Introduction
Allergic rhinitis (AR) and chronic rhinosinusitis (CRS) are common nasal inflammatory
diseases. Despite differences in pathophysiology, clinical symptoms might resemble each
other. Moreover, they are frequently associated (1). In recent years, different endotypes of
these diseases, differentiated by distinct pathophysiological mechanisms, have been found.
New therapeutic approaches aiming at the regulation of the inflammatory process on the
level of cytokines and other mediators require endotyping of CRS and AR. Measuring
cytokine levels in nasal secretions is a non-invasive and close-to-the-source method to learn
more about the inflammatory processes in the individual patient’s nose. The present work
contributes to the effort on finding biomarkers usable in individualised therapy.
1.1 Disease characteristics
The definition of AR is based on symptoms which include nasal obstruction and
rhinorrhoea, nasal itching, and sneezing (2). These symptoms are reversible spontaneously
or under treatment. The differential diagnoses of AR comprise CRS, infections, mechanical
factors such as adenoidal hypertrophy, granulomas and tumours, ciliary defects, and
cerebrospinal rhinorrhoea. AR is subdivided into intermittent and persistent disease with
symptoms in intermittent disease being less frequent than four days a week or lasting for
less than four consecutive weeks (3). Several risk factors such as familial history have been
identified. However, AR remains a multifactorial burden. Ranking among the atopic
syndromes, AR constitutes a risk for new onset asthma and more than one third of the AR
patients in school age already suffer from concurrent atopic eczema or asthma (4). Besides,
AR is often accompanied by asymptomatic bronchial involvement (5).
CRS is an inflammation of the nose and the paranasal sinuses. In adults, CRS is clinically
defined as having at least two symptoms for more than 12 weeks supported by endoscopic
or radiological signs (1). These symptoms can be nasal congestion and discharge as well as
facial pressure or pain and hyposmia. In primary care, the diagnosis is based on the patient’s
symptoms. Nasal endoscopy or computed tomography scans demonstrating nasal polyps or
mucosal changes may be added. However, these examinations are time-consuming and go

2
along with exposure to radiation, and thus are left to inexplicit cases. For research purposes,
endoscopy is required to distinguish CRS with nasal polyps (CRSwNP) from CRS without
nasal polyps (CRSsNP). CRS often occurs together with other diseases such as asthma,
aspirin sensitivity, or immunocompromised state (1). Moreover, complications such as
mucocoele formation or bone involvement may worsen the clinical picture.
AR and CRS are well known to health centres in all parts of Europe as AR affects 23 %
and CRS 11 % of the population (6, 7). Both significantly deteriorate patients’ quality of
life, cause sick leaves, and impose notable direct and indirect cost to public health systems
and society (8-10). Thus, research on effective therapeutic strategies might benefit
individual patients as well as society.
1.2 Cytokines
In inflammation, cells and tissues use polypeptides named cytokines for intercellular
communication. In 1957, Isaacs and Lindermann discovered interferon which was the first
of dozens of cytokines that were found in the following decades (11). Cytokines are still
subject to a wide variety of studies concerning their function, related and regulating genes,
and possible therapeutic uses. Currently, this group of proteins contains interleukins (IL),
chemokines, interferons (IFN), growth factors, tumour necrosis factors (TNF), and colony
stimulating factors (CSF) (12).
Cytokines are a heterogeneous group with some having pro-inflammatory, others anti-
inflammatory and modulating qualities. The properties of cytokines often are redundant
and cause synergistic effects. Some cytokines have been found to be associated to certain
cells of the innate or adaptive immune system. The following instances some of these.
Antigen-presenting cells secrete amongst others TNF, IL-1, and IL-6 and thus activate
granulocytes and lymphocytes, and induce acute-phase proteins (13). Fighting viruses and
neoplastic cells, IFN-� and IFN-� are vital to the activity of natural killer cells and cluster
of differentiation (CD) 8+ cytotoxic T cells. Besides, they induce pro-apoptotic genes (11).
IFN-�, on the other hand, is a signal molecule for T helper lymphocyte (TH) subclass 1.
IFN-� induces phagocytosis and thus contributes to cellular immunity (13). In anti-parasitic

3
and allergic immune response, eosinophilia, differentiation of naïve CD4+ cells into TH2,
and up-regulated production of immunoglobulin (Ig)-E are seen. Amongst the cytokines
made responsible for these processes are IL-4, IL-5, IL-13, and granulocyte-macrophage
CSF (GM-CSF) (13). Moreover, chemokines are known to be an important factor.
Eosinophil chemotactic protein (eotaxin) and others attract eosinophils to the site of
inflammation (14). In contrast to the aforementioned cytokines, IL-10 has
immunoregulatory properties. Primarily produced by regulatory T cells (Treg), IL-10
suppresses secretion of pro-inflammatory cytokines and inhibits TH differentiation into TH1
or TH2 (15). Keeping this knowledge on cytokine functions and their sources at the back of
our minds, cytokine patterns can be drafted. These patterns are characterised by increased
or reduced amounts of specific cytokines. Thus, the activity of particular cells of the
immune system can be inferred from the measured amounts of cytokines.
Cytokines mainly act in an autocrine or paracrine way at the site of inflammation. Thus,
highest amounts are expected there. However, in high concentrations, some cytokines such
as CSF execute endocrine functions.
Several cytokine receptors have been discovered. Binding to its receptor in the cell
membrane, a cytokine commences an intracellular biochemical cascade that activates
transcription factors. Thus, expression of selected genes is initiated. Most receptors are
specific for a certain cytokine. However, others have been found that are shared by different
cytokines of the same family, which emphasises the redundant functions of several
cytokines.
Ensuring intercellular communication, cytokines contribute to maintaining homoeostasis.
Moreover, they are crucial to the immune system when it comes to fighting infections.
However, a disequilibrium of cytokines is potentially pathogenic and held responsible for
a number of inflammatory diseases and autoimmune disorders, amongst them rheumatoid
arthritis, allergy, multiple sclerosis, psoriasis, and sepsis (15, 16).
While cytokines remain subject to current research, they are also of relevance concerning
patient care. For multiple diagnostic and prognostic purposes, interleukins are quantified in

4
blood plasma and chemokines in cerebrospinal fluid (17). Experimentally, cytokines are
measured in different body fluids and in tissue samples to learn more about
pathophysiology or establish new diagnostic tools (18-20). While colony stimulating
factors and interferons have been used as therapy for decades to treat diseases such as
neutropenia or viral hepatitis, novel therapeutic approaches with monoclonal antibodies
binding cytokines have been developed in recent years. Some are already established in
patient care, such as anti-TNF antibodies in rheumatoid arthritis, others are on clinical trials
(21). To select those patients who might be treated with specific antibodies, diagnostic tools
measuring cytokine levels have to be established.
1.3 Pathophysiology of AR
The pathophysiology of AR is that of a type 1 immediate hypersensitivity reaction to
aeroantigens.
Prior to the allergic reaction, sensitisation is required. Antigen presenting cells process the
antigen to peptides that are presented to naïve CD4+ T lymphocytes. These cells
predominantly differentiate into TH2 lymphocytes which initiate B cell differentiation and
induce Ig isotype switching. This results in the production of IgE.
The early phase of allergic reaction is characterised by immediate cell activation. Within
minutes, the allergen-IgE interaction activates prevailing IgE-coated mast cells, resulting
in degranulation of a number of mediators. These mediators include tryptase, histamine,
and neuropeptides, and are held responsible for boosted mucus production, vasodilatation,
and increased vascular permeability. This causes the typical nasal symptoms that patients
report such as rhinorrhoea or nasal congestion.
In the course of the allergic reaction, released cytokines recruit inflammatory cells such as
T lymphocytes, granulocytes, and monocytes. Attracted by chemokines such as eotaxin,
regulated on activation, normal T cell expressed and secreted (RANTES), and macrophage
inflammatory protein (MIP)-1�, eosinophils migrate into the nasal mucosa. Activated
eosinophils release granules containing mediators e.g. eosinophil cationic protein (ECP)

5
that can cause damage to nasal epithelial cells (22). In addition, they produce cytokines
inducing migration and activation of inflammatory cells. Thus, a pro-allergic milieu is
maintained. In contrast to the early phase, this late reaction generates a persistent
inflammation resulting in nasal hyperresponsiveness.
In AR, a disequilibrium of different T cell subsets is held responsible for the pathological
reactions. The lymphocyte population is dominated by TH2, and increased levels of the TH2
associated cytokines IL-4, IL-5, IL-13, and eotaxin have been measured (23). In contrast,
normal or even reduced levels of TH1 associated cytokines have been found, indicating an
imbalance of these two types of T helper cells (23). A recently found subtype of T helper
cells, named TH17, produces the pro-inflammatory cytokine IL-17. With regard to this
subtype, findings are inconsistent and their role in allergy remains to be elucidated (23, 24).
Tregs, another lymphocyte subtype, suppresses both TH1 and TH2-type cytokine expression
via inhibitory cytokines and has even the ability to inhibit inflammatory cells by direct cell
interaction. Concerning Tregs, a disequilibrium in comparison to the amount of TH2 cells
has been suspected (22).
1.4 Pathophysiology of CRS
Based on endoscopy, CRS is divided into CRSsNP and CRSwNP. Research on pathology
and histology of CRS revealed both to be different disease entities and thus confirmed this
subdivision.
The aetiology of CRS is not yet entirely understood. Different hypotheses contemplate T
cell activation in response to microbial antigens or environmental factors, and a
dysregulation of the immune barrier (1). In fact, patients suffering from CRSwNP were
found to have increased colonisation with Staphylococcus aureus (25). However, the
impact of microorganisms in CRS remains to be proven. Currently, CRS is described as a
multifactorial disease in which misguided interactions between host, pathogens, and
exogenous stress contribute (1).
In CRSsNP, a TH1-dominated milieu is found, and levels of the TH1-associated cytokine

6
IFN-� are reported to be elevated. The Treg population is – in contrast to CRSwNP –
reported to be normal (25). Fibrosis is dominating the histological picture. In addition,
basement membrane thickening, subepithelial oedema, and infiltration of inflammatory
cells such as monocytes and neutrophils is seen.
On the other hand, CRSwNP presents an eosinophilic inflammation with high amounts of
TH2-associated cytokines amongst these IL-4, IL-5, and IL-13. Mainly produced by
lymphocytes, IL-5 is held responsible for the local survival of eosinophils (26). Moreover,
a diminished population of Tregs is found in polyps, possibly due to attenuated migration
(25). A dysregulation of epithelial immune barrier function and chemokine production is
also suspected (1). However, the aforesaid only refers to the Caucasian population. Studies
on Asians show a TH2 negative but TH1/ TH17 predominated neutrophilic inflammation in
the majority of cases (25, 27). Thus, subdivision within the CRSwNP subgroup appears
necessary. Macroscopically, in the nasal cavity, the polyps can be easily identified as
greyish protuberances. Preparation of tissue samples reveals oedema in stromal tissue as
well as pseudocysts, epithelial damage, and inflammatory cell infiltration.
With new therapies emerging, research on the pathophysiology and endotyping of CRS
appears more vital than ever.
1.5 Methodological approach
Produced by goblet cells and seromucous glands, nasal secretions moisten and clear the air.
In disease, an increased amount of secretions is produced and leaked plasma contents may
contribute to the secretions. Different methods are used to investigate pathologies of the
nose. For research purposes, cells and tissues as well as nasal secretions are examined.
Immunocyto- or -histochemistry and PCR can be performed on cells gained by scraping
with cotton swab or cytobrush, and in tissue samples. However, cytology and histology
proved to be in an inferior position compared to mediators and cytokines in nasal secretions
when differentiation between nasal diseases is required (28). Methods to obtain secretions
are non-invasive and include nasal lavage with physiological saline and the use of
absorptive materials. In contrast to simple nasal blowing and vacuum suction, the

7
aforementioned methods extract a sufficient amount of secretion (29). The cotton wool
pieces used in the present studies gain secretions by capillary suction. This method was
chosen because it is non-invasive and least uncomfortable for the patient.
The exposure to aeroallergens is not only dependent on the absolute concentration in the
air but also to the patient’s habits and attempts to abstention. Thus, determining the exact
pollution with antigens the patient is exposed to is not feasible. Earlier studies employed
allergen or histamine challenge before taking samples (23, 30, 31). This results in
increasing cytokine release. However, the pace of increase differs in between the
biomarkers and for some, peak concentrations are not reached until several hours after
provocation (23). This requires taking multiple samples and constitutes a time-consuming
approach. Thus, this does not well meet the demands that would be made in an actual
clinical use. To obtain a true-to-life setting, AR subjects were thus examined irrespective
of the season and without prior allergen or histamine challenge.
This methodological approach unites a technique that is easy to perform, cheap, and small
in discomfort for the patient, with a true-to-life setting without demands concerning the
time of sampling. These features make it well applicable in clinical routine.
1.6 Current therapy options
Concerning AR, the physician is provided with a bunch of treatment options. Apart from
avoiding allergen exposure, current guidelines recommend oral H1-antihistamines,
intranasal application of glucocorticoids, and leukotriene-receptor antagonists (2).
However, one to two thirds of patients experience only partial relief by medication (32).
Moreover, for severe AR, immunotherapy is available. New approaches in research of AR
therapy focus on biopharmaceuticals such as monoclonal antibodies. Patients suffering
from seasonal AR (SAR) are shown to benefit from treatment with omalizumab, a
humanised anti-IgE antibody (2). Moreover, studies targeting IL-4, IL-5, and IL-13 are
conducted (32).
Current therapy options in CRS aim to achieve and maintain control of the disease. The

8
therapeutic standard is topical glucocorticoids (1). Besides, saline sprays may be used to
appease discomfort. Despite the aforementioned hypothesis of microbial involvement in
the aetiology of CRS, studies on antibiotic treatment did not show sweeping success (1).
Due to unclear effectivity, no recommendation for antibiotics in the therapy of CRS exists.
Regrettably, conservative treatment still shows poor success rates, with more than half of
the patients not responding adequately to medication (33). After abortive medical
treatment, sinus surgery preserving normal mucosa is recommended to restore sinus
ventilation and drainage (21). In recent years, research on biopharmaceuticals made
headway. Studies on humanised monoclonal antibodies directed against IgE, IL-5, and the
IL-4 receptor � showed auspicious results in small study populations (21). Currently, proof
of concept studies as well as clinical trials are conducted regarding effectivity and safety of
these biopharmaceuticals. However, further research is needed to evaluate the relevance of
the particular biopharmaceuticals and to establish biomarkers that predict the response to
this treatment.

9
2 Abstract
2.1 Background
Both AR and CRS rank among the most common nasal diseases. In AR, the inflammatory
reaction presents itself with tissue eosinophilia and a disequilibrium of T lymphocytes with
TH2 cells predominating. CRSsNP is characterised by a TH1 milieu. In contrast, CRSwNP
shows a TH2 driven eosinophilic inflammation. With new therapeutic approaches using
biopharmaceutics emerging, determination of biomarkers is required to select patients
suitable for these therapies.
2.2 Objective
Aim of the present studies was to describe disease-specific cytokine patterns in nasal
secretions. Therefore, levels of mediators and cytokines regulating T lymphocytes or
stimulating inflammatory cells were measured in different nasal diseases including SAR,
perennial AR (PAR), CRSsNP, and CRSwNP, and in healthy controls.
2.3 Methods
Study population: 230 volunteers participated in both studies, whereof 44 suffered from
SAR, 45 from PAR, 48 from CRSsNP, 45 from CRSwNP, and 48 were healthy controls.
AR was ascertained by patient history and a positive skin prick test and, according to the
allergens tested positive, rated into the SAR or PAR group. CRS was determined by patient
history, inspection of the nose and nasal endoscopy revealing the presence or absence of
polyps. Thus, subdivision into CRSsNP and CRSwNP was made. Healthy controls
presented no history of nasal complaints, normal findings in the endoscopic examination,
and a negative in vitro allergy screening test. Medication addressing the nasal disease six
weeks prior to the examination, purulent rhinitis, and the presence of a mixed AR-CRS
disease pattern constituted exclusion criteria.
Biochemical and immunological methods: Nasal secretions were gained by using cotton
wool pieces placed in the middle meatus of the nose for 20 min. Samples were extracted
10
using centrifugation, and all samples were diluted 1:5 due to the partially small volumes.
To determine the amounts of cytokines, a human cytokine 27-plex panel was utilised. This
panel uses fluorescently-addressed polystyrene beads with conjugated capture antibodies
directed to specific cytokines. The samples were analysed for IL-1�, IL-4, IL-5, IL-6, IL-
8, IL-10, IL-12, IL-13, IL-17, GM-CSF, granulocyte CSF (G-CSF), IFN-�, monocyte
chemotactic protein (MCP)-1, MIP-1�, MIP-1�, eotaxin, and RANTES. The amounts of
ECP and tryptase were quantified by ELISA.
Statistics: For statistical evaluation and graphical presentation, Sigma Plot version 11.0
software was utilised.
2.4 Results
In AR, nasal secretions were examined with regard to T lymphocyte-related cytokine
patterns. Concerning the amount of the TH1-associated biomarkers IL-12 and IFN-�, a
decrease could be demonstrated in nasal secretions of participants suffering from SAR
compared to both PAR and controls. With regard to TH2-associated cytokines, SAR
presented elevated levels of IL-5 and decreased amounts of IL-13. The quantity of IL-4 was
lowered in PAR. Concerning the other T cell associated cytokine patterns, decreased levels
of the Treg related cytokine IL-10, and elevated amounts of the TH17 indicating cytokine
IL-17 were found in SAR while PAR and the controls did not differ. Several degranulation
products and cytokines indicating inflammatory cell activation were investigated. In AR,
irrespective of seasonal or perennial disease, the levels of MCP-1, MIP-1�, ECP, and
tryptase were elevated over the controls. SAR only presented increased amounts of MIP-
1�. In SAR, RANTES and eotaxin were elevated over PAR, while no significant difference
between either of the AR groups and controls was calculated. The levels of IL-1�, IL-6,
GM-CSF, and G-CSF did not differ between the three groups.
In CRS, the TH2 associated cytokines also showed a heterogeneous picture. IL-4 showed
no significant differences between the groups, IL-5 was increased in CRSwNP over
CRSsNP, and IL-13 was reduced in both CRS groups. Nasal secretions from participants
suffering from CRSwNP showed lower quantities of the TH1 and Treg associated cytokines

11
IL-12 and IFN-�, and IL-10, respectively, compared to both CRSsNP and controls.
However, IL-17, indicating TH17 activity, was elevated in CRSwNP. As markers of
inflammatory cell activation, levels of MCP-1, MIP-1�, G-CSF, ECP, and tryptase were
elevated in CRSwNP, and the quantity of MIP-1� was increased in both CRS groups.
RANTES was found to be increased in CRSsNP over controls. The measurement of IL-8,
eotaxin, and GM-CSF did not show any differences among groups.
2.5 Conclusions
In both AR and CRS, the disease can be pictured by cytokines in nasal secretions. Pro-
inflammatory cytokines were evidently elevated in AR. ECP and tryptase, as well as MCP-
1 and MIP-1� clearly distinguished between healthy subjects and those suffering from AR.
The levels of RANTES allowed to differentiate between SAR and PAR. Yet, a more
pronounced inflammatory profile could be demonstrated in SAR, indicating a higher degree
of inflammatory reaction in this disease entity. Moreover, the data on hand suggests a
disequilibrium of T cells in SAR where a downregulation of TH1 and Treg as well as an
upregulation of TH17 is displayed by their respective cytokines. Furthermore, intensified
eosinophil and mast cell activity is displayed.
Similarly, inflammation in CRS presents itself in nasal secretions. Altogether, CRSwNP
showed a more distinct cytokine profile than CRSsNP, the latter differed only in two
biomarkers from the healthy controls, RANTES and MIP-1�. This study on CRSwNP
showed elevated levels of IL-5 and IL-17 combined with low levels of IL-10, IL-12, and
IFN-� in CRSwNP. Thus, it adumbrates an imbalance of T helper cells accompanied by a
downregulation of Tregs. Moreover, the elevation of various cytokines illustrated the
activity of different inflammatory cells in CRSwNP.
The present work shows that not only the inflammation, but also the T cell disequilibrium
can be detected in cytokine profiles in nasal secretions. Moreover, it demonstrates that
cytokines differentiate between inflammatory nasal diseases. Thus, examination of
cytokine profiles in nasal secretions may constitute a helpful tool in diagnosis and prognosis
of sinonasal diseases. Moreover, it constitutes a technique applicable to further research on
the pathology of those diseases.

12

13
3 Zusammenfassung
3.1 Hintergrund
Sowohl die allergische Rhinitis als auch die chronische Rhinosinusitis gehören zu den
häufigsten Erkrankungen der Nase. Die Entzündungsreaktion bei der allergischen Rhinitis
ist durch Eosinophilie und ein Ungleichgewicht der T-Lymphozyten gekennzeichnet,
wobei hier TH2-Zellen vorherrschen. Bei der CRSsNP sind TH1-Lymphozyten der
dominierende Zelltyp. Die CRSwNP zeigt hingegen eine Entzündungsreaktion, welche von
TH2-Zellen und Eosinophilen geprägt ist. Gegenstand derzeitiger Forschung zur
Behandlung dieser Erkrankungen sind neue Biopharmazeutika wie monoklonale
Antikörper. Hieraus ergibt sich die Notwendigkeit der Forschung an Biomarkern, denn mit
geeigneten Biomarkern können jene Patienten herausgefiltert werden, die sich für eine
solche Therapie eignen.
3.2 Zielsetzung
Ziel der vorliegenden Studien war es daher, krankheitsspezifische Zytokinprofile im
Nasensekret zu beschreiben. Hierfür wurden Zytokine und Botenstoffe bestimmt, welche
die T-Zell-Aktivität regulieren oder Entzündungszellen stimulieren. Neben gesunden
Kontrollen umfassten die Studien Patienten mit SAR, PAR, CRSsNP und CRSwNP.
3.3 Methoden
Studienteilnehmer: An den Studien nahmen 230 Freiwillige teil, die sich in folgende
Gruppen einteilen ließen: 44 Teilnehmer litten unter SAR, 45 unter PAR, 48 unter CRSsNP
und 45 unter CRSwNP. Die Kontrollgruppe umfasste 48 Personen. Die Diagnose AR
wurde nach der Erhebung der Anamnese gestellt und setzte einen positiven Prick-Test
voraus. In Abhängigkeit von den positiv getesteten Allergenen wurden die Teilnehmer der
SAR- oder PAR-Gruppe zugeteilt. Zur Ermittlung des Vorliegens einer CRS wurden neben
der Anamnese eine Inspektion sowie eine Endoskopie der Nase vorgenommen. Hierdurch
konnte das Vorliegen von Polypen festgestellt oder ausgeschlossen und die Patienten der

14
jeweiligen Gruppe zugeordnet werden. Die Teilnehmer in der Kontrollgruppe verneinten
nasale Beschwerden in der Krankengeschichte und zeigten Normalbefunde in der
Endoskopie der Nase. Ein In-vitro-Screening auf Allergien fiel zudem negativ aus.
Teilnehmer mit einer purulenten Rhinitis wurden ebenso von der Studie ausgeschlossen
wie Teilnehmer, die in den letzten sechs Wochen vor der Untersuchung Medikamente
verwendet hatten, welche eine Erkrankung der Nase oder der Nasennebenhöhlen
beeinflussen konnten. Ebenfalls ausgeschlossen wurden Teilnehmer, welche ein
gemischtes Krankheitsbild mit AR und CRS aufwiesen.
Biochemische und immunologische Methoden: Das Nasensekret wurde mittels
medizinischer Watte aus Baumwollgewebe, die für 20 min in den mittleren Nasengang
eingeführt und anschließend zentrifugiert wurden, gewonnen. Da hierbei teilweise nur
geringe Volumina erzielt wurden, wurden die Proben 1:5 verdünnt. Mittels eines Human
Cytokine 27-Plex Panel wurden die im Nasensekret enthaltenen Zytokine quantifiziert. Bei
diesem Verfahren kommen an fluoreszierende Polystyrenkügelchen gebundene Antikörper
zum Einsatz, welche sich gegen die jeweiligen Zytokine richten. Für die vorliegenden
Studien wurden folgende Zytokine untersucht: IL-1�, IL-4, IL-5, IL-6, IL-8, IL-10, IL-12,
IL-13, IL-17, GM-CSF, G-CSF, IFN-�, MCP-1, MIP-1�, MIP-1�, Eotaxin und RANTES.
Des Weiteren wurden ELISAs zur Messung von ECP und Tryptase verwendet.
Statistik: Zur statistischen Auswertung und zum Erstellen der Grafiken wurde das
Programm Sigma Plot Version 11.0 verwendet.
3.4 Ergebnisse
Die Nasensekrete der AR-Patienten wurden in Hinblick auf Zytokinprofile von T-
Lymphozyten untersucht. Hinsichtlich der TH1-zugeordneten Zytokine IL-12 und IFN-�
konnte in der SAR ein gegenüber der PAR und der Kontrollgruppe signifikant erniedrigtes
Niveau gezeigt werden. Bei den TH2-zugeordneten Zytokinen ergaben die Messungen in
der SAR-Gruppe erhöhte Werte für IL-5 und erniedrigte für IL-13. IL-4 war in der PAR-
Gruppe erniedrigt. Was die anderen T-Zellen anbelangte, zeigte sich eine Erniedrigung des
Treg-zugeordneten Zytokins IL-10 in der SAR, während das TH17-spezifische Molekül IL-

15
17 erhöht war. Zwischen PAR und der Kontrollgruppe fanden sich für diese Biomarker
keine Unterschiede. Neben Zytokinen, die auf eine T-Zell-Aktivität schließen lassen,
wurden auch Zytokine und Botenstoffe untersucht, die ein Wirken anderer
Entzündungszellen nahe legen. Unabhängig davon, ob eine Sensibilisierung gegen ein
saisonal oder ganzjährig auftretendes Allergen vorlag, zeigten sich im Vergleich zur
Kontrollgruppe erhöhte Werte für MCP-1, MIP-1�, ECP und Tryptase. Einzig die SAR-
Patienten wiesen eine Erhöhung von MIP-1� auf. Zudem waren RANTES und Eotaxin in
der SAR höher als bei PAR, es bestand jedoch kein signifikanter Unterschied zur
Kontrollgruppe. Für IL-1�, IL-6, GM-CSF und G-CSF ergaben sich keine Unterschiede
zwischen den Gruppen.
Bei der Untersuchung der CRS wurden ebenfalls die TH2-zugeordneten Zytokine
gemessen. Hier zeigten sich für IL-4 keine Unterschiede zwischen den Gruppen, während
sich IL-5 in der CRSwNP im Vergleich zur CRSsNP erhöht zeigte. IL-13 war im
Nasensekret beider CRS-Gruppen erniedrigt. Im Vergleich zur Kontrollgruppe und zu
CRSsNP zeigten die TH1- und Treg-zugeordneten Zytokine IL-12, IFN-� und IL-10
signifikant niedrigere Werte in der Gruppe CRSwNP. IL-17, das eine Aktivität der TH17-
Zellen anzeigt, war in dieser Gruppe hingegen erhöht. Von den Botenstoffen, die eine
Aktivierung verschiedener Entzündungszellen anzeigen, waren MCP-1, MIP-1�, G-CSF,
ECP und Tryptase bei Patienten, die unter CRSwNP litten, erhöht. In beiden CRS-Gruppen
wurden höhere Werte für MIP-1� gemessen als in der Kontrollgruppe. In der CRSsNP war
RANTES im Vergleich zur Kontrollgruppe erhöht. Für IL-8, Eotaxin und GM-CSF zeigten
sich keine Unterschiede zwischen den Gruppen.
3.5 Fazit
Die vorliegenden Studien konnten zeigen, dass sich die Erkrankungen sowohl im
Nasensekret von AR-Patienten als auch in dem von CRS-Patienten darstellen lassen. In
beiden AR-Gruppen waren die entzündungsfördernden Zytokine deutlich erhöht. Mittels
ECP, Tryptase, MCP-1 sowie MIP-1� konnte eindeutig zwischen der Kontrollgruppe und
den AR-Gruppen unterschieden werden. Zudem erlaubten die für RANTES gemessenen
Werte eine Unterscheidung von SAR und PAR. Im Nasensekret der SAR-Patienten zeigte

16
sich die Entzündungsreaktion stärker als in dem der PAR-Probanden. Dies lässt darauf
schließen, dass die Entzündungsreaktion in dieser Gruppe deutlich stärker ist. Zudem
bilden die vorliegenden Ergebnisse ein gestörtes Gleichgewicht der T-Zellen ab. TH1- und
Treg-Lymphozyten scheinen vermindert aktiv zu sein, während die Erhöhung von IL-17 auf
eine gesteigerte Aktivierung der TH17-Zellen hinweist. Daneben zeigt sich eine verstärkte
Aktivität von Mastzellen und Eosinophilen.
Auch bei CRS zeigte sich die Entzündung im Nasensekret. Mit Blick auf die Ergebnisse
lässt sich sagen, dass die Entzündungsreaktion bei den Patienten mit CRSwNP deutlicher
hervortrat als bei jenen Patienten ohne Polyposis, bei denen sich ein signifikanter
Unterschied zur Kontrollgruppe nur für zwei Zytokine, RANTES und MIP-1�, zeigte. Im
Nasensekret der CRSwNP-Patienten ließen sich erhöhte Werte für IL-5 und IL-17
nachweisen. Gemeinsam mit den erniedrigten Werten für IL-10, IL-12, und IFN-� weist
dieses Zytokinprofil auf ein unausgeglichenes Verhältnis der T-Helferzellen und eine
verminderte Aktivität der Tregs bei CRSwNP hin. Auch legt die Erhöhung unterschiedlicher
Botenstoffe nahe, dass verschiedene Immunzellen die Entzündung unterhalten.
Zusammenfassend kann gesagt werden, dass sowohl die Entzündung selbst als auch ein
gestörtes Gleichgewicht der T-Lymphozyten anhand des Zytokinprofils im Nasensekret
dargestellt werden können. Zudem kann mittels Zytokinprofilen zwischen verschiedenen
Erkrankungen der Nase unterschieden werden. Daher könnte sich die Untersuchung von
Zytokinen in Bezug auf AR und CRS als diagnostisch und prognostisch wichtiges
Werkzeug erweisen. Zudem ist die hier verwendete Methode ein geeignetes Mittel für
weitere Forschung über die Pathologie nasaler Krankheiten.

17
4 Prospects
Currently, new therapies targeting cytokines are emerging. This generates need for reliable
and uncomplicated methods to identify patients who might benefit from these therapies.
One of these methods suitable for clinical practice is the cotton-wool method to gain nasal
secretions as it is easy to handle, non-invasive, and cheap. Moreover, analysing cytokines
by multiplex assays provides data rapidly and reproducibly. The conducted studies provide
evidence that inflammation is depicted in nasal secretions. Hence, the utilised methods
constitute techniques which also meet the needs of researchers. On the one hand, further
research is required for clinical purposes as biomarkers are needed for differential
diagnosis, prognosis, and matching anti-cytokine therapies to the individual patient. On the
other hand, research on cytokines in nasal secretions provides the opportunity to learn more
about the pathophysiology of nasal diseases. Understanding the underlying mechanisms,
new therapies can be developed, and possibly even prevention can be initiated. Two key
approaches should be adopted. Firstly, healthy individuals have to be examined to establish
norm values. According to the findings of the present studies, these norm values need to
include data on the interleukins 5, 10, 12, and 17, on IFN-�, RANTES, MCP-1, MIP-1�,
MIP-1�, ECP, and tryptase. Yet, this is easily done in an automated fashion using cytokine
assays, once the samples are collected using the highly convenient cotton-wool method. In
addition, cytokine profiles should be measured in other nasal diseases such as acute rhinitis,
cystic fibrosis, or neoplastic diseases. The next step would be to study cytokine profiles in
individuals suffering from overlapping disease. Thereby, conclusions could be drawn about
the impact of each disease in the individual patient. Thus, therapies tailored to the
individual patient’s needs could be initiated.

18

19
5 References
1. W. J. Fokkens et al., European Position Paper on Rhinosinusitis and Nasal Polyps
2012. Rhinology. Supplement, 3 p preceding table of contents, 1-298 (2012).
2. J. Bousquet et al., Allergic Rhinitis and its Impact on Asthma (ARIA) 2008 update
(in collaboration with the World Health Organization, GA(2)LEN and AllerGen).
Allergy 63 Suppl 86, 8-160 (2008).
3. J. Bousquet, P. Van Cauwenberge, N. Khaltaev, Allergic rhinitis and its impact on
asthma. J Allergy Clin Immunol 108, S147-334 (2001).
4. H. Gough et al., Allergic multimorbidity of asthma, rhinitis and eczema over 20
years in the German birth cohort MAS. Pediatr Allergy Immunol 26, 431-437
(2015).
5. G. Ciprandi, I. Cirillo, The lower airway pathology of rhinitis. J Allergy Clin
Immunol 118, 1105-1109 (2006).
6. V. Bauchau, S. R. Durham, Prevalence and rate of diagnosis of allergic rhinitis in
Europe. Eur Respir J 24, 758-764 (2004).
7. D. Hastan et al., Chronic rhinosinusitis in Europe--an underestimated disease. A
GA(2)LEN study. Allergy 66, 1216-1223 (2011).
8. I. Baumann et al., [Patients with chronic rhinosinusitis: disease-specific and general
health-related quality of life]. HNO 54, 544-549 (2006).
9. J. Bousquet et al., Severity and impairment of allergic rhinitis in patients consulting
in primary care. J Allergy Clin Immunol 117, 158-162 (2006).
10. J. Hellgren, A. Cervin, S. Nordling, A. Bergman, L. O. Cardell, Allergic rhinitis and
the common cold--high cost to society. Allergy 65, 776-783 (2010).
11. S. Pestka, The interferons: 50 years after their discovery, there is much more to
learn. J Biol Chem 282, 20047-20051 (2007).
12. K. Murphy, C. Weaver, Janeway's immunobiology. p.811ff (Garland Science,
2016).
13. S. P. Commins, L. Borish, J. W. Steinke, Immunologic messenger molecules:
cytokines, interferons, and chemokines. J Allergy Clin Immunol 125, S53-72
(2010).
14. A. P. Kaplan, Chemokines, chemokine receptors and allergy. Int Arch Allergy
Immunol 124, 423-431 (2001).
15. I. Raphael, S. Nalawade, T. N. Eagar, T. G. Forsthuber, T cell subsets and their
signature cytokines in autoimmune and inflammatory diseases. Cytokine 74, 5-17
(2015).
16. C. L. Lakshmikanth, S. P. Jacob, V. H. Chaithra, H. C. de Castro-Faria-Neto, G. K.
Marathe, Sepsis: in search of cure. Inflamm Res 65, 587-602 (2016).

20
17. T. A. Rupprecht, C. Lechner, H. Tumani, V. Fingerle, [CXCL13: a biomarker for
acute Lyme neuroborreliosis: investigation of the predictive value in the clinical
routine]. Der Nervenarzt 85, 459-464 (2014).
18. I. Altun, Cytokine profile in degenerated painful intervertebral disc: variability with
respect to duration of symptoms and type of disease. The spine journal : official
journal of the North American Spine Society 16, 857-861 (2016).
19. M. S. Harkey et al., Osteoarthritis-related biomarkers following anterior cruciate
ligament injury and reconstruction: a systematic review. Osteoarthritis Cartilage
23, 1-12 (2015).
20. N. Xu, X. Li, Y. Zhong, Inflammatory cytokines: potential biomarkers of
immunologic dysfunction in autism spectrum disorders. Mediators Inflamm 2015,
531518 (2015).
21. C. Bachert, L. Zhang, P. Gevaert, Current and future treatment options for adult
chronic rhinosinusitis: Focus on nasal polyposis. J Allergy Clin Immunol 136, 1431-
1440 (2015).
22. B. Sin, A. Togias, Pathophysiology of allergic and nonallergic rhinitis. Proc Am
Thorac Soc 8, 106-114 (2011).
23. G. Scadding, Cytokine profiles in allergic rhinitis. Curr Allergy Asthma Rep 14, 435
(2014).
24. C. B. Schmidt-Weber, M. Akdis, C. A. Akdis, TH17 cells in the big picture of
immunology. J Allergy Clin Immunol 120, 247-254 (2007).
25. K. Van Crombruggen, N. Zhang, P. Gevaert, P. Tomassen, C. Bachert, Pathogenesis
of chronic rhinosinusitis: inflammation. J Allergy Clin Immunol 128, 728-732
(2011).
26. E. O. Meltzer et al., Rhinosinusitis: establishing definitions for clinical research and
patient care. J Allergy Clin Immunol 114, 155-212 (2004).
27. C. Bachert, N. Zhang, T. van Zele, P. Gevaert, Chronic rhinosinusitis: from one
disease to different phenotypes. Pediatr Allergy Immunol 23 Suppl 22, 2-4 (2012).
28. M. Groger et al., Eosinophils and mast cells: a comparison of nasal mucosa
histology and cytology to markers in nasal discharge in patients with chronic sino-
nasal diseases. Eur Arch Otorhinolaryngol 270, 2667-2676 (2013).
29. L. Klimek, G. Rasp, Norm values for eosinophil cationic protein in nasal secretions:
influence of specimen collection. Clin Exp Allergy 29, 367-374 (1999).
30. G. W. Bensch, H. S. Nelson, L. C. Borish, Evaluation of cytokines in nasal
secretions after nasal antigen challenge: lack of influence of antihistamines. Annals
of allergy, asthma & immunology : official publication of the American College of
Allergy, Asthma, & Immunology 88, 457-462 (2002).

21
31. C. de Graaf-in t Veld, I. M. Garrelds, S. Koenders, R. Gerth van Wijk, Relationship
between nasal hyperreactivity, mediators and eosinophils in patients with perennial
allergic rhinitis and controls. Clin Exp Allergy 26, 903-908 (1996).
32. L. M. Wheatley, A. Togias, Clinical practice. Allergic rhinitis. N Engl J Med 372,
456-463 (2015).
33. L. C. Young, N. W. Stow, L. Zhou, R. G. Douglas, Efficacy of medical therapy in
treatment of chronic rhinosinusitis. Allergy Rhinol (Providence) 3, e8-e12 (2012).

22

23
6 Acknowledgements
Many people have supported me and contributed in various ways to the formation of this
thesis. I wish to express my sincere thanks to all of them.
First of all, I sincerely thank my advisor, PD Dr. med. Moritz Gröger. This work would not
have been possible without his help and guidance. I also thank for his great confidence in
my work, excellent scientific advice and pleasant work conditions.
I am also grateful to Dr. med. Sven Becker, Dr. med. Katharina Eder, Mareike Haack, Dr.
med. Christine Klemens, Prof. Dr. med. Matthias F. Kramer, and Dr. med. Marion San
Nicoló, who were involved in planning, organising and conducting both studies. I
appreciate the fruitful collaboration and their helpful comments on the manuscripts.
Furthermore, I would like to express my deep gratitude to Elisabeth Pfrogner and Gabriele
Bärr for skilful assistance, and quick and uncomplicated help.
Thanks to all my friends for continuous support during the last years and illuminating
discussions on both medical and non-medical topics. A special thank goes to Johanna
Heinrich and Claudia Borlinghaus for constant encouragement and for reading the
manuscript of this thesis.
Finally, I wish to express my sincere thanks to my parents. Their unconditional support and
trust in me enabled this work. Moreover, I thank my sister Kristina for revealing the
properties of MS Word and for constructive criticism. Last but not least, I would like to
thank Simon Lanzmich for uncounted hours of reviewing the manuscripts, for precious
discussions, and his infinite patience.

24

25
7 Appendix
A Publications
Katrin König, Christine Klemens, Katharina Eder, Marion San Nicoló, Sven Becker,
Matthias F. Kramer and Moritz Gröger. Cytokine profiles in nasal fluid of patients with
seasonal or persistent allergic rhinitis. Allergy Asthma Clin Immunol 11, 26 (2015); doi:
10.1186/s13223-015-0093-x
Katrin König, Christine Klemens, Mareike Haack, Marion San Nicoló, Sven Becker,
Matthias F. Kramer and Moritz Gröger. Cytokine patterns in nasal secretion of non-atopic
patients distinguish between chronic rhinosinusitis with or without polyps. Allergy Asthma
Clin Immunol 12, 19 (2016); doi: 10.1186/s13223-016-0123-3

König et al. Allergy Asthma Clin Immunol (2015) 11:26
DOI 10.1186/s13223-015-0093-x
RESEARCH
Cytokine pro"les in nasal $uid of patients with seasonal or persistent allergic rhinitisKatrin König1, Christine Klemens1, Katharina Eder1, Marion San Nicoló1, Sven Becker1,2, Matthias F. Kramer1
and Moritz Gröger1*
Abstract
Background: New therapeutic approaches with biologic agents such as anti-cytokine antibodies are currently on
trial for the treatment of asthma, rhinosinusitis or allergic diseases necessitating patient selection by biomarkers.
Allergic rhinitis (AR), affecting about 20 % of the Canadian population, is an inflammatory disease characterised by a
disequilibrium of T-lymphocytes and tissue eosinophilia. Aim of the present study was to describe distinct cytokine
patterns in nasal secretion between seasonal and perennial AR (SAR/PAR), and healthy controls by comparing
cytokines regulating T-cells or stimulating inflammatory cells, and chemokines.
Methods: Nasal secretions of 44 participants suffering from SAR, 45 participants with PAR and 48 healthy controls
were gained using the cotton wool method, and analysed for IL-1β, IL-4, IL-5, IL-6, IL-10, IL-12, IL-13, IL-17, GM-CSF,
G-CSF, IFN-γ, MCP-1, MIP-1α, MIP-1β, eotaxin, and RANTES by Bio-Plex Cytokine Assay as well as for ECP and tryptase
by UniCAP-FEIA.
Results: Participants with SAR or PAR presented elevated levels of tryptase, ECP, MCP-1, and MIP-1β, while values of
GM-CSF, G-CSF, IL-1β, and IL-6 did not differ from the controls. Increased levels of IL-5, eotaxin, MIP-1α, and IL-17 and
decreased levels of IFN-γ, IL-12 and IL-10 were found in SAR only. RANTES was elevated in SAR in comparison to PAR.
Interestingly, we found reduced levels of IL-4 in PAR and of IL-13 in SAR.
Conclusions: Elevated levels of proinflammatory cytokines were seen in both disease entities. They were, however,
more pronounced in SAR, indicating a higher degree of inflammation. This study suggests a downregulation of TH1
and Treg-lymphocytes and an upregulation of TH17 in SAR. Moreover, the results display a prominent role of eosino-
phils and mast cells in AR. The observed distinct cytokine profiles in nasal secretion may prove useful as a diagnostic
tool helping to match patients to antibody therapies.
Keywords: Allergic rhinitis, Nasal secretion, Mediators, Cytokines, Chemokines, Interleukins
© 2015 König et al. This article is distributed under the terms of the Creative Commons Attribution 4.0 International License (http://creativecommons.org/licenses/by/4.0/), which permits unrestricted use, distribution, and reproduction in any medium, provided you give appropriate credit to the original author(s) and the source, provide a link to the Creative Commons license, and indicate if changes were made. The Creative Commons Public Domain Dedication waiver (http://creativecommons.org/publicdomain/zero/1.0/) applies to the data made available in this article, unless otherwise stated.
BackgroundAllergic rhinitis (AR) is a common disorder of the nose.
Patients’ symptoms include nasal obstruction, rhinor-
rhoea, sneezing and nasal itching. All of them are revers-
ible spontaneously or under treatment. AR is subdivided
into intermittent and persistent disease. Intermittent
disease is defined by the patient having symptoms for
less than 4 days a week or for less than 4 weeks [1]. It is
estimated that 400 million people worldwide are affected,
with a prevalence of AR of about 20 % in Canada and
23 % in Europe [2–4]. Todo-Bom et al. [5] found that
intermittent and persistent disease are equally frequent
in adults. AR is often associated with asthma, sinusitis,
otitis media or nasal polyps and has a significant impact
on patients’ quality of life [1, 6]. In addition, the disease
imposes a substantial economic burden for society [7].
Open Access
*Correspondence: [email protected] 1 Department of Otorhinolaryngology, Head and Neck Surgery, University
Medical Center Großhadern of the Ludwig-Maximilians-University
Munich, Marchioninistr. 15, 81377 Munich, Germany
Full list of author information is available at the end of the article

Page 2 of 10König et al. Allergy Asthma Clin Immunol (2015) 11:26
#e underlying pathology of AR is known to be a
type 1 immediate hypersensitivity reaction. During
the period of sensitisation, the allergen is presented
to CD4+ T-lymphocytes inducing differentiation to
the T-helper cell (TH) 2 phenotype. TH2-lymphocytes
secrete cytokines which promote the differentiation
of B cells as well as induce immunoglobulin (Ig) syn-
thesis and regulate Ig isotype switching. #is results
in increased levels of specific IgE, both local and sys-
temic [8]. In the early-phase of allergic reaction, mast
cells, coated with specific IgE, recognise the allergen
and release several mediators such as histamine and
tryptase. In contrast, the late-phase is characterised by
the secretion of chemokines like eosinophil chemotac-
tic protein (eotaxin), “regulated on activation, normal
T cell expressed and secreted” (RANTES), and mac-
rophage inflammatory protein-1α (MIP-1α) [9], which
induce the recruitment of eosinophils and other inflam-
matory cells. Activated eosinophils release granules
containing amongst others eosinophil cationic protein
(ECP) and major basic protein (MBP) [10]. In addi-
tion, eosinophils synthesise and secrete cytokines, e.g.
interleukin (IL)-5 or granulocyte–macrophage colony-
stimulating factor (GM-CSF). Whereas the early-phase
response to allergen exposure leads to acute symptoms,
the late-phase reaction is held responsible for persisting
inflammation.
AR is determined by a disequilibrium of T-helper cells
with a predominance of TH2-type cytokines but normal
levels of TH1-type cytokines. Another subtype of T-cells,
regulatory T-cells (Treg), suppresses both TH1 and TH2-
type cytokine expression [11]. #us, it has been suggested
that in AR, an imbalance between TH2 and Treg-cells
exists as well [10]. Concerning TH17-lymphocytes, some
authors found elevated levels of IL-17. However, the find-
ings on IL-17 are ambiguous and the role of TH17-cells in
AR remains unclear [12, 13].
Aim of the present study was to investigate whether
in AR caused by a seasonal (SAR) or a perennial (PAR)
allergen, representative cytokines and mediators in
nasal discharge show distinct patterns picturing the
pathophysiology. #erefore, we analysed the levels of
cytokines and other inflammatory mediators in the nasal
fluid of participants suffering from SAR or PAR, focus-
ing on three main topics: cytokines (1) regulating TH1
(interferon-γ (IFN-γ), IL-12), TH2 (IL-4, IL-13), Treg (IL-
10), and TH17 (IL-17) cells, or (2) stimulating and acti-
vating inflammatory cells like granulocytes and mast
cells (granulocyte colony-stimulating factor (G-CSF),
GM-CSF, IL-1β, IL-5, and IL-6), and (3) chemokines
such as eotaxin, RANTES, monocyte chemotactic pro-
tein-1 (MCP-1), or MIP-1α/β.
MethodsStudy population
Clinical history was taken by one of the investigators.
Patients presenting a history of chronic rhinosinusitis,
nasal polyposis or aspirin sensitivity were excluded from
the study (Table 1). Any medication concerning the nasal
disease during 6 weeks prior to the examination consti-
tuted an exclusion criterion, especially anti-inflamma-
tory medication such as nasal steroids or antihistamines.
Also, nasal endoscopy was performed in all participants
in order to assess clinical signs of rhinitis and to exclude
patients with signs of purulent rhinitis or polyposis. After
exclusion, 137 volunteers (73 males, 64 females, mean
age 38 ± 16 years) participated in this study.
AR was determined by the participant’s history and
by a positive skin prick test (SPT) (ALK-Abelló, Wedel,
Germany) for the following allergens: timothy grass, rye,
birch, hazel, alder, beech, mugwort, ribwort, nettle, dan-
delion, house dust mite, storage mite, dog, cat and horse
epithelial dander, alternaria, aspergillus, cladosporium,
and penicillium; histamine dihydrochloride solution at
1 mg/ml as positive control and allergen-free saline solu-
tion as negative control were used. #e SPT was consti-
tuted positive if the diameter of the wheal was >3 mm.
#ereafter, specific IgE to allergens tested positive in
skin prick test was measured in serum (UniCAP-FEIA,
Phadia, Freiburg, Germany).
SAR (n = 44) was determined by sensitisation to at
least one seasonal allergen with a positive skin prick
test and a compatible positive specific IgE measure-
ment (≥0.8 kU/l) as well as typical seasonal complaints
in participant’s history. If patient’s history did not allow a
definite rating of the seen sensitisation with respect to its
clinical relevance, a intranasal challenge to the suspected
allergen was performed. Participants additionally sensi-
tised to a perennial allergen were excluded.
PAR (n = 45) was determined by participant’s his-
tory, a sensitisation to house dust mite, animal dander,
or perennial mold like aspergillus with a positive skin
prick test and a specific IgE ≥ 0.8 kU/l. Moreover, an
intranasal allergen challenge was performed in case of a
sensitisation to house dust mite or perennial mold, or a
Table 1 Exclusion criteria
All groups Chronic rhinosinusitisNasal polyposisAspirin sensitivityPurulent rhinitisSpecific medication during the last 6 weeks
SAR Sensitisation to perineal allergen
PAR Sensitisation to seasonal allergen

Page 3 of 10König et al. Allergy Asthma Clin Immunol (2015) 11:26
sensitisation to animal dander whose clinical relevance
could not be clearly rated by patient’s history. Partici-
pants additionally sensitised to a seasonal allergen were
excluded.
Healthy controls (n = 48) presented no history of
inflammatory nasal complaints and a negative in vitro
allergy screening test Sx1 (Phadia, Freiburg, Germany).
Samples were collected during as well as outside pol-
len season. Collection was not done in relation to actual
allergen exposure or actual complaints.
#e study was approved by the ethics committee of
the medical faculty of Ludwig-Maximilians-University
and written informed consent was obtained from all
participants.
Biochemical and immunological methods
For sampling of nasal fluids, the cotton wool method was
performed with minor modifications as invented by Rasp
and coworkers [14]. Nasal secretions were gained as pre-
viously described using small cone-shaped cotton wool
pieces (absorbent cotton, Hartmann, Heidenheim/Brenz,
Germany) with a length of about 3 cm and a diameter
of about 6 mm [15]. Introduced into the middle meatus
of the nose, the cotton wool pieces were left in place for
20 min and were subsequently centrifuged (+4 °C, 2000g)
on a sieve for 10 min [16].
Because of partially small volumes, all samples were
diluted 1:5 and were analysed for IL-1β, IL-4, IL-5, IL-6,
IL-10, IL-12, IL-13, IL-17, GM-CSF, G-CSF, IFN-γ,
MCP-1, MIP-1α, MIP-1β, eotaxin, and RANTES using
a human cytokine 17-plex panel (Bio-Plex Cytokine
Assay, Bio-Rad Laboratories, Hercules, California). #e
cytokine assay uses fluorescently-addressed polystyrene
beads with conjugated capture antibodies directed to the
above-mentioned cytokines. After washing, a fluores-
cently marked detection antibody builds an immunoas-
say with the cytokine. For analysis, two lasers excite the
fluorochromes: one for classifying each bead, the other
for quantifying the amount of analyte bound [17]. Detec-
tion levels were 0.5 pg/ml.
ECP and tryptase were measured by ELISA (UniCAP-
FEIA, Phadia, Freiburg, Germany). #resholds for detec-
tion were 10 ng/ml for ECP and 5 ng/ml for tryptase.
Statistics
SigmaPlot for Windows version 11.0 software (Systat
Software, San José, California, USA) was used for sta-
tistical evaluation and graphical presentation. All data
failed normality testing (Shapiro–Wilk). #erefore, the
Kruskal–Wallis One Way Analysis of Variance (ANOVA)
on Ranks was used for testing a statistically significant
difference in the median values among the three groups.
To isolate the group or groups that differ from the
others, the All Pairwise Multiple Comparison Procedures
(Dunn’s Method) was used in the following step. p values
<0.05 were regarded as significant. For graphic presenta-
tion of results, data is given in a box plot with the median
(horizontal line within the box), the 25th and 75th per-
centile (boundary of the box), and the 10th and 90th per-
centile (whiskers above and below the box). Significances
are graphically represented between the corresponding
plots: * indicates p value <0.05, ** p value <0.01, and *** p
value <0.001.
Results44 participants suffering from SAR, 45 participants suf-
fering from PAR and 48 healthy subjects were included
in this study. Demographics and sensitisation profiles
are depicted in Table 2. #e mean age varied from 36
to 40 years. #e highest percentage of subjects suffer-
ing from asthma was found in the SAR group, followed
by the PAR group and the controls. Participants suffering
from SAR were frequently sensitised to grass and birch
while house dust mite and animal dander were the main
antigens in PAR. In SAR as well as in PAR one participant
(2 %) was sensitised to mold with alternaria (seasonal) or
aspergillus (perennial) being the relevant allergen.
AR is a TH2 dominated disease. #erefore, an increase
of TH2 cytokines and possibly a decrease of TH1 and Treg
cytokines could be expected. Concerning the markers
of TH2 induced B cell stimulation, we did not find ele-
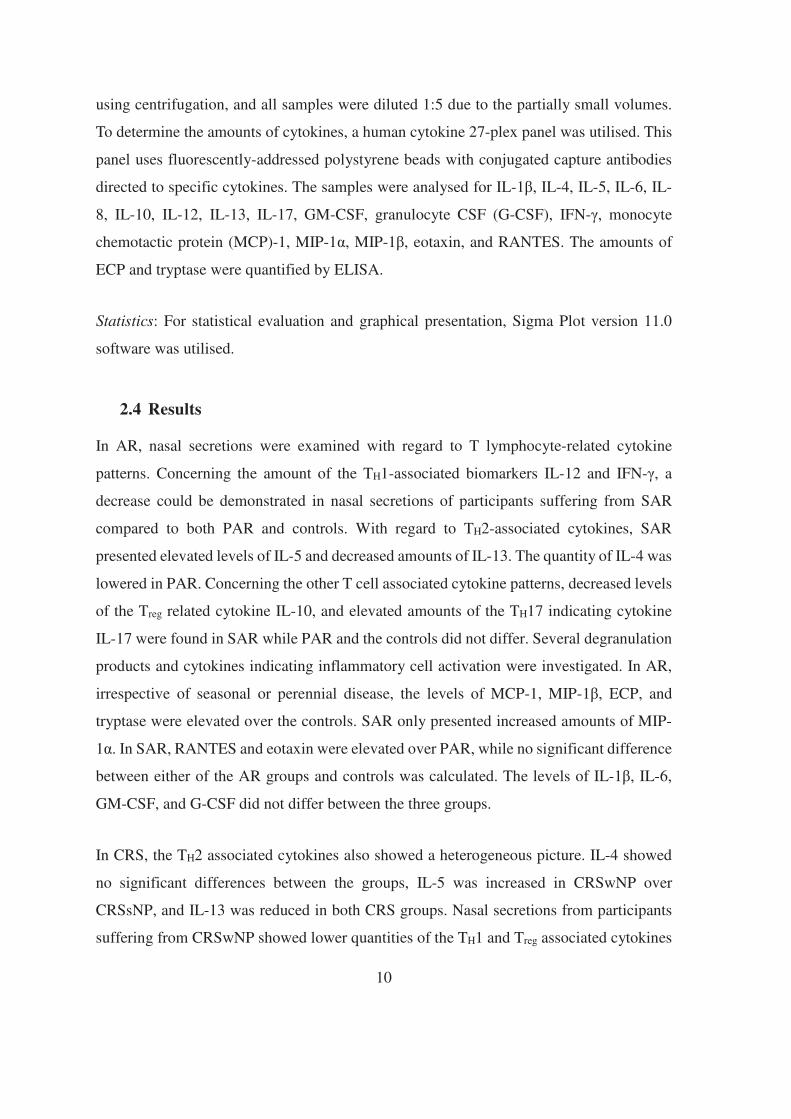
vated levels of either IL-4 nor IL-13. As shown in Fig. 1a,
similar levels of IL-4 were found in SAR (median 7 pg/
ml, range 2–17 pg/ml) and controls (median 7 pg/ml,
range 0–32 pg/ml), but significantly lower levels in PAR
(median 4 pg/ml, range 0–38 pg/ml) compared to con-
trols as well as to SAR (p < 0.001 vs. controls/SAR). #e
quantity of IL-13 was decreased in SAR (median 11 pg/
ml, range 6–137 pg/ml) compared to both the controls
(median 19 pg/ml, range 10–32 pg/ml; p < 0.001) and
Table 2 Demographic data and results of speci"c IgE
n.d. not determined
Controls SAR PAR
Participants (N) 48 44 45
Mean age (years) 40 37 36
Gender ♀/♂ (%) 62/38 34/66 42/58
Asthma (%) 9 24 18
Poaceae (%) n.d. 83 0
Betulaceae (%) n.d. 52 0
Asteraceae (%) n.d. 12 0
House dust mite (%) n.d. 0 82
Mold (%) n.d. 2 2
Animal dander (%) n.d. 0 27
Page 4 of 10König et al. Allergy Asthma Clin Immunol (2015) 11:26
PAR (median 19 pg/ml, range 7–48 pg/ml; p < 0.001)
(Fig. 1b).
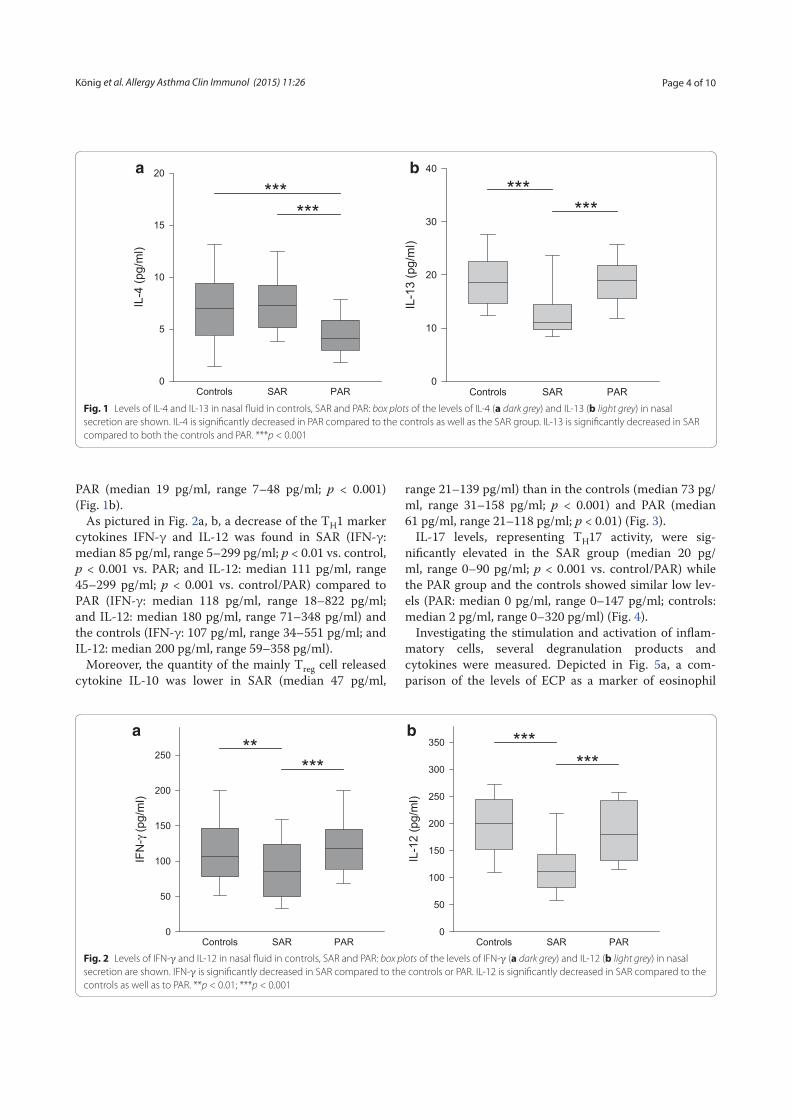
As pictured in Fig. 2a, b, a decrease of the TH1 marker
cytokines IFN-γ and IL-12 was found in SAR (IFN-γ:
median 85 pg/ml, range 5–299 pg/ml; p < 0.01 vs. control,
p < 0.001 vs. PAR; and IL-12: median 111 pg/ml, range
45–299 pg/ml; p < 0.001 vs. control/PAR) compared to
PAR (IFN-γ: median 118 pg/ml, range 18–822 pg/ml;
and IL-12: median 180 pg/ml, range 71–348 pg/ml) and
the controls (IFN-γ: 107 pg/ml, range 34–551 pg/ml; and
IL-12: median 200 pg/ml, range 59–358 pg/ml).
Moreover, the quantity of the mainly Treg cell released
cytokine IL-10 was lower in SAR (median 47 pg/ml,
range 21–139 pg/ml) than in the controls (median 73 pg/
ml, range 31–158 pg/ml; p < 0.001) and PAR (median
61 pg/ml, range 21–118 pg/ml; p < 0.01) (Fig. 3).
IL-17 levels, representing TH17 activity, were sig-
nificantly elevated in the SAR group (median 20 pg/
ml, range 0–90 pg/ml; p < 0.001 vs. control/PAR) while
the PAR group and the controls showed similar low lev-
els (PAR: median 0 pg/ml, range 0–147 pg/ml; controls:
median 2 pg/ml, range 0–320 pg/ml) (Fig. 4).
Investigating the stimulation and activation of inflam-
matory cells, several degranulation products and
cytokines were measured. Depicted in Fig. 5a, a com-
parison of the levels of ECP as a marker of eosinophil
Controls SAR PAR
IL-4
(pg/m
l)
0
5
10
15
20
******
a
Controls SAR PAR
IL-1
3 (
pg/m
l)
0
10
20
30
40
******
b
Fig. 1 Levels of IL-4 and IL-13 in nasal fluid in controls, SAR and PAR: box plots of the levels of IL-4 (a dark grey) and IL-13 (b light grey) in nasal
secretion are shown. IL-4 is significantly decreased in PAR compared to the controls as well as the SAR group. IL-13 is significantly decreased in SAR
compared to both the controls and PAR. ***p < 0.001
Controls SAR PAR
IFN
-γ (
pg/m
l)
0
50
100
150
200
250**
***
a
Controls SAR PAR
IL-1
2 (
pg/m
l)
0
50
100
150
200
250
300
350 ******
b
Fig. 2 Levels of IFN-γ and IL-12 in nasal fluid in controls, SAR and PAR: box plots of the levels of IFN-γ (a dark grey) and IL-12 (b light grey) in nasal
secretion are shown. IFN-γ is significantly decreased in SAR compared to the controls or PAR. IL-12 is significantly decreased in SAR compared to the
controls as well as to PAR. **p < 0.01; ***p < 0.001

Page 5 of 10König et al. Allergy Asthma Clin Immunol (2015) 11:26
activation in nasal mucosa revealed an increase in SAR
(median 116 ng/ml, range 0–1000 ng/ml; p < 0.001) and
PAR (median 43 ng/ml, range 0–1000 ng/ml; p < 0.01)
compared to the controls (median 20 ng/ml, range
0–467 ng/ml). Likewise, tryptase levels displaying mast
cell activation were significantly elevated in the nasal
secretions of the SAR (median 20 ng/ml, range 0–452 ng/
ml; p < 0.001) and the PAR group (median 9 ng/ml,
range 0–1000 ng/ml, p < 0.001) compared to con-
trols (median 0 ng/ml, range 0–94 ng/ml) (Fig. 5b). As
shown in Table 3, for G-CSF and GM-CSF, no significant
differences among the three groups were found. Also, the
amount of IL-1β in the nasal secretions was rather simi-
lar in all groups. Levels of IL-5 in SAR were significantly
increased over the controls. However, no statistically
significant difference between the controls and PAR was
seen. #e measurement of IL-6 revealed no differences
among the three groups.
Also displayed in Table 3 are the levels of chemokines
in nasal discharge of AR participants and controls. An
elevation of eotaxin was found in SAR compared to PAR.
Concerning RANTES, higher levels were detected in
SAR than in PAR whereas no significant difference could
be seen between the control group and either of the AR
groups. In comparison to the controls, elevated levels of
MCP-1 were found in both AR groups. MIP-1α showed
a significantly elevated level in the SAR group compared
to control as to PAR. For MIP-1β, compared to control
(median 103 pg/ml, range 0–2049 pg/ml), an increase
was found in SAR (median 226 pg/ml, range 16–1769 pg/
ml; p < 0.001) as well as in PAR (median 161 pg/ml, range
0–2138 pg/ml; p < 0.05) (Fig. 6).
DiscussionNasal secretion is easily accessible and Bio-Plex Cytokine
Assay is simple to perform. #us, it constitutes a method-
ological approach possibly applicable in clinical routine.
Cytokines in the nasal fluid of participants suffering from
SAR or PAR were analysed in a true-to-life clinical set-
ting. Aim of the present study was to investigate whether
in AR, representative cytokines in nasal discharge show
distinct patterns proving the used methodology helpful
for endotyping of inflammatory nasal diseases.
For a lifelike approach, we chose to collect the samples
neither during specific seasons of the year nor after aller-
gen provocation. In SAR, the participants’ exposition to
aeroallergens depends not only on the absolute amount
of antigens in the air but also on the habitation, profes-
sion and habits of the individual participant as well as
his efforts of abstention. Likewise, it is difficult to find
objective measurements for the individual pollination in
PAR participants’ everyday life which also varies in the
course of the year [18]. We thus refrained from deter-
mining the exact pollution with antigens. Moreover, not
using subjective or objective measures of AR, we did not
know if participants were actually suffering from AR at
the time of sample collection. #e magnitude of the aller-
gic response is associated with the preseasonal values of
IgE [8] and the levels of cytokines were found to differ
between atopic and non-atopic subjects during as well as
outside the pollen season [19]. Addressing the important
question of trends in cytokine levels over time, longitudi-
nal studies instead of the presented cross-sectional study
are mandatory.
Controls SAR PAR
IL-1
0 (
pg/m
l)
0
20
40
60
80
100
120
140
*****
Fig. 3 Levels IL-10 in nasal fluid in controls, SAR and PAR: box plot of
IL-10 levels in nasal secretion is shown. IL-10 is significantly decreased
in SAR compared to the controls as well as to PAR. **p < 0.01;
***p < 0.001
Controls SAR PAR
IL-1
7 (
pg/m
l)
0
20
40
60
******
Fig. 4 Levels IL-17 in nasal fluid in controls, SAR and PAR: box plot of
IL-17 levels in nasal secretion is shown. IL-17 is significantly increased
in SAR compared to both the controls and PAR. ***p < 0.001

Page 6 of 10König et al. Allergy Asthma Clin Immunol (2015) 11:26
IL-4 and IL-13 are produced by TH2-cells and other
inflammatory cells such as mast cells, eosinophils
or basophils [20]. In the pathology of allergy, similar
responses to these cytokines are known. #ey act in
concert or alone to induce differentiation of TH-cells,
migration of T-cells and eosinophils, Ig class switch-
ing or mucus secretion [20, 21]. In the present study, we
surprisingly found normal or decreased levels of these
TH2 characterising cytokines, contradicting an expected
upregulation, which would lead to stimulation of IgE
production. Previous studies on IL-4 and IL-13 revealed
normal or elevated levels in nasal secretions under nat-
ural allergen exposure, while increases were reported
after provocation tests [9, 15, 19, 22]. One group found
decreased levels of IL-4 in SAR patients [23]. We
measured the cytokine levels without prior nasal allergen
challenge, which might explain the missing elevations in
our study. On the one hand it might be concluded that
the amount of allergens in natural environment is not
high enough to provoke profuse production of IL-4 and
IL-13 but on the other hand this cannot explain decrease.
No definite explanation can be given to the normal or
even decreased values of IL-4 and IL-13, a methodologi-
cal cause cannot be ruled out.
Although allergy is known to be a TH2-dominated dis-
ease, the role of other T-cell subsets was also of interest
in the presented work. IL-12 and IFN-γ are well-known
indicators of TH1-type inflammation and crucial to
induction and maintenance of TH1 response, activating
preferably phagocytic and cytotoxic immune cells [24,
Controls SAR PAR
EC
P (
ng/m
l)
0
200
400
600
800
1000 **
***
a
Controls SAR PAR
Try
pta
se (
ng/m
l)
0
50
100
150
200
250
300
***
***
b
Fig. 5 Levels of ECP and tryptase in nasal fluid in controls, SAR and PAR: box plots of the levels of ECP (a dark grey) and tryptase (b light grey) in nasal
secretion are shown. ECP is significantly elevated in SAR and PAR compared to controls. Tryptase is significantly elevated in SAR and PAR compared
to controls. **p < 0.01; ***p < 0.001
Table 3 Cytokine levels in nasal #uid in healthy controls, SAR and PAR patients
Concentrations are given in pg/ml. Data are presented as median (upper line) and range (lower line)
n.s. not signi"cant
IL-1β IL-5 IL-6 G-CSF GM-CSF Eotaxin RANTES MCP-1 MIP-1α
Controls 20 5 25 90 32 45 9 66 0
4–1000 1–238 0–3036 9–7962 0–137 0–154 0–259 17–401 0–113
SAR 33 13 39 165 28 67 16 94 8
2–1677 0–829 5–443 10–10,681 0–115 0–503 0–766 30–600 0–66
PAR 31 6 32 146 27 30 0 93 0
5–7894 1–761 0–397 0–17,211 0–149 0–220 0–509 0–866 0–119
p values
SAR-Con n.s. <0.05 n.s. n.s. n.s. n.s. n.s. <0.01 <0.001
PAR-Con n.s. n.s. n.s. n.s. n.s. n.s. n.s. <0.05 n.s.
SAR-PAR n.s. n.s. n.s. n.s. n.s. <0.001 <0.01 n.s. <0.001

Page 7 of 10König et al. Allergy Asthma Clin Immunol (2015) 11:26
25]. Moreover, these cytokines counteract the differen-
tiation of TH2 and TH17 [24]. In our study, the levels of
IL-12 and IFN-γ were both decreased in SAR but not in
PAR. #is points to a downregulation of TH1-lympho-
cytes in SAR.
Having the ability to reduce Ig production and tis-
sue eosinophilia as well as TH2- and TH17-dependent
reactions, regulatory T-cells are essential in maintain-
ing peripheral tolerance. Allergen-specific Treg-cells
have been reported to be diminished in PAR and have
decreased suppressive capacity in SAR [26]. IL-10 is
an immunomodulatory cytokine which, together with
tumor growth factor (TGF)-β, is important for Treg oper-
ability. Previous studies on the levels of IL-10 revealed
discordant data. Unchanged or increased levels were
found in naïve nasal secretions of SAR patients, while
IL-10 was elevated after allergen provocation and specific
immunotherapy [12, 22, 26]. Our results might suggest a
diminished influence of Treg-cells in SAR, illustrating the
impaired peripheral tolerance in AR. However, no final
conclusion on Treg can be drawn based on our results
as IL-10 is produced by other cell types like TH2 cells as
well.
IL-17 is a cytokine with proinflammatory proper-
ties influencing diverse cells. IL-17 producing cells,
named TH17, were discovered in the beginning of this
century. Though TH17-lymphocytes were a subject
of interest in recent years, their role in AR remains
unclear. Scadding suspects elevated levels of this
cytokine, predominantly in PAR [12]. Our study does
not support this thesis, showing an elevation of IL-17
in SAR but undetectable levels in the majority of the
PAR samples. This is in line with a previous study
reporting no elevation of IL-17 in nasal discharge of
PAR patients [15].
Concerning the role of the discussed T-cell subsets
in AR, our results suggest a downregulation of TH1 and
Treg-lymphocytes especially in SAR. #is indicates an
imbalance between the different T-cell subsets result-
ing in an impaired tolerance to allergens. Furthermore,
increased markers of TH17 activity were found in AR
leaving this T-cell subset as a field of future research.
Mast cells, activated by antigen and IgE, immediately
release preformed mediators such as histamine, seroto-
nin, and tryptase. Moreover, stimulated mast cells newly
produce a number of other mediators, which are released
during the late-phase of allergic reaction [27]. We utilised
tryptase as a marker of mast cell activation and detected
elevated levels in both SAR and PAR. #is is concord-
ant with previous reports of elevated levels of tryptase
caused by natural or artificial allergen exposure [28, 29]
and emphasises the importance of mast cells in AR.
As the eosinophil is one of the predominant cell types
in AR, we measured two indicators of eosinophil activa-
tion, ECP and IL-5. #e level of ECP, which is secreted
by eosinophils and important in the defence of patho-
gens, correlates positively with the number of nasal
eosinophils [14, 30]. Consistent with previous reports,
our study found significantly elevated levels of ECP [14].
#e amount of nasal ECP was sixfold higher in SAR and
doubled in PAR in comparison to the controls. IL-5, pri-
marily produced by mast cells and TH2-lymphocytes, is
thought to be responsible for eosinophil survival, chemo-
taxis, and activation [31]. #is makes this cytokine a sec-
ond suitable indicator of eosinophil activation. Just as for
ECP, we found elevated levels in SAR, highlighting the
importance of eosinophils in this disease entity. However,
the concentration of IL-5 in PAR was in normal range.
We conclude that the role of eosinophils might be less in
PAR than in SAR, and other factors are more important
in maintaining the more chronic inflammation. #e ele-
vated level of IL-5 in SAR might also be a possible thera-
peutic target. Pavord et al. [32] found reduced numbers
of eosinophils in blood samples of asthmatics treated
with an monoclonal antibody against IL-5. In conclusion,
we found elevated levels of markers of eosinophil activa-
tion in both AR groups. However, the effect was more
pronounced in SAR, suggesting a greater influence of
eosinophils in SAR than in PAR.
Concerning the next group of cytokines, the colony-
stimulating factors, surprisingly no increases could be
shown. GM-CSF is a multifunctional proinflammatory
cytokine produced by a host of different cells, amongst
them epithelial cells, mononuclear cells or eosino-
phils. It acts locally in the nose stimulating dendritic
cells as well as neutrophils and eosinophils. Moreover,
Controls SAR PAR
MIP
-1β
(pg/m
l)
0
200
400
600
800
1000
1200
1400 ****
Fig. 6 Levels of MIP-1β in nasal fluid in controls, SAR and PAR: box
plot of MIP-1β levels in nasal secretion. MIP-1β is significantly elevated
in SAR as well as in PAR compared to controls. *p < 0.05; ***p < 0.001

Page 8 of 10König et al. Allergy Asthma Clin Immunol (2015) 11:26
GM-CSF induces proliferation and differentiation of stem
cells [33]. An increase of GM-CSF in AR patients was
reported [9]. However, we could not reproduce this find-
ing, which might be due to the fact that our samples were
taken without prior allergen provocation. For G-CSF, we
did not find a statistically significant increase in either of
the groups as well. G-CSF is known to regulate prolifera-
tion of haematopoietic progenitor cells and to influence
neutrophil function. As most groups did not examine the
amount of G-CSF in AR, little is known about its impact
on AR. Pelikan [34] found elevated levels in tears of SAR
patients after allergen provocation, providing evidence
for an influence of G-CSF in this disease entity. But fur-
ther research is needed to define its role in allergy.
We also measured the amount of two well-established
proinflammatory cytokines, IL-1β and IL-6. For both
cytokines, no statistically significant difference between
the three groups was found. IL-1β and IL-6 are rather
unspecific markers of inflammation. Various inflamma-
tory cells are able to produce these pleiotropic cytokines.
Physiologically, IL-1β and IL-6 influence the growth and
maturation of immune cells as well as haematopoiesis.
Furthermore, they are involved in auto-inflammatory dis-
eases and oncogenesis [35, 36]. Data on these two general
markers of inflammation in nasal fluids are inconsist-
ent [12]. Pelikan [34] did not find elevated levels of IL-6
in tears of allergic subjects. #is is consistent with our
results, but disagrees with an elevation of IL-1β and IL-6
found by others [9]. An explanation could be that we
examined nasal secretions under natural allergen expo-
sure while elevated levels were described after experi-
mental allergen challenge.
#e late-response of allergic reaction is characterised
by the influx of inflammatory cells into the site of inflam-
mation. In this process, chemokines play a crucial role.
To measure the recruitment of eosinophils, we examined
three chemokines potently attracting these cells: eotaxin,
RANTES, and MIP-1α. For all three, the concentration
in nasal secretions of SAR participants was increased.
Eotaxin, a specific eosinophil attractant, was elevated
in SAR over the PAR group. Our results affirm the find-
ings of Chawes et al. [22], who found elevated levels of
eotaxin in nasal secretions of SAR patients under natural
allergen exposure. Moreover, an increase of eotaxin posi-
tive cells and eosinophils in nasal biopsies was reported
after allergen provocation [37]. Concerning RANTES,
there was a significant elevation in SAR over PAR, while
the differences between either of the AR groups and
the controls were not significant. RANTES is not only
known to attract eosinophils but also to cause activa-
tion of eosinophils and basophils resulting in inflamma-
tory mediator release [21]. Further, elevated levels were
reported after nasal allergen challenge [9]. #e levels of
MIP-1α were significantly increased in SAR participants.
MIP-1α is produced by a number of inflammatory cells
and is able to attract granulocytes as well as to activate
eosinophils, to stimulate T-cells and to regulate Ig pro-
duction [21, 38]. It is reported to be elevated after nasal
allergen challenge [9, 12]. Interestingly, this chemokine
was not detectable in the majority of our controls or PAR
participants, while in SAR, most participants had detect-
able levels of MIP-1α. In summary, our results show an
increase of eosinophil attractants in SAR. #is is in line
with the elevated levels of ECP and IL-5, emphasising the
prominent role of eosinophils in SAR, while the normal
levels of IL-5 and just slightly elevated levels of ECP in
PAR indicate a minor role of eosinophils in the chronic
inflammation of PAR.
#e levels of MCP-1 and MIP-1β were elevated in
either of the AR groups. Increased MCP-1 and MIP-1β
release has been reported under natural exposure as well
as after allergen provocation in SAR subjects [12, 22].
MCP-1 potently attracts and activates monocytes and
basophils, and recruits macrophages and neutrophils
[38, 39]. Secreted by monocytes, natural killer cells and
activated lymphocytes, MIP-1β recruits lymphocytes,
natural killer cells and immature dendritic cells [40]. #e
elevation of these two chemokines clearly shows that in
both SAR and PAR, a bunch of diverse inflammatory cells
is recruited. Our results thus support the concept of min-
imal persistent inflammation in PAR [41]. #is concept
states a persistent infiltration of neutrophils under con-
tinuous low allergen exposure while eosinophils and mast
cells have minor influence.
ConclusionsAim of our study was to find distinct cytokine profiles in
nasal discharge of AR participants in a lifelike approach,
which might be useful for diagnostic purposes. Evaluat-
ing our results, ECP, tryptase, MCP-1, and MIP-1β are
suitable markers to differentiate AR participants from
healthy subjects. Furthermore, in SAR eotaxin, MIP-1α,
and IL-17 are elevated in comparison to both PAR par-
ticipants as well as controls. In addition, reduced levels of
IFN-γ and IL-10 are found. Moreover, SAR and PAR can
be distinguished by the levels of RANTES. Even though
some questions remain unanswered, we have demon-
strated that the methodology used in this study could
be developed into a diagnostic tool for “endotyping” of
patients in daily clinical routine. If such an “endotyping”
is feasible in nasal discharge, this method is superior to
immunohistochemical analysis of nasal biopsy specimen
because nasal discharge is easily accessible and collec-
tion is harmless to the patient. Further research is needed

Page 9 of 10König et al. Allergy Asthma Clin Immunol (2015) 11:26
to describe the cytokine patterns in nasal fluid of pure
CRS with or without nasal polyps followed by examina-
tions of mixed forms of CRS and AR. In the long term,
easily accessible biomarkers could help to match patients
with innovative therapeutic approaches like anti-cytokine
antibodies. Uncovering specific endotypes out of clini-
cally similar phenotypes might result in a more targeted,
individualised therapy beneficial to the patient.
Authors’ contributions
SB, MK and MG contributed to the study design, and to interpretation and
analysis of the data. MG additionally coordinated the study and helped
to draft the manuscript. KK performed the Pharmacia CAP System ECP/
Tryptase FEIA as well as the Bio-Rad Cytokine Multi-Plex assays and drafted
the manuscript. CK participated in the Bio-Rad Cytokine Multi-Plex assays and
contributed—together with KE and MSN—to the sample collection and data
acquisition. All authors read and approved the final manuscript.
Author details1 Department of Otorhinolaryngology, Head and Neck Surgery, University
Medical Center Großhadern of the Ludwig-Maximilians-University Munich,
Marchioninistr. 15, 81377 Munich, Germany. 2 Department of Otorhinolaryn-
gology, Head and Neck Surgery, University Medical Center of the Johannes
Gutenberg University Mainz, Langenbeckstr. 1, 55101 Mainz, Germany.
Acknowledgements
We thank Bio-Rad Laboratories, Hercules, California, USA, for providing the
Multi-Plex assays. Further, we would like to express our thanks to Mrs. Elisabeth
Pfrogner and Mrs. Gabriele Bärr for skilful technical assistance.
Compliance with ethical guidelines
Competing interests
The authors declare that they have no competing interests.
Received: 8 July 2015 Accepted: 15 September 2015
References
1. Bousquet J, van Cauwenberge P, Khaltaev N. Allergic rhinitis and its
impact on asthma. J Allergy Clin Immunol. 2001;108:147–334.
2. Greiner AN, Hellings PW, Rotiroti G, Scadding GK. Allergic rhinitis. The
Lancet. 2011;378:2112–22.
3. Bauchau V, Durham SR. Prevalence and rate of diagnosis of allergic rhinitis
in Europe. Eur Respir J. 2004;24:758–64.
4. Keith PK, Desrosiers M, Laister T, Schellenberg RR, Waserman S. The
burden of allergic rhinitis (AR) in Canada: perspectives of physicians and
patients. Allergy Asthma Clin Immunol. 2012;8:7.
5. Todo-Bom A, Loureiro C, Almeida MM, Nunes C, Delgado L, Castel-Branco
G, et al. Epidemiology of rhinitis in Portugal: evaluation of the intermit-
tent and the persistent types. Allergy. 2007;62:1038–43.
6. Bousquet J, Neukirch F, Bousquet PJ, Gehano P, Klossek JM, Le Gal M,
et al. Severity and impairment of allergic rhinitis in patients consulting in
primary care. J Allergy Clin Immunol. 2006;117:158–62.
7. Hellgren J, Cervin A, Nordling S, Bergman A, Cardell LO. Allergic rhinitis
and the common cold–high cost to society. Allergy. 2010;65:776–83.
8. Henderson LL, Larson JB, Gleich GJ. Maximal rise in IgE antibody following
ragweed pollination season. J Allergy Clin Immunol. 1975;55:10–5.
9. Ferreira MA. Cytokine expression in allergic inflammation: systematic
review of in vivo challenge studies. Mediators Inflamm. 2003;12:259–67.
10. Sin B, Togias A. Pathophysiology of allergic and nonallergic rhinitis. Proc
Am Thorac Soc. 2011;8:106–14.
11. Akdis M, Blaser K, Akdis CA. T regulatory cells in allergy. Chem Immunol
Allergy. 2006;91:159–73.
12. Scadding G. Cytokine profiles in allergic rhinitis. Curr Allergy Asthma Rep.
2014;14:435.
13. Oboki K, Ohno T, Saito H, Nakae S. Th17 and allergy. Allergol Int.
2008;57:121–34.
14. Rasp G, Thomas PA, Bujia J. Eosinophil inflammation of the nasal
mucosa in allergic and non-allergic rhinitis measured by eosinophil
cationic protein levels in native nasal fluid and serum. Clin Exp Allergy.
1994;24:1151–6.
15. Groger M, Klemens C, Wendt S, Becker S, Canis M, Havel M, et al. Media-
tors and cytokines in persistent allergic rhinitis and nonallergic rhinitis
with eosinophilia syndrome. Int Arch Allergy Immunol. 2012;159:171–8.
16. Kramer MF, Burow G, Pfrogner E, Rasp G. In vitro diagnosis of chronic
nasal inflammation. Clin Exp Allergy. 2004;34:1086–92.
17. Vignali DA. Multiplexed particle-based flow cytometric assays. J Immunol
Methods. 2000;243:243–55.
18. Hervas D, Pons J, Mila J, Matamoros N, Hervas JA, Garcia-Marcos L.
Specific IgE levels to Dermatophagoides pteronyssinus are associated with
meteorological factors. Int Arch Allergy Immunol. 2013;160:383–6.
19. Benson M, Strannegard IL, Wennergren G, Strannegard O. Cytokines in
nasal fluids from school children with seasonal allergic rhinitis. Pediatr
Allergy Immunol. 1997;8:143–9.
20. Williams CM, Rahman S, Hubeau C, Ma HL. Cytokine pathways in allergic
disease. Toxicol Pathol. 2012;40:205–15.
21. Romagnani S. Cytokines and chemoattractants in allergic inflammation.
Mol Immunol. 2002;38:881–5.
22. Chawes BL, Edwards MJ, Shamji B, Walker C, Nicholson GC, Tan AJ, et al.
A novel method for assessing unchallenged levels of mediators in nasal
epithelial lining fluid. J Allergy Clin Immunol. 2010;125:1387–9.
23. Baumann R, Rabaszowski M, Stenin I, Tilgner L, Scheckenbach K, Wiltfang
J, et al. Comparison of the nasal release of IL-4, IL-10, IL-17, CCL13/MCP-4,
and CCL26/eotaxin-3 in allergic rhinitis during season and after allergen
challenge. Am J Rhinol Allergy. 2013;27:266–72.
24. Billiau A, Matthys P. Interferon-gamma: a historical perspective. Cytokine
Growth Factor Rev. 2009;20:97–113.
25. Boyman O, Purton JF, Surh CD, Sprent J. Cytokines and T-cell homeostasis.
Curr Opin Immunol. 2007;19:320–6.
26. Soyka MB, Holzmann D, Akdis CA. Regulatory cells in allergen-specific
immunotherapy. Immunotherapy. 2012;4:389–96.
27. Galli SJ, Tsai M. IgE and mast cells in allergic disease. Nat Med.
2012;18:693–704.
28. Groger M, Bernt A, Wolf M, Mack B, Pfrogner E, Becker S, et al. Eosinophils
and mast cells: a comparison of nasal mucosa histology and cytology to
markers in nasal discharge in patients with chronic sino-nasal diseases.
Eur Arch Otorhinolaryngol. 2013;270:2667–76.
29. Scadding GW, Calderon MA, Bellido V, Koed GK, Nielsen NC, Lund K,
et al. Optimisation of grass pollen nasal allergen challenge for assess-
ment of clinical and immunological outcomes. J Immunol Methods.
2012;384:25–32.
30. Bystrom J, Amin K, Bishop-Bailey D. Analysing the eosinophil cationic
protein—a clue to the function of the eosinophil granulocyte. Respir Res.
2011;12:10.
31. Minai-Fleminger Y, Levi-Schaffer F. Mast cells and eosinophils: the two key
effector cells in allergic inflammation. Inflamm Res. 2009;58:631–8.
32. Pavord ID, Korn S, Howarth P, Bleecker ER, Buhl R, Keene ON, et al.
Mepolizumab for severe eosinophilic asthma (DREAM): a multicentre,
double-blind, placebo-controlled trial. Lancet. 2012;380:651–9.
33. Francisco-Cruz A, Aguilar-Santelises M, Ramos-Espinosa O, Mata-Espinosa
D, Marquina-Castillo B, Barrios-Payan J, et al. Granulocyte–macrophage
colony-stimulating factor: not just another haematopoietic growth factor.
Med Oncol. 2014;31:774.
34. Pelikan Z. Cytokine profiles in tears accompanying the second-
ary conjunctival responses induced by nasal allergy. Curr Eye Res.
2014;39:120–32.
35. Krause K, Metz M, Makris M, Zuberbier T, Maurer M. The role of inter-
leukin-1 in allergy-related disorders. Curr Opin Allergy Clin Immunol.
2012;12:477–84.
36. Kishimoto T. IL-6: from its discovery to clinical applications. Int Immunol.
2010;22:347–52.
37. Braunstahl GJ, Overbeek SE, Kleinjan A, Prins JB, Hoogsteden HC, Fokkens
WJ. Nasal allergen provocation induces adhesion molecule expression

Page 10 of 10König et al. Allergy Asthma Clin Immunol (2015) 11:26
and tissue eosinophilia in upper and lower airways. J Allergy Clin Immu-
nol. 2001;107:469–76.
38. Kita H, Gleich GJ. Chemokines active on eosinophils: potential roles in
allergic inflammation. J Exp Med. 1996;183:2421–6.
39. Gaga M, Ong YE, Benyahia F, Aizen M, Barkans J, Kay AB. Skin reactivity
and local cell recruitment in human atopic and nonatopic subjects by
CCL2/MCP-1 and CCL3/MIP-1alpha. Allergy. 2008;63:703–11.
40. Menten P, Wuyts A, Van Damme J. Macrophage inflammatory protein-1.
Cytokine Growth Factor Rev. 2002;13:455–81.
41. Gelardi M, Luigi Marseglia G, Licari A, Landi M, Dell’Albani I, Incorvaia C,
et al. Nasal cytology in children: recent advances. Ital J Pediatr. 2012;38:51.
Submit your next manuscript to BioMed Centraland take full advantage of:
• Convenient online submission
• Thorough peer review
• No space constraints or color figure charges
• Immediate publication on acceptance
• Inclusion in PubMed, CAS, Scopus and Google Scholar
• Research which is freely available for redistribution
Submit your manuscript at www.biomedcentral.com/submit

König et al.
Allergy Asthma Clin Immunol (2016) 12:19
DOI 10.1186/s13223-016-0123-3
RESEARCH
Cytokine patterns in nasal secretion of non-atopic patients distinguish between chronic rhinosinusitis with or without nasal polysKatrin König1, Christine Klemens1, Mareike Haack1, Marion San Nicoló1, Sven Becker1,2, Matthias F. Kramer1
and Moritz Gröger1*
Abstract
Background: Being one of the most common nasal diseases, chronic rhinosinusitis (CRS) is subdivided into CRS with
nasal polyps (NP) and CRS without nasal polyps (CRSsNP). CRSsNP presents itself with a TH1 milieu and neutrophil infil-
tration, while NP is characterised by a mixed TH1/TH2 profile and an influx of predominantly eosinophils, plasma cells
and mast cells. For the purpose of discovering disease-specific cytokine profiles, the present study compares levels of
mediators and cytokines in nasal secretions between CRSsNP, NP, and healthy controls.
Methods: The study included 45 participants suffering from NP, 48 suffering from CRSsNP and 48 healthy controls.
Allergic rhinitis constituted an exclusion criterion. Nasal secretions, sampled using the cotton wool method, were
analysed for IL-4, IL-5, IL-10, IL-12, IL-13, IL-17, IL-8, GM-CSF, G-CSF, IFN-γ, MCP-1, MIP-1α, MIP-1β, eotaxin, and RANTES,
and for ECP and tryptase, using Bio-Plex Cytokine assay or ELISA, respectively.
Results: Elevated levels of IL-5, IL-17, G-CSF, MCP-1, MIP-1α, MIP-1β, ECP, and tryptase, as well as decreased levels of
IL-10, IL-12, IL-13, and IFN-γ were detected in NP. CRSsNP presented increased levels of RANTES and MIP-1β while IL-13
was decreased. No differences between the three groups were found for IL-4, IL-8, GM-CSF, and eotaxin.
Conclusions: The present work suggests a disequilibrium of TH1 and TH2, together with a down-regulation of regula-
tory T lymphocytes and up-regulated TH17 in NP. Moreover, elevated levels of diverse mediators represent the activa-
tion of various inflammatory cells in this disease entity. The inflammation in CRSsNP, however, is only weakly depicted
in nasal secretions. Therefore, cytokines in nasal secretions may provide helpful information for differential diagnosis.
Keywords: Chronic rhinosinusitis, Nasal polyps, Nasal discharge, Mediators, Cytokines, Chemokines
© 2016 König et al. This article is distributed under the terms of the Creative Commons Attribution 4.0 International License (http://creativecommons.org/licenses/by/4.0/), which permits unrestricted use, distribution, and reproduction in any medium, provided you give appropriate credit to the original author(s) and the source, provide a link to the Creative Commons license, and indicate if changes were made. The Creative Commons Public Domain Dedication waiver (http://creativecommons.org/publicdomain/zero/1.0/) applies to the data made available in this article, unless otherwise stated.
BackgroundChronic rhinosinusitis (CRS) is one of the most common
nasal diseases, affecting 5 % of the Canadian population
and 11 % of Europeans [1, 2]. Deteriorating both physi-
cal and mental health, CRS significantly impairs patients’
quality of life and imposes immense costs on the public
health system [3, 4]. CRS is characterised by an inflam-
mation of the nose and paranasal sinuses for more than
12 weeks, causing nasal obstruction and discharge, facial
pain, and reduction of smell [5]. By nasal endoscopy, this
disease is subdivided into CRS with nasal polyps (NP)
and CRS without nasal polyps (CRSsNP) [5].
Nasal polyps manifest themselves macroscopically as
grey masses, prolapsing into the nasal cavity. In histologi-
cal sections, oedema, pseudocysts, and a colourful infil-
trate of inflammatory cells are seen. In contrast, CRSsNP
is characterised by fibrosis and basement membrane
thickening [6].
Open Access
Allergy, Asthma & Clinical Immunology
*Correspondence: [email protected] 1 Department of Otorhinolaryngology, Head and Neck Surgery, University
Medical Center Großhadern of the Ludwig-Maximilians-University
Munich, Marchioninistr. 15, 81377 Munich, Germany
Full list of author information is available at the end of the article

Page 2 of 9König et al. Allergy Asthma Clin Immunol (2016) 12:19
#e pathophysiology of CRS is not yet well understood.
Although CRS may be associated to genetic or systemic
diseases such as cystic fibrosis or sarcoidosis, the major-
ity of the CRS patients seems to suffer from idiopathic
disease [7]. Concerning the aetiopathology, local and sys-
temic host factors as well as environmental factors have
been discussed [8]. However, hypotheses about impaired
innate immunity, fungi, or superantigens remain to
be verified. Atopic diseases are more frequent in CRS
patients than in the general population, and allergy as an
associated or deteriorating factor has also been discussed
[9]. Yet, a definitive answer is owing.
According to reported cell and cytokine patterns,
CRSsNP and NP seem to be different disease entities.
CRSsNP is characterised by a TH1 milieu and neutro-
phils. NP, on the other hand, shows a mixed TH1/TH2
profile with increased numbers of eosinophils, plasma
cells and mast cells [6, 10]. However, this only applies
to the majority of the Caucasian NP patients; Asian NP
patients have been reported to show a TH1/TH17 polari-
sation, while the T cell patterns of CRSsNP were similar
in both races [6, 11, 12].
#e present work compares cytokines in nasal secre-
tions of NP and CRSsNP patients to those of healthy
subjects. In the present study, we wanted to study CRS
in pure form. As interference between the pathophysi-
ological processes of allergic rhinitis and CRS is conceiv-
able, allergy testing was performed to exclude allergic
patients from the study. Levels of cytokines were inves-
tigated in order to determine whether the pathophysi-
ology of CRS is depicted in nasal secretions. Our study
focusses on two major aspects: the regulation of the T
cell subsets TH1, TH2, TH17, and regulatory T cells (Treg),
represented by levels of interleukin (IL)-4, IL-5, IL-10,
IL-12, IL-13, IL-17, and Interferon (IFN)–γ, and the
regulation and activation of inflammatory cells such as
granulocytes and mast cells by levels of IL-5, IL-8, gran-
ulocyte–macrophage colony-stimulating factor (GM-
CSF), granulocyte colony-stimulating factor (G-CSF),
eotaxin, “regulated on activation, normal T cell expressed
and secreted” (RANTES) protein, macrophage inflamma-
tory protein (MIP)-1α, MIP-1β, monocyte chemotactic
protein-1 (MCP-1), eosinophil cationic protein (ECP),
and tryptase.
MethodsStudy population
141 volunteers (64 males, 77 females, mean age
41 ± 15 years) participated in the present study. Clinical
history was taken by one of the investigators. All subjects
were tested for allergy to aeroallergens with the in vitro
allergy screening test Sx1 (Phadia, Freiburg, Germany).
Based on a fluorescence-enzyme-immunoassay (FEIA)
this method tests for IgE to inhalant allergens in partici-
pants’ sera. Volunteers presenting a history of allergy or a
positive Sx1 were excluded from the study.
Any medication concerning the nasal disease during
6 weeks prior to the examination constituted an exclu-
sion criterion, particularly anti-inflammatory medica-
tion such as topical nasal steroids. To detect nasal polyps
and exclude patients with signs of purulent rhinitis, nasal
endoscopy was performed in all volunteers. For ethical
reasons, X-ray computed tomography (CT) scanning was
only performed if indicated for medical care, but not for
the purpose of this study.
NP (n = 45) was determined by the patient’s history
and the presence of endoscopically visible polyps in the
nasal cavity, the paranasal sinuses, or both.
CRSsNP (n = 48) was determined clinically by typical
complaints in the patient’s history such as midfacial pain
or pressure, postnasal drip, nasal obstruction, or reduc-
tion of smell. Inspection of the nose and nasal endoscopy
revealed the picture of a chronic mucosal inflammation
in the absence of polyps.
Healthy controls (n = 48) presented no history of
inflammatory nasal complaints and normal findings in
the endoscopic examination.
#e study was approved by the ethics committee of
the medical faculty of Ludwig-Maximilians-University
in Munich, Germany, and written informed consent was
obtained from all participants.
Biochemical and immunological methods
Nasal secretions were gained and processed with minor
modifications as described by Rasp and co-workers [13]:
For the sampling of nasal secretions, small cone-shaped
cotton wool pieces (absorbent cotton, Hartmann, Hei-
denheim/Brenz, Germany) with a length of about 3 cm
and a diameter of about 6 mm were used. After posi-
tioning the cotton wool pieces in the middle meatus of
the nose, they were left in place for 20 min and subse-
quently centrifuged (+4 °C, 2000g) on a sieve for 10 min
[14].
Diluted 1:5, all samples were analysed for IL-4, IL-5,
IL-10, IL-12, IL-13, IL-17, IL-8, GM-CSF, G-CSF, IFN-γ,
MCP-1, MIP-1α, MIP-1β, eotaxin, and RANTES using
a human cytokine 17-plex panel (Bio-Plex Cytokine
Assay, Bio-Rad Laboratories, Hercules, California). #is
cytokine assay uses fluorescently-addressed polystyrene
beads with conjugated capture antibodies directed to
the aforesaid cytokines. After washing, a fluorescently
marked detection antibody builds an immunoassay with
the cytokine. For analysis, two lasers excite the fluoro-
chromes: one for classifying each bead, the other for
quantifying the amount of analyte bound [15]. #e detec-
tion threshold was 0.5 pg/ml.

Page 3 of 9König et al. Allergy Asthma Clin Immunol (2016) 12:19
ECP and tryptase were measured by ELISA (UniCAP-
FEIA, Phadia, Freiburg, Germany). Detection levels were
10 ng/ml for ECP, and 5 ng/ml for tryptase.
Statistics
SigmaPlot for Windows version 11.0 software (Systat
Software, San José, California, USA) was utilised for sta-
tistical evaluation and graphical presentation. As all data
failed normality testing (Shapiro–Wilk), the Kruskal–
Wallis one way analysis of variance (ANOVA) on Ranks
was used, testing for statistically significant difference in
the median values among the three groups. To isolate the
group or groups that differ from the others, the all pair-
wise multiple comparison procedures (Dunn’s Method)
was used in the following step. To reduce the false discov-
ery rate, the method of Benjamini and Yekutieli was used
[16]. Data are given as median and range. For graphic
presentation, data are displayed in a box plot with the
median (horizontal line within the box), the 25th and
75th percentile (boundary of the box), and the 10th and
90th percentile (whiskers above and below the box). Sig-
nificances are graphically represented between the corre-
sponding plots: * indicates p value <0.05, ** p value <0.01,
and *** p value <0.001.
ResultsIn total, 141 participants were included in this study, 45
people suffering from NP (28 males, 17 females; mean
age 42 ± 15 years), 48 suffering from CRSsNP (18 males,
30 females; mean age 42 ± 15 years) and 48 healthy sub-
jects (18 males, 30 females; mean age 40 ± 16 years).
#e levels of TH2 related cytokines presented an inho-
mogeneous picture (Table 1). For IL-4, the three groups
showed no significant differences. #e level of IL-5
was increased in NP in comparison to CRSsNP, while a
comparison between either of both groups of chronic
rhinosinusitis versus controls revealed no differences.
As shown in Fig. 1, CRSsNP (median 15 pg/ml, range
2–92 pg/ml; p < 0.01 vs. controls and vs. NP) as well as
NP (median 10 pg/ml, range 4–62 pg/ml; p < 0.001 vs.
controls) presented reduced amounts of IL-13 (controls:
median 19 pg/ml, range 10–32 pg/ml).
Compared to the controls and CRSsNP, the quanti-
ties of TH1 associated cytokines IL-12 (Fig. 2a), as well
as IFN-γ (Fig. 2b) were decreased in NP (IL-12: median
108 pg/ml, range 17–211 pg/ml, p < 0.001 vs. con-
trols and vs. CRSsNP; INF-γ median 63 pg/ml, range
0–308 pg/ml, p < 0.001 vs. controls and p < 0.01 vs.
CRSsNP). CRSsNP (IL-12: median 158 pg/ml, range
60–318 pg/ml; INF-γ median 102 pg/ml, range 0–683 pg/
ml) did not differ from the controls (IL-12: median
200 pg/ml, range 59–358 pg/ml; INF-γ median 107 pg/
ml, range 34–551 pg/ml).
Likewise, IL-10 (Fig. 3), a Treg related cytokine, was
decreased in NP (median 41 pg/ml, range 8–72 pg/
ml) compared to controls (median 73 pg/ml, range
31–158 pg/ml; p < 0.001) as well as to CRSsNP (median
74 pg/ml, range 20–118 pg/ml; p < 0.001).
In contrast to these diminished cytokine levels, the
TH17 respective cytokine IL-17 (Fig. 4) was elevated
in nasal secretions of NP patients (median 15 pg/ml,
range 0–105 pg/ml) in comparison to controls (median
2 pg/ml, range 0–320 pg/ml; p < 0.001) and to CRSsNP
(median 2 pg/ml, range 0–146 pg/ml; p < 0.001).
Mast cell activation was seen in NP patients by ele-
vated levels of tryptase in nasal secretion, as indicated
in Fig. 5a (NP median 11 pg/ml, range 0–75 pg/ml;
controls: median 0 pg/ml, range 0–94 pg/ml; CRSsNP
median 0 pg/ml, range 0–75 pg/ml; p < 0.001 vs. con-
trols). Additionally, ECP (Fig. 5b), a marker of eosino-
phil activation, was increased in NP (NP median 56 pg/
ml, range 0–1000 pg/ml; controls: median 20 pg/ml,
Table 1 Cytokine levels in nasal "uid in healthy controls, NP and CRSsNP participants
Concentrations are given in pg/ml. Data are presented as median (upper line) and range (lower line). To control the false discovery rate, we used the method of
Benjamini and Yukatieli. Thus, values marked with ‘*’ are regarded as non-signi#cant despite p < 0.05
n.s. not signi#cant; s. signi#cant
IL-4 IL-5 IL-8 IL-13 Eotaxin GM-CSF RANTES MCP-1 MIP-1α
Controls 70–32
51–238
1310189–42,868
1910–32
450–154
320–137
90–259
6617–401
00–113
NP 70–17
100–500
18510–265,037
104–62
750–422
270–112
140–563
11713–3867
60–60
CRSsNP 50–30
31–1831
18770–1,384,113
152–92
490–339
420–132
350–426
890–1676
00–673
P values
NP—Con n.s. (0.822) n.s. (0.070) n.s. (0.562) s. (< 0.001) n.s. (0.114) n.s. (0.286) n.s. (0.447) s. (< 0.001) s. (< 0.001)
CRSsNP—Con n.s. (0.133) n.s. (0.025)* n.s. (0.291) s. (< 0.01) n.s. (0.361) n.s. (0.456) s. (< 0.050) n.s. (0.028)* n.s. (0.028)*
NP—CRSsNP n.s. (0.213) s. (<0.001) n.s. (0.887) s. (< 0.01) n.s. (0.315) n.s. (0.148) n.s. (0.079) n.s. (0.024)* n.s. (0.037)*

Page 4 of 9König et al. Allergy Asthma Clin Immunol (2016) 12:19
range 0–467 pg/ml; CRSsNP median 45 pg/ml, range
0–1000 pg/ml; p < 0.001) while the quantity of eotaxin in
nasal discharge showed no statistically significant differ-
ences among groups (Table 1).
Neutrophil associated factors such as IL-8 (Table 1)
partially showed a non-significant elevation in nasal
secretion from patients with chronic rhinosinusitis
either with or without nasal polyps. While in NP G-CSF
(Fig. 6) was increased threefold over the controls (NP
median 277 pg/ml, range 0–9802 pg/ml; controls: median
90 pg/ml, range 9–7962 pg/ml; CRSsNP: median 155 pg/
ml, range 0–8611 pg/ml; p < 0.01), levels of GM-CSF
(Table 1) were not different among groups.
Quantities of chemoattractant proteins were increased
in chronic rhinosinusitis. MCP-1 and MIP-1α were sig-
nificantly elevated in NP only (Table 1). Irrespective of the
existence of nasal polyps, levels of MIP-1β (Fig. 7) were
significantly increased in NP (median 251 pg/ml, range
12–2088 pg/ml; p < 0.001) as well as in CRSsNP (median
Controls NP CRSsNP
IL-1
3 (
pg
/ml)
0
10
20
30
40
**
***
**
Fig. 1 Levels of IL-13 in nasal fluid in controls, NP and CRSsNP: box
plots of the levels of IL-13 in nasal secretion is shown. IL-13 is signifi-
cantly decreased in NP compared to both CRSsNP and the controls.
Moreover, IL-13 is decreased in CRSsNP compared to the controls.
**p < 0.01, ***p < 0.001
Controls NP CRSsNP
IFN
-γ (
pg
/ml)
0
50
100
150
200
250
300
***
**
Controls NP CRSsNP
IL-1
2 (
pg
/ml)
0
100
200
300
400
******
b a
Fig. 2 Levels of IL-12 and IFN-γ in nasal fluid in controls, NP and CRSsNP: box plots of the levels of IL-12 (a dark grey) and IFN-γ (b light grey) in nasal
secretion are shown. IL-12 as well as IFN-γ are significantly decreased in NP compared to both CRSsNP and the controls. **p < 0.01, ***p < 0.001
Controls NP CRSsNP
IL-1
0 (
pg
/ml)
0
50
100
150
200
***
***
Fig. 3 Levels of IL-10 in nasal fluid in controls, NP and CRSsNP: box
plot of IL-10 levels in nasal secretion is shown. IL-10 is significantly
decreased in NP compared to the controls as well as to CRSsNP.
***p < 0.001

Page 5 of 9König et al. Allergy Asthma Clin Immunol (2016) 12:19
182 pg/ml, range 0–5296 pg/ml; p < 0.01) over controls
(median 103 pg/ml, range 0–2049 pg/ml). Concerning
RANTES, a statistically significant increase was found
only in CRSsNP compared to the controls, whereas levels
in NP did not differ from the other groups (Table 1).
Discussion#is study is part of an extensive project, aiming for dis-
tinct cytokine patterns in chronic nasal diseases. CRS
seems to be a heterogeneous group of diseases presenting
not only different phenotypes like CRS with or without
nasal polyps but also consisting of diverse endotypes.
New therapeutic approaches with biologic agents are cur-
rently in development [17]. #ese new approaches neces-
sitate patient selection by biomarkers. To determine this
reason, there is demand for tools helping to define endo-
types as well as to select suitable patients for therapies
with anti-cytokine antibodies. Bio-Plex Cytokine Assay in
nasal secretion could be such a tool as collection of nasal
discharge is an easy procedure harmless to the patient,
and the assay is simple to perform. #us, it constitutes a
methodological approach possibly applicable in clinical
routine. We therefore have already analysed cytokines
in nasal secretions of patients with allergic rhinitis in a
true-to-life clinical setting as a first step [18]. In the pre-
sent study, we measured the amount of cytokines in nasal
fluid of participants suffering from NP or CRSsNP as well
as healthy controls. #e aim of the current study was to
investigate whether in CRS with or without nasal polyps,
representative cytokines in nasal discharge show distinct
patterns proving the used methodology helpful for endo-
typing inflammatory nasal diseases. In the long term, we
aim for providing easily accessible biomarkers allocating
patients to specific endotypes and therapies.
IL-4, IL-5, and IL-13 are usually regarded as TH2
cytokines, being predominantly involved in the humoral
immune response. #ese cytokines are not only pro-
duced by TH2 lymphocytes but also by other cells
involved in this response pattern, such as plasma cells,
mast cells, and eosinophils [10, 19]. For IL-4, we did not
find any differences between the three groups, which is in
accordance with previous findings [20]. However, other
authors observed an elevation in nasal secretions in NP,
Controls NP CRSsNP
IL-1
7 (
pg
/ml)
0
10
20
30
40
50
******
Fig. 4 Levels of IL-17 in nasal fluid in controls, NP and CRSsNP:
box plot of IL-17 levels in nasal secretion is shown. IL-17 is signifi-
cantly increased in NP compared to both the controls and CRSsNP.
***p < 0.001
Controls NP CRSsNP
EC
P (
ng
/ml)
0
200
400
600
800
1000
***
Controls NP CRSsNP
Try
pta
se
(n
g/m
l)
0
50
100
150
200
***
a b
Fig. 5 Levels of tryptase and ECP in nasal fluid in controls, NP and CRSsNP: box plots of the levels of tryptase (a dark grey) and ECP (b light grey) in
nasal secretion are shown. Tryptase and ECP are significantly elevated in NP compared to controls. ***p < 0.001

Page 6 of 9König et al. Allergy Asthma Clin Immunol (2016) 12:19
and a correlation between IL-4 levels and the patients’
CT scores was described [21, 22]. IL-4, as well as IL-13,
supports the expression of a TH2 inflammatory pat-
tern by modulating lymphocyte differentiation, inducing
IgE production, and facilitating eosinophil infiltration
by the up-regulation of chemoattractants and adhesion
molecules [19, 23]. Moreover, in vitro studies revealed
a negative influence of IL-4 on the epithelial integrity in
NP [24]. We surprisingly found decreased levels of IL-13
in both CRS groups, contradicting previous reports of an
up-regulation of IL-13 mRNA in NP [22, 25]. Using the
same control group, we unexpectedly detected decreased
levels in allergic rhinitis patients in a previous study [18].
#is might imply a methodical error forming the basis of
the decreased amounts of IL-13. We are not able to offer
a suitable concept for this unexpected result. Concern-
ing IL-5, detected levels in CRSsNP and NP were not sig-
nificantly different from controls. However, the amount
of IL-5 in NP secretions was significantly higher than in
CRSsNP. Several authors found elevated levels of this
cytokine [25–27]. IL-5 is a hematopoietic growth factor
and crucial for the survival and maturation of eosinophils
at the site of inflammation [19, 23]. #erefore, it is dis-
cussed as a possible therapeutic target in NP and studies
with anti-IL-5 monoclonal antibodies show auspicious
results [28]. In conclusion, our results indicate a down-
regulation of TH2 lymphocytes in CRSsNP. Furthermore,
they rebut an expected up-regulation in NP and are
opposed to the general assumption that the majority of
Caucasian NP patients show a TH2 pattern of inflamma-
tion with elevations of TH2-type cytokines.
IL-12 and IFN-γ are indicators of TH1 lymphocyte
activity. Both cytokines were decreased in NP compared
to both the controls and CRSsNP, indicating a down-
regulation of TH1 cells in nasal polyposis. Others found
up-regulated or unchanged levels of IFN-γ and IL-12 in
NP and CRSsNP [27, 29]. However, these studies used
tissue samples instead of nasal secretions. Both IL-12 and
IFN-γ induce a predominantly cellular immune response,
involving cytotoxic cells and macrophages. #ey pro-
mote TH1 differentiation and counteract TH2 and TH17
development [30]. Moreover, they influence neutrophil
survival as well as epithelial integrity [24, 31]. In a study
on mice, IFN-γ expression was shown to be associated
with deteriorated olfactory function [32]. Accordingly,
this cytokine might be considered a therapeutic target for
treating the burdensome reduction of smell in patients
suffering from CRS.
IL-10 was used as a reference to the role of Treg in
CRS. A decrease was detected in NP which fits the find-
ings of Kim et al. who detected impaired migration of
regulatory T cells in NPs [33]. #is points to a derogated
immunomodulation in the mucosa of NPs. Furthermore,
the level of IL-17 was sevenfold higher in NP than in the
controls or CRSsNP. IL-17 is characteristic for TH17 lym-
phocytes and a proinflammatory cytokine affecting neu-
trophils and eosinophils [34, 35]. Data on IL-17 is still
ambiguous. While elevated levels have been described
in Chinese NP patients, studies on Caucasians reveal
conflicting results, ranging from elevated to reduced
amounts [12, 25, 36]. #us, further research on this
topic might be needed. In conjunction with the afore-
said results, we state that a relative ascendancy of TH2
Controls NP CRSsNP
G-C
SF
(pg/m
l)
0
1000
2000
3000
4000
**
Fig. 6 Levels of G-CSF in nasal fluid in controls, NP and CRSsNP: box
plot of G-CSF levels in nasal secretion. G-CSF is significantly elevated
in NP compared to controls. **p < 0.01
Controls NP CRSsNP
MIP
-1β
(pg/m
l)
0
500
1000
1500
*****
Fig. 7 Levels of MIP-1β in nasal fluid in controls, NP and CRSsNP: box
plot of MIP-1β levels in nasal secretion. MIP-1β is significantly elevated
in NP and CRSsNP compared to controls. **p < 0.01, ***p < 0.001

Page 7 of 9König et al. Allergy Asthma Clin Immunol (2016) 12:19
over TH1 as well as an up-regulation of TH17 was seen
in NP while an impaired function of Treg suggests itself
in this disease entity. CRSsNP, however, showed normal
quantities of all cytokines except for decreased levels
of the TH2 cytokine IL-13. Our results argue for a more
severe inflammation in NP, whereas the inflammation in
CRSsNP was only weakly depicted in nasal secretions.
Eosinophilic inflammation has frequently been described
in the nasal mucosa of patients suffering from NP. As men-
tioned, IL-5, a cytokine inducing survival and activation
of eosinophils was elevated in NP compared to CRSsNP.
Another major factor in eosinophilic inflammation is
eotaxin. It is up-regulated preferably by TH2 and potently
attracts eosinophils [10, 37, 38]. Elevated levels were found
in the sinunasal mucosa of CRS patients as well as in nasal
secretions of NP patients [27, 39]. In our study highest lev-
els were also seen in NP, however differences between the
three groups did not reach statistical significance. #e lev-
els of ECP, on the other hand, were significantly elevated in
NP but not in CRSsNP. ECP is a protein holding antimicro-
bial as well as modulatory properties [40]. Plenty of reports
of elevations of ECP levels in different nasal diseases exist,
indicating that ECP is rather a general marker of inflamma-
tion than disease-specific [14, 29, 41]. Our results suggest
an infiltration of eosinophils into the mucosa of nasal pol-
yps but not into the mucosa of CRSsNP. In allergic rhinitis,
mast cells have frequently been investigated, and much is
known about their role in the early-phase of allergic reac-
tion [42]. We detected elevated levels of tryptase in nasal
secretions of the NP patients. #is is in conformity with
findings from others describing an increased amount of
mast cells and tryptase in mucosal tissue and nasal secre-
tions of NP patients. Further, the level of tryptase in nasal
secretions correlated with nasal obstruction and rhinor-
rhoea [14, 43]. #is might suggest a benefit from mast cell
targeting medication in NP.
Di Lorenzo and colleagues reported that the levels of
tryptase and ECP in NP exceeded those in allergic rhini-
tis [44]. We compared the levels of these two mediators
in NP with the previously reported levels in allergic rhi-
nitis (AR) [18]. For ECP and tryptase, the levels in sea-
sonal AR were twice as high as in NP, while the values in
perineal AR were slightly lower than in NP. However, in
contrast to the findings of Di Lorenzo and co-workers,
in our study, the differences between the levels in NP
and AR did not reach statistically significance. Di Lor-
enzo et al. gained their samples by nasal lavage while we
used the cotton wool method. ECP release was found
to be higher in polyps than in the lower turbinate of NP
patients [45]. Probably, the amount of ECP and tryptase
would be higher under assured placement of the cotton
wool pieces on the polyp. #is might explain the differ-
ence to Di Lorenzo’s results.
Neutrophil infiltration has been seen in both CRSsNP
and NP [46]. In order to get indication of neutrophil
attraction, we measured the levels of IL-8 and detected
elevated amounts in both CRS groups but not reaching
a level of significance. Others report a more pronounced
increase of IL-8 in NP [47, 48].
#e colony-stimulating factors delay neutrophil death
[31]. While G-CSF influences proliferation and differen-
tiation of neutrophil progenitor cells as well as the func-
tion of mature neutrophils, GM-CSF often appears in
the context of recruitment, activation, and survival of
eosinophils [38, 49]. Concerning G-CSF, we found levels
threefold higher in NP than in controls. GM-CSF was in
a normal range in the nasal secretions in CRS, irrespec-
tive of nasal polyps, as opposed to elevations described
in tissue samples of NP patients [50]. In summary, we saw
no definite evidence of increased neutrophil attraction by
IL-8, but elevated levels of G-CSF in NP might indicate a
role of this type of granulocyte in polyposis.
In addition, different chemokines were examined.
RANTES was elevated in CRSsNP but not in NP, others
reported increased levels of RANTES in tissue samples of
polyps [50, 51]. RANTES is known to attract eosinophils,
basophils and mast cells, and is present in nasal secre-
tions during ongoing infection [38, 52, 53]. Plasma lev-
els of RANTES have been found to correlate with disease
severity [54]. In contrast to RANTES, we found MCP-1
to be elevated in NP. MCP-1 attracts different inflamma-
tory cells, among them monocytes and T cells. In CRS,
increased amounts of MCP-1 have been reported in nasal
secretions as well as in nasal mucosa biopsies [29, 55].
Two other chemokines, MIP-1α and MIP-1β, are struc-
turally related proteins, with 68 % of their amino acids
being identical [56]. Produced by a host of inflammatory
cells, they both have a number of cellular targets, such
as monocytes and dendritic cells. However, only MIP-1α
is ascribed to attract granulocytes [56, 57]. In our study,
increased amounts of MIP-1α were detected in poly-
posis patients while being undetectable in the majority
of the CRSsNP patients and controls. MIP-1β, on the
other hand, showed elevated levels in both CRSsNP and
NP. Peric and co-workers found a correlation between
MIP-1α levels in nasal secretions and endoscopic and
CT scores in NP [57]. Moreover, MIP-1α gene expression
was elevated in patients with early recurrence of polyps
after surgery over those being treatment-responsive [50].
Further research is needed to evaluate the diagnostic and
prognostic utility of this chemokine in CRS.
In conclusion, the evaluation of the chemokines and
growth factors in the present study revealed an eleva-
tion of G-CSF, MCP-1, MIP-1α, and MIP-1β in NP,
while CRSsNP shows increased levels of RANTES and
MIP-1β only. We conclude that a number of different

Page 8 of 9König et al. Allergy Asthma Clin Immunol (2016) 12:19
inflammatory cells are involved in NP and inflammation
is more pronounced in NP than in CRSsNP.
ConclusionsColleagues from Belgium recently emphasised in their
review “Emerging biologics for the treatment of chronic
sinusitis”: “#e greatest challenge for the future is to
define the different endotypes of CRSwNP using eas-
ily accessible biomarkers to select the patients who have
the best chance of a positive therapeutic response to
innovative approaches.” [58]. With the present study, we
tried to take a closer look exactly on this topic evaluating
cytokine profiles in participants suffering from CRS with
or without nasal polyps.
Overall, we found a more pronounced inflammatory
profile in NP than in CRSsNP. IL-5, IL-10, IL-12, IL-17,
and IFN-γ represent a disequilibrium of T cells in NP,
and ECP, tryptase, G-CSF, MCP-1, MIP-1α, and MIP-1β
depict the activation of various inflammatory cells in this
disease entity. CRSsNP participants, on the other hand,
did not differ much from healthy individuals. Merely
RANTES and MIP-1β seem to be suitable mediators to
distinguish between CRSsNP and healthy individuals.
As we did not detect any significant differences between
the three groups for IL-4, IL-8, GM-CSF, and eotaxin, we
conclude that these mediators are not of distinctive func-
tion in chronic rhinosinusitis.
In the long term, we aim to evaluate multiplex-analyses
of cytokines in nasal discharge being a suitable diagnostic
tool for the “endotyping” of patients with chronic sinona-
sal diseases. To us, this is a crucial step for selection of
patients with regard to a therapy with biologic agents,
especially anti-cytokine antibodies. #e sampling of nasal
secretions is an easily performable and non-invasive
method and could benefit many patients if established
as a diagnostic and prognostic tool. However, further
research regarding suitable indicators of different nasal
diseases and the establishment of norm values is needed
to attain this goal. #us, therapies tailored to the indi-
vidual patient’s needs should become accessible in the
future.
Authors’ contributions
SB, MK and MG contributed to the study design, and to interpretation and
analysis of the data. MG additionally coordinated the study and helped
to draft the manuscript. KK performed the Pharmacia CAP System ECP/
Tryptase FEIA as well as the Bio-Rad Cytokine Multi-Plex assays and drafted
the manuscript. CK participated in the Bio-Rad Cytokine Multi-Plex assays and
contributed—together with MH and MSN—to the sample collection and data
acquisition. All authors read and approved the final manuscript.
Author details1 Department of Otorhinolaryngology, Head and Neck Surgery, University
Medical Center Großhadern of the Ludwig-Maximilians-University Munich,
Marchioninistr. 15, 81377 Munich, Germany. 2 Department of Otorhinolaryn-
gology, Head and Neck Surgery, University Medical Center of the Johannes
Gutenberg University Mainz, Langenbeckstr. 1, 55101 Mainz, Germany.
Acknowledgements
We thank Bio-Rad Laboratories, Hercules, California, USA, for providing the
Multi-Plex assays. Further, we would like to express our thanks to Mrs. Elisabeth
Pfrogner and Mrs. Gabriele Bärr for skilful technical assistance.
Competing interests
The authors declare that they have no competing interests.
Received: 13 October 2015 Accepted: 23 March 2016
References
1. Hastan D, Fokkens WJ, Bachert C, Newson RB, Bislimovska J, Bockelbrink
A, et al. Chronic rhinosinusitis in Europe–an underestimated disease. A
GA2LEN study. Allergy. 2011;66(9):1216–23.
2. Chen Y, Dales R, Lin M. The epidemiology of chronic rhinosinusitis in
Canadians. Laryngoscope. 2003;113(7):1199–205.
3. Baumann I, Blumenstock G, Praetorius M, Sittel C, Piccirillo JF, Plinkert PK.
Patients with chronic rhinosinusitis: disease-specific and general health-
related quality of life. HNO. 2006;54(7):544–9.
4. Macdonald KI, McNally JD, Massoud E. The health and resource
utilization of Canadians with chronic rhinosinusitis. Laryngoscope.
2009;119(1):184–9.
5. Fokkens WJ, Lund VJ, Mullol J, Bachert C, Alobid I, Baroody F, et al.
European position paper on rhinosinusitis and nasal polyps 2012. Rhinol
Suppl. 2012;23:1–298 (3 p preceding table of contents).
6. Van Crombruggen K, Zhang N, Gevaert P, Tomassen P, Bachert C. Patho-
genesis of chronic rhinosinusitis: inflammation. J Allergy Clin Immunol.
2011;128(4):728–32.
7. Tan BK, Schleimer RP, Kern RC. Perspectives on the etiology of chronic
rhinosinusitis. Curr Opin Otolaryngol Head Neck Surg. 2010;18(1):21–6.
8. Bernstein JM, Kansal R. Superantigen hypothesis for the early develop-
ment of chronic hyperplastic sinusitis with massive nasal polyposis. Curr
Opin Otolaryngol Head Neck Surg. 2005;13(1):39–44.
9. Hamilos DL. Chronic rhinosinusitis: epidemiology and medical manage-
ment. J Allergy Clin Immunol. 2011;128(4):693–707.
10. Meltzer EO, Hamilos DL, Hadley JA, Lanza DC, Marple BF, Nicklas RA, et al.
Rhinosinusitis: establishing definitions for clinical research and patient
care. J Allergy Clin Immunol. 2004;114(6 Suppl):155–212.
11. Bachert C, Zhang N, van Zele T, Gevaert P. Chronic rhinosinusitis: from one
disease to different phenotypes. Pediatr Allergy Immunol. 2012;23(Suppl
22):2–4.
12. Zhang N, Van Zele T, Perez-Novo C, Van Bruaene N, Holtappels G, DeRuyck
N, et al. Different types of T-effector cells orchestrate mucosal inflamma-
tion in chronic sinus disease. J Allergy Clin Immunol. 2008;122(5):961–8.
13. Rasp G, Thomas PA, Bujia J. Eosinophil inflammation of the nasal
mucosa in allergic and non-allergic rhinitis measured by eosinophil
cationic protein levels in native nasal fluid and serum. Clin Exp Allergy.
1994;24(12):1151–6.
14. Kramer MF, Burow G, Pfrogner E, Rasp G. In vitro diagnosis of chronic
nasal inflammation. Clin Exp Allergy. 2004;34(7):1086–92.
15. Vignali DA. Multiplexed particle-based flow cytometric assays. J Immunol
Methods. 2000;243(1–2):243–55.
16. Benjamini Y, Yekutieli D. The Control of the false discovery rate in multiple
testing under dependency. Ann Stat. 2001;29(4):1165–88.
17. Bachert C, Zhang L, Gevaert P. Current and future treatment options
for adult chronic rhinosinusitis: focus on nasal polyposis. J Allergy Clin
Immunol. 2015;136(6):1431–40.
18. Konig K, Klemens C, Eder K, San Nicolo M, Becker S, Kramer MF, et al.
Cytokine profiles in nasal fluid of patients with seasonal or persistent
allergic rhinitis. Allergy Asthma Clin Immunol. 2015;11(1):26.
19. Otto BA, Wenzel SE. The role of cytokines in chronic rhinosinusitis with
nasal polyps. Curr Opin Otolaryngol Head Neck Surg. 2008;16(3):270–4.
20. Sharma S, Watanabe S, Sivam A, Wang J, Neuwirth SJ, Perez RI, et al.
Peripheral blood and tissue T regulatory cells in chronic rhinosinusitis. Am
J Rhinol Allergy. 2012;26(5):371–9.
21. Peric A, Vojvodic D, Peric AV, Radulovic V, Miljanovic O. Correlation
between cytokine levels in nasal fluid and scored clinical parameters

Page 9 of 9König et al. Allergy Asthma Clin Immunol (2016) 12:19
• We accept pre-submission inquiries
• Our selector tool helps you to find the most relevant journal
• We provide round the clock customer support
• Convenient online submission
• Thorough peer review
• Inclusion in PubMed and all major indexing services
• Maximum visibility for your research
Submit your manuscript atwww.biomedcentral.com/submit
Submit your next manuscript to BioMed Central and we will help you at every step:
in patients with nasal polyposis. Indian J Otolaryngol Head Neck Surg.
2013;65(Suppl 2):295–300.
22. Park SJ, Kim TH, Jun YJ, Lee SH, Ryu HY, Jung KJ, et al. Chronic rhinosinusi-
tis with polyps and without polyps is associated with increased expres-
sion of suppressors of cytokine signaling 1 and 3. J Allergy Clin Immunol.
2013;131(3):772–80.
23. Daines SM, Orlandi RR. Inflammatory cytokines in allergy and rhinosinusi-
tis. Curr Opin Otolaryngol Head Neck Surg. 2010;18(3):187–90.
24. Soyka MB, Wawrzyniak P, Eiwegger T, Holzmann D, Treis A, Wanke K,
et al. Defective epithelial barrier in chronic rhinosinusitis: the regula-
tion of tight junctions by IFN-gamma and IL-4. J Allergy Clin Immunol.
2012;130(5):1087–96.
25. Van Bruaene N, Perez-Novo CA, Basinski TM, Van Zele T, Holtappels G,
De Ruyck N, et al. T-cell regulation in chronic paranasal sinus disease. J
Allergy Clin Immunol. 2008;121(6):1435–41 (1441 e1–3).
26. Kramer MF, Ostertag P, Pfrogner E, Rasp G. Nasal interleukin-5, immuno-
globulin E, eosinophilic cationic protein, and soluble intercellular adhe-
sion molecule-1 in chronic sinusitis, allergic rhinitis, and nasal polyposis.
Laryngoscope. 2000;110(6):1056–62.
27. Van Zele T, Claeys S, Gevaert P, Van Maele G, Holtappels G, Van Cauwen-
berge P, et al. Differentiation of chronic sinus diseases by measurement of
inflammatory mediators. Allergy. 2006;61(11):1280–9.
28. Gevaert P, Van Bruaene N, Cattaert T, Van Steen K, Van Zele T, Acke F, et al.
Mepolizumab, a humanized anti-IL-5 mAb, as a treatment option for
severe nasal polyposis. J Allergy Clin Immunol. 2011;128(5):989–95.
29. Riechelmann H, Deutschle T, Rozsasi A, Keck T, Polzehl D, Burner H. Nasal
biomarker profiles in acute and chronic rhinosinusitis. Clin Exp Allergy.
2005;35(9):1186–91.
30. Billiau A, Matthys P. Interferon-gamma: a historical perspective. Cytokine
Growth Factor Rev. 2009;20(2):97–113.
31. Luo HR, Loison F. Constitutive neutrophil apoptosis: mechanisms and
regulation. Am J Hematol. 2008;83(4):288–95.
32. Pozharskaya T, Lane AP. Interferon gamma causes olfactory dysfunction
without concomitant neuroepithelial damage. Int Forum Allergy Rhinol.
2013;3(11):861–5.
33. Kim YM, Munoz A, Hwang PH, Nadeau KC. Migration of regulatory T cells
toward airway epithelial cells is impaired in chronic rhinosinusitis with
nasal polyposis. Clin Immunol. 2010;137(1):111–21.
34. Derycke L, Zhang N, Holtappels G, Dutre T, Bachert C. IL-17A as a regula-
tor of neutrophil survival in nasal polyp disease of patients with and
without cystic fibrosis. J Cyst Fibros. 2012;11(3):193–200.
35. Saitoh T, Kusunoki T, Yao T, Kawano K, Kojima Y, Miyahara K, et al. Role of
interleukin-17A in the eosinophil accumulation and mucosal remodeling
in chronic rhinosinusitis with nasal polyps associated with asthma. Int
Arch Allergy Immunol. 2010;151(1):8–16.
36. Oyer SL, Mulligan JK, Psaltis AJ, Henriquez OA, Schlosser RJ. Cytokine
correlation between sinus tissue and nasal secretions among chronic
rhinosinusitis and controls. Laryngoscope. 2013;123(12):E72–8.
37. Lukacs NW. Migration of helper T-lymphocyte subsets into inflamed tis-
sues. J Allergy Clin Immunol. 2000;106(5 Suppl):S264–9.
38. Pawankar R. Nasal polyposis: an update: editorial review. Curr Opin
Allergy Clin Immunol. 2003;3(1):1–6.
39. Cho DY, Nayak JV, Bravo DT, Le W, Nguyen A, Edward JA, et al. Expression
of dual oxidases and secreted cytokines in chronic rhinosinusitis. Int
Forum Allergy Rhinol. 2013;3(5):376–83.
40. de Oliveira PC, de Lima PO, Oliveira DT, Pereira MC. Eosinophil cationic
protein: overview of biological and genetic features. DNA Cell Biol.
2012;31(9):1442–6.
41. Bachert C, van Kempen M, Van Cauwenberge P. Regulation of proinflam-
matory cytokines in seasonal allergic rhinitis. Int Arch Allergy Immunol.
1999;118(2–4):375–9.
42. Gelfand EW. Inflammatory mediators in allergic rhinitis. J Allergy Clin
Immunol. 2004;114(5 Suppl):S135–8.
43. Takabayashi T, Kato A, Peters AT, Suh LA, Carter R, Norton J, et al. Glandular
mast cells with distinct phenotype are highly elevated in chronic rhinosi-
nusitis with nasal polyps. J Allergy Clin Immunol. 2012;130(2):410–20.
44. Di Lorenzo G, Drago A, Esposito Pellitteri M, Candore G, Colombo A, Ger-
vasi F, et al. Measurement of inflammatory mediators of mast cells and
eosinophils in native nasal lavage fluid in nasal polyposis. Int Arch Allergy
Immunol. 2001;125(2):164–75.
45. Behnecke A, Mayr S, Schick B, Iro H, Raithel M. Evaluation of ECP release
from intact tissue biopsies from patients with nasal polyps. Inflamm Res.
2008;57(Suppl 1):S65–6.
46. Rudack C, Sachse F, Alberty J. Chronic rhinosinusitis–need for further clas-
sification? Inflamm Res. 2004;53(3):111–7.
47. Kostamo K, Sorsa T, Leino M, Tervahartiala T, Alenius H, Richardson M,
et al. In vivo relationship between collagenase-2 and interleukin-8 but
not tumour necrosis factor-alpha in chronic rhinosinusitis with nasal
polyposis. Allergy. 2005;60(10):1275–9.
48. Ural A, Tezer M, Yucel A, Atilla H, Ileri F. Interleukin-4, interleukin-8 and
E-selectin levels in intranasal polyposis patients with and without allergy:
a comparative study. J Int Med Res. 2006;34(5):520–4.
49. Pessach I, Shimoni A, Nagler A. Granulocyte-colony stimulating factor
for hematopoietic stem cell donation from healthy female donors dur-
ing pregnancy and lactation: what do we know? Hum Reprod Update.
2013;19(3):259–67.
50. Lane AP, Truong-Tran QA, Schleimer RP. Altered expression of genes
associated with innate immunity and inflammation in recalcitrant rhinosi-
nusitis with polyps. Am J Rhinol. 2006;20(2):138–44.
51. Cavallari FE, Valera FC, Gallego AJ, Malinsky RR, Kupper DS, Milanezi
C, et al. Expression of RANTES, eotaxin-2, ICAM-1, LFA-1 and CCR-3
in chronic rhinosinusitis patients with nasal polyposis. Acta Cir Bras.
2012;27(9):645–9.
52. Kaplan AP. Chemokines, chemokine receptors and allergy. Int Arch
Allergy Immunol. 2001;124(4):423–31.
53. Das S, Palmer OP, Leight WD, Surowitz JB, Pickles RJ, Randell SH, et al.
Cytokine amplification by respiratory syncytial virus infection in human
nasal epithelial cells. Laryngoscope. 2005;115(5):764–8.
54. Chao PZ, Chou CM, Chen CH. Plasma RANTES and eotaxin levels are cor-
related with the severity of chronic rhinosinusitis. Eur Arch Otorhinolaryn-
gol. 2012;269(11):2343–8.
55. Ayers CM, Schlosser RJ, O’Connell BP, Atkinson C, Mulligan RM, Casey SE,
et al. Increased presence of dendritic cells and dendritic cell chemokines
in the sinus mucosa of chronic rhinosinusitis with nasal polyps and
allergic fungal rhinosinusitis. Int Forum Allergy Rhinol. 2011;1(4):296–302.
56. Menten P, Wuyts A, Van Damme J. Macrophage inflammatory protein-1.
Cytokine Growth Factor Rev. 2002;13(6):455–81.
57. Peric A, Baletic N, Sotirovic J, Spadijer-Mirkovic C. Macrophage inflam-
matory protein-1 production and eosinophil infiltration in chronic
rhinosinusitis with nasal polyps. Ann Otology Rhinol Laryngol.
2014;124(4):266–72.
58. Pauwels B, Jonstam K, Bachert C. Emerging biologics for the treatment of
chronic rhinosinusitis. Expert Rev Clin Immunol. 2015;11(3):349–61.
B Eidesstattliche Versicherung
König, Katrin Elisabeth
Ich erkläre hiermit an Eides statt, dass ich die vorliegende Dissertation mit dem Thema
Cytokine Profiles in Nasal Secretions of Patients with Allergic Rhinitis and Chronic
Rhinosinusitis
selbständig verfasst, mich außer der angegebenen keiner weiteren Hilfsmittel bedient und
alle Erkenntnisse, die aus dem Schrifttum ganz oder annähernd übernommen sind, als
solche kenntlich gemacht und nach ihrer Herkunft unter Bezeichnung der Fundstelle
einzeln nachgewiesen habe. Ich erkläre des Weiteren, dass die hier vorgelegte Dissertation
nicht in gleicher oder in ähnlicher Form bei einer anderen Stelle zur Erlangung eines
akademischen Grades eingereicht wurde.
München, den 29.10.2017 Katrin Elisabeth König


![Untitled-1 [dashandel.cz]CARE.compressed.pdfThe nasal aspirator ensures quick and easy removal of the accumulated secretions from the little nose. This is a good solution both for](https://static.fdocuments.net/doc/165x107/5f6be1c6db64935a246c69ab/untitled-1-carecompressedpdf-the-nasal-aspirator-ensures-quick-and-easy-removal.jpg)
