Cytochrome P450 enzymes affected by artemisinin …Cytochrome P450 enzymes affected by artemisinin...
63
Cytochrome P450 enzymes affected by artemisinin antimalarials – pharmacokinetic and pharmacogenetic aspects Sara Asimus 2008 Department of Pharmacology Institute of Neuroscience and Physiology The Sahlgrenska Academy at University of Gothenburg Sweden
Transcript of Cytochrome P450 enzymes affected by artemisinin …Cytochrome P450 enzymes affected by artemisinin...
Cytochrome P450 enzymes affected by artemisinin antimalarials
– pharmacokinetic and pharmacogenetic aspects
Sara Asimus 2008
Department of Pharmacology
Institute of Neuroscience and Physiology The Sahlgrenska Academy at University of Gothenburg
Sweden

Printed by Intellecta Docusys, Västra Frölunda 2008 © Sara Asimus 2008
ISBN 978-91-628-7595-4
Cytochrome P450 enzymes affected by artemisinin antimalarials – pharmacokinetic and pharmacogenetic aspects
Sara Asimus
Department of Pharmacology, Institute of Neuroscience and Physiology,
The Sahlgrenska Academy at University of Gothenburg, Göteborg, Sweden
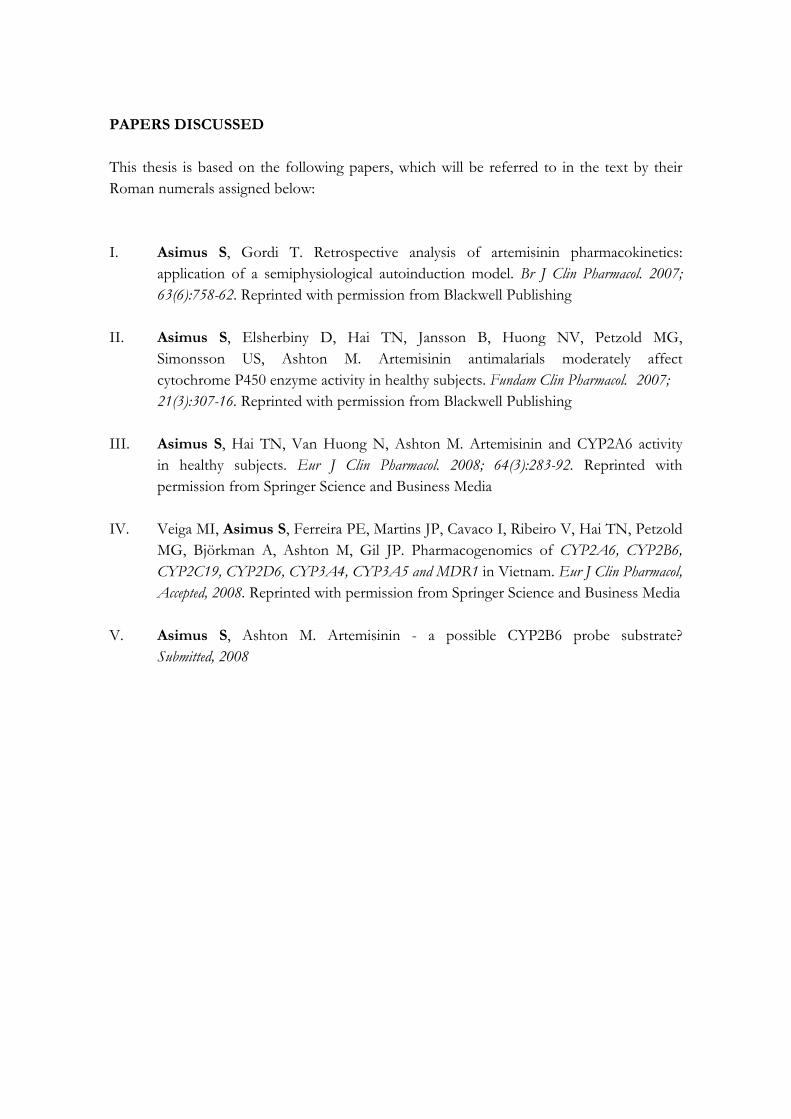
ABSTRACT
With more than 500 million cases and at least 1 million deaths each year, malaria is a major global health problem. The main problem with malaria control is the emerging drug resistance among parasites causing the infection. Consequently, there is an urgent need for new drugs. The artemisinin endoperoxide antimalarials are highly effective, well tolerated and have become the most important class of drugs in the treatment of malaria. The parent compound, artemisinin, exhibits remarkable time-dependent pharmacokinetics, resulting from a pronounced capacity for auto-induction. Artemisinin has also been shown to influence the cytochrome P450 (CYP) mediated metabolism of other drugs, increasing the risk of drug–drug interactions. The artemisinin antimalarials are recommended to be used in combination treatment. It is therefore crucial to elucidate which principal CYP enzymes are affected by these drugs. Using the cocktail approach it was demonstrated that several principal CYP enzymes were affected by the antimalarials artemisinin, dihydroartemisinin, artemether, arteether and artesunate in healthy volunteers. Metabolic changes were moderate but in several cases shared by all five endoperoxides studied, suggesting a class effect. At therapeutic doses artemisinin appeared to be associated with the strongest capacity for enzyme induction and inhibition. The time-dependent metabolism of artemisinin was described in both healthy volunteers and malaria patients by a previously developed pharmacokinetic auto-induction model. Further results indicate artemisinin to induce the activity of CYP2A6 in healthy subjects, but to which extent could not be demonstrated. Problems with studying induction of CYP2A6 using available probe compounds were highlighted. Pharmacogenetic data of genes coding for principal CYP enzymes involved in antimalarial treatment obtained in healthy Vietnamese volunteers, were in general agreement with reports from other Asian populations. Artemisinin is suggested to be an alternative marker to assess the activity of CYP2B6. Further studies are needed to investigate the metabolic fate of artemisinin, and evaluate its potential use as an in vitro and in vivo CYP2B6 probe. In conclusion, this thesis has contributed with pharmacokinetic and metabolic information on the artemisinin antimalarials, useful in the development of new derivatives and combination treatments. The potential of these drugs to affect CYP enzymes has to be considered in order to reduce the risk of drug-drug interactions and achieve optimal treatments of malaria. Keywords: artemisinin, autoinduction, cytochrome P450, induction, inhibition, malaria, metabolism, pharmacogenetics, pharmacokinetics, probe
PAPERS DISCUSSED This thesis is based on the following papers, which will be referred to in the text by their Roman numerals assigned below: I. Asimus S, Gordi T. Retrospective analysis of artemisinin pharmacokinetics: application of a semiphysiological autoinduction model. Br J Clin Pharmacol. 2007; 63(6):758-62. Reprinted with permission from Blackwell Publishing II. Asimus S, Elsherbiny D, Hai TN, Jansson B, Huong NV, Petzold MG, Simonsson US, Ashton M. Artemisinin antimalarials moderately affect cytochrome P450 enzyme activity in healthy subjects. Fundam Clin Pharmacol. 2007; 21(3):307-16. Reprinted with permission from Blackwell Publishing III. Asimus S, Hai TN, Van Huong N, Ashton M. Artemisinin and CYP2A6 activity in healthy subjects. Eur J Clin Pharmacol. 2008; 64(3):283-92. Reprinted with permission from Springer Science and Business Media IV. Veiga MI, Asimus S, Ferreira PE, Martins JP, Cavaco I, Ribeiro V, Hai TN, Petzold MG, Björkman A, Ashton M, Gil JP. Pharmacogenomics of CYP2A6, CYP2B6, CYP2C19, CYP2D6, CYP3A4, CYP3A5 and MDR1 in Vietnam. Eur J Clin Pharmacol, Accepted, 2008. Reprinted with permission from Springer Science and Business Media V. Asimus S, Ashton M. Artemisinin - a possible CYP2B6 probe substrate? Submitted, 2008

TILL PER

TABLE OF CONTENTS
LIST OF ABBREVIATIONS ....................................................................................... 9
INTRODUCTION ...................................................................................................... 11 THE ARTEMISININ ANTIMALARIALS ...........................................................................................................11
Background ............................................................................................................................................11 Pharmacokinetics and drug metabolism .........................................................................................................12 Artemisinin-based combination treatment (ACT) ...........................................................................................13
DRUG METABOLISM..................................................................................................................................15 Human cytochrome P450 enzymes...............................................................................................................15 In vitro metabolism of drugs........................................................................................................................17 Induction of CYP enzymes .........................................................................................................................17 Inhibition of CYP enzymes ........................................................................................................................18 Induction and inhibition of phase II enzymes..................................................................................................19 Probe substrates and metrics for assessment of enzyme activities ..........................................................................19 Genetic variation in drug metabolism ............................................................................................................21
AIMS OF THE THESIS .............................................................................................24
MATERIALS AND METHODS.................................................................................25 EXPERIMENTAL PROCEDURES ...................................................................................................................25
Ethics ....................................................................................................................................................25 Subjects ..................................................................................................................................................25 Study design ............................................................................................................................................25 Microsomal incubations .............................................................................................................................27
ANALYTICAL METHODS.............................................................................................................................28 Cocktail probe drugs (paper II) ...................................................................................................................28 Artemisinin and CYP2A6 probe drugs (paper III) ........................................................................................28 CYP2B6 substrates (paper V) ...................................................................................................................29
DATA ANALYSIS ........................................................................................................................................29 Pharmacokinetic modeling (paper I) .............................................................................................................29 Non-compartmental data analysis and statistics (papers II and III) ....................................................................31 Genotyping (paper IV)..............................................................................................................................32 Non-linear regression analysis (paper V).......................................................................................................32
RESULTS AND DISCUSSION ..................................................................................33 ASSESSMENT OF ARTEMISININ PHARMACOKINETICS BY THE APPLICATION OF A SEMIPHYSIOLOGICAL
AUTOINDUCTION MODEL (PAPER I)...........................................................................................................33 THE EFFECT OF ARTEMISININ ANTIMALARIALS ON PRINCIPAL CYP ENZYMES (PAPERS II AND III) ........... 34
PHARMACOGENETICS OF PRINCIPAL CYP ENZYMES IN HEALTHY VIETNAMESE VOLUNTEERS (PAPER IV) 41 ARTEMISININ AS A PUTATIVE CYP2B6 PROBE (PAPER V) ..........................................................................45
CONCLUSIONS..........................................................................................................47
SWEDISH SUMMARY................................................................................................49
ACKNOWLEDGEMENTS.........................................................................................51
REFERENCES............................................................................................................53

LIST OF ABBREVIATIONS
ACT artemisinin-based combination treatment Aem(∞) metabolite urinary recovery AhR aryl hydrocarbon receptor AUC area under the plasma concentration-time curve AUCpo AUC after oral administration AUCt AUC from time of dose until the last measurable time point AUCt-∞ AUC extrapolated from the last measurable data point to infinity AUC0-∞ total AUC CAR constitutive androgen receptor CL clearance CLint,0 intrinsic clearance in the pre-induced state CLuint,m partial intrinsic clearance CLR renal clearance CI confidence interval CV coefficient of variation CYP cytochrome P450 EMs extensive metabolizers DHA dihydroartemisinin FO first order method GR glucocorticoid receptor fu ratio of unbound and total drug concentration in plasma HPLC high performance liquid chromatography IIV interindividual variability IMs intermediate metabolizers IOV interoccasional variability Km Michaelis-Menten constant ka first order absorption rate constant kd first order rate constant for disappearance of parent drug kf first order metabolite formation rate constant LC/MS/MS liquid chromatography/tandem mass spectrometry LLOQ lower limit of quantification MDR multi drug resistance MIT mean induction time NADPH nicotinamide adenine dinucleotide phosphate NAT2 N-acetyltransferase 2 OFV objective function value PCR polymerase chain reaction PMs poor metabolizers
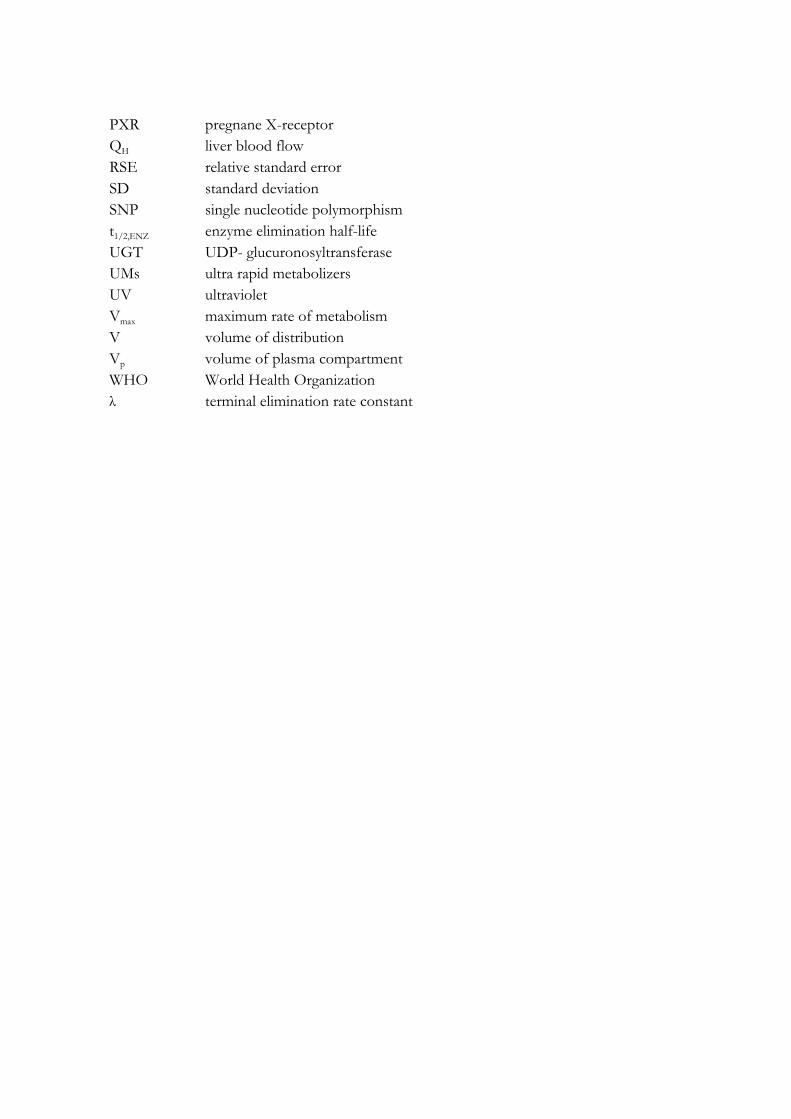
PXR pregnane X-receptor QH liver blood flow RSE relative standard error SD standard deviation SNP single nucleotide polymorphism t1/2,ENZ enzyme elimination half-life UGT UDP- glucuronosyltransferase UMs ultra rapid metabolizers UV ultraviolet Vmax maximum rate of metabolism V volume of distribution Vp volume of plasma compartment WHO World Health Organization λ terminal elimination rate constant
Cytochrome P450 enzymes affected by artemisinin antimalarials
INTRODUCTION
The artemisinin antimalarials
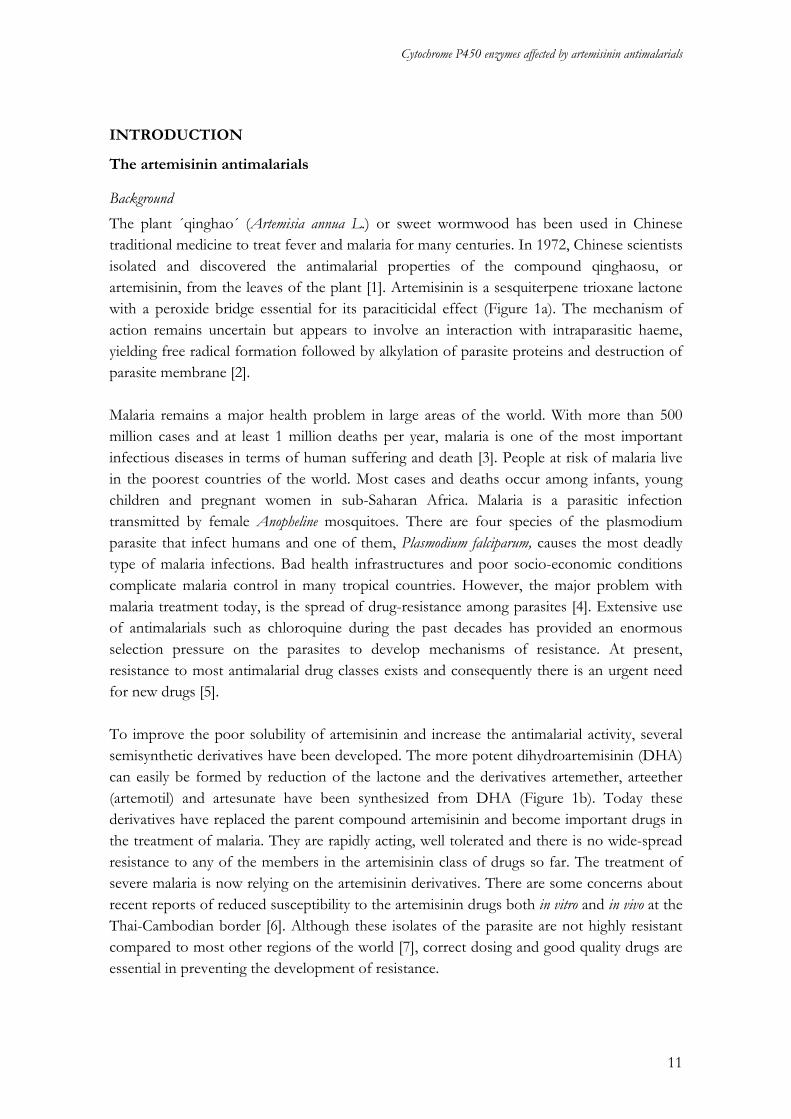
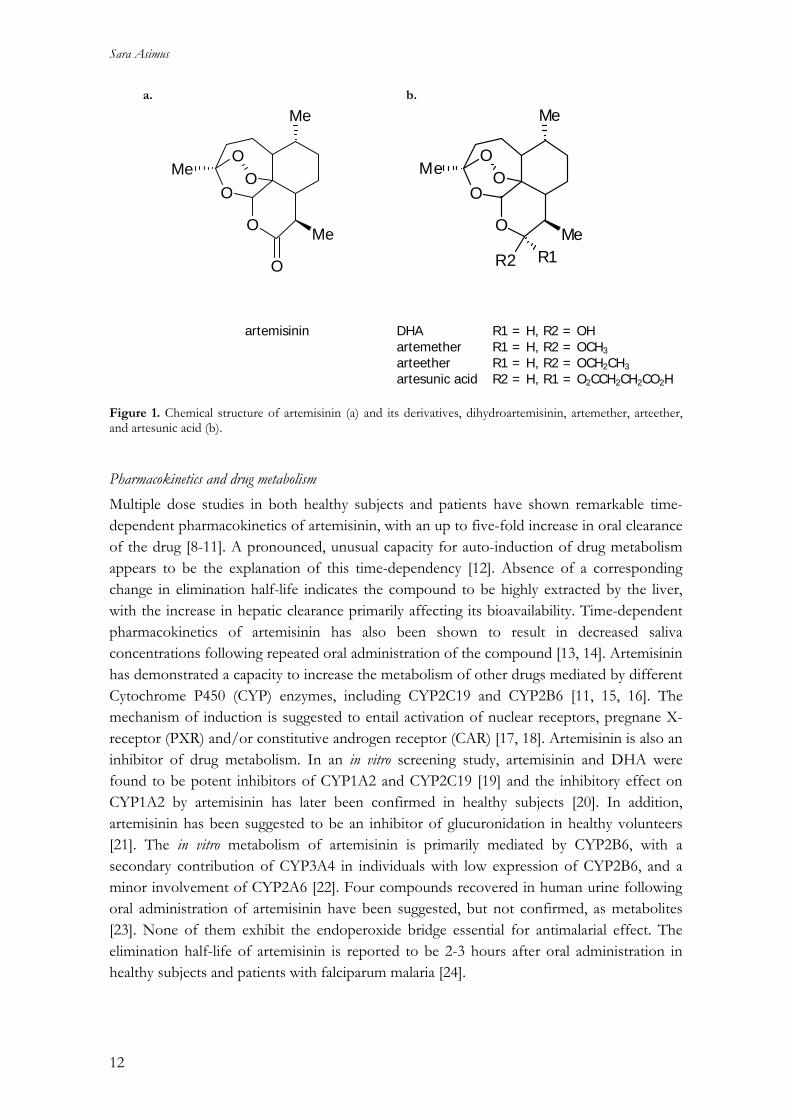
Background The plant ´qinghao´ (Artemisia annua L.) or sweet wormwood has been used in Chinese traditional medicine to treat fever and malaria for many centuries. In 1972, Chinese scientists isolated and discovered the antimalarial properties of the compound qinghaosu, or artemisinin, from the leaves of the plant [1]. Artemisinin is a sesquiterpene trioxane lactone with a peroxide bridge essential for its paraciticidal effect (Figure 1a). The mechanism of action remains uncertain but appears to involve an interaction with intraparasitic haeme, yielding free radical formation followed by alkylation of parasite proteins and destruction of parasite membrane [2]. Malaria remains a major health problem in large areas of the world. With more than 500 million cases and at least 1 million deaths per year, malaria is one of the most important infectious diseases in terms of human suffering and death [3]. People at risk of malaria live in the poorest countries of the world. Most cases and deaths occur among infants, young children and pregnant women in sub-Saharan Africa. Malaria is a parasitic infection transmitted by female Anopheline mosquitoes. There are four species of the plasmodium parasite that infect humans and one of them, Plasmodium falciparum, causes the most deadly type of malaria infections. Bad health infrastructures and poor socio-economic conditions complicate malaria control in many tropical countries. However, the major problem with malaria treatment today, is the spread of drug-resistance among parasites [4]. Extensive use of antimalarials such as chloroquine during the past decades has provided an enormous selection pressure on the parasites to develop mechanisms of resistance. At present, resistance to most antimalarial drug classes exists and consequently there is an urgent need for new drugs [5]. To improve the poor solubility of artemisinin and increase the antimalarial activity, several semisynthetic derivatives have been developed. The more potent dihydroartemisinin (DHA) can easily be formed by reduction of the lactone and the derivatives artemether, arteether (artemotil) and artesunate have been synthesized from DHA (Figure 1b). Today these derivatives have replaced the parent compound artemisinin and become important drugs in the treatment of malaria. They are rapidly acting, well tolerated and there is no wide-spread resistance to any of the members in the artemisinin class of drugs so far. The treatment of severe malaria is now relying on the artemisinin derivatives. There are some concerns about recent reports of reduced susceptibility to the artemisinin drugs both in vitro and in vivo at the Thai-Cambodian border [6]. Although these isolates of the parasite are not highly resistant compared to most other regions of the world [7], correct dosing and good quality drugs are essential in preventing the development of resistance.
11
Sara Asimus
O
O
Me
Me
R1Me
R2
OO
artemisinin DHA R1 = H, R2 = OH artemether R1 = H, R2 = OCH3 arteether R1 = H, R2 = OCH2CH3 artesunic acid R2 = H, R1 = O2CCH2CH2CO2H Figure 1. Chemical structure of artemisinin (a) and its derivatives, dihydroartemisinin, artemether, arteether, and artesunic acid (b).
Pharmacokinetics and drug metabolism Multiple dose studies in both healthy subjects and patients have shown remarkable time-dependent pharmacokinetics of artemisinin, with an up to five-fold increase in oral clearance of the drug [8-11]. A pronounced, unusual capacity for auto-induction of drug metabolism appears to be the explanation of this time-dependency [12]. Absence of a corresponding change in elimination half-life indicates the compound to be highly extracted by the liver, with the increase in hepatic clearance primarily affecting its bioavailability. Time-dependent pharmacokinetics of artemisinin has also been shown to result in decreased saliva concentrations following repeated oral administration of the compound [13, 14]. Artemisinin has demonstrated a capacity to increase the metabolism of other drugs mediated by different Cytochrome P450 (CYP) enzymes, including CYP2C19 and CYP2B6 [11, 15, 16]. The mechanism of induction is suggested to entail activation of nuclear receptors, pregnane X-receptor (PXR) and/or constitutive androgen receptor (CAR) [17, 18]. Artemisinin is also an inhibitor of drug metabolism. In an in vitro screening study, artemisinin and DHA were found to be potent inhibitors of CYP1A2 and CYP2C19 [19] and the inhibitory effect on CYP1A2 by artemisinin has later been confirmed in healthy subjects [20]. In addition, artemisinin has been suggested to be an inhibitor of glucuronidation in healthy volunteers [21]. The in vitro metabolism of artemisinin is primarily mediated by CYP2B6, with a secondary contribution of CYP3A4 in individuals with low expression of CYP2B6, and a minor involvement of CYP2A6 [22]. Four compounds recovered in human urine following oral administration of artemisinin have been suggested, but not confirmed, as metabolites [23]. None of them exhibit the endoperoxide bridge essential for antimalarial effect. The elimination half-life of artemisinin is reported to be 2-3 hours after oral administration in healthy subjects and patients with falciparum malaria [24].
O
O
O
Me
Me
Me
OO
a. b.
12
Cytochrome P450 enzymes affected by artemisinin antimalarials
Artemether, arteether and artesunate are all rapidly converted back to DHA after oral and parenteral administration. DHA is metabolized by glucuronidation, most likely mediated by UGT1A9 and UGT2B7 [25]. The in vitro metabolism of artemether is suggested to involve CYP1A2, CYP2B6, CYP2C19 and CYP3A4 [26]. In healthy subjects, no major contribution of CYP2D6 and CYP2C19 was seen in the demethylation of artemether [27], whereas intestinal CYP3A4 appears to be involved in its first-pass metabolism [28]. CYP3A4 seems not responsible for the time-dependent pharmacokinetics of artemether observed following repeated oral administration to healthy subjects and malaria patients [29]. Declining concentrations of DHA and artesunate have, although less convincingly, been reported after multiple administration of artesunate to malaria patients [30]. CYP3A4 is the primary enzyme involved in the in vitro metabolism of arteether, with a minor contribution of CYP3A5 and CYP2B6 [31]. The water-soluble artesunate, is considered as a pro-drug because of its very rapid conversion by hydrolysis to DHA in vivo [23]. After intravenous administration, hydrolysis of the drug appears to be mediated by esterase in the blood [26]. The in vitro metabolism of artesunate has been reported to involve CYP2A6 [32]. In general, absorption of the artemisinin drugs following oral administration appears to be rapid but incomplete. Data on intravenous administration is only available for artesunate and high relative bioavailability (82%) has been reported of DHA after intravenous administration of artesunate to malaria patients [33]. Compared to oral treatment with artemisinin, relative bioavailability following rectal administration was approximately 30% in malaria patients [9]. The relative bioavailability of intramuscular and intrarectal artemether has been reported to be 25% and 35%, respectively, compared to oral artemether in healthy volunteers [34]. Arteether is available for intramuscular injection only, and has an elimination half-life of > 20 h due to a slow absorption from the injection site [35]. The other derivatives appear to be rapidly eliminated after administration. Artemether has an elimination half-life of approximately 1 hour after oral administration [28]. Half-lives of approximately 3 min and 40 min have been reported for artesunate and DHA, respectively, following oral and intravenous administration of artesunate [33].
Artemisinin-based combination treatment (ACT) The main problem with the artemisinin drugs when given as mono-therapy and for a short duration, is frequent recrudescence of infection [36]. This is probably related to the short half-lives of the drugs. A seven-day treatment course is therefore required to maximize cure rates. To reduce recrudescence and prevent or slow development of resistance, the artemisinin drugs are recommended to be used in combination with another effective, more slowly eliminated antimalarial drug. Artemisinin-based combination treatments (ACTs) are now promoted by WHO as first-line treatment for all uncomplicated falciparum malaria [37]. Since the combination partner drug usually has a longer half-life than the artemisinin component, this allows a treatment course to be completed in three days [7]. Examples of
13
Sara Asimus
currently used ACTs include artemether-lumefantrine, artesunate-amodiaquine, artesunate-mefloquine and DHA-piperaquine. The artemisinins are safe and well-tolerated drugs, when used in short-course treatments of malaria. The safety and tolerability of ACTs is therefore mainly determined by the partner drug. Despite the wide-spread use of artemisinin and its derivatives, there have been very few reports of clinically significant toxicity reactions. Minor gastrointestinal adverse effects such as diarrhea, nausea and abdominal pains have been reported [38]. One major concern raised is dose-dependent neurotoxicity which has been observed in animal models. Prolonged exposure following intramuscular injection of oil-based artemisinin derivatives, has been suggested to be the main cause of these observations [39]. No evidence of neurotoxicity have been found in humans [40, 41]. Embryotoxic effects have been reported in experimental animals exposed to artemisinin drugs during early pregnancy [42]. The artemisinins are not recommended for treatment during the first trimester. The production of artemisinin has been increased in recent years, but the market price for an adult treatment course is still too high for many people in malaria endemic countries. There are several initiatives to reduce the cost of ACTs. Development of entirely synthetic antimalarial peroxides is one strategy and a large number of substances have been synthesized during the last years. However, it has been difficult to find candidates with satisfactory bioavailability which are easily synthesized, stable and inexpensive. Hybrid molecules combining two mechanisms of actions, trioxaquines, have shown to be more stable peroxides and are hence promising developments [7]. The tetraoxanes is another potential group of new peroxides which have been reported to be highly active, inexpensive and demonstrate low toxicity [43].
14

Cytochrome P450 enzymes affected by artemisinin antimalarials
Drug Metabolism Metabolism is the principal elimination pathway for a majority of drugs. Lipophilic parent drugs are transformed by enzymes to commonly more hydrophilic metabolites facilitating their excretion into bile or urine. The liver is the central organ for drug metabolism, but other tissues such as the gastrointestinal tract, kidneys, skin and lungs are also involved. Drug metabolism is usually divided into two different types of reactions, phase I and phase II. Phase I, or functionalisation reactions, expose or introduce a functional group on a molecule. These reactions include hydrolysis, reduction and oxidation. Phase II metabolism involves conjugation of a functional group of the molecule with hydrophilic endogenous substrates. While phase I reactions generally result in a small increase in hydrophilicity, will the consequence of most phase II reactions be a large increase in hydrophilicity [44]. Glucuronidation, sulfation, acetylation and gluthatione conjugation are examples of phase II metabolism. Glucuronidation is quantitatively the most important conjugation reaction for drugs. Drug metabolizing enzymes are primarily located in the endoplasmatic reticulum and the cytosol. Oxidative phase I enzymes are almost entirely localized in the endoplasmatic reticulum together with the phase II enzyme UDP-glucuronosyltransferase (UGT), while other phase II enzymes, such as sulfotransferase and glutathione-S-transferase, are found in the cytosol [45].
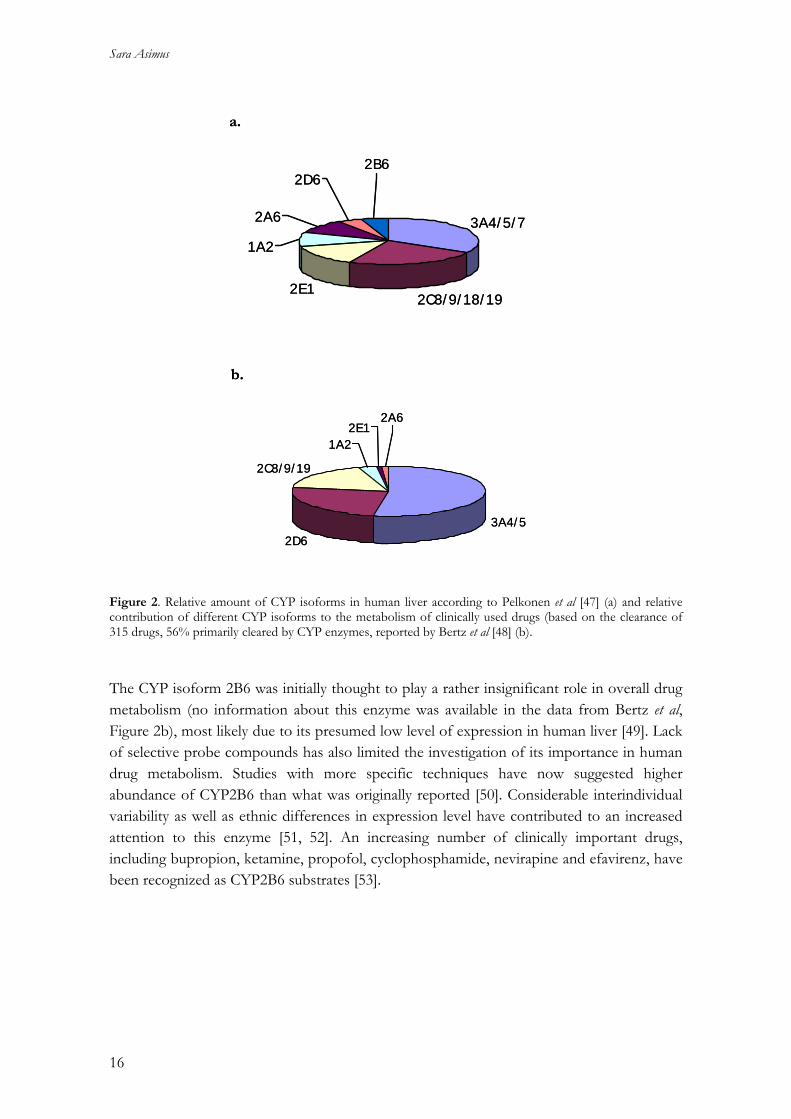
Human cytochrome P450 enzymes The main enzymes involved in phase I drug metabolism are the Cytochrome P450s. They are haeme-containing proteins catalyzing oxidation reactions by inserting molecular oxygen into substrates. This enables transformation reactions resulting in N-, O-, and S-dealkylation, aliphatic and aromatic hydroxylation. The CYP enzymes also have a key role in the biosynthesis and degradation of many endogenous compounds such as lipids, steroids and vitamins. Broad and often overlapping substrate specificities of the CYP enzymes makes it difficult to name them after the type of reaction they catalyses [44]. Individual CYP enzymes are therefore classified on the basis of similarities in their amino acid sequence and are named by a family number, a subfamily letter and a number for each isoform within a subfamily. Individual CYPs responsible for approximately 80% of the metabolism of clinically used drugs in humans are belonging to the CYP1, CYP2 and CYP3 families. CYP3A is the most abundant subfamily in both liver and small intestine [46]. Principal isoforms involved in drug metabolism include CYP1A2, 2A6, 2B6, 2C8, 2C9, 2C19, 2D6, 2E1 and 3A4. The relative amount of each of these isoforms in human liver and the relative contribution of the most important enzymes in drug metabolism is depicted in Figures 2a and b, respectively.
15
Sara Asimus
3A4/5/7
2C8/9/18/192E1
1A2
2A6
2D62B6
3A4/52D6
2C8/9/19
2A62E1
1A2
a.
b.
3A4/5/7
2C8/9/18/192E1
1A2
2A6
2D62B6
3A4/52D6
2C8/9/19
2A62E1
1A2
a.
b.
Figure 2. Relative amount of CYP isoforms in human liver according to Pelkonen et al [47] (a) and relative contribution of different CYP isoforms to the metabolism of clinically used drugs (based on the clearance of 315 drugs, 56% primarily cleared by CYP enzymes, reported by Bertz et al [48] (b). The CYP isoform 2B6 was initially thought to play a rather insignificant role in overall drug metabolism (no information about this enzyme was available in the data from Bertz et al, Figure 2b), most likely due to its presumed low level of expression in human liver [49]. Lack of selective probe compounds has also limited the investigation of its importance in human drug metabolism. Studies with more specific techniques have now suggested higher abundance of CYP2B6 than what was originally reported [50]. Considerable interindividual variability as well as ethnic differences in expression level have contributed to an increased attention to this enzyme [51, 52]. An increasing number of clinically important drugs, including bupropion, ketamine, propofol, cyclophosphamide, nevirapine and efavirenz, have been recognized as CYP2B6 substrates [53].
16
Cytochrome P450 enzymes affected by artemisinin antimalarials
In vitro metabolism of drugs There are several useful experimental systems (primary cultures of hepatocytes, liver tissue slices, subcellular fractions and heterologously expressed enzymes) available for studying the in vitro metabolism of drugs. Human liver microsomes, vesicles from fragmented endoplasmatic reticulum, are widely used to investigate CYP metabolism, UGT activity and in high-throughput screening for metabolic stability of compounds. They have good long-term stability and associated assays are usually simple, rapid and sensitive [54]. However, the production of metabolites can differ from in vivo conditions due to the closed experimental system [55]. Except for glucuronidation, no other phase II reactions are possible. By measuring disappearance rates of known substrates for particular CYP isoforms in liver microsomes, information about the activities of the enzymes of interest can be obtained [56]. A linear correlation between metabolic rate constants of two different substrates in the same microsomes indicates that the metabolic reactions are principally mediated by the same CYP isoform.
Induction of CYP enzymes The drug-metabolizing capacity in man is susceptible to changes due to influence of a variety of chemicals, administered for medical reasons or associated with our lifestyle. Many clinically used drugs from different therapeutic groups and with various chemical structures are known to induce or inhibit the metabolism of other drugs, leading to important drug-drug interactions. In recent years, much effort has been spent in trying to understand the mechanisms leading to induction of drug metabolism. The expression of genes can be increased by an induced gene transcription, processing or stabilization of mRNA. Induction can also result from enzyme stabilization [57]. The mechanism of induction for most CYP genes appears to be an increased gene transcription as a consequence of binding of inducers to intracellular receptors such as, aryl hydrocarbon receptor (AhR), pregnane X-receptor (PXR), constitutive androgen receptor (CAR) and glucocorticoid receptor (GR). PXR is directly activated in the nucleus upon binding of xenobiotics, while CAR undergoes translocation from the cytoplasm to the nucleus [58]. GR is suggested to enhance CYP induction by PXR and CAR [59]. The gene families CYP2 and CYP3 are activated by a similar mechanism through ligand-activation of nuclear receptors PXR and/or CAR. AhR is involved in the regulation of CYP1A1, while CYP1A2 is induced by stabilization or processing of mRNA [45, 60, 61]. CYP2E1 is induced at the posttranscriptional level by stabilization of mRNA a swell as by enzyme stabilization [62, 63]. Several CYPs are known to be inducible. CYP1A, CYP2A, CYP2B, CYP2C, CYP2E and CYP3A can be induced by dietary factors, drinking, smoking and therapeutic drugs [64]. CYP2D6 is considered to be a non-inducible enzyme, but increased CYP2D6 activity has been observed during pregnancy [65].
17
Sara Asimus
Enzyme induction is generally a slow process, involving the de novo synthesis of proteins. As a consequence the process is expected to be time- and dose-dependent [60, 66]. A new enzyme steady-state level will result from a balance between its biosynthesis and degradation, regardless of which underlying induction mechanism is involved [67]. It will also take time for normalization of enzyme activity to base-line levels after discontinuing the inducing agent [60]. The time it takes to reach a new steady state level of the enzyme is determined by a change in its half-life, as long as this is longer than the half-life of the inducing agent in the system [68, 69]. Induction of drug metabolism usually results in lower plasma levels of the compound, and becomes important especially for drugs with narrow therapeutic windows. For these drugs previously effective dosages can turn out to be ineffective upon induction. Enzyme induction can be associated with toxicity, due to an increased production of reactive metabolites, but the process is generally considered less important in causing serious adverse effects compared to enzyme inhibition [44]. There are several different examples of pharmacokinetic models describing enzyme induction. Despite this, little is known about the time-course of enzyme activity, including the onset and duration of induction [70]. A few models have been presented illustrating the auto-induction phenomena of drugs, including cyclophosphamide [71], ifosphamide [72], methadone [73] and artemisinin [14]. While most of these models describe changes in clearance of the drug, the latter model predicts the induction in terms of an increase in intrinsic clearance of the compound, which makes it possible to estimate the time-course of drugs with various degrees of extraction. Also, this model describes the commonly observed lag-time for the initiation of the induction process.
Inhibition of CYP enzymes In contrast to induction, inhibition of drug metabolism is more or less an immediate process. As a result of inhibition, drug plasma concentrations could rapidly increase and cause toxic effects. There are several types of enzyme inhibitors. Reversible inhibitors can be competitive, noncompetitive or uncompetitive, while mechanism-based inactivators or suicide inhibitors are classified as irreversible inhibitors. Competitive inhibition seems to be a relatively common mechanism of action for CYP enzymes. The inhibitor shares structural similarities with the substrates and can thereby compete for the active site of the enzyme. Both noncompetitive and uncompetitive inhibitors bind to the enzyme at a site distinct from that which binds the substrate, but the uncompetitive inhibitor will only bind to the enzyme-substrate complex. However, clear examples of the latter two types of reversible inhibitors are rather uncommon for enzymes involved in drug metabolism [74]. Inhibition of CYP enzymes is not always mediated by a substrate as in the case of mechanism-based inactivators, where the inhibitory effect is due to a metabolite. These inhibitors are defined as any compound that is catalytically transformed by the enzyme to give a reactive metabolite which inactivates the enzyme without leaving it [75, 76]. It involves the formation
18
Cytochrome P450 enzymes affected by artemisinin antimalarials
of a covalent binding or complex between the reactive metabolite and the enzyme itself, leading to a loss of a variable part of catalytic activity from the enzyme [67].
Induction and inhibition of phase II enzymes In addition to the CYPs, many other enzymes involved in the metabolism of drugs are induced to various extents. However, limited information is available about induction of phase II enzymes compared to the substantial knowledge about induction of CYP enzymes. Nuclear receptors PXR, CAR and AhR seems to be involved the expression of UGTs [77, 78] as well as in the induction of glutathione-S-transferase [79, 80]. Several phase II enzymes exist in multiple forms or as homo/heterodimers of two sub-units, which can be differentially induced and thereby dependent on the type of inducer [45]. A number of drugs have been characterized to act as competitive inhibitors of phase II enzymes. Glutathione-S-transferase enzymes are very abundant and thought to be competitively inhibited by some hydrophobic compounds [44]. Competitive as well as non-competitive inhibitors have been reported for UGTs [81]. The consequence of drug-drug interactions due to inhibition of phase II enzymes is so far largely unexplored.
Probe substrates and metrics for assessment of enzyme activities Substrates that are mostly or exclusively metabolized by one specific isoform have been identified, although overlapping substrate specificities are common among the CYPs. These so called probe drugs are commonly used for phenotyping to provide information on metabolic drug-drug interactions and polymorphisms in the elimination capacity of a drug. They are selected on the basis that a quantifiable pathway of its metabolism is primarily or completely mediated by the individual enzyme of interest [82]. An ideal probe drug should be specific for one CYP isoform, safe to use in humans, commonly available and easily measured in biological fluids. The pharmacokinetics of the probe drug should preferably be linear, determined by metabolism and not by plasma protein binding or liver blood flow [67]. It has been difficult to reach conclusions regarding optimal phenotyping methods since almost all available probe drugs are associated with advantages and limitations [83]. Nevertheless, there are recommended in vivo probe drugs for most of the principal CYPs involved in drug metabolism as shown in Table 1. One critical factor when estimating in vivo activity of an enzyme is the determination of appropriate pharmacokinetic parameters of the probe compound. Theoretically, estimating the unbound intrinsic clearance for a particular metabolic pathway mediated by one individual enzyme is the closest measure of the activity of that enzyme. This partial intrinsic clearance ( ) can be defined as a ratio between apparent (maximal rate of drug metabolism) and the Michaelis-Menten constant, (drug concentrations at half-maximal velocity), and is based on unbound drug concentrations in plasma [84]. However, calculation
mCLuint, maxV
mK
19
Sara Asimus
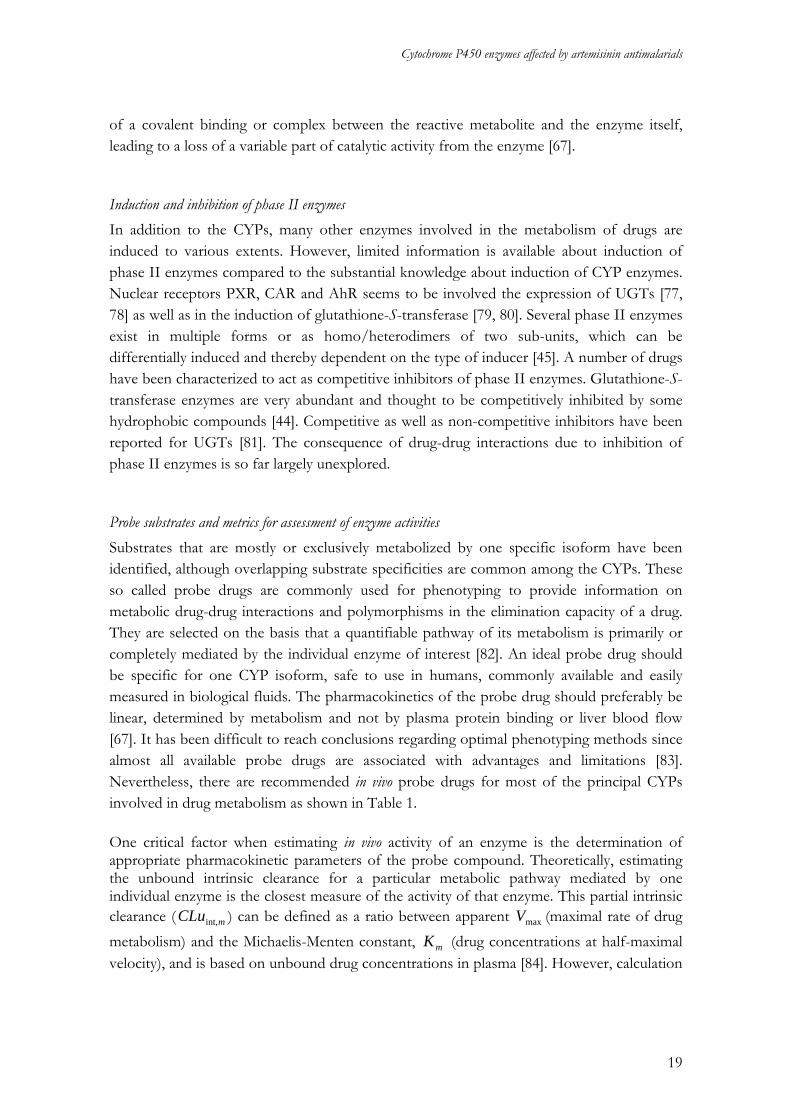
of this metric will necessitate measurements of urinary recovery of the metabolite ( ), the area under the plasma concentration–time curve ( ), plasma protein
binding (indicated by , fraction of unbound drug) and renal clearance ( ) of the parent drug and an estimation of liver blood flow ( ). In the applicable equation (equation 1), the liver is considered to be a ‘well-stirred’ organ and possible extra-hepatic metabolism of the drug and biliary excretion of drug or metabolites are not taken into account [85].
pomAe )(∞ poAUC
uf RCL
HQ
)()(
int,RHpou
Hpomm CLQAUCf
QAeCLu
+∗
∗=
∞ (1)
When renal clearance of the drug is low relative to liver blood flow the equation can be simplified to the following expression (equation 2):
pou
pomm AUCf
AeCLu
∗≈
∞)(int, (2)
Measurements of protein binding and AUC are often inconvenient in large studies involving many individuals. Indirect metrics reflecting ,mCLuint, such as metabolite - to - drug ratios in plasma and urine, total urinary recovery of metabolite and AUC, are therefore frequently used instead [85, 86]. Understanding the pharmacokinetic background of indirect metrics for enzyme activity is important to avoid misinterpretation of results. Metrics like metabolite-to-parent drug ratios in plasma or urine are generally more specific than AUC of a parent drug and urinary metabolite recovery, which reflect metabolic clearance by all routes and will be more dependent on the fraction of drug elimination occurring by that particular pathway [86, 87]. Urinary based metrics can be confounded by deficient or incomplete urine collection. Simple metrics based on plasma sampling, such as parent drug concentrations or metabolic ratios measured at a single time-point, have been shown to reflect AUC, CL or metabolite - to - parent drug AUC ratio of several probe drugs. Single point measurements, however, implies that single errors will have much more impact on the outcome compared to when full pharmacokinetic profiles are measured [88]. Appropriate and validated indirect metrics are available for many of the probe compounds presented in Table 1. Single point measurements have been reported for caffeine [89], bupropion [90], tolbutamide [91], metoprolol [92], chlorzoxazone [93] and midazolam [94, 95] in order to estimate the activity of CYP1A2, CYP2B6, CYP2C9, CYP2D6, CYP2E1 and CYP3A, respectively.
20
Cytochrome P450 enzymes affected by artemisinin antimalarials
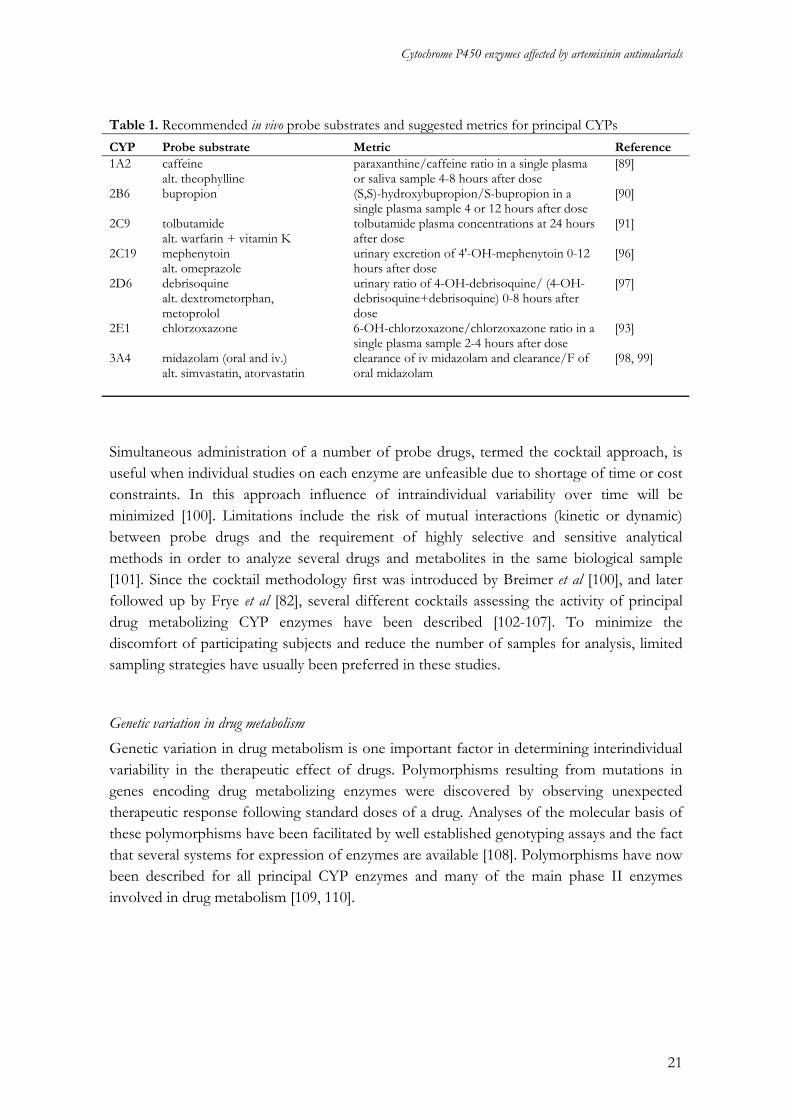
Table 1. Recommended in vivo probe substrates and suggested metrics for principal CYPs CYP Probe substrate Metric Reference 1A2 caffeine
alt. theophylline paraxanthine/caffeine ratio in a single plasma or saliva sample 4-8 hours after dose
[89]
2B6 bupropion (S,S)-hydroxybupropion/S-bupropion in a single plasma sample 4 or 12 hours after dose
[90]
2C9 tolbutamide alt. warfarin + vitamin K
tolbutamide plasma concentrations at 24 hours after dose
[91]
2C19 mephenytoin alt. omeprazole
urinary excretion of 4'-OH-mephenytoin 0-12 hours after dose
[96]
2D6 debrisoquine alt. dextrometorphan, metoprolol
urinary ratio of 4-OH-debrisoquine/ (4-OH-debrisoquine+debrisoquine) 0-8 hours after dose
[97]
2E1 chlorzoxazone 6-OH-chlorzoxazone/chlorzoxazone ratio in a single plasma sample 2-4 hours after dose
[93]
3A4 midazolam (oral and iv.) alt. simvastatin, atorvastatin
clearance of iv midazolam and clearance/F of oral midazolam
[98, 99]
Simultaneous administration of a number of probe drugs, termed the cocktail approach, is useful when individual studies on each enzyme are unfeasible due to shortage of time or cost constraints. In this approach influence of intraindividual variability over time will be minimized [100]. Limitations include the risk of mutual interactions (kinetic or dynamic) between probe drugs and the requirement of highly selective and sensitive analytical methods in order to analyze several drugs and metabolites in the same biological sample [101]. Since the cocktail methodology first was introduced by Breimer et al [100], and later followed up by Frye et al [82], several different cocktails assessing the activity of principal drug metabolizing CYP enzymes have been described [102-107]. To minimize the discomfort of participating subjects and reduce the number of samples for analysis, limited sampling strategies have usually been preferred in these studies.
Genetic variation in drug metabolism Genetic variation in drug metabolism is one important factor in determining interindividual variability in the therapeutic effect of drugs. Polymorphisms resulting from mutations in genes encoding drug metabolizing enzymes were discovered by observing unexpected therapeutic response following standard doses of a drug. Analyses of the molecular basis of these polymorphisms have been facilitated by well established genotyping assays and the fact that several systems for expression of enzymes are available [108]. Polymorphisms have now been described for all principal CYP enzymes and many of the main phase II enzymes involved in drug metabolism [109, 110].
21
Sara Asimus
A genetic polymorphism is generally defined as an inherited genetic difference that occurs with a frequency of at least 1% in the population. A single nucleotide polymorphism (SNP) is the most common cause of variation, but deletions and insertions of varying number of base-pairs has also been observed. Multiple gene copies of an allele or total deletion of the gene is quite common for the CYPs [108]. While many of these polymorphisms probably lack functional effects, some of them will result in altered activity or total absence of the enzyme. Amino acid changes influencing the substrate specificity may also be introduced. As a consequence of this genetic variability, populations can be divided into three subpopulations. Ultrarapid metabolizers (UM) have more than two gene copies coding for a particular CYP, extensive metabolizers (EM) present two functional genes and poor metabolizers (PM) lack the functional enzyme as a result of imperfect or absent genes. An additional phenotype, usually named intermediate metabolizers (IM), has been defined as individuals who carry one functional and one defective allele or two partly defective alleles [111]. Several CYP isoforms appear to be highly polymorphic enzymes. The most important and also most widely studied enzyme is CYP2D6, which is involved in the metabolism of approximately 25% of all drugs in clinical use. About 50% of these, mainly antidepressants, antipsychotics, analgesics, antiarrythmics and antiemetics, are affected by polymorphisms in CYP2D6 [112]. Significant interethnic differences have been reported for many CYP alleles. With respect to CYP2D6 PMs are common in Europe, UMs frequent in North Africa, while a high frequency of IMs bearing the defective CYP2D6*10 allele have been found among Asian populations [113]. PMs with deficient CYP2C19 alleles (CYP2C19*2 and CYP2C19*3) seem to be more frequent in Asians compared to Caucasian and African populations [114]. CYP2C9*2 and CYP2C9*3 are the two main allelic variants of CYP2C9 associated with decreased enzyme activity. The prevalence of both alleles is higher in Caucasians compared to populations in Africa and Asia [115]. The great interindividual variability that has been reported in CYP2A6 activity also shows important ethnic differences. The frequency of PMs appears to be very low in Caucasians, whereas PMs are much more common among Asian populations [116]. A number of variant alleles that are associated with decreased activity of CYP2B6 have been described. One of them, CYP2B6*6, has been found to be relatively common in several different populations including Caucasian, African-American, African and Asian populations [117]. In contrast, the CYP2B6*4 allele has been reported to cause increased enzyme activity both in vitro [118] and in vivo [119]. The activity of CYP3A also varies considerably between individuals. CYP3A5 is highly polymorphic, and CYP3A5*3 seems to be a prevalent defective allele in all ethnic groups [120]. The importance of polymorphisms in the CYP3A5 gene is most likely limited due to its relatively small contribution to overall CYP3A mediated drug metabolism. Several variant alleles have been described in the coding regions of CYP3A4, some of them resulting in decreased enzyme activity. However, all mutations described so far occur at very low population frequencies, and seems therefore unlikely to account for the interindividual differences seen in CYP3A4
22
Cytochrome P450 enzymes affected by artemisinin antimalarials
activity. Polymorphisms in the nuclear receptor PXR or outside the coding regions of the CYP3A4 gene have been suggested as possible explanations for genetic variations in CYP3A4 levels [108, 111].
23
Sara Asimus
AIMS OF THE THESIS
The overall aim of this thesis was to obtain pharmacokinetic and metabolic information on the artemisinin endoperoxide antimalarials to enable recommendation of safe and efficacious future combination treatments of malaria. Specific aims were to:
• describe the time-course of artemisinin’s autoinduction by applying a semi-physiological pharmacokinetic model to plasma concentration-time data from several studies in healthy subjects and malaria patients
• investigate the ability of the artemisinin antimalarials to induce and/or inhibit
principal CYP enzymes in healthy subjects and to compare their potential for drug-drug interactions in order to select the most suitable artemisinin derivative to be a partner in combination treatment
• investigate if artemisinin affects CYP2A6 activity in healthy subjects and to evaluate
the utility of coumarin and nicotine as in vivo probe compounds for CYP2A6
• obtain pharmacogenetic data in a Vietnamese population in genes coding for proteins involved in elimination of drugs currently used for the treatment of infectious diseases
• compare the in vitro metabolism of artemisinin with other substrates for CYP2B6 in
human liver microsomes from a panel of donors with different expression levels of CYP2B6
24
Cytochrome P450 enzymes affected by artemisinin antimalarials
MATERIALS AND METHODS
Experimental procedures
Ethics Studies described in papers II, III and IV were conducted at the Clinical Unit of the National Institute of Malariology, Parasitology and Entomology, Hanoi, in accordance with the principles laid down in the Helsinki Declaration and International Guidance for Good Clinical Practise. Written informed consent was obtained from all subjects prior to study enrollment. These studies were approved by the Ministry of Health, Hanoi, Vietnam, the Swedish Medical Products Agency, Uppsala, Sweden and by the Ethics Committee at University of Gothenburg, Göteborg, Sweden.
Subjects In paper I, data were obtained from six clinical studies involving oral repeated administration of artemisinin to 54 malaria patients and 33 healthy subjects (Table 2). Seventy-five healthy volunteers, 51 men and 24 women, were included in study II. Thirty-six of the subjects were smokers of no more than ten cigarettes per day. In paper III, twelve healthy male volunteers, which were required to be non-smokers, participated. None of the subjects included in papers II and III studies had taken any antimalarial drug within one month, any other drug within two weeks before the study start or had a history of alcohol abuse.
Study design An overview of different artemisinin administration schedules and blood sampling in the studies included in paper I is presented in Table 2. In paper II, volunteers were randomized to repeated oral treatment with one of the following artemisinin drugs; artemisinin (500 mg), DHA (60 mg), artemether (100 mg), arteether (100 mg) or artesunate (100 mg) for five days (day 1 -5). A cocktail of six probe drugs, caffeine (100 mg), coumarin (5 mg), mephenytoin (100 mg), metoprolol (100 mg), chlorzoxazone (250 mg) and midazolam (7.5 mg), were given orally six days before (day -6) administration of the artemisinin drugs. On day 1 and day 5 of artemisinin drug intake, the cocktail drugs were given again, 1 hour after the artemisinin drugs. The cocktail drugs were then administered once more after a wash-out period of five days (day 10). Probe compounds were measured in blood samples taken immediately before, and at 4 hours after administration of the cocktail drugs on days -6, 1, 5 and 10. On these days total voided urine was collected for 8 hours after intake of the cocktail drugs. The total weight of urine collected was recorded and an aliquot was kept frozen until analysis. Subjects underwent a physical examination on days -11 and 15. Blood
25
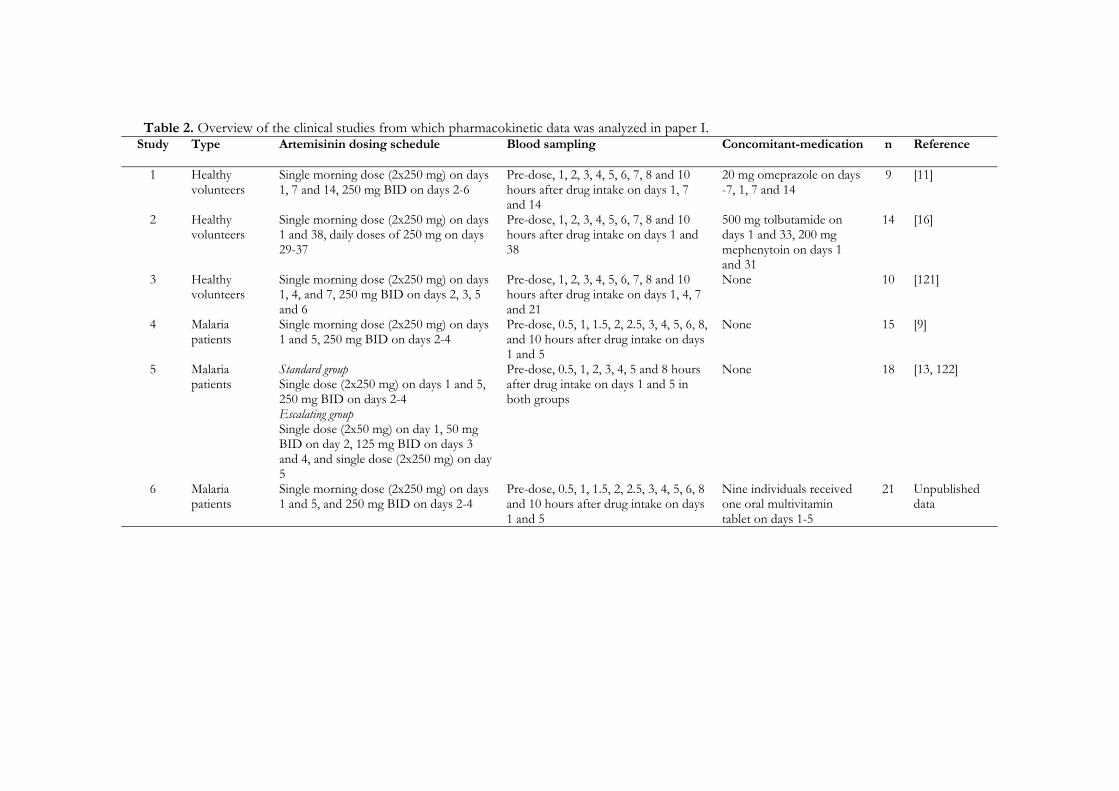
Table 2. Overview of the clinical studies from which pharmacokinetic data was analyzed in paper I. Study
Type Artemisinin dosing schedule Blood sampling Concomitant-medication n Reference
1 Healthy volunteers
Single morning dose (2x250 mg) on days 1, 7 and 14, 250 mg BID on days 2-6
Pre-dose, 1, 2, 3, 4, 5, 6, 7, 8 and 10 hours after drug intake on days 1, 7 and 14
20 mg omeprazole on days -7, 1, 7 and 14
9 [11]
2 Healthy volunteers
Single morning dose (2x250 mg) on days 1 and 38, daily doses of 250 mg on days 29-37
Pre-dose, 1, 2, 3, 4, 5, 6, 7, 8 and 10 hours after drug intake on days 1 and 38
500 mg tolbutamide on days 1 and 33, 200 mg mephenytoin on days 1 and 31
14 [16]
3 Healthy volunteers
Single morning dose (2x250 mg) on days 1, 4, and 7, 250 mg BID on days 2, 3, 5 and 6
Pre-dose, 1, 2, 3, 4, 5, 6, 7, 8 and 10 hours after drug intake on days 1, 4, 7 and 21
None 10 [121]
4 Malaria patients
Single morning dose (2x250 mg) on days 1 and 5, 250 mg BID on days 2-4
Pre-dose, 0.5, 1, 1.5, 2, 2.5, 3, 4, 5, 6, 8, and 10 hours after drug intake on days 1 and 5
None 15 [9]
5 Malaria patients
Standard group Single dose (2x250 mg) on days 1 and 5, 250 mg BID on days 2-4 Escalating group Single dose (2x50 mg) on day 1, 50 mg BID on day 2, 125 mg BID on days 3 and 4, and single dose (2x250 mg) on day 5
Pre-dose, 0.5, 1, 2, 3, 4, 5 and 8 hours after drug intake on days 1 and 5 in both groups
None 18 [13, 122]
6 Malaria patients
Single morning dose (2x250 mg) on days 1 and 5, and 250 mg BID on days 2-4
Pre-dose, 0.5, 1, 1.5, 2, 2.5, 3, 4, 5, 6, 8 and 10 hours after drug intake on days 1 and 5
Nine individuals received one oral multivitamin tablet on days 1-5
21 Unpublished data
Cytochrome P450 enzymes affected by artemisinin antimalarials
was taken for biochemical analysis on days -11 and on days 5 and 15 the subjects were interviewed concerning adverse events. In paper III, subjects were randomized to one of two study groups. Subjects in group A received coumarin (200 mg) and nicotine (4 mg chewing gum) as probe drugs in the first and the second treatment period, respectively. Treatment periods were separated by a wash-out period of one month. The sequence for subjects in group B was reversed. Artemisinin (500 mg) was administered orally in the morning for five days (days 1-5 and 43-47) in each treatment period. The probe drugs were given as single oral doses one week prior to (days –7 and 36) and on the first day (days 1 and 43) and on the last day (days 5 and 47) of artemisinin treatment. Blood samples were taken for quantification of probe drugs and corresponding metabolites on days -7, 1, 5, 36, 43 and 47. When the subjects received coumarin, samples were drawn pre-dose and at 5, 10, 15, 20, 30, 45, 60 min and 1.5, 2, 3, 4, 5, 6, 7 and 9 hours after drug intake. After nicotine intake, the samples were taken pre-dose and at 15, 30, 45, 60 min and 1.5, 2, 3, 4, 5, 7, 9, 11, 24, 48 and 72 hours. On the days of co-administration with artemisinin (days 1, 5, 43 and 47) were additional samples taken directly before and 30 min after artemisinin treatment. Urine was collected in two intervals (0-3 and 3-8 hours) after coumarin intake. The total weight of each urine sample was recorded and an aliquot was kept frozen until analysis. A physical examination was performed and blood was taken for biochemical analysis on days -12 and 52. Subjects were interviewed on adverse events on days 5 and 47. Some of the blood taken on day -11 (paper II) and day -12 (paper III) were used for genotyping of CYP2A6, CYP2B6, CYP2C19, CYP2D6, CYP3A4, CYP3A5 and MDR1 (paper IV). Genomic DNA was extracted from blood of participating subjects. The main SNPs in genes mentioned above were analyzed using polymerase chain reaction (PCR) techniques and pyrosequencing based methods.
Microsomal incubations In paper V, characterized human liver microsomes from twelve donors were obtained from Cellzdirect Inc (Pittsboro, NC, USA). Incubation mixtures consisted of human liver microsomes (0.25 mg protein/mL), 0.5 mM nicotinamide adenine dinucleotide phosphate (NADPH), 5 mM MgCl2 and 50 mM potassium phosphate buffer (pH 7.4) to a final volume of 1 mL. Substrate concentrations at the start of incubations were 10 µM for artemisinin and efavirenz and 20 µM for bupropion and propofol, respectively. After pre-incubation for 2 min at 37º, the reaction was started by adding NADPH. Samples (100 µL) were taken at 0, 10, 20, 30 and 60 min after start of incubation. The reaction was terminated by mixing the samples with 100 µL ice-cold methanol. Water (100 µL) was added to each sample before agitation and centrifugation (12000xg, 10 min). An aliquot (100 µL) of the supernatant was injected onto the high performance liquid chromatography (HPLC) system.
27
Sara Asimus
Analytical methods HPLC with ultraviolet (UV) or mass spectrometric detection and gas chromatography were used for drug quantification. The methods are summarized below.
Cocktail probe drugs (paper II) Plasma concentrations of caffeine, paraxanthine, chlorzoxazone, 6-hydroxychlorzoxazone (6-OH-chlorzoxazone), 7-hydroxycoumarin (7-OH-coumarin), metoprolol, α-hydroxymetoprolol (α-OH-metoprolol), midazolam and 1-hydroxymidazolam (1-OH-midazolam) were measured by a liquid chromatography-tandem mass spectrometry (LC/MS/MS) method modified from Scott et al [123]. Concentrations of 7-OH-coumarin in urine were measured with the same method as used for 7-OH-coumarin in plasma with some modifications. Plasma and urine samples were treated with β-glucuronidase before analysis. A separate LC/MS/MS method described by Jansson et al was used for quantification of S-mephenytoin and S-4'-hydroxymephenytoin (S-4'-OH-mephenytoin) in plasma [124]. The median value of the inter-day precision of all quality control (QC) levels for the two plasma methods was 6.5% (n = 20 or 21 per compound and level) and none of the analytes had a coefficient of variation (CV) above 16%. Inter-day precision was below 5.3% for three QC levels (n=6/level) in the urine analysis.
Artemisinin and CYP2A6 probe drugs (paper III) Artemisinin plasma concentrations were measured by HPLC with UV detection, following on-line sample clean up and post-column derivatization according to Gordi et al [125]. The lower limit of quantification (LLOQ) was set at 20 ng/mL. Inter-day CVs were ≤ 16% for three QC levels (n= 33-36/level) with accuracies ranging from -5% to -1%. Concentrations of coumarin and 7-OH-coumarin in plasma were determined with a LS/MS/MS method. Chromatography was performed using a gradient at a flow-rate of 0.4 mL/min. The mobile phase consisted of solvent A: acetonitrile in 0.1% acetic acid (2:98 v/v), and solvent B: acetonitrile in 0.1% acetic acid (80:20 v/v). The gradient conditions were as follows: 0-1 min 10% B, 1- 4.83 min 10-95% B, 4.83-5.83 min 95% B, 5.83-6.83 min 95-10% B and 6.83-8 min 10% B. Electrospray ionization in positive mode (ESI) with multiple reaction monitoring (MRM) was used. The transitions were mass-to-charge ratio (m/z) 146.9 → 91.5 and m/z 163.15 → 107.4 for coumarin and 7-OH-coumarin, respectively. LLOQ was 12.5 and 3.1 ng/mL for coumarin and 7-OH-coumarin, respectively. Inter-day CVs were below 13% for all QC levels (n = 14-17/level) with accuracies ranging between -2% and 8%. Plasma concentrations of 7-OH-coumarin glucuronide were analyzed by a HPLC method according to Bogan et al [126]. LLOQ was 47.5 ng/mL and inter-day CV were ≤ 10% for
28
Cytochrome P450 enzymes affected by artemisinin antimalarials
four QC levels (n = 23-24/level) with accuracies ranging from -16% to 7%. Concentrations of 7-OH-coumarin were measured in urine samples by the same method with some modifications. Urine samples were incubated with β-glucuronidase for 3 hours before analysis. LLOQ was 240 ng/mL and inter-day CV for three QC levels were below 9% (n=10/level) with accuracies varying between -4% and 14%. Nicotine and cotinine plasma concentrations were determined with gas chromatography by a previously described method [127]. LLOQ was 1 and 6 ng/mL for nicotine and cotinine, respectively.
CYP2B6 substrates (paper V) Artemisinin concentrations were quantified by HPLC with on-line post-column derivatization and UV detection according to Edlund et al [128] as modified by Ashton et al [12]. LLOQ was 0.6 µM and inter-day CVs were less than 4% for three QC levels (n=12/level), with accuracies ranging from -4.5% to -4.1%. Concentrations of hydroxybupropion and bupropion were determined according to a method adapted from Cooper et al with UV detection at dual-wavelengths [129]. Inter-day CVs were below 6% for three QC levels per compound (n=24/level and compound), with accuracies ranging from -2.3% to 3.5%. LLOQ was set at 5.5 µM and 0.13 µM for bupropion and hydroxybupropion, respectively. Propofol concentrations were quantified according to a method previously described by Tanaka and coworkers [130]. LLOQ was set at 1.25 µM and inter-day CV was below 6% for three QC levels (n=24/level) with accuracies ranging from -9.1% to -7.4%. Efavirenz and 8-hydroxyefavirenz (8-OH-efavirenz) concentrations were determined by a method described by Ward et al [131]. LLOQ was set at 0.6 µM and inter-day CV was less than 13% for three QC levels (n=24/level) with accuracies ranging from -1.2% to 2.4%.
Data analysis
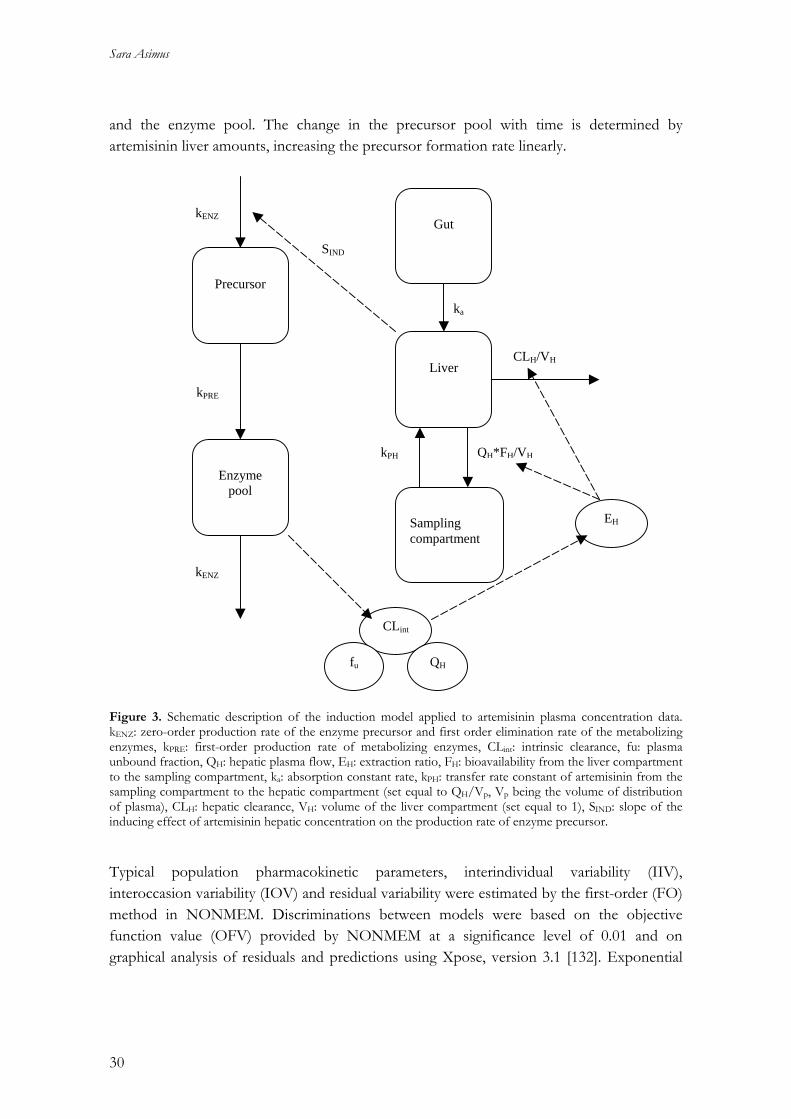
Pharmacokinetic modeling (paper I) A previously developed model of enzyme autoinduction was applied to artemisinin log-transformed plasma concentration-time data in paper I (Figure 3) [14], using a nonlinear mixed effects modeling approach as implemented in NONMEM version V (Globomax, MD, USA). The model consisted of two parts, one describing the pharmacokinetics of artemisinin and the other the time-variant amounts of the induced enzyme(s). In this model, artemisinin is introduced to a gut compartment followed by distribution into a liver compartment, from which elimination is described by a well-stirred model. Artemisinin is further distributed into a sampling compartment, which represents the whole body except that of the liver. The enzyme part of the model contains two compartments, the precursor
29
Sara Asimus
and the enzyme pool. The change in the precursor pool with time is determined by artemisinin liver amounts, increasing the precursor formation rate linearly.
Precursor
Enzyme
pool
Sampling compartment
Liver
Gut
ka
kPH
CLH/VH
QH*FH/VH
kENZ
kENZ
kPRE
CLint
fu QH
EH
SIND
Figure 3. Schematic description of the induction model applied to artemisinin plasma concentration data. kENZ: zero-order production rate of the enzyme precursor and first order elimination rate of the metabolizing enzymes, kPRE: first-order production rate of metabolizing enzymes, CLint: intrinsic clearance, fu: plasma unbound fraction, QH: hepatic plasma flow, EH: extraction ratio, FH: bioavailability from the liver compartment to the sampling compartment, ka: absorption constant rate, kPH: transfer rate constant of artemisinin from the sampling compartment to the hepatic compartment (set equal to QH/Vp, Vp being the volume of distribution of plasma), CLH: hepatic clearance, VH: volume of the liver compartment (set equal to 1), SIND: slope of the inducing effect of artemisinin hepatic concentration on the production rate of enzyme precursor. Typical population pharmacokinetic parameters, interindividual variability (IIV), interoccasion variability (IOV) and residual variability were estimated by the first-order (FO) method in NONMEM. Discriminations between models were based on the objective function value (OFV) provided by NONMEM at a significance level of 0.01 and on graphical analysis of residuals and predictions using Xpose, version 3.1 [132]. Exponential
30
Cytochrome P450 enzymes affected by artemisinin antimalarials
variance models were used to describe IIV in intrinsic clearance and volume of distribution as well as IOV in the absorption rate constant. A proportional residual error model was applied in the final model. Modifications of the original model that were tested included a model with a single enzyme compartment, no absorption lag-time, linear or saturable effect of artemisinin hepatic amounts on the precursor/enzyme and linear or saturable effect of enzyme amounts on intrinsic clearance of artemisinin. The only part of the final structural model that differed from the original model presented by Gordi et al [14], was that no absorption lag-time was estimated.
Non-compartmental data analysis and statistics (papers II and III) In paper II, the 4 hour plasma concentration ratio of paraxanthine/caffeine was used to evaluate CYP1A2 activity. Total recovery of 7-OH-coumarin in urine collected 0-8 hours after dose was used as an index for CYP2A6 activity. CYP2C19 activity was assessed by the S-4'-OH-mephenytoin/S-mephenytoin 4 hour concentration ratio in plasma. The 4 hour plasma concentration ratio of α-OH-metoprolol/metoprolol and 6-OH-chlorzoxazone/chlorzoxazone were used to estimate the activity of CYP2D6 and CYP2E1, respectively. Individual enzyme activities were investigated by the described metrics on days -6, 1, 5 and 10. Four contrasts were estimated for comparison of enzyme activity between study days; day 1 vs. day -6 (day 1/day -6), day 5 vs. day -6 (day 5/day -5), day 5 vs. day 1 (day 5/day 1) and day 10 vs. day -6 (day 10/day -6). A repeated ANOVA model with Gaussian random effects was applied to log-transformed data. An overall test level of 5% for the multiple (four) tests per treatment group was selected. According to the Bonferroni-method for multiple testing, 98.75% confidence intervals are presented and p-values compared to 0.0125 in the sequel. The Proc Mixed in SAS 8.2 (SAS Company Inc, Cary, USA) software was used for the analysis. In paper III, pharmacokinetic parameters were calculated by non-compartmental methods from plasma concentration-time data using WinNonlin version 5.0 (Pharsight Co., CA, USA). The area under the concentration-time curve until the last measurable time point (AUCt) was calculated for 7-OH-coumarin, 7-OH-coumarin glucuronide and artemisinin by the linear trapezoidal rule for ascending data points and by the log-trapezoidal rule for descending data points. The AUC extrapolated from the last data point to infinity (AUCt-∞) was calculated by dividing the estimated concentration at the last data point with the elimination rate constant (λ), which was estimated by log-linear regression of 3 to 5 terminal concentration-time data points. The total area under the plasma concentration time curve was calculated as AUC0-∞ = AUCt + AUCt-∞. For nicotine and cotinine increasing concentrations of both compounds were observed in samples taken 24, 48 and 72 hours after nicotine intake, wherefore AUC0-11hr was used instead of AUC0-∞. A 2-tailed paired t-test was used to compare artemisinin AUC values on the first and the fifth day. Repeated measurements ANOVA, applied to log-transformed data were used to compare AUC values
31
Sara Asimus
of the probe compounds and their metabolites, metabolic ratios and the sum of urinary excreted 7-OH-coumarin and 7-OH-coumarin glucuronide on the different days. An overall test level of 5% for the multiple (three) tests was selected. Confidence intervals and p-values were adjusted for three tests according to the Bonferroni-method for multiple testing. The Proc Mixed in SAS 8.2 (SAS Company Inc, Cary, USA) software was used for the statistical analysis.
Genotyping (paper IV) Genotype data obtained from healthy Vietnamese subjects (papers II and III) were in paper IV compared to previous published data in other Asian populations by Fisher's Exact Test. Differences in levels of pharmacokinetic metrics (CYP1A2; paraxanthine/caffeine plasma concentration ratio at 4 hours post dose, CYP2C19; S-4'-OH-mephenytoin/S-mephenytoin 4 hour plasma concentration ratio, CYP2D6; α-OH-metoprolol/metoprolol 4 hour plasma concentration ratio and CYP3A; midazolam 4 hour plasma concentrations) between genotypes were assessed using ANOVA and Bonferroni adjusted post-hoc tests. Results from the ANOVA applied to original scale data are reported, but the test was also performed for logarithmic scale data and using the corresponding non-parametric Kruskal-Wallis test. Using the pre-specified significance level of 0.05 no irregularities between the three tests were found. Hardy-Weinberg equilibrium testing for the analyzed SNPs was performed with the GenePop software (http://wbiomed.curtin.edu.au/genepop/).
Non-linear regression analysis (paper V) In paper V, metabolic rate constants of artemisinin, bupropion, propofol and efavirenz were estimated using WinNonlin version 5.2 (Pharsight Co., CA, USA). First-order kinetic models were fitted to concentration-time data (pooled duplicates) obtained in incubations with microsomes from individual donors. For bupropion and efavirenz, metabolite formation data was incorporated in the model. Initial concentrations were defined as amount of drug added divided by volume of distribution, where the latter was estimated as a free parameter. Correlations between metabolic rate constants for artemisinin and the other CYP2B6 substrates were investigated with linear regression and Pearson’s correlation coefficient using SPSS 16.0 for Windows (SPSS Inc., IL, USA).
32
Cytochrome P450 enzymes affected by artemisinin antimalarials
RESULTS AND DISCUSSION
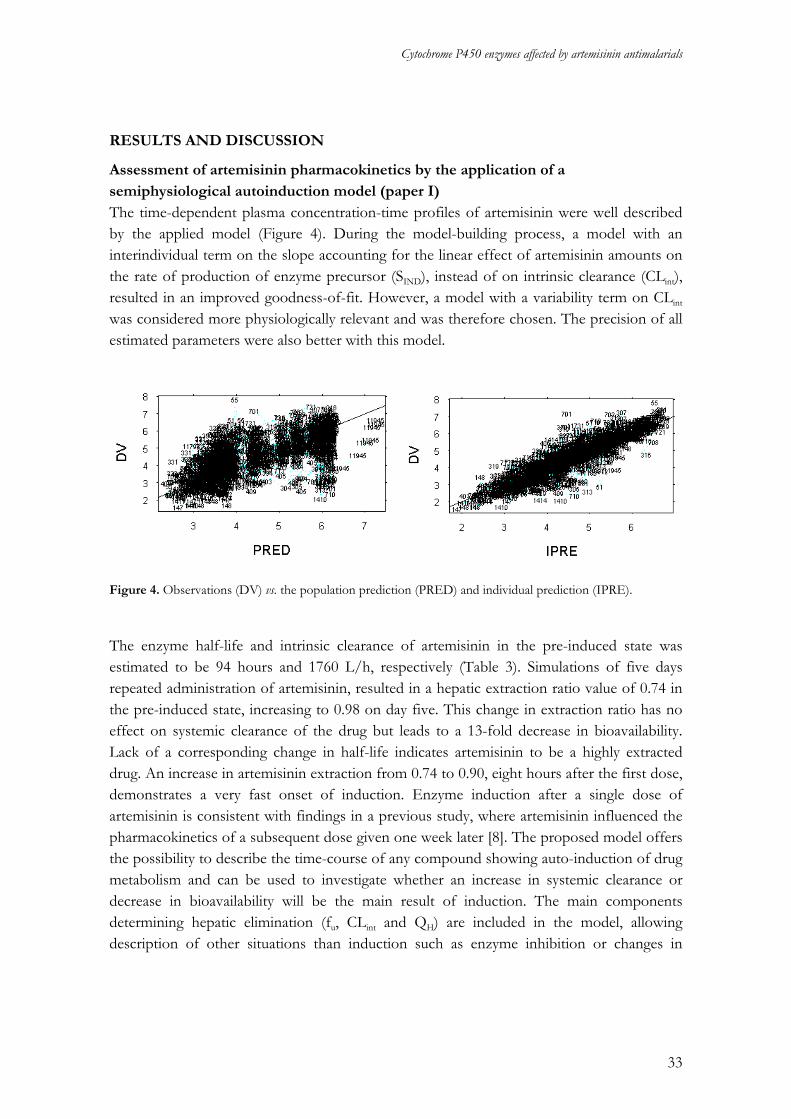
Assessment of artemisinin pharmacokinetics by the application of a semiphysiological autoinduction model (paper I) The time-dependent plasma concentration-time profiles of artemisinin were well described by the applied model (Figure 4). During the model-building process, a model with an interindividual term on the slope accounting for the linear effect of artemisinin amounts on the rate of production of enzyme precursor (SIND), instead of on intrinsic clearance (CLint), resulted in an improved goodness-of-fit. However, a model with a variability term on CLint
was considered more physiologically relevant and was therefore chosen. The precision of all estimated parameters were also better with this model.
Figure 4. Observations (DV) vs. the population prediction (PRED) and individual prediction (IPRE).
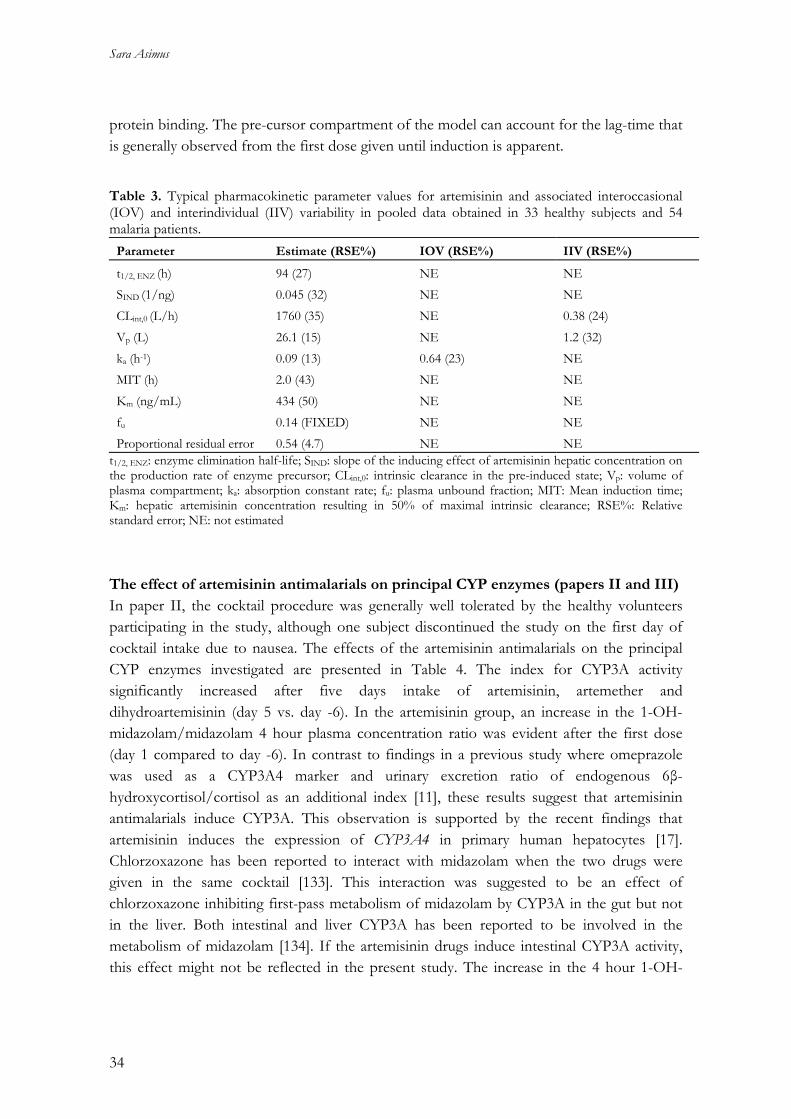
he enzyme half-life and intrinsic clearance of artemisinin in the pre-induced state was
Testimated to be 94 hours and 1760 L/h, respectively (Table 3). Simulations of five days repeated administration of artemisinin, resulted in a hepatic extraction ratio value of 0.74 in the pre-induced state, increasing to 0.98 on day five. This change in extraction ratio has no effect on systemic clearance of the drug but leads to a 13-fold decrease in bioavailability. Lack of a corresponding change in half-life indicates artemisinin to be a highly extracted drug. An increase in artemisinin extraction from 0.74 to 0.90, eight hours after the first dose, demonstrates a very fast onset of induction. Enzyme induction after a single dose of artemisinin is consistent with findings in a previous study, where artemisinin influenced the pharmacokinetics of a subsequent dose given one week later [8]. The proposed model offers the possibility to describe the time-course of any compound showing auto-induction of drug metabolism and can be used to investigate whether an increase in systemic clearance or decrease in bioavailability will be the main result of induction. The main components determining hepatic elimination (fu, CLint and QH) are included in the model, allowing description of other situations than induction such as enzyme inhibition or changes in
33
Sara Asimus
protein binding. The pre-cursor compartment of the model can account for the lag-time that is generally observed from the first dose given until induction is apparent. Table 3. Typical pharmacokinetic parameter values for artemisinin and associated interoccasional (IOV) and interindividual (IIV) variability in pooled data obtained in 33 healthy subjects and 54 malaria patients.
Parameter Estimate (RSE%) IOV (RSE%) IIV (RSE%)
t1/2, ENZ (h) 94 (27) NE NE SIND (1/ng) 0.045 (32) NE NE CLint,0 (L/h) 1760 (35) NE 0.38 (24) Vp (L) 26.1 (15) NE 1.2 (32) ka (h-1) 0.09 (13) 0.64 (23) NE MIT (h) 2.0 (43) NE NE Km (ng/mL) 434 (50) NE NE fu 0.14 (FIXED) NE NE Proportional residual error 0.54 (4.7) NE NE
t1/2, ENZ: enzyme elimination half-life; SIND: slope of the inducing effect of artemisinin hepatic concentration on the production rate of enzyme precursor; CLint,0: intrinsic clearance in the pre-induced state; Vp: volume of plasma compartment; ka: absorption constant rate; fu: plasma unbound fraction; MIT: Mean induction time; Km: hepatic artemisinin concentration resulting in 50% of maximal intrinsic clearance; RSE%: Relative standard error; NE: not estimated
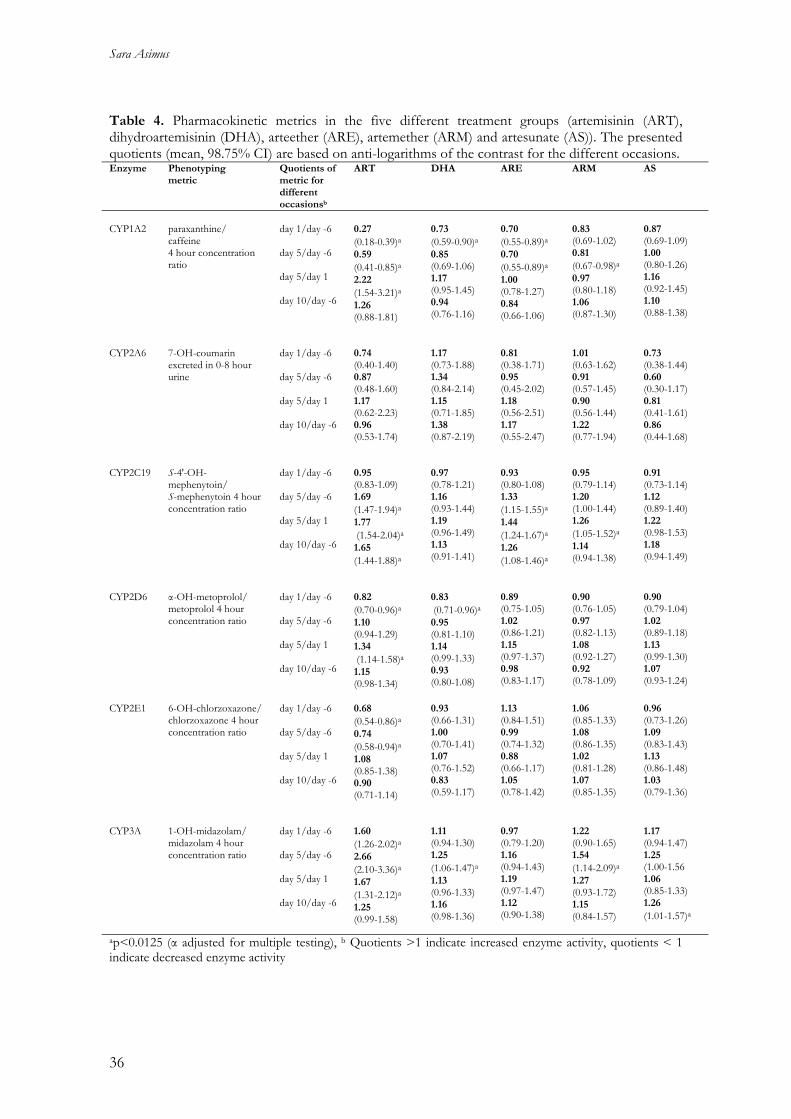
The effect of artemisinin antimalarials on principal CYP enzymes (papers II and III) In paper II, the cocktail procedure was generally well tolerated by the healthy volunteers participating in the study, although one subject discontinued the study on the first day of cocktail intake due to nausea. The effects of the artemisinin antimalarials on the principal CYP enzymes investigated are presented in Table 4. The index for CYP3A activity significantly increased after five days intake of artemisinin, artemether and dihydroartemisinin (day 5 vs. day -6). In the artemisinin group, an increase in the 1-OH-midazolam/midazolam 4 hour plasma concentration ratio was evident after the first dose (day 1 compared to day -6). In contrast to findings in a previous study where omeprazole was used as a CYP3A4 marker and urinary excretion ratio of endogenous 6β-hydroxycortisol/cortisol as an additional index [11], these results suggest that artemisinin antimalarials induce CYP3A. This observation is supported by the recent findings that artemisinin induces the expression of CYP3A4 in primary human hepatocytes [17]. Chlorzoxazone has been reported to interact with midazolam when the two drugs were given in the same cocktail [133]. This interaction was suggested to be an effect of chlorzoxazone inhibiting first-pass metabolism of midazolam by CYP3A in the gut but not in the liver. Both intestinal and liver CYP3A has been reported to be involved in the metabolism of midazolam [134]. If the artemisinin drugs induce intestinal CYP3A activity, this effect might not be reflected in the present study. The increase in the 4 hour 1-OH-
34
Cytochrome P450 enzymes affected by artemisinin antimalarials
midazolam/midazolam concentration ratio would then result from induction of hepatic CYP3A activity only. In the subjects receiving artemisinin and arteether, the 4 hour S-4'-OH-mephenytoin/mephenytoin concentration ratio significantly increased on the fifth day of drug intake (day 5 vs. day -6). Nine individuals, who had no measurable concentrations of S-4'-OH-mephenytoin were considered to be poor metabolizers of CYP2C19 and excluded from the data analysis. Total recovery of S-4'-OH-mephenytoin in urine and the S/R-mephenytoin ratio in urine are commonly used metrics for estimation of CYP2C19 activity [82, 96, 103, 107]. Since artemisinin previously has shown to increase oral clearance of both S- and R-mephenytoin [16], their ratio would be confounded. Non-eliminated concentrations of R-mephenytoin from previous doses on days 1, 5 and 10 would further have confused the S/R-mephenytoin ratio on these days. Due to these reasons the 4 hour S-4'-OH-mephenytoin/ mephenytoin plasma concentration ratio, although not pre-validated, was considered to be the best metric for estimating CYP2C19 activity for the situation at hand. Recent results from a model describing the inductive properties of the artemisinin antimalarials applied to mephenytoin data, confirm induction of CYP2C19 by artemisinin, artemether and arteether [135]. Intake of artemisinin, dihydroartemisinin and arteether significantly decreased the 4 hour paraxanthine/caffeine plasma concentration ratio day 1 compared with day -6, suggesting an inhibitory effect on CYP1A2. A significant increase in the same index was observed day 5 compared with day 1 after repeated administration of artemisinin. The inhibitory effect on CYP1A2 by artemisinin antimalarials is in agreement with previous in vitro findings and results from a recent study in healthy subjects [19, 20]. Residual concentrations of caffeine and paraxanthine found in the pre-dose samples confound the CYP1A2 metric in many subjects. An extended period of caffeine abstinence of 36 hours has been recommended in future studies [104]. A significant decrease in the α-OH-metoprolol/metoprolol 4 hour concentration ratio was observed in the artemisinin and dihydroartemisinin groups day 1 compared to day -6, indicating an inhibitory effect on CYP2D6. A significant increase in the same metric was found in the artemisinin group from day 1 to day 5. This effect was unexpected since CYP2D6 is considered to be a non-inducible enzyme, and might be explained by induction of another enzyme normally of minor importance for the metabolism of metoprolol to α-OH-metoprolol. Two individuals were considered to be poor metabolizers of CYP2D6 and hence excluded from the data analysis, since they had no detectable concentrations of α-OH-metoprolol.
35
Sara Asimus
Table 4. Pharmacokinetic metrics in the five different treatment groups (artemisinin (ART), dihydroartemisinin (DHA), arteether (ARE), artemether (ARM) and artesunate (AS)). The presented quotients (mean, 98.75% CI) are based on anti-logarithms of the contrast for the different occasions. Enzyme Phenotyping
metric Quotients of metric for different occasionsb
ART DHA ARE ARM AS
CYP1A2
paraxanthine/ caffeine 4 hour concentration ratio
day 1/day -6 day 5/day -6 day 5/day 1 day 10/day -6
0.27 (0.18-0.39)a0.59 (0.41-0.85)a2.22 (1.54-3.21)a1.26 (0.88-1.81)
0.73 (0.59-0.90)a0.85 (0.69-1.06) 1.17 (0.95-1.45) 0.94 (0.76-1.16)
0.70 (0.55-0.89)a0.70 (0.55-0.89)a1.00 (0.78-1.27) 0.84 (0.66-1.06)
0.83 (0.69-1.02) 0.81 (0.67-0.98)a0.97 (0.80-1.18) 1.06 (0.87-1.30)
0.87 (0.69-1.09) 1.00 (0.80-1.26) 1.16 (0.92-1.45) 1.10 (0.88-1.38)
CYP2A6
7-OH-coumarin excreted in 0-8 hour urine
day 1/day -6 day 5/day -6 day 5/day 1 day 10/day -6
0.74 (0.40-1.40) 0.87 (0.48-1.60) 1.17 (0.62-2.23) 0.96 (0.53-1.74)
1.17 (0.73-1.88) 1.34 (0.84-2.14) 1.15 (0.71-1.85) 1.38 (0.87-2.19)
0.81 (0.38-1.71) 0.95 (0.45-2.02) 1.18 (0.56-2.51) 1.17 (0.55-2.47)
1.01 (0.63-1.62) 0.91 (0.57-1.45) 0.90 (0.56-1.44) 1.22 (0.77-1.94)
0.73 (0.38-1.44) 0.60 (0.30-1.17) 0.81 (0.41-1.61) 0.86 (0.44-1.68)
CYP2C19
S-4'-OH-mephenytoin/ S-mephenytoin 4 hour concentration ratio
day 1/day -6 day 5/day -6 day 5/day 1 day 10/day -6
0.95 (0.83-1.09) 1.69 (1.47-1.94)a1.77 (1.54-2.04)a 1.65 (1.44-1.88)a
0.97 (0.78-1.21) 1.16 (0.93-1.44) 1.19 (0.96-1.49) 1.13 (0.91-1.41)
0.93 (0.80-1.08) 1.33 (1.15-1.55)a1.44 (1.24-1.67)a1.26 (1.08-1.46)a
0.95 (0.79-1.14) 1.20 (1.00-1.44) 1.26 (1.05-1.52)a1.14 (0.94-1.38)
0.91 (0.73-1.14) 1.12 (0.89-1.40) 1.22 (0.98-1.53) 1.18 (0.94-1.49)
CYP2D6
α-OH-metoprolol/ metoprolol 4 hour concentration ratio
day 1/day -6 day 5/day -6 day 5/day 1 day 10/day -6
0.82 (0.70-0.96)a1.10 (0.94-1.29) 1.34 (1.14-1.58)a
1.15 (0.98-1.34)
0.83 (0.71-0.96)a0.95 (0.81-1.10) 1.14 (0.99-1.33) 0.93 (0.80-1.08)
0.89 (0.75-1.05) 1.02 (0.86-1.21) 1.15 (0.97-1.37) 0.98 (0.83-1.17)
0.90 (0.76-1.05) 0.97 (0.82-1.13) 1.08 (0.92-1.27) 0.92 (0.78-1.09)
0.90 (0.79-1.04) 1.02 (0.89-1.18) 1.13 (0.99-1.30) 1.07 (0.93-1.24)
CYP2E1 6-OH-chlorzoxazone/ chlorzoxazone 4 hour concentration ratio
day 1/day -6 day 5/day -6 day 5/day 1 day 10/day -6
0.68 (0.54-0.86)a
0.74 (0.58-0.94)a
1.08 (0.85-1.38) 0.90 (0.71-1.14)
0.93 (0.66-1.31) 1.00 (0.70-1.41) 1.07 (0.76-1.52) 0.83 (0.59-1.17)
1.13 (0.84-1.51) 0.99 (0.74-1.32) 0.88 (0.66-1.17) 1.05 (0.78-1.42)
1.06 (0.85-1.33) 1.08 (0.86-1.35) 1.02 (0.81-1.28) 1.07 (0.85-1.35)
0.96 (0.73-1.26) 1.09 (0.83-1.43) 1.13 (0.86-1.48) 1.03 (0.79-1.36)
CYP3A
1-OH-midazolam/ midazolam 4 hour concentration ratio
day 1/day -6 day 5/day -6 day 5/day 1 day 10/day -6
1.60 (1.26-2.02)a2.66 (2.10-3.36)a1.67 (1.31-2.12)a
1.25 (0.99-1.58)
1.11 (0.94-1.30) 1.25 (1.06-1.47)a 1.13 (0.96-1.33) 1.16 (0.98-1.36)
0.97 (0.79-1.20) 1.16 (0.94-1.43) 1.19 (0.97-1.47) 1.12 (0.90-1.38)
1.22 (0.90-1.65) 1.54 (1.14-2.09)a1.27 (0.93-1.72) 1.15 (0.84-1.57)
1.17 (0.94-1.47) 1.25 (1.00-1.56 1.06 (0.85-1.33) 1.26 (1.01-1.57)a
ap<0.0125 (α adjusted for multiple testing), b Quotients >1 indicate increased enzyme activity, quotients < 1 indicate decreased enzyme activity
36
Cytochrome P450 enzymes affected by artemisinin antimalarials
The marker for CYP2E1 activity was not affected by the antimalarials, except for in the artemisinin group where a decrease in the 4 hour 6-OH-chlorzoxazone/chlorzoxazone plasma concentration ratio was seen day 1 compared to day -6 and day 5 compared to day -6, respectively. No indication of induction or inhibition of CYP2A6 was observed by the artemisinin antimalarials. The amount of 7-OH-coumarin excreted in urine 0-8 hours after coumarin intake was not significantly changed in any group. Coumarin has been widely used as a probe for estimation of CYP2A6 activity. Assessing the total amount of 7-OH-coumarin excreted in urine has usually been the metric of choice. However, coumarin is a highly extracted drug with a systemic bioavailability of only 4% and the major metabolite, 7-OH-coumarin, is excreted to 95% as the glucuronide in urine within 4 hours [136]. Therefore, the total amount of 7-OH-coumarin excreted within 8 hours after dose would probably not reflect a possible induction of CYP2A6 by artemisinin or its derivatives, and hence coumarin not an ideal probe to study enzyme induction. It would have been preferable if the subjects abstained from smoking during the study since it is known that smoking induces and inhibits the activity of CYP1A2 and CYP2A6, respectively [137, 138]. In a cultural setting where most men are smokers this was not possible. Low regular smoking, monitored by questioning, was therefore allowed. Since the data analysis was based on intraindividual changes and the daily number of cigarettes were monitored and kept constant, this approach was judged feasible. However, induction by the artemisinin antimalarials might not occur to the same extent in smokers as in non-smokers if the base-line level of CYP activities already is increased in these individuals. The randomization of subjects to different treatment groups were not stratified for gender, resulting in poorly matched number of females in the treatment groups. Some clinical studies have suggested that the level of CYP activities differs between men and women. On the other hand, gender does not appear to affect the induction of CYP enzymes in freshly cultured human hepatocytes [139]. The use of oral contraceptives might alter the base-line level of enzyme activity. In the present study, female participants were not specifically asked about their use of oral contraceptives. The basal level of enzyme activity might therefore be influenced by the different proportions of females/males in the treatment groups, but the induction or inhibition observed are probably not affected. In paper III, time-dependent pharmacokinetics of artemisinin was evident by a significant decrease in AUC0-∞ values after repeated administration of the drug in both the coumarin and nicotine period. No significant difference was observed in artemisinin pharmacokinetics whether it was co-administered with coumarin or with nicotine. Approximately 55% of the dose was excreted as 7-OH-coumarin or 7-OH-coumarin glucuronide when coumarin was given alone (day – 7/36). This value was 56% on the first (day 1/43) and 62% on the last (day 5/47) day of artemisinin intake (Table 5). The relative amount of the sum of 7-OH-coumarin and 7-OH-coumarin glucuronide excreted in urine has been reported to diminish
37
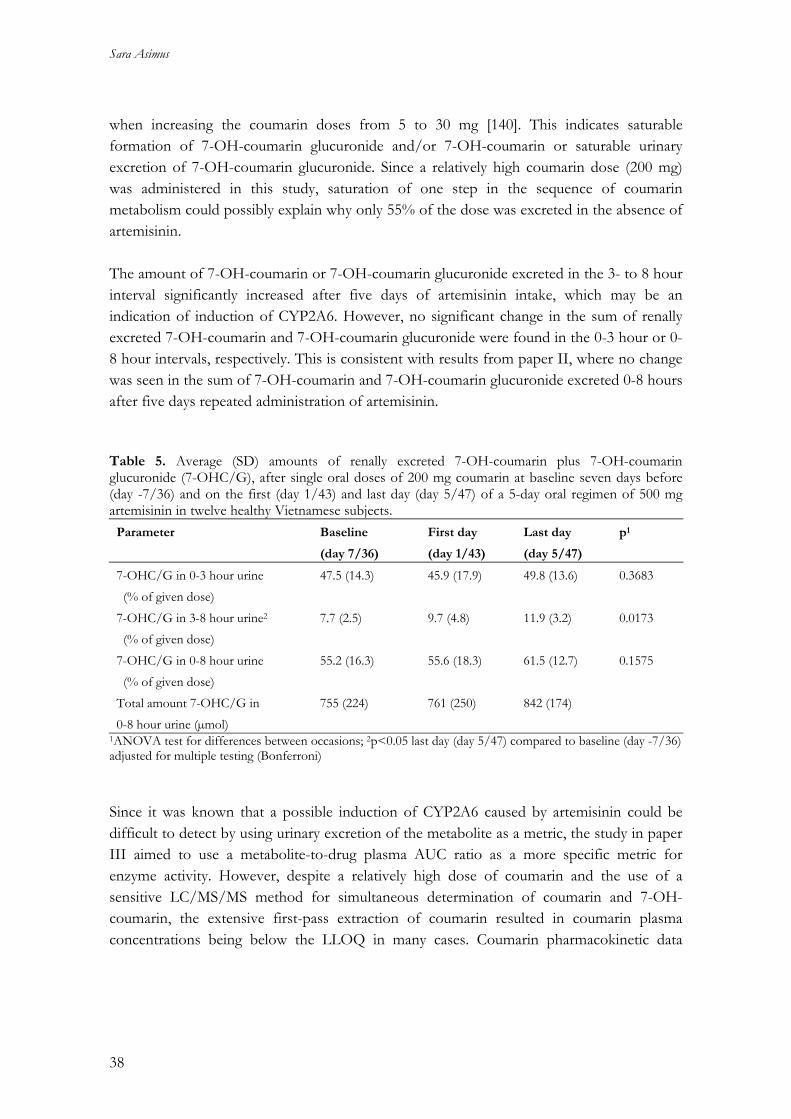
Sara Asimus
when increasing the coumarin doses from 5 to 30 mg [140]. This indicates saturable formation of 7-OH-coumarin glucuronide and/or 7-OH-coumarin or saturable urinary excretion of 7-OH-coumarin glucuronide. Since a relatively high coumarin dose (200 mg) was administered in this study, saturation of one step in the sequence of coumarin metabolism could possibly explain why only 55% of the dose was excreted in the absence of artemisinin. The amount of 7-OH-coumarin or 7-OH-coumarin glucuronide excreted in the 3- to 8 hour interval significantly increased after five days of artemisinin intake, which may be an indication of induction of CYP2A6. However, no significant change in the sum of renally excreted 7-OH-coumarin and 7-OH-coumarin glucuronide were found in the 0-3 hour or 0-8 hour intervals, respectively. This is consistent with results from paper II, where no change was seen in the sum of 7-OH-coumarin and 7-OH-coumarin glucuronide excreted 0-8 hours after five days repeated administration of artemisinin. Table 5. Average (SD) amounts of renally excreted 7-OH-coumarin plus 7-OH-coumarin glucuronide (7-OHC/G), after single oral doses of 200 mg coumarin at baseline seven days before (day -7/36) and on the first (day 1/43) and last day (day 5/47) of a 5-day oral regimen of 500 mg artemisinin in twelve healthy Vietnamese subjects.
Parameter Baseline
(day 7/36)
First day
(day 1/43)
Last day
(day 5/47)
p1
7-OHC/G in 0-3 hour urine (% of given dose)
47.5 (14.3) 45.9 (17.9) 49.8 (13.6) 0.3683
7-OHC/G in 3-8 hour urine2
(% of given dose) 7.7 (2.5) 9.7 (4.8) 11.9 (3.2) 0.0173
7-OHC/G in 0-8 hour urine (% of given dose)
55.2 (16.3) 55.6 (18.3) 61.5 (12.7) 0.1575
Total amount 7-OHC/G in 0-8 hour urine (µmol)
755 (224) 761 (250) 842 (174)
1ANOVA test for differences between occasions; 2p<0.05 last day (day 5/47) compared to baseline (day -7/36) adjusted for multiple testing (Bonferroni) Since it was known that a possible induction of CYP2A6 caused by artemisinin could be difficult to detect by using urinary excretion of the metabolite as a metric, the study in paper III aimed to use a metabolite-to-drug plasma AUC ratio as a more specific metric for enzyme activity. However, despite a relatively high dose of coumarin and the use of a sensitive LC/MS/MS method for simultaneous determination of coumarin and 7-OH-coumarin, the extensive first-pass extraction of coumarin resulted in coumarin plasma concentrations being below the LLOQ in many cases. Coumarin pharmacokinetic data
38

Cytochrome P450 enzymes affected by artemisinin antimalarials
could therefore not be obtained and a 7-OH-coumarin - to - coumarin AUC ratio could not be calculated as an index for CYP2A6 activity. In all subjects, five days repeated administration of artemisinin (day 5/47) significantly increased 7-OH-coumarin glucuronide values and the 7-OH-coumarin - to - 7-OH-coumarin glucuronide AUC ratio compared to base-line (day -6/36) (Figure 5, Table 6), suggesting artemisinin to be an inducer of glucuronidation. UGT2B15 has been reported to be involved in the glucuronidation of coumarin, but whether artemisinin and its derivatives are capable of increasing the activity of other UGT isoforms remains to be shown. Induction of UGTs may imply a risk of drug-drug interactions between ACTs and antiretroviral drugs that are eliminated by glucuronidation.
0
100
200
300
400
500
600
700
800
7-O
HCG
/7-O
HC A
UC r
atio
-7/36 1/43 5/47 day Figure 5. 7-OH-coumarin glucuronide (7-OHCG)/7-OH-coumarin (7-OHC) AUC0-∞ values in twelve healthy Vietnamese subjects after intake of 200 mg coumarin at baseline seven days before (day -7/36), and on the first day (day 1/43) and following 5 days repeated administration of 500 mg artemisinin once daily (day 5/47). An increased formation of 7-OH-coumarin glucuronide could be an alternative explanation to the increased renal excretion of 7-OH-coumarin and its glucuronide in one of two intervals of urine collection. However, since most of the 7-OH-coumarin formed is further metabolized to the glucuronide before excretion into urine [141], a large increase in the amount 7-OH-coumarin glucuronide formed seems unlikely. Therefore, induction of CYP2A6 could be one explanation to the increased in renally excreted 7-OH-coumarin and 7-OH-coumarin glucuronide. These results highlight the difficulties in interpreting the outcome when using coumarin as a probe compound, in particular if both 7-OH-coumarin and its glucuronide are influenced by the studied drug.
39
Sara Asimus
Both nicotine and cotinine AUC0-11hr values significantly decreased after 5 days of artemisinin intake (day 5/47) compared to base-line (day -7/36). There was no significant change in the 2 and 4 hour cotinine/nicotine plasma concentration ratio or the cotinine/nicotine AUC0-11hr ratio after five days repeated administration of artemisinin (Table 6). The subjects included in the study were supposed to be non-smokers and smoking was not allowed during the study. Despite this, both nicotine and cotinine were found in the pre-dose samples from most subjects and increasing concentrations of both compounds detected in samples taken 24, 48 and 72 hours after supervised intake of nicotine, suggesting that subjects had been exposed to cigarette smoke during the study. However, provided that nicotine and cotinine follow linear kinetics, an induction of the formation of cotinine from nicotine by artemisinin would result in an increased metabolite-to-parent drug ratio, regardless if the subjects had varying nicotine intake during the study. The reduction of cotinine and nicotine AUC0-11hr values after repeated administration of artemisinin suggest an induction of CYP2A6 since the enzyme is involved in the metabolism of both compounds. This also implies that any cotinine - to - nicotine ratio would be an unreliable metric for CYP2A6 activity. Table 6. 7-OH-coumarin (7-OHC), 7-OH-coumarin glucuronide (7-OHCG), nicotine and cotinine AUC values for after a single oral dose of 200 mg coumarin and chewing a 4 mg nicotine gum, respectively, in twelve healthy Vietnamese subjects at baseline seven days before (day -7/36), on the first day (day 1/43) and following five days of once daily repeated administration of 500 mg artemisinin (day 5/47).
Parameter Baseline
(day -7/36)
First day
(day 1/43)
Last day
(day 5/47)
p1
7-OHC AUC0-∞
(h*µmol/L) 0.281 (0.204-0.389)
0.298 (0.218-0.408)
0.206 (0.152-0.279)
0.0452
7-OHCG AUC0-∞2
(h*µmol/L) 54.7 (41.9-71.4)
58.5 (43.5-78.6)
68.7
(58.9-80.1)
0.0054
7-OHCG/7-OHC2, 3 AUC0-∞ ratio
222 (118)
238 (127) 375 (176) 0.0018
Nicotine AUC0-11hr2, 3
(h*µmol/L) 0.547 (0.292-1.02)
0.450 (0.209-0.970)
0.293 (0.131-0.653)
0.0005
Cotinine AUC0-11hr2
(h*µmol/L) 10.6 (5.91-19.1)
9.55 (4.79-19.0)
9.72 (6.74-14.0)
0.0212
Cotinine/nicotine AUC0-11hr ratio
22.4 (11.5) 26.2 (16.9) 26.4 (9.02) 0.2470
Data are presented as geometric mean and 95% CI, except for AUC ratios which are presented as mean and standard deviation. 1ANOVA test for differences between occasions; 2p<0.05 last day (day 5/47) compared to baseline (day -7/36) adjusted for multiple testing (Bonferroni); 3p<0.05 last day (day 5/47) compared to the first day (day 1/43) adjusted for multiple testing (Bonferroni)
40
Cytochrome P450 enzymes affected by artemisinin antimalarials
The in vitro metabolism of artemisinin is primarily mediated by CYP2B6, with a secondary contribution of CYP2A6 and CYP3A4 [22]. CYP2B6 has been reported to partly explain the time-dependent pharmacokinetics of artemisinin [16]. The extent of CYP2A6 contribution to the auto-induction of artemisinin could not clearly be demonstrated with the present results. Neither coumarin nor nicotine was an optimal probe compound for studying CYP2A6 induction using applied metrics. Problems in assay sensitivity, metrics and/or complexity of metabolic pathways of both compounds limit their use as markers for CYP2A6 induction. Also, smoking has been reported to reduce CYP2A6 activity [138], which may further confound the interpretation of results.
Pharmacogenetics of principal CYP enzymes in healthy Vietnamese volunteers (paper IV) The allele frequencies in the studied Vietnamese subjects generally follow the trends of other Asian populations (Table 7). Some significant differences were observed. CYP2A6*4 was more frequent compared with in a Chinese population and CYP2A6*5 was several-fold more frequent compared with all other Asian populations studied. Interestingly, CYP2B6*6 was about 2-fold more common in Vietnamese subjects compared with Korean and Japanese subjects. This observation follows recent investigations showing an unusual allele prevalence of N-acetyltransferase 2 (NAT2) in the studied Vietnamese subjects [142]. The SNP (516G>T) present in CYP2B6*6 has been associated to higher plasma exposure of efavirenz leading to central nervous system effects [143]. The relatively high observed frequency of this allele indicates that about 10% of AIDS patients in Vietnam may be at risk of having elevated exposure to efavirenz. Two SNPs (CYP2D6 100C>T and MDR1 3435C>T) were found to not be in Hardy-Weinberg equilibrium. Their frequencies were not significantly different from the observed in other Asian populations as presented in Table 7. Since the subjects were unrelated and the study was conducted in a large and highly populated city (Hanoi), a possible explanation to this observation could be a reflection of a certain degree of ethnic admixture. The relationship between genotype and pharmacokinetic metrics of CYP2A6, CYP2C19, CYP2D6 and CYP3A activities, respectively is presented in Figure 6. The subjects were ranked according to their metabolic capacity of each enzyme and depicted as per descending pharmacokinetic metric against a background of the distribution of CYP genotype. It should be noted that the available pharmacokinetic metrics may not represent best practice when relating to genotype, but is presented to illustrate how they vary with genotype in the studied group of Vietnamese subjects. CYP2D6 genotypes were associated with the α-OH-metoprolol/metoprolol 4 hour plasma concentration ratio (p<0.001). However, some individuals heterozygous for the CYP2D6*10 allele exhibited similar metabolic ratios as subjects with homozygous wild-type genotype.
41
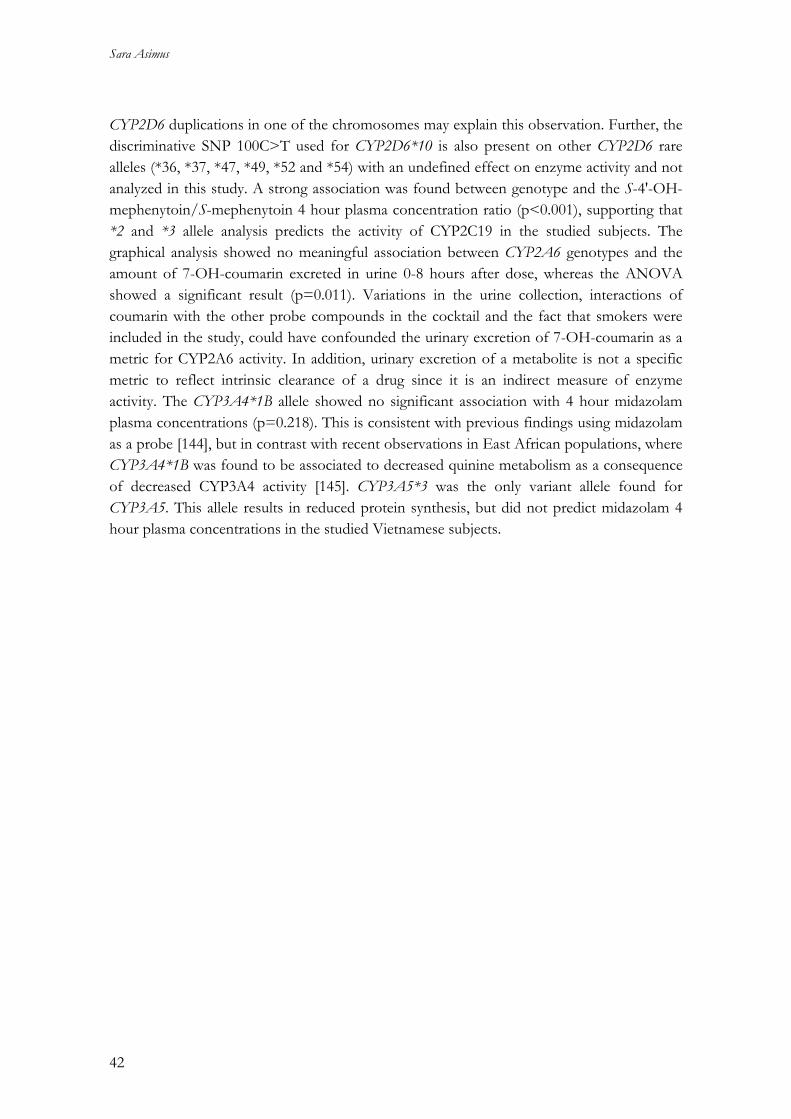
Sara Asimus
CYP2D6 duplications in one of the chromosomes may explain this observation. Further, the discriminative SNP 100C>T used for CYP2D6*10 is also present on other CYP2D6 rare alleles (*36, *37, *47, *49, *52 and *54) with an undefined effect on enzyme activity and not analyzed in this study. A strong association was found between genotype and the S-4'-OH-mephenytoin/S-mephenytoin 4 hour plasma concentration ratio (p<0.001), supporting that *2 and *3 allele analysis predicts the activity of CYP2C19 in the studied subjects. The graphical analysis showed no meaningful association between CYP2A6 genotypes and the amount of 7-OH-coumarin excreted in urine 0-8 hours after dose, whereas the ANOVA showed a significant result (p=0.011). Variations in the urine collection, interactions of coumarin with the other probe compounds in the cocktail and the fact that smokers were included in the study, could have confounded the urinary excretion of 7-OH-coumarin as a metric for CYP2A6 activity. In addition, urinary excretion of a metabolite is not a specific metric to reflect intrinsic clearance of a drug since it is an indirect measure of enzyme activity. The CYP3A4*1B allele showed no significant association with 4 hour midazolam plasma concentrations (p=0.218). This is consistent with previous findings using midazolam as a probe [144], but in contrast with recent observations in East African populations, where CYP3A4*1B was found to be associated to decreased quinine metabolism as a consequence of decreased CYP3A4 activity [145]. CYP3A5*3 was the only variant allele found for CYP3A5. This allele results in reduced protein synthesis, but did not predict midazolam 4 hour plasma concentrations in the studied Vietnamese subjects.
42
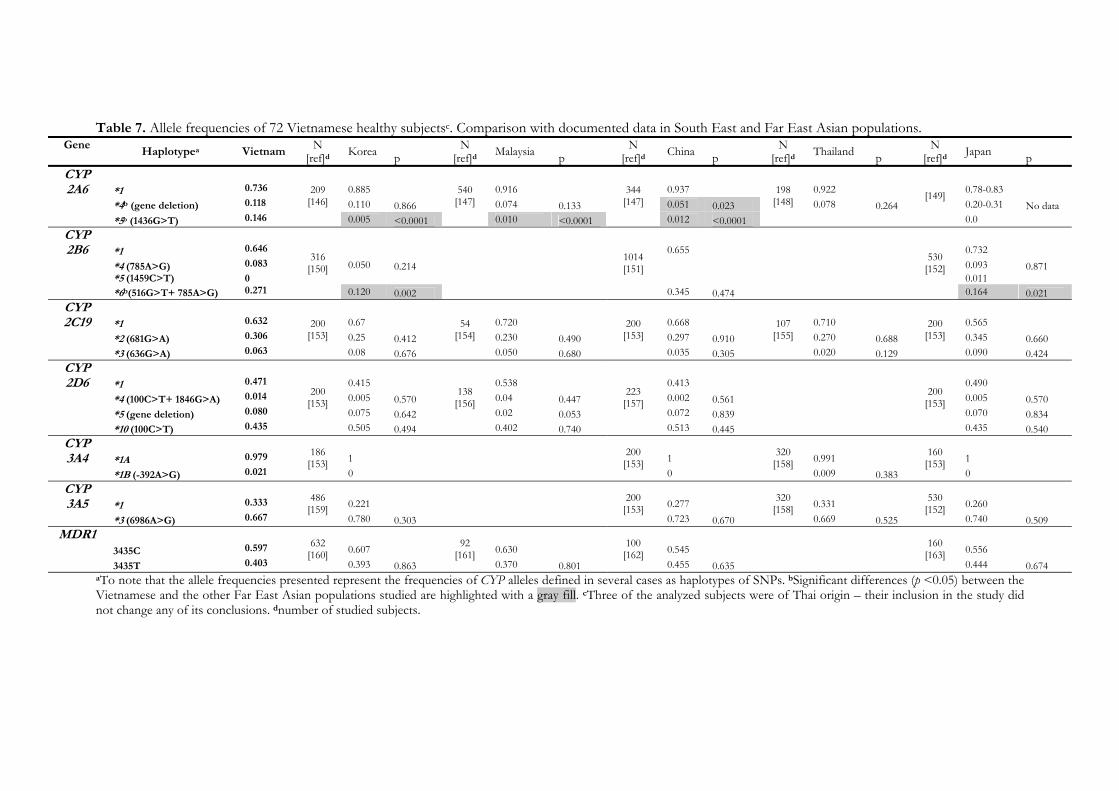
Table 7. Allele frequencies of 72 Vietnamese healthy subjectsc. Comparison with documented data in South East and Far East Asian populations. Gene
Haplotypea Vietnam N
[ref]d Korea p N
[ref]d Malaysia p N
[ref]d China p N
[ref]d Thailand p N
[ref]d Japan p CYP 2A6 *1 0.736 0.885 0.916 0.937 0.922 0.78-0.83
*4b (gene deletion) 0.118 0.110 0.866 0.074 0.133 0.051 0.023 0.078 0.264 0.20-0.31 No data *5b (1436G>T) 0.146
209 [146]
0.005 <0.0001
540 [147]
0.010 <0.0001
344 [147]
0.012 <0.0001
198 [148]
[149]
0.0 CYP 2B6 *1 0.646 0.655 0.732
*4 (785A>G) 0.083 0.050 0.214 0.093 0.871 *5 (1459C>T) 0 0.011
*6b(516G>T+ 785A>G) 0.271
316 [150]
0.120 0.002
1014 [151]
0.345 0.474
530 [152]
0.164 0.021 CYP 2C19 *1 0.632 0.67 0.720 0.668 0.710 0.565
*2 (681G>A) 0.306 0.25 0.412 0.230 0.490 0.297 0.910 0.270 0.688 0.345 0.660 *3 (636G>A) 0.063
200 [153]
0.08 0.676
54 [154]
0.050 0.680
200 [153]
0.035 0.305
107 [155]
0.020 0.129
200 [153]
0.090 0.424 CYP 2D6 *1 0.471 0.415 0.538 0.413 0.490
*4 (100C>T+ 1846G>A) 0.014 0.005 0.570 0.04 0.447 0.002 0.561 0.005 0.570 *5 (gene deletion) 0.080 0.075 0.642 0.02 0.053 0.072 0.839 0.070 0.834 *10 (100C>T) 0.435
200 [153]
0.505 0.494
138 [156]
0.402 0.740
223 [157]
0.513 0.445
200 [153]
0.435 0.540 CYP 3A4 *1A 0.979 1 1 0.991 1
*1B (-392A>G) 0.021
186 [153]
0
200 [153]
0
320 [158]
0.009 0.383
160 [153]
0 CYP 3A5 *1 0.333 0.221 0.277 0.331 0.260
*3 (6986A>G) 0.667
486 [159]
0.780 0.303
200 [153]
0.723 0.670
320 [158]
0.669 0.525
530 [152]
0.740 0.509 MDR1
3435C 0.597 0.607 0.630 0.545 0.556 3435T 0.403
632 [160]
0.393 0.863
92 [161]
0.370 0.801
100 [162]
0.455 0.635
160 [163]
0.444 0.674 aTo note that the allele frequencies presented represent the frequencies of CYP alleles defined in several cases as haplotypes of SNPs. bSignificant differences (p <0.05) between the Vietnamese and the other Far East Asian populations studied are highlighted with a gray fill. cThree of the analyzed subjects were of Thai origin – their inclusion in the study did not change any of its conclusions. dnumber of studied subjects.
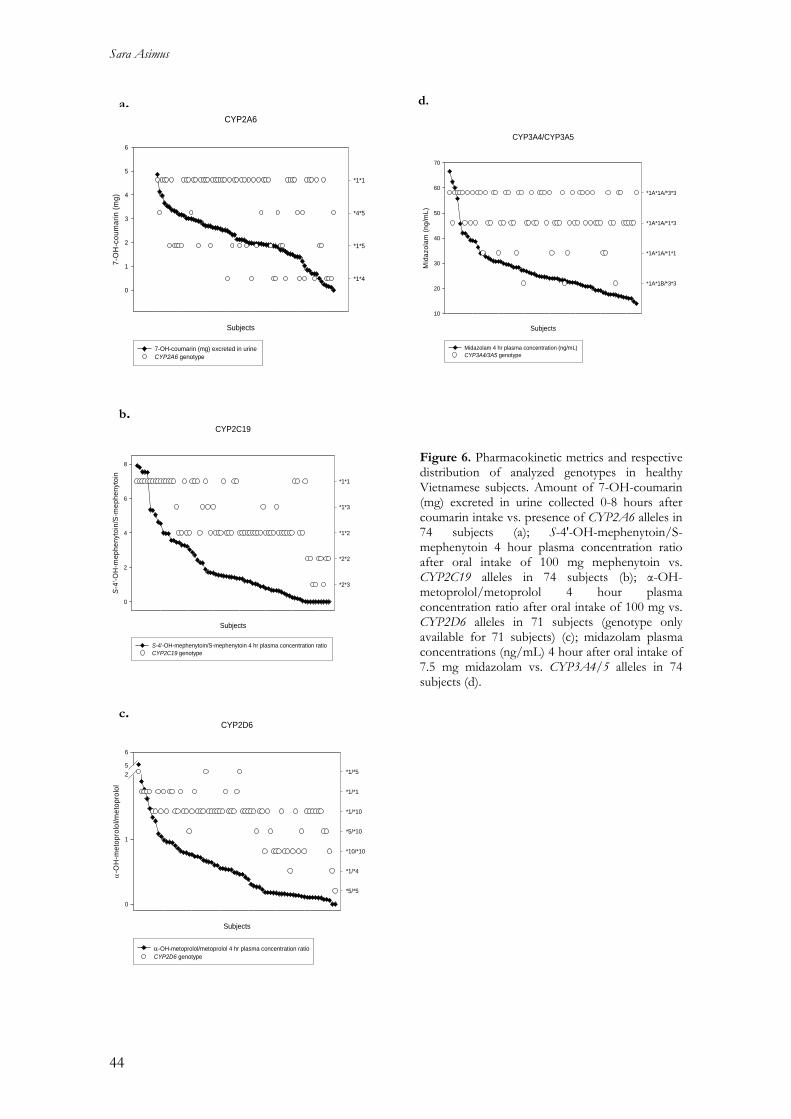
Sara Asimus
CYP2A6
Subjects
7-O
H-c
oum
arin
(mg)
0
1
2
3
4
5
6
*1*1
*4*5
*1*5
*1*4
7-OH-coumarin (mg) excreted in urine CYP2A6 genotype
CYP2C19
Subjects
S-4'
-OH
-mep
heny
toin
/S-m
ephe
nyto
in
0
2
4
6
8
*1*1
*1*3
*1*2
*2*2
*2*3
S-4'-OH-mephenytoin/S-mephenytoin 4 hr plasma concentration ratio CYP2C19 genotype
CYP2D6
Subjects
α-O
H-m
etop
rolo
l/met
opro
lol
0
1
25
6
*1/*5
*1/*1
*1/*10
*5/*10
*10/*10
*1/*4
*5/*5
α-OH-metoprolol/metoprolol 4 hr plasma concentration ratioCYP2D6 genotype
a. d.
CYP3A4/CYP3A5
Subjects
Mid
azol
am (n
g/m
L)
10
20
30
40
50
60
70
*1A*1A/*3*3
*1A*1A/*1*3
*1A*1A/*1*1
*1A*1B/*3*3
Midazolam 4 hr plasma concentration (ng/mL) CYP3A4/3A5 genotype
b. Figure 6. Pharmacokinetic metrics and respective distribution of analyzed genotypes in healthy Vietnamese subjects. Amount of 7-OH-coumarin (mg) excreted in urine collected 0-8 hours after coumarin intake vs. presence of CYP2A6 alleles in 74 subjects (a); S-4'-OH-mephenytoin/S-mephenytoin 4 hour plasma concentration ratio after oral intake of 100 mg mephenytoin vs. CYP2C19 alleles in 74 subjects (b); α-OH-metoprolol/metoprolol 4 hour plasma concentration ratio after oral intake of 100 mg vs. CYP2D6 alleles in 71 subjects (genotype only available for 71 subjects) (c); midazolam plasma concentrations (ng/mL) 4 hour after oral intake of 7.5 mg midazolam vs. CYP3A4/5 alleles in 74 subjects (d).
c.
44

Cytochrome P450 enzymes affected by artemisinin antimalarials
Artemisinin as a putative CYP2B6 probe (paper V) Artemisinin and propofol concentration-time data, obtained from incubations with human liver microsomes from different donors, were described by a first order depletion model. For bupropion and efavirenz the formation of their respective major metabolite could be followed with time wherefore metabolite data was incorporated in the model. Estimated metabolic rate constants for each substrate varied considerably in microsomes from different donors. Values for volumes of distribution were estimated to be almost equal to the experimental incubation volume of 1 mL. For efavirenz, concentrations of the metabolite were in many cases below the LLOQ. For that reason the response from the UV detector measured as peak areas of efavirenz and 8-OH-efavirenz were used as substitutes for concentrations in the non-linear regression. Efavirenz concentrations at time zero were in many cases lower than in samples taken at 10 min, possibly explained by dissolution not being instantaneous. Efavirenz values at time zero where therefore excluded in the final data analysis. The rate constants of artemisinin depletion were well correlated to the metabolic rate constants for bupropion, propofol and efavirenz (r ≥ 0.88) Figure 7. These results reaffirm artemisinin to be principally metabolized by CYP2B6 and further suggest that the compound could be an alternative CYP2B6 probe substrate. Artemisinin has some properties that are favorable of a probe compound. An analytical method for its quantification in saliva samples is available, offering a non-invasive sampling method [125]. The compound is reported to be a safe and well-tolerated drug with few adverse effects reported [164]. The short half-life of artemisinin makes it possible to obtain pharmacokinetic parameters such as AUC with a limited number of samples over a short duration of time. The potential use of artemisinin as an in vivo probe drug is also associated with several drawbacks. There are today no registered artemisinin products, even though the compound has been extensively used in the treatment of malaria. The pronounced capacity for auto-induction implies that any use of artemisinin as a probe drug should be restricted to single dose administration. Further, artemisinin has also been reported to induce the metabolism of other drugs [11, 16]. Due to the risk of drug–drug interactions it would therefore not be recommended to use artemisinin in combined phenotyping, such as the cocktail approach, which involves the administration of a number of probe compounds simultaneously.
45
Sara Asimus
0
0.2
0.4
0.6
0.8
1
1.2
1.4
0 1 2 3
propofol depletion rate constant, kd (h-1)
arte
mis
inin
dep
letio
n ra
te c
onst
ant,
k d (h-1
)
4
0
0.2
0.4
0.6
0.8
1
1.2
1.4
0 0.2 0.4 0.6 0.8 1
bupropion depletion rate constant, kd (h-1)
arte
mis
inin
dep
letio
n ra
te c
onst
ant,
k d (h-1
)
0
0.2
0.4
0.6
0.8
1
1.2
1.4
0 0.1 0.2 0.3 0.4 0.5 0.6 0.7
hydroxybupropion formation rate constant, kf (h-1)
arte
mis
inin
dep
letio
n ra
te c
onst
ant,
k d (h-1
)
0
0.2
0.4
0.6
0.8
1
1.2
1.4
0 0.05 0.1 0.15 0.2 0.25 0.3
efavirenz depletion rate constant, kd (h-1)
arte
mis
inin
dep
letio
n ra
te c
onst
ant,
k d (h
-1)
a. d.
r = 0.88 r = 0.95
b. e.
0
0.2
0.4
0.6
0.8
1
1.2
1.4
0 0.05 0.1 0.15 0.2
8-hydroxyefavirenz formation rate constant, kf (h-1)
arte
mis
inin
dep
letio
n ra
te c
onst
ant,
k d (h-1
)
r = 0.94 r = 0.97
c. Figure 7. Correlations of the rate constant of artemisinin depletion with that of propofol depletion (a), bupropion depletion (b), hydroxybupropion formation (c), efavirenz depletion (d) and 8-hydroxyefavirenz formation (e) in human liver microsomes from 12 donors (duplicate incubations). Initial concentrations were 10 µM for artemisinin and efavirenz and 20 µM for bupropion and propofol, respectively. Also shown is the Pearson’s correlation coefficient (r).
r = 0.95
46
Cytochrome P450 enzymes affected by artemisinin antimalarials
CONCLUSIONS The artemisinin antimalarials have become the most important new class of antimalarials since half a century. The parent compound, artemisinin, is associated with time-dependent pharmacokinetics, caused by autoinduction of drug metabolism, and an ability to induce the metabolism of other drugs. A better understanding of the pharmacokinetics and drug metabolism of artemisinin antimalarials is essential to elucidate their potential for drug-drug interactions, especially since they are recommended to be used in combination with other drugs. Also, to a large extent antimalarial treatment is taking place against a backdrop of concurrent TB/HIV-treatments. The time-dependent pharmacokinetics of artemisinin in both healthy subjects and malaria patients can be described by a previously developed semi-physiological autoinduction model. With this model, conditions other than enzyme induction, such as enzyme inhibition and changes in plasma protein binding, can be described. The model can thus be of value when studying the changes in the pharmacokinetics of drug combinations by illustrating the effect of an inducer/inhibitor on the elimination of a second drug. A cocktail of six probe drugs was used to investigate the potential induction and inhibition of principal CYP enzymes by the artemisinin drugs in healthy subjects. Changes in the applied metrics were shown, indicating that several of the investigated enzymes were affected by artemisinin, dihydroartemisinin, artemether, arteether and artesunate. The observed changes in individual metrics were not significant in all treatment groups but pointed in the same direction for the five artemisinin drugs studied in many cases, suggesting a class effect. At therapeutic doses, artemisinin appeared to be associated with the strongest capacity for induction and inhibition. The most suitable artemisinin drug to be used in combination treatment, with respect to drug-drug interactions, could not be selected based on the present results. The observed metabolic changes were moderate but could be of clinical importance for some individuals in the population and needs to be taken into account in the development of new derivatives and drug combinations for malaria treatment. Induction of CYP2A6 was of particular interest since this enzymes has been shown to be involved in the in vitro metabolism of artemisinin. Coumarin and nicotine were used as probe drugs for CYP2A6. The results show that artemisinin might be able to induce CYP2A6, but to what extent could not be demonstrated since both coumarin and nicotine were associated with limitations using the applied metrics. Artemisinin appears to be an inducer of also glucuronidation, an effect that needs to be further investigated and evaluated for the other artemisinin derivatives as well. These results illustrate the difficulties of studying CYP2A6 induction in a population where most men are smokers using available probe drugs.
47
Sara Asimus
Pharmacogenetic data of genes coding for principal CYP enzymes involved in the metabolism of antimalarial drugs were obtained in 78 healthy Vietnamese subjects. The frequencies of the main SNPs of CYP2A6, CYPB6, CYPC19, CYP2D6, CYP3A and MDR1 were in general agreement with other Asian populations, with some significant different trends. Genotypes of CYP2C19 and CYP2D6 were associated to available metrics for enzyme activity, whereas no relationship was found between CYP2A6 and CYP3A genotypes and the pharmacokinetic metrics used. Artemisinin has been shown to primarily be metabolized by CYP2B6 in vitro. Investigations of this enzyme have until recently been limited due to lack of selective probe substrates. The in vitro metabolism of artemisinin appears to be well correlated to that of the recommended CYP2B6 probe bupropion, suggesting artemisinin to be an alternative marker to assess CYP2B6 activity. However, further studies are needed in order to characterize the metabolic fate of artemisinin and its potential use as an in vitro and in vivo CYP2B6 probe compound. Overall, this thesis contributes with pharmacokinetic and metabolic information on the artemisinin antimalarials, useful in the development of new artemisinin derivatives and possible combination treatments. The potential of these drugs to affect CYP enzymes has to be considered in order to reduce the risk of drug-drug interactions and achieve optimal future treatments of malaria.
48
Cytochrome P450 enzymes affected by artemisinin antimalarials
SWEDISH SUMMARY Malaria är ett av de största hälsoproblemen i världen idag. Miljontals människor insjuknar och över en miljon, framför allt barn, dör i malaria varje år, huvudsakligen till följd av begränsad tillgång på effektiva läkemedel. Ett av de största hoten mot malariabehandling är en allt snabbare spridning av läkemedelsresistenta parasitstammar, vilket medför ett betydande behov av nya verksamma läkemedel. Artemisinin och dess derivat är en grupp läkemedel som har visat sig vara mycket effektiva och förenade med få biverkningar. Hög återfallsfrekvens av malaria är ett problem som har visats i kliniska studier där artemisinin och dess derivat har givits som monoterapi. För att minska återfallsfrekvensen och förhindra uppkomsten av resistens mot dessa preparat är rekommendationen att de skall ges i kombination med ett mer långverkande antimalarialäkemedel. Artemisinins omsättning i kroppen (farmakokinetik) är tidsberoende till följd av att substansen kraftigt kan öka sin egen nedbrytning i levern (metabolism) efter upprepad administrering. Förutom denna förmåga till autoinduktion av läkemedelsmetabolism kan artemisinin också påverka andra substansers metabolism via en grupp enzymer i levern som kallas cytokrom P450 (CYP). Med en ökande användning av artemisinin och dess derivat i kombinationsterapi är det därför viktigt att känna till vilka CYP enzym som kan påverkas och hur de olika derivaten skiljer sig åt i förmåga att inducera och inhibera. Det övergripande målet med denna avhandling var att öka kunskapen om artemisinins farmakokinetik och metabolism och därmed bidra till en mer effektiv och säker kombinationsbehandling av malaria. Avhandlingen sammanfattar resultaten från fem delarbeten. Det första arbetet visar att en farmakokinetisk modell kan beskriva artemisinins autoinduktion hos både friska försökspersoner och malariapatienter. Samma modell skulle också kunna användas för att beskriva farmakokinetiska förändringar vid kombinationsbehandling till följd av enzyminduktion eller enzymhämning. Resultat från det andra arbetet visar att artemisinin och dess kliniskt använda derivat kan påverka aktiviteten av ett antal huvudsakliga CYP enzym hos friska försökspersoner. Resultaten tyder på att effekten på enzymaktivitet delas av de fem undersökta läkemedlen, vilket indikerar en klasseffekt. En sådan klasseffekt är viktig att ha i åtanke när nya artemisininderivat och läkemedelskombinationer för behandling av malaria utvecklas. I det tredje arbetet undersöktes artemisinins förmåga att påverka aktiviteten av CYP2A6 hos friska försökspersoner, med hjälp av två olika modellsubstanser för detta enzym. Resultatet antyder att artemisinin inducerar CYP2A6, men i vilken utsträckning gick inte att fastställa i den här studien. Däremot visar resultaten på svårigheter med att studera induktion av CYP2A6 med de modellsubstanser som finns tillgängliga.
49
Sara Asimus
Det fjärde arbetet beskriver genetisk variation av de enzym som studerades hos friska vietnamesiska försökspersoner i arbete två och tre. Förutom några signifikanta skillnader, som kan ha betydelse för läkemedelsmetabolism hos vissa individer, visar resultaten att den genetiska variationen av de undersökta enzymen hos vietnameser stämmer överens med vad som rapporterats i övriga asiatiska befolkningar och som kan ha inverkan vid behandling exempelvis malaria, tuberkulos och HIV/AIDS. Resultat från det femte och sista arbetet föreslår att artemisinin kan användas som en alternativ modellsubstans för att undersöka aktiviteten av CYP2B6, ett specifikt och ännu relativt outforskat CYP enzym. Ytterligare studier är dock nödvändiga för att vidare utreda hur lämplig artemisinin är som en sådan modellsubstans. Sammanfattningsvis bidrar denna avhandling med information som ger ökad kunskap om artemisinin och dess derivats farmakokinetik och metabolism, som kan vara till nytta vid utveckling av nya läkemedel och kombinationer för malariabehandling. Dessa substansers förmåga att påverka läkemedelsmetabolism är viktig att känna till för att förhindra interaktioner mellan läkemedel och uppnå en optimal behandling av malaria.
50
Cytochrome P450 enzymes affected by artemisinin antimalarials
ACKNOWLEDGEMENTS This work was performed at the Unit for Pharmacokinetics and Drug Metabolism, Department of Pharmacology, Institute of Neuroscience and Physiology, Sahlgrenska Academy at University of Gothenburg. I am sincerely grateful to many wonderful people that have made this thesis possible and would like to express my gratitude and appreciation to the following persons: My supervisor, Michael Ashton, for guiding me in the interesting field of pharmacokinetics and drug metabolism, for generously sharing your vast scientific knowledge and for all good advice and inspiration you have given me over the years. To all past and present members in the PKDM group, especially, Sofia Friberg Hietala, Joel Tärning, Rasmus Jansson, Daniel Röshammar, Sofia Sandberg and Carl Johansson , for being the best of colleagues and for contributing to a friendly and creative working environment. I have really enjoyed sharing the daily work with such a fantastic team of talented and fun people. Thanks for taking time reading this thesis and for all your valuable comments on my work. Thank you also for nice company on various travels, conferences and courses. Special thanks to Sofia F-H, my roommate, for great company and for help with many excellent sentences. I have really appreciated our discussions, regarding science and everything else. You have become a dear friend! I am forever thankful to all my co-authors, for contributing with your expertise and knowledge to different parts of this work. Ulrika Simonsson, for always being positive and enthusiastic, your contribution to the cocktail work has been very valuable. Doaa Elsherbiny, for the great effort you have laid down in the cocktail work, especially during the intensive sample analysis. It was a pleasure to get to know you and to share this work with you, which became much easier and more fun thanks to you! Britt Jansson, for outstanding analytical method development in the cocktail work and for always being helpful in the lab. To work with you has been very pleasant and I learnt a lot! Toufigh Gordi, for involving me in your work and giving me the opportunity to learn more about NONMEM, for your willingness to answer my questions, I have enjoyed working with you. Trinh Ngoc Hai and colleagues at NIMPE, Hanoi, for your hard work with the clinical studies and for friendly welcoming me during my stay in Hanoi. To all healthy volunteers, participating in the studies at NIMPE, for your co-operation. Pedro Gil, Isabel Veiga and Pedro Ferreira for your hard and patient work with the pharmacogenetics manuscript and for inspiring and guiding me when it comes to genotyping.
51
Sara Asimus
Max Petzold, for wonderful help with the statistic parts of this thesis. Thanks for always being positive and for taking time trying to explain things. Niklas Nilsson, Anna Andersson, Martin Zachariasson, Sara Måhlberg and Sabarinath Sreedharan Nair are acknowledged for your valuable contribution to various projects in this thesis. All past and present colleagues at the Department of Pharmacology, I will remember you all with joy! Special thanks to Mariann Nyqvist, for always being helpful and for all practical things you have taken care of regarding the students and to Annalena Carlred for help with financial and practical issues . To all my fantastic friends outside work, for great times and much joy! Special thanks to Sofia and Daniel Wadskog for great hospitality and nice company during my stay in Uppsala. Thanks to you these weeks were not only associated with work. Wolfgang and Irene, for your generosity and care. My parents, Gunnel and Gunnar, for all your love and continuous support. Thank you for always being there for me and for reminding me of what is important in life. My wise brother Martin with your dear family, for friendship, encouragement and interest in my work. My lovely sister Lisa, for never being far away thanks to Halebop! Ruth, my little sunshine, thank you for giving me thousands of reasons to smile every day! Finally, Per, thank you for sharing my life, for love and inspiration. You are just fantastic and your never-ending support means everything to me. I would never have done it this far without you, this thesis belongs to you! Parts of this work were supported by the Swedish International Development Cooperation Agency (SIDA/SAREC), which is gratefully acknowledged. The Swedish Academy for Pharmaceutical Sciences, Lindhés Advokatbyrå, Knut och Alice Wallenbergs Stiftelse and Wilhelm och Martina Lundgrens Vetenskapsfond are acknowledged for financial support.
52
Cytochrome P450 enzymes affected by artemisinin antimalarials
REFERENCES
[1] Klayman, D.L., Qinghaosu (artemisinin): an antimalarial drug from China. Science. 1985, 228 (4703); 1049-55.
[2] van Agtmael, M.A.; Eggelte, T.A.; van Boxtel, C.J., Artemisinin drugs in the treatment of malaria: from medicinal herb to registered medication. Trends Pharmacol Sci. 1999, 20 (5); 199-205.
[3] WHO. Malaria. 2007 [cited 2007; Available from: http://www.who.int/mediacentre/factsheets/fs094/en/index.html.
[4] Lewison, G.; Srivastava, D., Malaria research, 1980-2004, and the burden of disease. Acta Trop. 2008, 106 (2); 96-103.
[5] White, N.J., Antimalarial drug resistance. J Clin Invest. 2004, 113 (8); 1084-92. [6] Resistance to artemisinin derivatives along the Thai-Cambodian border. Wkly
Epidemiol Rec. 2007, 82 (41); 360. [7] White, N.J., Qinghaosu (artemisinin): the price of success. Science. 2008, 320 (5874);
330-4. [8] Ashton, M.; Gordi, T.; Trinh, N.H.; Nguyen, V.H.; Nguyen, D.S.; Nguyen, T.N.;
Dinh, X.H.; Johansson, M.; Le, D.C., Artemisinin pharmacokinetics in healthy adults after 250, 500 and 1000 mg single oral doses. Biopharm Drug Dispos. 1998, 19 (4); 245-50.
[9] Ashton, M.; Nguyen, D.S.; Nguyen, V.H.; Gordi, T.; Trinh, N.H.; Dinh, X.H.; Nguyen, T.N.; Le, D.C., Artemisinin kinetics and dynamics during oral and rectal treatment of uncomplicated malaria. Clin Pharmacol Ther. 1998, 63 (4); 482-93.
[10] Hassan Alin, M.; Ashton, M.; Kihamia, C.M.; Mtey, G.J.; Bjorkman, A., Multiple dose pharmacokinetics of oral artemisinin and comparison of its efficacy with that of oral artesunate in falciparum malaria patients. Trans R Soc Trop Med Hyg. 1996, 90 (1); 61-5.
[11] Svensson, U.S.; Ashton, M.; Trinh, N.H.; Bertilsson, L.; Dinh, X.H.; Nguyen, V.H.; Nguyen, T.N.; Nguyen, D.S.; Lykkesfeldt, J.; Le, D.C., Artemisinin induces omeprazole metabolism in human beings. Clin Pharmacol Ther. 1998, 64 (2); 160-7.
[12] Ashton, M.; Sy, N.D.; Gordi, T.; Hai, T.N.; Thach, D.C.; Huong, N.V.; Farah, M.H.; Johansson, M.; Cong, L.D., Evidence for time-dependent artemisinin kinetics in adults with uncomplicated malaria. Pharm Pharmacol Lett. 1996, 6 (3); 127-130.
[13] Gordi, T.; Huong, D.X.; Hai, T.N.; Nieu, N.T.; Ashton, M., Artemisinin pharmacokinetics and efficacy in uncomplicated-malaria patients treated with two different dosage regimens. Antimicrob Agents Chemother. 2002, 46 (4); 1026-31.
[14] Gordi, T.; Xie, R.; Huong, N.V.; Huong, D.X.; Karlsson, M.O.; Ashton, M., A semiphysiological pharmacokinetic model for artemisinin in healthy subjects incorporating autoinduction of metabolism and saturable first-pass hepatic extraction. Br J Clin Pharmacol. 2005, 59 (2); 189-98.
[15] Mihara, K.; Svensson, U.S.; Tybring, G.; Hai, T.N.; Bertilsson, L.; Ashton, M., Stereospecific analysis of omeprazole supports artemisinin as a potent inducer of CYP2C19. Fundam Clin Pharmacol. 1999, 13 (6); 671-5.
[16] Simonsson, U.S.; Jansson, B.; Hai, T.N.; Huong, D.X.; Tybring, G.; Ashton, M., Artemisinin autoinduction is caused by involvement of cytochrome P450 2B6 but not 2C9. Clin Pharmacol Ther. 2003, 74 (1); 32-43.
53
Sara Asimus
[17] Burk, O.; Arnold, K.A.; Nussler, A.K.; Schaeffeler, E.; Efimova, E.; Avery, B.A.; Avery, M.A.; Fromm, M.F.; Eichelbaum, M., Antimalarial artemisinin drugs induce cytochrome P450 and MDR1 expression by activation of xenosensors pregnane X receptor and constitutive androstane receptor. Mol Pharmacol. 2005, 67 (6); 1954-65.
[18] Simonsson, U.S.; Lindell, M.; Raffalli-Mathieu, F.; Lannerbro, A.; Honkakoski, P.; Lang, M.A., In vivo and mechanistic evidence of nuclear receptor CAR induction by artemisinin. Eur J Clin Invest. 2006, 36 (9); 647-53.
[19] Bapiro, T.E.; Egnell, A.C.; Hasler, J.A.; Masimirembwa, C.M., Application of higher throughput screening (HTS) inhibition assays to evaluate the interaction of antiparasitic drugs with cytochrome P450s. Drug Metab Dispos. 2001, 29 (1); 30-5.
[20] Bapiro, T.E.; Sayi, J.; Hasler, J.A.; Jande, M.; Rimoy, G.; Masselle, A.; Masimirembwa, C.M., Artemisinin and thiabendazole are potent inhibitors of cytochrome P450 1A2 (CYP1A2) activity in humans. Eur J Clin Pharmacol. 2005, 61 (10); 755-61.
[21] Zhang, S.Q.; Hai, T.N.; Ilett, K.F.; Huong, D.X.; Davis, T.M.; Ashton, M., Multiple dose study of interactions between artesunate and artemisinin in healthy volunteers. Br J Clin Pharmacol. 2001, 52 (4); 377-85.
[22] Svensson, U.S.; Ashton, M., Identification of the human cytochrome P450 enzymes involved in the in vitro metabolism of artemisinin. Br J Clin Pharmacol. 1999, 48 (4); 528-35.
[23] Lee, I.S.; Hufford, C.D., Metabolism of antimalarial sesquiterpene lactones. Pharmacol Ther. 1990, 48 (3); 345-55.
[24] de Vries, P.J.; Dien, T.K., Clinical pharmacology and therapeutic potential of artemisinin and its derivatives in the treatment of malaria. Drugs. 1996, 52 (6); 818-36.
[25] Ilett, K.F.; Ethell, B.T.; Maggs, J.L.; Davis, T.M.; Batty, K.T.; Burchell, B.; Binh, T.Q.; Thu le, T.A.; Hung, N.C.; Pirmohamed, M.; Park, B.K.; Edwards, G., Glucuronidation of dihydroartemisinin in vivo and by human liver microsomes and expressed UDP-glucuronosyltransferases. Drug Metab Dispos. 2002, 30 (9); 1005-12.
[26] Navaratnam, V.; Mansor, S.M.; Sit, N.W.; Grace, J.; Li, Q.; Olliaro, P., Pharmacokinetics of artemisinin-type compounds. Clin Pharmacokinet. 2000, 39 (4); 255-70.
[27] van Agtmael, M.A.; Van Der Graaf, C.A.; Dien, T.K.; Koopmans, R.P.; van Boxtel, C.J., The contribution of the enzymes CYP2D6 and CYP2C19 in the demethylation of artemether in healthy subjects. Eur J Drug Metab Pharmacokinet. 1998, 23 (3); 429-36.
[28] van Agtmael, M.A.; Cheng-Qi, S.; Qing, J.X.; Mull, R.; van Boxtel, C.J., Multiple dose pharmacokinetics of artemether in Chinese patients with uncomplicated falciparum malaria. Int J Antimicrob Agents. 1999, 12 (2); 151-8.
[29] van Agtmael, M.A.; Gupta, V.; van der Graaf, C.A.; van Boxtel, C.J., The effect of grapefruit juice on the time-dependent decline of artemether plasma levels in healthy subjects. Clin Pharmacol Ther. 1999, 66 (4); 408-14.
[30] Khanh, N.X.; de Vries, P.J.; Ha, L.D.; van Boxtel, C.J.; Koopmans, R.; Kager, P.A., Declining concentrations of dihydroartemisinin in plasma during 5-day oral treatment with artesunate for Falciparum malaria. Antimicrob Agents Chemother. 1999, 43 (3); 690-2.
54

Cytochrome P450 enzymes affected by artemisinin antimalarials
[31] Grace, J.M.; Aguilar, A.J.; Trotman, K.M.; Peggins, J.O.; Brewer, T.G., Metabolism of beta-arteether to dihydroqinghaosu by human liver microsomes and recombinant cytochrome P450. Drug Metab Dispos. 1998, 26 (4); 313-7.
[32] Li, X.Q.; Bjorkman, A.; Andersson, T.B.; Gustafsson, L.L.; Masimirembwa, C.M., Identification of human cytochrome P(450)s that metabolise anti-parasitic drugs and predictions of in vivo drug hepatic clearance from in vitro data. Eur J Clin Pharmacol. 2003, 59 (5-6); 429-42.
[33] Batty, K.T.; Thu, L.T.; Davis, T.M.; Ilett, K.F.; Mai, T.X.; Hung, N.C.; Tien, N.P.; Powell, S.M.; Thien, H.V.; Binh, T.Q.; Kim, N.V., A pharmacokinetic and pharmacodynamic study of intravenous vs oral artesunate in uncomplicated falciparum malaria. Br J Clin Pharmacol. 1998, 45 (2); 123-9.
[34] Teja-Isavadharm, P.; Nosten, F.; Kyle, D.E.; Luxemburger, C.; Ter Kuile, F.; Peggins, J.O.; Brewer, T.G.; White, N.J., Comparative bioavailability of oral, rectal, and intramuscular artemether in healthy subjects: use of simultaneous measurement by high performance liquid chromatography and bioassay. Br J Clin Pharmacol. 1996, 42 (5); 599-604.
[35] Looareesuwan, S.; Oosterhuis, B.; Schilizzi, B.M.; Sollie, F.A.; Wilairatana, P.; Krudsood, S.; Lugt Ch, B.; Peeters, P.A.; Peggins, J.O., Dose-finding and efficacy study for i.m. artemotil (beta-arteether) and comparison with i.m. artemether in acute uncomplicated P. falciparum malaria. Br J Clin Pharmacol. 2002, 53 (5); 492-500.
[36] Alin, M.H.; Kihamia, C.M.; Bjorkman, A.; Bwijo, B.A.; Premji, Z.; Mtey, G.J.; Ashton, M., Efficacy of oral and intravenous artesunate in male Tanzanian adults with Plasmodium falciparum malaria and in vitro susceptibility to artemisinin, chloroquine, and mefloquine. Am J Trop Med Hyg. 1995, 53 (6); 639-45.
[37] White, N.J., Delaying antimalarial drug resistance with combination chemotherapy. Parassitologia. 1999, 41 (1-3); 301-8.
[38] Hien, T.T.; White, N.J., Qinghaosu. Lancet. 1993, 341 (8845); 603-8. [39] Gordi, T.; Lepist, E.I., Artemisinin derivatives: toxic for laboratory animals, safe for
humans? Toxicol Lett. 2004, 147 (2); 99-107. [40] Hien, T.T.; Turner, G.D.; Mai, N.T.; Phu, N.H.; Bethell, D.; Blakemore, W.F.;
Cavanagh, J.B.; Dayan, A.; Medana, I.; Weller, R.O.; Day, N.P.; White, N.J., Neuropathological assessment of artemether-treated severe malaria. Lancet. 2003, 362 (9380); 295-6.
[41] Kissinger, E.; Hien, T.T.; Hung, N.T.; Nam, N.D.; Tuyen, N.L.; Dinh, B.V.; Mann, C.; Phu, N.H.; Loc, P.P.; Simpson, J.A.; White, N.J.; Farrar, J.J., Clinical and neurophysiological study of the effects of multiple doses of artemisinin on brain-stem function in Vietnamese patients. Am J Trop Med Hyg. 2000, 63 (1-2); 48-55.
[42] Longo, M.; Zanoncelli, S.; Manera, D.; Brughera, M.; Colombo, P.; Lansen, J.; Mazue, G.; Gomes, M.; Taylor, W.R.; Olliaro, P., Effects of the antimalarial drug dihydroartemisinin (DHA) on rat embryos in vitro. Reprod Toxicol. 2006, 21 (1); 83-93.
[43] Opsenica, I.; Opsenica, D.; Smith, K.S.; Milhous, W.K.; Solaja, B.A., Chemical stability of the peroxide bond enables diversified synthesis of potent tetraoxane antimalarials. J Med Chem. 2008, 51 (7); 2261-6.
[44] Parkinson, A., Biotransformation of xenobiotics, in Casett & Doull's Toxicology: The Basic Science of Poisons, C.D. Klaassen, Editor. 2001, McGraw-Hill: NewYork.
[45] Gordon, G.G.; Skett, P., Introduction to Drug Metabolism. 3 ed. 2001, Cheltenham: Nelson Thornes Publishers.
55
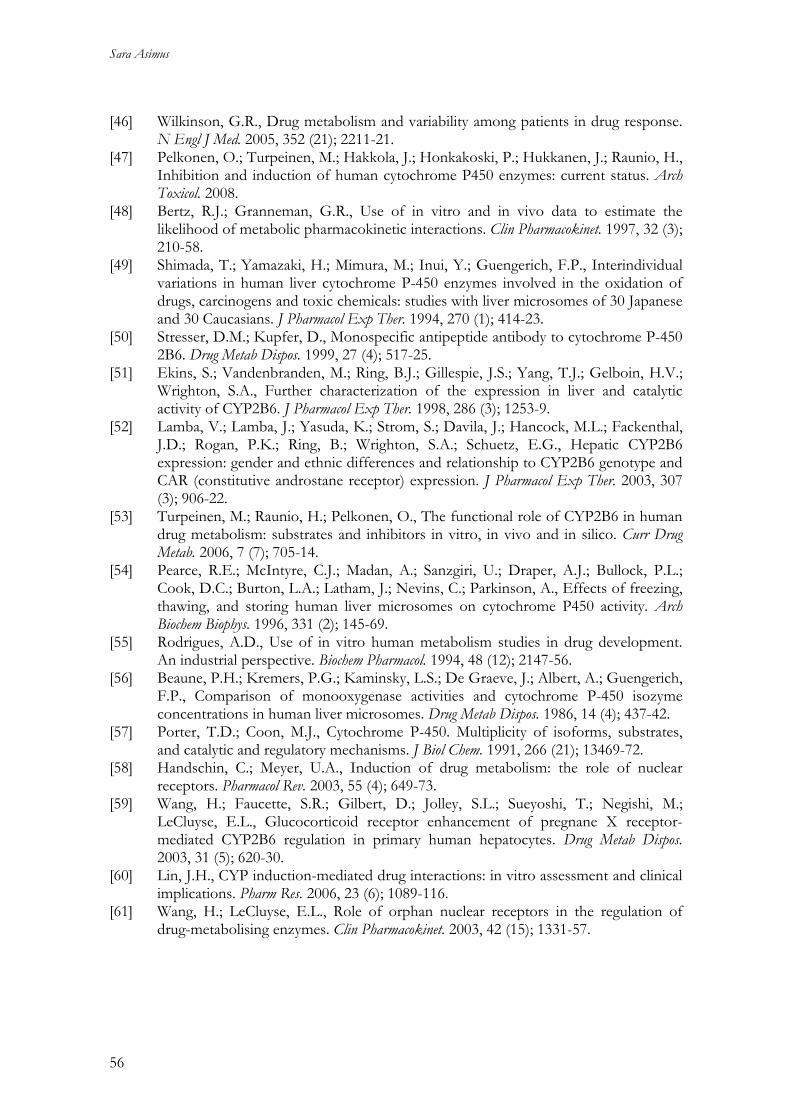
Sara Asimus
[46] Wilkinson, G.R., Drug metabolism and variability among patients in drug response. N Engl J Med. 2005, 352 (21); 2211-21.
[47] Pelkonen, O.; Turpeinen, M.; Hakkola, J.; Honkakoski, P.; Hukkanen, J.; Raunio, H., Inhibition and induction of human cytochrome P450 enzymes: current status. Arch Toxicol. 2008.
[48] Bertz, R.J.; Granneman, G.R., Use of in vitro and in vivo data to estimate the likelihood of metabolic pharmacokinetic interactions. Clin Pharmacokinet. 1997, 32 (3); 210-58.
[49] Shimada, T.; Yamazaki, H.; Mimura, M.; Inui, Y.; Guengerich, F.P., Interindividual variations in human liver cytochrome P-450 enzymes involved in the oxidation of drugs, carcinogens and toxic chemicals: studies with liver microsomes of 30 Japanese and 30 Caucasians. J Pharmacol Exp Ther. 1994, 270 (1); 414-23.
[50] Stresser, D.M.; Kupfer, D., Monospecific antipeptide antibody to cytochrome P-450 2B6. Drug Metab Dispos. 1999, 27 (4); 517-25.
[51] Ekins, S.; Vandenbranden, M.; Ring, B.J.; Gillespie, J.S.; Yang, T.J.; Gelboin, H.V.; Wrighton, S.A., Further characterization of the expression in liver and catalytic activity of CYP2B6. J Pharmacol Exp Ther. 1998, 286 (3); 1253-9.
[52] Lamba, V.; Lamba, J.; Yasuda, K.; Strom, S.; Davila, J.; Hancock, M.L.; Fackenthal, J.D.; Rogan, P.K.; Ring, B.; Wrighton, S.A.; Schuetz, E.G., Hepatic CYP2B6 expression: gender and ethnic differences and relationship to CYP2B6 genotype and CAR (constitutive androstane receptor) expression. J Pharmacol Exp Ther. 2003, 307 (3); 906-22.
[53] Turpeinen, M.; Raunio, H.; Pelkonen, O., The functional role of CYP2B6 in human drug metabolism: substrates and inhibitors in vitro, in vivo and in silico. Curr Drug Metab. 2006, 7 (7); 705-14.
[54] Pearce, R.E.; McIntyre, C.J.; Madan, A.; Sanzgiri, U.; Draper, A.J.; Bullock, P.L.; Cook, D.C.; Burton, L.A.; Latham, J.; Nevins, C.; Parkinson, A., Effects of freezing, thawing, and storing human liver microsomes on cytochrome P450 activity. Arch Biochem Biophys. 1996, 331 (2); 145-69.
[55] Rodrigues, A.D., Use of in vitro human metabolism studies in drug development. An industrial perspective. Biochem Pharmacol. 1994, 48 (12); 2147-56.
[56] Beaune, P.H.; Kremers, P.G.; Kaminsky, L.S.; De Graeve, J.; Albert, A.; Guengerich, F.P., Comparison of monooxygenase activities and cytochrome P-450 isozyme concentrations in human liver microsomes. Drug Metab Dispos. 1986, 14 (4); 437-42.
[57] Porter, T.D.; Coon, M.J., Cytochrome P-450. Multiplicity of isoforms, substrates, and catalytic and regulatory mechanisms. J Biol Chem. 1991, 266 (21); 13469-72.
[58] Handschin, C.; Meyer, U.A., Induction of drug metabolism: the role of nuclear receptors. Pharmacol Rev. 2003, 55 (4); 649-73.
[59] Wang, H.; Faucette, S.R.; Gilbert, D.; Jolley, S.L.; Sueyoshi, T.; Negishi, M.; LeCluyse, E.L., Glucocorticoid receptor enhancement of pregnane X receptor-mediated CYP2B6 regulation in primary human hepatocytes. Drug Metab Dispos. 2003, 31 (5); 620-30.
[60] Lin, J.H., CYP induction-mediated drug interactions: in vitro assessment and clinical implications. Pharm Res. 2006, 23 (6); 1089-116.
[61] Wang, H.; LeCluyse, E.L., Role of orphan nuclear receptors in the regulation of drug-metabolising enzymes. Clin Pharmacokinet. 2003, 42 (15); 1331-57.
56
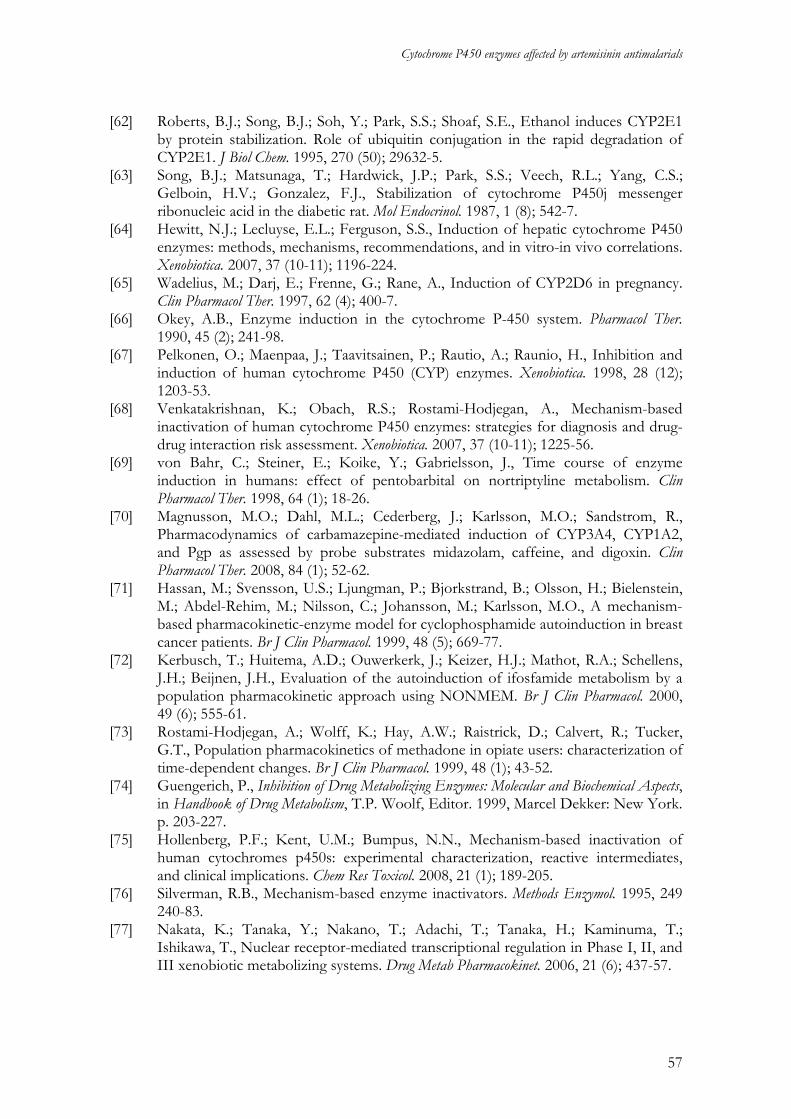
Cytochrome P450 enzymes affected by artemisinin antimalarials
[62] Roberts, B.J.; Song, B.J.; Soh, Y.; Park, S.S.; Shoaf, S.E., Ethanol induces CYP2E1 by protein stabilization. Role of ubiquitin conjugation in the rapid degradation of CYP2E1. J Biol Chem. 1995, 270 (50); 29632-5.
[63] Song, B.J.; Matsunaga, T.; Hardwick, J.P.; Park, S.S.; Veech, R.L.; Yang, C.S.; Gelboin, H.V.; Gonzalez, F.J., Stabilization of cytochrome P450j messenger ribonucleic acid in the diabetic rat. Mol Endocrinol. 1987, 1 (8); 542-7.
[64] Hewitt, N.J.; Lecluyse, E.L.; Ferguson, S.S., Induction of hepatic cytochrome P450 enzymes: methods, mechanisms, recommendations, and in vitro-in vivo correlations. Xenobiotica. 2007, 37 (10-11); 1196-224.
[65] Wadelius, M.; Darj, E.; Frenne, G.; Rane, A., Induction of CYP2D6 in pregnancy. Clin Pharmacol Ther. 1997, 62 (4); 400-7.
[66] Okey, A.B., Enzyme induction in the cytochrome P-450 system. Pharmacol Ther. 1990, 45 (2); 241-98.
[67] Pelkonen, O.; Maenpaa, J.; Taavitsainen, P.; Rautio, A.; Raunio, H., Inhibition and induction of human cytochrome P450 (CYP) enzymes. Xenobiotica. 1998, 28 (12); 1203-53.
[68] Venkatakrishnan, K.; Obach, R.S.; Rostami-Hodjegan, A., Mechanism-based inactivation of human cytochrome P450 enzymes: strategies for diagnosis and drug-drug interaction risk assessment. Xenobiotica. 2007, 37 (10-11); 1225-56.
[69] von Bahr, C.; Steiner, E.; Koike, Y.; Gabrielsson, J., Time course of enzyme induction in humans: effect of pentobarbital on nortriptyline metabolism. Clin Pharmacol Ther. 1998, 64 (1); 18-26.
[70] Magnusson, M.O.; Dahl, M.L.; Cederberg, J.; Karlsson, M.O.; Sandstrom, R., Pharmacodynamics of carbamazepine-mediated induction of CYP3A4, CYP1A2, and Pgp as assessed by probe substrates midazolam, caffeine, and digoxin. Clin Pharmacol Ther. 2008, 84 (1); 52-62.
[71] Hassan, M.; Svensson, U.S.; Ljungman, P.; Bjorkstrand, B.; Olsson, H.; Bielenstein, M.; Abdel-Rehim, M.; Nilsson, C.; Johansson, M.; Karlsson, M.O., A mechanism-based pharmacokinetic-enzyme model for cyclophosphamide autoinduction in breast cancer patients. Br J Clin Pharmacol. 1999, 48 (5); 669-77.
[72] Kerbusch, T.; Huitema, A.D.; Ouwerkerk, J.; Keizer, H.J.; Mathot, R.A.; Schellens, J.H.; Beijnen, J.H., Evaluation of the autoinduction of ifosfamide metabolism by a population pharmacokinetic approach using NONMEM. Br J Clin Pharmacol. 2000, 49 (6); 555-61.
[73] Rostami-Hodjegan, A.; Wolff, K.; Hay, A.W.; Raistrick, D.; Calvert, R.; Tucker, G.T., Population pharmacokinetics of methadone in opiate users: characterization of time-dependent changes. Br J Clin Pharmacol. 1999, 48 (1); 43-52.
[74] Guengerich, P., Inhibition of Drug Metabolizing Enzymes: Molecular and Biochemical Aspects, in Handbook of Drug Metabolism, T.P. Woolf, Editor. 1999, Marcel Dekker: New York. p. 203-227.
[75] Hollenberg, P.F.; Kent, U.M.; Bumpus, N.N., Mechanism-based inactivation of human cytochromes p450s: experimental characterization, reactive intermediates, and clinical implications. Chem Res Toxicol. 2008, 21 (1); 189-205.
[76] Silverman, R.B., Mechanism-based enzyme inactivators. Methods Enzymol. 1995, 249 240-83.
[77] Nakata, K.; Tanaka, Y.; Nakano, T.; Adachi, T.; Tanaka, H.; Kaminuma, T.; Ishikawa, T., Nuclear receptor-mediated transcriptional regulation in Phase I, II, and III xenobiotic metabolizing systems. Drug Metab Pharmacokinet. 2006, 21 (6); 437-57.
57
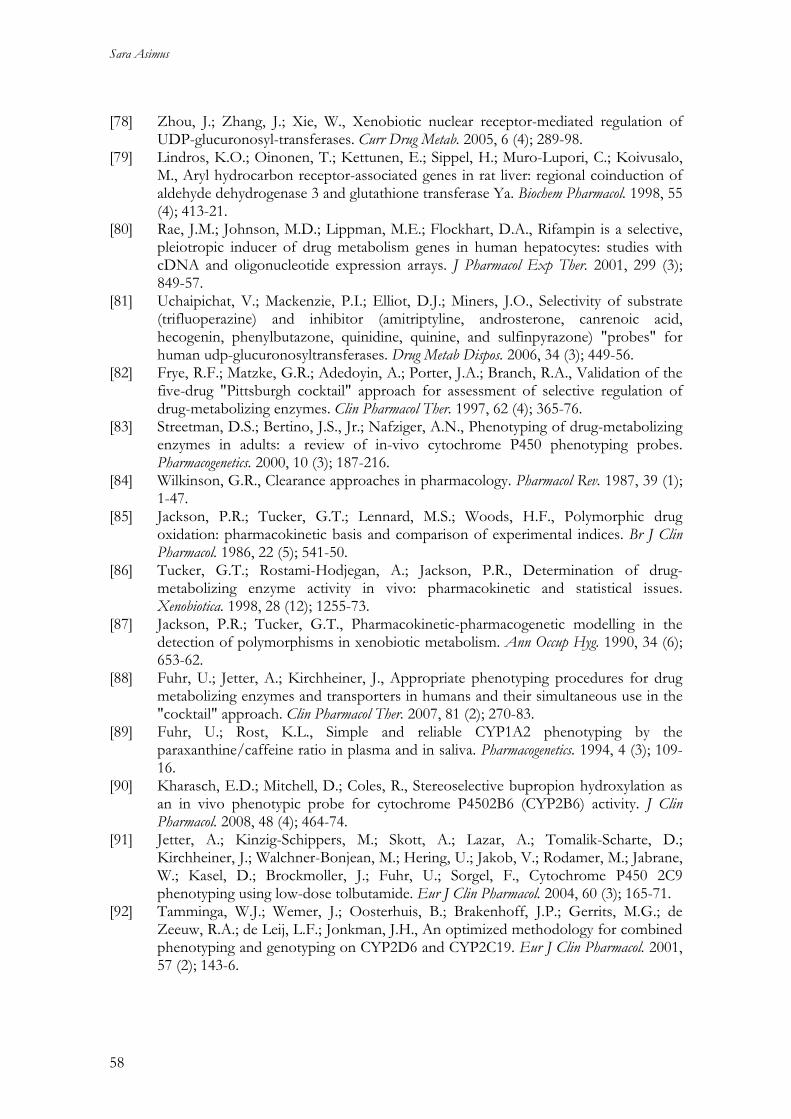
Sara Asimus
[78] Zhou, J.; Zhang, J.; Xie, W., Xenobiotic nuclear receptor-mediated regulation of UDP-glucuronosyl-transferases. Curr Drug Metab. 2005, 6 (4); 289-98.
[79] Lindros, K.O.; Oinonen, T.; Kettunen, E.; Sippel, H.; Muro-Lupori, C.; Koivusalo, M., Aryl hydrocarbon receptor-associated genes in rat liver: regional coinduction of aldehyde dehydrogenase 3 and glutathione transferase Ya. Biochem Pharmacol. 1998, 55 (4); 413-21.
[80] Rae, J.M.; Johnson, M.D.; Lippman, M.E.; Flockhart, D.A., Rifampin is a selective, pleiotropic inducer of drug metabolism genes in human hepatocytes: studies with cDNA and oligonucleotide expression arrays. J Pharmacol Exp Ther. 2001, 299 (3); 849-57.
[81] Uchaipichat, V.; Mackenzie, P.I.; Elliot, D.J.; Miners, J.O., Selectivity of substrate (trifluoperazine) and inhibitor (amitriptyline, androsterone, canrenoic acid, hecogenin, phenylbutazone, quinidine, quinine, and sulfinpyrazone) "probes" for human udp-glucuronosyltransferases. Drug Metab Dispos. 2006, 34 (3); 449-56.
[82] Frye, R.F.; Matzke, G.R.; Adedoyin, A.; Porter, J.A.; Branch, R.A., Validation of the five-drug "Pittsburgh cocktail" approach for assessment of selective regulation of drug-metabolizing enzymes. Clin Pharmacol Ther. 1997, 62 (4); 365-76.
[83] Streetman, D.S.; Bertino, J.S., Jr.; Nafziger, A.N., Phenotyping of drug-metabolizing enzymes in adults: a review of in-vivo cytochrome P450 phenotyping probes. Pharmacogenetics. 2000, 10 (3); 187-216.
[84] Wilkinson, G.R., Clearance approaches in pharmacology. Pharmacol Rev. 1987, 39 (1); 1-47.
[85] Jackson, P.R.; Tucker, G.T.; Lennard, M.S.; Woods, H.F., Polymorphic drug oxidation: pharmacokinetic basis and comparison of experimental indices. Br J Clin Pharmacol. 1986, 22 (5); 541-50.
[86] Tucker, G.T.; Rostami-Hodjegan, A.; Jackson, P.R., Determination of drug-metabolizing enzyme activity in vivo: pharmacokinetic and statistical issues. Xenobiotica. 1998, 28 (12); 1255-73.
[87] Jackson, P.R.; Tucker, G.T., Pharmacokinetic-pharmacogenetic modelling in the detection of polymorphisms in xenobiotic metabolism. Ann Occup Hyg. 1990, 34 (6); 653-62.
[88] Fuhr, U.; Jetter, A.; Kirchheiner, J., Appropriate phenotyping procedures for drug metabolizing enzymes and transporters in humans and their simultaneous use in the "cocktail" approach. Clin Pharmacol Ther. 2007, 81 (2); 270-83.
[89] Fuhr, U.; Rost, K.L., Simple and reliable CYP1A2 phenotyping by the paraxanthine/caffeine ratio in plasma and in saliva. Pharmacogenetics. 1994, 4 (3); 109-16.
[90] Kharasch, E.D.; Mitchell, D.; Coles, R., Stereoselective bupropion hydroxylation as an in vivo phenotypic probe for cytochrome P4502B6 (CYP2B6) activity. J Clin Pharmacol. 2008, 48 (4); 464-74.
[91] Jetter, A.; Kinzig-Schippers, M.; Skott, A.; Lazar, A.; Tomalik-Scharte, D.; Kirchheiner, J.; Walchner-Bonjean, M.; Hering, U.; Jakob, V.; Rodamer, M.; Jabrane, W.; Kasel, D.; Brockmoller, J.; Fuhr, U.; Sorgel, F., Cytochrome P450 2C9 phenotyping using low-dose tolbutamide. Eur J Clin Pharmacol. 2004, 60 (3); 165-71.
[92] Tamminga, W.J.; Wemer, J.; Oosterhuis, B.; Brakenhoff, J.P.; Gerrits, M.G.; de Zeeuw, R.A.; de Leij, L.F.; Jonkman, J.H., An optimized methodology for combined phenotyping and genotyping on CYP2D6 and CYP2C19. Eur J Clin Pharmacol. 2001, 57 (2); 143-6.
58
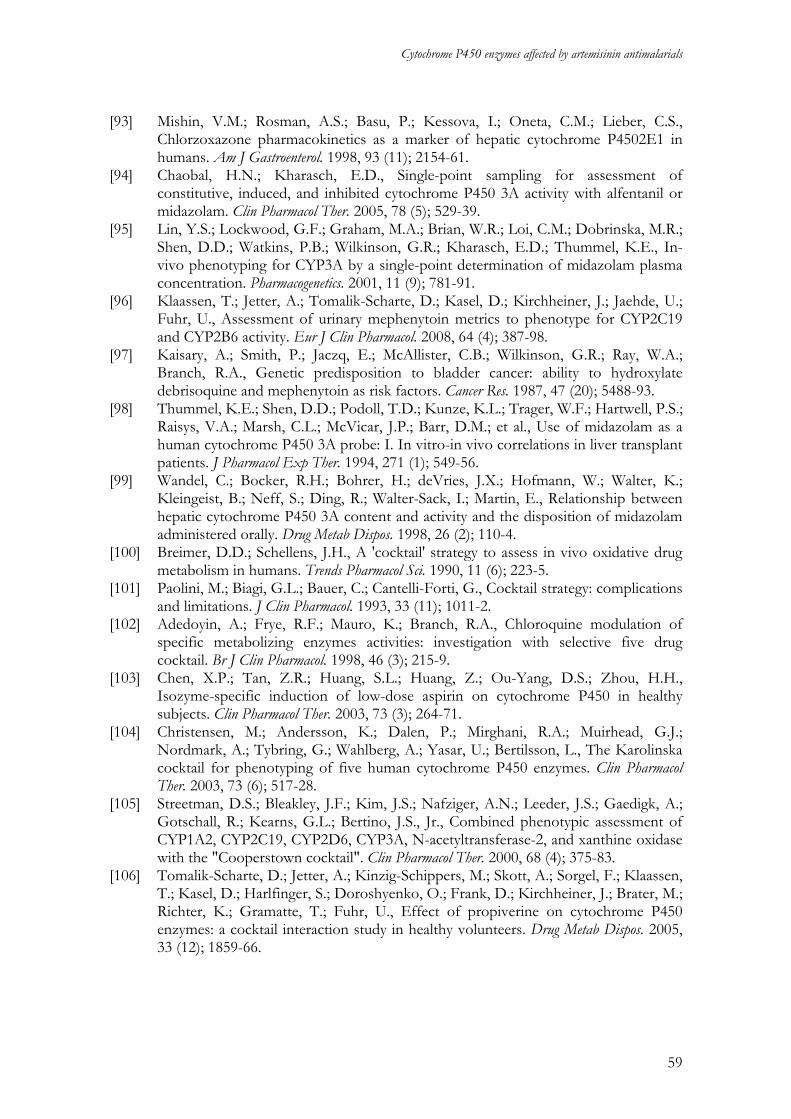
Cytochrome P450 enzymes affected by artemisinin antimalarials
[93] Mishin, V.M.; Rosman, A.S.; Basu, P.; Kessova, I.; Oneta, C.M.; Lieber, C.S., Chlorzoxazone pharmacokinetics as a marker of hepatic cytochrome P4502E1 in humans. Am J Gastroenterol. 1998, 93 (11); 2154-61.
[94] Chaobal, H.N.; Kharasch, E.D., Single-point sampling for assessment of constitutive, induced, and inhibited cytochrome P450 3A activity with alfentanil or midazolam. Clin Pharmacol Ther. 2005, 78 (5); 529-39.
[95] Lin, Y.S.; Lockwood, G.F.; Graham, M.A.; Brian, W.R.; Loi, C.M.; Dobrinska, M.R.; Shen, D.D.; Watkins, P.B.; Wilkinson, G.R.; Kharasch, E.D.; Thummel, K.E., In-vivo phenotyping for CYP3A by a single-point determination of midazolam plasma concentration. Pharmacogenetics. 2001, 11 (9); 781-91.
[96] Klaassen, T.; Jetter, A.; Tomalik-Scharte, D.; Kasel, D.; Kirchheiner, J.; Jaehde, U.; Fuhr, U., Assessment of urinary mephenytoin metrics to phenotype for CYP2C19 and CYP2B6 activity. Eur J Clin Pharmacol. 2008, 64 (4); 387-98.
[97] Kaisary, A.; Smith, P.; Jaczq, E.; McAllister, C.B.; Wilkinson, G.R.; Ray, W.A.; Branch, R.A., Genetic predisposition to bladder cancer: ability to hydroxylate debrisoquine and mephenytoin as risk factors. Cancer Res. 1987, 47 (20); 5488-93.
[98] Thummel, K.E.; Shen, D.D.; Podoll, T.D.; Kunze, K.L.; Trager, W.F.; Hartwell, P.S.; Raisys, V.A.; Marsh, C.L.; McVicar, J.P.; Barr, D.M.; et al., Use of midazolam as a human cytochrome P450 3A probe: I. In vitro-in vivo correlations in liver transplant patients. J Pharmacol Exp Ther. 1994, 271 (1); 549-56.
[99] Wandel, C.; Bocker, R.H.; Bohrer, H.; deVries, J.X.; Hofmann, W.; Walter, K.; Kleingeist, B.; Neff, S.; Ding, R.; Walter-Sack, I.; Martin, E., Relationship between hepatic cytochrome P450 3A content and activity and the disposition of midazolam administered orally. Drug Metab Dispos. 1998, 26 (2); 110-4.
[100] Breimer, D.D.; Schellens, J.H., A 'cocktail' strategy to assess in vivo oxidative drug metabolism in humans. Trends Pharmacol Sci. 1990, 11 (6); 223-5.
[101] Paolini, M.; Biagi, G.L.; Bauer, C.; Cantelli-Forti, G., Cocktail strategy: complications and limitations. J Clin Pharmacol. 1993, 33 (11); 1011-2.
[102] Adedoyin, A.; Frye, R.F.; Mauro, K.; Branch, R.A., Chloroquine modulation of specific metabolizing enzymes activities: investigation with selective five drug cocktail. Br J Clin Pharmacol. 1998, 46 (3); 215-9.
[103] Chen, X.P.; Tan, Z.R.; Huang, S.L.; Huang, Z.; Ou-Yang, D.S.; Zhou, H.H., Isozyme-specific induction of low-dose aspirin on cytochrome P450 in healthy subjects. Clin Pharmacol Ther. 2003, 73 (3); 264-71.
[104] Christensen, M.; Andersson, K.; Dalen, P.; Mirghani, R.A.; Muirhead, G.J.; Nordmark, A.; Tybring, G.; Wahlberg, A.; Yasar, U.; Bertilsson, L., The Karolinska cocktail for phenotyping of five human cytochrome P450 enzymes. Clin Pharmacol Ther. 2003, 73 (6); 517-28.
[105] Streetman, D.S.; Bleakley, J.F.; Kim, J.S.; Nafziger, A.N.; Leeder, J.S.; Gaedigk, A.; Gotschall, R.; Kearns, G.L.; Bertino, J.S., Jr., Combined phenotypic assessment of CYP1A2, CYP2C19, CYP2D6, CYP3A, N-acetyltransferase-2, and xanthine oxidase with the "Cooperstown cocktail". Clin Pharmacol Ther. 2000, 68 (4); 375-83.
[106] Tomalik-Scharte, D.; Jetter, A.; Kinzig-Schippers, M.; Skott, A.; Sorgel, F.; Klaassen, T.; Kasel, D.; Harlfinger, S.; Doroshyenko, O.; Frank, D.; Kirchheiner, J.; Brater, M.; Richter, K.; Gramatte, T.; Fuhr, U., Effect of propiverine on cytochrome P450 enzymes: a cocktail interaction study in healthy volunteers. Drug Metab Dispos. 2005, 33 (12); 1859-66.
59
Sara Asimus
[107] Zhu, B.; Ou-Yang, D.S.; Chen, X.P.; Huang, S.L.; Tan, Z.R.; He, N.; Zhou, H.H., Assessment of cytochrome P450 activity by a five-drug cocktail approach. Clin Pharmacol Ther. 2001, 70 (5); 455-61.
[108] Daly, A.K., Pharmacogenetics of the cytochromes P450. Curr Top Med Chem. 2004, 4 (16); 1733-44.
[109] Home Page of the Human Cytochrome P450 (CYP) Allele Nomenclature Committee 2008 [cited; Available from: http://www.cypalleles.ki.se/.
[110] Daly, A.K., Pharmacogenetics of the major polymorphic metabolizing enzymes. Fundam Clin Pharmacol. 2003, 17 (1); 27-41.
[111] Ingelman-Sundberg, M.; Sim, S.C.; Gomez, A.; Rodriguez-Antona, C., Influence of cytochrome P450 polymorphisms on drug therapies: pharmacogenetic, pharmacoepigenetic and clinical aspects. Pharmacol Ther. 2007, 116 (3); 496-526.
[112] Zanger, U.M.; Raimundo, S.; Eichelbaum, M., Cytochrome P450 2D6: overview and update on pharmacology, genetics, biochemistry. Naunyn Schmiedebergs Arch Pharmacol. 2004, 369 (1); 23-37.
[113] Ingelman-Sundberg, M., Genetic polymorphisms of cytochrome P450 2D6 (CYP2D6): clinical consequences, evolutionary aspects and functional diversity. Pharmacogenomics J. 2005, 5 (1); 6-13.
[114] Desta, Z.; Zhao, X.; Shin, J.G.; Flockhart, D.A., Clinical significance of the cytochrome P450 2C19 genetic polymorphism. Clin Pharmacokinet. 2002, 41 (12); 913-58.
[115] Schwarz, U.I., Clinical relevance of genetic polymorphisms in the human CYP2C9 gene. Eur J Clin Invest. 2003, 33 Suppl 2 23-30.
[116] Oscarson, M., Genetic polymorphisms in the cytochrome P450 2A6 (CYP2A6) gene: implications for interindividual differences in nicotine metabolism. Drug Metab Dispos. 2001, 29 (2); 91-5.
[117] Zanger, U.M.; Klein, K.; Saussele, T.; Blievernicht, J.; Hofmann, M.H.; Schwab, M., Polymorphic CYP2B6: molecular mechanisms and emerging clinical significance. Pharmacogenomics. 2007, 8 (7); 743-59.
[118] Jinno, H.; Tanaka-Kagawa, T.; Ohno, A.; Makino, Y.; Matsushima, E.; Hanioka, N.; Ando, M., Functional characterization of cytochrome P450 2B6 allelic variants. Drug Metab Dispos. 2003, 31 (4); 398-403.
[119] Kirchheiner, J.; Klein, C.; Meineke, I.; Sasse, J.; Zanger, U.M.; Murdter, T.E.; Roots, I.; Brockmoller, J., Bupropion and 4-OH-bupropion pharmacokinetics in relation to genetic polymorphisms in CYP2B6. Pharmacogenetics. 2003, 13 (10); 619-26.
[120] Lee, S.J.; Usmani, K.A.; Chanas, B.; Ghanayem, B.; Xi, T.; Hodgson, E.; Mohrenweiser, H.W.; Goldstein, J.A., Genetic findings and functional studies of human CYP3A5 single nucleotide polymorphisms in different ethnic groups. Pharmacogenetics. 2003, 13 (8); 461-72.
[121] Ashton, M.; Hai, T.N.; Sy, N.D.; Huong, D.X.; Van Huong, N.; Nieu, N.T.; Cong, L.D., Artemisinin pharmacokinetics is time-dependent during repeated oral administration in healthy male adults. Drug Metab Dispos. 1998, 26 (1); 25-7.
[122] Gordi, T.; Hai, T.N.; Hoai, N.M.; Thyberg, M.; Ashton, M., Use of saliva and capillary blood samples as substitutes for venous blood sampling in pharmacokinetic investigations of artemisinin. Eur J Clin Pharmacol. 2000, 56 (8); 561-6.
[123] Scott, R.J.; Palmer, J.; Lewis, I.A.; Pleasance, S., Determination of a 'GW cocktail' of cytochrome P450 probe substrates and their metabolites in plasma and urine using
60
Cytochrome P450 enzymes affected by artemisinin antimalarials
automated solid phase extraction and fast gradient liquid chromatography tandem mass spectrometry. Rapid Commun Mass Spectrom. 1999, 13 (23); 2305-19.
[124] Jansson, B.; Elsherbiny, D.; Simonsson, U.S., Enantiospecific separation and quantitation of mephenytoin and its metabolites nirvanol and 4'-hydroxymephenytoin in human plasma and urine by liquid chromatography/tandem mass spectrometry. Rapid Commun Mass Spectrom. 2006, 20 (3); 463-72.
[125] Gordi, T.; Nielsen, E.; Yu, Z.; Westerlund, D.; Ashton, M., Direct analysis of artemisinin in plasma and saliva using coupled-column high-performance liquid chromatography with a restricted-access material pre-column. J Chromatogr B Biomed Sci Appl. 2000, 742 (1); 155-62.
[126] Bogan, D.P.; O'Kennedy, R., Simultaneous determination of coumarin, 7-hydroxycoumarin and 7-hydroxycoumarin glucuronide in human serum and plasma by high-performance liquid chromatography. J Chromatogr B Biomed Appl. 1996, 686 (2); 267-73.
[127] Molander, L.; Lunell, E.; Andersson, S.B.; Kuylenstierna, F., Dose released and absolute bioavailability of nicotine from a nicotine vapor inhaler. Clin Pharmacol Ther. 1996, 59 (4); 394-400.
[128] Edlund, P.O.; Westerlund, D.; Carlqvist, J.; Wu, B.L.; Jin, Y.H., Determination of artesunate and dihydroartemisinine in plasma by liquid chromatography with post-column derivatization and UV-detection. Acta Pharm Suec. 1984, 21 (4); 223-34.
[129] Cooper, T.B.; Suckow, R.F.; Glassman, A., Determination of bupropion and its major basic metabolites in plasma by liquid chromatography with dual-wavelength ultraviolet detection. J Pharm Sci. 1984, 73 (8); 1104-7.
[130] Tanaka, E.; Takano, Y.; Inomata, S.; Toyooka, H.; Honda, K., Premedication medicines do not cause drug metabolic interaction with propofol using human liver microsomes in vitro. Eur J Clin Pharmacol. 2004, 60 (8); 565-8.
[131] Ward, B.A.; Gorski, J.C.; Jones, D.R.; Hall, S.D.; Flockhart, D.A.; Desta, Z., The cytochrome P450 2B6 (CYP2B6) is the main catalyst of efavirenz primary and secondary metabolism: implication for HIV/AIDS therapy and utility of efavirenz as a substrate marker of CYP2B6 catalytic activity. J Pharmacol Exp Ther. 2003, 306 (1); 287-300.
[132] Jonsson, E.N.; Karlsson, M.O., Xpose--an S-PLUS based population pharmacokinetic/pharmacodynamic model building aid for NONMEM. Comput Methods Programs Biomed. 1999, 58 (1); 51-64.
[133] Palmer, J.L.; Scott, R.J.; Gibson, A.; Dickins, M.; Pleasance, S., An interaction between the cytochrome P450 probe substrates chlorzoxazone (CYP2E1) and midazolam (CYP3A). Br J Clin Pharmacol. 2001, 52 (5); 555-61.
[134] Thummel, K.E.; O'Shea, D.; Paine, M.F.; Shen, D.D.; Kunze, K.L.; Perkins, J.D.; Wilkinson, G.R., Oral first-pass elimination of midazolam involves both gastrointestinal and hepatic CYP3A-mediated metabolism. Clin Pharmacol Ther. 1996, 59 (5); 491-502.
[135] Elsherbiny, D.A.; Asimus, S.A.; Karlsson, M.O.; Ashton, M.; Simonsson, U.S., A model based assessment of the CYP2B6 and CYP2C19 inductive properties by artemisinin antimalarials: implications for combination regimens. J Pharmacokinet Pharmacodyn. 2008, 35 (2); 203-17.
[136] Pasanen, M.; Rannala, Z.; Tooming, A.; Sotaniemi, E.A.; Pelkonen, O.; Rautio, A., Hepatitis A impairs the function of human hepatic CYP2A6 in vivo. Toxicology. 1997, 123 (3); 177-84.
61
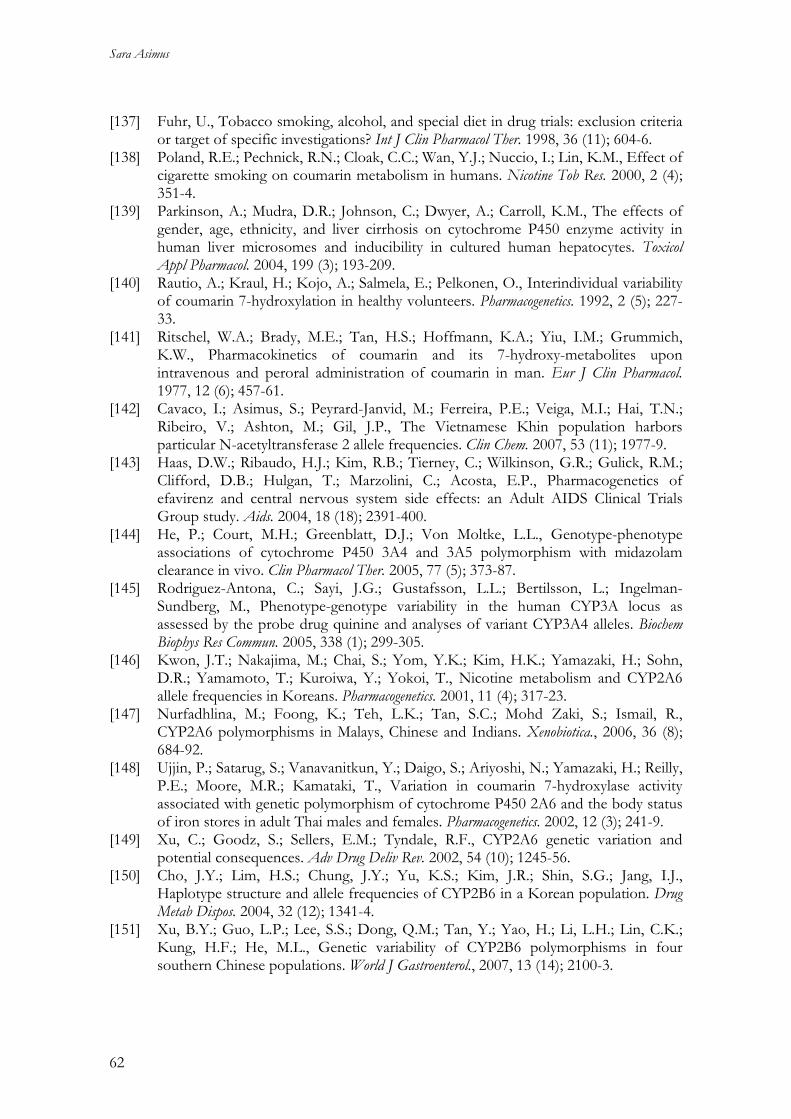
Sara Asimus
[137] Fuhr, U., Tobacco smoking, alcohol, and special diet in drug trials: exclusion criteria or target of specific investigations? Int J Clin Pharmacol Ther. 1998, 36 (11); 604-6.
[138] Poland, R.E.; Pechnick, R.N.; Cloak, C.C.; Wan, Y.J.; Nuccio, I.; Lin, K.M., Effect of cigarette smoking on coumarin metabolism in humans. Nicotine Tob Res. 2000, 2 (4); 351-4.
[139] Parkinson, A.; Mudra, D.R.; Johnson, C.; Dwyer, A.; Carroll, K.M., The effects of gender, age, ethnicity, and liver cirrhosis on cytochrome P450 enzyme activity in human liver microsomes and inducibility in cultured human hepatocytes. Toxicol Appl Pharmacol. 2004, 199 (3); 193-209.
[140] Rautio, A.; Kraul, H.; Kojo, A.; Salmela, E.; Pelkonen, O., Interindividual variability of coumarin 7-hydroxylation in healthy volunteers. Pharmacogenetics. 1992, 2 (5); 227-33.
[141] Ritschel, W.A.; Brady, M.E.; Tan, H.S.; Hoffmann, K.A.; Yiu, I.M.; Grummich, K.W., Pharmacokinetics of coumarin and its 7-hydroxy-metabolites upon intravenous and peroral administration of coumarin in man. Eur J Clin Pharmacol. 1977, 12 (6); 457-61.
[142] Cavaco, I.; Asimus, S.; Peyrard-Janvid, M.; Ferreira, P.E.; Veiga, M.I.; Hai, T.N.; Ribeiro, V.; Ashton, M.; Gil, J.P., The Vietnamese Khin population harbors particular N-acetyltransferase 2 allele frequencies. Clin Chem. 2007, 53 (11); 1977-9.
[143] Haas, D.W.; Ribaudo, H.J.; Kim, R.B.; Tierney, C.; Wilkinson, G.R.; Gulick, R.M.; Clifford, D.B.; Hulgan, T.; Marzolini, C.; Acosta, E.P., Pharmacogenetics of efavirenz and central nervous system side effects: an Adult AIDS Clinical Trials Group study. Aids. 2004, 18 (18); 2391-400.
[144] He, P.; Court, M.H.; Greenblatt, D.J.; Von Moltke, L.L., Genotype-phenotype associations of cytochrome P450 3A4 and 3A5 polymorphism with midazolam clearance in vivo. Clin Pharmacol Ther. 2005, 77 (5); 373-87.
[145] Rodriguez-Antona, C.; Sayi, J.G.; Gustafsson, L.L.; Bertilsson, L.; Ingelman-Sundberg, M., Phenotype-genotype variability in the human CYP3A locus as assessed by the probe drug quinine and analyses of variant CYP3A4 alleles. Biochem Biophys Res Commun. 2005, 338 (1); 299-305.
[146] Kwon, J.T.; Nakajima, M.; Chai, S.; Yom, Y.K.; Kim, H.K.; Yamazaki, H.; Sohn, D.R.; Yamamoto, T.; Kuroiwa, Y.; Yokoi, T., Nicotine metabolism and CYP2A6 allele frequencies in Koreans. Pharmacogenetics. 2001, 11 (4); 317-23.
[147] Nurfadhlina, M.; Foong, K.; Teh, L.K.; Tan, S.C.; Mohd Zaki, S.; Ismail, R., CYP2A6 polymorphisms in Malays, Chinese and Indians. Xenobiotica., 2006, 36 (8); 684-92.
[148] Ujjin, P.; Satarug, S.; Vanavanitkun, Y.; Daigo, S.; Ariyoshi, N.; Yamazaki, H.; Reilly, P.E.; Moore, M.R.; Kamataki, T., Variation in coumarin 7-hydroxylase activity associated with genetic polymorphism of cytochrome P450 2A6 and the body status of iron stores in adult Thai males and females. Pharmacogenetics. 2002, 12 (3); 241-9.
[149] Xu, C.; Goodz, S.; Sellers, E.M.; Tyndale, R.F., CYP2A6 genetic variation and potential consequences. Adv Drug Deliv Rev. 2002, 54 (10); 1245-56.
[150] Cho, J.Y.; Lim, H.S.; Chung, J.Y.; Yu, K.S.; Kim, J.R.; Shin, S.G.; Jang, I.J., Haplotype structure and allele frequencies of CYP2B6 in a Korean population. Drug Metab Dispos. 2004, 32 (12); 1341-4.
[151] Xu, B.Y.; Guo, L.P.; Lee, S.S.; Dong, Q.M.; Tan, Y.; Yao, H.; Li, L.H.; Lin, C.K.; Kung, H.F.; He, M.L., Genetic variability of CYP2B6 polymorphisms in four southern Chinese populations. World J Gastroenterol., 2007, 13 (14); 2100-3.
62
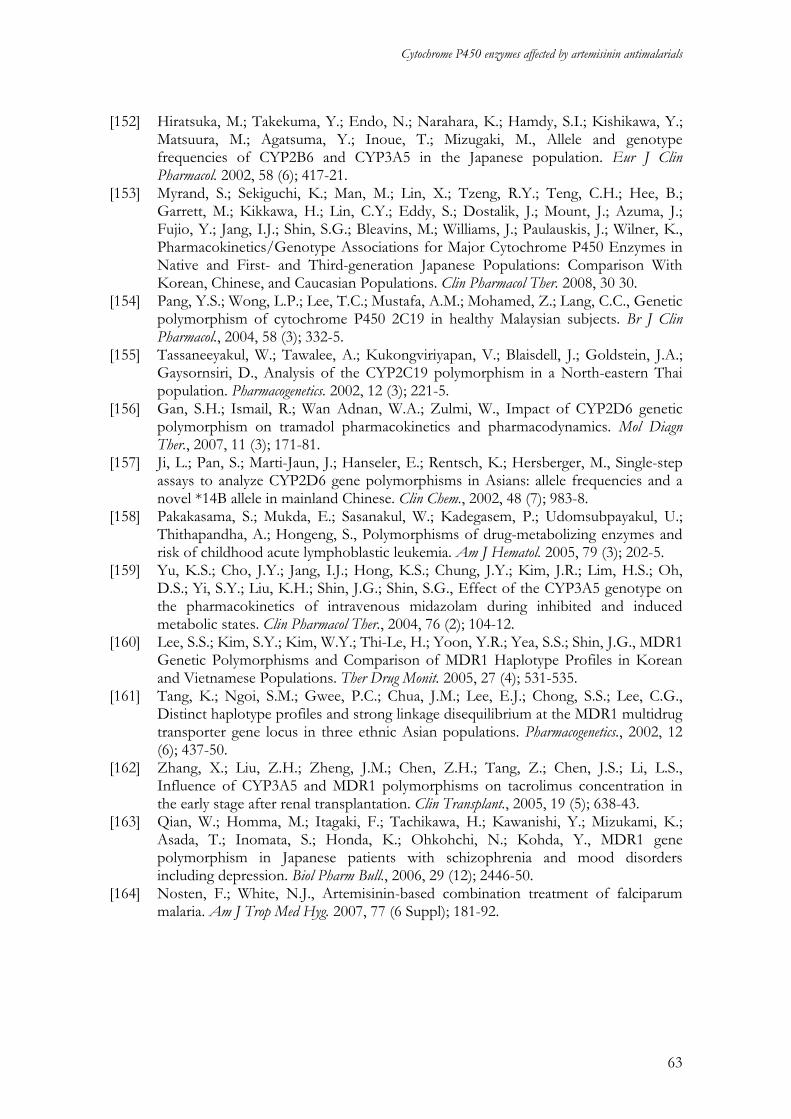
Cytochrome P450 enzymes affected by artemisinin antimalarials
[152] Hiratsuka, M.; Takekuma, Y.; Endo, N.; Narahara, K.; Hamdy, S.I.; Kishikawa, Y.; Matsuura, M.; Agatsuma, Y.; Inoue, T.; Mizugaki, M., Allele and genotype frequencies of CYP2B6 and CYP3A5 in the Japanese population. Eur J Clin Pharmacol. 2002, 58 (6); 417-21.
[153] Myrand, S.; Sekiguchi, K.; Man, M.; Lin, X.; Tzeng, R.Y.; Teng, C.H.; Hee, B.; Garrett, M.; Kikkawa, H.; Lin, C.Y.; Eddy, S.; Dostalik, J.; Mount, J.; Azuma, J.; Fujio, Y.; Jang, I.J.; Shin, S.G.; Bleavins, M.; Williams, J.; Paulauskis, J.; Wilner, K., Pharmacokinetics/Genotype Associations for Major Cytochrome P450 Enzymes in Native and First- and Third-generation Japanese Populations: Comparison With Korean, Chinese, and Caucasian Populations. Clin Pharmacol Ther. 2008, 30 30.
[154] Pang, Y.S.; Wong, L.P.; Lee, T.C.; Mustafa, A.M.; Mohamed, Z.; Lang, C.C., Genetic polymorphism of cytochrome P450 2C19 in healthy Malaysian subjects. Br J Clin Pharmacol., 2004, 58 (3); 332-5.
[155] Tassaneeyakul, W.; Tawalee, A.; Kukongviriyapan, V.; Blaisdell, J.; Goldstein, J.A.; Gaysornsiri, D., Analysis of the CYP2C19 polymorphism in a North-eastern Thai population. Pharmacogenetics. 2002, 12 (3); 221-5.
[156] Gan, S.H.; Ismail, R.; Wan Adnan, W.A.; Zulmi, W., Impact of CYP2D6 genetic polymorphism on tramadol pharmacokinetics and pharmacodynamics. Mol Diagn Ther., 2007, 11 (3); 171-81.
[157] Ji, L.; Pan, S.; Marti-Jaun, J.; Hanseler, E.; Rentsch, K.; Hersberger, M., Single-step assays to analyze CYP2D6 gene polymorphisms in Asians: allele frequencies and a novel *14B allele in mainland Chinese. Clin Chem., 2002, 48 (7); 983-8.
[158] Pakakasama, S.; Mukda, E.; Sasanakul, W.; Kadegasem, P.; Udomsubpayakul, U.; Thithapandha, A.; Hongeng, S., Polymorphisms of drug-metabolizing enzymes and risk of childhood acute lymphoblastic leukemia. Am J Hematol. 2005, 79 (3); 202-5.
[159] Yu, K.S.; Cho, J.Y.; Jang, I.J.; Hong, K.S.; Chung, J.Y.; Kim, J.R.; Lim, H.S.; Oh, D.S.; Yi, S.Y.; Liu, K.H.; Shin, J.G.; Shin, S.G., Effect of the CYP3A5 genotype on the pharmacokinetics of intravenous midazolam during inhibited and induced metabolic states. Clin Pharmacol Ther., 2004, 76 (2); 104-12.
[160] Lee, S.S.; Kim, S.Y.; Kim, W.Y.; Thi-Le, H.; Yoon, Y.R.; Yea, S.S.; Shin, J.G., MDR1 Genetic Polymorphisms and Comparison of MDR1 Haplotype Profiles in Korean and Vietnamese Populations. Ther Drug Monit. 2005, 27 (4); 531-535.
[161] Tang, K.; Ngoi, S.M.; Gwee, P.C.; Chua, J.M.; Lee, E.J.; Chong, S.S.; Lee, C.G., Distinct haplotype profiles and strong linkage disequilibrium at the MDR1 multidrug transporter gene locus in three ethnic Asian populations. Pharmacogenetics., 2002, 12 (6); 437-50.
[162] Zhang, X.; Liu, Z.H.; Zheng, J.M.; Chen, Z.H.; Tang, Z.; Chen, J.S.; Li, L.S., Influence of CYP3A5 and MDR1 polymorphisms on tacrolimus concentration in the early stage after renal transplantation. Clin Transplant., 2005, 19 (5); 638-43.
[163] Qian, W.; Homma, M.; Itagaki, F.; Tachikawa, H.; Kawanishi, Y.; Mizukami, K.; Asada, T.; Inomata, S.; Honda, K.; Ohkohchi, N.; Kohda, Y., MDR1 gene polymorphism in Japanese patients with schizophrenia and mood disorders including depression. Biol Pharm Bull., 2006, 29 (12); 2446-50.
[164] Nosten, F.; White, N.J., Artemisinin-based combination treatment of falciparum malaria. Am J Trop Med Hyg. 2007, 77 (6 Suppl); 181-92.
63