
CUSTOMER LOYALTY IN RETAIL BANKING: …...During this omnichannel transition, success hinges on...
52
CUSTOMER LOYALTY IN RETAIL BANKING: GLOBAL EDITION 2013 What it takes to make loyalty pay off
Transcript of CUSTOMER LOYALTY IN RETAIL BANKING: …...During this omnichannel transition, success hinges on...
CUSTOMER LOYALTY IN RETAIL BANKING: GLOBAL EDITION 2013
What it takes to make loyalty pay off

Copyright © 2013 Bain & Company, Inc. All rights reserved.
Customer loyalty in retail banking: Global edition 2013 | Bain & Company, Inc.
Page i
Contents
Executive summary: What it takes to make loyalty pay off . . . . . . . . . . . . . . . . 2
1. Loyalty trends around the world . . . . . . . . . . . . . . . . . . . . . . . . . . . . . . . . . . 9
2. Leaders and laggards in the shift to omnichannel . . . . . . . . . . . . . . . . . . . . . 15
3. Mobile banking expands its mainstream appeal . . . . . . . . . . . . . . . . . . . . . . 21
4. The battle for scarce new customers . . . . . . . . . . . . . . . . . . . . . . . . . . . . . . . 27
5. Cross-selling: The golden opportunity . . . . . . . . . . . . . . . . . . . . . . . . . . . . . . 33
6. Five ways to realize the fruits of loyalty . . . . . . . . . . . . . . . . . . . . . . . . . . . . 39

Customer loyalty in retail banking: Global edition 2013 | Bain & Company, Inc.
Page 2
What it takes to make loyalty pay off
How exactly does customer loyalty translate into better financial results for a retail bank? And how much value
is at stake? For many bankers, the link between loyalty and financial results is somewhat unclear.
This year’s report, based on Bain’s proprietary research with 190,200 consumers in 27 countries, sheds light
on how banks are using (or failing to use) loyalty to improve the economics of the business. The research was
conducted online in July and August 2013 through market research firms Research Now and GMI.
In some countries, banks made progress in earning customers’ loyalty during 2013, as indicated by a rising Net
Promoter ScoreSM (NPS®). But Bain analysis shows that they are far from exploiting the full potential of that loyalty.
With new customers more scarce, loyalty is half the battle
In all 27 countries surveyed, banks formed new relationships—customers switching their primary bank plus
customers altogether new to banking—at an average rate of about 3% in developed markets and 6% in developing
ones over the past year.
Earning high levels of customer loyalty definitely helps the cause: On average, a bank’s relative NPS explains roughly
half of the variation in its relative win rate—a metric that shows whether a bank is winning more or less than
its fair share of customers. Relatively strong NPS among existing customers thus allows banks such as DKB in
Germany and Bankinter in Spain to win more than their fair share of new customers.
Other factors that influence win rate vary by market, but the factors that customers cite most often include the
level of fees, the convenience of the branch network and the ease of opening an account.
Winning new relationships provides a lifetime of opportunity to sell people more banking products and earn
their advocacy. Given the low rate of new relationship formation, however, this route alone will not be sufficient
as a growth strategy.
The missing payoff from existing customers
Most banks currently miss a significant opportunity for cross-selling to their existing customer base. The steady
expansion of the middle class in emerging markets, combined with digital channels making it easier to purchase
products, has created a huge opportunity to cross-sell, but it has also become easier to buy from a bank other
than your primary provider.
About half of customers in developed countries and 84% in emerging countries opened a new banking product
over the past year. And customers purchased fully one-third of those products, on average, from a bank other
than the customer’s primary bank. Loyalty matters in cross-selling: For almost every product and in every country,
customers who gave their primary bank a high NPS both own and purchase more products from that bank than
customers who gave a low NPS.

Customer loyalty in retail banking: Global edition 2013 | Bain & Company, Inc.
Page 3
The unbundling of financial products has spread through some countries faster than others. In the competitive Hong Kong market, for instance, 77% of customers took a new product, but only 52% chose their primary bank. It’s a different story in Denmark, which has a highly-concentrated banking sector. There, 38% of customers took a new product, and fully 81% stayed with their primary bank. Competitive forces likely will increase over time, giving customers even more bank options.
Yet unbundling does not necessarily limit a bank to only a certain share of its customers’ financial purchases. Product win rates—the share of products bought by respondents at their primary bank—vary even more by bank than by country. In the US, the rates range from 38% to 63%, with Huntington National Bank leading overall. Several years ago, Huntington (which had high NPS to begin with) began to consolidate customer data and build a unified view across all locations and business units. It replaced its manual sales process with an automated one that made it easier for employees to manage cross-selling and upselling opportunities. Huntington has gradually grown the number of products held by customers.
Loyalty plays a key role. The difference in product take-up between customers who are promoters of their primary bank (those who give an NPS of 9 or 10) and customers who are detractors (those giving an NPS of zero to 6) is a healthy 14 percentage points on average for developed countries and 10 points in developing countries.
The winning model: Loyalty plus five capabilities
Our research and client work show that loyalty needs to join up with five specific capabilities in order to spur existing customers to buy more from their primary bank, attract new customers and reduce costs without damaging customer relationships.
1. Decide where you must win and where you’re willing to lose
Banks in many countries have a long history of egalitarian treatment of customers, regardless of how much their marketers segment the customer base. But catering to the average means catering to no one in particular.
Each customer segment has different priorities, expectations and lifetime value for a bank. Our US survey finds, for instance, that older customers care more about branch location and quality of branch staff, while younger customers place greater value on mobile device interactions and rely heavily on recommendations from family, friends and colleagues.
Leading banks not only know such preferences and behaviors well, they act on that knowledge by taking distinctly differentiated tacks for each segment. Some loyalty leaders, for instance, have improved offerings for affluent, high-value customers and wrapped them in premium services. That’s how Citibank has become Asia’s largest wealth manager under the Citigold brand.
Others have created entirely separate models for young adults. In Singapore, OCBC’s “FRANK by OCBC” branches could pass for a hip clothing store. They offer edgy images on debit cards and a simple savings account. What you don’t find at FRANK are tellers or cash.
And some banks profitably serve segments such as pensioners or lower-income customers with good-enough products and service through light-branch formats. In Malaysia, Maybank serves a mass market with self-service kiosks open for extended hours. The kiosks allow customers to open an account with just their identification in 10 minutes, for seven product categories.
Customer loyalty in retail banking: Global edition 2013 | Bain & Company, Inc.
Page 4
2. Design products that pop
Retail banks find it difficult to keep their products distinctive, as product features get copied quickly. At a minimum, banks must at least keep up with the latest features that customers value. Banks also can differentiate products at the margin through innovative pricing or by bundling several products together in appealing ways.
Customers obviously care about product features like interest rates and fees, rewards, ease of transaction and, for more complex products like wealth management, the quality of advice. Banks show a wide variation in how customers perceive their product performance. Among US banks, the share of customers who say their primary bank performs well or extremely well on home mortgages ranges from 62% for the lowest bank to 97% for USAA.
In Australia, Westpac has differentiated its BT Super for Life superannuation account by allowing customers to apply online and to see the account online alongside their current account. St.George links its home equity line of credit to various interest offset accounts, making it easier for customers to manage taxes and investments.
Whether with a current account, credit card or mortgage, the key is to strike the right price-value balance for the target customer. And there’s a minimum menu of offerings necessary just to have credibility in a category.
3. Accelerate the digital transformation
As digital banking spreads, banks increasingly have opportunities to excel at moments of truth in the customer experience, such as resolving fraudulent account activity or giving expert advice. They can also use technologies to delight customers through transactions such as remote deposit capture. Conversely, slow or confusing digital interfaces will quickly annoy customers.
Banks have made significant progress in the shift from a mostly analog world to an omnichannel world, where customers expect to be able to use the channel of their choice when and where it suits them. Yet we’re still in early days with a long way to go.
More than half of customers’ interactions on average took place through online or mobile channels, ranging from 75% in Norway to 38% in Mexico. But many banks could make more of the technology or steer customers to adopt it. Globally, fewer than half of respondents in developing countries and just over one-third of those in developed countries used smartphones or tablets for their banking. The cross-country variation ranges from 60% in China to 17% in Belgium.
In South Korea, fully 56% of customers engage in mobile banking. Hana Bank has consistently focused on digital innovations, such as the ability to withdraw cash from ATMs via smartphone, with only the phone number re-quired, not an account number. Parents can also send money to their children via their smartphones, and the digital currency works at many Korean retail outlets.
Mobile usage also varies within most national markets. Lagging banks and countries should be concerned, because mobility continues to spur customers to recommend their bank. Mobile users give an NPS 25 points higher on average than people who don’t use mobile devices, and that premium rises in countries such as China and Thailand.
As banking moves to an omnichannel world, the future of the physical branch remains an open question. But two things have become clear.

Customer loyalty in retail banking: Global edition 2013 | Bain & Company, Inc.
Page 5
First, too many routine interactions, like making a deposit, take place in the branch in many countries. Banks can no longer afford the cost structure that supports such interactions, which could go through lower-cost, self-service digital channels. Globally, some two-thirds of branch interactions consist of the routine, with only one-third being sales or service.
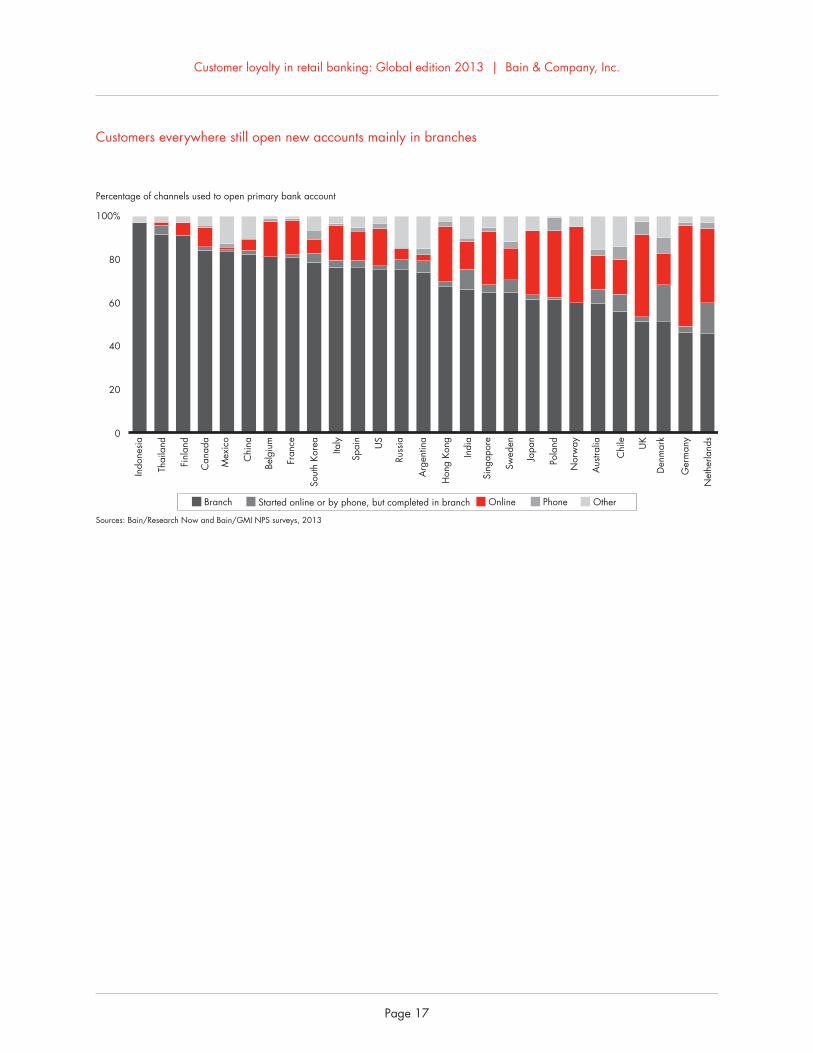
Second, branches in every market remain the dominant channel for starting relationships. Roughly three-quarters of new account openings happen in branches.
During this omnichannel transition, success hinges on making digital channels convenient and defect-free, and on converting branches to more sales-oriented purposes. Nordea, one of the largest Scandinavian banks, has shrunk and modified its branch network so that only 45% of branches now manually handle cash, down from 85% in 2009, and they focus instead on advice and sales.
4. Loyalty gives you the right to win more business—but you do have to ask for the sale
Banks with strong customer loyalty have an open door to win more of their customers’ business. For every financial product and in every country market we have analyzed, we find that promoters buy more products with their primary bank than detractors do.
That doesn’t mean the business comes effortlessly—banks have to ask for it. For example, about one-third of banking products in the US are sold, not bought. That is, customers did not plan to buy a particular product, but they received an offer and then decided to get it.
Returning to Maybank in Malaysia, the bank has chosen to bundle products in a way that make it easy to sell them. Customers apply once for all products and provide all necessary information at that time; they then can activate and access products as needed, through the channel of their choice.
In Australia, Hong Kong and India, Citibank excels in onboarding and then cross-selling to customers, particularly in wealth management. Citibank mandates that every relationship manager raises his or her customers’ share of wallet each quarter.
Some banks that are loyalty leaders score low on the sales metric, but the good news is that their customers accept the right kind of sales overtures. Other banks have high selling scores but lag on NPS. These players will want to concentrate on adjusting the tone of their selling and delivering a better experience after the sale.
5. Build branding that delivers more trust, less buzz
The brand interacts with the other elements discussed here and either enhances or degrades each one. In fact, a bank’s NPS tends to be highly correlated with its brand strength.
Banks’ standing among regulators, legislators and the broad public took a hit in the years following the financial crisis. In response, many banks have increased their advertising and other forms of explicit marketing over the past few years, with the hope of restoring their image.
Although building awareness can be useful, a new brand campaign by itself merely applies a fresh coat of paint on a rusty ship, rather than repairing the engine and hull. Rebuilding trust involves a slow, steady process. Credibility comes by telling the story of what a bank has to offer, not what it wishes to be. And that story also gets shaped by the daily interactions with customers.
Customer loyalty in retail banking: Global edition 2013 | Bain & Company, Inc.
Page 6
Hang Seng in Hong Kong, for example, promotes the attributes of a friendly, service-oriented local bank. Hang Seng reinforces these brand attributes not only through activities with local neighborhoods and universities, but also through convenient branch locations in the local transit system and through staff training.
A customer-led, not marketing-led, perspective on the brand leads bank managers to spend their time differently. Instead of asking brand questions (“Should we rebrand?” “What logo and tagline should we use?”), managers will find it more effective to start with customer questions (“What do our best customers say about us?” “How can we amplify that?”).
• • •
A few large incumbent banks have made meaningful progress on several of the five elements. Consider JPMorgan Chase in the US. Of all the national banks, Chase posted the biggest NPS gains in 2013, moving from the third quartile to the second quartile and opening a lead over other national banks. That’s due to such factors as select investments in mobile technology, a concerted effort to improve the customer experience and effective marketing to tell people how the bank can simplify their financial lives. Those factors also combined to help Chase perform well above average in winning new relationships and cross-selling to existing customers.
Every bank can benchmark against competitors in its home market and the best performers globally. This report introduces the relevant framework and metrics to do so, with an eye toward making focused investments that will generate superior growth, and make loyalty pay.

Customer loyalty in retail banking: Global edition 2013 | Bain & Company, Inc.
Page 7


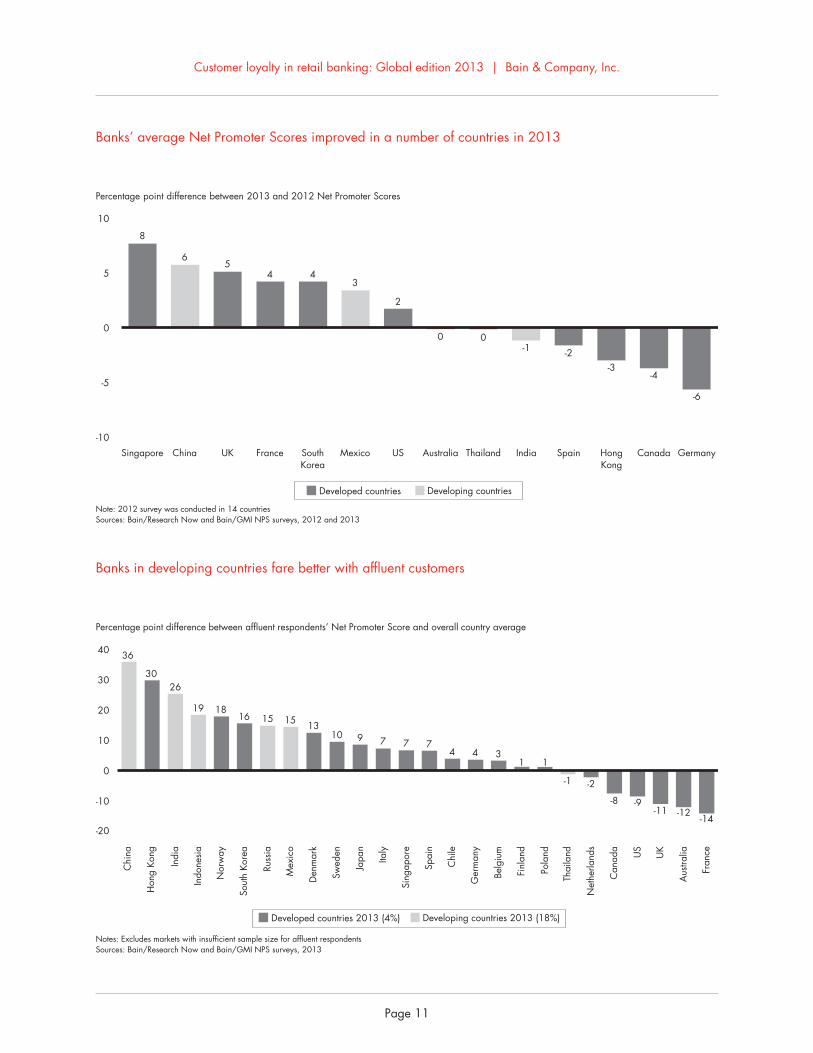
• In some countries, customer loyalty as measured by NPS improved in 2013 from the year earlier, as the financial crisis recedes and some banks have devoted more effort to addressing customers’ priorities . The continued surge in mobile banking no doubt contributed to higher scores, because mobile tools have a strong, positive effect on customer advocacy .
• NPS varies by country and is generally higher in developing countries . But what matters most to an individual bank is how it performs relative to its peer group . Within national markets, NPS varies widely from bank to bank . In Australia, for instance, top-performer Bendigo has an NPS 45 points higher than the worst performer and 32 points above the country average .
• For the first time in a US region, a national bank leads the traditional banks in NPS, with Chase out front in the South . In 2011, Chase started a deliberate effort to become more customer-centered rather than product-centered, and that shift has paid off with gains in loyalty, new relationships and share of wallet .
• Wealthier customers have a high economic value when banks earn their advocacy . Banks in devel-oping markets, like China and India, generally do better in targeting and serving affluent customers, which is reflected in their NPS scores from the affluent . Banks in Canada, the US, the UK, Aus-tralia and France still struggle in this regard .
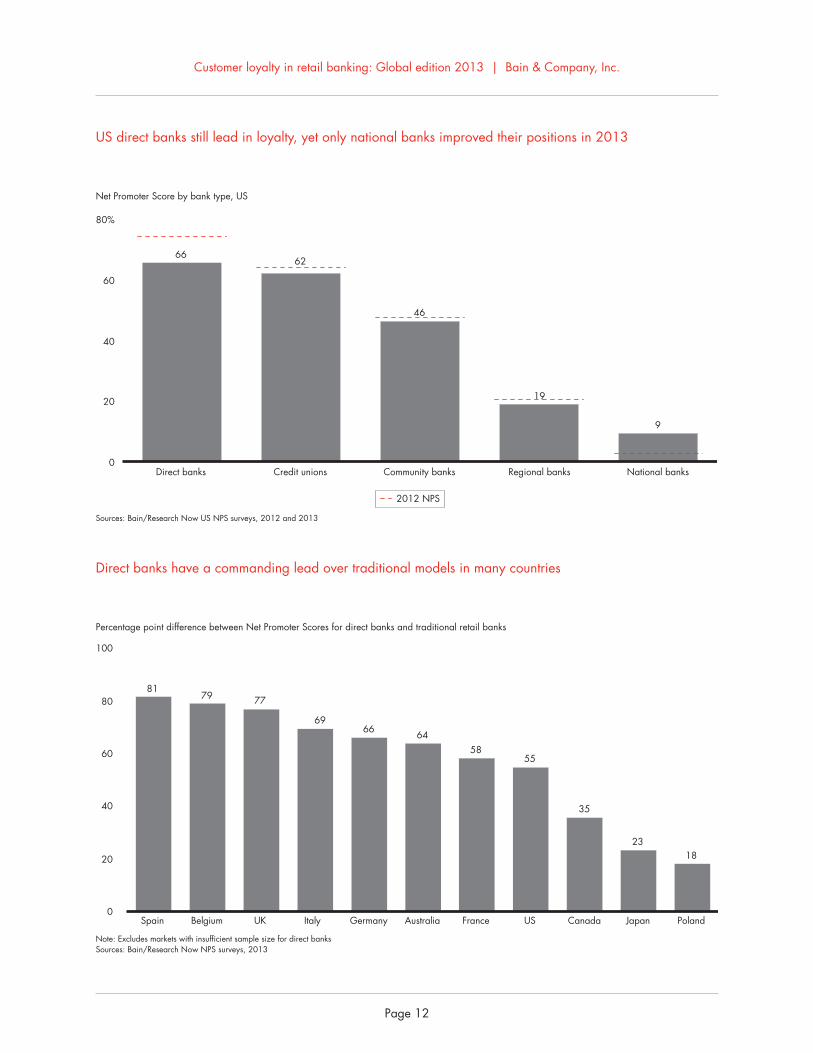
• Direct banks such as ING and First Direct have been the NPS leaders in many countries for several years . They often target self-directed, digital-savvy customers with a simple proposition around low cost, high rates and fast processes .
1.Loyalty trends around the world

Customer loyalty in retail banking: Global edition 2013 | Bain & Company, Inc.
Page 10
Within each country, there’s a wide range of Net Promoter Scores
UK
Spain
Poland
Italy
Germany
France
Belgium
Euro
pe
Notes: Excludes markets with insufficient number of banks (n≥200); country averages include all banks; highest and lowest banks include only banks where n≥200 Sources: Bain/Research Now NPS surveys, 2013
Primary bank Net Promoter Scores
Thailand
South Korea
Singapore
Japan
Hong Kong
China
Australia
US-West
US-South
US-Midwest
US-Northeast
Mexico
Canada
Banorte
President’s Choice FinancialTD Canada Trust
USAA
USAA
M&T, TD
BB&T, JPMorgan Chase
USAABank of the West
USAAHuntington
Bendigo Bank
China Merchants
Standard Chartered
Japan Post Bank
Kookmin
SCB
Standard Chartered
Average
Highest traditional bank
Highest direct bankLowest bank
-80 -60 -40 -20 0 20 40 60 80 100%
Am
eric
asA
sia-
Paci
fic
Argenta Spaarbank
First DirectNationwide
Credit Mutuel
Alior Bank
Banca Nazionale del Lavoro
BankinterING
DKBSparda-Bank
Fineco
Customer loyalty in retail banking: Global edition 2013 | Bain & Company, Inc.
Page 11
Banks in developing countries fare better with affluent customers
Banks’ average Net Promoter Scores improved in a number of countries in 2013
-20
-10
0
10
20
30
40
Percentage point difference between affluent respondents’ Net Promoter Score and overall country average
36
3026
19 1816 15 15 13
10 9 7 7 74 4 3
1 1
-1 -2
-11 -12-14
-8 -9
Notes: Excludes markets with insufficient sample size for affluent respondentsSources: Bain/Research Now and Bain/GMI NPS surveys, 2013
Developed countries 2013 (4%) Developing countries 2013 (18%)
Chi
na
Hon
g Ko
ng
Indi
a
Indo
nesi
a
Nor
way
Sout
h Ko
rea
Russ
ia
Mex
ico
Den
mar
k
Swed
en
Japa
n
Italy
Sing
apor
e
Spai
n
Chi
le
Ger
man
y
Belg
ium
Finl
and
Pola
nd
Thai
land
Net
herla
nds
Can
ada
US
UK
Aus
tralia
Fran
ce
-10
-5
0
5
10
Percentage point difference between 2013 and 2012 Net Promoter Scores
8
65
4 43
2
0 0-1 -2
-3-4
-6
Singapore
Note: 2012 survey was conducted in 14 countriesSources: Bain/Research Now and Bain/GMI NPS surveys, 2012 and 2013
China UK France SouthKorea
Mexico US Australia Thailand India Spain HongKong
Canada Germany
Developed countries Developing countries
Customer loyalty in retail banking: Global edition 2013 | Bain & Company, Inc.
Page 12
Direct banks have a commanding lead over traditional models in many countries
US direct banks still lead in loyalty, yet only national banks improved their positions in 2013
0
20
40
60
80
100
Percentage point difference between Net Promoter Scores for direct banks and traditional retail banks
Spain
81
Belgium
79
UK
77
6966 64
58
US
55
Canada
35
Japan
23
Poland
18
Italy Germany Australia France
Note: Excludes markets with insufficient sample size for direct banksSources: Bain/Research Now NPS surveys, 2013
0
20
40
60
80%
Net Promoter Score by bank type, US
Direct banks
66
Credit unions
62
Community banks
46
Regional banks
19
National banks
9
Sources: Bain/Research Now US NPS surveys, 2012 and 2013
2012 NPS

Customer loyalty in retail banking: Global edition 2013 | Bain & Company, Inc.
Page 13


• Banks everywhere are expanding digital channels, but the pace of engagement varies dramatically . The Nordic countries lead in the share of digital banking interactions, while a number of Asian countries lag .
• Generational differences in digital usage persist . For example, some 18% of US customers under age 35 opened an account online, twice as many as customers over age 55 .
• Countries vary in the pace of their evolution to de-ploy each type of channel to advantage . Some countries, particularly the Nordic countries, have made significant progress in steering routine trans-actions out of the branch and into lower-cost, self-service digital channels, including smart ATMs .
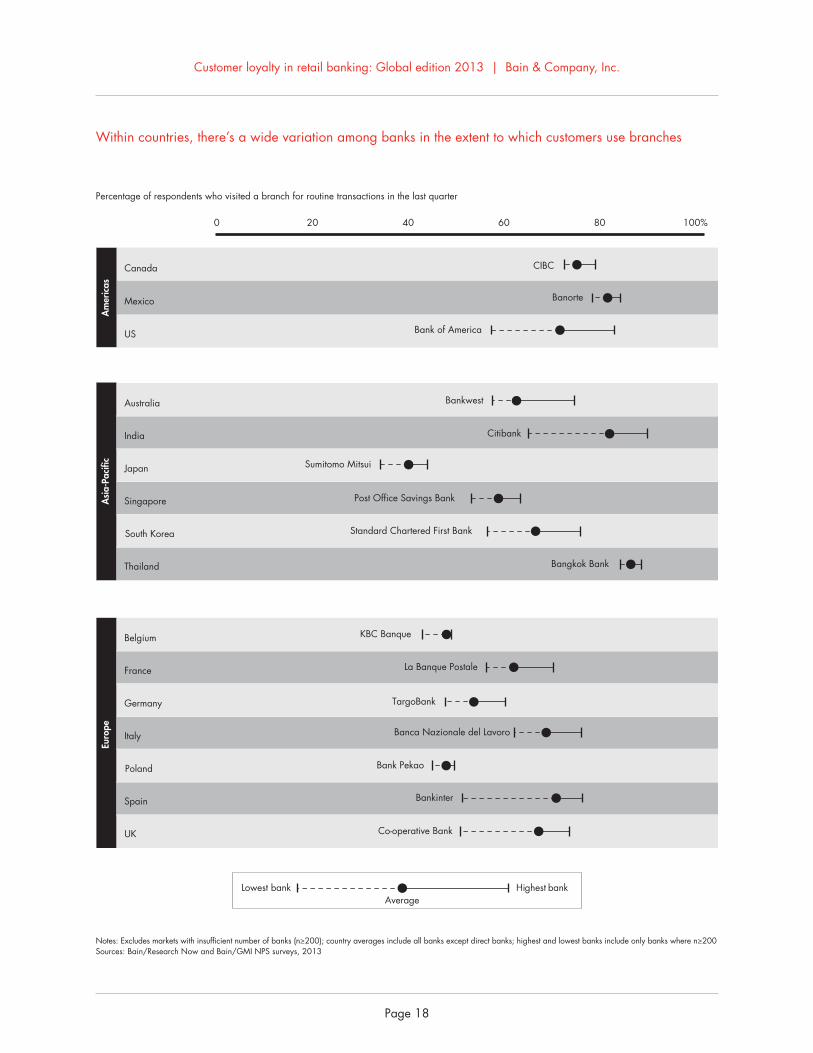
• Within most countries, individual banks vary widely in their progress to move the routine to digital chan-nels and refocus the branch on sales and high-value service . In Spain, for instance, Bankinter leads the least digital bank by 25 percentage points .
• When it comes to account opening, direct banks excel in handling the task online . Yet among other banks, account opening still occurs mostly in the branch, though that’s shifting to the phone in the UK, Germany and the Netherlands .
• Experiments with branch features and layout abound . Raiffeisen’s flagship branch in Zurich offers advanced technologies such as a robotic retrieval system for round-the-clock access to safety deposit boxes . Other banks have launched branches that resemble lounges or cafes, either to complement a strong direct bank presence or to encourage high-value relationships .
• ATMs play an outsize role in Japan, Indonesia, Russia and Singapore . In a few places like Singa-pore, more versatile ATMs make customers’ lives easier by allowing them to buy airline tickets or pay parking fines .
2.Leaders and laggards in the shift to omnichannel

Customer loyalty in retail banking: Global edition 2013 | Bain & Company, Inc.
Page 16
Developing countries still rely more on branches, on average, while the Nordic countries are eliminating routine transactions from their branches
On the path to an omnichannel world, some countries are lagging in digital banking
0
2
4
6
87 7 7
76 6 6
5 5 5 5 4 4 4 4 3 3 3 33
2 2 2 11 1 1
Number of branch interactions per respondent in the last quarter
Sales/service
73 396682 47 4064 48 6081 69 59 20297173 39 27 2280 7186 88 66 65 64 62Percentage of respondents using branch for routine interaction at least once
Sources: Bain/Research Now and Bain/GMI NPS surveys, 2013
Rout
ine
Thai
land
Mex
ico
Chi
na
Indi
a
Chi
le
Arg
entin
a
Sout
h Ko
rea
Spai
n
Hon
g Ko
ng
Indo
nesi
a
US
Can
ada
Italy
Russ
ia UK
Ger
man
y
Fran
ce
Aus
tralia
Sing
apor
e
Belg
ium
Pola
nd
Japa
n
Den
mar
k
Swed
en
Nor
way
Finl
and
Net
herla
nds
Developed countries Developing countries
Chi
le
Chi
na
Spai
n0
20
40
60
80
100%
Percentage of interactions by channel in the last quarter
Nor
way
Den
mar
k
Swed
en
Aus
tralia
Net
herla
nds
US
Ger
man
y
Sout
h Ko
rea
Belg
ium
Pola
nd
Fran
ce
Can
ada
UK
Arg
entin
a
Sing
apor
e
Italy
Russ
ia
Hon
g Ko
ng
Indo
nesi
a
Indi
a
Japa
n
Thai
land
Mex
ico
Sources: Bain/Research Now and Bain/GMI NPS surveys, 2013
OtherPhoneBranchATMSmartphone/tabletOnline
Customer loyalty in retail banking: Global edition 2013 | Bain & Company, Inc.
Page 17
Customers everywhere still open new accounts mainly in branches
Sources: Bain/Research Now and Bain/GMI NPS surveys, 2013
OtherPhoneStarted online or by phone, but completed in branchBranch Online
0
20
40
60
80
100%
Percentage of channels used to open primary bank account
Indo
nesi
a
Thai
land
Finl
and
Can
ada
Mex
ico
Chi
na
Belg
ium
Fran
ce
Sout
h Ko
rea
Italy
Spai
n
US
Russ
ia
Arg
entin
a
Hon
g Ko
ng
Indi
a
Sing
apor
e
Swed
en
Japa
n
Pola
nd
Nor
way
Aus
tralia
Chi
le UK
Den
mar
k
Ger
man
y
Net
herla
nds
Customer loyalty in retail banking: Global edition 2013 | Bain & Company, Inc.
Page 18
Within countries, there’s a wide variation among banks in the extent to which customers use branches
Notes: Excludes markets with insufficient number of banks (n≥200); country averages include all banks except direct banks; highest and lowest banks include only banks where n≥200 Sources: Bain/Research Now and Bain/GMI NPS surveys, 2013
Percentage of respondents who visited a branch for routine transactions in the last quarter
AverageHighest bankLowest bank
UK
Spain
Poland
Italy
Germany
France
Belgium
Euro
pe
Thailand
South Korea
Singapore
Japan
India
Australia
US
Mexico
Canada
0 20 40 60 80 100%
Am
eric
asA
sia-
Paci
fic
Bankwest
Citibank
CIBC
Bank of America
Banorte
Sumitomo Mitsui
Bangkok Bank
Post Office Savings Bank
Standard Chartered First Bank
KBC Banque
Co-operative Bank
TargoBank
Bankinter
Bank Pekao
Banca Nazionale del Lavoro
La Banque Postale

Customer loyalty in retail banking: Global edition 2013 | Bain & Company, Inc.
Page 19


• Across the globe, mobile banking continues to spread . Customers have embraced banking on their smartphones and tablets when banks offer appli-cations that are both useful and easy to navigate .
• Commonwealth Bank of Australia, for example, offers a versatile mobile platform that allows cus-tomers to trade stocks, pay third parties using their mobile number or email, and explore visual and written details of homes for sale .
• China, Chile, South Korea and India have leap-frogged other countries that lag in mobility, like Belgium, Japan and Canada . In general, the devel-oping countries have forged further ahead, and several have more than half of their respondents using mobile channels . They show an especially big lead in mobile payments, with almost twice the level of activity as developed countries .
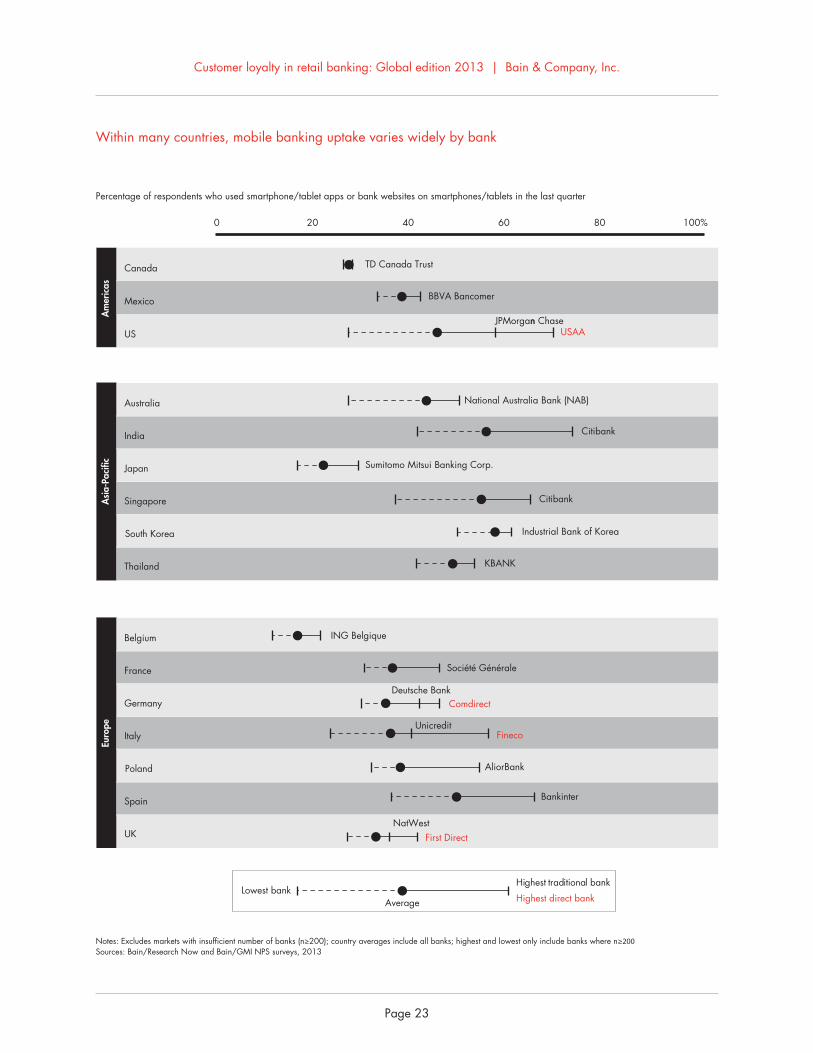
• Within a given country, however, there’s a wide dispersion in mobile uptake . And not all of the mobile leaders are direct banks . Citibank in India has a higher mobile penetration than Comdirect in Germany and Fineco in Italy . In the US, Chase leads among traditional banks . It invested heavily in mobile technology such as smartphone pay-ments, and its recent advertising highlights how the technology simplifies people’s lives .
• Regardless of bank model, frequent mobile users consistently report higher NPS than non-users . The greatest gap in NPS between the two groups occurs in China, Japan and Thailand, while the narrowest gap is found in Belgium, France and the Netherlands .
• Mobile banking has risen among all age groups and income levels . But younger customers rank as the most avid users, especially in Australia, the US, India and Sweden .
3.Mobile banking expands its mainstream appeal

Customer loyalty in retail banking: Global edition 2013 | Bain & Company, Inc.
Page 22
Mobile payment has caught on fastest in developing countries
Mobile banking adoption varies widely across countries
0
10
20
30
40
50%
Percentage of respondents who used smartphone/tablet to make payments in the last quarter
49
40 40
35 3432
2826
2321 21 21 20 19 19 19 18 17 17
15 14 13 13 1210
7 6
Sources: Bain/Research Now and Bain/GMI NPS surveys, 2013
Developed countries (19%) Developing countries (30%)
Chi
na
Indi
a
Chi
le
Sout
h Ko
rea
Indo
nesi
a
Sing
apor
e
Hon
g Ko
ng
Russ
ia
Aus
tralia
Spai
n
Arg
entin
a
Thai
land
Mex
ico
Nor
way
Swed
en US
Den
mar
k
Italy
Net
herla
nds
Finl
and
Pola
nd UK
Ger
man
y
Can
ada
Fran
ce
Belg
ium
Japa
n
Sources: Bain/Research Now and Bain/GMI NPS surveys, 2013
0
20
40
60%
Percentage of respondents who used smartphone/tablet apps or bank websites on smartphones/tablets in the last quarter
6057 56 55 54 53 52
49 4845
4340 38 38 38 37 37 36 35 33 32 31
27 27 2622
17
5 23 35 4 58484 55 48 575 75 445 10 9 68
Developed countries (38%) Developing countries (46%)
Average interactions per respondent in last quarter
Chi
na
Chi
le
Sout
h Ko
rea
Indi
a
Sing
apor
e
Hon
g Ko
ng
Indo
nesi
a
Spai
n
Thai
land US
Aus
tralia
Nor
way
Pola
nd
Swed
en
Mex
ico
Russ
ia
Fran
ce
Italy
Ger
man
y
UK
Finl
and
Arg
entin
a
Den
mar
k
Net
herla
nds
Can
ada
Japa
n
Belg
ium
Customer loyalty in retail banking: Global edition 2013 | Bain & Company, Inc.
Page 23
Within many countries, mobile banking uptake varies widely by bank
UK
Spain
Poland
Italy
Germany
France
Belgium
Euro
pe
Notes: Excludes markets with insufficient number of banks (n≥200); country averages include all banks; highest and lowest only include banks where n≥200Sources: Bain/Research Now and Bain/GMI NPS surveys, 2013
Percentage of respondents who used smartphone/tablet apps or bank websites on smartphones/tablets in the last quarter
Thailand
South Korea
Singapore
Japan
India
Australia
US
Mexico
Canada
Average
Highest traditional bank
Highest direct bankLowest bank
0 20 40 60 80 100%
Am
eric
asA
sia-
Paci
fic
JPMorgan n Chase
Citibank
National Australia Bank (NAB)
Sumitomo Mitsui Banking Corp.
BBVA Bancomer
USAA
TD Canada Trust
Citibank
KBANK
Industrial Bank of Korea
Bankinter
First DirectNatWest
ING Belgique
AliorBank
ComdirectDeutsche Bank
Société Générale
FinecoUnicredit

Customer loyalty in retail banking: Global edition 2013 | Bain & Company, Inc.
Page 24
Frequent mobile banking users give much higher loyalty scores than other customers
Younger customers have embraced mobility
0
10
20
30
40
50
42
36 36 34 33 33
28 28 27 27 2624 23 22
21 2017
14
10 108
6 5
Percentage point difference in Net Promoter Scores between frequent mobile banking users and nonusers
Notes: Mobile banking includes use of smartphone/tablet apps and bank websites via smartphone/tablet; frequent users are defined as those in the top quartile for the number of bank interactions using smartphone/tablet apps and bank websites via mobile devices; markets where n≥100 for any category were excludedSources: Bain/Research Now and Bain/GMI NPS surveys, 2013
Developed countries Developing countries
Chi
na
Japa
n
Thai
land
Italy
Hon
g Ko
ng
Sing
apor
e
Russ
ia
Pola
nd
Indo
nesi
a
Spai
n
Swed
en
Chi
le
Indi
a
Mex
ico
Sout
h Ko
rea
Ger
man
y
UK US
Aus
tralia
Can
ada
Net
herla
nds
Fran
ce
Belg
ium
0
10
20
30
40
5046
40
36 3634
31
2624 23 23 23
1918
9
Percentage point difference in usage of banking smartphone/tablet app or bank website on smartphone/tablet between respondents under 35 and those over 55
Note: Excluded markets where n<100 for either age categorySources: Bain/Research Now and Bain/GMI NPS surveys, 2013
Australia US India Sweden UK Canada France Spain Mexico Italy Netherlands Germany Belgium Japan

Customer loyalty in retail banking: Global edition 2013 | Bain & Company, Inc.
Page 25

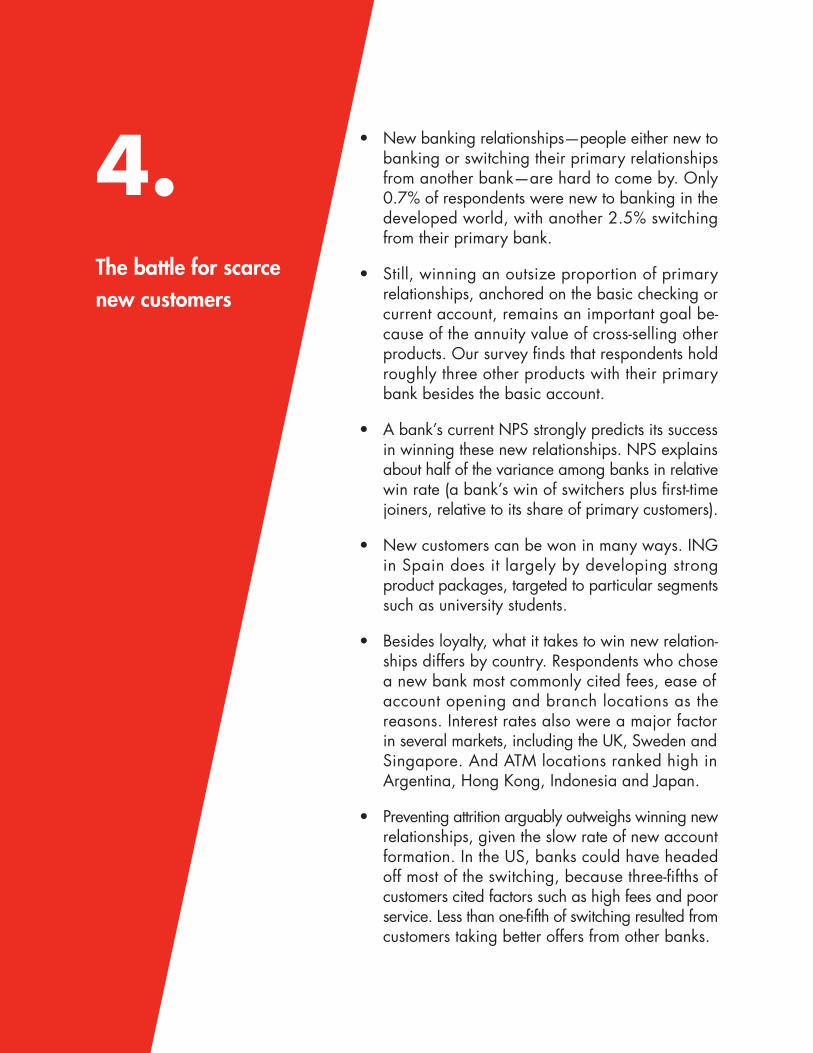
• New banking relationships—people either new to banking or switching their primary relationships from another bank—are hard to come by . Only 0 .7% of respondents were new to banking in the developed world, with another 2 .5% switching from their primary bank .
• Still, winning an outsize proportion of primary relationships, anchored on the basic checking or current account, remains an important goal be-cause of the annuity value of cross-selling other products . Our survey finds that respondents hold roughly three other products with their primary bank besides the basic account .
• A bank’s current NPS strongly predicts its success in winning these new relationships . NPS explains about half of the variance among banks in relative win rate (a bank’s win of switchers plus first-time joiners, relative to its share of primary customers) .
• New customers can be won in many ways . ING in Spain does it largely by developing strong product packages, targeted to particular segments such as university students .
• Besides loyalty, what it takes to win new relation-ships differs by country . Respondents who chose a new bank most commonly cited fees, ease of account opening and branch locations as the reasons . Interest rates also were a major factor in several markets, including the UK, Sweden and Singapore . And ATM locations ranked high in Argentina, Hong Kong, Indonesia and Japan .
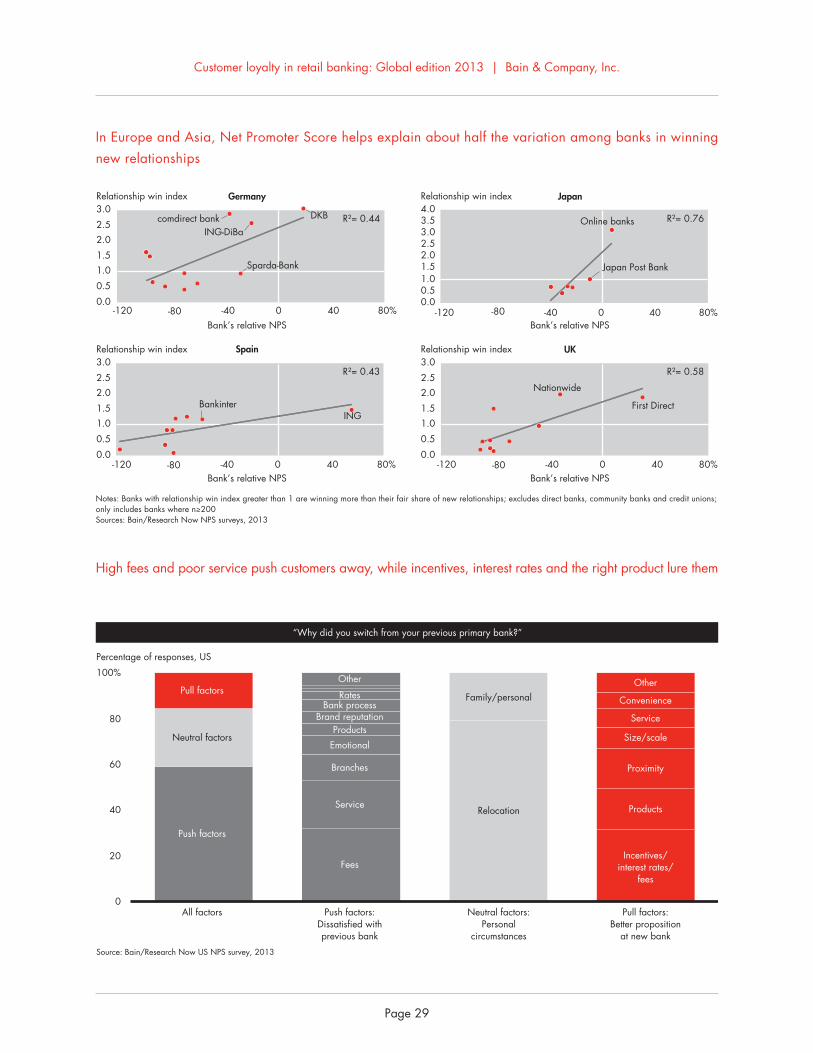
• Preventing attrition arguably outweighs winning new relationships, given the slow rate of new account formation . In the US, banks could have headed off most of the switching, because three-fifths of customers cited factors such as high fees and poor service . Less than one-fifth of switching resulted from customers taking better offers from other banks .
4.The battle for scarce new customers
Customer loyalty in retail banking: Global edition 2013 | Bain & Company, Inc.
Page 28
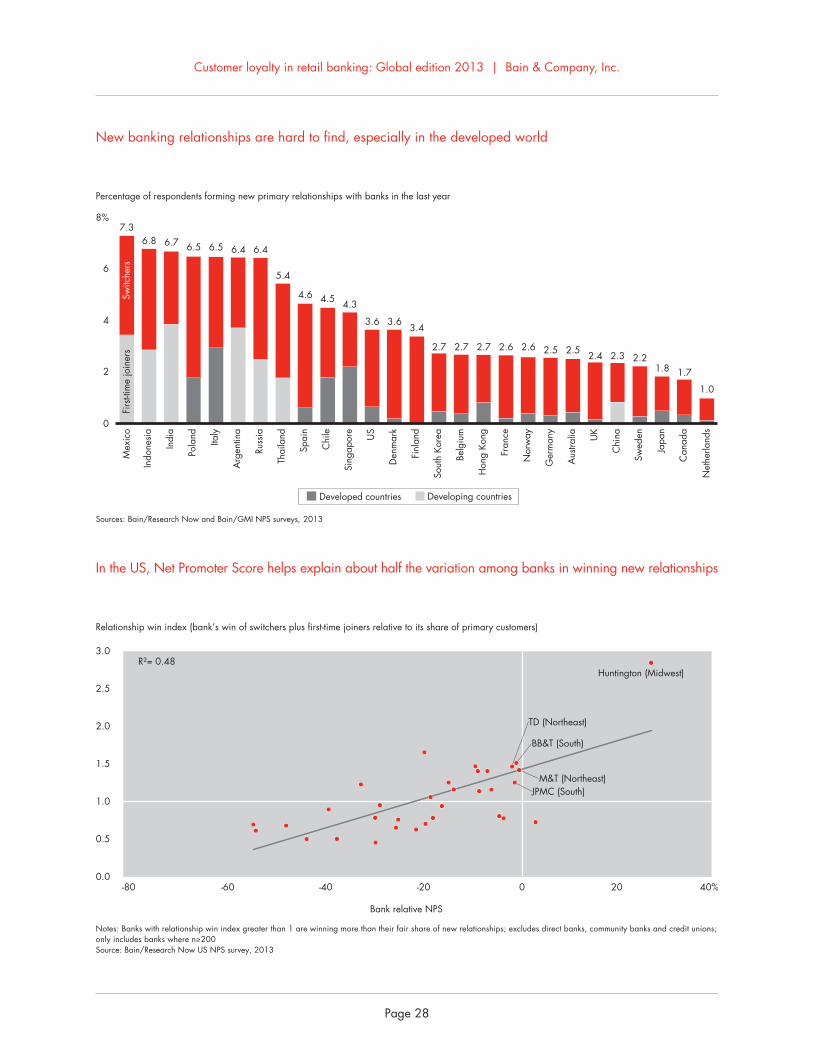
In the US, Net Promoter Score helps explain about half the variation among banks in winning new relationships
New banking relationships are hard to find, especially in the developed world
0.0
0.5
1.0
1.5
2.0
2.5
3.0
-80 -60 -40 -20 0 20 40%
Bank relative NPS
Relationship win index (bank’s win of switchers plus first-time joiners relative to its share of primary customers)
Huntington (Midwest)
JPMC (South)
BB&T (South)
TD (Northeast)
M&T (Northeast)
Notes: Banks with relationship win index greater than 1 are winning more than their fair share of new relationships; excludes direct banks, community banks and credit unions; only includes banks where n≥200Source: Bain/Research Now US NPS survey, 2013
R²= 0.48
0
2
4
6
8%
Percentage of respondents forming new primary relationships with banks in the last year
Developed countries Developing countries
Sources: Bain/Research Now and Bain/GMI NPS surveys, 2013
Switc
hers
Firs
t-tim
e jo
iner
s
7.3
Mex
ico
Indo
nesi
a
Indi
a
Pola
nd
Italy
Arg
entin
a
Russ
ia
Thai
land
Spai
n
Chi
le
Sing
apor
e
US
Den
mar
k
Finl
and
Sout
h Ko
rea
Belg
ium
Hon
g Ko
ng
Fran
ce
Nor
way
Ger
man
y
Aus
tralia UK
Chi
na
Swed
en
Japa
n
Can
ada
Net
herla
nds
6.8 6.7 6.5 6.5 6.4 6.4
5.4
4.6 4.5 4.3
3.6 3.63.4
2.7 2.7 2.7 2.6 2.6 2.5 2.5 2.4 2.3 2.21.8 1.7
1.0
Customer loyalty in retail banking: Global edition 2013 | Bain & Company, Inc.
Page 29
In Europe and Asia, Net Promoter Score helps explain about half the variation among banks in winning new relationships
Germany Japan
UKSpain
0.0
0.5
1.01.5
2.02.5
3.0
-120 -80 -40 0 40 80%Bank’s relative NPS
Relationship win index
comdirect bank
Sparda-Bank
DKB
0.0
0.5
1.01.5
2.02.5
3.0
-120 -80 -40 0 40 80%Bank’s relative NPS
Relationship win index
BankinterING
R²= 0.43
0.0
0.5
1.01.5
2.02.5
3.0
-120 -80 -40 0 40 80%Bank’s relative NPS
Relationship win index
Nationwide
First Direct
R²= 0.58
0.00.51.01.52.02.53.03.54.0
-120 -80 -40 0 40 80%Bank’s relative NPS
Relationship win index
Online banks
Japan Post Bank
Notes: Banks with relationship win index greater than 1 are winning more than their fair share of new relationships; excludes direct banks, community banks and credit unions; only includes banks where n≥200Sources: Bain/Research Now NPS surveys, 2013
ING-DiBaR²= 0.44 R²= 0.76
High fees and poor service push customers away, while incentives, interest rates and the right product lure them
0
20
40
60
80
100%
All factors
Push factors
Neutral factors
Pull factors
Push factors:Dissatisfied withprevious bank
Service
Branches
Fees
Rates
Products
Emotional
Bank process
Other
Neutral factors:Personal
circumstances
Family/personal
Relocation
Pull factors:Better proposition
at new bank
Other
Incentives/interest rates/
fees
Proximity
Products
Convenience
Service
Size/scale
“Why did you switch from your previous primary bank?”
Percentage of responses, US
Brand reputation
Source: Bain/Research Now US NPS survey, 2013

Customer loyalty in retail banking: Global edition 2013 | Bain & Company, Inc.
Page 30
Reasons for choosing a new bank differ across countries, though fees and ease of account opening often lead the list
Countries
Respondents’ ranking of importance of factors for choosing a new bank
Fees
Ease
of o
peni
ng
acco
unt
Bran
ch lo
catio
ns
Onl
ine
serv
ice
Prod
uct f
eatu
res
ATM
loca
tions
Bran
ch s
taff
Inte
rest
rate
s
Com
pany
bra
nd
Fam
ily
reco
mm
enda
tions
Bran
ch h
ours
Abi
lity
to g
et
cred
it
Fina
ncia
l adv
isor
Mob
ile p
aym
ents
Phon
e se
rvic
e
Mob
ile/t
able
t ap
p
Prio
r rel
atio
nshi
p w
ith b
ank
Soci
al m
edia
re
com
men
datio
ns
Argentina 12 3 5 7 7 1 2 11 3 5 18 7 10 16 14 15 13 17
Canada 2 5 4 8 1 9 3 6 6 10 10 13 12 15 14 16 17 18
Chile 2 1 3 5 9 5 9 7 4 7 18 14 9 12 15 17 16 13
Mexico 3 2 1 12 8 5 6 11 4 14 7 9 10 15 13 17 16 18
US 1 5 2 6 3 4 7 11 8 9 10 15 17 12 14 13 16 18
Australia 2 4 5 7 3 9 8 1 6 11 12 10 12 15 15 14 17 18
China 2 6 1 4 9 2 6 11 4 14 8 14 14 9 11 11 17 18
Hong Kong 2 9 3 3 9 1 5 5 8 9 5 9 14 17 14 16 13 18
India 12 1 6 1 4 5 6 8 3 11 13 15 14 16 10 8 17 18
Indonesia 9 2 3 7 12 1 8 11 5 15 3 14 16 4 13 10 18 17
Japan 2 6 3 4 12 1 9 5 6 9 6 13 16 9 16 15 14 18
Singapore 3 6 4 8 7 2 9 1 4 9 9 12 14 16 18 15 12 16
South Korea 1 8 2 11 3 3 7 5 6 8 8 14 14 11 16 16 11 18
Thailand 6 4 3 8 7 1 5 12 15 16 2 13 9 13 9 9 17 18
Belgium 2 1 6 8 7 9 4 3 5 11 12 10 15 17 14 16 12 18
Denmark 1 6 11 5 4 11 3 2 9 8 15 11 7 11 10 15 15 18
Finland 1 4 6 3 5 17 9 2 11 15 7 8 10 13 11 15 13 17
France 1 6 10 3 4 18 5 2 9 11 12 7 8 16 13 14 15 17
Germany 1 2 5 4 8 3 9 7 13 11 15 16 12 6 14 17 10 18
Italy 1 2 6 4 8 2 5 9 10 7 12 13 11 16 14 15 18 17
Netherlands 8 1 3 3 2 5 5 13 5 15 9 16 11 11 9 14 18 17
Norway 1 3 17 3 5 14 6 1 7 10 17 10 8 10 17 14 8 16
Poland 1 5 9 2 3 3 6 11 10 12 14 15 13 7 16 8 18 17
Russia 2 3 4 7 11 1 9 5 6 10 13 7 14 15 16 17 12 18
Spain 1 5 9 4 3 6 7 8 2 9 11 15 13 16 14 12 17 18
Sweden 3 2 7 3 3 9 6 1 8 10 10 13 12 15 17 14 15 18
UK 5 3 8 4 2 12 7 1 6 9 11 16 17 15 10 14 13 18
Sources: Bain/Research Now and Bain/GMI NPS surveys, 2013
Americas
Asia-Pacific
Europe

Customer loyalty in retail banking: Global edition 2013 | Bain & Company, Inc.
Page 31

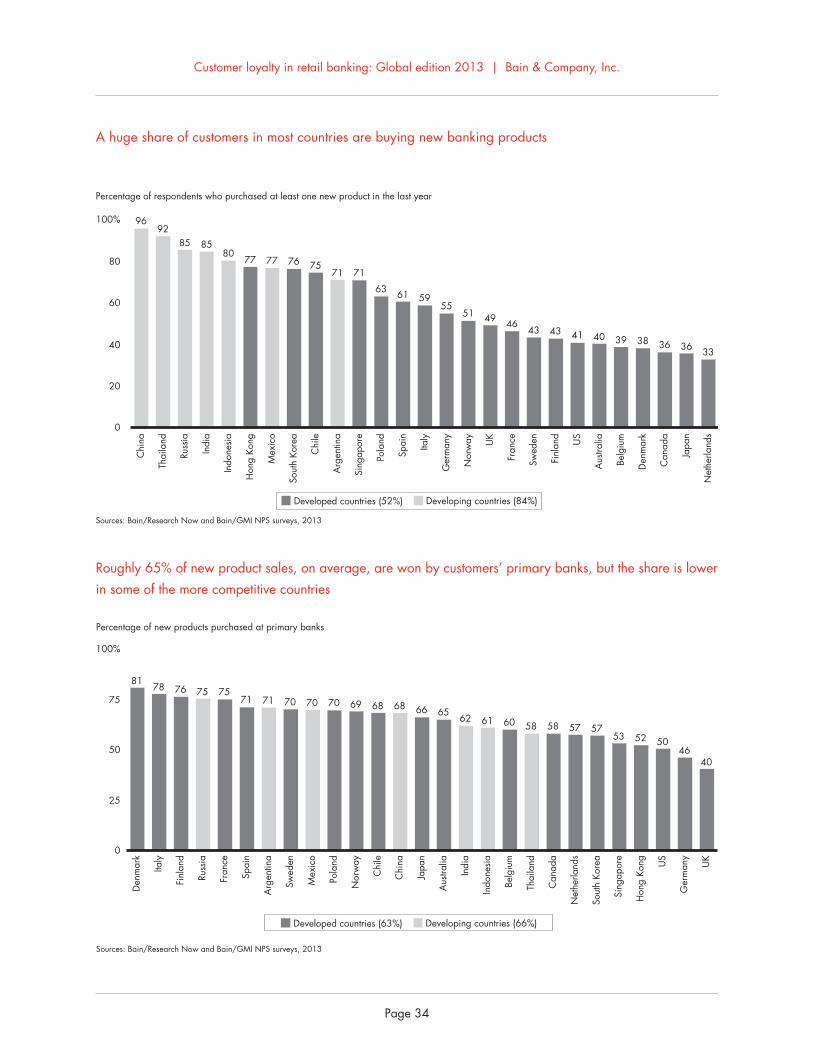
• A surprisingly large opportunity exists to sell new products such as credit cards to existing customers . In the developing countries, 83% of respondents purchased a new product over the past year; in the developed countries, 50% did .
• While the primary bank captures most of these new products, on average, 35% of new product sales go to a competitor . The competitors’ share ranges from 19% in Denmark, which has a very concen-trated banking sector, to a remarkable 60% in the UK and 54% in Germany, where the global trend to unbundle product holding has gone further . The UK and German markets have many specialized challenger banks, as well as customers who have a low regard for large banks after the crisis and, in Germany, who are highly price sensitive .
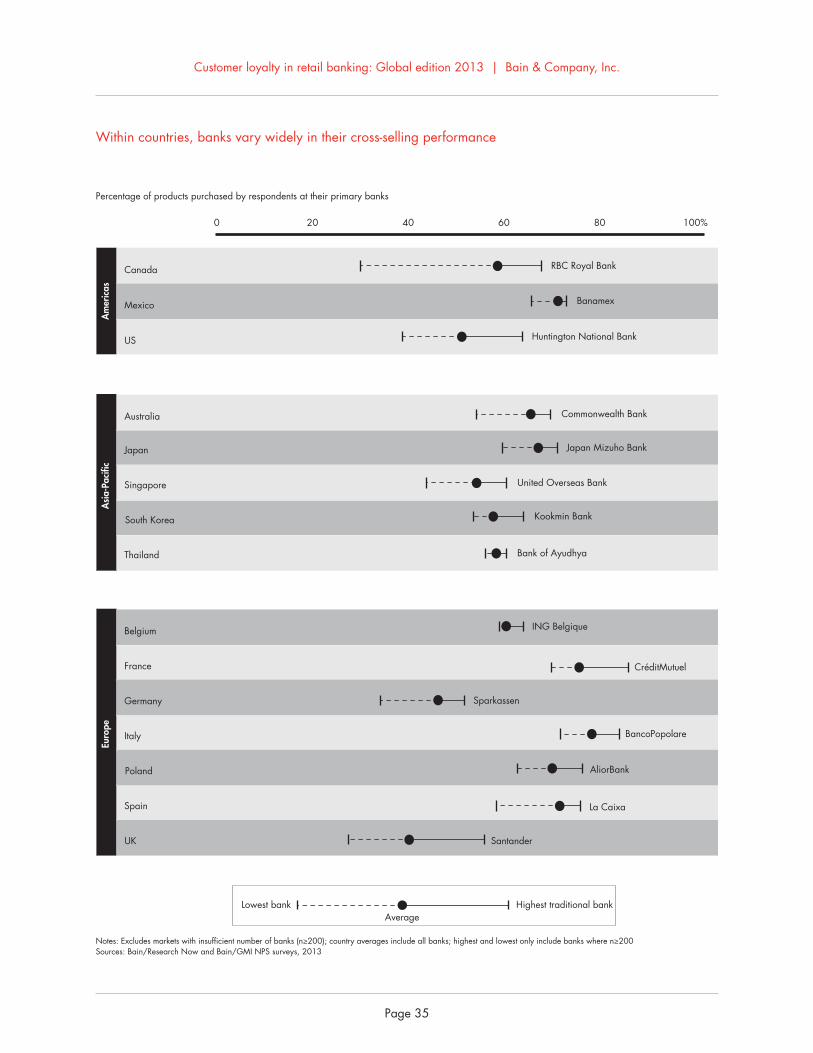
• Cross-selling performance varies even more by bank within countries . In Canada, for instance, RBC has a win rate of more than two times the least effective bank, and Santander has a similar lead in the UK .
• While many factors account for this difference in performance, customer loyalty has a big influence on a bank’s current cross-selling performance and its future potential . Customers who are promoters of their primary bank buy more from that bank than detractors do . In developing countries, the NPS gap between the two groups of customers amounts to 9 percentage points; in developed countries, the difference is 14 points .
• Consider banking products in China . Some 61% of promoters have bought an auto loan from their pri-mary bank, vs . just 31% of detractors . The spread is similar for life insurance and wealth and in-vestment products .
• The higher cross-sell rates that result from stronger loyalty lead to broader product holdings with the primary bank as well . Promoters hold on average 68% of products with their primary bank vs . 60% for detractors .
5.Cross-selling: The golden opportunity
Customer loyalty in retail banking: Global edition 2013 | Bain & Company, Inc.
Page 34
Roughly 65% of new product sales, on average, are won by customers’ primary banks, but the share is lower in some of the more competitive countries
A huge share of customers in most countries are buying new banking products
Sources: Bain/Research Now and Bain/GMI NPS surveys, 2013
0
25
50
75
100%
Percentage of new products purchased at primary banks
8178 76 75 75
71 71 70 70 70 69 68 68 66 6562 61 60 58 58 57 57
53 52 5046
40
Developed countries (63%) Developing countries (66%)
Den
mar
k
Italy
Finl
and
Russ
ia
Fran
ce
Spai
n
Arg
entin
a
Swed
en
Mex
ico
Pola
nd
Nor
way
Chi
le
Chi
na
Japa
n
Aus
tralia
Indi
a
Indo
nesi
a
Belg
ium
Thai
land
Can
ada
Net
herla
nds
Sout
h Ko
rea
Sing
apor
e
Hon
g Ko
ng US
Ger
man
y
UK
Sources: Bain/Research Now and Bain/GMI NPS surveys, 2013
0
20
40
60
80
100%
Percentage of respondents who purchased at least one new product in the last year
9692
85 8580
77 77 76 7571 71
63 61 5955
51 49 4643 43 41 40 39 38 36 36 33
Developed countries (52%) Developing countries (84%)
Chi
na
Thai
land
Russ
ia
Indi
a
Indo
nesi
a
Hon
g Ko
ng
Mex
ico
Sout
h Ko
rea
Chi
le
Arg
entin
a
Sing
apor
e
Pola
nd
Spai
n
Italy
Ger
man
y
Nor
way UK
Fran
ce
Swed
en
Finl
and
US
Aus
tralia
Belg
ium
Den
mar
k
Can
ada
Japa
n
Net
herla
nds
Customer loyalty in retail banking: Global edition 2013 | Bain & Company, Inc.
Page 35
Within countries, banks vary widely in their cross-selling performance
Notes: Excludes markets with insufficient number of banks (n≥200); country averages include all banks; highest and lowest only include banks where n≥200Sources: Bain/Research Now and Bain/GMI NPS surveys, 2013
Percentage of products purchased by respondents at their primary banks
AverageHighest traditional bankLowest bank
0 20 40 60 80 100%
US
Mexico
Canada
Am
eric
as
Huntington National Bank
RBC Royal Bank
Banamex
Thailand
South Korea
Singapore
Japan
Australia
Asi
a-Pa
cific
Commonwealth Bank
United Overseas Bank
Bank of Ayudhya
Kookmin Bank
Japan Mizuho Bank
UK
Spain
Poland
Italy
Germany
France
Belgium
Euro
pe
Santander
ING Belgique
CréditMutuel
La Caixa
AliorBank
Sparkassen
BancoPopolare

Customer loyalty in retail banking: Global edition 2013 | Bain & Company, Inc.
Page 36
And across all products, promoters buy more from their primary banks than detractors do
Throughout the world, customers who are promoters of their primary banks buy more from their banks than detractors do
Source: Bain/GMI China NPS survey, 2013
Percentage of products purchased at respondents’ primary banks (China, 2013)
Private banking87 83
75
Credit card
68 6457
Savings account
77 73 74
Home mortgage
55 49
30
Small business
66
48 48
Wealth/investments
7561
45
Mutual funds
7159
48
Debit card
72 68 67
Auto loan
6149
31
Life insurance
63
4436
Promoter DetractorPassivePrimary bank NPS category
0
5
10
15
20
25
Percentage point difference in the share of products purchased at primary bank between promoters and detractors
22 22 21
18 17 17 1715 15
14 14 1412 12 11 11
109 9 9 9
87 6
4
Note: Markets where n >100 for any category are excluded; promoters give NPS of 9 or 10; detractors give NPS of 0 to 6.Sources: Bain/Research Now and Bain/GMI NPS surveys, 2013
Developed countries (14%) Developing countries (10%)
Hon
g Ko
ng
Aus
tralia
Belg
ium
Net
herla
nds
Can
ada
Spai
n
Swed
en
Pola
nd
Ger
man
y
Den
mar
k
Fran
ce UK
Mex
ico
US
Russ
ia
Chi
na
Italy
Arg
entin
a
Chi
le
Sout
h Ko
rea
Indi
a
Thai
land
Indo
nesi
a
Sing
apor
e
Japa
n

Customer loyalty in retail banking: Global edition 2013 | Bain & Company, Inc.
Page 37
And across all products, promoters own more at their primary banks than detractors do
Promoters also own more products than detractors do, throughout the world
Source: Bain/GMI China NPS survey, 2013
Credit card
Private banking83 78
71
66 6256
Home mortgageSavings account
71 68 7057
44
30
Wealth/investments
Small business
65
46 45
7158
43
Mutual funds
6856
48
Debit card
68 66 65
Auto loan Life insurance
59
40 35
6351
34
Percentage of products held at respondents’ primary banks (China, 2013)
Promoter DetractorPassivePrimary bank NPS category
0
5
10
15%
Percentage point difference in the share of products held at primary bank between promoters and detractors
11 11 11 11 11 10 10 10 10 9 9 9 9 9 9 8 88 8 8 7 7 7 6
6
3
Note: Markets where n=greater than 100 for any category are excludedSources: Bain/Research Now and Bain/GMI NPS surveys, 2013
Developed countries (8%) Developing countries (9%)
Can
ada
Swed
en
Russ
ia
Hon
g Ko
ng
Mex
ico
Chi
na
Net
herla
nds
Ger
man
y
Belg
ium
Indi
a
Fran
ce
Arg
entin
a
Aus
tralia
Den
mar
k
Pola
nd
Sout
h Ko
rea
US
Chi
le UK
Italy
Indo
nesi
a
Thai
land
Sing
apor
e
Spai
n
Finl
and
Japa
n


• Winning new customers, limiting attrition and seizing the cross-sell opportunity all start with a bank’s ability to earn loyalty . But the experiences of leading banks show that five other elements are required in order to generate outsize growth .
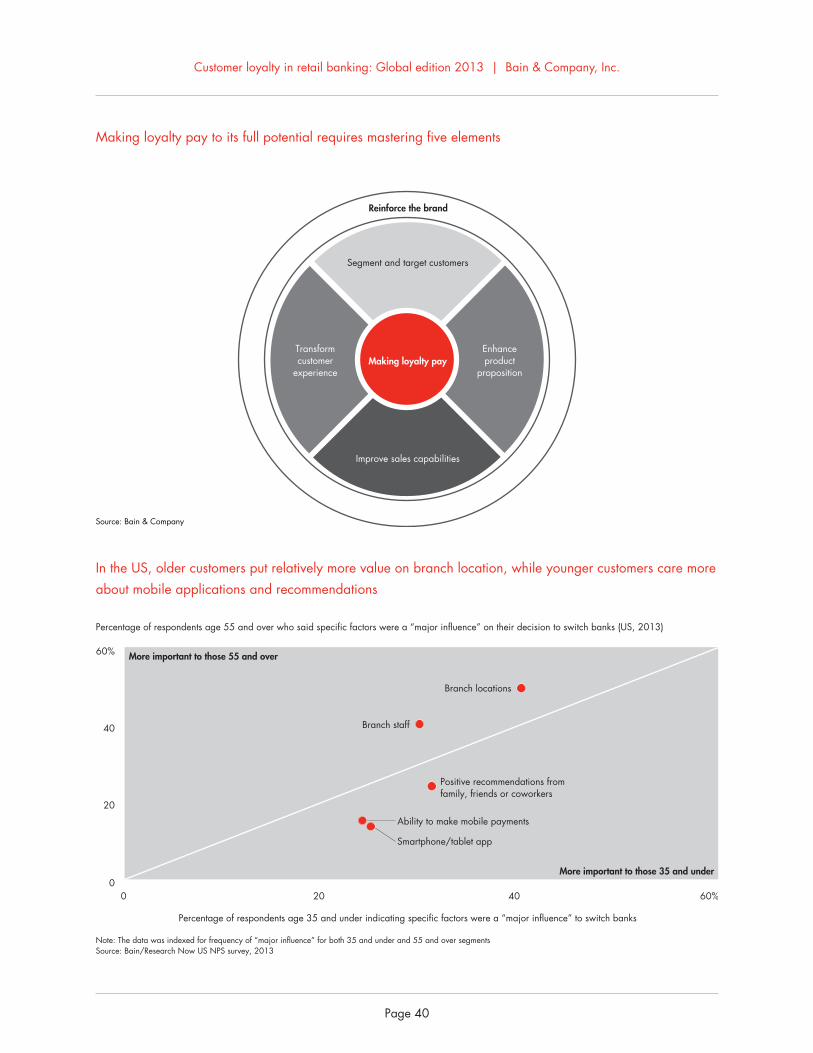
• These start with insightful and practical customer segmentation schemes . In the US, younger custom-ers place far more importance on recommenda-tions from others and on mobile tools than older customers, who care relatively more about branch location and helpful staff .
• Banks must also ensure that they have a competitive suite of products . In the US, no traditional bank ranked highest on more than one product, so they clearly have room to improve .
• Selling capabilities are critical . In the US, roughly one-third of products get sold, not bought . The leading bank performs two to five times better than the laggard, depending on the product category .
• Service stands as the dominant cause of loyalty in most markets . To delight customers these days, the banking experience must be consistent and seamless in person, online, on mobile and on the phone, because customers increasingly hop among chan-nels to complete a task .
• Finally, these four capabilities should reinforce and be supported by the bank’s brand and reputation . USAA has one of the strongest brands in banking despite its modest investment in advertising, in part because it serves such a specific, homoge-neous group of customers—the military, veterans and their families—and consistently delivers on the brand promise .
• In general, loyalty leaders outperform on both win rates for new relationships and cross-selling to existing customers . Banks that have advanced on several of the five elements thus have started to translate loyalty to better economics .
6.Five ways to realize the fruits of loyalty
Customer loyalty in retail banking: Global edition 2013 | Bain & Company, Inc.
Page 40
In the US, older customers put relatively more value on branch location, while younger customers care more about mobile applications and recommendations
Making loyalty pay to its full potential requires mastering five elements
Note: The data was indexed for frequency of “major influence” for both 35 and under and 55 and over segmentsSource: Bain/Research Now US NPS survey, 2013
0
20
40
60%
0 20 40 60%
Percentage of respondents age 35 and under indicating specific factors were a “major influence” to switch banks
Percentage of respondents age 55 and over who said specific factors were a “major influence” on their decision to switch banks (US, 2013)
Ability to make mobile payments
Branch staff
Smartphone/tablet app
Branch locations
Positive recommendations from family, friends or coworkers
More important to those 55 and over
More important to those 35 and under
Segment and target customers
Improve sales capabilities
Making loyalty pay
Reinforce the brand
Transformcustomer
experience
Enhanceproduct
proposition
Source: Bain & Company
Customer loyalty in retail banking: Global edition 2013 | Bain & Company, Inc.
Page 41
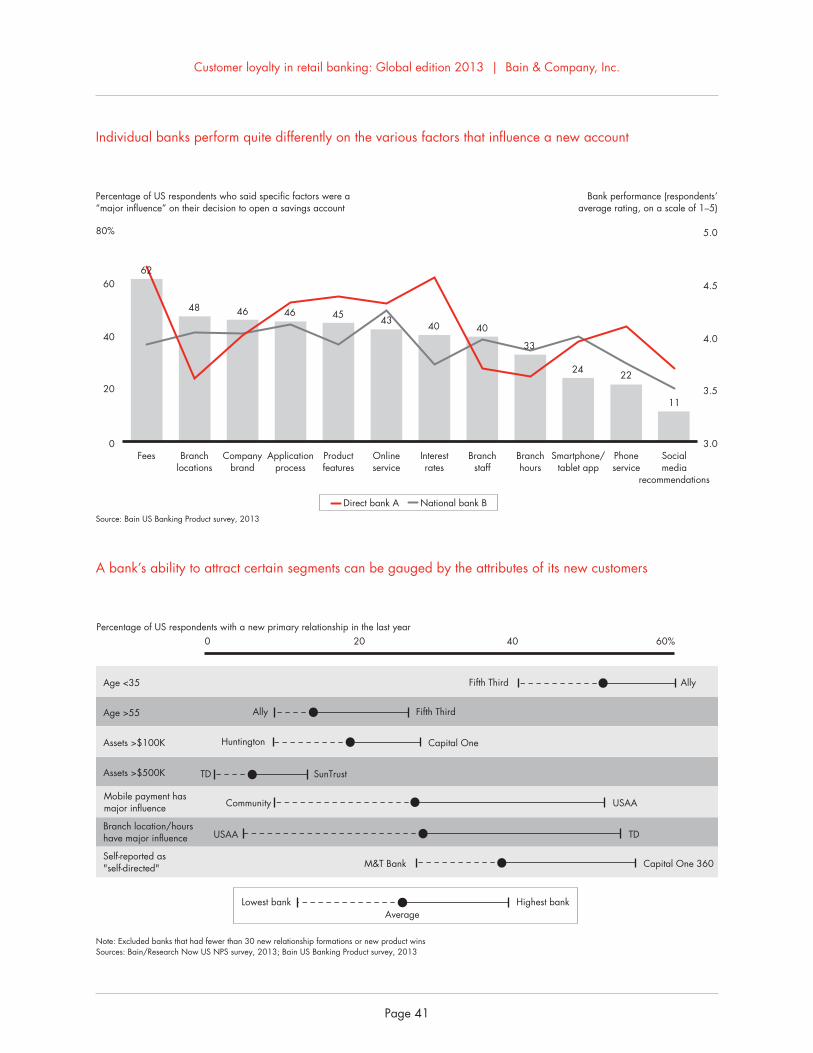
A bank’s ability to attract certain segments can be gauged by the attributes of its new customers
Individual banks perform quite differently on the various factors that influence a new account
Percentage of US respondents with a new primary relationship in the last year
Note: Excluded banks that had fewer than 30 new relationship formations or new product winsSources: Bain/Research Now US NPS survey, 2013; Bain US Banking Product survey, 2013
AverageHighest bankLowest bank
0 20 40 60%
Self-reported as"self-directed"
Branch location/hourshave major influence
Mobile payment hasmajor influence
Assets >$500K
Assets >$100K
Age >55
Age <35
TD
Capital One 360M&T Bank
TDUSAA
AllyFifth Third
USAACommunity
SunTrust
Capital OneHuntington
Fifth ThirdAlly
Source: Bain US Banking Product survey, 2013
0
20
40
60
80%
3.0
3.5
4.0
4.5
5.0
Percentage of US respondents who said specific factors were a“major influence” on their decision to open a savings account
Bank performance (respondents’average rating, on a scale of 1–5)
Direct bank A National bank B
62
48 46 46 45 43 40 40
33
24 22
11
Fees Branchlocations
Companybrand
Applicationprocess
Productfeatures
Onlineservice
Interestrates
Branchstaff
Branchhours
Smartphone/tablet app
Phoneservice
Socialmedia
recommendations

Customer loyalty in retail banking: Global edition 2013 | Bain & Company, Inc.
Page 42
Roughly one-third of products are sold, not bought
In the US, banks vary widely in their performance on product features
AverageHighest bankLowest bank
Which of the following statements best describes why you got a specific product?
Percentage of US respondents who said, “I was not initially planning to get it, but received an offer and decided to get it”’
Note: Excluded banks with fewer than 30 new product wins, except for “home equity line of credit,” which excluded banks with fewer than 15 new product winsSource: Bain US Banking Product survey, 2013
0 2010 40 5030 60 70 80%
Wealth management/investment products
Home equity line of credit
Home mortgage
Credit card(primary)
Savings account
Bank of America
Wells Fargo
JPMorgan Chase
Citibank
Capital One
Thinking about the product you purchased, how well do you think your bank performed on the dimension of “product features”?
Percentage of respondents who rated their banks a 4 or 51 is “not well at all” and 5 is “extremely well”
Note: Excluded banks with fewer than 30 new product wins, except for “home equity line of credit,” which excluded banks with fewer than 15 new product winsSource: Bain US Banking Product survey, 2013
Average
Highest direct bankHighest traditional bank
Lowest bank
50 60 70 80 90 100%
Wealth management/investment products
Home equity line of credit
Home mortgage
Credit card(primary)
Savings account Capital One 360
USAA
USAA
PNC Bank
USAA
TD
Citibank
U.S. Bank
JPMorgan Chase

Customer loyalty in retail banking: Global edition 2013 | Bain & Company, Inc.
Page 43
Brand strength varies significantly, but a few banks are showing strong performance across product categories
Across countries, services and fees/rates usually have the biggest effect on loyalty
How well do you think your bank performed on the dimension of brand?
Percentage of US respondents who rated their banks a 4 or 5
Note: Excluded banks with fewer than 30 new product wins, except for “home equity line of credit,” which excluded banks with fewer than 15 new product winsSource: Bain US Banking Product survey, 2013
Average
Highest direct bankHighest traditional bank
Lowest bank
50 60 70 80 90 100%
Wealth management/investment products
Home equity line of credit
Home mortgage
Credit card(primary)
Savings account USAA
USAA
USAA
JPMorgan Chase
USAA
Citibank
JPMorgan Chase
JPMorgan Chase
JPMorgan Chase
Note: Excludes responses where no rationale was givenSources: Bain/Research Now NPS surveys, 2013
Service Fees/rates Products Branch OnlineEmotional Other
0
25
50
75
100
125
Mentions per 100 responses
US
Positive
33
7
14
7
7
19
93
7
21
Negative
Canada
Positive
38
8
12
6
9
682
56
18
Negative
UK
Positive
33
77
10
19
85
96
729
Negative
Germany
Positive
31
69
36
13
22
120
77
20
Negative
Australia
Positive
34
6
20
10
7
19
100
65
18
Negative

Customer loyalty in retail banking: Global edition 2013 | Bain & Company, Inc.
Page 44
Loyalty leaders are more likely to win new customers and cross-sell to current customers
NPS quartile
35
50
65%
0.0 0.5 1.0 1.5 2.0
10,000respondents
Relationship win index
Percentage of products purchased by US respondents at their primary banks in past year
JPMorgan Chase
U.S. Bank
USAA
Citibank
TD
Capital One
BB&T
Huntington
Direct bank
Ally
Direct bank
Top Second Third Bottom
Notes: Banks where n<200 are not shown; for national and regional banks, NPS quartiles were determined using regional respondent-weighted-average relative Net Promoter Scores; all listed direct banks included in top quartileSource: Bain/Research Now US NPS survey, 2013
Wells Fargo
Bank of America
TD

Customer loyalty in retail banking: Global edition 2013 | Bain & Company, Inc.
Page 45
USAA’s progress on the five dimensions has helped it excel in many product areas
Note: Results based on a standard set of 11 productsSource: Bain/Research Now US NPS survey, 2013
0.00.30.50.81.01.3
Average number of deposit products (excluding checking) owned at primary bank per US respondent
USA
A
Citi
bank
Cap
italO
ne36
0
Sove
reig
n
Wel
ls Fa
rgo
Citi
zen’
s
Bank
of
Am
eric
a
M&
T Ba
nk
Fifth
Thi
rd
PNC
U.S
. Ban
k
SunT
rust
BB&
T
Cap
italO
ne
JPM
orga
nC
hase
TD B
ank
Regi
ons
0.00.20.40.60.81.0
Average number of credit cards owned at primary bank per US respondent
USA
A
Citi
bank
Cap
italO
ne36
0
Sove
reig
n
Wel
ls Fa
rgo
Citi
zen’
s
Bank
of
Am
eric
a
M&
T Ba
nk
Fifth
Thi
rd
PNC
U.S
. Ban
k
SunT
rust
BB&
T
Cap
italO
ne
JPM
orga
nC
hase
TD B
ank
Regi
ons
0.00.10.20.30.40.5
Average number of lending products owned at primary bank per US respondent
USA
A
Citi
bank
Sove
reig
n
Wel
ls Fa
rgo
Citi
zen’
s
Bank
of
Am
eric
a
M&
T Ba
nk
Fifth
Thi
rd
PNC
U.S
. Ban
k
SunT
rust
BB&
T
Cap
italO
ne
JPM
orga
nC
hase
TD B
ank
Regi
ons
Cap
italO
ne36
0
0.0
0.1
0.2
0.3
Average number of wealth management products at primary bank per US respondent
USA
A
Citi
bank
Cap
italO
ne36
0
Sove
reig
n
Wel
ls Fa
rgo
Citi
zen’
s
Bank
of
Am
eric
a
M&
T Ba
nk
Fifth
Thi
rd
PNC
U.S
. Ban
k
SunT
rust
BB&
T
Cap
italO
ne
JPM
orga
nC
hase
TD B
ank
Regi
ons
National Regional Direct

Customer loyalty in retail banking: Global edition 2013 | Bain & Company, Inc.
Page 46
Appendix: Methodology
Bain & Company partnered with Research Now, the online global market research organization, to survey consumer panels in Argentina, Australia, Belgium, Chile, Canada, Denmark, Finland, France, Germany, Italy, Japan, Mexico, the Netherlands, Norway, Poland, Russia, Spain, Sweden, the UK and the US. The survey’s purpose was to gauge customers’ loyalty to their principal bank and the underlying reasons they hold the views they do. Conducted in the summer of 2013, the survey polled 177,937 customers of national branch network banks, regional banks, private banks, direct banks, community banks and credit unions in these countries. We included in the individual bank analysis only those banks for which we received at least 200 valid responses, though in many countries, sample sizes exceeded 200 for each bank included.
Bain worked with GMI to survey a further 12,251 account holders in China, Hong Kong, India, Indonesia, Singapore, South Korea and Thailand. Similarly, individual bank Net Promoter Scores are based on the responses of at least 200 participants.
Survey questions
Respondents were first asked to identify their primary bank, after which they were asked the following three questions to assess their loyalty to that institution:
• On a scale of zero to 10, where zero represents “not at all likely” and 10 represents “extremely likely,” how likely are you to recommend your primary bank to a friend or relative?
• Tell us why you gave your primary bank the score you did.
• How long have you used this bank as your primary bank?
If respondents had been with their current primary institution for less than a year, they were asked to identify whether they were new to banking or if they had switched from another institution. We subsequently asked about their prior primary banking relationship, why they switched banks, what influenced them in their choice of a new bank and which channel they used to open their new account.
For all survey respondents, we asked what major products they hold with their primary bank and other banks, and which of these products were purchased in the last year. We also asked which channels they use to do their banking. The remaining questions elicited demographic profile information on household income, investable assets and region of residence.
We followed up with 5,200 US respondents to ask more detailed questions about their purchase of specific products, including their product NPS, the methods they used to research their purchases, the channel they used to purchase the product, the major factors that influenced them in the purchase of the product and how the bank performed on those factors. For those people who did not purchase from their primary bank, we asked reasons for purchasing elsewhere.
On the question of statistical significance, the results of our data analysis are robust both for the measurement of bank NPS by country and for respondent NPS for each demographic category. The NPS measured for each bank

Customer loyalty in retail banking: Global edition 2013 | Bain & Company, Inc.
Page 47
included in the US regional rankings is statistically significant to an 80% confidence level, with a two-tailed test of the confidence interval ranging from plus or minus 1.5% (n=4,500) to plus or minus 6.8% (n=201). In countries where sample sizes were smaller, confidence intervals are wider, with a maximum of plus or minus 7.5%.
Countries classified as developed are based on the World Bank’s high-income category; the developing countries are based on its middle- and low-income categories.
Net Promoter® and NPS® are registered trademarks of Bain & Company, Inc., Fred Reichheld and Satmetrix Systems, Inc.Net Promoter SystemSM and Net Promoter ScoreSM are trademarks of Bain & Company, Inc., Fred Reichheld and Satmetrix Systems, Inc.
Customer loyalty in retail banking: Global edition 2013 | Bain & Company, Inc.
Page 48
Key contacts in Bain’s Global Financial Services practice
Global: Philippe De Backer in Dubai ([email protected]) Edmund Lin in Singapore ([email protected]) Americas: Mike Baxter in New York ([email protected]) Europe, Middle East and Africa: Henrik Naujoks in Düsseldorf ([email protected]) Asia-Pacific: Gary Turner in Sydney ([email protected])
Acknowledgments
This report was prepared by Gerard du Toit and Maureen Burns, partners in Bain’s Financial Services practice, and a team led by Christy de Gooyer, a practice area manager. The authors thank Bain partners in each of the countries covered in the report for their valuable input and John Campbell for his editorial support.


For more information, visit www.bain.com
Shared Ambition, True Results
Bain & Company is the management consulting firm that the world’s business leaders come to when they want results.
Bain advises clients on strategy, operations, technology, organization, private equity and mergers and acquisitions. We develop practical, customized insights that clients act on and transfer skills that make change stick. Founded in 1973, Bain has 50 offices in 32 countries, and our deep expertise and client roster cross every industry and economic sector. Our clients have outperformed the stock market 4 to 1.
What sets us apart
We believe a consulting firm should be more than an adviser. So we put ourselves in our clients’ shoes, selling outcomes, not projects. We align our incentives with our clients’ by linking our fees to their results and collaborate to unlock the full potential of their business. Our Results Delivery® process builds our clients’ capabilities, and our True North values mean we do the right thing for our clients, people and communities—always.