CUSHION MATERIAL TESTING - Package Testing, … · I. CUSHION MATERIAL TESTING The ability of...
22
CUSHION MATERIAL TESTING PREPARED BY HERBERT H. SCHUENEMAN, CP-P/MH PRESENTED BY WESTPAK, INC. 83 Great Oaks Blvd., San Jose, CA 95119 (408) 224-1300 FAX (408) 224-5113 www.westpak.com ________________________________________________
Transcript of CUSHION MATERIAL TESTING - Package Testing, … · I. CUSHION MATERIAL TESTING The ability of...

CUSHION MATERIAL TESTING
PREPARED BY
HERBERT H. SCHUENEMAN, CP-P/MH
PRESENTED BY
WESTPAK, INC. 83 Great Oaks Blvd., San Jose, CA 95119
(408) 224-1300 FAX (408) 224-5113 www.westpak.com
________________________________________________

I. CUSHION MATERIAL TESTING
The ability of various materials to mitigate shock and vibration input is an important characteristic to the packaging engineer. It is necessary to know exactly what to expect when using certain materials in a particular design situation.
SHOCK PERFORMANCE
The shock performance of cushion materials is measured using instrumented impacts resulting in a cushion curve such as that shown in Figure 1. The cushion curve describes the level of deceleration transmitted through a given thickness of material as a function of static stress (loading) on the cushion and the drop height. Procedures for running a cushion curve are covered by ASTM D1596, D4168, and similar MIL Specs. They are basically a matter of dropping a guided platen of predetermined mass onto a cushion of known thickness and area from a given drop height. The amount of deceleration transmitted through the cushion is measured by an accelerometer mounted on the platen or test block. The results are displayed on an oscilloscope or similar readout device.
The procedure results in cushion curves, such as those in Figure 1, with peak deceleration on the vertical axis and static stress on the horizontal axis (static stress = weight/bearing area). Each curve should be drawn from a minimum of 5 test points (static stress levels) and each test point is the average of the last 4 of 5 deceleration readings from the cushion material.
- 1 -

STATIC STRESS g/cm^2
DECELERATION G
0 25 50 75 100 125 1500
10
20
30
40
50
60
70
80
90
100
AVG 2-5 DATA
FIRST DROP DATA
WESTPAK Figure 1
Sample Cushion Curve 6 cm Drop Height
Most cushion curves have the general shape of those in Figure 1. The left-hand portion of the curve shows a relatively high deceleration transmitted through the cushion. In this area the static stress is relatively low because of the light weight on the cushion; the object (the platen in the cushion test) does not have sufficient force to deflect the cushion and the result is a rigid or "stiff" impact. The effect resembles dropping a product onto a rigid surface.
In the center portion of the curve (where the cushion is being used effectively), the falling object has sufficient force to deflect the cushion and cause the deceleration to be spread over a longer period of time. The result is a lower deceleration level. On the right-hand portion of the curve, the cushion material is being overloaded and the falling object continues right through the cushion (it bottoms out) and impacts with the surface on which the cushion is resting. Thus, it approaches using no cushion at all resulting in, once again, high deceleration levels.
It is desirable to use the cushion in the lower portion of the curve where its performance is optimum. When the product critical acceleration, weight and design
- 2 -

drop height are known, the usable range of cushion area can be determined for a given cushion material and thickness.
VIBRATION PERFORMANCE
The vibration performance characteristics of cushion materials are determined by subjecting them to vibrational inputs over the frequency range typical of the distribution environment. In this case, the cushion and a test block form a spring/mass system which displays resonant frequency characteristics important to the package designer.
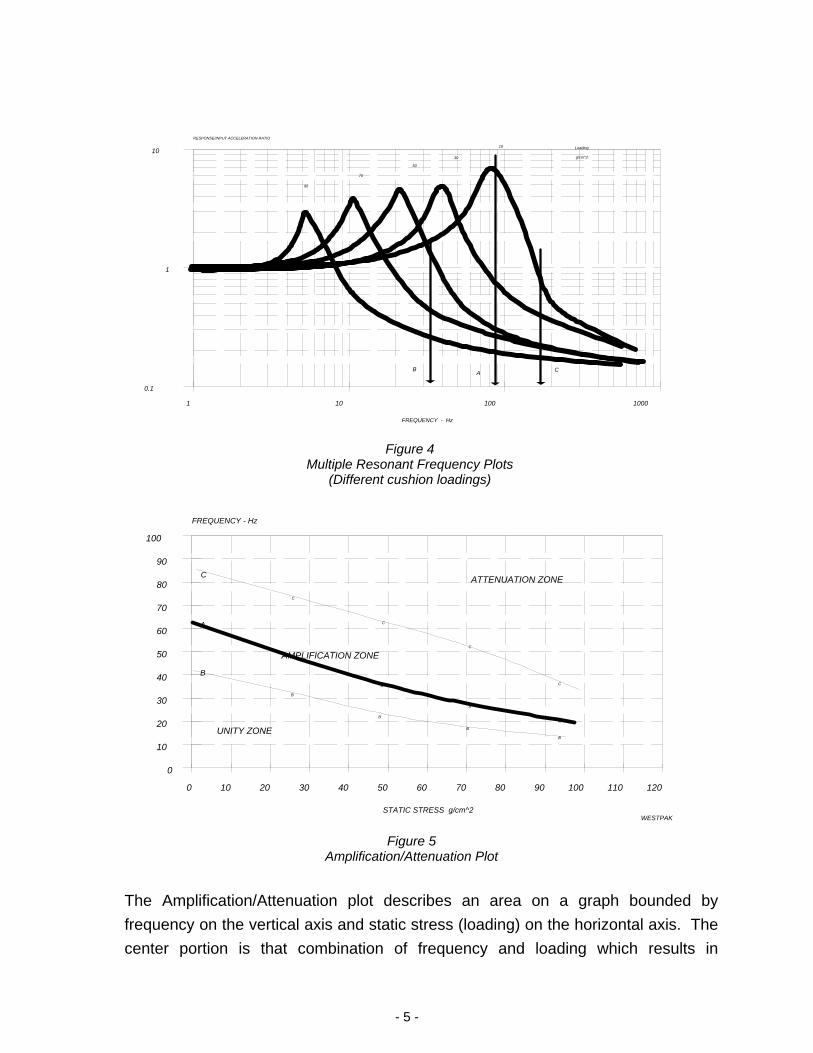
Figure 2 shows two typical test setups and Figure 3 the transmissibility curve for a typical cushion material. The mass of the test block is changed in order to vary the static stress loading on the cushion material and the test is repeated. Different plots are obtained in this fashion (see Figure 4). A series of 5 vibrational sweeps are recommended to construct the Amplification/Attenuation (A/A) plot shown in Figure 5.
- 3 -

MASS
CUSHION
VIBRATION TABLE VIBRATION TABLE
CUSHION
MASS
CUSHION
RESPONSE
INPUT
MASS ADHERED TO FOAM
SO THAT THE "SPRING"
(CUSHION) WORKS IN BOTH
TENSION AND COMPRESSION
MASS ISOLATED BETWEEN
2 "SPRINGS" (CUSHIONS)
THAT WORK ONLY
IN COMPRESSION.
METHOD AMETHOD B
ACCELEROMETER
ACCELEROMETER
Figure 2
Typical Cushion Vibration Test Setups
FREQUENCY - Hz
RESPONSE/INPUT ACCELERATION RATIO
1 10 100
0.1
1
10
WESTPAK
Figure 3
Cushion Resonant Frequency Plot (Transmissibility)
- 4 -
FREQUENCY - Hz
RESPONSE/INPUT ACCELERATION RATIO
1 10 100 1000
0.1
1
10
The Amplification/Attenuation plot describes an area on a graph bounded by frequency on the vertical axis and static stress (loading) on the horizontal axis. The center portion is that combination of frequency and loading which results in
B A C
90
70
30
10 Loading
g/cm^2
50
Figure 4
Multiple Resonant Frequency Plots (Different cushion loadings)
STATIC STRESS g/cm^2
FREQUENCY - Hz
0 10 20 30 40 50 60 70 80 90 100 110 120
0
10
20
30
40
50
60
70
80
90
100
C
A
B
A
A
A
A
C
C
C
C
B
B
B
B
X
UNITY ZONE
AMPLIFICATION ZONE
ATTENUATION ZONE
WESTPAK
Figure 5
Amplification/Attenuation Plot
- 5 -

amplification of the vibrational input. This is the area of greatest concern to the packaging engineer.
The plot in Figure 5 may be interpreted as follows: for a given frequency, the lower static stress levels result in the same acceleration transmitted to the product as the input. In other words, the response/input ratio is approximately 1. As the static stress (loading) increases, there is a range in which the cushion material amplifies the vibrational input. In this region the response/input ratio is greater than 1. At higher static stress levels, the cushion material attenuates (reduces) the vibrational input and the response/input ratio is less than 1.
The producers and users of cushion materials should be familiar with cushion curves and Amplification/Attenuation plots both in terms of the data itself and how it is obtained. This is important. For example, information obtained from ASTM D1596 will likely be different from information obtained by use of other test methods such as the Enclosed Test Block method described in ASTM D4168 for testing of foam-in-place materials.
A user of cushion materials should insist on shock and vibration data when considering a given material in a package design situation. Without adequate performance data, the package designer is incapable of optimizing performance. It is very possible to design a package system that will actually destroy a product rather than protect it, particularly if the cushion material amplifies vibrational input at product critical frequencies.
- 6 -

II. REVIEWING PACKAGE TEST PROCEDURES
Before a package system is designed or tested, it is vital to establish the exact procedure used to judge its performance characteristics. This should include the design drop height and the test procedure used to evaluate the vibration characteristics. In addition, the amount or duration of input must be specified. For example, will the package be subjected to one, two, or three impacts on each face from the design drop height, or one impact on each face, corner and edge, or a procedure such as ASTM D4169?
The reason for establishing the test procedure before the package design process comes from the characteristic of many cushion materials in which they transmit higher levels of deceleration with increasing number of drops. For example, a close look at the cushion curve found in Figure 6 shows that the first drop from a given height and static stress level will result in lower transmitted deceleration than succeeding drops. This is especially true for semi-resilient cushion materials such as expanded polystyrene (EPS). The heavier loadings necessary to achieve lower deceleration levels will also have a negative effect on the cushion's ability to withstand repeated impacts. On the other hand, resilient materials such as polyethylene foam generally show very little degradation with repeated impacts.
The result is that if one were designing an EPS pack for a single impact verification test procedure, the static stress loading would be different than if the test procedure required multiple impacts on the same face. However, if one were using polyethylene foam it would probably make little difference if the test procedure called for one impact on each face or multiple impacts. The end result should be a clearly established test procedure prior to cushion design.
- 7 -

PERFORMANCE VS. INTEGRITY TEST PROCEDURES
STATIC STRESS g/cm^2
DECELERATION G
0 25 50 75 100 125 1500
10
20
30
40
50
60
70
80
90
100
WESTPAK
5 43
2
1
IMPACT NUMBER
Figure 6
Cushion Curve The Effect of Multiple Impacts
There is a subtle, though distinct, difference between the performance and the integrity characteristics of a package system, both in terms of design criteria and the testing used to verify compliance with those criteria. The performance of a package refers to its ability to mitigate shock and vibration inputs to a level below the product fragility. This is distinguished from integrity which refers to the ability of the package system itself to withstand the normal forces involved in the distribution process. It is very possible to design a package which has the proper laboratory performance characteristics but will not withstand the forces typical of the "real" shipping environment.
Package shock performance testing normally involves a series of flat impacts with the deceleration transmitted through the cushion monitored by appropriate instrumentation. The shock integrity of a package system is generally verified by a series of flat, corner and edge impacts typical of the ISTA test procedures.
Vibration performance refers to the ability of a package system to attenuate vibration input at and near product natural frequencies. Vibration performance is tested by subjecting an instrumented package system to vibration input in a
- 8 -

sinusoidal sweep test (ASTM D999, Method B is often used). The normal vibration integrity test involves one or more resonance dwells at package natural frequencies. Random vibration testing may be used in place of or in addition to resonance dwells for integrity testing.
It is interesting to note that design performance is something that is taught in universities and can be verified by analytical techniques. Designing for integrity, however, is something which must be learned by experience and is probably more art than science. It is indeed rare to find a designer who can successfully integrate both performance and integrity requirements into package cushion designs.
III. PACKAGE SYSTEM DESIGN
A. DETERMINE CUSHION THICKNESS
The package design process begins with determining the thickness of cushion material necessary to achieve the desired performance. For this, assume the cushion material behaves as a linear spring and look solely at the total dynamic deflection necessary to achieve the required deceleration from the design drop height. This deflection is determined from the following formula:
X = 2h/(G-2) where: x= cushion dynamic deflection in cm (or inches) h = drop height in cm (or inches) G = the require deceleration level (G's)
Remember that this exercise gives the theoretical dynamic deflection necessary, not the overall cushion thickness. In general, cushion materials such as expanded polystyrene and polyethylene foam will compress approximately 40 to 70% of their total thickness before "bottoming out" starts to occur. More flexible materials such as polyurethane foam will compress up to 80% of total thickness before beginning to bottom out.
- 9 -

DESIGN EXAMPLE: Suppose a product has a fragility of 50 G's and a design drop height of 90 cm (36 in.). Calculate the dynamic deflection necessary and the resulting total cushion thickness for expanded polystyrene (EPS), polyethylene (PE), and polyurethane (PU) foam materials. The theoretical deflection can be calculated from the previously given formula: ( X = 2 x 90 cm / (50-2) = 3.75 cm). The resulting theoretical dynamic deflection is 3.75 cm. From this number calculate the total cushion thickness necessary for the individual materials: MATERIAL OPTIMUM STRAIN % TOTAL THICKNESS
EPS 40% (3.75/.4) = 9.4 cm (3.7 in.) PE 50% (3.75/.5) = 7.5 cm (3.0 in.) PU 70% (3.75/.7) = 5.4 cm (2.2 in.)
As we shall see later, these numbers can be modified somewhat by the use of "ribs". However, the numbers do provide a good guideline for estimating cushion thickness. For example, if a designer wants to achieve a 50 G response from a 90 cm. (36 in.) freefall using a 2 cm (.75 in.) thick EPS pad, the numbers clearly show that this is impossible.
- 10 -

B. ESTABLISH OPTIMUM STATIC LOADING
The optimum static stress loading (weight/bearing area) for a given material, thickness and drop height combination is determined from a cushion curve such as that found in Figure 7. Theoretically, any portion of the cushion curve that lies below the product fragility level will define a static stress loading capable of transmitting less than the critical acceleration to the product. For optimum material usage, it is normally desirable to load the cushion to a level determined by the highest static stress allowed by the curves. However, many designers find it desirable to load the material at the low point of the cushion curve where transmitted deceleration is a minimum.
Note that the procedure used for establishing cushion curves may have a significant effect on the usefulness of the information. Cushion curves are only one indication of material shock performance. The static stress loading information may be valid but the associated deceleration levels should be taken as approximately values.
If vibration data will be used in the design, the next step is to draw a horizontal line across the Amplification/Attenuation plot for this cushion material, tangent with the product natural frequencies. The A/A plot must describe the same material and thickness as that described in the cushion curve.
STATIC STRESS g/cm^2
DECELERATION G
0 25 50 75 100 125 1500
10
20
30
40
50
60
70
80
90
100
WESTPAK
2 cm THICK
3 cm THICK
PRODUCT FRAGILITY = 28 G
SHOCK PROTECTION = 65 g/cm^2
MAXIMUM LOADING FOR
Figure 7
Design for Shock Protection 75 cm Drop Height (“Design” Drop Height)
- 11 -

The minimum static stress loading is determined from the intersection of the attenuation boundary and the lowest product critical frequency (See Figure 8). Higher static stress loading will result in greater vibration attenuation (which is desirable) while lower static stress loading may amplify vibrational input (normally undesirable).
STATIC STRESS g/cm^2
FREQUENCY - Hz
0 10 20 30 40 50 60 70 80 90 100 110 120
0
10
20
30
40
50
60
70
80
90
100
UNITY ZONE
ATTENUATION ZONE
WESTPAK
AMPLIFICATIOPN ZONE
LOWEST PRODUCT
NATURAL FREQUENCY = 33 Hz
VIBRATION PROTECTION = 68 g/cm^2
MINIMUM LOADING FOR
3 cm THICK CUSHION
Figure 8
Cushion Vibration Design From Amplification/Attention Plot
The end result of this process should be a static stress loading which will give good results for both shock and vibration requirements. Cushion thickness may have to be adjusted in order to achieve this goal.
While it is relatively straightforward, this process is not will understood by most package engineers. Therefore vibration performance is sometimes not considered as part of cushion system designs. This is unfortunate since a compromise between the requirements of shock and vibration in a package system should normally be settled in favor of the vibration requirements. The reasons for this include:
1. The vibration environment can normally be predicted with reasonable
accuracy. However, the likelihood that the product will be subjected to the design drop height is a probability function and the probability of a severe drop input is very low.
- 12 -

2. The fragility level established by Damage Boundary shock testing using a trapezoidal shock pulse is conservative. It is normal for a product to survive a shock pulse of less damaging waveform at peak accelerations greater than the fragility level.
Testing of a package system will provide an evaluation of any compromises or tradeoffs made in the design of a prototype package. All things being equal, it should be remembered that the likelihood of vibration input is 100%, while the likelihood of a shock input is a probability function and the probability of a severe input is very low.
C. CONSIDER THE USE OF RIBS
It is instructive to investigate why ribs are used in package cushion systems. In general, ribs will result in less material usage and therefore, higher loading on the material which remains. This results in greater dynamic deflection from a given cushion thickness.
There are no recognized procedures which would guide a designer to a certain rib configuration. Most of the work done in this area has been intuitive in nature. After reviewing the available literature, the following guidelines are offered for establishing rib configurations:
1. In general, the depth of a rib should be approximately 1/2 to 2/3 the total
cushion thickness. 2. The cross sectional area of material at zero deflection should yield a static
stress value of 2 or more times the optimum static stress obtained from a cushion curve for that material, thickness and drop height. For example, using the 50 G response requirement from a 90 cm (36 in.) freefall, the optimum static stress for a material 8 cm (3.1 in.) thick may be 0.05 kg/cm2 (0.7 psi). Using this guideline, the area of the top of the rib would yield a static stress loading of 0.1 kg/cm2 (1.4 psi) or greater (see Figure 9).
3. The cross sectional area of a rib at 25% total deflection should be
approximately equal to that which would give the optimum static stress
- 13 -

loading for that material from a representative cushion curve. For the example listed above, the total cross sectional area at 25% deflection would give a static stress loading of 0.05 kg/cm2 (0.7 psi).
4. The cross sectional area at 50% total rib compression should equal a static
stress approximately one half that called for by the applicable cushion curve (again refer to Figure 9).
RIB COMPRESSION
50%
25%
0%
.6TT
PYRAMIDAL TRAPEZOIDAL HEMISPHERICAL
Figure 9
Various Rib Configurations
It is interesting to note that most rib designs are trapezoidal in cross section and most literature treats this as a "standard" shape for ribs. Theoretically, the best rib design is a pyramidal cross section. A rib with a hemispherical cross section also is a good theoretical design. The reason is that at zero deflection, the static stress loading is (theoretically) infinite and therefore deflection occurs very rapidly at the onset of a dynamic force input. As deflection of the cushion material continues in response to the force input, the static stress decreases as the area of the cushion increases. Ideally this deflection and change in loading will occur at a rate which is optimum for the shock performance of the cushion.
Of greater significance is the fact that the vibration response characteristics of a cushion material can be substantially altered through the use of ribs. In particular, a high static stress loading at the peak of the rib will result in a lower natural frequency for the package system. This is generally the most desirable situation for vibration sensitive products. The force levels associated with environmental vibration are relatively small and therefore the deflection of the cushion is correspondingly small. This deflection will occur at the point of maximum static stress. If this is the peak of the rib, that area will determine the vibration characteristics of the entire package system and can be designed to effectively attenuate undesirable vibration frequencies.
- 14 -

D. PACKAGE DESIGN SUMMARY
Once the total thickness, static stress, and rib configurations are determined, the package must be designed using these numbers. This is the point where both the performance and the integrity requirements of the package system must be addressed. Certainly other factors enter into the process of determining the best package design. These include fabrication requirements, end user constraints, ecological considerations, flammability and a host of others. The important requirement for dynamics is a static stress loading in each product axis which satisfies the product shock sensitivities and does not result in vibration amplification at product critical frequencies.
IV. PACKAGE PROTOTYPE TESTING
Once the design is complete and a prototype fabricated, it must be tested for performance and integrity.
For shock performance testing, flat impacts are generally used with the deceleration transmitted through the cushion measured by one or more accelerometers mounted on the product. Westpak recommends 3 accelerometers, one for each axis. The test procedure should be that previously agreed to, but in most cases will follow closely ASTM D775 or similar procedures. Take care to ensure flat impacts. This is important! The difference between a flat drop and an "almost flat" drop can be very drastic in terms of response acceleration. Using 3 accelerometers can help determine if the impact was flat.
It is also important that the monitored location (where the accelerometer is mounted) be as rigid as possible and ideally as close to the product/cushion interface as possible. The reason is to determine the package input acceleration, not the product response characteristics. In many cases these are difficult to separate. If the product were a solid uniform mass it probably wouldn't make any difference where the accelerometer was located; the input from the cushion would be identical to the response of the mass. However, most products have suspended masses and other components which will be excited or put into motion by a shock input. The response of these various suspended components can cause such
- 15 -

things as "chattering" or high frequency noise on the response waveform (see Figure 10).
Often the response acceleration peak is well above the input of the cushion. For example, a primary cushion response waveform may have a peak of 40 G's with superimposed high frequency on top of it which may double that number. It is important to be able to separate these two by identifying the difference between package input and product response.
Figure 10
High Frequency “Noise” on Response Waveform (left), Filtered (right)
This is one of the most common problems in package response testing. There are several methods of avoiding this problem which should be helpful.
1. Learn to mount the response accelerometer in the proper location, avoiding
flexible elements and locating the transducer as close as possible to the cushion material.
2. Understand the use of electronic filters and how they can reduce the apparent
affect of high frequency ringing superimposed on the primary response waveform. Exercise care to avoid overfiltering and distorting the response data.1
1 “To Filter or Not to Filter, That is the Question”, WESTPAK, Inc., 1992
- 16 -

3. If possible, restrict flexible elements within the product in order to make it as homogeneous and rigid as possible. It is sometimes instructive to perform two drop tests; one with the flexible elements unrestrained showing the high frequency response and the second with flexible elements restrained. Note the difference on the product response characteristics.
The vibration performance of a package system is verified by subjecting it to a sine sweep over the same frequency range likely to be experienced in the distribution environment. With an accelerometer mounted on a rigid part of the product, the designer can identify the frequencies where the cushion material amplifies vibration input and where it begins to attenuate that input. If the job was done correctly, the package will attenuate (reduce in amplitude) those frequencies where the product is most sensitive.
Package shock integrity tests typically involve a series of corner and edge impacts such as those called out in ASTM D4169. This procedure is perhaps the most up to date method incorporating much of the environmental input studies to date. This standard is recommended for package integrity testing.
The vibration integrity characteristics of a package system are tested using a sinusoidal dwell test such as that called out in ASTM D999, Method B. Alternately a properly designed random vibration procedure can be used to test both performance and integrity characteristics. Select a suitable random vibration spectrum that "envelopes" the anticipated input from vehicles used to distribute the product. Dwell times vary; some firms use a dwell equal to 5 to 10% of the anticipated time the product will be exposed to vibration input. Thus a 20 hour truck trip may dictate a 1 hour random dwell. Some experimentation in this area will be necessary.
Beware of the "mechanical bounce" test, sometimes called a vibration test procedure. The bounce test (conducted on a mechanical shaker) amounts to a series of repeated impacts with very short intervals between events. It may be referred to as a repeated impact test, a bounce test, a fatigue test or something else...but it should not be mistaken for a vibration test. Variable frequency sine testing or random vibration is the only way to test for package natural frequency and product vibration attenuation.
- 17 -

If the package system meets all its requirements, then the job is finished. If not, further package system refinements are necessary. The following sections should help with those refinements.
V. INTERPRETING PACKAGE RESPONSE DATA
A. WAVEFORM ANALYSIS
The response waveform generated during a package drop test contains a wealth of information useful to the package designer. A good designer learns to interpret this information.
The first piece of information taken from a response waveform is the total velocity change (or what can be thought of as the energy released during the impact). This can be determined by integrating the waveform. The integral is the area under the acceleration vs. time pulse. This area can be estimated by multiplying the peak by the duration. Use the following formula:
V = Ap x g x D x .6 where Ap = Peak Pulse Acceleration in G's g = 9.8 m/sec2 (386 in./sec2) D = pulse duration in seconds
The ".6" factor accounts for the shape of the waveform which is generally someplace between a halfsine and a haversine. The resulting estimate of velocity change should fall somewhere between the minimum (the impact velocity from the design drop height) and maximum (two times the impact velocity). If it doesn't, there is something wrong with the test and it should be investigated. In general, the rise time of a shock response pulse (the time from onset of the pulse until peak acceleration) should be 1/3 to 1/2 total pulse duration. If the rise time is shorter than this, it generally indicates that the cushion is too stiff or
- 18 -

the loading too light. If the rise time is greater than 1/2 pulse duration, this generally indicates that the material is too flexible or is overloaded.
In a similar way, if a sharp spike is seen at the very beginning of the waveform, it generally indicates that the cushion material is too stiff or too lightly loaded. Conversely, if a sharp spike is seen near the end of the waveform, this indicates that the material is too flexible or too heavily loaded.
B. INCONSISTENT DATA
In some cases, repeated drops will produce different results with the same drop height and accelerometer location. This generally indicates that either the drop is not flat or that the product is rotating within the cushion on impact. One way to resolve this is to use two accelerometers at different locations within the product, or (less desirable) make two separate drops with the accelerometer moved to a different location for the second input. Product rotation upon impact is normally an indication that the cushion material is not properly distributed in relation to the weight of the product. Another method of determining this is to use a triaxial accelerometer (3 accelerometers in one) to measure the cross axis acceleration during a package drop test.
Instrumentation problems can also cause inconsistent data during a drop test. Be sure that the acceleration monitoring system is connected properly and that there are no shorts or intermittence in the accelerometer cable.
- 19 -

VI. DESIGNING WITH NEW OR COMBINATION MATERIALS
As most people are aware, moldable resilient foam material (sometimes called "beaded foam") has been introduced worldwide. These materials (polyethylene, polypropylene, and copolymers) promise to revolutionize at least part of the foam cushion industry in that they are capable of being molded in configurations similar to expanded polystyrene. Although they promise to have excellent shock and vibration characteristics, their high costs necessitate optimum material usage.
This means that standard cushion curves may no longer be as valuable for determining proper static stress loading. Rather, the designer should first use a formula to determine the required deflection (and therefore overall cushion thickness) and then use waveform analysis of a drop test in order to further optimize the package system. This will likely result in a substantial amount of trial and error.
To reduce this effort to the absolute minimum, the designer must be knowledgeable in waveform analysis. The designer must be able to look at a response waveform and determine if more or less flexibility, more or less cushion thickness, or different cushion distribution is required.
Another interesting feature of cushion systems of the future will likely be the increased use of combination materials; for example, polyethylene and polyurethane foam used together, or polystyrene and polyethylene foam used in the same package system. Currently it is rare to find a design which uses combination materials, either in series (one above the other) or in parallel (side by side). On the few occasions that one finds it, the results are normally not encouraging. The reason is that there are few guidelines to help the designer produce an optimum package system. Rather, it is generally a series of trial and error efforts that may or may not product fruitful results. However, all this is changing. Through the use of waveform analysis and microcomputers, the designer can quickly determine if combination materials make sense over conventional cushioning techniques.
- 20 -

VII. CONCLUSION
All cushion systems work in the same way: they trade peak acceleration for duration. They trade a high peak short duration shock pulse for a longer duration lower peak shock pulse (See Figure 11). The longer duration depends on the deflection of the cushion. This deflection can be the result of compression, shear, flexure, or other motion of the material. In all cases, the results are the same, namely, the material must "give" in order to change the shape of the acceleration vs. time pulse delivered to the product. The nature of this deflection is predicted by a series of simple physical formulas. Also, the relationship of the variables involved in dynamic package response is straightforward and once it is understood by the designer, it can be of great help in optimizing cushion systems.
SHOCK INPUT
CUSHIONED PRODUCT RESPONSE
G's
TIME
Figure 11
Shock Input and Cushioned Response
It is likely that package design and testing will become more technical in the future. However, the increased sophistication will simply involve adaptations of a few basic techniques explored in this paper. The designer is encouraged to learn why and how cushion materials do their job and to use this information to design better package systems.
- 21 -