Curtailing Energy Theft by Remote Monitoring Case study ... · Electricity theft can be in the form...
5
Abstract— Nigeria continues to wallow in the doldrums of inadequate generation, supply and distribution of power. Industrialization, a major output of stable and adequate power supply has waned, leading to adverse effects on the economy. A major contributing factor to the ineffectiveness of Nigeria’s power network is electricity theft. Many consumers have resorted to electricity theft and tampering of electricity devices leading to unreliability, overloading of power lines and increased billing on the part of legal consumers. It is on the basis of these challenges that remote monitoring on power lines is proposed by designing a power meter that transmits data wirelessly to the base station (Distribution Company). The monitoring system (power meter) is expected to be resident on each transformer, distribution pole as well as the consumer’s premises. The readings are then sent to the distribution company office for analysis through the wireless network. This system will increase overall returns to the distribution company and improve transparency in the metering process. We shall adopt the University of Nigeria, Nsukka was used as a case study, making the assumptions that Internet access and a remote cutoff mechanism is available. Index Terms—Electricity theft, inadequate generation, unreliability, monitoring system I. INTRODUCTION Electricity losses abound in the transmission and distribution system of Nigeria’s power network. Nigeria’s power grid has a total transmission and distribution loss of 40% [1]. This is indeed alarming. The losses are due to either commercial or technical losses. Technical losses occur due to energy dissipated in conductors and equipment used in the transmission and distribution of power. Commercial losses, on the other hand are due to defective meters, in the estimation of unmetered energy supply and electricity theft. While Losses due to defective meters are defined as the difference between the amount of energy actually delivered through the meters and the amounted registered by the meters; unmetered losses refer to situations where the energy usage is estimated instead of measured with an energy meter. Manuscript received August 2, 2016. M. J. Mbunwe is with the Department of Electrical Engineering, University of Nigeria, Nsukka. (corresponding author: +2348036675952; e- mail: [email protected] ). N. David is with the Department of Electronic Engineering, University of Nigeria, Nsukka ( e-mail: [email protected] ). Energy theft refers to energy delivered to customers that is not measure by the customer’s electricity meter. This paperwill focus on the monitoring of energy theft using the University of Nigeria, Nsukka as a case study. II. ELECTRICITY THEFT Electricity theft can be in the form of fraud (meter tampering), stealing (illegal connections), billing irregularities, and unpaid bills [2]. The emergence of power theft as a serious problem has evolved due to several recent trends. Most countries developed electric power systems that were highly centralized state owned monopolies, where efficiency and profits were not high priority. The privatization of the infrastructure and new modes of power policy requires the new business-like enterprises to operate efficiently and try to optimize profits in an environment of rapid change. In many countries power theft is an issue of open discussion, even in the most efficient (such as in the USA) and moderately efficient (Malaysia) systems. In South Asian countries, electric power is rarely discussed without reference to power theft, since it is such a prevalent practice. However, in some countries (Thailand, China) the topic is rarely part the analysis of power systems [2]. A. Types of Electricity Theft Electricity thefts occur in different forms. From available literature and practical daily reports in Nigeria, the common ways include bypassing (illegal tapping of electricity from the feeder), meter tampering (by grounding the neutral wire as it does not measure readings) and physical methods to evade payment of bills. The basic method of stealing electricity is a direct wire-connection to a main power route passing a shop or a house so that electricity can flow to the consumer without crossing the electric meter installed by a government agency which is responsible for providing electrical services to customer. There are different types of theft done all over the world. Huge amount of power theft are done by tapping from line or bypassing the meter, According to a study 80% of the total theft detected all over the world is from residential buildings and 20% from commercial and industrial premises [3]. Theft and pilferage account for a substantial part of the high transmission and distribution losses in Nigeria theft/ pilferage of energy is mainly committed by two categories of consumers, that is, non-consumers and legal consumers. Curtailing Energy Theft by Remote Monitoring Case study: University of Nigeria, Nsukka Mbunwe Muncho Josephine and David Nathan, Member, IAENG Proceedings of the World Congress on Engineering and Computer Science 2016 Vol I WCECS 2016, October 19-21, 2016, San Francisco, USA ISBN: 978-988-14047-1-8 ISSN: 2078-0958 (Print); ISSN: 2078-0966 (Online) WCECS 2016
Transcript of Curtailing Energy Theft by Remote Monitoring Case study ... · Electricity theft can be in the form...

Abstract— Nigeria continues to wallow in the doldrums of
inadequate generation, supply and distribution of power.
Industrialization, a major output of stable and adequate power
supply has waned, leading to adverse effects on the economy. A
major contributing factor to the ineffectiveness of Nigeria’s
power network is electricity theft. Many consumers have
resorted to electricity theft and tampering of electricity devices
leading to unreliability, overloading of power lines and
increased billing on the part of legal consumers. It is on the
basis of these challenges that remote monitoring on power lines
is proposed by designing a power meter that transmits data
wirelessly to the base station (Distribution Company). The
monitoring system (power meter) is expected to be resident on
each transformer, distribution pole as well as the consumer’s
premises. The readings are then sent to the distribution
company office for analysis through the wireless network. This
system will increase overall returns to the distribution
company and improve transparency in the metering process.
We shall adopt the University of Nigeria, Nsukka was used as a
case study, making the assumptions that Internet access and a
remote cutoff mechanism is available.
Index Terms—Electricity theft, inadequate generation,
unreliability, monitoring system
I. INTRODUCTION
Electricity losses abound in the transmission and
distribution system of Nigeria’s power network. Nigeria’s
power grid has a total transmission and distribution loss of
40% [1]. This is indeed alarming. The losses are due to
either commercial or technical losses. Technical losses
occur due to energy dissipated in conductors and equipment
used in the transmission and distribution of power.
Commercial losses, on the other hand are due to defective
meters, in the estimation of unmetered energy supply and
electricity theft.
While Losses due to defective meters are defined as the
difference between the amount of energy actually delivered
through the meters and the amounted registered by the
meters; unmetered losses refer to situations where the
energy usage is estimated instead of measured with an
energy meter.
Manuscript received August 2, 2016.
M. J. Mbunwe is with the Department of Electrical Engineering,
University of Nigeria, Nsukka. (corresponding author: +2348036675952; e-
mail: [email protected]).
N. David is with the Department of Electronic Engineering, University
of Nigeria, Nsukka ( e-mail: [email protected]).
Energy theft refers to energy delivered to customers that is
not measure by the customer’s electricity meter. This
paperwill focus on the monitoring of energy theft using the
University of Nigeria, Nsukka as a case study.
II. ELECTRICITY THEFT
Electricity theft can be in the form of fraud (meter
tampering), stealing (illegal connections), billing
irregularities, and unpaid bills [2]. The emergence of power
theft as a serious problem has evolved due to several recent
trends. Most countries developed electric power systems
that were highly centralized state owned monopolies, where
efficiency and profits were not high priority. The
privatization of the infrastructure and new modes of power
policy requires the new business-like enterprises to operate
efficiently and try to optimize profits in an environment of
rapid change.
In many countries power theft is an issue of open
discussion, even in the most efficient (such as in the USA)
and moderately efficient (Malaysia) systems. In South Asian
countries, electric power is rarely discussed without
reference to power theft, since it is such a prevalent practice.
However, in some countries (Thailand, China) the topic is
rarely part the analysis of power systems [2].
A. Types of Electricity Theft
Electricity thefts occur in different forms. From available
literature and practical daily reports in Nigeria, the common
ways include bypassing (illegal tapping of electricity from
the feeder), meter tampering (by grounding the neutral wire
as it does not measure readings) and physical methods to
evade payment of bills. The basic method of stealing
electricity is a direct wire-connection to a main power route
passing a shop or a house so that electricity can flow to the
consumer without crossing the electric meter installed by a
government agency which is responsible for providing
electrical services to customer. There are different types of
theft done all over the world. Huge amount of power theft
are done by tapping from line or bypassing the meter,
According to a study 80% of the total theft detected all over
the world is from residential buildings and 20% from
commercial and industrial premises [3].
Theft and pilferage account for a substantial part of the
high transmission and distribution losses in Nigeria theft/
pilferage of energy is mainly committed by two categories
of consumers, that is, non-consumers and legal consumers.
Curtailing Energy Theft by Remote Monitoring
Case study: University of Nigeria, Nsukka
Mbunwe Muncho Josephine and David Nathan, Member, IAENG
Proceedings of the World Congress on Engineering and Computer Science 2016 Vol I WCECS 2016, October 19-21, 2016, San Francisco, USA
ISBN: 978-988-14047-1-8 ISSN: 2078-0958 (Print); ISSN: 2078-0966 (Online)
WCECS 2016
Some of the modes for illegal abstraction or consumption of
electricity are given below:
1) Meter tampering: customers tamper the meter by
grounding the neutral wire, this causes the meter to
assume an incomplete circuit and it does measure
the meter reading.
2) Meter bypass: the input terminal and output terminal
of the energy meter has been shorted by a wire.
This act prevents energy from been registered in
the meter.
3) Illegal terminal taps of overhead lines on the low
tension side of the transformer: primarily,
electricity theft affects the power sector as a whole,
tapping of the low tension side of the transformer
result in overloading which causes tripping and can
lead to blackout.
4) Illegal tapping to bare wires or underground cables:
This is the most used method for theft of power.
80% of total power theft all over the world is done
by direct tapping from line. The consumer taps into
a direct power line from a point ahead of the
energy. This energy source is unmeasured in its
consumption and procured with or without
switches.
5) Unpaid bills: Non-payment of bills by individuals,
government institutions and untouchable VIPs
results in utility running at a loss and a must
continually increase in electricity charges.
6) Billing irregularities: This incorporates the
inaccurate meter reading taken by bribed
servicemen and intentional fixing of the bill by
office staffs in exchange of illicit payments from
the consumers.
B. Implications of Electricity Theft
Electricity theft has the following implications both to the
distribution company as well as the consumer:
1) Increased billing on the part of legal consumers
2) Economic losses to the Utility
3) Overloading of power lines
4) Unreliability of Electricity service
5) Unsafe environment for troubleshooting
III. OBJECTIVES
There are three primary objectives of this paper:
1) To provide concise information of power consumed
for each consumer and transformer, to check
electricity theft and maximize economic returns
using a power meter
2) To remotely monitor supply and consumption of
electricity through a wireless network
3) To localize electricity information and hence compare
energy supplied to bills issued.
IV. POWER METER DESIGN
The power meter consists of the hardware section, which
are: Arduino mega 2560; CC3000 Wi-Fi Shield; Non-
Invasive current sensor; 7inch Liquid crystal display
(MD070SD); and Voltage sensor (ZMPT101B); will
interface with Carriots online database software section
using the proposed case study. The current measurement
circuit is used to eliminate the negative current readings
while the Wi-Fi shield add on board is used to wirelessly
connect the module to the internet. A current transducer
(clamp on sensor), is used to sense the current by clamping
the current sensor on the positive wire while a voltage
sensor (ZMPT101B) senses the voltage. The Arduino is
programmed to compute energy consumed using the sensed
current and voltage and then, wirelessly sends the data to
the base station account using a web interface called
Carriots [5].
The 7 inch liquid crystal display (MD070SD) adopts
8080 timing sequence with 16-bit parallel bus interface,
resolution of 800 × 480, display panel with 16M color and
integrated with 8-page video memory and the remaining
memory used as extended memory. Table I shows the
specification.
Determination of maximum output rms volta, Umax,
which is decided by the AD peak voltage in the sample loop
as:
As for Bipolar AD, 2
max
ePeakvoltagU (1)
As for Unipolar AD, 22
max
epeakvoltagU (2)
Example: For ±5V AD, the maximum rms voltage of the
transformer
VU 53.325max
For 0~3.3V AD, the maximum rms voltage of the
transformer
VVV 16.1223.3max
Determination of input current-limiting resistor, RI:
IVR I (3)
Where V= rated input voltage
I= rated operating current
ZMPT101B/ZMPT107 usually working at rated
current:1~2mA.
Figure 1 shows the proposed power meter for the case
study.
The current transducer is an electrical device having two
jaws which open to allow clamping around an electrical
conductor. This allows properties of the electric current in
the conductor to be measured, without having to make
physical contact with it, or to disconnect it for insertion
through the probe. The current clamp reads the magnitude
of a sinusoidal current (as invariably used in alternating
current (AC) power distribution systems), but in conjunction
with more advanced instrumentation, the phase and
waveform are available.
The reading produced by a conductor carrying a very low
current can be increased by winding the conductor around
the clamp several times; the meter reading divided by the
number of turns is the current, with some loss of accuracy
due to inductive effects. This current transducer is rated
30A, but similar current transducers rated 1000A can be
used for a larger scale. In addition, less-expensive clamp
meters use a rectifier circuit which actually reads mean
current, but is calibrated to display the RMS current
Proceedings of the World Congress on Engineering and Computer Science 2016 Vol I WCECS 2016, October 19-21, 2016, San Francisco, USA
ISBN: 978-988-14047-1-8 ISSN: 2078-0958 (Print); ISSN: 2078-0966 (Online)
WCECS 2016

corresponding to the measured mean, giving a correct RMS
reading only if the current is a sine wave. For other
waveforms, readings will be incorrect; when these simpler
meters are used with non-sinusoidal loads such as the
ballasts used with fluorescent lamps or high-intensity
discharge lamps or most modern computer and electronic
equipment, readings can be quite inaccurate. Figure 2 shows
the block diagram of the power meter.
The reference design specifications are specified in Table
II and Table III.
Fig. 1: The power meter
Fig. 2: Block diagram of the power meter
The current will be measured from a current carrying
wire using a non- invasive current transducer into the main
power panel. A supply cable from the main power panel is
sent to the house. The power is the computer in the Arduino
Mega, the calculated values are sent to the display on the
resident’s house and wirelessly sent to the base station using
a Wifi shield (cc3000). The data will be transmitted over a
wireless connection from the power meter, through the Wifi
shield to a web application interface called Carriots.
V. CARRIOT (ONLINE DATA BASE APPLICATION)
The Carriots serves as an online data base that keeps track
of energy consumed for each consumer. Carriots is an
application hosting and development platform (Platform as a
Service) specially designed for projects related to the
Internet of Things (IoT) and Machine to Machine (M2M). It
enables data collection from connected objects (the things
part), store it, build powerful applications with few lines of
code and integration with external Industrial Training (IT)
systems (the internet part). Carriots provides a development
environment, APIs and hosting for IoT projects
development. A snapshot of the online database and data
from each meter is shown in appendix.
Proceedings of the World Congress on Engineering and Computer Science 2016 Vol I WCECS 2016, October 19-21, 2016, San Francisco, USA
ISBN: 978-988-14047-1-8 ISSN: 2078-0958 (Print); ISSN: 2078-0966 (Online)
WCECS 2016
VI. WIRELESSLY MONITORING POWER
CONSUMPTION
The use of radio waves to achieve a wireless connectivity
solution would definitely be cheaper to implement. The
adopted topology is a star topology. This topology has the
advantage of speedy setup and easy extension. As for the
kind of applications that the network will accommodate, it is
expected that, initially, the network will be exclusively used
for distribution of Internet access campus-wide [6].
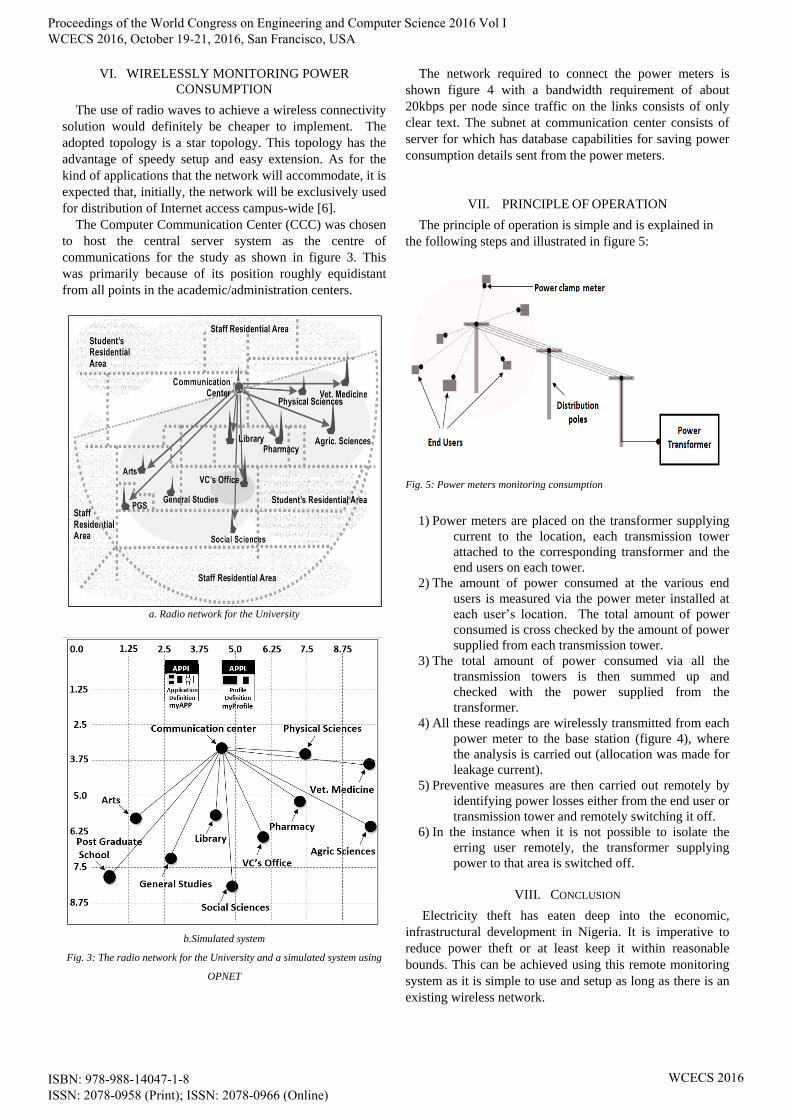
The Computer Communication Center (CCC) was chosen
to host the central server system as the centre of
communications for the study as shown in figure 3. This
was primarily because of its position roughly equidistant
from all points in the academic/administration centers.
a. Radio network for the University
b.Simulated system
Fig. 3: The radio network for the University and a simulated system using
OPNET
The network required to connect the power meters is
shown figure 4 with a bandwidth requirement of about
20kbps per node since traffic on the links consists of only
clear text. The subnet at communication center consists of
server for which has database capabilities for saving power
consumption details sent from the power meters.
VII. PRINCIPLE OF OPERATION
The principle of operation is simple and is explained in
the following steps and illustrated in figure 5:
Fig. 5: Power meters monitoring consumption
1) Power meters are placed on the transformer supplying
current to the location, each transmission tower
attached to the corresponding transformer and the
end users on each tower.
2) The amount of power consumed at the various end
users is measured via the power meter installed at
each user’s location. The total amount of power
consumed is cross checked by the amount of power
supplied from each transmission tower.
3) The total amount of power consumed via all the
transmission towers is then summed up and
checked with the power supplied from the
transformer.
4) All these readings are wirelessly transmitted from each
power meter to the base station (figure 4), where
the analysis is carried out (allocation was made for
leakage current).
5) Preventive measures are then carried out remotely by
identifying power losses either from the end user or
transmission tower and remotely switching it off.
6) In the instance when it is not possible to isolate the
erring user remotely, the transformer supplying
power to that area is switched off.
VIII. CONCLUSION
Electricity theft has eaten deep into the economic,
infrastructural development in Nigeria. It is imperative to
reduce power theft or at least keep it within reasonable
bounds. This can be achieved using this remote monitoring
system as it is simple to use and setup as long as there is an
existing wireless network.
Proceedings of the World Congress on Engineering and Computer Science 2016 Vol I WCECS 2016, October 19-21, 2016, San Francisco, USA
ISBN: 978-988-14047-1-8 ISSN: 2078-0958 (Print); ISSN: 2078-0966 (Online)
WCECS 2016
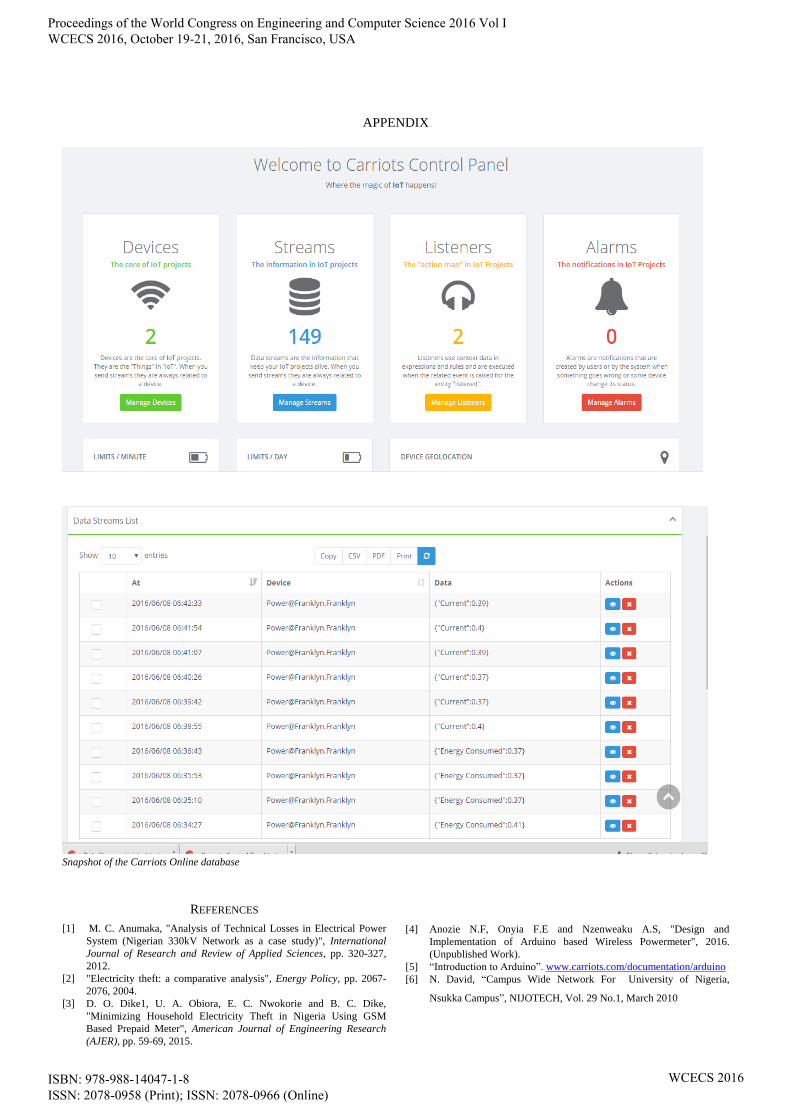
APPENDIX
Snapshot of the Carriots Online database
REFERENCES
[1] M. C. Anumaka, "Analysis of Technical Losses in Electrical Power
System (Nigerian 330kV Network as a case study)", International
Journal of Research and Review of Applied Sciences, pp. 320-327,
2012.
[2] "Electricity theft: a comparative analysis", Energy Policy, pp. 2067-
2076, 2004.
[3] D. O. Dike1, U. A. Obiora, E. C. Nwokorie and B. C. Dike,
"Minimizing Household Electricity Theft in Nigeria Using GSM
Based Prepaid Meter", American Journal of Engineering Research
(AJER), pp. 59-69, 2015.
[4] Anozie N.F, Onyia F.E and Nzenweaku A.S, "Design and
Implementation of Arduino based Wireless Powermeter", 2016.
(Unpublished Work).
[5] “Introduction to Arduino”. www.carriots.com/documentation/arduino
[6] N. David, “Campus Wide Network For University of Nigeria,
Nsukka Campus”, NIJOTECH, Vol. 29 No.1, March 2010
Proceedings of the World Congress on Engineering and Computer Science 2016 Vol I WCECS 2016, October 19-21, 2016, San Francisco, USA
ISBN: 978-988-14047-1-8 ISSN: 2078-0958 (Print); ISSN: 2078-0966 (Online)
WCECS 2016