Current Concepts of Analysis of Cerebral White Matter
9
Current Concepts of Analysis of Cerebral White Matter Hyperintensities on Magnetic Resonance Imaging Mitsuhiro Yoshita, MD, PhD, Evan Fletcher, PhD, and Charles DeCarli, MD Abstract: Cerebrovascular disease is common and associated with cognitive deficits and increased risk for dementia. Until recently, only limited attention has focused on advances in imaging techniques to better define and quantify the spectrum of asympto- matic cerebrovascular disease commonly seen on magnetic resonance imaging, such as abnormal white matter signals. Abnormal signals in cerebral white matter, although nonspecific, are increased in prevalence and severity in association with aging and cerebrovascular risk factors among older individuals. The ubiquitous occurrence of these abnormal white matter signals commonly referred to as white matter hyperintensities (WMHs) and the association with cerebrovascular risk and cognitive impairment among older individuals make scientific evaluation of WMHs an important and much needed avenue of research. In this section, we review current methods of WMH analysis. Strengths and limitation of both quantitative and qualitative methods are discussed initially, followed by a brief review of current magnetic resonance imaging segmentation and mapping techniques that make it possible to assess the anatomical location of WMHs. We conclude by discussing future analytic methods designed to better understand the pathophysiology and cognitive consequences of WMHs. Key Words: magnetic resonance imaging, white matter hyperintensities, brain segmentation (Top Magn Reson Imaging 2005;16:399Y407) H yperintense white matter (WMH) signal abnormalities are commonly found in the cerebral white matter of T2- weighted and fluid-attenuated inversion recovery (FLAIR) brain magnetic resonance imaging (MRI) sequences. White matter hyperintensities are consistently associated with age, hypertension, and other cardiovascular risk factors. 1 Indivi- duals with extensive WMHs are also at significantly increased risk for future stroke. 2,3 White matter hyperintensities are therefore commonly considered part of the spectrum of vascular-related injury, particularly among older individuals. 4 White matter hyperintensities also impact the cognitive function of otherwise healthy elderly people and those with mild cognitive impairment (MCI) and dementia. Among cognitively normal older individuals, WMHs are associated with subtle reductions in memory, processing speed, and executive function. 5 White matter hyperintensities are also associated with the symptoms of MCI, 6,7 including memory loss, 8 and may increase the risk for conversion to dementia, 9 although this finding is controversial. 10 White matter hyperintensities are more extensive in patients diagnosed with Alzheimer disease (AD), 11Y13 and individuals with WMHs require a lower neuropathologic AD burden to demonstrate cognitive impairment 14 and dementia 15 than individuals with- out these lesions. The presence of concurrent WMHs may also cause diagnostic confusion for the treating physician, 16 potentially limiting effective care for these individuals. The relationship between WMHs and cognition in dementia, however, remains unclear. Although some studies show increased WMHs in association with AD, this pattern is not uniformly observed. 17,18 Moreover, some studies suggest that subjects with AD and WMHs perform worse on cognitive tasks than cognitively healthy aging individuals, 19 yet other studies find no relationship between WMH and cognition among patients with AD. 18,20 Finally, individuals with extensive WMHs are often excluded from studies of normal aging and clinical trials in AD, further limiting our under- standing of how WMH impacts the aging process and AD. Advances in imaging technology have facilitated routine detection of WMH in clinical settings, but scientific under- standing of the significance of WMH lags behind. This chapter focuses on how WMHs are measured. QUALITATIVE AND QUANTITATIVE MEASURE OF WMHs Both qualitative and quantitative techniques have been used to measure WMHs. The qualitative approach uses visual rating scales whereby a single summary value of WMH severity is assigned to each image by a well-trained rater based on an operationally defined rating scale. 21Y25 Visual rating scales have the advantage of ease of use and insen- sitivity to artifacts that commonly limit quantitative method, making such approaches attractive to large epidemiological studies. 2,5,7,12,26 There are a variety of published visual rating scales. 21,24,27Y29 Unfortunately, qualitative scales have a number of limitations. For example, categorical ratings have a restricted range of values that limit the power of association. Moreover, qualitative scales are often subjective in their interpretation, limiting interrater and intrarater reliability. Reliability is particularly poor with longitudinal studies. 30 For example, Ma ¨ntyla ¨ et al 25 compared 13 different ORIGINAL ARTICLE Top Magn Reson Imaging & Volume 16, Number 6, December 2005 399 From the Imaging of Dementia and Aging Laboratory, Department of Neurology and Center for Neuroscience, University of California at Davis, Davis, CA. Reprints: Charles DeCarli, MD, Alzheimer’s Disease Center and Imaging of Dementia and Aging (IDeA) Laboratory, Department of Neurology and Center for Neuroscience, University of California at Davis, 4860 Y Street, Suite 3700 Sacramento, CA 95817 (e-mail: [email protected]). Copyright * 2005 by Lippincott Williams & Wilkins Copyr ight © Lippincott Williams & Wilkins. Unauthor iz ed reproduction of this article is prohibited.
Transcript of Current Concepts of Analysis of Cerebral White Matter

Current Concepts of Analysis of Cerebral White MatterHyperintensities on Magnetic Resonance Imaging
Mitsuhiro Yoshita, MD, PhD, Evan Fletcher, PhD, and Charles DeCarli, MD
Abstract: Cerebrovascular disease is common and associated with
cognitive deficits and increased risk for dementia. Until recently,
only limited attention has focused on advances in imaging
techniques to better define and quantify the spectrum of asympto-
matic cerebrovascular disease commonly seen on magnetic
resonance imaging, such as abnormal white matter signals.
Abnormal signals in cerebral white matter, although nonspecific,
are increased in prevalence and severity in association with aging
and cerebrovascular risk factors among older individuals. The
ubiquitous occurrence of these abnormal white matter signals
commonly referred to as white matter hyperintensities (WMHs) and
the association with cerebrovascular risk and cognitive impairment
among older individuals make scientific evaluation of WMHs an
important and much needed avenue of research. In this section, we
review current methods of WMH analysis. Strengths and limitation
of both quantitative and qualitative methods are discussed initially,
followed by a brief review of current magnetic resonance imaging
segmentation and mapping techniques that make it possible to assess
the anatomical location of WMHs. We conclude by discussing future
analytic methods designed to better understand the pathophysiology
and cognitive consequences of WMHs.
Key Words: magnetic resonance imaging, white matter
hyperintensities, brain segmentation
(Top Magn Reson Imaging 2005;16:399Y407)
Hyperintense white matter (WMH) signal abnormalitiesare commonly found in the cerebral white matter of T2-
weighted and fluid-attenuated inversion recovery (FLAIR)brain magnetic resonance imaging (MRI) sequences. Whitematter hyperintensities are consistently associated with age,hypertension, and other cardiovascular risk factors.1 Indivi-duals with extensive WMHs are also at significantly increasedrisk for future stroke.2,3 White matter hyperintensities aretherefore commonly considered part of the spectrum ofvascular-related injury, particularly among older individuals.4
White matter hyperintensities also impact the cognitivefunction of otherwise healthy elderly people and those with
mild cognitive impairment (MCI) and dementia. Amongcognitively normal older individuals, WMHs are associatedwith subtle reductions in memory, processing speed, andexecutive function.5 White matter hyperintensities are alsoassociated with the symptoms of MCI,6,7 including memoryloss,8 and may increase the risk for conversion to dementia,9
although this finding is controversial.10 White matterhyperintensities are more extensive in patients diagnosedwith Alzheimer disease (AD),11Y13 and individuals with WMHsrequire a lower neuropathologic AD burden to demonstratecognitive impairment14 and dementia15 than individuals with-out these lesions. The presence of concurrent WMHs may alsocause diagnostic confusion for the treating physician,16
potentially limiting effective care for these individuals.The relationship between WMHs and cognition in
dementia, however, remains unclear. Although some studiesshow increased WMHs in association with AD, this pattern isnot uniformly observed.17,18 Moreover, some studies suggestthat subjects with AD and WMHs perform worse on cognitivetasks than cognitively healthy aging individuals,19 yet otherstudies find no relationship between WMH and cognitionamong patients with AD.18,20 Finally, individuals withextensive WMHs are often excluded from studies of normalaging and clinical trials in AD, further limiting our under-standing of how WMH impacts the aging process and AD.Advances in imaging technology have facilitated routinedetection of WMH in clinical settings, but scientific under-standing of the significance of WMH lags behind. Thischapter focuses on how WMHs are measured.
QUALITATIVE AND QUANTITATIVEMEASURE OF WMHs
Both qualitative and quantitative techniques have beenused to measure WMHs. The qualitative approach uses visualrating scales whereby a single summary value of WMHseverity is assigned to each image by a well-trained raterbased on an operationally defined rating scale.21Y25 Visualrating scales have the advantage of ease of use and insen-sitivity to artifacts that commonly limit quantitative method,making such approaches attractive to large epidemiologicalstudies.2,5,7,12,26 There are a variety of published visual ratingscales.21,24,27Y29 Unfortunately, qualitative scales have anumber of limitations. For example, categorical ratingshave a restricted range of values that limit the power ofassociation. Moreover, qualitative scales are often subjectivein their interpretation, limiting interrater and intraraterreliability. Reliability is particularly poor with longitudinalstudies.30 For example, Mantyla et al25 compared 13 different
ORIGINAL ARTICLE
Top Magn Reson Imaging & Volume 16, Number 6, December 2005 399
From the Imaging of Dementia and Aging Laboratory, Department ofNeurology and Center for Neuroscience, University of California atDavis, Davis, CA.
Reprints: Charles DeCarli, MD, Alzheimer’s Disease Center and Imaging ofDementia and Aging (IDeA) Laboratory, Department of Neurology andCenter for Neuroscience, University of California at Davis, 4860 Y Street,Suite 3700 Sacramento, CA 95817 (e-mail: [email protected]).
Copyright * 2005 by Lippincott Williams & Wilkins
Copyr ight © Lippincott Williams & Wilkins. Unauthorized reproduction of this article is prohibited.

visual rating scales to determine the consistency with whichthe various methods would rate WMH severity. Theyconcluded that the heterogeneous properties of the differentscales resulted in inconsistencies among previously publishedstudies. Furthermore, it was clear that some of the scales werelimited by ceiling effects. In the Leukokraurosis and Disabilitystudy, it was also mentioned that visual rating scales have poordiscrimination of absolute lesion volume.31 Therefore,research on cognition and WMH using visual rating scaletechniques has enough inconsistency to be problematic.
Quantitative methods of measuring WMH severity usecomputer-based techniques to obtain volumetric measures ofWMH burden.32Y40 These methods vary from manual out-lining techniques to fully-automatic WMH detection. Manualoutlining techniques are referred to as Bregion-of-interest^(ROI) methodologies, in which the reviewer views the scanon a computer and manually traces WMH with the mouse andcursor. After an ROI is traced, the computer calculates avolume of the region based on the section thickness and thenumber of pixels residing in the traced area. The values for allsections are then added together to make a total WMHvolume. Volumetric determination is a strength of suchmethods; however, these methods are limited by the need forcomputer-based digital imaging and a well-trained investi-gator and are time consuming.
Fully automated techniques are based on computeralgorithms for segmenting and measuring WMH volumesfrom the intensity of each voxel. After counting the number ofvoxels exceeding a predefined threshold of intensity (whichmay be set in a straightforward manner or a moresophisticated way using computations from global and localintensity histograms), a WMH volume is made by collectingthe hyperintense voxels from all sample slices. The processesof setting the threshold by which voxels are estimated to behyperintense are susceptible to errors resulting from humanvisual assessing of WMH boundaries, equivocal regions, andartifacts. The advantages of quantitative image analysis havebeen reported.31,41,42 Although it might be difficult, withouthistopathology, to truly determine which of these techniquesis superior, nonetheless, these studies have concluded thatcomputer-mediated methods are likely to be more accurateestimates of WMH severity.
Quantification of WMH volumes can give importantinformation about the total extent of abnormal signal in thebrain. Unfortunately, knowledge of total volume alone doesnot recognize individual differences in the anatomicaldistribution of WMH which can vary substantially amongindividuals and may be important to the understanding of thepathophysiology and the cognitive impact of WMH. There-fore, we next describe the methods that account for WMHdistribution and volume.
MEASURING WMH EXTENTAND DISTRIBUTION
Building on the advantages of quantitative measures ofWMH, several studies on spatial distribution and extent ofWMH have been published.38,43Y45 Such studies are likely toinstruct us on questions such as hemispheric symmetry and
provide a basis for the examination of the functionalrelevance of these lesions.
For example, DeCarli et al46 described an automatedWMH segmentation technique as part of an extensivealgorithm to acquire morphometric data for a large numberof brains of aging individuals. In this algorithm, the onlyhuman intervention is to remove nonbrain tissue fromconventional double spin-echo images. These images weresegmented in a multistep process by performing local slice-based inhomogeneity corrections and brain matter segmenta-tion on pseudo-T1 images and then segmenting voxels from aweighted summed proton density and T2 images withintensity of greater than 3.5 SDs above the mean to identifyWMH voxels. This study found broad demographic patternsof brain changes concurrent with aging. However, it did notattempt to place these patterns on a common template.
Wen and Sachdev38 and Benson et al43 showed topo-graphical WMH distributions using statistical parametricmapping47 techniques. For instance, they reported, in a cross-sectional study, the detailed topography of WMH in thebrains of a representative sample and showed its widespreadand important determinants.38 In brief, they used a 1.5 T MRIscanner to obtain 1.5-mm thick T1-weighted (fast spoiledgradient-recalled echo) contiguous coronal sections and 4-mmthick T2-weighted FLAIR coronal slices through the wholebrain. An age-specific FLAIR template in Montreal Neuro-logical Institute (MNI) space48 was constructed. Spatial nor-malization of the coregistered FLAIR and T1-weightedMRIs was then performed using the FLAIR templates. Thedetection and grading of WMH from each normalized FLAIRimage, with the coregistered T1-weighted images as refer-ence, was carried out. Each WMH map generated by thecomputer algorithm was visually inspected, and the falseclassification of WMH was manually removed from the map.White matter hyperintensity maps thus generated wereternary images, the voxel values of which indicated eitherthe presence or absence of severe or moderate WMH on thatlocation. Linear and nonlinear transforms were applied ontoeach individual MRI to place it into the MNI template, whichis situated in Talairach space.49 To quantify the WMHdistribution, the template was partitioned into lobar regionsand arterial territories. After normalizing each brain intoTalairach space, a profile of WMH distribution by ROI couldbe tabulated, and a voxel-based probability map for WMHoccurrence was also developed using Statistical ParametricMapping99 (SPM99; Wellcome Functional Imaging Labora-tory, London, UK).47 In summary, the 2 important compo-nents of the technique were the following: (1) automaticdetection of moderate and severe WMH in each subject(supplemented by human visual confirmation and adjustment)and (2) the use of a common template space, making possiblea large-scale cross-sectional study of WMH distributions.
The previous methods included human interaction toremove false-positive identifications of WMH and to confirmthe results of the automated segmentation. Another approachby Admiraal-Bhehloul et al39 added an automaticBreasoning^ step to replace the role of the human validator.Their method uses 3 subject images: FLAIR, T2, and protondensityVall coregistered. In a 2-level algorithm, intensity
Yoshita et al Top Magn Reson Imaging & Volume 16, Number 6, December 2005
400 * 2005 Lippincott Williams & Wilkins
Copyr ight © Lippincott Williams & Wilkins. Unauthorized reproduction of this article is prohibited.

values from the 3 images are first assigned linguistic criteria,such as Bdark^ and Bbright,^ and voxel positions are assignedcriteria such as BIC^ (for intracranial) and BWM^ (for whitematter) based on probabilistic estimates from gray and whitetemplates supplied by MNI. Next, in a Breasoning level,^these voxel linguistic criteria are used to deduce theappropriate tissue class, whether cerebrospinal fluid (CSF)or WMH. The reasoning level is implemented as a fuzzyinference system,50 applying human-style reasoning to thelinguistic criteria previously assigned. The outcome is asegmentation of the CSF and WMH voxels of the brain. Theauthors report excellent results from criterion standardvalidation with human raters and also from testing theirresults for robustness after reorienting and reslicing theimages. Unlike the work previously described by Wen andSachdev38 and Benson et al,43 however, they do not discussusing the WMH segmentation to obtain cross-sectionalresults for the occurrence of WMH lesions. Nonetheless, itcould certainly be applied in this direction.
This was the focus of work by DeCarli et al,44 whoexplored the relationship between periventricular WMH,deep WMH, and total WMH using 3-dimensional anatomicalmapping of WMH voxels. These methods also usedautomatic detection of WMH in each subject, followed byhigh-dimensional warping of each WMH map onto acommon template. We will present these methods in greaterdetail in the next section.44,45
IMAGE ACQUISITION AND MAPPINGIn this section, we will discuss the methods developed
in our laboratory for WMH segmentation and mapping. Thesehave much in common with the automated detectionmethods described previously, particularly those of Wenand Sachdev,38 both in their use of computer algorithms toperform intensity-based WMH detection and in using theWMH maps to make inferences about the patterns of WMHdistributions across a population. Therefore, they arepresented as an illustration of these techniques and the resultsthat can be obtained from them.
MRI SEQUENCESTwo sequences were used: a T1-weighted coronal 3-
dimensional spoiled gradient-recalled echo acquisition and aFLAIR sequence designed to enhance WMH segmentation.51
WMH SEGMENTATIONThis section describes the methods of extracting WMH
locations from the FLAIR images. Segmentation of WMH wasperformed on the FLAIR images by a semiautomated procedureusing a set of in-house computer algorithms and programspreviously described.44,52,53 Initial reorientation of the 3-dimensional volume images was performed, so that brainregions were accurately delineated using common internallandmarks.54,55 Before segmentation, nonbrain elements weremanually removed from the image by operator-guided tracingof the dura matter within the cranial vault, and image intensitynonuniformity correction was applied.53 Our method of image
segmentation rests on the assumption that, within a given 2-dimensional image, image pixel intensities for each tissue type(such as CSF and brain matter or gray matter and white matter)have their own population distribution that differs but possiblyoverlaps with that of the other tissue types. CerebrospinalfluidYbrain matter segmentation was obtained by mathemati-cally modeling the pixel intensity distributions from each imageusing Gaussian normal distributions, as previously described.52
The optimal segmentation threshold was defined as theintersection of the CSF modeled distribution with the brainmatter modeled distribution.52 After the image segmentation ofthe brain from CSF was performed, the pixel intensityhistogram of the brain-only FLAIR image was modeled as anormal Gaussian distribution, and pixel intensities of 3.5 SDsabove the mean were considered WMH.56
In the next several subsections, we will describe all thesteps in obtaining a WMH mask overlaid on the studytemplate. The following figure illustrates these steps, from theinitial WMH segmentation to the final image in templatespace (Fig. 1).
T1 IMAGE CORRECTION AND MAPPINGThis section describes the methods by which individual
subject’s WMH maps are deformed into a common templatespace for cross-sectional comparison to generate groupstatistics. The steps are outlined as follows:1. Linearly align and reslice the subject FLAIR image to the
high-resolution T1 image. Transform the WMH map ontothe T1 using the alignment parameters.
2. Use the locations of the WMH voxels on the T1 image toreset the corresponding T1 voxel intensities to reducematching errors during normalization.
3. Perform a high-dimensional cubic B-spline warp oftemplate image onto the subject’s T1 image. Use thewarping parameters to deform the subject’s WMH mapsinto the template space.
4. Construct a WMH population composite map in templatespace based upon the warps of subject’s WMH maps.
These steps will be discussed in turn.
Linear Alignment of FLAIR onto T1 ImageThe FLAIR images, from which the WMH maps are
derived, must first be aligned to the subject’s high-resolutionT1 image. Affine coregistration57 of the FLAIR image to thehigh-resolution T1 image is done using a 6-parametertransformation (ie, using rotations and translations only).After the alignment of the FLAIR image onto the T1 image,its accompanying segmented WMH map is resliced andtransformed onto the T1 image. To compensate for partialvolume errors caused by interpolations in the transformation,the transformed mask may be thresholded at a level thatyields the best approximation to the volume of nonzerovoxels in the original segmented mask.
T1 Image Intensity CorrectionIn T1 images, areas of WMH appear with darker
intensity values than the surrounding normal white matter. In
Top Magn Reson Imaging & Volume 16, Number 6, December 2005 Cerebral White Matter Hyperintensities on MRI
* 2005 Lippincott Williams & Wilkins 401
Copyr ight © Lippincott Williams & Wilkins. Unauthorized reproduction of this article is prohibited.

certain instances, the WMH intensities overlap with those ofCSF voxels. The result perhaps is that, during the warpingstage, WMH areas will be mistaken for CSF, and incorrectalignments will occur at the ventricle boundaries. To addressthis problem, we execute a procedure for Bwhite matterreplacement^. Because WMH voxel intensities in T1 imagesare darker than the normal white matter, we estimate thenormal white matter mean intensities surrounding theidentified WMH locations and replace the WMH intensitiesof the T1 image by this estimated mean.
The following figures illustrate this process. Areaswhere white matter voxel intensity replacements occurredhave been circled in red. In the left image (prereplacement),particularly around the anterior ventricle horns, areas can beseen with reduced intensity which may be treated as CSF bythe warping process and lead to matching errors during thewarp. Voxels in these areas have been reset to a higherintensity in the right image, approximating the surroundingnormal white matter (Fig. 2).
High-dimensional Spatial NormalizationThe T1 image with white matter replacement is
spatially normalized using a minimal deformation template(MDT).48 In this study, this type of template image is createdto minimize the amount of distortion in the nonlineardeformation of each subject’s MRI. The MDT is created asthe most appropriate for the group of study subjects. In theexamples presented here, the subject population was elderlywith a mix of diagnoses, including AD, MCI, and normal. OurMDT was created as the average warp of one of the healthy
elderlies onto 29 subjects randomly selected but with a viewto include all categories of diagnosis. In a precisely definedmeasure,58 the MDT is a high-resolution synthetic image thatis Bclosest^ overall to the images in the study group, needingthe smallest amount of deformation, on average, to matchimages in the study. Figure 3 displays a sample slice from theMDT (left panel).
Spatial normalization consists of a high-dimensionalcubic B-spline warp of the template onto each subject.59 It isaccomplished using a 3-dimensional grid of equally spacedcontrol points which allows locally independent warps to beconstructed in small subvolumes defined by cubes, having
FIGURE 2. Left, T1 image showing WMH areas with reducedvoxel intensities. Right, areas of voxel intensity replacementfollowing the locations of the WMH voxels in the WMHsegmented map.
FIGURE 1. Flowchart for mapping thesubject’s WMH onto the template image.In this figure, the subject FLAIR image(lower right) is segmented to produce aWMH mask (lower middle). The FLAIRimage is linearly aligned and resliced to thesubject’s T1 image (upper middle), andthe T1 image is nonlinearly warped usingthe MDT as a template (upper left). Thealignment and warp parameters are finallyused to transform the WMH mask into thespace of the template (lower left). Adaptedfrom DeCarli.44
Yoshita et al Top Magn Reson Imaging & Volume 16, Number 6, December 2005
402 * 2005 Lippincott Williams & Wilkins
Copyr ight © Lippincott Williams & Wilkins. Unauthorized reproduction of this article is prohibited.

control points as vertices. These result in a matching of fineanatomical details. Each data voxel in the target and subject’simage is contained within a 4 � 4 � 4 cube of such controlpoints, and its position, along with the first and secondderivatives of the warp at that location, is defined by a sum of64 tensor products of B-spline basis functions (third-orderpolynomials) together with the positions of these controlpoints. The third-order polynomial basis functions guaranteethat the local warps are smoothly joined at the boundaries ofthe cubes. By changing one or more of these grid points, thelocation of the voxels can be adjusted. Because thisadjustment is dependent on local parameters only (thelocations of the neighboring 64 grid points), one can obtaina finer anatomical match than what is achievable using linearor nonlinear globally parameterized transformations.
The normalization strategy follows a multigrid hierar-chy. The multigrid approach refers to performing a series ofimage normalizations using control point grids of succes-sively finer mesh. We used control point separations of 32-,16-, 8-, 4-, and 2-mm in succession.
Constructing WMH Frequency MapsAfter transformation of each WMH image using the
warping parameters, the WMH masks are generally wellpositioned in the space of the MDT. The WMH voxels are inlocations analogous to their original locations in the subjects’images. Figure 3 (middle panel) shows an example for 1subject, where the transformed WMH mask is displayed as acolor-coded map over the MDT. In this figure, the nonwhitevoxels at the edges of the transformed WMH mask areartifacts of the display only; the actual mask has beenthresholded at a value to approximate the volume of theuntransformed WMH mask.
We use these transformed subject’s WMH masks tocompute a composite map displaying the fraction of thesubject population having WMH at each voxel of the MDT.The right panel of Figure 3 illustrates the frequency map for astudy population of 88 subjects, in which 26 were diagnosedas having AD, and 29 were diagnosed as having MCI; 33
were healthy controls. Low-intensity peripheral areas of thefrequency map represent voxels where 3% to 5% of thepopulation had WMH. Around the ventricle horns, particu-larly in the anterior region, areas reached 70%.
White matter hyperintensity coordinates from the MDTcan also be converted into MNI coordinates using the MNItemplate48 for further anatomical localization (Fig. 4).
IMAGE ANALYSISImage analysis consists of 2 major components. The
first is to create a WMH composite frequency distributionmap for each group. Voxel intensity values of the groupcomposite maps are floating point values ranging from 0 to1.0, indicating the frequency of WMH at each location ofthe MDT image for that group. Thus, the WMH frequencymaps serve as a measure of intersubject variability and relativeWMH lesion load for each group at that anatomical location.The next figure shows examples of color-coded images ofgroup WMH frequency maps overlaid on the MDT (Fig. 5).
FIGURE 3. The role of the MDT template in white matter mapping. Left, Representative slice from MDT template. The parameterscomputed from normalizing a subject to the MDT are then used to inverse-warp each subject’s T1 image onto the MDT. Inaddition, the subject’s accompanying coregistered FLAIR image and WMH mask are also transformed onto the MDT. Middle, Asample image of 1 subject’s WMH mask after transforming and overlaying on the MDT template. Right, The composite WMHfrequency map for population of 88 subjects.
FIGURE 4. Minimal deformation template and MNI.Composite frequency map for population of 88 subjects, madeto reach the threshold at 20% and overlaid as a color-codedmap onto template images. Left, MDT template. Right,MNI template. Coordinate transformation between the MDTand MNI images was obtained by high-dimensional B-splinewarp between MNI and MDT.
Top Magn Reson Imaging & Volume 16, Number 6, December 2005 Cerebral White Matter Hyperintensities on MRI
* 2005 Lippincott Williams & Wilkins 403
Copyr ight © Lippincott Williams & Wilkins. Unauthorized reproduction of this article is prohibited.
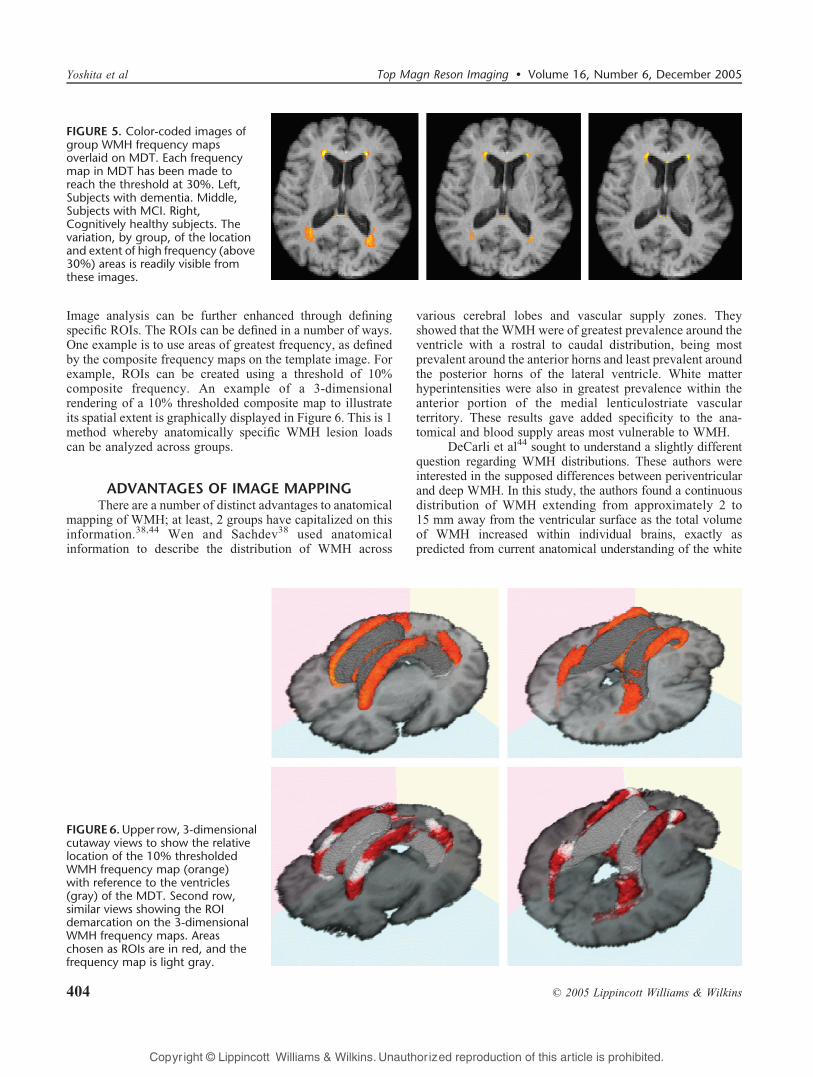
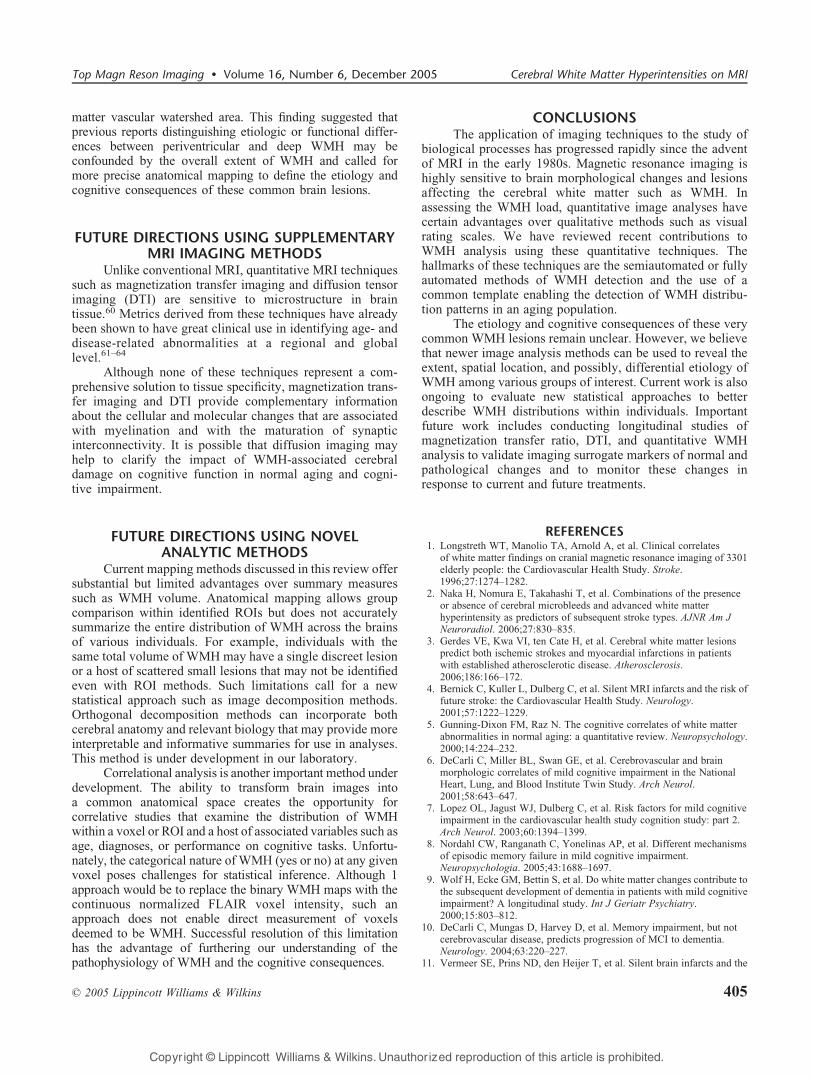
Image analysis can be further enhanced through definingspecific ROIs. The ROIs can be defined in a number of ways.One example is to use areas of greatest frequency, as definedby the composite frequency maps on the template image. Forexample, ROIs can be created using a threshold of 10%composite frequency. An example of a 3-dimensionalrendering of a 10% thresholded composite map to illustrateits spatial extent is graphically displayed in Figure 6. This is 1method whereby anatomically specific WMH lesion loadscan be analyzed across groups.
ADVANTAGES OF IMAGE MAPPINGThere are a number of distinct advantages to anatomical
mapping of WMH; at least, 2 groups have capitalized on thisinformation.38,44 Wen and Sachdev38 used anatomicalinformation to describe the distribution of WMH across
various cerebral lobes and vascular supply zones. Theyshowed that the WMH were of greatest prevalence around theventricle with a rostral to caudal distribution, being mostprevalent around the anterior horns and least prevalent aroundthe posterior horns of the lateral ventricle. White matterhyperintensities were also in greatest prevalence within theanterior portion of the medial lenticulostriate vascularterritory. These results gave added specificity to the ana-tomical and blood supply areas most vulnerable to WMH.
DeCarli et al44 sought to understand a slightly differentquestion regarding WMH distributions. These authors wereinterested in the supposed differences between periventricularand deep WMH. In this study, the authors found a continuousdistribution of WMH extending from approximately 2 to15 mm away from the ventricular surface as the total volumeof WMH increased within individual brains, exactly aspredicted from current anatomical understanding of the white
FIGURE 5. Color-coded images ofgroup WMH frequency mapsoverlaid on MDT. Each frequencymap in MDT has been made toreach the threshold at 30%. Left,Subjects with dementia. Middle,Subjects with MCI. Right,Cognitively healthy subjects. Thevariation, by group, of the locationand extent of high frequency (above30%) areas is readily visible fromthese images.
FIGURE 6.Upper row, 3-dimensionalcutaway views to show the relativelocation of the 10% thresholdedWMH frequency map (orange)with reference to the ventricles(gray) of the MDT. Second row,similar views showing the ROIdemarcation on the 3-dimensionalWMH frequency maps. Areaschosen as ROIs are in red, and thefrequency map is light gray.
Yoshita et al Top Magn Reson Imaging & Volume 16, Number 6, December 2005
404 * 2005 Lippincott Williams & Wilkins
Copyr ight © Lippincott Williams & Wilkins. Unauthorized reproduction of this article is prohibited.
matter vascular watershed area. This finding suggested thatprevious reports distinguishing etiologic or functional differ-ences between periventricular and deep WMH may beconfounded by the overall extent of WMH and called formore precise anatomical mapping to define the etiology andcognitive consequences of these common brain lesions.
FUTURE DIRECTIONS USING SUPPLEMENTARYMRI IMAGING METHODS
Unlike conventional MRI, quantitative MRI techniquessuch as magnetization transfer imaging and diffusion tensorimaging (DTI) are sensitive to microstructure in braintissue.60 Metrics derived from these techniques have alreadybeen shown to have great clinical use in identifying age- anddisease-related abnormalities at a regional and globallevel.61Y64
Although none of these techniques represent a com-prehensive solution to tissue specificity, magnetization trans-fer imaging and DTI provide complementary informationabout the cellular and molecular changes that are associatedwith myelination and with the maturation of synapticinterconnectivity. It is possible that diffusion imaging mayhelp to clarify the impact of WMH-associated cerebraldamage on cognitive function in normal aging and cogni-tive impairment.
FUTURE DIRECTIONS USING NOVELANALYTIC METHODS
Current mapping methods discussed in this review offersubstantial but limited advantages over summary measuressuch as WMH volume. Anatomical mapping allows groupcomparison within identified ROIs but does not accuratelysummarize the entire distribution of WMH across the brainsof various individuals. For example, individuals with thesame total volume of WMH may have a single discreet lesionor a host of scattered small lesions that may not be identifiedeven with ROI methods. Such limitations call for a newstatistical approach such as image decomposition methods.Orthogonal decomposition methods can incorporate bothcerebral anatomy and relevant biology that may provide moreinterpretable and informative summaries for use in analyses.This method is under development in our laboratory.
Correlational analysis is another important method underdevelopment. The ability to transform brain images intoa common anatomical space creates the opportunity forcorrelative studies that examine the distribution of WMHwithin a voxel or ROI and a host of associated variables such asage, diagnoses, or performance on cognitive tasks. Unfortu-nately, the categorical nature of WMH (yes or no) at any givenvoxel poses challenges for statistical inference. Although 1approach would be to replace the binary WMH maps with thecontinuous normalized FLAIR voxel intensity, such anapproach does not enable direct measurement of voxelsdeemed to be WMH. Successful resolution of this limitationhas the advantage of furthering our understanding of thepathophysiology of WMH and the cognitive consequences.
CONCLUSIONSThe application of imaging techniques to the study of
biological processes has progressed rapidly since the adventof MRI in the early 1980s. Magnetic resonance imaging ishighly sensitive to brain morphological changes and lesionsaffecting the cerebral white matter such as WMH. Inassessing the WMH load, quantitative image analyses havecertain advantages over qualitative methods such as visualrating scales. We have reviewed recent contributions toWMH analysis using these quantitative techniques. Thehallmarks of these techniques are the semiautomated or fullyautomated methods of WMH detection and the use of acommon template enabling the detection of WMH distribu-tion patterns in an aging population.
The etiology and cognitive consequences of these verycommon WMH lesions remain unclear. However, we believethat newer image analysis methods can be used to reveal theextent, spatial location, and possibly, differential etiology ofWMH among various groups of interest. Current work is alsoongoing to evaluate new statistical approaches to betterdescribe WMH distributions within individuals. Importantfuture work includes conducting longitudinal studies ofmagnetization transfer ratio, DTI, and quantitative WMHanalysis to validate imaging surrogate markers of normal andpathological changes and to monitor these changes inresponse to current and future treatments.
REFERENCES1. Longstreth WT, Manolio TA, Arnold A, et al. Clinical correlates
of white matter findings on cranial magnetic resonance imaging of 3301elderly people: the Cardiovascular Health Study. Stroke.1996;27:1274Y1282.
2. Naka H, Nomura E, Takahashi T, et al. Combinations of the presenceor absence of cerebral microbleeds and advanced white matterhyperintensity as predictors of subsequent stroke types. AJNR Am JNeuroradiol. 2006;27:830Y835.
3. Gerdes VE, Kwa VI, ten Cate H, et al. Cerebral white matter lesionspredict both ischemic strokes and myocardial infarctions in patientswith established atherosclerotic disease. Atherosclerosis.2006;186:166Y172.
4. Bernick C, Kuller L, Dulberg C, et al. Silent MRI infarcts and the risk offuture stroke: the Cardiovascular Health Study. Neurology.2001;57:1222Y1229.
5. Gunning-Dixon FM, Raz N. The cognitive correlates of white matterabnormalities in normal aging: a quantitative review. Neuropsychology.2000;14:224Y232.
6. DeCarli C, Miller BL, Swan GE, et al. Cerebrovascular and brainmorphologic correlates of mild cognitive impairment in the NationalHeart, Lung, and Blood Institute Twin Study. Arch Neurol.2001;58:643Y647.
7. Lopez OL, Jagust WJ, Dulberg C, et al. Risk factors for mild cognitiveimpairment in the cardiovascular health study cognition study: part 2.Arch Neurol. 2003;60:1394Y1399.
8. Nordahl CW, Ranganath C, Yonelinas AP, et al. Different mechanismsof episodic memory failure in mild cognitive impairment.Neuropsychologia. 2005;43:1688Y1697.
9. Wolf H, Ecke GM, Bettin S, et al. Do white matter changes contribute tothe subsequent development of dementia in patients with mild cognitiveimpairment? A longitudinal study. Int J Geriatr Psychiatry.2000;15:803Y812.
10. DeCarli C, Mungas D, Harvey D, et al. Memory impairment, but notcerebrovascular disease, predicts progression of MCI to dementia.Neurology. 2004;63:220Y227.
11. Vermeer SE, Prins ND, den Heijer T, et al. Silent brain infarcts and the
Top Magn Reson Imaging & Volume 16, Number 6, December 2005 Cerebral White Matter Hyperintensities on MRI
* 2005 Lippincott Williams & Wilkins 405
Copyr ight © Lippincott Williams & Wilkins. Unauthorized reproduction of this article is prohibited.
risk of dementia and cognitive decline. N Engl J Med. 2003;348:1215Y1222.
12. Prins ND, van Dijk EJ, den Heijer T, et al. Cerebral white matter lesionsand the risk of dementia. Arch Neurol. 2004;61:1531Y1534.
13. Scheltens P, Barkhof F, Valk J, et al. White matter lesions on magneticresonance imaging in clinically diagnosed Alzheimer’s disease:evidence for heterogeneity. Brain. 1992;115:735Y748.
14. Esiri MM, Nagy Z, Smith MZ, et al. Cerebrovascular disease andthreshold for dementia in the early stages of Alzheimer’s disease. Lancet.1999;354:919Y920.
15. Snowdon DA, Greiner LH, Mortimer JA, et al. Brain infarctionand the clinical expression of Alzheimer disease. JAMA. 1997;277:813Y817.
16. DeCarli C. The role of cerebrovascular disease in dementia. Neurologist.2003:123Y136.
17. Erkinjuntti T, Gao F, Lee DH, et al. Lack of difference in brainhyperintensities between patients with early Alzheimer’s disease andcontrol subjects. Arch Neurol. 1994;51:260Y268.
18. Leys D, Soetaert G, Petit H, et al. Periventricular and white mattermagnetic resonance imaging hyperintensities do not differ betweenAlzheimer’s disease and normal aging. Arch Neurol. 1990;47:524Y527.
19. Skoog I, Berg S, Johansson B, et al. The influence of white matter lesionson neuropsychological functioning in demented and nondemented85-year-olds. Acta Neurol Scand. 1996;93:142Y148.
20. Hirono N, Kitagaki H, Kazui H, et al. Impact of white matter changes onclinical manifestation of Alzheimer’s disease: a quantitative study.Stroke. 2000;31:2182Y2188.
21. Wahlund LO, Barkhof F, Fazekas F, et al. A new rating scale for agerelated white matter changes applicable to MRI and CT. Stroke.2001;32:1318Y1322.
22. Scheltens P, Erkinjunti T, Leys D, et al. White matter changes on CT andMRI: an overview of visual rating scales. European task force onage-related white matter changes. Eur Radiol. 1998;39:80Y89.
23. Kapeller P, Barber R, Vermeulen JR, et al, for the European Task Forceof Age Related White Matter Changes. Visual rating of age-relatingwhite matter changes on magnetic resonance imaging. Stroke.2003;34:441Y445.
24. Pantoni L, Simoni M, Pracucci G, et al, for the European Task onAge-Related White Matter Changes. Visual rating scales for age-relatedwhite matter changes (leukoaraiosis). Can the heterogeneity be reduced?Stroke. 2002;33:2827Y2833.
25. Mantyla R, Erkinjuntti T, Salonene O, et al. Variable agreement betweenvisual rating scales for white matter hyperintensities on MRI.Comparison of 13 rating scales in a poststroke cohort. Stroke.1997;28:1614Y1623.
26. Liao D, Cooper L, Cai J, et al. Presence and severity of cerebral whitematter lesions and hypertension, its treatment, and its control. TheARIC Study, Atherosclerosis Risk in Communities Study. Stroke.1996;27:2262Y2270.
27. Scheltens P, Barkhof F, Leys D, et al. Histopathologic correlates of whitematter changes on MRI in Alzheimer’s disease and normal aging.Neurology. 1995;45:883Y888.
28. Scheltens P, Barkhof FF, Leys DA. A semiquantitative rating scale forthe assessment of signal hyperintensities on magnetic resonanceimaging. J Neurol Sci. 1993;114:7Y12.
29. Fazekas F, Kleinrt R, Offenbacher H, et al. Pathologic correlates ofincidental MRI white matter signal hyperintensities. Neurology.1993;43:1683Y1689.
30. Prins ND, van Straaten EC, van Dijk EJ, et al. Measuring progression ofcerebral white matter lesions on MRI: visual rating and volumetrics.Neurology. 2004;62:1533Y1539.
31. van Straasen ECW, Fazekas F, Rostrup E, et al. Impact of white matterhyperintensities scoring method on correlation with clinical data. TheLADIS study. Stroke. 2006;37:836Y840.
32. Grimaud J, Lai M, Thorpe J, et al. Quantification of MRI lesion load inmultiple sclerosis: a comparison of three computer-assisted techniques.Magn Reson Imaging. 1996;14:495Y505.
33. Guttmann CRG, Kikinis R, Anderson MC, et al. Quantitative follow-upof patients with multiple sclerosis using MRI: reproducibility. J MagnReson Imaging. 1999;9:509Y528.
34. Alfano B, Brunetti A, Larobina M, et al. Automated segmentation and
measurement of global white matter lesion volume in patients withmultiple sclerosis. J Magn Reson Imaging. 2000;12:799Y807.
35. Itti L, Chang L, Ernst T. Segmentation of progressive multifocalleukoencephalopathy lesions in fluid-attenuated inversion recoverymagnetic resonance imaging. J Neuroimaging. 2001;11:412Y417.
36. Zijdenbos AP, Forghani R, Evans AC. Automatic pipeline analysis of3D MRI data for clinical trials: application to multiple sclerosis.IEEE Trans Med Imaging. 2002;21:1280Y1291.
37. Anbeek P, Vincken KL, van Osch MJP, et al. Probability segmentationof white mater lesions in MRI imaging. Neuroimage. 2004;21:1037Y1044.
38. Wen W, Sachdev P. The topography of white matter hyperintensities onbrain MRI in healthy 60-to 64-year-old individuals. Neuroimage.2004;22:144Y154.
39. Admiraal-Bhehloul F, van den Heuvel DMJ, Olofsen H, et al. Fullyautomatic segmentation of white matter hyperintensities in MR imagesof the elderly. Neuroimage. 2005;28:607Y617.
40. DeCarli C, Murphy DG, Tranh M, et al. The effect of white matterhyperintensities volume on brain structure, cognitive performance, andcerebral metabolism of glucose in 51 healthy adults. Neurology.1995;45:2077Y2084.
41. Garrett KD, Cohen RA, Paul RH, et al. Computer-mediatedmeasurement and subjective ratings of white matter hyperintensities invascular dementia: relationships to neuropsychological performance.Clin Neuropsychol. 2004;18:50Y62.
42. van den Heuvel DM, ten Dam VH, de Craen AJ, et al. Measuringlongitudinal white matter changes: comparison of a visual rating scalewith a volumetric measurement. AJNR Am J Neuroradiol.2006;27:875Y878.
43. Benson RR, Guttmann CRG, Wei X, et al. Older people with impairedmobility have specific loci of periventricular abnormality on MRI.Neurology. 2002;58:48Y55.
44. DeCarli C, Fletcher E, Ramey V, et al. Anatomical mapping of whitematter hyperintensities (WMH). Exploring the relationship betweenperiventricular WMH, WMH Deep, and total WMH burden. Stroke.2005;36:50Y55.
45. Yoshita M, Fletcher E, Martinez O, et al. Extent and distribution ofwhite matter hyperintensities in normal aging, mild cognitiveimpairment and dementia. Neurology. 2006;66(suppl 2):A106YA107.
46. DeCarli C, Massaro J, Harvey D, et al. Measures of brain morphologyand infarction in the Framingham Heart Study: establishing what isnormal. Neurobiol Aging. 2005;26:491Y510.
47. Friston KJ, Ashburner J, Poline JB, et al. Spatial registration andnormalisation of images. Hum Brain Mapp. 1995;2:165Y189.
48. Evans AC, Collins DL, Mills SR, et al. 3D Statistical neuroanatomicalmodels from 305 MRI volumes. Proc IEEE Nucl Sci Symp Med ImagingConf. 1994;3:1813Y1817.
49. Talairach J, Tournoux P. Co-planar Stereotactic Atlas of the HumanBrain. Stuttgart, Germany: Thieme; 1988.
50. Takagi T, Sugeno M. Fuzzy identification of systems and its applicationsto modeling and control. IEEE Trans Syst Man Cybern. 1985;15:116Y132.
51. Jack CR Jr, O’Brien PC, Rettman DW, et al. FLAIR histogramsegmentation for measurement of leukoaraiosis volume. J Magn ResonImaging. 2001;14:668Y676.
52. DeCarli C, Maisog J, Murphy DG. Method for quantification of brain,ventricular, and subarachnoid CSF volumes from MR images. J ComputAssist Tomogr. 1992;16:274Y284.
53. DeCarli C, Murphy DG, Teichberg D, et al. Local histogram correctionof MRI spatially dependent image pixel intensity nonuniformity.J Magn Reson Imaging. 1996;6:519Y528.
54. Murphy DG, DeCarli C, Schapiro MB, et al. Age-related differences involumes of subcortical nuclei, brain matter, and cerebrospinal fluid inhealthy men as measured with magnetic resonance imaging. ArchNeurol. 1992;49:839Y845.
55. Murphy DG, DeCarli CD, Daly E, et al. Volumetric magneticresonance imaging in men with dementia of the Alzheimer type:correlations with disease severity. Biol Psychiatry. 1993;34:612Y621.
56. DeCarli C, Murphy DG, Tranh M, et al. The effect of white matterhyperintensities volume on brain structure, cognitive performance, andcerebral metabolism of glucose in 51 healthy adults. Neurology.1995;45:2077Y2084.
Yoshita et al Top Magn Reson Imaging & Volume 16, Number 6, December 2005
406 * 2005 Lippincott Williams & Wilkins
Copyr ight © Lippincott Williams & Wilkins. Unauthorized reproduction of this article is prohibited.
57. Maes F, Collignon A, Vanermuelen D, et al. Multimodality imageregistration by maximization of mutual information. IEEE Trans MedImaging. 1997;16:187Y198.
58. Kochunov P, Lancaster J, Thompson P, et al. Regional spatialnormalization: toward an optimal target. J Comput Assist Tomogr.2001;25:805Y816.
59. Otte M. Elastic registration of fMRI data using bezier-splinetransformations. IEEE Trans Med Imaging. 2001;20:193Y206.
60. Filippi M. Linking structural, metabolic and functional changes inmultiple sclerosis. Eur J Neurol. 2001;8:291Y297.
61. Armstrong CL, Traipe E, Hunter JV, et al. Age-related, regional,hemispheric, and medial-lateral differences in myelin integrity in
vivo in the normal adult brain. AJNR Am J Neuroradiol. 2004;25:977Y984.
62. Pfefferbaum A, Adalsteinsson E, Spielman D, et al. In vivo brainconcentrations of N-acetyl compounds, creatine, and choline inAlzheimer disease. Arch Gen Psychiatry. 1999;56:185Y192.
63. Rovaris M, Iannucci G, Cercignani M, et al. Age-related changes inconventional, magnetization transfer, and diffusion-tensor MR imagingfindings: study with whole-brain tissue histogram analysis. Radiology.2003;227:731Y738.
64. Nusbaum AO, Tang CY, Buchsbaum MS, et al. Regional and globalchanges in cerebral diffusion with normal aging. AJNR Am JNeuroradiol. 2001;22:136Y142.
Top Magn Reson Imaging & Volume 16, Number 6, December 2005 Cerebral White Matter Hyperintensities on MRI
* 2005 Lippincott Williams & Wilkins 407
Copyr ight © Lippincott Williams & Wilkins. Unauthorized reproduction of this article is prohibited.