CULINARY WATER IMPACT FEE ANALYSIS (IFA)
17
CULINARY WATER IMPACT FEE ANALYSIS (IFA) WILLARD CITY, UTAH JULY 2021
Transcript of CULINARY WATER IMPACT FEE ANALYSIS (IFA)

CULINARY WATER IMPACT FEE ANALYSIS (IFA)
WILLARD CITY, UTAH
JULY 2021
P a g e 2
IFA: CULINARY WATER WILLARD CITY, UTAH JULY 2021
TABLE OF CONTENTS
IMPACT FEE CERTIFICATION .................................................................................................................... 3
DEFINITIONS ................................................................................................................................................ 4
SECTION 1: EXECUTIVE SUMMARY .......................................................................................................... 5
SECTION 2: GENERAL IMPACT FEE METHODOLOGY ............................................................................ 7
SECTION 3: OVERVIEW OF SERVICE AREA, DEMAND, AND LOS ......................................................... 8
SECTION 4: EXISTING FACILITIES INVENTORY ....................................................................................... 9
SECTION 5: CAPITAL FACILITY ANALYSIS ............................................................................................ 11
SECTION 6: CULINARY WATER IMPACT FEE CALCULATION .............................................................. 13
APPENDIX A: DETAIL OF PROPOSED CAPITAL IMPROVEMENTS ...................................................... 15 APPENDIX B: CULINARY WATER CAPITAL FACILITIES PLAN (NOVEMBER 2017) AND CAPITAL FACILITIES PLAN 2021 APPENDIX .......................................................................................................... 17

P a g e 3
IFA: CULINARY WATER WILLARD CITY, UTAH JULY 2021
IMPACT FEE CERTIFICATION
IFA CERTIFICATION Lewis Young Robertson & Burningham, Inc. certifies that the Impact Fee Analysis prepared for culinary water services:
1. includes only the costs of public facilities that are: a. allowed under the Impact Fees Act; and b. actually incurred; or c. projected to be incurred or encumbered within six years after the day on which each impact fee is paid;
2. does not include: a. costs of operation and maintenance of public facilities; b. costs for qualifying public facilities that will raise the level of service for the facilities, through impact fees, above
the level of service that is supported by existing residents; c. an expense for overhead, unless the expense is calculated pursuant to a methodology that is consistent with
generally accepted cost accounting practices and the methodological standards set forth by the federal Office of Management and Budget for federal grant reimbursement;
d. offsets costs with grants or other alternate sources of payment; and 3. complies in each and every relevant respect with the Impact Fees Act.
LEWIS YOUNG ROBERTSON & BURNINGHAM, INC.

P a g e 4
IFA: CULINARY WATER WILLARD CITY, UTAH JULY 2021
DEFINITIONS The following acronyms or abbreviations are used in this document: AF: Acre Foot ERC: Equivalent Residential Connection GAL: Gallons GPM: Gallons per Minute GPD: Gallons per Day IFA: Impact Fee Analysis IFFP: Impact Fee Facilities Plan LOS: Level of Service LYRB: Lewis Young Robertson and Burningham, Inc. MG: Million Gallons

P a g e 5
IFA: CULINARY WATER WILLARD CITY, UTAH JULY 2021
SECTION 1: EXECUTIVE SUMMARY
The purpose of this Impact Fee Analysis (IFA), is to fulfill the requirements established in Utah Code Title 11 Chapter 36a, the “Impact Fees Act,” and help Willard City (the “City”) fund necessary capital improvements for future growth. This document will address the future culinary water infrastructure needed to serve new development through the next ten years, as well as the appropriate impact fees the City may charge to new growth to maintain the level of service (LOS). The Willard City 2017 Culinary Water Capital Facilities Plan and the CFP 2021 Appendix (the “CFP”, See Appendix B), along with information from the City, provide much of the information for this analysis as the basis for calculating impact fees.
Impact Fee Service Area: The Service Area for the culinary water impact fees includes all areas within the City boundary and proposed annexation areas. This document identifies the necessary future system improvements for the Service Area that will maintain the proposed LOS into the future.
Demand Analysis: The demand unit utilized in this analysis is equivalent residential connections (ERCs). The primary impact on the system will be growth in ERCs. As development occurs within the City, it generates increased demand on the culinary water system. The system improvements identified in this study are designed to maintain the proposed LOS for any new ERCs that connect to the system.
Level of Service: The proposed LOS for source is based on peak day indoor and outdoor demand of 1.51 gallons per minute (gpm) per ERC. The proposed level of service for the storage component is 1,084 gallons of equalization storage. The distribution system LOS is based on maintaining 20 psi during conditions of fire flow, 30 psi during peak instantaneous demand, and 40 psi during peak day demand.1
Excess Capacity: Based on the proposed LOS, there are 439 gpm of source excess capacity. The excess capacity related to storage is 431,428 gallons. Excess capacity within distribution is based on proportionate ERCs within the 10-year planning horizon.
Outstanding Debt: The City currently has one piece of outstanding debt related to culinary water improvements. These bonds were issued in 2013.
Capital Facilities Analysis: Based on the projected growth of 1,013 ERCs, the excess capacity within the existing source and storage infrastructure will not be sufficient to maintain the proposed LOS. New development will need to cover the cost of the excess capacity they consume, as well as the proposed new source, storage and distribution facilities. A total of $5,722,274 is considered growth-related cost within the IFA planning horizon.
Funding of Future Facilities: This analysis assumes future growth-related facilities will be funded through a combination of utility revenues and impact fee revenues.
PROPOSED CULINARY WATER IMPACT FEE The culinary water impact fees proposed in this analysis will be assessed within the Service Area. Table 1.1 illustrates the appropriate fee associated with culinary water projects occurring within the next ten years. TABLE 1.1: IMPACT FEE PER ERC
COST % TO IFA COST TO IFA ERCS SERVED COST PER ERC
Buy-In
Source Buy-in $328,652 26% $86,102 1,013 $85
Storage Buy-in $798,196 78% $626,117 1,013 $618
Distribution Buy-in $3,267,976 - - 1,013 -
Future Facilities
Source $6,886,699 48% $3,326,736 1,013 $3,286
Storage $5,471,496 26% $1,442,985 1,013 $1,425
Distribution $2,412,955 39% $952,553 1,013 $941
Professional Expense $6,600 100% $6,600 1,013 $7
Total Fee Per ERC $6,361
1 Source: CFP p. 6-7

P a g e 6
IFA: CULINARY WATER WILLARD CITY, UTAH JULY 2021
NON-STANDARD CULINARY WATER IMPACT FEES The City reserves the right under the Impact Fees Act2 to assess an adjusted fee that more closely matches the true impact that the land use will have upon the culinary water system. This adjustment could result in a lower impact fee if evidence suggests a particular user will create a different impact than what is standard for its category. FORMULA FOR NON-STANDARD IMPACT FEES: Estimated ERC * Impact Fee per ERC ($6,361) = Impact Fee
2 11-36a-402(1)(c)

P a g e 7
IFA: CULINARY WATER WILLARD CITY, UTAH JULY 2021
SECTION 2: GENERAL IMPACT FEE METHODOLOGY The purpose of this study is to fulfill the requirements of the Impact Fees Act regarding the establishment of an IFA3 and identify the demands placed upon the City’s existing facilities by future development, evaluate how these demands will be met by the City, and the future improvements required to maintain the existing LOS. The purpose of the IFA is to proportionately allocate the cost of the new facilities and any excess capacity to new development, while ensuring that all methods of financing are considered. The following elements are important considerations when completing an IFA.
DEMAND ANALYSIS The demand analysis serves as the foundation for this analysis. This element focuses on a specific demand unit related to each public service – the existing demand on public facilities and the future demand as a result of new development that will impact system facilities.
LEVEL OF SERVICE ANALYSIS The demand placed upon existing public facilities by existing development is known as the existing LOS. Through the inventory of existing facilities, combined with the growth assumptions, this analysis identifies the LOS which is provided to a community’s existing residents and ensures that future facilities maintain these standards. Any excess capacity identified within existing facilities can be apportioned to new development. Any demand generated from new development that overburdens the existing system beyond the existing capacity justifies the construction of new facilities.
EXISTING FACILITY INVENTORY In order to quantify the demands placed upon existing public facilities by new development activity, the analysis provides an inventory of existing system facilities. The inventory of existing facilities is important to properly determine the excess capacity of existing facilities and the utilization of excess capacity by new development.
FUTURE CAPITAL FACILITIES ANALYSIS The demand analysis, existing facility inventory and LOS analysis allow for the development of a list of capital projects necessary to serve new growth and to maintain the existing system. This list includes any excess capacity of existing facilities, as well as future system improvements necessary to maintain the level of service. Any demand generated from new development that overburdens the existing system beyond the existing capacity justifies the construction of new facilities.
FINANCING STRATEGY This analysis must also include a consideration of all revenue sources, including impact fees, future debt costs, alternative funding sources and the dedication of system improvements, which may be used to finance system improvements.4 In conjunction with this revenue analysis, there must be a determination that impact fees are necessary to achieve an equitable allocation of the costs of the new facilities between the new and existing users.5
PROPORTIONATE SHARE ANALYSIS The written impact fee analysis is required under the Impact Fees Act and must identify the impacts placed on the facilities by development activity and how these impacts are reasonably related to the new development. The written impact fee analysis must include a proportionate share analysis, clearly detailing each cost component and the methodology used to calculate each impact fee. A local political subdivision or private entity may only impose impact fees on development activities when its plan for financing system improvements establishes that impact fees are necessary to achieve an equitable allocation of the costs borne in the past and to be borne in the future (UCA 11-36a-302).
3UC 11-36a-301,302,303,304 4 UC 11-36a-302(2) 5 UC 11-36a-302(3)
FIGURE 2.1: IMPACT FEE
METHODOLOGY
DEMAND ANALYSIS
LOS ANALYSIS
EXISTING FACILITIES
ANALYSIS
FUTURE FACILITIES
ANALYSIS
FINANCING STRATEGY
PROPORTIONATE
SHARE ANALYSIS
P a g e 8
IFA: CULINARY WATER WILLARD CITY, UTAH JULY 2021
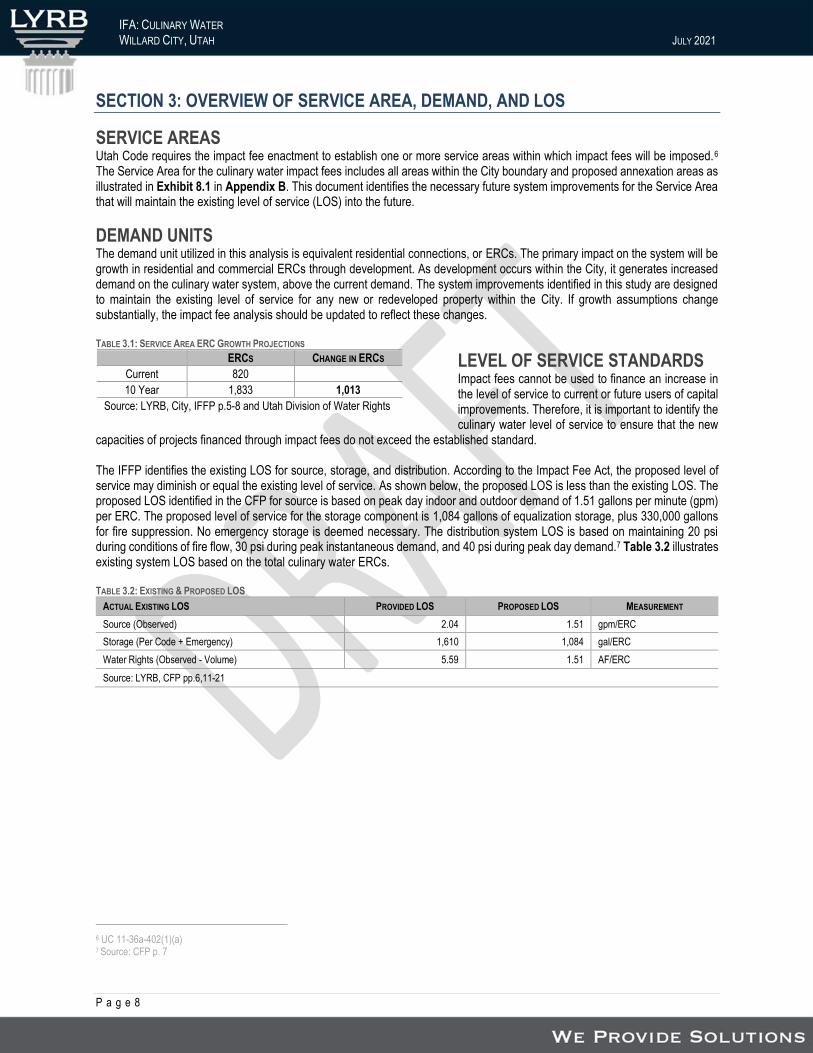
SECTION 3: OVERVIEW OF SERVICE AREA, DEMAND, AND LOS
SERVICE AREAS Utah Code requires the impact fee enactment to establish one or more service areas within which impact fees will be imposed.6 The Service Area for the culinary water impact fees includes all areas within the City boundary and proposed annexation areas as illustrated in Exhibit 8.1 in Appendix B. This document identifies the necessary future system improvements for the Service Area that will maintain the existing level of service (LOS) into the future.
DEMAND UNITS The demand unit utilized in this analysis is equivalent residential connections, or ERCs. The primary impact on the system will be growth in residential and commercial ERCs through development. As development occurs within the City, it generates increased demand on the culinary water system, above the current demand. The system improvements identified in this study are designed to maintain the existing level of service for any new or redeveloped property within the City. If growth assumptions change substantially, the impact fee analysis should be updated to reflect these changes. TABLE 3.1: SERVICE AREA ERC GROWTH PROJECTIONS
LEVEL OF SERVICE STANDARDS Impact fees cannot be used to finance an increase in the level of service to current or future users of capital improvements. Therefore, it is important to identify the culinary water level of service to ensure that the new
capacities of projects financed through impact fees do not exceed the established standard. The IFFP identifies the existing LOS for source, storage, and distribution. According to the Impact Fee Act, the proposed level of service may diminish or equal the existing level of service. As shown below, the proposed LOS is less than the existing LOS. The proposed LOS identified in the CFP for source is based on peak day indoor and outdoor demand of 1.51 gallons per minute (gpm) per ERC. The proposed level of service for the storage component is 1,084 gallons of equalization storage, plus 330,000 gallons for fire suppression. No emergency storage is deemed necessary. The distribution system LOS is based on maintaining 20 psi during conditions of fire flow, 30 psi during peak instantaneous demand, and 40 psi during peak day demand.7 Table 3.2 illustrates existing system LOS based on the total culinary water ERCs. TABLE 3.2: EXISTING & PROPOSED LOS
ACTUAL EXISTING LOS PROVIDED LOS PROPOSED LOS MEASUREMENT
Source (Observed) 2.04 1.51 gpm/ERC
Storage (Per Code + Emergency) 1,610 1,084 gal/ERC
Water Rights (Observed - Volume) 5.59 1.51 AF/ERC
Source: LYRB, CFP pp.6,11-21
6 UC 11-36a-402(1)(a) 7 Source: CFP p. 7
ERCS CHANGE IN ERCS
Current 820
10 Year 1,833 1,013
Source: LYRB, City, IFFP p.5-8 and Utah Division of Water Rights

P a g e 9
IFA: CULINARY WATER WILLARD CITY, UTAH JULY 2021
SECTION 4: EXISTING FACILITIES INVENTORY
EXISTING FACILITIES SOURCE The City has a total of 1,800 gpm of source capacity, as shown in TABLE 4.1.
STORAGE The City has a total of 1,650,000 gallons of storage capacity, as shown in TABLE 4.2.
DISTRIBUTION The City has a total of $3,208,632 in existing distribution infrastructure. This infrastructure serves existing development.
MANNER OF FINANCING EXISTING PUBLIC FACILITIES The City currently has one piece of outstanding debt related to culinary water improvements. These bonds were issued in 2013 and have a remaining $340,806 in debt service. The proceeds of the bonds were used for the purpose of refinancing the 1995 Bonds and the 1995B Bonds. The interest associated with these bonds is included in the determination of existing value and the appropriate buy-in figure. TABLE 4.3: ALLOCATION OF OUTSTANDING BOND INTEREST
PRINCIPAL COUPON INTEREST
2013 Bonds $261,000 Increasing $79,806
Allocation Strategy
PRINCIPAL ALLOCATION INTEREST
Water $261,000 100% $79,806
TABLE 4.4: ALLOCATION OF INTEREST COMPONENT
ORIGINAL COST INTEREST TOTAL NOTES
Source $322,684 $5,968 $328,652 See Table 4.5
Storage $783,702 $14,495 $798,196 See Table 4.6
Distribution $3,208,632 $59,343 $3,267,976 See Table 4.7
Total $4,315,018 $79,806 $4,394,824
EXCESS CAPACITY Based on the existing LOS, there is 497 gpm of source excess capacity available for new growth. The excess capacity related to storage is 473,376 gpd, or approximately 36 percent of the total system storage capacity. As stated previously, development is not expected to increase the amount of irrigated acreage in the City. Therefore, only indoor demands were considered in calculating the number of ERCs that will be served by the excess capacity. However, for the purposes of calculating existing used capacity, the indoor and outdoor LOS is applied to existing ERCs. The tables below illustrate the calculation of excess capacity and the proportional value included in the calculation of the impact fee. TABLE 4.5: ILLUSTRATION OF SOURCE EXCESS CAPACITY
GPM NOTES
Existing Source Capacity 1,674 IFFP p.12
Required for Existing Dev to Maintain LOS 1,177 820 Existing ERCs x LOS of 1.51 gpm/ERC
Excess Capacity 439
TABLE 4.1: EXISTING SOURCE FACILITIES
SOURCE ALLOWED
FLOW ACTUAL
FLOW
GPM GPM
1936 Well (Irrigation) 325 -
1995 Well (WS004) 1,140 850
2003 North Well (WS007) 1,773 700
Upper Spring (WS003) 1,346 250
TOTAL 4,584 1,800
Current ERCs 820 820
Provided LOS per ERC 5.59 2.20
Estimated Loss 7% 7%
Total Capacity After Loss 4,263 1,674
Provided LOS After Loss 5.20 2.04
Source: CFP Pg. 12 Table 4.1, Willard City
TABLE 4.2: EXISTING STORAGE FACILITIES
STORAGE
VOLUME
GAL
Upper Tank 500,000
Lower Tank #1 400,000
Lower Tank #2 200,000
New Reservoir 550,000
Total 1,650,000
Less Fire 330,000
Available 1,320,000
Current ERCs 820
Provided LOS per ERC 1,610
CFP Pg. 16 Table 5.1

P a g e 1 0
IFA: CULINARY WATER WILLARD CITY, UTAH JULY 2021
GPM NOTES
Required for New Dev to Maintain LOS 1,525 1,013 New ERCs x LOS of 1.51 gpm/ERC
% of Total 26.2% 439 gpm / 1,674 gpm
Value of Existing Source Improvements $328,652 Source: City Depreciation Statements
Includes associated interest
Value to New Growth $86,102 $328,652 x 26.2%
Additional Source Needed for IFA 1,087
Remaining ERCs to Serve 721
TABLE 4.6: ILLUSTRATION OF STORAGE EXCESS CAPACITY
GALLONS NOTES
Existing Storage Capacity 1,320,000 IFFP p.16
Required for Existing Dev to Maintain LOS 888,572 820 Existing ERCs x LOS of 1,084 gal/ERC
Excess Capacity 431,428
Required for New Dev to Maintain LOS 1,097,169 1,013 New ERCs x LOS of 1,084 gal/ERC
% of Total 78.4% 431,428 gal / 550,000-gal New Tank
Value of Existing Storage Improvements $798,196 Source: City, Based on most recent constructed reservoir #4
Value to New Growth $626,117 $798,196 x 78.4%
Additional Storage Needed for IFA 1,097,169
Remaining ERCs to Serve 614
As shown in Tables 4.4-4.6, there is capacity related to source and storage. However, based on the forecasted growth in ERCs, the City will need to construct additional distribution facilities to serve the demand within the next ten years. Section 5 addresses the proposed capital improvements and the proportion of impact fee eligible costs.

P a g e 1 1
IFA: CULINARY WATER WILLARD CITY, UTAH JULY 2021
SECTION 5: CAPITAL FACILITY ANALYSIS The estimated costs attributed to new growth were analyzed based on existing development versus future development patterns. From this analysis, a portion of future development costs were attributed to new growth and included in this impact fee analysis as shown in Table 5.1. Capital projects related to curing existing deficiencies were not included in the calculation of the impact fees. The costs of projects related to curing existing deficiencies cannot be funded through impact fees. Based on the projected growth of 1,013 ERCs, the excess capacity within existing infrastructure will not be sufficient to maintain the proposed LOS. Therefore, new facilities will be needed, as summarized below and detailed in Appendix A. TABLE 5.1: ILLUSTRATION OF CAPITAL IMPROVEMENTS SCHEDULED TO BE COMPLETED IN THE NEXT 10 YEARS
PROJECT DESCRIPTION 2017 2020 REPLACEMENT/
DEFICIENCY IMPACT FEE
ELIGIBLE DEVELOPER
COST % TO IFFP
COST TO IFFP
DEMAND
Source $1,230,000 $7,257,543 $387,918 $6,886,699 - 48% 3,326,736
Distribution $8,355,750 $10,657,017 $7,035,301 $2,412,955 $1,208,760 39% 952,553
Storage $2,866,250 $6,110,742 $639,245 $5,471,496 - 26% 1,442,985
SYSTEM VS. PROJECT IMPROVEMENTS System improvements are defined as existing and future public facilities designed to provide services to service areas within the community at large.8 Project improvements are improvements and facilities that are planned and designed to provide service for a specific development (resulting from a development activity) and considered necessary for the use and convenience of the occupants or users of that development.9 To the extent possible, this analysis only includes the costs of system improvements related to new growth within the proportionate share analysis.
FUNDING OF FUTURE FACILITIES The IFFP must also include a consideration of all revenue sources, including impact fees and the dedication of system improvements, which may be used to finance system improvements.10 In conjunction with this revenue analysis, there must be a determination that impact fees are necessary to achieve an equitable allocation of the costs of the new facilities between the new and existing users.11 In considering the funding of future facilities, the City has determined the portion of future projects that will be funded by impact fees as growth-related, system improvements. No other revenues from other government agencies, grants or developer contributions have been identified within the IFFP to help offset future capital costs. If these revenues become available in the future, the impact fee analysis should be revised. It is anticipated that future project improvements will be funded by the developer. These costs have not been included in the calculation of the impact fee. Other revenues such as utility rate revenues will be necessary to fund non-growth-related projects and to fund growth related projects when sufficient impact fee revenues are not available. In the latter case, impact fee revenues will be used to repay utility rate revenues for growth related projects. A brief description of alternative financing options is included below.
Utility Rate Revenues: Utility rate revenues serve as the primary funding mechanism within enterprise funds. Rates are established to ensure appropriate coverage of all operations and maintenance expenses, debt service coverage, and capital project needs. Impact fee revenues are generally considered non-operating revenues and help offset future capital costs.
Grants, Donations and Other Contributions: Grants and donations are not expected as a future funding source. The impact fees should be adjusted if grant monies are received. New development may be entitled to a reimbursement for any grants or donations received for growth related projects, or for developer funded IFFP projects.
Debt Financing: The City may need to utilize debt financing to fund the new storage facility or other infrastructure. The Impact Fees Act allows for the costs related to the financing of future capital projects to be included in the impact fee. This allows the City to finance and quickly construct infrastructure for new development and reimburse itself later from impact fee revenues for the costs of principal and interest. However, no future debt expense is included in this analysis.
8 11-36a-102(21) 9 11-36a-102(14) 10 11-36a-302(2) 11 11-36a-302(3)

P a g e 1 2
IFA: CULINARY WATER WILLARD CITY, UTAH JULY 2021
PROPOSED CREDITS OWED TO DEVELOPMENT The Impact Fees Act requires a local political subdivision or private entity to ensure that the impact fee enactment allows a developer, including a school district or a charter school, to receive a credit against or proportionate reimbursement of an impact fee if the developer: (a) dedicates land for a system improvement; (b) builds and dedicates some or all of a system improvement; or (c) dedicates a public facility that the local political subdivision or private entity and the developer agree will reduce the need for a system improvement.12 The facilities must be considered system improvements or be dedicated to the public, and offset the need for an improvement identified in the IFFP.
EQUITY OF IMPACT FEES Impact fees are intended to recover the costs of capital infrastructure that relate to future growth. The impact fee calculations are structured for impact fees to fund 100 percent of the growth-related facilities identified in the proportionate share analysis as presented in the impact fee analysis. Even so, there may be years that impact fee revenues cannot cover the annual growth-related expenses. In those years, other revenues such as general fund revenues will be used to make up any annual deficits. Any borrowed funds are to be repaid in their entirety through impact fees.
NECESSITY OF IMPACT FEES An entity may only impose impact fees on development activity if the entity’s plan for financing system improvements establishes that impact fees are necessary to achieve parity between existing and new development. This analysis has identified the improvements to public facilities and the funding mechanisms to complete the suggested improvements. Impact fees are identified as a necessary funding mechanism to help offset the costs of new capital improvements related to new growth. In addition, alternative funding mechanisms are identified to help offset the cost of future capital improvements.
12 11-36a-402(2)

P a g e 1 3
IFA: CULINARY WATER WILLARD CITY, UTAH JULY 2021
SECTION 6: CULINARY WATER IMPACT FEE CALCULATION Impact fees are calculated based on many variables centered on proportionality and LOS. The previous sections identified the future demand, the existing and proposed level of service, the availability of excess capacity and the needed future facilities to serve new development. The following section identifies the appropriate impact fee to be assessed to new development to maintain the existing LOS.
PROPOSED CULINARY WATER IMPACT FEE PLAN BASED IMPACT FEE CALCULATION Impact fees can be calculated based on a defined set of costs specified for future development, usually defined within the Master Plan, Capital Improvement Plan and IFFP. The total project costs are divided by the total demand units the projects are designed to serve. Under this methodology, it is important to identify the existing level of service and determine any excess capacity in existing facilities that could serve new growth. Impact fees are then calculated based on many variables centered on proportionality share and LOS.
The culinary water impact fees proposed in this analysis will be assessed within the Service Area. The table below illustrates the appropriate impact fee to maintain the existing LOS, based on the assumptions within this document. The fee below represents the maximum allowable impact fee assignable to new development. The total fee per ERC is $6,361. TABLE 6.1: IMPACT FEE PER ERC
COST % TO IFA COST TO IFA ERCS SERVED COST PER ERC
Buy-In
Source Buy-in $328,652 26% $86,102 1,013 $85
Storage Buy-in $798,196 78% $626,117 1,013 $618
Distribution Buy-in $3,267,976 - - 1,013 -
Future Facilities
Source $6,886,699 48% $3,326,736 1,013 $3,286
Storage $5,471,496 26% $1,442,985 1,013 $1,425
Distribution $2,412,955 39% $952,553 1,013 $941
Professional Expense $6,600 100% $6,600 1,013 $7
Total Fee Per ERC $6,361
NON-STANDARD IMPACT FEES The City reserves the right under the Impact Fees Act13 to assess an adjusted fee that more closely matches the true impact that the land use will have upon the culinary water system. This adjustment could result in a lower impact fee if evidence suggests a particular user will create a different impact than what is standard for its category. FORMULA FOR NON-STANDARD IMPACT FEES: Estimated ERC * Impact Fee per ERC ($6,361) = Impact Fee
CONSIDERATION OF ALL REVENUE SOURCES The Impact Fees Act requires the proportionate share analysis to demonstrate that impact fees paid by new development are the most equitable method of funding growth-related infrastructure. See Section 5 for further discussion regarding the consideration of revenue sources.
EXPENDITURE OF IMPACT FEES Legislation requires that impact fees should be spent or encumbered within six years after each impact fee is paid. Impact fees collected in the next five to six years should be spent only on those projects outlined in the IFFP as growth related costs to maintain the LOS.
GROWTH-DRIVEN EXTRAORDINARY COSTS The City does not anticipate any extraordinary costs necessary to provide services to future development.
13 11-36a-402(1)(c)

P a g e 1 4
IFA: CULINARY WATER WILLARD CITY, UTAH JULY 2021
SUMMARY OF TIME PRICE DIFFERENTIAL The Impact Fees Act allows for the inclusion of a time price differential to ensure that the future value of costs incurred at a later date are accurately calculated to include the costs of construction inflation. While an inflation component may be included in the impact fee analysis to reflect the future cost of facilities, at the request of the City it is not considered in the cost estimates in this study. However, the impact fee analysis should be updated regularly to account for changes in costs estimates over time.

P a g e 1 5
IFA: CULINARY WATER WILLARD CITY, UTAH JULY 2021
APPENDIX A: DETAIL OF PROPOSED CAPITAL IMPROVEMENTS
# PROJECT DESCRIPTION 2017 2020 TOTAL
ESTIMATED
COST
REPLACEMENT/ DEFICIENCY
IMPACT FEE
ELIGIBLE DEVELOPER
COST NEW
CAPACITY UNIT
ERCS
SERVED REMAINING
ERCS % TO IFFP
COST TO IFFP
DEMAND
Source
2 Replace pump at 1962/1995 well to increase pumping rate to 1,000 gpm
62,500 68,295 68,295 68,295 17,074 - 150 gpm
3 Rehabilitate existing spring to increase flow
93,750 102,443 102,443 102,443 - - 0
6 Install generators for back-up power at Control Building and Wells
198,750 217,179 217,179 217,179 - - 0
17 Develop additional water sources by drilling new well(s)
875,000 2,289,875 2,289,875 - 2,289,875 - 700
18 Drill and construct new well and well house to service South end of Willard City
2,289,875 2,289,875 2,289,875 - 700 gpm
19
Drill and construct new well and well house to service part of North End of Willard City
2,289,875 2,289,875 2,289,875 - 700 gpm
Total Source $1,230,000 $7,257,543 $7,257,543 $387,918 $6,886,699 - 2,250 1,493 721 48% $3,326,736
Distribution
4 Replace existing water line on 200 E from Center St to 200 South
236,375 258,293 258,293 258,293 - - 21% -
5 Replace old valve with new Pressure Reducing Valve in Control Building
12,500 13,659 13,659 13,659 - - 21% -
7 Upsize existing water line to 10” line 750 North from Main St to 600 West
724,300 791,462 791,462 672,743 118,719 - 21% 25,354
8 Upsize water line to 8” line on Main St. from 500 North to 850 North
452,500 494,459 494,459 445,013 49,446 - 21% 10,560
9 Install 8” line on 200 West from 550 North to 750 North
214,250 234,117 234,117 - - 234,117 21% -
10 Install new 8” water line from Hargis Hill to Main St.
80,000 87,418 87,418 87,418 - - 21% -
12 Upsize water line to 8” on Main St. from 550 South to South City Limit
585,200 639,464 639,464 617,683 21,781 - 21% 4,652

P a g e 1 6
IFA: CULINARY WATER WILLARD CITY, UTAH JULY 2021
# PROJECT DESCRIPTION 2017 2020 TOTAL
ESTIMATED
COST
REPLACEMENT/ DEFICIENCY
IMPACT FEE
ELIGIBLE DEVELOPER
COST NEW
CAPACITY UNIT
ERCS
SERVED REMAINING
ERCS % TO IFFP
COST TO IFFP
DEMAND
13 Upsize existing 6” lines to 8” lines throughout City as funds allow
4,427,500 4,838,049 4,838,049 4,838,049 - - 21% -
14 Emergency connections with neighboring water systems
93,750 102,443 102,443 102,443 - - 21% -
15 Install 12” line from Control Building to 300 East 300 North
198,125 216,497 216,497 - 216,497 - 21% 46,236
16 Install 12” line on 300 East from 300 North to 1650 North
1,331,250 1,454,693 1,454,693 - 480,049 974,644 21% 102,521
20
Install pressurized irrigation system within City to eliminate need for culinary water outdoor use
- - - - - - 21% -
21 New 12” PVC distribution waterline from South end water tank
1,135,838 1,135,838 - 1,135,838 - 50% 567,919
22 New 12” PVC distribution waterline from North end water tank
390,625 390,625 - 390,625 - 50% 195,313
Total Distribution $8,355,750 $10,657,017 $10,657,017 $7,035,301 $2,412,955 $1,208,760 - - 1,013 39% $952,553
Storage
1 Construct new 0.5 MG tank for lower pressure zone
615,000 672,027 672,027 - 672,027 - 500,000
11 Repair or replace Lower Tank #1
585,000 639,245 639,245 639,245 - -
18 Construct new 0.25 MG tank for upper pressure zone
380,000 415,236 415,236 - 415,236 - 250,000
19 Construct new 1.15 MG tank(s) for lower pressure zone
1,286,250 1,405,520 1,405,520 - 1,405,520 - 1,150,000
20 Construct new 600,000 Gallon culinary water tank on South end of Willard City
1,214,625 1,214,625 - 1,214,625 - 600,000
21 Construct new 1.25 Million Gallon culinary water tank on North end of Willard City
1,764,088 1,764,088 - 1,764,088 - 1,250,000
Total Storage $2,866,250 $6,110,742 $6,110,742 $639,245 $5,471,496 - $3,750,000 2,330 614 26% $1,442,985

P a g e 1 7
IFA: CULINARY WATER WILLARD CITY, UTAH JULY 2021
APPENDIX B: CULINARY WATER CAPITAL FACILITIES PLAN (NOVEMBER 2017) AND CAPITAL FACILITIES PLAN 2021 APPENDIX