CTC Deliverable 22 - final - 20171017 - sfbos.org · 1 Executive Summary ... 7.3 Financial Analysis...
201
Transcript of CTC Deliverable 22 - final - 20171017 - sfbos.org · 1 Executive Summary ... 7.3 Financial Analysis...


CTC Technology & Energy | IMG Rebel | Fiber for San Francisco | October 2017
ii
Contents1 Executive Summary ................................................................................................................. 1
1.1 Fiber‐to‐the‐Premises Design and Cost Estimate ............................................................ 2
1.2 Delivery Mechanism Analysis ........................................................................................... 5
1.3 Potential P3 Models: Dual P3s (Dark Fiber and Lit Services) or a Single Dark Fiber P3 ... 9
1.4 Procurement Strategy and Recommendations .............................................................. 15
2 FTTP Design and Cost Estimate ............................................................................................. 17
2.1 Summary of Cost Estimates ........................................................................................... 17
2.2 Approach to Technical Analysis ...................................................................................... 19
2.3 FTTP Network Design ..................................................................................................... 25
2.4 FTTP Cost Estimate ......................................................................................................... 35
3 The Purely Public Broadband Option Involves High Risk ...................................................... 44
3.1 Background ..................................................................................................................... 44
3.2 Benefits ........................................................................................................................... 46
3.3 Challenges ...................................................................................................................... 46
3.4 Financial Analysis............................................................................................................ 47
4 The Purely Private Option Will Not Meet the City’s Goals of Open, Ubiquitous Fiber to All
Homes and Businesses .................................................................................................................. 49
4.1 AT&T ............................................................................................................................... 50
4.2 Comcast .......................................................................................................................... 51
4.3 Etheric Networks ............................................................................................................ 52
4.4 Monkeybrains ................................................................................................................. 52
4.5 Wave ............................................................................................................................... 53
4.6 Webpass ......................................................................................................................... 55
4.7 Sonic ............................................................................................................................... 56
4.8 Factors That Can Impact Private Deployment Patterns ................................................. 58
4.9 Benefits and Challenges of the Private Investment Model ........................................... 59
4.10 Risk of Consolidation and Reduction in Competition ................................................. 60
5 P3 Structure Could Enable the City to Achieve the Goal of Open, Ubiquitous Fiber ........... 61
5.1 P3 Background ................................................................................................................ 61

CTC Technology & Energy | IMG Rebel | Fiber for San Francisco | October 2017
iii
5.2 The Core Structure of the Formal P3 ............................................................................. 62
5.3 Applying the Formal P3 Model to Broadband Creates Some Risks ............................... 63
6 P3 Model Analysis ................................................................................................................. 64
6.1 Framework Goals Used to Develop Potential Project Delivery Models ........................ 64
6.2 Classic P3 Model Illustrates Limitations of Broadband P3 Approaches ......................... 65
7 Alternative P3 Approach: Dual P3s for Dark and Lit Fiber .................................................... 68
7.1 Overview of the Dual P3 Model ..................................................................................... 68
7.2 How the Dual P3 Model Addresses the Project Principles ............................................ 72
7.3 Financial Analysis and Models of Dual P3 ...................................................................... 73
7.4 Structuring the Lit Fiber P3 to Achieve City Goals ......................................................... 88
8 Single Dark Fiber P3 Approach .............................................................................................. 93
8.1 Benefits ........................................................................................................................... 93
8.2 Challenges ...................................................................................................................... 94
8.3 Financial Analysis............................................................................................................ 95
9 Recommendations for Implementation and Procurement Strategy .................................. 101
9.1 A Pre‐Procurement Capacity Leasing Process Should Precede the P3 Procurement so as
to Improve P3 Bidding Outcomes by Accounting for Some New Revenue Opportunity ....... 103
9.2 The Procurement Timeline Should Be Developed in Light of the Complexities and
Newness of the Strategy ......................................................................................................... 105
9.3 The P3 Procurement Process Should Begin as Early as Possible in Order to Gain Inputs
from Bidders Prior to Putting Together the Proposed Funding Authorization ...................... 107
Appendix A: Glossary .................................................................................................................. 108
Appendix B: Value‐for‐Money Assessment and Value‐for‐Money Drivers ................................ 110
Appendix C: Risk Matrix .............................................................................................................. 116
Appendix D: Direct Economic Benefits of Fiber Construction in San Francisco ......................... 125
Appendix E: Technical Performance Metrics and Standards ...................................................... 127
Appendix F: List of Information to Be Available to Bidders ........................................................ 134
Appendix G: Potentially Usable City Facilities ............................................................................ 151
Appendix H: Digital Inclusion and Broadband Affordability ....................................................... 153

CTC Technology & Energy | IMG Rebel | Fiber for San Francisco | October 2017
iv
Appendix I: Potential Technical Framework for the Lit Fiber, Multi‐Provider, Open‐Access
Network ...................................................................................................................................... 172
Appendix J: Financial Analysis of Purely Public Model ............................................................... 180
FiguresFigure 1: Demarcation Between City and Partner Network Elements in Lit and Dark Models .... 19
Figure 2: Crowded Utility Pole Line in Bayview ............................................................................ 21
Figure 3: Utility Pole Requiring Make‐Ready in Excelsior ............................................................. 22
Figure 4:Tree Trimming Required on Richmond Pole Line ........................................................... 23
Figure 5: Clean Pole Line in Silver Terrace .................................................................................... 23
Figure 6: High‐Level FTTP Architecture ......................................................................................... 26
Figure 7: FTTP Service Areas ......................................................................................................... 29
Figure 8: Sample FTTP Access Layer Design .................................................................................. 30
Figure 9: Total Estimated Cost versus Take Rate (Low‐Cost Estimate) ........................................ 36
Figure 10: Wave Service in San Francisco ..................................................................................... 55
Figure 11: Sonic Service in San Francisco ..................................................................................... 58
Figure 12: Classic P3 Model .......................................................................................................... 65
Figure 13: Dual P3 Model .............................................................................................................. 68
Figure 14: Dual P3 Model .............................................................................................................. 74
Figure 15: FTTP Subscribers Can Access Civic Network Directly or via an RSP's Network ........... 92
Figure 16: P3 Value Drivers ......................................................................................................... 111
Figure 17: City Fiber Facilities ..................................................................................................... 151
Figure 18: Property Owned by City and County ......................................................................... 152
Figure 19: Percent of Households with Minimum 200 Kbps Service .......................................... 155
Figure 20: Percent of Households with Minimum 10 Mbps/1 Mbps Service ............................. 156
Figure 21: Yearly Household Income by Census Tract ................................................................ 157
Figure 22: Responsibilities in a Layered Service Model .............................................................. 173
Figure 23: Multiple Services Provided over the Same FTTP Network ........................................ 174
Figure 24: Service from RSP A Is Provisioned to the Customer ONT via an EVC ........................ 174
Figure 25: A Point‐to‐Point Topology ......................................................................................... 175
Figure 26: A Multipoint, or LAN, Topology ................................................................................. 175
Figure 27: A Tree Topology ......................................................................................................... 175
Figure 28: Layered Operational Responsibilities for the Open‐Access FTTP Network ............... 176
Figure 29: Trouble Report Workflow .......................................................................................... 177
Figure 30: Service Provisioning Workflow .................................................................................. 179
CTC Technology & Energy | IMG Rebel | Fiber for San Francisco | October 2017
v
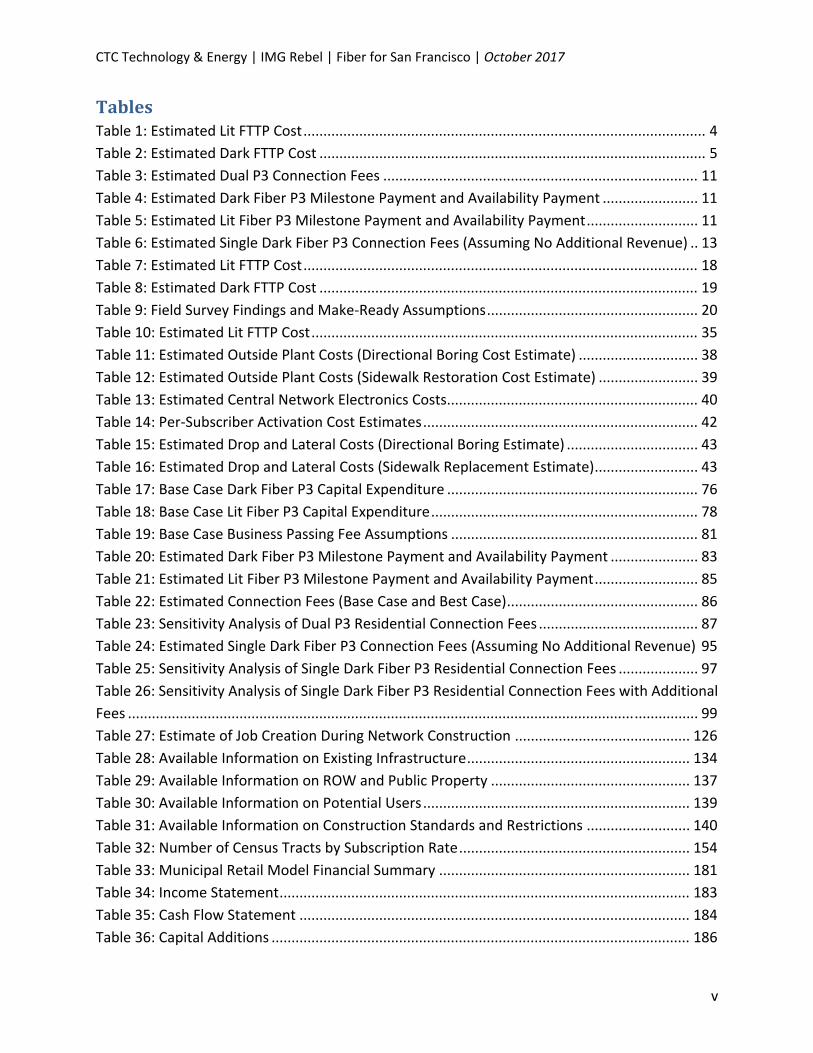
TablesTable 1: Estimated Lit FTTP Cost ..................................................................................................... 4
Table 2: Estimated Dark FTTP Cost ................................................................................................. 5
Table 3: Estimated Dual P3 Connection Fees ............................................................................... 11
Table 4: Estimated Dark Fiber P3 Milestone Payment and Availability Payment ........................ 11
Table 5: Estimated Lit Fiber P3 Milestone Payment and Availability Payment ............................ 11
Table 6: Estimated Single Dark Fiber P3 Connection Fees (Assuming No Additional Revenue) .. 13
Table 7: Estimated Lit FTTP Cost ................................................................................................... 18
Table 8: Estimated Dark FTTP Cost ............................................................................................... 19
Table 9: Field Survey Findings and Make‐Ready Assumptions ..................................................... 20
Table 10: Estimated Lit FTTP Cost ................................................................................................. 35
Table 11: Estimated Outside Plant Costs (Directional Boring Cost Estimate) .............................. 38
Table 12: Estimated Outside Plant Costs (Sidewalk Restoration Cost Estimate) ......................... 39
Table 13: Estimated Central Network Electronics Costs............................................................... 40
Table 14: Per‐Subscriber Activation Cost Estimates ..................................................................... 42
Table 15: Estimated Drop and Lateral Costs (Directional Boring Estimate) ................................. 43
Table 16: Estimated Drop and Lateral Costs (Sidewalk Replacement Estimate) .......................... 43
Table 17: Base Case Dark Fiber P3 Capital Expenditure ............................................................... 76
Table 18: Base Case Lit Fiber P3 Capital Expenditure ................................................................... 78
Table 19: Base Case Business Passing Fee Assumptions .............................................................. 81
Table 20: Estimated Dark Fiber P3 Milestone Payment and Availability Payment ...................... 83
Table 21: Estimated Lit Fiber P3 Milestone Payment and Availability Payment .......................... 85
Table 22: Estimated Connection Fees (Base Case and Best Case) ................................................ 86
Table 23: Sensitivity Analysis of Dual P3 Residential Connection Fees ........................................ 87
Table 24: Estimated Single Dark Fiber P3 Connection Fees (Assuming No Additional Revenue) 95
Table 25: Sensitivity Analysis of Single Dark Fiber P3 Residential Connection Fees .................... 97
Table 26: Sensitivity Analysis of Single Dark Fiber P3 Residential Connection Fees with Additional
Fees ............................................................................................................................................... 99
Table 27: Estimate of Job Creation During Network Construction ............................................ 126
Table 28: Available Information on Existing Infrastructure ........................................................ 134
Table 29: Available Information on ROW and Public Property .................................................. 137
Table 30: Available Information on Potential Users ................................................................... 139
Table 31: Available Information on Construction Standards and Restrictions .......................... 140
Table 32: Number of Census Tracts by Subscription Rate .......................................................... 154
Table 33: Municipal Retail Model Financial Summary ............................................................... 181
Table 34: Income Statement ....................................................................................................... 183
Table 35: Cash Flow Statement .................................................................................................. 184
Table 36: Capital Additions ......................................................................................................... 186
CTC Technology & Energy | IMG Rebel | Fiber for San Francisco | October 2017
vi
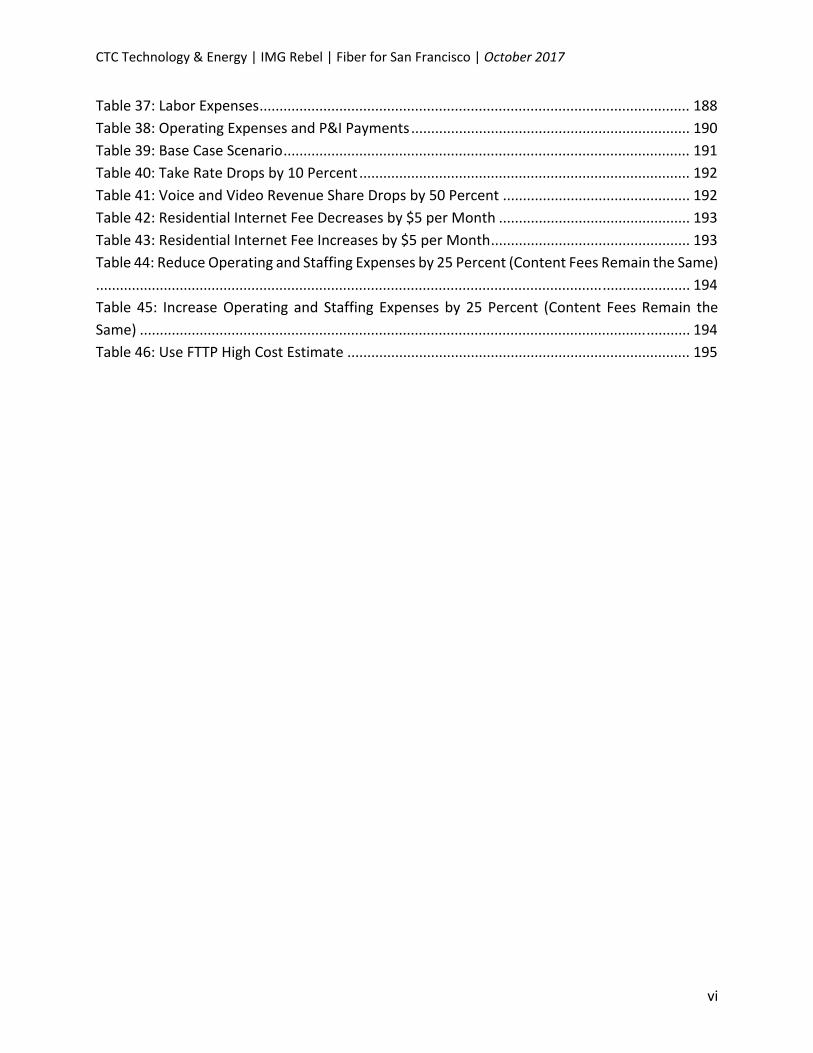
Table 37: Labor Expenses ............................................................................................................ 188
Table 38: Operating Expenses and P&I Payments ...................................................................... 190
Table 39: Base Case Scenario ...................................................................................................... 191
Table 40: Take Rate Drops by 10 Percent ................................................................................... 192
Table 41: Voice and Video Revenue Share Drops by 50 Percent ............................................... 192
Table 42: Residential Internet Fee Decreases by $5 per Month ................................................ 193
Table 43: Residential Internet Fee Increases by $5 per Month .................................................. 193
Table 44: Reduce Operating and Staffing Expenses by 25 Percent (Content Fees Remain the Same)
..................................................................................................................................................... 194
Table 45: Increase Operating and Staffing Expenses by 25 Percent (Content Fees Remain the
Same) .......................................................................................................................................... 194
Table 46: Use FTTP High Cost Estimate ...................................................................................... 195

CTC Technology & Energy | IMG Rebel | Fiber for San Francisco | October 2017
1
1 ExecutiveSummaryBroadband networks rank among the most important infrastructure assets of our time—for
purposes of economic development and competitiveness, innovation, workforce preparedness,
healthcare, education, democratic discourse, and environmental sustainability. The City and
County of San Francisco (City) recognizes the need for essential high‐speed, affordable
broadband services in the City and is considering how to facilitate development of such services,
including to those with no or limited access or ability to afford high‐quality services.
The City commissioned this report in early 2017 from a Project Team that includes CTC
Technology & Energy, a public sector broadband consultancy, 1 and IMG Rebel, a financial
advisory and P3 structuring firm.2
The City directed the Project Team to develop a delivery strategy for delivery of services over
ubiquitous fiber‐to‐the‐premises (FTTP, or fiber connectivity to every home and business in San
Francisco) that would be open, offering equal potential access to the network by multiple
entities so as to enable and stimulate competition. The City directed the Project Team to consider
the potential for (1) fully public, (2) fully private, or (3) public–private partnership (P3)
arrangements for financing, designing, constructing, maintaining, and operating the network. In
addition to the ubiquity and openness parameters for the fiber, the City articulated the following
key principles to guide the effort:
● Equity: Every resident and business in San Francisco should have access to fast and
affordable broadband connectivity necessary to participate and thrive in the 21st century.
With 13.2 percent of the City’s residents living below the poverty level, affordability of
broadband services is a significant factor in the City’s digital inclusion efforts. The City
intends to prioritize providing service to traditionally underserved households.
1 CTC Technology & Energy is a 30‐year‐old broadband consultancy focused on public sector and non‐profit efforts
to improve government and utility communications, expand broadband internet service, and develop new strategies for delivery of network capabilities, including broadband public–private partnerships and innovative collaborations. CTC offers strategy, engineering, business planning, project management, and grant planning services. CTC’s clients include the cities of San Francisco, Seattle, Portland (Ore.), Washington, D.C., Boston, Atlanta, San Antonio, Vancouver, B.C., and hundreds of other cities and counties of all sizes. CTC is the leading broadband consultancy working with the application of P3 concepts to broadband in such projects as KentuckyWired and the Westminster, Maryland, fiber P3. CTC also helped define the framework for broadband P3s in the Benton Foundation’s paper on “The Emerging World of Broadband Public–Private Partnerships” (https://www.benton.org/sites/default/files/partnerships.pdf). 2 IMG Rebel is among the world’s leading P3 advisors. IMG Rebel has advised on more than 50 P3 transactions
across sectors as lead transaction advisor, including many first‐of‐its‐kind deals. IMG Rebel has supported most of the leading U.S. federal, state, and local P3 practitioners, including the states of Florida, Texas, and Virginia and the Federal Highway Administration’s (FHWA) Office of Innovative Project Delivery as a financial and/or P3 advisor.

CTC Technology & Energy | IMG Rebel | Fiber for San Francisco | October 2017
2
● Jobs, Innovation, Growth: Investment in new connectivity will result in increased local
employment and provide numerous economic development advantages for the entire
City to continue to be the innovation capital of the world.
● Local Authority: A San Francisco owned fiber network will protect the City’s stated
values of equity, privacy, net neutrality, and open access.
To identify a sustainable approach to facilitating both the City’s technical solution (ubiquitous,
open access FTTP) and policy goals (with a focus on equity), the Project Team undertook the
following analyses:
1. Developed a technical design and cost estimate for deployment of a fiber network that
would connect every home and business in San Francisco
2. Considered three delivery models for execution of the ubiquitous, open FTTP goal: purely
public, purely private, and P3
3. Developed two innovative P3 delivery strategies and financial models for financing,
designing, constructing, maintaining, and operating a network that meet the City’s
required parameters:
a. A Dual P3 Model in which the City would develop two P3s, one for dark
fiber/outside plant only, and one to deliver lit services to every home and
business, while also providing wholesale services to competing service providers
b. A Single Dark Fiber P3 Model in which the City would develop one P3 for dark fiber,
and then lease dark fiber to competing service providers who would light and
operate the fiber
4. Developed a procurement strategy for the P3 that applies P3 best practices to the new
asset class of broadband while seeking to appropriately improve the broadband market
and leverage the potential demand (on the part of both consumers and internet service
providers) for new competition opportunities
1.1 Fiber‐to‐the‐PremisesDesignandCostEstimateCTC’s engineers prepared a network design and cost estimate for an open fiber optic
infrastructure to connect to all homes and businesses in San Francisco.3 The recommended
architecture is a hierarchical data network that provides critical scalability and flexibility, both in
initial network deployment and in capacity to accommodate the increased demands of future
applications and technologies. It includes the following characteristics:
3 This analysis is described in detail in Section 2 below.

CTC Technology & Energy | IMG Rebel | Fiber for San Francisco | October 2017
3
● Capacity – ability to provide efficient transport for subscriber data, even at peak levels
● Availability – high levels of redundancy, reliability, and resiliency; ability to quickly detect
faults and re‐route traffic
● Failsafe operation – physical path diversity to minimize operational impact resulting from
fiber or equipment failure
● Efficiency – no traffic bottlenecks; efficient use of resources
● Scalability – ability to grow in terms of physical service area and increased data capacity,
and to integrate newer technologies
● Manageability – simplified provisioning and management of subscribers and services
● Flexibility – ability to provide different levels and classes of service to different customer
environments; can support an open‐access network or a single‐provider network; can
provide separation between service providers on the physical layer (separate fibers) or
logical layer (separate VLAN or VPN providing networks within the network)
● Security – controlled physical access to all equipment and facilities, plus network access
control to devices
With input from City public works and engineering staff regarding both costs and City processes,
the Project Team then developed cost estimates, 4 assuming City cost structures, 5 for the
following:
4 The network design and cost estimates are based on data and insight gathered by CTC engineers in discussions
with City stakeholders and an extensive field and desk survey of candidate fiber routes. The design and cost estimation methodology are discussed in detail below. 5 All of CTC’s cost estimates for this report are based on our experience with municipal cost structures, rather than
those of the private sector. As a result, some of these estimates will vary from the likely costs that would be incurred by a P3 concessionaire. We chose this methodology for two reasons: First, while the private sector can realize some kinds of efficiencies that public entities cannot, this is unlikely to impact the most significant of the cost areas, labor. We presume based on City guidance that any P3 awardee will be required to pay salaries and benefits in compliance with City policy, which may be higher than private market rates. We note that the P3 concessionaire may be able to improve on our cost estimates through the benefits of scale, particularly in the areas of equipment purchases, customer service, and other operating costs, but given the City’s living wage commitments, significantly reduced costs for construction labor are unlikely. Second, given that this project represents a first‐of‐its‐kind evaluation, there does not exist in the broadband field a set of data regarding private costs and bidding levels for FTTP P3s. This is unlike P3 planning in other sectors, where multiple P3s have been executed and public sponsors are able to draw on data developed in earlier projects and bids. As a result, we deliberately chose the conservative methodology of estimating based on municipal cost structures. We anticipate that P3 bidders will be able to greatly improve on our conservative estimates in the areas of equipment
CTC Technology & Energy | IMG Rebel | Fiber for San Francisco | October 2017
4
● A “lit” FTTP network, including the costs to deploy FTTP outside plant infrastructure, as
well as all electronics, consumer drops, and customer premises equipment (CPE). This
estimate shows the total capital cost to build an FTTP network to support ubiquitous 1
Gbps (gigabit per second) data service
● A “dark” FTTP network, including the cost to deploy only the outside plant infrastructure.
This is the total capital cost for the City to build a dark FTTP network for use by one or
more entities
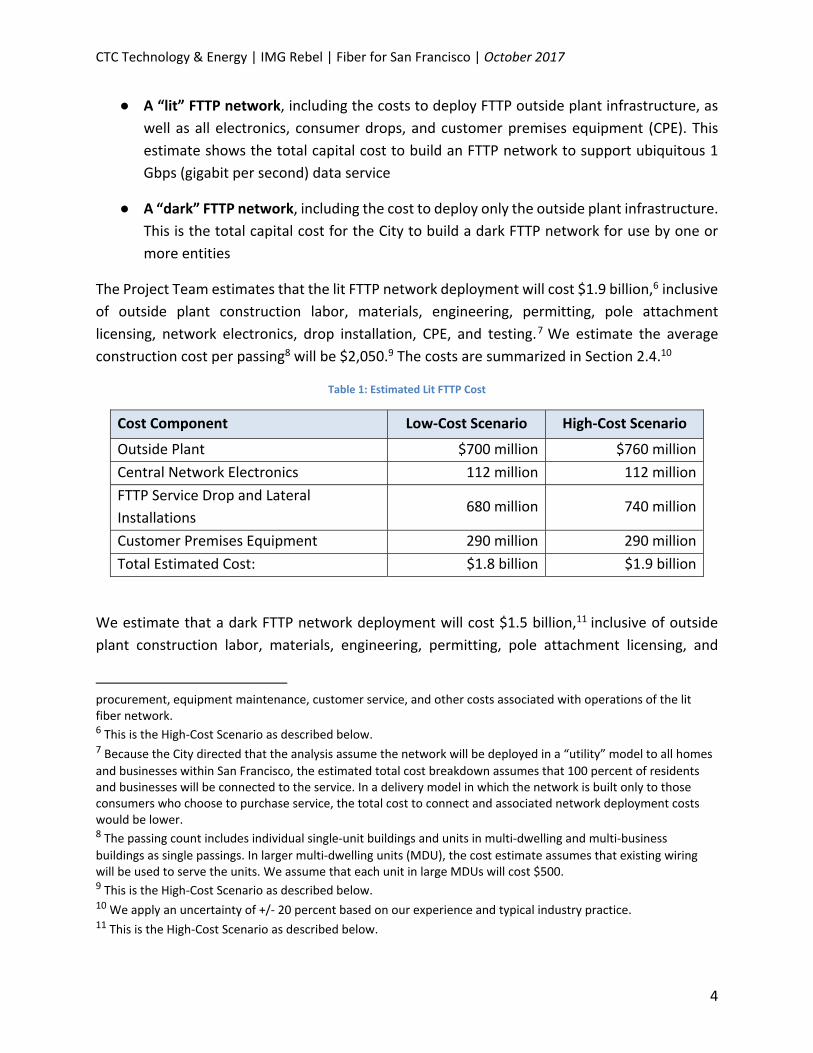
The Project Team estimates that the lit FTTP network deployment will cost $1.9 billion,6 inclusive
of outside plant construction labor, materials, engineering, permitting, pole attachment
licensing, network electronics, drop installation, CPE, and testing.7 We estimate the average
construction cost per passing8 will be $2,050.9 The costs are summarized in Section 2.4.10
Table 1: Estimated Lit FTTP Cost
Cost Component Low‐Cost Scenario High‐Cost Scenario
Outside Plant $700 million $760 million
Central Network Electronics 112 million 112 million
FTTP Service Drop and Lateral
Installations 680 million 740 million
Customer Premises Equipment 290 million 290 million
Total Estimated Cost: $1.8 billion $1.9 billion
We estimate that a dark FTTP network deployment will cost $1.5 billion,11 inclusive of outside
plant construction labor, materials, engineering, permitting, pole attachment licensing, and
procurement, equipment maintenance, customer service, and other costs associated with operations of the lit fiber network. 6 This is the High‐Cost Scenario as described below. 7 Because the City directed that the analysis assume the network will be deployed in a “utility” model to all homes
and businesses within San Francisco, the estimated total cost breakdown assumes that 100 percent of residents and businesses will be connected to the service. In a delivery model in which the network is built only to those consumers who choose to purchase service, the total cost to connect and associated network deployment costs would be lower. 8 The passing count includes individual single‐unit buildings and units in multi‐dwelling and multi‐business
buildings as single passings. In larger multi‐dwelling units (MDU), the cost estimate assumes that existing wiring will be used to serve the units. We assume that each unit in large MDUs will cost $500. 9 This is the High‐Cost Scenario as described below. 10 We apply an uncertainty of +/‐ 20 percent based on our experience and typical industry practice. 11 This is the High‐Cost Scenario as described below.

CTC Technology & Energy | IMG Rebel | Fiber for San Francisco | October 2017
5
lateral drop and materials. This estimate, which does not include any electronics or subscriber
equipment, is summarized in Section 2.1.2.12
Table 2: Estimated Dark FTTP Cost
Cost Component Low‐Cost Scenario High‐Cost Scenario
Outside Plant $700 million $760 million
FTTP Service Drop and Lateral Installations 680 million 740 million
Total Estimated Cost $1.4 billion $1.5 billion
The cost estimates are based on a combination of aerial and underground construction, and a
range of potential construction scenarios. The low‐cost scenario assumes directional boring
throughout the City using test pitting to minimize outages to existing utilities. The high‐cost
scenario requires high levels of surface restoration (i.e., complete sidewalk replacement).
The dark fiber estimate assumes that the City or its partner constructs and owns the FTTP
infrastructure up to a demarcation point (a network interface device, or NID) at each residence
and business, and that the dark fiber backbone, distribution, and drop fiber are then lit by a
separate entity. The lit fiber entity would be responsible for all network electronics and customer
premises equipment (CPE). The network architecture could support multiple entities using fiber
assets on a leased basis or other basis.
The outside plant construction landscape in the City has changed since CTC last estimated the
cost of fiber construction for San Francisco in 2009 (and even since the CostQuest study two years
ago). More providers have entered the market or expanded their service footprints, which means
more crowding on utility poles and higher pole make‐ready costs. Further, new surface
restoration standards will increase the cost of underground construction and the amount of time
needed to construct the network. Utility pole replacement costs will increase, too, because taller
poles will be needed in many locations to support the new fiber attachment. And existing poles
continue to age—increasing the number of replacements needed.
1.2 DeliveryMechanismAnalysisThe Project Team went through a structuring exercise to develop a recommended approach. The
focus was to identify a delivery model that would:
● Meet the goals specified for this initiative (open, ubiquitous fiber optics to every home
and business, with opportunity for competition over the network)
● Create a broadband market that provides long‐term best value for taxpayers, users, and
the City
12 We apply an uncertainty of +/‐ 20 percent based on our experience and typical industry practice.

CTC Technology & Energy | IMG Rebel | Fiber for San Francisco | October 2017
6
● Create a feasible business case for the project
● Create a marketable structure that can be financed
The Project Team considered three delivery models: purely public, purely private, and public–
private partnership (P3).
1.2.1 FullyPrivateorPublicDeliveryModelsDoNotSatisfytheCity’sGoalsThe Project Team first evaluated the two polar options that have existed as broadband delivery
models in the past: either fully‐private or fully‐public networks.13
Private broadband investment is resulting in new broadband competition in unevenly
distributed ways across San Francisco. AT&T is upgrading its network to fiber in certain areas, but
not, to our knowledge, on a ubiquitous basis. Comcast has recently upgraded its residential
service footprint with DOCSIS 3.1 electronics that will allow speeds of up to a gigabit in the
downstream direction, but this network still relies on coaxial cable for distribution and the gigabit
service is priced in excess of $150 per month.14
On the competitive side of the industry, a new class of competitors including Sonic, Webpass,
and Monkeybrains is making important investments in fiber and other technologies in some San
Francisco neighborhoods, but these new networks are available only in certain areas and to
certain buildings or consumers.
Both incumbents and competitors deploy new or upgraded infrastructure on a limited basis,
focused on geographic areas where costs are lowest and revenues and return on investment are
likely to be highest. As a result, most network investments are generally uneven across the City,
with some San Francisco residents offered far better options than others, and many unable to
afford the higher‐capacity options. In addition, none of the incumbent or competitive providers
in San Francisco operates its network on an open basis, allowing its competitors to reach
consumers over its infrastructure.
We therefore conclude that the private sector is not currently poised to deliver the City’s stated
goals of ubiquitous, open, fiber‐based service throughout San Francisco.
A purely public network could meet goals for ubiquity and openness, but the City has raised a
number of areas of concern, including internal capacity to build and operate a new utility; public
13 The public and private delivery models are summarized and discussed in more detail in Sections 3 and 4 below. 14 Comcast representatives told CTC and City staff in a September 2017 meeting that the residential gigabit
product (with 35 Mbps upstream) is offered at the “everyday price” of $160 per month, plus a modem purchase of $200 or $10 per month. Introductory, promotional pricing for the same product is $70 per month, plus the cost of equipment, based on a 24 month contract. Gigabit service will be available to businesses by the end of the year, but at higher pricing.

CTC Technology & Energy | IMG Rebel | Fiber for San Francisco | October 2017
7
finance challenges in light of the many important project vying for public financing, and the
substantial risks of proceeding on a purely public basis.
Indeed, in a purely public model, the City could meet its policy goals but would assume all project
risk, including construction, operations, performance, customer service, demand and market
considerations, and technology change. A parallel set of concerns relates to public sector capacity
and interest in building, maintaining, and operating a communications utility, including the
particular challenge of operating a communications network in an area of the country where
hiring professionals in that field is most competitive.
And the market risk assumed by the City in a purely public model is considerable. To put the
initiative into context of other city‐led efforts and the larger broadband market, we developed a
financial model for a traditional municipal network in which San Francisco would build, own, and
operate the network, and provide retail services to residents and businesses. 15 This model
suggests that the network would require a take rate of 45 percent (assuming the lower cost
estimate) to 53 percent (assuming the higher cost estimate) to break even, both of which
represent very aggressive goals.16 Few municipal networks have managed to reach this level of
penetration.
1.2.2 Application of P3 Delivery to Broadband Involves Novel Questions andOpportunity
P3 delivery represents a logical alternative opportunity for deployment, maintenance, and
operations of ubiquitous fiber. It enables the City to own the core infrastructure and use it to
achieve policy goals such as competition and equity—at the same time as shifting some risk to
the private sector and leveraging private sector delivery capabilities.17
In a formal P3 structure, a selected private partner takes responsibility for some combination of
design, construction, financing, operations, and maintenance, 18 at least partially funded or
guaranteed by the public partner over the period of the concession.
Formal P3s have emerged in the broadband sector in other parts of the world where
infrastructure is more frequently delivered through a P3 than in the United States. In the past
few years, a range of creative broadband P3 structures has started to evolve in the United States.
The nature of these P3s range from public sector facilitation of private broadband investment
15 The model is discussed in detail in Section 3 below. 16 Take‐rate is one of the traditional metrics for evaluating the performance of broadband networks, both public
and private. 17 The P3 delivery model is summarized and discussed in more detail in Sections 5‐8 below. 18 “Financial Structuring of Public–Private Partnerships (P3s),” U.S. Department of Transportation, 2013
http://goo.gl/gCJIZK (accessed February 2017).

CTC Technology & Energy | IMG Rebel | Fiber for San Francisco | October 2017
8
(through process, regulation, and economic development incentives) to public deployment of
infrastructure for use by the private sector.
What is novel about the Fiber for San Francisco Initiative is that it contemplates application of
the “classic” P3 structure to a broadband network that would reach 100 percent of the homes
and businesses in the community.
The application of P3 structures and principles to broadband is not straightforward. Formal P3s
developed as an effective tool for governments to shift appropriate risks to the private sector in
infrastructure areas that have traditionally been entirely the responsibility of government, such
as transportation, public transit, prisons, and water and sewer utilities.
In contrast, in the broadband environment, application of a P3 involves an opposite set of
relationships. In an area that traditionally, in the United States, has been primarily the province
of private companies, broadband P3s contemplate allocation of some risk and responsibility to
the public sector.
While government has long had a critical and insufficiently acknowledged role in shaping the
broadband market, that role has often been limited to regulation, deregulation, preferred access
to assets, and so on—as well as certain kinds of public subsidy for private networks such as
through the Federal Communications Commission’s High Cost and Connect America Funds. The
P3 structure contemplates assumption of the type of financial risk that traditionally has been the
domain of private investors—in a somewhat competitive marketplace with constantly shifting
services and consumer preferences.
1.2.3 TheClassicP3ModelAppliedtoBroadbandCreatesSomeChallengesTo understand how a formal P3 can be structured for FTTP, which has never before been done in
the United States, we first considered the “classic” model and then developed alternative models
that we believe will better suit this new class of projects.
In the Classic P3 Model, the City would negotiate a long‐term contract with a P3 broadband
concessionaire who would design, construct, finance, operate, and maintain the network. The
City would sponsor and own the infrastructure,19 but the concessionaire would control access to
it. The City would achieve some of its primary goals under this model. The City’s contract with
the concessionaire would also shield the City from some long‐term project risks. The
concessionaire would hold the long‐term performance risks associated with the project, as well
as some portion of the construction and market risk.
19 The term sponsor comes from the term “Project Sponsor” which is the entity with the overall accountability for
the project. In this case, the City of San Francisco is the sponsor of the project. The City has ultimate responsibility, and is accountable to the public/taxpayers.

CTC Technology & Energy | IMG Rebel | Fiber for San Francisco | October 2017
9
However, in terms of the principles that guide our financial and strategic analysis, the Classic P3
Model raises concerns. First, a single concessionaire with a long‐term concession (as in a toll road
scenario) would not deliver the open, competitive environment the City seeks. Second, uncertain
revenues increase risk to the project business case. Potential commercial revenues under this
model are highly uncertain, due both to the unpredictable nature of broadband equipment and
network technologies and the maturity of the San Francisco market. Transferring this revenue
risk to the concessionaire would require the City to pay a very high cost of financing. Third, risk
mitigation is required to attract investors and financiers. Due to the highly uncertain revenue
streams in this model, it is unlikely that financiers and investors will be willing to invest unless
they would have a quasi‐monopoly, including rate‐setting powers, and/or some type of
contribution from the City (e.g., a guarantee, risk‐sharing mechanism, or partial payment) to
mitigate risk.
1.3 PotentialP3Models:DualP3s (DarkFiberandLitServices)oraSingleDarkFiberP3
We then developed two alternative P3 approaches to meet the City’s goals, one that
contemplates P3 delivery of both dark fiber and lit services (a “Dual P3 Model”) and one that
contemplates a dark fiber model only (“Single Dark Fiber P3 Model”).20
1.3.1 PotentialDualP3Model:SeparatetheDarkFiberandLitServiceP3sThe recommended Dual P3 Model recognizes that the most critical challenge in the Classic P3
Model is the disparity between the risk profiles associated with the dark fiber investment and
the provisioning of lit services. Combining these two risk profiles within one P3 makes the Classic
P3 Model highly challenging from the perspective of developing a sustainable business model.
Our approach is to create as much market competition as possible at both the dark fiber and lit
services layers. In this approach, the City’s concessionaires would not enter the internet business,
but rather would enable robust private sector competition.
As such, the recommended Dual P3 Model comprises two separate P3 contracts:
1. Dark Fiber P3: Includes design, build, partial finance, and operations and maintenance
(O&M) of the outside plant infrastructure, including the fiber itself. This is a long‐term P3
contract (likely 30 years) for dark fiber investments that includes partial public financing.
2. Lit Fiber P3: Includes equipment and O&M investments, and provision of base‐level
service. This is a shorter‐term P3 contract (likely seven to 10 years, timed to match the
useful life of most of the network equipment).
20 This analysis is described in detail in Sections 7 and 8 below.

CTC Technology & Energy | IMG Rebel | Fiber for San Francisco | October 2017
10
The Dark and Lit Fiber P3 investments can be separated because interrelationships between the
two are limited. This approach results in a more explicit distinction between the dark fiber
network provider and the service provider on that network, with the intent to enable more
technological flexibility and competition in lit service delivery.
1.3.1.1 FinancialAnalysisandModelingofDualP3ModelThe Project Team developed a financial model for the Dual P3 structure to understand the
required Connection Fee per residence, required Connection Fee per business, and expected
payments to the P3 concessionaires based on cost estimates for full FTTP deployment. The
analysis also sought to understand how cost and revenue variations influence these fees.21
Table 3 shows that a $51 per month residential Connection Fee and a $73 per month average
business Connection Fee would cover all of the project costs (including the subsidy) and make
the project financially feasible under the base case assumptions. Because these results are
uncertain (which is typical for this stage of project development), the sensitivity analysis shows
the likely range of required payments based on differing assumptions for six main variables that
can affect the Connection Fees: capital costs, operations costs, contract term of the Lit Fiber P3,
level of subsidy, additional revenues, and financing conditions.
Uncertainties related to capital costs are the most significant, followed by the financing
uncertainties and alternative strategies regarding the subsidy for low‐income residents. As the
project progresses and additional analysis and information is added, these uncertainties will be
reduced.22 The sensitivity analyses found that the worst‐case scenario garnered a residential
Connection Fee of $67 per month, whereas the best‐case scenario residential Connection Fee is
$26 per month.
21 This analysis is based on preliminary information and assumptions as available for the project at this time, and are uncertain—which is common at this stage of project development. We expect that as more analysis is conducted on the project, and the project progresses, we will be able to refine our analysis based on more substantive information regarding expected upfront revenues, commitment of public resources, and so on. Additionally, due to the level of uncertainty, most results of the financial analysis are represented as ranges rather than exact outcomes, as appropriate. 22 Among the questions the Project Team considered was how to structure the Lit Fiber P3 and craft an RFP for a Lit Fiber Concessionaire that would serve the City’s defined principles and goals. Among other matters, the Lit Fiber approach contemplates delivery of a base level of broadband service to every San Francisco household and business; defining what that base level of service should be is the key challenge of structuring the Lit Fiber P3. In summary, the Project Team determined that provision of a lit fiber service by the City’s concessionaire would create significant challenges, either through reduction in the potential commercial market (if the Concessionaire offered a high‐speed product as part of the base‐level service) or through inefficiency (if the Concessionaire offered a low bandwidth
product that would waste the capacity of the network and entail significant cost relative to benefit). This analysis is described in detail in Section 7 below.
CTC Technology & Energy | IMG Rebel | Fiber for San Francisco | October 2017
11
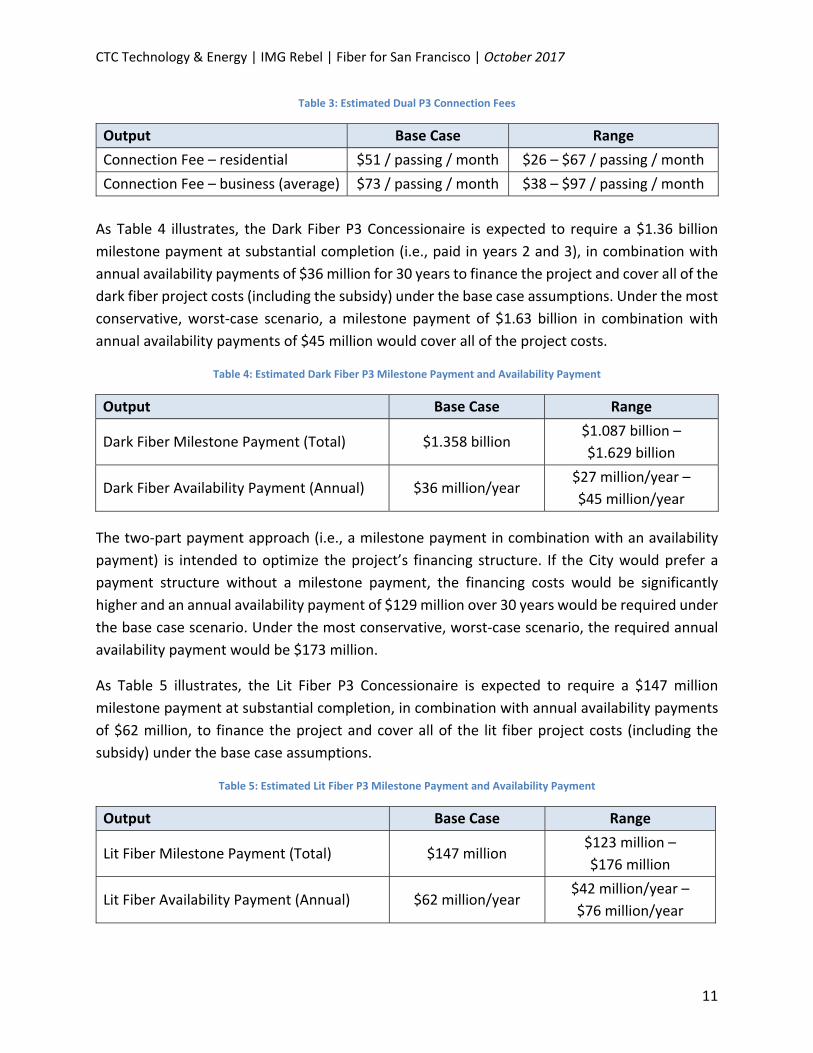
Table 3: Estimated Dual P3 Connection Fees
Output Base Case Range
Connection Fee – residential $51 / passing / month $26 – $67 / passing / month
Connection Fee – business (average) $73 / passing / month $38 – $97 / passing / month
As Table 4 illustrates, the Dark Fiber P3 Concessionaire is expected to require a $1.36 billion
milestone payment at substantial completion (i.e., paid in years 2 and 3), in combination with
annual availability payments of $36 million for 30 years to finance the project and cover all of the
dark fiber project costs (including the subsidy) under the base case assumptions. Under the most
conservative, worst‐case scenario, a milestone payment of $1.63 billion in combination with
annual availability payments of $45 million would cover all of the project costs.
Table 4: Estimated Dark Fiber P3 Milestone Payment and Availability Payment
Output Base Case Range
Dark Fiber Milestone Payment (Total) $1.358 billion $1.087 billion –
$1.629 billion
Dark Fiber Availability Payment (Annual) $36 million/year $27 million/year –
$45 million/year
The two‐part payment approach (i.e., a milestone payment in combination with an availability
payment) is intended to optimize the project’s financing structure. If the City would prefer a
payment structure without a milestone payment, the financing costs would be significantly
higher and an annual availability payment of $129 million over 30 years would be required under
the base case scenario. Under the most conservative, worst‐case scenario, the required annual
availability payment would be $173 million.
As Table 5 illustrates, the Lit Fiber P3 Concessionaire is expected to require a $147 million
milestone payment at substantial completion, in combination with annual availability payments
of $62 million, to finance the project and cover all of the lit fiber project costs (including the
subsidy) under the base case assumptions.
Table 5: Estimated Lit Fiber P3 Milestone Payment and Availability Payment
Output Base Case Range
Lit Fiber Milestone Payment (Total) $147 million $123 million –
$176 million
Lit Fiber Availability Payment (Annual) $62 million/year $42 million/year –
$76 million/year
CTC Technology & Energy | IMG Rebel | Fiber for San Francisco | October 2017
12
1.3.2 PotentialP3Model:SingleDarkFiberP3OnlyThe Project Team also developed a second potential business structure to meet the City’s goals
for this initiative in which the City would not build lit services into the P3 plan but would develop
a single dark fiber P3. The dark fiber structure would be designed to maximize competition
through leasing of dark fiber to competing ISPs rather than through City‐funded provision of
competition at the lit services layers.
1.3.2.1 BenefitsofSingleDarkFiberP3So long as a market emerges for dark fiber leases that would enable new competition, a Single
Dark Fiber P3 model offers greater simplicity, lower cost, and—potentially—lower risk and
reduced opposition from incumbent providers that oppose the City’s efforts to increase
broadband competition. With a Single Dark Fiber P3, the City would spend dramatically less
because it would not take on the financial commitment necessary for a Lit Fiber Concession.
Developing a Single Dark Fiber P3 also reduces complexity and administrative burden for the City.
Unlike lit services and equipment, dark fiber is a stable, predictable asset.
The model also removes from the City’s purview network operations. Rather than determining
parameters and terms for these areas of operation through the Lit Fiber PG, the City’s role would
be limited to the simpler dark fiber layer of the network.
The Single Dark Fiber P3 model also potentially reduces the challenges inherent in the City’s work
to promote competition and better broadband. Regardless of merits, City efforts to expand
broadband and broadband competition have been aggressively opposed by incumbent phone
and cable companies nationwide. In a dark fiber model, the City (and its Concessionaire) play no
role in providing services to the public, but rather provide a dark fiber platform to enable the
private sector to enter the service business. Frankly, incumbents are likely to oppose this
initiative regardless of how limited the City’s role is, but the customary incumbent claim of “unfair
competition” from the public sector is undercut by the model.
Further, by removing the City from direct roles in shaping services, pricing, or performance
standards, the Single Dark Fiber P3 preserves the full retail market for competing ISPs—rather
than using a P3 to deliver some level of services to the public.
1.3.2.2 ChallengesofSingleDarkFiberP3Though simple and efficient, the Single Dark Fiber P3 model reduces options with regard to
funding and to competition. Without a service delivered to every home and business, a property‐
related fee cannot be used for the Connection Fee to fund the project.
The competition considerations are also complex with respect to comparison between the Single
Dark Fiber P3 and the Dual P3 models. While the Single Dark Fiber P3 creates unprecedented
opportunity at the dark fiber layer, it also does not deliver competition as effectively as a Lit Fiber
CTC Technology & Energy | IMG Rebel | Fiber for San Francisco | October 2017
13
P3 potentially can. The market, depending on how the fiber is priced, may support only one or
two dark fiber lessees for the foreseeable future. In contrast, a lit network can provide very
inexpensive open access to many service providers, including very small operations with modest
resources, at low incremental cost. The unknowns regarding the dark fiber market also raise the
question of whether the model will ensure sufficient competition emerge to support the City’s
affordability and digital equity goals.
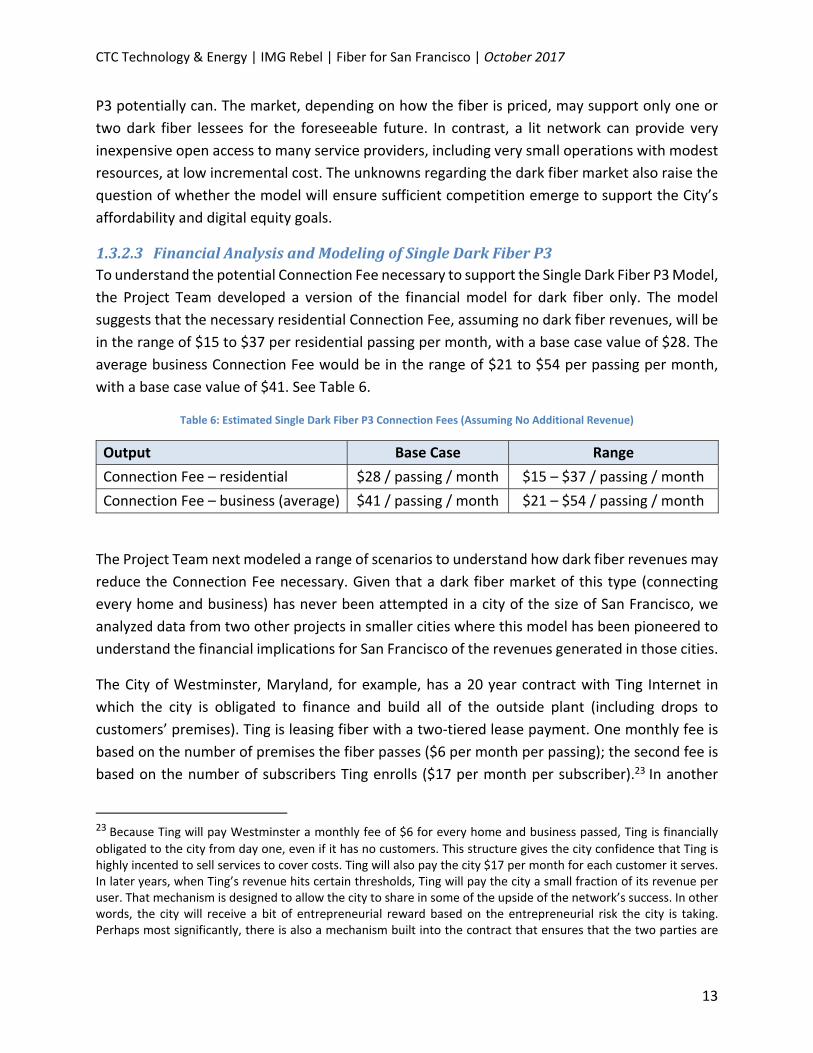
1.3.2.3 FinancialAnalysisandModelingofSingleDarkFiberP3To understand the potential Connection Fee necessary to support the Single Dark Fiber P3 Model,
the Project Team developed a version of the financial model for dark fiber only. The model
suggests that the necessary residential Connection Fee, assuming no dark fiber revenues, will be
in the range of $15 to $37 per residential passing per month, with a base case value of $28. The
average business Connection Fee would be in the range of $21 to $54 per passing per month,
with a base case value of $41. See Table 6.
Table 6: Estimated Single Dark Fiber P3 Connection Fees (Assuming No Additional Revenue)
Output Base Case Range
Connection Fee – residential $28 / passing / month $15 – $37 / passing / month
Connection Fee – business (average) $41 / passing / month $21 – $54 / passing / month
The Project Team next modeled a range of scenarios to understand how dark fiber revenues may
reduce the Connection Fee necessary. Given that a dark fiber market of this type (connecting
every home and business) has never been attempted in a city of the size of San Francisco, we
analyzed data from two other projects in smaller cities where this model has been pioneered to
understand the financial implications for San Francisco of the revenues generated in those cities.
The City of Westminster, Maryland, for example, has a 20 year contract with Ting Internet in
which the city is obligated to finance and build all of the outside plant (including drops to
customers’ premises). Ting is leasing fiber with a two‐tiered lease payment. One monthly fee is
based on the number of premises the fiber passes ($6 per month per passing); the second fee is
based on the number of subscribers Ting enrolls ($17 per month per subscriber).23 In another
23 Because Ting will pay Westminster a monthly fee of $6 for every home and business passed, Ting is financially
obligated to the city from day one, even if it has no customers. This structure gives the city confidence that Ting is highly incented to sell services to cover costs. Ting will also pay the city $17 per month for each customer it serves. In later years, when Ting’s revenue hits certain thresholds, Ting will pay the city a small fraction of its revenue per user. That mechanism is designed to allow the city to share in some of the upside of the network’s success. In other words, the city will receive a bit of entrepreneurial reward based on the entrepreneurial risk the city is taking. Perhaps most significantly, there is also a mechanism built into the contract that ensures that the two parties are

CTC Technology & Energy | IMG Rebel | Fiber for San Francisco | October 2017
14
variation on this model, Huntsville, Alabama’s municipal electric utility is building a fiber network
and Google Fiber is leasing fiber throughout the city to serve residences and small businesses.24
Google Fiber’s lease is for 20 years based on a rate sheet that provides for various levels of pricing
based on amounts and volume. The pricing structure is complex but we estimate Google Fiber’s
monthly cost to be approximately $6 to $7 per month per passing.25
The financial model suggests that, applying the Westminster and Huntsville pricing to San
Francisco at a take rate of 50 percent for residential customers and 30 percent for business
customers would bring the expected Connection Fee down from $28 per month without dark
fiber revenues to $16 (Westminster pricing) to $22 (Huntsville pricing) per month. Our base case
for additional revenues assumes a monthly per passing fee of $6 and a monthly per subscriber
fee of $6 at a take rate of 50 percent for residential customers and 30 percent for business
customers, resulting in a residential Connection Fee in the Single Dark Fiber P3 model of $20 per
month.
1.3.3 UpfrontSecuringRevenuesThe key uncertainty in the financial analysis of this initiative is the revenue potential. Whereas
the analysis of passing fee and customer fee structures provide a rough indication, the revenue
potential of the initiative is inherently uncertain. This is why a pre‐lease of access to the network
in advance of the procurement and construction is important. Such an approach would not only
reduce the Connection Fee that is required to make the initiative financially feasible, but would
also create more robust cash flow and thereby enhance the ability to finance the initiative. Similar
pre‐lease or pre‐sale agreements are common in other sectors, such as real estate and power.
The Project Team prepared a simple sensitivity analysis that shows that an annual revenue
stream of $25 million would reduce the required Connection Fee from $51 to $44 per month
under the Dual P3 Model and from $28 to $22 per month under the Single Dark Fiber P3 Model.
(Note that this is an illustration only; the $25 million figure is not based on research and is highly
uncertain.) These results emphasize the significance of the upfront securitization of revenues.
truly sharing risk around the financing of the outside plant infrastructure. In any quarter in which Ting’s financial obligations to the city are insufficient to meet the city’s debt service, Ting will pay the city 50 percent of the shortfall. In subsequent quarters, if Ting’s fees to the city exceed the debt service requirements, Ting will be reimbursed an equivalent amount. This element of the financial relationship made the deal much more attractive to the city because it is a clear demonstration of the fact that its private partner is invested with it. 24 Huntsville is not financing or building the drops to the home; it’s obligation to Google is to provide fiber that
passes the premises only. 25 In contrast, Ting’s obligations to Westminster are based in part on how much fiber it uses and in part on how
many customers it secures and revenues it generates. As a result, Westminster will have less predictability and certainty about its revenues from Ting, but has the potential to share in upside in the event that Ting is very successful in that market.

CTC Technology & Energy | IMG Rebel | Fiber for San Francisco | October 2017
15
1.3.4 Innovative,Lower‐CostFinancingStructureBoth P3 models assume that the Dark Fiber P3 will be financed in an innovative, efficient way to
reduce the total financing costs to the City. We anticipate that the City can largely convert its
dark fiber debt from P3 capital (which is customarily quite expensive relative to public finance)
to revenue bonds. The revenue bonds would be secured with the Connection Fee revenues,
which are likely to be a sufficiently robust stream of revenues to support a lower‐cost revenue
bond. We recommend that the revenue bond not entirely replace P3 capital, but rather that the
City include some P3 capital to ensure the concessionaire’s commitment and continuous
incentive to perform. In this way, the City may be able to significantly reduce its finance costs,
while still enjoying the benefits of P3 financing related to effective risk transfer and performance
incentives. Any long‐term dark fiber revenues that the City is able to secure in advance can
further support this financing structure.26
1.3.5 SubsidyofConnectionFeeforLowerIncomeSanFranciscansA P3 that involves assessment of a fee or tax to residences and businesses would impose some
burden on lower income San Franciscans. In consultation with City staff, CTC analyzed the
potential P3 structures with consideration of subsidizing the Connection Fee for some San
Francisco households. Under the base case assumptions a subsidy would be offered to 15 percent
of households.
1.4 ProcurementStrategyandRecommendationsBoth of the alternative broadband P3 delivery models discussed above require a procurement
strategy that is grounded in the traditional P3 process—but customized and expanded to account
for both the unique aspects of this effort and the P3 investment community’s lack of familiarity
with the broadband sector.27 And the unique nature of broadband as an asset class also requires
adding new features to the procurement process, including securing offtake agreements or pre‐
lease of access to the network in advance of the procurement. We recommend the following
elements for a P3 procurement process:
1. Industry sounding. A pre‐procurement industry sounding will clarify and market the project
and proposed P3 structure—generating market appetite and soliciting inputs to further refine
the structure. The industry sounding could include “industry day” interactions or one‐on‐one
interactions with interested parties.
2. Pre‐procurement sale of dark fiber leases. A pre‐procurement sale for dark fiber and other
network capacity in advance of the P3 RFP will quantify and secure revenues that would
otherwise be speculative; this will enable (1) bids with lower requirements for City
26 A recommendation to secure dark fiber revenues in advance of network construction is described in Section 9.1. 27 Detailed discussion of a procurement and fiber leasing strategy is in Section 9 below.
CTC Technology & Energy | IMG Rebel | Fiber for San Francisco | October 2017
16
funding/guarantees, and (2) a more competitive bidding process in which all bidders can
account for these revenue streams. This sale of capacity also has the potential to concretize
the opportunity, for investors, service providers, and the public.
3. Two P3 procurements, if the Dual P3 structure is adopted. Separate P3 procurements (one
for dark fiber and other outside plant infrastructure, another for equipment, operations, and
services) should be run partially in parallel to enable adjustments as necessary and efficiency.
4. Integration of RFP development and industry consultation/negotiations. Although the City
has been contemplating an RFP development process followed by negotiations with one or
more selected bidders, we recommend integrating these phases and building multi‐step
consultation with selected bidders into a more extensive process of RFP development and
vetting. This process—which should be more extensive than in other P3 sectors, given the
novelty of this effort—will enable the necessary level of interaction with potential bidders,
giving the City opportunity to refine these complex procurements, while enabling the bidders
to further understand and craft bids for this new, unfamiliar asset class.
Within this framework, we also recommend that the procurement process should:
● Begin as early as possible in order to gather industry feedback. A key risk for this project is
that there will be a mismatch between the level of funding pre‐approved, and what bidders
will propose during the procurement process. In an ideal situation, bidders would be selected
in advance of final funding approvals, enabling a firm understanding of the level of financial
commitment needed. Starting engagement with potential bidders through an industry
sounding, and initiating the RFQ and RFP process as early as possible in order to obtain some
level of interaction and information from bidders, will help provide as much information as is
feasible at that early stage of the process.
● Build in sufficient time and flexibility. A procurement timeline that accounts for the
pioneering and singular nature of this effort will build in sufficient time and flexibility to vet
all elements of the bid requirements. In the event the City elects to pursue the dual P3
structure, an extended timeline will likely also be required.
● Apply P3 procurement best practices. Even though this procurement will be the first‐of‐its‐
kind, several P3 procurement best practices can be applied. These include shortlisting three
or four qualified bidders in the RFQ phase, and communicating with bidders prior to bid
submission in the draft RFP phase.

CTC Technology & Energy | IMG Rebel | Fiber for San Francisco | October 2017
17
2 FTTPDesignandCostEstimateCTC’s engineers prepared a network design and cost estimates for deploying a gigabit FTTP
network to all homes and businesses in the City. We developed cost estimates for two FTTP
deployment approaches to provide data relevant to assessing the financial viability of network
deployment, and to developing a business model for the Fiber for San Francisco Initiative:
● A “lit” FTTP network, including the costs to deploy FTTP outside plant infrastructure, as
well as all electronics, consumer drops, and customer premises equipment (CPE); this
estimate shows the total capital costs (by the City or the City and partners) to build an
FTTP network to support a ubiquitous 1 Gbps (gigabit per second) data service
● A “dark” FTTP network, including the cost to deploy just the FTTP outside plant; this is
the total capital cost for the City to build a dark FTTP network for use by one or more
entities, including private internet service providers
The network design and cost estimates are based on data and insight gathered by CTC engineers
in discussions with City stakeholders and an extensive field and desk survey of candidate fiber
routes.
2.1 SummaryofCostEstimatesThe cost estimates are based on a combination of aerial and underground construction, and a
range of potential construction scenarios. The low‐cost scenario assumes directional boring
throughout the City using test pitting to minimize outages to existing utilities. The high‐cost
scenario requires high levels of surface restoration (i.e., complete sidewalk replacement).
2.1.1 LitFTTPCostEstimateWe estimate the lit FTTP network deployment will cost $1.9 billion,28 inclusive of outside plant
construction labor, materials, engineering, permitting, pole attachment licensing, network
electronics, drop installation, CPE, and testing.29 We estimate the average construction cost per
passing30 is $2,050. These costs are summarized in Table 7.31
28 This is the High‐Cost Scenario as described below. 29 Because the City directed that the analysis assume the network will be deployed in a “utility” model, the
estimated total cost breakdown assumes that 100 percent of residents and businesses will subscribe to the service. In a delivery model in which residents decide whether or not to subscribe to service, this market penetration rate or “take rate” would be less than 100 percent, and some network deployment costs would be less as a result. 30 The passing count includes individual single‐unit buildings and units in multi‐dwelling and multi‐business
buildings as single passings. In larger MDUs, the cost estimate assumes that existing wiring will be used to serve the units. We assume that each unit in large MDUs will cost $500. 31 This is the High‐Cost Scenario as described below.

CTC Technology & Energy | IMG Rebel | Fiber for San Francisco | October 2017
18
Table 7: Estimated Lit FTTP Cost32
Cost Component Low‐Cost Scenario High‐Cost Scenario
Outside Plant $700 million $760 million
Central Network Electronics 112 million 112 million
FTTP Service Drop and Lateral Installations
680 million 740 million
Customer Premises Equipment 290 million 290 million
Total Estimated Cost: $1.8 billion $1.9 billion
Actual costs may vary due to factors that cannot be precisely known until the detailed design is
completed, or until construction commences. These factors include: 1) costs of private
easements, 2) utility pole replacement and make‐ready costs, 3) variations in labor and material
costs, 4) surface restoration, and 5) the City’s operational and business model. We have
incorporated suitable assumptions to address these factors based on our experiences in similar
markets.
The outside plant construction landscape in the City has changed since we last estimated
construction costs for San Francisco FTTP in 2009. Since then more providers have entered the
market, which means more attachers on the utility poles and more conduit in the ground. New
providers mean space that was originally available for the City to install fiber is no longer there,
while costs for make‐ready and underground conduit installation have increased. Further, new
surface restoration standards will increase the cost of underground construction and the amount
of time needed to construct the network. Utility pole replacement costs will increase, too,
because taller poles will be needed in many locations to support the existing attachers and new
City fiber. And existing poles continue to age—increasing the number of replacements needed.
All of these changes increase the cost of outside plant construction.
2.1.2 DarkFTTPCostEstimateWe estimate that a dark FTTP network deployment will cost $1.5 billion,33 inclusive of outside
plant construction labor, materials, engineering, permitting, pole attachment licensing, and
lateral drop and materials. This estimate does not include any electronics or subscriber
equipment. Cost components are described in Table 8.
32 We apply an uncertainty of +/‐ 20 percent based on our experience and typical industry practices. 33 This is the High‐Cost Scenario as described below.

CTC Technology & Energy | IMG Rebel | Fiber for San Francisco | October 2017
19
Table 8: Estimated Dark FTTP Cost34
Cost Component Low‐Cost Scenario High‐Cost Scenario
Outside Plant $700 million $760 million
FTTP Service Drop and Lateral Installations
680 million 740 million
Total Estimated Cost: $1.4 billion $1.5 billion
The dark fiber estimate assumes that the City or its partner constructs and owns the FTTP
infrastructure up to a demarcation point (a network interface device) at each residence and
business, and that the dark fiber backbone, distribution, and drop fiber are then lit by a separate
entity. The lit fiber entity would be responsible for all network electronics and customer premises
equipment (CPE)—as well as network sales, marketing, and operations. The network architecture
could support multiple entities using fiber assets on a leased basis or other basis.
Figure 1: Demarcation Between City and Partner Network Elements in Lit and Dark Models
2.2 ApproachtoTechnicalAnalysisCTC engineers performed a range of analytical tasks to gather data and insight for the FTTP
design.
2.2.1 FieldSurveyA CTC outside plant engineer performed a preliminary survey of San Francisco onsite and via
Google Earth Street View to develop estimates of per‐mile cost for aerial fiber in the
communications space, and per‐mile costs for underground fiber (where poles are not available).
34 We apply an uncertainty of +/‐ 20 percent based on our experience and typical industry practices.

CTC Technology & Energy | IMG Rebel | Fiber for San Francisco | October 2017
20
The engineer reviewed available green space, necessary make‐ready on poles, and pole
replacement—all of which have been factored in to the design and cost estimate.35
Table 9 summarizes the conditions determined through our field and desk survey, with respect
to three population densities we used in the cost estimation model—high, medium, and low.
Make‐ready and aerial construction costs will be higher in the City than other cities but will still
be less expensive than underground construction.
Table 9: Field Survey Findings and Make‐Ready Assumptions
High Density Medium
Density Low Density
Aerial Construction 20% 50% 60%
Poles per Mile 50 50 50
Moves per Pole 4 4 3
Poles Requiring
Make‐Ready 60% 60% 60%
Poles Requiring
Replacement 10% 10% 10%
Cost Per Move $450 $450 $450
Cost Per Pole
Replacement $35,000 $35,000 $35,000
CTC’s outside plant engineer noted that the quality of the poles and pole attachments in San
Francisco varied, as they do in many cities—but overall, many poles would not support an
additional communications attachment without significant make‐ready. While the pole lines may
not be ideal for aerial construction, the cost of make‐ready is still less than the cost of
underground construction in the City. As such, we recommend aerial construction where pole
lines exist.
The following figures illustrate existing City utility conditions observed by CTC’s outside plant
engineer.
35 Green space is right‐of‐way typically covered in grass or sidewalk that would be less expensive to construct in
than the street. Make‐ready if the work needed to bring a utility pole into compliance and clear space for an additional attachment. Pole replacement is the replacement of a utility pole typically with one that is taller and/or a higher class that will support additional attachments.

CTC Technology & Energy | IMG Rebel | Fiber for San Francisco | October 2017
21
Figure 2 shows a typical utility pole line along a major roadway in Bayview. The poles are
crowded, which will necessitate significant make‐ready.
Figure 2: Crowded Utility Pole Line in Bayview

CTC Technology & Energy | IMG Rebel | Fiber for San Francisco | October 2017
22
Figure 3 shows another crowded pole line in Excelsior.
Figure 3: Utility Pole Requiring Make‐Ready in Excelsior

CTC Technology & Energy | IMG Rebel | Fiber for San Francisco | October 2017
23
Figure 4 shows a pole line in Richmond that will require extensive tree trimming.
Figure 4:Tree Trimming Required on Richmond Pole Line
Figure 5 shows a clean pole line with relatively little required make‐ready in Silver Terrace.
Figure 5: Clean Pole Line in Silver Terrace

CTC Technology & Energy | IMG Rebel | Fiber for San Francisco | October 2017
24
2.2.2 SubsurfaceInvestigationsCTC engineers met with the City and various service providers to discuss their experiences with
underground construction. The City’s density and age make it extremely difficult and expensive
to construct underground facilities, especially in older neighborhoods.
2.2.2.1 DirectionalBoringDirectional boring involves the digging of small test pits, generally at locations where pull boxes
will be installed, and drilling hundreds of feet between these pits. The boring equipment then
pulls the conduit back through the bore path as it is removed.
To minimize damaging underground utilities, the City is developing new regulations that will
require companies that use directional boring to take extra precautions prior to construction.
The new requirements include reviewing City‐provided utility maps, performing pre‐inspection
of the existing utilities, and test‐pitting the crossings of all known and assumed utilities.36 These
impending requirements are in response to a recent undergrounding project in which City utilities
were hit by a company that had used directional boring as the construction method.
Even with the new regulations, however, there is still risk involved with this type of construction.
The City has identified cases where undocumented sewer service lines have been damaged
because they enter homes and businesses at shallower depths than the City’s current standard.
2.2.2.2 MicrotrenchingThe City is contemplating a microtrenching policy. Microtrenching cuts a narrow trench (i.e., one
to two inches wide) into roadway or sidewalk pavement. The contractor then installs narrow
conduits, into which specialized fiber is blown. Because microtrenching minimizes the amount of
surface restoration required, it can be a cost‐effective alternative to traditional underground
construction. This approach is widely used in New York City, Boston, and Vancouver, British
Columbia, especially by wireless service providers.
However, because microtrenching requires a trench 12 to 18 inches37 deep into the sidewalk, a
contractor could still hit existing service lines to homes and businesses. Also, under the City’s
proposed rules, microtrenching is only allowed in the sidewalk, and requires total replacement
of any sidewalk slabs that are cut. These requirements will increase the cost of microtrenching
construction, compared to the more common practice of only requiring the cut to be filled, or
compared to microtrenching along the curb.
36 Our low cost estimate assumes that directional boring is used to reduce costs, with test pitting performed every
25 feet on average. 37 The depth of the microtrenching is based on the saw blade. Deeper depths such as 18 inches are more
expensive than shallower depths.

CTC Technology & Energy | IMG Rebel | Fiber for San Francisco | October 2017
25
In addition, in San Francisco, there have been instances of sidewalk replacement causing cuts to
existing telecommunications providers’ service drops. This has occurred in places where the
drops were installed at extremely shallow depths because other utilities were located deeper,
below the telecommunications drops. We anticipate that a microtrenching approach that follows
the City’s new rules would result in construction costs between our low and high estimates.
2.2.2.3 StreetRestorationAny block of a street in San Francisco that is trenched more than 25 feet (longitudinally) requires
the repaving of the entire trenched lane of that block. This requirement, while protecting the
roadways, will also increase the cost of underground construction. It is partly because of this
requirement that many of the City’s underground areas will require construction on both sides
of the road, instead of the more common technique of building fiber on one side of the right‐of‐
way, then boring under the street to reach the residences and businesses on the other side.
2.2.2.4 SidewalkRestorationIf the City or a dark fiber partner were to build the FTTP network in adherence to the City’s current
sidewalk restoration standards, which require replacement of each disturbed concrete slab, the
project would result in the full rebuild of most of the City’s sidewalks in underground construction
areas. This large‐scale rebuild should be considered one of the main outcomes of the project, if
not the primary one. The sheer amount of underground construction required to build the
network, combined with the sidewalk restoration requirements, would result in an amount of
sidewalk replacement equivalent to that of a large‐scale capital improvement project.
The City could view the sidewalk replacement costs as a separate capital improvement project
implemented concurrently with the fiber build. At an estimated cost of $150 per concrete slab,
sidewalk restoration would account for approximately $100 million of the estimated outside
plant and drop costs. Additional capital improvement money could be used at the same time to
further improve the streetscape by adding ramps at corners, repairing street curbs, installing tree
boxes, replacing street signs, and so on.
2.3 FTTPNetworkDesignThe architecture of the physical plant determines the network’s scalability for future uses and
how the plant will be operated and maintained; the architecture is also the main determinant of
the total cost of the deployment, because outside plant is both the most expensive part of the
network and the longest lasting. Figure 6 (below) shows a logical representation of the high‐level
FTTP network architecture we recommend in San Francisco. This design is open to a variety of
architecture options. The drawing illustrates the primary functional components in the FTTP
network, their relative position to one another, and the flexibility of the architecture to support
multiple subscriber models and classes of service.
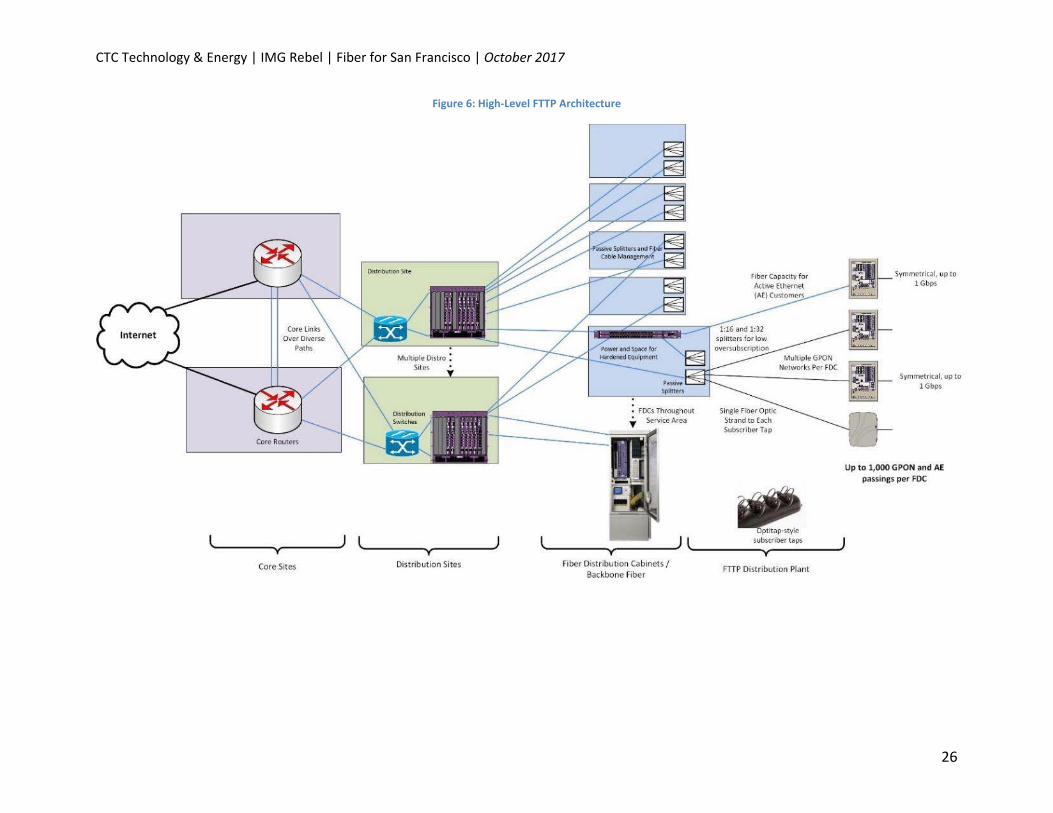
CTC Technology & Energy | IMG Rebel | Fiber for San Francisco | October 2017
26
Figure 6: High‐Level FTTP Architecture

CTC Technology & Energy | IMG Rebel | Fiber for San Francisco | October 2017
27
The recommended architecture is a hierarchical data network that provides critical scalability and
flexibility, both in terms of initial network deployment and its ability to accommodate the
increased demands of future applications and technologies. The characteristics of this
hierarchical FTTP data network are:
● Capacity – ability to provide efficient transport for subscriber data, even at peak levels
● Availability – high levels of redundancy, reliability, and resiliency; ability to quickly detect
faults and re‐route traffic
● Failsafe operation – physical path diversity to minimize operational impact resulting from
fiber or equipment failure
● Efficiency – no traffic bottlenecks; efficient use of resources
● Scalability – ability to grow in terms of physical service area and increased data capacity,
and to integrate newer technologies
● Manageability – simplified provisioning and management of subscribers and services
● Flexibility – ability to provide different levels and classes of service to different customer
environments; can support an open‐access network or a single‐provider network; can
provide separation between service providers on the physical layer (separate fibers) or
logical layer (separate VLAN or VPN providing networks within the network)
● Security – controlled physical access to all equipment and facilities, plus network access
control to devices
This architecture offers the scalability necessary to meet long‐term needs. It is consistent with
best practices for an open‐access network model that might potentially be required to support
multiple network operators, or at least multiple Retail Service Providers requiring dedicated
connections to certain customers. This design would support a combination of Gigabit Passive
Optical Network (GPON) and direct Active Ethernet services (with the addition of electronics at
the fiber distribution cabinets), which would enable the network to scale by migrating to direct
connections to each customer, or reducing splitter ratios, on an as‐needed basis.
The design assumes placement of manufacturer‐terminated fiber tap enclosures within the right‐
of‐way or easements, providing watertight fiber connectors for customer service drop cables and
eliminating the need for service installers to perform splices in the field. This is an industry‐
standard approach to reducing both customer activation times and the potential for damage to
distribution cables and splices. The model also assumes the termination of standard lateral fiber
connections within larger multi‐tenant business locations and multi‐dwelling units (MDU).

CTC Technology & Energy | IMG Rebel | Fiber for San Francisco | October 2017
28
2.3.1 NetworkDesignThe network design and cost estimates assume the City or its dark fiber partner will:
● Identify and procure space at two core facilities to house network electronics and
provide backhaul to the internet
● Utilize existing City land to locate 10 distribution hub facilities with adequate
environmental and backup power systems to house network electronics
● Construct fiber optics to connect core sites to distribution hubs in a backbone ring
● Construct additional backbone fiber to connect the distribution hubs to fiber
distribution cabinets (FDC)
● Construct fiber optics from the FDCs to each residence and business (i.e., from
termination panels in the FDC to tap locations in the right‐of‐way or on City easements)
● Construct fiber laterals into large, multi‐tenant business facilities and MDUs
Leveraging the City’s conduit and fiber resources could decrease the costs associated with both
constructing a backbone and identifying locations to house electronics that are near the City’s
existing resources. Given the high cost of construction in many areas of the City, using existing
conduit may provide a noticeable impact on the cost of construction. However, for a project of
this magnitude, the cost savings are likely within the range of our projected contingency.
The FTTP network and service areas, depicted in Figure 7 (below), were defined based on the
following criteria:
● Design targets 512 passings per FDC
● Service areas were defined by passing density and existing utilities and are broken into
the categories of high, medium, and low densities
● Multiple FDCs serve each service area
● FDCs are suitable to support hardened network electronics, providing backup power
and an active heat exchange38
● Distribution plant avoids crossing major roadways, bridges, and railways
38 These hardened FDCs reflect an assumption that the City’s operational and business model will require the
installation of provider electronics in the FDCs that are capable of supporting open access among multiple providers. We note that the overall FTTP cost estimate would decrease if the hardened FDCs were replaced with passive fiber distribution cabinets (which would house only optical splitters) and the providers’ electronics were housed only at hub locations. Includes costs associated with the Surface Mounted Facilities Ordinance.

CTC Technology & Energy | IMG Rebel | Fiber for San Francisco | October 2017
29
Coupled with an appropriate network electronics configuration, this design serves to greatly
increase the reliability of fiber services provided to customers compared to that of more
traditional cable and telephone networks. The backbone design minimizes the average length of
non‐diverse distribution plant between the network electronics and each customer, thereby
reducing the probability of service outages caused by a fiber break.
Figure 7: FTTP Service Areas

CTC Technology & Energy | IMG Rebel | Fiber for San Francisco | October 2017
30
The access layer of the network, encompassing the fiber plant from the FDCs to the customers,
dedicates a single fiber strand from the FDC to each passing (potential customer address). This
traditional FTTP design allows either network electronics or optical splitters in the FDCs. See
Figure 8 below for a sample design.
Figure 8: Sample FTTP Access Layer Design

CTC Technology & Energy | IMG Rebel | Fiber for San Francisco | October 2017
31
2.3.2 NetworkCoreandHubSitesThe network core sites link the FTTP network to the public internet and deliver all services to end
users. The proposed network design includes two core locations, based on the network’s
projected capacity requirements and the need for geographical redundancy (i.e., if one core site
were to fail, the second core site would continue to operate the network).
The location of core network facilities also provides physical path diversity for subscribers and all
upstream service and content providers. For the design and cost estimates, we assume that the
City’s core sites will be housed in secure locations with diverse connectivity to the internet and
the City’s existing fiber optic network.
The core locations in this plan will house providers’ Operational Support Systems (OSS) such as
provisioning platforms, fault and performance management systems, remote access, and other
operational support systems for FTTP operations. The core locations are also where any business
partner or content / service providers will gain access to the subscriber network with their own
point‐of‐presence. This may be via remote connection, but collocation is recommended.
The core locations are typically run in a High Availability (HA) configuration, with fully meshed
and redundant uplinks to the public internet and/or all other content and service providers. It is
imperative that core network locations are physically secure and allow unencumbered access
24x7x365 to authorized engineering and operational staff.
The operational environment of the network core and hub locations is similar to that of a data
center. This includes clean power sources, UPS batteries, and diesel power generation for survival
through sustained commercial outages. The facility must provide strong physical security,
limited/controlled access, and environmental controls for humidity and temperature. Fire
suppression is highly recommended.
Equipment is to be mounted securely in racks and cabinets, in compliance with national, state,
and local codes. Equipment power requirements and specification may include ‐48 volt DC and/or
120/240 volts AC. All equipment is to be connected to conditioned/protected clean power with
uninterrupted cutover to battery and generator.
For the cost estimate, we assumed that the core facilities would be located in leased data centers
and distribution hubs will be located at existing City facilities with land for a telecommunications
shelter. The square footage needed depends on the business model, however we estimated 100
square feet needed per core site and 200 square feet needed per hub site to be able to support
multiple service operators. A network supporting multiple service providers requires more space
than a single service provider, but less space at the core and hubs may limit future network
scalability.

CTC Technology & Energy | IMG Rebel | Fiber for San Francisco | October 2017
32
2.3.3 DistributionandAccessNetworkDesignThe distribution network is the layer between the hubs and the fiber distribution cabinets (FDCs,
which provide the access links to the taps). The distribution network aggregates traffic from the
FDCs to the core. Fiber cuts and equipment failures have progressively greater operational impact
as they happen closer to the network core, so it is critical to build in redundancies and physical
path diversities in the distribution network, and to seamlessly re‐route traffic when necessary.
The distribution and access network design proposed in this report is flexible and scalable enough
to support two different architectures:
1. Housing both the distribution and access network electronics at the hubs, and using only
passive devices (optical splitters and patches) at the FDCs, or
2. Housing the distribution network electronics at the hubs and pushing the access network
electronics further into the network by housing them at the FDCs
By housing all electronics at the hubs, the network will not require power at the FDCs. Choosing
a network design that only supports this architecture may reduce costs by allowing smaller,
passive FDCs in the field. However, this architecture will limit the redundancy capability from the
FDCs to the hubs.
By pushing the network electronics further into the field, the network gains added redundancy
by allowing the access electronics to connect to the hub sites. In the event one hub has an outage,
the subscribers connected to the FDC would still have network access. Choosing a network design
that only supports this architecture may reduce costs by reducing the size of the hubs.
Selecting a design that supports both models would allow the City to accommodate many
different service operators, their network designs, and various network technologies. This design
would also allow service providers to start with a small deployment (i.e., placing electronics only
at the hub sites) and to grow by pushing electronics closer to their subscribers.
2.3.3.1 AccessNetworkTechnologiesFDCs can sit on a curb, be mounted on a pole, or reside in a building. This model recommends
installing sufficient FDCs to support higher than anticipated levels of subscriber penetration. This
approach will accommodate future subscriber growth with minimal re‐engineering. Passive
optical splitters are modular and can be added to an existing FDC as required to support
subscriber growth, or to accommodate unanticipated changes to the fiber distribution network
with potential future technologies.
The FTTP design also includes the placement of indoor FDCs and splitters to support MDUs. This
would require obtaining the right to access the equipment for repairs and installation in whatever
CTC Technology & Energy | IMG Rebel | Fiber for San Francisco | October 2017
33
timeframe is required by the service agreements with the customers. Lack of access would
potentially limit the ability to perform repairs after normal business hours, which could be
problematic for both commercial and residential services.
In this model, we assume the use of GPON electronics for the majority of subscribers and Active
Ethernet for a small percentage of subscribers (typically business customers) that request a
premium service or require greater bandwidth. GPON is the most commonly provisioned FTTP
service—used, for example, by AT&T Fiber, Verizon (in its FiOS systems), Google Fiber, and
Sonic.net.
Furthermore, providers of gigabit services typically provide these services on GPON platforms.
Even though the GPON platform is limited to 1.2 Gbps upstream and 2.4 Gbps downstream for
the subscribers connected to a single PON, operators have found that the variations in actual
subscriber usage generally means that all subscribers can obtain 1 Gbps on demand (without
provisioned rate‐limiting), even if the capacity is aggregated at the PON. Furthermore, many
GPON manufacturers are developing technology to support up to 10 Gbps and faster speeds as
user demand increases.
GPON supports high‐speed broadband data, and is easily leveraged by triple‐play carriers for
voice, video, and data services. The GPON OLT uses single‐fiber (bi‐directional) SFP modules to
support multiple (most commonly less than 32) subscribers.
GPON uses passive optical splitting, which is performed inside fiber distribution cabinets (FDC),
to connect fiber from the OLTs to the customer premises. With GPON service, the FDCs house
multiple optical splitters, each of which splits the fiber link to the OLT between 16 to 32
customers.
Active Ethernet (AE) provides a symmetrical (up/down) service that is commonly referred to as
“Symmetrical Gigabit Ethernet.” AE can be provisioned to run at sub‐gigabit speeds, and like
GPON, easily supports legacy voice, voice over IP (VoIP), and video content. AE is typically
deployed for customers who require specific service level agreements that are easier to manage
and maintain on a dedicated service.
For subscribers receiving Active Ethernet service, a single dedicated fiber goes directly to the
subscriber premises with no splitting. Because AE requires dedicated fiber (home‐run fiber) 39
from the OLT to the CPE, and because each subscriber uses a dedicated SFP on the OLT, there is
a significant cost difference in provisioning an AE subscriber versus a GPON subscriber.
39 Home‐run fiber is a fiber optic architecture where individual fiber strands are extended from the distribution
sites to the premises. Home‐run fiber does not use any intermediary aggregation points in the field.
CTC Technology & Energy | IMG Rebel | Fiber for San Francisco | October 2017
34
The fiber plant is designed to provide Active Ethernet service or PON service to all passings. The
network operator selects electronics based on the mix of services it plans to offer and can modify
or upgrade electronics to change the mix of services.
2.3.3.2 ExpandingtheAccessNetworkBandwidthGPON is currently the most commonly provisioned FTTP technology, due to inherent economies
when compared with technologies delivered over home‐run fiber such as Active Ethernet. The
cost difference between constructing an entire network using GPON and Active Ethernet is 40
percent to 50 percent.40 GPON is used to provide services up to 1 Gbps per subscriber and is part
of an evolution path to higher‐speed technologies that use higher‐speed optics and wave‐division
multiplexing.
This model provides many options for scaling capacity, which can be done separately or in
parallel:
1. Reducing the number of premises in a PON segment by modifying the splitter assignment
and adding optics. For example, by reducing the split from 16:1 to 4:1, the per‐user
capacity in the access portion of the network is quadrupled.
2. Adding higher‐speed PON protocols can be accomplished by adding electronics at the FDC
or hub locations. Since these use different frequencies than the GPON electronics, no
other CPE would need to be replaced.
3. Adding WDM‐PON electronics as they become widely available. This will enable each user
to have the same capacity as an entire PON. Again, these use different frequencies than
GPON and are not expected to require replacement of legacy CPE equipment.
4. Option 1 could be taken to the maximum, and PON replaced by a 1:1 connection to
electronics—an Active Ethernet configuration.
These upgrades would all require complementary upgrades in the backbone and distribution
Ethernet electronics, as well as in the upstream internet connections and peering—but they
would not require increased fiber construction.
2.3.3.3 CustomerPremisesEquipment(CPE)andSubscriberServicesIn the final segment of the FTTP network, fiber runs from the FDC to customers’ homes,
apartments, and office buildings, where it terminates at the subscriber tap—a fiber optic housing
located in the right‐of‐way closest to the premises. The service installer uses a pre‐connectorized
drop cable to connect the tap to the subscriber premises without the need for fiber optic splicing.
40 “Enhanced Communications in San Francisco: Phase II Feasibility Study,” CTC report, October 2009, at p. 205.

CTC Technology & Energy | IMG Rebel | Fiber for San Francisco | October 2017
35
The drop cable extends from the subscriber tap (either on the pole or underground) to the
building, enters the building, and connects to customer premises equipment (CPE).
2.4 FTTPCostEstimateThis section provides a summary of cost estimates for construction of a lit FTTP network to all
City residences and businesses. This deployment will cost an estimated $1.9 billion,41 inclusive of
outside plant construction labor, materials, engineering, permitting, pole attachment licensing,
network electronics, drop installation, customer premises equipment (CPE), and testing.
Table 10 summarizes these costs.42
Table 10: Estimated Lit FTTP Cost
Cost Component Low‐Cost Scenario High‐Cost Scenario
Outside Plant $700 million $760 million
Central Network Electronics 112 million 112 million
FTTP Service Drop and Lateral Installations
680 million 740 million
Customer Premises Equipment 290 million 290 million
Total Estimated Cost: $1.8 billion $1.9 billion
To illustrate the potential cost if the City were to choose a model other than the utility model
(i.e., if residents were to choose whether or not to buy services), Figure 9 shows the total low
estimated cost with respect to potential take rates. The projected cost is roughly linear by take
rate because the cost of adding additional subscribers is a fixed cost.
41 This is the High‐Cost Scenario as described below. 42 We apply an uncertainty of +/‐ 20 percent based on our experience and typical industry practices.
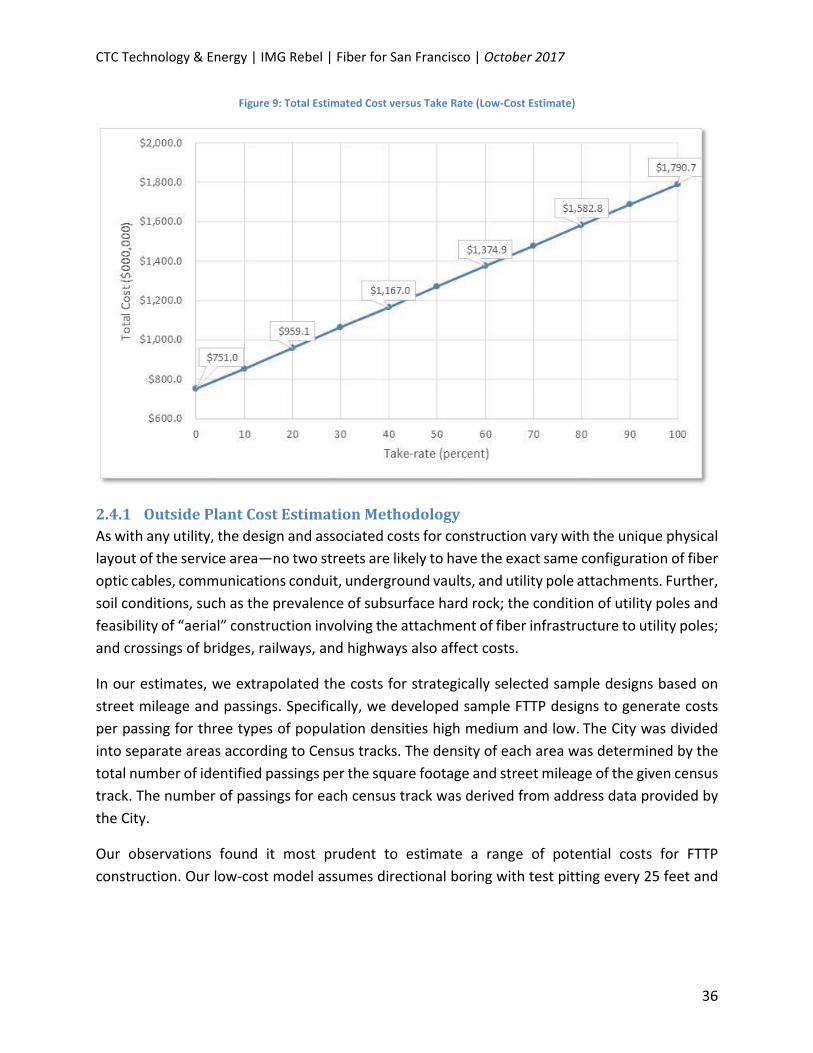
CTC Technology & Energy | IMG Rebel | Fiber for San Francisco | October 2017
36
Figure 9: Total Estimated Cost versus Take Rate (Low‐Cost Estimate)
2.4.1 OutsidePlantCostEstimationMethodologyAs with any utility, the design and associated costs for construction vary with the unique physical
layout of the service area—no two streets are likely to have the exact same configuration of fiber
optic cables, communications conduit, underground vaults, and utility pole attachments. Further,
soil conditions, such as the prevalence of subsurface hard rock; the condition of utility poles and
feasibility of “aerial” construction involving the attachment of fiber infrastructure to utility poles;
and crossings of bridges, railways, and highways also affect costs.
In our estimates, we extrapolated the costs for strategically selected sample designs based on
street mileage and passings. Specifically, we developed sample FTTP designs to generate costs
per passing for three types of population densities high medium and low. The City was divided
into separate areas according to Census tracks. The density of each area was determined by the
total number of identified passings per the square footage and street mileage of the given census
track. The number of passings for each census track was derived from address data provided by
the City.
Our observations found it most prudent to estimate a range of potential costs for FTTP
construction. Our low‐cost model assumes directional boring with test pitting every 25 feet and
CTC Technology & Energy | IMG Rebel | Fiber for San Francisco | October 2017
37
minimal surface restoration. 43 The high‐cost model assumes that sidewalk replacement is
required for surface restoration and that conduit would be installed in underground areas as part
of the sidewalk replacement.
The assumptions, sample designs, and cost estimates were used to extrapolate a cost per passing
for the outside plant. This number was then multiplied by the number of passings in each area
based on the City’s GIS data. The actual cost to construct FTTP to every premises in the City could
differ from the estimate due to changes in the assumptions underlying the model.
For example, if access to the utility poles is not granted or make‐ready and pole replacement
costs are too high, more of the network would have to be constructed underground—which
could significantly increase the cost of construction. Alternatively, if the City could partner with
a local telecommunications provider and overlash to existing pole attachments, the cost of the
build could be significantly lower. Further and more extensive analysis would be required to
develop a more accurate cost estimate across the entire City.
2.4.2 ComponentsofConstructionCostEstimateThe cost components for outside plant construction include the following tasks:
● Engineering – includes system level architecture planning, preliminary designs and field
walk‐outs to determine candidate fiber routing; development of detailed engineering
prints and preparation of permit applications; and post‐construction “as‐built” revisions
to engineering design materials.
● Quality Control / Quality Assurance – includes expert quality assurance field review of
final construction for acceptance.
● General Outside Plant Construction – consists of all labor and materials related to
“typical” underground or aerial outside plant construction, including conduit placement,
utility pole make‐ready construction, aerial strand installation, fiber installation, and
surface restoration; includes all work area protection and traffic control measures
inherent to all roadway construction activities.
● Special Crossings – consists of specialized engineering, permitting, and incremental
construction (material and labor) costs associated with crossings of railroads, bridges, and
interstate / controlled access highways.
43 By comparison, the cost to microtrench would likely be between the low and high costs estimate depending on
the surface restoration required.

CTC Technology & Energy | IMG Rebel | Fiber for San Francisco | October 2017
38
● Backbone and Distribution Plant Splicing – includes all labor related to fiber splicing of
outdoor fiber optic cables.
● Backbone Hub, Termination, and Testing – consists of the material and labor costs of
placing hub shelters and enclosures, terminating backbone fiber cables within the hubs,
and testing backbone cables.
● FTTP Service Drop and Lateral Installations – consists of all costs related to fiber service
drop installation, including outside plant construction on private property, building
penetration, and inside plant construction to a typical backbone network service
“demarcation” point. This cost also includes all materials and labor related to the
termination of fiber cables at the demarcation point. We assumed a take rate of 100
percent for standard fiber service drops, because the “utility” model means that every
residence and business will be served.
2.4.3 OutsidePlantConstructionCostsIn terms of outside plant, the estimated cost to construct the proposed FTTP network is $760
million, or $2,050 per passing.44 As discussed above, the model assumes a mixture of aerial and
underground fiber construction, depending on the construction of existing utilities in the area as
well as the state of any utility poles and existing infrastructure. Table 11 and Table 12provide a
breakdown of the estimated outside plant costs by type of area. (Note that the costs have been
rounded.)
Table 11: Estimated Outside Plant Costs (Directional Boring Cost Estimate)
Area Distribution
Plant Mileage
Total Cost Passings Cost per Passing
Cost Per Plant Mile
Entire City 1,600 $703,292,000 374,000 $1,880 $440,000
High Density 20 $10,875,000 26,000 $420 $544,000
Medium Density
400 $200,439,000 140,000 $1,430 $501,000
Low Density 1,180 $491,978,000 208,000 $2,370 $417,000
44 This is the High‐Cost Scenario. The passing count includes individual single‐unit buildings and units in multi‐
dwelling and multi‐business buildings as single passings. In larger MDUs, the cost estimate assumes that existing wiring will be used to serve the units. We assume that each unit will cost $500 per unit in large MDUs.

CTC Technology & Energy | IMG Rebel | Fiber for San Francisco | October 2017
39
Table 12: Estimated Outside Plant Costs (Sidewalk Restoration Cost Estimate)
Area Distribution
Plant Mileage
Total Cost Passings Cost per Passing
Cost Per Plant Mile
Entire City 1600.0 $762,858,000 373,480 $2,040 $480,000
High Density 20.0 $11,686,000 25,960 $450 $644,000
Medium Density
400.0 $211,365,000 139,940 $1,510 $531,000
Low Density 1,180.0 $539,807,000 207,580 $2,600 $459,000
Costs for aerial and underground placement were estimated using available unit cost data for
materials and estimated labor costs for placing, pulling, and boring fiber based on construction
in comparable markets.
Barring unknown economies of scale and inflation rates, as well as any sort of phenomenon
restricting material availability and costs, material costs were generally straightforward.
We estimated labor costs associated with the construction of fiber based on similar FTTP
construction projects, information from service providers in the City, and the costs the City has
paid for other fiber construction.
Aerial construction entails the attachment of fiber infrastructure to existing utility poles, which
could offer significant savings compared to all‐underground construction, but increases
uncertainty around cost and timeline. The utility pole owners and other attached providers can
impose costs and delays related to pole remediation and “make‐ready” construction that can
make aerial construction cost‐prohibitive in comparison to underground construction.
While generally allowing for greater control over timelines and more predictable costs,
underground construction is subject to uncertainty related to congestion of utilities in the public
rights‐of‐way and the prevalence of subsurface hard rock—neither of which can be fully
mitigated without physical excavation and/or testing. While anomalies and unique challenges
will arise regardless of the design or construction methodology, the large scale of this project is
likely to provide ample opportunity for variations in construction difficulty to yield relatively
predictable results on average.
We assume underground construction will consist primarily of horizontal, directional boring to
minimize right‐of‐way impact and to provide greater flexibility to navigate around other utilities.
The design model assumes a single two‐inch, High‐Density Polyethylene (HDPE) flexible conduit

CTC Technology & Energy | IMG Rebel | Fiber for San Francisco | October 2017
40
over underground distribution paths, and dual two‐inch conduits over underground backbone
paths to provide scalability for future network growth.
2.4.4 CentralNetworkElectronicsCostsCentral network electronics will cost an estimated $112 million, or $300 per passing, based on an
assumed take rate of 100 percent.45 (These costs may be phased in as subscribers are added to
the network.) The central network electronics consist of the electronics to connect subscribers
to the FTTP network at the core, hubs, and cabinets. Table 13 below lists the estimated costs for
each segment.
Table 13: Estimated Central Network Electronics Costs
Network Segment Passings Cost per Passing Subtotal
Core and Distribution Electronics 373,000 $100 $37 million
FTTP Access Cabinet Electronics 373,000 $200 $75 million
Central Network Electronics Total 373,000 $300 $112 million
2.4.4.1 CoreElectronicsThe core electronics connect the hub sites and connect the network to the internet. Core
electronics consist of high‐performance routers, which handle all the routing both on the FTTP
network and to the internet. The core routers should have modular chassis to provide high
availability in terms of redundant components and the ability to “hot swap”46 line cards and
modular in the event of an outage. Modular routers also provide the ability to expand the routers
as demand for additional bandwidth increases.
The cost estimate design envisions redundant rings between the core sites running networking
protocols such as hot standby routing protocol (HSRP) to ensure redundancy in the event of a
core failure. Additional rings can be added as bandwidth on the network increases. The core sites
would also tie to both hubs using 10 Gbps links. The links to the hubs can also be increased with
additional 10 Gbps and 40 Gbps line cards and optics as demand grows on the network. The core
networks will also have 40 Gbps to internet service providers that connect the FTTP network to
the internet.
The cost of the core routing equipment for the two core sites is $8 million. These costs do not
include the service provider’s Operational Support Systems (OSS) such as provisioning platforms,
45 The take rate affects the electronics and drop costs, but also may affect other parts of the network, as the City
may make different design choices based on the expected take rate. In CTC’s financial analysis, we will examine how the feasibility of the project depends on a range of take rates. 46 A “hot swappable” line card can be removed and reinserted without the entire device being powered down or
rebooted. The control cards in the router should maintain all configurations and push them to a replaced line card without the need for reconfirmation.

CTC Technology & Energy | IMG Rebel | Fiber for San Francisco | October 2017
41
fault and performance management systems, remote access, and other operational support
systems for FTTP operations. Service providers and/or their content providers may already have
these systems in place.
2.4.4.2 DistributionElectronicsThe distribution network electronics at the two hub sites aggregate the traffic from the FDCs and
send it to the core sites to access the internet. The core sites consist of high‐performance
aggregation switches, which consolidate the traffic from the many access electronics and send it
to the core for route processing. The distribution switches typically are large modular switch
chassis that can accommodate many line cards for aggregation. The switches should also be
modular to provide redundancy in the same manner as the core switches.
This cost estimate assumes that the aggregation switches connect to the access network
electronics with 10 Gbps links to each distribution switch. The aggregation switches would then
connect to the core switches over single or multiple 10 Gbps links as needed to meet the demand
of the FTTP users in each service area.
The cost of the distribution switching equipment for distribution hubs is $29 million. These costs
do not include any of the service provider’s OSS or other management equipment.
2.4.4.3 AccessCabinetElectronicsThe access network electronics at the FDCs connect the subscribers’ CPEs to the FTTP network.
We recommend deploying access network electronics that can support both GPON and Active
Ethernet subscribers to provide flexibility within the FDC service area. We also recommend
deploying modular access network electronics for reliability and the ability to add line cards as
more subscribers join in the service area. Modularity also helps reduce initial capital costs while
the network is under construction or during the roll out of the network.
The cost of the access network electronics for the network is $74 million. These costs include
optical splitters at the FDCs and are based on a take rate of 100 percent under the utility delivery
model.
2.4.5 Subscriber Electronics and Service Drop Installation Costs (Per‐SubscriberCosts)
Each activated subscriber would also require a fiber drop installation and subscriber electronics,
which would cost roughly $2,600 to $2,800 per subscriber, or $970 million to $1.0 billion total.
These costs are summarized in Table 14.

CTC Technology & Energy | IMG Rebel | Fiber for San Francisco | October 2017
42
Table 14: Per‐Subscriber Activation Cost Estimates
Construction and Electronics Required to
Activate a Subscriber Estimated Average Cost
Drop Installation and Materials $1,800 to $2,000
Subscriber Electronics (ONT and OLT) 500
Electronics Installation 200
Installation Materials 100
Total $2,600 to $2,800
The numbers provided above are averages and will vary depending on the type of premises and
the internal wiring available at each premises.
2.4.5.1 CustomerPremisesEquipmentandRelatedSubscriberElectronicsThe per‐subscriber expenses for electronics are the cost of the optical network terminal (ONT) at
the premises, a portion of the optical line termination (OLT) costs at the hub, the labor to install
and configure the electronics, and the incidental materials needed to perform the installation.
The ONT, also known as customer premises equipment (CPE), is the subscriber’s interface to the
FTTP network. For this cost estimate, we selected CPEs that provide only Ethernet data services
(however, there are a wide variety of CPEs offering other data, voice, and video services).
Assuming a 100 percent take rate under the utility delivery model, we estimated the CPE for
customers will be $290 million. For large MDUs we assume the use of internal wiring. The cost
estimate assumes the use of an Ethernet switch or a G.Fast or G.hn network access multiplexer
and network terminal.
2.4.5.2 DropInstallationThe drop installation cost is the biggest variable in the total cost of adding a subscriber. A short
aerial drop can cost as little as $250 to install, whereas a long underground drop installation in a
congested underground area like San Francisco can cost upward of $5,000. In this model, we
estimate an average of $1,800 to $2,000 per drop installation, for a total of $680 million to $740
million.
To estimate the cost of the drops, we determined the average drop length for each subscriber.
The average drop length is calculated using a variety of variable and assumptions including
average house set‐back, average home frontage, and nearest tap placement. Less dense areas
have longer drops however they tend to have more aerial construction which is less expensive.47
47 The FTTP fiber distribution plant is approximately half aerial and half underground, therefore half of the drops
will be aerial and half the drops will be underground. Table 9 provides the breakdown of aerial plant between density areas.

CTC Technology & Energy | IMG Rebel | Fiber for San Francisco | October 2017
43
We assumed a cost of approximately $400 for the installation of an aerial drop or pulling a drop
through existing conduit. In underground areas, we assumed a cost of $50 to $65 per foot for
underground conduit placement. MDUs larger than 20 units receive a single lateral to serve the
entire building. The following tables summarize the drop costs (and have been rounded).
Table 15: Estimated Drop and Lateral Costs (Directional Boring Estimate)
Area Total Drop
Costs Passings
Total Drop Footages
Average Drop Length
Drop Cost Per Passing
Entire City $680,000,000 373,000 23,000,000 133 $1,800
High Density $11,000,000 26,000 300,000 98 $700
Medium Density
$200,000,000 140,000 8,800,000 124 $1,700
Low Density $490,000,000 207,000 13,900,000 142 $2,100
Table 16: Estimated Drop and Lateral Costs (Sidewalk Replacement Estimate)
Area Total Drop
Costs Passings
Total Drop Footages
Average Drop Length
Drop Cost Per Passing
Entire City $741,000,000 373,000 23,000,000 125 $2,000
High Density $19,000,000 26,000 300,000 98 $700
Medium Density
$260,000,000 140,000 8,800,000 124 $1,900
Low Density $462,000,000 207,000 13,900,000 142 $2,200
The cost of underground construction drives the average drop. For example, an installation
requiring 30 feet of underground construction costs $1,900 ($400 for the drop at $1,500 for
conduit installation at $50 per foot). Whereas, in a suburban community where a drop could be
plowed through a grassy yard the cost would only be $700 assuming a conduit installation cost
of $10 per foot.

CTC Technology & Energy | IMG Rebel | Fiber for San Francisco | October 2017
44
3 ThePurelyPublicBroadbandOptionInvolvesHighRiskIn evaluating the options before the City, the Project Team considered a purely public model, in
which the City would build, own, and operate an FTTP network itself. This is a high‐risk and high‐
reward proposition, with a respectable track record in communities across the country. In our
observation, however, this is a difficult model to replicate, particularly for a city that does not
own its electric utility or one that does not have the internal expertise to build and operate an
internet enterprise. Aggressive anti‐municipal efforts by incumbent phone and cable companies
make this model even more risky. The purely public model has never been undertaken by a city
of the size or profile of San Francisco.
And the economics of the model are likely to be challenging in San Francisco. Assuming the lower
cost estimate developed by the engineers, the City would require financing of almost $1.29 billion
in bonds and a $20 million loan. To break even, the City would require a 47 percent take rate in
both the business and residential markets. If implementation costs approach the high cost
estimate, developing a project that is financially feasible becomes even more challenging. The
total bonding in the first four years increases to roughly $1.43 billion, plus the initial loan of $20
million. The take rate required to break even increases to 53 percent.
3.1 BackgroundOver the past 25 years, about 100 local communities have built hybrid fiber‐coaxial (HFC)
networks (the architecture used by cable companies) or FTTP networks to comprehensively serve
residential and business markets. In almost every case, these networks have been deployed in
small to mid‐size towns in largely rural areas. Some, but not all, of these towns already had cable
modem service, but many of them were unserved or close to unserved by broadband service.
3.1.1 TrackRecordofPublicBroadbandEffortsinFTTPThe economics of FTTP are extremely challenging given the very high capital costs and the modest
revenues possible, particularly in light of competition from lesser broadband technologies. Unlike
other public utilities such as water and sewer, city communications networks do not operate in
a monopoly environment, and a number of competitor technologies, however inferior, do exist.
These include far‐lower‐bandwidth options such as DSL, cable modem service, and wireless
service. (In contrast, some of the municipal FTTP networks were built a decade or more ago at a
time when there may not have been much or any competition in those rural towns.) These
alternative technologies do not offer the same future‐proof scalability and speeds as fiber, but
can certainly offer robust competition with respect to price and other factors.

CTC Technology & Energy | IMG Rebel | Fiber for San Francisco | October 2017
45
Tremendous successes have been achieved by public FTTP networks such in Lafayette, Louisiana;
Chattanooga, Tennessee; and Wilson, North Carolina—all of which are municipal electric utilities
that achieved substantial efficiencies.48
The most dramatic successes of these networks are in the benefits that do not necessarily show
up on financial statements—such as enhanced productivity, innovation, education, health care,
company recruitment, and related benefits that are among the reasons for the communications
investment in the first place.
A modest subset of the municipal FTTP and HFC networks have struggled financially for a range
of reasons, including the challenges created by incumbent opposition to municipal networks,
which in some states has restricted municipal options (for example, in Utah, municipalities are
statutorily prohibited from offering retail services—a law that was passed at the behest of the
incumbent providers, and that has created significant economic challenges for municipal
networks) but also ongoing litigation, anti‐municipal PR campaigns, and related efforts to delay,
obstruct, and increase the costs of municipal efforts.
The significant challenging economics of competitive broadband have also played a factor in
creating real financial challenges for a subset of the municipal networks. In some communities,
some of the functions required to operate a competitive internet, cable, and phone enterprise
have simply proven challenging for public sector entities—in particular such critical elements as
superior customer service in a competitive market is challenging even for private companies, and
has proven so for some public entities as well.
3.1.2 TrackRecordofPublicBroadbandinCaliforniaA handful of municipal networks that have stumbled have emerged and been widely publicized
by anti‐municipal incumbents and their allies. In California, there exist a number of very
successful municipal efforts, particularly those with more modest or incremental goals. For
example, the city of Santa Monica built fiber optics beginning in the late 1990s to connect
government buildings and has been successful in expanding its network and offering services in
the commercial market, though it has not to date entered the residential market. Similarly, the
city of Palo Alto’s municipal electric utility has seen tremendous success in leasing to the private
sector dark fiber strands on its backbone network.
48 Christopher Mitchell, “Broadband At the Speed of Light: How Three Communities Built Next‐Generation
Networks,” Institute for Local Self‐Reliance, April 2012, http://www.ilsr.org/wp‐content/uploads/2012/04/muni‐bb‐speed‐light.pdf (accessed March 2017). See also: Julie Kendrick, “The Broadband Challenge,” The Line, July 18, 2012, http://www.thelinemedia.com/features/broadband071812.aspx (accessed March 2017).

CTC Technology & Energy | IMG Rebel | Fiber for San Francisco | October 2017
46
Ubiquitous broadband to the home has proven more challenging. The city of Alameda, for
example, built a hybrid fiber‐coaxial cable and internet network that it later sold at a substantial
loss to Comcast following a number of years of challenging financial outcomes.
3.1.3 AdvantagesofHavingaPublicElectricUtilityThe majority of the public networks that have been deployed were deployed by municipal electric
utilities. This correlation is not surprising for a number of reasons. First, communities in which
the private sector did not have a business case for electrification are where local governments
chose to build public power. Not surprisingly, those same communities did not see adequate
private sector investment in broadband, either, and thus chose, in both cases, to invest for the
benefit of the broader community.
Second, the challenge of undertaking a public‐facing communications project is reduced for a
municipal electric utility relative to a local government that is not already a power provider. A
range of elements of a communications network overlap those of a power network, including the
poles on which the infrastructure is built, the facilities in which network hubs are located, the
skills and equipment of field staff, and even, in some cases, the billing, operating, and customer
service systems that support the service offerings. A minority of the municipal, public‐facing
networks were built by localities that were not power utilities.
3.2 BenefitsWhile it comes at considerable cost, municipal broadband offers demonstrable and important
benefits, including municipal decision‐making and control with regard to critical factors such as
insuring that the network is made universally accessible to all members of the community rather
than building only to areas with a higher return on investment.
Municipal ownership also delivers considerable flexibility and opportunity to expand, change
business models, and otherwise innovate as necessary to meet the needs of the community.
An additional and critical area of benefit is in regard to pricing and the affordability that is created
by a competitive dynamic. The municipal FTTP and HFC networks to date have tended to be in
markets where the likelihood of a third private competitor emerging was slim to nonexistent. In
fact, some of these networks have developed in markets where only one or no broadband
competitors existed. As a result, these municipal networks have almost universally delivered a
level of competition that was inconceivable otherwise.
3.3 ChallengesAt the same time, municipal networks present considerable challenges. In addition to the
financial risk entailed in building and operating a venture that competes with private sector
service offerings in some cases, a number of other challenges present themselves. Municipal

CTC Technology & Energy | IMG Rebel | Fiber for San Francisco | October 2017
47
networks are generally only possible when a city is in a position to issue bonds to raise capital to
build the network. In many cases, even cities with outstanding credit ratings are unable to bond
to support a communications network because of other critical priorities, such as shoring up
pension funds, building schools and public safety facilities, and the many other functions of
government for which bonding capacity must be reserved. And bonding capacity is limited in any
city, no matter how good its credit rating or how prosperous its economy.
Competing needs for capital are thus a considerable challenge around municipal efforts. At the
same time, additional challenges can be created in multiple functional areas associated with
construction, operations, and maintenance of a communications enterprise. The challenges can
range from the considerable difficulty of hiring network engineers, particularly in the Bay Area of
California where network engineers are in such demand and command very high private sector
salaries that are difficult for the public sector to match.
3.4 FinancialAnalysisTo fully understand the potential viability of the purely public model for this initiative, the Project
Team developed a full financial model and analysis of the economics of the traditional municipal
ownership and operations model. (See Appendix J.)
Under this model, and assuming the lower cost estimate developed by the engineers, the City
would require financing of almost $1.29 billion in bonds and a $20 million loan. To break even,
the City would need almost half of all residences and businesses to buy services—a very robust
take rate.
The base case analysis assumes that the City offers three data services:
● 1 Gbps residential service at $80 per month
● 1 Gbps small commercial service at $90 per month
● 1 Gbps medium commercial service (with service‐level agreements) at $240 per month49
These service prices are above those of Google Fiber in other markets ($70 for 1 Gbps) but are
lower than some other providers’ pricing. For example, Comcast’s recently announced residential
1 Gbps service in San Francisco is priced at $160 per month, with introductory promotional
pricing at $70 per month, plus an equipment rental fee of $10 per month.
The model assumes that subscribership for data services will ramp up over years one through
four, and then remain steady. The model assumes that subscribership for voice and video services
49 Medium commercial service receives a lower oversubscription rate, that is, less customers sharing the
connection, decreasing the instances of network congestion reducing overall speeds.

CTC Technology & Energy | IMG Rebel | Fiber for San Francisco | October 2017
48
will ramp up over the same period, but then decline as adoption of over‐the‐top (OTT)
alternatives increases.
If the take rate assumed in this base case analysis were to drop, or if the City were unable to
maintain service prices at the levels assumed in our analysis, the enterprise would accumulate
significant deficits over time.
As an example, our sensitivity analysis indicates that if the take rate were to drop by 10
percentage points, the enterprise would quickly turn from an unrestricted cash balance of about
$406,000 in year one to a negative cash balance. By year five, the unrestricted cash balance
deficit would be over $61.9 million, growing to a deficit of more than $324 million by year 20.
We also found that if competitive pressures were to force the City to reduce the residential
internet service fee by $5 per month from the levels assumed in the base case, the enterprise
would not be financially feasible. By year 10, the unrestricted cash balance deficit would be more
than $58.2 million, growing to a deficit of just under $126 million by the end of year 20.

CTC Technology & Energy | IMG Rebel | Fiber for San Francisco | October 2017
49
4 The Purely Private OptionWill NotMeet the City’s Goals of Open,UbiquitousFibertoAllHomesandBusinesses
With respect to the key goals identified for this initiative—open access and direct fiber
connectivity to every home and business in San Francisco—private deployment alone is unlikely
to suffice. Though there are emerging patterns of new deployment by competitors and upgrades
by incumbents, none of the providers in San Francisco offers an open access network and none
of them plans to build fiber on a ubiquitous basis.
There exists little agreement about the degree to which private capital is emerging to expand
broadband competition and improve broadband speeds. Nationally, while the incumbent
communications companies claim to be investing extensively in upgraded and new broadband
facilities, robust new fiber investment tends to be concentrated in markets that already feature
strong competition (such as those where Google Fiber deployed extensive residential fiber) or
more incremental in nature (for example, incremental expansion of the cable industry’s fiber
backbone to support new cable modem technologies, or incremental expansion of the phone
company’s fiber footprint to reach large business customers).
San Francisco’s residents and businesses have a relatively broad range of services available, as
compared to other urban areas. However, as compared to FTTP areas (such as Verizon FiOS and
Google Fiber cities and the FTTP networks in major cities in Asia), San Francisco is among the
American cities without citywide residential fiber.
In San Francisco, none of the City’s incumbent wired providers (AT&T, Wave, and Comcast) has
indicated any plans to deploy fiber on a ubiquitous basis, although new competition is emerging
in smaller, select areas thanks to new investment by companies like Sonic, Monkeybrains, and
Webpass.
Verizon offers FiOS in parts of Southern California but has not indicated any plans of extending
the service to San Francisco. Google Fiber’s expansion appears halted, at least for now, though
Google Access’ Webpass unit is expanding in the multi‐dwelling unit market downtown.
Comcast has upgraded its entire San Francisco service footprint50 to the next generation of cable
modem technology, which enables speeds of up to 1 Gbps in the downstream direction under
optimal conditions. AT&T is also upgrading its infrastructure to fiber in many parts of San
Francisco, but it’s unlikely that the upgrade will be citywide or ubiquitous. AT&T’s upgrades in
many cities thus far have been incremental and concentrated in select neighborhoods,
50 Comcast informed CTC and City staff in a September 2017 meeting that its network reaches 98.9 percent of residences and 56 percent of businesses in San Francisco.

CTC Technology & Energy | IMG Rebel | Fiber for San Francisco | October 2017
50
sometimes based on where AT&T already has fiber and can cost‐effectively extend it, or on areas
where AT&T has reason to build fiber to serve large enterprise customers.
In summary, while Comcast’s upgrade has improved speeds throughout the City, and while the
other companies are all incrementally growing or upgrading their existing facilities, the private
sector is not currently poised to deliver ubiquitous service or ubiquitous competition throughout
San Francisco. There does exist new investment, which may increase with time, but the results
will be uneven and inconsistent, with some but not all areas seeing substantially improved
services.
4.1 AT&TAT&T is the primary incumbent local exchange carrier in San Francisco and much of California,
where it offers DSL and other copper‐line services to most of the City and provides fiber services
such as Metro Ethernet to businesses. Because the cost of the fiber services is substantially higher
than the DSL services, small and medium‐sized businesses may have difficulty affording these
enhanced services.
DSL represents a relatively low‐bandwidth form of broadband—a network of roads, not
superhighways. DSL runs on telephone network copper wires, which simply cannot handle the
same capacity as fiber or even as Comcast’s hybrid fiber‐coaxial (HFC) networks. As capacity
requirements increase, DSL is likely to fall further behind cable.51 Even with newer DSL versions,
such as the VDSL fiber‐to‐the‐cabinet service providing download speeds of approximately 50
Mbps,20 its speed is significantly lower that what is available over cable or fiber. From a technical
standpoint, DSL is a short‐term solution in a market where bandwidth needs are growing
exponentially and high, symmetrical capacity is increasingly needed for small businesses and for
popular applications like video‐downloads, video‐gaming, and video‐conferencing. Aging copper
plant is not capable of meeting these growing needs in the long run.
In a very positive development, AT&T has recently started upgrading some areas in a few dozen
cities throughout the country to FTTP52 and we have observed AT&T upgrading infrastructure in
some parts of San Francisco. It’s not clear how extensive the fiber upgrade in San Francisco will
be, and experience in other cities suggests it is unlikely to be ubiquitous.
51 The limitations of DSL are illustrated by Verizon’s investment, over the past decade or so, to supplement its old
copper phone networks with new FTTP networks in limited metropolitan areas within its existing footprint, and by AT&T’s limited but effective expansion of fiber in some markets where it faces competition. 52 “100% Fiber Network Powered by AT&T Fiber Expands in 17 Metros – See if It’s Near You,” AT&T, March 23,
2017, http://about.att.com/newsroom/att_fiber_expands_to_17_metro_areas.html; http://www.theverge.com/2017/3/24/15056428/at‐t‐continues‐to‐expand‐its‐fiber‐internet‐service (accessed June 2017).

CTC Technology & Energy | IMG Rebel | Fiber for San Francisco | October 2017
51
4.2 ComcastIn San Francisco, Comcast operates a hybrid fiber‐coaxial system that ably competes against
other offerings in the existing marketplace. Comcast has also indicated that it will upgrade its
network in San Francisco to the next generation of cable modem technology, known as DOCSIS
3.1, within the next year or two.53 That upgrade, if it is also supported by additional fiber
construction, will enable Comcast to offer (“up to”) gigabit speeds in the downstream direction
to many San Francisco consumers. Pricing for this product in other markets has thus far exceeded
$150.
Comcast’s network, however, is limited by its lack of fiber—even with advanced electronics and
software, its system cannot keep pace with the potential speeds of fully‐fiber networks such as
those operated by Verizon, Google Fiber and, in limited areas, AT&T and CenturyLink. Cable
systems are bound by the inherent limitations of the coaxial cable that runs from their nodes into
the home. An additional limitation arises from the shared nature of cable modem service—
bandwidth within a neighborhood is shared rather than dedicated. As a result, promised speeds
of “up to” 1 Gbps downstream (and considerably less upstream) may be significantly decreased
by one’s neighbors’ simultaneous use of their cable modems.
Importantly, the DOCSIS 3.1 upgrade provides the potential for higher speeds to nearly all San
Francisco residents, because the upgrade covers the entire service area, not on an incremental
or partial basis (for technical reasons, an electronics upgrade such as DOCIS 3.1 is done on a
system‐wide basis).
In contrast, however, the DOCSIS 3.1 technology will not be available for those in small business
areas that are outside Comcast’s existing footprint. Because the traditional footprint of cable
companies was residential only, for purposes of selling one‐way cable video products, cable
networks frequently do not reach into business areas where there exists insufficient for new
infrastructure investment. As a result, some business areas do not have the benefit of Comcast’s
networks and extension of the infrastructure to those businesses can be prohibitively expensive.
Comcast also offers “Gigabit Pro,” its FTTP symmetrical 2 Gbps residential service, in limited parts
of San Francisco. Gigabit Pro is only available to customers within a quarter to a third of a mile of
Comcast’s existing fiber backbone—and the service require extension of that fiber the customer’s
53 Jon Brodkin, “Comcast’s gigabit cable will be in 15 cities by early 2017,” ArsTechnica, November 2, 2016,
https://arstechnica.com/information‐technology/2016/11/comcasts‐gigabit‐cable‐will‐be‐in‐15‐cities‐by‐early‐2017/ (accessed June 2017).

CTC Technology & Energy | IMG Rebel | Fiber for San Francisco | October 2017
52
premises, which can take many weeks. As of late 2016, Comcast was charging approximately
$1,000 for installation and service activation. Monthly service fees are approximately $300.54
4.3 EthericNetworksEtheric Networks is a privately owned, fixed‐wireless ISP, based in Redwood City, with coverage
areas spanning from Salinas to Berkeley. Since 2003, the company has deployed licensed
microwave antennas to connect customers to its fiber backbone.55 The company also provides
direct fiber connections for businesses in select locations.
Its residential service comes with a $400 to $440 startup fee, covering the cost of new antennas
and their installation. Then service costs $85 to $350 per month for guaranteed minimum,
symmetrical speeds ranging from 1 Mbps to 25 Mbps. They also have more expensive small
business/home office service with lower latency and greater burst potential available in some
areas. This SOHO service costs $160 to $700 per month with guaranteed speeds between 3 Mbps
and 25 Mbps. Etheric’s business service levels range from $200 to $1,500 per month, with
guaranteed speeds ranging from 2 Mbps to 100 Mbps.56
Etheric reports that it continues to deploy higher‐speed wireless technologies as they become
available, but the company has shared no plans to further expand its fiber backbone at this time.
4.4 MonkeybrainsMonkeybrains is a San Francisco‐based ISP that started offering dial‐up service in 1998. It focuses
exclusively on serving the San Francisco area, but does not offer service in much of the western
region of the City. Over the years, it has continued to improve its service offerings as better
technologies have become available to connect customers to its core fiber network. In 2009, it
began using microwave technology to connect end customers to its core fiber network. It now
has a network of more than 1,000 network access points across the City, which send signals along
line‐of‐sight connections to antennas on customer premises.
Monkeybrains’ standard residential service costs $35 a month, after a $250 antenna setup fee.
In 2015, it used a crowdfunding campaign to negotiate a bulk buying discount on millimeter wave
radios. Through the crowdfunding campaign, customers could cover the cost of the $2,500
antenna, and as a reward, Monkeybrains promised to deliver 300 to 500 Mbps to their home or
54 Jon Brodkin, “Comcast’s gigabit cable will be in 15 cities by early 2017,” ArsTechnica, November 2, 2016,
https://arstechnica.com/information‐technology/2016/11/comcasts‐gigabit‐cable‐will‐be‐in‐15‐cities‐by‐early‐2017/ (accessed June 2017). 55 Robert Mullins, “Etheric Bootstraps to build wireless broadband network,” Silicon Valley Business Journal,
November 30, 2003, http://www.bizjournals.com/sanjose/stories/2003/12/01/story5.html/ (accessed June 2017). 56 Etheric Networks, https://ethericnetworks.com/ (accessed June 2017).

CTC Technology & Energy | IMG Rebel | Fiber for San Francisco | October 2017
53
office at the same monthly price of $35. Through the campaign, 273 backers helped the company
raised $420,501, enough to purchase almost twice as many antennas as planned. The company
used the extra funds from the project to deploy additional antennas on the roofs of schools,
homeless shelters, and cultural centers across the City.57
While Monkeybrains’ standard service remains 20 Mbps/10 Mbps, it also offers business
packages with symmetrical speeds ranging from 20 Mbps to 1+ Gbps.58 Their service levels will
likely improve as wireless technologies get better and more affordable, but the company
leadership acknowledges that at some point they will have to invest more heavily into fiber. The
founders have reportedly stated that they have no plans to invest in last‐mile fiber links until
there is “‘some sort of relaxation in the right‐of‐way access [of fiber].’”59
FCC Form 477 data are not available for Monkeybrains, but our understanding of the
Monkeybrains service footprint is that it is limited to certain areas of single‐family homes in San
Francisco.
4.5 WaveWave is a Kirkland, Washington, based ISP with a network that includes metropolitan areas on
the West Coast from the Bay Area to Seattle. The privately‐held company was recapitalized for
more than $1 billion in November 2012,60 and raised $130 million in 201561 and another $125
million in 2016.62 It is using these funds to expand its fiber and coaxial footprint through new
construction and acquisitions.
57 Rick Paulus, “Can an Indie ISP beat Comcast?” Popular Mechanics, March 14, 2016,
http://www.popularmechanics.com/technology/infrastructure/a19741/can‐an‐indie‐isp‐beat‐comcast/ (accessed June 2017). 58 Monkeybrains.net, https://www.monkeybrains.net/business.php (accessed June 2017). 59 Rick Paulus, “Can an Indie ISP beat Comcast?” Popular Mechanics, March 14, 2016,
http://www.popularmechanics.com/technology/infrastructure/a19741/can‐an‐indie‐isp‐beat‐comcast/ (accessed June 2017). 60 “WaveDivision Holdings Raises $1.052 Billion, Plans to accelerate Expansion of West Coast Broadband/Fiber
Optic Network,” Press Release, Waller Capital, November 15, 2012, http://www.wallercapital.com/wavedivision‐holdings‐raises‐1‐052‐billion‐plans‐to‐accelerate‐expansion‐of‐west‐coast‐broadbandfiber‐optic‐network/ (accessed June 2017). 61 Mike Farrell, “Wave Raises $130M for Fiber Build,” MultiChannel News, May 21, 2015,
http://www.multichannel.com/news/broadband/wave‐raises‐130m‐fiber‐build/390795 (accessed June 2017). 62 “Wave Raises $125 Million to Continue Accelerated Fiber Network Construction and Commercial Broadband
Services Expansion,” Press Release, Wave, September 14, 2016, http://residential.wavebroadband.com/wave‐raises‐125‐million‐to‐continue‐accelerated‐fiber‐network‐construction‐and‐commercial‐broadband‐services‐expansion/ (accessed June 2017).

CTC Technology & Energy | IMG Rebel | Fiber for San Francisco | October 2017
54
Wave began offering gigabit residential internet service in San Francisco in June, 2015. It has
focused its fiber efforts on large MDUs, and it does not share the location of its existing fiber
plant. Where available, the service costs $80 per month.
Consumers who do not live in a building with Wave‐G gigabit service may still be able to receive
up to 110 Mbps service over Wave’s hybrid fiber coaxial (HFC) network.63 The company also
offers business speeds up to 1 Gbps, but service levels above 250 Mbps are only available in select
locations, or with added new construction fees.64
While it is unclear how much new fiber construction Wave has planned for the San Francisco
area, the company recently put out a job listing for a fiber construction lead in San Francisco.65
The company will likely continue to expand fiber to MDUs, but has not indicated any intention to
expand its FTTP service to single family homes.
The following map (Figure 10) illustrates the reach of Wave’s services, and is based on self‐
reported data provided by Wave to the FCC.66
63 “San Francisco, CA Cable TV, Internet, and Phone Service,” Wave,
http://residential.wavebroadband.com/resources/cities/san‐francisco‐cable‐internet‐phone.php (accessed June 2017). 64 “High Speed Internet, Wave, http://residential.wavebroadband.com/internet/ (accessed June 2017). 65 “Fiber Construction Lead: Wave Broadband, San Francisco Bay Area,” Job Listing, LinkedIn,
https://www.linkedin.com/jobs/view/249977325 (accessed June 2017). 66 The map is based on FCC Form 477 data as of June 30, 2016, https://www.fcc.gov/general/broadband‐
deployment‐data‐fcc‐form‐477 (accessed June 2017).

CTC Technology & Energy | IMG Rebel | Fiber for San Francisco | October 2017
55
Figure 10: Wave Service in San Francisco
4.6 WebpassWebpass is a wireless ISP, founded in San Francisco in 2003. The company uses millimeter wave
antennas to offer high‐speed service to customers in MDUs. When Alphabet’s access division,
Google Access, purchased the company in June, 2016, Webpass had infrastructure to serve some
residential MDUs and office buildings in San Francisco, Oakland, San Diego, Miami, Chicago, and
Boston.67
67 “A Great Day,” Webpass Blog, October 3, 2016, https://webpass.net/blog/a‐great‐day (accessed June 2017).

CTC Technology & Energy | IMG Rebel | Fiber for San Francisco | October 2017
56
Since the acquisition, Google Access has scaled back its FTTP efforts68 and appears to be moving
forward with Webpass’ wireless strategy.69 Webpass has launched new service in Denver, and
appears to be preparing to launch in Seattle.70
Webpass offers its customers speeds ranging from 100 Mbps to 1 Gbps for $60 per month.71
Webpass continues to expand its services to new buildings in the markets it serves. In order to
be eligible for Webpass service, a building must have at least 10 units and be wired with Ethernet
cabling.72 It appears unlikely that Webpass will provide service to single family homes in the near
future due to the high cost of the millimeter wave antennas that the company relies on for its
last‐mile connections.73
FCC Form 477 data are not available for Webpass, but our understanding of the Webpass service
footprint is that it is concentrated in MDUs in the downtown area of San Francisco.
4.7 SonicSonic is a Santa Rosa‐based ISP that has been in business since 1994. Historically, Sonic offered
DSL service over AT&T’s copper phone lines, but the company has steadily expanded its network
across the Bay Area, and began offering fiber‐based service to residential customers in limited
areas in 2011, with fiber‐based business service soon to follow.74 After building smaller FTTP
projects in North and East Bay, Sonic announced in February 2016 the provision of Gigabit fiber
68 Jon Brodkin, “Google Fiber division cuts staff by 9%, ‘pauses’ fiber plans in 11 cities,” ArsTechnica, October 25,
2016, https://arstechnica.com/information‐technology/2016/10/google‐fiber‐laying‐off‐9‐of‐staff‐will‐pause‐plans‐for‐10‐cities/ (accessed June 2017). 69 Jack Clark, “Google Plots Cheaper Wireless Future to Expand Fiber Project,” Bloomberg Technology, July 28,
2016, https://www.bloomberg.com/news/articles/2016‐07‐28/google‐plots‐cheaper‐wireless‐future‐to‐expand‐fiber‐project (accessed June 2017). 70 Jon Brodkin, “Google Fiber makes expansion plans for $60 wireless gigabit service,” ArsTechnica, February 22,
2017, https://arstechnica.com/information‐technology/2017/02/google‐fiber‐makes‐expansion‐plans‐for‐60‐wireless‐gigabit‐service/ (accessed June 2017). 71 Jon Brodkin, “Google Fiber makes expansion plans for $60 wireless gigabit service,” ArsTechnica, February 22,
2017, https://arstechnica.com/information‐technology/2017/02/google‐fiber‐makes‐expansion‐plans‐for‐60‐wireless‐gigabit‐service/ (accessed June 2017). 72 “More Places To Grab Gigabit, With Webpass,” Blog Posting, Webpass, January 30, 2017,
https://webpass.net/blog/more‐places‐to‐grab‐gigabit‐with‐webpass (accessed June 2017). 73 Bruce Brown, “Google Fiber Isn’t Just Fiber Anymore—Now It Offers Wireless Service, Too,” Digital Trends,
October 5, 2016, http://www.digitaltrends.com/web/google‐fiber‐webpass‐hybrid‐internet‐fiber‐wireless/ (accessed June 2017). 74 Martin Espinoza, “Sonic increases investment in fiber networks,” The Press Democrat, January 18, 2015,
http://www.pressdemocrat.com/news/3310907‐181/sonic‐increases‐investment‐in‐fiber?artslide=0 (accessed June 2017).

CTC Technology & Energy | IMG Rebel | Fiber for San Francisco | October 2017
57
service available in parts of the Sunset and Richmond neighborhoods.75 Over the past year, Sonic
has continued to build fiber infrastructure in San Francisco neighborhoods where construction
costs are lowest (generally, areas with overhead utilities, which tend to offer lower costs than
underground construction). Sonic’s leadership suggested in recent meetings with the City that
the company will expand its FTTP footprint to additional areas of San Francisco with aerial utilities
over the next year or so. Even in aerial areas, Sonic’s construction is not uniform and tends to
skip areas where costs and complexity are higher. We thus do not expect Sonic’s fiber
construction to be ubiquitous, even in the neighborhoods where it plans to build.
Where available, Sonic’s gigabit service is $40 per month ($58 including taxes and fees),76 and
includes a free phone line.
The following map illustrates the reach of Sonic’s services, and is based on self‐reported data
provided by Sonic to the FCC.77
75 Dane Jasper, “Sonic Fusion Gigabit Fiber Now Available in San Francisco,” Blog Posting, Sonic, February 25, 2016,
https://corp.sonic.net/ceo/2016/02/25/sonic‐fusion‐gigabit‐fiber‐now‐available‐in‐san‐francisco/ (accessed June 2017). 76 Bernie Arnason, “Sonic Brings Disruptive Pricing for Gigabit Services Ahead of Google Fiber,” Telecompetitor,
February 26, 2016, http://www.telecompetitor.com/sonic‐brings‐disruptive‐pricing‐for‐gigabit‐services‐ahead‐of‐google‐fiber/ (accessed June 2017). 77 The map is based on FCC Form 477 data as of June 30, 2016, https://www.fcc.gov/general/broadband‐
deployment‐data‐fcc‐form‐477 (accessed June 2017).

CTC Technology & Energy | IMG Rebel | Fiber for San Francisco | October 2017
58
Figure 11: Sonic Service in San Francisco
4.8 FactorsThatCanImpactPrivateDeploymentPatternsEvery company obviously makes unique decisions about deployment based on its technology
choices, available capital, business plan, and return on investment requirements. In an
environment where the private sector has complete control over that dynamic, there exists a
wide range of factors that will determine deployment patterns.
Among these are proximity to existing backbone and backhaul fiber plant. AT&T, for example,
tends to offer gigabit services around the country to multi‐dwelling units and single‐family homes
that are located in close proximity to its existing fiber optics.
Another factor is proximity to areas with significant potential enterprise business. As with the
former factor, many companies will have invested in fiber infrastructure to areas where large
enterprise customers that make big monthly purchases of services are located. As a result,
neighborhoods with some proximity to these enterprise customers tend to offer better
economics for new residential deployment.

CTC Technology & Energy | IMG Rebel | Fiber for San Francisco | October 2017
59
The availability of aerial utility pole space is a further critical factor, so long as utility poles are in
reasonably good condition and do not require costly replacement or extensive “make‐ready” to
prepare them for a new attachment.
Closely related to whether aerial utilities are available or not is the cost factor associated with
density. The higher the density in a neighborhood, the lower the per‐customer construction or
upgrade costs (all other things being equal); obviously the savings associated with density can be
negated by the potential higher costs of expensive pole replacement and make‐ready or costly
underground construction.
Another related factor is the type of housing in the neighborhood, and whether it is single family
or MDUs. Construction to MDUs can be more cost‐effective, assuming that the inside wiring in
the building is usable for new broadband purposes, and that the service provider has access to
the market in the MDU. (This is frequently not the case—but San Francisco became the first city
in the country to pass a law regulating a tenant’s right to choose communications services and
access to the inside wiring owned by the property owner.)
Finally, demographics play a significant role in private sector investment calculus around
broadband upgrades or expansion. Again, all other things being equal, families with higher levels
of education, multiple breadwinners, multiple children of internet‐use age, and so on tend to be
high‐revenue customers for broadband internet service. Neighborhoods and cities in which these
potential customers are concentrated are of particular interest to private investors. In San
Francisco, these demographic factors will play less of a role than in other cities, where the overall
demographic factors are less attractive than in San Francisco.
The totality of these and other factors will impact private deployment. In a model in which the
City leaves broadband investment entirely to the private sector, other than through some
facilitation or other low‐cost strategies, these factors rather than the City’s policy priorities
around digital opportunity, digital equity, and universal access will determine deployment
patterns.
4.9 BenefitsandChallengesofthePrivateInvestmentModelThe foremost benefit of the private investment model is private investment and lack of City
financial risk. To the extent that the private market delivers new broadband capabilities and new
broadband competition, the City is in a position to partially or incrementally meet its policy goals
without risk to the taxpayers. That said, as is discussed throughout this document, private
investment is an uneven and incremental solution, rather than a comprehensive and universal
approach.

CTC Technology & Energy | IMG Rebel | Fiber for San Francisco | October 2017
60
Along with the benefit of not having to fund or finance a broadband network, the private solution
can deliver the considerable benefits of private sector innovation and creativity. Particularly in a
singular market like San Francisco of early adopters and technology‐adept citizens, private
networks in theory will respond to the capabilities of the market through service innovation and
creativity. We note, though, that the broadband market has historically seen less of this kind of
innovation than one would want, given lack of competition and opportunity for network
operators to use the monopoly or duopoly status to protect existing business models and
revenue streams.
The modest emerging competition in some parts of San Francisco will hopefully continue to
impact that static dynamic, as has been the case to some extent in markets throughout the
country since the early Google Fiber announcements stimulated modest new investment by
incumbents. But the incremental increases in competition in some parts of the City would not
have the same transformative impact with regard to competitive service delivery and innovation
as would a comprehensive, universal citywide deployment.
Among the considerable challenges, from the City’s standpoint, of leaving broadband to a largely
noncompetitive private market is the deeply uneven benefit to some communities and
neighborhoods relative to others. As we have documented here, with the exception of Comcast,
private sector deployment patterns are not comprehensive or consistent throughout the City.
This has an impact not only in regard to services and availability, but also in regard to the
affordability that is presumably created by robust competition.
4.10 RiskofConsolidationandReductioninCompetitionIn the current environment, broadband competition faces political challenges. Given the
regulatory environment in Washington, we are moving toward far greater consolidation and
monopolization of communications infrastructure ownership.
For example, we anticipate a very friendly regulatory approach toward mergers, given the current
leadership at the Federal Communications Commission and Department of Justice. Indeed, we
are already seeing a wave of consolidation among enterprise providers. That consolidation began
a number of years ago and is likely to accelerate, as demonstrated by CenturyLink’s pending
acquisition of Level 3.
We expect this consolidation to reach even further into the industry, as well. The prospect of
Verizon’s acquisition of either Charter or Comcast, for example, would not only reduce wireline
broadband competition, but would also threaten the promised mobile competition that cable
companies are planning to offer to mobile phone companies.

CTC Technology & Energy | IMG Rebel | Fiber for San Francisco | October 2017
61
5 P3 Structure Could Enable the City to Achieve the Goal of Open,UbiquitousFiber
P3 represents a promising means by which to meet San Francisco’s goals for this initiative. Policy
goals such as ubiquity, openness, and pricing can potentially be negotiated with the private
partner because the City’s investment buys it influence.
5.1 P3BackgroundP3 is a new term in broadband planning,78 as that term is used internationally to signify an
alternative delivery mechanism for financing construction and operations of a public asset.
The formal P3 Structure is largely untested in the U.S. with respect to broadband. To our
knowledge, the Kentucky middle mile project is the only formal broadband P3 to have closed79
and the only other current P3 project contemplated for FTTP (other than this initiative) is a
nascent project in Topeka, Kansas, and the surrounding county.80 P3 has been utilized for last
mile broadband in parts of Asia and Europe.
In other infrastructure areas, the formal P3 mechanism has long been a preferred tool for public
infrastructure projects in parts of Europe and Asia, and has gained considerable currency in the
U.S. in recent years. Indeed, it appears to be potentially contemplated for the much‐discussed
potential Trump infrastructure bill that may emerge over the next year.
The formal P3 mechanism has been used most frequently in the areas of transportation and
public transit, and is increasingly now being used for public projects like libraries, schools,
government buildings, prisons, and convention centers. Formal P3s have tended to be
concentrated in the United States in projects that are at least in part self‐funding—projects
78 The term public–private partnership is used in a range of ways—including to refer to less formal arrangements
such as facilitation by public entities of private investment, such as Google Fiber’s relationship with Kansas City, Austin, and others. But for purposes of this document and the Fiber for San Francisco Initiative, we use the term to refer to a formal negotiated structure under which a public entity selects a concessionaire to deliver, over some substantial period of time, some subset of the necessary elements of an infrastructure project. 79 KentuckyWired is the first of its kind in the country. The network will connect 1,100 government entities over a
3,400‐mile fiber optic backbone and excess capacity will be made available to private sector companies for lease, development, and innovation. Kentucky will retain ownership of the network; the concessionaire will build, maintain and operate the network for 30 years. The project is notable for its politically bipartisan support. KentuckyWired was first announced by Rep. Hal Rogers, a Republican, and then‐Gov. Steve Beshear, a Democrat, in 2014. Gov. Matt Bevin, a Republican, announced his support for the project after his election in 2016. “Kentucky Wins 'Deal of the Year' for KentuckyWired Fiber Optic Project,” News, CTC Technology & Energy, December 8, 2015, http://www.ctcnet.us/blog/kentucky‐wins‐deal‐of‐the‐year‐for‐kentuckywired‐fiber‐optic‐project/(accessed June 2017); “KentuckyWired Statewide Broadband Network Initiative Moving Forward in Eastern Kentucky and Beyond,” Press Release, KentuckyWired, September 16, 2016, https://goo.gl/QxzjYx (accessed June 2017). 80 “JEDO Board Meeting,” Minutes, December 14, 2016, City of Topeka and Shawnee County, Joint Economic
Development Organization, http://www.jedoecodevo.com/Meeting‐Documents/2016Documents/12.14.16Agenda%20Packet.pdf (accessed June 2017).

CTC Technology & Energy | IMG Rebel | Fiber for San Francisco | October 2017
62
where a revenue stream is associated with the infrastructure project, and those revenues can be
applied to the public entity’s financial obligation to the concessionaire.
Thus, for example, in the case of a toll road, a hypothetical P3 might anticipate certain toll
revenues over a period of time that the concessionaire would collect and keep—potentially with
a minimum revenue guarantee (from the state department of transportation that is the sponsor
of the P3) in the event that toll revenues do not meet the negotiated targets, and potentially with
revenue‐sharing between public and private entities in the event that revenues exceed certain
targets.
Each P3 is obviously unique, with a customized mechanism for addressing revenue risk, as well
as long‐term revenue upside. Similarly customized for each P3 would be allocation of a full range
of risks, including construction risk and performance risk. Public entities that sponsor
infrastructure P3s frequently do so in order to efficiently allocate such risks as best they can.
Thus, for example, a formal P3 could potentially allocate performance risk to the private sector
to get the advantage of presumed private sector efficiencies and operational capacity—while
possibly still allocating some construction risk to the public partner, particularly if public
processes such as permitting, access to land, and so on, are contributors to risk.
Another primary reason for public sponsorship of P3s is a scenario in which the P3 provides access
to capital for the public infrastructure project. Private capital of this sort is not necessarily low
cost. Indeed, it is almost always going to be higher‐cost capital than would be public bond debt.
But in the event that this is the most accessible or only accessible form of capital, this is a useful
tool for a government to proceed with projects that otherwise would have to wait.
5.2 TheCoreStructureoftheFormalP3At its core, the concessionaire model represents a public grant of rights to a private partner that
contracts to finance, build, and operate a broadband network, with the concession lasting a
considerable period of time (likely 30 or more years). The private partner agrees to provide
financing, construction, operations, and service delivery over the network.
To fund all this activity and investment, the locality agrees to an arrangement that guarantees a
certain level of revenue to the concessionaire. This revenue mechanism could take any form
legally available to the locality. Depending on state and local law, the locality could provide a
direct revenue stream out of general funds, through a specific fee or tax, or otherwise.
Alternatively, the partnership could be structured such that the private partner’s revenue stream
derives from end‐user payments (service fees for data, voice, and video services, paid by network
customers), with a minimum revenue guarantee by the locality such that any shortfall in
projected revenues would be made up by the locality. Hybrid arrangements are also possible, in
which the private partner’s payments are funded partially through a public tax or fee and partially

CTC Technology & Energy | IMG Rebel | Fiber for San Francisco | October 2017
63
through end Connection Fees for services. In any event, the private partner is unlikely to assume
all or most of the demand and revenue risk in a P3 arrangement.
To partially offset public risk in this regard, P3 arrangements also frequently include provision for
revenue sharing in the event that network revenues exceed the minimum amounts guaranteed
to the private partner.
Some communities that have considered P3s have sought “easy out” scenarios in which the
locality can cancel the partnership or choose not to appropriate necessary funds in any given
year, and thus depart its financial obligations at any time. But without the public entity’s long‐
term financial commitment, this approach is unlikely to be marketable.
5.3 ApplyingtheFormalP3ModeltoBroadbandCreatesSomeRisksThe application of the formal P3 model to broadband is still new and untested in the U.S. with
respect to last‐mile broadband, which is not an area of traditional public sector operations. Thus,
for example, unlike roads, bridges, and subway systems, broadband represents an infrastructure
category that has largely (though not exclusively) been the province of the private sector. As a
result, a formal P3 in the context of broadband faces certain analytical and practical challenges
that are not experienced in the same way in other P3 sectors.
As a result, traditional P3 risk modeling for municipal infrastructure is insufficient as applied to
broadband. In a water, sewer, or tollway project, one typically considers traditional financing
factors and the type of demand that exists in a monopolistic environment. Furthermore, in those
infrastructure categories, the services provided are largely stable and predictable (a water utility
will provide water for its entire lifetime, and a toll road will provide transit for vehicles for its
entire lifetime). This, however, is not the case in broadband, an industry in which the ways in
which consumers use the product is constantly in flux and the services provided over the network
are predictable only in the short to medium‐term. Note, for example, the decline of cable
television as a service as consumers move to internet‐based video streaming services such as
Netflix and Hulu. Similarly, wireline phone service, once a universally‐adopted service, is now
used by as few as half the homes in technology‐adept markets.
Indeed, applying P3 to FTTP introduces a range of critical market and demand risks. Because right
alongside the City’s network, private competitors operate their own networks, even though none
offers ubiquitous fiber, so the services they offer will not match what is possible over the FTTP
network that the City envisions. And both the City‐sponsored network and private competitors
have to grapple with, and adapt to, constant and substantial changes in consumer demand,
service preferences, and technology change. These factors are dramatically different to those
impacting revenue risk in a formal P3 in a more traditional sector such as water or public transit.

CTC Technology & Energy | IMG Rebel | Fiber for San Francisco | October 2017
64
6 P3ModelAnalysisThis section of the report provides an analysis regarding application of alternative delivery
models to the City’s proposed FTTP project. P3s have never before been applied to FTTP projects
in the United States, though the idea has been considered in a number of communities. As a
result, this is a first‐of‐its‐kind analysis. In this section, we describe the City’s guiding principles
and the principles of rigorous financial modeling that shaped the analysis and recommendations.
We summarize our analysis and the alternatives we considered, including the typical
infrastructure P3 model (the “Classic P3 Model”), and describe our recommendations for two
alternative means by which to apply P3 to FTTP.
6.1 FrameworkGoalsUsedtoDevelopPotentialProjectDeliveryModelsWe set aside standard thinking about broadband P3s to develop framework goals that would
guide our assessment of potential approaches—and, ultimately, the creation of a completely new
broadband P3 model that meets the City’s goals and creates a feasible investment vehicle for
private partners. Our three framework goals are as follows.
6.1.1 Create a Broadband Market That Provides Long‐Term “Best Value” forTaxpayers,Users,andtheCity
We seek to create long‐term “best value” for the City by creating a level playing field and
competitive market at the service level and, ideally, at the dark fiber level, which we believe will
lead to reduced costs and improved services for users. To achieve true competition, the model
would need to support the entry of multiple service providers.
Some level of City and/or taxpayer support will be necessary for a project of this size and nature—
but enabling additional ISPs and application providers to enter the market will likely yield more
revenues and lessen the financial burden on the City and its taxpayers.
To ensure that this principle remains in place over the long term, we seek flexibility to
accommodate changes over time—in terms of technology (which will improve over time) as well
as supply and demand for services.
6.1.2 CreateaFeasibleBusinessCasefortheProjectInvestments in the project will be significant—and the project’s revenues will need to be
sufficient to not only recover the investments, but also to cover operational costs and
compensate parties for absorbing risks.
The guiding financial question, then, is how to minimize life cycle costs as much as possible,
generate enough revenues, and reduce the project’s risk profile. These outcomes are not a given,
but can be optimized by scoping the project with these needs in mind, and by structuring its
funding mechanisms, financing structure, and delivery model.
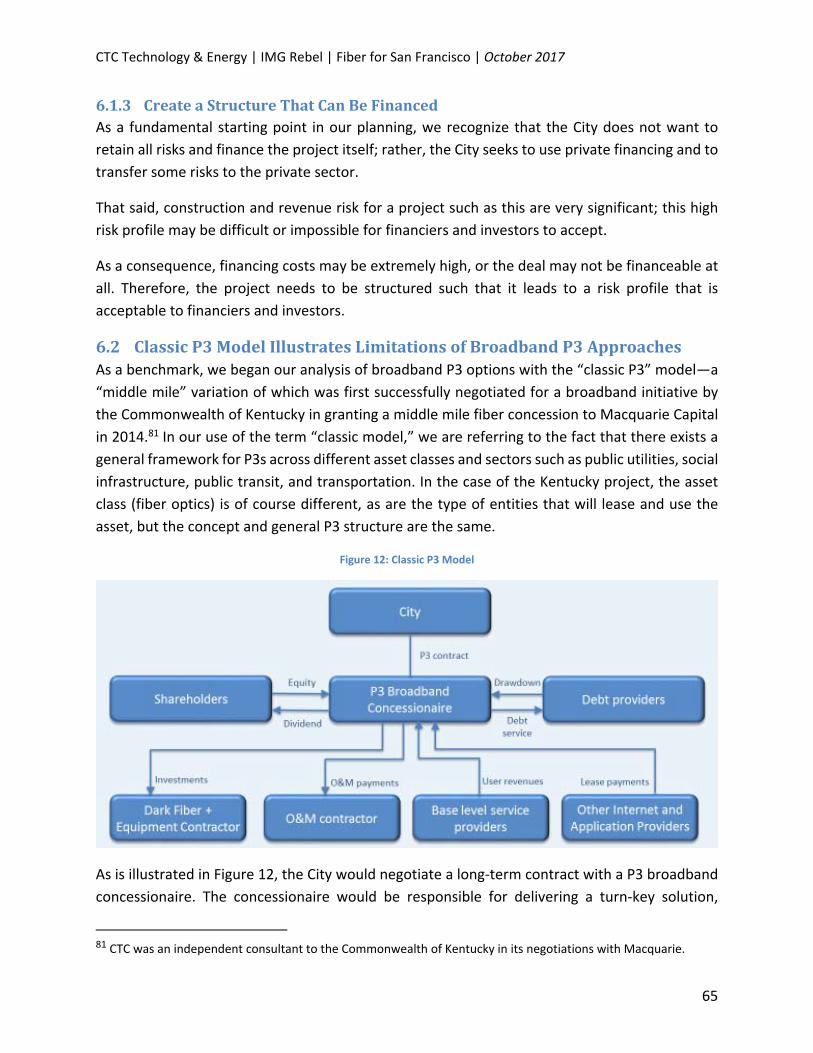
CTC Technology & Energy | IMG Rebel | Fiber for San Francisco | October 2017
65
6.1.3 CreateaStructureThatCanBeFinancedAs a fundamental starting point in our planning, we recognize that the City does not want to
retain all risks and finance the project itself; rather, the City seeks to use private financing and to
transfer some risks to the private sector.
That said, construction and revenue risk for a project such as this are very significant; this high
risk profile may be difficult or impossible for financiers and investors to accept.
As a consequence, financing costs may be extremely high, or the deal may not be financeable at
all. Therefore, the project needs to be structured such that it leads to a risk profile that is
acceptable to financiers and investors.
6.2 ClassicP3ModelIllustratesLimitationsofBroadbandP3ApproachesAs a benchmark, we began our analysis of broadband P3 options with the “classic P3” model—a
“middle mile” variation of which was first successfully negotiated for a broadband initiative by
the Commonwealth of Kentucky in granting a middle mile fiber concession to Macquarie Capital
in 2014.81 In our use of the term “classic model,” we are referring to the fact that there exists a
general framework for P3s across different asset classes and sectors such as public utilities, social
infrastructure, public transit, and transportation. In the case of the Kentucky project, the asset
class (fiber optics) is of course different, as are the type of entities that will lease and use the
asset, but the concept and general P3 structure are the same.
Figure 12: Classic P3 Model
As is illustrated in Figure 12, the City would negotiate a long‐term contract with a P3 broadband
concessionaire. The concessionaire would be responsible for delivering a turn‐key solution,
81 CTC was an independent consultant to the Commonwealth of Kentucky in its negotiations with Macquarie.

CTC Technology & Energy | IMG Rebel | Fiber for San Francisco | October 2017
66
including the outside plant infrastructure, lighting of the network, and provision of all operations
and services. In other words, the concessionaire would design, construct, finance, operate (i.e.,
deliver services to end users and/or sell capacity to competing ISPs to deliver services), and
maintain the network. The City would sponsor the infrastructure,82 but the concessionaire would
control access to it under negotiated and agreed‐upon terms with the City.
The City would achieve some of its primary goals under this model—including the construction
of a future‐proof fiber optic broadband network and delivery of services to residents and
businesses. The City’s contract with the concessionaire would also shield the City from some long‐
term project risks. The concessionaire would hold the long‐term performance risks associated
with the project, as well as revenue risks (e.g., commercial revenue from base level service
providers, lease payments from other internet and application providers).
That said, pursuing the Classic P3 Model has some shortcomings:
1. Limited competition reduces long‐term value
Because the concessionaire is completely responsible for services over the infrastructure—
delivering base level services to all households and businesses, additional retail services, and
wholesale services to service providers—this model limits competition. This is an issue for
creating a level playing field with respect to retail services, and for incentivizing a competitive
market that can effectively drive down prices for end users and offer the other benefits of
competition.
In addition, there may be limited ability to accommodate changes over time due to the long‐term
nature of P3 contracts. This may not be as important of an issue at the dark fiber level, as fiber
represents a long‐term asset and has a longer replacement life cycle. But for investments in
network equipment, operations, and service provision, the economic life of this equipment is
only seven to 10 years—which is hard to accommodate within a long‐term P3 concessionaire
model.
2. Uncertain revenues increase risk to project business case
Potential commercial revenues under this model are uncertain, due both to the unpredictable
nature of broadband equipment and network technologies and the maturity of the San Francisco
market.
In this model, for example, the concessionaire would hold risks associated with commercial
revenue from base level service providers, and lease payments from other internet and
82 The term sponsor comes from the term “Project Sponsor” which is the entity with the overall accountability for
the project. In this case, the City of San Francisco is the sponsor of the project. The City has ultimate responsibility, and is accountable to the public / taxpayers.

CTC Technology & Energy | IMG Rebel | Fiber for San Francisco | October 2017
67
application providers—which are uncertain revenue streams. This is unfavorable for the project’s
business case.
Dedicating revenue from users could reduce the revenue risk profile for the P3 concessionaire,
but would only partially mitigate the risk.
3. Risk mitigation required to attract investors and financiers
Due to the uncertain revenue streams created by this model, financing a project using this
approach would be quite challenging. It is unlikely that financiers and investors will be willing to
invest unless they would have a “quasi‐monopoly,” including rate‐setting powers, and/or some
type of contribution from the City (e.g., a guarantee, risk‐sharing mechanism, or partial payment)
to mitigate risk.
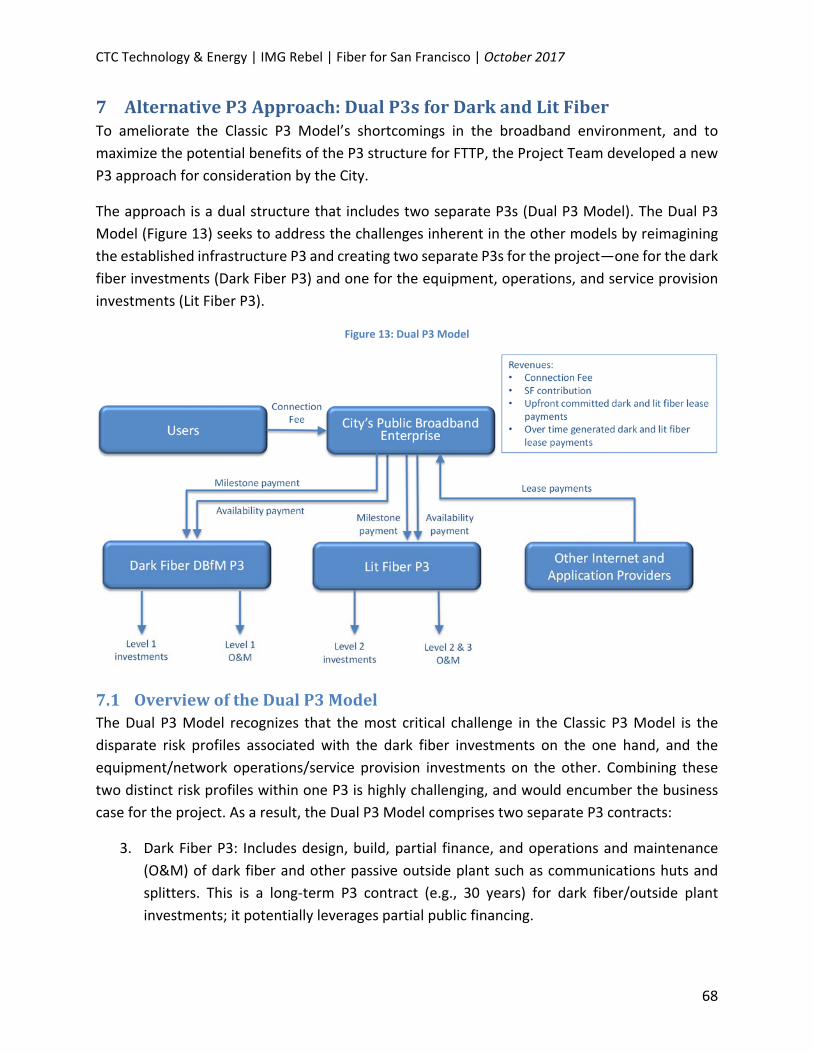
CTC Technology & Energy | IMG Rebel | Fiber for San Francisco | October 2017
68
7 AlternativeP3Approach:DualP3sforDarkandLitFiberTo ameliorate the Classic P3 Model’s shortcomings in the broadband environment, and to
maximize the potential benefits of the P3 structure for FTTP, the Project Team developed a new
P3 approach for consideration by the City.
The approach is a dual structure that includes two separate P3s (Dual P3 Model). The Dual P3
Model (Figure 13) seeks to address the challenges inherent in the other models by reimagining
the established infrastructure P3 and creating two separate P3s for the project—one for the dark
fiber investments (Dark Fiber P3) and one for the equipment, operations, and service provision
investments (Lit Fiber P3).
Figure 13: Dual P3 Model
7.1 OverviewoftheDualP3ModelThe Dual P3 Model recognizes that the most critical challenge in the Classic P3 Model is the
disparate risk profiles associated with the dark fiber investments on the one hand, and the
equipment/network operations/service provision investments on the other. Combining these
two distinct risk profiles within one P3 is highly challenging, and would encumber the business
case for the project. As a result, the Dual P3 Model comprises two separate P3 contracts:
3. Dark Fiber P3: Includes design, build, partial finance, and operations and maintenance
(O&M) of dark fiber and other passive outside plant such as communications huts and
splitters. This is a long‐term P3 contract (e.g., 30 years) for dark fiber/outside plant
investments; it potentially leverages partial public financing.

CTC Technology & Energy | IMG Rebel | Fiber for San Francisco | October 2017
69
4. Lit Fiber P3: Includes design, build, and O&M of network electronics investments, and
provision of a base‐level of service, as well as provision of wholesale services to Retail
Service Providers who will compete over the network. This is a shorter‐term P3 contract
designed to enable responsiveness to technology change and the need to replace
network electronics every seven to 10 years.
This model recognizes that the risk profile for constructing and maintaining a fiber network is
different from the risk profile associated with providing services over the long term in a
commercial broadband market. The P3 for the dark fiber/outside plant investments can be
separated from the P3 for electronic equipment, network operations, and provision of base‐level
service because interrelationships between the two are limited. This approach results in a more
explicit distinction between the dark fiber network provider and the operator/service provider
on that network, with the intent to enable more technological flexibility and competition at in
network operations and service provision.
7.1.1 PotentialParticipatingEntitiesThe Dual P3 Model assigns roles to a wide range of participants. The City and County of San
Francisco would be the sponsoring agency—providing an oversight role, and paying the
concessionaire for services to the City. The City is ultimately accountable to the residents and
taxpayers of the City, who are the intended users and beneficiaries of this project.
Residents and businesses in the City of San Francisco would fund some of the infrastructure
through some form of assessment, utility tax, property‐related fee, parcel tax, or any type of
approved revenue initiative.83 If a property‐related fee is applied, then provisioning of base‐level
services will need to be included in the P3 to justify the fee.84
A public broadband entity (Public Broadband Enterprise) would be created by the City to manage
the multiple P3 agreements, organize leasing of the assets, and oversee lease payments and
other financial transactions. This role could be taken by a City agency (existing or newly created)
or some other public entity, potentially even including (limited) private involvement.85 The Public
Broadband Enterprise could also receive users’ property‐related fees or parcel tax payments and
issue public financing, if that approach is selected. Alternatively, receipt of fees and issuance of
83 In consultation with the City Attorney’s office, the Project Team developed a matrix and business analysis of
potential funding mechanisms that is included in the appendices to this report. 84 See Section 7.3 for more detail. 85 In order to help maximize the value at the system level, it would be an option to have involvement from private
shareholders. A potential way to structure this would be to start off by selling a small percentage of the Public Broadband Enterprise’s shares. Private ownership could potentially be expanded over time (when the risk profile decreases and the value of the Public Broadband Enterprise shares is expected to increase).

CTC Technology & Energy | IMG Rebel | Fiber for San Francisco | October 2017
70
financing could be fulfilled by a non‐profit corporation that works in parallel with the Public
Broadband Enterprise.86
Internet and application service providers (ISPs and ASPs) would include any entity that makes
a payment for access to dark or lit fiber. These may include large corporations, institutions (e.g.,
universities), and service providers of a range of sizes, including some that are very small but who
are able to compete over the network by purchasing wholesale services from the Lit Fiber
Concessionaire.
The dark fiber design, build, finance, maintain (DBfM) concessionaire (Dark Fiber
Concessionaire) will provide investments in dark fiber and other outside plant assets and,
following construction, outside plant operations and maintenance (O&M).
A base‐level service concessionaire (Lit Fiber Concessionaire) will provide equipment and O&M
investments, and will deliver both base‐level services to homes and businesses and wholesale “lit
fiber” services to other ISPs. Importantly, this partner will be precluded from delivering retail
services other than base‐level services.
7.1.2 FinancialFlowsThe Dual P3 Model is similar to the Classic P3 Model in that it will include some financial features
that were crafted to address issues that are universal to the Fiber for San Francisco Initiative,
regardless of the P3 model. This model:
● Attributes a fixed partial payment from the City to the project (i.e., the City will commit
to some level of dedicated funding of the project) to mitigate the concessionaires’ high
risks of uncertain project revenues
● Provides a minimum revenue guarantee from the City
● Allows for upfront lease payments to be agreed upon by the City and other internet and
application providers
The City will be in a position to make a contribution for data services it receives from the
concessionaire and that are currently procured from other parties in the form of leased circuits.
The amount of that contribution would potentially be based on avoided costs, and while we have
not been provided data in this regard, based on experience in other cities, we estimate the
amount to be in excess of $10 million per year.
86 For more information on 63‐20 corporations, see:
http://www.financingtransportation.org/funding_financing/legislation_regulations/state_legislation/non_profit_63_20.aspx

CTC Technology & Energy | IMG Rebel | Fiber for San Francisco | October 2017
71
San Francisco’s residents and businesses will also provide some type of dedicated funding, for
both the Dark Fiber P3 and the Lit Fiber P3. If a property‐related fee is used, then provision of
base‐level services is needed to justify the fee, and provision of base‐level services will need to
be included in the P3.
The Lit Fiber Concessionaire would be responsible for a combination of equipment investments,
maintenance, and base‐level service provision. Additional financial flows include:
● City payments to the Dark Fiber Concessionaire
o Milestone payments: Payments from the public entity to the Dark Fiber
Concessionaire for the dark fiber construction
o Availability payments: Periodic payment to the Dark Fiber Concessionaire for
making the infrastructure available at agreed upon standards for the duration of
the P3 contract
● City payments to the Lit Fiber Concessionaire
o Service payment: Periodic payment to the Lit Fiber Concessionaire for providing
services at the agreed upon standards for the duration of the P3 contract
In terms of financing, we believe the Dark Fiber P3 would require partial public and partial private
financing, given the high cost of the dark fiber network. We believe that the required investments
for the Lit Fiber P3 can be delivered through private financing.
7.1.3 KeyContractualElements
7.1.3.1 Terms/periodsNo technological flexibility is necessary at for the dark fiber/outside plant because fiber
technology is not expected to be a limiting factor; therefore, a long‐term contract is suitable.
In contrast, for network equipment, operations, and service provision, a relatively short contract
term would allow for flexibility to modify standards over time to address future technological
changes. The economic life of network equipment is seven to 10 years, depending on the type of
equipment—so this P3 concession should ideally be re‐procured every seven to 10 years to
maintain technological currency. This regular revision of technical standards—and continuous
competition—will increase the likelihood that San Franciscans will receive a high quality of
service and the latest technical standards at attractive rates.
To further promote competition, the equipment that is part of the Lit Fiber P3 would be
transferred to the Public Broadband Enterprise at the end of the contract term and would be
available to the Lit Fiber Concessionaire selected for the new term; detailed information about
CTC Technology & Energy | IMG Rebel | Fiber for San Francisco | October 2017
72
the equipment and its condition would be part of the RFP for the next Lit Fiber P3 so as to enable
all bidders to build the information into their planning and bids.
7.1.3.2 ElementsAs is discussed in detail in the procurement strategy section of this report, we recommend that,
prior to launching the P3 procurements, the City undertake a leasing process to secure third party
revenues for dark fiber (and potentially lit fiber wholesale services). This approach would further
improve financial feasibility of the project and ensure a more level playing field for P3 bidders.87
7.1.3.3 Allowableactivities/generatingadditionalrevenuesIn the Dual P3 Model, concessionaires may deliver only specific services; they are prohibited from
engaging in other activities.
To maximize revenues, revenue incentives can be included in either the Lit Fiber P3 or both P3s.
P3 bidders should have an incentive to secure additional revenues during the bidding process;
securing more revenues upfront can reduce the fee or tax to be charged for establishing the fiber
network and delivering a base‐level service.
P3 concessionaires should also have an incentive to generate more revenues over time. Providing
an incentive rather than transferring all revenue risk to the P3 concessionaire will presumably
encourage the concessionaire to maximize revenue risk over time, without creating an
excessively high‐risk profile that results in very high financing costs.
7.2 HowtheDualP3ModelAddressestheProjectPrinciplesSplitting the project into two separate P3s maximizes long‐term value by increasing
competition. Having a separate Lit Fiber P3 that is re‐procured every seven to 10 years (matching
the economic life cycle of the electronics in the network) maximizes competition, creating more
long‐term value for the City. Re‐procuring the Lit Fiber P3 will also help to create a level playing
field among competing service providers, and incentivize a competitive market that can
effectively drive down prices for end users.
This model creates a feasible business case, with more certainty regarding revenue, through an
upfront sale or pre‐lease of dark fiber and other network capacity, in which the City will seek to
secure commercial revenues prior to procurement—such that all potential bidders have some
dedicated commercial revenue to include in their proposed projects. Absent this pre‐P3 sale,
potential commercial revenues (dark fiber lease fees, fees for wholesale lit access to customers)
would be highly uncertain, due both to the unpredictable nature of broadband technology
development and broadband services, as well as the relative maturity of the San Francisco
market. Splitting the project into two separate P3s also mitigates some of the risks associated
87 Section 9.1 provides detail regarding this consideration.
CTC Technology & Energy | IMG Rebel | Fiber for San Francisco | October 2017
73
with long‐term uncertainty for revenue streams by making a shorter term P3 for the Lit Fiber
portion of the project.
This model also creates a structure that can likely be financed. By separating the project into
two P3s, the recommended model also separates two distinct risk profiles—making the project
more attractive to investors and financiers, who can choose to invest in the P3 with a risk profile
most appropriate to their risk appetite. Additionally, the actions taken to create more certainty
regarding revenues can alleviate some of the pressure that financiers and investors would have
put on the project to have a “quasi‐monopoly,” including rate‐setting powers, and/or some type
of contribution from the City (e.g., a guarantee, risk‐sharing mechanism, or partial payment) to
mitigate risk.
7.3 FinancialAnalysisandModelsofDualP3As part of the analysis for the Fiber for San Francisco Initiative, the Project Team analyzed the
financial feasibility of the Dual P3 Model, based on our construction cost estimates for full FTTP
deployment. This section is a description of the financial analysis, including assumptions, and
preliminary financial results and sensitivities.
Financial feasibility analysis is typically conducted to understand the financial implications of the
project. Specifically, the financial feasibility analysis of this project seeks to answer the following
questions:
● Given the capital and operations costs for the project, what is the expected residential
fee per passing?
● Given the capital and operations costs for the project, what is the expected business fee
per passing?
● How do cost variations (for example, low‐income subsidy or increasing capital costs)
influence these fees?
● How do revenue variations (for example, from upfront commitments or from City
resources) influence these fees?
● What is the expected annual availability payment to the P3 concessionaires?
Currently, the project is at the pre‐procurement stage, where answers to the questions above
can help decision‐makers understand whether to proceed with the project. Specifically, the
expected fees per passing influence the Connection Fees. The level of the Connection Fee can
help decision‐makers understand the feasibility of this project from a political standpoint.

CTC Technology & Energy | IMG Rebel | Fiber for San Francisco | October 2017
74
The foundation of the financial feasibility analysis is a financial model that was tailor‐built for this
project—and based on a “base case” consisting of preliminary assumptions. More in‐depth
project preparations are needed, including an industry sounding and a pre‐procurement sale
process to firm up assumptions on costs, potential upfront revenues, public resources, subsidy,
financing conditions, and so on. The financial model and subsequent financial feasibility analysis
do not include an analysis of the City’s financial resources for this project.
7.3.1 High‐LevelOverviewofCashFlowsinBroadbandP3ModelOur analysis is based on the Dual P3 model, consisting of two separate P3s, as described above.88
Figure 14: Dual P3 Model
The Dual P3 Model also includes a Public Broadband Enterprise (PBE). The PBE manages the
multiple P3 agreements, organizes an upfront lease sale, and oversees lease payments and other
financial transactions. This role could be taken by a City agency (existing or newly created) or
some other public entity.
Key financial flows in this model consist of the following:
88 Dark Fiber P3: Includes design, build, partial finance, and operations and maintenance (O&M) of dark fiber and
other passive outside plant such as communications huts and splitters. This is a long‐term P3 contract (e.g., 30 years) for dark fiber/outside plant investments. Lit Fiber P3: Includes design, build, financing and O&M of network electronics investments, and provision of a base‐level of service, as well as provision of wholesale services to retail service providers who will compete over the network. This is a shorter‐term P3 contract designed to enable responsiveness to technology change and the need to replace network electronics every five to 10 years.
CTC Technology & Energy | IMG Rebel | Fiber for San Francisco | October 2017
75
● City payments to the Dark Fiber Concessionaire
o Milestone payments: Payments from the PBE to the Dark Fiber Concessionaire
for the dark fiber construction
o Availability payments: Periodic payment to the Dark Fiber Concessionaire for
making the infrastructure available at agreed upon standards for the duration of
the P3 contract
● City payments to the Lit Fiber Concessionaire
o Availability payment: Periodic payment from the PBE to the Lit Fiber
Concessionaire for providing services at the agreed upon standards for the
duration of the P3 contract
All City payments to both concessionaires will come from the PBE. The PBE will be funded
through:
● Connection Fees – the payments from households and businesses to fund the P3s, most
likely structured in the form of a property related fee, or parcel tax
● Possible service fees from the City for use of the broadband network—similar to existing
costs that the City incurs for current broadband services
Potential payments/revenues associated with this project include:
● Lease payments for dark and or lit fiber from lessees that are committed upfront via the
pre‐procurement sale
● Additional lease payments/revenues confirmed by either concessionaire
7.3.2 AssumptionsperEntity
7.3.2.1 GeneralAssumptionsThe Project Team assumes that the project will begin after an appropriate project preparation,
analysis, and procurement period. The main assumption for the base case is that the project’s
costs are funded by Connection Fees and potential additional revenues—however, these
potential additional revenues are unknown at this time. The model is currently a “flat model,”
assuming no indexing of costs or revenues for inflation.

CTC Technology & Energy | IMG Rebel | Fiber for San Francisco | October 2017
76
7.3.2.2 AssumptionsforDarkFiberP3
7.3.2.2.1 TimingConstruction of dark fiber is assumed to occur over three years. As dark fiber infrastructure is
installed, it will be made available for use. Therefore, an appropriate proportion of associated
operations and maintenance costs will be incurred as dark fiber infrastructure is installed over
the three‐year construction period. Logically, the availability payment for the dark fiber
infrastructure, made to the concessionaire, will also be provided in proportion with the
percentage of infrastructure made available. We assume a construction ramp‐up profile as
follows: year 1, 30 percent; year 2, 50 percent; year 3, 20 percent. The operations period of the
infrastructure is 30 years from completion of construction.
7.3.2.2.2 CapitalExpendituresFor the base case used in this financial feasibility analysis, the total estimated capital expenditure
is approximately $1.5 billion. These costs represent the equipment, material, and construction
labor associated with building, and implementing a dark fiber network.
Table 17: Base Case Dark Fiber P3 Capital Expenditure
Dark Fiber P3
Capital Expenditure Elements
Description Base Case
Cost
Outside plant
Engineering, QA/QC, general outside plant construction, special crossings, backbone and distribution plant splicing, backbone hub, termination, and testing, FTTP service drop and lateral installations.
$776 million
Customer premises equipment
Assumes residential drops (354,807 passings) and business drops (18,674 passings)
$728 million
7.3.2.2.3 OperationalExpendituresOperations expenditures for the dark fiber infrastructure have various timing profiles. Some
operational expenditures are linked to the ramp up profile of the capital expenditures (for
example, for fiber and network maintenance), while others are linked to a separate ramp‐up
profile: year 1, 50 percent; year 2, 50 percent (for example, for office expenses). Annual
operations cost after construction is approximately $23 million. This includes labor, insurance,
offices, facilities lease, locates and ticket processing, contingency, fiber and network
maintenance, legal, consulting, education and training, and pole attachments.

CTC Technology & Energy | IMG Rebel | Fiber for San Francisco | October 2017
77
7.3.2.2.4 RevenuesRevenues for the Dark Fiber P3 consist of two main sources, milestone payments during
construction, and availability payments as the dark fiber infrastructure is made available. For the
base case, the Project Team assumed two milestone payments at the end of the second and third
year of construction, totaling $1.4 billion. This assumption was made based on the Project Team’s
professional judgement that the P3 market would expect that the milestone payment from the
City would fund approximately 90 percent of capital cost.89
Availability payments will be transmitted to the Dark Fiber Concessionaire from the PBE. It is
optimized to cover for all costs, except for the majority of construction—which is covered with
the milestone payments as described above. Availability payments will commence in year 1, as
30 percent of the dark fiber network is deployed, and will ramp up to full payment of $36 million,
in line with the capital expenditure ramp‐up profile.
For the base case, no additional lease payments from lessees, or additional payments from the
City are assumed.
7.3.2.2.5 FinancingBased on the Project Team’s experience with P3 transactions in other sectors, we expect that the
market will be receptive to a broadband infrastructure project that features partial public and
partial private financing—meaning that the public sector will fund a portion of the capital cost of
the project. Based on experiences in other P3 projects, the Project Team anticipates that the
public sector can fund approximately 90 percent of the capital cost of the project while still
enjoying the benefits of private financing related to effective risk transfer and performance
incentives. As such, we have assumed milestone payments from the PBE to the Dark Fiber
Concessionaire equal to 90 percent of the capital cost.
Private financing for P3 projects typically comprises of a combination of private equity and debt.
Based on the Project Team’s experience with other P3 projects, we expect that the private
finance structure will be highly leveraged, with 90 percent debt and 10 percent equity in the base
case. The Project Team anticipates that the Dark Fiber P3 concessionaire will use a bridge loan to
meet the portion of the financing that will be repaid with milestone payments.
7.3.2.3 AssumptionsforLitFiberP3
7.3.2.3.1 TimingThe Lit Fiber P3 concession is assumed to have a seven‐year contract duration—with subsequent
Lit Fiber P3 procurements. For this financial analysis, the Project Team chose to model only the
first lit fiber concession because it is difficult to predict market expectations and assumptions
89 Please see Section 7.3.2.2.5 for a detailed explanation.

CTC Technology & Energy | IMG Rebel | Fiber for San Francisco | October 2017
78
seven years into the future for a market such as broadband that has such fast‐changing
technological requirements.
Construction of lit fiber infrastructure is assumed to begin in 2020, one year after the Dark Fiber
P3 starts, with a two‐year construction duration. As dark fiber infrastructure is installed, it will be
made available for use—and the Lit Fiber Concessionaire will follow with its construction
accordingly. Therefore, an appropriate proportion of associated operations and maintenance
costs will be incurred as the lit fiber infrastructure is installed over the two‐year construction
period.
The operations period of the infrastructure is five years from completion of construction—
totaling to a seven‐year contract duration.
7.3.2.3.2 CapitalExpendituresFor the base case used in this financial feasibility analysis, the total estimated capital expenditure
for the Lit Fiber P3 is approximately $360 million. These costs represent the equipment, material,
and labor associated with building and implementing lit fiber infrastructure over dark fiber.
Table 18: Base Case Lit Fiber P3 Capital Expenditure
Lit Fiber P3
Capital Expenditure Elements Description
Base Case Cost
Network equipment Core network equipment, distribution and access equipment (GPON)
$112 million
Last mile and customer premises equipment
CPE for residential, CPE for businesses, and additional annual replacement capital
$247 million
Reinvestments and major maintenance of the lit fiber infrastructure is implicitly included by using
the same availability payment that is required to completely recover the investments in the first
contract term for subsequent contracts. This allows for the complete renewal of the lit fiber
infrastructure every seven years.
7.3.2.3.3 OperationalExpendituresOperations expenditures for the lit fiber infrastructure is assumed to start in 2020, one year after
the commencement of the dark fiber contract. We assume a ramp‐up profile as follows: 2020 –
50 percent, and 2021 – 50 percent.
Annual operations costs after construction is estimated to be approximately $21 million. This
includes labor, insurance, utilities, office expenses, facility leases, locates and ticket processing,
contingency, legal fees, consulting fees, education and training, and vendor maintenance
contracts.

CTC Technology & Energy | IMG Rebel | Fiber for San Francisco | October 2017
79
7.3.2.3.4 RevenuesRevenues for the Lit Fiber P3 consist of two main sources: milestone payments during
construction, and availability payments as the lit fiber service is made available. For the base
case, the Project Team assumed two milestone payments at the end of each construction year,
totaling $147 million. This assumption was made based on the Project Team’s professional
judgement that the P3 market would expect that the milestone payments from the City would
fund approximately 50 percent of capital cost.90
Availability payments for the lit fiber infrastructure and service will also be provided in proportion
with the percentage of infrastructure made available, commencing in 2020 with 50 percent of
the availability payment, further ramping up to the full availability payment in year 2021.
For the base case, neither additional lease payments from lessees, nor additional payments from
the City, are assumed.
7.3.2.3.5 FinancingJust like for the Dark Fiber P3, we expect that the market will be receptive to a Lit Fiber P3 project
that features partial public and partial private financing—meaning that the public sector will fund
a portion of the capital cost of the project. Because the Lit Fiber P3 has a shorter duration, and
lower capital costs, the Project Team anticipates that approximately 50 percent of the capital
cost of the project will need to be funded by the public sector, and as such we have assumed
milestone payments from the PBE to the Lit Fiber Concessionaire equal to 50 percent of the
capital cost.
Private financing for P3 projects typically comprise a combination of private equity and debt.
Based on the Project Team’s experience with other P3 projects, we expect that the private
finance structure will be leveraged with approximately 90 percent debt, 10 percent equity. Other
financing conditions are assumed to be similar to transactions with a very similar risk profile that
the Project Team has observed in comparable P3 sectors.
7.3.2.4 AssumptionsforPublicBroadbandEntityThe PBE manages the multiple P3 agreements, organizes the fiber leasing process, and oversees
lease payments and other financial transactions. This role could be taken by a City agency
(existing or newly created) or some other public entity. The PBE could also receive users’
property‐related fees or parcel tax payments and issue public financing, if that approach is
selected. Alternatively, receipt of fees and issuance of financing could be fulfilled by a non‐profit
corporation that works in parallel with the PBE. Therefore, this entity will not incur any capital
90 A detailed explanation can be found in Section 7.3.2.2.5.

CTC Technology & Energy | IMG Rebel | Fiber for San Francisco | October 2017
80
expenditure, but will have operational expenditures and revenues, as detailed in the following
sections.
7.3.2.4.1 OperationalExpendituresOperational expenditures for the PBE include three categories of costs: payments to the P3
concessionaires, operations costs, and cost of subsidies for target populations. Payments to the
P3 concessionaries include: milestone payments to both Dark Fiber and Lit Fiber Concessionaires,
availability payments for the Dark Fiber P3, and availability payments for the Lit Fiber P3.
Currently, operational costs for running this department or entity (e.g., labor costs) have not
been included due to lack of information. This information should be included in future updates
of the analysis and include costs for staffing, running the department, collecting fees, and so on.
The overall project includes subsidies for target populations. The base case assumption is that 15
percent of residential passings are eligible for subsidy. In order to provide subsidies that can bring
the residential Connection Fee down to $10 per month, the PBE will need to provide $486
annually per each eligible residential passing. The annual cost of the subsidy at full deployment
is approximately $26 million.
7.3.2.4.2 RevenuesRevenues for the PBE are anticipated to include Connection Fee revenue, additional lease
revenues, and contributions from the City. However, for this base case, the Project Team has only
included Connection Fee revenue, as additional lease revenues, and contributions from the City
are unknown at this point.
Connection Fee revenue is anticipated to net $266 million per year by year 4 (full operations).
Connection Fees are anticipated to be implemented in the form of dedicated revenue provided
by the City—and are accounted for as a per passing fee. The total number of residential passings
assumed is 345,807.
Business passing fees were estimated using the assumptions shown in Table 19 below. For
business passings, there is an additional assumption of 2 percent bad debt (inability to collect the
Connection Fee).

CTC Technology & Energy | IMG Rebel | Fiber for San Francisco | October 2017
81
Table 19: Base Case Business Passing Fee Assumptions
Maximum number
of employees No. of passings
Multiplier
(%)
4 24,478 100
9 9,445 150
19 4,375 200
49 2,373 300
99 827 300
249 478 500
499 150 500
999 54 700
4,999 66 1,000
9,999 6 1,000
9,999 and above 13 1,000
7.3.2.4.3 FinancingThe Project Team anticipates that the City will need to issue bond financing in order to meet its
substantial obligations in the early years of the project due to the milestone payments for capital
expenditures to the two P3 concessionaires. Based on the Project Team’s experience as financial
advisors for both municipal governments, and P3 transactions, the Project Team anticipates that
the bond issuance associated with this project can, and should, be structured as a revenue bond.
This is due to the assumption that Connection Fees structured as parcel taxes or property taxes
will be dedicated to the repayment of this bond.
The bond service duration is assumed to be 27 years, with major drawdowns in years 2 and 3 of
the project in order to pay milestone payments. As is typical of revenue bonds, we assume 3.5
percent interest, and minimum DSCR of 1.2.
Currently, the Project Team does not anticipate that a debt service reserve account is needed
due to the significant cushion that the Connection Fee provides.
7.3.3 ResultsOne key financial output of the business case for this FTTP initiative is the Connection Fee that
will be required to make the project feasible. Financial indicators that inform that output are the
payments that the P3 concessionaires will need to cover their investments and operational
expenses, meet their financing obligations, and make an appropriate return on equity vis‐à‐vis
the various project risks that they are accepting under the P3 agreements.
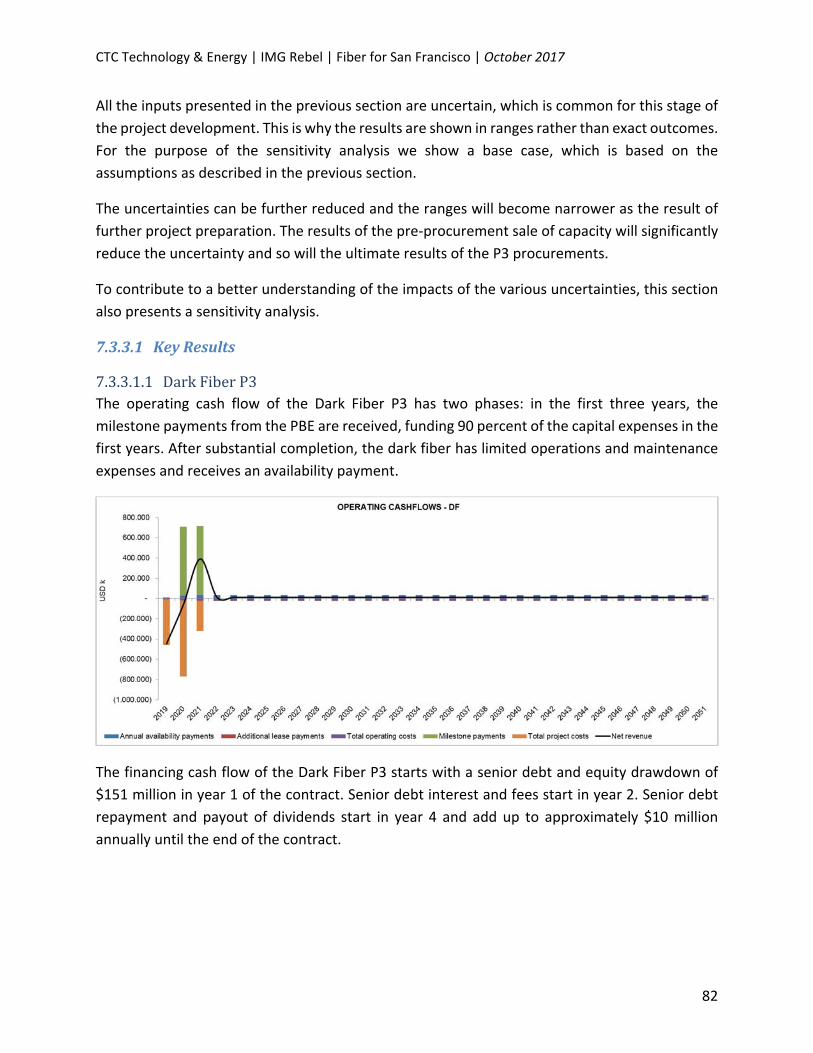
CTC Technology & Energy | IMG Rebel | Fiber for San Francisco | October 2017
82
All the inputs presented in the previous section are uncertain, which is common for this stage of
the project development. This is why the results are shown in ranges rather than exact outcomes.
For the purpose of the sensitivity analysis we show a base case, which is based on the
assumptions as described in the previous section.
The uncertainties can be further reduced and the ranges will become narrower as the result of
further project preparation. The results of the pre‐procurement sale of capacity will significantly
reduce the uncertainty and so will the ultimate results of the P3 procurements.
To contribute to a better understanding of the impacts of the various uncertainties, this section
also presents a sensitivity analysis.
7.3.3.1 KeyResults
7.3.3.1.1 DarkFiberP3The operating cash flow of the Dark Fiber P3 has two phases: in the first three years, the
milestone payments from the PBE are received, funding 90 percent of the capital expenses in the
first years. After substantial completion, the dark fiber has limited operations and maintenance
expenses and receives an availability payment.
The financing cash flow of the Dark Fiber P3 starts with a senior debt and equity drawdown of
$151 million in year 1 of the contract. Senior debt interest and fees start in year 2. Senior debt
repayment and payout of dividends start in year 4 and add up to approximately $10 million
annually until the end of the contract.

CTC Technology & Energy | IMG Rebel | Fiber for San Francisco | October 2017
83
The expected milestone payments and availability payments that the Dark Fiber P3
Concessionaire needs to make its business case work are the following:
Table 20: Estimated Dark Fiber P3 Milestone Payment and Availability Payment
Output Base Case Range
Dark Fiber Milestone Payment $1.358 billion $1.087 billion –
$1.629 billion
Dark Fiber Availability Payment $36 million/year $27 million/year –
$45 million/year
As Table 20 illustrates, a $1.36 billion milestone payment at substantial completion (i.e., paid in
years 2 and 3), in combination with annual availability payments of $36 million for 30 years,
would cover all of the project costs (including the subsidy) under the base case assumptions.
Because these results are uncertain (which is typical for this stage of project development), the
sensitivity analysis shows the likely range of required payments, based on the main uncertainties.
Under the most conservative, worst‐case scenario, a milestone payment of $1.63 billion in
combination with annual availability payments of $45 million would cover all of the project costs.
The Project Team developed the two‐part payment approach (i.e., a milestone payment in
combination with an availability payment) to optimize the project’s financing structure. Covering
all of the project costs without the milestone payment, for example, would require an annual
availability payment of $129 million over 30 years under the base case scenario. Under the most
conservative, worst‐case scenario, the required annual availability payment would be $173
million. In both of these scenarios, the City would face significantly higher financing costs.

CTC Technology & Energy | IMG Rebel | Fiber for San Francisco | October 2017
84
7.3.3.1.2 LitFiberP3Operating cash flow of the Lit Fiber P3 starts in year 2 of the project. In the first two years,
milestone payments are received, financing 50 percent of the capital expenditures of this P3
contract. Availability payments start in year 2, ramping up to the full $62 million in year 3, then
continuing throughout the rest of the contract period. Operating costs ramp up in year 1 and 2
of the contract (year 2 and 3 of the project period) and stabilize at $21 million until the end of
the contract period.
The financing cashflow of the Lit Fiber P3 is characterized by two years of drawdowns of equity
and debt, with minor interest payments for senior debt, followed by five years of outflows in the
form of interest, debt repayment, and dividends. In year 1 of the contract, $101 million in senior
debt and $40 million in equity are drawn down to finance capital expenditures. These payments
peak in year 4 of the contract at $76 million, followed by three years of combined payments of
about $38 million.
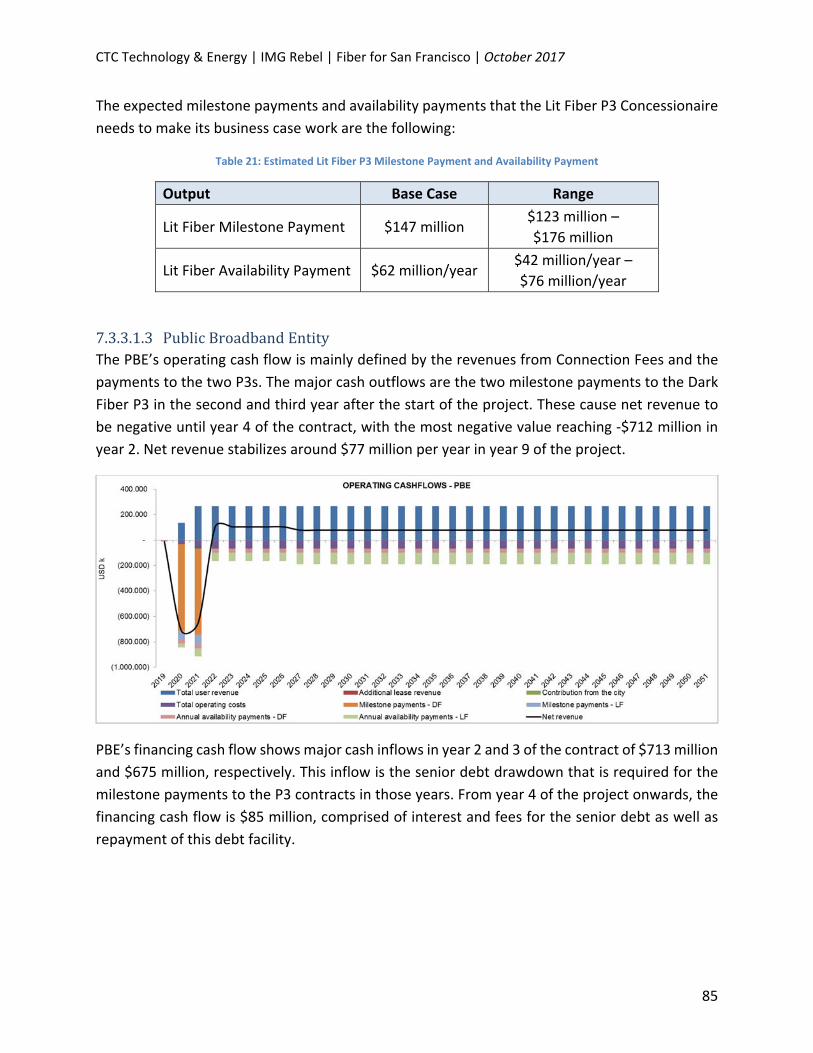
CTC Technology & Energy | IMG Rebel | Fiber for San Francisco | October 2017
85
The expected milestone payments and availability payments that the Lit Fiber P3 Concessionaire
needs to make its business case work are the following:
Table 21: Estimated Lit Fiber P3 Milestone Payment and Availability Payment
Output Base Case Range
Lit Fiber Milestone Payment $147 million $123 million –
$176 million
Lit Fiber Availability Payment $62 million/year $42 million/year –
$76 million/year
7.3.3.1.3 PublicBroadbandEntityThe PBE’s operating cash flow is mainly defined by the revenues from Connection Fees and the
payments to the two P3s. The major cash outflows are the two milestone payments to the Dark
Fiber P3 in the second and third year after the start of the project. These cause net revenue to
be negative until year 4 of the contract, with the most negative value reaching ‐$712 million in
year 2. Net revenue stabilizes around $77 million per year in year 9 of the project.
PBE’s financing cash flow shows major cash inflows in year 2 and 3 of the contract of $713 million
and $675 million, respectively. This inflow is the senior debt drawdown that is required for the
milestone payments to the P3 contracts in those years. From year 4 of the project onwards, the
financing cash flow is $85 million, comprised of interest and fees for the senior debt as well as
repayment of this debt facility.
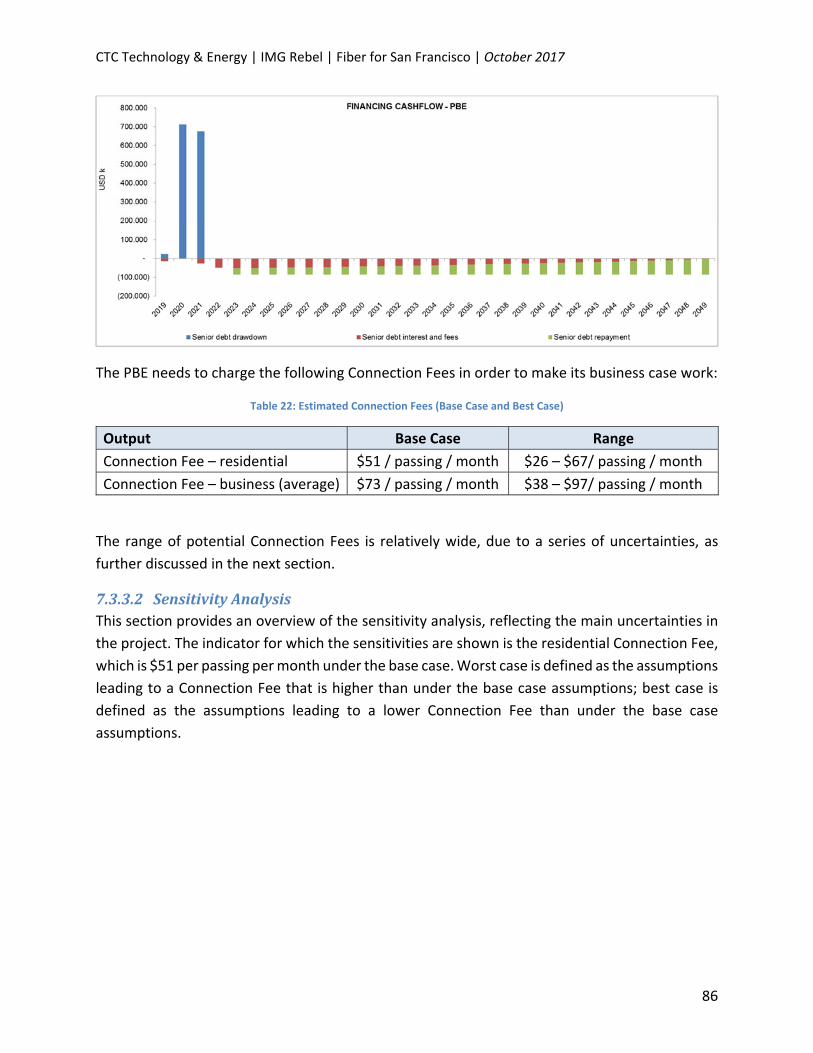
CTC Technology & Energy | IMG Rebel | Fiber for San Francisco | October 2017
86
The PBE needs to charge the following Connection Fees in order to make its business case work:
Table 22: Estimated Connection Fees (Base Case and Best Case)
Output Base Case Range
Connection Fee – residential $51 / passing / month $26 – $67/ passing / month
Connection Fee – business (average) $73 / passing / month $38 – $97/ passing / month
The range of potential Connection Fees is relatively wide, due to a series of uncertainties, as
further discussed in the next section.
7.3.3.2 SensitivityAnalysisThis section provides an overview of the sensitivity analysis, reflecting the main uncertainties in
the project. The indicator for which the sensitivities are shown is the residential Connection Fee,
which is $51 per passing per month under the base case. Worst case is defined as the assumptions
leading to a Connection Fee that is higher than under the base case assumptions; best case is
defined as the assumptions leading to a lower Connection Fee than under the base case
assumptions.
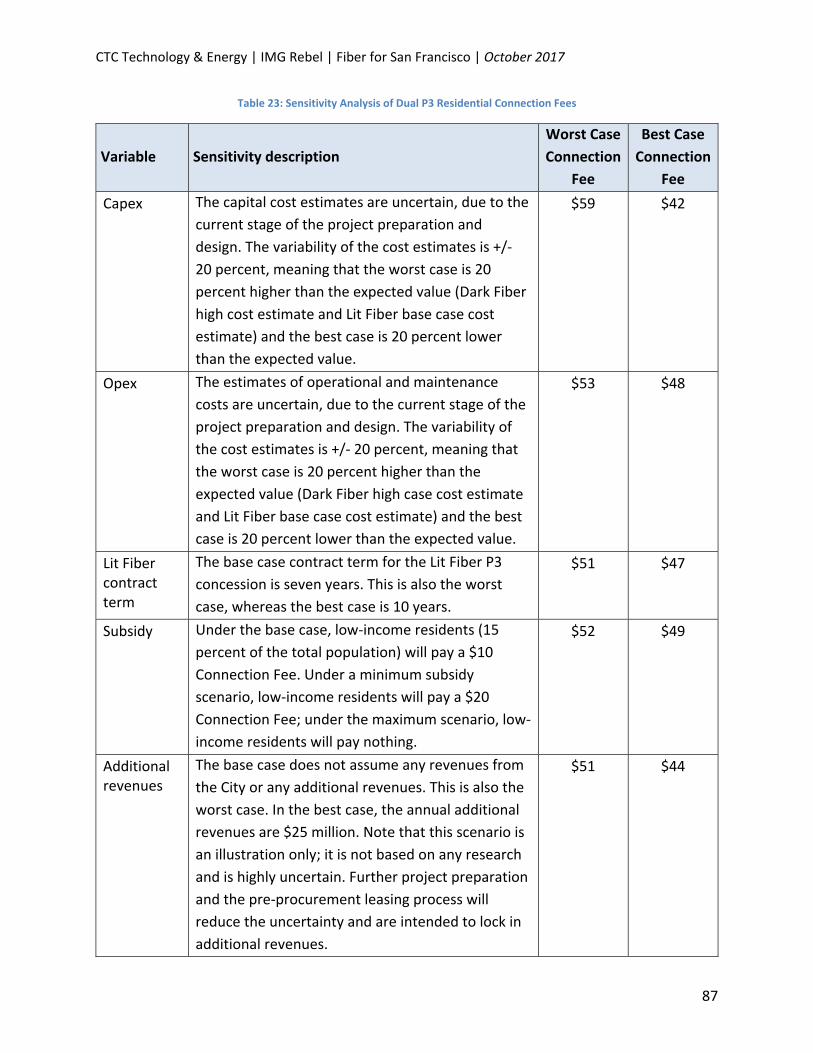
CTC Technology & Energy | IMG Rebel | Fiber for San Francisco | October 2017
87
Table 23: Sensitivity Analysis of Dual P3 Residential Connection Fees
Variable Sensitivity description
Worst Case
Connection
Fee
Best Case
Connection
Fee
Capex The capital cost estimates are uncertain, due to the
current stage of the project preparation and
design. The variability of the cost estimates is +/‐
20 percent, meaning that the worst case is 20
percent higher than the expected value (Dark Fiber
high cost estimate and Lit Fiber base case cost
estimate) and the best case is 20 percent lower
than the expected value.
$59 $42
Opex The estimates of operational and maintenance
costs are uncertain, due to the current stage of the
project preparation and design. The variability of
the cost estimates is +/‐ 20 percent, meaning that
the worst case is 20 percent higher than the
expected value (Dark Fiber high case cost estimate
and Lit Fiber base case cost estimate) and the best
case is 20 percent lower than the expected value.
$53 $48
Lit Fiber contract term
The base case contract term for the Lit Fiber P3
concession is seven years. This is also the worst
case, whereas the best case is 10 years.
$51 $47
Subsidy Under the base case, low‐income residents (15
percent of the total population) will pay a $10
Connection Fee. Under a minimum subsidy
scenario, low‐income residents will pay a $20
Connection Fee; under the maximum scenario, low‐
income residents will pay nothing.
$52 $49
Additional revenues
The base case does not assume any revenues from
the City or any additional revenues. This is also the
worst case. In the best case, the annual additional
revenues are $25 million. Note that this scenario is
an illustration only; it is not based on any research
and is highly uncertain. Further project preparation
and the pre‐procurement leasing process will
reduce the uncertainty and are intended to lock in
additional revenues.
$51 $44
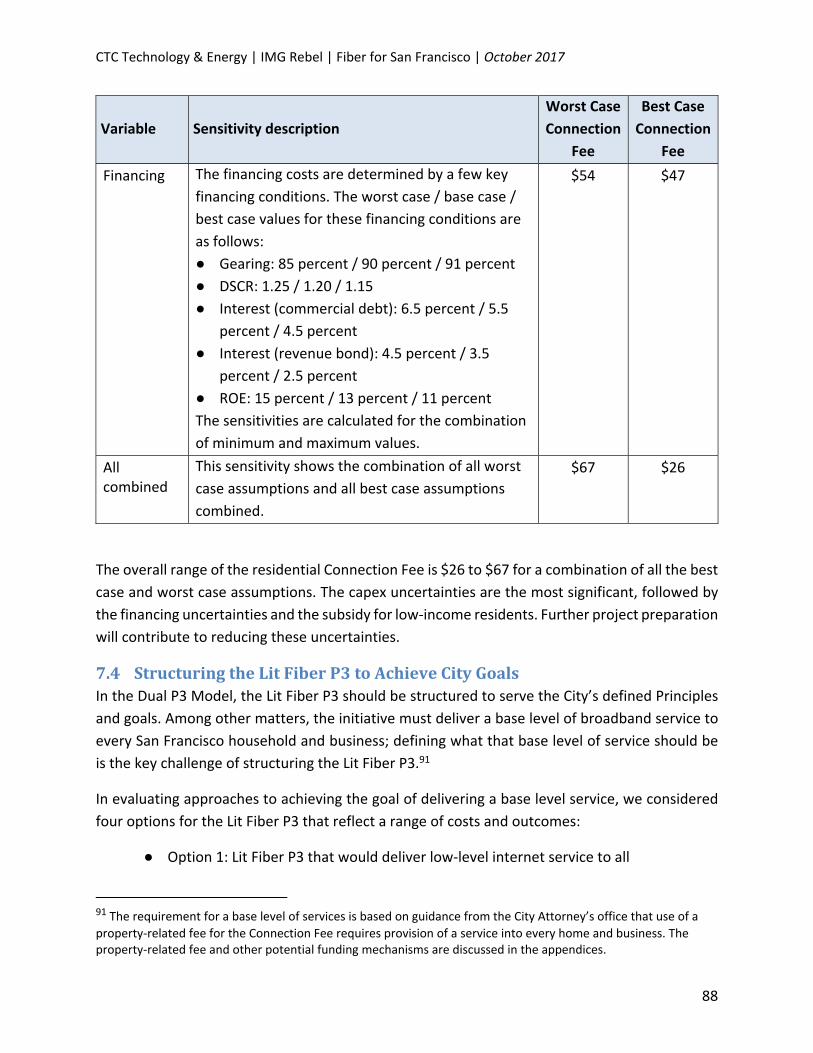
CTC Technology & Energy | IMG Rebel | Fiber for San Francisco | October 2017
88
Variable Sensitivity description
Worst Case
Connection
Fee
Best Case
Connection
Fee
Financing The financing costs are determined by a few key
financing conditions. The worst case / base case /
best case values for these financing conditions are
as follows:
● Gearing: 85 percent / 90 percent / 91 percent
● DSCR: 1.25 / 1.20 / 1.15
● Interest (commercial debt): 6.5 percent / 5.5
percent / 4.5 percent
● Interest (revenue bond): 4.5 percent / 3.5
percent / 2.5 percent
● ROE: 15 percent / 13 percent / 11 percent
The sensitivities are calculated for the combination
of minimum and maximum values.
$54 $47
All combined
This sensitivity shows the combination of all worst
case assumptions and all best case assumptions
combined.
$67 $26
The overall range of the residential Connection Fee is $26 to $67 for a combination of all the best
case and worst case assumptions. The capex uncertainties are the most significant, followed by
the financing uncertainties and the subsidy for low‐income residents. Further project preparation
will contribute to reducing these uncertainties.
7.4 StructuringtheLitFiberP3toAchieveCityGoalsIn the Dual P3 Model, the Lit Fiber P3 should be structured to serve the City’s defined Principles
and goals. Among other matters, the initiative must deliver a base level of broadband service to
every San Francisco household and business; defining what that base level of service should be
is the key challenge of structuring the Lit Fiber P3.91
In evaluating approaches to achieving the goal of delivering a base level service, we considered
four options for the Lit Fiber P3 that reflect a range of costs and outcomes:
● Option 1: Lit Fiber P3 that would deliver low‐level internet service to all
91 The requirement for a base level of services is based on guidance from the City Attorney’s office that use of a
property‐related fee for the Connection Fee requires provision of a service into every home and business. The property‐related fee and other potential funding mechanisms are discussed in the appendices.

CTC Technology & Energy | IMG Rebel | Fiber for San Francisco | October 2017
89
● Option 2: Lit Fiber P3 that would deliver robust, higher‐speed internet service to all
● Option 3: Lit Fiber P3 that would deliver robust, higher‐speed internet service to
low‐income residents
● Option 4: Lit Fiber P3 that would deliver universal access to a high‐speed Civic
Network, with internet provided not by the Lit Fiber Concessionaire but rather by
ISPs
The City’s goals for openness and competition are best served by Option 4—which would include
robust access to a high‐speed Civic Network for every household and business in the City. At the
same time, the Lit Fiber Concessionaire would provide wholesale access to competing ISPs that
would make possible robust competition with very low start‐up costs for ISPs that choose to
provide retail services over the network lit up by the Lit Fiber Concessionaire. This approach is
new and untested in a U.S. city the size of San Francisco, but has the potential to achieve the
City’s key goals (including equity, competition, civic opportunity, and innovation) while avoiding
some of the significant pitfalls and financial failings of the other approaches.
In the sections below, we describe the pros and cons of each option, and the analysis that led to
our recommendation.
7.4.1 Option1:Low‐LevelInternetServicetoAllThe first option we considered would require the Lit Fiber Concessionaire to deliver a low‐level
internet service (i.e., at a level lower than BLA’s recommended 25 Mbps downstream, 3 Mbps
upstream) to every home and business in the City. Achieving equity through ubiquity, this
approach makes a direct connection between the Connection Fee and service; every property
owner would pay a fee, and every household and business would receive service.
This approach presents two benefits in terms of the City’s goals for market‐based competition.
First, the lit network would serve as a platform for the Lit Fiber Concessionaire to sell wholesale
services to competing retail ISPs. Second, because a low‐level internet service would be slower
than many higher‐income residents’ current services, it would be unlikely to satisfy those users
and thus would be unlikely to take significant market share from the competing ISPs.
Those competitive benefits, however, are largely overshadowed by several negative aspects of
delivering a low‐level internet service to every home and business. First, given the high cost of
deploying the proposed broadband infrastructure, this option would be an expensive mechanism
for delivering a largely inconsequential service for many residents. Second, many of the lower
income residents who might benefit from this service may already be eligible for low‐cost, low‐
bandwidth programs such as Comcast’s Internet Essentials program—so this option would
duplicate an existing service. Finally, because the service would be low‐level, it would not deliver

CTC Technology & Energy | IMG Rebel | Fiber for San Francisco | October 2017
90
the transformative benefits of “true” broadband to the very citizens, those of lower‐income, that
the Fiber for San Francisco Initiative is designed to support.
7.4.2 Option2:RobustHigh‐SpeedInternetServicetoAllRecognizing that the low‐level service considered in Option 1 would not deliver the benefits of
true broadband to the City’s low‐income residents, we next considered delivering robust internet
service to every home and business. In this scenario, the Lit Fiber Concessionaire would serve
each resident and business with at least 25/3 service, the level of service recommended by the
Budget and Legislative Analyst and that meets the FCC’s definition of broadband.
Like Option 1, this option would deliver a service to every resident and business—achieving
equity and making the case for a property‐related fee. By increasing the minimum speed of the
base‐level service, this option would provide “true” broadband to low‐income residents. The
base‐level service would be an improvement over Comcast’s and AT&T’s low‐cost, low‐
bandwidth programs, rather than a duplication.
But delivering robust internet service to every resident and business would have negative
consequences for the competitive market. Because it would be robust, this base‐level service
would likely satisfy many users—who would then be unlikely to pay for higher‐level service from
the competing ISPs that lease access on the platform lit by the Lit Fiber Concessionaire. By
eroding the potential market for ISPs, this option would dramatically change the economic
prospects for the network.
7.4.3 Option3:Robust,High‐SpeedInternetServicetoLow‐IncomeResidentsIn our analysis of Option 2, we found that providing a robust internet service to all passings would
achieve equity in terms of the benefits of true broadband, but would make much more
challenging the project’s potential to enable new competition and generate related income.
Drawing a distinction between residents who can afford to buy robust broadband and those who
cannot, we then looked at the effects of delivering robust internet as a base‐level service only to
low‐income residents. Higher‐income residents and business passings would pay the Connection
Fee but would not receive a base‐level service.
This option ameliorates some of the shortcomings of Option 1 and Option 2. Most importantly,
in terms of equity, lower‐income residents would receive the kind of high‐bandwidth broadband
service that is prioritized by the Fiber for San Francisco Initiative, and the benefits that come with
that level of service. And in terms of the business model, the potential market for competing
retail ISPs would not be diminished, because higher‐income residents would not be receiving a
service. That said, Option 3 has some significant shortcomings. Like Option 1, it would represent
an extremely expensive means of delivering service to lower‐income residents. And because
higher‐income residents and businesses would not be receiving any base‐level service, the

CTC Technology & Energy | IMG Rebel | Fiber for San Francisco | October 2017
91
sources of funding for the Connection Fee might be reduced because not all payers of the Fee
are receiving a direct service.
7.4.4 Option4:RobustCivicNetworkServicetoAllIn our P3 analysis, we determined that separating the network layers (dark fiber infrastructure in
one P3, lit service in another) would solve some of the fundamental issues in terms of the Fiber
for San Francisco Initiative’s risk profiles and financial projections. Similarly, this option solves the
puzzle of providing a base‐level service by treating infrastructure and internet service as separate
issues.
In this option, as in the first three options above, a Dark Fiber Concessionaire would construct
infrastructure to pass every residence and business in the City. A Lit Fiber Concessionaire would
light the fiber and sell wholesale access to competing ISPs.
Where this option diverges from those other approaches is in the definition of the base‐level
service. Rather than choosing an internet service level, this option envisions delivering 1 Gbps
intranet access to every home and business and thereby creating a Civic Network that would
connect all San Francisco residents and businesses to civic, educational, health care, and non‐
profit resources. Residents and businesses can also choose to purchase retail services (from
competing providers that would buy wholesale service from the Lit Fiber Concessionaire), in
addition to the free, high‐bandwidth access to the Civic Network.
To address the issues of affordability and equity, the City could provide a subsidy to low‐income
residents to purchase retail internet service—though we note that service fees may be very low
under this scenario because the technical configuration would make it easy and cheap for many
retail service providers to compete over the network.
This option checks the boxes on both the City’s priorities and the primary benefits achieved in
the other options. It would ensure ubiquitous access and, thus, would deliver value for the
Connection Fee. It would also make the dark fiber infrastructure a platform the Lit Fiber
Concessionaire to sell wholesale services to competing retail service providers—and would
maintain the market for those providers.
7.4.5 TechnicalDescriptionofthePotentialCivicNetworkIn the Option 4 scenario, the Lit Fiber Concessionaire would design and operate a Civic Network
which will be made available at no extra charge to subscribers connected to the City’s FTTP
network.92 This service will provide access to certain resources to be made available by the City
as well as a self‐service portal, to be operated by the Lit Fiber Concessionaire, which will allow
92 A detailed technical description of the functioning of the Civic Network and the potential to enable robust open
access and competition over the network is included in the appendices to this report.

CTC Technology & Energy | IMG Rebel | Fiber for San Francisco | October 2017
92
subscribers to sign up for services offered by RSPs. Access to the City’s Civic Network should be
provisioned to a subscriber port via an EVC in the same way that retail services are provisioned.
The self‐service portal will act as a virtual storefront for services being offered on the City FTTP
network. The Lit Fiber Concessionaire will be responsible for developing and operating a backend
service which will allow RSPs to list their available services and pricing and a frontend service
which will allow subscribers to select those services. Depending on the service requested, the
portal should either trigger an automated process which will provision the requested service to
the subscriber port and alert the RSP to being billing, or should automatically create a service
request which will be sent to the Lit Fiber Concessionaire NOC and the RSP so provisioning and
billing services and be performed by the respective entities.
The City’s Civic Network will be made available to all subscribers on the FTTP network regardless
of whether they subscribe to retail services. Because different EVCs on the network are
separated, with traffic for each EVC being routed by each RSP or the Civic Network, a subscriber
receiving two or more service EVCs would need to have each service delivered on a separate
physical port or on different VLANs over the same port. This may be a reasonable situation for
subscribers who run their own business‐class routers and switches, but would be too complex
for most residential subscribers and many business subscribers.
In order to provide easy access to the City’s Civic Network for subscribers who also subscribe to
a retail service, the agreement with RSPs should require a no‐cost interconnection with the City’s
Civic Network. This will allow subscriber traffic destined for the City’s Civic Network to be routed
over the RSP’s network. (See Figure 15.)
Figure 15: FTTP Subscribers Can Access Civic Network Directly or via an RSP's Network
CTC Technology & Energy | IMG Rebel | Fiber for San Francisco | October 2017
93
8 SingleDarkFiberP3ApproachThis option envisions a markedly different approach to the entire Fiber for San Francisco
Initiative. In contrast to the Dual P3 Model, in this alternative approach the City would enter into
a single P3 for dark fiber only (Single Dark Fiber P3) and play no financial or operational role in
how the fiber is lit or services provided over it. Rather, the City would focus its efforts on enabling
competition at the dark fiber layer. It would execute a Dark Fiber concession and the Public
Broadband Enterprise or the Concessionaire would then lease dark fiber on a wholesale access
to competing ISPs. The ISPs would light the fiber and sell retail services to any interested residents
or businesses.
8.1 BenefitsSo long as a market emerges for dark fiber leases that would enable new competition, a Single
Dark Fiber P3 Model offers greater simplicity, lower cost, and—potentially—reduced
controversy.
8.1.1 ReducedComplexityandCostWith a Single Dark Fiber P3, the City would spend dramatically less because it would not take on
the financial commitment necessary for a Lit Fiber Concession. As the financial analysis for the
Dual P3 Model demonstrates, the Connection Fee for the Lit Fiber P3 is considerable.93 If that
component is removed and the Connection Fee is limited to the Dark Fiber P3 only, the revenue
necessary to support the model is greatly reduced.
Developing a Single Dark Fiber P3 only also reduces complexity and administrative burden for the
City. Unlike lit services and equipment, dark fiber is a stable, predictable asset. It is an infinitely
scalable, long life, future‐proof asset that will continue to be usable and useful over 30 years or
more so long as it is adequately maintained. And fiber is universally acknowledged as the most
robust and most scalable of communications media, enabling scaling as necessary as bandwidth
needs grow and essential to support future generations of wireless technology, both mobile and
fixed. Lit services, in contrast, change dramatically over time, in response to market changes and
service innovations. And the equipment to light up those services will also change as the market
and bandwidth demands grow. Broadband equipment must also be replaced, depending on the
component, approximately every seven to 10 years. Administering and enforcing a Lit Fiber P3
with all these elements is an administrative challenge that is alleviated by eliminating the Lit Fiber
P3 entirely and leaving all these elements to the market.
The model also removes from the City’s purview network operations, where a considerable
amount of risk lies in managing technological and customer service aspects of the network.
Rather than determining parameters and terms for these areas of operation through the Lit Fiber
93 The Connection Fee analysis is detailed in Section 7.

CTC Technology & Energy | IMG Rebel | Fiber for San Francisco | October 2017
94
PG, the City’s role would be limited to the simpler dark fiber layer of the network. The
Concessionaire also would have a role limited to building and maintaining dark fiber, and there
would be no need for a Concessionaire to deal with the more challenging areas of network
performance, service delivery, and customer relationships.
8.1.2 Removes the City from the internet business or competing with privatecompanies
The Single Dark Fiber P3 Model also potentially reduces the challenges inherent in the City’s work
to promote competition and better broadband. Regardless of merits, City efforts to expand
broadband and broadband competition have been aggressively opposed by incumbent phone
and cable companies nationwide. In a dark fiber model, the City (and its Concessionaire) play no
role in providing services to the public, but rather provide a dark fiber platform to enable the
private sector to enter the service business. Frankly, incumbents are likely to oppose this
initiative regardless of how limited the City’s role is, but the customary incumbent claim of “unfair
competition” from the public sector is undercut by the model.
Further, by removing the City from any role in shaping services, pricing, or performance
standards, the Single Dark Fiber P3 preserves the full retail market for competing ISPs—rather
than using a P3 to deliver some level of services to the public.
8.2 ChallengesThough simple and efficient, the Single Dark Fiber P3 Model reduces options with regard to
funding and to competition.
8.2.1 FundingoptionsThis approach potentially reduces the range of options before the City for funding. In particular,
without a service delivered to every home and business, a property‐related fee cannot be used
for the Connection Fee to fund the project.94 Eliminating the Lit Fiber P3 is efficient, but narrows
the City’s path forward.
8.2.2 CompetitionconsiderationsThe competition considerations are complex with respect to comparison between the Single Dark
Fiber P3 and the Dual P3 models. While the Single Dark Fiber P3 creates unprecedented
opportunity at the dark fiber layer, it also does not deliver competition as effectively as a Lit Fiber
3 potentially can.
Though access to dark fiber greatly reduces the barrier to entering the San Francisco market for
new providers, there is still considerable cost and complexity in lighting and operating an optical
network over dark fiber. Only a sophisticated, well‐funded company will have the scale and
94 A range of potential funding sources is analyzed in the appendices to this report.

CTC Technology & Energy | IMG Rebel | Fiber for San Francisco | October 2017
95
capacity to do so. Given the cost involved and the potential competition in the market created
by the dark fiber itself, it’s not likely that more than a small handful of entities would be
interested in leasing dark fiber in the near term. Indeed, the market, depending on how the fiber
is priced, may support only one or two lessees for the foreseeable future. Over the long term,
however, market demand and structures may change and new opportunities for dark fiber
competition may arise.95
In contrast, a lit network can provide very inexpensive open access to many service providers,
including very small operations with modest resources, at low incremental cost.96 Lighting the
network in the first place is costly, but the platform can then add additional competing providers
quickly and cheaply.
The unknowns regarding the dark fiber market also raise the question of whether the model will
ensure sufficient competition emerge to support the City’s affordability and digital equity goals.
In this scenario, the City would not be able to use the Lit Fiber P3 to itself provide lower cost
products for low‐income residents. Rather, the City could provide a subsidy to low‐income
residents to ensure they can afford retail services.
8.3 FinancialAnalysisTo understand the potential Connection Fee necessary to support the Single Dark Fiber P3 Model,
the Project Team developed a version of the financial model for dark fiber only. The model
suggests that the necessary Connection Fee, assuming no dark fiber revenues, will be in the range
of $15 to $37 per residential passing per month, with a base case value of $28. The average
business Connection Fee would be in the range of $21 to $54 per passing per month, with a base
case value of $41. See Table 24.
Table 24: Estimated Single Dark Fiber P3 Connection Fees (Assuming No Additional Revenue)
Output Base Case Range
Connection Fee – residential $28 / passing / month $15 – $37 / passing / month
Connection Fee – business (average) $41 / passing / month $21 – $54 / passing / month
The Project Team next modeled a range of scenarios to understand how dark fiber revenues may
reduce the necessary residential Connection Fee. Given that a dark fiber market of this type
95 In Huntsville, Alabama, where the city’s municipal utility owns a fiber network with this business model, Google
Fiber has thus far been the only entity to lease fiber from the utility, even though others may can lease based on Huntsville Utilities’ established rates. Over time, there will potentially be other ISP users of the city’s fiber, particularly to serve larger businesses and institutions, though we question whether the economics exist for another provider to compete against Google Fiber in the residential market, as least in the short‐term. 96 The technical description for low cost open access over a lit network can be found in Section 7.

CTC Technology & Energy | IMG Rebel | Fiber for San Francisco | October 2017
96
(connecting every home and business) has never been attempted in a city of the size of San
Francisco, we analyzed data from two other projects in smaller cities where this model has been
pioneered to understand the financial implications for San Francisco of the revenues generated
in those cities.
The City of Westminster, Maryland, for example, has a 20‐year contract with Ting Internet in
which the city is obligated to finance and build all of the outside plant (including drops to
customers’ premises). Ting is leasing fiber with a two‐tiered lease payment. One monthly fee is
based on the number of premises the fiber passes ($6 per month per passing); the second fee is
based on the number of subscribers Ting enrolls ($17 per month per subscriber).97
In another variation on this model, Huntsville, Alabama’s municipal electric utility is building a
fiber network and Google Fiber is leasing fiber throughout the city to serve residences and small
businesses.98 Google Fiber’s lease is for 20 years based on a rate sheet that provides for various
levels of pricing based on amounts and volume. The pricing structure is complex but we estimate
Google Fiber’s monthly cost to be approximately $6 to $7 per month per passing.99
The financial model suggests that applying the Westminster and Huntsville pricing to San
Francisco would bring the expected Connection Fee down from $28 per month without dark fiber
revenues to $20 to $26 per month, respectively.
The following sensitivity analysis reflects the main uncertainties in the project. The indicator for
which the sensitivities are shown is the residential Connection Fee, which is $28 per passing per
month under the scenario without any additional fees. Worst case is defined as the assumptions
leading to a Connection Fee that is higher than under the base case assumptions; best case is
97 Because Ting will pay Westminster a monthly fee of $6 for every home and business passed, Ting is financially
obligated to the city from day one, even if it has no customers. This structure gives the city confidence that Ting is highly incented to sell services to cover costs. Ting will also pay the city $17 per month for each customer it serves. In later years, when Ting’s revenue hits certain thresholds, Ting will pay the city a small fraction of its revenue per user. That mechanism is designed to allow the city to share in some of the upside of the network’s success. In other words, the city will receive a bit of entrepreneurial reward based on the entrepreneurial risk the city is taking. Perhaps most significantly, there is also a mechanism built into the contract that ensures that the two parties are truly sharing risk around the financing of the outside plant infrastructure. In any quarter in which Ting’s financial obligations to the city are insufficient to meet the city’s debt service, Ting will pay the city 50 percent of the shortfall. In subsequent quarters, if Ting’s fees to the city exceed the debt service requirements, Ting will be reimbursed an equivalent amount. This element of the financial relationship made the deal much more attractive to the city because it is a clear demonstration of the fact that its private partner is invested with it. 98 Huntsville is not financing or building the drops to the home; it’s obligation to Google is to provide fiber that
passes the premises only. 99 In contrast, Ting’s obligations to Westminster are based in part on how much fiber it uses and in part on how
many customers it secures and revenues it generates. As a result, Westminster will have less predictability and certainty about its revenues from Ting, but has the potential to share in upside in the event that Ting is very successful in that market.

CTC Technology & Energy | IMG Rebel | Fiber for San Francisco | October 2017
97
defined as the assumptions leading to a lower Connection Fee than under the base case
assumptions.
Table 25: Sensitivity Analysis of Single Dark Fiber P3 Residential Connection Fees
Variable Sensitivity Description Worst Case Connection
Fee
Best Case Connection
Fee
Capex The capital cost estimates are uncertain, due to the
current stage of the project preparation and
design. The variability of the cost estimates is +/‐
20 percent, meaning that the worst case is 20
percent higher than the expected value (Dark Fiber
high cost estimate) and the best case is 20 percent
lower than the expected value.
$32 $24
Opex The estimates of operational and maintenance
costs are uncertain, due to the current stage of the
project preparation and design. The variability of
the cost estimates is +/‐ 20 percent, meaning that
the worst case is 20 percent higher than the
expected value (Dark Fiber high case cost estimate)
and the best case is 20 percent lower than the
expected value.
$29 $27
Subsidy Under the base case, low‐income residents (15
percent of the total population) will pay a $10
Connection Fee, and those who buy internet
service (expected to be 80 percent of the low‐
income residents) receive an additional $30 subsidy
per month. Under a minimum subsidy scenario,
low‐income residents will pay a $20 Connection
Fee and the additional internet service subsidy is
$20; under the maximum scenario, low‐income
residents will pay nothing and the additional
internet service subsidy is $40.
$29 $27
Additional revenues
The base case does not assume any revenues from
the City or any additional revenues. This is also the
worst case. In the best case, the annual additional
$28 $22

CTC Technology & Energy | IMG Rebel | Fiber for San Francisco | October 2017
98
Variable Sensitivity Description Worst Case Connection
Fee
Best Case Connection
Fee
revenues are $25 million. Note that this scenario is
an illustration only; it is not based on any research
and is highly uncertain. Further project preparation
and the pre‐procurement auction will reduce the
uncertainty and are intended to lock in additional
revenues.
Financing The financing costs are determined by a few key
financing conditions. The worst case / base case /
best case values for these financing conditions are
as follows:
Gearing: 85 percent / 90 percent / 91 percent
DSCR: 1.25 / 1.20 / 1.15
Interest (commercial debt): 6.5 percent / 5.5
percent / 4.5 percent
Interest (revenue bond): 4.5 percent / 3.5
percent / 2.5 percent
ROE: 15 percent / 13 percent / 11 percent
The sensitivities are calculated for the combination
of minimum and maximum values.
$31 $26
All combined
This sensitivity shows the combination of all worst
case assumptions and all best case assumptions
combined.
$37 $15
The residential Connection Fee in the Single Dark Fiber P3 Model is $20 per month under a
scenario assuming a monthly per passing fee of $6 and a monthly per subscriber fee of $6 (at a
take rate of 50 percent for residential customers and 30 percent for business customers) in
addition to the Connection Fee. The table below shows the main sensitivities under this scenario.

CTC Technology & Energy | IMG Rebel | Fiber for San Francisco | October 2017
99
Table 26: Sensitivity Analysis of Single Dark Fiber P3 Residential Connection Fees with Additional Fees
Variable Sensitivity Description Worst Case Connection
Fee
Best Case Connection
Fee
Capex The capital cost estimates are uncertain, due to the
current stage of the project preparation and
design. The variability of the cost estimates is +/‐
20 percent, meaning that the worst case is 20
percent higher than the expected value (Dark Fiber
high cost estimate) and the best case is 20 percent
lower than the expected value.
$24 $16
Opex The estimates of operational and maintenance
costs are uncertain, due to the current stage of the
project preparation and design. The variability of
the cost estimates is +/‐ 20 percent, meaning that
the worst case is 20 percent higher than the
expected value (Dark Fiber high case cost estimate)
and the best case is 20 percent lower than the
expected value.
$21 $19
Subsidy Under the base case, low‐income residents (15
percent of the total population) will pay a $10
Connection Fee, and those who buy internet
service (expected to be 80 percent of the low‐
income residents) receive an additional $30 subsidy
per month. Under a minimum subsidy scenario,
low‐income residents will pay a $20 Connection
Fee and the additional internet service subsidy is
$20; under the maximum scenario, low‐income
residents will pay nothing and the additional
internet service subsidy is $40.
$21 $19
Additional revenues
The base case does not assume any revenues from
the City or any additional revenues. This is also the
worst case. In the best case, the annual additional
revenues are $25 million. Note that this scenario is
an illustration; it is not based on any research and
is highly uncertain. Further project preparation and
$20 $14

CTC Technology & Energy | IMG Rebel | Fiber for San Francisco | October 2017
100
Variable Sensitivity Description Worst Case Connection
Fee
Best Case Connection
Fee
the pre‐procurement auction will reduce the
uncertainty and are intended to lock in additional
revenues.
Financing The financing costs are determined by a few key
financing conditions. The worst case / base case /
best case values for these financing conditions are
as follows:
Gearing: 85 percent / 90 percent / 91 percent
DSCR: 1.25 / 1.25 / 1.15
Interest (commercial debt): 6.5 percent / 5.5
percent / 4.5 percent
Interest (revenue bond): 4.5 percent / 3.5
percent / 2.5 percent
ROE: 15 percent / 13 percent / 11 percent
The sensitivities are calculated for the combination
of minimum and maximum values.
$22 $18
Take rate In the base case, a take rate of 50 percent for
residential customers and 30 percent for business
customers is assumed. In the best case assumption,
the take rate is increased to 60 percent
(residential) and 40 percent (business customers).
In the worst case assumption, the take rate is
reduced to 30 percent (residential) and 20 percent
(business customers).
$21 $19
All combined
This sensitivity shows the combination of all worst
case assumptions and all best case assumptions
combined.
$30 $6
The sensitivity analysis demonstrates that a good structuring of the per passing and per customer
fees in combination with upfront commitment of additional revenues can help reduce the
Connection Fee significantly.
CTC Technology & Energy | IMG Rebel | Fiber for San Francisco | October 2017
101
9 RecommendationsforImplementationandProcurementStrategyThis section of the report concerns the procurement strategy for the recommended approach for
the Fiber for San Francisco Initiative. In summary, this section describes the ways in which this
pioneering FTTP P3 procurement will be the first of its kind and that, given its uniqueness and
pioneering nature, a procurement strategy customized for application of P3 delivery mechanisms
to the new P3 area of FTTP is necessary.
We therefore suggest a procurement process grounded in the traditional P3 process but
customized and expanded to account for the unique aspects of this effort, including (1) funding
authorization requirements, (2) unique market characteristics, and (3) the lack of familiarity of
the investment community with P3s in the broadband sector.
We recommend the following steps in the procurement process:
1. Industry Sounding. A pre‐procurement industry sounding to clarify and market the
project and proposed P3 structure to generate market appetite as well as solicit inputs to
further refine the structure. The industry sounding could include a full day event or one‐
on‐one conversations.
2. Pre‐Procurement Dark Fiber Leasing. A pre‐procurement pre‐lease or sale of dark fiber
and other network capacity in advance of the P3 RFPs so as to quantify and secure some
revenues that would otherwise be speculative; this will enable (1) bids with lower
requirements for City funding/guarantees, and (2) a more competitive bidding process in
which all bidders can account for these revenue streams.
3. P3 Procurement. In the event that the Dual P3 Model is adopted, a P3 procurement
process that distinguishes two procurements: one for dark fiber and other outside plant
infrastructure (Dark Fiber RFP); and a separate one for the service provider (Lit Fiber RFP),
to be run partially in parallel.
4. Integration of RFP Development and Industry Consultation/Negotiations. Although the
City has been contemplating an RFP development process followed by negotiations with
one or more selected bidders, we recommend integrating these phases and building
consultation with selected bidders into a more extensive process of RFP development and
vetting. This process—which should be more extensive than in other P3 sectors, given the
novelty of this effort—will enable the necessary level of interaction with potential
bidders, giving the City opportunity to refine these complex procurements, while enabling
the bidders to further understand and craft bids for this new, unfamiliar asset class.

CTC Technology & Energy | IMG Rebel | Fiber for San Francisco | October 2017
102
Overall, the procurement process should:
● Begin as early as possible in order to gather industry feedback before seeking funding
approval. A key task for this project is to ensure a match between the level of funding
approved and what bidders will propose during the procurement process. In an ideal
situation, bidders would be selected and a firm understanding of the level of financial
commitment needed would be clear before funding authorization is sought. However,
bidders tend to require funding approval in advance of submitting complex bids and are
less willing to put significant effort into completing bids for projects that they have reason
to doubt will be funded. Therefore, starting engagement with potential bidders through
an industry sounding, and initiating the RFQ and RFP process as early as possible in order
to obtain some level of interaction and information from bidders, will help provide some
clarity to the approval process and provide decision‐makers with as much information as
is feasible at that stage of the process, even if binding bids have not already been
submitted.
● Build in sufficient time and flexibility. A procurement timeline that accounts for the
pioneering and singular nature of this effort and thus builds in sufficient time and
flexibility to vet all elements of the bid requirements; an extended timeline will likely also
be required by the emerging strategy of separating the Dark Fiber RFP from the Lit Fiber
RFP.
● Apply P3 procurement best practices. Even though this procurement will be the first‐of‐
its‐kind, several P3 procurement best practices can be applied, including:
o Shortlist three or four qualified bidders (RFQ Phase): Given the time and resources
required for the City and bidders, it is important that the City selectively identify
bidders for advancement. The shortlisting of qualified bidders is considered standard
practice for any complex procurement and is particularly important for P3
procurements. Only having a small group of pre‐qualified bidders allows the City to
focus its resources on responding to a smaller number of bidders. From the bidders’
perspective, because the cost of developing a detailed proposal during the RFP stage
is significant, they too prefer to compete among a handful of shortlisted teams. A
smaller pool of competitors increases the probability of succeeding at the RFP stage,
which motivates bidders to invest resources in developing a high‐quality bid.
o Communicate with the bidders prior to bid submission (Draft RFP Phase): The City
can use a multi‐stage “draft RFP” process to increase dialogue with the potential P3
concessionaires, with the objective of crafting an agreement that adequately reflects
acceptable long‐term transfer of risks and responsibilities between the parties in the
CTC Technology & Energy | IMG Rebel | Fiber for San Francisco | October 2017
103
most efficient way possible. When done well, a draft RFP process is an organized way
to solicit input from pre‐qualified bidders and increase fair competition. A draft P3
agreement can be included in the draft RFP documents to gain early industry input on
the proposed contractual agreement, and to limit negotiations with a single preferred
bidder. This process decreases the likelihood of major last‐minute amendments to the
final RFP, which could distort the competitive process and increase transaction costs.
Ideally, it also replaces the post‐bid negotiations with one or more selected bidders
that are contemplated by the City’s original plan. Given the pioneering nature of this
effort and the newness of this sector to P3 bidders, multiple iterations of this draft
RFP process may be advisable, and the timeline should reflect the need for flexibility
and creativity during the RFP development process.
These issues are discussed in further detail below.
9.1 A Pre‐Procurement Capacity Leasing Process Should Precede the P3Procurement soas to ImproveP3BiddingOutcomesbyAccounting forSomeNewRevenueOpportunity
One way to demonstrate the potential viability of the opportunity in advance of a full funding
decision, both to policy‐makers and to potential bidders, relates to the second primary
consideration of procurement for this initiative—that is, the nature of the infrastructure and
services at hand.
9.1.1 FTTPRepresentsanUntestedArea forP3Delivery, inaComplexandEver‐ChangingSector
Unlike traditional P3 areas, broadband and FTTP exist in a somewhat “competitive” market
(although it is a market of uneven levels of service to various parts of the City, and with services
less capable and less robust than the FTTP infrastructure envisioned by this initiative). In addition,
the use of the fiber and the ways in which connectivity and the internet will be used over the
course of the life of this network are in substantial ways unpredictable.
Unlike a water utility P3 that will, in its first year and its last year, provide water—or a toll road
that will throughout the life of the concession provide access to a navigable road—the FTTP
network will be used in the medium and long term in ways that are largely impossible to project
at the current moment. Generally, we can anticipate only some of the uses of the network—out
to perhaps seven to 10 years. Consider, for example, that the advent of the commercial internet
was only 22 years ago. Facebook was founded only 13 years ago. Netflix started offering
streaming content only 10 years ago.

CTC Technology & Energy | IMG Rebel | Fiber for San Francisco | October 2017
104
As a result, it is not only difficult to determine how consumers will use this infrastructure and
services over it in the future, but it is also extremely challenging to anticipate what companies
will be interested in with respect to the use of the City’s new infrastructure.
9.1.2 TheOpportunityPresentedbyThisInitiativeIsUnfamiliartotheInvestmentCommunity
In addition, the opportunity the City is about to present to the private sector is unprecedented.
There has never before existed in any American community an opportunity for a private entity
to lease fiber or broadband infrastructure to reach 100 percent of the homes and businesses in
the community. While a handful of localities have sought to offer open‐access networks, those
were on a smaller scale than San Francisco and only connected a portion of the community (those
customers that paid for service) and, even then, generally over networks without the technical
robustness of what is contemplated for this initiative. In contrast, what the City has elected to
examine for this initiative is immediate connectivity to 100 percent of the homes and businesses
in the community.
In addition, there has never before existed a mechanism for companies to lease dark fiber on
such a scale. Because the phone and cable incumbents do not allow access to their distribution
networks to the home and business at the dark fiber layer (and, indeed, at any layer in many
cases), private sector internet entrepreneurs and other companies have never had the
opportunity presented here.
For all these reasons, it is deeply challenging to anticipate the kinds of lessees that may emerge
even in the first few years after the network is built, let alone in the medium and long term.
In sum, the opportunity the City is presenting to the private sector is unprecedented, and
therefore there exist no empirical data by which to project or understand what kinds of potential
revenues may emerge. In addition, P3 investors will not accept the kind of uncertainty that is a
necessary element of the pioneering nature of the asset. Rather, they will bid with a requirement
that the risk presented by this uncertainty is borne by the City.
9.1.3 A Pre‐Procurement Lease ofAccess to theNetworkWouldHelp toMitigateTheseUncertainties
Given the confluence of all these factors, we recommend a substantial additional phase to this
P3 procurement—one that would occur in advance of an RFP for a P3 bidder. This first
procurement would be aimed not at the P3 investment community, but at the potential users of
the network, who would be interested in leasing capacity on the network to reach residences
and businesses in San Francisco.

CTC Technology & Energy | IMG Rebel | Fiber for San Francisco | October 2017
105
The procurement would be designed to quantify at least some of the potential dark fiber leasing
revenues and to effectively create binding mechanisms and revenue streams from these bidders
that would then become part of the RFP and the business proposition offered to the P3 bidders.
In other words, a preliminary procurement of anchor customers would allow the City’s P3
procurement to quantify and guarantee a substantial source of revenue to the bidders—which
would reduce the required financial contribution to be asked of the taxpayers.
Outside the P3 context, this kind of strategy has been used on a much smaller scale in a few
communities that have “pre‐sold” dark fiber leases before construction so as to bring in revenues.
The City could entice dark fiber lessees by offering pre‐construction pricing akin to the real estate
environment, and in this way, could convert at least some of the network’s revenue potential
from speculative to guaranteed.
A further benefit of this strategy arises from the fact that identifying and securing these revenues
in advance of a P3 procurement will result in a more competitive procurement, as all the bidders
will be able to build in to their business models these potential revenues. In contrast, if these
revenues are still speculative, a single bidder may be able to quietly enter into an agreement with
a potential lessee of fiber; this would skew the competitive process because other bidders would
not be able to factor those revenues into their bids, even though those revenues are likely to
materialize.
The combination of all these factors leads us to recommend a procurement process that includes
contingent dark fiber leasing in advance of the P3 procurement.
9.1.4 APre‐Procurement IndustrySoundingShouldBeUsed toMarket theProjectandSolicitInputsfromthePrivateSector
Due to the unique nature of this project, including an ambitious project scope, competitive
market landscape, and potentially, a dual P3 structure, an industry engagement event (“industry
sounding”) is highly recommended. Industry sounding is used as a forum for providing
information about the project to potential bidders, marketing the project, and soliciting input
from bidders.
9.2 The Procurement Timeline Should Be Developed in Light of theComplexitiesandNewnessoftheStrategy
The procurement timeline should account for the pioneering and singular nature of this effort
and build in sufficient time and flexibility to vet and negotiate various elements of the bid
requirements. We urge the City to build a prudent and risk‐mitigating procurement timeline so
as to enable multiple stages of vetting of various elements of the bid documentation with
potential bidders, as well as expert comment on the effort.

CTC Technology & Energy | IMG Rebel | Fiber for San Francisco | October 2017
106
The newness and innovative nature of the City’s combination of technical scope (open,
ubiquitous FTTP) and delivery mechanism (P3) creates uncertainty and risk that can to some
extent be mitigated by a very organized, fair, and transparent procurement process that strives
to limit one‐on‐one negotiations with a single bidder as much as possible. Therefore, we
recommend a process that has been used in P3 procurements globally, and has emerged as a
best practice. This process features a detailed request for qualifications (RFQ) process in which
bidders are shortlisted, and a draft RFP and final RFP process that allows for dialogue between
the City and shortlisted bidders—resulting in robust competition amongst a small number of
qualified bidders on a final RFP and P3 contract that does not necessitate extensive negotiations
after selection of preferred bidder.
In a pioneering area such as FTTP, using this recognized P3 process could reduce uncertainty and
allow for refinement and change of strategies or terms that can enhance value‐for‐money for the
City, and produce fair, and transparent competition.
The need for time is also required by the potential Dual P3 structure of separating the RFP for
the fiber network from the RFP for operations and service. As part of this emerging strategy,
there are two options for how to organize the dark fiber procurement, and the lit services
procurement: (1) sequential procurements, or (2) staggered procurements. The first option is for
the procurement of the P3s to be done sequentially, first for the dark fiber, and then for the
services P3. This option is more in line with the timing of the project overall and holds fewer
procurement risks related to possible gaming of the process, and challenges.
The second option is for the procurement of the P3s to be completed in a staggered manner,
such that the procurement of the Dark Fiber P3 begins, and only closes after the Lit Fiber P3
procurement begins. This staggered procurement allows for the City to use the draft RFP process
within both P3 procurements to work through coordination issues between the two inter‐related
projects. This enables the City to guard against locking itself into a Dark Fiber P3 contract that
may not be optimal for the subsequent Lit Fiber P3. This staggered approach can also provide a
better indication of the funding requirements to the City, as information from both procurements
can be used to provide a firm indication of financial need from the entire, integrated project.
As such, although it will be more complicated to use a staggered procurement approach, we
recommend that the City use the staggered approach into order to address coordination issues
within the two competitive procurement processes.

CTC Technology & Energy | IMG Rebel | Fiber for San Francisco | October 2017
107
9.3 TheP3ProcurementProcessShouldBeginasEarlyasPossibleinOrdertoGainInputsfromBiddersPriortoPuttingTogethertheProposedFundingAuthorization
Funding authorization requirements and market viability necessitate a relatively extensive
timeline to prepare the procurement and educate policy‐makers and the public regarding the
project.
9.3.1 TheP3ProcurementsShouldBeInitiatedBeforeFullFundingAuthorizationWe recommend initiating the P3 procurements (but not complete procurement) before full
funding authorization. This will allow for an accelerated process, and for the City to use
information gleaned from bidders within the procurement process to be more certain about the
level of financial commitment that bidders will need from the City. Under this option, the
procurement processes will be initiated before full funding authorization, and closed after final
funding approval is secured. If proposals would be submitted prior to funding authorization, they
would come with so many caveats and at such a level of generality that the bidding process would
not result in the kind of definitive and efficient procurement that could fully protect the City’s
interests.
9.3.2 TheBidsShouldBeRequestedAfterFundingAuthorizationFunding authorization will provide certainty to bidders about the level of financial commitment
available to the project. Additionally, having funding certainty from the City will provide a
measure of comfort to investors as they undertake the level of effort and cost required to bid on
this opportunity. Furthermore, prior to full funding approval, the City would presumably be
unable to award a binding contract.
9.3.3 TheUseofStipendsWillEncourageBidderParticipationThe City can encourage bidder participation through a mechanism that is generally used in very
large P3 procurements—which is to compensate the bidders for their efforts. This would likely
be undertaken with the understanding that the winning bidder’s compensation from the City
would then be rolled in to the bid itself, and the City’s financial obligation for this particular
process would extend only to the losing bidders.
This is a viable and tested way to conduct a large, significant‐scale procurement, and is frequently
used once a subset of bidders (those that are prequalified) are selected. It would likely entail
payment between $500,000 and $2 million, given the newness of broadband P3s and the level of
effort necessary for each bidder to develop new partnerships, models, and legal analysis.

CTC Technology & Energy | IMG Rebel | Fiber for San Francisco | October 2017
108
AppendixA:GlossaryAdministrative Fee – The portion of the Connection Fee allocated to funding the administrative
efforts of the Public Broadband Enterprise.
Commercial Service Fees – The fee charged to consumers for data services provided by retail
services providers.
Connection Fee – The fee assessed to households and businesses to fund the P3s.
CPE (Customer Premises Equipment) – The equipment at the subscriber site that connects to the
FTTP network via the subscriber port, such as a router, switch, or set‐top box.
Dark Fiber Concessionaire – The private awardee of the P3 for building and maintaining outside
plant infrastructure, including fiber optics and hub facilities.
Dark Fiber Connection Fee – The portion of the Connection Fee allocated to funding the Dark
Fiber Concessionaire.
Dark Fiber Lease Fees – The lease fees paid by lessees of dark fiber.
Dual P3 Model – The dual P3 structure developed for this initiative that would entail two P3s,
one for dark fiber (Dark Fiber P3) and one for lit service (Lit Fiber P3).
Single P3 Model – The alternative P3 structure developed for this initiative that would entail a
single P3 for open access dark fiber, with the City playing no role in lighting the fiber or offering
services.
EVC (Ethernet Virtual Connection) – A service connection between two or more subscriber ports
or RSP access ports.
FDC (Fiber Distribution Cabinet) – A cabinet placed geographically between the network
aggregation switches or central office which serves as an aggregation point for fiber that feeds
subscriber premises. The cabinet houses either passive optical equipment (such as GPON
splitters) or active optical equipment (such as an OLT).
Lit Fiber Concessionaire – The private awardee of the P3 for providing equipment and lit services
over dark fiber.
Lit Fiber Connection Fee – The portion of the Connection Fee allocated to funding the Lit Fiber
Concessionaire.

CTC Technology & Energy | IMG Rebel | Fiber for San Francisco | October 2017
109
NNI (Network‐to‐Network Interface) – A physical network port that acts as the demarcation
point between two service provider networks; in this case, between the City FTTP network and a
service provider network.
OLT (Optical Line Termination) – The upstream connection point (to the FTTP network) for
subscribers which connects to the ONT. The choice of an optical interface installed in the OLT
determines whether the network provisions shared access (one fiber split among multiple
subscribers in a GPON architecture) or dedicated active‐E access (one port for one subscriber).
ONT (Optical Network Terminal) – A device that sits at the subscriber premises and is connected
to fiber from the FTTP. The device converts the network signal between the FTTP optical fiber
and the copper Ethernet connection used for the CPE.
Public Broadband Enterprise (PBE) – The entity of San Francisco government that will manage
and administer the P3 contract(s), collect Connection Fees, and issue relevant debt.
QoS (Quality of Service) – The means to ensure minimum performance levels for certain network
traffic through prioritization and reservation of resources.
Service Provider – The organization providing a network service; most commonly, an internet
service provider (ISP).
Subscriber – The individual or organization purchasing a network service.
UNI (User‐to‐Network Interface) – A physical network port that acts as the demarcation point
between the FTTP network and a subscriber network. On an FTTP network, this would usually be
a copper Ethernet port on an ONT or an Ethernet switch with an optical upstream interface.
CTC Technology & Energy | IMG Rebel | Fiber for San Francisco | October 2017
110
AppendixB:Value‐for‐MoneyAssessmentandValue‐for‐MoneyDriversA value‐for‐money assessment is a structured comparison of delivery methods, usually
comparing a conventional delivery model (various single contracts for design, construction,
operations) with P3 delivery method (e.g., design, build, finance, operate, and maintain—or
DBFOM). The assessment answers the question “which delivery method provides the ‘best deal’
for implementing a specific project from the perspective of the tax payer or government?”
A value‐for‐money assessment can be either qualitative or quantitative. For example, for highway
and social infrastructure projects, the result of a value‐for‐money assessment typically is a net
present value or percentage difference between a conventional delivery model and a P3 delivery
model.
However, an increasing number of governments, in the U.S. and internationally, have decided to
de‐emphasize the quantitative comparison or move away from the quantitative comparison
altogether; this analytical shift reflects the limited data available to justify expected differences
between conventional and P3 delivery, and an increase in claims regarding the manipulation of
outcomes within the value‐for‐money assessment.
This trend has led to an increase in purely qualitative value‐for‐money assessments. Since there
is very little data on implementation of city‐wide broadband networks, our analysis of the Fiber
for San Francisco Initiative did not include a qualitative comparison.
Moreover, for this initiative, there is not really a ‘conventional model’ that can be realistically
implemented. This makes the traditional value‐for‐money assessment infeasible.
That said, the qualitative arguments around value‐for‐money are still relevant for structuring and
assessing delivery models for the Fiber for San Francisco Initiative. The alternative traditional
value‐for‐money assessment included here discusses the drivers of value‐for‐money and apply
those in the discussion and qualitative comparison of delivery models.

CTC Technology & Energy | IMG Rebel | Fiber for San Francisco | October 2017
111
GovernanceMechanismsThatDriveValue‐for‐MoneyThere are five major categories of governance mechanisms within P3 agreements that drive
value‐for‐money, as shown in Figure 16:
1. Integration and life‐cycle costing
2. Specifications allowing for innovation
3. Financial incentives
4. Competition
5. Efficient risk allocation
Figure 16: P3 Value Drivers
IntegrationandLifeCycleCostingConventional delivery of infrastructure by public entities typically relies on the public entity to
integrate multiple contracts—from design, to construction, to a series of operations and
maintenance contracts—throughout the life cycle of the project. As such, the public entity holds
risk related to integrating these contracted services.
In P3 delivery, a private entity provides all the services for the life cycle of the infrastructure
through one contract, thereby taking on the risk of integrating all the different components of
the project. Integration of these different components is a foundation for the value that P3s are
expected to generate, because the integration aligns incentives for the private entity. For

CTC Technology & Energy | IMG Rebel | Fiber for San Francisco | October 2017
112
example, the private entity might make specific decisions in project design and construction that
could be subsequently advantageous in operations and maintenance.
Output‐BasedSpecificationsThatAllowforInnovationIn P3 contracts, specifications regarding what the concessionaire provides are output‐based,
leaving room for the concessionaire to decide how to deliver the services that are required. This
contrasts with typical contracts, in which design and engineering solutions are provided in detail,
and the private parties simply provide the service to the determined specification. Output‐based
specifications, in combination with competitive pressure through a bidding process, incentivize
concessionaires to come up with creative solutions that seek life‐cycle savings and higher quality
of service.
FinancialIncentivesA P3 can align public and private interests—and incentivize the private sector’s performance—
through financial incentives and penalties. Positive performance improves the private sector’s
profits directly through timely, or higher, payments, or indirectly, through lower costs. Poor
performance triggers penalties, which will directly affect the financial performance of the
concessionaire.
Financial incentives for the concessionaire are structured as a direct relationship with the output‐
based specifications, and are linked to performance. A key to properly aligning financial
incentives is to make sure that the concessionaire has “money at stake.” Additionally, financing
aligns the interest of debt financiers with the interests of the public entity. The private party will
only be paid (and the debt provider repaid) if the project/service is delivered well.
CompetitionThe benefits of a P3 will only materialize if the concessionaire is procured through a fair,
transparent, and competitive process that features multiple, highly‐qualified bidders. The
foundation of a competitive procurement is market appetite and capacity. A procurement
process that features P3 best practices—such as shortlisting of pre‐qualified bidders, using a draft
RFP process, and limiting appropriations risk upfront—can minimize transaction costs for all
parties involved, and can directly affect market appetite.100
100 A note on P3 transaction costs: Limiting transaction costs is also important for the public sector. P3 transactions are typically more complex, and usually require more time, and outside counsel to complete—particularly if a public entity does not have prior experience with procuring P3s. Higher transaction costs for P3s is expected due to the fact that a P3 is essentially one contract that replaces multiple contracts. It is important to note that over the life cycle of a project, transaction costs associated with conventional delivery may be higher than a P3 due to the need to procure multiple contracts, from design, to construction, to financing, to various operations and maintenance contracts.

CTC Technology & Energy | IMG Rebel | Fiber for San Francisco | October 2017
113
Another aspect of competition is the procurement evaluation criteria. The goal of every bidder
within a competitive procurement process is to win. To win, bidders need to obtain the best score
vis‐à‐vis the evaluation criteria. Therefore, the evaluation criteria should focus on the key public
sector objectives for the project. In order to do this, and balance the goal of creating the highest
value‐for‐money, evaluation criteria are not simply price‐based, but based on “best‐value,”
which includes achieving public goals.
EfficientAllocationofRisksThe core of a P3 deal is efficient risk allocation. Risk allocation is based on the principle that risks
should be allocated to the party that can best manage the risks. Key to risk allocation is
recognition that simply because the risk is allocated to a specific party does not mean that the
risk does not exist.
Also, regardless of whether the public or the private party assumes the risk, there is a cost
associated with bearing the risk, which is reflected in the P3’s overall value‐for‐money. Some
risks, such as political risk or risks associated with budget appropriations, are typically best
managed by the public sector. Technical and interface risks such as errors and omissions in
design, or construction delays, are typically best managed by the private sector. Note that some
risks, such as force majeure and technical changes over time, are typically shared between the
public and private parties.
Value‐for‐MoneyAnalysisofClassicP3ModelThe Classic P3 Model does not create the best value‐for‐many profile for broadband P3 projects
because it does not efficiently allocate risks, limits competition, limits output‐based
specifications, and typically involves high transaction costs. However, this model does allow for
financial incentives through performance‐based payments and / or revenue sharing.
Efficient allocation of risks: Most risks are allocated to the concessionaire in this model. Given
that efficiency is defined as allocation of risks to the party that is the most able and equipped to
manage and mitigate the risk, the concessionaire is likely not the best entity to manage all risks
associated with long‐term revenue for services that tend to change over time.
Integration and life cycle costing: This model does allow for maximum integration of various
elements of the project—in particular, integration between dark fiber and lit services. However,
as we noted above, this model does come with the risk of producing a quasi‐monopoly, which
would limit competition for lit services.
Output‐based specifications that allow for innovation: This model can allow for output‐based
specifications. However, it will be challenging to create specifications that are truly output‐based
in this P3 model, because the economic life of the equipment is only seven to 10 years. This type
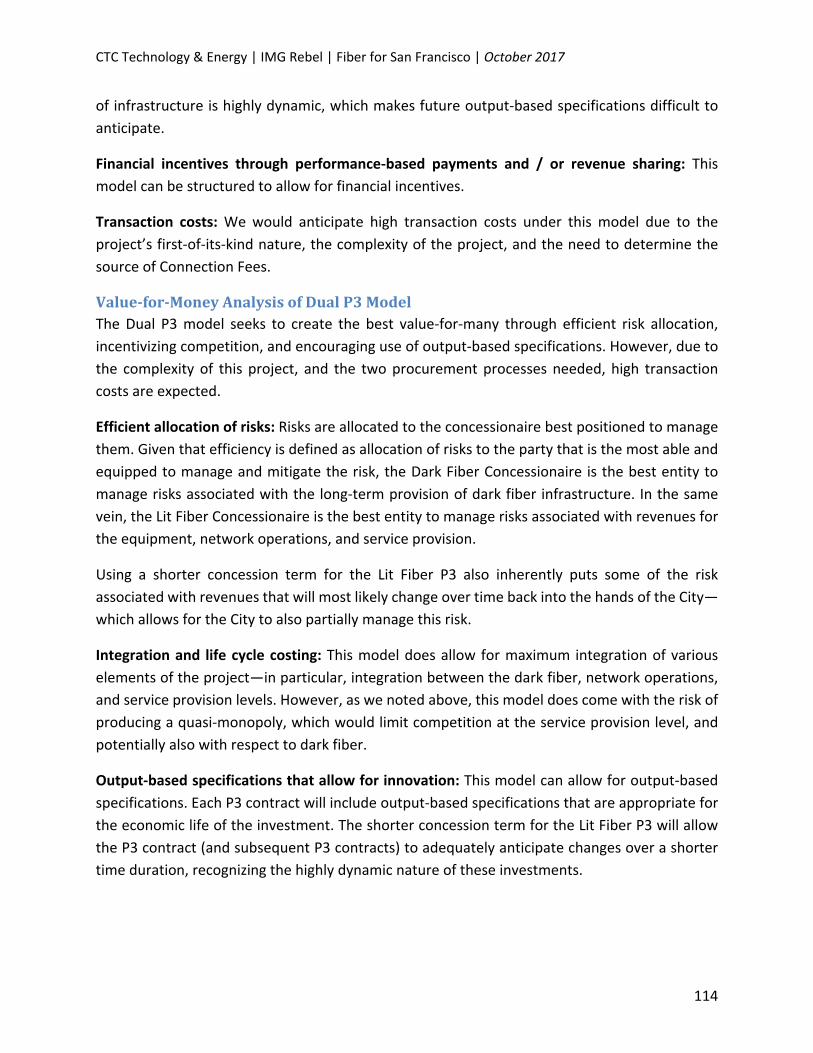
CTC Technology & Energy | IMG Rebel | Fiber for San Francisco | October 2017
114
of infrastructure is highly dynamic, which makes future output‐based specifications difficult to
anticipate.
Financial incentives through performance‐based payments and / or revenue sharing: This
model can be structured to allow for financial incentives.
Transaction costs: We would anticipate high transaction costs under this model due to the
project’s first‐of‐its‐kind nature, the complexity of the project, and the need to determine the
source of Connection Fees.
Value‐for‐MoneyAnalysisofDualP3ModelThe Dual P3 model seeks to create the best value‐for‐many through efficient risk allocation,
incentivizing competition, and encouraging use of output‐based specifications. However, due to
the complexity of this project, and the two procurement processes needed, high transaction
costs are expected.
Efficient allocation of risks: Risks are allocated to the concessionaire best positioned to manage
them. Given that efficiency is defined as allocation of risks to the party that is the most able and
equipped to manage and mitigate the risk, the Dark Fiber Concessionaire is the best entity to
manage risks associated with the long‐term provision of dark fiber infrastructure. In the same
vein, the Lit Fiber Concessionaire is the best entity to manage risks associated with revenues for
the equipment, network operations, and service provision.
Using a shorter concession term for the Lit Fiber P3 also inherently puts some of the risk
associated with revenues that will most likely change over time back into the hands of the City—
which allows for the City to also partially manage this risk.
Integration and life cycle costing: This model does allow for maximum integration of various
elements of the project—in particular, integration between the dark fiber, network operations,
and service provision levels. However, as we noted above, this model does come with the risk of
producing a quasi‐monopoly, which would limit competition at the service provision level, and
potentially also with respect to dark fiber.
Output‐based specifications that allow for innovation: This model can allow for output‐based
specifications. Each P3 contract will include output‐based specifications that are appropriate for
the economic life of the investment. The shorter concession term for the Lit Fiber P3 will allow
the P3 contract (and subsequent P3 contracts) to adequately anticipate changes over a shorter
time duration, recognizing the highly dynamic nature of these investments.

CTC Technology & Energy | IMG Rebel | Fiber for San Francisco | October 2017
115
Financial incentives through performance‐based payments and/or revenue sharing: This model
can be structured to allow for financial incentives, including performance‐based payments
and/or revenue sharing.
Transaction costs: We would anticipate high transaction costs under the Dual P3 Model due to
the project’s first‐of‐its‐kind nature, the complexity of the project, the need to go to determine
the source of Connection Fees, and the fact that two complex procurements will need to be
completed in a staggered fashion.

CTC Technology & Energy | IMG Rebel | Fiber for San Francisco | October 2017
116
AppendixC:RiskMatrixThe following table summarizes the Project Team’s assessment of potential risk factors across a
range of project phases.

CTC Technology & Energy | IMG Rebel | Fiber for San Francisco | October 2017
117
Category Description Risk Impact Mitigation Approach Public Private
Design
Utility pole owners and attached parties impose
excessive engineering requirements and provide poor
documentation for existing infrastructure, increasing
the difficulty of aerial engineering which results in
increased design costs and project delays.
High Medium
Prior to the engineering phase, alert the various pole
owners of the project scope and negotiate a
streamlined process for the concessionaire to obtain
pole attachment information over the course of the
project. Constantly revise priorities and schedules to
accommodate unexpected construction roadblocks.
Construct underground where necessary. Establish a
one‐touch make ready practice for a new attacher.
60 40
Stringent City agency permitting, inspection and
restoration requirements increases the difficulty of
underground engineering which results in high design
costs and project delays.
High Medium
Work with the City agencies to eliminate non‐
essential permit requirements. Constantly revise
priorities and schedules to accommodate unexpected
construction roadblocks. Concessionaire calls in utility
locates during the engineering design process for
certain areas of the City where underground
congestion is expected.
70 30
Poor documentation of existing infrastructure increase
the difficulty of underground engineering which
results in increased design costs and project delays.
High Medium
Develop a process to make sure City agencies provide
the best available information on underground
utilities to the concessionaire.
100 0
City agencies change construction standards during
the course of the project causing engineering designs
to become infeasible or not optimal from a cost
perspective. This could result in additional costs and
project delays due to design revisions.
Low Medium
With acceptance from the appropriate City agencies,
develop a set of clearly defined construction
standards that shall remain valid throughout the
duration of the FTTP construction project.
100 0

CTC Technology & Energy | IMG Rebel | Fiber for San Francisco | October 2017
118
Category Description Risk Impact Mitigation Approach Public Private
Delayed responses from City agencies or pole owners
when the engineering contractor makes information
requests pertaining to engineering or permitting.
High Low
Work with City agency or pole owner to establish
response time requirements for any process that
currently does not have defined response times.
Identify appropriate POCs for each agency and pole
owner.
90 10
City agencies and/or utility pole owners do not have
the capacity to review engineering and provide
permits in a timely manner for a project of this scale,
causing delays in construction.
High Medium
Work with the city agencies to eliminate non‐
essential permit requirements and develop a
streamlined process for the various City agencies to
review essential permits.
Phase the planned aerial construction to account for
expected delays with pole attachment review.
Prioritize the submission of pole attachment packages
so that critical routes are reviewed first.
100 0
Engineering contractor has difficulty obtaining
permission to access commercial buildings and MDUs,
resulting in delays or incomplete engineering.
High Medium
Develop plan to effectively enforce new legislation
that requires building owners to allow access to all
state‐licensed providers.
50 50
Construction
Unanticipated construction requirements and/or
obstructions that cannot be identified during the
design phase that result in increased costs and project
delays.
Medium High
Concessionaire calls in utility locates during the
engineering design process for certain areas of the
City where underground congestion is expected.
50 50

CTC Technology & Energy | IMG Rebel | Fiber for San Francisco | October 2017
119
Category Description Risk Impact Mitigation Approach Public Private
Areas of the City may have limited space in the
underground ROW resulting in redesign of routes
which can increase costs and delayed construction.
Low High
Concessionaire calls in utility locates during the
engineering design process for certain areas of the
City where underground congestion is expected.
0 100
Pole owners such as PG&E and AT&T have a multi‐year
schedules for pole replacement and make ready work.
They do not perform work out of their scheduled
order, nor do they provide details of the scheduled
work. Significant project delays for aerial builds could
occur while waiting for pole owner to perform make
ready work. Increased costs for engineering redesign
and underground construction may occur if the City
builds underground to bypass the delays.
High High
Negotiate with pole owners to make an exception to
their standard process, allowing out of order work to
be performed on the City's project.
Obtain the detailed work schedule from the pole
owner so engineering and construction can be phased
to accommodate the planned make ready schedule.
50 50
Construction contractors are unable to obtain fiber
construction materials due to supply shortages
causing project delays.
Medium Medium
If needed the concessionaire can work directly with a
fiber cable manufacturer to reserve a spot in the
production queue to ensure fiber cable is available
during the project.
0 100
Local utility locating services do not have capacity to
keep up with locates requests for a project of this
scale, causing delays in construction.
Medium Medium
Prior to construction, alert local locating services of
impending project scope to allow them prepare for
the influx of locate requests as best as possible.
50 100

CTC Technology & Energy | IMG Rebel | Fiber for San Francisco | October 2017
120
Category Description Risk Impact Mitigation Approach Public Private
Project contractor damages City‐owned or third‐party
utilities causing delays in construction and project
pushback from City agencies or third‐party utility
owners.
Medium Medium
Require the selected concessionaire to use multiple
construction contractors, so that contactors who
have issues with damaging utilities can be removed
from the project without compromising the project
timeline.
Require concessionaire to use construction
contractors with experience working in the City
and/or a proven track record of low hit rates.
Develop additional quality control processes for
contractors to implement after they hit a utility.
0 100
Operations
A power outage at core sites or hub facilities causes a
service outage on the network. Low Medium
Design the network to have backup power at core
sites and hub locations. Design network with
redundant routing to minimize service outages.
0 100
Network suffers significant damage from earthquake
or other natural disaster. Low High
Ensure SLAs are in place to guarantee quick response
and repair times for damaged assets. Design network
with redundant routing to minimize service outages
during repairs.
50 50
A cyberattack causes a service outages or vulnerability
to users on the network. Medium Medium
Ensure firewalls and other security measures and best
practices are built into the network. Develop a
response plan to deal with the attack and restore
services.
0 100
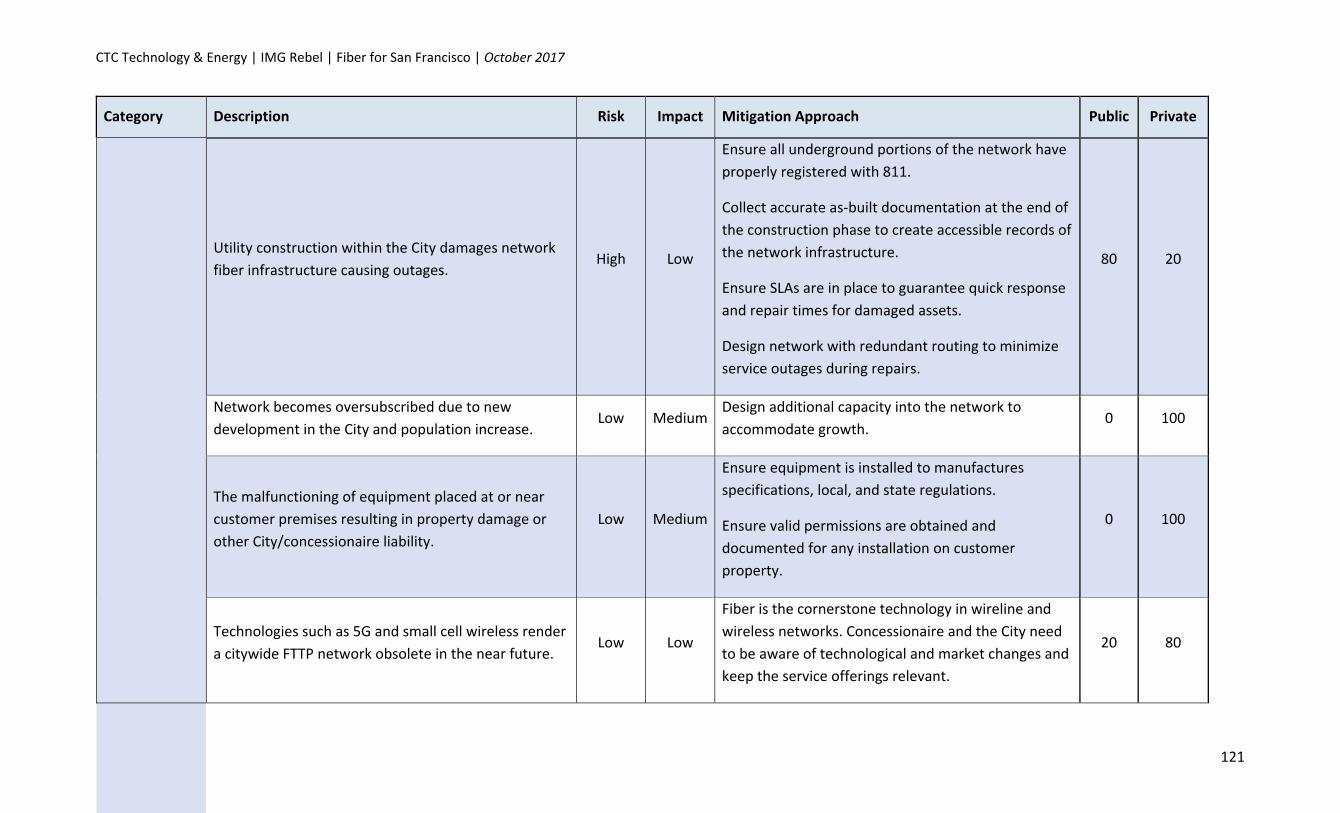
CTC Technology & Energy | IMG Rebel | Fiber for San Francisco | October 2017
121
Category Description Risk Impact Mitigation Approach Public Private
Utility construction within the City damages network
fiber infrastructure causing outages. High Low
Ensure all underground portions of the network have
properly registered with 811.
Collect accurate as‐built documentation at the end of
the construction phase to create accessible records of
the network infrastructure.
Ensure SLAs are in place to guarantee quick response
and repair times for damaged assets.
Design network with redundant routing to minimize
service outages during repairs.
80 20
Network becomes oversubscribed due to new
development in the City and population increase. Low Medium
Design additional capacity into the network to
accommodate growth. 0 100
The malfunctioning of equipment placed at or near
customer premises resulting in property damage or
other City/concessionaire liability.
Low Medium
Ensure equipment is installed to manufactures
specifications, local, and state regulations.
Ensure valid permissions are obtained and
documented for any installation on customer
property.
0 100
Technologies such as 5G and small cell wireless render
a citywide FTTP network obsolete in the near future. Low Low
Fiber is the cornerstone technology in wireline and
wireless networks. Concessionaire and the City need
to be aware of technological and market changes and
keep the service offerings relevant.
20 80
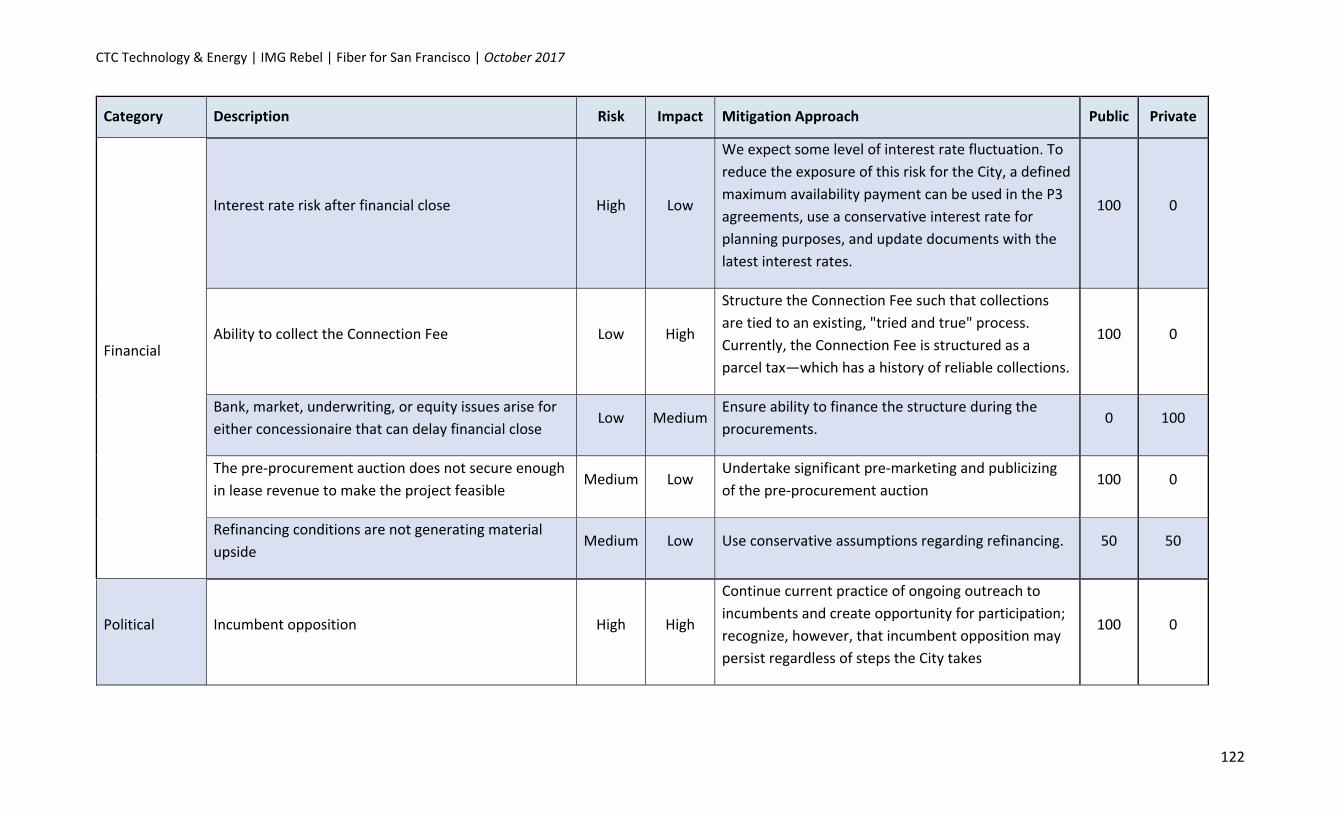
CTC Technology & Energy | IMG Rebel | Fiber for San Francisco | October 2017
122
Category Description Risk Impact Mitigation Approach Public Private
Financial
Interest rate risk after financial close High Low
We expect some level of interest rate fluctuation. To
reduce the exposure of this risk for the City, a defined
maximum availability payment can be used in the P3
agreements, use a conservative interest rate for
planning purposes, and update documents with the
latest interest rates.
100 0
Ability to collect the Connection Fee Low High
Structure the Connection Fee such that collections
are tied to an existing, "tried and true" process.
Currently, the Connection Fee is structured as a
parcel tax—which has a history of reliable collections.
100 0
Bank, market, underwriting, or equity issues arise for
either concessionaire that can delay financial close Low Medium
Ensure ability to finance the structure during the
procurements. 0 100
The pre‐procurement auction does not secure enough
in lease revenue to make the project feasible Medium Low
Undertake significant pre‐marketing and publicizing
of the pre‐procurement auction 100 0
Refinancing conditions are not generating material
upside Medium Low Use conservative assumptions regarding refinancing. 50 50
Political Incumbent opposition High High
Continue current practice of ongoing outreach to
incumbents and create opportunity for participation;
recognize, however, that incumbent opposition may
persist regardless of steps the City takes
100 0
CTC Technology & Energy | IMG Rebel | Fiber for San Francisco | October 2017
123
Category Description Risk Impact Mitigation Approach Public Private
Delays to City approvals for the P3 contracts or the
project ? Medium
Gain a clear understanding of all City approvals that
are needed for this project, and engage with
stakeholders early and often.
100 0
Managing concerns and issues raised by public
stakeholders that can stop the project Medium Medium
Work with legislators, stakeholders, elected officials,
etc. to fully understand public concerns.
Prior to financial close, the public will own all of this
risk. Post financial close, the concessionaire will want
to be engaged in efforts to manage stakeholder
issues, and shaping public opinion about the project,
and services provided.
80 20
P3 dark fiber procurement does not garner significant
market interest, and does not generate robust
competition
Low High Engage the market early to understand interest,
identify possible issues/show stoppers, etc. 100 0
Procurement
Delays in the procurement process for either P3 High MediumSet a realistic schedule for the two P3s, including an
appropriate timeframe for review, approvals, etc. 100 0
Limited competition in subsequent rounds of the lit
fiber P3 Medium Medium
Carefully structure the market and align incentives for
the future base level service P3 procurement (in 5‐7
years)
100 0

CTC Technology & Energy | IMG Rebel | Fiber for San Francisco | October 2017
124
Category Description Risk Impact Mitigation Approach Public Private
Proposals received in the dark fiber P3 procurement
make it very difficult to implement the lit fiber P3 Medium High
Structure the dark fiber P3 procurement with the
base level service P3 in mind, and include dialogue
and time delay between the procurements in order to
identify and address issues.
100 0
Bidder appeals of the procurement process,
particularly if it is seen to advantage an incumbent, or
limit subsequent competition
Low MediumClearly articulate the rules of the procurement
process, to limit opportunities for appeal. 100 0
Distortion of level playing field, lack of a competitive
procurement due to collusion, having one bidder
secure a very large lease, etc.
Medium High
Keep an active eye on issues associated with
collusion, and manage pre‐procurement auction
properly to avoid issues of large lessees that are
dedicated to one proposer.
100 0

CTC Technology & Energy | IMG Rebel | Fiber for San Francisco | October 2017
125
Appendix D: Direct Economic Benefits of Fiber Construction in SanFranciscoTo determine the potential economic benefits of the Fiber for San Francisco Initiative, the
following is an analysis of the potential direct job creation from this initiative, as construction
labor and network staffing represents a large portion of the total project cost
CTC engineers undertook an independent analysis of likely job creation based on our experience
analyzing, testing, and designing communications networks and on our observations of fiber
deployments elsewhere. Our analysis is also based on our direct experience with network
projects in other cities that are substantially similar to San Francisco.
In our experience, there are two distinct categories of direct job creation from broadband
initiatives: (1) network construction and (2) operations:
The first category of direct jobs will only exist during the three‐year project construction period.
These jobs relate to the labor associated with construction and deployment of the network (e.g.,
technicians and construction workers who lay the broadband pipes).101 This category of job
creation includes the direct labor associated with installing the infrastructure components and
equipment that takes the fiber to the user location. It also includes construction of wireless tower
structures and network electronics.
Fiber construction in San Francisco will have an immediate impact in the construction and
information technology sectors. Workers will engage in engineering, planning, and
environmental compliance. During the intensive three‐year construction period, workers will dig
ditches and trenches and place fiber in the ground and on utility poles. Additional workers will
place and configure communications equipment, manage installation, repair supporting
infrastructure, and interact with customers. Some of these direct benefits will accrue to workers
from outside the community. Nonetheless, these workers will benefit the local economy because
they will purchase fuel, eat at local restaurants, and sleep in local hotels.
Based on our experience, we conservatively estimate that 309 jobs per year will be created during
the three‐year construction phase of a San Francisco build‐out (Table 27).
101 Robert D. Atkinson, Daniel Castro and Stephen J. Ezell, “The Digital Road to Recovery: A Stimulus Plan to Create Jobs, Boost Productivity and Revitalize America,” ITIF, Jan. 7, 2009, at 2 (http://www.itif.org/files/roadtorecovery.pdf) (accessed May 10, 2017).

CTC Technology & Energy | IMG Rebel | Fiber for San Francisco | October 2017
126
Table 27: Estimate of Job Creation During Network Construction
Item Unit Avg. Hours Per Unit
Project Scope
Estimated Total Hours
Construction FTEs (3‐Year Build Out)
Project Management and Quality Control
Miles 110 1,830 201,300 35
Physical Plant Engineering and Permitting
Miles 80 1,830 146,400 25
Construction Miles 580 1,830 1,061,400 184
Network Electronics Design and Deployment
Subscribers 1 373,481 373,481 65
TOTAL 309
The second category of direct job creation includes jobs associated with the ongoing operations
for both the dark fiber and the network electronics. The network will create skilled jobs as
workers install and activate communications equipment and other materials that are essential
for the operation of the fiber optics. We estimate that at least 170 jobs will be created per year
in the operations phase for fiber maintenance and network operations, including:
47 FTEs to operate the fiber portion of the network
8 FTE contractors for locates and ticket processing102
27 FTE contractors for fiber repairs103
88 FTEs for network operations (e.g., network support, network management, call centers
and customer support)
The first three categories of operations’ jobs relate to the maintenance of the dark fiber network.
The majority of these jobs are likely to be located in or near the City of San Francisco, since they
entail maintaining the physical aspects of the network, which cannot be completed remotely. A
significant percentage of the final category (network operations, which includes activities related
to providing customer service and managing call centers) can be performed in other parts of the
country, and perhaps the world.
In sum, we estimate that construction of the 1,830‐mile fiber network will support 309 jobs in
each of the three years that the project is constructed and an additional 170 jobs throughout the
project life.
102 Based on estimated fees paid to contractor for services in year 5 and thereafter ($712,900), assuming 90 percent of listed expenses attributed to labor costs, $60,000 per FTE, and a 40 percent cost burden per FTE. 103 Based on estimated fees paid to contractor for services in year 5 and thereafter ($15,040,400), assuming 25 percent of fiber repair expenses attributed to labor costs, $100,000 per FTE, and a 40 percent cost burden per FTE.

CTC Technology & Energy | IMG Rebel | Fiber for San Francisco | October 2017
127
AppendixE:TechnicalPerformanceMetricsandStandards
StandardSpecificationsforConstructionandMaintenanceoftheFTTPNetworkFiberThe selected Dark Fiber Concessionaire shall provide the design, engineering, permitting,
procurement, material coordination, construction, testing, and completion of a fiber optic
network, primarily consisting of, but not limited to, the following tasks:
Develop system‐level network designs that meet the City’s goals;
Perform field walk‐out and documentation of all fiber routes;
Prepare GIS‐based designs and CAD construction prints of final designs;
Obtain all necessary permits, including environmental approvals and/or jurisdictional
determinations;
Obtain all necessary agreements for utility pole attachment or third‐party conduit use;
Initiation of utility locate requests through the USA North 811, and strict adherence to all
California utility locating laws;
Sub‐surface installation of conduit, primarily through the use of horizontal directional
drilling, microtrenching, and trenching, including existing utility locating through test
pitting, traffic control, and permanent surface restoration;
Installation of underground handholes and ground rods, including permanent paved
surface restoration;
Placement of fiber optic cable and tracer wire in conduit;
Installation of new messenger strand between utility poles for aerial cable construction,
to include installation or relocation of guy wires and anchors;
Lash and/or overlash fiber optic cable to aerial messenger strand;
Installation of fiber splice enclosures and fiber splicing;
Installation of telecommunication huts and fiber distribution cabinets;
Placement and assembly of fiber termination panels and related hardware;
Optical performance testing of fiber optic strands;
Ongoing network maintenance and repair; and

CTC Technology & Energy | IMG Rebel | Fiber for San Francisco | October 2017
128
Provision and storage of all materials related to the above construction tasks.
The Concessionaire shall be responsible for identifying and securing suitable space for material
and equipment storage and staging during construction.
The Concessionaire will provide regular progress reporting, and will closely coordinate its
construction schedule with the City. The Concessionaire shall provide a primary point of contact
to the City for the duration of the contract, and shall be expected to attend regular project status
and management meetings. The Concessionaire shall provide daily progress reporting and
forecasting of the construction locations for the following work day during active construction
phases of the project, and shall provide weekly reporting of key progress metrics to be defined
by the City.
NetworkDesignSpecificationsThe design for the FTTP network shall be in accordance with the goals and objectives expressed
by the City. The design is limited to the physical layer of the network (conduit, fiber, hub
locations, etc.), and does not include network electronics, but must take into account current
and emerging FTTP network technologies. It is the intent of the City for the FTTP physical
infrastructure to support any current or future mix of Passive Optical Network (PON), Active
Ethernet, and/or future technology standard.
NetworkConstructionSpecificationsConstruction of the network shall be in compliance with the National Electrical Code, the National
Electric Safety Code, and applicable industry standards, as well as any and all other applicable
Federal, State and local laws and regulations. Construction methods and techniques used shall
be in accordance with the recommended practices and procedures published by leading industry
manufacturers and trade associations, including but not limited to the following:
Society of Cable Telecommunications Engineers (SCTE) Recommended Practices for
Optical Fiber Construction and Testing;
Telcordia Blue Book – Manual of Design‐Builder’s Procedures;
California Occupational Safety and Health (Cal/OSHA) Division; and
Federal Occupational Safety and Health Administration (OSHA) regulations.
Construction shall also follow all applicable local standards, including but not limited to the
following:
Department of Public Works Standard Specifications and Plans;
CTC Technology & Energy | IMG Rebel | Fiber for San Francisco | October 2017
129
Department of Public Works Order Number 178,940;
San Francisco Municipal Transportation Agency Regulations for Working in
San Francisco Streets (Blue Book); and
California Public Utilities Commission General Order 95.
The contractors shall be aware of all standards and their application. Ignorance or lack of
knowledge shall not be an excuse for improper work to occur. Any work constructed in violation
of any applicable code shall be corrected and re‐installed properly at the Contractor’s expense.
ConstructionMaterialSpecificationsMaterials used in the construction of the network must meet acceptable industry standards and
shall meet the City’s specification for each individual item.
Conduit used for the construction of the network will generally have a nominal diameter of 2
inches, unless otherwise directed by the City. Conduit shall be high‐density polyethylene (HDPE)
roll duct meeting applicable ASTM standards. All supplied conduit shall have a smooth inner wall
and smooth outer wall. All conduit shall be pre‐lubricated, and contain a pre‐installed 1100‐
pound polyester pull tape.
When microtrenching is used to construct the network, microduct shall be used in place of
conduit. Microduct shall be high‐density polyethylene (HDPE) that conforms to ASTM D3350‐98a,
Type III, Category 5, Class B or C and Grade P‐34 per ASTM D1248‐84, or meets equivalent
standards. Unless otherwise directed by the City, microduct shall conform to the following sizes:
12mm nominal outside diameter and 8mm nominal inside diameter
14mm nominal outside diameter and 10mm nominal inside diameter
The fiber optic cable used for the construction of the network shall be in accordance to the
following specifications:
Ribbon optical cable for backbone applications, containing 12‐strand ribbons, conforming
to international standards ITU‐T G.652.D and Telcordia GR‐20.
Loose buffer tube optical cable for service drop applications, containing 12‐strand buffer
tubes, in 12 and 24‐count sheaths, conforming to international standards ITU‐T G.652.D
and Telcordia GR‐20.
Delivered on reels holding a contiguous fiber cable length of up to 18,000 feet. The
Contractor shall be expected to coordinate cable orders to ensure cable lengths are

CTC Technology & Energy | IMG Rebel | Fiber for San Francisco | October 2017
130
provided as needed support contiguous cable runs without splicing (not including mid‐
sheath splices) according to final engineering designs.
Comprised of All Dielectric (AD) materials.
Comprised of a gel‐free cable design incorporating dry water‐blocking elements.
Marked, in permanent white characters, with:
o Manufacturer name
o Month and year of manufacture
o Number of optical fibers
o Sequential length markings, minimum of every two feet, in feet
SpecificationsforFiberTestingOptical performance tests shall be performed for all new and/or repaired cables to validate the
optical performance of the entire link, as well as to verify that fiber splicing has occurred
according to supplied splice matrices. This testing will consist of bi‐directional OTDR testing, as
well as direct optical attenuation and continuity testing using a calibrated optical source and
power meter. This testing shall occur only after fibers are terminated on both ends of a link, and
all intermediate construction and/or splicing involving the re‐entry of installed splice cases or
handling of the fiber optic cable is completed for a particular segment under test. Electronic
documentation of all test results shall be provided to the City.
Testing shall be deemed successfully completed if: (1) maximum fiber losses meet manufacturer
specifications, with an allowance for splices and connectors; (2) individual splice losses do not
exceed 0.1 dB; and (3) maximum mated connector losses do not exceed manufacturer
specifications. Testing will be performed by the Concessionaire’s contractors, and may be
observed by the City and other designated representatives of the City. The City may request
and/or perform additional testing to verify results prior to accepting test data.
An OTDR shall be used to measure and document splice losses and connector losses. To correctly
identify abnormalities at a short range, a 100‐meter or longer launch cable shall be used between
the OTDR and the fiber under test. Bi‐directional traces shall be acquired for each fiber. If the
connection of the launch cable to the patch panel requires optimization by the operator,
sampling acquisition will commence upon completion of the optimization.

CTC Technology & Energy | IMG Rebel | Fiber for San Francisco | October 2017
131
Each fiber will be identified, and the results of the test for each fiber will be recorded as indicated
below. The test will be repeated for each of the fibers linking a particular site. All tests will be
made at 1310 nm and 1550 nm.
Settings on the OTDR shall reflect the following:
The Refractive Index shall be set for the actual fiber utilized (commonly‐used Corning
SMF‐28 single mode fiber has a refractive index of 1.4677 at 1310 nm);
Pulse width no greater than 100 ns (10m) for all fiber lengths;
Scattering coefficient specified by the fiber manufacturer for each wavelength tested;
A minimum of 10,000 sampling acquisitions (averages);
Maximum range set to no more than 10 km for all fiber length less than 10 km;
Maximum range set to no more than 25 km for fiber lengths greater than 10 km; and
Event threshold: 0.05 dB.
A uniform file‐naming scheme for recorded data shall be used that comply with conventions
mutually agreed upon by the City and the Concessionaire.
Installed optical fiber OTDR test documentation shall include:
Total fiber length;
Individual fiber traces for complete fiber length;
Losses of individual splices and connectors;
Losses of other anomalies;
Wavelength tested and measurement directions;
Manufacturer, model and serial number of the test equipment; and
Name and company of the technician performing the tests.
All data collected at each location during the tests shall be recorded at the time of the tests using
electronic means.

CTC Technology & Energy | IMG Rebel | Fiber for San Francisco | October 2017
132
Optical power meter measurements shall be made at the same time as the OTDR tests to
determine overall fiber loss and to ensure that fibers have appropriate end‐to‐end continuity
(fibers not crossed). Power meter testing shall be performed at both 1310 nm and 1550 nm and
shall report the relative loss of each fiber strand.
FiberMaintenanceRequirementsFiber maintenance and emergency repair services shall be made available on a 24x7x365 basis.
The Dark Fiber Concessionaire shall have a reasonable inventory of materials and vehicles
normally supplied under the terms of this contract for maintenance requests and emergency
repairs. These items below describe the minimum level of service the Dark Fiber Concessionaire
shall provide to the Lit Fiber Concessionaire and the City. Exact terms should be determined on
a case‐by‐case basis and stated in an SLA with the Lit Fiber Concessionaire.
• Mean time to acknowledge: 1 hour
• Mean time to respond: 4 hour
• Mean time to repair fiber: 24 hours
Time to acknowledge means time for the Dark Fiber Concessionaire to acknowledge receipt of
the service request and verbally communicate an acceptable plan of action to resolve service
request submitted by the City or Lit Fiber Concessionaire.
Time to respond means time to arrive at the location of fiber damage, with all necessary
equipment and personnel resources to make repairs.
PerformanceRequirementsfortheLitNetworkThe selected Lit Fiber Concessionaire shall provide operation of the network’s lit services,
primarily consisting of, but not limited to, the following tasks:
• Transport of the network’s services;
• Design and operation of the Civic Network;
• NOC (network operations center) services which include monitoring, troubleshooting,
and fixing the transport network;
• Providing support and provisioning services for Retail Service Providers; and
• Engaging the Dark Fiber Concessionaire when a fix or new fiber installation is required.

CTC Technology & Energy | IMG Rebel | Fiber for San Francisco | October 2017
133
LitNetworkPerformanceSpecificationsThe Lit Fiber Concessionaire shall supply and provision network electronics capable of delivering
highly‐available transport for a variety of services over the dark fiber. Transport services shall
meet or exceed a Committed Information Rate (CIR) of 50 Mbps with the ability to provide a
range of upstream and downstream speeds up to symmetrical 1 Gbps speeds from the Provider
Port to the point of network interface.
Transport services provided by the Concessionaire shall meet the following minimum
performance requirements for any link between a RSP port and a subscriber port or between any
two subscriber ports on the network.
• Network availability (monthly): 99.9%
• Packet loss: < 0.3%
• Latency (one‐way): < 10 ms
• Jitter (one‐way): < 3 ms
NetworkMonitoringRequirementsThe Lit Fiber Concessionaire shall also provide NOC services to monitor the network and act as
the central point of contact for service requests and trouble reports from service providers. For
requests that fall outside their scope responsibilities, the NOC shall be responsible for dispatching
the correct team. These items below describe the minimum level of service the NOC shall provide
to RSPs. Exact terms should be determined on a case‐by‐case basis and stated in an SLA with each
RSP.
• Mean time to acknowledge: 15 minutes
• Mean time to provision (excluding fiber and electronics): 4 hours
• Mean time to respond: 4 hours
• Mean time to repair (excluding fiber): 6 hours
• Mean time to repair fiber: 24 hours
Time to acknowledge means time for a NOC representative to acknowledge receipt of a service
request or trouble report submitted by an RSP. This excludes automated responses.
Time to provision means time to provision an existing service EVC to an existing subscriber port.
This excludes cases that require new fiber, new service drops, or new electronics.
Time to respond means time to arrive on site with electronics or arrive at location of fiber
damage, whichever is applicable.

CTC Technology & Energy | IMG Rebel | Fiber for San Francisco | October 2017
134
AppendixF:ListofInformationtoBeAvailabletoBiddersThis appendix identifies information deemed useful to a Master Developer looking to build a
ubiquitous broadband network (such as FTTP) throughout the City. The datasets identified in this
report are categorized by the type of information they contain, including:
1. City and third‐party infrastructure
2. Public right‐of‐way and City‐owned property
3. Potential network users
4. Construction standards and restrictions
For each category, this appendix identifies what data are available, recommends what additional
data should be collected, and proposes a method for the collection of the additional data.
CityandThird‐PartyInfrastructureCity‐owned or third‐party infrastructure that exists within the public right‐of‐way (e.g., conduit
or utility poles) may prove beneficial to a Master Developer that can leverage those assets to
reduce its construction costs and avoid the challenges of the City’s crowded rights‐of‐way.
Existing infrastructure could also present obstructions and potential complications during
construction. Underground utilities such as gas, water, and sewer take up space in the right‐of‐
way and may make construction of new utilities difficult in some locations. Additionally, street
furniture, which may provide value for wireless deployments, can also present obstacles for
certain types of underground construction.
AvailableDataThe City has some data on existing infrastructure, but most of the datasets provide limited
information beyond the location of the asset. A Master Developer could use this information to
get a general sense of the assets in the City, but additional work would be required to make the
data more useful. Table 28 identifies data that are available for use by a Master Developer.
Table 28: Available Information on Existing Infrastructure
ID # Dataset
2.1.1 San Francisco Department of Technology Fiber Map
1.1.2 San Francisco Department of Public Works Utility Undergrounding Map
2.1.3 San Francisco Public Utilities Commission Conduit, Pullboxes, and Street Lights
2.1.4 San Francisco Municipal Transportation Agency Conduit Map
2.1.5 San Francisco Municipal Transportation Agency Routes and Stops
2.1.6 San Francisco Municipal Transportation Overhead Lines Trolley Pole Database 150813
2.1.7 San Francisco Municipal Transportation Map of Traffic Signals
2.1.8 San Francisco Department of Public Works Map of Street Trees

CTC Technology & Energy | IMG Rebel | Fiber for San Francisco | October 2017
135
SanFranciscoDepartmentofTechnologyFiberNetworkMapThis dataset provides a map of the municipal fiber network operated by the Department of
Technology (DT). The map also identifies which portions of the network are underground and
which are aerial. This information may be useful as a Master Developer may be able to utilize
additional conduit space on the underground fiber routes or overlash to the City’s aerial routes
to reduce construction expenses. DT can provide this map to the Master Developer.
SanFranciscoDepartmentofPublicWorksUtilityUndergroundingMapThis dataset is a geocoded map of where the power and telecommunications utilities are
underground. The dataset does not contain any specific information about the utilities, just that
utilities are located underground. This dataset may inform a Master Developer of where aerial
construction may not be possible. This map can be made available to the Master Developer by
the San Francisco Public Utilities Commission (SFPUC).
SanFranciscoPublicUtilitiesCommissionConduit,Pullboxes,andStreetlightsThis dataset provides a geocoded map of all SFPUC‐owned conduit installed prior to September
2005, as well as data on SFPUC streetlights and pullboxes. This conduit information may be useful
to a Master Developer that seeks to use existing conduit space to reduce its construction
expenses. The information on streetlight locations may be useful when looking at Smart City
applications or hybrid 5G solutions that require equipment to be mounted on structures. This
map can be made available to the Master Developer by the SFPUC.
SanFranciscoMunicipalTransportationAgencyConduitMapThis dataset provides geospatial data for the fiber cable conduit used by the traffic signal network
(SFGo). All other information on SFMTA conduit is kept in paper records, which may not capture
all of the existing conduit routes. If SFMTA is willing to allow access to its conduit, this information
may be useful to a Master Developer that seeks to use existing conduit space to reduce its
construction expenses. This dataset can be made available to the Master Developer by the
SFMTA.
SanFranciscoMunicipalTransportationAgencyRoutesandStopsThis dataset provides a map SFMTA’s route and stop locations. While this dataset does not show
conduit or fiber locations, SFMTA’s light rail network has conduit and fiber along the routes and
may provide a good starting point for further investigation. The dataset also identifies whether a
stop is sheltered, which may help to identify street furniture where 5G equipment could be
mounted. This dataset can be found on dataSF via the link below.
SFMTA Routes and Stops Map: https://data.sfgov.org/Transportation/SFMTA‐routes‐and‐stops‐
for‐March‐2012/f5c3‐8kkj
CTC Technology & Energy | IMG Rebel | Fiber for San Francisco | October 2017
136
SanFranciscoMunicipalTransportationOverheadLinesTrolleyPoleDatabase150813This dataset provides estimated locations of poles supporting electric distribution wires for
trolley lines—however, the data are 30 years old. It is possible that under some circumstances
these poles could be used to support aerial fiber deployment. This dataset can be provided to a
Master Developer by SFMTA.
SanFranciscoMunicipalTransportationMapofTrafficSignalsThis dataset provides maps of locations where the City has traffic signals. This information may
be useful to a Master Developer as it provides the general location of traffic cabinets which could
potentially serve as hub locations for the FTTP network or a Smart City network. The traffic signal
map can be found on dataSF via the link below.
Traffic Signal Map: https://data.sfgov.org/Transportation/Map‐of‐Traffic‐Signals/8xta‐sna8
SanFranciscoDepartmentofPublicWorksStreetTreeMapThis dataset provides a map of the locations of DPW‐owned and maintained street trees. This
information may be useful to a Master Developer because knowing the locations of the trees will
allow the Master Developer to anticipate potential conflicts with the microtrenching construction
methodology or where tree trimming may be required during aerial construction. Additionally,
the trees may pose an issue to any potential hybrid 5G solution with equipment that requires
direct line‐of‐sight. The street tree map can be found on dataSF via the link below.
DPW Street Tree Map:
https://data.sfgov.org/browse?q=Street%20Tree%20Map&sortBy=relevance&utf8=%E2%9C%9
3
AdditionalDataRecommendationsWhile the City has some data on existing infrastructure, the existing datasets would benefit from
a higher level of detail. Additionally, the collection of data for several key utilities would provide
value. The following data would be useful for a Master Developer.
CollectUtilityPoleDatafromOtherNCJPAMembersHaving access to information on the locations of utility poles would be useful for a Master
Developer as it would help them to assess options for aerial construction within the City. As a
member of the Northern California Joint Pole Association (NCJPA), the City can request maps of
pole locations from PG&E, AT&T, and other owners. The City could provide this information to a
selected Master Developer under a Non‐Disclosure Agreement (NDA). We recommend that the
City work directly with the pole owners to obtain this information if possible. Ideally, the
information could be provided in GIS format as part of a complete database of spatially accurate
pole locations. However, it is possible the pole locations can only be provided in paper map books
or another format. At the very least the City should alert the NCJPA members to the possibility
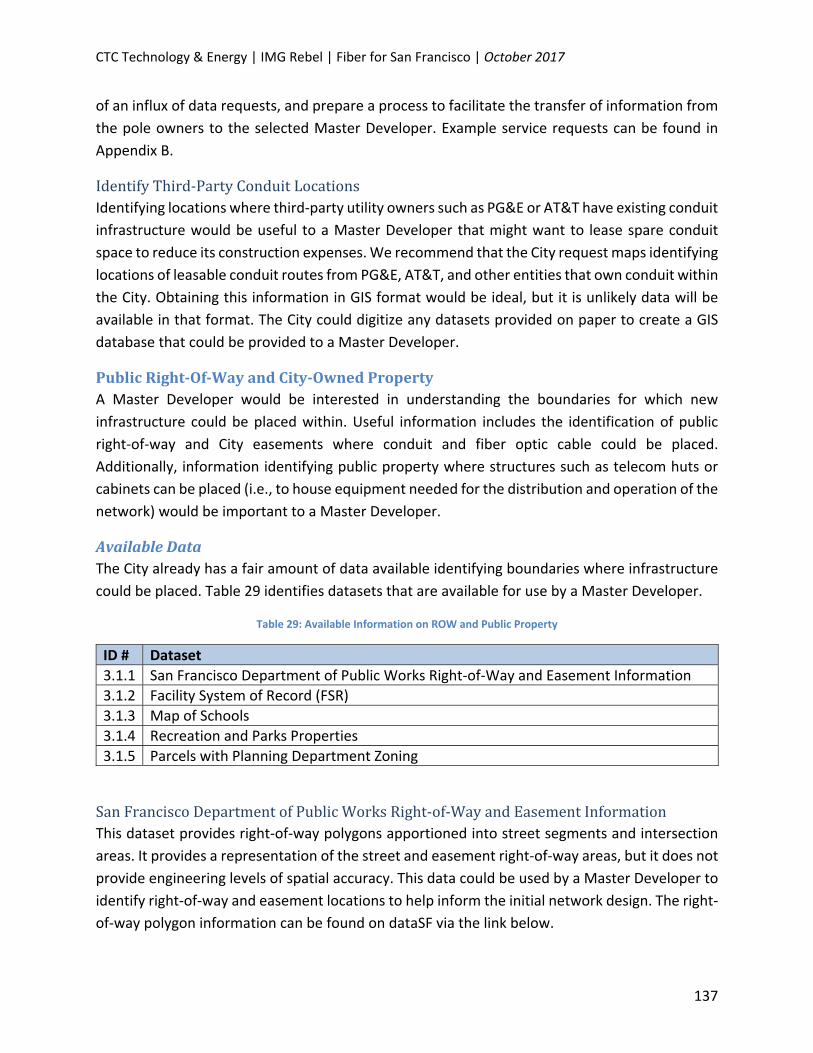
CTC Technology & Energy | IMG Rebel | Fiber for San Francisco | October 2017
137
of an influx of data requests, and prepare a process to facilitate the transfer of information from
the pole owners to the selected Master Developer. Example service requests can be found in
Appendix B.
IdentifyThird‐PartyConduitLocationsIdentifying locations where third‐party utility owners such as PG&E or AT&T have existing conduit
infrastructure would be useful to a Master Developer that might want to lease spare conduit
space to reduce its construction expenses. We recommend that the City request maps identifying
locations of leasable conduit routes from PG&E, AT&T, and other entities that own conduit within
the City. Obtaining this information in GIS format would be ideal, but it is unlikely data will be
available in that format. The City could digitize any datasets provided on paper to create a GIS
database that could be provided to a Master Developer.
PublicRight‐Of‐WayandCity‐OwnedPropertyA Master Developer would be interested in understanding the boundaries for which new
infrastructure could be placed within. Useful information includes the identification of public
right‐of‐way and City easements where conduit and fiber optic cable could be placed.
Additionally, information identifying public property where structures such as telecom huts or
cabinets can be placed (i.e., to house equipment needed for the distribution and operation of the
network) would be important to a Master Developer.
AvailableDataThe City already has a fair amount of data available identifying boundaries where infrastructure
could be placed. Table 29 identifies datasets that are available for use by a Master Developer.
Table 29: Available Information on ROW and Public Property
ID # Dataset
3.1.1 San Francisco Department of Public Works Right‐of‐Way and Easement Information
3.1.2 Facility System of Record (FSR)
3.1.3 Map of Schools
3.1.4 Recreation and Parks Properties
3.1.5 Parcels with Planning Department Zoning
SanFranciscoDepartmentofPublicWorksRight‐of‐WayandEasementInformationThis dataset provides right‐of‐way polygons apportioned into street segments and intersection
areas. It provides a representation of the street and easement right‐of‐way areas, but it does not
provide engineering levels of spatial accuracy. This data could be used by a Master Developer to
identify right‐of‐way and easement locations to help inform the initial network design. The right‐
of‐way polygon information can be found on dataSF via the link below.

CTC Technology & Energy | IMG Rebel | Fiber for San Francisco | October 2017
138
Right‐of‐Way Polygons: https://data.sfgov.org/City‐Infrastructure/Right‐of‐Way‐
Polygons/a2mg‐gwmg
FacilitySystemofRecord(FSR)This dataset provides the City’s best available list of public property, including City‐owned and
leased facilities, and facilities owned by non‐City public entities. This dataset would inform a
Master Developer of possible locations for the placement of structures to house the equipment
needed to distribute and operate the FTTP services. Identifying these structure locations is a
crucial part of the initial design process. The Facility System of Record list can be made available
by DT.
MapofSchoolsThis dataset details the location of all schools (Infant, Pre‐K, and K‐12). The data points can be
combined with parcel data to identify school property limits. The school location data point
information can be found on dataSF via the link below.
Map of School Locations: https://data.sfgov.org/Economy‐and‐Community/Map‐of‐
Schools/qb37‐w9se
RecreationandParksPropertiesThis dataset details data points of property owned and maintained by the San Francisco
Recreation and Parks Department. The information includes parks and other types of open
spaces within the City. The data points can be combined with parcel data to identify property
limits. The Recreation and Parks property information can be found on dataSF via the link below.
Recreation and Parks Property Locations: https://data.sfgov.org/Culture‐and‐Recreation/Park‐
and‐Open‐Space‐Map/4udc‐s3pr
ParcelswithPlanningDepartmentZoningThis dataset contains every parcel in San Francisco and each parcel’s zoning. This information can
be found on dataSF via the link below.
Parcels with Zoning Information: https://data.sfgov.org/City‐Infrastructure/Parcels‐With‐
Planning‐Department‐Zoning/6b2n‐v87s
AdditionalDataRecommendationsThe available datasets should provide enough information for purposes of the initial network
design. A Master Developer will need to perform additional research as part of the detailed
design engineering to ensure that new infrastructure is placed properly within the public space.

CTC Technology & Energy | IMG Rebel | Fiber for San Francisco | October 2017
139
PotentialNetworkUsersThe City’s goal is to build a ubiquitous communications network that will provide fiber to every
home and business within San Francisco. To achieve this, a Master Developer would need to
understand the quantity and location of potential users.
AvailableDataThe City has a few datasets that will provide a good starting point for a Master Developer to begin
the process of identifying service locations. Table 30 identifies datasets available for use.
Table 30: Available Information on Potential Users
ID # Dataset
4.1.1 Addresses with Units from the City’s Enterprise Addressing System (EAS)
4.1.2 Department of Planning Land Use Map
4.1.3 Treasurer‐Tax Collector Registered Business Locations
AddresseswithUnitsfromtheCity’sEnterpriseAddressingSystem(EAS)This dataset lists all active addresses from the City's Enterprise Addressing System, including sub‐
addresses, such as individual units. The Master Developer could use this dataset to identify
service locations in the City, which will help inform the initial network design. The EAS can be
found on dataSF via the link below.
EAS: https://data.sfgov.org/Geographic‐Locations‐and‐Boundaries/Addresses‐with‐Units‐
Enterprise‐Addressing‐System‐/dxjs‐vqsy
DepartmentofPlanningLandUseMapThis dataset details the land use information for each parcel within the City and identifies the
number of residential units located on that parcel. The dataset does not include unregistered or
illegal residential units, nor does it include any information on non‐residential buildings. This
dataset will be useful because it provides the number of residential units for each parcel; the
Master Developer may be able to use these data in conjunction with the Registered Business
Location dataset to identify the density of users for a given area, which will help inform the initial
network design. The Land Use Map can be found on dataSF via the link below:
Land Use Map: https://data.sfgov.org/Housing‐and‐Buildings/Land‐Use/us3s‐fp9q
Treasurer‐TaxCollectorRegisteredBusinessLocationsThis dataset lists the street address and latitude‐longitude coordinates of each registered
business in the City. This dataset will be useful to map the locations of all businesses throughout
the City. The Master Developer may be able to use this dataset in conjunction with residential
information from the Land Use Map to identify the density of users for a given area, which will

CTC Technology & Energy | IMG Rebel | Fiber for San Francisco | October 2017
140
help inform the initial network design. The registered business locations can be found on dataSF
via the link below.
Registered Business Locations: https://data.sfgov.org/Economy‐and‐Community/Registered‐
Business‐Locations‐San‐Francisco/g8m3‐pdis
AdditionalDataRecommendationsThe available datasets should be sufficient for a Master Developer to identify the potential users
and service locations for proposes of the initial network design. As part of the detailed design
engineering, the Master Developer should confirm the total number of service locations while
performing the site survey work.
ConstructionStandardsandRestrictionsAs the scope of this project will require citywide construction, it is important that the Master
Developer understands the City’s approved construction standards and restrictions. This will
allow them to better understand the level of effort required for the project and help them to
make appropriate assumptions on how the network can be built. Important information would
include approved construction methodologies, standard specifications, identification of
jurisdictional restrictions, and permitting processes.
AvailableDataTable 31 identifies datasets that are available for use by a Master Developer.
Table 31: Available Information on Construction Standards and Restrictions
ID # Dataset
5.1.1 California Public Utilities Commission General Order No. 95 (GO 95)
5.1.2 Northern California Joint Pole Association Operations/Routine Handbook 2016
5.1.3 San Francisco Municipal Transportation Agency Regulations for Working In San Francisco Streets (Blue Book)
5.1.4 Department of Public Works Standard Specifications and Plans
5.1.5 Department of Public Works Excavation Regulations
5.1.6 AT&T General Terms and Conditions for Conduit Use
5.1.7 PG&E Conduit License Agreement
5.1.8 Department of Public Works Utility Excavation Moratorium Streets List
5.1.9 Department of Public Works Pavement Condition Index (PCI) Scores List
5.1.10 City Projects for Utility Excavation and Paving
CaliforniaPublicUtilitiesCommissionGeneralOrderNo.95(GO95)This document provides rules and requirements for overhead line design, construction, and
maintenance within the State of California and is applicable to utility poles within the City. The

CTC Technology & Energy | IMG Rebel | Fiber for San Francisco | October 2017
141
Master Developer could use this information to understand the effort required to construct
aerially within the City.
A link to each of the sections of GO 95 can be found on California Public Utilities Commission’s
website via the following link: http://www.cpuc.ca.gov/gos/GO95/go_95_section_1.html
NorthernCaliforniaJointPoleAssociationOperations/RoutineHandbook2016This document provides a comprehensive overview of the pole attachment process for all joint‐
owned poles within the City. Information in the document includes the attachment process for
joint owners, attachment standards, and authorized costs. The Master Developer could use this
information to understand the pole attachment process and the effort required to construct
aerially within the City. As a member of the NCJPA, the City has access to this document and can
provide it to the selected Master Developer.
SanFranciscoMunicipalTransportationAgencyRegulationsforWorkinginSanFranciscoStreets(BlueBook)
This document is a manual for City agencies (DPW, Muni, SFWD, DPT, Port of SF, etc.), utility
crews, private contractors, and others doing work in San Francisco’s streets. It establishes rules
for working safely and in a way that will cause the least possible interference with pedestrian,
bicycle, transit, and other traffic. The document includes requirements for permitting, traffic
control procedures, and agency contact information—all which would be useful for a Master
Developer.
A link to each of the sections of the standard specification document can be found on SFMTA’s
website via the following link: https://www.sfmta.com/services/streets‐sidewalks/construction‐
regulations
DepartmentofPublicWorksStandardSpecificationsandPlansThe Standard Specifications provide information on the City’s requirements for various types of
construction projects, including types of construction that would overlap with fiber construction.
The specifications that will most likely be useful for a Master Developer would be found in the
electrical work, excavation and backfill, and landscaping work sections of the document.
A link to each of the sections of the standard specification document can be found on DPW’s
website via the following link: http://sfpublicworks.org/services/standards‐specifications‐and‐
plans
This webpage also provides links to DPW’s standard plans for pullboxes as well as other
information that may be useful for the Master Developer.

CTC Technology & Energy | IMG Rebel | Fiber for San Francisco | October 2017
142
DepartmentofPublicWorksExcavationRegulationsThis group of documents provides compete detail on the City’s rules and regulations regarding
excavation in the public right‐of‐way. This information will be useful to a Master Developer
because a citywide FTTP build will most likely require a substantial amount of excavation within
the City.
A link to each of these documents can be found under the Excavation Regulations section of the
Project Manual and Reference Documents page of DPW’s website, which can be accessed via the
following link: http://sfpublicworks.org/services/project‐manual‐and‐reference‐documents
AT&TGeneralTermsandConditionsforConduitUseThis document provides the general terms and conditions for access and use of AT&T’s conduit
in the City. This information will be useful to a Master Developer because leveraging existing
conduit infrastructure in the City may be a viable way to reduce the overall project cost. The City
has access to this document and can provide it to the selected Master Developer. While the
Master Developer will need to obtain its own agreement with AT&T, this document will provide
and understanding of what the Master Developer can expect.
PG&EConduitLicenseAgreementThis document outlines the process for applying to gain access to PG&E conduit, the rules and
regulations for use of the conduit, and an overview of the estimated pricing to use the conduit.
This information will be useful to a Master Developer because leveraging existing conduit
infrastructure in the City may be a viable way to reduce the overall project cost. The City has
access to this document and can provide it to the selected Master Developer. While the Master
Developer will need to obtain its own agreement with PG&E, this document will provide and
understanding of what the Master Developer can expect.
DepartmentofPublicWorksUtilityExcavationMoratoriumStreetsListThis dataset identifies the streets within San Francisco that are under a utility excavation
moratorium. This information may be useful as it will help identify streets where a Master
Developer would need to avoid street excavation or obtain a special waiver from DPW. A Master
Developer could potentially use this information to inform project phasing and other planning
considerations. The utility excavation moratorium streets list can be found on dataSF via the link
below.
Utility Excavation Moratorium Streets List: https://data.sfgov.org/City‐Infrastructure/Utility‐
Excavation‐Moratorium‐Streets/5wbp‐dwzt
DepartmentofPublicWorksPavementConditionIndex(PCI)ScoresListThis dataset provides information on the condition of the pavement for more than 12,800 streets
in San Francisco. This information may be useful as it will help identify locations where DPW will

CTC Technology & Energy | IMG Rebel | Fiber for San Francisco | October 2017
143
be more amenable to underground and excavation work. A Master Developer could potentially
use this information to inform project phasing and other planning considerations. The PCI
spreadsheet can be found on dataSF via the link below.
PCI: https://data.sfgov.org/City‐Infrastructure/Streets‐Data‐Pavement‐Condition‐Index‐PCI‐
Scores/5aye‐4rtt
CityProjectsforUtilityExcavationandPavingThis dataset provides information on planned excavation and pavement projects, including both
public and private capital/utility projects. This information may be useful as because it could
allow a Master Developer to reduce its costs by potentially coordinating construction efforts with
other ongoing projects. This information could inform the network design, project phasing, and
other planning considerations. The utility excavation and paving projects list can be found on
dataSF via the link below.
Utility Excavation and Paving Projects List: https://data.sfgov.org/City‐Infrastructure/Envista‐
Projects‐for‐Utility‐Excavation‐and‐Paving/sf93‐6dmr
AdditionalDataRecommendationsThe City has a significant amount of documentation relating to construction standards and
restrictions. Compiling this information into a format that could be easily reviewed and
understood would be beneficial to a Master Developer. Accordingly, we make the following
recommendations.
DevelopStandardSpecificationsforFiberConstructionThe Department of Public Works has standard specifications and design plans for various types
of construction, including streets and highways, structures, electrical work, excavation and
backfill, and landscaping. While some of these standards overlap with work that would be
conducted in a citywide FTTP project, many standards that are specific to fiber construction are
not covered in the existing specifications. Developing a single document that clearly defines
approved construction methodologies and practices for this specific project would be very
beneficial to a Master Developer.
CTC recommends that a set of standards be developed specifically for fiber construction within
the City and that the development of this document should be a collaboration between DT and
DPW.
FinalizeStandardsforMicrotrenchingThe City has approved legislation for an ordinance amending the Public Works Code to allow the
use of microtrenching to install fiber‐optic cables in the sidewalk portion of the public right‐of‐
way. While this document will provide some guidance to a Master Developer on the proposed

CTC Technology & Energy | IMG Rebel | Fiber for San Francisco | October 2017
144
regulations for microtrenching in the City, there are still certain parameters of this construction
methodology that require clarification and acceptance from DPW.
CTC recommends that the City finalize outstanding requirements for microtrenching and develop
a set of DPW‐approved standards that a Master Developer could use for guidance. The approved
microtrenching standards could be included as part of the standard specifications document for
general fiber construction.
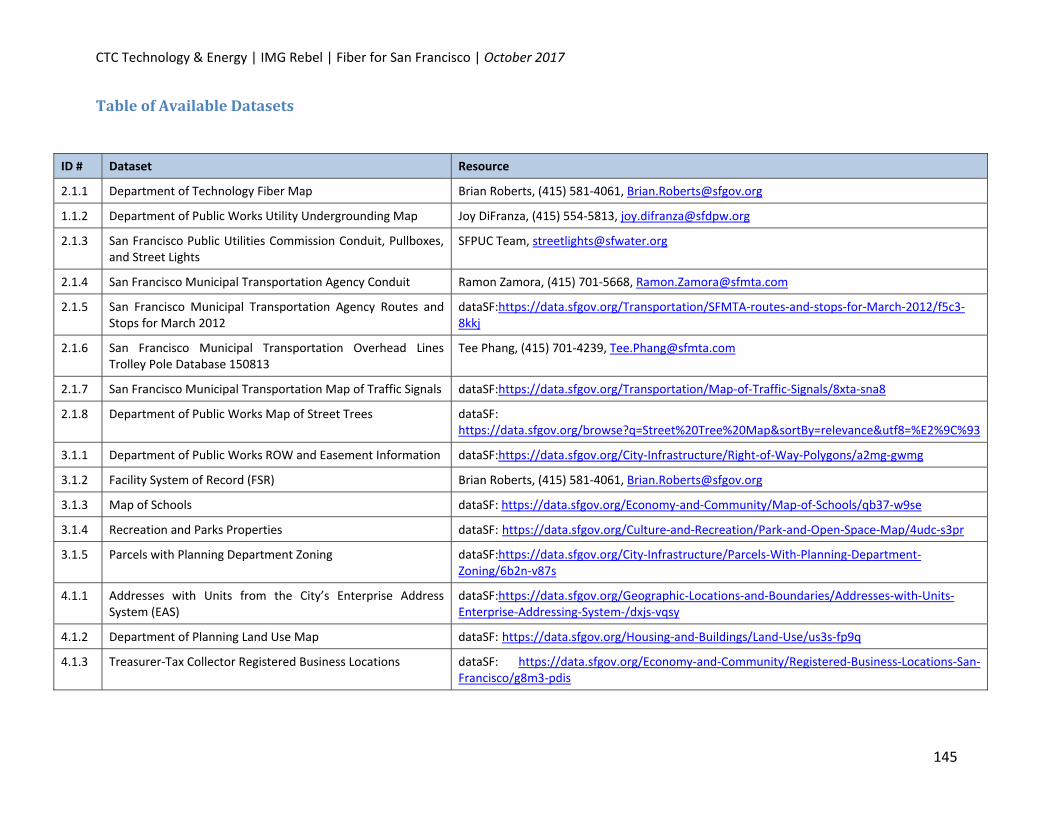
CTC Technology & Energy | IMG Rebel | Fiber for San Francisco | October 2017
145
TableofAvailableDatasets
ID # Dataset Resource
2.1.1 Department of Technology Fiber Map Brian Roberts, (415) 581‐4061, [email protected]
1.1.2 Department of Public Works Utility Undergrounding Map Joy DiFranza, (415) 554‐5813, [email protected]
2.1.3 San Francisco Public Utilities Commission Conduit, Pullboxes, and Street Lights
SFPUC Team, [email protected]
2.1.4 San Francisco Municipal Transportation Agency Conduit Ramon Zamora, (415) 701‐5668, [email protected]
2.1.5 San Francisco Municipal Transportation Agency Routes and Stops for March 2012
dataSF:https://data.sfgov.org/Transportation/SFMTA‐routes‐and‐stops‐for‐March‐2012/f5c3‐8kkj
2.1.6 San Francisco Municipal Transportation Overhead Lines Trolley Pole Database 150813
Tee Phang, (415) 701‐4239, [email protected]
2.1.7 San Francisco Municipal Transportation Map of Traffic Signals dataSF:https://data.sfgov.org/Transportation/Map‐of‐Traffic‐Signals/8xta‐sna8
2.1.8 Department of Public Works Map of Street Trees dataSF: https://data.sfgov.org/browse?q=Street%20Tree%20Map&sortBy=relevance&utf8=%E2%9C%93
3.1.1 Department of Public Works ROW and Easement Information dataSF:https://data.sfgov.org/City‐Infrastructure/Right‐of‐Way‐Polygons/a2mg‐gwmg
3.1.2 Facility System of Record (FSR) Brian Roberts, (415) 581‐4061, [email protected]
3.1.3 Map of Schools dataSF: https://data.sfgov.org/Economy‐and‐Community/Map‐of‐Schools/qb37‐w9se
3.1.4 Recreation and Parks Properties dataSF: https://data.sfgov.org/Culture‐and‐Recreation/Park‐and‐Open‐Space‐Map/4udc‐s3pr
3.1.5 Parcels with Planning Department Zoning dataSF:https://data.sfgov.org/City‐Infrastructure/Parcels‐With‐Planning‐Department‐Zoning/6b2n‐v87s
4.1.1 Addresses with Units from the City’s Enterprise Address System (EAS)
dataSF:https://data.sfgov.org/Geographic‐Locations‐and‐Boundaries/Addresses‐with‐Units‐Enterprise‐Addressing‐System‐/dxjs‐vqsy
4.1.2 Department of Planning Land Use Map dataSF: https://data.sfgov.org/Housing‐and‐Buildings/Land‐Use/us3s‐fp9q
4.1.3 Treasurer‐Tax Collector Registered Business Locations dataSF: https://data.sfgov.org/Economy‐and‐Community/Registered‐Business‐Locations‐San‐Francisco/g8m3‐pdis

CTC Technology & Energy | IMG Rebel | Fiber for San Francisco | October 2017
146
ID # Dataset Resource
5.1.1 California Public Utilities Commission General Order No. 95 (GO 95)
CPUC Website: http://www.cpuc.ca.gov/gos/GO95/go_95_section_1.html
5.1.2 Northern California Joint Pole Association Operations/Routine Handbook 2016
Brian Roberts, (415) 581‐4061, [email protected]
5.1.3 San Francisco Municipal Transportation Agency Regulations for Working In San Francisco Streets (Blue Book)
SFMTA Website: https://www.sfmta.com/services/streets‐sidewalks/construction‐regulations
5.1.4 Department of Public Works Standard Specifications and Plans DPW Website: http://sfpublicworks.org/services/standards‐specifications‐and‐plans
5.1.5 Department of Public Works Excavation Regulations DPW Website: http://sfpublicworks.org/services/project‐manual‐and‐reference‐documents
5.1.6 AT&T General Terms and Conditions for Conduit Use Brian Roberts, (415) 581‐4061, [email protected]
5.1.7 PG&E Conduit License Agreement Brian Roberts, (415) 581‐4061, [email protected]
5.1.8 Department of Public Works Utility Excavation Moratorium Streets List
dataSF: https://data.sfgov.org/City‐Infrastructure/Utility‐Excavation‐Moratorium‐Streets/5wbp‐dwzt
5.1.9 Department of Public Works Pavement Condition Index (PCI) Scores List
dataSF: https://data.sfgov.org/City‐Infrastructure/Streets‐Data‐Pavement‐Condition‐Index‐PCI‐Scores/5aye‐4rtt
5.1.10 City Projects for Utility Excavation and Paving dataSF: https://data.sfgov.org/City‐Infrastructure/Envista‐Projects‐for‐Utility‐Excavation‐and‐Paving/sf93‐6dmr
CTC Technology & Energy | IMG Rebel | Fiber for San Francisco | October 2017
147
Third‐PartyDataRequests
DataRequesttoPG&EPG&E has a large amount of infrastructure in the City including utility poles and conduit that
could be leveraged in a Citywide fiber build. As a power company, PG&E does not provide services
that would compete with the City’s proposed FTTP network and should be more amenable to the
City’s data requests then telecom providers such as AT&T. With the current NCJPA guidelines,
the burden for data collection generally falls to the entity looking to attach as opposed to the
pole owner. Because PG&E is not usually required to facilitate access to their data, the odds are
low that they would be willing to freely provide information without incentive. It could be
expected that the more effort required by PG&E to provide the data, the less likely they will be
willing to provide the data.
Obtaining from a power company is not impossible, an awardee of a Broadband Technology
Opportunities Program (BTOP) grant, Howard County Maryland was able to successfully obtain
geospatial data containing utility pole locations for the entire footprint of their local power
company, Baltimore Gas and Electric. This allowed the County to identify aerial attachment
opportunities and make informed engineering decisions that benefited their fiber construction
project.
Prior to sending the data request, the City should identify the proper point of contact(s) to handle
the request. PG&E will most likely have separate contacts for utility poles and underground
infrastructure. The data request should include an overview of the proposed project and state
the City’s willingness to comply with non‐disclosure requirements.
The City should request the following information:
#1 Utility Pole Locations Geospatial data identifying the location of all utility poles are located within the City should be requested. The data should be provided in GIS format if possible to allow for easy transfer and review of the information. Though not preferred, paper maps of the pole locations would be better than receiving no data. Paper maps may require more effort from PG&E to provide the information, so the City may consider requesting data for specific sections of the City to increase the likelihood of obtaining the data.
#2 Conduit Locations Geospatial data identifying the locations of available conduit routes should be requested. The data should be provided in GIS format if possible. Though not preferred, a paper map of the general location of available conduit within the City would be better than receiving no data, as it could provide a starting point for further investigation.

CTC Technology & Energy | IMG Rebel | Fiber for San Francisco | October 2017
148
#3 Utility Pole Information Specific information on PG&E’s poles should be requested to help with analyzing the feasibility of aerial construction. Useful data would include the following:
Individual pole information including; pole class, height, age, material, compliance
Current attachments and loading analysis for individual poles
PG&E’s pole replacement and make ready schedule
It is possible PG&E has some of the individual pole data in GIS format which would be preferred, though they should have paper records of this data as this information is provided to them every time a new attachment is made.
#4 Conduit Information Specific information on PG&E’s available conduit would provide additional benefit. Useful data would include the following:
Conduit size
Current occupancy and available space
Access points (i.e. handhole locations, building entrances)
PG&E may have some of the conduit attributes in GIS format which would be preferred, though it is more likely they have paper records of this information.
#5 Abandoned Gas Lines Geospatial data identifying the locations of abandoned gas line could be requested. When permitted by the utility owner, fiber can be placed in the abandoned lines to avoid new fiber construction. Abandoned gas lines tend to be less useful because the lack of access points and general placement of the utility make accessing the fiber difficult. Ideally this information could be provided in GIS format, however paper maps would be acceptable.
DataRequesttoAT&TAT&T has a large amount of infrastructure in the City including utility poles and conduit that could
be leveraged in a Citywide fiber build. It is possible that AT&T could see the City’s proposed
network as a competitor and reluctant to provide information to the City. With the current NCJPA
guidelines, the burden for data collection generally falls to the entity looking to attach as opposed
to the pole owner. Because AT&T is not usually required facilitate access to their data, the odds
are low that they would be willing to freely provide information without incentive. It could be
expected that the more effort required by AT&T to provide the data, the less likely they will be
willing to provide the data.
Prior to sending the data request, the City should identify the proper point of contact(s) to handle
the request. AT&T will most likely have separate contacts for utility poles and underground

CTC Technology & Energy | IMG Rebel | Fiber for San Francisco | October 2017
149
infrastructure. The data request should include an overview of the proposed project and state
the City’s willingness to comply with non‐disclosure requirements.
The City should request the following information:
#1 Utility Pole Locations Geospatial data identifying the location of all utility poles are located within the City should be requested. The data should be provided in GIS format if possible to allow for easy transfer and review of the information. Though not preferred, paper maps of the pole locations would be better than receiving no data. Paper maps may require more effort from AT&T to provide the information, so the City may consider requesting data for specific sections of the City to increase the likelihood of obtaining the data.
#2 Conduit Locations Geospatial data identifying the locations of available conduit routes should be requested. The data should be provided in GIS format if possible. Though not preferred, a paper map of the general location of available conduit within the City would be better than receiving no data, as it could provide a starting point for further investigation.
#3 Utility Pole Information Specific information on AT&T’s poles should be requested to help with analyzing the feasibility of aerial construction. Useful data would include the following:
Individual pole information including; pole class, height, age, material, compliance
Current attachments and loading analysis for individual poles
AT&T’s pole replacement and make ready schedule
It is possible AT&T has some of the individual pole data in GIS format which would be preferred, though they should have paper records of this data as this information is provided to them every time a new attachment is made.
#4 Conduit Information Specific information on AT&T’s available conduit would provide additional benefit. Useful data would include the following:
Conduit size
Current occupancy and available space
Access points (i.e. handhole locations, building entrances)
Information on the terms and conditions to include any applicable service restrictions
AT&T may have some of the conduit attributes in GIS format which would be preferred, though it is more likely they have paper records of this information.
CTC Technology & Energy | IMG Rebel | Fiber for San Francisco | October 2017
150
DataRequesttoOtherProvidersOther providers such as Zayo, CenturyLink, and Crown Castle have underground infrastructure in
the City that could be leveraged in a Citywide fiber build. It is possible that these entities would
be willing to provide information of their available conduit routes, and may offer additional
benefit in return such as joint build opportunities during the citywide fiber construction.
Prior to sending the data request, the City should identify the proper point of contact(s) to handle
the request. The data request should include an overview of the proposed project and state the
City’s willingness to comply with non‐disclosure requirements.
The City should request the following information:
#1 Conduit Locations Geospatial data identifying the locations of available conduit routes should be requested. The data should be provided in GIS format if possible. Though not preferred, a paper map of the general location of available conduit within the City would be better than receiving no data, as it could provide a starting point for further investigation.
#2 Conduit Information Specific information on the provider’s available conduit would provide additional benefit. Useful data would include the following:
Conduit size
Current occupancy and available space
Access points (i.e. handhole locations, building entrances)
Information on the terms and conditions to include any applicable service restrictions
Per foot pricing for leased conduit
Provider may have some of the conduit attributes in GIS format which would be preferred, though it is more likely they have paper records of this information.

CTC Technology & Energy | IMG Rebel | Fiber for San Francisco | October 2017
151
AppendixG:PotentiallyUsableCityFacilities
City‐OwnedFiberInfrastructureThe City’s existing fiber infrastructure has potential to be used for this project. The infrastructure
comprises conduit, handholes, and pole attachments which are all built to accommodate fiber
deployment. As an example, the project could leverage additional conduit space in the existing
underground fiber routes to reduce construction costs. In areas where the City has aerial fiber,
new fiber can be overlashed to the City attachments instead of requiring a new attachment,
which may reduce or eliminate make‐ready work.
Figure 17: City Fiber Facilities

CTC Technology & Energy | IMG Rebel | Fiber for San Francisco | October 2017
152
City‐OwnedPropertyCity property can provide a place to locate network hub sites, fiber distribution cabinets, or other
infrastructure. The sample design estimates the need for approximately 10 hub locations spread
throughout the City. Each hub will require approximately 200 feet of space, power, secure access,
and environmental controls. The hubs can be placed in buildings that meet these requirements,
or in telecom huts built on City property. Fiber distribution cabinets are much smaller than hubs
and can be placed in the ROW or be mounted on utility poles. However, it may be ideal to place
the cabinets on City property when feasible to keep the ROW clear of additional congestion.
Figure 18: Property Owned by City and County

CTC Technology & Energy | IMG Rebel | Fiber for San Francisco | October 2017
153
AppendixH:DigitalInclusionandBroadbandAffordabilityThe Fiber for San Francisco Initiative is intended to develop new means of expanding next‐
generation, world‐class broadband infrastructure in the City. The following is an analysis of some
considerations regarding digital inclusion in the City.
This section notes that affordability is one critical challenge in ensuring the universal adoption of
broadband services, despite the apparent universal availability of fixed and mobile broadband in
San Francisco, in part because of the uneven availability of lower‐priced products that are
ostensibly targeted toward low‐income residents of the City. Affordability of broadband services
is by no means the only factor impacting adoption rates, but addressing that issue is one way that
the City can improve rates of use of high‐speed broadband by lower‐income members of the
community. Complementary initiatives focused on device ownership and internet literacy will be
necessary to supplement the City’s efforts to make high‐speed broadband affordable.
LowBroadbandAdoptioninSanFranciscoCorrelateswithLower‐IncomeAreasRecent data from the FCC suggests a correlation between lower broadband adoption rates and
lower‐income areas in the City. While the data do not speak to causation, the correlation is
important when considering barriers to broadband adoption.
Twice a year, internet service providers (ISPs) submit data to the FCC via Form 477, reporting
where wireline broadband service is available and the percent of households subscribing to their
service.104 This information is then aggregated by the FCC and released to the public roughly one
year after collection. The data illustrate the percentage of homes with minimum internet speeds
within a given census tract.
Census tracts are defined by geographical boundaries (rather than population), and can contain
from 1,200 to 8,000 people.105 As a result, it is impossible to obtain a definitive number of how
many households subscribe to internet services from Form 477 data. Rather, the most recent
available data (from December 31, 2015) show the percent of households receiving a service of
a minimum 200 Kbps one‐way, and a minimum 10 Mbps/1 Mbps (upstream/downstream) within
196 census tracts in the City.
Table 32 provides a breakdown of census tracts by percent subscription rate.106
104 Entities required to submit these data include “facilities‐based providers of broadband connections” and “providers of wired or fixed wireless local exchange telephone service.” See: “Who Must File Form 477?”, Federal Communications Commission, https://transition.fcc.gov/form477/WhoMustFileForm477.pdf (accessed March 2017). 105 “Geographic Terms and Concepts – Census Tract,” U.S. Census Bureau, https://www.census.gov/geo/reference/gtc/gtc_ct.html (accessed March 2017). 106 “Internet Access Service Reports,” Federal Communications Commission, https://www.fcc.gov/reports‐research/reports/internet‐access‐services‐reports/internet‐access‐services‐reports (accessed March 2017).
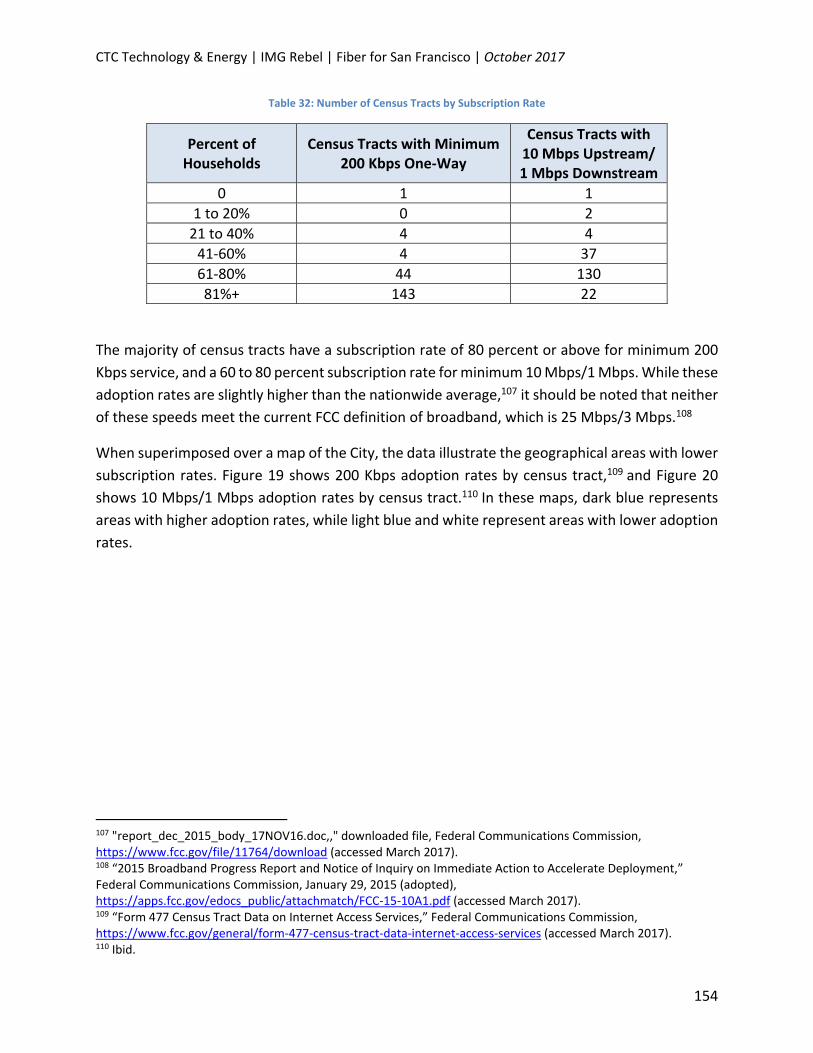
CTC Technology & Energy | IMG Rebel | Fiber for San Francisco | October 2017
154
Table 32: Number of Census Tracts by Subscription Rate
Percent of Households
Census Tracts with Minimum 200 Kbps One‐Way
Census Tracts with 10 Mbps Upstream/ 1 Mbps Downstream
0 1 1
1 to 20% 0 2
21 to 40% 4 4
41‐60% 4 37
61‐80% 44 130
81%+ 143 22
The majority of census tracts have a subscription rate of 80 percent or above for minimum 200
Kbps service, and a 60 to 80 percent subscription rate for minimum 10 Mbps/1 Mbps. While these
adoption rates are slightly higher than the nationwide average,107 it should be noted that neither
of these speeds meet the current FCC definition of broadband, which is 25 Mbps/3 Mbps.108
When superimposed over a map of the City, the data illustrate the geographical areas with lower
subscription rates. Figure 19 shows 200 Kbps adoption rates by census tract,109 and Figure 20
shows 10 Mbps/1 Mbps adoption rates by census tract.110 In these maps, dark blue represents
areas with higher adoption rates, while light blue and white represent areas with lower adoption
rates.
107 "report_dec_2015_body_17NOV16.doc,," downloaded file, Federal Communications Commission, https://www.fcc.gov/file/11764/download (accessed March 2017). 108 “2015 Broadband Progress Report and Notice of Inquiry on Immediate Action to Accelerate Deployment,” Federal Communications Commission, January 29, 2015 (adopted), https://apps.fcc.gov/edocs_public/attachmatch/FCC‐15‐10A1.pdf (accessed March 2017). 109 “Form 477 Census Tract Data on Internet Access Services,” Federal Communications Commission, https://www.fcc.gov/general/form‐477‐census‐tract‐data‐internet‐access‐services (accessed March 2017). 110 Ibid.

CTC Technology & Energy | IMG Rebel | Fiber for San Francisco | October 2017
155
Figure 19: Percent of Households with Minimum 200 Kbps Service

CTC Technology & Energy | IMG Rebel | Fiber for San Francisco | October 2017
156
Figure 20: Percent of Households with Minimum 10 Mbps/1 Mbps Service
In both figures, the map shows a clear crescent‐shaped area of lower subscription rates, passing
from the area north of Chinatown, through the Mission district, and then back southeast to the
Bayview district. There is also a pocket of low subscription in census tracts in the south of the
City.
Figure 21 illustrates census tracts by yearly household income, with dark blue representing higher
average household income. 111 This map illustrates the same crescent shape and southern
pocket—an illustration of low‐income areas that correlates with low broadband adoption
illustrated in Figure 20. The clear commonalities of the geographic distribution in the two data
111 Data USA, https://embed.datausa.io/profile/geo/san‐francisco‐ca/economy/income_geo/?viz=True (accessed March 2017).
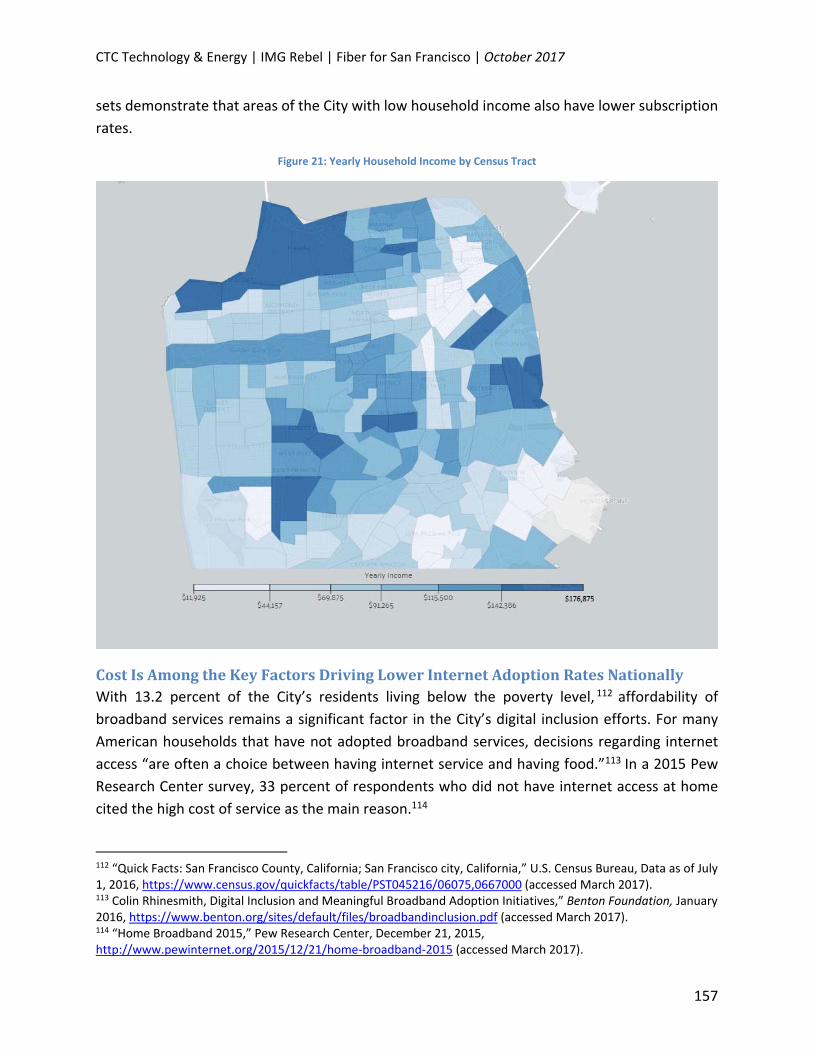
CTC Technology & Energy | IMG Rebel | Fiber for San Francisco | October 2017
157
sets demonstrate that areas of the City with low household income also have lower subscription
rates.
Figure 21: Yearly Household Income by Census Tract
CostIsAmongtheKeyFactorsDrivingLowerInternetAdoptionRatesNationallyWith 13.2 percent of the City’s residents living below the poverty level, 112 affordability of
broadband services remains a significant factor in the City’s digital inclusion efforts. For many
American households that have not adopted broadband services, decisions regarding internet
access “are often a choice between having internet service and having food.”113 In a 2015 Pew
Research Center survey, 33 percent of respondents who did not have internet access at home
cited the high cost of service as the main reason.114
112 “Quick Facts: San Francisco County, California; San Francisco city, California,” U.S. Census Bureau, Data as of July 1, 2016, https://www.census.gov/quickfacts/table/PST045216/06075,0667000 (accessed March 2017). 113 Colin Rhinesmith, Digital Inclusion and Meaningful Broadband Adoption Initiatives,” Benton Foundation, January 2016, https://www.benton.org/sites/default/files/broadbandinclusion.pdf (accessed March 2017). 114 “Home Broadband 2015,” Pew Research Center, December 21, 2015, http://www.pewinternet.org/2015/12/21/home‐broadband‐2015 (accessed March 2017).

CTC Technology & Energy | IMG Rebel | Fiber for San Francisco | October 2017
158
Although the digital divide has narrowed over the course of the last decade, many low‐income
individuals remain unable to access the internet from home, hindering their ability to reach
economic and educational resources critical for success in the 21st century. According to a recent
Pew Research Center survey, 47 percent of Americans with household incomes under $30,000
per year lack home broadband service, compared with 6 percent among individuals with
household incomes over $100,000 per year.115
The City analyzed digital divide issues in 2007 and again in 2015. In the latter study, the Board of
Supervisor’s budget and legislative analyst reported on a study that found that 12 percent of City
residents lack internet access at home (and another 6 percent reported using dial‐up
connections). While the study noted that “75 percent of households with incomes of less than
$25,000” had home internet access—a significantly higher percentage of low‐income residents
than the national average—affordability is still clearly an issue.116 The 2007 study also indicated
that affordability was a factor in home internet use.117
While these numbers are better than the national numbers, there is still, as of the date of these
studies, a remarkable gap between lower‐ and higher‐income residents of the City in terms of
home internet use. Despite the barriers, each year more and more low‐income individuals are
finding ways to access online resources. As of 2016, 79 percent of adults living with household
incomes under $30,000 reported using the internet 118 and 64 percent reported having a
smartphone. 119 Even those without home broadband service increasingly acknowledge that
access to the internet is critical in many key areas of life.120
115 Monica Anderson, “Digital divide persists even as lower income Americans make gains in tech adoption,” Pew Research Center, March 22, 2017, http://www.pewresearch.org/fact‐tank/2017/03/22/digital‐divide‐persists‐even‐as‐lower‐income‐americans‐make‐gains‐in‐tech‐adoption/ (accessed March, 2017). 116 Fred Brousseau, “Policy Analysis Report: Digital Divide in San Francisco,” City and County of San Francisco Board of Supervisors, April 15, 2015, http://sfbos.org/sites/default/files/FileCenter/Documents/52249‐BLA.DigitalDivide.041515.pdf (accessed March 2017). 117 Thomas Berman, Matthew Case, Joshua Daniels, Mara Larsen‐Fleming, and Sun Ha Lee, “Digital Inclusion in San Francisco,” University of California, Berkeley, and San Francisco Department of Telecommunications and Information Services, June 2007, http://sfgov.org/dt/ftp/uploadedfiles/dtis/tech_connect/UCBDigitalInclusionReport060282007Final%281%29.pdf (accessed March 2017). 118 “Internet/Broadband Fact sheet,” Pew Research Center, January 12, 2017, http://www.pewinternet.org/fact‐sheet/internet‐broadband/ (accessed March 2017). 119 Monica Anderson, “Digital divide persists even as lower income Americans make gains in tech adoption,” Pew Research Center, March 22, 2017, http://www.pewresearch.org/fact‐tank/2017/03/22/digital‐divide‐persists‐even‐as‐lower‐income‐americans‐make‐gains‐in‐tech‐adoption/ (accessed March 2017). 120 John Horrigan and Maeve Duggan, “Home Broadband 2015,” Pew Research Center, December 21, 2015, http://www.pewinternet.org/2015/12/21/home‐broadband‐2015/pi‐2015‐10‐21_broadband2015‐03/ (accessed March 2017).

CTC Technology & Energy | IMG Rebel | Fiber for San Francisco | October 2017
159
For those who lack home internet, some make use of free broadband services at libraries,
community centers, and private businesses, while others rely on their mobile devices. Roughly
one‐fifth of individuals living with household incomes under $30,000 report having a
smartphone, but no internet at home, up from 12 percent in 2013.121 With few other options,
low‐income households disproportionally rely on smartphones to complete tasks that wealthier
counterparts complete on laptops and desktops. The majority of low‐income smartphone owners
report using their mobile device to look up information about a job, and a third report using their
smartphone to send in job applications.122
So as the internet becomes increasingly relevant to the lives of low‐income individuals, what
keeps them from signing up for home broadband service? While no single factor can explain the
persistent home broadband gap, the high cost of monthly subscriptions is undoubtedly a major
contributor. When individuals without home broadband were asked their most important reason
for not having a home broadband connection, 33 percent said that monthly home broadband
subscriptions are too expensive, more than twice the response that any other reason received.123
A recent study of broadband adoption initiatives found that, while all low‐income individuals and
families who participated in this study understood the value of broadband connectivity, many
were often forced to choose between having internet and having enough food for the month.124
In a study of individuals who have dropped home broadband service, all individuals with
household income up to $40,000 per year cited the service being “too expensive” as the primary
reason why they dropped service.125
BroadbandServiceCostsinSanFranciscoAreUnevenlyDistributed,Unpredictable,and,forSome,Unaffordable
Current data products available in the City reflect unpredictable layers of cost.
121 Monica Anderson, “Digital divide persists even as lower income Americans make gains in tech adoption,” Pew Research Center, March 22, 2017, http://www.pewresearch.org/fact‐tank/2017/03/22/digital‐divide‐persists‐even‐as‐lower‐income‐americans‐make‐gains‐in‐tech‐adoption/ (accessed March 2017). 122 Aaron Smith, “U.S. Smartphone Use in 2015,” Pew Research Center, April 1, 2015, http://www.pewinternet.org/2015/04/01/chapter‐two‐usage‐and‐attitudes‐toward‐smartphones/#job percent20seeking (accessed March 2017). 123 John Horrigan and Maeve Duggan, “Home Broadband 2015,” Pew Research Center, December 21, 2015, http://www.pewinternet.org/2015/12/21/home‐broadband‐2015/pi‐2015‐10‐21_broadband2015‐12/ (accessed March 2017). 124 Colin Rhinesmith, Digital Inclusion and Meaningful Broadband Adoption Initiatives,” Benton Foundation, January 2016, https://www.benton.org/sites/default/files/broadbandinclusion.pdf (accessed March 2017). 125 Brian Whitacre and Colin Rhinesmith, “Understanding Broadband Un‐adopters,” Benton Foundation, January 12, 2016, https://www.benton.org/blog/understanding‐broadband‐un‐adopters (accessed March 2017).

CTC Technology & Energy | IMG Rebel | Fiber for San Francisco | October 2017
160
WirelineDataProductsComcast advertises no‐contract residential internet services with 25 Mbps maximum download
speed for $49.99 per month. While its advertised price alone may be prohibitive to low‐income
citizens, the plan comes with further hidden charges:
Activation fee up to $500 (total price not disclosed until after sign up)
Promotional price increases to $59.99—$64.99 per month after first year (total price
not disclosed until after first year)
Plan subject to early termination fee (price not disclosed)
Plan price does not include equipment charges, which can be either a substantial
upfront cost, or monthly “nominal fees”
Plan allows 1 TB of data use per month, after which each 50 GB increment will cost
$10 per month (not to exceed $200 monthly)
All fees, other than the contracted monthly subscription fee, are subject to change at
any time126
In the first month of service alone, pricing stipulations of at least $500 in costs additional to
service fee are likely to serve as obvious barriers to adoption by low‐income residents.
MobileWirelessDataProductsFor subscribers who do not purchase wireline data services at home, data‐only mobile broadband
services provided by major wireless carriers are a potential alternative. However, the high cost
of connectivity and adequate capacity can prove to be deterrents to even moderate‐income
subscribers. Similar to their wired counterparts, mobile broadband plans are frequently rife with
upcharges and unexpected costs. Unlike most wired plans, many mobile services charge by the
amount of data transmitted, limiting their feasibility for high‐capacity applications such as
transmission of large files, videoconferencing, and extended content and media‐rich web
browsing.
The cost of an entry‐level mobile data product from Verizon begins at $20 per month for 2 GB of
data. Prices increase $10 per month per 2 GB additional data. Further charges include:
$5 per month per device connected to the plan
$10 per month per tablet connected to the plan
126 “Select the package that’s perfect for you,” Comcast Xfinity, https://www.xfinity.com/locations/internet‐service/california/sanfrancisco.html (accessed March 2017).

CTC Technology & Energy | IMG Rebel | Fiber for San Francisco | October 2017
161
$20 per month per hotspot connected to the plan
$15 per each additional 1 GB of data
Cost of device, tablet, or hotspot
Subscribers who do not want to be charged overage fees can choose to be “throttled” once plan
data allowances have been used, slowing connection speeds to 128 Kbps—well below broadband
speeds, and limiting functionality.127
AT&T also offers wireless internet plans, characterized by high price points and a limited amount
of “high‐speed” data. For those interested in a data‐only plan, AT&T has a 250 MB plan for $14.99
monthly, which includes unlimited access to AT&T Wi‐Fi hotspots distributed around major
metropolitan areas. This plan does not allow customers to “tether” another device, so all
browsing must occur on the mobile device on the plan. If the customer exceeds the 250 MB
allowance, each additional 250 MB used costs an additional $14.99. Higher‐capacity 3 GB and 5
GB plans can be purchased for $30 and $50 per month, respectively, and come with similar
overage fees. For customers who wish to “tether” another device (such as a home computer, an
additional tablet, or phone other than that on the plan), customers must purchase the $50
plan.128
Recently, AT&T announced an “unlimited” plan that includes unlimited talk, text, and data. For
$90 per month, the plan allows 22 GB of data at 4G‐LTE speeds, after which AT&T throttles the
user to 128 Kbps. For those interested in tethering their home computer or another device to
this plan, only 10 GB of the initial 22 GB will be 4G‐LTE speeds for tethering or “mobile hotspot”
use. Like the above plans, the advertised price is lower than the amount customers will be
charged in the first few months. To receive $90 monthly pricing, customers must enroll in
autopay (with a credit card), paperless billing, and allow “1—3 months” of billing cycles before
discounts will be applied.129 Given these constraints, this product may not be useful for lower
income San Franciscans.
T‐Mobile also offers prepaid mobile, data‐only plans for customers who lack sufficient credit to
qualify for monthly plans, or who do not wish to sign up for multi‐year contracts. T‐Mobile’s pay‐
as‐you‐go plan costs $3 per month, but customers then must regularly purchase data passes at a
rate of $5 per day inclusive of 500 MB of 4G data, or $10 per week for 1 GB of 4G data.130 The
127 “Data Only Plan,” Verizon Wireless, https://www.verizonwireless.com/plans/data‐only‐plan (accessed March 2017). 128 “Select a Plan,” AT&T, https://www.att.com/shop/wireless/plans/planconfigurator.html (accessed March 2017). 129 “Unlimited Data. Unreal Deal,” AT&T, https://www.att.com/plans/unlimited‐data‐plans.html (accessed March 2017). 130 “Pay As You Go,” T‐Mobile, https://prepaid‐phones.t‐mobile.com/pay‐as‐you‐go (accessed April 2017).

CTC Technology & Energy | IMG Rebel | Fiber for San Francisco | October 2017
162
company also offers monthly prepaid plans at a rate of $45 per month for 4 GB of 4G data, $55
per month for 6 GB of 4G data or $75 for unlimited 4G data.131 However, the unlimited plan’s
fine print contains a number of restrictions, including an additional $15 tethering fee for every 5
GB of 4G data used on tethered devices.132
Sprint has prepaid 3G/4G (depending on availability) mobile data plans as well, ranging from $15
per day inclusive of 150 MB of data, $30 per week inclusive of 500 MB of data, and $50 per month
inclusive of 1.5 GB of data.133 They also have a post‐paid unlimited plan for $60 per month, but it
requires a credit check, and once again, the unlimited plans come with a number of restrictions
in the fine print, including a 10 GB limit on tethered data use.134
AT&T, T‐Mobile, and Sprint also have their own prepaid brands that market themselves to lower‐
income customers. AT&T’s Cricket Wireless offers monthly plans at a rate of $30 for 1 GB, $40
for 3 GB, $50 for 8 GB, and $60 for unlimited data (throttled after 22 GB); however, these plans
are restricted to 8 Mbps when a user is on AT&T’s 4G LTE network, and to 4 Mbps when on
AT&T’s HSPA+ network.135
T‐Mobile’s MetroPCS offers monthly plans at a rate of $30 for 1 GB, $40 for 3 GB, $50 for
unlimited LTE data on a single handset, and $60 for unlimited LTE data on a single handset plus
8 GB of tethered data.136
MetroPCS customers enjoy speeds close to the speeds of T‐Mobile customers. In a recent test,
MetroPCS boasted an average download speed of 22 Mbps and upload speed of 16 Mbps.137
Sprint has two prepaid brands, Virgin Mobile USA and Boost Mobile. Virgin Mobile has monthly
plans priced at $35 for 5 GB of 4G LTE data and $45 for 10 GB, with each additional GB of data
costing $5. Boost Mobile offers a $35 monthly plan with 2 GB of data, with each additional GB of
131 “Prepaid Phones,” T‐Mobile, https://prepaid‐phones.t‐mobile.com/prepaid‐plans‐individual?icid=WEB__Q117PREPAI_YYP087QVHNJ7801#getting‐started (accessed April 2017). 132 Jacob Kastrenakes, “T‐Mobile and Sprint's new unlimited plans have some nasty fine print,” The Verge, August 18, 2016, http://www.theverge.com/2016/8/18/12533308/tmobile‐sprint‐unlimited‐data‐plans‐limit‐video (accessed April 2017). 133 “Services,” Sprint, http://shop.sprint.com/mysprint/services_solutions/details.jsp?detId=mbb_passes&catId=service_mbb&catName=Mobile%20Broadband&detName=Mobile%20Broadband%20Passes&specialCat= (accessed April 2017). 134 “Unlimited,” Sprint, https://www.sprint.com/landings/unlimited‐cell‐phone‐plans/ (accessed April 2017). 135 “Plans,” Cricket, https://www.cricketwireless.com/support/plans‐and‐features/cricket‐plans‐and‐features/customer/plans.html (accessed April 2017). 136 “Plans,” MetroPCS, https://www.metropcs.com/shop/plans (accessed April 2017). 137 Philip Michaels, “MetroPCS Is Fastest Discount Carrier, Straight Talk Slowest,” Tom’s Guide, March 28, 2017, http://www.tomsguide.com/us/discount‐carriers‐performance,news‐24762.html (accessed April 2017).
CTC Technology & Energy | IMG Rebel | Fiber for San Francisco | October 2017
163
data costing $5. It also has an unlimited plan for $50 per month, but again, tethering is limited to
8 GB of data.138
In addition to the four major carriers, there are a number of mobile virtual network operators
(MVNOs) that offer low‐cost, no contract, data plans. Google’s Project Fi offers a $20 per month
plan, where customers pay $10 per GB of data they use.139 Ting Mobile offers plans under which
consumers pay only for as many voice minutes, texts, and GB of data as they use each month,
with a $6 per line base rate and each GB of data used costing $10.140 Republic Wireless has
monthly plans that offer unlimited voice minutes and texts at a rate of $20 for 1 GB, $30 for 2
GB, $45 for 4 GB, and $60 for 6 GB of cellular data. 141 These MVNOs rely on partnership
agreements with major carriers, and therefore speeds and availability are dependent on the
strength of their partner carrier’s network in a given area. Given that much of the new investment
in high speed mobile networks is concentrated in high‐income areas, individuals living in lower‐
income neighborhoods have access to slower than average service speeds.
MobileBroadbandServicesRepresentanInadequateAlternativetoFixedServicesWhile mobile data plans may be helping to bridge the divide for now, they have distinct
disadvantages compared to wired broadband subscriptions. Low‐cost mobile data plans are often
metered, with strict data caps. Thrifty mobile users learn to wait until they are connected to Wi‐
Fi to download large files, or use data‐intensive applications, such as video‐streaming or
teleconferencing. Those who live with, or in close proximity to available Wi‐Fi networks can pay
substantially less for mobile data than someone who uses the same amount of data, but relies
exclusively on their mobile carrier’s network.
The demand for mobile data is skyrocketing,142 and in many areas, carriers are struggling to keep
up.143 If the federal government fails to free up substantial amounts of new spectrum in the next
few years, the U.S. could face a serious shortage of spectrum available for commercial data
138 “Shop Plans,” Boost Mobile, https://www.boostmobile.com/#!/shop/plans/monthly‐phone‐plans/ (accessed April 2017). 139 “Project Fi: A simple plan for everyone,” Google, https://fi.google.com/about/plan/ (accessed April 2017.) 140 “Only pay for the levels you reach,” Ting, https://ting.com/rates (accessed April 2017). 141 “Smartphone service shouldn’t have to cost a lot. Now it doesn’t.” Republic Wireless, https://republicwireless.com/cell‐phone‐plans/?gclid=CjwKEAjwq5LHBRCN0YLf9‐GyywYSJAAhOw6mWSuShk9jtYZlI_se8gHqgH3j82ex7MXUonHIli0wOBoCvZbw_wcB (accessed April 2017). 142 Phillip Tracy, “Moving in‐building forward with shared infrastructure and neutral host,” RCR Wireless News, November 1, 2016, http://www.rcrwireless.com/20161101/carriers/in‐building‐neutral‐host‐tag31 143 Keith Carls, “Next Generation Cell Tower Coming to Area Near You; cellular companies scrambling to keep up with demand from mobile devices,” KEYT, May 25, 2016 http://www.keyt.com/news/santa‐barbara‐s‐county/next‐generation‐cell‐towers‐coming‐to‐area‐near‐you/87615564 (accessed March 2017).

CTC Technology & Energy | IMG Rebel | Fiber for San Francisco | October 2017
164
services, which would lead to slow downs and price spikes.144 Even if an individual purchases
high‐speed service or an unlimited plan, many of the major carriers’ terms of service contain fine
print allowing the carriers to throttle speeds during periods of network congestion, or after a
customer reaches a certain usage milestone each month. Most of the unlimited plans have strict
limits on how much data tethered devices can use, making them less‐than ideal for use as a
households primary internet connection.145
Lower‐CostBroadbandServicesAreNotUniversallyAvailableandTendtoOfferLowerSpeeds
ComcastInternetEssentialsFor some low‐income and senior households that meet very specific requirements, Comcast
offers its Internet Essentials service for $9.95 per month. The service includes up to 10 Mbps
download speeds, and advertises no contract or installation fees necessary. To be eligible for the
service, all applicants must meet all the following eligibility requirements:
Live in an area currently served by Comcast,
Not have been a Comcast internet subscriber within the past 90 days, and
Have no outstanding debt to Comcast from within the past year146
All families with students enrolled in schools with more than 40 percent of the student body
participating in the National School Lunch Program’s free or reduced lunch program are
automatically approved for the program and do not need to submit individual documentation
beyond certifying that a child is enrolled in a pre‐approved school.147
144 George Ford, “Have we got it all wrong? Forecasting mobile data use and spectrum exhaust,” Phoenix Center for Advanced Legal & Economic Public Policy Studies, October 21, 2014, http://www.phoenix‐center.org/perspectives/Perspective14‐06Final.pdf (accessed March 2017). 145 Tim Moynihan, “Verizon’s Unlimited Plan is Back. Here’s how it compares to other carriers,” Wired, February 13, 2017, https://www.wired.com/2017/02/verizons‐unlimited‐data‐plan‐back‐heres‐compares‐carriers/; Christina Warren, “Is Verizon’s resurrected Unlimited data plan a good deal?” Gizmodo, February 13, 2017, http://gizmodo.com/is‐verizons‐resurrected‐unlimited‐data‐plan‐a‐good‐deal‐1792294971; Jon Brodkin, “T‐Mobile now throttling mobile hotspots when network is congested,” ArsTechnica, October 4, 2016, https://arstechnica.com/information‐technology/2016/10/t‐mobile‐now‐throttling‐mobile‐hotspots‐when‐network‐is‐congested/; Adam Ismail, “Cricket’s Unlimited data customers could soon see speed cuts during peak hours,” Digital Trends, February 27, 2017, http://www.digitaltrends.com/mobile/cricket‐reduces‐unlimited‐data‐speeds/ (accessed March 2017). 146 “Affordable Internet at home for your family,” Internet Essentials from Comcast, https://www.internetessentials.com/apply (accessed March 2017). 147 “Internet Essentials from Comcast,” Fact Sheet, Comcast, August 2016, https://www.internetessentials.com/~/media/InternetEssential/IE%20Fact%20Sheet%209.9.2016.pdf (accessed April 2017).

CTC Technology & Energy | IMG Rebel | Fiber for San Francisco | October 2017
165
Households that do not meet the pre‐approved criteria must demonstrate financial eligibility by
submitting proof that:
At least one child is eligible for the Federal School Lunch Program,
At least one member of the household is eligible for the Supplemental Nutrition
Assistance Program (SNAP) or
At least one member of the household is eligible for Housing and Urban Development
(HUD) assistance.148
In addition, seniors in select pilot areas, including San Francisco, are eligible for the program,
provided they are older than 62, and are receiving state or federal assistance.149 Community
college students enrolled in select public post‐secondary educational institutions in Colorado and
Illinois that are Pell Grant recipients are also eligible for the program.150 Comcast has not
announced plans to expand these pilot programs at this time.
It should be noted that while the Internet Essentials program is an indisputable step in the right
direction, its limited scope in assisting only those on federal assistance programs may be leaving
behind those in the lower income brackets who do not qualify for federal help. For many
Americans who do not qualify for federal assistance, the choice between food and internet may
be an obvious, though difficult decision.
And despite the availability of Internet Essentials, the City’s Budget and Legislative Analyst found
in 2015 that although 70 percent of public school students in the City’s public schools
(approximately 11,000 student families) are eligible for the program, only approximately 1,500
students (13.6 percent) do subscribe.151
AT&TAccessAT&T also offers a low‐cost product for lower‐income consumers. As one of the conditions of
AT&T’s merger with DirecTV, AT&T agreed to offer low‐cost wireline home internet service for
low‐income individuals and households. The company’s “Access” service is available to
households living in AT&T’s existing service area in which at least one resident participates in the
Supplemental Nutrition Assistance Program (SNAP) program. The program is also open to
148 “Frequently Asked Questions: Housing Assistance,” Internet Essentials from Comcast, https://www.internetessentials.com/Getting‐Help/HousingAssistance (accessed March 2017). 149 “Frequently Asked Questions: Seniors,” Internet Essentials from Comcast, https://www.internetessentials.com/Getting‐Help/Seniors (accessed March 2017). 150 “Access to school and job opportunities, now from home,” Internet Essentials from Comcast, https://www.internetessentials.com/college (accessed April 2017). 151 City and County of San Francisco Board of Supervisors Budget and Legislative Analyst, Policy Analysis Report regarding Digital Divide in San Francisco, April 15, 2015.

CTC Technology & Energy | IMG Rebel | Fiber for San Francisco | October 2017
166
Californians receiving Supplemental Security Income (SSI) benefits. Further requirements
include:
Home address in a currently served area within AT&T’s 21‐state footprint
No outstanding debt for standard AT&T internet service within the past 6 months
No outstanding debt for Access service
AT&T provides qualifying individuals with speeds ranging from 768 Kbps to 10 Mbps, depending
on availability. Service levels between 768 Kbps and 3 Mbps cost $5 per month, while the 5 to 10
Mbps service costs $10 per month. For qualifying individuals, the service contains no start‐up or
installation fees, and includes a Wi‐Fi router for the home. Customers also receive access to
AT&T’s network of hotspots. Like other wired plans, Access plans are subject to a data cap of 150
GB for $5 plans and 1 TB for $10 plans, and overages will be charged $10 per 50 GB over plan
limits.152
The Access service will only remain available until 2020.153
Initially, AT&T used a loophole in the merger condition to offer the discounted Access service
only in locations where its network could support 3 Mbps service, regardless of eligibility.154 After
some controversy, the company has since expanded the program to those living in areas with at
least 768 Kbps service available. Individuals living in areas where 768 Kbps is not available still
cannot qualify for service through Access.
FederalLifelineSubsidyLow‐income residents may be able to obtain a service subsidy through the federal Lifeline
program, which offers benefits for either telephone or internet service to qualifying low‐income
households nationwide, effectively providing low‐ or no‐cost telephone or internet service. For a
household to be eligible for the program, a member must be enrolled in one of nine federal aid
programs, including the Supplemental Nutrition Assistance Program (SNAP), Supplemental
Security Income (SSI), and Medicaid; or have a household income below the Federal Poverty
152 “Access from AT&T,” https://www.att.com/shop/internet/access/#/ (accessed March 2017). 153 “Access from AT&T,” https://www.att.com/shop/internet/access/#/ (accessed March 2017). 154 Jon Brodkin, “AT&T refuses to offer low‐income discounts for sub‐3Mbps Internet,” ArsTechnica, September 6, 2016, https://arstechnica.com/information‐technology/2016/09/att‐refuses‐to‐offer‐low‐income‐discounts‐for‐sub‐3mbps‐internet/ (accessed March 2017).
CTC Technology & Energy | IMG Rebel | Fiber for San Francisco | October 2017
167
guideline. Households are eligible for one benefit—either telephone or internet service—usually
totaling a $9.25 credit on their monthly bill.155
To apply, new customers petition qualified Lifeline providers (of which there are 36 in California,
including AT&T for home phone service, but not any of the City’s other providers156) and provide
documentation of eligibility for the program. The providers then check applicants’ eligibility
against the registries of federal programs, and if accepted, receive funds for each eligible
subscriber from the Universal Service Fund, managed by the Universal Services Administrative
Company.157 Once subscribed, Lifeline customers may change providers once every 60 days for
telephone service, or once every 12 months for internet service.158
Recent political changes have created threats to the program. In February, FCC Chairman Ajit Pai
announced that nine potential Lifeline providers would not be allowed to participate in the
Lifeline program,159 despite their earlier certification by the FCC under former Chairman Tom
Wheeler. Wheeler’s former advisor Gigi Sohn criticized Pai’s actions and noted that they “will
make the market for Lifeline broadband services less competitive, limiting choice and keeping
prices high. As a result, fewer low income Americans will be able to afford broadband.”160
Chairman Pai released a clarifying statement in late March, noting “I want to make it clear that
broadband will remain in the Lifeline program so long as I have the privilege of serving as
Chairman… But as we implement the Lifeline program—as with any program we administer—we
must follow the law. And the law here is clear: Congress gave state governments, not the FCC,
the primary responsibility for approving which companies can participate in the Lifeline program
under Section 214 of the Communications Act.”161
155 “Get Connected: Become a Lifeline Customer,” Universal Service Administrative Company, http://www.lifelinesupport.org/ls/ (accessed March 2017). 156 “Companies Near Me: California,” Lifeline, Universal Service Administrative Company, http://www.lifelinesupport.org/ls/companies/CompanyListing.aspx?state=CA&stateName=California (accessed March 2017). 157 “Lifeline Program for Low‐Income Consumers,” Federal Communications Commission, https://www.fcc.gov/general/lifeline‐program‐low‐income‐consumers (accessed March 2017). 158 “Change My Company,” Lifeline, Universal Service Administrative Company, http://www.lifelinesupport.org/ls/change‐my‐company.aspx (accessed March 2017). 159 Brian Fung, “The FCC is stopping 9 companies from providing federally subsidized Internet to the poor,” Washington Post, February 3, 2017, https://www.washingtonpost.com/news/the‐switch/wp/2017/02/03/the‐fcc‐is‐stopping‐9‐companies‐from‐providing‐subsidized‐broadband‐to‐the‐poor/?utm_term=.2a7ab9593e96 (accessed March 2017). 160 Gigi Sohn, “Defending the Indefensible: Chairman Pai’s Lifeline Reversal Will Widen the Digital Divide,” Blog Posting, Benton Foundation, https://www.benton.org/blog/Defending‐the‐Indefensible (accessed March 2017). 161 “Statement of FCC Chairman Ajit Pai: On the Future of Broadband in the Lifeline Program,” News Release, Federal Communications Commission, March 29, 2017, https://www.fcc.gov/document/chairman‐pai‐future‐broadband‐lifeline‐program (accessed March 2017).

CTC Technology & Energy | IMG Rebel | Fiber for San Francisco | October 2017
168
Low income residents can also obtain free devices that will connect to Wi‐Fi networks provided
by the City, community centers, and businesses through the federal Lifeline Assistance Program.
Known colloquially as “Obamaphones,” these devices are Wi‐Fi enabled and provided at no cost
to low‐income Americans who qualify. There is much anecdotal evidence of the devices’ use in
low‐income and homeless communities both in San Francisco and nationwide. While many
Lifeline wireless carriers offer limited amounts of mobile data (50 to 500 MB per month),162,163,164
there is no option to increase the amount of data on the plans. For homeless and low‐income
families, the device’s internet functionality is dependent on the availability of Wi‐Fi service in the
City.
CostsforItemsOtherThanBroadbandServicesAlsoImpactBroadbandAdoptionRatesIt should be noted that monthly service costs are not the only prohibitive factor for non‐
broadband adopters. In the Pew Research poll, 10 percent of respondents cited the high cost of
purchasing a computer as the reason they do not have broadband access. While investigating
barriers to broadband adoption, Dailey et. al found “hardware and software costs, installation
costs and deposits, equipment maintenance fees, transaction costs for disconnecting, and
changes to subscription pricing all introduce additional—and often unpredictable—layers of
cost.”165 For respondents to Dailey’s surveys, these unanticipated costs “were often cited as
reasons for dropping broadband at home.”166
FactorsOtherThanCostAlsoImpactBroadbandAdoptionRatesA lack of digital and internet literacy and computer skills make the task of getting online feel
daunting, and contribute to lower broadband adoption rates. Many Americans of all ages lack
the technical skills needed to feel comfortable and confident accessing online resources and
services, but the digital readiness gap is especially pronounced among older adults, who grew up
in an era before the internet became integrated into everyday life. A 2016 Pew Research Center
study found that 52 percent of adults were relatively hesitant to access online learning
services.167 A 2014 study also found that nearly one third of Americans had low levels of digital
162 “Lifeline Program Description,” Assurance Wireless, http://www.assurancewireless.com/Public/MorePrograms.aspx (accessed March 2017). 163 “Plans,” Life Wireless, https://www.lifewireless.com/main/plans (accessed March 2017). 164 “Frequently Asked Lifeline Questions,” enTouch Wireless, https://www.entouchwireless.com/pages/free_phone_more_info#collapse‐TwentyFour (accessed March 2017). 165 “Broadband Adoption in Low‐Income Communities,” Social Science Research Council, March 2010, http://webarchive.ssrc.org/broadband_adoption.pdf (accessed March 2017). 166 Ibid. 167 John Horrigan, “Digital Readiness Gaps,” Pew Research Center, September 20, 2016, http://www.pewinternet.org/files/2016/09/PI_2016.09.20_Digital‐Readiness‐Gaps_FINAL.pdf (accessed March 2017).

CTC Technology & Energy | IMG Rebel | Fiber for San Francisco | October 2017
169
skills, and this lack of skills have the largest impact on determining what online services an
individual will access.168
Even some users who have the technical capabilities to use the internet to access certain services
or resources still may not feel comfortable accessing other services due to a lack of trust or
understanding of privacy issues. According to a 2015 NTIA survey, “84 percent of online
households named at least one concern they had about online privacy and security risks,”
including identity theft, credit card fraud, data collection, loss of control over private data, data
collection by government and threats to personal safety.169 These fears lead some individuals to
stay off line altogether, while others limit their internet use to activities they feel comfortable
with.
Many individuals will not want internet enough to sign up for home broadband service until they
gain the skills they need to feel confident and comfortable online. Many organizations have
developed successful programs that help low‐income and elderly populations develop the digital
literacy skills they need to take advantage of online resources and services. 170 The most
successful programs use relevant content, and establish trust between the individuals and the
organizations offering the service.171 These efforts help build demand for the internet, and,
together with low‐cost access to broadband and hardware, lead to higher rates of broadband
adoption.
DigitalInclusionCanBeExpandedThroughLow‐Cost,High‐BandwidthServicesMaking reliable, high‐bandwidth, home broadband service available at an affordable price will
not solve all digital inclusion problems, but it will make a substantial difference on the supply side
of the challenge. Comcast’s Internet Essentials program has made good progress in this direction,
but it is not available to all low‐income individuals, and with advertised speeds ‘up to 10Mbps,’
it will not support many of the data‐hungry applications that are quickly being integrated into
schools and workplaces.
168 John Horrigan, “Digital Readiness: Nearly one‐third of Americans lack the skills to use next‐generation ‘Internet of things’ applications,” June 2014, http://jbhorrigan.weebly.com/uploads/3/0/8/0/30809311/digital_readiness.horrigan.june2014.pdf (accessed March 2017). 169 Rafi Goldberg, “Lack of Trust in Internet Privacy and Security May Deter Economic and Other Online Activities,” Blog Posting, National Telecommunications and Information Administration, May 13, 2016, https://www.ntia.doc.gov/blog/2016/lack‐trust‐internet‐privacy‐and‐security‐may‐deter‐economic‐and‐other‐online‐activities (accessed March 2017). 170 “Strategies and Recommendations for Promoting Digital Inclusion,” Consumer and Governmental Affairs Bureau, Federal Communications Commission, January 11, 2017, https://apps.fcc.gov/edocs_public/attachmatch/DOC‐342993A1.pdf (accessed March 2017). 171 “Libraries' Increasing Role in Broadband Adoption: Barriers: Digital Literacy, Relevancy & Cost,” Benton Foundation, January 2016, https://www.benton.org/initiatives/libraries‐broadband‐adoption/barriers (accessed March 2017).

CTC Technology & Energy | IMG Rebel | Fiber for San Francisco | October 2017
170
In order to move beyond the digital divide, low‐income individuals and families need to have
access to a similar online experience as their higher‐income counterparts. If affordable home
broadband services only provide a second‐class experience, they will continue to hinder low‐
income individuals’ ability to fully partake in economic, educational, and civic life in the 21st
century. Instead of building demand for home broadband, a slow service could generate
frustration and cause some users to give up on home broadband service altogether.
A better approach, in terms of meeting the City’s policy goals, would be to make the same service
that is available on the open market (i.e., the standard, off‐the‐shelf service that consumers can
buy) available to low‐income consumers at a reduced rate.
Creating a special, deliberately inferior product (i.e., lower speed) at a reduced rate for low‐
income consumers is the approach taken by Comcast for its Internet Essentials program and by
AT&T for its Access service. These products are low cost only in terms of the monthly fee in
comparison to other broadband services on the market; they are not low‐fee on a per‐megabit
basis.
This means that the industry’s low‐cost digital inclusion services are very basic. They do not
enable many of the applications that are fundamental to the internet today, such as streaming
educational videos.
The alternative approach to creating a digital inclusion product is to make available an internet
product that has the same level of quality that wealthy people are able to buy, but to make it
available to low‐income consumers at lower cost. This was the model initially adopted for the
Lifeline program for voice communications.
Given everything discussed here—including the importance of bandwidth, and the fact that while
many low‐income residents already have access to Comcast and AT&T’s products, those products
are not equivalent to what wealthy people are able to buy (and are not transformative for low‐
income users)—the Fiber for San Francisco Initiative should consider prioritizing the second
model, not the first.
That said, for individuals struggling to make ends meet, even a $10 a month service can be
difficult to afford. Successful digital inclusion efforts often go a step further in trying to meet
people where they are, providing as much flexibility in payment options as possible.
For example, PCs for People in St. Paul, Minnesota, sets up prepaid plans for their clients, and
allows them to pay cash for one‐month, three‐month, six‐month, or 12‐month periods of service
at a time. The organization offers the first three months free, to help offset the cost of the router
and allow their clients to save up before another payment was due. If they do not have enough
saved up by the time the next payment is due, their service is just put on hold until they make

CTC Technology & Energy | IMG Rebel | Fiber for San Francisco | October 2017
171
their next payment. And instead of having to interface with a large, corporate customer support
system, users can walk in to a local facility staffed with friendly individuals that want to help them
get online.172
In Wilson, North Carolina, a partnership between the municipal Greenlight network and the local
housing authority allows residents to sign up for 50 Mbps symmetrical service at $10 per month.
The housing authority provides residents with a free router, thus eliminating additional startup
costs, and then adds the monthly fee to users’ existing monthly bills, simplifying the payment
process.173
To maximize the impact of an affordable, high‐bandwidth service, it will need to be paired with
digital literacy training, low‐cost hardware initiatives, and public access computer centers that
offer support. These complementary initiatives will help build demand for high‐speed home
broadband.
However, in many cases, the demand for home broadband is already there. There is simply no
one offering to supply adequate service at a price that low‐income individuals can afford.
172 Angela Siefer, “Innovators in Digital Inclusion: PCs for People,” Benton Foundation, September 28, 2016, https://www.benton.org/blog/innovators‐digital‐inclusion‐pcs‐people (accessed March 2017). 173 Christopher Mitchell, “Wilson Greenlight, Public Housing Authority Solve Access Gap ‐ Community Broadband Bits Episode 236,” Community Networks, January 17, 2017, https://muninetworks.org/content/transcript‐community‐broadband‐bits‐episode‐236 (accessed March 2017).

CTC Technology & Energy | IMG Rebel | Fiber for San Francisco | October 2017
172
Appendix I: Potential Technical Framework for the Lit Fiber, Multi‐Provider,Open‐AccessNetwork
The following describes, at a high‐level, our recommendations for the Lit Fiber network that will
be administered by the Lit Fiber Concessionaire: An open‐access FTTP network capable of
simultaneous use by multiple Retail Service Providers (RSP).
An open‐access FTTP network serves as a platform for multiple service providers to reach
subscribers over a shared infrastructure. The network model provides a centralized place where
RSPs can connect to the network and deliver their services to their subscribers.
This shared last‐mile fiber will reduce the cost for new service providers to enter the market,
reduce redundant and costly builds to reach subscribers, and give subscribers more choices for
service providers to meet their connectivity needs.
NetworkArchitectureThis open‐access network model takes a layered approach to dividing the responsibilities of
running a fully‐functional FTTP network. We describe the three roles as follows:
1. Dark Fiber Concessionaire: Responsible for the physical fiber plant. This includes
construction, the initial network, responding to and repairing fiber breaks, constructing
new fiber, splicing, and any ongoing maintenance tasks.
2. Lit Fiber Concessionaire: Responsible for lit services and the network electronics required
to deliver those services. This includes provisioning services between RSPs and their
subscribers and acting as a central point of contact for the network: providing service to
RSPs and dispatching the Dark Fiber Concessionaire when fiber work is required. The Lit
Fiber Concessionaire will also provide NOC services and operate a Civic Network and self‐
service portal.
3. Retail Service Provider (RSP): Responsible for providing network services, such as an
internet connection, to subscribers over the FTTP network. RSPs obtain access to the FTTP
network through the Lit Fiber Concessionaire and sell their services to subscribers on the
network.

CTC Technology & Energy | IMG Rebel | Fiber for San Francisco | October 2017
173
Figure 22 illustrates the responsibilities of a Dark Fiber Concessionaire, a Lit Fiber Concessionaire,
and a Retail Service Provider in a layered service model.
Figure 22: Responsibilities in a Layered Service Model
The primary goal of the FTTP network is to provide a fast, secure, and reliable connection
between an RSP and its subscribers. The FTTP network will allow an RSP to connect via a “provider
access port” and offer retail service to any subscriber on the network.
The Lit Fiber Concessionaire will create an EVC (Ethernet virtual connection) that associates an
RSP access port with one or more subscriber connections, in effect, creating a “pipe” between an
RSP and their subscribers. Many EVCs can be created to carry various services from different RSPs
across the network in a secure way.
The Lit Fiber Concessionaire may employ various networking technologies and create a network
that is as complex or as simple as necessary and still present the EVC as a simple connection
between an RSP and its subscribers.

CTC Technology & Energy | IMG Rebel | Fiber for San Francisco | October 2017
174
Figure 23 illustrates how multiple RSPs can connect to the FTTP network and provide various
services to connected subscribers.
Figure 23: Multiple Services Provided over the Same FTTP Network
Figure 24 illustrates an EVC provisioned between RSP A’s port and a port on a subscriber’s ONT.
All three service providers shown have their own EVC on the network, but only RSP A’s service is
provisioned to this particular customer.
Figure 24: Service from RSP A Is Provisioned to the Customer ONT via an EVC

CTC Technology & Energy | IMG Rebel | Fiber for San Francisco | October 2017
175
The FTTP network should allow for multiple types of EVC services including:
1. Point‐to‐point services used to connect two subscriber locations (Figure 25)
2. Multipoint (LAN) services used to interconnect more than two locations (Figure 26)
3. “Tee” services used to connect multiple “leaf” locations back to a “root” location which
allows the leaf locations to communicate with the root, but not with one another (Figure
27)
A tree service may be desirable for certain applications such as residential internet service or a
corporate WAN where branch locations should not be able to see each other’s traffic.
The network also must allow for performance monitoring or individual EVCs and quality of service
classifications so that SLAs can be monitored and enforced or so that certain traffic, such as live
video or VoIP traffic, can be prioritized when crossing the FTTP network.
Figure 25: A Point‐to‐Point Topology Figure 26: A Multipoint, or LAN, Topology
Figure 27: A Tree Topology
NetworkOperationalModelWe divide the operational responsibilities for the FTTP network into three layered categories:
fiber maintenance, transport service, and retail service (Figure 28). The Dark Fiber Concessionaire

CTC Technology & Energy | IMG Rebel | Fiber for San Francisco | October 2017
176
will be responsible for constructing and maintaining the physical fiber plant, the Lit Fiber
Concessionaire will be responsible for operating transport service over the physical fiber plant,
and multiple RSPs will connect to the network and purchase transport services in order to provide
retail network services to subscribers. This model establishes clear separation of responsibilities
and lines of communication.
Fiber maintenance: Responsibility for the physical fiber plant. This includes responding to
and repairing fiber breaks, constructing new fiber as required, splicing, and any ongoing
maintenance tasks.
Transport service: Responsibility for lit services and network electronics (routers and
switches) and at the fiber access layer (OLT and ONT). This includes provisioning services
between subscribers and services providers and providing network monitoring services.
Retail network service: Responsibility for providing network services, such as an internet
connection, to subscribers over the FTTP network.
Figure 28: Layered Operational Responsibilities for the Open‐Access FTTP Network
The Lit Fiber Concessionaire serves a central role in this operational model. They are responsible
not only for operating transport services, but also for providing NOC (network operations center)
services which include monitoring, troubleshooting, and fixing the transport network; providing
support and provisioning services for RSPs; and engaging the Dark Fiber Concessionaire when a
fix or new fiber installation is required. The NOC should serve as a single point of contact for RSPs
and the Dark Fiber Concessionaire while the subscriber relationship should be managed by the
RSPs.
The NOC should actively monitor the network and its services and proactively find and resolve
issues on the network. The Lit Fiber Concessionaire should also provide the RSPs with some view
into their monitoring solution. RSPs should also be able to escalate trouble reports to the Lit Fiber
Concessionaire (Figure 29). The Lit Fiber Concessionaire will assist in troubleshooting and

CTC Technology & Energy | IMG Rebel | Fiber for San Francisco | October 2017
177
determine whether the issue is with the transport network, the physical fiber plant, or an issue
with the RSP or subscriber network and direct the issue to the correct group.
Figure 29: Trouble Report Workflow
NewSubscriberProvisioningThe Lit Fiber Concessionaire will be responsible for accepting requests from RSPs for new services
to be provisioned. Most service requests will fall into one of three categories:
An RSP wishes to offer service in a new area. This will require installation of a new fiber
distribution cabinet (FDC) and new fiber to connect the FDC to the network and to the
subscriber premises within the new service area.
An RSP wishes to offer service to a new subscriber premises in an existing service area.
This will require either installation of a service drop between the subscriber premises and
existing FDC or constructing a lateral fiber connection from an existing fiber cable as well
as configuration and installation of new electronics and provisioning service to the new
subscriber.
An RSP wishes to offer new service or change existing services at an existing subscriber
premises. This will require provisioning an RSP’s EVC to an existing subscriber port.

CTC Technology & Energy | IMG Rebel | Fiber for San Francisco | October 2017
178
Services requiring new fiber: If a service requires new fiber, the Lit Fiber Concessionaire will
engage the services of the Dark Fiber Concessionaire and provide an estimated completion date.
Depending on the model being used, the Dark Fiber Concessionaire may install and configure an
ONT or switch at the subscriber premises as part of the construction process.
Services requiring new electronics: We envision a scenario where the Lit Fiber Concessionaire
will pre‐configure and pre‐provision a new subscriber ONT and provide it to the RSP to be
installed along with the service provider’s CPE. This process would limit the number of visits
required to the subscriber premises and allow the retail service provider to have more control
over the subscriber relationship. The Lit Fiber Concessionaire would need to be immediately
available to provide assistance if the retail service provider is unable to bring up the subscriber
connection.
Alternatively, the ONT may be installed by the Dark Fiber Concessionaire during the fiber
construction process. This would allow the transport service to be fully‐tested before the retail
service provider arrives and may be more desirable in certain scenarios, such as cases where the
ONT is being installed on the outside of the subscriber building, where the fiber installation
process necessitates entry into the subscriber premise, or where configuration and provisioning
of the ONT requires that the ONT be installed and active.
Services requiring provisioning to an existing subscriber port: The Lit Fiber Concessionaire will
implement a self‐service portal that allows subscribers to select standard services from available
retail providers. (This self‐service portal is described in greater detail in Section 7.4.5.) For more
advanced services, the Lit Fiber Concessionaire NOC should be prepared to provision the
appropriate subscriber ports within a time frame that will be specified in the provider’s SLA
(Figure 30).

CTC Technology & Energy | IMG Rebel | Fiber for San Francisco | October 2017
179
Figure 30: Service Provisioning Workflow

CTC Technology & Energy | IMG Rebel | Fiber for San Francisco | October 2017
180
AppendixJ:FinancialAnalysisofPurelyPublicModelTo fully understand the potential viability of the purely public model for this initiative, the Project
Team developed a full financial model and analysis of the economics of the traditional municipal
ownership and operations model.
FrameworkThe financial analysis in this section assumes the City owns, operates, and provides retail voice,
video, and data services to residents and businesses in the community. The analysis is based on
the low‐cost model developed by the engineers174 and the assumptions described below.
The model is designed to be cash flow positive in year one; this is accomplished through bond
and loan financing. Over time, given the lower cost estimate to construct, maintain, and operate
the FTTP network, the model indicates that a 47 percent take rate of households and businesses
passed will be required to break even.
The analysis assumes that the City offers three data services:
1 Gbps residential service at $80 per month
1 Gbps small commercial service at $90 per month
1 Gbps medium commercial service (with service‐level agreements) at $240 per month175
These service prices are above those of Google Fiber in other markets ($70 for 1 Gbps) but are
lower than some other providers’ pricing. For example, Comcast’s recently announced residential
1 Gbps service is likely to be priced in excess of $150 per month.
The analysis assumes that 25 percent of business customers will purchase the higher‐level
service. It also assumes that the City will offer video and data services through a service partner
or contractor. For video, we assume that customers will pay an average package price of $85 per
month, and that the City will receive $12.75. For telephone, we assume that two services are
offered—a residential service at $20 per month and a business line at $40 per month—and that
the City will receive $5 per month and $10 per month, respectively.
Table 33 represents a summary of this model.
174 The implications of the higher cost estimate are described as a scenario below. 175 Medium commercial service receives a lower oversubscription rate, that is, less customers sharing the connection, decreasing the instances of network congestion reducing overall speeds.

CTC Technology & Energy | IMG Rebel | Fiber for San Francisco | October 2017
181
Table 33: Municipal Retail Model Financial Summary
Income Statement Year 1 Year 5 Year 10 Year 15 Year 20Total Revenues $16,056,195 $226,825,740 $222,822,540 $222,822,540 $222,822,540 Total Cash Expenses (14,641,640) (95,009,580) (91,973,400) (91,973,400) (91,973,400)Depreciation (19,524,010) (83,441,050) (78,874,790) (77,234,410) (77,234,410)
Interest Expense (16,457,000) (57,012,630) (44,572,300) (28,991,300) (9,308,020)
Taxes
‐
‐
‐ ‐
‐
Net Income $(34,566,455) $(8,637,520) $7,402,050 $24,623,430 $44,306,710
Cash Flow Statement Year 1 Year 5 Year 10 Year 15 Year 20
Unrestricted Cash Balance
$498,455 $9,553,265 $22,393,535 $38,247,385 $54,219,245
Depreciation Reserve ‐ 61,421,730 71,081,400 10,923,510 16,297,160 Interest Reserve 15,057,000 ‐ ‐ ‐ ‐
Debt Service Reserve 16,730,000 64,420,000 64,420,000 64,420,000 64,420,000
Total Cash Balance $32,285,455 $135,394,995 $157,894,935 $113,590,895 $134,936,405
The model assumes that subscribership for data services will ramp up over years one through
four, and then remain steady. The model assumes that subscribership for voice and video services
will ramp up over the same period, but then decline as adoption of over‐the‐top (OTT)
alternatives increases.176
FinancingCostsThis financial analysis assumes that the City will seek a series of bonds and a one‐time loan. It
assumes that a debt service reserve of 5 percent and an interest reserve account is required for
the bonds.
The analysis estimates total financing requirements to be almost $1.29 billion in bonds and a $20
million loan. The bonds are issued at a 4.5 percent finance rate and principal payments start in
the third year after issuance.
We also assume a 20‐year, $20 million loan is obtained in in year one. The loan is issued at a 7
percent finance rate and principal payments start in sixth year after issuance.
The model assumes a straight‐line depreciation of assets, and that the outside plant will have a
20‐year life span while the network equipment will need to be replaced after 10 years. Customer
Premises Equipment (CPE) as well as other miscellaneous equipment (test equipment, vehicles,
176 The analysis uses a flat model (i.e., does not include inflation and salary cost increases because those operating cost increases will be offset and passed on to subscribers in the form of increased prices). Models that add an inflation factor to both revenues and expenses typically greatly overstate future cash flow because net revenues are unlikely to increase as quickly as inflation. At best, the provider will be able to match expenses increases with a dollar‐for‐dollar rate increase, which is what the flat model represents.

CTC Technology & Energy | IMG Rebel | Fiber for San Francisco | October 2017
182
computers) will need to be replaced every five years. Network equipment, including last mile and
CPEs will be replaced or upgraded at 80 percent of original cost, miscellaneous implementation
costs at 100 percent. The model plans for a depreciation reserve account, starting in year three,
to fund future electronics replacements and upgrades.
Table 34 shows the income statement for years one, five, 10, 15, and 20. The City’s net income is
about negative $34.6 million in year one, and negative $8.6 million in year five. By year 10, the
operation will generate a net income just under $7.4 million, growing to just over $24.6 million
in year 15, and just over $44.3 million in year 20.
Table 35 shows the cash flow statement for years one, five, 10, 15, and 20. The unrestricted cash
balance is approximately $498,000 in year one and $22.4 million in year 10. By year 15, the
unrestricted cash balance is just over $38.2 million; it is just over $54.2 million by year 20.

CTC Technology & Energy | IMG Rebel | Fiber for San Francisco | October 2017
183
Table34:IncomeStatement
Income Statement Year 1 Year 5 Year 10 Year 15 Year 20
Revenues
Video $5,595,720 $39,615,780 $39,615,780 $39,615,780 $39,615,780
Internet ‐ Residential 8,004,480 160,089,600 160,089,600 160,089,600 160,089,600
Internet ‐ Business 672,120 13,428,360 13,428,360 13,428,360 13,428,360
Enterprise ‐ ‐ ‐ ‐ ‐
Voice 1,125,600 13,692,000 9,688,800 9,688,800 9,688,800
Connection Fee (net) 658,275 ‐ ‐ ‐ ‐
Ancillary Revenues
‐
‐ ‐ ‐
‐
Total $16,056,195 $226,825,740 $222,822,540 $222,822,540 $222,822,540
Content Fees
Video $4,759,830 $33,674,280 $33,674,280 $33,674,280 $33,674,280
Internet 124,350 2,418,490 2,418,490 2,418,490 2,418,490
Enterprise ‐ ‐ ‐ ‐ ‐
Voice 844,200
10,269,000
7,266,600
7,266,600
7,266,600
Total $5,728,380 $46,361,770 $43,359,370 $43,359,370 $43,359,370
Operating Costs
Operation Costs $4,923,260 $28,186,810 $28,153,030 $28,153,030 $28,153,030
Labor Costs
3,990,000
20,461,000
20,461,000
20,461,000
20,461,000
Total $8,913,260 $48,647,810 $48,614,030 $48,614,030 $48,614,030
EBITDA $1,414,555 $131,816,160 $130,849,140 $130,849,140 $130,849,140
Depreciation 19,524,010 83,441,050 78,874,790 77,234,410 77,234,410
Operating Income (EBITDA less Depreciation)
$(18,109,455) $48,375,110 $51,974,350 $53,614,730 $53,614,730
Non‐Operating Income
Interest Income $‐ $314,600 $338,750 $188,360 $201,790
Interest Expense (10 Year Bond) ‐ ‐ ‐ ‐ ‐
Interest Expense (20 Year Bond) (15,057,000) (55,927,230) (43,758,410) (28,446,980) (9,366,150)
Interest Expense (Loan)
(1,400,000)
(1,400,000) (1,152,640)
(732,680)
(143,660)
Total $(16,457,000) $(57,012,630) $(44,572,300) $(28,991,300) $(9,308,020)
Net Income (before taxes) $(34,566,455) $(8,637,520) $7,402,050 $24,623,430 $44,306,710
Facility Taxes $ ‐ $ ‐ $ ‐ $ ‐ $ ‐
Net Income $(34,566,455) $(8,637,520) $7,402,050 $24,623,430 $44,306,710

CTC Technology & Energy | IMG Rebel | Fiber for San Francisco | October 2017
184
Table35:CashFlowStatement
Cash Flow Statement Year 1 Year 5 Year 10 Year 15 Year 20
a. Net Income $(34,566,455) $(8,637,520) $7,402,050 $24,623,430 $44,306,710
b. Cash Outflows
Debt Service Reserve $(16,700,000) $ ‐ $ ‐ $ ‐ $ ‐
Interest Reserve (30,114,000) ‐ ‐ ‐ ‐
Depreciation Reserve ‐ (21,277,470) (20,113,070) (19,694,770) (19,694,770)
Financing (3,346,000) ‐ ‐ ‐ ‐
Capital Expenditures (303,926,100) ‐ ‐ ‐ ‐
Total $(354,116,100) $(21,277,470) $(20,113,070)
$(19,694,770) $(19,694,770)
c. Cash Inflows
Interest Reserve $15,057,000 $3,307,500 $ ‐ $ ‐ $ ‐
Depreciation Reserve ‐ ‐ ‐ ‐ ‐
Investment Capital ‐ ‐ ‐ ‐ ‐
10‐Year Bond/Loan Proceeds ‐ ‐ ‐ ‐ ‐
20‐Year Bond Proceeds 334,600,000 ‐ ‐ ‐ ‐
Loan Proceeds 20,000,000 ‐ ‐ ‐ ‐
Total $369,657,000 $3,307,500 $ ‐ $ ‐ $ ‐
d. Total Cash Outflows and Inflows $15,540,900
$(17,969,970)
$(20,113,070)
$(19,694,770)
$(19,694,770)
e. Non‐Cash Expenses – Depreciation $19,524,010 $83,441,050 $78,874,790 $77,234,410 $77,234,410
f. Adjustments
Proceeds from Additional Cash Flows (10 Year Bond)
$‐ $‐ $‐ $‐ $‐
Proceeds from Additional Cash Flows (20 Year Bond)
$(334,600,000)
$‐ $‐ $‐ $‐
Proceeds from Additional Cash Flows (Loan) $(20,000,000) $‐ $‐ $‐ $‐
g. Adjusted Available Net Revenue
$(354,101,545) $56,833,560 $66,163,770 $82,163,070 $101,846,350
h. Principal Payments on Debt
10 Year Bond Principal $‐ $‐ $‐ $‐ $‐
20 Year Bond Principal ‐ 47,289,880 62,195,610 77,507,040 96,587,870
Loan Principal
‐ ‐ 1,043,250 1,463,220 2,052,240
Total $‐ $47,289,880 $63,238,860 $78,970,260 $98,640,110
i. Net Cash $498,455 $9,543,680 $2,924,910 $3,192,810 $3,206,240
j. Cash Balance
Unrestricted Cash Balance $498,455 $9,553,265 $22,393,535 $38,247,385 $54,219,245
Depreciation Reserve ‐ 61,421,730 71,081,400 10,923,510 16,297,160
Interest Reserve 15,057,000 ‐ ‐ ‐ ‐
Debt Service Reserve 16,730,000 64,420,000 64,420,000 64,420,000 64,420,000
Total Cash Balance $32,285,455 $135,394,995 $157,894,935 $113,590,895 $134,936,405
CTC Technology & Energy | IMG Rebel | Fiber for San Francisco | October 2017
185
CapitalAdditionsSignificant network expenses, known as capital additions, are incurred in the first few years
during the construction phase of the network. These represent the equipment, material and
construction labor associated with building, implementing, and lighting a fiber network. Table 36
shows the capital additions costs in years one through four, assuming a 48 percent take rate, or
about 175,500 customers.
This analysis projects that capital additions in year one will total approximately $303.9 million.
These costs will total approximately $486.3 million in year two, just under $342.6 million in year
three, and $106.2 million in year four.

CTC Technology & Energy | IMG Rebel | Fiber for San Francisco | October 2017
186
Table36:CapitalAdditions
Capital Additions Year 1 Year 2 Year 3 Year 4Network Equipment Core & GPON Equipment $65,615,200 $16,403,800 $ ‐ $ ‐
Additional Annual Capital
‐
‐ ‐
‐
Total $65,615,200 $16,403,800 $ ‐ $ ‐
Outside Plant and Facilities
Total Backbone and FTTP $214,675,200 $357,792,000
$143,116,800
$ ‐
Additional Annual Capital
‐
‐ ‐
‐
Total $214,675,200 $357,792,000
$143,116,800 $ ‐
Last Mile and Customer Premises Equipment
CPE (residential and small commercial) $5,762,600 $28,654,300 $51,033,800 $27,170,000 CPE (medium commercial) 77,000 384,300 690,900 383,600 CPE (enterprise) ‐ ‐ ‐ ‐Average Drop Cost 16,656,100 82,810,000 147,476,700 78,530,100
Additional Annual Replacement Capital
‐
‐ ‐
‐
Total $22,495,700
$111,848,600
$199,201,400 $106,083,700
Miscellaneous Implementation Costs
OSS $400,000 $ ‐ $ ‐ $ ‐ Vehicles 70,000 140,000 105,000 ‐Emergency Restoration Kit 100,000 ‐ ‐ ‐Work Station, Computers, and Software 70,000 138,000 170,000 82,000 Fiber OTDR and Other Tools 100,000 ‐ ‐ ‐Billing Software 250,000 ‐ ‐ ‐Fiber Management Software 150,000 ‐ ‐ ‐
Additional Annual Capital
‐
‐ ‐
‐
Total $1,140,000 $278,000 $275,000 $82,000
Total Capital Additions $303,926,100 $486,322,400
$342,593,200
$106,165,700
OperatingandMaintenanceExpensesUnder the assumptions in the model, the City’s operating and maintenance expenses, including
principal and interest payments, will total over $31 million in year one, growing to $199.3 million
in year five, $199.7 million in year 10, and $199.9 million in years 15 and 20.
O&M expenses include staffing for sales and marketing, network operations, and other functions
new to the City. The addition of new staff will require new office space. Similarly, network
inventory requirements will require warehousing space. The model builds in costs for the City to:
CTC Technology & Energy | IMG Rebel | Fiber for San Francisco | October 2017
187
Expand office facilities for management, technical, and clerical staff
Open a retail storefront to facilitate customer contact and enhance their experience doing
business with the FTTP enterprise
Provide warehousing for receipt and storage of cable and hardware for the installation
and ongoing maintenance of the broadband infrastructure
Establish a location to house servers, switches, routers, and other core network
equipment
Training new and existing staff will be required to fully realize the economies of starting the FTTP
network. Marketing and sales will also be required, and will represent a new activity for the City.
Staffing with skills in the following disciplines will be required:
Sales/Promotion Finance
Internet and related technologies Vendor Negotiations
Staff Management Networking (addressing, segmentation)
Strategic Planning Marketing
The expanded business and increased responsibilities will require the addition of new staff. The
initial additional positions, staffing levels, and base salaries are shown in Table 37. These numbers
assume two shifts of customer service representative support and 1.5 shifts of customer
technicians. Changing to full 24x7 staffing will increase costs. Similarly, reducing the support
hours (e.g., to 7 a.m. to 8 p.m.) will decrease the required staffing.
Note that Table 37 lists only new employees—the model assumes no existing staff will be
allocated to the enterprise. The listed salaries do not include overhead. To account for overhead,
the model adds 40 percent to the base salaries.

CTC Technology & Energy | IMG Rebel | Fiber for San Francisco | October 2017
188
Table37:LaborExpenses
New Employees Year 1 Year 2 Year 3 Year 4 Year 5+ Year 1 Salary Business Manager 1.00 1.00 1.00 1.00 1.00 $150,000 Marketing & Sales Manager 1.00 1.00 1.00 1.00 1.00 $125,000 GIS & Recordkeeping 2.00 3.00 3.00 3.00 3.00 $90,000 Network Engineer 2.00 3.00 3.00 3.00 3.00 $120,000 Network Technicians 4.00 6.00 6.00 6.00 6.00 $80,000 Sales & Marketing Representatives 10.00 20.00 25.00 25.00 25.00 $65,000 Customer Service Representatives 4.00 24.00 56.00 74.00 74.00 $65,000 Service Technicians/Installers & IT Support 4.00 23.00 55.00 73.00 73.00 $90,000 HR, Administration & Support 1.00 3.00 3.00 3.00 3.00 $75,000 Call Center Support 2.00 8.00 18.00 23.00 23.00 $65,000 Fiber Plant O&M Technicians 4.00 12.00 18.00 18.00 18.00 $90,000
Total 35.00 104.00 189.00 230.00 230.00
Additional key operating and maintenance assumptions include:
Direct internet access costs are estimated at $0.50 per Mbps per month for the first 3,000
Mbps, and $0.40 per Mbps per month beyond that
Insurance is estimated to be zero in year one and $400,000 from year two on
Utilities are estimated to be $100,000 in year one and $200,000 from year two on
Office expenses are estimated to be $200,000 in year one and $400,000 from year two
on
Facility lease fees are expected to be $240,000 in year one and $480,000 from year two
on
Locates and ticket processing are estimated to start in year one at $71,300, increase to
$356,400 in year two, and increase to $712,900 from year three on
Peering expenses are estimated at $42,100 in year one, $252,800 in year two, $631,900
in year three, and $842,600 in year four on
Contingency is estimated to be $200,000 in year one and $400,000 from year two on
Billing and maintenance contract fees are estimated at $75,000 from year two on
Legal fees are estimated to be $200,000 in years one and two, and $100,000 from year
three on
Consulting fees are estimated at $150,000 in year one and $75,000 from year two on
CTC Technology & Energy | IMG Rebel | Fiber for San Francisco | October 2017
189
Marketing and promotional expenses are estimated to be $1 million in year one and
$750,000 from year two on
Vendor maintenance contract fees are expected to start at $8.2 million in year two and remain
steady from year two on (based upon 10 percent of accrued investment). Annual variable
operating expenses not including direct internet access include:
Education and training are calculated as 2 percent of direct payroll expense
Allowance for bad debts is computed as 0.5 percent of revenues
Churn is anticipated to be 6 percent annually, which initiates a $175 per subscriber
acquisition cost.
The estimated cost of electronic billing for the new FTTP enterprise is $0.50 per bill. This is in
addition to the $250,000 cost for the billing software, which will require updating every five
years,177 and $75,000 in annual software support fees.
Fiber network maintenance costs are calculated at 1 percent of the total construction cost, per
year. This is estimated based on a typical rate of occurrence in an urban environment, and the
cost of individual repairs. These costs will total $2.3 million in year one, $6.7 million in year two,
$9.6 million in year three, and roughly $10.4 million in year four on. This is in addition to staffing
costs to maintain the fiber.
Table 38 shows operating expenses for years one, five, 10, 15, and 20. As seen, some expenses
will remain constant while others will increase as the network expands and the customer base
increases.
177 Replacement value estimated at 80 percent of the original cost.

CTC Technology & Energy | IMG Rebel | Fiber for San Francisco | October 2017
190
Table38:OperatingExpensesandP&IPayments
Operating Expenses Year 1 Year 5 Year 10 Year 15 Year 20
Support Services $ ‐ $ ‐ $ ‐ $ ‐ $ ‐
Insurance ‐ 400,000 400,000 400,000 400,000
Utilities 100,000 200,000 200,000 200,000 200,000
Office Expenses 200,000 400,000 400,000 400,000 400,000
Facility Lease 240,000 480,000 480,000 480,000 480,000
Locates & Ticket Processing 71,300 712,900 712,900 712,900 712,900
Peering 42,100 842,600 842,600 842,600 842,600
Contingency 200,000 400,000 400,000 400,000 400,000
Billing Maintenance Contract ‐ 75,000 75,000 75,000 75,000
Fiber & Network Maintenance 2,313,310 10,410,570 10,410,570 10,410,570 10,410,570
Vendor Maintenance Contracts ‐ 8,201,800 8,201,800 8,201,800 8,201,800
Legal 200,000 100,000 100,000 100,000 100,000
Planning ‐ ‐ ‐ ‐ ‐
Consulting 150,000 75,000 75,000 75,000 75,000
Marketing 1,000,000 750,000 750,000 750,000 750,000
Education and Training 79,800 409,220 409,220 409,220 409,220
Customer Handholding ‐ ‐ ‐ ‐ ‐
Customer Billing (Unit) 55,640 1,080,940 1,075,940 1,075,940 1,075,940
Allowance for Bad Debts 80,280 1,134,130 1,114,110 1,114,110 1,114,110
Churn (acquisition costs) 97,380 1,891,650 1,882,890 1,882,890 1,882,890
Pole Attachment Expense 93,450 623,000 623,000 623,000 623,000
Video 4,759,830 33,674,280 33,674,280 33,674,280 33,674,280
Internet 124,350 2,418,490 2,418,490 2,418,490 2,418,490
Enterprise ‐ ‐ ‐ ‐ ‐
Voice 844,200 10,269,000
7,266,600
7,266,600
7,266,600
Sub‐Total $10,651,640 $74,548,580 $71,512,400 $71,512,400 $71,512,400
Labor Expenses
$3,990,000
$20,461,000
$20,461,000
$20,461,000
$20,461,000
Sub‐Total $3,990,000 $20,461,000 $20,461,000 $20,461,000 $20,461,000
Total Expenses $14,641,640
$95,009,580
$91,973,400
$91,973,400
$91,973,400
Principal and Interest $16,457,000 $104,302,510 $107,811,160 $107,961,560 $107,948,130
Facility Taxes ‐
‐
‐ ‐
‐
Sub‐Total $16,457,000
$104,302,510
$107,811,160
$107,961,560
$107,948,130
Total Expenses, P&I, and Taxes $31,098,640 $199,312,090 $199,784,560 $199,934,960 $199,921,530

CTC Technology & Energy | IMG Rebel | Fiber for San Francisco | October 2017
191
SensitivityScenariosTo understand the sensitivity of the financial model to a range of possible outcomes, we
developed sensitivity scenarios. Many of these scenarios may not be realistically attainable, but
are meant to demonstrate the sensitivity of the financial projections to these assumptions.
BaseCaseAs we previously noted, the base case shows that a 47 percent take rate is required to break
even, assuming the lower‐cost construction estimate.178 Table 39 shows a financial summary for
this scenario.
Table39:BaseCaseScenario
Income Statement Year 1 Year 5 Year 10 Year 15 Year 20
Total Revenues $16,056,195 $226,825,740 $222,822,540 $222,822,540 $222,822,540
Total Cash Expenses (14,641,640) (95,009,580) (91,973,400) (91,973,400) (91,973,400)
Depreciation (19,524,010) (83,441,050) (78,874,790) (77,234,410) (77,234,410)
Interest Expense (16,457,000) (57,012,630) (44,572,300) (28,991,300) (9,308,020)
Taxes ‐ ‐ ‐ ‐ ‐
Net Income $(34,566,455) $(8,637,520) $7,402,050 $24,623,430 $44,306,710
Cash Flow Statement Year 1 Year 5 Year 10 Year 15 Year 20
Unrestricted Cash Balance $498,455 $9,553,265 $22,393,535 $38,247,385 $54,219,245
Depreciation Reserve ‐ 61,421,730 71,081,400 10,923,510 16,297,160
Interest Reserve 15,057,000 ‐ ‐ ‐ ‐
Debt Service Reserve 16,730,000 64,420,000 64,420,000 64,420,000 64,420,000
Total Cash Balance $32,285,455 $135,394,995 $157,894,935 $113,590,895 $134,936,405
TakeRateDropsby10PercentagePointsIf the take rate were to drop by 10 percentage points, the enterprise would quickly turn from an
unrestricted cash balance of about $406,000 in year one to a negative cash balance. By year five,
the unrestricted cash balance deficit would be over $61.9 million, growing to a deficit of over
$324 million by year 20.
178 Indicates take rate in year 4. The take rate declines slightly over time due to the reduction of video and voice subscribers.

CTC Technology & Energy | IMG Rebel | Fiber for San Francisco | October 2017
192
Table40:TakeRateDropsby10Percent
Income Statement Year 1 Year 5 Year 10 Year 15 Year 20
Total Revenues $12,644,430 $178,564,620 $175,415,820 $175,415,820 $175,415,820
Total Cash Expenses (13,108,080) (79,018,980) (76,630,810) (76,630,810) (76,630,810)
Depreciation (17,910,490) (73,623,070) (70,028,340) (68,684,740) (68,684,740)
Interest Expense (15,669,500) (52,030,410) (40,592,890) (26,281,980) (8,223,660)
Taxes
‐
‐
‐ ‐
‐
Net Income $(34,043,640) $(26,107,840) $(11,836,220) $3,818,290 $21,876,610
Cash Flow Statement Year 1 Year 5 Year 10 Year 15 Year 20
Unrestricted Cash Balance $406,050 $(61,936,285) $(151,077,335) $(237,684,675) $(324,075,705)
Depreciation Reserve ‐ 54,423,780 71,837,970 32,135,980 46,109,470
Interest Reserve 14,269,500 ‐ ‐ ‐ ‐
Debt Service Reserve 15,855,000 58,730,000 58,730,000 58,730,000 58,730,000
Total Cash Balance $30,530,550 $51,217,495 $(20,509,365) $(146,818,695) $(219,236,235)
VoiceandVideoRevenueDropsby50PercentWhile the base case assumes that voice and video revenue will drop over time as customers turn
to over‐the‐top (OTT) alternatives, we also assumed a revenue share with a voice and video
provider. As the table below illustrates, reducing voice and video revenue by 50 percent from the
base case turns the unrestricted cash balance negative by year 5, with the deficit increasing to
just under $7 million by year 10. This deficit would be reduced over time, totaling $4.9 million by
year 20.
Table41:VoiceandVideoRevenueShareDropsby50Percent
Income Statement Year 1 Year 5 Year 10 Year 15 Year 20
Total Revenues $16,056,195 $226,825,740 $222,822,540 $222,822,540 $222,822,540
Total Cash Expenses (15,061,954) (97,983,170) (94,946,990) (94,946,990) (94,946,990)
Depreciation (19,524,010) (83,441,050) (78,874,790) (77,234,410) (77,234,410)
Interest Expense (16,457,000) (57,012,630) (44,572,300) (28,991,300) (9,308,020)
Taxes
‐
‐
‐ ‐
‐
Net Income $(34,986,769) $(11,611,110) $4,428,460 $21,649,840 $41,333,120
Cash Flow Statement Year 1 Year 5 Year 10 Year 15 Year 20
Unrestricted Cash Balance $78,141 $(4,964,808) $(6,992,490) $(6,006,592) $(4,902,684)
Depreciation Reserve ‐ 61,421,730 71,081,400 10,923,510 16,297,160
Interest Reserve 15,057,000 ‐ ‐ ‐ ‐
Debt Service Reserve 16,730,000 64,420,000 64,420,000 64,420,000 64,420,000
Total Cash Balance $31,865,141 $120,876,922 $128,508,910 $69,336,918 $75,814,476
ResidentialInternetFeeDecreasesorIncreasesby$5perMonthIf competitive pressures force the City to reduce the residential internet service fee by $5 per
month from the levels assumed in the base case, the enterprise would not be financially feasible.

CTC Technology & Energy | IMG Rebel | Fiber for San Francisco | October 2017
193
By year 10, the unrestricted cash balance deficit would be more than $58.2 million, growing to a
deficit of just under $126 million by the end of year 20 (see the table below).
Table42:ResidentialInternetFeeDecreasesby$5perMonth
Income Statement Year 1 Year 5 Year 10 Year 15 Year 20
Total Revenues $15,555,915 $216,820,140 $212,816,940 $212,816,940 $212,816,940
Total Cash Expenses (14,639,140) (94,959,550) (91,923,370) (91,923,370) (91,923,370)
Depreciation (19,524,010) (83,441,050) (78,874,790) (77,234,410) (77,234,410)
Interest Expense (16,457,000) (57,012,630) (44,572,300) (28,991,300) (9,308,020)
Taxes
‐
‐
‐ ‐
‐
Net Income $(35,064,235) $(18,593,090) $(2,553,520) $14,667,860 $34,351,140
Cash Flow Statement Year 1 Year 5 Year 10 Year 15 Year 20
Unrestricted Cash Balance $675 $(21,309,005) $(58,246,585) $(92,170,585) $(125,976,575)
Depreciation Reserve ‐ 61,421,730 71,081,400 10,923,510 16,297,160
Interest Reserve 15,057,000 ‐ ‐ ‐ ‐
Debt Service Reserve 16,730,000 64,420,000 64,420,000 64,420,000 64,420,000
Total Cash Balance $31,787,675 $104,532,725 $77,254,815 $(16,827,075) $(45,259,415)
With a $5 per month increase in residential internet service fees, with all other assumptions
remaining the same, the unrestricted cash balance would balloon, compared to the base case,
and hit $234.4 million by year 20 (see table below).
Table43:ResidentialInternetFeeIncreasesby$5perMonth
Income Statement Year 1 Year 5 Year 10 Year 15 Year 20
Total Revenues $16,556,475 $236,831,340 $232,828,140 $232,828,140 $232,828,140
Total Cash Expenses (14,644,140) (95,059,610) (92,023,430) (92,023,430) (92,023,430)
Depreciation (19,524,010) (83,441,050) (78,874,790) (77,234,410) (77,234,410)
Interest Expense (16,457,000) (57,012,630) (44,572,300) (28,991,300) (9,308,020)
Taxes
‐
‐
‐ ‐
‐
Net Income $(34,068,675) $1,318,050 $17,357,620 $34,579,000 $54,262,280
Cash Flow Statement Year 1 Year 5 Year 10 Year 15 Year 20
Unrestricted Cash Balance $996,235 $40,415,535 $103,033,655 $168,665,355 $234,415,065
Depreciation Reserve ‐ 61,421,730 71,081,400 10,923,510 16,297,160
Interest Reserve 15,057,000 ‐ ‐ ‐ ‐
Debt Service Reserve 16,730,000 64,420,000 64,420,000 64,420,000 64,420,000
Total Cash Balance $32,783,235 $166,257,265 $238,535,055 $244,008,865 $315,132,225
ReducingorIncreasingOperatingandStaffingExpensesby25PercentAssuming all other factors adhere to the base case, reducing the operating and staffing expenses
by 25 percent would have a substantial positive impact on cash flow. As the table below shows,
unrestricted cash balance would soar to over $354.7 million by year 20 in this scenario.
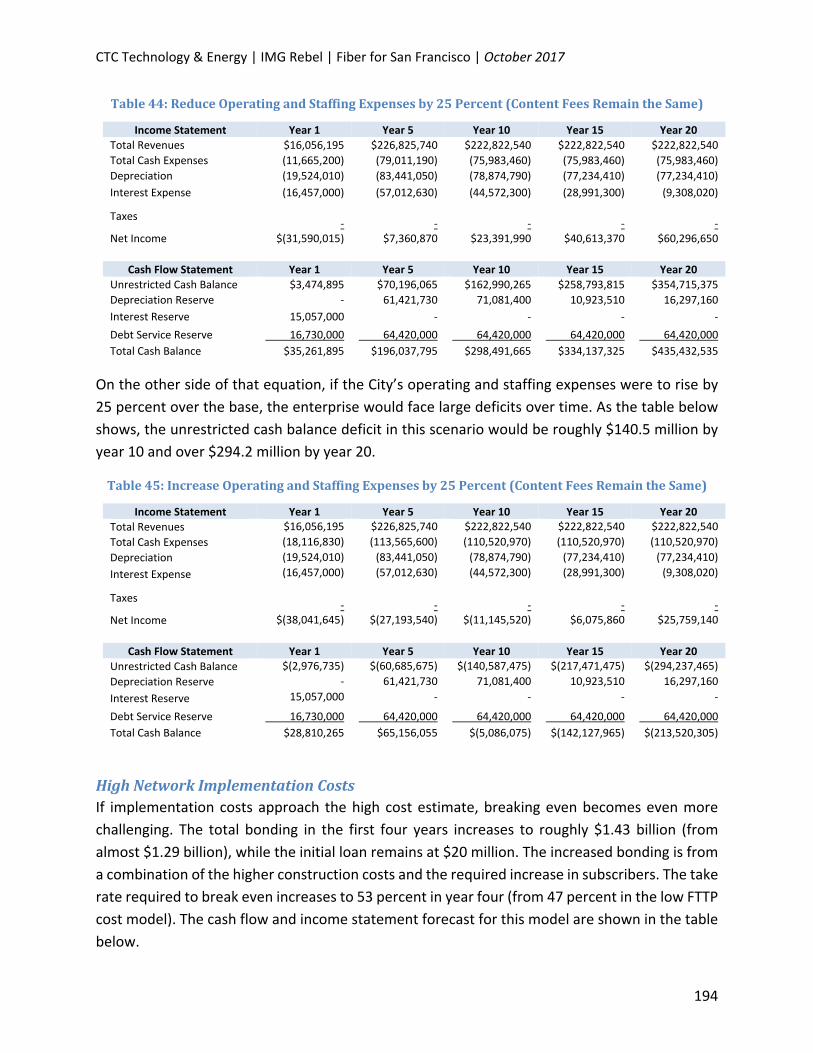
CTC Technology & Energy | IMG Rebel | Fiber for San Francisco | October 2017
194
Table44:ReduceOperatingandStaffingExpensesby25Percent(ContentFeesRemaintheSame)
Income Statement Year 1 Year 5 Year 10 Year 15 Year 20
Total Revenues $16,056,195 $226,825,740 $222,822,540 $222,822,540 $222,822,540
Total Cash Expenses (11,665,200) (79,011,190) (75,983,460) (75,983,460) (75,983,460)
Depreciation (19,524,010) (83,441,050) (78,874,790) (77,234,410) (77,234,410)
Interest Expense (16,457,000) (57,012,630) (44,572,300) (28,991,300) (9,308,020)
Taxes
‐
‐
‐ ‐
‐
Net Income $(31,590,015) $7,360,870 $23,391,990 $40,613,370 $60,296,650
Cash Flow Statement Year 1 Year 5 Year 10 Year 15 Year 20
Unrestricted Cash Balance $3,474,895 $70,196,065 $162,990,265 $258,793,815 $354,715,375
Depreciation Reserve ‐ 61,421,730 71,081,400 10,923,510 16,297,160
Interest Reserve 15,057,000 ‐ ‐ ‐ ‐
Debt Service Reserve 16,730,000 64,420,000 64,420,000 64,420,000 64,420,000
Total Cash Balance $35,261,895 $196,037,795 $298,491,665 $334,137,325 $435,432,535
On the other side of that equation, if the City’s operating and staffing expenses were to rise by
25 percent over the base, the enterprise would face large deficits over time. As the table below
shows, the unrestricted cash balance deficit in this scenario would be roughly $140.5 million by
year 10 and over $294.2 million by year 20.
Table45:IncreaseOperatingandStaffingExpensesby25Percent(ContentFeesRemaintheSame)
Income Statement Year 1 Year 5 Year 10 Year 15 Year 20
Total Revenues $16,056,195 $226,825,740 $222,822,540 $222,822,540 $222,822,540
Total Cash Expenses (18,116,830) (113,565,600) (110,520,970) (110,520,970) (110,520,970)
Depreciation (19,524,010) (83,441,050) (78,874,790) (77,234,410) (77,234,410)
Interest Expense (16,457,000) (57,012,630) (44,572,300) (28,991,300) (9,308,020)
Taxes
‐
‐
‐ ‐
‐
Net Income $(38,041,645) $(27,193,540) $(11,145,520) $6,075,860 $25,759,140
Cash Flow Statement Year 1 Year 5 Year 10 Year 15 Year 20
Unrestricted Cash Balance $(2,976,735) $(60,685,675) $(140,587,475) $(217,471,475) $(294,237,465)
Depreciation Reserve ‐ 61,421,730 71,081,400 10,923,510 16,297,160
Interest Reserve 15,057,000 ‐ ‐ ‐ ‐
Debt Service Reserve 16,730,000 64,420,000 64,420,000 64,420,000 64,420,000
Total Cash Balance $28,810,265 $65,156,055 $(5,086,075) $(142,127,965) $(213,520,305)
HighNetworkImplementationCostsIf implementation costs approach the high cost estimate, breaking even becomes even more
challenging. The total bonding in the first four years increases to roughly $1.43 billion (from
almost $1.29 billion), while the initial loan remains at $20 million. The increased bonding is from
a combination of the higher construction costs and the required increase in subscribers. The take
rate required to break even increases to 53 percent in year four (from 47 percent in the low FTTP
cost model). The cash flow and income statement forecast for this model are shown in the table
below.

CTC Technology & Energy | IMG Rebel | Fiber for San Francisco | October 2017
195
Table46:UseFTTPHighCostEstimate
Income Statement Year 1 Year 5 Year 10 Year 15 Year 20
Total Revenues $18,109,770 $255,787,560 $251,273,160 $251,273,160 $251,273,160
Total Cash Expenses (15,942,020) (104,852,130) (101,428,250) (101,428,250) (101,428,250)
Depreciation (20,768,800) (93,031,680) (87,882,480) (86,242,100) (86,242,100)
Interest Expense (17,640,500) (63,218,610) (49,433,340) (32,155,680) (10,361,920)
Taxes
‐
‐
‐ ‐
‐
Net Income $(36,241,550) $(5,314,860) $12,529,090 $31,447,130 $53,240,890
Cash Flow Statement Year 1 Year 5 Year 10 Year 15 Year 20
Unrestricted Cash Balance $965,850 $14,161,200 $45,057,100 $79,528,430 $114,200,870
Depreciation Reserve ‐ 72,375,750 88,838,430 34,939,740 46,567,670
Interest Reserve 16,240,500 ‐ ‐ ‐ ‐
Debt Service Reserve 18,045,000 71,565,000 71,565,000 71,565,000 71,565,000
Total Cash Balance $35,251,350 $158,101,950 $205,460,530 $186,033,170 $232,333,540