CST Brands, Inc
31
CST Brands, Inc. Investor Presentation April 2013
Transcript of CST Brands, Inc

CST Brands, Inc. Investor Presentation April 2013
1
Safe Harbor Statement
Statements contained in this presentation that state the Company’s or management’s expectations or predictions of the future are forward–looking statements intended to be covered by the safe harbor provisions of the Securities Act of 1933 and the Securities Exchange Act of 1934. The words “believe,” “expect,” “should,” “intends,” “estimates,” and other similar expressions identify forward–looking statements. It is important to note that actual results could differ materially from those projected in such forward–looking statements. For more information concerning factors that could cause actual results to differ from those expressed or forecasted, see Valero’s annual reports on Form 10-K and quarterly reports on Form 10-Q, filed with the Securities and Exchange Commission, and available on Valero’s website at www.valero.com and CST Brand’s registration statement on Form 10 as amended and filed with the Securities and Exchange Commission, and available on the CST Brand’s website at www.cstbrands.com.

Management Presenters
Kim Bowers President & CEO
Clay Killinger SVP & CFO
2

Overview – We are one of the largest independent retailers of transportation fuels and
convenience merchandise in North America – Nearly 1,900 sites in two geographic segments: Retail-U.S. and Retail-Canada – 2012 revenues of $13.1 billion – Pro forma 2012 EBITDA(1) of $379 million
– $455 million of capital expenditures over the past 4 years • Almost 60% of which relates to store remodels and sustaining activities
Retail – U.S. – 1,032 company-operated (COOP) fuel and convenience store sites – Sites located in the Southwest and Central U.S. – Targeting 15 New-to-Industry (“NTI”) sites in 2013
Retail – Canada – 848 retail sites
• 261 COOP fuel and convenience store sites • 507 dealer/agent-operated sites (participate in fuel sales only) • 80 unattended truck fuel sites (“Cardlock” sites)
– Sites located in the provinces of Eastern Canada, including Ontario and Quebec
– Targeting 8 NTI sites in 2013
Summary of Our Business
(1) See Appendix for a full EBITDA definition and reconciliation. Note: Store count data as of December 31, 2012.
3

159
83
63 37 2
625
29
30
4
Large Scale and Geographic Diversity
Site data as of December 31, 2012.
CST Service Centers San Antonio and Montreal
122 542 184
U.S. Canada Total
COOPDealer-Agent
& CardlockOwned 833 81% 187 72% 132 22% 1,152Leased 199 19% 74 28% 455 78% 728
Total 1,032 100% 261 100% 587 100% 1,880
COOP
4

Our Family of Brands
Licensed Brands Proprietary Brands
5

CST is a leading C-store operator in attractive and growing markets in the Southwestern U.S. – 1,032 company-operated retail sites with
average store size of 2,200 sq ft – Averaged 5,083 gallons of fuel sold per
site per day in 2012 – Averaged $17,841 in fuel sales per site per
day in 2012 – Averaged $3,341 in merchandise sales per
site per day in 2012 Convenience-type merchandise include
tobacco products, beer, snacks, beverages and fresh foods – Recent focus on food service and private
label programs drives improvement in merchandise margins • Recent NTIs have a larger format, more
conducive to food service and other services • NTI’s 2012 average store size was 5,360 sq ft
6
Retail U.S. Segment Overview
Fuel Volume and Pro Forma Margin
Total COOP Inside Sales Breakdown
4,983 5,086 5,059 5,083
$0.109 $0.126 $0.131
$0.147
2009 2010 2011 2012
Note: Margins are net of credit card fees, include LIFO and are adjusted for new commercial agreements.
Margin ($ per gallon)
Note: Margin includes retail distribution center.
Cigarettes Food Service Beverages Alcohol Other
36%
8%
23%
15% 18%
38%
8% 23%
14% 17%
36%
9% 23%
15% 17%
9%
32% 25%
16% 18%
$1,171m $1,205m $1,223m $1,239m Total:
2009 2012 2010 2011
(Gallons per site per day)

Company operated and dealer – Consists of 768 sites selling fuel under the
Ultramar brand
• 261 company operated sites (fuel and merchandise) • 507 retail sites that are dealer/agent operated
(fuel only) • Averaged 3,046 gallons of fuel sold per site per
day in 2012 • Averaged $13,008 in fuel sales per site per day
in 2012
• Averaged $2,743 in merchandise sales per site per day in 2012
Cardlock – Consists of 80 Card-activated, self-service,
unattended stations that allow commercial, trucking and governmental fleets to buy transportation fuel 24 hours a day • Averaged 6,220 gallons of fuel sold per site per
day in 2012 • Averaged $25,301 in fuel sales per site per day
in 2012
Heating Oil – One of the largest retail heating oil distributors in Eastern Canada
7
Retail Canada Segment Overview
Total COOP Inside Sales Breakdown
Fuel Volume and Pro Forma Margin
2009 2012 2010 2011
Total: $240m $261m $257m
48%
10% 20%
11%
10%
50%
9% 19%
11% 11%
50%
9%
19%
11%
11%
9%
50%
19%
11% 11%
$201m
3,086 3,223 3,320 3,340
$0.195 $0.224
$0.259 $0.233
2009 2010 2011 2012
Note: Margins are net of credit card fees, include LIFO and are adjusted for new commercial agreements, includes Cardlock motor fuel sales.
Margin ($ per gallon)
(Gallons per site per day)
Cigarettes Food Service Beverages Alcohol Other

Proven Historical Financial Results and Conservative Capital Structure
Available liquidity of ≈$550 million expected at spin-off
Investment Highlights
Significant Real Estate Ownership
Experienced and Deep Management Team
Well Positioned for Growth
Stable Margins Through All Cycles
Exposure to Growing Markets
Robust and Growing Industry
6
5
1
2
3
4 81% of U.S. sites are owned and 72% of Canadian COOP sites are owned
Impressive industry performance even during recessions
Strong urban footprint in the U.S. and Canadian markets with a
concentration in growing markets
Fuel margins are relatively stable on an annual basis despite short-term volatility
Growth in food service and private label programs along with efficient merchandise logistics drive margin growth. NTI
program drives growth in market share. Potential for wholesale business and bolt-on acquisitions
The company is well positioned to be a leader in the sector
Customer.Service.Team.
7
Management team has an average of 27 years of relevant experience
8
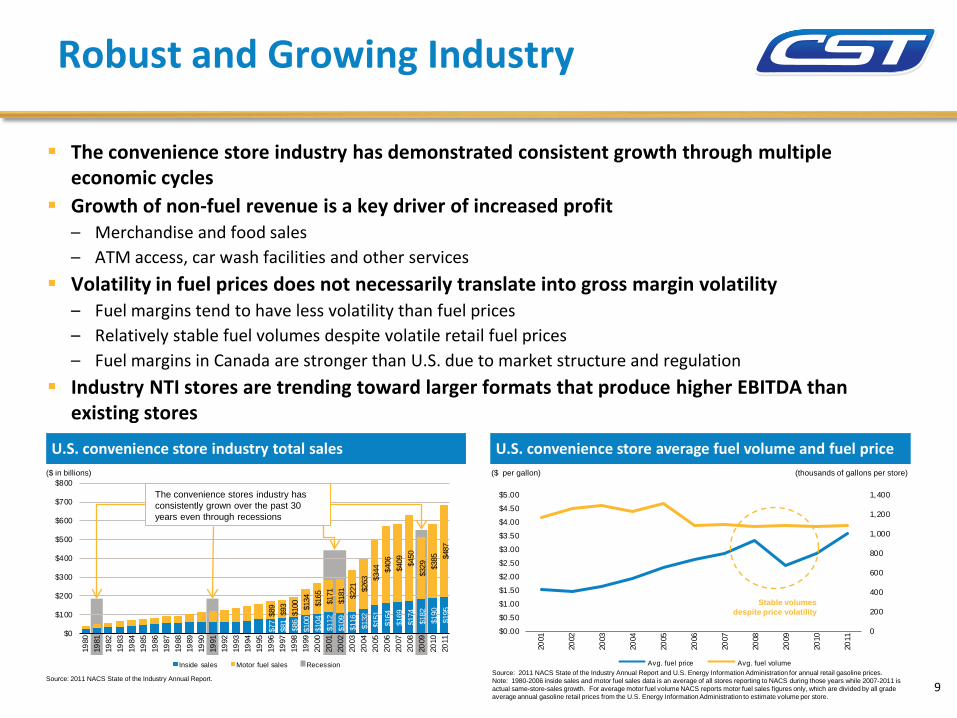
The convenience store industry has demonstrated consistent growth through multiple economic cycles
Growth of non-fuel revenue is a key driver of increased profit – Merchandise and food sales – ATM access, car wash facilities and other services
Volatility in fuel prices does not necessarily translate into gross margin volatility – Fuel margins tend to have less volatility than fuel prices – Relatively stable fuel volumes despite volatile retail fuel prices – Fuel margins in Canada are stronger than U.S. due to market structure and regulation
Industry NTI stores are trending toward larger formats that produce higher EBITDA than existing stores
Robust and Growing Industry
$77
$81
$86
$100
$104
$112
$109
$116
$132
$151
$164
$169
$174
$182
$190
$195$8
9$9
3$1
00 $134 $165
$171
$181 $2
21 $263 $3
44 $406
$409 $4
50$3
29 $385 $4
87
$0
$100
$200
$300
$400
$500
$600
$700
$800
1980
1981
1982
1983
1984
1985
1986
1987
1988
1989
1990
1991
1992
1993
1994
1995
1996
1997
1998
1999
2000
2001
2002
2003
2004
2005
2006
2007
2008
2009
2010
2011
Inside sales Motor fuel sales Recession
The convenience stores industry has consistently grown over the past 30 years even through recessions
($ in billions)
Source: 2011 NACS State of the Industry Annual Report.
0
200
400
600
800
1,000
1,200
1,400
$0.00
$0.50
$1.00
$1.50
$2.00
$2.50
$3.00
$3.50
$4.00
$4.50
$5.00
2001
2002
2003
2004
2005
2006
2007
2008
2009
2010
2011
Avg. fuel price Avg. fuel volume
($ per gallon) (thousands of gallons per store)
Stable volumes despite price volatility
Source: 2011 NACS State of the Industry Annual Report and U.S. Energy Information Administration for annual retail gasoline prices. Note: 1980-2006 inside sales and motor fuel sales data is an average of all stores reporting to NACS during those years while 2007-2011 is actual same-store-sales growth. For average motor fuel volume NACS reports motor fuel sales figures only, which are divided by all grade average annual gasoline retail prices from the U.S. Energy Information Administration to estimate volume per store.
U.S. convenience store industry total sales U.S. convenience store average fuel volume and fuel price
9
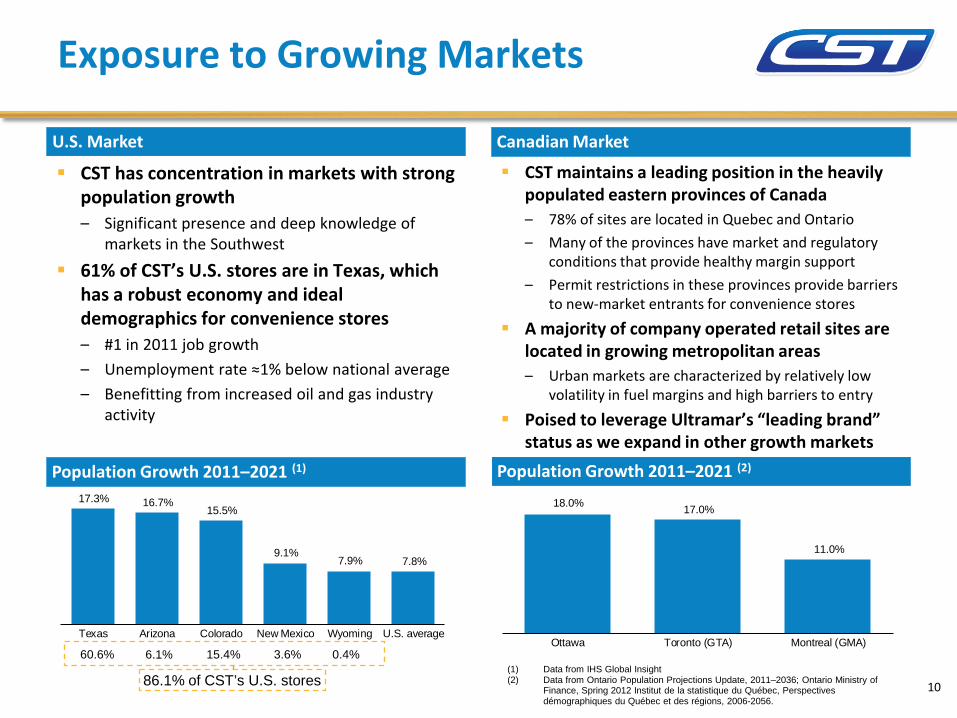
CST has concentration in markets with strong population growth – Significant presence and deep knowledge of
markets in the Southwest
61% of CST’s U.S. stores are in Texas, which has a robust economy and ideal demographics for convenience stores – #1 in 2011 job growth – Unemployment rate ≈1% below national average – Benefitting from increased oil and gas industry
activity
Exposure to Growing Markets
U.S. Market Canadian Market
Population Growth 2011–2021 (2) Population Growth 2011–2021 (1)
86.1% of CST’s U.S. stores (1) Data from IHS Global Insight (2) Data from Ontario Population Projections Update, 2011–2036; Ontario Ministry of
Finance, Spring 2012 Institut de la statistique du Québec, Perspectives démographiques du Québec et des régions, 2006-2056.
18.0% 17.0%
11.0%
Ottawa Toronto (GTA) Montreal (GMA)
CST maintains a leading position in the heavily populated eastern provinces of Canada – 78% of sites are located in Quebec and Ontario – Many of the provinces have market and regulatory
conditions that provide healthy margin support – Permit restrictions in these provinces provide barriers
to new-market entrants for convenience stores
A majority of company operated retail sites are located in growing metropolitan areas – Urban markets are characterized by relatively low
volatility in fuel margins and high barriers to entry
Poised to leverage Ultramar’s “leading brand” status as we expand in other growth markets
10
17.3% 16.7% 15.5%
9.1% 7.9% 7.8%
Texas Arizona Colorado New Mexico Wyoming U.S. average
15.4% 6.1% 60.6% 0.4% 3.6%

$0
$20
$40
$60
$80
$100
$120
-$0.10
$0.00
$0.10
$0.20
$0.30
$0.40
$0.50
$0.60
January 2009
October 2009
July 2010 April 2011 January 2012
October 2012
$ pe
r bar
rel
Cen
ts p
er g
allo
n
Fuel Margin WTI
Stable Margins Through All Cycles
$0.124 $0.137 $0.140 $0.158
$0.00
$0.05
$0.10
$0.15
$0.20
$0.25
$0.30
$0.35
$0.40
2009 2010 2011 2012
Cen
ts p
er g
allo
n
Note: Not adjusted for new commercial agreements with VLO and are presented for price trend comparisons.
Monthly margins are volatile and correlated to
crude oil prices
$0.218 $0.247
$0.278 $0.243
$0.00
$0.05
$0.10
$0.15
$0.20
$0.25
$0.30
$0.35
$0.40
2009 2010 2011 2012
Cen
ts p
er g
allo
n
U.S. Reported Annual Fuel Margins
U.S. Monthly Fuel Margins Canada Monthly Fuel Margins
Canada Reported Annual Fuel Margins
$0
$20
$40
$60
$80
$100
$120
$140
-$0.10
$0.00
$0.10
$0.20
$0.30
$0.40
$0.50
$0.60
January 2009
October 2009
July 2010 April 2011 January 2012
October 2012
$ pe
r bar
rel
Cen
ts p
er g
allo
n
Fuel Margin Brent
11

Well Positioned for Growth Merchandise Growth Drivers in Place
Growing Food Service Business Significant growth opportunity Grow immediate consummables /
snackable business Growth through proprietary food
programs (breakfast and lunch programs)
Growth through branded food programs such as Subway and Country Style
Strong Core Categories Continue to drive sales around core
categories Leverage CST’s high customer counts to
build core category sales Leverage CST’s network volumes to
achieve lower cost of goods
Private Label Program Development Provides gross profit growth Delivers value to and increase loyalty
from consumers Private label volume provides leverage
over national brands
Efficient Supply Chain Strong relationship with distributors Strong central merchandising group
that leverages technology to enhance productivity and optimize costs
Increases store inventory turns Significant benefits achieved through
our Texas distribution center
12

NTI vs. 2012 COOP Average Merchandise Gross Margin Dollars
NTI vs. 2012 COOP Average Fuel Gross Margin Dollars
Well Positioned for Growth NTI (New-To-Industry) Program
13
Overview – CAPEX program selects markets and
properties to invest in based on various factors including competition, growth potential, store concentration, traffic counts and customer access, among others
– CAPEX program is balanced between redevelopment of existing owned properties and NTIs
Retail – U.S. – Anticipate completing 15 NTIs in 2013
(Completed 11 NTIs in 2012) – Have traditionally identified sites well
positioned within CST’s footprint – Focus for 2013 projects is key markets in
Texas Retail – Canada
– Anticipate completing 8 NTIs in 2013 (Completed 5 NTIs in 2012)
– Target markets are the Greater Toronto, Ottawa and Montreal areas
$452
$295
3-Year NTI Average
System COOP Average
Retail - US $706
$441
3-Year NTI Average
System COOP Average
Retail - Canada
$677
$363
3-Year NTI Average
System COOP Average
Retail - US
$387 $299
3-Year NTI Average
System COOP Average
Retail - Canada
($ in thousands)
($ in thousands)
Note: 3-Year NTI Average is for the period of 2009-2011.

Transformation from a “fuel-centric” business to a retail business focused on creating shareholder value
Participate in the convenience store consolidation – Continue to see consolidation in the industry – We will continue to explore and evaluate acquisition opportunities, but with an independent
retailer view – Our scale gives us the ability to integrate quickly
Wholesale Development – Opportunity as an independent company to have a dealer network – Utilize our expertise in Canada’s wholesale business to expand network
Well Positioned for Growth New Opportunities as Independent Company
14

New fuel pricing tools and analysis allow for more dynamic pricing – Centralized pricing center in Canada provides the latest
competitive information to each retail store to optimize price – In US, making investments to utilize historic pricing information,
centralized approach, and LED store signage to respond quickly to changing market dynamics
Internal store redesign highlights high margin offerings and increased merchandise sales – Food service focus generates incremental revenue with above
average gross margins – Private label merchandise offerings increase gross margins and
provide consumers added value
Well Positioned for Growth Focus on Fuel & Merchandise Margin
U.S. – Legacy
U.S. – New
Canada – Legacy Canada – New 15

81%
72% 79%
52%
CST-US CST-CAN CST Consolidated
Other Public Retail Pure-plays
(1)
Leases typically include rent increases at the rate of inflation or higher – Fixed costs increase every year as rent
increases – Leases eventually expire leaving the tenant
subject to renegotiation risk Ownership mitigates impact of lease risks
– No “rent creep” – Potential for long-term increase in value – No risk of losing best locations to lease
expirations – Provides flexibility of use
Significant Real Estate Ownership A True Differentiator
% of COOP with CST Real Estate Ownership
Source: Company data and public filings. (1) Includes Casey’s, Couche-Tard, Pantry and Susser.
16

Kim Bowers, President and Chief Executive Officer – Kim has over 15 years of service with Valero, having served as its Executive Vice President and General Counsel since 2007 until her
promotion to her current position in January 2013. Prior to joining Valero in 1997, Kim specialized in mergers & acquisitions with a Fort Worth, Texas based law firm. Kim holds a B.A. in Spanish and in International Studies from Miami University (Ohio), an M.A. in International Relations from Baylor University, and her J.D. from the University of Texas School of Law. Kim is a 2009 graduate of the Stanford Executive Program.
Clay Killinger, Senior Vice President and Chief Financial Officer – Clay has over 11 years of service with Valero, having served as its Senior Vice President and Controller since 2007 until his promotion to his
current position in January 2013. Prior to that, Clay served as Vice President and Controller of Valero since 2003. Prior to joining Valero in 2001, Clay was a partner at Arthur Andersen LLP, with service there from 1983 through December 2001. Clay is a Certified Public Accountant, with his B.B.A in Accounting from the University of Texas at San Antonio, where he graduated Summa Cum Laude.
Tony Bartys, Senior Vice President and Chief Operating Officer – Tony has over 27 years of experience in the retail and fuel marketing businesses, with 21 of those years at Valero and certain of its
predecessor companies, having served as the Vice President of Retail Operations and Marketing for Valero, overseeing all U.S. Retail operations, from 2001 until his promotion to his current position in January 2013. Tony has a B.A. in Accounting from the University of West Florida-Pensacola. Prior to attending University, Tony served in the U.S. Navy as a submarine Torpedoman 2nd class for five years.
Steve Motz, Senior Vice President and Chief Development Officer – Steve has 30 years of service with Valero and certain of its predecessor companies, having served as the Vice President of Retail Asset
Development and Administration from 2003 until his promotion to his current position in January 2013. Steve has had several areas of responsibilities over his tenure with Valero, including 15 years as part of the Canadian Retail organization, where he directed the launch of the Canadian company operated retail business and led the efforts to rebrand and reposition the Ultramar brand. Steve received his B.B.A. from Wilfrid Laurier University (Waterloo, Ontario).
Hal Adams, Senior Vice President of Marketing – Hal has over 25 years with Valero retail and its predecessor companies, having served as the Vice President of Retail Merchandising from
January 2001 until his promotion to his current position in January 2013. Hal began his tenure with the Company as a store associate in a Stop N Go store in Ventura, California. He has been a Store Manager, District Representative, Regional Merchandiser and has held several leadership positions in the store merchandising area of the network operation. Hal received a B.A. in Business Economics from the University of California, Santa Barbara and he earned his M.B.A. from The University of Texas at San Antonio.
17
Experienced and Deep Management Team Senior Executive Leadership

Name Title Years of relevant
experience Kim Bowers President & Chief Executive Officer 22 years Clay Killinger SVP & Chief Financial Officer 30 years Tony Bartys SVP & Chief Operating Officer 27 years Steve Motz SVP & Chief Development Officer 30 years Hal Adams SVP of Marketing 27 years Cindy Hill SVP & General Counsel & Corporate Secretary 26 years Henry Martinez SVP of Human Resources 20 years Christian Houle SVP – Canada 37 years Stephane Trudel VP – Canada 22 years James Maxey VP & Chief Information Officer 26 years Paul Clark VP of Construction and Maintenance 25 years Jeremy Bergeron VP & Treasurer 20 years Tammy Floyd VP & Controller 19 years Kevin Sheehan VP of Internal Audit and Risk Management 32 years Jeff Truman VP, Regional Retail Operations 28 years Pete Linton VP, Regional Retail Operations 36 years
18
Experienced and Deep Management Team Corporate Executive Leadership Team

Financial Overview

19% 24% 25% 26%
18% 19% 19% 18%
2009 2010 2011 2012
CST Brands C-Store Peer Average
$39 $67
$91 $114 $25
$38 $39
$42
$64
$105
$130
$156
2009 2010 2011 2012
U.S. Canada
$148 $194
$166
$240
2009 2010 2011 2012
$5,311 $6,183 $7,557 $7,907
$3,469 $4,188
$5,306 $5,228 $8,780 $10,371
$12,863 $13,135
2009 2010 2011 2012
U.S. Canada
Pro Forma Cash Flow Return on Net Assets Historical Operating Revenue
Pro Forma Free Cash Flow Historical Capital Expenditures
($ in millions)
($ in millions) ($ in millions)
Source: Company filings. Note: Please see Appendix for a reconciliation of non-GAAP metrics. (1) Peers include Casey’s, Pantry, Susser and Couche-Tard.
(1)
Proven Historical Financial Results Consolidated
20
Sustaining CAPEX : $43 $65 $83 $72

$1,171
$1,205$1,223
$1,239
28.1% 28.3% 28.9% 29.7%
25.0%
30.0%
35.0%
$1,100
$1,150
$1,200
$1,250
2009 2010 2011 2012
MerchandiseRevenue
Gross margin percentage
Merchandise Revenue & Gross Margin Percentage
Number of Site Locations Motor Fuel Average CPG Margin & Pump Price
($ in millions)
Source: Company filings. Note: Please see Appendix for a reconciliation of non-GAAP metrics. (1) U.S. peers include Casey’s, Pantry, and Susser. (2) Margins are net of credit card fees, include LIFO and are adjusted for new commercial agreements
$2.25 $2.68
$3.42 $3.51
$0.109 $0.126 $0.131 $0.147
–
$0.100
$0.200
$0.300
$0.400
–
$1.00
$2.00
$3.00
$4.00
2009 2010 2011 2012
Motor Fuel Avg. Retail Pump Price Motor Fuel Avg. CPG Margin
991 994 998 1,032
700 750 800 850 900 950
1,000 1,050 1,100
2009 2010 2011 2012
16% 20% 19% 23%
16% 18% 17% 16%
2009 2010 2011 2012
CST Brands - U.S. C-Store U.S. Peer Average
Pro Forma Cash Flow Return on Net Assets
(1)
Proven Historical Financial Results U.S.
21
(2)

$201$240 $261 $257
29.4% 30.0% 29.5% 29.2%
25.0%
27.0%
29.0%
31.0%
33.0%
35.0%
$0$50
$100$150$200$250$300
2009 2010 2011 2012
Revenue Gross margin percentage
Merchandise Revenue & Gross Margin Percentage
Number of Site Locations Motor Fuel Average CPG Margin & Pump Price
($ in millions)
907 895 873 848
500
600
700
800
900
2009 2010 2011 2012
26% 34%
40% 33%
24% 23% 25% 25%
2009 2010 2011 2012
CST Brands - Canada C-Store Canadian Peer Average
Pro Forma Cash Flow Return on Net Assets
(1)
Source: Company filings. Note: Please see Appendix for a reconciliation of non-GAAP metrics. (1) Canadian peers include Couche-Tard. (2) Margins are net of credit card fees, include LIFO and are adjusted for new commercial agreements
Proven Historical Financial Results Canada
22
$3.16 $3.84
$4.90 $4.95
$0.195 $0.224 $0.259 $0.233
–
$0.200
$0.400
$0.600
–$1.00 $2.00 $3.00 $4.00 $5.00 $6.00
2009 2010 2011 2012
Motor Fuel Avg. Retail Pump Price Motor Fuel Avg. CPG Margin(2)

At spin, CST expects to issue $1.05 billion of debt with net cash proceeds distributed to Valero
Expected strong pro forma liquidity of ≈$550 million(1), including approximately $200 million of cash generated from “Net 10” payment terms
2012 pro forma lease-adjusted leverage of 3.1x debt-to-EBITDAR(2)
2012 pro forma leverage of 2.8x debt-to-EBITDA(2)
CST
Valero
$500MM 5-Year
Term Loan L + 1.75%
Bank facilities Debt capital
markets
$300MM Revolving
Credit Facility
$550MM 10-Year
High Yield Bonds Estimated at 5.50%
$500MM
$550MM
(1) Includes ~$50 million in existing cash net of transaction expenses, $300 million of revolver availability and $200 million in cash generated by net 10 day payment term from new supply agreements. (2) Please see Appendix for a reconciliation of EBITDA and EBITDAR.
Post spin capital structure
$1,050MM
23
Conservative Capital Structure Key Highlights of Spin

($ in millions) As of December 31, 2012
CST Brands
ActualTransaction
Adj.CST Brands Pro Forma
Cash and equivalents (2) $61 $184 $245 Long-term debt:
New $300 million revolving credit facility New term loan $500 $500 New high yield notes 550 550 Total long-term debt $1,050 $1,050
Total book equity 1,247 (777) 470 Total book capitalization $1,247 $1,520
Credit statistics: 2012 Pro forma EBITDA (3) $379Debt / 2012 EBITDA (3) 2.8x Debt / Total book capitalization 69.1% Net debt / Total book capitalization 53.0% Lease adjusted credit statistics: 2012 Pro forma EBITDAR (3) $404Adj. debt (4) / 2012 EBITDAR (3) 3.1x Adj. debt (4) / Total adj. book capitalization (4) 72.7% Adj. net debt (4) / Total adj. book capitalization (4) 58.4% Source: Company f ilings.(1) Cash from net 10 day payment term from new supply agreements. (2) Includes transaction adjustments related to the spin-off and cash to balance sheet. (3) Please see Appendix for a reconciliation ofEBITDA and EBITDAR.(4) Debt and book capitalization have been adjusted (increased) by 8 times 2012 minimum lease rentals of $25 million, or $200 million.
Total pro forma liquidity of ≈$550 million including $300 million of revolver
availability
($ in millions)
Sources UsesHigh yield notes $550 Payment to VLO $1,050Term loan 500 Cash to balance sheet 184New credit terms with VLO (1) 200 Fees and expenses 16
Total sources $1,250 Total uses $1,250
24
Conservative Capital Structure Pro Forma Capitalization
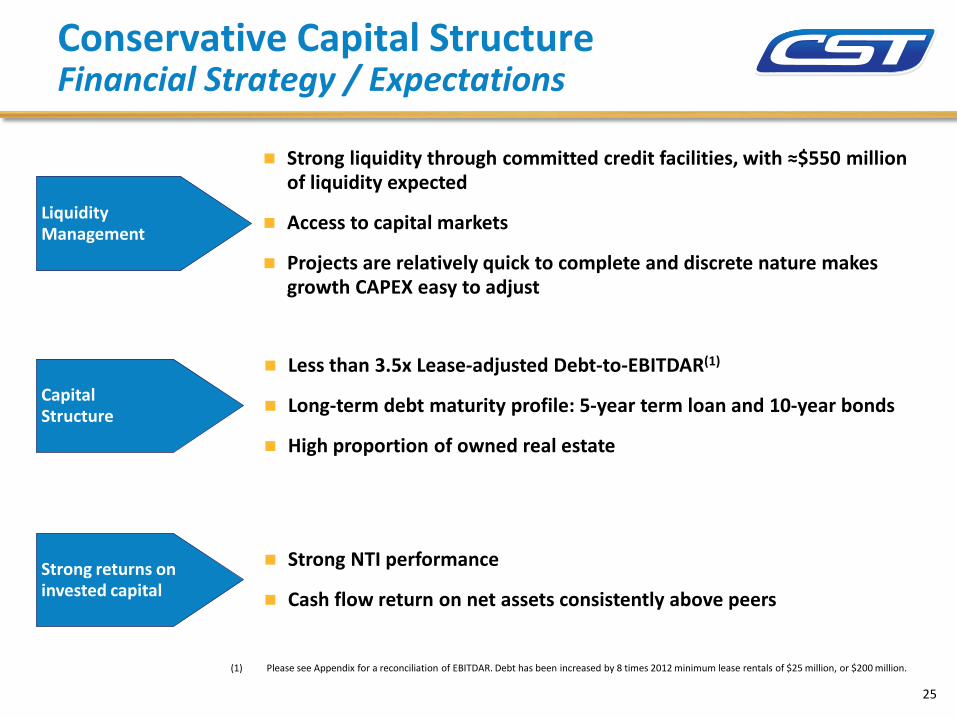
Liquidity Management
Strong liquidity through committed credit facilities, with ≈$550 million of liquidity expected
Access to capital markets
Projects are relatively quick to complete and discrete nature makes growth CAPEX easy to adjust
Capital Structure
Less than 3.5x Lease-adjusted Debt-to-EBITDAR(1)
Long-term debt maturity profile: 5-year term loan and 10-year bonds
High proportion of owned real estate
Strong returns on invested capital
Strong NTI performance
Cash flow return on net assets consistently above peers
(1) Please see Appendix for a reconciliation of EBITDAR. Debt has been increased by 8 times 2012 minimum lease rentals of $25 million, or $200 million.
25
Conservative Capital Structure Financial Strategy / Expectations

Investment Highlights
Proven Historical Financial Results and Conservative Capital Structure
Available liquidity of ≈$550 million expected at spin-off
Significant Real Estate Ownership
Experienced and Deep Management Team
Well Positioned for Growth
Stable Margins Through All Cycles
Exposure to Growing Markets
Robust and Growing Industry
6
5
1
2
3
4 81% of U.S. sites are owned and 72% of Canadian COOP sites are owned
Impressive industry performance even during recessions
Strong urban footprint in the U.S. and Canadian markets with a
concentration in growing markets
Fuel margins are relatively stable on an annual basis despite short-term volatility
Growth in food service and private label programs along with efficient merchandise logistics drive margin growth. NTI
program drives growth in market share. Potential for wholesale business and bolt-on acquisitions
The company is well positioned to be a leader in the sector
Customer.Service.Team.
7
Management team has an average of 27 years of relevant experience
26

Appendix

28
(1) Represents minimum rent expense and excludes contingent rent.
Reconciliation of Net Income to EBITDA and EBITDAR
U.S. Canada Consol. U.S. Canada Consol. U.S. Canada Consol. U.S. Canada Consol.
Historical Net Income, as reported $78 $68 $146 $100 $93 $193 $101 $113 $214 $127 $83 $210Depreciation andamortization expense 71 30 101 72 33 105 76 37 113 78 37 115Asset Impairment Loss 8 5 13 2 3 5 2 1 3 - - - Interest Expense, net 1 - 1 1 - 1 1 - 1 1 - 1 Income Tax expense 45 31 76 57 40 97 59 44 103 75 30 105EBITDA, as reported $203 $134 $337 $232 $169 $401 $239 $195 $434 $281 $150 $431
Rent(1) 25 25 25 25EBITDAR $362 $426 $459 $456
EBITDA, as reported $203 $134 $337 $232 $169 $401 $239 $195 $434 $281 $150 $431 Estimated Commercial Agreement Adj. (26) (25) (51) (20) (24) (44) (18) (21) (39) (21) (11) (32) Estimated Administrative Expense Adj. (19) (1) (20) (19) (1) (20) (19) (1) (20) (19) (1) (20)Pro Forma EBITDA $158 $108 266 $193 $144 337 $202 $173 375 $241 $138 379
Rent 25 25 25 25Pro Forma EBITDAR $291 $362 $400 $404
2009 2010 2011 2012

29
Cash Flow Return on Net Assets
(1) Includes current maturities of Capital Lease obligations.
2009 2010 2011 2012U.S. Retail:Pro Forma EBITDA $158 $193 $202 $241Total assets 1,067 1,065 1,133 1,153Less: Current Liabilities(1) (80) (88) (84) (96)Add: Current Maturities of Debt & Capital Leases 1 1 1 1Net assets $988 $978 $1,050 $1,058
Return on Net Assets - U.S. Retail 16% 20% 19% 23%
Canadian Retail:Pro Forma EBITDA $108 $144 $173 $138Total assets 513 556 558 556Less: Current Liabilities (97) (127) (128) (132)Add: Current Maturities of Debt & Capital Leases – – – –Net assets $416 $429 $430 $424
Return on Net Assets - Canadian Retail 26% 34% 40% 33%
CST Brands Consolidated:Pro Forma EBITDA $266 $337 $375 $379Total assets 1,580 1,621 1,691 1,709Less: Current Liabilities(1) (177) (215) (212) (228)Add: Current Maturities of Debt & Capital Leases 1 1 1 1Net assets $1,404 $1,407 $1,480 $1,482
Return on Net Assets - CST Brands 19% 24% 25% 26%
Year Ended December 31,
30
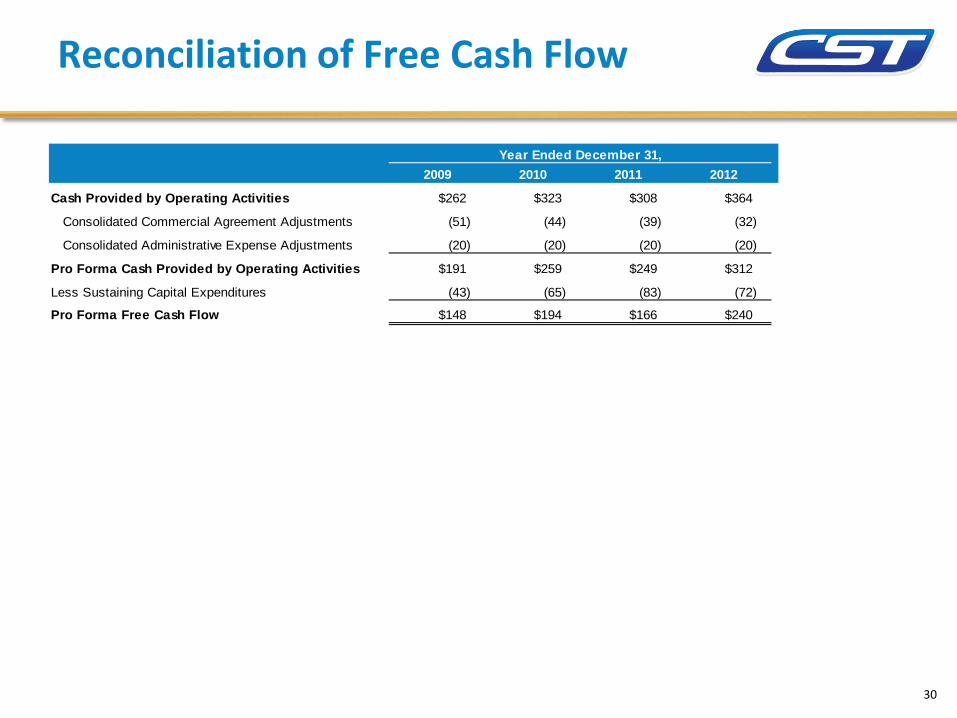
Reconciliation of Free Cash Flow
Year Ended December 31,2009 2010 2011 2012
Cash Provided by Operating Activities $262 $323 $308 $364
Consolidated Commercial Agreement Adjustments (51) (44) (39) (32)
Consolidated Administrative Expense Adjustments (20) (20) (20) (20)
Pro Forma Cash Provided by Operating Activities $191 $259 $249 $312
Less Sustaining Capital Expenditures (43) (65) (83) (72)
Pro Forma Free Cash Flow $148 $194 $166 $240