Crustal Structures of the Adamawa Plateau (Cameroon) from ...GRACE gravity model GGM02C then...
11
European Journal of Scientific Research ISSN 1450-216X / 1450-202X Vol. 148 No 2 January, 2018, pp. 277-287 http://www. europeanjournalofscientificresearch.com Crustal Structures of the Adamawa Plateau (Cameroon) from Combined Terrestrial Gravity Measurements and GRACE Model Bouba Apollinaire Corresponding Author, Department of Physics Higher Teachers’ Training College University of Maroua, Cameroon E-mails:[email protected] Kamguia Joseph Department of Physics, Faculty of Science, University of Yaounde I, Cameroon National Institute of Cartography, Yaounde, Cameroon E-mail: [email protected] Nouayou Robert Department of Physics, Faculty of Science University of Yaounde I, Cameroon E-mail: [email protected] Tabod Charles Tabod Department of Physics, Faculty of Science University of Yaounde I, Cameroon E-mail: [email protected] Njandjock Nouck Philippe Department of Physics, Faculty of Science University of Yaounde I, Cameroon E-mail: [email protected] Abstract The terrestrial gravity data of the Adamawa Plateau region (North-Cameroon) were combined with data computed from the GRACE gravity model, in order to analyze and better highlight the crustal geological structures. Computed data were compared to measured terrestrial gravity ones using standard deviation and some particular locations called checkpoints. This comparison showed that calculated and measured data have similar precision. These two data sets were therefore superimposed. To isolate the deep source anomalies from those due to less deep density contrasts the maximum level of the upward continuation was obtained using Zeng method. This method is permitted to establish new residual gravity anomaly map in the study area characterized by positive and negative anomalies. For the quantitative interpretation three profiles on this residual map is carried out using a gravity modeling program. The results show a basaltic intrusion under the granite-gneisses substratum. Keywords: Adamawa plateau; GRACE; Standard deviation; Checkpoint; Residual anomaly
Transcript of Crustal Structures of the Adamawa Plateau (Cameroon) from ...GRACE gravity model GGM02C then...

European Journal of Scientific Research ISSN 1450-216X / 1450-202X Vol. 148 No 2 January, 2018, pp. 277-287 http://www. europeanjournalofscientificresearch.com
Crustal Structures of the Adamawa Plateau
(Cameroon) from Combined Terrestrial Gravity
Measurements and GRACE Model
Bouba Apollinaire
Corresponding Author, Department of Physics
Higher Teachers’ Training College
University of Maroua, Cameroon
E-mails:[email protected]
Kamguia Joseph
Department of Physics, Faculty of Science, University of Yaounde I, Cameroon
National Institute of Cartography, Yaounde, Cameroon
E-mail: [email protected]
Nouayou Robert
Department of Physics, Faculty of Science
University of Yaounde I, Cameroon
E-mail: [email protected]
Tabod Charles Tabod
Department of Physics, Faculty of Science
University of Yaounde I, Cameroon
E-mail: [email protected]
Njandjock Nouck Philippe
Department of Physics, Faculty of Science
University of Yaounde I, Cameroon
E-mail: [email protected]
Abstract
The terrestrial gravity data of the Adamawa Plateau region (North-Cameroon) were combined with data computed from the GRACE gravity model, in order to analyze and better highlight the crustal geological structures. Computed data were compared to measured terrestrial gravity ones using standard deviation and some particular locations called checkpoints. This comparison showed that calculated and measured data have similar precision. These two data sets were therefore superimposed. To isolate the deep source anomalies from those due to less deep density contrasts the maximum level of the upward continuation was obtained using Zeng method. This method is permitted to establish new residual gravity anomaly map in the study area characterized by positive and negative anomalies. For the quantitative interpretation three profiles on this residual map is carried out using a gravity modeling program. The results show a basaltic intrusion under the granite-gneisses substratum.
Keywords: Adamawa plateau; GRACE; Standard deviation; Checkpoint; Residual anomaly

Crustal Structures of the Adamawa Plateau (Cameroon) from Combined Terrestrial Gravity Measurements and GRACE Model 278
1. Introduction In this area many geophysical studies have been done. Some are based on regional setting, highlighting deep structural contrasts. The significance attributed to its gravity anomalies does not take into account the effect of density contrasts. These include the works of (Collignon, 1970; Poudjom-Djomani et al., 1997). Some other works are based on gravity data obtained during terrestrial gravity surveys (Noutchogwe, 2004; Noutchogwe, 2010). These data are limited by inaccessibility and deprive a large number of interesting areas, including mountain ranges and virgin forests. It is therefore necessary to find an intermediate technique, which makes it possible to acquire gravity measurements in these unexplored regions. In this study, the main objective is to densify terrestrial measurements with data from the GRACE gravity model GGM02C then identify the geological structures among the crustal formations. Regional-residual separation of the gravity anomaly is performed here using the Zeng et al., 2007 method, in order to isolate the regional components, signatures of deep-seated geological structures from the higher frequency components which are characteristics of near-surface small extended structures. The new residual Bouguer anomaly map obtained is interpreted along three profiles. 2. Materials and Methods 2.1. Presentation of the Study Area
The study area extends between latitudes 5° and 8°N and longitudes 13° to 15°E (Figure 1). The recent geological studies undertaken in this area (Ngako et al., 1991; Kamgang et al., 2010) have permitted to regroup the geological formations into two groups: The basement and cover formations. The basement is formed by the Pan-African and Paleoproterozoic formations. The Pan-African formations are constituted by: granites very abundant in the region, gneisses present in the western part of the region and schist resting on the granite-gneisses basement. The Paleoproterozoic formations are constituted by: gneisses with high degrees of metamorphism which are outcropping on the pan-African formations. The cover formations are represented on the one hand by Cretaceous sedimentary series these are: sediments of Djerem basin and Mbere ditch made up respectively of red clays and marls (Marechal and Vincent, 1971) and the other one by basaltic formations. The terrestrial gravity data were obtained by "Office de la Recherche Scientifique et Technique d’Outre-Mer" (ORSTOM), now called IRD (Institut de Recherche pour le Developpement). Over the study area 672 measured points has obtained (Figure 2) and corrected.
Figure 1: Location map of the study area

279 Bouba Apollinaire, Kamguia Joseph, Nouayou Robert, Tabod Charles Tabod and Njandjock Nouck Philippe
Figure 2: Map of Bouguer data distribution
2.2. Description of GRACE Gravity Data
In this study the densification of gravity data is done by using global geopotential models. These models are obtained from the mathematical decomposition of the gravitation field strength, into a series of spherical harmonic coefficients. The latest can be used to generate gravity anomaly Gg∆ at
any points with known coordinates on the earth surface, using the following equation (1):
( )==
∆+∆−
=∆
n
m
mnmnmn
N
n
n
G PmSmCnr
a
r
MGg
022
)(sinsincos)1(max
ϕλλ (1)
where,G is the gravitational constant; M is the mass of the earth, ),,( ϕλr are the spherical
coordinates of the computation point; a is the equatorial radius of the earth; (sin )nm
P ϕ are the fully
normalized associated Legendre functions for degree n and order m ; mnC∆ and mnS∆ are the
normalized coefficients of the global model, reduced for even zonal harmonics for the reference ellipsoid. The above expression gives the order, degree and coefficients of the global model used. In this work, gravity data of Adamawa Plateau was densified using GGM02C of GRACE model (Merry, 2003, Tapley et al., 2005; Bouba et al., 2017). The recent geopotential model EGM2008 is of higher degree but is not yet fully tested in the study area.
To get the data from the field model, we proceed as follows: (1) Quadrate the study area by generating a grid based on the values of latitudes (Min and Max) and longitudes (Min and Max). The grids spacing of 5 kilometers (km) were considered. This interval was chosen in order to manage the initial data without losing recorded information. (2) After having generated the coordinates spaced at regular intervals, we interpolated each grid node value of the altitude, using the digital elevation model (DEM) GLOBE (Hastings and Dunbar, 1998). (3) Finally, based on the mathematical relationship program (relation1), which takes as input the parameters mentioned above and the treaty coefficients of GGM02C field model (at GGM.GEO format) file and in turn generates the values of free air gravity data outdoors at each node point. The terrestrial data have more detailed and accurate information and are often used to validate the satellite data. Then, we corrected free air data of the underlying topographic effects using an average rock density of 2.67gcm-3. Due to the presence of relatively smooth topography, no terrain correction was added. Thus, calculated data and terrestrial data are compared by using standard deviation and measured points wisely choose called checkpoints. These data are then combined and adjusted to obtain usable gravity data.

Crustal Structures of the Adamawa Plateau (Cameroon) from Combined Terrestrial Gravity Measurements and GRACE Model 280
3. Result and Discussion 3.1. Comparison of Calculated and Measured Data using Standard Deviation
The quantity that contains important and interpretable information is the standard deviation (SD). This is a test of quantification, which measures the dispersion deviation from the average size of the study. Table 1 shows that for the measured data, simple Bouguer anomaly varies less than the free air anomaly, whereas the standard deviation of simple Bouguer anomaly becomes greater than that of the free air anomalies for the data from field model. The difference between both values is close to 7 mGal, which is not negligible but does not bias the quality of the obtained data. Table 1: Statistical comparison of measured and calculated free air and simple Bouguer anomalies
Free air anomaly
Measured (mGal)
Free air anomaly
calculated (mGal)
Simple Bouguer anomaly
measured (mGal)
Simple Bouguer anomaly
calculated (mGal)
Min – 59.97 – 10.62 – 125.62 – 153.9 Max 88.98 37.97 – 45.76 – 35.76 Average 26.00 15.99 – 90.46 – 85.74 SD 22.97 12.66 13.28 19.90
3.2. Comparison of Calculated and Measured Data using Checkpoints
The checkpoints are the points from some stations in the study area which will be used as a reference points for the comparison between the predicted values of the gravity anomaly and its actual values. These points and their values depend on the grid spacing considered. For a step of 0.05°, it was necessary to select around the node of a regular grid of size 0.05°×0.05° all points whose coordinates are less than or equal to 0.03°, which were already a value of the measured gravity anomaly. Table 2
illustrates nine control points and statistical comparisons. Table 2: Statistical comparison of measured and calculated free air and simple Bouguer anomalies
Latitude
(degree)
Longitude
(degree)
Altitude
(meter)
Simple Bouguer anomaly
measured (mGal)
Simple Bouguer anomaly
calculated (mGal)
5.50 14.30 928 – 83.67 – 76.41 5.55 14.10 847 – 87.04 – 97.75 6.35 13.75 973 – 88.76 – 97.16 6.40 14.30 1000 – 114.85 – 90.56 6.45 13.30 947 – 72.64 – 87.28 6.70 13.55 903 – 95.29 – 78.38 6.95 14.50 1219 – 100.34 – 108.37 7.10 14.00 1411 – 105.60 – 116.62 7.25 14.00 1325 – 104.32 – 107.70
From (table 2), measured and calculated simple Bouguer anomalies are very close. This result
shows that the global geopotential model GGM02C represents accurately the gravity anomalies in the Adamawa plateau. The standard deviation of the measured and calculated simple Bouguer anomalies remains substantially the same. Averaging the difference of these anomalies is less than 1mGal (table 3). Through the standard deviation and checkpoints the measured data and calculated data have the same accuracy so they are stackable and can be densified.

281 Bouba Apollinaire, Kamguia Joseph, Nouayou Robert, Tabod Charles Tabod and Njandjock Nouck Philippe
Table 3: Average statistical study of simple Bouguer anomalies at checkpoints
Simple Bouguer anomaly
measured (mGal)
Simple Bouguer anomaly
calculated (mGal)
Differences between simple Bouguer
anomaly measured and calculated (mGal)
Min – 114.83 – 116.62 1.79 Max – 72.64 – 76.41 3.77 Average – 94.72 – 95.58 0.86 SD 12.99 13.77 0.78
3.3. Separation of Gravity Anomalies
To extract the regional anomaly due to the Moho, we used the empirical method of Zeng et al.,2007 which is a compromise between the upward continuation and polynomial smoothing. This method allows to determine the optimal degree of the polynomial surface, which gives the best estimation of the regional trend from the Bouguer anomaly map. It consists of calculating correlation factor r between upward continuated fields at two successive heights. The correlation factor between two gravity fields g1 and g2 is calculated by the formula proposed by Abdelrahman et al., 1989.
1 2
1 21 1
,
2 21 2
1 1 1 1
( , ) ( , )
( , ) ( , )
M N
i j i j
i j
g gM N M N
i j i j
i j i j
g x y g x y
r
g x y g x y
= =
= = = =
=
(2)
where M and N are the number of sampling data along x-direction and y-direction respectively. The correlation factor is plotted as a function of increasing continuation height. The height increases from zero to a level where the change in correlation values has clearly passed the point giving rise to a maximum deflection (Figure 3a). This deflection denoted by C is given by the gap between the curve of the correlation factor and the line joining the two ends of the curve.
For each prolonged map, the number of extrema (points where the gradient is zero) is counted. The retaining high (Hm) is such that, the extrema number of prolonged maps at heights greater than Hm remains approximately constant (Figure 3b). In our case, it corresponds to 25 km (H25). A polynomial smoothing by surfaces of degree d ranging from 1 to 10 is then applied to the anomalies resulting from the upward continuation of the Bouguer at 25 km. The appropriate degree of regional polynomial is estimated from the point of discontinuity on the graphical factor of correlation versus the polynomial degree (Figure 3c). The optimum degree of polynom representing the anomalies due upward continuation at 25 km is 5. The polynomial of degree 5 will be used to extract the regional trend linked to the undulations of the Moho discontinuity. I this study the residual of order 5 is therefore the new map used to highlight density contrasts within the crust.

Crustal Structures of the Adamawa Plateau (Cameroon) from Combined Terrestrial Gravity Measurements and GRACE Model 282
Figure 3: Optimum upward-continuation height by the method of Zeng et al., 2007. (a) Cross-correlation between two successive upward continuated as a function of the continuation height, (b) the deflection C of the cross-correlation curve and (c) the factor of correlation according to the degrees of regional anomaly
3.4. Presentation of Residual Gravity Anomalies
The new residual Bouguer anomaly map (Figure 4) obtained after densification of the terrestrial gravity data shows positive and negative anomalies which amplitudes range between +40 mGal and −70 mGal.
Positive anomalies are found at Bagodo, Meiganga, Djohong, south-west of Kongolo, Mbe and north-east of Ngaoundere. On the basis of geological considerations, the positives anomalies in south-west of Kongolo can be interpreted by gravimetric effect at schist of Lom series. At Bagodo, Meiganga and between the localities of Ngam and Belel, the positive residual anomalies observed are assigned to the thinning down of the crust on the one hand and on the other hand to the existence of invisible basaltic rocks under the granite-gneisses basement. At Djohong, a significant lateral gradient of the anomalies is observed with positive maxima and negative minima. This gradient is characteristic of fractured layers. In the northern part of the region, the positive values of residual Bouguer anomalies (+40 mGal) appear in west of Mbe and north-east of Ngaoundere show an uplift of dense rocks in the substratum.

283 Bouba Apollinaire, Kamguia Joseph, Nouayou Robert, Tabod Charles Tabod and Njandjock Nouck Philippe
Figure 4: Residual gravity anomaly map of 5th order showing profiles P1, P2 and P3
The negative residual anomalies are found at east of Ngaoundere, north of Belel, south of Bagodo, south and east of Mbe. A close look of this map, the negative Bouguer anomalies at Bagodo indicated the effect of granites which corresponds to the socle. In Ngaoundere these anomalies embodying a low density of the underlying rock. In east and south of Mbe, the negative value of anomalie (−30 mGal) compared to the values obtained in the slopes of the massif (+40 mGal), suggest the variable thickness of the structures in this zone. In north of Belel, negative anomalies would indicate the presence of low density rock and associated with granites, conglomerates and formations belonging to the Mbere sedimentary basin. In order to show the capacity of densified data to identify the geological structures revealed by the new residual gravity anomaly map, 2D modeling program (Cooper, 2003) was used along three profiles (P1, P2, P3). 3.5. 2D Modeling of Residual Gravity Anomalies
The 2D modeling is based on the Talwani algorithm to calculate the gravity contribution of each body to the observed anomaly in an interactive way, so a change of a body does not require the recalculation of the whole model. Before construction of 2D models, regional background fields were removed from gravity anomaly profiles to obtain residual fields. The distances are measured in kilometers; the densities are gcm-3 and the anomalies in mGal. Similar methodology was successfully used to constructs 2D models of the gravity data (Poudjom-Djomani et al., 1997; Noutchogwe, 2004).

Crustal Structures of the Adamawa Plateau (Cameroon) from Combined Terrestrial Gravity Measurements and GRACE Model 284
3.5.1. Choice of the Profiles and Constraints of the Model
In order to better highlight the crustal geological structures in the Adamawa plateau, we chose three profiles (P1, P2, and P3) on the new residual Bouguer anomalies map in SE-NW direction. These profiles are executed perpendicular to the principal direction of the geological structures to be studied. In this study for the reasons of validation of our results, we decided to compare the results of profile P3 to those obtained by the previous studies. This profile crosses the sector where the previous gravimetric works were carried out.
The modeling consisted in fitting the observed anomalies and computed curves, based on bodies representing the possible geological units present in the subsurface. The mean density of granites, gneisses, basaltic rocks and sedimentary formations (Sandstones and marl) presents in the study area has been taken respectively as 2.65; 2.80; 3; 2.45 gcm-3 (Telford et al., 1990). According to (Noutchogwe, 2004) density contrast is the most important parameter for construction of the models. This density contrast is calculated by 0i iC d d= − where
id is the average density of the ith formation
and 0d is the average density of granite, 0d = 2.65 gcm-3. A contrast of 0gcm-3 was given to the granite
which constitutes the basement; 0.1gcm-3 to the gneisses and migmatites; 0.3gcm-3 to the basaltic rocks and -0.2gcm-3 was given to the sediments of the cretaceous Mbere ditch and the Djerem valleys essentially made up of sandstone and marl. The interpretation of profiles (P1, P2, and P3) shows the structural model of the crust. 3.5.2. Interpretations of the Profiles
Profile P1 runs across gneisses granites and then gneisses in succession. The corresponding structural model (Figure 5) shows two granite-gneisses contact along fault planes. This model agrees with the surface geology, which shows that the profile crosses two mylonites bands corresponding to fracture zones affecting the basement in the region. It shows an intrusion of dense rocks with a density contrast of 0.3gcm-3 at the base of the granite-gneisses basement which is responsible for the positive residual Bouguer anomaly observed in this area. This dense mass has been identified with the basaltic uplift which probably cooled down and could not reach the earth’s surfaces. The model deduced density contrast indicates the presence of igneous intrusion that originated at great depth.
Figure 5: Gravity profile P1. (a) observed and calculated anomaly; (b) structural model of the crust
Profile P2 same as P1 successively crosses granites and gneisses. The corresponding structural model (Figure 6) shows four bodies with contrast density of 0.1gcm-3 and might correspond to the gneisses with variable thickness separated each other with few distance. The model also shows an intrusion of dense material at the base of granite-gneisses, which is composed of basaltic rocks. These basaltic intrusions with a density contrast of 0.3gcm-3 are seen through the whole profile and are
285 Bouba Apollinaire, Kamguia Joseph, Nouayou Robert, Tabod Charles Tabod and Njandjock Nouck Philippe
responsible to the positive residual gravity anomaly observed in this zone. The depths to the top of the dense formations vary between 5 km and 8 km.
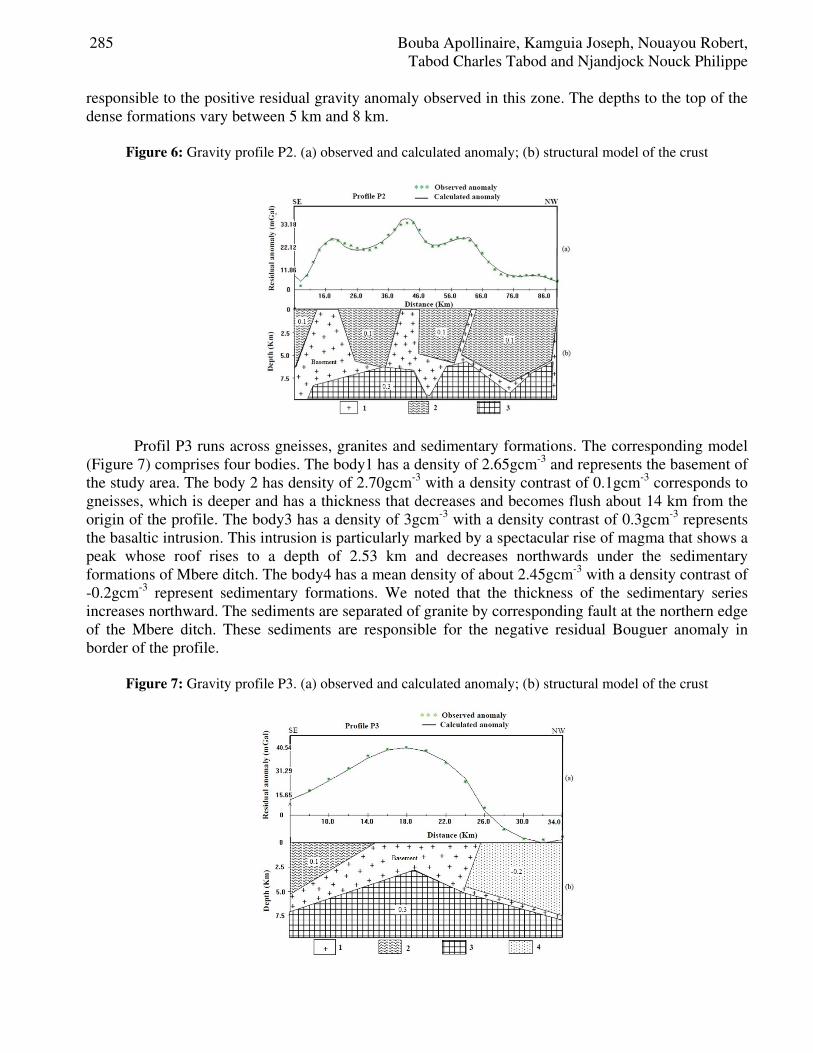
Figure 6: Gravity profile P2. (a) observed and calculated anomaly; (b) structural model of the crust
Profil P3 runs across gneisses, granites and sedimentary formations. The corresponding model (Figure 7) comprises four bodies. The body1 has a density of 2.65gcm-3 and represents the basement of the study area. The body 2 has density of 2.70gcm-3 with a density contrast of 0.1gcm-3 corresponds to gneisses, which is deeper and has a thickness that decreases and becomes flush about 14 km from the origin of the profile. The body3 has a density of 3gcm-3 with a density contrast of 0.3gcm-3 represents the basaltic intrusion. This intrusion is particularly marked by a spectacular rise of magma that shows a peak whose roof rises to a depth of 2.53 km and decreases northwards under the sedimentary formations of Mbere ditch. The body4 has a mean density of about 2.45gcm-3 with a density contrast of -0.2gcm-3 represent sedimentary formations. We noted that the thickness of the sedimentary series increases northward. The sediments are separated of granite by corresponding fault at the northern edge of the Mbere ditch. These sediments are responsible for the negative residual Bouguer anomaly in border of the profile.
Figure 7: Gravity profile P3. (a) observed and calculated anomaly; (b) structural model of the crust

Crustal Structures of the Adamawa Plateau (Cameroon) from Combined Terrestrial Gravity Measurements and GRACE Model 286
3.5.3. Validation of the Results
To validate our 2D modeling, we decided to compare the profile P3 results to those obtained by others authors. This profile crosses the sector where the previous gravimetric works were carried out and strengths some hypotheses already supported by the previous geophysical and geological studies carried out in this zone. Significant similarities are underlined through results deduced from present and previous works according to number of bodies, shape, orientation, and density contrast. In the present work, the structural model associated with the profile P3 consists of the gneisses, granites, basalts and sedimentary series with density contrast respectively +0.1gcm-3, 0gcm-3, +0.3gcm-3 and -0.2gcm-3. The body with density contrast +0.3gcm-3 corresponds to the basaltic intrusion under the granite basement. This body is responsible to the positive residual gravity anomaly observed in this sector. The origin of this body is found at great depth; it has cooled down and could not reach the earth’s surface. These results are compatible with the findings of (Noutchogwe, 2004) and the scheme proposed by (Temdjim, 1986) to explain the mechanism of magmatologic establishment of lavas in the Adamawa plateau. According to (Noutchogwe, 2004), the body with density contrast -0.2gcm-3 is essentially outcrop and has no gravimetric signature; it is constituted to a simple overlap on the granitic socle. In this work we noted that the thickness of this body increases northward and reached a depth of about 8km. These sediments are responsible to the negative residual Bouguer anomaly observed in nord border of the profile contrary to the previous works results. However, it is interesting to note that the density contrast +0.05gcm-3 associated to the gneisses formations as reported by the works of (Noutchogwe, 2004) is slightly lower than the density contrast +0.1gcm-3 attributed to the gneisses formations in the present work. This difference between the results of our work and the previous ones would probably due to the lack of gravity data in this area. The better coverage of gravity data has undoubtedly permitted us to obtain a better 2D modeling of geological structures in the Adamawa plateau. 4. Conclusion In this study, global geopotential model is used to fill the gaps in the gravity net of the Adamawa plateau. The findings demonstrated that the calculated gravity anomalies using the GGM02C field model are capable of providing gravity data which can be superimposed on the measured terrestrial data for better accuracy and reliability in the gravity anomaly interpretation. The standard deviation and checkpoints were used to prove the accuracy of the data. We found that calculated data had nearly the same accuracy as the measured data in the field, so they are stackable. Using Zeng method, we found that the new residual Bouguer anomaly map of order 5 is the main one for the interpretation of the crustal gravity source. From this map 2D modeling has shown the bodies and density contrast sources of the observed gravity anomalies. The various models show the intrusion of heavy rocks at the basement of the socle with density contrast of about +0.3gcm-3. We interpreted as a rise of intrusive heavy rocks, probably basaltic in the granite-gneisses environment. Bibiographical References List [1] Collignon, F., 1970. “Rapport sur quelques profils gravimétriques et magnétiques dans la vallée
de la Mbéré’’, Centre ORSTOM de Bangui. [2] Poudjom-Djomani, Y.H., Diament, M., Wilson, M., 1997. “Lithospheric structures across the
Adamawa plateau (Cameroon) from gravity studies’’, Tectonophysics 273, 317-327. [3] Noutchogwe, T.C. 2004. “Apport de la gravimétrie à l’étude de la bordure méridionale du
plateau de l’Adamaoua ’’, Thèse de Doctorat 3e Cycle, Université de Yaoundé I, 127 p.

287 Bouba Apollinaire, Kamguia Joseph, Nouayou Robert, Tabod Charles Tabod and Njandjock Nouck Philippe
[4] Noutchogwe, T.C., 2010. “Investigation Géophysique dans la Région de l'Adamaoua par les
Méthodes Gravimétriques et Magnétiques: Implications Structurales et Hydrogéologiques’’, Thèse Doctorat/PhD, Université de Yaoundé I, 146 p.
[5] Zeng, H., Xu, D., Tan, H., 2007. “A model study for estimating optimum upward continuation height for gravity separation with application to a Bouguer gravity anomaly over a mineral deposit, Jilin province, northeast China’’, Geophysics 72, 145-150.
[6] Ngako, V., Jegouzo, P., Nzenti, J.P., 1991. “Le Cisaillement Centre Camerounais, rôle structural et géodynamique dans l’orogénèse panafricaine’’, Comptes Rendus de l’Académie
des Sciences de Paris II(313), 457-463. [7] Kamgang, P., Njonfang, E., Nono, A., Dedzo, M. G., Tchoua, F., 2010. “Petrogenesis of a
silicic magma system: Geochemical evidence from Bamenda Mountains, NW Cameroon, Cameroun Volcanic Line’’, Journal of Africa Earth Sciences 58, 285-304.
[8] Marechal, A., Vincent, P.R., 1971. “Le fossé crétacé du Sud Adamaoua (Cameroun)’’, Cahier
d’ORSTROM, Série Géologique 3(1), 67-83. [9] Merry, C.L., 2003. “The African Geoid Project and its relevance to the unification of African
Vertical Reference Frames’’, 2nd FIG Regional Conference Morocco, December 2-5, 2003. [10] Tapley, B., Ries, J., Bettadpur, S., Chambers, D., Cheng, M., Condi, F., Gunter, B., Kang, Z.,
Nagel, P., Pastor, R., Pekker, T., Poole, S., Wang, F., 2005. “GGM02- an improved earth gravity field from GRACE’’, Journal of Geodesy, 11 p.
[11] Bouba, A., Kamguia, J., Tabod, C.T., Yap, L., Nouayou, R., Kande, H.L., Oyoa, V., 2017. “Subsurface Structural Mapping Using Combined Terrestrial and Grace Gravity Data of the Adamawa Plateau (North-Cameroon)’’, International Journal of Geosciences 8, 869-887.
[12] Hastings, D. A., Dunbar, P. K., 1998. “Development and assessment of the Global Land One-kilometer Base Elevation digital elevation model (GLOBE)’’, ISPRS Archives 218-221.
[13] Abdelrahman, E.M., Bayoumi, A.I., Abdelhady, Y.E., Gobashi, M.M., El-Araby, H.M., 1989. “Gravity interpretation using correlation factors between successive least-squares residual anomalies’’, Geophysics 54, 1614-1621.
[14] Cooper, G.R.J., 2003. “Interactive gravity modeling program for Microsoft Windows, School of Geosciences’’, University of the Witwatesrand (South Africa).
[15] Telford, W.M., Geldart, L.P., Sheriff, R.E., Keys, D.A., 1990. “Applied Geophysics, 4th edition of National Conference on geophysics, Cambridge University Press’’, Cambridge United Kingdom, 860 p.
[16] Temdjim, R. 1986. “Le volcanisme de la région de Ngaoundéré (Adamaoua-Cameroun) : Étude volcanologique et pétrographique’’, Thèse de Doctorat 3e cycle, Université Clermont-Ferrand, 185 p.