Receiver function study of the crustal structure of the ... · Receiver function study of the...
15
Receiver function study of the crustal structure of the southeastern Caribbean plate boundary and Venezuela Fenglin Niu, 1 Tammy Bravo, 2 Gary Pavlis, 2 Frank Vernon, 3 Herbert Rendon, 4 Maximiliano Bezada, 1 and Alan Levander 1 Received 13 October 2006; revised 22 July 2007; accepted 31 August 2007; published 29 November 2007. [1] We have investigated crustal thickness and composition across the southeastern Caribbean plate boundary with the receiver function technique. We used teleseismic data recorded by a temporary broadband array deployed under the BOLIVAR project and the permanent national seismic network of Venezuela. We used the primary P-to-S conversion and crustal reverberations to estimate crustal thickness and average crustal V P /V S ratio over the region. We observe large variations in crustal thickness and Poisson’s ratio. Estimated Moho depth ranges from 16 km beneath the southeastern Caribbean Sea to 52 km beneath northeastern Venezuela and the Venezuelan Andes. There is a good correlation between crustal structure and tectonic terranes. Data from the Precambrian Guayana Shield suggest that the underlying crustal structure is relatively uniform with a moderate thickness (37 km) and an intermediate composition. A thick crust is found below the foreland basins. The two mountain systems in northern Venezuela, the Serrania del Interior and the Serrania del Falcon, have a thin crust with arc composition and are likely dynamically supported by elastic rebound or underthrusting of the oceanic plateau that characterizes the southern Caribbean. On the other hand, the Venezuelan Andes and Perija Range on the western side of the country are probably isostatically balanced by thick crustal roots. Citation: Niu, F., T. Bravo, G. Pavlis, F. Vernon, H. Rendon, M. Bezada, and A. Levander (2007), Receiver function study of the crustal structure of the southeastern Caribbean plate boundary and Venezuela, J. Geophys. Res., 112, B11308, doi:10.1029/2006JB004802. 1. Introduction [2] The origin of continental crust has been a long term focus of the Earth sciences [Taylor, 1967; de Wit et al., 1992]. It is now generally believed that the formation of the continents involved extensive collisional accretion of island arcs and microcontinental blocks although details of the aggregation are still unclear [Hoffman, 1988; Nelson, 1991; Jordan, 1988]. Since the bulk chemistry of modern island arcs and continental crust is quite different [Taylor and White, 1965; Taylor and McLennan, 1985; Fountain and Christensen, 1989; Rudnick and Fountain, 1995; Christensen and Mooney , 1995; Suyehiro et al., 1996; Holbrook et al., 1999], either chemical differentiation or mechanical refining processes have been involved in the arc accretion or different accretion processes have operated throughout geologic history to create the continents due to the evolving thermal history of the Earth. It is thus very important to identify age dependencies in crustal structure and composition. [3] Durrheim and Mooney [1994] argued for a substantial difference between Archean and Proterozoic crust in both thickness and composition. They found that Proterozoic terranes are characterized by a several-km-thick lowermost mafic layer, which is not typically seen beneath Archean terranes. Mixed observations have been reported regarding whether such a characteristic difference exists or not. Nguuri et al. [2001] and Niu and James [2002] found that the crust beneath the Kaapvaal and Zimbabwe cratons is relatively thin (35 km). The Moho-discontinuity is extremely flat and sharp with a large velocity and density contrast which indicates the lack of a high velocity mafic layer in the lower crust. Contradictory observations, however, have also been reported. For example, a global study of average crustal V P /V S ratio by Zandt and Ammon [1995] favors the presence of a mafic layer beneath cratons. The Deep Probe experiment [Henstock et al., 1998; Snelson et al., 1998] identified a very thick (25 km) mafic layer at the base of the Archean Wyoming province. A comparison between Archean and Proterozoic globally is very important to the understanding of continental formation and evolution in the early stage as well as Precambrian global tectonics. [4] The present study is part of the passive seismic experiment under the BOLIVAR (Broadband Ocean-Land Investigations of Venezuela and the Antilles arc Region) and GEODINOS (Geodina ´mica Reciente del Lı ´mite Norte de la Placa Sudamericana–Recent Geodynamics of the JOURNAL OF GEOPHYSICAL RESEARCH, VOL. 112, B11308, doi:10.1029/2006JB004802, 2007 Click Here for Full Articl e 1 Department of Earth Science, Rice University, Houston, Texas, USA. 2 Department of Geological Sciences, Indiana University, USA. 3 Scripps Institution of Oceanography, University of California, USA. 4 FUNVISIS, El Llanito, Venezuela. Copyright 2007 by the American Geophysical Union. 0148-0227/07/2006JB004802$09.00 B11308 1 of 15
Transcript of Receiver function study of the crustal structure of the ... · Receiver function study of the...

Receiver function study of the crustal structure of the southeastern
Caribbean plate boundary and Venezuela
Fenglin Niu,1 Tammy Bravo,2 Gary Pavlis,2 Frank Vernon,3 Herbert Rendon,4
Maximiliano Bezada,1 and Alan Levander1
Received 13 October 2006; revised 22 July 2007; accepted 31 August 2007; published 29 November 2007.
[1] We have investigated crustal thickness and composition across the southeasternCaribbean plate boundary with the receiver function technique. We used teleseismic datarecorded by a temporary broadband array deployed under the BOLIVAR project andthe permanent national seismic network of Venezuela. We used the primary P-to-Sconversion and crustal reverberations to estimate crustal thickness and average crustalVP/VS ratio over the region. We observe large variations in crustal thickness andPoisson’s ratio. Estimated Moho depth ranges from �16 km beneath the southeasternCaribbean Sea to �52 km beneath northeastern Venezuela and the Venezuelan Andes.There is a good correlation between crustal structure and tectonic terranes. Data from thePrecambrian Guayana Shield suggest that the underlying crustal structure is relativelyuniform with a moderate thickness (�37 km) and an intermediate composition. A thickcrust is found below the foreland basins. The two mountain systems in northernVenezuela, the Serrania del Interior and the Serrania del Falcon, have a thin crust with arccomposition and are likely dynamically supported by elastic rebound or underthrusting ofthe oceanic plateau that characterizes the southern Caribbean. On the other hand,the Venezuelan Andes and Perija Range on the western side of the country are probablyisostatically balanced by thick crustal roots.
Citation: Niu, F., T. Bravo, G. Pavlis, F. Vernon, H. Rendon, M. Bezada, and A. Levander (2007), Receiver function study of the
crustal structure of the southeastern Caribbean plate boundary and Venezuela, J. Geophys. Res., 112, B11308,
doi:10.1029/2006JB004802.
1. Introduction
[2] The origin of continental crust has been a long termfocus of the Earth sciences [Taylor, 1967; de Wit et al.,1992]. It is now generally believed that the formation of thecontinents involved extensive collisional accretion of islandarcs and microcontinental blocks although details of theaggregation are still unclear [Hoffman, 1988; Nelson, 1991;Jordan, 1988]. Since the bulk chemistry of modern islandarcs and continental crust is quite different [Taylor andWhite, 1965; Taylor and McLennan, 1985; Fountainand Christensen, 1989; Rudnick and Fountain, 1995;Christensen and Mooney, 1995; Suyehiro et al., 1996;Holbrook et al., 1999], either chemical differentiation ormechanical refining processes have been involved in the arcaccretion or different accretion processes have operatedthroughout geologic history to create the continents due tothe evolving thermal history of the Earth. It is thus veryimportant to identify age dependencies in crustal structureand composition.
[3] Durrheim and Mooney [1994] argued for a substantialdifference between Archean and Proterozoic crust in boththickness and composition. They found that Proterozoicterranes are characterized by a several-km-thick lowermostmafic layer, which is not typically seen beneath Archeanterranes. Mixed observations have been reported regardingwhether such a characteristic difference exists or not. Nguuriet al. [2001] and Niu and James [2002] found that the crustbeneath the Kaapvaal and Zimbabwe cratons is relatively thin(�35 km). The Moho-discontinuity is extremely flat andsharp with a large velocity and density contrast whichindicates the lack of a high velocity mafic layer in the lowercrust. Contradictory observations, however, have also beenreported. For example, a global study of average crustalVP/VS
ratio by Zandt and Ammon [1995] favors the presence of amafic layer beneath cratons. The Deep Probe experiment[Henstock et al., 1998; Snelson et al., 1998] identified a verythick (�25 km) mafic layer at the base of the ArcheanWyoming province. A comparison between Archean andProterozoic globally is very important to the understandingof continental formation and evolution in the early stage aswell as Precambrian global tectonics.[4] The present study is part of the passive seismic
experiment under the BOLIVAR (Broadband Ocean-LandInvestigations of Venezuela and the Antilles arc Region)and GEODINOS (Geodinamica Reciente del Lımite Nortede la Placa Sudamericana–Recent Geodynamics of the
JOURNAL OF GEOPHYSICAL RESEARCH, VOL. 112, B11308, doi:10.1029/2006JB004802, 2007ClickHere
for
FullArticle
1Department of Earth Science, Rice University, Houston, Texas, USA.2Department of Geological Sciences, Indiana University, USA.3Scripps Institution of Oceanography, University of California, USA.4FUNVISIS, El Llanito, Venezuela.
Copyright 2007 by the American Geophysical Union.0148-0227/07/2006JB004802$09.00
B11308 1 of 15
Northern Limit of the South American Plate) projects.These projects aimed to study island arc accretion processesoccurring at the northern margin of South America withgeological, geochemical and seismic structure investigationsof the Caribbean and South America plate boundary zoneand the surrounding area [Levander et al., 2006]. As a resultthe focus of this study is Venezuela, its northern continentalmargin, and the southern Caribbean.[5] The northern margin of South America originated in
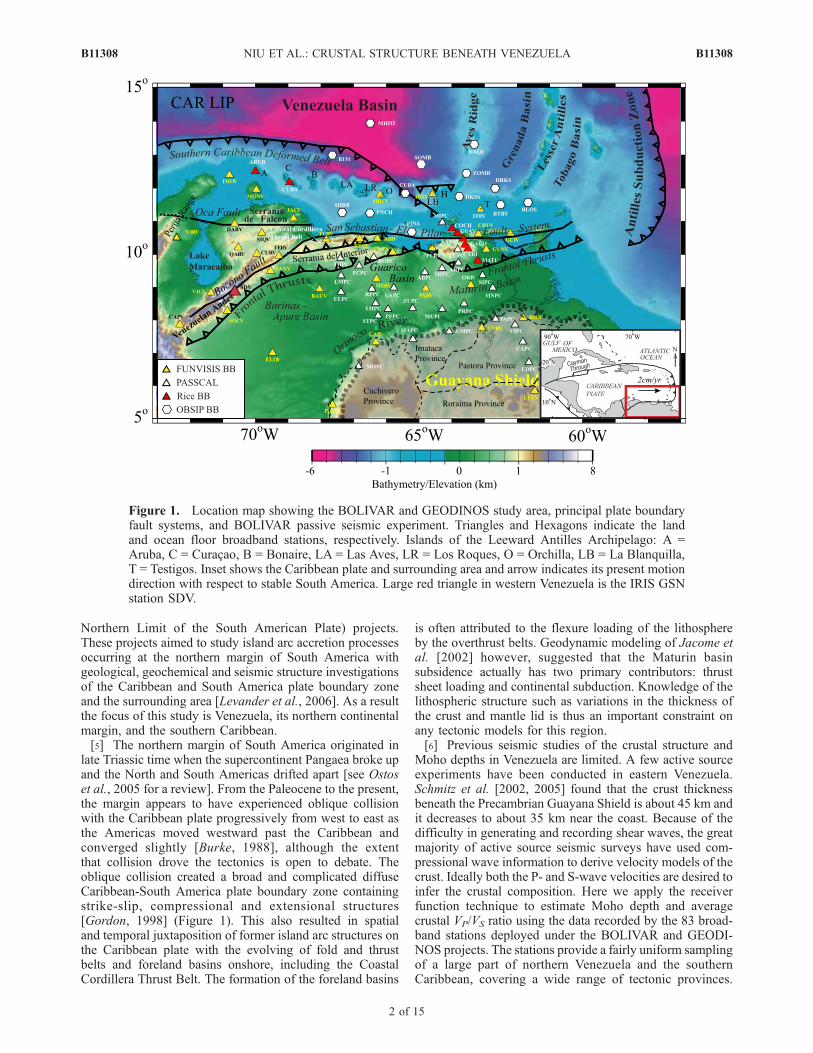
late Triassic time when the supercontinent Pangaea broke upand the North and South Americas drifted apart [see Ostoset al., 2005 for a review]. From the Paleocene to the present,the margin appears to have experienced oblique collisionwith the Caribbean plate progressively from west to east asthe Americas moved westward past the Caribbean andconverged slightly [Burke, 1988], although the extentthat collision drove the tectonics is open to debate. Theoblique collision created a broad and complicated diffuseCaribbean-South America plate boundary zone containingstrike-slip, compressional and extensional structures[Gordon, 1998] (Figure 1). This also resulted in spatialand temporal juxtaposition of former island arc structures onthe Caribbean plate with the evolving of fold and thrustbelts and foreland basins onshore, including the CoastalCordillera Thrust Belt. The formation of the foreland basins
is often attributed to the flexure loading of the lithosphereby the overthrust belts. Geodynamic modeling of Jacome etal. [2002] however, suggested that the Maturin basinsubsidence actually has two primary contributors: thrustsheet loading and continental subduction. Knowledge of thelithospheric structure such as variations in the thickness ofthe crust and mantle lid is thus an important constraint onany tectonic models for this region.[6] Previous seismic studies of the crustal structure and
Moho depths in Venezuela are limited. A few active sourceexperiments have been conducted in eastern Venezuela.Schmitz et al. [2002, 2005] found that the crust thicknessbeneath the Precambrian Guayana Shield is about 45 km andit decreases to about 35 km near the coast. Because of thedifficulty in generating and recording shear waves, the greatmajority of active source seismic surveys have used com-pressional wave information to derive velocity models of thecrust. Ideally both the P- and S-wave velocities are desired toinfer the crustal composition. Here we apply the receiverfunction technique to estimate Moho depth and averagecrustal VP/VS ratio using the data recorded by the 83 broad-band stations deployed under the BOLIVAR and GEODI-NOS projects. The stations provide a fairly uniform samplingof a large part of northern Venezuela and the southernCaribbean, covering a wide range of tectonic provinces.
Figure 1. Location map showing the BOLIVAR and GEODINOS study area, principal plate boundaryfault systems, and BOLIVAR passive seismic experiment. Triangles and Hexagons indicate the landand ocean floor broadband stations, respectively. Islands of the Leeward Antilles Archipelago: A =Aruba, C = Curacao, B = Bonaire, LA = Las Aves, LR = Los Roques, O = Orchilla, LB = La Blanquilla,T = Testigos. Inset shows the Caribbean plate and surrounding area and arrow indicates its present motiondirection with respect to stable South America. Large red triangle in western Venezuela is the IRIS GSNstation SDV.
B11308 NIU ET AL.: CRUSTAL STRUCTURE BENEATH VENEZUELA
2 of 15
B11308
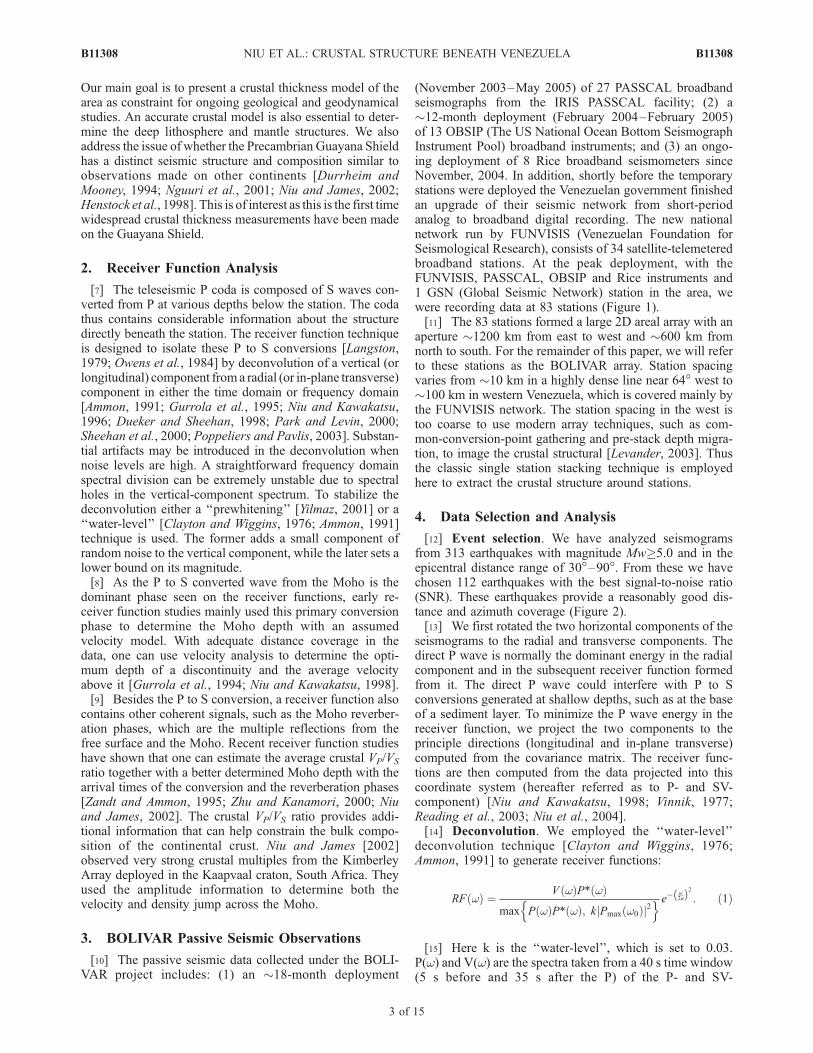
Our main goal is to present a crustal thickness model of thearea as constraint for ongoing geological and geodynamicalstudies. An accurate crustal model is also essential to deter-mine the deep lithosphere and mantle structures. We alsoaddress the issue of whether the Precambrian Guayana Shieldhas a distinct seismic structure and composition similar toobservations made on other continents [Durrheim andMooney, 1994; Nguuri et al., 2001; Niu and James, 2002;Henstock et al., 1998]. This is of interest as this is the first timewidespread crustal thickness measurements have been madeon the Guayana Shield.
2. Receiver Function Analysis
[7] The teleseismic P coda is composed of S waves con-verted from P at various depths below the station. The codathus contains considerable information about the structuredirectly beneath the station. The receiver function techniqueis designed to isolate these P to S conversions [Langston,1979; Owens et al., 1984] by deconvolution of a vertical (orlongitudinal) component from a radial (or in-plane transverse)component in either the time domain or frequency domain[Ammon, 1991; Gurrola et al., 1995; Niu and Kawakatsu,1996; Dueker and Sheehan, 1998; Park and Levin, 2000;Sheehan et al., 2000; Poppeliers and Pavlis, 2003]. Substan-tial artifacts may be introduced in the deconvolution whennoise levels are high. A straightforward frequency domainspectral division can be extremely unstable due to spectralholes in the vertical-component spectrum. To stabilize thedeconvolution either a ‘‘prewhitening’’ [Yilmaz, 2001] or a‘‘water-level’’ [Clayton and Wiggins, 1976; Ammon, 1991]technique is used. The former adds a small component ofrandom noise to the vertical component, while the later sets alower bound on its magnitude.[8] As the P to S converted wave from the Moho is the
dominant phase seen on the receiver functions, early re-ceiver function studies mainly used this primary conversionphase to determine the Moho depth with an assumedvelocity model. With adequate distance coverage in thedata, one can use velocity analysis to determine the opti-mum depth of a discontinuity and the average velocityabove it [Gurrola et al., 1994; Niu and Kawakatsu, 1998].[9] Besides the P to S conversion, a receiver function also
contains other coherent signals, such as the Moho reverber-ation phases, which are the multiple reflections from thefree surface and the Moho. Recent receiver function studieshave shown that one can estimate the average crustal VP/VS
ratio together with a better determined Moho depth with thearrival times of the conversion and the reverberation phases[Zandt and Ammon, 1995; Zhu and Kanamori, 2000; Niuand James, 2002]. The crustal VP/VS ratio provides addi-tional information that can help constrain the bulk compo-sition of the continental crust. Niu and James [2002]observed very strong crustal multiples from the KimberleyArray deployed in the Kaapvaal craton, South Africa. Theyused the amplitude information to determine both thevelocity and density jump across the Moho.
3. BOLIVAR Passive Seismic Observations
[10] The passive seismic data collected under the BOLI-VAR project includes: (1) an �18-month deployment
(November 2003–May 2005) of 27 PASSCAL broadbandseismographs from the IRIS PASSCAL facility; (2) a�12-month deployment (February 2004–February 2005)of 13 OBSIP (The US National Ocean Bottom SeismographInstrument Pool) broadband instruments; and (3) an ongo-ing deployment of 8 Rice broadband seismometers sinceNovember, 2004. In addition, shortly before the temporarystations were deployed the Venezuelan government finishedan upgrade of their seismic network from short-periodanalog to broadband digital recording. The new nationalnetwork run by FUNVISIS (Venezuelan Foundation forSeismological Research), consists of 34 satellite-telemeteredbroadband stations. At the peak deployment, with theFUNVISIS, PASSCAL, OBSIP and Rice instruments and1 GSN (Global Seismic Network) station in the area, wewere recording data at 83 stations (Figure 1).[11] The 83 stations formed a large 2D areal array with an
aperture �1200 km from east to west and �600 km fromnorth to south. For the remainder of this paper, we will referto these stations as the BOLIVAR array. Station spacingvaries from �10 km in a highly dense line near 64� west to�100 km in western Venezuela, which is covered mainly bythe FUNVISIS network. The station spacing in the west istoo coarse to use modern array techniques, such as com-mon-conversion-point gathering and pre-stack depth migra-tion, to image the crustal structural [Levander, 2003]. Thusthe classic single station stacking technique is employedhere to extract the crustal structure around stations.
4. Data Selection and Analysis
[12] Event selection. We have analyzed seismogramsfrom 313 earthquakes with magnitude Mw�5.0 and in theepicentral distance range of 30�–90�. From these we havechosen 112 earthquakes with the best signal-to-noise ratio(SNR). These earthquakes provide a reasonably good dis-tance and azimuth coverage (Figure 2).[13] We first rotated the two horizontal components of the
seismograms to the radial and transverse components. Thedirect P wave is normally the dominant energy in the radialcomponent and in the subsequent receiver function formedfrom it. The direct P wave could interfere with P to Sconversions generated at shallow depths, such as at the baseof a sediment layer. To minimize the P wave energy in thereceiver function, we project the two components to theprinciple directions (longitudinal and in-plane transverse)computed from the covariance matrix. The receiver func-tions are then computed from the data projected into thiscoordinate system (hereafter referred as to P- and SV-component) [Niu and Kawakatsu, 1998; Vinnik, 1977;Reading et al., 2003; Niu et al., 2004].[14] Deconvolution. We employed the ‘‘water-level’’
deconvolution technique [Clayton and Wiggins, 1976;Ammon, 1991] to generate receiver functions:
RF wð Þ ¼ V wð ÞP* wð Þmax P wð ÞP* wð Þ; kjPmax w0ð Þj2
n o e�w2að Þ2 : ð1Þ
[15] Here k is the ‘‘water-level’’, which is set to 0.03.P(w) and V(w) are the spectra taken from a 40 s time window(5 s before and 35 s after the P) of the P- and SV-
B11308 NIU ET AL.: CRUSTAL STRUCTURE BENEATH VENEZUELA
3 of 15
B11308
components. The width factor, a, of the Gaussian lower-passfilter was set to 1.5. We used a bandpass filter of 0.01–2 Hzfor the PASSCAL and RICE stations (STS2 and CMG3T)and 0.02–2 Hz for the FUNVISIS stations (CMG-40T)before the deconvolution.[16] Orientation estimates of the OBS stations. For the
OBSIP stations, we determined the azimuths, q1 and q2, ofthe two horizontal components (BH1, BH2) using tele-seismic P waves with high SNR. Note the instrumentsconstrain q2 = q1 + 90�. The azimuths were chosen whenthe summed P wave energy in the transverse componentreaches its minimum. For an assumed azimuth, q1, which isdefined clockwise from north, we first rotated horizontalseismograms to radial and transverse directions based onraypath geometry. We then computed the weighted summa-tion of the transverse P wave energy for all events. The totalnumber of events used for each station is between 24 and26. The weight was calculated from the product of SNR andlinearity of the P wave particle motion. q1 was taken in therange of 0� to 180� with an increment of 1�. There are twopossible azimuths, q1 and q1 + 180�, in which the transversecomponent reaches the minimum. Finally, we took the crosscorrelation (cc) between the vertical and radial componentsand chose the azimuth that shows a positive correlation. Ingeneral, this worked very well. The 180� ambiguity, how-ever, remains when the correlation between the vertical andhorizontal is lower. The measured q1 and their standarddeviations are shown in Table 1. We used the sameapproach to confirm the orientations of the land stations.
The estimated orientations of the north–south componentare in the range of �38� to 26� with an average of �5 ± 9�.We note that this accuracy is sufficient for the purpose forwhich we are using these data. That is, as long as thealignment is good enough to allow a deconvolution ofconverted phases with the right polarity and approximatelycorrect amplitude the results can be used to estimate crustalthickness and VP/VS ratio.[17] Velocity Models. To convert traveltimes to depths,
we used velocity models derived from refraction andreflection/wide-angle seismic data [Schmitz et al., 2002,2005; S. A. Clark et al., Characterizing the diffuse plateboundary between the Caribbean and South AmericanPlates at 64�W, submitted to Journal of Geophysical
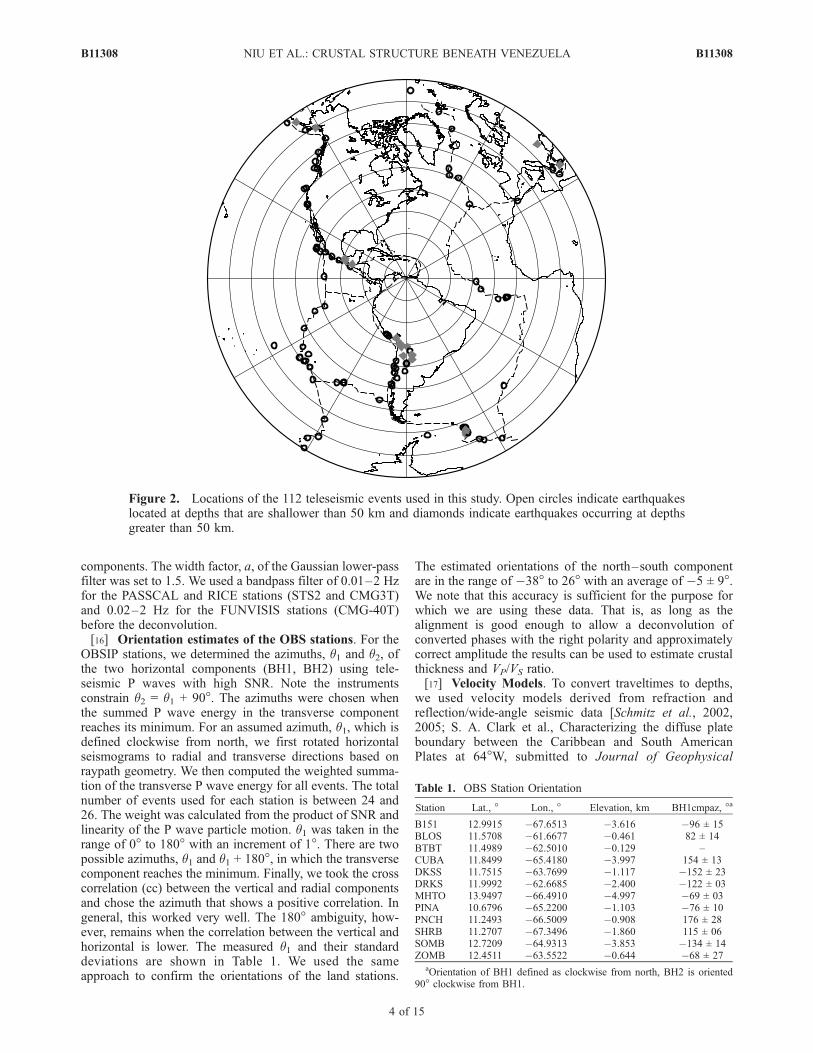
Figure 2. Locations of the 112 teleseismic events used in this study. Open circles indicate earthquakeslocated at depths that are shallower than 50 km and diamonds indicate earthquakes occurring at depthsgreater than 50 km.
Table 1. OBS Station Orientation
Station Lat., � Lon., � Elevation, km BH1cmpaz, �a
B151 12.9915 �67.6513 �3.616 �96 ± 15BLOS 11.5708 �61.6677 �0.461 82 ± 14BTBT 11.4989 �62.5010 �0.129 –CUBA 11.8499 �65.4180 �3.997 154 ± 13DKSS 11.7515 �63.7699 �1.117 �152 ± 23DRKS 11.9992 �62.6685 �2.400 �122 ± 03MHTO 13.9497 �66.4910 �4.997 �69 ± 03PINA 10.6796 �65.2200 �1.103 �76 ± 10PNCH 11.2493 �66.5009 �0.908 176 ± 28SHRB 11.2707 �67.3496 �1.860 115 ± 06SOMB 12.7209 �64.9313 �3.853 �134 ± 14ZOMB 12.4511 �63.5522 �0.644 �68 ± 27
aOrientation of BH1 defined as clockwise from north, BH2 is oriented90� clockwise from BH1.
B11308 NIU ET AL.: CRUSTAL STRUCTURE BENEATH VENEZUELA
4 of 15
B11308
Research, 2007; M. B. Magni et al., Crustal structure ofthe South American-Caribbean plate boundary at 67.5 Wfrom controlled-source seismic data, submitted to Journal ofGeophysical Research, 2007; Guedez et al., 2006; Guedez,2007; Bezada et al., unpublished]. For stations located
within 50 km of an active source line, we constructed a1D P wave velocity model by projecting the refractionmodel to the station. Locations of the active source profilesare shown in Figure 5. For those stations that are >50 kmaway from any active source profiles, we used crustal 5.1[Mooney et al., 1998] to form a 1D reference velocitymodel. Where VP/VS measurements are available fromanalysis of multiple reflections in the receiver functions,we used them to construct 1D S-wave velocity models forthe depth stacking. Otherwise we used a default VP/VS =1.732.[18] Depth Stacking. We manually checked all the seis-
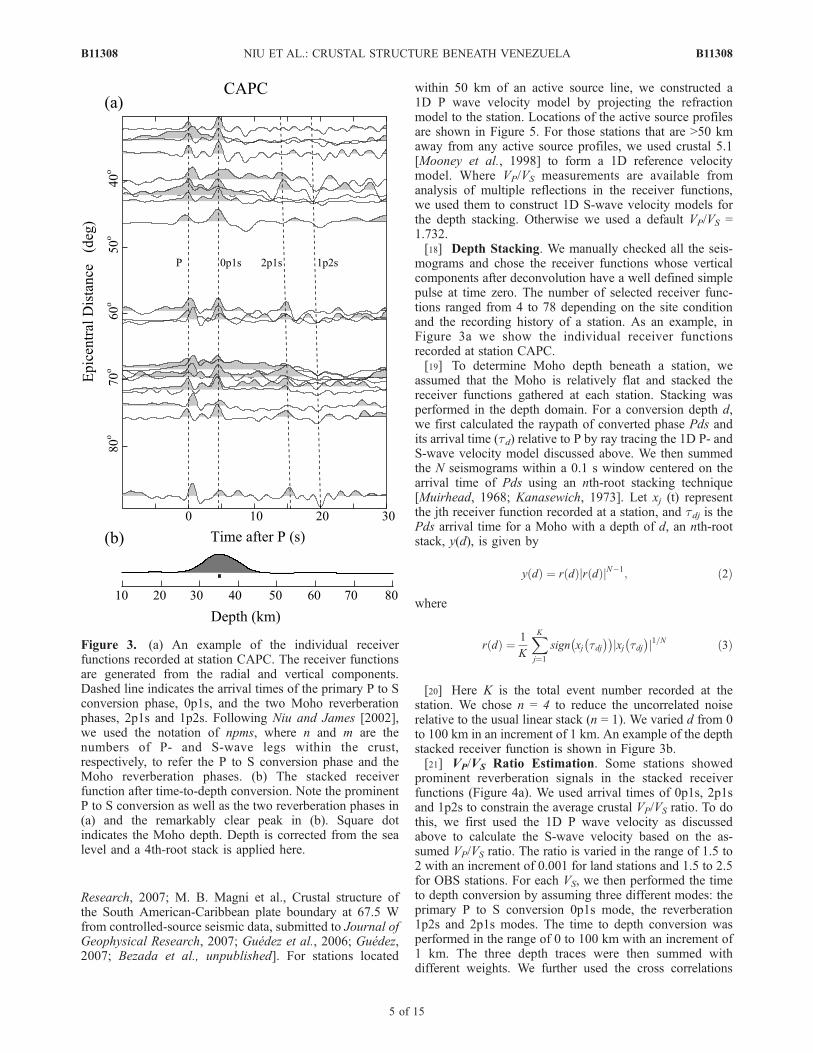
mograms and chose the receiver functions whose verticalcomponents after deconvolution have a well defined simplepulse at time zero. The number of selected receiver func-tions ranged from 4 to 78 depending on the site conditionand the recording history of a station. As an example, inFigure 3a we show the individual receiver functionsrecorded at station CAPC.[19] To determine Moho depth beneath a station, we
assumed that the Moho is relatively flat and stacked thereceiver functions gathered at each station. Stacking wasperformed in the depth domain. For a conversion depth d,we first calculated the raypath of converted phase Pds andits arrival time (td) relative to P by ray tracing the 1D P- andS-wave velocity model discussed above. We then summedthe N seismograms within a 0.1 s window centered on thearrival time of Pds using an nth-root stacking technique[Muirhead, 1968; Kanasewich, 1973]. Let xj (t) representthe jth receiver function recorded at a station, and tdj is thePds arrival time for a Moho with a depth of d, an nth-rootstack, y(d), is given by
y dð Þ ¼ r dð Þjr dð ÞjN�1; ð2Þ
where
r dð Þ ¼ 1
K
XKj¼1
sign xj tdj� �� �
jxj tdj� �
j1=N ð3Þ
[20] Here K is the total event number recorded at thestation. We chose n = 4 to reduce the uncorrelated noiserelative to the usual linear stack (n = 1). We varied d from 0to 100 km in an increment of 1 km. An example of the depthstacked receiver function is shown in Figure 3b.[21] VP/VS Ratio Estimation. Some stations showed
prominent reverberation signals in the stacked receiverfunctions (Figure 4a). We used arrival times of 0p1s, 2p1sand 1p2s to constrain the average crustal VP/VS ratio. To dothis, we first used the 1D P wave velocity as discussedabove to calculate the S-wave velocity based on the as-sumed VP/VS ratio. The ratio is varied in the range of 1.5 to2 with an increment of 0.001 for land stations and 1.5 to 2.5for OBS stations. For each VS, we then performed the timeto depth conversion by assuming three different modes: theprimary P to S conversion 0p1s mode, the reverberation1p2s and 2p1s modes. The time to depth conversion wasperformed in the range of 0 to 100 km with an increment of1 km. The three depth traces were then summed withdifferent weights. We further used the cross correlations
Figure 3. (a) An example of the individual receiverfunctions recorded at station CAPC. The receiver functionsare generated from the radial and vertical components.Dashed line indicates the arrival times of the primary P to Sconversion phase, 0p1s, and the two Moho reverberationphases, 2p1s and 1p2s. Following Niu and James [2002],we used the notation of npms, where n and m are thenumbers of P- and S-wave legs within the crust,respectively, to refer the P to S conversion phase and theMoho reverberation phases. (b) The stacked receiverfunction after time-to-depth conversion. Note the prominentP to S conversion as well as the two reverberation phases in(a) and the remarkably clear peak in (b). Square dotindicates the Moho depth. Depth is corrected from the sealevel and a 4th-root stack is applied here.
B11308 NIU ET AL.: CRUSTAL STRUCTURE BENEATH VENEZUELA
5 of 15
B11308

between the three modes as a weight function and summedthe three depth traces:
A d; rð Þ ¼ c rð Þw1 þ w2 þ w3
w1Aop1s d; rð Þ þ w2A2p1s d; rð Þ þ w3A1p2s d; rð Þ� �
: ð4Þ
[22] Here d and r are the Moho depth and VP/VS ratio. w1,w2 and w3, are the weights for 0p1s, 2p1s and 1p2s and c(r)is the cross correlation weight. The weights assigned to thethree modes were w1 = 0.50, w2 = 0.25 and w3 = 0.25.Moho depth and VP/VS ratio were determined where thesummed amplitude reaches its maximum. We also usedthree different combinations: (1) all three modes, (2) 0p1sand 1p2s modes, and (3) 0p1s and 2p1s modes to search themaximum. We accept those measurements only when twoor all of them have consistent results. An example of the VP/VS ratio measurement is shown in Figure 4b.
5. Results and Discussion
[23] We obtained a total of 63 Moho depths and 34 VP/VS
ratio measurements from the 83 stations. The results are
listed in Table 2. The table is organized by grouping stationsin the following tectonic/physiographic regions: theGuayana Shield, the foreland basins, coastal plains, Serraniadel Interior, Serrania del Falcon, Venezuelan Andes, oceanislands, and southeast Caribbean Sea. 1s errors are calcu-lated based on a bootstrap method [Efron and Tibshirani,1986], but we note that these are formal errors, that do notinclude uncertainty in the velocity model, and actual errorsare likely higher.[24] For those stations at which we were not able to
identify the Moho, about half are OBS and island stationswhere very few receiver functions were available because ofhigh noise levels or a very short recording period. The otherhalf are stations deployed in the foreland basins. They haverecorded very strong sediment induced reverberations, mak-ing it hard to pick the P to S converted wave from the Moho.[25] The Moho relief map based on the 63 measurements
is shown in Figure 5a. The interpolation was performed tofit a flattest Moho. An inversion algorithm was employed inthe interpolation. We divided the study area between 73�Wto 60�W and 5�N to 14�N into meshed grids of 0.25� 0.25�. Moho depths at grid nodes, mij, are considered asunknown parameters (total 53 27 = 1961). The 63observations, dn, were then projected to the nearest gridnodes. G is the kernel matrix with a dimension of 63 1961. It has 63 none zero elements (=1) that corresponds tothe 63 observations. This gives a total of N = 63 equations:
Gm ¼ d ð5Þ
[26] To solve the equation (5) we also added the regular-ization that minimizes the first derivative of the model(flattest Moho, first-order Tikhonov regularization) [Asteret al., 2004]:
Lm ¼ 0; ð6Þ
Here L is the finite difference operator matrix of the firstderivative in a 2 dimensional problem. Combining equa-tions (5) and (6) we solved the damped least squaresproblem to minimize the objective function:
k Gm� d k2 þl2 k Lm k2 : ð7Þ
Here l is a regularization parameter, and is selected tomeet the condition that the chi-square defined belowequals to one.
c2 ¼XNi¼1
di � Gmð Þi� �2
s2i
ð8Þ
Here si is the uncertainty in each measurement.[27] The resulting Moho relief map shows a highly
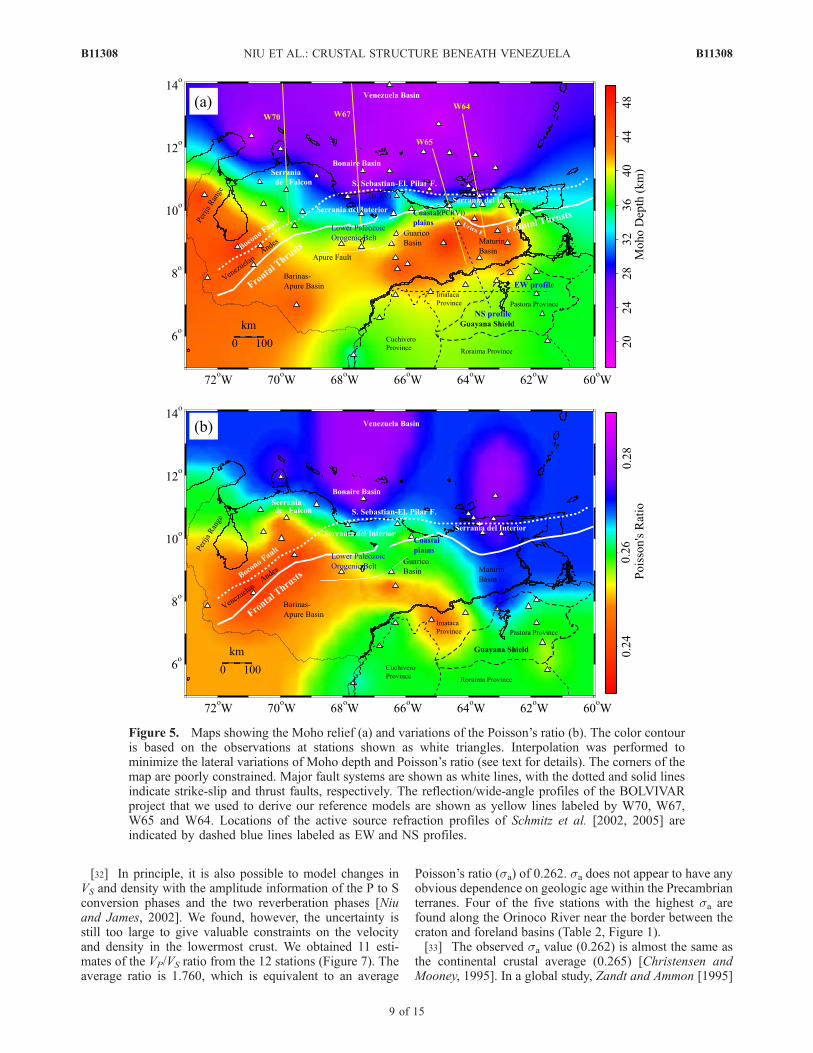
variable crustal structure. The estimated Moho depths rangefrom 16 km beneath the Bonaire Basin to �53 km beneathnortheastern Venezuela and Venezuelan Andes.[28] The interpolated/extrapolated map of Poisson’s ratio
from 34 measurements is shown in Figure 5b. We used thesame algorithm except for using a grid size of 0.5� 0.5�.Both maps show a good correlation with tectonic and
Figure 4. (a) Receiver functions generated from the SV-and P-components recorded at station CAPC are stacked inthe time domain. Moveout of each trace is calculated basedon a relative slowness of �0.005 s/deg with respect to the Pwave. (b) Color contour of the summed amplitude as afunction of crustal thickness and VP/VS ratio. Location of theamplitude peak is indicated by the two white lines.
B11308 NIU ET AL.: CRUSTAL STRUCTURE BENEATH VENEZUELA
6 of 15
B11308
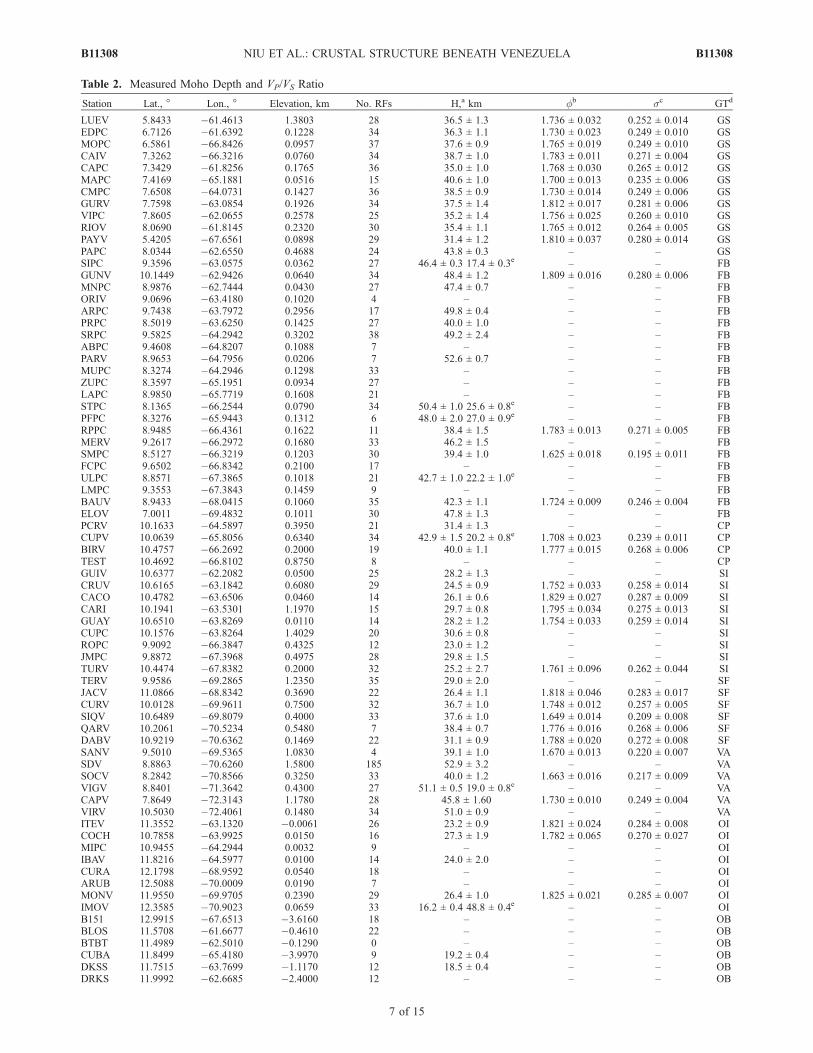
Table 2. Measured Moho Depth and VP/VS Ratio
Station Lat., � Lon., � Elevation, km No. RFs H,a km fb sc GTd
LUEV 5.8433 �61.4613 1.3803 28 36.5 ± 1.3 1.736 ± 0.032 0.252 ± 0.014 GSEDPC 6.7126 �61.6392 0.1228 34 36.3 ± 1.1 1.730 ± 0.023 0.249 ± 0.010 GSMOPC 6.5861 �66.8426 0.0957 37 37.6 ± 0.9 1.765 ± 0.019 0.249 ± 0.010 GSCAIV 7.3262 �66.3216 0.0760 34 38.7 ± 1.0 1.783 ± 0.011 0.271 ± 0.004 GSCAPC 7.3429 �61.8256 0.1765 36 35.0 ± 1.0 1.768 ± 0.030 0.265 ± 0.012 GSMAPC 7.4169 �65.1881 0.0516 15 40.6 ± 1.0 1.700 ± 0.013 0.235 ± 0.006 GSCMPC 7.6508 �64.0731 0.1427 36 38.5 ± 0.9 1.730 ± 0.014 0.249 ± 0.006 GSGURV 7.7598 �63.0854 0.1926 34 37.5 ± 1.4 1.812 ± 0.017 0.281 ± 0.006 GSVIPC 7.8605 �62.0655 0.2578 25 35.2 ± 1.4 1.756 ± 0.025 0.260 ± 0.010 GSRIOV 8.0690 �61.8145 0.2320 30 35.4 ± 1.1 1.765 ± 0.012 0.264 ± 0.005 GSPAYV 5.4205 �67.6561 0.0898 29 31.4 ± 1.2 1.810 ± 0.037 0.280 ± 0.014 GSPAPC 8.0344 �62.6550 0.4688 24 43.8 ± 0.3 – – GSSIPC 9.3596 �63.0575 0.0362 27 46.4 ± 0.3 17.4 ± 0.3e – – FBGUNV 10.1449 �62.9426 0.0640 34 48.4 ± 1.2 1.809 ± 0.016 0.280 ± 0.006 FBMNPC 8.9876 �62.7444 0.0430 27 47.4 ± 0.7 – – FBORIV 9.0696 �63.4180 0.1020 4 – – – FBARPC 9.7438 �63.7972 0.2956 17 49.8 ± 0.4 – – FBPRPC 8.5019 �63.6250 0.1425 27 40.0 ± 1.0 – – FBSRPC 9.5825 �64.2942 0.3202 38 49.2 ± 2.4 – – FBABPC 9.4608 �64.8207 0.1088 7 – – – FBPARV 8.9653 �64.7956 0.0206 7 52.6 ± 0.7 – – FBMUPC 8.3274 �64.2946 0.1298 33 – – – FBZUPC 8.3597 �65.1951 0.0934 27 – – – FBLAPC 8.9850 �65.7719 0.1608 21 – – – FBSTPC 8.1365 �66.2544 0.0790 34 50.4 ± 1.0 25.6 ± 0.8e – – FBPFPC 8.3276 �65.9443 0.1312 6 48.0 ± 2.0 27.0 ± 0.9e – – FBRPPC 8.9485 �66.4361 0.1622 11 38.4 ± 1.5 1.783 ± 0.013 0.271 ± 0.005 FBMERV 9.2617 �66.2972 0.1680 33 46.2 ± 1.5 – – FBSMPC 8.5127 �66.3219 0.1203 30 39.4 ± 1.0 1.625 ± 0.018 0.195 ± 0.011 FBFCPC 9.6502 �66.8342 0.2100 17 – – – FBULPC 8.8571 �67.3865 0.1018 21 42.7 ± 1.0 22.2 ± 1.0e – – FBLMPC 9.3553 �67.3843 0.1459 9 – – – FBBAUV 8.9433 �68.0415 0.1060 35 42.3 ± 1.1 1.724 ± 0.009 0.246 ± 0.004 FBELOV 7.0011 �69.4832 0.1011 30 47.8 ± 1.3 – – FBPCRV 10.1633 �64.5897 0.3950 21 31.4 ± 1.3 – – CPCUPV 10.0639 �65.8056 0.6340 34 42.9 ± 1.5 20.2 ± 0.8e 1.708 ± 0.023 0.239 ± 0.011 CPBIRV 10.4757 �66.2692 0.2000 19 40.0 ± 1.1 1.777 ± 0.015 0.268 ± 0.006 CPTEST 10.4692 �66.8102 0.8750 8 – – – CPGUIV 10.6377 �62.2082 0.0500 25 28.2 ± 1.3 – – SICRUV 10.6165 �63.1842 0.6080 29 24.5 ± 0.9 1.752 ± 0.033 0.258 ± 0.014 SICACO 10.4782 �63.6506 0.0460 14 26.1 ± 0.6 1.829 ± 0.027 0.287 ± 0.009 SICARI 10.1941 �63.5301 1.1970 15 29.7 ± 0.8 1.795 ± 0.034 0.275 ± 0.013 SIGUAY 10.6510 �63.8269 0.0110 14 28.2 ± 1.2 1.754 ± 0.033 0.259 ± 0.014 SICUPC 10.1576 �63.8264 1.4029 20 30.6 ± 0.8 – – SIROPC 9.9092 �66.3847 0.4325 12 23.0 ± 1.2 – – SIJMPC 9.8872 �67.3968 0.4975 28 29.8 ± 1.5 – – SITURV 10.4474 �67.8382 0.2000 32 25.2 ± 2.7 1.761 ± 0.096 0.262 ± 0.044 SITERV 9.9586 �69.2865 1.2350 35 29.0 ± 2.0 – – SFJACV 11.0866 �68.8342 0.3690 22 26.4 ± 1.1 1.818 ± 0.046 0.283 ± 0.017 SFCURV 10.0128 �69.9611 0.7500 32 36.7 ± 1.0 1.748 ± 0.012 0.257 ± 0.005 SFSIQV 10.6489 �69.8079 0.4000 33 37.6 ± 1.0 1.649 ± 0.014 0.209 ± 0.008 SFQARV 10.2061 �70.5234 0.5480 7 38.4 ± 0.7 1.776 ± 0.016 0.268 ± 0.006 SFDABV 10.9219 �70.6362 0.1469 22 31.1 ± 0.9 1.788 ± 0.020 0.272 ± 0.008 SFSANV 9.5010 �69.5365 1.0830 4 39.1 ± 1.0 1.670 ± 0.013 0.220 ± 0.007 VASDV 8.8863 �70.6260 1.5800 185 52.9 ± 3.2 – – VASOCV 8.2842 �70.8566 0.3250 33 40.0 ± 1.2 1.663 ± 0.016 0.217 ± 0.009 VAVIGV 8.8401 �71.3642 0.4300 27 51.1 ± 0.5 19.0 ± 0.8e – – VACAPV 7.8649 �72.3143 1.1780 28 45.8 ± 1.60 1.730 ± 0.010 0.249 ± 0.004 VAVIRV 10.5030 �72.4061 0.1480 34 51.0 ± 0.9 – – VAITEV 11.3552 �63.1320 �0.0061 26 23.2 ± 0.9 1.821 ± 0.024 0.284 ± 0.008 OICOCH 10.7858 �63.9925 0.0150 16 27.3 ± 1.9 1.782 ± 0.065 0.270 ± 0.027 OIMIPC 10.9455 �64.2944 0.0032 9 – – – OIIBAV 11.8216 �64.5977 0.0100 14 24.0 ± 2.0 – – OICURA 12.1798 �68.9592 0.0540 18 – – – OIARUB 12.5088 �70.0009 0.0190 7 – – – OIMONV 11.9550 �69.9705 0.2390 29 26.4 ± 1.0 1.825 ± 0.021 0.285 ± 0.007 OIIMOV 12.3585 �70.9023 0.0659 33 16.2 ± 0.4 48.8 ± 0.4e – – OIB151 12.9915 �67.6513 �3.6160 18 – – – OBBLOS 11.5708 �61.6677 �0.4610 22 – – – OBBTBT 11.4989 �62.5010 �0.1290 0 – – – OBCUBA 11.8499 �65.4180 �3.9970 9 19.2 ± 0.4 – – OBDKSS 11.7515 �63.7699 �1.1170 12 18.5 ± 0.4 – – OBDRKS 11.9992 �62.6685 �2.4000 12 – – – OB
B11308 NIU ET AL.: CRUSTAL STRUCTURE BENEATH VENEZUELA
7 of 15
B11308
geologic terranes (Figure 6). In the following paragraphs wewill divide the Moho depth and VP/VS ratio measurementsinto 8 groups and discuss the basic features of each group.[29] The Guayana Shield. We observed significant dif-
ferences in the nature of the crust and the crust-mantleboundary between the Precambrian Guayana shield and theother terranes. The Moho depth beneath the shield is�37.2 km on average. There is little topographic reliefacross the part of the shield covered by our seismic array.The standard deviation is 2.3 km from the estimates of12 stations and only 1.4 km if the 2 stations located at theedge of the shield (PAPC and PAYV, Figure 1) arediscounted. The entire Guayana Shield is composed offour Archean and Proterozoic provinces [Ostos et al., 2005],and is part of a larger shield known as the Amazonian Craton[e.g., Neves and Cordani, 1991]. The Archean Imatacaprovince lies in the northern end of the shield just south ofthe Orinoco River. It is bounded by two Proterozoic prov-inces, the Pastora and Cuchivero, to the southeast andsouthwest, respectively. A third Proterozoic province, Ror-aima, lies further south of the Pastora and Cuchivero prov-inces (Figure 1). We found stations in the northern ArcheanImataca province (RIOV, PAPC, GURV, CMPC, andMAPC)generally have about 1–2 km thicker crust than those locatedin the southern Proterozoic provinces (LUEV, EDPC, andCAPC, PAYV, MOPC) (Table 2, Figures 1 and 6). Thus theMoho dips slightly from south to north beneath the shield.This northward dip may reflect the southern limit of elasticflexural loading induced by complicated interactions alongthe Caribbean-South America plate [Jacome et al., 2002;Clark et al., 2006].[30] Schmitz et al. [2005] obtained a crustal thickness of
37–38 km directly beneath the Orinoco River from seismicrefraction measurements made along a north–south profile(NS, Figure 5) extending from the shield to the coast, ingood agreement with our results. Schmitz et al. [2002]estimated the crust beneath the Pastora province to be43 km along an EW refraction profile recording quarryblasts from two mines in the shield (EW, Figure 5), a valueconsiderably greater than what we measure. Our estimatedMoho depths are, however, �6 km shallower than theirobservations [Schmitz et al., 2002, 2005]. In general onemajor error source in estimating Moho depth from receiverfunction analysis is the assumed velocity model used inconverting traveltimes to depths. This should not be the casehere since we used the velocity models of Schmitz el al.
[2002, 2005] to estimate Moho depths. Moreover, it requiresan unreasonable high crustal velocity (7.4 km/s) to matchour observation to their active source results. The discrep-ancy could also be caused by different sampling nature inactive and passive seismic data as the two have verydifferent frequency contents, and the former samples fromabove, while the latter samples from below. If the crust-mantle transition is a gradient boundary, the estimatedMoho depth depends on the wavelength used to measureit. While high frequency active source data more or lessreport the depth associated with a rapid change in velocity,the long wavelength teleseismic waves are likely to give theaverage depth of the whole transition. The two could bedifferent from each other depending on the fine structure ofthe crust-mantle transition. However, as we discuss belowthe observed receiver functions suggested that the Mohomust be a sharp boundary with a thickness of less than 2 km,making this argument unlikely. The quarry blast data weresampled with receivers on average spaced at about 7 kmapart. There were no Pn or Sn observations, Moho depthswere solely determined from arrival times of PmP, resultingin a large uncertainty in the estimated crustal thickness. TheMoho thickness is thus not well determined beneath thePastora province. We note that the Schmitz et al. [2005]refraction results, from a survey utilizing controlled shots,agrees well with our results at the northernmost edge of thecraton. We suggest that the phase correlations in the poorlysampled quarry blast data may be misidentified, or theripple fired blasts have produced signals that have led toinconsistent traveltime picks at near and far distance.[31] Another distinct feature shown in the receiver func-
tions from the craton is the large amplitude P to S convertedwaves as well as the strong crustal reverberation phases(Figures 3 and 4a). This indicates that the Moho beneatheach station must be very flat and have a large change invelocity and density across it. The crust-mantle boundarymust be sharp with a transition zone less than a fewkilometers. The reverberation phases 2p1s and 1p2s exhibitwaveform broadening compared to the direct P wave(Figure 4a). We used a forward modeling approach [Niuand James, 2002] to estimate the upper boundary of thethickness of the crust-mantle transition. If the observedbroadening is caused entirely by a velocity gradient acrossthe Moho, then the width of the waveform of 1p2s con-strains the allowable extent of the transition zone to be lessthan 2 km.
Table 2. (continued)
Station Lat., � Lon., � Elevation, km No. RFs H,a km fb sc GTd
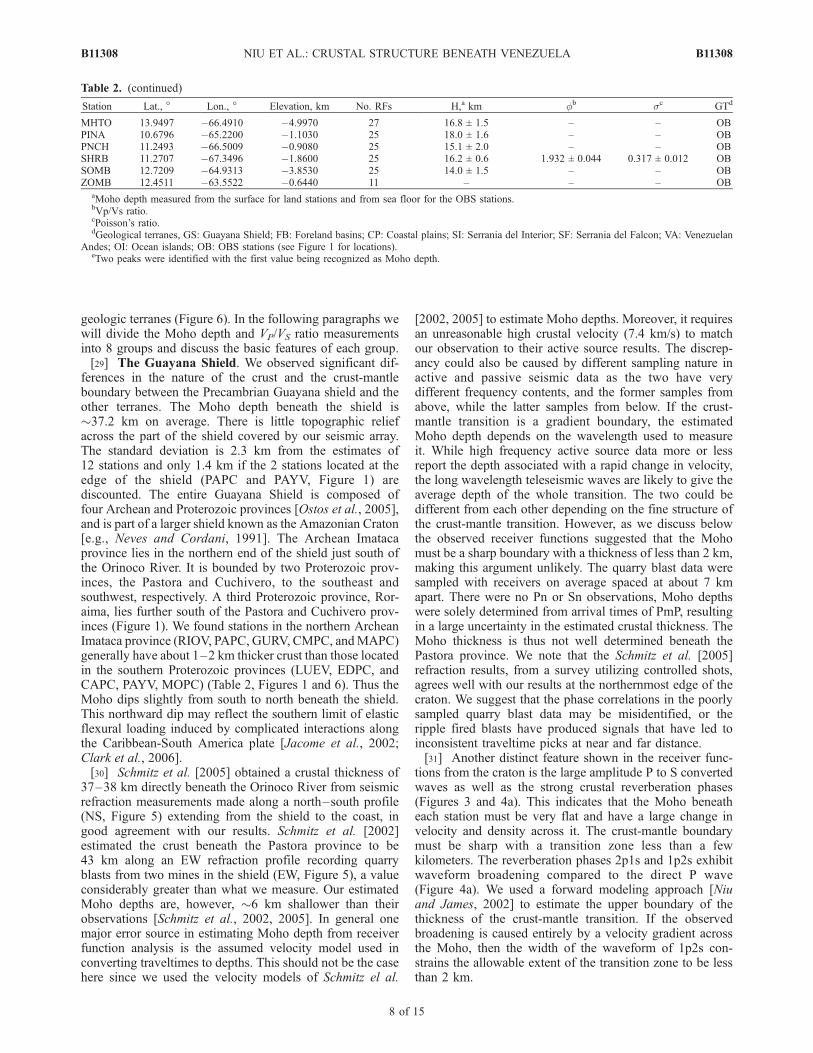
MHTO 13.9497 �66.4910 �4.9970 27 16.8 ± 1.5 – – OBPINA 10.6796 �65.2200 �1.1030 25 18.0 ± 1.6 – – OBPNCH 11.2493 �66.5009 �0.9080 25 15.1 ± 2.0 – – OBSHRB 11.2707 �67.3496 �1.8600 25 16.2 ± 0.6 1.932 ± 0.044 0.317 ± 0.012 OBSOMB 12.7209 �64.9313 �3.8530 25 14.0 ± 1.5 – – OBZOMB 12.4511 �63.5522 �0.6440 11 – – – OB
aMoho depth measured from the surface for land stations and from sea floor for the OBS stations.bVp/Vs ratio.cPoisson’s ratio.dGeological terranes, GS: Guayana Shield; FB: Foreland basins; CP: Coastal plains; SI: Serrania del Interior; SF: Serrania del Falcon; VA: Venezuelan
Andes; OI: Ocean islands; OB: OBS stations (see Figure 1 for locations).eTwo peaks were identified with the first value being recognized as Moho depth.
B11308 NIU ET AL.: CRUSTAL STRUCTURE BENEATH VENEZUELA
8 of 15
B11308
[32] In principle, it is also possible to model changes inVS and density with the amplitude information of the P to Sconversion phases and the two reverberation phases [Niuand James, 2002]. We found, however, the uncertainty isstill too large to give valuable constraints on the velocityand density in the lowermost crust. We obtained 11 esti-mates of the VP/VS ratio from the 12 stations (Figure 7). Theaverage ratio is 1.760, which is equivalent to an average
Poisson’s ratio (sa) of 0.262. sa does not appear to have anyobvious dependence on geologic age within the Precambrianterranes. Four of the five stations with the highest sa arefound along the Orinoco River near the border between thecraton and foreland basins (Table 2, Figure 1).[33] The observed sa value (0.262) is almost the same as
the continental crustal average (0.265) [Christensen andMooney, 1995]. In a global study, Zandt and Ammon [1995]
Figure 5. Maps showing the Moho relief (a) and variations of the Poisson’s ratio (b). The color contouris based on the observations at stations shown as white triangles. Interpolation was performed tominimize the lateral variations of Moho depth and Poisson’s ratio (see text for details). The corners of themap are poorly constrained. Major fault systems are shown as white lines, with the dotted and solid linesindicate strike-slip and thrust faults, respectively. The reflection/wide-angle profiles of the BOLVIVARproject that we used to derive our reference models are shown as yellow lines labeled by W70, W67,W65 and W64. Locations of the active source refraction profiles of Schmitz et al. [2002, 2005] areindicated by dashed blue lines labeled as EW and NS profiles.
B11308 NIU ET AL.: CRUSTAL STRUCTURE BENEATH VENEZUELA
9 of 15
B11308

concluded that the crust of ancient shields is characterizedby a relatively high Poisson’s ratio (0.29), which is indic-ative of mafic material in the lowermost crust. For theGuayana Shield studied here, however, the measured saindicate that it can accommodate only relatively smallamounts of granulite-facies mafic components. The lackof a high velocity mafic layer is indirectly supported bythe large velocity contrast across the Moho inferred from thelarge amplitude of conversion and reverberation phases. Theresults here are consistent with observations in South Africa[Niu and James, 2002] and west Australia [Durrheim andMooney, 1994]. However, we could not identify a differencein lower crustal structure between the Archean and Protero-zoic crust as suggested by Durrheim and Mooney [1994].[34] The Foreland Basins. This region consists of the
Barinas-Apure Basin, Guarico Basin and Maturin Basinlocated at the south side of the Frontal Thrusts (Figures 1and 5). The region between Guarico and Barinas-Apurebasin is a former Paleozoic orogenic belt that has beeneroded [Ostos et al., 2005]. The Maturin and Guarico basinsare relatively well instrumented compared to the Barinas-
Apure Basin in the west mainly because of annual floodingduring the wet season. In general the quality of the receiverfunctions recorded in basins is poor due to the low similaritybetween the horizontal and vertical components of therecordings. This is probably due to the strong sediment-induced reverberations. We were able to obtain 15 depthmeasurements from a total of 22 stations deployed in thisregion (Table 2, Figures 1 and 6). The average crustal Mohodepth is 45.8. There is a large conversion at depths between4 and 15 km which we interpret as the base of the sedimentlayer, as we used the P-SV pair in the receiver functionanalysis and the P wave energy should be minimized in thereceiver functions. The thickest crust is observed in theeastern Maturin basin where very large Bouguer gravityanomalies (�160 mGal) and an extremely thick sedimenta-ry column (>10 km) have been observed previously[Schmitz et al., 2005]. The crust beneath the Guarico Basinand the Paleozoic orogenic belt appears to be shallower thanthat of the Maturin Basin. We suggest that the shallowerMoho depth might result from the lack of thrust loading, orcontinental subduction, or both along the coast here. We
Figure 6. Stacked receiver functions sorted by tectonic terranes: 1. Guayana Shield; 2. Foreland basins;3. Coastal plains; 4. Serrania del Interior; 5. Serrania del Falcon; 6. Venezuelan Andes; 7. Ocean islands;8. Ocean floors. Reference line of 40 km for land stations, 30 km for ocean islands, and 10 km for oceanfloor stations. Arrow indicates the base of the sedimentary layer observed mainly from the stations in theforeland basins. Square dots indicate the identified Moho depth. Traces with question marks show twopeaks and our identifications are based solely on the consistency with other stations and thus could bearbitrary.
B11308 NIU ET AL.: CRUSTAL STRUCTURE BENEATH VENEZUELA
10 of 15
B11308
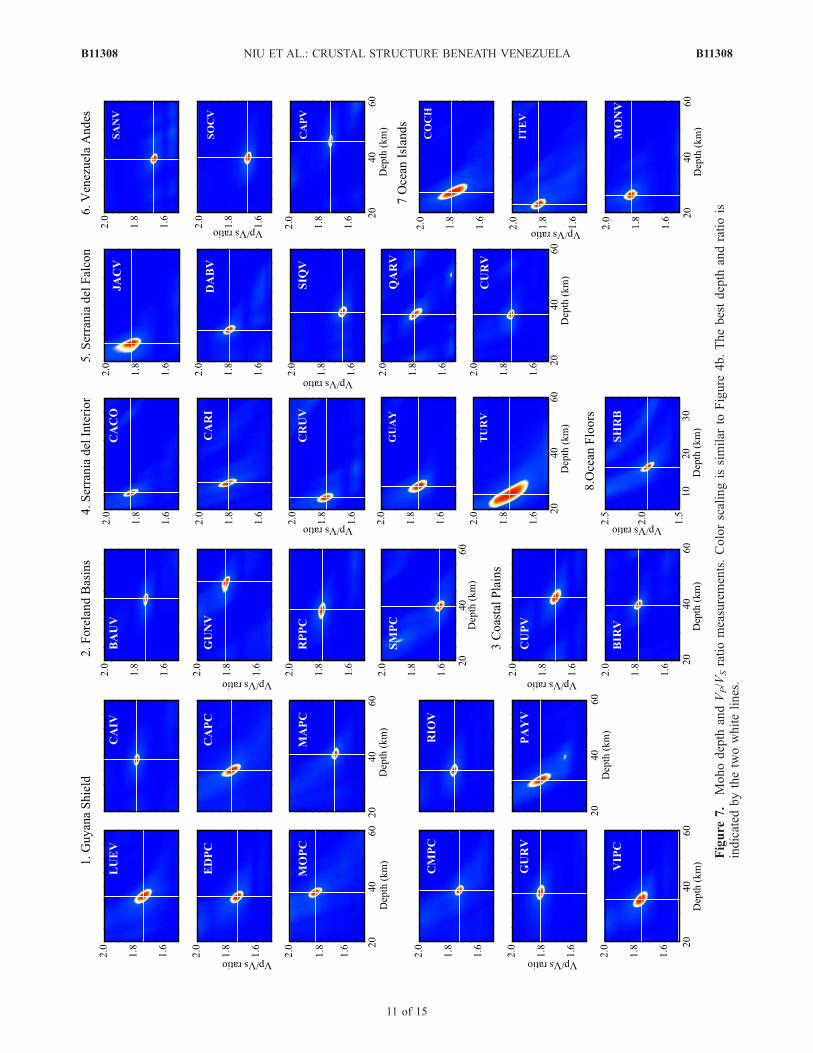
Figure
7.
Mohodepth
andVP/V
Sratiomeasurements.Colorscalingissimilar
toFigure
4b.Thebestdepth
andratiois
indicated
bythetwowhitelines.
B11308 NIU ET AL.: CRUSTAL STRUCTURE BENEATH VENEZUELA
11 of 15
B11308

also found that the crust beneath the Guarico Basin and thePaleozoic orogenic belt is more complex. Several stations inthis area show two prominent P to S conversion peaks ofwhich we picked the deeper one in order to keep the Mohoas flat as possible. The shallower peak we see in the oldPaleozoic orogenic belt might be related to detachments orthrust faults. We obtained 4 VP/VS ratio measurements, withan average value of 1.735 or a Poisson’s ratio of 0.248(Figure 7). Station GUNV at the northeastern edge of theMaturin basin has the largest ratio, while the three stationsat the edge of the Paleozoic orogenic belt (RPPC, SMPCand BAUV) appear to have low Poisson’s ratios (Table 2,Figure 5b).[35] The Coastal Plains. Here we refer to the coastal
plains as the relatively flat area between the eastern andwestern mountain ranges of the Serrania del Interior. It isbounded by two towns, Puerto La Cruz (station PCRV) inthe east and Birongo (station BIRV) in the west. The regionis characterized by very distinct crustal thickness and VP/VS
ratio from the coastal mountain ranges. The crust is about37.7 km thick (Table 2, Figure 6) with a Poisson’s ratio of0.254 (Table 2, Figure 7). We also observed a shallowerpeak at the station CUPV, which might be related to thedetachment of the nearby thrust fault (Figure 1).[36] The Serrania del Interior. The Moho beneath this
geological province is surprisingly flat and shallow(Figure 6). The average Moho depth is 26.8 km with astandard deviation of 2.5 km. Given that this region ischaracterized by an average elevation of 800 m, the moun-tains in this region are not isostatically balanced. This
indicates that these mountains must be dynamically sup-ported, probably from flexural rebound of the South Americaplate. It has been suggested that the subducted Atlantic slabhas been detaching from the South America continent pro-gressively from west to east beneath northeastern Venezuela[VanDecar et al., 2003]. The tear-off could result in anupward rebound of the deflected South America plate. Amore quantitative synthesis of the regional tectonics from theactive and passive source data as well as numerical modelingare presented elsewhere.[37] The relative simplicity of the crustal structure has
resulted in robust measurements of sa (Figure 7). In generalthe region has a sa = 0.268, in good agreement with eitherthat of average continental crust, 0.265 [Christensen andMooney, 1995] or the 0.27 of Miller and Christensen [1994]measured on rocks from the Kohistan arc in northernPakistan, The local sa thus agrees with a scenario that alarge amount of the crust in this region may have an islandarc origin.[38] The Serrania del Falcon. We have a total of
6 stations deployed in the Tertiary Falcon Basin. Formationof this region involved uplift that started from a tectonicinversion of a marine basin resulting from NW–SE com-pression in the Miocene [Audemard, 2001] associated withthe northward escape of the Maracaibo block. The 6 stationscan be roughly divided into two groups. The three stationsin the eastern and northern part of the basin (TERV, JACVand DABV) showed a relative thin crust around 28 km witha high Poisson’s ratio of 0.278, while the crust in the centraland southern areas (SIQV, QARV and CURV) has amoderate thickness of 37 km with a lower Poisson’s ratioof 0.245. The average elevation of the eastern and northernstations is about 600 m above the sea level. It is thus likelythat the excess topography here also has a dynamic origin.A possible source is the positive buoyancy of the Caribbeanoceanic plateau thrust underneath the Falcon region [vander Hilst and Mann, 1994; Guedez, 2007].[39] The Venezuelan Andes. We observed a very thick
crust beneath the NE–SW trending Venezuelan Andes. Theaverage crustal thickness is around 46 km (Table 2,Figures 5 and 6). The central part of the chain has thethickest crust which reaches �52 km depth. The Mohoshallows more rapidly toward the northeast than to thesouthwest, consistent with shortening related to the com-pression between the Maracaibo block and South America[Audemard and Audemard, 2002]. The crust beneath thestation located in the Perija Range (VIRV) is also close to50 km thick, indicating that both the Venezuelan Andes andthe Perija Range are underlain by thick crustal roots. On theother hand we obtained very low Poisson’s ratios from threestations in the Venezuelan Andes. The average Poisson’sratio is 0.229, suggesting considerably more felsic crustthan the rest of Venezuela.[40] We collected 185 receiver functions at the GSN
station SDV, which lies on the southern flank of the centralVenezuelan Andes. The large number of receiver functionsallowed us to examine azimuthal dependence of crustalstructure. We sorted the receiver functions based on theback azimuth. The stacked receiver functions gathered at 11back azimuth bins are shown in Figure 8. In general thereare two P to S conversion peaks in the stacked receiverfunctions and we interpreted the deeper one as the Moho in
Figure 8. Depth stacked receiver functions gathered at 11back azimuth bins. Numbers above each trace indicate theback azimuth ranges. The SV receiver functions recorded atstation SDV are displayed.
B11308 NIU ET AL.: CRUSTAL STRUCTURE BENEATH VENEZUELA
12 of 15
B11308
this area. We found very large variations among these backazimuth stacks. The Moho is totally absent in the receiverfunctions stacked from three southeastern back azimuthbins. This may be caused by a dipping Moho structure. Ifthe Moho dips toward the northwest, teleseismic P wavesarriving from southeast directions arrive at almost normalincidence to the Moho, resulting in very small P to Sconversions.[41] The Ocean Islands. We have broadband data from
9 islands within the Caribbean-South America plate bound-ary. The island stations are generally very noisy and weobtained only 5 Moho depth estimates (Table 2, Figure 6)and 3 VP/VS ratio measurements (Figure 7). We observedtwo strong P to S conversion peaks at depths of 16.2 km and48.8 km beneath the Los Monjes Island (IMOV), thewestern end of the island chain. We picked the shallowerone in order to keep the Moho as flat as possible althoughthe second peak has larger amplitude. Crustal thicknessesobserved at the other 4 stations have very small variationswith an average thickness of 25.1 km. Both Monte Cano(MONV) and Los Testigos (ITEV) have high Poisson’s ratio(0.285 and 0.284), consistent with a mafic island arc origin.
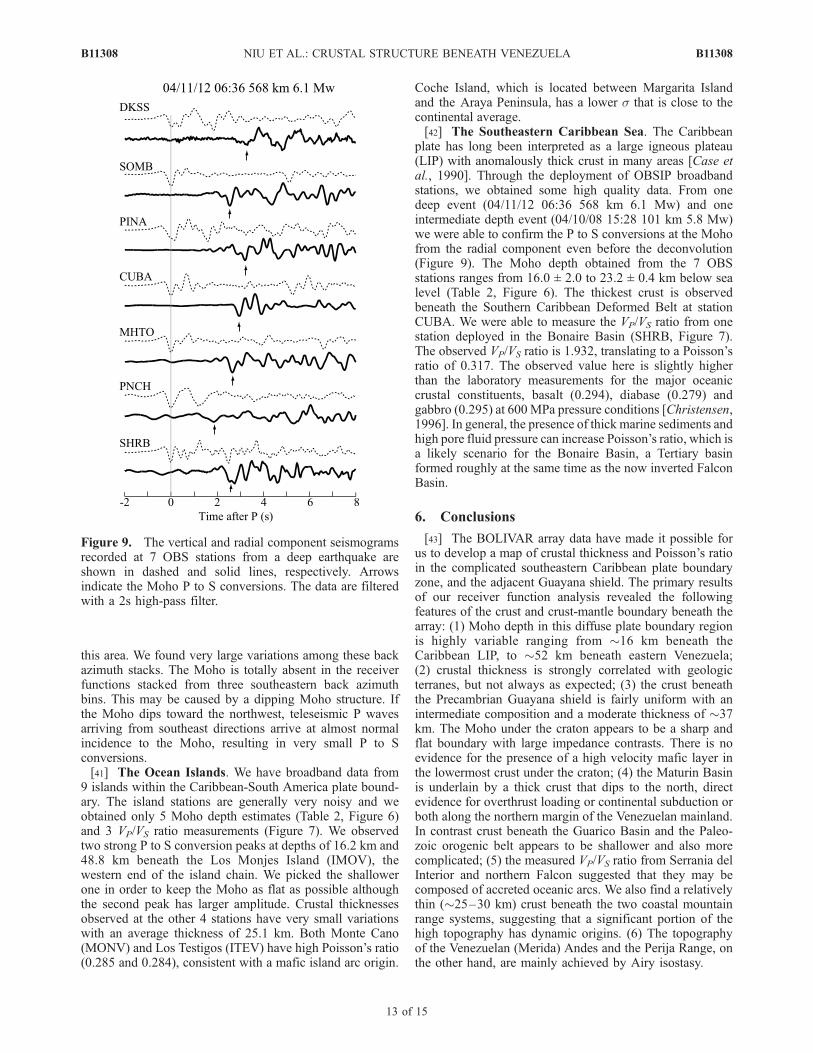
Coche Island, which is located between Margarita Islandand the Araya Peninsula, has a lower s that is close to thecontinental average.[42] The Southeastern Caribbean Sea. The Caribbean
plate has long been interpreted as a large igneous plateau(LIP) with anomalously thick crust in many areas [Case etal., 1990]. Through the deployment of OBSIP broadbandstations, we obtained some high quality data. From onedeep event (04/11/12 06:36 568 km 6.1 Mw) and oneintermediate depth event (04/10/08 15:28 101 km 5.8 Mw)we were able to confirm the P to S conversions at the Mohofrom the radial component even before the deconvolution(Figure 9). The Moho depth obtained from the 7 OBSstations ranges from 16.0 ± 2.0 to 23.2 ± 0.4 km below sealevel (Table 2, Figure 6). The thickest crust is observedbeneath the Southern Caribbean Deformed Belt at stationCUBA. We were able to measure the VP/VS ratio from onestation deployed in the Bonaire Basin (SHRB, Figure 7).The observed VP/VS ratio is 1.932, translating to a Poisson’sratio of 0.317. The observed value here is slightly higherthan the laboratory measurements for the major oceaniccrustal constituents, basalt (0.294), diabase (0.279) andgabbro (0.295) at 600MPa pressure conditions [Christensen,1996]. In general, the presence of thick marine sediments andhigh pore fluid pressure can increase Poisson’s ratio, which isa likely scenario for the Bonaire Basin, a Tertiary basinformed roughly at the same time as the now inverted FalconBasin.
6. Conclusions
[43] The BOLIVAR array data have made it possible forus to develop a map of crustal thickness and Poisson’s ratioin the complicated southeastern Caribbean plate boundaryzone, and the adjacent Guayana shield. The primary resultsof our receiver function analysis revealed the followingfeatures of the crust and crust-mantle boundary beneath thearray: (1) Moho depth in this diffuse plate boundary regionis highly variable ranging from �16 km beneath theCaribbean LIP, to �52 km beneath eastern Venezuela;(2) crustal thickness is strongly correlated with geologicterranes, but not always as expected; (3) the crust beneaththe Precambrian Guayana shield is fairly uniform with anintermediate composition and a moderate thickness of �37km. The Moho under the craton appears to be a sharp andflat boundary with large impedance contrasts. There is noevidence for the presence of a high velocity mafic layer inthe lowermost crust under the craton; (4) the Maturin Basinis underlain by a thick crust that dips to the north, directevidence for overthrust loading or continental subduction orboth along the northern margin of the Venezuelan mainland.In contrast crust beneath the Guarico Basin and the Paleo-zoic orogenic belt appears to be shallower and also morecomplicated; (5) the measured VP/VS ratio from Serrania delInterior and northern Falcon suggested that they may becomposed of accreted oceanic arcs. We also find a relativelythin (�25–30 km) crust beneath the two coastal mountainrange systems, suggesting that a significant portion of thehigh topography has dynamic origins. (6) The topographyof the Venezuelan (Merida) Andes and the Perija Range, onthe other hand, are mainly achieved by Airy isostasy.
Figure 9. The vertical and radial component seismogramsrecorded at 7 OBS stations from a deep earthquake areshown in dashed and solid lines, respectively. Arrowsindicate the Moho P to S conversions. The data are filteredwith a 2s high-pass filter.
B11308 NIU ET AL.: CRUSTAL STRUCTURE BENEATH VENEZUELA
13 of 15
B11308
[44] Acknowledgments. We thank FUNVISIS for providing accessto their new digital broadband data as part of this collaboration. We areindebted to the IRIS-PASSCAL program, a facilities program of theNational Science Foundation, for providing instrumentation and technicalsupport for this experiment. We also thank the NSF funded US NationalOcean Bottom Seismograph Instrument Pool, and in particular the UCSDL-cheapo group for their support of the passive OBS deployment. We thankall the people involved in the BOLIVAR and GEODINOS projects. We owea special debt of thanks to a long list of personnel at FUNVISIS whoassisted in the PASSCAL deployment. At the Meteorological ServiceNetherlands Antilles & Aruba, special thanks are due to Albert Martis,Arthur Dania, and Marck Oduber for their generous support in siting,constructing and maintaining our stations in their facilities. Discussionswith Hans Ave Lallemant, Stoney Clark, Cin-Ty A. Lee, Michael Schmitzand Colin Zelt were helpful in preparing the manuscript. The AssociateEditor, Dr. Martha Savage and one anonymous reviewer provided veryconstructive reviews that improved the manuscript significantly. TheBOLIVAR project is funded by the National Science Foundation Conti-nental Dynamics Program (EAR-0222270). F.N. expresses special thanks toRice University for the generous support for his field work.
ReferencesAmmon, C. J. (1991), The isolation of receiver effects from teleseismic Pwaveforms, Bull. Seismol. Soc. Am., 81, 2504–2510.
Aster, R., B. Borchers, and C. Thurber (2004), Parameter Estimation andInverse Problems, Int. Geophys. Ser., vol. 90, 301 pp., Elsevier, NewYork.
Audemard, F. A. (2001), Quaternary tectonics and present stress tensor ofthe inverted northern Falcon Basin, northwestern Venezuela, J. Struct.Geol., 23, 431–453.
Audemard, F. E., and F. A. Audemard (2002), Structure of the MeridaAndes, Venezuela: Relations with the South America-Caribbean geody-namic interaction, Tectonophysics, 345, 299–327.
Burke, K. (1988), Tectonic evolution of the Caribbean, Ann. Rev. EarthPlanet. Sci., 16, 201–230.
Case, J. E., W. MacDonald, and P. J. Fox (1990), Caribbean crustal pro-vinces, seismic and gravity, in The Caribbean Region, G. Dengo and J. E.Case (Eds.), Geological Soc. of America, Boulder Colorado, pp.15–36.
Christensen, N. I. (1996), Poisson’s ratio and crustal seismology, J. Geo-phys. Res., 101, 3139–3156.
Christensen, N. I., and W. D. Mooney (1995), Seismic velocity structureand composition of the continental crust: A global view, J. Geophys. Res.,100, 9761–9788.
Clark, S. A., F. Niu, A. Levander, and the BOLIVAR Working Group(2006), Tearing the lithosphere: Diachronous slab detachment along theVenezuelan margin from BOLIVAR seismic data, Eos Trans. AGU,87(52), Fall Meet. Suppl., Abstract, T42C-06.
Clayton, R. W., and R. A. Wiggins (1976), Source shape estimation anddeconvolution of teleseismic body waves, Geophys. J. R. Astron. Soc.,47, 151–177.
de Wit, M. D., C. E. J. de Ronde, M. Tredoux, C. Roering, R. J. Hart, R. A.Armstrong, R. W. E. Green, E. Peberdy, and R. A. Hart (1992), Forma-tion of an Archaean continent, Nature, 357, 553–562.
Dueker, K. G., and A. F. Sheehan (1998), Mantle discontinuity structurebeneath the Colorado Rocky Mountains and High Plains, J. Geophys.Res., 103, 7153–7169.
Durrheim, R. J., and W. D. Mooney (1994), Evolution of the Precambrianlithosphere: Seismological and geochemical constraints, J. Geophys.Res., 99, 15,359–15,374.
Efron, B., and R. Tibshirani (1986), Bootstrap methods for standard errors,confidence intervals, and other measures of statistical accuracy, Stat. Sci.,1, 54–75.
Fountain, D. M., and N. I. Christensen (1989), Composition of the con-tinental crust and upper mantle: a review, in Geophysical Framework ofthe Continental United States, L. C. Pakiser and W. D. Mooney (Eds.),Geol. Soc. Am. Mem. 172, Boulder, CO, pp.711–742.
Gordon, R. G. (1998), The plate tectonic approximation: Plate non rigidity,diffuse plate boundaries, and global plate reconstructions, Ann. Rev.Earth Planet. Sci., 26, 615–642.
Guedez, M. C. (2007), BOLIVAR: Crustal Structure across the Caribbean-South American Plate Boundary at 70W- Results from Seismic Refrac-tion and Reflection Data, M.S. Thesis, Rice Univ., Houston, TX, USA,41 pp.
Guedez, M. C., C. A. Zelt, M. B. Magnani, and A. Levander (2006),BOLIVAR: Crustal structure of the Caribbean-South America plateboundary at 70W, EOS, Trans AGU, Abstract T43D-1677.
Gurrola, H., J. B. Minster, and T. Owens (1994), The use of velocityspectrum for stacking receiver functions and imaging upper mantle dis-continuities, Geophys. J. Int., 117, 427–440.
Gurrola, H., G. E. Baker, and J. B. Minster (1995), Simultaneous time-domain deconvolution with application to the computation of receiverfunction, Geophys. J. Int., 120, 537–543.
Henstock, T. J., A. Levander, and the Deep Probe Working Group (1998),Probing the Archean and Proterozoic lithosphere of western North Amer-ica, GSA Today, 8, 1–5, 16–17.
Hoffman, P. F. (1988), United plates of America, the birth of a craton: EarlyProterozoic assembly and growth of Laurentia, Ann. Rev. Earth Planet.Sci., 16, 543–603.
Holbrook, W. S., D. Lizarralde, S. McGeary, N. Bangs, and J. Diebold(1999), Structure and composition of the Aleutian island arc and implica-tions for continental crustal growth, Geology, 27, 31–34.
Jacome, M. I., N. Kusznir, F. Audemard, and S. Flint (2002), The Forma-tion of the Maturin Foreland Basin, Eastern Venezuela: Thrust SheetLoading or Subduction Dynamic Topography, Tectonics, 22(5), 1046,doi:10.1029/2002TC001381.
Jordan, T. H. (1988), Structure and formation of the continental tectosphere,J. Petrology, Special Lithospher Issue, 11–37.
Kanasewich, E. R. (1973), Time Sequence Analysis in Geophysics, Univ. ofAlberta Press, Edmonton, AB, pp. 364.
Langston, C. A. (1979), Structure under Mount Rainier, Washington,inferred from teleseismic body waves, J. Geophys. Res., 84, 4749–4762.
Levander, A. (2003), USArray design implications for wavefield imaging inthe lithosphere and upper mantle, The Leading Edge, 22, 250–255.
Levander, A., et al. (2006), Evolution of the Southern Caribbean plateboundary, Eos Trans. AGU 87, 97, 2006.
Miller, D. J., and N. I. Christensen (1994), Seismic signature and geochem-istry of an island arc: A multidisciplinary study of the Kohistan accretedterrane, northern Pakistan, J. Geophys. Res., 99, 11,623–11,642.
Mooney, W. D., G. Laske, and G. Masters (1998), CRUST 5.1: A globalcrustal model at 5� 5�, J. Geophys. Res., 103, 727–747.
Muirhead, K. J. (1968), Eliminating false alarms when detecting seismicevents automatically, Nature, 217, 533–534.
Nelson, K. D. (1991), A unified view of craton evolution motivated byrecent deep seismic reflection and refraction results, Geophys. J. Int., 105,25–35.
Neves, B. B., and U. G. Cordani (1991), Tectonic evolution of SouthAmerica during the Late Proterozoic, Precambrian Res., 53, 23–40.
Nguuri, T. K., J. Gore, D. E. James, S. J. Webb, C. Wright, T. G. Zengeni,O. Gwavana, and J. A. Snoke (2001), Kaapvaal Seismic Group, Crustalstructure beneath southern Africa and its implications for the formationand evolution of the Kaapvaal and Zimbabwe cratons, Geophys. Res.Lett., 28, 2501–2504.
Niu, F., and D. E. James (2002), Fine structure of the lowermost crustbeneath the Kaapvaal craton and its implications for crustal formationand evolution, Earth Planet. Sci. Lett., 200, 121–130.
Niu, F., and H. Kawakatsu (1996), Complex structure of the mantle dis-continuities at the tip of the subducting slab beneath the northeast China:A preliminary investigation of broadband receiver functions, J. Phys.Earth, 44, 701–711.
Niu, F., and H. Kawakatsu (1998), Determination of the absolute depths ofthe mantle transition zone discontinuities beneath China: Effect of stag-nant slabs on mantle transition zone discontinuities, Earth Planets Space,50, 965–975.
Niu, F., A. Levander, C. M. Cooper, C.-T. Aeolus Lee, A. Lenardic, andD. E. James (2004), Seismic constraints on the depth and compositionof the mantle keel beneath the Kaapvaal craton, Earth Planet. Sci. Lett.,224, 337–346.
Ostos, M., F. Yoris, and H. G. Ave Lallemant (2005), Overview of thesoutheast Caribbean-South America plate boundary zone, in: Carib-bean-South American Plate Interactions, Venezuela, H. G. Ave Lallemantand V. B. Sisson (Eds.), Geol. Soc. Am. Special Paper 394, Boulder CO,pp.53–89.
Owens, T. J., G. Zandt, and S. R. Taylor (1984), Seismic evidence for anancient rift beneath the Cumberland plateau, Tennessee: A detailed ana-lysis of broadband teleseismic P waveforms, J. Geophys. Res., 89, 7783–7795.
Park, J., and V. Levin (2000), Receiver functions from multiple-taper spec-tral correlation estimates, Bull. Seismol. Soc. Am., 90, 1507–1520.
Poppeliers, C., and G. Pavlis (2003), Three-dimensional, prestack, planewave migration of teleseismic P-to-S converted phases: 1. Theory,J. Geophys. Res., 108(B2), 2112, doi:10.1029/2001JB000216.
Reading, A., B. L. N. Kennett, and M. Sambridge (2003), Improved inver-sion for seismic structure using transformed, S-wave vector receiverfunctions: Removing the effect of the free surface, Geophys. Res. Lett.,30(19), 1981, doi:10.1029/2003GL018090.
Rudnick, R. L., and D. M. Fountain (1995), Nature and composition of thecontinental crust: A lower crustal perspective, Rev. Geophys., 33, 267–309.
B11308 NIU ET AL.: CRUSTAL STRUCTURE BENEATH VENEZUELA
14 of 15
B11308
Schmitz, M., D. Chalbaud, J. Castillo, and C. Izarra (2002), The crustalstructure of the Guayana Shield, Venezuela, from seismic refraction andgravity data, Tectonophysics, 345, 103–118.
Schmitz, M., A. Martins, C. Izarra, M. I. Jacome, J. Sanchez, andV. Rocabado (2005), The major features of the crustal structure in north-eastern Venezuela from deep wide-angle seismic observations and gravitymodelling, Tectonophysics, 399, 109–204.
Sheehan, A. F., P. M. Shearer, H. J. Gilbert, and K. G. Dueker (2000),Seismic migration processing of P–SV converted phases for mantle dis-continuity structure beneath the Snake River Plain, western United States,J. Geophys. Res., 105, 19,055–19,065.
Snelson, C. M., T. J. Henstock, G. R. Keller, K. C. Miller, and A. Levander(1998), Crustal and uppermost mantle structure along the Deep Probeseismic profile, Rocky Mountain Geology, 33, 181–198.
Suyehiro, K., N. Takahashi, Y. Ariie, Y. Yokoi, R. Hino, M. Shinohara,T. Kanazawa, N. Hirata, H. Tokuyama, and A. Taira (1996), Continentalcrust, crustal underplating, and Low-Q upper mantle beneath an oceanicisland arc, Science, 272, 390–392.
Taylor, S. R. (1967), The origin and growth of continents, Tectonophysics,4, 17–34.
Taylor, S. R., and S. M. McLennan (1985), The continental Crust: itsComposition and Evolution: An Examination of the Geochemical RecordPreserved in Sedimentary Rocks (GT), Blackwell Publishing Ltd, Oxford,UK.
Taylor, S. R., and A. R. White (1965), Geochemistry of andesites and thegrowth of continents, Nature, 208, 271–273.
VanDecar, J. C., R. M. Russo, D. E. James, W. B. Ambeh, and M. Franke(2003), Aseismic continuation of the Lesser Antilles slab beneath con-tinental South America, J. Geophys. Res., 108(B1), 2043, doi:10.1029/2001JB000884.
Van der Hilst, R. D., and P. Mann (1994), Tectonic implications of tomo-graphic images of subducted lithosphere beneath northwestern SouthAmerica, Geology, 22, 451–454.
Vinnik, L. P. (1977), Detection of waves converted from P to SV in themantle, Phys. Earth Planet. Inter., 15, 39–45.
Yilmaz, O. (2001), Seismic Data Analysis: Processing, Inversion and Inter-pretation of Seismic Data, Soc. of Explor. Geophys., Tulsa, OK.
Zandt, G., and C. J. Ammon (1995), Continental crust composition con-strained by measurement of crustal Poisson’s ratio, Nature, 374, 152–154.
Zhu, L., and H. Kanamori (2000), Moho depth variation in southern Cali-fornia from teleseismic receiver functions, J. Geophys. Res., 105, 2969–2980.
�����������������������M. Bezada, A. Levander, and F. Niu, Department of Earth Science, Rice
University, 6100 Main Street, Houston, TX 77005, USA. ([email protected])T. Bravo and G. Pavlis, Department of Geological Sciences, Indiana
University, USA.H. Rendon, FUNVISIS, El Llanito, Venezuela.F. Vernon, Scripps Institution of Oceanography, University of California,
USA.
B11308 NIU ET AL.: CRUSTAL STRUCTURE BENEATH VENEZUELA
15 of 15
B11308