CRITICAL PARAMETERS OF THE DELIVERY IN TEN PIN...
155
CRITICAL PARAMETERS OF THE DELIVERY IN TEN PIN BOWLING RIZAL MOHD RAZMAN THESIS SUBMITTED IN FULFILMENT OF THE REQUIREMENTS FOR THE DEGREE OF DOCTOR OF PHILOSOPHY FACULTY OF ENGINEERING UNIVERSITY OF MALAYA KUALA LUMPUR AUGUST 2013
Transcript of CRITICAL PARAMETERS OF THE DELIVERY IN TEN PIN...

CRITICAL PARAMETERS OF THE DELIVERY IN
TEN PIN BOWLING
RIZAL MOHD RAZMAN
THESIS SUBMITTED IN FULFILMENT
OF THE REQUIREMENTS
FOR THE DEGREE OF DOCTOR OF PHILOSOPHY
FACULTY OF ENGINEERING
UNIVERSITY OF MALAYA
KUALA LUMPUR
AUGUST 2013

ii
Original Literary Work Declaration
Name of Candidate: Rizal Mohd Razman
Registration/Matric No: KHA070026
Name of Degree: Doctor of Philosophy
Field of Study: Sports Biomechanics
Title of Thesis (“this Work”): Critical Parameters of the Delivery in Ten Pin Bowling
I do solemnly and sincerely declare that:
(1) I am the sole author/writer of this Work;
(2) This Work is original;
(3) Any use of any work in which copyright exists was done by way of fair dealing
and for permitted purposes and any excerpt or extract from, or reference to or
reproduction of any copyright work has been disclosed expressly and
sufficiently and the title of the Work and its authorship have been
acknowledged in this Work;
I. I do not have any actual knowledge nor do I ought reasonably to know that the
making of this work constitutes an infringement of any copyright work;
II. I hereby assign all and every rights in the copyright to this Work to the
University of Malaya (“UM”), who henceforth shall be owner of the copyright
in this Work and that any reproduction or use in any form or by any means
whatsoever is prohibited without the written consent of UM having been first
had and obtained;
III. I am fully aware that if in the course of making this Work I have infringed any
copyright whether intentionally or otherwise, I may be subject to legal action or
any other action as may be determined by UM.
Candidate’s Signature Date
Subscribed and solemnly declared before,
Witness’s Signature DateJadeera Cheong

iii
Abstract
This exploratory study examined the possible important parameters for high level bowlers in
three main areas - physical attribute, kinematics and movement variability. Consideration of
the 'critical' parameters was made by looking at the variables that best distinguished the elite
from the semi-elite bowlers using the discriminant function analysis. The study had an
applied perspective in terms of the applications of the results and findings. Elite and semi-
elite bowlers were grouped by their bowling score average (BSave), with participants scoring
200 pin falls and above assigned to the elite group. A total of 18 elite bowlers (M=10, F=8;
BSave 213.2±6.80), 12 semi-elite bowlers (M=7, F=5; BSave 181.3±9.36) and 33 sedentary
university students (M=14, F=19) representing the normal population were recruited.
Ten anthropometric measurements and seven strength tests were conducted but there were
no identifiable critical parameter of physical attributes for better bowlers as it was not
possible to successfully distinguish between elite and semi-elite bowlers. However,
differences were found when compared to the normal population, whereby the bowlers were
heavier, had longer limbs, had stronger forearm internal rotation and arm flexion.
A four-camera, 100 Hz, video-based 3D motion capture system was utilised for technique
analysis. A total of 43 discrete kinematic variables were gathered from the motion analysis,
out of which it was concluded that the two bowling groups had similar kinematic patterns
for the majority of segments, with the exception of the shoulder and elbow regions.
Discriminant analysis revealed that there were three critical kinematic variables, which
showed an estimated 76.7% success rate for cross-validated classification in distinguishing
the elite and semi-elite bowlers.
iv
From the discrete kinematic data, the within-subject inter-trial variability was also extracted
to compare movement consistency. Consequently, 41 absolute variability variables were
examined with a number of differences observed between the elite and semi-elite bowlers
especially at the base (foot region) and the wrist, both of which are the most distal segments.
The discriminant analysis highlighted four critical variability variables, with an estimated
76.7% success rate in distinguishing bowling playing level.
It was concluded that the critical parameters of delivery for good bowling performance were
faster shoulder velocity at front foot strike, faster elbow velocity at release, lower wrist
height at release, more consistent foot lateral position at front foot strike, more consistent
wrist lateral position at release, more varied foot slide distance, and more varied wrist
superior-inferior position at release.
Finally, as a consequence of the vast data gathered from this study, anthropometric and
strength normative data, as well as kinematics and absolute variability measures for high
level bowlers in Malaysia have been established and are readily available as a reference.

v
Abstrak
Penyelidikan awalan ini mengkaji parameter yang berkemungkinan penting bagi pemain
boling prestasi tinggi, di dalam tiga bidang utama – sifat fizikal, kinematik dan variabiliti
pergerakan. Pertimbangan untuk klasifikasi parameter ‘kritikal’ di buat berdasarkan
kebolehan pembolehubah tersebut membezakan pemain elit berbanding pemain semi-elit,
melalui hasil keputusan analisis fungsi pembezalayan. Penyelidikan ini mempunyai
perspektif gunaan dalam soal aplikasi keputusan dan penemuan. Pemain boling elit dan
semi-elit telah dipecahkan kepada dua kumpulan berdasarkan mata boling purata mereka
(BSave), dimana peserta yang mempunyai 200 jatuhan pin dan ke atas diuntukkan sebagai
golongan elit. Sejumlah 18 pemain boling elit (M=10, F=8; BSave 213.2±6.80), 12 pemain
boling semi-elit (M=7, F=5; BSave 181.3±9.36) dan 33 pelajar universiti sedentari (M=14,
F=19) mewakili populasi awam telah digunakan.
Sepuluh pengukuran anthropometrik dan tujuh ujian kekuatan telah dijalankan, tetapi tidak
ada parameter sifat fizikal kritikal yang dapat dikenal pasti kerana hasil analisis fungsi
pembezalayan tidak berjaya membezakan di antara pemain elit berbanding semi-elit.
Bagaimanapun, perbezaan telah dikenal pasti apabila dibanding dengan populasi awam, di
mana pemain-pemain boling di dapati lebih berat, mempunyai anggota badan yang lebih
panjang, mempunyai kekuatan putaran internal lengan dan kekuatan fleksi siku yang lebih.
Bagi analisis teknik, sebuah system empat kamera, 100 Hz, penangkap-gerakan 3D
berasaskan video telah digunakan. Sejumlah 43 pembolehubah kinematik diskrit telah
dikumpul dari analisis pergerakan, dimana dapat disimpulkan bahawa kedua-dua kumpulan
pemain mempunyai corak kinematik serupa bagi kebanyakkan anggota badan, dengan

vi
pengecualian bagi kawasana bahu dan siku. Analisis pembezalayan mendedahkan bahawa
terdapat tiga pembolehubah kinematik kritikal, yang menunjukkan anggaran 76.7% kadar
kejayaan bagi klasifikasi pengesahan-silang dalam membezakan pemain boling elit dan
semi-elit.
Daripada data kinematik diskrit pula, kebolehubahan antara-percubaan setiap peserta juga
diekstrak keluar untuk membandingkan ketekalan pergerakan. Sejumlah 41 pembolehubah
kebolehubahan mutlak telah diperiksa dan didapati terdapat beberapa perbezaan antara
pemain boling elit dan semi-elit terutama di kawasan tapak (bahagian kaki) dan pergelangan
tangan, yang mana kedua-duanya merupakan segmen paling distal. Analisis pembezalayan
menunjukkan empat pembolehubah kebolehubahan kritikal, dengan anggaran 76.7% kadar
kejayaan dalam membezakan tahap boling pemain.
Disimpulkan bahawa parameter kritikal untuk mencapai prestasi boling yang cemerlang
adalah kelajuan bahu lebih tinggi ketika kaki depan mendarat, kelajuan fleksi siku lebih
tinggi ketika melepaskan bola, kedudukan ketinggian pergelangan tangan lebih rendah
ketika melepaskan bola, kedudukan sisi kaki yang lebih konsisten ketika kaki depan
mendarat, kedudukan sisi pergelangan tangan yang lebih konsisten ketika melepaskan bola,
jarak lunjuran kaki lebih berbeza-beza, dan kedudukan atas-bawah pergelangan tangan
kedudukan sisi yang lebih berbeza.beza
Akhir kata, hasil daripada jumlah data luas yang didapati dari kajian ini, data normatif
anthropometrik dan kekuatan, beserta data kinematik dan kebolehubahan mutlak pemain
boling peringkat tinggi di Malaysia telah diwujudkan dan boleh diguna sebagai rujukan.

vii
Table of Contents
Original Literary Work Declaration……………………………………………….. ii
Abstract…………………………………………………………………………….. iii
Table of Contents…………………………………………………………………...vii
List of Tables………………………………………………………………………..x
List of Figures…………..…………………………………………………………..xi
List of Published Work Arising from this Thesis………………………………….. xiii
Chapter 1: Introduction
1.1 The Sport of Ten Pin Bowling………………………………………….3
1.2 Statement of the Problem……………………………………………….7
1.3 Objective………………………………………………………………..9
1.4 Organisation of the Thesis……………………………………………... 9
1.5 Significance of the Research……………………………………………10
1.6 Research Scope………………………………………………………… 11
1.7 Delimitations ……………………………………………………………16
1.8 Limitations………………………………………………………………17
1.9 Definition of Terms……………………………………………………...18
Chapter 2: Review of Literature
2.1 Anthropometry and Strength - Its Relationship to Performance………. 20
2.2 Kinematic Analysis of Throwing……………………………………….27
2.2.1 Segment Contribution and Sequentiality…………………….. 29
2.2.2 Kinematic Differences in Technique………………………… 30
2.3 Within-Subject Movement Variability in Sports………………………. 37
2.4 Statistical Methods for Determining Critical Parameters ………………43

viii
Chapter 3: Research Methodology
3.1 Physical Body Measurements Methods………………………………...46
3.1.1 Anthropometric Test Procedures…………………………….. 47
3.1.2 Isometric Arm Strength Procedures…………………………..51
3.2 Motion Analysis Methods………………………………………………53
3.3 Measuring Segment Contribution………………………….……….…..66
3.4 Statistical Analysis Methods……………………………………………66
Chapter 4: Results and Discussion
4.1 General Bowling Performance
4.1.1 Results………………………………………………………...69
4.1.2 Discussion…………………………………………………….69
4.2 Anthropometry and Strength
4.2.1 Results of Anthropometric Comparisons……………………..72
4.2.2 Results of Isometric Upper Limb Strength Comparisons…….72
4.2.3 Relationship to Bowling Average…………………………….73
4.2.4 Discriminant Analysis of Physical Attribute Variables………73
4.2.5 Anthropometry and Strength Discussion……………………..76
4.3 Kinematic Analysis
4.3.1 Kinematic Analysis Results………………………………….. 82
4.3.1.1 Movement Patterns………………………………………… 82
4.3.1.2 Kinematic Differences between Group……………………. 82
4.3.2 Discriminant Analysis of Kinematic Variables ………………94

ix
4.3.3 Kinematic Discussion
4.3.3.1 Male and Female Bowlers………………………………… 95
4.3.3.2 Kinematic Patterns……………………………….……….. 95
4.3.3.3 Critical Kinematic Parameters of the Delivery……............ 96
4.4 Within-Subject Inter Trial Movement Variability
4.4.1 Results of Variability Differences between Groups…………………. 99
4.4.2 Discriminant Analysis of Variability Variables……………………..101
4.4.3 Variability Discussion……………………………………………….102
4.5 Segment Contribution
4.5.1 Results …………………………………………………..…………..105
4.5.2 Contribution and Sequence towards Ball Release Velocity ……….. 106
4.5.2 Estimation of Upper Limb Joint Torques …………………………...111
Chapter 5: Conclusion and Implications
5.1 Conclusion……………………………………………………………..119
5.2 Implications……………………………………………………………120
5.3 Future Research Direction……………………………………..............122
References and Bibliography..…………………………..……………………………….. 124
Appendix 1: Preliminary Questionnaire for Coaches……………………………..............135
Appendix 2: Participant Background Information and Consent Form…………………....137
Appendix 3: Concurrent Validity and Test-retest Reliability of the Strength Tests……....138
Appendix 4: Body Segment Parameters from Data Gathered by Winter (2005)………….139
Appendix 5: Computational Methods for an Arm Model (Ariff & Rambely, 2009)……...140

x
List of Tables
Table 4.1: Descriptive bowling performance results………………………………………. 69
Table 4.2: Anthropometric and Normalised Isometric Upper Body Strength ……………..74
Table 4.3: Correlation Matrix between Measured Variables and Performance…………….75
Table 4.4: Discriminant function results for anthropometry and strength………………….75
Table 4.5: Means for kinematic and inter-trial variability variables of the foot slide……... 85
Table 4.6: Means for kinematic and inter-trial variability variables of the knee joint…….. 86
Table 4.7: Means for kinematic and inter-trial variability variables of the hip joint……….87
Table 4.8: Means for kinematic and inter-trial variability variables of the trunk…………..88
Table 4.9: Means for kinematic and inter-trial variability variables of the shoulder joint... 89
Table 4.10: Means for kinematic and inter-trial variability variables of the elbow joint….. 90
Table 4.11: Means for inter-trial variability variables of the wrist…………………………91
Table 4.12: Means for kinematic and inter-trial variability variables of ball height ……… 92
Table 4.13: Discriminant Function Results for Kinematic Variables……………………... 94
Table 4.14: Discriminant Function Results for Variability Variables……………………..102
Table 4.15: Means for percentage of segment contributions……………………………....107
Table 4.16: Normalised torques at the shoulder, elbow and wrist joints…………………. 107

xi
List of Figures
Figure 1.1: Bowling lane layout…………………………………………………………….4
Figure 1.2: Standard pin arrangement……………………………………………………... 5
Figure 1.3: Sequence of a bowling delivery……………………………………………….. 7
Figure 1.4: Possible biomechanical factors of the delivery in bowling…………………….14
Figure 1.5: Anthropometric and strength possible performance influence…………………15
Figure 1.6: Phases of interest of the delivery in bowling …………………………………. 16
Figure 3.1: Finger pinch, internal/external rotation and lower arm flexion test……………52
Figure 3.2: Self-fabricated timing generator………………………………………………..57
Figure 3.3: Basler cameras with self built IR lights and mounts…………………………...58
Figure 3.4: Calibration frame……………………………………………………………….60
Figure 3.5: Marker placement………………………………………………………………60
Figure 3.6: Hip joint centre (Tylkowski method)………………………………………….. 61
Figure 3.7: Camera placement at the bowling alley……………………………………….. 62
Figure 3.8: Key events – TBS, FFS and REL……………………………………………... 63
Figure 3.9: Variables for kinematic analysis………………………………………………. 65
Figure 3.10: Variables for variability analysis……………………………………………...66
Figure 4.1: Scatter plot of ball release velocity for various bowling averages……………..71
Figure 4.2: Angular kinematic patterns of the shoulder, elbow, hip and knee…………...... 83

xii
Figure 4.3: Angular velocity-time graph of the shoulder, elbow, hip and knee…………… 84
Figure 4.4: Scatter plot of release ball height for various bowling averages…………….... 98
Figure 4.5: Sequence of peak linear velocities of various segments for male bowlers …. 108
Figure 4.6: Sequence of peak linear velocities of various segments for female bowlers…109
Figure 4.7: Model of a planar three-link kinematic chain of the arm……………………. 112
Figure 4.8: Convention for sagittal plane flexion (+) and extension (-)…………………..114
Figure 4.9: Torque-time graphs of the shoulder, elbow and wrist ………………………..115

xiii
List of Published Work Arising from this Thesis
1. Razman, R., Cheong, J. P. G., Wan Abas, W. A. B., & Abu Osman, N. A. (2012).
Anthropometric and strength characteristics of ten pin bowlers with different playing
abilities. Biology of Sport, 29, 33-38. (ISI-Cited Publication)
2. A review of anthropometric and body type studies of athletes in Malaysia. (submitted
for review). Journal of Sports Science and Medicine.
3. Cheong, J. P. G., Lay, B. J., Grove, R., Medic, N., & Razman, R. (2012). Practicing
field hockey skills along the contextual interference continuum: A comparison of five
practice schedules. Journal of Sports Science and Medicine, 11, 304-311. (ISI-Cited
Publication)
4. Razman, R., Wan Abas, W. A. B., Abu Osman, N. A., & Cheong, J. P. G. (2011).
Temporal characteristics of the final delivery phase in ten pin bowling and its
relationship to performance. Proceedings of the 5th Kuala Lumpur International
Conferences on Biomedical Engineering, pp. 222-224. Kuala Lumpur, Malaysia.
5. Razman, R., Wan Abas, W. A. B., & Abu Osman. N.A. (2010). Front foot slide
variability and its relation to ten pin bowling performance. Proceedings of the 28th
International Conference on Biomechanics in Sports, pp. 19-23 Michigan, USA.
6. Razman, R., & Cheong, J.P.G. (2010) Ball height during backswing and its influence
on tenpin bowling performance. British Journal of Sports Medicine (Supplement), 44, 25.
7. Razman, R. & Cheong, J. P. G. (2010). Upper limb strength of Malaysian tenpin
bowlers: Relationship with bowling average and ball release velocity. Journal of Science
and Medicine in Sport (Supplement 1), 13, e82.

1
CHAPTER ONE:
INTRODUCTION

2
Chapter 1: Introduction
The game of bowling had its earliest inception near 3200 BC in Egypt. In Europe, there are
claims that it has been around in Germany since 300 BC and in England from the 1100’s.
The current form of bowling has its roots dating back the 16th century in the Netherlands.
Throughout those years, bowling was enjoyed as a recreational game with the occasional
competitive aspect fuelled by monetary bets. The first organised association established with
the intention to form structured competition was inaugurated in 1926 while the FIQ
(International Federation of Bowlers) was initiated as recently as 1952. From then on,
domestic and international competitions began to appear.
In 1961, bowling was introduced into Malaysia when the first bowling centre was set up in
Penang. Around 1965, the Malaysian Tenpin Bowling Congress (MTBC) was established.
In 1970, Malaysia had its first international success with an eight out of nine gold medal
haul at the Asian FIQ Championships in Hong Kong. Since then, Malaysia has had
tremendous success with medals at the World Championships, World Cup, Commonwealth
Games and Asian Games.
FIQ considers bowling a competitive technical sport. Although it may not be as physically
demanding on the human body as certain other competitive sports, its demand on technical
expertise and finesse is nearly second to none (Rypcinski, 2002). This is supported by the
fact that bowling is included in multi-sport games such as the Commonwealth and Asian
Games for many years now. Additionally, a majority of elite bowlers compete in a number a
professionally run leagues around the world, not to mention the many open tournaments that
offer generous amounts of prize money.

3
To underline the competitive nature of bowling and help its cause towards acceptance into
the Olympics, FIQ went to the extent of commissioning a study to differentiate between elite
and amateur bowlers (Johnson, 2002). Even though the results were only available on their
website and had a rather biased view (as it was a commissioned study), the study highlighted
the vast qualitative and quantitative difference in skill levels and execution between a good
bowler and an average one. It had hoped to pave the way for more specific research on ten
pin bowling skills. Prior to that, Thomas, Schlinker and Over (1996) had assessed
psychological and psychomotor skills of bowlers and concluded that there were significant
differences between skilled and less skilled bowlers.
1.1 The Sport of Ten Pin Bowling
Ten pin bowling is a sport in which a player (known as the "bowler") rolls a bowling ball
down a wooden or synthetic lane with the objective of knocking down as many pins as
possible. The 41.5-inch (1.05 m) wide, 60-foot (18.29 m) long lane is oiled (between 18 to
30 ml of oil) and has parallel ‘drains’ bordering along its length (known as gutters) to collect
balls that are bowled way off-target (Figure 1.1).
There is a "foul line" at the front end of the lane. If any part of a bowler's body touches the
lane side of this line after the ball is released, it is considered a "foul" and the preceding pin
knock downs are not tallied. Behind the line there is an area approximately 15-feet (4.57 m)
long used in the delivery approach to gain initial overall momentum before delivery. At the
front, 18.29 m from the foul line, is where the lane ends.
For competitive bowling, the ball is made of a completely solid material and its weight
distributed evenly. The circumference does not exceed 2.25 feet (0.686 m), while the weight

4
Figure 1.1: Bowling lane layout

5
does not exceed16 pounds (7.26 kg). It has a smooth surface over its entire circumference
except for holes or indentations used for gripping the ball, holes or indentations made to
bring the ball back into compliance with weight-distribution regulations, identification
letters and numbers, and general wear from normal use. The design and technology in
bowling evolved so dramatically over the past few years that the regulating bodies had to
draw out explicit rules which involve stringent test and certification procedures (FIQ, 2010)
that restrict certain characteristics of the ball such as the radius of gyration and hooking
potential.
Meanwhile, a pin is 15-inches (38.1 cm) tall and about 4.7-inches (11.4 cm) wide at the
"belly" of the pin, the point where a ball would make contact. The weight of a single pin is
at least 3 pounds, 4 ounces (1.47 kg) and no more than 3 pounds, 10 ounces (1.64 kg). There
are ten pins that are set into four rows which form an equilateral triangle with four pins on a
side, also known as a Tetractys shape. There are four pins in the back row, then three, then
two, and finally one in the front at the center of the lane (see Figure 1.2). For common terms
of reference, the pins are numbered one through ten, starting with one in front, and ending
with ten in the back to the right.
Figure 1.2: Standard pin arrangement

6
Each pin is set up 12 inches (30 cm) apart, measured from center to center. Due to the
spacing of the pins and the size of the ball which is about 8.6 inches or 22 cm in diameter, it
is impossible for the ball to contact every pin. Therefore, a precise measured shot is needed,
which would result in a calculated reaction of pin hitting pin.
A bowler is allowed ten tries (frames) in a game in which to knock down pins, with each
frame consisting of up to two deliveries. If the first ball rolled knocks down all ten pins (also
referred to as a ‘strike’), the frame is completed. However, when there are pins left standing
after the first ball, those that were knocked down are counted and removed. A second ball is
rolled and if the remaining pins are knocked down, the term "spare" is used. If all ten pins
were to fall with each first shot and also achieve strikes with each of the bonus balls in the
tenth frame, it would then be considered a "perfect game" of 300 – which is the ultimate aim
of every bowler. In a tournament, a competitive bowler will usually bowl six games a day
and depending on their progress, would compete for between three to five consecutive days.
Generally there are two primary styles of rolling the ball down the lane. New players often
play by rolling the ball straight, aiming for the 1-3 pocket for right-handed bowlers or the 1-
2 pocket for left-handed bowlers. It has been acknowledged that to get the ideal shot to get
the perfect strike, the ball will only touch pins 1, 3, 5 and 9 for a right-handed bowler with
the rest of the pins falling due to pin-to-pin interaction. For this ideal shot to occur, the ball
needs to enter the pocket at an angle of about 6 degrees from the first pin (from a line
parallel to the gutter). Unfortunately it means that a ball that is thrown straight will need to
be bowled from the next corresponding lane (explained in detail by Johnson, 1998), which is
nearly an impossible task.

7
Therefore, more experienced bowlers will use a more precise technique to target the
respective pockets. The ball path will be curved (hooked), whereby the ball starts out
straight, and then curves towards the pocket. To produce a hook, the player needs to let go
of the ball with a slightly different release technique and more wrist rotation. This will make
the ball rotate about its axis with the spin of the ball producing friction with the lane surface
and resulting in a curved path. The more the spin, the more ‘hooked’ the path will be.
The conventional bowling styles use either a 4 or 5-step approach beginning 8 to 16 feet
(2.44 to 4.88 m) behind the foul line. Generally, a bowler starts by grasping the ball with
two hands near the chest, and then they would initiate a backswing – termed as the
‘pushaway’. Whilst continuing to take forward steps, the ball is swung back up to a point
before being swung forward to generate forward momentum. Prior to releasing the ball, the
bowler will take the last step and initiate a slide that will end before the foul line. The ball is
then released at the end of the slide. Figure 1.3 illustrates the bowling action described
above.
Figure 1.3: Sequence of a bowling delivery

8
There are many different skill components in ten pin bowling and it can be looked at in
many different ways. The most common way of looking at it is to categorise the components
according to the phases of the bowling action (Strickland, 1996). The phases for the
components are listed in the following order:
Delivery – Stance, pushaway, back swing, forward swing, slide, ball release.
Ball Travel – Ball flight, ball roll/spin and the resulting ball path.
Ball to Pin Contact – First contact, resulting ball-to-pin and pin-to-pin interaction
1.2 Statement of the Problem
Published academic literature on ten pin bowling is surprisingly scarce for such a popular
sport. Even then, those that are available are either related only to psychological aspects
(Thomas, Schlinker, & Over, 1996), or physiological aspects (Tan, Aziz, & Teh, 2000; Tan,
Aziz, Teh, & Lee, 2001). In addition, there was some very early work on anthropometry and
strength in ten pin bowling (Greenlee, 1960; Sabol, 1963; Widule, 1967) but due to changes
in the way bowling is played now and the technological advancement in equipment and lane
construction as well as motion capture capability over the past 20 years, care must be taken
when interpreting their results. The only research done thus far in the area of bowling
technique and biomechanics has been the work commissioned by the FIQ (Johnson, 2002)
and the exploratory work of Chu, Zhang, and Mau (2002).
Due to the evident lack of literature in bowling techniques, deriving research questions from
previous research results was a tall order. Nonetheless, from the literature in other sports, it
is clear that there is a tremendous potential for investigations in the sport of ten pin bowling.

9
Given the minimal state of available literature, this thesis chose to have an exploratory
nature and formed its basis from the following ideas:
Firstly, it is universally understood that in many different types of sports, body dimensions
and strength have a significant role. Taller players in basketball and volleyball have an
automatic advantage in the respective sports. The stronger athlete will throw further in
events such as the shot put and hammer. Indeed, these straightforward examples may not
apply to bowling, but it is highly unlikely that body dimensions and strength variables have
no relation at all to bowling performance. Thus, recognising if body dimensions or strength
variables (or both) are of importance in ten pin bowling, is critical. More specifically, there
is a need to identify if there are differences between bowlers of different levels, and between
bowlers and non-bowlers. These differences (if they exist), is important for identifying
potential bowlers.
Secondly, quantifying bowling performance is rather straightforward, as one would just need
to keep and compare the scores. The logical assumption is that bowlers with a better
delivery will get the higher score. But this does not provide the whole picture as the delivery
itself is a complex sequence of events that can be further broken down into smaller distinct
phases. It involves a multitude of variables such as arm swing velocity, and trunk and wrist
position in space, therefore it is of great interest to look at how these variables relate to
factors such as the ball release speed, and ultimately, to the average score.
Finally, in order to be successful in a competitive environment, bowlers not only need to be
able to knock down many pins, they must be able to do it under huge amounts of pressure
with changing environment and playing surface conditions. Above all else, to be an

10
exceptional bowler, they have to perform the above mentioned tasks well in many frames of
games, in many tournaments, over a period of many months and years, while remaining
extremely consistent. Accordingly, the movement variability aspect in relation to playing
level is also investigated.
1.3 Objective
The purpose of this study was to determine the critical parameters in ten pin bowling
delivery that is important for a good bowling performance. More specifically, this
exploratory study was designed to differentiate bowlers by attempting to:
identify anthropometric and strength attributes that are specific to certain bowlers
identify kinematic variables that differ between different level bowlers
identify variability of movement patterns that exists between different level bowlers
1.4 Organisation of the Thesis
A comprehensive literature review about the discussed parameters is provided in Chapter
two. It commences with the examination of the effect and relationship of anthropometry and
strength characteristics to performance and is followed by an analysis about the kinematics
of throwing. A discussion about movement variability in relation to sports performance is
also provided. The literature review chapter concludes with a review of statistical methods
used in determining critical parameters of sports performance.
Following the literature review chapter, the methodology section is presented in Chapter
three. It details the meticulous work involved in the preparation of the motion analysis
equipment, which was mostly assembled from scratch under limited budget conditions.

11
Subsequently, in Chapter four, the results of the studies that form the basis of this thesis are
presented followed by a relevant in-depth discussion. Finally, a summary of findings are
provided in Chapter five. Practical application and recommendations for future research are
also presented in this final chapter.
1.5 Significance of Research
The sport of bowling deserves much more attention within the academic research circles as
it is a competitive sport that has been accepted into multi-sport games and is played by
millions across the globe, either competitively or otherwise.
Being competitive necessitates the need to stay ahead of others. Coaches perpetually strive
to find means and ways to adjust and modify a bowlers’ technique so that their athletes have
the slight edge over other competitors. A study that highlights the technique patterns of a
good delivery and identifies the major contributors of a good performance should prove to
be invaluable to coaches. Knowledge gathered here will help coaches and athletes alike in
restructuring the way training is organised especially in relation to younger players, where
motor skill is at the developmental stages (Haywood & Getchell, 2009). It can help change
the way bowling is taught and possibly modify certain aspects of the techniques involved, as
well as increase the understanding of the common bowling pattern.
The study will also highlight the role of consistency in bowling performance. Coaches and
bowlers will have a deeper understanding of its importance in bowling delivery, and
knowledge about the areas of the delivery technique that show significant variability
differences between good and average bowlers.

12
Furthermore, by recognising the patterns of delivery and body dimensions most related to
good bowling performance, coaches will be able to have a more definitive criterion in
selecting potential talents. It has been shown that, even on its own, anthropometrical
parameters have a decent relationship to sporting performance (Norton & Olds, 2006),
although it is acknowledged that the relationships are not necessarily causal. It is the same
for motion analysis, with a number of studies finding links between kinematic and kinetic
variables to sports performance (Lees, 2002). A multi-dimensional study that takes into
account physical body dimensions as well as movement analysis will be able to provide
copious amount of information to identify potential talents.
Finally, with the establishment of normative kinematic, anthropometric and strength data,
future research will be able to have a reference point.
1.6 Research Scope
There are numerous factors that influence bowling performance in ten pin bowling. The
scope and variables measured for this study was determined in part from the feedback of the
state and national coaches (see Appendix 1).The bowling process can essentially be divided
into two parts: the ‘delivery’ in which the bowler has full control of the ball and the ‘post
release’ in which the bowler has absolutely no control over. The interaction between lane
condition and ball is a good example of a ‘post release’ factor that can have a huge impact
on score performance (Benson, 2000). This study concentrates only on the delivery part of
the bowling process. A majority of the components in the delivery is within the athlete’s
control, hence why bowling is commonly referred to as a closed skill sport (Schmidt &
Wrisberg, 2008).

13
Naturally, all bowlers would want to achieve strikes in all their first ball throws. For this to
materialise, firstly, there must be plenty of pin-to-pin and ball-to-pin interaction. For greater
interaction, ball momentum plays a significant role. This has resulted in the modern game
tactics, commonly being referred to as the ‘power game’, in which more and more bowlers
are using heavy balls and releasing with greater velocity (Benson, 2000). The source and
technique in the so called power aspect of the game is of great interest in this study.
Secondly, the initiating point (first ball-to-pin contact) has to be precise and repeatable (at
the pocket between the 1st and 3rd pin) so that a more predictable pin-to-pin reaction occurs.
In terms of precision, the ball has to follow a curved path so as to be able to reach the
targeted pocket. To get to the curved path, the ball has to be spun about its own axis when
released from the hand. The aspect of ball spin and the process of generating spin to induce
hook is not covered in this particular research.
Meanwhile the aspect of repeatability (which is a function of movement variability) has
been widely looked into in many sports (Bartlett, 2008) and bowling being a closed skill
sport, should have interesting relationships to movement consistency. Therefore, the
consistency during the delivery and release is a major point of the study.
The objective of the bowler then, is to manipulate the components of the delivery so as to
deliver the ball in such a way that it is able to achieve both the above goals. As with most
sports skills, the delivery factors affecting bowler’s capability to produce strikes could be
also generally categorised as biomechanical, physiological and psychological in nature. The
biomechanical factors can be reduced to a deterministic model as advocated by Hay and
Reid (1982).
14
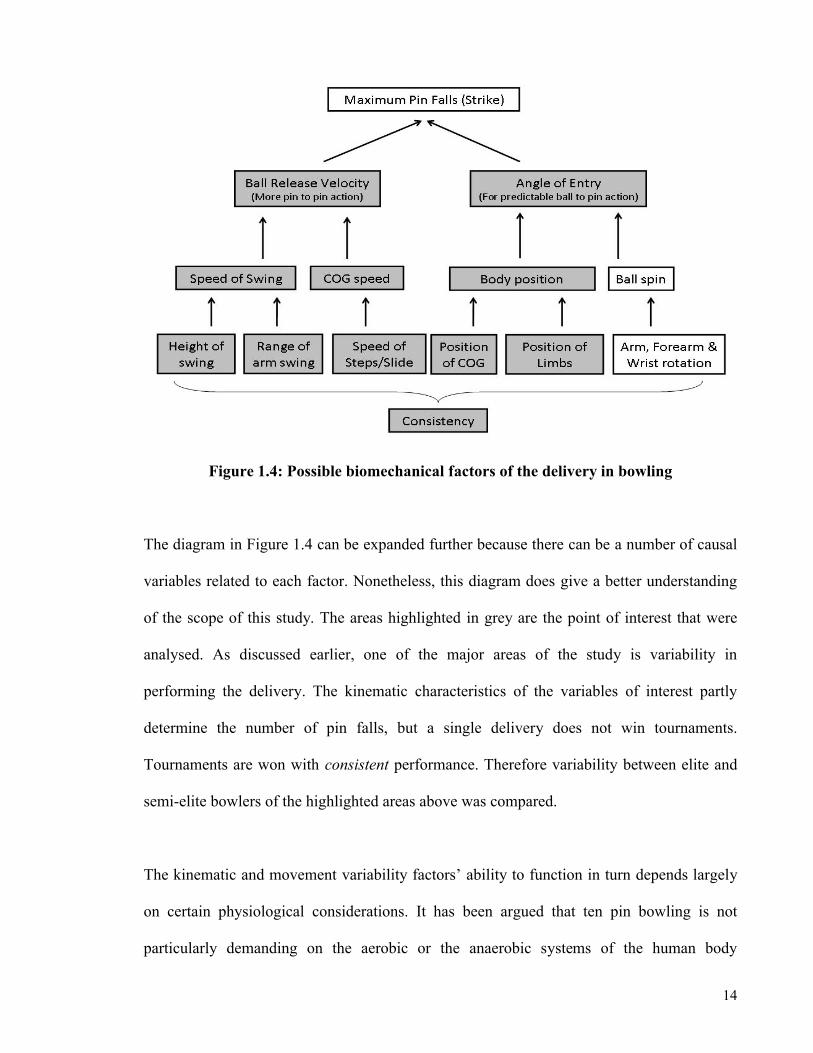
Figure 1.4: Possible biomechanical factors of the delivery in bowling
The diagram in Figure 1.4 can be expanded further because there can be a number of causal
variables related to each factor. Nonetheless, this diagram does give a better understanding
of the scope of this study. The areas highlighted in grey are the point of interest that were
analysed. As discussed earlier, one of the major areas of the study is variability in
performing the delivery. The kinematic characteristics of the variables of interest partly
determine the number of pin falls, but a single delivery does not win tournaments.
Tournaments are won with consistent performance. Therefore variability between elite and
semi-elite bowlers of the highlighted areas above was compared.
The kinematic and movement variability factors’ ability to function in turn depends largely
on certain physiological considerations. It has been argued that ten pin bowling is not
particularly demanding on the aerobic or the anaerobic systems of the human body

15
(Rypcinski, 2000). Even though earlier research hardly found relationships between
physiological or body dimensions to bowling performance, Tan et al., (2001) still suggested
further investigations in this area, as common sense and logic still pointed towards possible
connections. For example, swinging a 7 kg ball needs strength and doing it repeatedly will
most definitely need muscle endurance. Therefore, the study also looked at how
anthropometric and strength attributes could distinguish playing level. Diagram in Figure 1.4
can then be expanded (see Figure 1.5).
Figure 1.5: Anthropometric and strength possible performance influence
The delivery sequence in ten pin bowling involves many phases, and for each phase there
could be a large variation between bowlers, for example, some might prefer a 4-step
approach while most would use the 5-step approach. The analysis of critical parameters
discussed earlier for this study is focused only on the last step, the slide and the final

16
position. While in terms of the arm swing, the phases of interest will only be from the top of
the back swing through to the ball release as illustrated in the highlighted area of Figure 1.6.
Figure 1.6: Phases of interest of the delivery in bowling
17
1.7 Delimitations
In terms of technique analysis, this study is delimited to just the final phases of the delivery
action. It does not include any actions post ball release. It also only incorporates the first ball
deliveries, the outcome therefore should not be generalised for delivery of spares. Rotations
along the long axis of the arms and the corresponding ball spinning action were not
measured – conclusions would have to bear the lack of ball spin effect on precision. The
bowling population is delimited to bowlers in Malaysia with an average bowling score of
between 170 to 215 pin falls per game with video recording done under controlled non-
competition based environment.
1.8 Limitations
The major assumption of this study is that the bowlers with higher average scores (averaged
over the closest three tournaments to the data collection dates) have better delivery
techniques. The term ‘better’ constitutes technique and consistency. Considering the low
number of trials as compared to a fully fledged tournament, it is also assumed that the lane
conditions prior to the foul line stayed the same throughout the testing period. In terms of
measures, the static (isometric) strength test was used instead of one repetition maximum
(1RM) dynamic strength tests as the participants were in the competitive season. Due to
logistical constrains anthropometric measures were limited to skeletal length and do not
include measurement of circumference and skinfold. Finally, common with most motion
analysis research, the presence of emotional and psychological factors arising from the
knowledge that the movement will be recorded on video and the use of body suit and
markers cannot be overcome completely.

18
1.9 Definition of Terms
Entry Angle: The angle the ball takes when going into the 1-3 pocket (or 1-2).
Approach: Part of the lane from the back of the ball return area to the foul line.
Arm swing: The arc of the bowling arm during delivery.
Bowling shoe: Special shoes for bowlers have a sticky, rubbery sole on the non-
sliding foot and harder sole on the other foot to allow slide.
Carry: Ability of the ball to knock down the pins (as in "carry more pins").
Delivery: Includes the preparation up to ball release.
Foul: Touching or going beyond the foul line at delivery.
Foul line: The mark that determines the beginning of the actual bowling lane.
Gutter: Depression approximately 9.5 inches wide to the right and the left of the
lane to guide the ball to the pit should it leave the playing surface.
Lane: Playing surface. Wooden or urethane deck pins placed 60 feet from the
foul line. Gutters are not part of the lane (see Figure 1.6)
Perfect game: Twelve strikes in a row resulting in a perfect score of 300.
Pocket: The 1-3 pin for right-handers and 1-2 for left handers.
Spare: All pins knocked down with two deliveries.
Strike: All ten pins knocked down on the first delivery.
TBS: Top of Backswing – the maximum point of the backward swing; prior to
the start of the forward arm swing
FFS: Front Foot Strike – the point at which the leading foot first makes contact
to the lane; prior to the foot slide.
REL: Release – the point of which the ball separates from the bowlers hand.
TOF: Top of Follow-through – the maximum point of the arm swing after
releasing the ball.

19
CHAPTER TWO:
REVIEW OF LITERATURE

20
Chapter 2: Review of Literature
It has to be noted here, that studies specifically about ten pin bowling are extremely limited.
As such, the following review includes literature that mostly revolves around other throwing
related events or events with a throwing-like motion.
2.1 Anthropometry and Strength - its Relationship to Performance
Optimal performance in sports is the result of an intricate blend of anthropometric,
physiological, biomechanical and psychological factors. Scientific procedures are useful to
identify those attributes, and the level of contribution of those attributes that are essential for
successful performance. Once identified, these attributes may also be used for talent
identification and to develop more specific assessments. Furthermore, it may assist the
coach or sport scientist to construct a training program that develops all of the essential
attributes to the levels required for success.
Interest in anthropometric characteristics and physical characteristics of sportsmen from
different competitive sports has increased tremendously over the past few years. It has been
established that specific physical characteristics or anthropometric profiles indicate whether
the player would be suitable for the competition at the highest level in a specific sport
(Claessens, Lefevre, Beunen, & Malina, 1999; Reilly, Bangsbo, & Franks, 2000)
The relationship between body build and general physical performance has been
investigated in-depth by many researches over the past years, with most indicating
significant relationships between certain anthropometric parameters and general physical
performance (Ross & Marfell-Jones, 1991). To exemplify this, Fuster, Jerez, and Ortega

21
(1998), in a study with 303 participants found that vertical jump performance was related to
length of a number of body segments of females and males, while body mass was correlated
with performance in static strength tests. Subsequently, Visnapuu and Jurimae (2007)
examined basketball and handball players and found that measured finger length and hand
perimeters correlated significantly to hand grip strength.
On the other hand, there are a minority who do not support the notion that relationships
exists between body build and physical performance. For example, in a study involving
recreational athletes who were tested on vertical jump performance, Davis et al., (2006)
concluded that although there were minor relationships between segment length and vertical
jump performance, skeletal length measurements were opinioned as having no predictive
value on performance. However, the consensus though, appears that anthropometric
dimensions and morphological characteristics play an important role in determining the
success of an athlete (Wilmore & Costill, 1999; Keogh, 1999).
The possible causal link between physical characteristics and specific sports performance is
not as straightforward as there is an array of various different types of sports, and within
each sport there are a multitude of performance variables. The research resources are spread
thin with some sports such as soccer, athletics, aquatics/water sports, American football and
volleyball having established relationships, while other sports such as ten pin bowling, there
are practically not even any known anthropometric database to speak of.
Over the years a number of studies on anthropometric and strength characteristics have
successfully managed to discriminate between good and average athletes in a range of
diverse sports including rugby union (Rigg & Reilly, 1988), rugby league (Gabbett, 2002),

22
soccer (Hoare & Warr, 2000), and Australian football (Keogh, 1999). Thissen-Milder and
Mayhew (1991) demonstrated that selected physiological and anthropometric characteristics
could successfully discriminate among freshman, junior varsity, and varsity volleyball
players, and between starting and non-starting players. In a more recent study, Gabbett and
Georgieff (2007) reported significant differences among junior national, state, and novice
volleyball players for stature, standing reach stature, skinfold thickness and vertical jump. In
addition, Fry and Kraemer (1991) concluded that power clean, bench press and vertical jump
height were good discriminators between division of play and playing ability in American
football players.
In relation to aquatic sports, water polo studies have shown that the diameter of the femur
and the biacromial were correlated positively and significantly with goal shooting velocity
(Vila, Ferragut, Argudo, Abraldes, Rodriguez, & Alacid, 2009; Van der Wende, 2005).
Furthermore, Feltner and Taylor (1997) discovered that chest, upper body, and forearm
circumference measures may be causal determinant in the choice of technique style in
throwing the ball. More interestingly, Tan, Polglaze, Dawson, and Cox (2009) found that
they were able to statistically discriminate water polo player position within a particular
team by analysing the anthropometric and strength data alone.
A throwing sport that has garnered a lot of spectator as well as research interest because of
its explosive exciting nature is cricket fast bowling. Mechanically, it is known that a longer
radius is advantageous in generating higher rotational velocity, and this has been shown to
be true in cricket whereby longer arm segments was significantly related to higher ball
velocities (Glazier, Paradisis, & Cooper, 2000). Correspondingly, chest girth was also
related to higher ball velocities (Portus, Sinclair, Burke, Moore, & Farhart, 2000) whereby

23
other than being an indication of bigger upper body muscles, chest girth could also alter the
pivot point of the upper body rotating parameter. Apparently the relationship is very much
dependent on the playing level – only senior bowlers with more established techniques had
their ball velocities affected by arm length (Pyne, Duthie, Saunders, Petersen, & Portus,
2006). The latter example possibly points out that segment length, although theoretically
should have an effect of performance, seem only significant once the athletes movement
patterns are well developed.
In another predominantly overhand throwing sport, Marques, Van den Tillaar, Vescovi, and
Gonzales-Badillo (2007) looked at strength variables in relation to handball throwing
performance and found that absolute bench press strength was correlated to ball velocity.
Even for static strength, Van den Tillaar and Ettema (2004b) demonstrated that isometric
strength positively related to higher throwing velocity in experienced male and female
handball players.
Meanwhile, for underarm throwing pattern, the movements which are most similar to ten pin
bowling would be the windmill softball pitch and the release in lawn bowl. Neither of the
two had any known available data on physical body parameters in relation to performance.
Alternatively, looking at underarm type motion in golf, Keogh, Marnewick, Maulder,
Nortje, Hume, and Bradshaw (2009) reported that better golfers were stronger in golf
specific strength compared to lower level golfers and that higher golf-specific strength test
scores were also correlated significantly to higher club head velocities. This relationship is
evident too in baseball batting whereby a strong correlation between muscle strength and
hitting success existed (Gebhardt, Bowers, & Archer, 1991).

24
The discussions above had led to the belief that there was a decent link between physical
characteristics and specific sports performance. Consequently, it is safe to assume that it is
also therefore possible to utilise this knowledge for identifying new talents. The assessment
of the physical characteristics of successful competitors can provide further information
regarding the prerequisites of sporting success. The measurement of body dimensions can
provide an appraisal of the structural status of an athlete and therefore may be used to
describe the 'typical' athlete that succeeds within a certain sport (Ross & Marfell-Jones,
1991). A range of relevant anthropometric and physiological factors can be considered in
talent scouting which are subject to strong genetic influences (e.g. stature) or are largely
environmentally determined and susceptible to training effects (Reilly et al., 2000).
Based on comparison between youth athletes and their peers, Zhang, Chen, Zhang, Li, and
Zhou (2009) recommended that the typical anthropometric indices that should be considered
in recruitment for women volleyball players include body mass, stature, sitting height,
subscapular skinfold, ankle girth, forearm girth, biacromial breadth, and Achilles’ tendon
length. In elite youth handball, players were heavier and had greater muscle circumferences
than their non-athletic peers (Mohamed et al, 2009), while Reilly, Bangsbo, and Franks
(2000) concluded that anthropometric and physiological criteria do have a role as part of a
holistic monitoring of talented young soccer players. This was corroborated by Wong,
Chamari, Dellal, and Wisloff (2009) by providing a scientific rationale behind the coaches’
practice of selecting young soccer players according to their anthropometry for short-term
benefits, such as heavier players for higher ball shooting speed and 30 m sprint ability.
However the authors also noted that such a practice was not justified in the long-term
process of player development as although the distinctions are evident in adult and elite

25
youth players, their existence must be interpreted carefully in talent identification and
development programs.
Moving on specifically to bowling, over the years the sport has attracted various types of
participants, both large and small. It is argued to be a sport for all (Cheah, 2009; Wiedman,
2006) and has also been labeled a gender neutral sport (Thomas, Schlinker, & Over, 1996),
as it involves a seemingly low reliance on absolute strength, power and fitness (Tan et al.,,
2000). Consequently, it is relatively common to have women’s scores equaling or even
exceeding the men’s.
Currently, it is estimated that there are approximately 100 million bowlers worldwide, with
about 10 million participating competitively (FIQ, 2010). Yet, research in ten pin bowling is
surprisingly scarce (Tan et al., 2000). Even more lacking are studies related to physical and
physiological parameters, with a handful of older unpublished theses (Curtis, 1951;
Greenlee, 1960; Sabol, 1963; Widule, 1967)] and only two recently published work (Tan et
al., 2000; Tan et al., 2001). These studies are in a disagreement over the relationship
between strength and anthropometric variables with bowling performance. Some studies had
found significant relationships (Curtis, 1951; Sabol, 1963), while others had not (Greenlee,
1960; Widule, 1967and Tan et al., 2001).
In two of only a few available published works on bowling, Tan and colleagues (2000;
2001) concluded that bowlers of relatively diverse age and build can be equally competitive
in the sport of ten pin bowling. The authors did not find any strong relationship between grip
strength, lower body strength and flexibility to bowling performance, and summarised that
on the whole, the common physiological measurements do not adequately predict

26
performance in the sport of ten pin bowling at the elite level. The authors went further to
suggest that other factors such as mental skills and technique were more likely to have a
greater contribution to bowling success. Although no significant relationships was
established, it was suggested that there might be a threshold for strength with regards to
bowling successfully, after which further strength gains do not necessitate better
performance.
Considering the small number of empirical research conducted to date, there is a need to
further explore the influence of strength and anthropometric variables on bowling
performance and identify how bowlers of different playing abilities differ in terms of these
variables. There is also no known study that has tried to discriminate bowlers of different
playing abilities by utilising anthropometric and strength attributes.
The choice of physical characteristics tests and measurements used in previous studies was
varied. Measurement of anthropometric and body dimensions were widely used, with
measurements such as height, weight, segment length and breadth taken in many studies
(e.g. Barker et al, 1993; Barett & Manning, 2004; Gabbett & Georgieff, 2007, Reilly et al.,
2000; Thissen-Milder & Mayhew,1991) but the choice of strength tests was not so obvious.
Strength is one of the more commonly conducted tests in sports and has been used to
discriminate different level athletes (Barker et al., 1993) as well as to track training progress.
Although dynamic sports specific maximal strength test (e.g. 1RM) would be the ideal
strength gauge, its use for in-competition bowlers as the case in this current study, was risky.
Alternately, isometric strength tests have been shown to have high correlations with
dynamic strength tests (Baker, Wilson, & Carlyon, 1994; McGuigan & Winchester, 2008) as
well as showing correlations with real-world throwing performance (Van den Tillaar &

27
Ettema, 2004b). The use of isometric tests has come into question only when looking at
training adaptations in experimental conditions over a period of dynamic movement training
(Baker, Wilson & Carlyon, 1994), but its use in cross-sectional, group-comparison type
studies seem to be acceptable.
Among the variables measured in Tan and colleagues (2000) study on the relationship
between bowling performance to physiological and physical characteristics of bowlers
included height, weight, grip strength and lower body strength. Due the limited literature in
ten pin bowling, the final choice of test battery used in this current study was made after
discussions with the national team coaches (Cheah, 2009) pertaining to the available tests
and measurements that were possibly related to bowling performance.
2.2 Kinematic Analysis of Throwing
Throwing is a one of the many natural movement patterns in humans. Just as walking and
jumping, it is a basic motor function that is used for daily living. A person’s throwing
pattern is acquired through the normal motor development process, which tends to happen at
the early ages of human growth (Marques-Bruna & Grimshaw, 1997). Throws can be
subdivided mechanically into three distinct phases - preparation, action, and recovery, with
the base of support in the direction of the force being applied. The patterns can also be
generalised into three groups, that is, the side arm, overarm and underarm. Throws are done
in either one of these styles or possibly a combination of two. Atwater (1979) was the first to
distinguish between the overarm and sidearm throwing patterns in terms of the direction in
which the trunk is laterally flexed. When lateral flexion occurred away from the throwing
arm, and overarm pattern was used, while lateral flexion toward the throwing arm indicated
a sidearm pattern. The underarm pattern is distinguished by motion predominantly in the

28
sagittal plane. Broer (1969) was the first to highlight the similarity of these movement
patterns used in seemingly dissimilar activities such as the overarm pattern seen in the fast
bowl in cricket, the badminton smash, and the volleyball spike.
It is possible to distinguish throwing-like motions for distance, in which segments rotate
sequentially, and pushing-like motions for accuracy, in which segmental rotations occur
more simultaneously. Sequential movement of the body segments results in the production
of a summated velocity at the end of the chain of segments used. Sequential segmental
motions are most frequently used to produce fast velocities in external objects. Depending
on the objective of the skill (i.e. speed for distance, accuracy, or a
combination), modifications in the sequential pattern may be involved, larger or smaller
ranges of motion might be used, and longer or shorter lever lengths may be chosen.
However, few throws in sport have no accuracy requirements. In some throws, the objective
is not to achieve maximal distance but rather accuracy or minimal time in the air (such as
throwing back to the wicketkeeper in cricket). In such throws, the release speed, height and
angle need to be such that the flight time is minimised within the accuracy and distance
constraints of the throw (Bartlett, 2008). In accuracy-dominated events, such as dart
throwing, the athlete needs to achieve accuracy within the distance constraints of the skill.
The interaction of speed and accuracy in these skills is often expressed as the speed-
accuracy trade-off (Bartlett, 2008).
Ten pin bowling falls under the underarm throwing pattern but the objective of the ‘throw’ is
rather unique. Unlike darts, ten pin bowling is not predominantly accuracy orientated. In
modern bowling, the emphasis is on the power game (Weidman, 2006). On one hand,
bowlers need to target the pocket of pins 1 and 3 (right handed bowlers) but at the same time
29
the ball needs to have enough momentum to knock down the rest of the pins through pin-to-
pin interaction (carry). To have high momentum, the ball mass in ten pin bowling is higher
than any other ball sports. Compounding matters, to have any chance of hitting the specified
pocket, the ball needs to be excessively spun to produce a hooked trajectory, as a straight
ball will need to be delivered from the next corresponding lane to have chance at hitting the
target. These unique demands make ten pin bowling unlike any other throwing sports.
2.2.1 Segment Contribution and Sequentiality
Early work in the analysis of segment contribution was done primarily with joint
immobilisation (Miller, 1980). Although the methods are crude and has near zero ecological
validity, it did provide the base understanding of how humans perform throwing motor
tasks. The typical finding was that the distal segments had higher speeds than proximal ones
(Atwater, 1979). With the advancement of motion analysis technology, segment contribution
analysis in sporting movements has been more precise with higher ecological validity.
Quantifications of segments’ landmark linear velocities in primarily speed objective
overarm and sidearm throws have demonstrated a characteristic sequence pattern of
proximal to distal increases in segment velocities in water polo penalty throws (Elliott &
Armour, 1988), javelin throws (Whiting, Gregor, & Halushka, 1991), baseball pitches
(Elliott, Grove, Gibson, & Thurston, 1986), tennis serves (Elliott, Marsh, & Blanksby 1986),
tennis forehand drives (Elliott, Marsh, & Overheu, 1989) and basketball free throw (Hayes,
1988). It seems that the segment contribution pattern and proximal-to-distal sequence are
present for both genders of the same skill level, as demonstrated by Mero, Komi, Korjus,
Navarro, and Gregor (1994) in their work with javelin athletes.

30
By looking at segment contribution, researchers have made many conclusive statements that
have contributed immensely to the knowledge base of the particular sport in terms of
performance enhancement, training specificity and injury risk management. For example, it
is now known that in baseball (and most other overarm throwing patterns), the biggest
contributors towards ball velocity are elbow extension and internal rotation of the shoulder
(Van den Tillaar & Ettema, 2004a). Studies in tennis also concurred, that a majority of the
racket head velocity in the tennis serve is attributed to internal rotation, elbow extension as
well as wrist flexion (Gordon & Dapena, 2006).
More interestingly, in softball windmill pitching (an underarm pattern much like in ten pin
bowling) there is also evidence of proximal-to-distal sequence. Alexander and Haddow
(1982) concluded that there was a definite proximal-to-distal sequence of the softball
pitching motion, with decelerations occurring in the proximal segments prior to release of
the ball. Oliver, Dwelly and Kwon (2010) agreed that there was evidence of sequentiality
among the arm segments, but only in the intermediate and advanced softball pitchers. In
terms of segment contribution, the novice athletes tended to rely more on the upper arm and
forearm. The authors summed that emphasis should not be placed on the shoulder alone, but
training and conditioning methods should focus on the entire kinetic chain including the
torso and the full arm segment in an attempt to attain the highest velocity in the windmill
softball pitch.
2.2.2 Kinematic Differences in Technique
Since the the introduction of the direct linear transformation (DLT) method by Abdel-Aziz
and Karara (1971) and the inception of video technology which replaced the cumbersome
film, 3D motion analysis has developed by leaps and bound. Comprehensive kinematic
31
description of the baseball pitching motion, for example, was done using 3D motion analysis
as early on as 1986 by Feltner and Dapena. Further research extending from the kinematic
descriptive studies were on segment contribution of various sports skills, which are since not
uncommon. Kinematic analysis and joint contribution has been investigated in a range of
diverse fields including cricket (Portus et al., 2000; Glazier, Paradisis, & Cooper, 2000),
javelin (Mero et al., 1994), tennis (Gordon & Dapena, 2006; Elliott et al., 1989) and baseball
(Matsuo, Escamilla, Fleisig, Barrentine, & Andrews, 2001; Fleisig, Barrentine, Zheng,
Escamilla, & Andrews, 1999).
From the earlier work of kinematic description of sports technique, biomechanists have
more recently looked at identifying the best techniques for specific motor tasks. The ‘ideal’
performance is derived by comparing elite to the non-elite athletes or through statistical
prediction such as multiple regression analyses or through computer aided modeling. In
relation to this, there are also a number of studies that compared differences between men
and women’s technique.
The sport that has received one of the widest coverage is the throwing events in athletics.
The early 2D work of Gregor, Whiting, and McCoy (1985) in discus, suggested that there
were little difference between men and women regarding the angle and velocity of release
but larger differences were observed in foot position at release and height of release between
men and women. Years later, more in depth 3D analysis by Leigh and Yu (2007) concluded
that the relationships between technical parameters and discus throwing performance are
generally different for males and females. Their results suggest that elite female discus
throwers are reliant on effective technique to achieve long distances, whereas male discus
32
throwers have a relatively homogeneous technique, and a dependence on physical strength
to achieve their long throws.
Similarly, Alexander, Lindner, and Whalen (1996) found gender differences for technique
parameters in shot put. The authors reported quantifiable predictors of performance in both
males and females and that the predictors were differentiated by the sex of the athlete. For
the male throwers, centre of mass speed during glide, vertical acceleration of centre of mass
during delivery, and trunk angle at the start of glide were the most important parameters to
produce longer throws. On the other hand, the critical parameters for female throwers
included knee extension during the glide, elbow speed during delivery, and a greater
shoulder flexion angle at release. Another study on elite female shot putters highlighted
other critical parameters for success, that is, knee flexion angle at both rear foot touchdown
and release along with a neutral shoulder-hip angle at release (Young & Li, 2002).
Gender differences were also observed in javelin, whereby LeBlanc and Mooney (2004)
stated that men and women had significantly different trunk and implement angles at various
points during run up to release. The difference in trunk and consequently javelin angles were
said to possibly contribute to the huge disparity of around 70% difference between the
distances thrown. Looking at male athletes of different levels, Bartlett, Stockill, Elliot, and
Burnett (1996) did not find differences in javelin angles but instead concluded that better
performance was dependent mostly on release speed. Release speed in turn was dependent
on peak velocities of the body and upper limb segments as well as timing sequence of the
lower limbs. Relationships between segment peak velocity and performance was also found
in shot put (Alexander et al., 1996). The reliance on velocity (and hence, strength and

33
power) was in agreement with Whiting et al., (1991) as well as Leigh and Bing Yu’s (2007)
work on discus and Young and Li’s (2002) work on shot put.
All three field events discussed above are speed outcome oriented, as the objective was to
get maximal distance, hence the logical positive relationship between performances and
segment velocities. There were a number of discrete variables at specified phases that were
good predictors of performance. In general, it can be agreed that there were significant
differences between genders in the techniques used to achieve the same speed outcome
goals.
In a landmark study involving youth, high school, college, and professional baseball pitchers
performing a speed and accuracy outcome movement (pitching), Fleisig and colleagues
(1999) found that only one out of the 11 discrete position parameters had shown significant
differences between groups, but all five velocity parameters had shown significant
differences. None of their six temporal parameters showed any significant differences
between the groups. Adding to this, a more recent study found that two temporal parameters
and three kinematic position parameters were significantly related to increased ball pitching
velocity (Stodden, Fleisig, McLean, & Andrews, 2005). Considering that the variables
recorded in both studies were not similar (which cumulates to 11 different kinematic
variables), it generates an assumption that temporal, velocity and position kinematic data
could possibly differentiate different level performers.
Although a close relative to the sport of baseball, totally dissimilar findings were reported
for pitching in softball. It is one of the very few ball throwing sports that utilises the
underarm pattern motion – the others being lawn bowls and ten pin bowling. Alexander and

34
Haddow (1982) had looked at four highly-skilled pitchers from the sagittal aspect only, with
the resulting kinematic analysis indicating that one of the critical parameters was the ability
to decelerate segments, which likely require very strong eccentric contractions of
antagonistic muscle groups. Surprisingly for a former Olympic sport, there were no other
known studies that looked at relationships between kinematic variables to pitching
performance as majority of work published had mostly revolved around possible injury risks
in relation to pitching technique (Werner, Jones, Guido, & Brunet, 2006).
Meanwhile, delivering the ball in cricket is a different ball game altogether – it is more an
overarm technique as compared to sidearm in baseball and underarm in softball and it allows
for a run-up preceding the release. There are two different ways to hit the wicket (target),
either by ‘tricking’ the batsman by excessively spinning the ball (accuracy outcome
objective) or to try move the ball faster than the batsman can react (accuracy and speed
outcome objective); or a combination of both. Consequently, at the extreme ends of the
continuum, there are the spinners and the fast bowlers. Due to vast number of types,
variations and variables involved in spin bowling, the majority of technique analysis in
cricket has been centered around fast bowlers. In one study, Salter, Sinclair, and Portus
(2007) using a multiple stepwise regression analysis, showed that 87.5% of the within
bowler (single bowler) variation in ball release speed can be attributed to run-up velocity,
angular velocity of the bowling arm, vertical velocity of the non-bowling arm, and stride
length. Another study had found that increased shoulder counter rotation movement was
related to better bowling accuracy (Portus et al., 2000). From these studies, it appeared that
both accuracy and speed outcomes objectives can possibly be predicted from kinematic data.

35
Prior discussions had centered on activities that have a primarily speed outcome objective
with a defined accuracy constraint. Alternatively, in rugby line-out throw (a movement that
has a speed-accuracy trade-off), Trewartha, Casanova, and Wilson (2008) found that players
exhibited greater accuracy at shorter throwing distances, although the accuracy decrement
was less in the elite. Participants demonstrated different alterations in technique when
performing throws of longer distances, either showing increased magnitudes of upper-body
joint angle velocities (less accurate thrower) or lower body joint velocities (more accurate
thrower). Meanwhile, Miller and Bartlett (1996) had examined basketball shooting from
different distances and found that there were increases in release speed as shooting distance
increased, which was explained by increased angular velocities of both shoulder flexion and
elbow extension and an increased speed of the centre of mass in the direction of the basket.
Players also exhibited an earlier timing of release as shooting distance increased.
To summarise the discussions about technique analysis and performance, it is clear that
better performance can be predicted from kinematic data. For primarily speed outcome
objective, release speed and segment peak velocities seem important. For sports where speed
outcome is required within an accuracy constraint, a number of discrete spatial data appear
to be predictive. As for movements with a speed-accuracy trade-off requirement, a
combination of segment velocities and temporal data were of importance. Also, it seems that
men and women utilise different techniques to achieve same performance goals.
Moving on to the sport of ten pin bowling, surprisingly, research and literature on the
biomechanical aspects of bowling are extremely scarce for a sport that is popular in most
parts of the world. Being a closed motor skill, most studies have been directed towards the
psychological and mental aspects of performance. There are also various works on bowling

36
balls and bowling lane preparation, but hardly any known studies on the bowling techniques.
Therefore coaches and athletes are devoid of any methodological skill analysis and
knowledge.
To date, one study that tried to describe the kinematics of bowling delivery was done by
Johnson (2002) and the findings are only available on the FIQ website. In that study, it was
concluded that a novice player took fewer steps to deliver the ball, produced a slower, less
controlled ball at release as compared to elite bowlers. The novices also tended to have an
erect body posture at release with an extended leading leg and very restricted shoulder
movement. In addition, the beginners usually released the ball at a higher vertical height,
thus letting the ball bounce. Elite players were able to get a curvilinear ball path resulting in
less dependency on ball speed. Extreme care must be noted when interpreting this work as it
utilised unclear methodology and were discussed mostly qualitatively without any concrete
statistical comparisons. There is also a possibility that some findings may be biased as the
research was commissioned by FIQ. To illustrate, a majority of the discussions had
advocated bowlers as skilled athletes, thus lending support and leading to the idea that ten
pin bowling should be included as a future Olympic sport.
In the other only known technique analysis study done on ten pin bowling, Chu et al., (2002)
attempted to profile 12 elite level ten pin bowlers in terms of delivery technique and to
compare the male and female bowlers. The study utilised 2D motion capture and was done
without joint markers. The authors found that the male bowlers slide foot stopped further
away from the foul line compared to the female counterparts. Shoulder angles at release and
at top of back swing were also different between genders. Although a rudimentary study, the
results indicated that in terms of technique, bowlers like their counterparts in other sports,
37
can also be distinguished by discrete kinematic data. Further research into the areas of
performance techniques and segment contribution in ten pin bowling would yield
tremendous benefits. Among other things, one would be able to establish which kinematic
patterns contribute the most toward a good delivery in bowling, recognise and isolate the
sequencing or movement patterns that are synonymous with better bowlers, and dissipate
this knowledge to coaches and lower level athletes.
2.3 Within-Subject Movement Variability in Sports
Most early sports-related variability studies analysed only one trial per individual. With the
advent of automatic marker tracking, it is now easier to track multiple trials per individual,
opening up new opportunities. One of the advantages of collecting multiple trial kinematic
data is the ability to gauge within-subject variability, whereas previous works had reported
mostly on inter-subject variability. In event where the number of participants is sufficient,
comparisons of the within-subject variability between the participants can be made.
Movement consistency has always been understood to have some implications to
performance and different motor control paradigms offer different views on variability.
There have been earlier arguments from the cognitive motor control perspective that
generally, consistent movement patterns leads to better performance (Higgins and Spaeth,
1972). These cognitive motor control theorists traditionally considered variability as
undesirable system noise, or error, and saw variability as reducing with skill learning as the
learner freezes unwanted degrees of freedom in the kinematic chain (Bartlett, Wheat, &
Robins, 2007). Alternately, ecological motor control advocates view variability as having a
functional role in human movement whereby variability is seen as essential in giving
flexibility to adapt effectively to changes in the environment. More recent studies have

38
indicated that even the best athletes are not able to replicate the exact same movements in
achieving good scores (Miller, 2002). There seem to be no such thing as “standardized
movement pattern” for the best performance (Bauer & Schollhorn, 1997).
This has led to the belief that outcome consistency is not dependent on movement
consistency. In actual fact even for outcome consistency, Woo and Zatsiorsky (2006), in
their retrospective study of athletic throwing event performance at major games, found that
the performance scores variance was slightly larger in the best athletes and was larger in
female athletes than in males in all events. With the improvement of the performance
outcome level, the percentage of the successful (not fouling) throwing attempts increased. It
was concluded that with higher ranked athletes, the dependability of the athlete’s
performance improved, while the performance variability did not change irrespective of the
athletes’ level. The study basically summed that elite throwing athletes did not show
particularly consistent outcome scores during big events, and as mentioned earlier, even
when they did achieve their ‘best’ throws, Bauer and Schollhorn (1997) suggested that they
possibly did it with variable motor patterns.
Movement variability in performing sport skills has been studied in various throwing
disciplines such as javelin, baseball and basketball. In baseball pitching which has a speed-
outcome objective within an accuracy constraint, Stodden and colleagues (2005)
investigated the relationship between pitching mechanics and ball velocity within individual
athletes, with a total of 166 fastballs thrown by 19 healthy adult pitchers analysed. The
authors found that lower variability in three kinematic, three kinetic, and two temporal
within-subject parameters correlated with more consistent ball velocities. Furthermore, when
comparing different level pitchers, Fleisig and colleagues (2009) found that there was a

39
significant overall difference in kinematics and in six of the eleven discrete kinematic
parameters analysed. Individual standard deviations tended to be greatest for youth pitchers,
and decreased for higher levels of competition. Thus pitchers who advanced to higher levels
exhibited less variability in their motions. Meanwhile, in terms of consistency throughout a
game, Escamilla and colleagues (2007) digitised ten college pitchers during a simulated
game and reported that kinematic and kinetic variability for a pitcher from start to end of a
game was relatively low. Looking at studies on baseball pitching alone has led to the
understanding that variability of segment motions was related to consistency of
performance; that skilled performers had more consistent patterns, and that movement
patterns can be quite consistent throughout a game.
In an example of a solely speed-outcome event, Bartlett (2008) and Bartlett, Muller,
Lindinger, Brunner, and Morriss, (1996) reported intra-individual differences in novice,
club, and elite javelin throwers, with intra-individual differences greater for the novice and
elite throwers than for the club throwers. Generally, this showed that even athletes in events
striving for maximum distance do not generate identical coordination patterns.
For movements with a speed-accuracy trade-off, specifically basketball shooting, Robins,
Wheat, Irwin, and Bartlett, (2006) reported considerable variability between trials in discrete
segment variables from various distances. However, Miller (1998, 2002) found no
significant differences in speed variability between successful and unsuccessful shots and
this finding was attributed to possible compensatory variability during the final finger-ball
contact (which was not measured). Miller’s assumptions were supported by Hayes (1988)
who found high ball velocity variability among subjects prior to release but this variability
was greatly reduced at release. The low variability in velocity at release was most likely

40
accounted for by the narrow limits of velocity required to drop the ball in the basket from
the foul line. Vaughn (1993) also found that generally, movement patterns in shooting was
inconsistent and summed that there was no evidence from their study that a free throw
shooter can retrieve a motor program from memory and precisely reproduce that movement
pattern. This discovery suggested that intra-individual variability is an inherent component.
Interestingly, Miller (2002) too found an increasing trend in absolute variability of joint
speed along the sequential segment chain whilst taking the shot, which was corroborated by
Robins and colleagues (2006). Thus it was apparent that although the final release ball
velocity in shooting appeared consistent, the movement patterns leading up to the release
was inconsistent. However, improvements in skill level appear to be associated with an
increasing amount of inter trial movement consistency especially from the elbow and wrist
joints (Button, Macleod, Sanders, & Coleman, 2003)
Besides spatial variability, some researchers chose to solely look at temporal variability,
more so for ball-implement impact tasks. It was demonstrated that expert performers in a
number of games (i.e., baseball, table tennis and field hockey) executed their drives with
more consistent movement times (Bootsma & Van Wieringen, 1990). It appeared that the
time between the first forward motion of the implement and the moment of ball contact
varied little between trials. However this consistency was not apparent in throwing where
Fleisig and colleagues (2009) reported no differences in temporal variation, concluding that
coordination was not improved at higher levels. Furthermore, Matsuo and colleagues (2001)
found that the variability of timing among pitchers decreased from early to late parameters
in the throwing motion, and argued that timing early in the throw may be the key to ball
velocity. Throwing is a process that proceeds from the ground up, and energy is transferred

41
from the larger lower proximal segments to the lighter upper distal segments. The
implication was that throwers can, to some extent, adjust in response to early inconsistencies
in their movement timing to produce a more consistent end result (Fleisig et al., 2009).
Currently, there are no published studies on movement variability of the delivery in ten pin
bowling, but there is one known unpublished thesis that is related to variability, hence it
merits some discussion. In that thesis, Harris (2008) in labeling ten pin bowling a “physical
tasks with self-paced requirements”, used movement variability as a tool to investigate
internalised mental representations. It was argued that there were two approaches to motor
performance - the expert performance approach, which proposes cognitive mediation of task
performance via mental representations versus the ecological/dynamical systems approach,
which proposes the environmental information as the primary mediator of performance, the
former of which was hypothesised to be applicable to ten pin bowling. To address his
research question, Harris used bowling under normal conditions against bowling under
obscured conditions as the experimental approach.
Without further discussions into the second part of his study (bowling under obscured
conditions), the first part which constituted normal bowling conditions found that skilled
participants exhibited low levels of execution variability and high success rates during
normal spare and strike conditions. Success rate was negatively correlated with execution
variability, i.e., the greater the amount of execution variability exhibited by the participant,
the lower the participant’s score, on both spare and strike trials. There was also a significant
negative correlation between execution variability and skill level on both spare and trials.
Thus, low levels of execution variability were associated with higher success rates and
higher skill level.

42
Unfortunately, there were two major concerns with the study. First was the range of subjects
used. The averages for the skilled bowlers group ranged from 170 to 240 (mean score =
200.67). The novice group had a bowling average of 120 or less. The averages for the novice
bowlers ranged from 50 to 120 (mean score = 103.75). Comparisons between the two
distinct groups would be acceptable, but correlation analysis was questionable as there were
no bowlers in the mid-range scores. Second was the choice of motion capture and variability
calculations methods. The use of 38 mm table tennis balls would introduce higher variance
of measurement during digitising as well as higher movement artefacts from the large
markers. Reflective markers used in biomechanics are usually only around 15 mm in
diameter and made from Styrofoam which is lighter. The methods of measuring variability
were also unclear, in addition to the trials being not time-normalised to facilitate between-
trials comparisons. In view of these methodological shortcomings, results of Harris’s (2008)
work in terms of biomechanical interpretation should be viewed with caution.
In summary, movement variability was found in real sports competitions, with strong
ecological validity, in simulated field conditions, and in laboratory conditions, with strong
research validity (Bartlett et al., 2007). More importantly, varied motor patterns have many
potential benefits as highlighted by Bartlett (2008). In the context of this study, the benefits
of the ability to vary motor patterns include being able to facilitate changes in coordination
as in learning new motor skills, being able to adapt to changes in the environment such as
deteriorating lane conditions in ten pin bowling, and being able to modify tissue loads from
repeated ball deliveries thereby reducing injury risks. As such, investigation into the critical
variability parameters is warranted.

43
2.4 Statistical Methods for Determining Critical Parameters
From an overall perspective, despite the lack of work examining critical parameters in ten
pin bowling, attempting to determine the critical parameters in other sporting events was not
something new. The more common statistical method used for identification of critical
parameters in previous studies was regression analysis. An example of a study that
illustrated the use of regression analysis was by Hay, Vaughan, and Woodworth (1981),
whereby the authors had proposed a model for the standing vertical jump by describing the
performance parameters in the skill and analysing data from a large number of athletes to
evaluate the model. In that study, the correlation of each parameter in the model with the
jump height was calculated to determine which parameters might be most important,
followed by a multiple regression analysis to determine which of the parameters contributed
most to explaining the performance of each individual.
Some of the other sporting techniques that have been analysed in this manner include triple
jump, sprints and hurdles, ice skating and shot put (Young & Li Li, 2005). These studies had
provided insight into the technical parameters of the events that were most closely related to
success, and which parameters were the best predictors of performance. Importantly, the
previous analyses of critical parameters in various sports had involved continuous variables
as the dependent variable (i.e. distance thrown or jumped, time of race completion), which
led to the use of the multiple regression analysis. In this study, the dependent variable was
categorical, that is, groups based on playing level. Instead of looking at parameters that
contributed most to explaining performance, this study looked at parameters that best
distinguished the groups. Hence, the discriminant function analysis was used.
44
CHAPTER THREE:
RESEARCH METHODOLOGY

45
Chapter 3: Research Methodology
Research Design
The present study used a non-experimental cross-sectional research design, and is
exploratory and descriptive in nature. Participants were grouped based on their playing level
and were categorised as elite and semi-elite bowlers. Data collection was carried out for five
days. Measurements for each subject were taken in the first half of the day on one of the five
days, prior to the commencement of their regular training session.
For the study involving anthropometric and strength measurements, a third group made up
of sedentary university students was chosen to allow for comparisons between the bowlers
and a representation of the normal population.
Participants
A total of 30 national and state bowlers that were in competition during the current season
and had various competitive years of experience were recruited. Subjects were assigned into
either elite or semi-elite groups according to their average bowling score over three major
tournaments nearest to the data collection date. Subjects with a Bowling Score Average
(BSave) of 200 pin falls and above were placed in the elite group, while the other bowlers
were placed in the semi-elite group. There were 10 male elite (Age 23.6 ±3.9; Experience
11.2 ±3.7 years), 8 female elite (Age 22.4 ±5.4; Experience 8.1 ±5.2 years), 7 male semi-
elite (Age 20.6 ±2.4; Experience 4.9 ±2.3 years) and 5 female semi-elite bowlers (Age 20.6
±4.0; Experience 5.8 ±1.3 years). This number of elite and semi-elite participants
represented nearly the entire population of bowlers in the Malaysian senior and back-up
national teams.
46
As for the non-bowlers group, the participants comprised of 33 randomly chosen first and
second year undergraduate students that were not involved in any competitive sport. There
were 14 male students (Age 22.0 ±1.6) and 19 female students (Age 22.6 ±1.3).
Participants received a clear explanation of the study, including the risks and benefits of
participation, and written consent (or parental consent for participants under the age of 18
years) was obtained before participants were permitted to participate (see Appendix 2). All
participants reported that they were injury free on the data collection dates. There were no
invasive procedures used throughout the course of the data collection.
3.1 Physical Measurement Methods
Anthropometric and Strength Measurement Equipment
For length and breadth measurements, one medium and one larger unit of calibrated
Lafayette Sliding Anthropometer (Lafayette Instrument Company, USA) was used. Height
was taken using a SECA Stadiometer (SECA Gmbh, Hamburg) while weight was measured
using a calibrated balance weighing scale (DETECTO, Missouri). Arm span measurement
was taken using a fiberglass tape that was attached to the wall.
For strength measurements, the multi-head universal Lafayette Load Cell, Model 01163
Manual Muscle Tester (Lafayette Instrument Company, USA) was used. An additional steel
strength apparatus was constructed in the lab to aid in isolating certain hand segments during
the strength tests. A pilot trial of 20 volunteers yielded a concurrent validity correlation
coefficient for this setup, tested against correspondingly well known strength tests of 0.96,
0.94 and 0.75 (see Appendix 3). While the correlation coefficient for test retest reliability of
three of the test used in this study were 0.98, 0.97 and 0.98.
47
Test Protocol
Choice of tests was based on literature of other throwing events and thorough discussions
with the national coaches (Cheah, 2009). It was important to note that, testing was
constrained by the time allowed, which was a maximum of two hour per bowler to complete
the measurements as well as conduct the motion analysis.
The data collection was done over a five day period. Each participant only came for either
one of the days and spent between 40 to 60 minutes going through the tests. Participants
started off by filling up a personal background form as well as a consent form. All
participants had neither major illnesses nor major injury and were able to continue to
participate in the study.
Firstly, participants were instructed to change into their respective bodysuits.
Anthropometric measurements were taken, followed by the set of isometric strength tests.
Participants were then asked to wear their ankle level socks and shoes, their body wiped
down of any sweat and had reflective markers placed on them. Lastly, when all
measurements and tests were completed, the video capture process for each participant
commenced.
3.1.1 Anthropometric Test Procedures
Participants were subjected to ten anthropometric measurements which were height, weight,
seated height, biiliac and biacromial breadth, armspan, dominant side’s upper arm, lower
arm, hand length and tibial length. Circumference and skinfold measurements were not
measured. Leg length was calculated by subtracting seated height from height, from there
the ratio of seated height to leg length (SH:LL Ratio) was generated. Anthropometric data

48
collection methods were as per convention listed by Lohman, Roche, and Martorell (1991).
Three non-consecutive trials were taken for each site and the median score was used in the
analysis. Participants were measured whilst wearing only a body suit, and where
appropriate, the suit was pulled back so as to take direct measurements from the skin.
Only one tester collected the anthropometric measurements throughout the study. This
individual was trained a month in advance. A pilot trial by repeatedly measuring 20
volunteer students resulted in an acceptable intra-class correlation coefficient for test-retest
reliability and typical error of measurement for tibial length, armspan, hand length and
biiliac breadth of 0.94, 0.98, 0.96, 0.94 and 0.6%, 0.2%, 0.8%, 1.0%, respectively.
Height
Measurement was taken using a stadiometer that was attached to a square, vertical concrete
beam that was approximately 30 cm wide. While barefooted, participants stood with their
back against the beam, heels close together, hands freely hanging at side with the palms
facing the thighs and the head and eyes facing straight ahead. The heels, buttocks and
scapula were touching the beam and weight was distributed evenly on both legs. Participants
were then instructed to inhale and to hold their breath while maintaining an erect posture.
Measurement was taken while applying sufficient pressure on the stadiometer to compress
the hair. Height was recorded to the nearest 0.1 cm.
Sitting Height
The same apparatus as the Height measure was used but with the addition of a 50 cm high
square box. The subject sat with legs stretched to the front on the box that was lined up
against the beam, with the buttocks and scapula touching the beam. Hands were rested on
the thigh and the head and eyes were facing forward. Participants were then instructed to
49
inhale and to hold their breath while maintaining an erect posture. Measurement was taken
while applying sufficient pressure on the stadiometer to compress the hair. Sitting Height
was recorded to the nearest 0.1cm.
Weight
Each participant stood still on the centre of the scale with the bodyweight distributed evenly
on both feet. Measurement was recorded once the meter’s scale stabilised. The participant
got off the scale and the process was repeated. Weight was recorded to the nearest 0.1 kg.
Arm Span
A fiberglass tape was mounted horizontally to a flat surface of a wall, 160 cm from the floor.
A triangular ruler was used to accommodate for height differences between subjects and to
mark length. Each participant stood with the feet together and the back against the wall.
Their arms were outstretched laterally and maximally at about shoulder height while in
contact with the wall and with palms facing forward. Adjustment to standing position was
needed to ensure the tip of the middle finger (excluding fingernail) of the right hand was
exactly at the zero end of the tape. In addition, the tip of the middle finger of the left hand
was touching the ruler. The arms needed to be slightly abducted/adducted to find the longest
reach. The position of the ruler on the tape was then recorded to the nearest 0.1 cm.
Tibial Length
The direct length measurement method was used. The participant sat down with the leg of
interest crossing over the opposite knee. The proximal end of the medial border of the tibia
and the distal tip of the medial molleolus were marked. The anthropometer was aligned so
that each blade was applied to the landmark markings and the shaft was parallel to the long
axis of the tibia. Reading was taken to the nearest 0.1 cm.

50
Upper arm (Shoulder-Elbow) Length
The participants stood erect with their weight evenly distributed on both feet. The shoulders
were drawn back and upper arm hanged loosely at the side. Both elbows were flexed to
place the forearm and hands in the horizontal plane parallel to each other. The shaft of the
anthropometer lined up parallel to the upper arm and the fixed ended blade was in firm
contact with the superior lateral aspect of the acromion. The sliding blade was moved to be
in firm contact with the posterior surface of the ulna olecranon process. Reading was taken
to the nearest 0.1 cm.
Lower arm (Elbow-Wrist) Length
The participants stood erect with their weight evenly distributed on both feet. The shoulders
were drawn back and upper arm hanged loosely at the side. Both elbows were flexed to
approximately 90 degrees with palms facing medially and fingers fully extended. The shaft
of the anthropometer lined up parallel to the forearm and the fixed ended blade was in firm
contact with the most posterior point overlying the olecranon. The sliding blade was moved
to be in firm contact with the most distal palpable point of the styloid process of the radius.
Reading was taken to the nearest 0.1 cm.
Hand Length
The participants stood relaxed with the forearms extended horizontally. The hand and
fingers were extended and facing upwards. The shaft of the anthropometer lined up parallel
to the longitudinal axis of the hand and the fixed ended blade was in firm contact with the
most distal palpable point of the styloid process of the radius. The sliding blade was moved
to be in light contact with the flesh tip of the middle finger. Reading was taken to the nearest
0.1 cm.

51
Biacromial Breadth
The measurement was taken from the rear while the participant stood erect, heels together
and hands loosely hanging at the side. The participant was in a relaxed state, with the
shoulders downwards and slightly forward to get the maximal reading. Each end of the
anthropometer blade was pressed firmly on the most lateral border of acromial process on
both shoulders, and the shaft parallel to the line formed between the two processes. Reading
was taken to the nearest 0.1 cm.
Biiliac Breadth
The measurement was taken from the rear while the participant stood erect with feet about 5
cm apart (which prevented swaying). The arm was folded at the chest. The anthropometer
blades were brought into contact with the iliac crests so as to find the maximum breadth.
Firm pressure was applied with the anthropometer slanted at a 45 degree angle. Reading was
taken to the nearest 0.1 cm.
3.1.2 Isometric Arm Strength Test Procedures
Peak isometric strength test was chosen for this study, and seven variables were measured -
finger pinch between the index to thumb, middle finger to thumb, third finger to thumb, arm
flexion (at approximately 90 degrees), wrist flexion (at full extension), forearm/wrist
internal rotation (FIR) and forearm/wrist external rotation (FER) (Figure 3.1). Three non-
consecutive trials were done for the dominant side and participants kept their in-active hand
behind their backs. The maximum score was used in the analysis. All scores were
normalised to body weight.
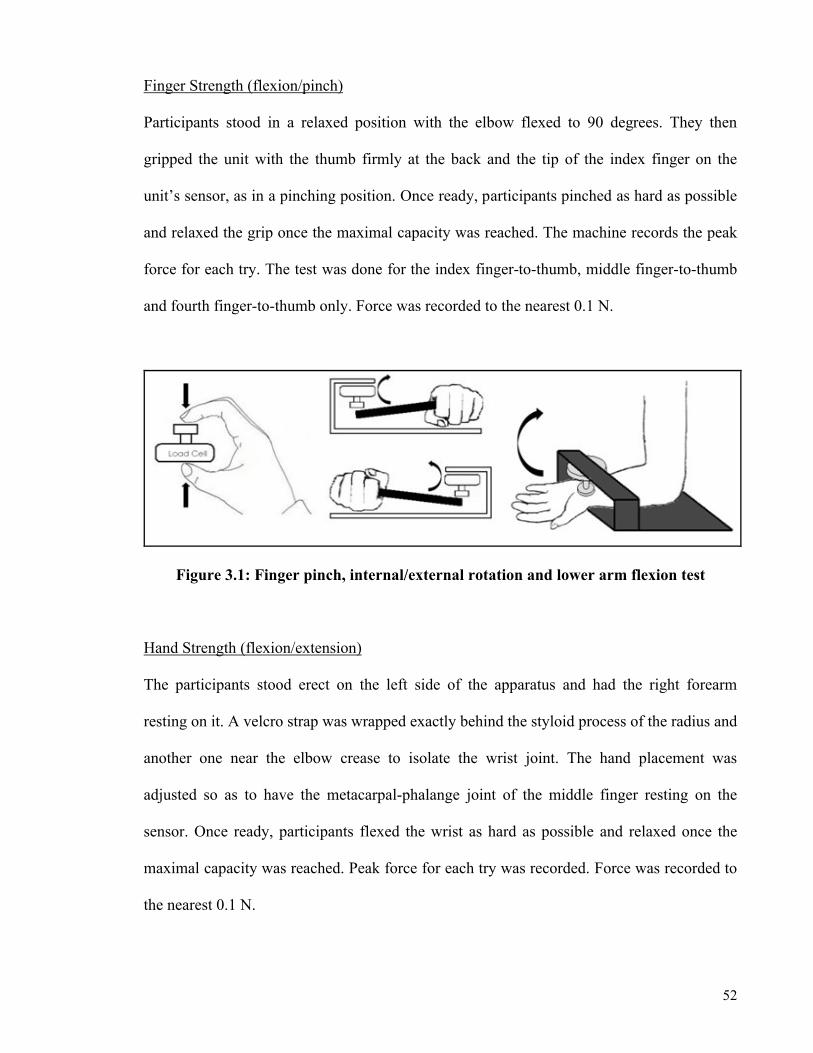
52
Finger Strength (flexion/pinch)
Participants stood in a relaxed position with the elbow flexed to 90 degrees. They then
gripped the unit with the thumb firmly at the back and the tip of the index finger on the
unit’s sensor, as in a pinching position. Once ready, participants pinched as hard as possible
and relaxed the grip once the maximal capacity was reached. The machine records the peak
force for each try. The test was done for the index finger-to-thumb, middle finger-to-thumb
and fourth finger-to-thumb only. Force was recorded to the nearest 0.1 N.
Figure 3.1: Finger pinch, internal/external rotation and lower arm flexion test
Hand Strength (flexion/extension)
The participants stood erect on the left side of the apparatus and had the right forearm
resting on it. A velcro strap was wrapped exactly behind the styloid process of the radius and
another one near the elbow crease to isolate the wrist joint. The hand placement was
adjusted so as to have the metacarpal-phalange joint of the middle finger resting on the
sensor. Once ready, participants flexed the wrist as hard as possible and relaxed once the
maximal capacity was reached. Peak force for each try was recorded. Force was recorded to
the nearest 0.1 N.
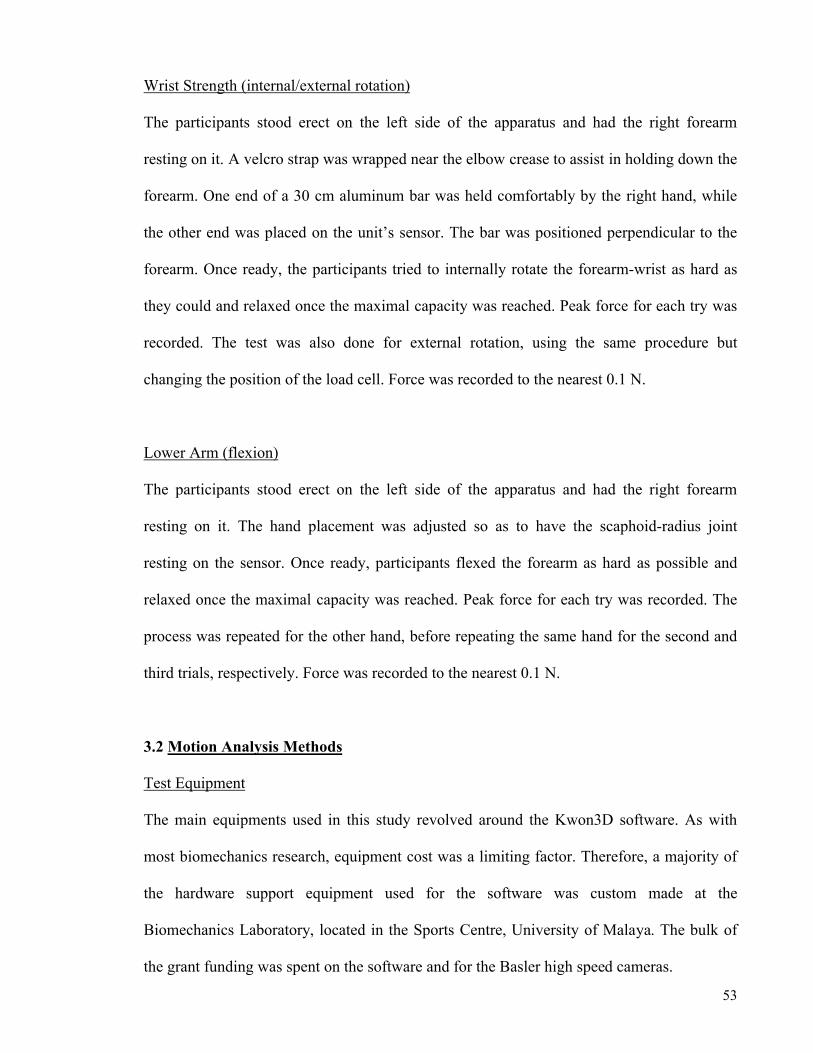
53
Wrist Strength (internal/external rotation)
The participants stood erect on the left side of the apparatus and had the right forearm
resting on it. A velcro strap was wrapped near the elbow crease to assist in holding down the
forearm. One end of a 30 cm aluminum bar was held comfortably by the right hand, while
the other end was placed on the unit’s sensor. The bar was positioned perpendicular to the
forearm. Once ready, the participants tried to internally rotate the forearm-wrist as hard as
they could and relaxed once the maximal capacity was reached. Peak force for each try was
recorded. The test was also done for external rotation, using the same procedure but
changing the position of the load cell. Force was recorded to the nearest 0.1 N.
Lower Arm (flexion)
The participants stood erect on the left side of the apparatus and had the right forearm
resting on it. The hand placement was adjusted so as to have the scaphoid-radius joint
resting on the sensor. Once ready, participants flexed the forearm as hard as possible and
relaxed once the maximal capacity was reached. Peak force for each try was recorded. The
process was repeated for the other hand, before repeating the same hand for the second and
third trials, respectively. Force was recorded to the nearest 0.1 N.
3.2 Motion Analysis Methods
Test Equipment
The main equipments used in this study revolved around the Kwon3D software. As with
most biomechanics research, equipment cost was a limiting factor. Therefore, a majority of
the hardware support equipment used for the software was custom made at the
Biomechanics Laboratory, located in the Sports Centre, University of Malaya. The bulk of
the grant funding was spent on the software and for the Basler high speed cameras.

54
Kwon3D Motion Analysis Software
Kwon3D (Visol Inc, Korea) is a flexible motion analysis system that is able to capture
synchronised 100 frames per second digital video simultaneously from multiple cameras.
There was not a need for different recording and capturing processes because it utilised
digital cameras connected directly via IEEE1394 (firewire) from the host computer. Stream
data from the cameras were stored directly onto the main computer hard drive (in this case,
one hard drive per camera) in real time.
This arrangement also allowed the host computer to control the cameras, hence the
synchronised capturing which eliminated the need for manual or audio gen-locks later on in
the analysis process. It allowed capturing to be done using normal video input with normal
background lights or as in the case of this study, infra red (IR) images utilising IR lights and
Basler cameras that had its IR filter removed.
Captured footage was digitised directly in the software, using the semi-auto marker tracking
option. 3D coordinates were then computed by the system using the Direct Linear
Transformation (DLT) method (Abdel-Aziz & Karara, 1971) based on the body model that
was defined.
Computer Hardware
The system had two computers, a primary host computer and a secondary slave computer.
Both were connected to each other via a Gigabit LAN router. It operated based on Windows
XP operating system and was powered by Intel Pentium (R) D 3.00 GHz processors. It had 2
GB of RAM space and equipped with ATI ASUS AX550 graphics cards with 512 MB of
HyperMemory. The main unit was also installed with a National Instruments (National

55
Instruments, Austin, Texas, USA) PCI6601 Data Acquisition Board. Both the units also had
Gigabit Network Adapters for high speed data transfers between them.
Using high speed cameras capturing directly to the hard drives meant that there was an
enormous amount of data being transferred and stored at any given time. A computer
motherboard has only two PCI slots to house the IEEE1394 Firewire PCI adapters, and these
slots have a limited bus-speed and bandwidth which can only handle a certain amount of
data at a time. Therefore, to be able to stream 100 Hz raw video, only one camera could be
connected to one adapter, meaning that one computer can only accommodate two high speed
cameras.
The Kwon3D software was installed in the primary unit, while the secondary computer had
a software called Visol MultiNet Express that allowed it to capture from the two cameras
and transfer the data directly to the main unit via the Gigabit LAN. The main computer was
also the storage centre whereby, on top of its own systems’ hard drive it also had four
additional 320 GB drives, one for each camera. All the computer hardware was self-
assembled in the biomechanics laboratory.
Basler High Speed Cameras
There were four high speed cameras used in this study, the Basler A602fc, acquired from
Basler AG (Ahrenburg, Germany). These units had ½ inch CMOS sensors utilising global
shutter and were able to capture at 100 full frames per second. The Kwon3D software was
able to control the capture rate of the cameras at 30, 60, 80 or 100 fps. This study used the
maximum capture rate of 100 fps. The cameras’ power was supplied by the IEEE1394
bus/cables. Via the IEEE1394, the software was also able to control the cameras’ gain,

56
brightness and exposure time of each individual camera. In addition, the Basler 602fc also
had LAN RJ45 ports that accepted trigger signals from the Timing Generator via two wires
in the LAN cables. This in turn allowed synchronised video capture from all four cameras.
In short, there were only two cables that ran to each camera, the IEEE1394 (Firewire) for
video data as well as the camera power and controls as well as the LAN RJ45 cables for
timing triggers and modified power supply for the IR LED lights.
Throughout the data collection of this study, a locally sourced C-mount 4.5-10 mm zoom
lens with 1:1.6 scale was used for the Basler cameras. It had a work space range of between
5 to 10 meters, which was ideal for use in the bowling alley. The IR lens filter from each
camera was also physically removed to allow for better quality video under IR environment.
The cameras were used in conjunction with custom made tripods. It was made using 1¾ inch
steel tubing and was able to be adjusted from a height of 1.5 to 2.5 m. It also had a
combination of closed cell foam and rubber dampeners at the bottom of each leg to help
dissipate vibrations that occur on the bowling alley floor. The unit was self-fabricated in the
laboratory.
Timing Generator
The software was able to synchronise all the cameras for simultaneous video capture, but
it needed a hardware interface, that is, a timing generator (Figure 3.2). The device
generated identical timing signals for each camera.

57
Figure 3.2: Self-fabricated timing generator
The source of the signal came from the National Instruments PCI6601 card located in one of
the PCI slots of the main computer. Meanwhile, the timing of each signal was based on the
video capture rate that was set in the Kwon3D software. The PCI6601’s signal was then
transferred to an external ‘distribution box’ which was able to transmit the signal via
individual RJ45 LAN cable to each camera. This box unit was also hand constructed in the
laboratory by modifying a donor LAN router to host a National Instruments CB-68LPR I/O
connector block.
Reflective Markers and Body Suit
In line with most modern motion analysis capture environment, reflective markers were used
in this study to make semi-auto digitisation possible. The markers used were 15 mm in
diameter and were hand made using polystyrene that was wrapped in 3M (3M Corporation
Minnesota, USA) reflective tape. A 20 mm flat base, made using a thick plastic button, was
also added that made placement on the subject easier.
To aid in locating the markers, participants were made to wear black body hugging Arena
bodysuits (Arena, Italy). The body hugging nature of the suit makes it more akin to placing
reflective markers directly on to the skin. It came in four different sizes for men and women,
respectively. A black swim cap was also used to aid the placement of a marker on the vertex.

58
Infra Red Lighting System
Infra Red (IR) LED lights was chosen instead of using powerful halogen lights because the
brightness and glare of the halogen lamps distracted the bowlers as was found in the pilot
trials. These halogen lamps with their 500 watts bulbs would have also needed a direct
power supply from the mains and four lamps would have meant four additional thick cables
running across the bowling alley test site. IR light meanwhile was less obtrusive and it
required less power.
The IR lighting system was self-constructed in the laboratory using a combination of large
(8 mm) and small (4 mm) IR LED’s that were soldered on a printed circuit board (Figure
3.3). The board had a large opening in the middle for the camera lens to pass through as well
as mounting holes so that it could be securely mounted to the camera.
Figure 3.3: Basler cameras with self built IR lights and mounts
Each camera had a total array of 36 large and 24 small IR LED’s mounted on its frame but
only consumed a total of less than 2 amp per set. These were powered via an external 10
amp AC/DC converter that was connected via timing generator’s distribution box. As the
timing signal was only transmitted using two wires out of eight in the RJ45 LAN cable, the

59
remainder of the wires in the cable was available to use for power supply. This arrangement
greatly reduced the logistical issue of routing additional power cables.
Portable Calibration Frame
A 2 m high by 2 m long by 1 m wide frame was used for every calibration frame capture of
the study. It was constructed with the intent of making it portable, therefore it could be
assembled or disassembled easily. It was made of aluminum tubes (15 mm in diameter) and
connector blocks (Figure 3.4). A total of 33 tubes and 18 connector blocks were used in the
frame. There were 15 mm strips of 3M reflective tape wrapped around the upright bars that
was placed 20 cm, 50 cm, 80 cm, 120 cm, 150 cm and 180 cm away respectively from the
mid-point of the bottom connector ball. In total there were 36 markers on the calibration
frame. It also had an adjustable base under each bottom connector block to accommodate
uneven surfaces.
With the current hardware/software setup, the RMS reconstruction error values in the x, y
and z axes for the calibration frame were 3.9, 3.8 and 4.1 mm respectively.
Marker Placements
For the whole body model that was constructed for the delivery analysis, there were 21
reflective markers placed on the participants (Figure 3.5). The markers were at:
Vertex of the head [x 1]
Chin (below the mental foramen) [x 1]
Lateral tip of the acromion [x 2]
Anterior Superior Illiac Spine (ASIS) [x 2]
Posterior Superior Illiac Spine (mid-point between left and right) [x 1]
Elbow (between lateral epicondyle and olecranon) [x 2]
Wrist (styloid process of the ulna and radius) [x 4]
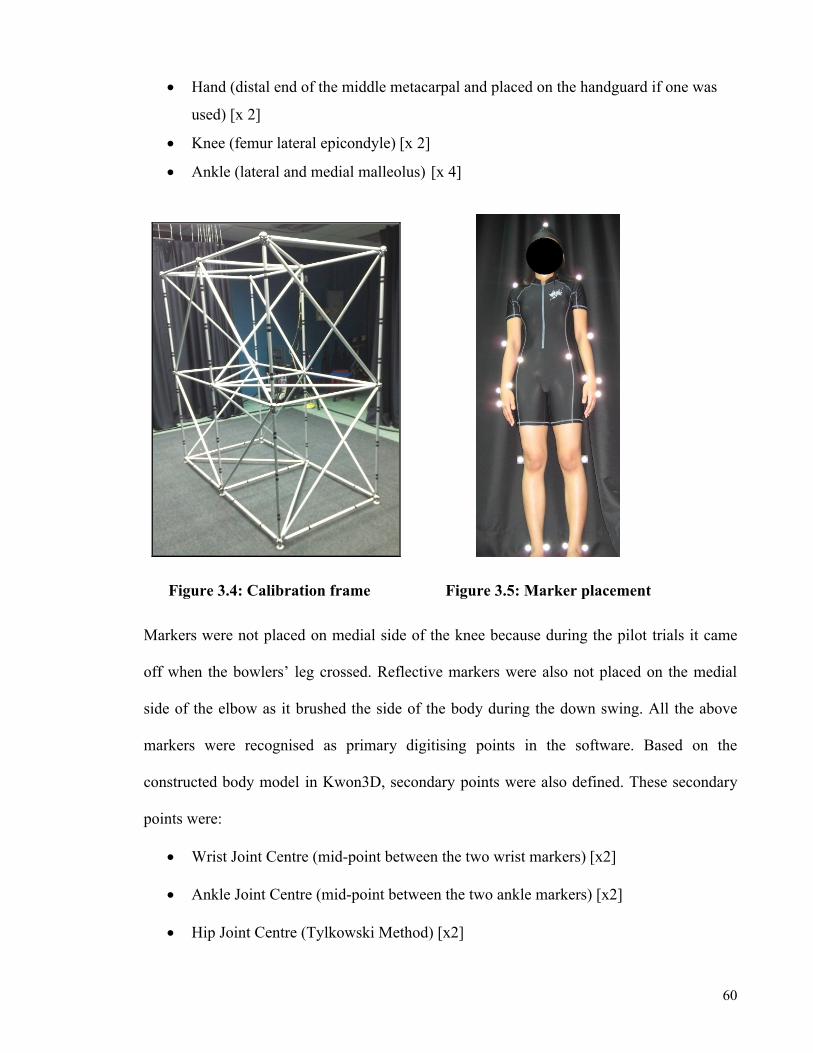
60
Hand (distal end of the middle metacarpal and placed on the handguard if one was
used) [x 2]
Knee (femur lateral epicondyle) [x 2]
Ankle (lateral and medial malleolus) [x 4]
Markers were not placed on medial side of the knee because during the pilot trials it came
off when the bowlers’ leg crossed. Reflective markers were also not placed on the medial
side of the elbow as it brushed the side of the body during the down swing. All the above
markers were recognised as primary digitising points in the software. Based on the
constructed body model in Kwon3D, secondary points were also defined. These secondary
points were:
Wrist Joint Centre (mid-point between the two wrist markers) [x2]
Ankle Joint Centre (mid-point between the two ankle markers) [x2]
Hip Joint Centre (Tylkowski Method) [x2]
Figure 3.5: Marker placementFigure 3.4: Calibration frame

61
The estimation of hip joint centre used in this study was originally suggested
by Tylkowski, Simon, and Mansour (1982) and had the ratio values adjusted
by Bell, Pedersen, and Brand (1990). The mediolateral, anteriorposterior and
superiorinferior positions of the hip joint in the pelvis were functions of the
inter-ASIS width (W in Figure 3.6): 0.14W medial, 0.19W posterior and
0.30W inferior to the corresponding side ASIS.
Figure 3.6: Hip joint centre (Tylkowski method)
Camera Placement
There were four cameras used in this study. Each was mounted on a secure tripod
approximately 2.2 m high. Camera 1 faced down at about a 30 degree angle while the rest of
the cameras were at a 45 degree slant. All the relevant cabling was routed around the alley
being used and none cut across the alley or interfered with the bowlers initial steps.
Approximate camera placements on the bowling alley are as shown in Figure 3.7.

62
Figure 3.7: Camera placement at the bowling alley
Video Capture Procedures
Prior to each day’s session, the calibration frame was brought onto the test alley and
cameras were adjusted to have an unobstructed view of the markers as well correct focus
and gain. The exposure time was set at 1/500 s for all cameras while gain varied for each
camera and was adjusted accordingly in order to have the best reflection from the reflective
markers. Two calibration frame trials were recorded before the frame was removed. There
was also a fixed marker placed on the floor, visible throughout the calibration and all trials.
Participants were asked to warm-up by bowling 10 balls at their own pace to get accustomed
to bowling with the bodysuit and markers under dimmer light conditions. This process took
between 5 to 10 minutes. Participants used their own bowling shoes and their own bowling
ball. Participants then indicated when they were ready to commence the tests.

63
Only first ball deliveries were captured (pins were reset after every trial), and subjects were
instructed to try to bowl with their best effort, with the same technique in every trial. More
specifically, this meant that they were told not to change their bowling style midway.
Participants were also asked to indicate after each trial whether there were any problems
with that particular delivery, if so then that specific trial would be repeated. There were
seven trials conducted, but video capture was only done for the last four trials. The
participants did not know which trial was being recorded. The first three trials helped in
getting them familiarised with bowling under the scrutiny of the cameras and testers.
Trials were recorded at 100 frames per second for 3.5 seconds from their first initial
movement, with the capture start controlled manually by the tester manning the main
computer. The start was initiated as the participant took the first step.
Digitising
The bowling motion was distinguished by three key events (Figure 3.8), which were:
1. Top of Back Swing (TBS) - the start of the motion of interest,
2. Front Foot Strike (FFS) - the point at which the sliding foot first touched the ground,
3. Ball Release (REL) - the frame at which the ball leaves the hand.
Figure 3.8: Key events – TBS, FFS and REL

64
Capture footage from all cameras were trimmed five frames prior to the TBS and five
frames after the bowlers reached the top of their follow-through. Kwon 3D semi-auto
digitising function was carried out utilising a user defined body model with the listed
primary and secondary points. Even though on auto mode, digitising was done frame by
frame to scrutinise for error in marker tracking as well as to identify markers that were
obscured or had low reflection. Manual digitising was done for the ball as there were no
markers placed there. Digitising was done by the same research assistant throughout the
study. Interpolation function for missing markers was used only when there were less than
two cameras in view of a particular marker at a given point in time. Interpolation frequency
was set at 100 Hz, the same as the camera capture rate.
Data Reduction
Raw marker point position data was filtered for random noise, marker skin movement
artefacts as well as camera/tripod vibration. Filtering was done using a low pass filter, the
second order digital Butterworth filter and the cut-off frequency was set at 6 Hz. As the total
frame for each trail varied, the variable-time data was time normalised from TBS to REL
(percentage of cycle, with 101 data points) to facilitate comparisons between trials and
between subjects.
Research Variables
The primary dependent variable is the Bowling Score Average (BSave) which was tabulated
from three major tournaments nearest to the data collection date.
In terms of independent kinematic variables, for linear motion, means of four trials position-
time in X (lateral), Y (anterior-posterior) and Z (superior-inferior) directions were used with
subsequent velocity-time and acceleration-time data. Discrete data points of interest such at

65
TBS, FFS, REL, maximum, minimum and range as well as the corresponding temporal data
was extracted (Figure 3.9). While for kinematic angular motion, only angles in the sagittal
plane were used, whereby the 3D position of joint markers from corresponding linked
segments were projected onto the 2D sagittal plane to generate the respective joint angles.
In terms independent variables used for the within-subject inter trial movement variability
analysis; standard deviation (SD) at discrete points in time of the individuals’ four trials was
used as the indicator for absolute variability (Figure 3.10).
Figure 3.9: Variables for kinematic analysis

66
Figure 3.10: Variables for variability analysis
3.3 Measuring Segment Contribution
Peak horizontal linear velocities of joint markers were used as representation of the
particular segment contribution towards the final linear ball velocity at release. Peak linear
horizontal velocities of the hip marker (representing the lower limb contribution), shoulder
marker (representing the upper body contribution), elbow marker (representing the upper
arm contribution), wrist marker (representing the lower arm contribution) and metacarpal
marker (representing the hand contribution) were extracted. Meanwhile, the difference
between the metacarpal marker velocity to the final ball velocity at release was considered
as contribution from the fingers.
3.4 Statistical Analysis Methods
Data analysis was conducted using the SPSS 16.0 statistical software package. Means and
the range for all of the independent variables were determined. Differences between elite,

67
semi-elite as well as non-bowlers (only for anthropometric and strength measurements) were
compared using a two-way (group*gender) analysis of variance.
For anthropometric and strength variables, if there was a significant main effect for group, a
Tukey’s HSD post hoc test was conducted. In addition if there was a significant interaction
effect, separate one-way ANOVA for males and females, respectively, were carried out to
differentiate the elite, semi-elite and non-bowlers within each gender.
Meanwhile, for all other variables (kinematic and movement variability) which had
significant interaction effects, a Mann-Whitney test was performed to determine if there
were group differences within the males and females, respectively. Furthermore, the Pearson
product moment correlation coefficients were also examined as a secondary analysis to
explore the respective variables’ relationship to BSave so that data interpretation is enhanced.
The use of gender in all analyses was a secondary factor, with minimal emphasis on inter-
gender comparisons. Rather, emphasis was on inter-group comparisons conducted with
gender pooled, and inter-group comparisons carried out gender by gender.
The objective of this study was to determine the critical parameters in ten pin bowling
delivery that contributed to bowling performance. Consequently, a discriminant analysis was
conducted to highlight variables that best discriminated the groups – these variables were
considered the ‘critical parameters’. Clearly, many comparisons and correlations were
performed in an aggressive statistical approach to control Type II errors and to identify
important independent variables, inadvertently resulting in a probably larger familywise
Type I error rate. Because of this, and the limited sample size, it is important to regard the
findings of this study as essentially exploratory and descriptive in nature.

68
CHAPTER FOUR:
RESULTS AND DISCUSSION

69
Chapter 4: Results and Discussion
4.1 General Bowling Performance
4.1.1. Results
The descriptive bowling performance results for the elite and semi-elite bowlers are shown
in Table 4.1. Although the bowlers were grouped based on their BSave, the independent-
samples t-test revealed that overall, there were no significant differences between the males
and females in terms BSave, t(28) = -0.11, p = .91 and competitive experience, t(28) = 0.847,
p = .404. While for ball release velocity, there were no significant differences between
gender t(28) = 1.674, p = .105 as well as between groups t(28) = 1.053, p = .301.
Table 4.1: Descriptive bowling performance results (reported as Mean ±SD)
Variable EliteSemi-
EliteElite (M) Elite (F)
Semi-
Elite (M)
Semi-
Elite (F)
Bowling average
(pin falls)
213.23
±6.80
181.84
±9.36
213.80
±7.69
212.53
±5.92
180.67
±8.18
182.29
±11.78
Competitive experience
(years)
9.83
±4.55
5.25
±1.91
11.20
±3.71
8.13
±5.17
4.86
±2.27
5.80
±1.30
Ball release velocity
(m/s)
8.00
±0.42
7.78
±0.71
8.08
±0.47
7.89
±0.35
8.02 ±
0.69
7.45
±0.67
4.1.2 Discussion
The exploratory analysis were guided by a number of factors including (but not limited to)
national/state coaches feedback, coaching manuals and reference from other similar
underarm pattern sports. The underlying assumptions for group comparisons based on
playing level was that there should be no significant difference in terms of performance

70
between male and females bowlers. This assumption was confirmed in this study whereby
there was no significant difference in terms of BSave between genders. In contrast, Tan, Aziz,
and Teh (2000) found that elite male bowlers had significantly higher scores than the
female. Though, in the particular study they had 50% more male samples than females and
the samples also had a lower mean bowling average compared to this study. Earlier in that
decade, Thomas, Schlinker, and Over (1996) summed that since men and women of the
same overall bowling average in their study had similar psychological and psychomotor skill
profiles, ten-pin bowling should be considered a gender-neutral sport. This latter proposition
seems rather appropriate in light of the dearth of published literature on this simple issue.
The mean BSaveof 213 for elite and 181 pin falls for semi-elite over three tournaments
closest to the data collection date highlights that both the groups consists of high calibre
bowlers. As this point in time, it was the highest level of bowlers used in any published
study. Comparatively, Thomas, Schlinker, and Over (1996) recruited league bowlers ranging
from 112 to 186 pin falls, Tan, Aziz, and Teh (2000) utilised elite bowlers with a mean
bowling average of 193 pin falls while Harris (2008) used elite bowlers with a mean of 200
pin falls and novices with a mean of 103 pin falls.
In relation to ball release velocity, even though there were differences in overall ball release
velocities between male (8.05 m/s) and female (7.72 m/s) bowlers, this difference was not
statistically significant. There were also no significant difference in ball velocity between
the elite (8.00 m/s) and semi-elite (7.78 m/s) groups. In addition, this study found no
significant relationship between ball release velocity and BSave. Although it is common
notion (Benson, 2000; Strickland, 1996) to equate the modern game in bowling as being a
power game, this apparent lack of relationship suggested that there is possibly a ball velocity

71
threshold – after which any increase in ball velocity does not necessarily equate to better
scores. The scatter plot in Figure 4.1 indicating that these high level bowlers released the
ball between 7.5 to 8.5 m/s.
Consequently, the decision to group males and females together based on bowling
performance, and to use BSave as the sole performance indicating dependent variable were
deemed appropriate for this study.
Figure 4.1: Scatter plot of ball release velocity for various bowling averages

72
4.2 Anthropometry and Strength
4.2.1Results of Anthropometric Comparisons
Means for anthropometric results are presented in Table 4.2. There was a significant
interaction effect for SH:LL Ratio. Follow-up analyses using separate t-tests for the three
different groups revealed that the SH:LL Ratio for males and females were significantly
different only for the semi-elite, t(10) = 5.06, p< .001, and non-bowlers groups, t(31) = 3.16,
p = .004. There were no group differences within each gender.
There were significant main effects for gender in height, weight, tibial length, armspan and
hand length. In addition, there were significant main effects for groups in terms of weight,
tibial length, armspan and hand length. For body weight, the elite bowlers (M = 68.7± 12.9
kg) were heavier than the non-bowlers (M = 58.0± 11.2 kg). Both elite (M = 38.2± 2.2 cm)
and semi-elite bowlers (M = 38.2± 3.2 cm) had longer tibial length than the non-bowlers (M
= 35.7± 2.1 cm). Similarly, elite (M = 172.1± 8.1 cm) and semi-elite (M = 172.6± 12.9 cm)
bowlers had longer armspan compared to the non-bowlers (M = 164.0± 9.7 cm). For hand,
elite bowlers (M = 18.6± 1.0 cm) hands were longer than non-bowlers (M = 17.6± 1.1 cm).
4.2.2 Results of Isometric Upper Limb Strength Comparisons
Means for strength measurements are presented in Table 4.2. There was a significant
interaction effect for arm flexion. Follow up using a separate one-way ANOVA for each
gender revealed that there was a significant difference for the male group, F (2,57) = 8.88, p =
.001, whereby the male elite bowlers had significantly higher arm flexion scores compared
to the male non-bowlers, but differences between female elite bowlers and female non-
bowlers were not detected. There was a significant main effect for gender whereby the males
had higher scores in the pinch strength between theindex to thumb and middle finger to

73
thumb as well as for arm flexion, wrist flexion, FIR and FER. Meanwhile, there was also a
significant main effect for group FIR. The elite bowlers (M = 6.17 ±2.28 kg) had stronger
FIR compared to non-bowlers (M = 4.35 ±1.42 kg).
4.2.3 Relationship to Bowling Average
The bivariate correlation analysis showed that none of the anthropometric and strength
variables had any significant (p>.05) correlation with bowling average. Table 4.3 shows the
Pearson product-moment correlation coefficient values for all anthropometric and strength.
4.2.4Discriminant Analysis ofPhysical Attribute Variables
Firstly, the selection of variables to be included in the discriminant analysis was based on
whether there was a significant difference between groups for the specific variables. As a
result, weight, tibial length, armspan, hand length, arm flexion and FIR were short listed
(refer to Table 4.2). Secondly, to adhere to the multicolinearity assumption, shortlisted
variables that had high co-correlation (r > .05) were omitted. Consequently, only weight,
hand length and FIR were used as variables in the analysis. Box’s M indicated that
assumptions of equality of variance-covariance matrices were met. The discriminant
analysis indicated the presence of two functions. The first indicated an emphasis on the
strength and mass dimension while the second reflected more on the anthropometric
dimension (refer to Table 4.4). Only the first function was significant (p = .002), but the
model only explains for 28.8% of variation in the grouping variable. The cross-validated
classification showed that overall, 54.0% of the participants were correctly classified.
Within each group, 55.6% of the elite, 16.7% of the semi-elite and 66.7% of the non-
bowlers were correctly placed in their respective groups. There were high (r > .30) loadings
for all variables in the first function, with FIR being the best predictor.

74
Table 4.2: Anthropometric and Normalised Isometric Upper Body Strength (%Body Weight) Measures of Elite Bowlers, Semi-Elite Bowlers and Non-Bowlers (reported as Mean ±SD)
Male FemaleElite Semi-Elite Non-Bowlers Elite Semi-Elite Non-Bowlers
Age 23.6 ± 3.9 20.6 ± 2.4 22.00± 1.6 22.4 ± 5.6 20.6 ± 4.0 22.6 ± 1.4Height (cm) † 170.7 ±8.7 171.8 ±8.3 167.2 ±7.3 162.6 ±4.8 159.0 ±7.2 157.0 ±4.5SH:LL Ratio* † 1.05 ±0.04 0.99 ±0.03 1.02 ±0.06 1.06 ±0.06 1.10 ±0.47 1.08 ±0.45Weight (kg) † ‡ 69.6 ±12.9 68.0 ±19.9 66.7 ±13.7 67.5 ±13.7 56.6 ±5.4 53.6 ±9.4
Anthropometric MeasuresTibial Length (cm) † ‡ 39.0 ±2.3 40.1 ±2.6 37.2 ±1.8 37.2 ±1.7 35.6 ±1.9 34.5 ±1.6Armspan (cm) † ‡ 176.2 ±7.1 180.5 ±9.0 172.1 ±8.2 166.9 ±6.2 161.6 ±8.5 158.0 ±5.4Upper arm (cm) + 33.9 ±1.9 34.0 ±2.0 32.7 ±1.8 30.9 ±1.2 29.6 ±1.0 30.1 ±1.3Forearm (cm) + 28.0 ±1.3 28.6 ±1.6 26.6 ±1.6 26.2 ±1.8 24.7 ±1.1 24.0 ±0.9Hand Length (cm) † ‡ 18.8 ±1.1 19.3 ±1.3 19.4 ±1.1 18.2 ±0.9 17.1 ±0.9 17.0 ±0.6Biacromial Breadth (cm) + 40.3 ±1.7 39.4 ±3.3 38.8 ±2.0 36.3 ±1.1 35.2 ±1.9 33.6 ±1.5Biiliac Breadth (cm) 28.0 ±3.8 27.3 ±3.3 27.0 ±1.8 27.5 ±2.8 26.5 ±1.5 26.2 ±1.2
Strength MeasuresIndex Finger to Thumb Pinch (%) † 8.46 ±1.49 8.70 ±2.01 7.47 ±1.34 6.42 ±1.24 7.27 ±1.90 6.60 ±1.51Middle Finger to Thumb Pinch (%)† 7.10 ±1.95 7.33 ±1.85 5.97 ±2.07 6.62 ±1.55 5.04 ±1.11 5.75 ±1.57
Third Finger To Thumb Pinch (%) 4.06 ±1.38 5.22 ±1.45 4.10 ±1.44 3.99 ±1.30 3.71 ±0.84 3.97 ±1.03Arm Flexion (%) * † ‡ § 35.31 ±5.16 30.17 ±6.59 § 26.51 ±4.04 21.40 ±5.12 19.72 ±6.15 20.78 ±5.07Wrist Flexion (%) † 20.13 ±2.77 18.33 ±3.95 16.46 ±2.42 12.98 ±3.77 13.62 ±3.70 12.54 ±2.52Forearm Internal Rotation (%) † ‡ 7.63 ±1.95 6.05 ±1.23 5.41 ±1.28 4.33 ±0.91 4.10 ±0.86 3.57 ±0.96Forearm External Rotation (%) † 6.79 ±1.71 6.79 ±1.49 5.95 ±1.31 4.25 ±0.96 3.98 ±1.01 4.34 ±1.03* Significant interaction effect (p<0.05) † Significant main effect for gender, significant difference (p<0.05) between males and females‡ Significant main effect for group (p<0.05)§ Significant difference between groups (p<0.05), from separate one-way ANOVA for males and females+Upper arm, Forearm and Biacromial breadth were not used in further analysis as it had high (p>0.90) co-correlation with Armspan.

75
Table 4.3: Correlation matrix between measured variables and performance
Anthropometric Measures Bowling Average
Standing Height .022
Body Weight .199
Seated Height to Leg Length Ratio .143
Tibial Length .000
Armspan -.001
Hand Length .089
Biiliac Breadth .083
Isometric Strength Measures
Index (2nd) Finger to Thumb -.072
Middle (3rd) Finger to Thumb .173
Ring (4th) Finger to Thumb -.221
Arm Flexion .291
Wrist Flexion .170
Internal Rotation .308
External Rotation .043
Table 4.4: Discriminant function results for anthropometry and strength
Structure Matrix of Function Discriminant Function Coefficients
1 2 UnstandardisedCoefficients
Forearm Internal Rotation .74* .04 49.11
Weight .59* .04 .06
Hand Length .58 .79* -.07
Constant -4.78
* Largest absolute correlation between each variable and either discriminant function

76
4.2.5Anthropometry and Strength Discussion
In an effort to identify characteristics that are potentially critical to performance,
comparisons between elite bowlers, semi-elite bowlers and non-bowlers were made, and
relationships between these characteristics with bowling performance (bowling average
score) were investigated. The bowling group was distinguished based on a single
performance variable, which was the BSave.
Although there were no gender differences in terms of bowling performance, there were
significant differences between males and females in a number of anthropometric and
strength variables. Males were taller, heavier, had longer limbs and had stronger finger
pinch, arm and wrist flexion as well as forearm/wrist rotation strength. These results are
similar to previous research findings and the common understanding that there are gender
differences in the physical characteristics of athletes (Gabbett & Gieorgieff, 2007; Tan, Aziz
& Teh, 2000) as well as in the normal population (Wolfe & Gray, 1982).
In terms of group differences for anthropometric variables, the results indicated that bowlers
and non-bowlers were quite different. Elite bowlers were heavier than the non-bowlers. In
addition, the elite and semi-elite bowlers had significantly longer upper limbs and lower leg
length compared to the non-bowling counterparts although they did not significantly differ
in stature. A number of other studies had shown that relationships existed between
anthropometric characteristics and sports performance. Body mass have been shown to be
positively correlated with throwing velocity (Van den Tillaar & Ettema, 2004b) and kicking
prowess (Wong et al., 2009). At the same time, longer limbs have been shown to be
positively related to better over-arm throwing performance (Pyne et al., 2006). In fact, an
early study in ten pin bowling had also found that longer arm span correlated with better

77
bowling scores (Curtis, 1951) but as technique and technology in bowling has changed so
much in the past 60 odd years it makes this particular finding rather obsolete.
Longer limbs and more mass (presumably muscle) could be advantageous in tenpin bowling.
The whole arm can be assumed as a fixed rod with a ball held at one end and the shoulder
joint as the point of rotation. For an equivalent swing velocity, an increase in the arm length
will theoretically lead to an increase in the tangential velocity of the ball (tangential velocity
= angular velocity x radius arm). Hence, it is theoretically possible that individuals with
longer limbs would have an advantage by having to put in less effort to reach the desired
ball release speeds. With modern bowling considered to be a power game, this would mean
that the longer ‘arm’ provided by the longer segments and larger muscle mass would be the
desired foundation towards becoming a good bowler. Consequently, talent identification
programs in bowling may benefit by paying particular interest to young bowlers with above
average build and upper limb length.
Despite several anthropometric differences between the bowlers and non-bowlers, more
importantly, there was no significant anthropometric difference specifically distinguishing
the elite from the semi-elite bowlers. This finding was also supported by the fact that none
of the anthropometric variables showed a significant linear relationship with BSave.
Collectively, it would seem that bowling unlike certain physical based sports (i.e. basketball,
volleyball, and rugby), is a sport where participants of all sizes – big or small – have a pretty
equal chance of being successful at the highest level.

78
Meanwhile, in terms of isometric strength measurements, the only notable differences were
found for FIR and arm flexion. Furthermore, although not significantly correlated, the
highest correlation to BSave was also for FIR and arm flexion.
For FIR, there appeared to be a significant difference between groups. More specifically, the
follow-up test showed that FIR strength was higher for the elite bowlers as compared to the
non-bowlers. With forearm/wrist rotators as the most likely primary generators of the
tremendous ball spin commonly seen in the modern game and considering that skilful and
experienced players impart huge amounts of spin on the bowling ball, the first possibility is
that the elite bowlers developed stronger internal rotators of the forearm/wrist region, having
amassed much more practice and playing years. A study on handball corroborated this
possibility of strength increasing with playing years whereby the authors showed that ball
throwing velocity and strength greatly increased with just one regular season of active
competition (Gorostiaga, 2006). Comparatively, a Malaysian elite bowler participates in
various competitions and is in active training for 10 months in a year (Cheah, 2009).
A second possibility is that the physical requirements of the sport contributed to the
differences in the FIR between the elite and non-bowling group. A common misconception
is that bowling is not a physically challenging sport (Thomas, Schlinker, & Over, 1996;
Wiedman, 2006). In reality, a bowler swings a 12 to 16 pound ball, for 12 to 21 times a
game for usually six games a day, during competition. Each swing is executed at a
considerable speed to generate high ball momentum. It has been argued that a decent amount
of muscle strength and muscle endurance was required for the execution of the delivery
(Tan, Aziz, & Teh, 2000; Tan et al, 2001). Hence, the participants in the elite group could
have possessed a higher degree of FIR strength which was required to be successful .

79
To answer this quandary, a partial correlation was done looking at the relationship between
FIR and BSave while controlling for years of playing experience. The result was not
significant (r = .36, p <.05), the relationship was only marginally higher than when playing
experience was not controlled for. This suggested that elite bowlers had stronger FIR
irrespective of how long they had played bowling. However it can be argued that this
suggestion is not conclusive, as years of playing experience does not necessarily equate to
actual competition and training hours.
Apart from the contributions of the forearm/wrist rotators, significant differences between
groups were also detected for arm flexion strength. The follow-up ANOVA revealed that the
male elite bowlers were stronger than their non-bowling counterparts. This result appeared
logical considering that the arm flexors play an integral role in the forward motion of the
forearm in the final phase of the swing. However, the female elite bowlers did not appear to
be stronger than the female non-bowlers. There could be two possible explanations for the
contrast between genders. Firstly, the females may have employed a different strategy in
their swing. Instead of utilising a lot of strength, they relied on optimum technique to
achieve the same competitive scores. Female bowlers may have concentrated on spin and
accuracy rather than outright ball speed. This explanation is highlighted in a swimming
technique study whereby the female swimmers employed a different front crawl technique
to achieve the same effective velocity as males (Seifert, Boulesteix, & Chollet, 2004).
Alternately, it is also likely that as the strength of bowlers increased over the period of
participation, these changes were possibly more apparent in the men possibly due to
hormonal differences between genders.

80
Interestingly, finger pinch strength did not differ between the groups. One would assume
that a strong finger grip was needed to have good control of the heavy bowling ball but the
results did not support this assumption. It is likely that proper ball grip technique was more
important than outright finger strength when it came to handling the ball. This result was in
agreement with one study that found that hand grip strength was not correlated with bowling
scores (Tan, Aziz, & Teh, 2000). The authors had suggested that there was a strength
threshold that was needed to bowl competitively, after which, further strength gains were not
essential. This suggestion seem to hold true here as well as the correlation coefficient of all
strength variables to BSave was weak and non significant, leading to an assumption of a
threshold. Nonetheless, results from the strength tests provides a useful input for coaches in
terms of highlighting the necessary muscle groups that need to be trained to be competitive
in bowling.
This study explored the anthropometric and strength parameters that bests distinguished the
elite, semi-elite and non-bowlers; with the best discriminators being considered the critical
parameters. A number of studies had successfully demonstrated that it was possible to
statistically discriminate good and not so good players in various sports (Barker et al., 1993;
Barrett & Manning, 2004; Gabbett & Gieorgieff, 2007; Mohamed et al., 2009; Reily,
Bangsbo, & Franks, 2000; Tan et al., 2009).
Utilising the discriminant analysis, the generated function successfully classified 54.0% of
the participant into their respective groups. In a three group setting such as in this study,
there was a 33.33% possibility of placing a group member in the correct group by chance,
hence, an overall prediction accuracy that is double the value of chance would have been

81
ideal. For example, in a two group study using discriminant analysis, a prediction accuracy
of 87.2% between elite and non-elite handball players was possible (Mohamed et al., 2009).
Based on the current results, it can be implied that it was not entirely possible to successfully
distinguish ten pin bowling playing ability from the selected physical characteristics used in
this study alone. Caution must be applied in interpreting the discriminant function, as there
was multicolinearity between the discriminator variables which necessitated the removal of
some variables from the analysis. For future research, a different set of non-correlated
variables should be used so that more predictor variables could be used in the function and
possibly increase its group predicting accuracy.
From the discriminant analysis, the FIR appeared to be the best distinguishing variable.
Along with the higher strength scores in the elite compared to non-bowlers group, the
relevance of FIR and ball spin in modern bowling was further supported and subsequently,
the importance of placing emphasis on strengthening the relevant arm rotator muscles in
bowler training are highlighted.
However, in relation to main objective of this study, the poor ability to especially
discriminate the semi-elite bowlers (only 16.7% success rate) coupled with the fact that
there were no significant differences in any of the anthropometric and strength variables
between elite and semi-elite bowlers suggested that there were no outstanding critical
parameters for anthropometry and strength based on the selected variables that was tested
for.

82
4.3 Kinematic Analysis
4.3.1 Kinematic Analysis Results
4.3.1.1 Movement Patterns
The near similar patterns of angular displacement and angular velocity for the shoulder,
elbow, hip and knee are presented graphically in Figures 4.2 and 4.3.
4.3.1.2 Kinematic Differences between Groups
The results are separated into seven sections (i.e., foot slide, knee joint, hip joint, trunk
position, shoulder joint, elbow joint, and ball height and ball velocity). Means and standard
deviations across all groups and genders for all variables in each section are presented in
Tables 4.5, 4.6, 4.7, 4.8, 4.9, 4.10 and 4.12 respectively.
Foot Slide - There was a significant main effect for gender for anterior-posterior velocity at
FFS (F1, 26 = 9.55, p = .005), anterior-posterior maximum velocity (F1, 26 = 8.74, p = .007)
and anterior-posterior maximum deceleration (F1, 26 = 5.55, p = .027). There were no
significant effects for groups. Interaction effects were also undetected.
Knee Joint - Similar to the foot slide, only significant gender effects were found, whereby
the angle range (F1, 26 =7.98, p = .009) for the males were bigger than the female bowlers.
Hip Joint - Although there was a significant interaction effect for hip joint angle at TBS, F(1,
26) = 5.91, p = .022, no significant group differences were detected in the follow-up test.
There was also a significant gender effect for hip joint angle at FFS, F(1, 26) = 5.51, p = .027
but gender effect was not a priority area for this study.
Trunk Position - Only one significant effect was detected, for gender, for anterior-posterior
maximum deceleration, F(1, 26) = 6.62, p = .016.
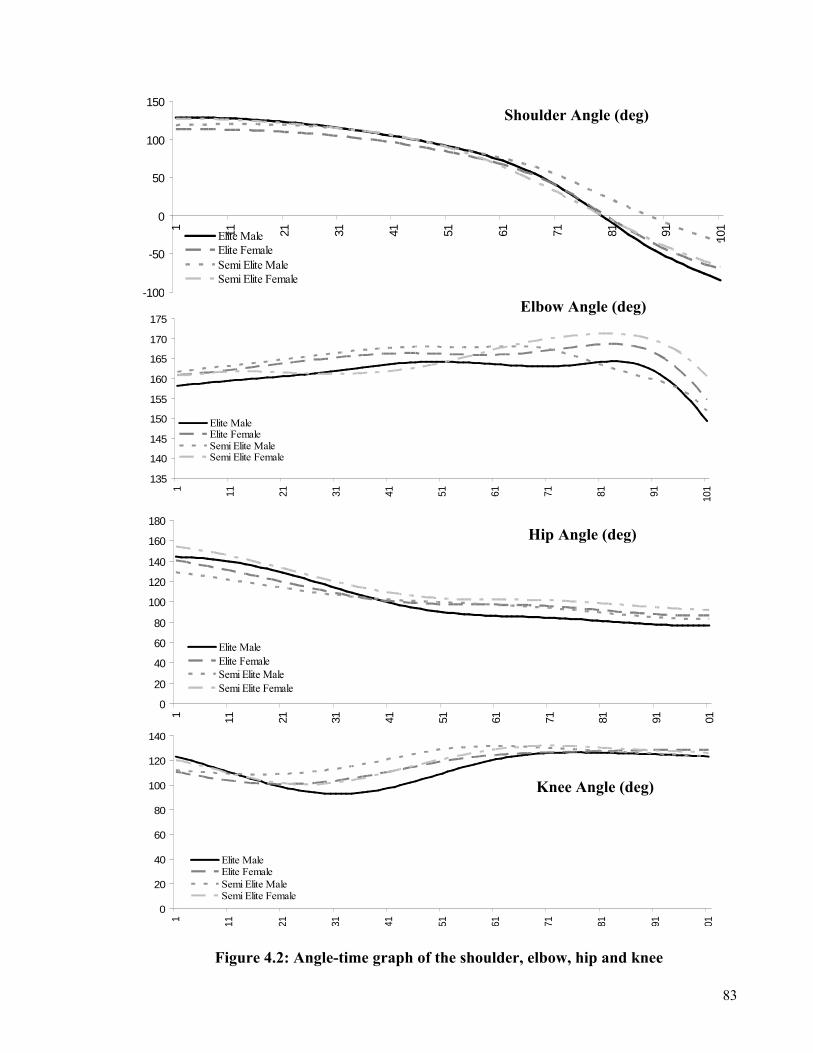
83
-100
-50
0
50
100
150
1 11 21 31 41 51 61 71 81 91 101
Elite MaleElite FemaleSemi Elite MaleSemi Elite Female
135
140
145
150
155
160
165
170
175
1 11 21 31 41 51 61 71 81 91 101
Elite MaleElite FemaleSemi Elite MaleSemi Elite Female
0
20
40
60
80
100
120
140
160
180
1 11 21 31 41 51 61 71 81 91 101
Elite MaleElite FemaleSemi Elite MaleSemi Elite Female
0
20
40
60
80
100
120
140
1 11 21 31 41 51 61 71 81 91 101
Elite MaleElite FemaleSemi Elite MaleSemi Elite Female
Figure 4.2: Angle-time graph of the shoulder, elbow, hip and knee
Shoulder Angle (deg)
Elbow Angle (deg)
Hip Angle (deg)
Knee Angle (deg)

84
-1000
-800
-600
-400
-200
0
200
1 11 21 31 41 51 61 71 81 91 101
Elite MaleElite FemaleSemi Elite MaleSemi Elite Female
-350
-300
-250
-200
-150
-100
-50
0
50
100
1 11 21 31 41 51 61 71 81 91 101
Elite MaleElite FemaleSemi Elite MaleSemi Elite Female
-300
-250
-200
-150
-100
-50
0
50
1 11 21 31 41 51 61 71 81 91 101
Elite MaleElite FemaleSemi Elite MaleSemi Elite Female
-300
-200
-100
0
100
200
300
1 11 21 31 41 51 61 71 81 91 101
Elite MaleElite FemaleSemi Elite MaleSemi Elite Female
Figure 4.3: Angular velocity-time graph of the shoulder, elbow, hip and knee
Shoulder Angular Velocity (deg/s)
Elbow Angular Velocity (deg/s)
Hip Angular Velocity (deg/s)
Knee Angular Velocity (deg/s)

85
Table 4.5: Means for kinematic and inter-trial variability variables of the foot slide (N=29)Kinematic Variable Elite Semi-Elite Elite (M) Elite (F) Semi-Elite (M) Semi-Elite (F)
Ant-Post Velocity at FFS (m/s) § 6.09 ±0.63 5.99 ±0.71 6.36 ±0.62 5.77 ±0.49 6.36 ±0.61 5.56 ±0.61
Ant-Post Peak Velocity (m/s) § 6.16 ±0.66 6.08 ±0.75 6.42 ±0.66 5.84 ±0.52 6.46 ±0.68 5.62 ±0.61
Time of Ant-Post Peak Velocity (s) 0.19 ±0.07 0.17 ±0.10 0.22 ±0.05 0.15 ±0.07 0.16 ±0.11 0.18 ±0.09
Ant-Post Peak Deceleration (m/s2) § -34.34 ±8.98 -35.28 ±10.60 -38.10 ±7.81 -29.64 ±8.49 -38.82 ±12.07 -31.02 ±7.58
Time of Ant-Post Peak Deceleration (s) 0.31 ±0.06 0.30 ±0.10 0.33 ±0.06 0.28 ±0.06 0.28 ±0.13 0.33 ±0.05
Slide Distance (m) 1.04 ±0.15 0.92 ±0.19 1.01 ±0.18 1.09 ±0.10 0.88 ±0.23 0.98 ±0.13
Variability Variable Elite Semi-Elite Elite (M) Elite (F) Semi-Elite (M) Semi-Elite (F)
SD of Lateral Position at FFS ▲* 0.015 ±0.007 0.023 ±0.010 0.017 ±0.005 0.014 ±0.009 0.018 ±0.007 0.030 ±0.010
SD of Lateral Position at REL 0.015 ±0.008 0.019 ±0.007 0.013 ±0.006 0.018 ±0.009 0.021 ±0.006 0.016 ±0.009
SD of Ant-Post Position at FFS 0.151 ±0.071 0.136 ±0.068 0.163 ±0.083 0.137 ±0.055 0.170 ±0.061 0.096 ±0.055
SD of Ant-Post Position at REL 0.023 ±0.018 0.030 ±0.020 0.025 ±0.018 0.022 ±0.020 0.032 ±0.022 0.028 ±0.018
SD of Slide Distance ▲ 0.073 ±0.024 0.047 ±0.019 0.062 ±0.022 0.086 ±0.020 0.048 ±0.021 0.046 ±0.019
* Significant interaction effect (p<0.05) § Significant main effect for gender, significant difference (p<0.05) between males and females▲ Significant main effect for group, significant difference (p<0.05) between elite and semi-elite bowlers
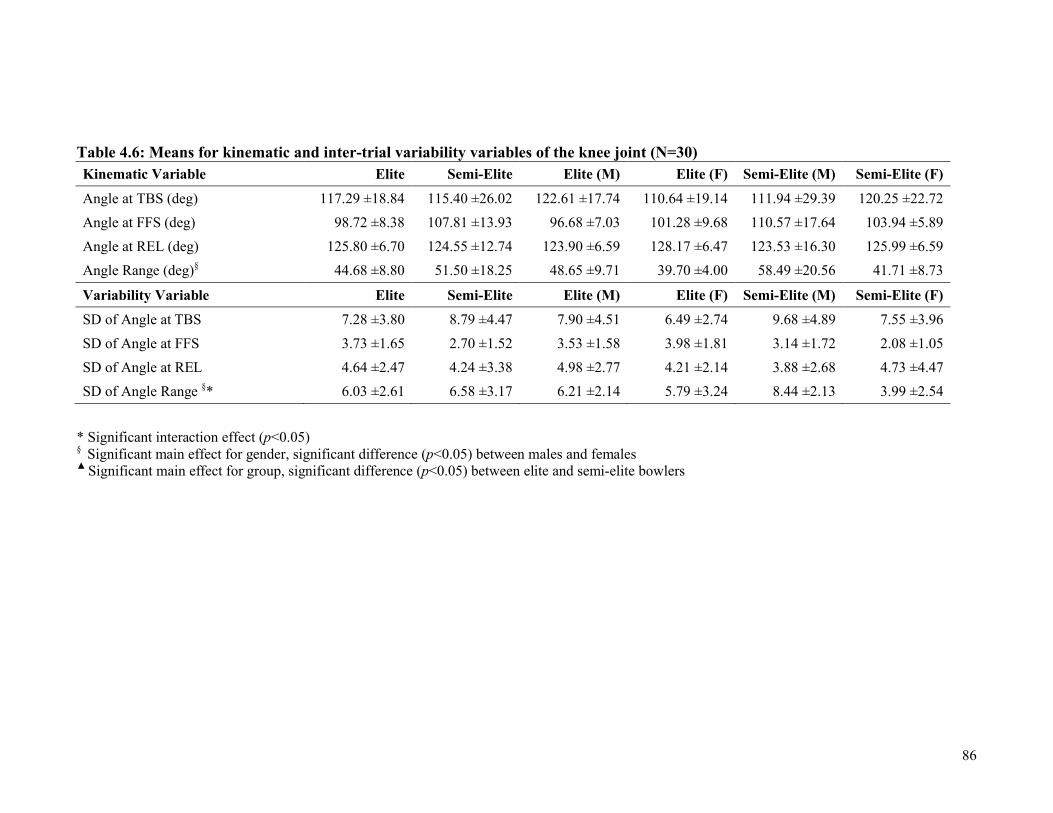
86
Table 4.6: Means for kinematic and inter-trial variability variables of the knee joint (N=30)Kinematic Variable Elite Semi-Elite Elite (M) Elite (F) Semi-Elite (M) Semi-Elite (F)
Angle at TBS (deg) 117.29 ±18.84 115.40 ±26.02 122.61 ±17.74 110.64 ±19.14 111.94 ±29.39 120.25 ±22.72
Angle at FFS (deg) 98.72 ±8.38 107.81 ±13.93 96.68 ±7.03 101.28 ±9.68 110.57 ±17.64 103.94 ±5.89
Angle at REL (deg) 125.80 ±6.70 124.55 ±12.74 123.90 ±6.59 128.17 ±6.47 123.53 ±16.30 125.99 ±6.59
Angle Range (deg)§ 44.68 ±8.80 51.50 ±18.25 48.65 ±9.71 39.70 ±4.00 58.49 ±20.56 41.71 ±8.73
Variability Variable Elite Semi-Elite Elite (M) Elite (F) Semi-Elite (M) Semi-Elite (F)
SD of Angle at TBS 7.28 ±3.80 8.79 ±4.47 7.90 ±4.51 6.49 ±2.74 9.68 ±4.89 7.55 ±3.96
SD of Angle at FFS 3.73 ±1.65 2.70 ±1.52 3.53 ±1.58 3.98 ±1.81 3.14 ±1.72 2.08 ±1.05
SD of Angle at REL 4.64 ±2.47 4.24 ±3.38 4.98 ±2.77 4.21 ±2.14 3.88 ±2.68 4.73 ±4.47
SD of Angle Range §* 6.03 ±2.61 6.58 ±3.17 6.21 ±2.14 5.79 ±3.24 8.44 ±2.13 3.99 ±2.54
* Significant interaction effect (p<0.05) § Significant main effect for gender, significant difference (p<0.05) between males and females▲ Significant main effect for group, significant difference (p<0.05) between elite and semi-elite bowlers

87
Table 4.7: Means for kinematic and inter-trial variability variables of the hip joint (N=30)Kinematic Variable Elite Semi-Elite Elite (M) Elite (F) Semi-Elite (M) Semi-Elite (F)
Angle at TBS (deg)* 144.35 ±13.53 139.42 ±24.34 147.30 ±14.48 140.65 ±12.12 129.07 ±24.81 153.91 ±16.01
Angle at FFS (deg)§ 104.98 ±13.71 108.16 ±14.66 99.82 ±10.30 111.43 ±15.31 103.24 ±14.03 115.05 ±13.92
Angle at REL (deg) 82.32 ±12.20 86.99 ±8.97 78.90 ±13.10 86.59 ±10.17 83.39 ±7.48 92.02 ±9.11
Angle Range (deg) 74.05 ±12.53 68.96 ±17.17 74.99 ±15.08 72.87 ±9.28 65.69 ±18.11 73.55 ±16.56
Variability Variable Elite Semi-Elite Elite (M) Elite (F) Semi-Elite (M) Semi-Elite (F)
SD of Angle at TBS 5.91 ±3.34 4.92 ±4.78 5.18 ±3.39 6.81 ±3.26 6.01 ±6.07 3.39 ±1.59
SD of Angle at FFS 3.95 ±1.90 2.88 ±1.55 3.44 ±2.07 4.58 ±1.57 2.42 ±1.45 3.52 ±1.60
SD of Angle at REL 4.55 ±2.65 4.65 ±2.39 5.09 ±3.42 3.88 ±1.04 5.04 ±2.20 4.11 ±2.80
SD of Angle Range 4.82 ±4.02 6.84 ±5.10 3.30 ±2.62 6.71 ±4.81 6.83 ±4.72 6.84 ±6.18
* Significant interaction effect (p<0.05) § Significant main effect for gender, significant difference (p<0.05) between males and females▲ Significant main effect for group, significant difference (p<0.05) between elite and semi-elite bowlers

88
Table 4.8: Means for kinematic and inter-trial variability variables of the trunk (N=30)Kinematic Variable Elite Semi-Elite Elite (M) Elite (F) Semi-Elite (M) Semi-Elite (F)
Ant-Post Velocity at TBS (m/s) 2.22 ±0.28 2.21 ±0.32 2.26 ±0.32 2.17 ±0.23 2.29 ±0.34 2.09 ±0.27
Ant-Post Velocity at FFS (m/s) 2.67 ±0.36 2.48 ±0.35 2.80 ±0.38 2.50 ±0.26 2.57 ±0.26 2.36 ±0.44
Ant-Post Velocity at REL (m/s) 0.99 ±0.22 0.82 ±0.30 1.02 ±0.23 0.95 ±0.21 0.72 ±0.27 0.96 ±0.32
Ant-Post Peak Velocity (m/s) 2.87 ±0.30 2.69 ±0.28 2.92 ±0.39 2.81 ±0.12 2.74 ±0.18 2.61 ±0.39
Time of Ant-Post Peak Velocity (s) 0.24 ±0.06 0.23 ±0.10 0.24 ±0.08 0.25 ±0.04 0.20 ±0.12 0.27 ±0.03
Ant-Post Peak Deceleration (m/s2) § -10.92 ±2.59 -11.11 ±2.61 -11.47 ±3.08 -10.24 ±1.79 -12.53 ±2.17 -9.12 ±1.78
Time of Ant-Post Peak Deceleration (s) 0.43 ±0.06 0.41 ±0.10 0.43 ±0.06 0.42 ±0.05 0.39 ±0.13 0.44 ±0.03
Variability Variable Elite Semi-Elite Elite (M) Elite (F) Semi-Elite (M) Semi-Elite (F)
SD of Lateral Position at TBS * 0.014 ±0.007 0.017 ±0.009 0.015 ±0.009 0.013 ±0.005 0.013 ±0.006 0.023 ±0.008
SD of Lateral Position at FFS 0.013 ±0.007 0.016 ±0.009 0.013 ±0.009 0.013 ±0.005 0.013 ±0.006 0.021 ±0.010
SD of Lateral Position at REL 0.015 ±0.011 0.016 ±0.007 0.015 ±0.014 0.015 ±0.006 0.016 ±0.004 0.016 ±0.011
SD of Ant-Post Position at FFS § 0.059 ±0.026 0.052 ±0.013 0.067 ±0.028 0.048 ±0.021 0.059 ±0.009 0.042 ±0.013
SD of Ant-Post Position at REL 0.021 ±0.011 0.022 ±0.019 0.024 ±0.012 0.017 ±0.006 0.020 ±0.020 0.026 ±0.018
SD of Sup-Infe Position at FFS 0.017 ±0.021 0.009 ±0.004 0.023 ±0.027 0.008 ±0.004 0.011 ±0.003 0.007 ±0.004
SD of Sup-Infe Position at REL 0.012 ±0.016 0.008 ±0.003 0.016 ±0.022 0.008 ±0.002 0.010 ±0.002 0.006 ±0.003
* Significant interaction effect (p<0.05) § Significant main effect for gender, significant difference (p<0.05) between males and females▲ Significant main effect for group, significant difference (p<0.05) between elite and semi-elite bowlers

89
Table 4.9: Means for kinematic and inter-trial variability variables of the shoulder joint (N=29) Kinematic Variable Elite Semi-Elite Elite (M) Elite (F) Semi-Elite (M) Semi-Elite (F)
Angle at TBS (deg) 122.99 ±19.41 122.10 ±18.64 131.08 ±18.57 112.87 ±16.17 117.95 ±19.20 127.07 ±18.73
Angle at FFS (deg) 106.16 ±19.10 110.97 ±20.18 106.41 ±19.30 105.84 ±20.17 109.90 ±19.46 112.26 ±23.25
Angle at REL (deg)§ -78.22 ±15.92 -76.98 ±14.85 -84.37 ±15.10 -70.54 ±14.17 -85.22 ±12.59 -67.08 ±11.34
Angular Velocity at FFS (deg/s)▲* -194.16 ±75.77 -116.62 ±91.19 -217.68 ±61.28 -164.76 ±85.66 -83.29 ±70.77 -156.62 ±104.23
Angular Velocity at REL (deg/s) -461.64 ±125.44 -438.61 ±95.96 -498.22 ±147.93 -415.92 ±76.03 -443.52 ±124.60 -432.72 ±59.43
Peak Angular Velocity (deg/s) -1006 ±429.09 -908 ±451.53 -1048 ±372.25 -954 ±513.31 -969 ±590.54 -835 ±249.71
Time of Peak Angular Velocity (s) 75.78 ±4.85 69.73 ±12.65 75.30 ±5.14 76.38 ±4.72 65.17 ±14.27 75.20 ±8.76
Peak Angular Acceleration (deg/s2) -10165 ±8109 -10468 ±6984 -10340 ±6765 -9946 ±10039 -14150 ±6973 -6050 ±4054
Time Peak Angular Acceleration (s) 61.17 ±12.39 58.73 ±14.00 64.80 ±6.61 56.63 ±16.55 55.00 ±17.41 63.20 ±8.07
Peak Angular Deceleration (deg/s2) 7806 ±7300.01 8234 ±6057.22 7452 ±5713.87 8250 ±9330.21 10776 ±6810.35 5184 ±3524.64
Time Peak Angular Deceleration (s)§▲ 86.06 ±4.63 79.27 ±12.43 84.20 ±4.59 88.38 ±3.74 73.83 ±12.61 85.80 ±9.47
Angle Range (deg) 201.03 ±32.49 199.07 ±26.44 215.12 ±31.98 183.42 ±24.70 203.17 ±29.17 194.15 ±25.06
TBS to REL Swing Time (s) 0.54 ±0.05 0.53 ±0.10 0.55 ±0.05 0.52 ±0.04 0.52 ±0.13 0.54 ±0.02
Variability Variable Elite Semi-Elite Elite (M) Elite (F) Semi-Elite (M) Semi-Elite (F)
SD of Angle at TBS 2.27 ±1.16 2.43 ±1.12 2.30 ±1.22 2.24 ±1.17 2.45 ±1.35 2.41 ±0.91
SD of Angle at FFS 2.96 ±1.02 3.25 ±2.02 3.29 ±1.01 2.55 ±0.94 2.95 ±2.44 3.61 ±1.57
SD of Angle at REL 5.40 ±3.59 4.30 ±2.06 6.54 ±4.16 4.11 ±2.48 4.34 ±2.22 4.25 ±2.10
SD of Angle Range 6.77 ±5.34 4.18 ±1.71 8.62 ±6.23 4.46 ±2.89 4.53 ±2.24 3.77 ±0.81
SD of TBS to REL Swing Time 0.03 ±0.01 0.03 ±0.01 0.03 ±0.02 0.03 ±0.01 0.03 ±0.02 0.03 ±0.01
* Significant interaction effect (p<0.05) § Significant main effect for gender, significant difference (p<0.05) between males and females▲ Significant main effect for group, significant difference (p<0.05) between elite and semi-elite bowlers

90
Table 4.10: Means for kinematic and inter-trial variability variables of the elbow joint (N=29)Kinematic Variable Elite Semi-Elite Elite (M) Elite (F) Semi-Elite (M) Semi-Elite (F)
Angle at TBS (deg) 159.46 ±6.15 160.59 ±6.77 158.36 ±6.25 160.83 ±6.14 160.48 ±6.74 160.73 ±7.60
Angle at FFS (deg) 164.96 ±5.30 163.32 ±8.34 163.77 ±4.83 166.46 ±5.81 165.53 ±5.33 160.22 ±11.31
Angle at REL (deg)§ 151.44 ±7.95 155.69 ±7.90 148.72 ±7.59 154.84 ±7.47 152.19 ±7.65 160.60 ±5.69
Angular Velocity at FFS (deg/s) 28.98 ±40.61 7.32 ±52.46 41.27 ±47.88 15.16 ±27.17 13.84 ±57.09 -1.81 ±50.01
Angular Velocity at REL (deg/s) ▲ -325.12 ±83.79 -267.54 ±41.91 -340.34 ±95.98 -306.09 ±66.78 -267.77 ±54.87 -267.22 ±17.71
Angle Range (deg) 8.97 ±7.23 9.33 ±3.78 9.71 ±9.11 8.04 ±4.32 10.71 ±3.77 7.39 ±3.16
Variability Variable Elite Semi-Elite Elite (M) Elite (F) Semi-Elite (M) Semi-Elite (F)
SD of Angle at TBS 2.20 ±1.19 2.72 ±1.81 2.28 ±1.36 2.09 ±1.02 3.04 ±1.74 2.27 ±2.01
SD of Angle at FFS 1.66 ±0.78 2.09 ±1.09 1.82 ±0.70 1.46 ±0.87 2.11 ±0.93 2.06 ±1.40
SD of Angle at REL 4.14 ±4.99 2.59 ±0.87 5.68 ±6.32 2.22 ±1.25 2.34 ±0.90 2.94 ±0.76
SD of Angle Range 3.11 ±1.65 3.63 ±0.83 3.29 ±2.00 2.90 ±1.26 3.65 ±0.62 3.60 ±1.15
* Significant interaction effect (p<0.05) § Significant main effect for gender, significant difference (p<0.05) between males and females▲ Significant main effect for group, significant difference (p<0.05) between elite and semi-elite bowlers

91
Table 4.11: Means for inter-trial variability variables of the wrist (N=29)Variability Variable Elite Semi-Elite Elite (M) Elite (F) Semi-Elite (M) Semi-Elite (F)
SD of Lateral Position at TBS * 0.017 ±0.009 0.021 ±0.006 0.021 ±0.010 0.013 ±0.007 0.018 ±0.007 0.024 ±0.005
SD of Lateral Position at FFS ▲ 0.014 ±0.009 0.021 ±0.008 0.014 ±0.009 0.015 ±0.009 0.020 ±0.008 0.023 ±0.009
SD of Lateral Position at REL ▲ 0.012 ±0.005 0.018 ±0.006 0.011 ±0.004 0.014 ±0.005 0.019 ±0.006 0.016 ±0.008
SD of Ant-Post Position at TBS 0.063 ±0.029 0.061 ±0.017 0.065 ±0.032 0.061 ±0.027 0.068 ±0.017 0.051 ±0.014
SD of Ant-Post Position at FFS 0.044 ±0.021 0.041 ±0.014 0.046 ±0.025 0.041 ±0.017 0.046 ±0.016 0.036 ±0.009
SD of Ant-Post Position at REL 0.044 ±0.031 0.035 ±0.019 0.040 ±0.036 0.048 ±0.026 0.034 ±0.024 0.036 ±0.010
SD of Sup-Infe Position at TBS § 0.019 ±0.010 0.023 ±0.012 0.023 ±0.011 0.014 ±0.006 0.029 ±0.012 0.016 ±0.007
SD of Sup-Infe Position at FFS § 0.055 ±0.032 0.049 ±0.029 0.068 ±0.034 0.039 ±0.019 0.058 ±0.031 0.037 ±0.023
SD of Sup-Infe Position at REL ▲ 0.020 ±0.010 0.012 ±0.006 0.021 ±0.010 0.017 ±0.009 0.012 ±0.007 0.013 ±0.004
* Significant interaction effect (p<0.05) § Significant main effect for gender, significant difference (p<0.05) between males and females▲ Significant main effect for group, significant difference (p<0.05) between elite and semi-elite bowlers

92
Table 4.12: Means for kinematic and inter-trial variability variables of ball height and ball velocity (N=30)Kinematic Variable Elite Semi-Elite Elite (M) Elite (F) Semi-Elite (M) Semi-Elite (F)
Peak Ball Height (normalised) (m)* 0.945 ±0.105 0.898 ±0.143 0.992 ±0.095 0.887 ±0.090 0.863 ±0.175 0.948 ±0.072
Ball Height (absolute) at REL (m)▲ 0.327 ±0.032 0.356 ±0.038 0.329 ±0.031 0.324 ±0.035 0.361 ±0.048 0.348 ±0.017
Variability Variable Elite Semi-Elite Elite (M) Elite (F) Semi-Elite (M) Semi-Elite (F)
SD of Peak Ball Height § 0.020 ±0.011 0.023 ±0.013 0.024 ±0.013 0.015 ±0.006 0.029 ±0.013 0.016 ±0.010
SD of Ball Height (absolute) at REL 0.022 ±0.012 0.016 ±0.007 0.025 ±0.014 0.018 ±0.010 0.019 ±0.008 0.013 ±0.005
SD of Ball Velocity at REL §* 0.250 ±0.190 0.170 ±0.122 0.366 ±0.183 0.105 ±0.044 0.184 ±0.151 0.150 ±0.076
* Significant interaction effect (p<0.05) § Significant main effect for gender, significant difference (p<0.05) between males and females▲ Significant main effect for group, significant difference (p<0.05) between elite and semi-elite bowlers

93
Shoulder Joint - There were significant effects for gender, group and the interaction between
the two. For gender, there were significant differences between the males and females for
shoulder joint angle at REL, F(1, 26) = 9.06, p = .006, and for time of maximum angular
deceleration, F(1, 26) = 7.64, p = .011. More importantly, for group, there were significant
differences between the elite and semi-elite bowlers for angular velocity at FFS, F(1, 26) =
5.59, p = .026, and for time of maximum angular deceleration, F(1, 26) = 4.91, p = .036, with
the elite group swinging at a faster rate and decelerating significantly later in the swing,
respectively. However, only the correlation between angular velocity at FFS and BSave was
found to be significant (r = -.438, p = .017). In addition, the interaction for angular velocity
at FFS was also significant, F(1, 26) = 4.38, p = .047, and the post hoc test revealed that the
shoulder joint of only the male elite bowlers were moving faster than the semi-elite male
counterparts.
Elbow Joint - No significant interaction effects were observed. However, there was a
significant gender effect for elbow joint angle at REL, F(1, 26) = 6.96, p = .014, and a
significant group effect for angular velocity at REL, F(1, 26) = 4.26, p = .049, with the elite
group flexing at a higher rate than the semi-elite group. Furthermore, the correlation
between angular velocity at REL and BSave was found to be significant (r = -.454, p = .012).
Ball Height and Ball Velocity - Although the interaction between gender and group was
significant for normalised ball height at TBS, F(1, 26) = 4.90, p = .036, the post hoc test
showed that there were no significant group differences within each gender. For absolute
ball height at REL, there was a significant group effect (F1, 26 = 4.45, p = .045), with the elite
bowlers releasing the ball closer to the lane than the semi-elite bowlers. The correlation
between absolute BH at REL and BSave was also significant (r = -.43, p = .019)
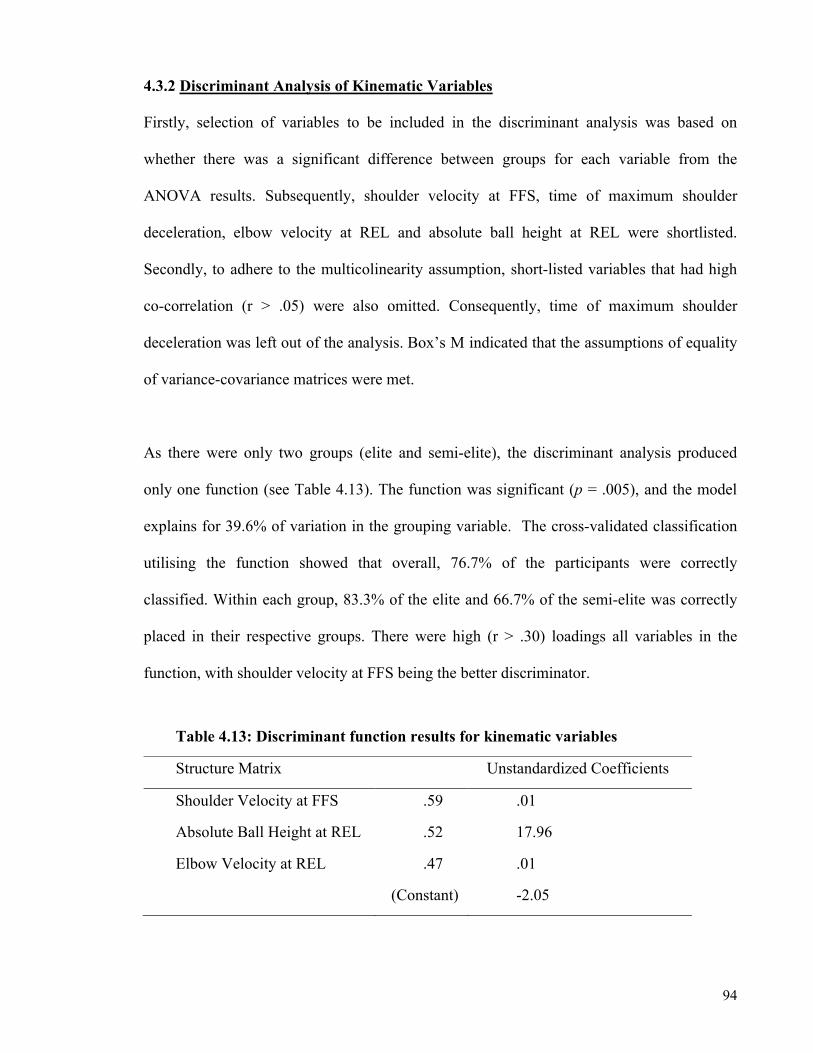
94
4.3.2 Discriminant Analysis of Kinematic Variables
Firstly, selection of variables to be included in the discriminant analysis was based on
whether there was a significant difference between groups for each variable from the
ANOVA results. Subsequently, shoulder velocity at FFS, time of maximum shoulder
deceleration, elbow velocity at REL and absolute ball height at REL were shortlisted.
Secondly, to adhere to the multicolinearity assumption, short-listed variables that had high
co-correlation (r > .05) were also omitted. Consequently, time of maximum shoulder
deceleration was left out of the analysis. Box’s M indicated that the assumptions of equality
of variance-covariance matrices were met.
As there were only two groups (elite and semi-elite), the discriminant analysis produced
only one function (see Table 4.13). The function was significant (p = .005), and the model
explains for 39.6% of variation in the grouping variable. The cross-validated classification
utilising the function showed that overall, 76.7% of the participants were correctly
classified. Within each group, 83.3% of the elite and 66.7% of the semi-elite was correctly
placed in their respective groups. There were high (r > .30) loadings all variables in the
function, with shoulder velocity at FFS being the better discriminator.
Table 4.13: Discriminant function results for kinematic variables
Structure Matrix Unstandardized Coefficients
Shoulder Velocity at FFS .59 .01
Absolute Ball Height at REL .52 17.96
Elbow Velocity at REL .47 .01
(Constant) -2.05

95
4.3.3Kinematic Discussion
4.3.3.1 Male and Female Bowlers
Although not the primary objective of this study, it is worth to note that there was significant
measurable difference between gender in seven discrete kinematics variables as well as five
absolute variability measures. As the BSave of male and female bowlers were not
significantly different, it can be established that the bowlers clearly adopted different ways
to achieve the same outcome goals. These differences of pattern between genders were also
reported by Chu, Zhang, and Mau (2002) in their exploratory work on ten pin bowling as
well as in other sports such as javelin (Gregor, Whiting, & McCoy, 1985); and discus (Leigh
& Yu, 2007). In Leigh and Yu’s (2007) study, although there was variation in overall
throwing performance between male and females, they suggested that elite female discus
throwers were reliant on effective technique to achieve long distances, whereas male discus
throwers have a relatively homogeneous technique, with a dependence on physical strength
to achieve their long throws. This observation could be applicable for bowling considering
that the male bowlers in this study were significantly stronger than their female counterparts
in nearly all measured areas (see Table 4.2). Even though there are differences in technique
and execution consistency between genders, this particular study was primarily interested in
the parameters of good performance only. Therefore considering that the male and female
bowlers have near similar outcome performance (similar BSave), there is limited further
discussion. Future research could focus specifically gender differences aspect.
4.3.3.2Kinematic Patterns
Descriptively, the kinematic patterns of both the elite and semi-elite bowlers were
graphically similar as presented by the graphs in Figures 4.2 and 4.3. It is very likely that the
pattern similarities were due to both groups being relatively high level bowlers (mean BSave

96
of 213 and 181 pin falls respectively). A visually distinguishable difference was in the elbow
region, and this was probably a consequence of the slight variations in the ‘hook’ technique
between the bowlers. However, this is not able to be proved due to the limitation of the
study, as there was a lack of a local reference frame in the elbow region to measure
longitudinal arm rotation. On the other hand, future studies utilising a full range from elite to
recreational bowlers would likely yield a more varied pattern for most of the variables. For
example, Wagner and colleagues (2010) in a study of handball jump throw kinematics of
elite and low level players found the that the respective patterns were dissimilar.
4.3.3.3Critical Kinematic Parameters of the Delivery
The objective of this study was to look at parameters that bests distinguished between
playing levels. In this regard, the discriminant analysis highlighted that faster shoulder
rotation at FFS was one of the better discriminators. Though, the shoulder velocity was more
similar at the later stages of the swing with the ANOVA showing that the groups were not
different in terms of shoulder rotation velocity and shoulder angle at release. This suggested
that the elite bowler’s earlier gain in arm angular velocity from the mid point of the swing
(i.e. FFS) could help in giving allowance for compensatory adjustment near release,
resulting in a more similar velocity at the end. This is supported by the fact that the elite
bowlers also had their peak shoulder deceleration significantly later. It is possible that their
better motor ability allowed a much later adjustment in velocity.
A higher elbow flexion velocity at release was another variable that could distinguish the
bowlers. This result corresponds with the stronger arm flexion and FIR strength exhibited by
the elite bowlers discussed earlier in 4.2.2.The likely cause could be the effort of trying to
impart maximum ball spin near release which necessitates quick flexion and internal arm

97
rotation (Strickland, 1996; Wiedman, 2006). It is common for coaching books to associate
more ball spin with higher level bowlers, and this was recently supported by Fuss (2009) in
his pilot work with an instrumented bowling ball. Hence, the elite bowler’s effort to impart
more spin would inadvertently result in higher elbow flexion velocity that was found.
Probably the most compelling kinematic discriminator was the ball release height. The elite
bowlers released the ball significantly closer to the bowling lane. This is in line with the
common coaching instruction of not ‘throwing the ball’ (Cheah, 2009; Wiedman, 2006).
Unskilled bowlers are frequently distinguished by the excessive ‘thud’ that is heard by them
‘throwing’ the ball. Energy losses incurred by the ball drop also does not augur well for
good pin to pin interaction as the ball would have lost some of its energy that otherwise
would have been able to be transferred to the pins. Additionally, the significant, positive
correlation coefficient indicated that the closer to the lane the ball was at release, the higher
the BSave. Having said this, it is more than likely that there is a threshold height. Trying to
go too low to release the ball will increase the risk of the ball hitting the lane before the
actual release, which may cause a bowler to compensate by reducing the approach speed.
The finding also has unprecedented applied implications, as there is no known scientific
endeavour to actually prove that better bowlers released the ball closer to the lane.
Considering that it is easily applicable to routine training, coaches can now instruct new
bowlers to explicitly release closer to the ground, somewhere in the region of 30 to 35 cm,
which is the mean value of elite bowlers in this study (see Figure 4.4).
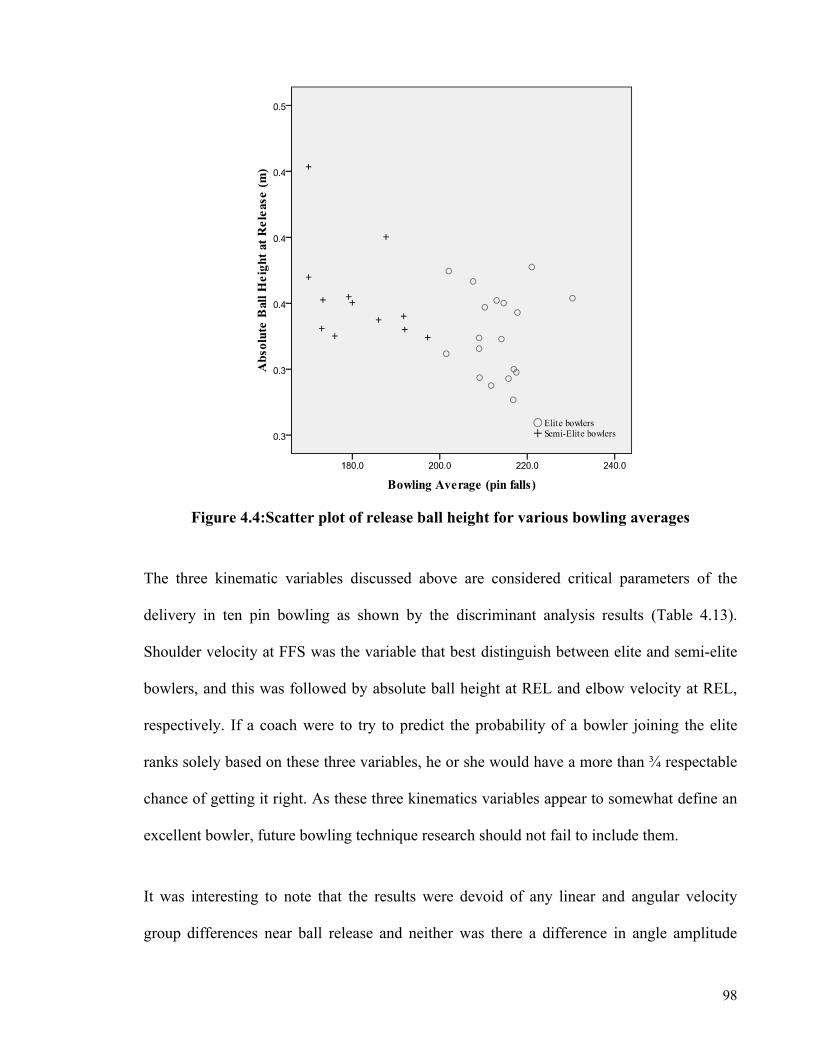
98
Figure 4.4:Scatter plot of release ball height for various bowling averages
The three kinematic variables discussed above are considered critical parameters of the
delivery in ten pin bowling as shown by the discriminant analysis results (Table 4.13).
Shoulder velocity at FFS was the variable that best distinguish between elite and semi-elite
bowlers, and this was followed by absolute ball height at REL and elbow velocity at REL,
respectively. If a coach were to try to predict the probability of a bowler joining the elite
ranks solely based on these three variables, he or she would have a more than ¾ respectable
chance of getting it right. As these three kinematics variables appear to somewhat define an
excellent bowler, future bowling technique research should not fail to include them.
It was interesting to note that the results were devoid of any linear and angular velocity
group differences near ball release and neither was there a difference in angle amplitude

99
(range of motion) of the various joints. On the surface, it is in contrast to the beliefs
propagated by bowling experts that modern bowling is power dependant (Benson, 2000;
Strickland, 1996; Wiedman, 2006). In reality, as the two groups in this study were both
highly skilled group of bowlers, the speed related difference (if any) were rather expectedly
insignificant. It is more than likely that the bowling experts were qualitatively comparing the
modern bowlers with bowling techniques of old, rather than referring to a distinct
correlation between ball speeds and bowling score. From the results of this study, it can be
safely said that high level bowlers should strive for an end product ball velocity in the
vicinity of 8.0 m/s (±0.42 m/s). Anything faster not necessarily equates to better scores and
anything slower would more likely be an indication of less than ideal delivery technique.
4.4 Within-Subject Inter Trial Movement Variability
4.4.1 Results of Variability Differences between Group
The variability results have an additional section as compared to the kinematic results and
are separated into eight sections (i.e., foot slide, knee joint, hip joint, trunk position, shoulder
joint, elbow joint, wrist position, ball height and ball velocity). Means and standard
deviations across all groups and genders for all variables in each section are presented in
Tables 4.5, 4.6, 4.7, 4.8, 4.9, 4.10, 4.11 and 4.12, respectively.
Foot Slide - There was a significant main effect for group for SD of lateral foot position at
FFS (F1, 26 = 9.23, p = .006) and SD of slide distance (F1, 26 =11.65, p = .002). The elite
bowlers were more consistent than the semi-elite bowlers for the SD of Lateral Foot Position
at FFS but less consistent for SD of slide distance. More specifically, the Interaction for SD
of lateral foot position at FFS was also significant (F1, 26 = 7.25, p = .012), with the follow-
up test revealing that the elite females were significantly more consistent than the semi-elite

100
females (U13 = 4.00, Z = -2.35, p = .019). For the relationship with average bowling score, a
significant correlation was found only for the SD of lateral foot position (r = -.43, p = .022)
and slide distance (r = .57, p = .001). There were no significant gender effects.
Knee Joint - For SD of the angle range, there was a significant interaction (F1, 26 =4.41, p =
.046) and gender (F1, 26 =6.46, p = .017) effect. The post hoc analysis revealed that there
were no significant differences between the groups with different playing levels.
Hip Joint - No significant effects were observed for the any of the variables.
Trunk Position - A significant gender effect was found for SD of anterior-posterior position
at FFS (F1, 26 =5.36, p = .029). In addition, a significant interaction effect was also found for
SD of the lateral trunk position at TBS (F1, 26 =4.33, p = .047), with the follow up test for
this significant interaction revealing that the female elite bowlers were more consistent
laterally at TBS than the female semi-elite bowlers (U13 = 6.00, Z = -2.05, p = .040).
Shoulder Joint - There were no significant effects for the any of the variables.
Elbow Joint - As with the shoulder joint, no significant effects were detected for all.
Wrist Position - There were significant effects for gender, group and the interaction between
the two. For gender, there were significant differences between the males and females for
SD of superior-inferior wrist position at TBS (F1, 26 = 8.26, p = .008), and at FFS (F1, 26 =
5.42, p = .028), respectively. For group, there were significant differences for SD of lateral
wrist position at FFS (F1, 26 = 4.51, p = .043), and at REL (F1, 26 = 5.72, p = .024), as well as
for SD of superior-inferior position at REL (F1, 26 = 4.78, p = .038), with the elite group
more consistent at the lateral positions and less consistent at the superior-inferior position

101
compared to the semi-elite group. More specifically, for SD of lateral wrist position at TBS,
the interaction was significant, F(1, 26) = 5.91, p = .022, and the post hoc test revealed that
the female elite bowlers were more consistent than the female semi-elite bowlers (U13 = 4.00,
Z = -2.34, p = .019). Furthermore, where playing level was significant, significant correlations
were also found between average bowling score and SD of lateral wrist position at FFS (r = -
.50, p = .005) and at REL (r = -.41, p = .026), as well as for SD of superior-inferior wrist
position at REL (r = .436, p = .016), respectively.
Ball Height and Ball Velocity - For SD of ball velocity at REL, there was a significant
interaction effect (F1, 26 = 4.95, p = .035). The post hoc test revealed that the male elite
bowlers had more inconsistent ball velocity scores compared to the male semi-elite bowlers
(U17 = 13.00, Z = -2.15, p = .032).
4.4.2 Discriminant Analysis of Variability Variables
As mentioned earlier, selection of variables to be included in the discriminant analysis was
based firstly on whether there were significant differences between groups for each variable
from the ANOVA results. Subsequently, SD of foot lateral position at FFS, SD of foot slide
distance, SD of trunk lateral position at TBS, SD of wrist lateral position at TBS, SD of
wrist lateral position at REL, and SD of wrist superior-inferior position at REL were
shortlisted. Secondly, to adhere to the multicolinearity assumption, shortlisted variables that
had high co-correlation (r > .05) were omitted.
Consequently, only SD of foot lateral position at FFS, SD of foot slide distance, SD of wrist
lateral position at REL and SD of wrist superior-inferior position at REL were used as
discriminating variables in the analysis. Box’s M indicated that the assumptions of equality
of variance-covariance matrices were met.

102
Again, as there were only two groups (elite and semi-elite), the discriminant analysis
produced only one function (see Table 4.14). The function was significant (p = .001), and
the model explains for 52.1% of variation in the grouping variable. The cross-validated
classification utilising the function suggested that overall, 76.7% of the participants were
correctly classified. Within each group, 77.8% of the elite and 75.0% of the semi-elite was
correctly placed in their respective groups. There were high (r > .30) loadings for all the
variables in the function, with SD of foot lateral position at FFS being the best discriminator.
Table 4.14: Discriminant function results for variability variables
Structure Matrix Unstandardised Coefficients
SD of Foot Lateral Position at FFS .56 -45.01
SD of Foot Slide Distance -.46 29.20
SD of Wrist Lateral Position at REL -.41 -112.13
SD of Wrist Superior-Inferior Position at REL . 37 66.68
(Constant) -.55
4.4.3 Variability Discussion
In closed skill sports it is often that the outcome is either determined by the best single value
of a series of trials (e.g. the javelin) or; by the accuracy towards a target (e.g. archery). In the
case for accuracy, higher scores are awarded for attempts that finish nearer a specific
location (e.g. 1-3 pin pocket in bowling). These movements are characterised by sub-
maximal effort, and outcome is often dependent on the sum of performances over a series of
attempts (Miller, 2008). Thus, the ability to generate the same (accurate) outcome
consistently is important.
103
More consistent lateral positioning of the trunk and the slide foot were key discriminators
between bowling groups. This finding were in direct relation to the movement consistency
needed in bowling and was expected considering the high precision and accuracy
requirement to hit pins 1 and 3. Higgins and Spaeth (1972) proposed that a successful
movement pattern should be developed and reproduced on each trial to maximise accuracy.
This indicated that accurate movement patterns would be characterised by high inter-trial
reproducibility. Furthermore, it may be inferred that deviation from a successful movement
pattern would be a cause of inaccuracy.
In this study, the lateral positioning of the foot and wrist that were highly reproducible were
indicative of higher level bowlers, but because the elite bowlers were not anymore
consistent in other areas it would be inaccurate to generalise Higgins and Spaeth (1972)
suggestions to the whole delivery motion. Moreover, no evidence was found to suggest that
any of the bowlers were able to reproduce the exact movement from each delivery, as
variability was present at all discrete points (within the limits of experimental error).
On the opposite end of the variability spectrum, motor control experts summed that
considering the degree of freedom of the sensorimotor system, "it seems impossible for a
given individual to generate identical movement patterns on successive attempts at
performing the same task" (Newell & Corcos, 1993). In relation to this, the results showed
that the elite bowlers had higher variability in terms of foot slide distance and vertical wrist
position at release; both of which were also significant discriminators of playing level. In
2008, Barlett suggested that certain types of movement variability could be attributed to
compensatory mechanism employed by skilled athletes. Button et al., (2003) and Robbins et

104
al., (2003) suggested that the compensatory mechanism was present in basketball shooting,
which is another accuracy based, sub-maximal skill.
The compensatory suggestion is also plausible for bowling, considering that variations in
slide distance could accommodate variations in approach speeds. Bowlers either take four or
five steps during approach, in which time it would be extremely difficult to maintain the
exact gait velocity and stride length. Coming up short in the last step would necessitate a
longer slide to reach closer to the foul line, and vice versa.
The same explanation can also be applied to the arm swing, as the ball push-away and back
swing also starts from the very first step of approach. Inadvertently, it is near impossible to
acquire the exact same trajectory throughout the swing. Elite bowlers had more variations
between trials in wrist height at release (the most distal segment), which possibly permitted
final corrections so that the ball was released at the bowler’s desired height. This meant that
the elite bowlers could have variations in their kinematics, yet still have similar release
height as evident by the lack of difference in SD of ball release height between the groups.
From a theoretical perspective, the closed-loop theory of motor control presented by Adams
(1971) contends that a performer uses feedback from the early stages of the movement to
make adjustments in the latter stages. Thus, slight changes in initial joint actions (i.e. ankle,
knee, hips and trunk) that are beyond tolerable system parameters would be counterbalanced
by subsequent more distal joint actions. Robbins and colleagues (2006) believed that the
increased variability in the elbow and wrist region in basketball shooting was due
specifically to this compensatory mechanism. Since the wrist is the last element in the
kinematic chain, it is possible that the higher observed values in intra-individual variability
represent this motor control mechanism at work in the elite bowlers.

105
In summary, it appears that the variability results were two fold. On one hand, consistent
lateral positioning of the base and most distal segment was highly desirable in line with the
needs to maximise accuracy. However this alone did not paint the whole picture for the
delivery. Better bowlers also had more variable foot slide distances and hand height at ball
release, both of which were the last stages of the delivery motion. This suggested the closed
loop motor control mechanism at work, by making final adjustments which compensates for
kinematic differences of the earlier stages.
The four absolute variability variables discussed above are considered critical parameters of
the delivery in ten pin bowling as shown by the discriminant analysis results (Table 4.15).
SD of foot lateral position at FFS was the variable that best distinguished between elite and
semi-elite bowlers, and this was followed by SD of foot slide distance, SD of wrist lateral
position at REL and SD of wrist superior-inferior position at REL respectively. If one were
to try to foretell whether a bowler was cut out for the elite ranks solely based on these four
variables, they would have a 76.7 percent chance of getting it right. As it stands, future
bowling technique research should endeavour to include all four of these consistency
variables, as it defines a good bowler from an excellent one.
4.5Segment Contribution
4.5.1Results
There were no significant differences in terms of the various segment contributions to the
final ball velocity at release between the elite and semi-elite groups (Table 4.15). The
contributions were also similar for both genders. Segment linear velocity-time graphs are
presented in Figure 4.5 and 4.6. It shows a similar pattern of sequentiallity, with the peak of
the distal segments occurring following the deceleration of the preceding proximal segment.

106
4.5.2 Contribution and Sequence towards Ball Release Velocity
It has been established that sequential increase in velocities from proximal to more distal
segments are evident in throwing for maximal distance/speed (Atwater, 1979) and in some
events with high accuracy requirements (Hayes, 1988). The results of the segment endpoint
linear velocities (see Figures 4.5 and 4.6) clearly suggested that the ball delivery in ten pin
bowling was sequential in nature as opposed to being simultaneous. This result was the first
of its kind documented for ten pin bowling, a sport which has a speed-accuracy trade-off
emphasis. Such observations were common in movements with maximal velocity priority,
including those of another underarm pattern, the softball windmill pitch. Alexander and
Haddow (1982) was first to report that there were sequential decelerations occurring in the
proximal segments prior to release of the softball, and this was supported in a more recent
study by Oliver, Dwelly, and Kwon (2010).
In this present study there were no significant differences between the groups in terms of
how much each segment contributed towards the final ball velocity (Table 4.15). In contrast,
Oliver, Dwelly, and Kwon (2010) had presented the arm segment contributions in
intermediate and advanced softball pitchers, with the former relying more on the upper arm
and forearm. The difference in findings was most likely a consequence of the objective of
ten pin bowling, which was not solely about ball speed. Should all the bowlers try to achieve
maximal ball velocities, one would assume that there would be a difference in segment
contributions between playing level; for example the elite level bowler might walk faster
during approach compared to a semi-elite bowler.

107
Table 4.15: Means for percentage (%) of segment contributions towards final ball velocity (N=30)Segment Elite Semi-Elite Elite (M) Elite (F) Semi-Elite (M) Semi-Elite (F)
Lower Body (walking speed) - Hip marker 37.87 ±3.92 36.95 ±3.90 36.69 ±4.32 39.33 ±2.97 36.47 ±3.01 37.62 ±5.22
Trunk (flexion + rotation) - Shoulder marker 0.50 ±4.61 3.32 ±4.44 1.24 ±4.45 -0.43 ±4.94 5.38 ±3.92 0.44 ±3.66
Upper arm (underarm swing) - Elbow marker 18.90 ±6.33 17.02 ±4.84 21.37 ±6.61 15.82 ±4.64 16.80 ±5.69 17.32 ±3.95
Lower arm (flexion) - Wrist marker 29.10 ±4.23 28.11 ±5.52 29.96 ±5.10 28.02 ±2.76 28.75 ±6.62 27.21 ±4.04
Wrist (flexion) - Metacarpal marker 12.45 ±3.88 11.76 ±4.14 12.20 ±4.39 12.76 ±3.41 9.51 ±4.01 14.90 ±1.41
Fingers - ball velocity increment after wrist 1.19 ±5.03 2.86 ±6.72 -1.46 ±3.91 4.50 ±4.40 3.10 ±7.44 2.52 ±6.38
* Significant interaction effect (p<0.05) § Significant main effect for gender, significant difference (p<0.05) between males and females▲ Significant main effect for group, significant difference (p<0.05) between elite and semi-elite bowlers
Table 4.16: Normalised torques at the shoulder, elbow and wrist joints.
Joint torques (%BW*H) Elite Semi-Elite Elite (M) Elite (F) Semi-Elite
(M) Semi-Elite
(F) Peak shoulder flexion 9.62 ±4.95 11.04 ±5.28 10.93 ±2.90 8.08 ±6.60 14.22 ±7.34 7.86 ±1.80
Peak shoulder extension(-) 4.24 ±4.90 6.86 ±5.64 4.74 ±3.01 3.66 ±6.79 8.97 ±6.94 4.76 ±3.76
Peak elbow flexion 2.65 ±1.54 3.10 ±2.24 2.95 ±1.52 2.31 ±1.61 4.95 ±1.54 1.25 ±0.51
Peak elbow extension(-) 3.70 ±1.99 4.73 ±2.18 3.72 ±1.87 3.67 ±2.30 5.80 ±2.67 3.67 ±0.72
Peak wrist flexion 1.71 ±0.85 1.63 ±0.49 1.88 ±0.55 1.52 ±1.14 1.55 ±0.49 1.70 ±0.56
Peak wrist extension(-) 0.92 ±1.12 0.89 ±0.50 0.88 ±0.57 0.97 ±1.62 0.98 ±0.41 0.81 ±0.62

108
Figure 4.5: Sequence of peak linear velocities (m/s) of segments for male bowlers
Male Elite Bowlers
Male Semi-Elite Bowlers

109
Figure 4.6: Sequence of peak linear velocities (m/s) of segments for female bowlers
Female Elite Bowlers
Female Semi-Elite Bowlers

110
Considering that the contributions are near similar for both groups, it can be summed in total
that the final linear ball velocity in ten pin bowling (average of 8 m/s) stemmed from
contributions of the lower limb during approach (37.4%), rotation and flexion of the trunk
(1.6%), upper arm (18.1%), lower arm (28.7%), with the wrist and fingers contributing
(13.9%).This meant that the upper limbs had a combined contribution of 60.7%, while the
trunk had the least contribution. Sidearm throws (Van den Tillaar & Ettema, 2004b) and
overarm throws (Gordon & Dapena, 2006) also displayed these similar characteristics.
The results presented the contribution of individual segments in attaining the ball release
velocity. In applied terms, coaches and bowlers would be able to make necessary
adjustments for certain shortcomings. For example, a shorter bowler with lower ball height
reach (lower potential energy) should compensate by walking faster during approach to
attain the desired ball release velocity.
However, caution must be used in interpreting the results, as unlike other movements,
bowling involves a very heavy ball and the underarm pattern allows for a preparatory phase
for the ball to be lifted at heights, allowing it to freefall. Arm swing in ten pin bowling is
suggested to be gravity driven (Benson, 2000), compared to the internal arm rotation of
baseball pitching (Van den Tillaar & Ettema, 2004a) and the underarm swing of softball
pitching (Werner et al., 2006) which involves high muscle torque. In relation to this, firstly it
would be of interest to further investigate whether bowlers were actively trying to accelerate
their arms during swing or left it to freefall. Secondly, considering the elbow and wrist joints
are attached about the upper arm segment at the shoulder – measuring horizontal linear
velocities alone might not best represent the respective individual upper limb contribution.
To help answer these quandaries, the following supplementary analysis was conducted.

111
4.5.2 Estimation of Upper Limb Joint Torques
Through inverse dynamics it was possible to estimate torques about the shoulder, elbow and
wrist during delivery utilising the kinematic and anthropometric data collected. A simple
planar (2D) model was used. The mathematical model for a three-link kinematic chain of an
arm was constructed based on Kane’s vector-based approach method. The original model
was first presented by Ariff and Rambely (2009) and was used to study the smash motion in
badminton. The detailed computational methods for the model are available in Appendix 5.
It had a racket forming the end segment together with the hand and an external force in the
form of the shuttle contacting the racket. The model was adapted for use in bowling motion
by removing the external contact force and, as the bowling ball was cupped, it was
considered to form the final segment together with the hand. Computations were done using
the R software package (R Development Core Team, 2003). To remove the effects of body
size in comparisons, joint torques were reported as values normalised to the product of the
participant’s body weight and height.
Important assumptions for this model are that:
the segments have a fixed mass represented by the point of centre of mass (COM).
the position of the segments COM are fixed throughout the motion.
the length of the segments are constant throughout the motion.
the joints are considered as frictionless hinge joints.
the bowling ball is a solid sphere with uniformly distributed mass.
the arm swing motion is entirely in a single plane.

112
Figure 4.7: Model of a planar three-link kinematic chain of the arm
Figure 4.7 presents a planar kinematic chain of the arm with three degrees of freedom,
represented by the angles q1, q
2 and q
3. Segment A is connected to the reference frame N by
the frictionless Ao
joint. Segment B is connected to segment A by the frictionless joint Bo;
and segment C is connected to segment B by the frictionless joint Co. While ni, âi, bi, ĉi, ( i=
1, 2, 3) are mutually orthogonal unit vectors that determines the direction of the vector
component for the segments A, B, C and the reference frame N.
To compute torques about the shoulder, elbow and wrist, the following individual body
parameters of the bowlers needed to be generated:

113
i. Segment lengths taken from anthropometric measurements (see section 3.1.1)
ℓA = measured length of the upper arm
ℓB = measured length of the forearm
ℓC = estimated hand thickness and diameter of bowling ball = (0.02 + 0.218) m
ii. Distance of COM of segment to its proximal end. Estimates of COM percentage location
are based on tables provided in Winter (2005) (see also Appendix 4).
ρA= COM distance for segment A = ℓA × (estimate percentage of A
*)
ρB= COM distance for segment B = ℓB × (estimate percentage of B
*)
ρC= hand thickness and COM location of ball = (0.02 + 0.109) m
iii. Mass of segments was estimated from pre-determined percentage of body mass as
provided by Winter (2005).
mA= mass of upper arm = (participants body mass × 0.028) kg
mB= mass of forearm = (participants body mass × 0.016) kg
mC= mass of hand and ball = (participants body mass × 0.006) kg + (mass of ball)
iv.Moment of inertia about the COM of segments A,B and C. Radii of gyration values for
upper arm and forearm are provided by Winter (2005). Moment of inertia of the hand +
ball segment is calculated directly by assuming it is one solid uniform sphere.
IA*= [(mA
× 0.5422) + (m
A× ρ
A
2)] kgm
2
IB*= [(mB× 0.526
2) + (m
B× ρ
B
2)] kgm
2
IC*= [(2/5)(mC
x 0.1092)] kgm
2

114
Shoulder Elbow Wrist
Figure 4.8: Convention for sagittal plane flexion (+) and extension (-)
Peak normalised torques of the shoulder, elbow and wrist are presented in Table 4.16. Visual
representation of the respective torque curves are presented in Figure 4.9. Two- way analysis
of variance for playing level and gender yielded no significant differences between the elite
and semi-elite bowlers or between gender in terms of peak torque generated at the shoulder,
elbow or wrist.
Discussion
All bowlers displayed higher torque values at the shoulder, followed by the elbow and wrist,
and this corresponds with the proximal to distal segment contributions and sequence
discussed in the earlier section. It is now evident by the torques generated at the three joints
that the shoulder region contributed the most to ball velocity as compared to other upper
limb segments.
Interestingly, the torques at each of the joints displayed rather gradual slope from TBS right
up to around 70% of the delivery cycle (Figure 4.9). From then on, the shoulder joint
exhibited a sharp decrease in flexion torque followed by an increase in extension torques
prior to ball release. This seemingly ‘braking’ component could possibly be an

115
Normalised Shoulder Torques
-10
-5
0
5
10
15
1 5 9 13 17 21 25 29 33 37 41 45 49 53 57 61 65 69 73 77 81 85 89 93 97 101
%B
W*H
Elite Female
Elite Male
Semi Elite Female
Semi Elite Male
Normalised Elbow Torques
-4
-3
-2
-1
0
1
2
3
1 4 7 10 13 16 19 22 25 28 31 34 37 40 43 46 49 52 55 58 61 64 67 70 73 76 79 82 85 88 91 94 97
%B
W*H
Elite Female
Elite Male
Semi Elite Female
Semi Elite Male
Normalised Wrist Torques
-1
-0.5
0
0.5
1
1.5
2
1 5 9 13 17 21 25 29 33 37 41 45 49 53 57 61 65 69 73 77 81 85 89 93 97
%B
W*H
Elite Female
Elite Male
Semi Elite Female
Semi Elite Male
Figure 4.9: Torque-time graph of the shoulder, elbow and wrist

116
important factor in terms of motor correctional mechanisms (Bartlett, 2008) as well as injury
prevention. Extension torques has been previously suggested to being able to help increase
compression forces on the shoulder complex during high velocity movements (Barrentine et
al., 1998) and thus help protect and ensure the joint was preserved during repetitive stress.
Similar type of extension torques were also present at the elbow prior to release, as well as
at the wrist, but at much smaller magnitudes. The wrist had minimal torques throughout the
delivery, indicating it had little role in generating ball velocity. It is common for some
bowlers to use wrist guards to ‘lock’ the wrist (Wiedman, 2006) to have more consistent
motion by reducing joint degree of freedom. Now it appears to makes sense to do so.
The similar normalised torque patterns and peak values displayed between the groups was in
agreement with the near similar kinematic patterns that was observed between the groups
discussed earlier. All 30 of the bowlers were relatively of a high level, went through the
same coaching development with the national bowling setup, hence, the similar techniques
that were employed.
It was not possible to compare kinetic data from this study with bowlers from other studies
as there was no previous published research done on ten pin bowling. Alternatively, when
the generated torques was compared to another underarm movement – the windmill softball
pitch, the patterns were rather similar. Peak shoulder and elbow extension torques also
occurred near ball release in the windmill pitch (Werner et al., 2006, Barrentine et al., 1998).
When compared to data from Werner et al. (2006), their female Olympic pitchers had peak
shoulder flexion torque of 4.5 %BW*H and peak extension torque of 22 %BW*H.
Comparatively, the elite female bowlers from this study exhibited higher peak shoulder
flexion torque (8.1 %BW*H) but lower peak extension (3.7 %BW*H). At the elbow region,

117
the pitchers showed no flexion torques but had an extension torque of 13.0 %BW*H.
Meanwhile, the elite female bowlers had 2.3 %BW*H flexion and 3.7 %BW*H extension
torques at the elbow respectively. The higher flexion torques seen specifically in the
shoulder region in bowling is explainable by the effort needed to move a significantly higher
mass, as a bowling ball weighs 7 kg while a softball only weighs 0.17 kg. On the other hand,
the pitchers showed higher extension torques compared to bowlers, which most likely stem
from the higher peak angular velocities of 2190.0 deg/s that the pitchers generated (Werner
et al., 2006), thus warranting a higher need for the pitchers to introduce more compressive
forces near release. Comparatively, the elite female bowlers only generated velocities of
954.0 deg/s.
Finally, it was also interesting to relate this finding to the common assumption that the
downswing during delivery was gravity driven (Benson, 2000) and bowlers only controlled
the direction of swing. It has been shown from the analysis that this assumption was
misleading. It could be seen in Figure 4.9 that joint torques were present entire swing
motion. The gradual increase in shoulder torque indicated that the arm was actively being
accelerated as opposed to free falling. The extension torques displayed in all joints also
suggested that bowlers were actively controlling the swing near release.
In summary, it is apparent that joint torques in bowling are quite pronounced. Considering
that Barrentine et al. (1998) suggested that torques about the shoulder region of between 3-7
%BW*H are sufficient to produce overuse injury, the elite and semi-elite bowlers were
therefore constantly vulnerable to injury risk. Thus it is reasonable to state that bowling is
not only a recreational activity, as at the higher levels the skills, finesse and risks involved
are quite marked and on par with other competitive sports.

118
CHAPTER FIVE:
CONCLUSION AND IMPLICATIONS
119
Chapter 5: Conclusion and Implications
5.1 Conclusion
The objective of this study was to determine the critical parameters in the ten pin bowling
delivery that was important for a good bowling performance. In the effort to achieve this
goal, the first part of this study involved ten anthropometric measurements and seven
strength tests. From these variables, a number of differences were found between the elite
bowlers, semi-elite bowlers and the non-bowlers. On closer inspection, these differences
mainly appear only between the bowlers and the non-bowlers. No significant differences
were detected between elite and semi-elite bowlers, which were the main focus groups.
There were also no identifiable critical parameters for good bowling performance, as this
study was not able to successfully distinguish between good and excellent bowlers based on
physical attributes alone. However, in terms of differences to the normal population, bowlers
generally tended to be heavier, had longer limbs, had stronger forearm internal rotation and
arm flexion.
For the second part of the study, a total of 43 discrete kinematic variables were extracted
from the 3D motion analysis, from which it can be summed that the two bowling groups had
similar patterns for the majority of segments with the exception of the shoulder and elbow
region. The discriminant analysis revealed that there were three critical kinematic variables.
To a certain extent it was possible to distinguish the playing level of bowlers utilising these
variables alone, with the cross-validated classification estimating a 76.7% success rate.
From the discrete kinematic data, this study also looked at within-subject inter-trial
variability to compare movement consistency. In total, 41 absolute variability variables were

120
examined, of which a number of differences were observed between the elite and semi-elite
bowlers, especially at the base (foot region) and the wrist, both of which are the most distal
segments. The discriminant analysis highlighted four critical variability variables. Cross-
validated classification revealed an estimated 76.7% success rate in distinguishing the
playing level of bowlers utilising these variables alone.
With regards to the supplementary analysis, it was established that arm swing in bowling
was not purely gravity driven as the bowlers actively accelerated the arm throughout the
swing. In addition, the arm segment, in particular, the shoulder region contributes the most
towards final ball velocity.
In conclusion, the critical parameters of delivery for good bowling performance were higher
shoulder velocity at front foot strike, higher elbow velocity at release, lower wrist height at
release, more consistent foot lateral position at front foot strike, more consistent wrist lateral
position at release, more varied foot slide distance, and more varied wrist superior-inferior
position at release.
Finally, as a consequence of the vast data gathered from this study, anthropometric and
strength normative data, as well as kinematic and absolute variability measures for high
level bowlers in Malaysia have been established and are readily available as a reference.
5.2 Implications
The structure and direction of this study were designed with the goal of producing results
that have practical implications and applications for bowling coaches and bowlers
themselves.
121
At the top level, there seem to be no advantage for any particular physical attributes, making
it possible for bowlers of varying builds to reach the highest level. At the same time, it
would not be misleading to suggest that bowlers and coaches pay particular attention to
forearm/wrist internal rotators and the arm flexors during strength training. Overall though,
as bowlers were different to the normal population in a number of physical aspects, there
may be a case for specific scouting of potential bowlers. Bowling talent identification
programs would probably have a better athlete base to build upon by selecting bigger built
candidates that have relatively long limbs. This would probably make it easier to attain the
desired ball velocity threshold to be a successful bowler.
In terms of delivery technique, bowlers should be advised to have fast shoulder angular
velocities near mid-point of the arm swing with a correspondingly high elbow flexion
velocity near ball release. Importantly, coaches should advocate a lower ball release height,
specifically in the region of 30 to 35 cm.
Moreover, in line with common knowledge in bowling, bowlers need to be as consistent as
possible in terms of lateral positioning. Specifically, the position of the slide foot and the
position of the wrist near release need to be consistent. Conversely, coaches should
encourage their bowlers, where needed, to vary their slide distance as well as the height of
the wrist near release as these adjustments may be necessary for attaining certain ball release
requirements.
Taking into consideration that teaching consistency in rapid motions is a challenging task;
this study suggests the use of additional markers on the bowling lane during training to aid

122
foot placement consistency. Where access to technology is possible, the use of projected
laser lines on the lane is probably more logistically feasible. Additionally, to aid training for
consistency of wrist position a custom wrist cuff apparatus with accelerometers or active
marker is suggested. Both these suggestions are under consideration for intellectual property
applications at the time of submission of this thesis.
5.3 Future Research Direction
As the anthropometric data from this current study was limited to length and breadth
measurements, a comprehensive anthropometrical study in the future may include segment
girths and skinfold measurements. Besides this, research looking at the influence of
forearm/wrist rotation to ball spin and performance may be important as it will widen the
knowledge base established by this current study. Alternately, investigations into the
kinematics distinctions of the different bowling styles would be interesting as it may reveal
how different technique affected ball delivery and performance. Finally, this study reported
a number of differences between male and female bowlers, even though the bowling scores
were similar. However, discussions were limited as gender differences were not a main
concern for this study. Therefore, it would be of great interest to examine how males and
females achieved the same performance level, despite differences in kinematics and
movement variability.

123
REFERENCES AND BIBLIOGRAPHY

124
References
1. Abdel-Aziz, Y. I., & Karara, H. M. (1971). Direct linear transformation from
comparator coordinates into object coordinates in close-range photogrammetry.
Proceedings of the ASP/UI Symposium on Close-Range Photogrammetry, pp. 1-18. Falls
Church, VA: American Society of Photogrammetry.
2. Adams, J. A. (1971). A closed loop theory of motor learning. Journal of Motor
Behaviour, 3(2), 111-150.
3. Alexander, M. J., & Haddow, J. B. (1982). A kinematic analysis of an upper
extremity ballistic skill: The windmill pitch. Canadian Journal of Applied Sport
Sciences, 7(3), 209-217.
4. Alexander, M. J., Lindner, K. J., & Whalen, M. T. (1996). Structural and
biomechanical factors differentiating between male and female shot put athletes. Journal
of Human Movement Studies, 30, 103-146.
5. Ariff, F. H. M. & Rambely A. S. (2009). Modeling of an arm via Kane’s method: An
inverse dynamic approach. European. Journal of Scientific Research, 33(2), 358-364.
6. Atwater, A. E. (1979). Biomechanics of overarm throwing movements and of
throwing injuries. Exercise and Sport Sciences Reviews, 7(1), 43-86.
7. Baker, D., Wilson, G. & Carlyon, B. (1994). Generality versus specificity: a
comparison of dynamic and isometric measures of strength and speed-strength.
European Journal of Applied Physiology and Occupational Physiology, 68(4), 350-355.
8. Barker, M., Wyatt, T. J., Johnson, R. L., Stone, M. H., O'Bryant, H. S., Poe, C., &
Kent, M. (1993). Performance factors, psychological assessment, physical
characteristics, and football playing ability. Journal Strength and Conditioning
Research, 7, 224-233.
9. Barrett, R. S. & Manning, J. M. (2004). Relationships between rigging set-up,
anthropometry, physical capacity, rowing kinematics and rowing performance. Sports
Biomechanics, 3(2), 221-235.
10. Bartlett, R. M. (2008). Movement variability and its implications for sports scientists
and practitioners: An overview. International Journal of Sports Science and Coaching,
3, 113-123.

125
11. Bartlett, R. M., Muller, E., Lindinger, S., Brunner, F., & Morriss, C. (1996). Three-
dimensional evaluation of the kinematic release parameters for javelin throwers of
different skill levels. Journal of Applied Biomechanics, 12, 58-71.
12. Bartlett, R. M., Stockill, N. P., Elliot, B. C., & Burnett, A. F. (1996). The
biomechanics of fast bowling in men’s cricket: A review. Journal of Sports Sciences, 14,
403-424.
13. Bartlett, R. M., Wheat, J. S., & Robins, M. (2007). Is movement variability
important for sports biomechanists? Sports Biomechanics, 6(2), 224-243.
14. Bauer, H. U., & Schollhorn, W. I. (1997) Self-organizing maps for the analysis of
complex movement patterns. Neural Processing Letters, 5, 193-199.
15. Bell, A. L., Pedersen, D. R., & Brand, R. A. (1990). A comparison of the accuracy of
several hip center location prediction methods. Journal of Biomechanics, 23, 617-621.
16. Benson, M. (Ed.). (2000). Essential Bowling. New York: Lyons Press.
17. Bootsma, R. J., & Van Wieringen, P. C. (1990) Timing an attacking forehand drive
in table tennis. Journal of Experimental Psychology: Human Perception and
Performance, 16(1), 21-29.
18. Broer, M. (1969). Efficiency of Human Movement. (2nd ed.). Philadelphia: W. B.
Saunders.
19. Button, C., Macleod, M., Sanders, R., & Coleman, S. (2003). Examining movement
variability in the basketball free-throw action at different skill levels. Research
Quarterly for Exercise and Sport, 74, 257-269.
20. Cheah, H. (2009) Personal communication. Head Coach, Malaysian Tenpin Bowling
Congress.
21. Chu, D. P. K., Zhang, B., & Mau, K. (2002). Tenpin bowling technique on elite
players. Proceedings of the 20th International Symposium on Biomechanics in Sports,
pp. 123-125. Caceres, Spain.
22. Claessens, A. L., Lefevre, J., Beunen, G., & Malina, R. M. (1999). The contribution
of anthropometric characteristics to performance scores in elite female gymnast. Journal
of Sports Medicine and Physical Fitness, 39(4), 355-360.
23. Curtis, J. M. (1951). The relationship of strength of selected muscle groups to
performance in bowling. Unpublished Masters Thesis. University of Wisconsin,
Madison.

126
24. Davis, D. S., Bosley, E. E., Gronell, L. C., Keeney, S. A., Rossetti, A. M.,
Mancinelli, C. A., & Petronis, J. J. (2006). The relationship of body segment length and
vertical jump displacement in recreational athletes. Journal of Strength and Conditioning
Research, 20(1), 136-140.
25. Elliott, B. C. & Armour, J. (1988). The penalty throw in water polo: A
cinematographic analysis. Journal of Sports Sciences, 6(2), 103-114.
26. Elliott, B., Grove, J. R., Gibson, B., & Thurston, B. (1986). A three-dimensional
cinematographic analysis of the fastball and curve pitches in baseball. International
Journal of Sports Biomechanics, 2, 20-28.
27. Elliott, B., Marsh. T., & Overheu, P. (1989). A biomechanical comparison of the
multisegment and single unit topspin forehand drives in tennis. International Journal of
Sport Biomechanics, 5, 350-364.
28. Elliott, B. C., Marsh, T., & Blanksby, B. (1986). A three dimensional cinemato-
graphic analysis of the tennis serve. International Journal of Sports Biomechanics, 2(4),
260-270.
29. Escamilla, R. F., Barrentine, S. W., Fleisig, G. S., Zheng, N., Takada, Y., Kingsley,
D., & Andrews, J. R. (2007). Pitching biomechanics as a pitcher approaches muscular
fatigue during a simulated baseball game. American Journal of Sports Medicine, 35(1),
23-33.
30. Federation Internationale des Quilleurs. (n.d). FIQ Information (2009). Retrieved
from www.fiq.org/contingut.php?id_menu=101&id_contingut=32.
31. Feltner, M. E., & Dapena, J. (1986). Dynamics of the shoulder and elbow joints of
the throwing arm during a baseball pitch. International Journal of Sport Biomechanics,
2, 235-259.
32. Feltner, M., & Taylor, G. (1997). Three-dimensional kinetics of the shoulder, elbow,
and wrist during a penalty throw in water polo. Journal of Applied Biomechanics, 13(3),
347-372.
33. Fleisig, G. S., Barrentine, S. W., Zheng, N., Escamilla, R. F., & Andrews, J. R.
(1999). Kinematic and kinetic comparison of baseball pitching among various levels of
development. Journal of Biomechanics, 32, 1371-1375.
34. Fleisig, G., Chu, Y. C., Weber, A., & Andrews, J. (2009) Variability in baseball
pitching biomechanics among various levels of competition. Sports Biomechanics, 8(1),
10-21.
127
35. Fry, A. C., & Kraemer, W. J. (1991). Physical performance characteristics of
American collegiate football players. Journal of Strength and Conditioning Research,
5(3), 126-138.
36. Fuster, V., Jerez, A., & Ortega, A. (1998). Anthropometry and strength relationship:
male-female differences. Anthropologischer Anzeiger Jahrg, 56(1), 49-56.
37. Fuss, F. K. (2009). Design of an instrumented bowling ball and its application to
performance analysis in tenpin bowling. Sports Technology, 2(3-4), 97-110.
38. Gabbett, T. J. (2002). Influence of physiological characteristics on selection in a
semi professional first grade rugby league team: a case study. Journal of Sports
Sciences, 20, 399-405.
39. Gabbett, T., & Georgieff, B. (2007). Physiological and anthropometric
characteristics of Australian junior national, state, and novice volleyball players. Journal
of Strength and Conditioning Research, 21(3), 902-908.
40. Gebhardt, M., Bowers, C., & Archer, D. (1991). Strength training and hitting.
Scholastic Coach, 60(9), 32-34.
41. Glazier, P. S., Paradisis, G. P., & Cooper, S. (2000). Anthropometric and kinematic
influences on release speed in men’s fast-medium bowling. Journal of Sports Sciences,
18, 1013-1021.
42. Gordon, B. J., & Dapena, J. (2006). Contributions of joint rotations to racquet speed
in the tennis serve. Journal of Sports Sciences, 24(1), 31-49.
43. Gorostiaga, E. M. (2006). Effects of an entire season on physical fitness changes in
elite male handball players. Medicine and Science in Sports and Exercise, 38(2), 357-366.
44. Greenlee, G. A. (1960). The relationship of selected measures of strength, balance
and kinesthesis to bowling performance. Unpublished Masters Thesis. University of
Oregon, Eugene.
45. Gregor, R. J., Whiting, W. C., & McCoy, R. W. (1985). Kinematic analysis of
olympic discus throwers. International Journal of Sport Biomechanics, 1, 131-138.
46. Hayes, D. (1988). Intra-individual variability in selected components of the
basketball free throw. Paper presented at the Fifth Biennial Conference of the Canadian
Society for Biomechanics, Ottawa, Canada.
47. Harris, K. R. (2008). Deliberate practice, mental representations, and skilled
performance in bowling. Unpublished Dissertation. Florida State University, Florida.

128
48. Hay, J. G., & Reid, G. (1982). Anatomy, Mechanics and Human Motion (2nd ed.).
Englewood Cliffs, NJ: Prentice Hall.
49. Hay, J. G., Vaughan, C. L., & Woodworth, G. G. (1981). Technique and
performance: identifying the limiting factors. In Morecki, M. (ed.), Biomechanics VII-B.
Baltimore: University Park Press.
50. Haywood, K. M., & Getchell, N. (2009). Life span motor development (5th ed.).
Champaign, IL: Human Kinetics.
51. Higgins, J. R. & Spaeth, R. K. (1972). Relationship between consistency of
movement and environmental condition. Quest, 17(1), 61-69.
52. Hoare, D. G., & Warr, C. R. (2000). Talent identification and women’s soccer: An
Australian experience. Journal of Sports Sciences, 18, 751-758.
53. Johnson, B. (2002) Is Bowling an Elite Sport? Retrieved from www.fiq.org.
54. Johnson, B. D. (1998). The physics of bowling: How good bowlers stay off the
straight and narrow. Retrieved from mathcs.slu.edu/~johnson/public /maths/bowling.pdf.
55. Keogh, J. (1999). The use of physical fitness scores and anthropometric data to
predict selection in an elite under 18 Australian rules football team. Journal of Science
and Medicine in Sport, 2(2), 125-133.
56. Keogh, J. W. L., Marnewick, M. C., Maulder, P. S., Nortje, J. P., Hume, P. A., &
Bradshaw, E. J. (2009). Are anthropometric, flexibility, muscular strength and
endurance variables related to clubhead velocity in low and high handicap golfers?
Journal of Strength and Conditioning Research, 23(6), 1841–1850.
57. LeBlanc, M., & Mooney, R (2004). Kinematic differences in elite-level American
male and female javelin throwers. Engineering in Sport, 5, 182-188.
58. Lees, A. (2002). Technique analysis in sports: a critical review. Journal of Sports
Sciences, 20, 813-828.
59. Leigh, S., & Yu, B. (2007). The associations of selected technical parameters with
discuss throwing performance: A cross-sectional study. Sports Biomechanics, 6(3), 269-
284.
60. Lohman, T.G., Roche, A.F., & Martorell, R. (1991) Anthropometric standardization
reference manual. Champaign, IL: Human Kinetics.
61. Marques, M. C., Van den Tillaar, R., Vescovi, J. D., & Gonzales-Badillo, J. J.
(2007). Relationship between throwing velocity, muscle power, and bar velocity during

129
bench press in elite handball players. International Journal of Sports Physiology and
Performance, 2, 414-422.
62. Marques-Bruna, P., & Grimshaw, P. N. (1997). 3-dimensional kinematics of overarm
throwing action of children age 15 to 30 months. Perceptual and Motor Skills, 84, 1267-
1283.
63. Matsuo, T., Escamilla, R. F., Fleisig, G. S., Barrentine, S.W., & Andrews, J. R.
(2001). Comparison of kinematic and temporal parameters between different pitch
velocity groups. Journal of Applied Biomechanics, 17, 1-13.
64. McGuigan, M. R., & Winchester, J. B. (2008). The relationship between isometric
and dynamic strength in college football players. Journal of Sports Science and
Medicine, 7, 101-105.
65. Mero, A., Komi, P. V., Korjus, T., Navarro, E., & Gregor, R. J. (1994). Body
segment contributions to javelin throwing during final thrust phases. Journal of Applied
Biomechanics, 10, 166-177.
66. Miller, D. (1980). Body segment contributions to sport skill performance: Two
contrasting approaches. Research Quarterly for Exercise and Sport, 5, 219-233.
67. Miller, S. A., & Bartlett, R. M. (1996). The relationship between basketball shooting
kinematics, distance and playing position. Journal of Sports Sciences, 14, 243-253.
68. Miller, S. A. (1998). The kinematics of inaccuracy in basketball shooting. In: H. J.
Riehle, & M. M. Vieten (Eds.), Proceedings of the 16th International Symposium on
Biomechanics in Sports, pp. 188-191, Universitatsverlag Konstanz, Konstanz, Germany.
69. Miller, S. A. (2002). Variability in basketball shooting: Practical implications. In: Y.
Hong, (Ed.)., International Research in Sports Biomechanics, pp. 27-34, London,
Routledge.
70. Mohamed, H., Vaeyens, R., Matthys, S., Multael, M., Lefevre, J., Lenoir, M., &
Philippaerts, R. (2009). Anthropometric and performance measures for the development
of a talent detection and identification model in youth handball. Journal of Sports
Sciences, 27(3), 257-266.
71. Norton, K. & Olds, T. (Eds.). (2006). Anthropometrica: A textbook of body
measurement for sports and health courses. Sydney: University of New South Wales
Press Ltd.
72. Newell, K. M., & Corcos, D. M. (Eds.) (1993). Variability and motor control.
Champaign. IL: Human Kinetics.

130
73. Oliver, G. D., Dwelly, P. M., & Kwon, Y. H. (2010) Kinematic motion of windmill
softball pitch in prepubescent and pubescent girls. Journal of Strength and Conditioning
Research, 24(9), 2400–2407.
74. Portus, M. R., Sinclair, P. J., Burke, S. T., Moore, D. J. A., & Farhart, P. T. (2000).
Cricket fast bowling performance and technique and the influence of selected physical
factors during an 8-over spell. Journal of Sports Sciences, 18, 999-1011.
75. Pyne, D., Duthie, G. M., Saunders, P. U., Petersen, C. A., & Portus, M. R. (2006).
Anthropometric and strength correlates of fast bowling speed in junior and senior
cricketers. Journal of Strength and Conditioning Research, 20(3), 620-626.
76. Reilly, T., Bangsbo, J., & Franks, A. (2000). Anthropometric and physiological
predispositions for elite soccer. Journal of Sports Sciences, 18, 669-683.
77. Rigg, P., & Reilly, T. (1988). A fitness profile and anthropometric analysis of first
and second class rugby union players. In T. Reilly, A. Lees, K. Davids & W. J. Murphy
(Eds.), Science and football (pp. 194-200). London: E & FN Spon.
78. Robins, M., Wheat, J. S., Irwin, G., & Bartlett, R. (2006). The effect of shooting
distance on movement variability in basketball. Journal of Human Movement Studies,
20, 218-238.
79. Ross, W. D., & Marfell-Jones, M. J. (1991). Kinanthropometry. In J. D.
MacDougall, H. A. Wenger & R. J. Green (Eds.), Physiological testing of the high-
performance athlete (pp. 223-308). Champaign, IL: Human Kinetics.
80. Rypcinski, L. (2002). Bowling’s final frontier. Bowling Digest, 20(3), 34.
81. Sabol, B. (1963). A study of relationships among anthropometric, strength and
performance measures of college women bowlers. Unpublished Masters Thesis.
University of Oregon, Eugene.
82. Salter, C. W., Sinclair, P. J., & Portus, M., R. (2007). The associations between fast
bowling technique and ball release speed: A pilot study of the within-bowler and
between-bowler approaches. Journal of Sports Sciences, 25(11), 1279-1285.
83. Schmidt, R. A. & Wrisberg, C. A. (2008). Motor learning and performance: A
situation based approach. Champaign, IL: Human Kinetics.
84. Seifert, L., Boulesteix, D., & Chollet, D. (2004). Effect of gender on the adaptation
of arm coordination in front crawl. International Journal of Sports Medicine,
25(3), 217-223.

131
85. Stodden, D. F., Fleisig, G. S., McLean, S. P., & Andrews, J. R. (2005). Relationship
of biomechanical factors to baseball pitching velocity: Within pitcher variation. Journal
of Applied Biomechanics, 21, 44-56.
86. Strickland, R. (1996). Bowling: steps to success. Champaign, IL: Human Kinetics.
87. Tan, B., Aziz, A. R., Teh, K. C., & Lee, H. C. (2001). Grip strength measurement in
competitive ten-pin bowlers. Journal of Sports Medicine and Physical Fitness, 41(1),
68-72.
88. Tan, B., Aziz, R., & Teh, K. C. (2000). Correlations between physiological
parameters and performance in elite ten-pin bowlers. Journal of Science and Medicine in
Sport, 3(2), 176-185.
89. Tan, F. H. Y., Polglaze, T., Dawson, B. & Cox, G. (2009). Anthropometric and
fitness characteristics of elite Australian female water polo players. Journal of Strength
and Conditioning Research, 23(5), 1530-1536.
90. Thissen-Milder, M., & Mayhew, J. L. (1991). Selection and classification of high
school volleyball players from performance tests. Journal of Sports Medicine and
Physical Fitness, 31, 380-384.
91. Thomas, P. R., Schlinker, P. J., & Over, R. (1996). Psychological and psychomotor
skills associated with prowess at ten-pin bowling. Journal of Sports Sciences, 14, 255-
268.
92. Trewartha, G., Casanova, R., & Wilson, C. (2008). A kinematic analysis of rugby
lineout throwing. Journal of Sports Sciences, 26(8), 845-854.
93. Tylkowski, C. M., Simon, S. R., & Mansour, J. M. (1982). Internal rotation gait in
spastic cerebral palsy. The hip: Proceedings of the Tenth Open Scientific Meeting of the
Hip Society, pp. 89-125. St. Louis, Mosby.
94. Van den Tillaar, R., & Ettema, G. (2004a). A force-velocity relationship and
coordination patterns in overarm throwing. Journal of Sports Science and Medicine, 3,
211-219.
95. Van der Tillaar, R. & Ettema, G. (2004b). Effect of body size and gender in overarm
throwing performance. European Journal of Applied Physiology, 91, 413-418.
96. Van der Wende, K. (2005). The effects of game specific task constraints on the
outcome of the water polo shot. Unpublished Masters Thesis, Auckland University of
Technology, Auckland, New Zealand.
132
97. Vila, H., Ferragut, C., Argudo, F. M., Abraldes, J. A., Rodriguez, N., & Alacid, F.
(2009). Relationship between anthropometric parameters and throwing velocity in water
polo players. Journal of Human Sport and Exercise, 4(1), 57-68.
98. Vaughn, R. E. (1993). Intra-individual variability for basketball free throws. ISBS
conference proceedings archive. Retrieved from https://ojs.ub.uni-
konstanz.de/cpa/article/view/1734.
99. Visnapuu, M., & Jurimae, T. (2007). Handgrip strength and hand dimensions in
young handball and basketball players. Journal of Strength and Conditioning Research,
21(3), 923-929.
100. Wagner, H., Buchecker, M., Von Duvillard, S.P., & Müller, E. (2010). Kinematic
description of elite vs. low level players in team-handball jump throw. Journal of Sports
Science and Medicine 9, 15-23.
101. Werner, S. L., Jones, D. G., Guido, J. A., & Brunet, M. E. (2006). Kinematics and
kinetics of elite windmill softball pitching. American Journal of Sports Medicine, 34(4),
597-603.
102. Whiting, W. C., Gregor, R. J., & Halushka, M. (1991). Body segment and release
parameter contributions to new-rules javelin throwing. International Journal of Sport
Biomechanics, 7, 111-124.
103. Widule, C. J. (1967). A study of anthropometric, strength and performance
characteristics of men and women league bowlers. Unpublished Masters Thesis.
University of Oregon, Eugene.
104. Wiedman, D. L. (2006). Bowling: steps to success. Champaign, IL: Human Kinetics.
105. Wilmore, J. H., & Costill, D. L. (1999). Physiology of Sport and Exercise.
Champaign, IL: Human Kinetics.
106. Winter, D. A. (2005). Biomechanics and Motor Control of Human Movement. Ed. 3.
New Jersey: John Wiley & Sons, Inc.
107. Wolfe, L. D., & Gray, P. J. (1982) A cross-cultural investigation into the sexual
dimorphism of stature. In Hall, R. L. (Ed.), Sexual dimorphism in Homo sapiens. A
question of size. New York: Praeger Scientific.
108. Wong, P. L., Chamari, K., Dellal, A., & Wisloff, U. (2009). Relationship between
anthropometric and physiological characteristics in youth soccer players. Journal of
Strength and Conditioning Research, 23(4), 1204-1210.

133
109. Woo, B. H., & Zatsiorsky, V. M. (2006). Variability of competition performance in
throwing and jumping events in elite athletes. Human Movement, 7(1), 5-13.
110. Young, M., & Li, L. (2002). Determination of critical parameters among elite female
shot putters. Sports Biomechanics, 4(2), 131-148.
111. Zhang, Y., Chen, X. R., Zhang, Q., Li, J., & Zhou, S. (2009, 12-14 August). An
investigation on the anthropometry profile and its relationship with selected physical
performance measurements of elite Chinese women volleyball players. Paper presented
at the 8th Annual Conference of the Society of Chinese Scholars on Exercise Physiology
and Fitness, Hong Kong.
Bibliography
1. Robertson, D.G.E., Caldwell, G.E., Hamill, J., Kamen, G. & Whittlesey, S.N. (2004).
Research Methods in Biomechanics. Champaign, IL: Human Kinetics.
2. Griffiths, I.W. (2006). Principles of Biomechanics and Motion Analysis. Baltimore:
Lippioncott Williams & Wilkins.
3. Payton, C.J. & Bartlett, R. M. (2008). Biomechanical Evaluation of Movement in Sport
and Exercise. The British Association of Sport and Exercise Science Guidelines. New
York, NY: Routledge.

134
APPENDIX

135
Appendix 1
Preliminary Questionnaire for Coaches on the Important Parameters of the Delivery in Ten Pin Bowling
Greetings! This questionnaire is part of a postgraduate research project on ten pin bowling delivery. The purpose of these questions is to gauge the opinions of coaches on issues related to the delivery phase in bowling.
Some questions are subjective and open ended while others are based on a rating scale of 1 to 5. With 1 being Not Important and 5 being Very Important, you will have to circle the appropriate number. Please assume that the bowler in question is right handed and is only delivering first balls (not spare deliveries).
Please do not rush through the questions; take your time to answer and if necessary playback some old bowling videos to refresh your memory. Also, please do not hesitate to contact me at [email protected] or 6012-2962707 if you have any queries. Thank you!
1. How important is it to release exactly at the bottom end of the downward swing?
(Not Important)← 1 2 3 4 5 →(Very Important)
2. Which body segment is used as the marker for the release point? For example: should they release before the ankle at the final step.
______________________________________________________________________________________________________________________________
3. What is the approximate maximum height for the backswing (relative to the bowler)? For example: should the ball reach the head height.
______________________________________________________________________________________________________________________________
4. When should the maximum backswing occur? For example: should it be at the same time as the foot contact on the second last step.
______________________________________________________________________________________________________________________________5. How important is the follow through in the bowling delivery?
(Not Important)← 1 2 3 4 5 →(Very Important)
6. In which direction should the hand swing be in the follow through? For example: should it swing exactly straight in front
_______________________________________________________________________________________________________________________________
7. How important is the head position during release?
(Not Important)← 1 2 3 4 5 →(Very Important)

136
8. Which direction should the head be facing and what should they look at during release?______________________________________________________________________________________________________________________________
9. How important is the opposing arm position at release?
(Not Important)← 1 2 3 4 5 →(Very Important)
10. In what position (relative to the bowler) should the opposite arm be at release? For example: should it be in line with the sliding leg
______________________________________________________________________________________________________________________________
11. How important is the forward/leading leg slide at release?
(Not Important)← 1 2 3 4 5 →(Very Important)
12. Describe how and when should the forward/leading leg slide start and end?______________________________________________________________________________________________________________________________
13. How important is the opposite leg slide at release?
(Not Important)← 1 2 3 4 5 →(Very Important)
14. Describe how and when should the opposite leg slide start and end? -______________________________________________________________________________________________________________________________
15. How important is it to have the exact same timing on every delivery?
(Not Important)← 1 2 3 4 5 →(Very Important)
16. How do you identify the proper timing of movements with your bowlers? For example: the first step leg contact should correspond with the start of backswing
______________________________________________________________________________________________________________________________
17. Please describe any other points relating to the release that you think is important.____________________________________________________________________________________________________________________________________________________________________________________________________________________________________________________________

137
Appendix 2
Participant Background Information and Consent Form
NAME: _______________________________________________AGE: ___________
I/C NO: ______________________________________________ GENDER: _______
DOMINANT SIDE: ____________________________________ HEIGHT: ________
ADDRESS: ___________________________________________ WEIGHT: _______
___________________________________________ BMI: ___________
TEL NO & EMAIL: _____________________________________________________
BOWLING STYLE: _____________________________ AVERAGE SCORE: ______
HIGHEST LEVEL: _______________________________ FROM: ________________
BEST ACHIVEMENT: ___________________________ HIGHEST SCORE: _______
STARTED BOWLING: __________________ YEARS IN ACTIVE TRAINING: ____
WEIGHT OF BALL: _______________ TYPE: ________ STEPS TAKEN: _________
Circle your answer. If in doubt circle ‘YES’Have you ever been diagnosed to have a heart problem? YES / NO
Have you ever been diagnosed with high blood pressure? YES / NO
Have you ever had muscle, bone or joint injury or illness YES / NO
Do you have any other illness or anomalies? YES / NO
Are you carrying any injuries? YES / NO
Are you using any prescription drugs at the moment? YES / NO
Do you have any other problems related to physical activity? YES / NO
If you answered YES to any of the above questions, please consult the instructor or your doctor before commencing any tests.
I UNDERSTAND THAT I AM PARTICIPITATING IN THESE TESTS ON MY OWN FREE WILL. I AM AWARE THAT ALTHOUGH UNIVERSITY OF MALAYA, SPORTS CENTRE AND THE INSTRUCTOR CONDUCT THE TESTS IN THE SAFEST POSSIBLE MANNER, THERE ARE STILL SOME RISKS INVOLVED. I WILL NOT HOLD UNIVERSITY OF MALAYA, MTBC, SPORTS CENTRE OR THE INSTRUCTOR LIABLE SHOULD ANY ACCIDENT / INJURY OCCUR DURING THE TESTS.
SIGNATURE: DATE:
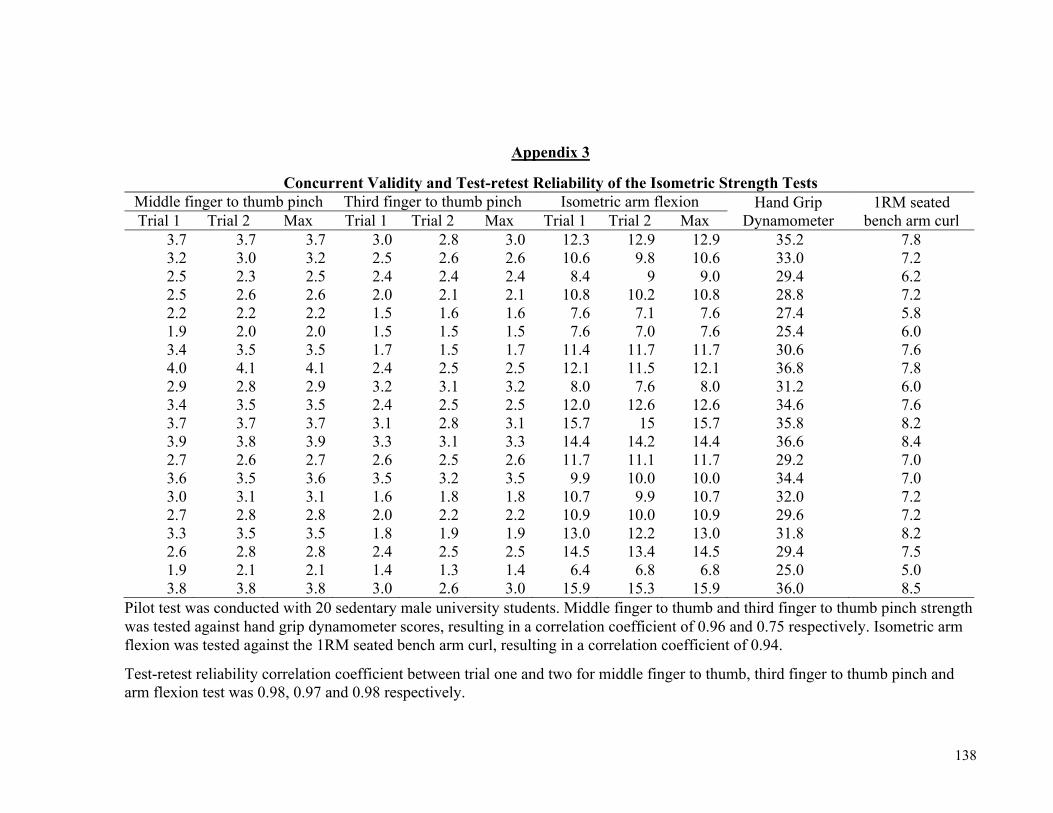
138
Appendix 3
Concurrent Validity and Test-retest Reliability of the Isometric Strength TestsMiddle finger to thumb pinch Third finger to thumb pinch Isometric arm flexion Hand Grip
Dynamometer1RM seated
bench arm curlTrial 1 Trial 2 Max Trial 1 Trial 2 Max Trial 1 Trial 2 Max3.7 3.7 3.7 3.0 2.8 3.0 12.3 12.9 12.9 35.2 7.83.2 3.0 3.2 2.5 2.6 2.6 10.6 9.8 10.6 33.0 7.22.5 2.3 2.5 2.4 2.4 2.4 8.4 9 9.0 29.4 6.22.5 2.6 2.6 2.0 2.1 2.1 10.8 10.2 10.8 28.8 7.22.2 2.2 2.2 1.5 1.6 1.6 7.6 7.1 7.6 27.4 5.81.9 2.0 2.0 1.5 1.5 1.5 7.6 7.0 7.6 25.4 6.03.4 3.5 3.5 1.7 1.5 1.7 11.4 11.7 11.7 30.6 7.64.0 4.1 4.1 2.4 2.5 2.5 12.1 11.5 12.1 36.8 7.82.9 2.8 2.9 3.2 3.1 3.2 8.0 7.6 8.0 31.2 6.03.4 3.5 3.5 2.4 2.5 2.5 12.0 12.6 12.6 34.6 7.63.7 3.7 3.7 3.1 2.8 3.1 15.7 15 15.7 35.8 8.23.9 3.8 3.9 3.3 3.1 3.3 14.4 14.2 14.4 36.6 8.42.7 2.6 2.7 2.6 2.5 2.6 11.7 11.1 11.7 29.2 7.03.6 3.5 3.6 3.5 3.2 3.5 9.9 10.0 10.0 34.4 7.03.0 3.1 3.1 1.6 1.8 1.8 10.7 9.9 10.7 32.0 7.22.7 2.8 2.8 2.0 2.2 2.2 10.9 10.0 10.9 29.6 7.23.3 3.5 3.5 1.8 1.9 1.9 13.0 12.2 13.0 31.8 8.22.6 2.8 2.8 2.4 2.5 2.5 14.5 13.4 14.5 29.4 7.51.9 2.1 2.1 1.4 1.3 1.4 6.4 6.8 6.8 25.0 5.03.8 3.8 3.8 3.0 2.6 3.0 15.9 15.3 15.9 36.0 8.5
Pilot test was conducted with 20 sedentary male university students. Middle finger to thumb and third finger to thumb pinch strength was tested against hand grip dynamometer scores, resulting in a correlation coefficient of 0.96 and 0.75 respectively. Isometric arm flexion was tested against the 1RM seated bench arm curl, resulting in a correlation coefficient of 0.94.
Test-retest reliability correlation coefficient between trial one and two for middle finger to thumb, third finger to thumb pinch and arm flexion test was 0.98, 0.97 and 0.98 respectively.

139
Appendix 4
Body Segment Parameters from Data Gathered by Winter (2005)

140
Appendix 5
Computational Methods for an Arm Model (Ariff & Rambely, 2009)

141

142