Critical Analysis and Application of Net-Metering Practice ...
13
Research Article Critical Analysis and Application of Net-Metering Practice in MEPCO Hassan Zahid, 1 Farhana Umer , 1 Zeeshan Rashid , 1 Abdur Raheem, 1 Rabia Shakoor, 1 and G. Amjad Hussain 2 1 Department of Electrical Engineering, Islamia University of Bahawalpur Pakistan, Pakistan 2 School of Engineering and Applied Sciences, American University of Kuwait, Kuwait Correspondence should be addressed to Farhana Umer; [email protected] Received 10 January 2020; Accepted 24 March 2020; Published 13 June 2020 Academic Editor: Leonardo Palmisano Copyright © 2020 Hassan Zahid et al. This is an open access article distributed under the Creative Commons Attribution License, which permits unrestricted use, distribution, and reproduction in any medium, provided the original work is properly cited. The electrical infrastructure around the globe is expanding at a rapid rate for the sake of fulfilling power demands in the domestic, commercial and entertainment industries aiming to boost the living standards. In this regard, renewable energy sources (RES) are globally accepted potential candidates for maintaining inexhaustible, clean, and reliable electricity with a supplementary feature of economic prospect. The efficiency of power distribution at reduced cost to the consumers can be further enhanced by introducing a two-way billing system so-called net-metering which has the potential to overcome issues such as voltage regulation, power blackouts, overstressed grid and need for expensive storage systems thereby making it beneficial for the grid and the end user. This envisioning has encouraged the Government of Pakistan to install net-metering infrastructure at places which accommodate surplus renewable energy reserves. According to the Electric Power Act 1997, the National Electric Power Regulatory Authority (NEPRA) issued the net-metering rules and regulations in September 2015 by the endorsement of Federal Government which allowed the distribution companies in Pakistan to buy surplus electricity units generated by the consumers in order to partly reimburse the units imported from the utility grid. The aim behind this research work is to promote renewable energy utilization through net-metering mechanism in order to achieve maximum power. The export of units from consumer side to utility grid and vice versa can be made through bidirectional energy meter. In this paper, a solar net-metering analysis has been carried out on ETAP software to determine its benefits in a distribution network. Different scenarios have been investigated, and it is concluded that solar net-metering technique has multiple influential benefits, e.g., improvement in voltage regulation, reduction in transmission and distribution losses, increase in power availability, less billing to consumers, and reduction of loading on utility grid. 1. Introduction In Pakistan, the energy demand is growing by more than nine percent annually, and it is predicted that an increase in energy demand will be eightfold by 2030 and twenty-fold by 2050 [1]. Among all developing countries, Pakistan is also in a race of development and in order to conform to its huge load demand, Pakistan requires expanding the scale of power network to be able to maintain the balance between energy supply and demand. Due to the continuous and overwhelm- ing population growth in the country, the supply of electricity is lagging behind the demand and due to this significant imbalance, a severe load shedding of 10 to 12 hours in urban areas and 16 to 18 hours in rural areas is taking place in sum- mer [2]. The best and feasible solution to overcome this energy gap is to promote renewable energy on an individual basis and develop awareness for its efficient utilization through net-metering. The renewable energy sources such as wind, tidal, geothermal, and solar energy can be accessible in excess quantity, and the dramatic increase in energy demand can be easily maintained with them [3]. Net- metering is an advanced billing mechanism which has the capability to run the meter in backward direction when elec- tricity is credited to the grid during off-peak hours; thus, units are sold by the consumer. Now with the help of Alternative Energy Development Board (AEDB), National Hindawi International Journal of Photoenergy Volume 2020, Article ID 4135860, 13 pages https://doi.org/10.1155/2020/4135860
Transcript of Critical Analysis and Application of Net-Metering Practice ...

Research ArticleCritical Analysis and Application of Net-MeteringPractice in MEPCO
Hassan Zahid,1 Farhana Umer ,1 Zeeshan Rashid ,1 Abdur Raheem,1 Rabia Shakoor,1
and G. Amjad Hussain2
1Department of Electrical Engineering, Islamia University of Bahawalpur Pakistan, Pakistan2School of Engineering and Applied Sciences, American University of Kuwait, Kuwait
Correspondence should be addressed to Farhana Umer; [email protected]
Received 10 January 2020; Accepted 24 March 2020; Published 13 June 2020
Academic Editor: Leonardo Palmisano
Copyright © 2020 Hassan Zahid et al. This is an open access article distributed under the Creative Commons Attribution License,which permits unrestricted use, distribution, and reproduction in any medium, provided the original work is properly cited.
The electrical infrastructure around the globe is expanding at a rapid rate for the sake of fulfilling power demands in the domestic,commercial and entertainment industries aiming to boost the living standards. In this regard, renewable energy sources (RES) areglobally accepted potential candidates for maintaining inexhaustible, clean, and reliable electricity with a supplementary feature ofeconomic prospect. The efficiency of power distribution at reduced cost to the consumers can be further enhanced by introducing atwo-way billing system so-called net-metering which has the potential to overcome issues such as voltage regulation, powerblackouts, overstressed grid and need for expensive storage systems thereby making it beneficial for the grid and the end user.This envisioning has encouraged the Government of Pakistan to install net-metering infrastructure at places whichaccommodate surplus renewable energy reserves. According to the Electric Power Act 1997, the National Electric PowerRegulatory Authority (NEPRA) issued the net-metering rules and regulations in September 2015 by the endorsement of FederalGovernment which allowed the distribution companies in Pakistan to buy surplus electricity units generated by the consumersin order to partly reimburse the units imported from the utility grid. The aim behind this research work is to promoterenewable energy utilization through net-metering mechanism in order to achieve maximum power. The export of units fromconsumer side to utility grid and vice versa can be made through bidirectional energy meter. In this paper, a solar net-meteringanalysis has been carried out on ETAP software to determine its benefits in a distribution network. Different scenarios havebeen investigated, and it is concluded that solar net-metering technique has multiple influential benefits, e.g., improvement involtage regulation, reduction in transmission and distribution losses, increase in power availability, less billing to consumers,and reduction of loading on utility grid.
1. Introduction
In Pakistan, the energy demand is growing by more than ninepercent annually, and it is predicted that an increase inenergy demand will be eightfold by 2030 and twenty-foldby 2050 [1]. Among all developing countries, Pakistan is alsoin a race of development and in order to conform to its hugeload demand, Pakistan requires expanding the scale of powernetwork to be able to maintain the balance between energysupply and demand. Due to the continuous and overwhelm-ing population growth in the country, the supply of electricityis lagging behind the demand and due to this significantimbalance, a severe load shedding of 10 to 12 hours in urban
areas and 16 to 18 hours in rural areas is taking place in sum-mer [2]. The best and feasible solution to overcome thisenergy gap is to promote renewable energy on an individualbasis and develop awareness for its efficient utilizationthrough net-metering. The renewable energy sources suchas wind, tidal, geothermal, and solar energy can be accessiblein excess quantity, and the dramatic increase in energydemand can be easily maintained with them [3]. Net-metering is an advanced billing mechanism which has thecapability to run the meter in backward direction when elec-tricity is credited to the grid during off-peak hours; thus,units are sold by the consumer. Now with the help ofAlternative Energy Development Board (AEDB), National
HindawiInternational Journal of PhotoenergyVolume 2020, Article ID 4135860, 13 pageshttps://doi.org/10.1155/2020/4135860

Electric Power Regulatory Authority (NEPRA) and con-cerned Distribution Companies (DISCOS), the Governmentof Pakistan is motivating people to draw their attentiontowards net-metering by promoting renewable energy so thatthe investments can be made on renewable energy sector atsmall/individual level. In 2015, the rules and standards on anet-metering scheme were defined by NEPRA by allowingDISCOS to take/purchase excess energy units generated byrenewable energy sources from consumer side at the samerates prescribed by the company [4].
In a modernized era of technological advancements, net-metering adoption has expanded in a significantly influentialmanner in the power sector. The net-metering mechanism isof great interest for renewable energy users, e.g., wind andsolar. Net-metering is a scheme by which electric power canbe transferred to an electric grid on the same rates prescribedby the distribution companies at which consumer is beingcharged. For renewable energy users such as solar and windenergy, the net-metering mechanism is very attractive as itallows the end users to consume all their generated electricalenergy, depending upon their need or to transfer extra elec-trical energy/all generated electrical energy to utility grid bybidirectional billing mechanism. When required, the extraexported electrical energy can again be drawn on the samerates as it was transferred to the utility grid. During this pro-cess, the electric grid behaves like a storage device (battery) tosolar energy or wind energy users thereby eliminating theneed for dedicated battery banks [5]. The block diagram ofthe net-metering mechanism is shown below in Figure 1.
In terms of geography, Pakistan is full of renewableenergy sources especially solar energy and is located in a veryattainable solar range where sunshine’s up to 7 to 8 hoursregularly in winter and 11 to 12 hours regularly in a summerseason. Although, the weather conditions, e.g., humidity,dust, fog, and clouds also affect the solar irradiance, yet, theamount of solar energy reaching the earth is about 80% inclear and bright days. Having such a special geographicalarea, Pakistan receives the solar radiations continuously thewhole year, and average solar radiation is approximately 9hours [6]. The annual direct solar irradiation values in allfour provinces of Pakistan are shown in Table 1.
The installation of a rooftop PV system through a net-metering mechanism can meet increasing energy demand[7]. This will not only reduce the burden on the power systembut also reduces transmission and distribution losses.
Due to the best geographical area, Pakistan has aimed toset about 10 GWh from renewable energy until 2030 [8]. Withthe collaboration of AEDB, the Government of Pakistan isplaying a vital role for the promotion and the advancementof solar power in Pakistan. In 2006, AEDB abolished the taxduties on solar energy products for the purpose of promotingand increasing the solar technology in Pakistan [8]. One of theexamples for the advancement of solar power within Pakistanis by setting up the world’s largest solar power plant namedQuaid-e-Azam Solar Park (QASP). QASP is located inBahawalpur (Punjab) having a capacity of 1000MW withCommercial Operation Date (COD) set for 2020 [9]. Up tonow, 4units are in operation and synchronized with thenational grid, each having a 100MW capacity [9].
2. Literature Review
In former times, the net-metering scheme was firstly adoptedby the USA where the solar energy or wind energy wassynchronized with the grid network. This system wasintroduced for the users of renewable energy because theywere interested to use all their generated electrical energy atdifferent times according to their demand. In 1981, the firststate that passed the net-metering license was Minnesota[10]. After Minnesota, many other states also passed thenet-metering scheme license, since the interest behind thislaw was only to feed excess energy to utility grids on the ratesprescribed by concerned distribution companies. Up to now,42 states have adopted and implemented the net-metering inUSA [10].
In the Philippines, the net-metering mechanism wasinitiated by the Renewable Energy Act (REA) 2008, and itsImplementing Rules and Regulation (IRR). The EnergyRegulatory Commission (ERC) is the implementing bodywhich is in coordination with the National Renewable EnergyBoard (NREB) [11]. In 2013, a net-metering scheme was alsostarted in Cyprus with the cooperation of the Cyprus EnergyRegulatory Authority (CERA) [12]. The interest behind thisscheme was to promote the rooftop installation of the PV sys-tem in Cyprus as a sign of clean and environmental friendlyenergy. After the first promotion of a net-metering scheme inCyprus, the rooftop installations of PV started becomingpopular on the individual basis because of the interest andsimplicity of the net-metering policy offered in Cyprus. TheCyprus that lies in the Eastern side of the Mediterraneanregion has the greatest solar irradiance and photovoltaicpotential of Europe [12]. The yearly (horizontal) irradiancein hilly areas lies between the ranges of 1800 to 1900 kWh/m2
and in seaside areas/inner-side of the country lies between1900 to 2100 kWh/m2 [12].
Due to the fast economic growth in the past few years,many southeast countries are planning to equalize rapid eco-nomic development with long-range renewability goals. Dueto this upgradation, several countries have aimed to increase
Solar pvpanels Invertor
Consumer end
Consumerpanel Net meter
Utilitypower
discount
Utilityend
Utilitypole
Consumerloads
Figure 1: Block-diagram of net-metering mechanism [5].
Table 1: Pakistan all provinces solar irradiance [6].
Province nameMin. solar irradiation
(kWh/m2/day)Max. solar irradiation
(kWh/m2/day)
Punjab 6.5 7
Baluchistan 7 7.5
Sindh 5 5.5
KPK 4.5 5
2 International Journal of Photoenergy

their renewable energy share within their national grids.Recently the attention has inflated to promote the renewableenergy sources on small-scale geared towards commercial aswell as residential areas [13]. Among these aimed countries,Malaysia, Singapore, Thailand, Philippines, and Indonesiahave initiated frameworks for its residential users to installrooftop PV systems. Recently, Indonesia also introduced anet-metering scheme [13]. Thailand and Malaysia are alsoinitiating a net-metering mechanism [9].
In India, Maharashta was the first state to availed net-metering. The first bidirectional meter was installed inVerdean Industries Ltd. by Tata Power Company. After-wards, further 25 kW of solar metering was installed atVatic-Nagar word office. Some other projects were alsoeffectively installed by Rooftop-Urjacomopany, i.e., 3 kWsolar net-metering system at Telangana, 15 kW solar net-metering system at Karnataka, 10 kW solar net-meteringsystem at Karnataka [14].
Many distribution companies are promoting solar net-metering mechanism to residential level. Several states inthe United States of America and also in Japan have executeda net-metering mechanism where generated electricity is self-consumed before feeding surplus electricity to the utility grid.On the other side, Germany is widely known for the thrivingexecution of the gross-metering scheme [15].
India is also known for its fervent solar energy, wheresolar radiations are accessible for longer durations on a dailybasis. As solar energy has much potential to overcome energylosses. Therefore, the National Solar Mission was planned byIndia [16]. The aim of National Solar Mission was to increasegeneration capacity by technological innovation and also todrop down the cost of electricity as low as possible. Themission consists of three-stage approach. The 1st approach(i.e., 2010-2013) is promoting off-grid system whichcomprises of grid-tied solar power generation to 1000MW.The 2nd approach (i.e., 2014-2017) comprises of further3000MW or more grid-tied solar power generation. The 3rd
phase (i.e., 2017-2022) will comprise of 20000MW or moregrid-tied solar power generation [16].
In Gujarat, power generation through net-meteringscheme aims to set up to 5MW of power, i.e., 1MW inprivate society and 4MW in government buildings [15].
3. Methodology
In this paper, an 11 kV feeder named “CITY-3, Azeem Abad”is chosen for solar net-metering analysis which is emanatingout from the 132 kV grid station, Burewala in the region ofMultan electric power company (MEPCO). The grid voltageis stepped down by 160 distribution transformers (3-phase)from 11kV to 415V at which multiple loads are connected.For the convenience of easiness in simulation, these 160 dis-tribution transformers are combined to form 8 distributiontransformers. Table 2 shows the detail of the total 3-phasedistribution transformers of CITY-3 feeder [17].
From CITY-3 feeder, a consumer named M. Sarwar fromPunjab College (PC), Azeem Abad, Burewala is utilizing itsown solar electricity having availed the solar net-meteringscheme. The sectioned load of this consumer is 170 kW and
the generation capacity of solar net-metering is 192. Withthe help of bidirectional meter, this solar net-metering useris exporting excess electricity to the utility grid when its gen-eration is more than its power demand. In this research work,we simulate this feeder and perform load flow analysis withand without solar net-metering. The purpose of this simula-tion is to implement a net-metering scheme inMEPCO usingelectric transient and analysis program (ETAP) software.Another main reason is to promote a solar net-meteringscheme in Pakistan. At the end, we do a comparison of volt-age levels, distribution losses, and line losses with and with-out a solar net-metering scheme. The Table 3 shown belowindicates the status of a net-metering applicant on whichsimulation has to be performed [17].
In this paper, a different number of cases are performedwith respect to Bus22 on CITY-3 feeder with solar net-metering mechanism, and critical analysis, i.e., load flowanalysis and harmonics analysis are also carried out onETAP. The Bus22 is selected subject to the net-metering sta-tus of MEPCO [17]. Multiple loads are connected on N-Mnetwork transformer as shown in Figure 2(b). Out of theseloads, the only PC Burewala load had installed a solar systemof 192 kW and had availed net-metering. As the scope of thispaper is to promote the net-metering scheme and to show itsnotable advantages on the distribution system. So in the lightof the above points, the Bus22 is selected. The following casesare performed:
Case 1. Load flow analysis of CITY-3 feeder with Bus22 loadON/solar power OFF.
Table 2: CITY-3 feeder distribution transformers [17].
Transformer (KVA) Quantity
10 4
15 7
25 77
50 23
75 1
100 25
200 20
400 1
630 2
Total 160
Table 3: Status of net-metering applicant, MEPCO [17].
Net-metering applicant statusName of applicant M. Sarwar (PC Burewala)
Sub division codes 15333
Feeder name CITY-3 Azeem Abad
Sectioned load 170
Generation license DGL/620/2018
Installation status Installed
Billing started Yes
Solar generation (kW) 192
3International Journal of Photoenergy

Gen12 MW
SW1
Bus50.415 kV
Bus100.415 kV
Bus150.415 kV
Bus1111 kV
Bus1711 kV
Bus1811 kV
Bus190.415 kV
Bus1611 kV
Bus90.415 kV
Bus40.415 kV
Bus140.415 kV
Load10.55 MVA
Load50.6 MVA
SW4
Load70.5 MVA
CAP10.9 MVAR
SW20
Load22 MVA Load4
0.4 MVALoad60.55 MVA
132 kV G.S Burewala10 MVAsc
Load30.6 MVA
SW2
T32 MVA
T42 MVA
T22 MVA
T11 MVA
T61.26 MVA
T52 MVA
T71.3 MVA
Bus611 kV
Bus711 kV
Bus811 kV
Bus311 kV
Bus211 kV
Bus1211 kV
Single line diagram
NM network
Net metering
Bus1311 kV
Bus111 kV
SW5
(a)
Single line diagram of N-M networkBus2011 kV
Bus210.415 kV
Bus220.415 kV
PVAIPC burewala load120 kvA
Line 12 T80.475 MVA
Cable 1
Load135 kVA
Load85 kVA
Load97 kVA
Load1160 kVA
Load1415.5 kVA
Load154 kVA
Load124.4 kVA
Load1015 kVA
Mtr14 HP
Mtr27 HP
Mtr312 HP
Mtr318 HP
Load164.5 kVA
(b)
Figure 2: (a) Single line diagram of CITY-3 feeder (MEPCO). (b) Single line diagram of net-metering network.
4 International Journal of Photoenergy
Load flow analysis with solar OFF
Gen12 MW
Load22 MVA
Bus50.415 kV
Bus611 kV
154.1 kW10.1 Kvar
T22 MVA
Bus111 kV
3274 kW469.8 kvar
3274 kW469.8 kvar
3273.8 kW469.8 kvar
Load40.4 MVA
Bus100.415 kV
Bus1111 kV
Bus1211 kV
2107 kW–45.9 kvar
Bus1311 kV
Bus140.415 kV
Bus190.415 kV97.83 %
97.94 %
98.91 %
99.03 %99.14 %
99.03 %
98.95 %
98.8 %
97.7 %
98.78 %Bus1811 kV
CAP10.9 MVAR
0 kW884.6 kvar
959.8 kW339.7 kvar36
6.4
kW12
8.8
kvar
519.
8 kW
261.
6 kv
ar
366.1 kW128.5 kvar
364.6 kW119.8 kvar
132 kV G.S Burewala10 MVAsc
Bus1711 kV
Bus1611 kV
Bus150.415 kV
Load60.55 MVA
T41 MVA
100%
1700 kW600 kvar
1855 kW609.7 kvar
Bus711 kV
Bus811 kV
Bus90.415 kV
Load30.6 MVA
Load10.55 MVA
Load50.6 MVA
Load70.5 MVA
T52 MVA
T71.3 MVA
T61.26 MVA
516.8 kW250.3 kvar
455.6 kW149.8 kvar
457.1 kW160.3 kvar
518.2 kW260.1 kvar
501.5 kW177.9 kvar
500.5 kW177 kvar
498.7 kW163.9 kvar
457.5 kW160.9 kvar
Bus40.415 kV
Bus311 kV
Bus211 kV
488.7 kW312.2 kvar
485.6 kW300.9 kvar
T32 MVA
486.9 kW310.7 kvar
T11 MVA
256.1 kW99 kvar
501.5 kW180.3 kvar
99.18 %
502.2 kW181 kvar
99.36 %154.3 kW10.2 kvar
498.6 kW163.9 kvar
97.69 %97.58 %
98.66 %
99 %
98.89 %
98.78 %
NM network
Net metering
644.
8 kW
323.
4 kv
ar
(a)
Load flow analysis (N-M network) with solar OFFBus2011 kV
Bus210.415 kV
Bus220.415 kV
108.5 kW35.7 kvar
4.54
kW
1.49
kva
r
3.64
kW
2.32
kva
r6.
36 k
W2.
09 k
var
13.6
kW
4.48
kva
r7.
05 k
W4.
24 k
var
54.5
kW
17.9
kva
r
4 kW
1.31
kva
r15
.4 k
W8.
31 k
var
10.4
kW
5.91
kva
r
PVAI
Open
PC burewala load120 kvA
Line 12 T80.475 MVA
Load135 kVA
99.23%
Load85 kVA
Load97 kVA
Load1160 kVA
Load1415.5 kVA
97.55 %
97.78 %
255.9 kW99.1 kvar
Load154 kVALoad12
4.4 kVALoad1015 kVA
Mtr14 HP
Mtr27 HP
Mtr312 HP
Mtr318 HP
Load164.5 kVA
108.8 kW35.7 kvar
–108.5 kW
Cable 1
4.54 kW1.49 kvar
4.09 kW1.34 kvar
14.1 kW4.63 kvar
3.63 kW1.19 kvar
–35.66 kvar
(b)
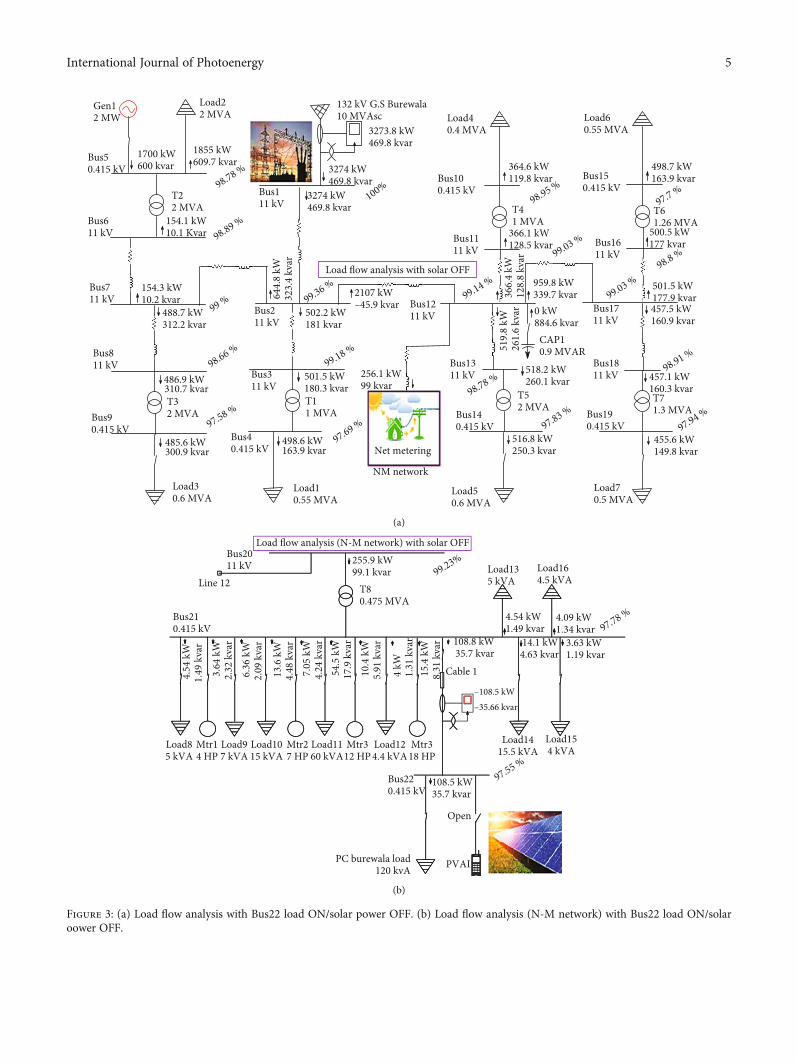
Figure 3: (a) Load flow analysis with Bus22 load ON/solar power OFF. (b) Load flow analysis (N-M network) with Bus22 load ON/solaroower OFF.
5International Journal of Photoenergy

Case 2. Load flow analysis of CITY-3 feeder with Bus22 loadON/solar power ON.
Case 3. Load flow analysis of CITY-3 feeder with Bus22 loadOFF/solar power ON.
4. Load Flow Analysis and Results
A single line diagram of CITY-3 feeder represents a 3-phasepower system as shown in Figure 2(a). For the sake of consid-eration, a single line diagram of the solar net-metering mech-anism is separately shown in a new network/window (N-Mnetwork) and is connected with the feeder as shown belowin Figure 2(b). The reason to make a separate network is toobserve the prominent effects of solar net-metering in a dis-tribution network.
4.1. Case 1, Load Flow Analysis with Bus22 Load ON/SolarPower OFF. In the first case, the solar power generation isnot available (during night or cloudy weather condition),and the load Bus22 of PC Burewala is drawing all therequired power from the utility grid as shown inFigures 3(a) and 3(b). In this case, the voltage on load busBus21 of N-M network is 408V, while the nominal voltageis 415V. It can be seen that there is a voltage drop of 8 voltsacross load Bus21. In addition, there is an additional burdenof 120 kW (PC Burewala load) on utility grid as PC Burewalaload is drawing all the required power from the grid station,resulting in increase in transmission and distribution losses.In this case, load flow analysis shows the real and reactivepower flowing within the network, the buses voltage levelsas well as the transmission and transformation losses in a dis-tribution network which can be seen in reports generated bythe load flow study analysis in ETAP.
It can be seen in Figure 3(b) that the solar power is OFFwhich means the solar is not feeding power to Bus22, andall the power is coming from the utility grid to Bus22 to feedPC Burewala load as shown by multimeter. As seen bymultimeter, the active and reactive power consumption ofPC Burewala load is -109.5 kW and -35.99 kVAR.
The negative sign depicts that the load is drawing bothreal power and reactive power from the utility grid. Thevoltage profile of the feeder can also be observed from theutility grid, 11 kV feeder to the load Bus22 of PC Burewala.The Table 4 shows the comparison of voltages on differentbuses between nominal voltage and observed voltage profilepercentage in Case 1.
The Table 5 shown below shows the load flow on relevantbuses of the net-metering network for Case 1.
It can be seen from the Table 5 that there is a load of108.5 kW on Bus22 and the solar power is OFF (nogeneration on Bus22), and voltage profile on main loadBus21 of the net-metering network is 97.78% and on PCBurewala load Bus22 is 97.55%. A complete feeder is drawing3274 kW and 469.8 kVAR power from the utility grid asshown in Figure 3(a). The negative sign with 0.109MW onBus22 shows that the PC Burewala load on Bus22 is extract-ing power from the utility grid.
Table 4: Voltage profile in Case 1.
Bus ID Nominal voltage (V) Observed voltage level (% age)
Bus1 11000 100
Bus2 11000 99.36
Bus3 11000 99.18
Bus4 415 97.69
Bus5 415 98.78
Bus6 11000 98.89
Bus7 11000 99
Bus8 11000 98.66
Bus9 415 97.58
Bus10 415 97.95
Bus11 11000 99.03
Bus12 11000 99.14
Bus13 11000 98.78
Bus14 415 97.83
Bus15 415 97.7
Bus16 11000 98.8
Bus17 11000 99.03
Bus18 11000 98.91
Bus19 11000 97.94
Bus20 11000 99.06
Bus21 415 97.78
Bus22 415 97.55
Table 5: Load flow of N-M network for Case 1.
Bus IDVoltage Load flow
kV % mag. MW MVAR
20 11.000 99.065 -0.256 -0.099
21 0.415 97.779 -0.255 -0.092
22 0.415 97.555 -0.108 -0.036
Table 6: Branch losses for Case 1.
Branch IDLosses
Branch IDLosses
kW kW
Line1 18.8 Line12 0.2
Line2 0.8 Cable1 0.3
Line3 2.1 T1 2.8
Line4 0.2 T2 1.1
Line5 1.4 T3 1.4
Line6 4.8 T4 1.5
Line7 0.3 T5 1.4
Line8 1.6 T6 1.8
Line9 0.9 T7 1.5
Line10 1.0 T8 1.3
Line11 0.4
Total losses (kW) 45.6
6 International Journal of Photoenergy

Load flow analysis with solar ON
Gen12 MW
Load22 MVA
Bus50.415 kV
Bus611 kV
155.2 kW10.5 Kvar
T22 MVA
Bus111 kV
3105 kW463.2 kvar
3105 kW463.2 kvar
3105 kW463.2 kvar
Load40.4 MVA
Bus100.415 kV
Bus1111 kV
Bus1211 kV
1939 kW–52 kvar
Bus1311 kV
Bus140.415 kV
Bus190.415 kV97.88 %
97.99 %
98.96 %
99.08 %99.19 %
99.08 %
98 %
98.86 %
97.75 %
98.83 %Bus1811 kV
CAP10.9 MVAR
0 kW885.5 kvar
960.8 kW340 kvar36
6.8
kW12
9 kv
ar
520.
3 kW
261.
9 kv
ar
366.5 kW128.7 kvar
365 kW120 kvar
132 kV G.S Burewala10 MVAsc
Bus1711 kV
Bus1611 kV
Bus150.415 kV
Load60.55 MVA
T41 MVA
100%
1700 kW600 kvar
1855 kW609.7 kvar
Bus711 kV
Bus811 kV
Bus90.415 kV
Load30.6 MVA
Load10.55 MVA
Load50.6 MVA
Load70.5 MVA
T52 MVA
T71.3 MVA
T61.26 MVA
516.4 kW250.6 kvar
455.1 kW149.9 kvar
457.6 kW160.4 kvar
518.7 kW260.4 kvar
502 kW178.1 kvar
501.1 kW177.1 kvar
499.2 kW164.1 kvar
458.3 kW161.2 kvar
Bus40.415 kV
Bus311 kV
Bus211 kV
488.7 kW312.2 kvar
485.9 kW301.1 kvar
T32 MVA
487.2 kW310.9 kvar
T11 MVA
86.5 kW94.5 kvar
501.8 kW180.4 kvar
99.21 %
502.5 kW181.1 kvar
99.39 %155.3 kW10.6 kvar
499 kW164 kvar
97.72 %97.61 %
98.69 %
99.03 %
98.92 %
98.81 %
NM network
Net metering
646.
2 kW
323.
9 kv
ar
(a)
Load flow analysis (N-M network) with solar ONBus2011 kV
Bus210.415 kV
Bus220.415 kV
170.8 kW0 kvar
110.1 kW36.2 kvar
60.6 kW–36.2 kvar
4.54
kW
1.5
kvar
3.64
kW
2.32
kva
r
6.41
kW
2.11
kva
r
13.7
kW
4.51
kva
r
7.05
kW
4.24
kva
r
54.9
kW
18.1
kva
r
4.03
kW
1.32
kva
r
10.4
kW
5.91
kva
r
PVAIPC burewala load120 kvA
Line 12T80.475 MVA
Load135 kVA
99.15%
Load85 kVA
Load97 kVA
Load1160 kVA
Load1415.5 kVA
98.3 %
98.18 %
86.5 kW94.7 kvar
Load154 kVA
Load124.4 kVA
Load1015 kVA
Mtr14 HP
Mtr27 HP
Mtr312 HP
Mtr318 HP
Load164.5 kVA
15.4
kW
8.31
kva
r
Cable 1
4.58 kW1.5 kvar
4.12 kW1.35 kvar
14.2 kW4.67 kvar
3.66 kW1.2 kvar
60.64 kW
–36.
2 kv
ar
(b)
Figure 4: (a) Load flow analysis with Bus22 load ON/solar ON. (b) Load flow analysis (N-M network) with Bus22 load ON/solar ON.
7International Journal of Photoenergy

Branch losses in Case 1: Table 6 shows the branch lossesreport of CITY-3 feeder.
Table 6 shows that the total losses of the system in Case 1when PC Burewala load is ON and solar power is OFF are45.6 kW. All these values are of importance from the compar-ison point of view when solar is generating power, (solar ON)to meet consumer demand and feeding surplus energy to theutility grid.
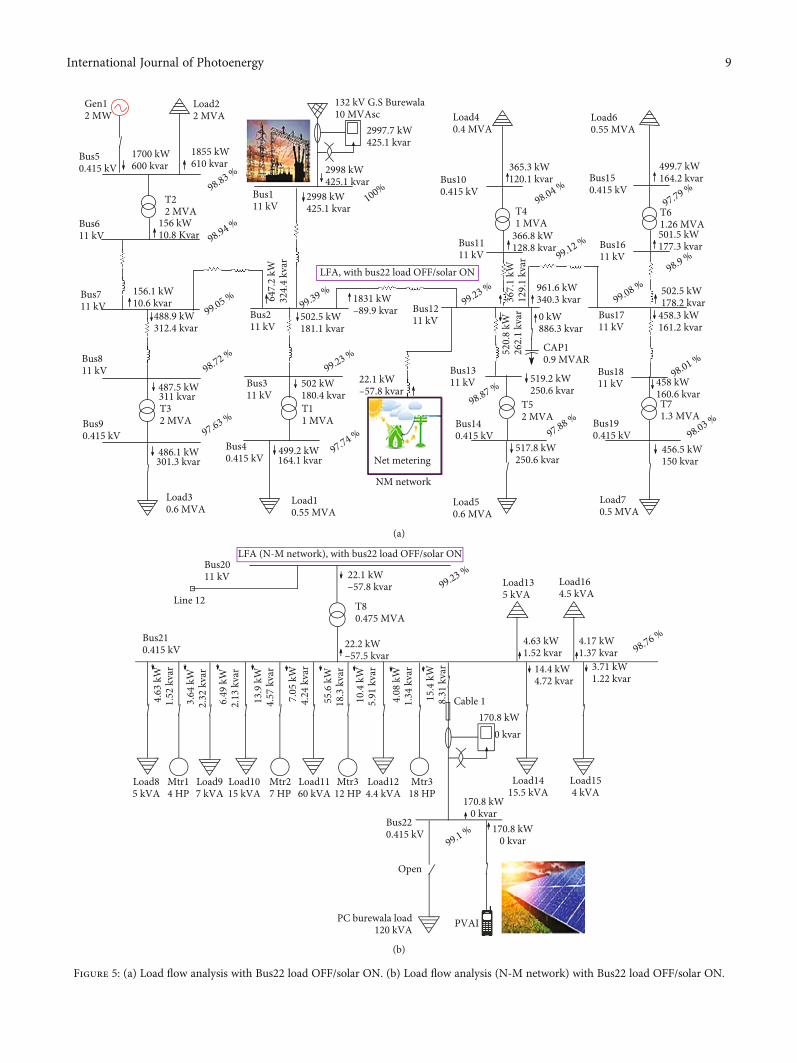
4.2. Case 2: Load Flow Analysis with Bus22 Load ON/SolarPower. In Case 2, the solar power is available (i.e., SolarON) feeding the Bus22 load and exporting surplus power tothe utility grid. Due to net-metering phenomena, a numberof notable changes can be observed in a distribution networkwhich can be visible in corresponding load flow and branchlosses results. It can be seen that, in Case 1, when solar wasOFF, the complete feeder was drawing 3274 kW from theutility grid, but in this case, when solar is ON, the completefeeder is drawing 3105.1 kW from the utility grid whichshows that solar net-metering mechanism reduces theburden on utility grid as well as the dependency of the net-metering user on utility grid as shown in Figure 4(a). In thiscase, the multimeter on PC Burewala load side shows thereading of 60.64 kW and -36.3 kVAR as shown below inFigure 4(b). The positive sign with real power 60.64 kWshows that the solar is feeding extra power to the utility grid,whereas the negative sign with reactive power -36.3 kVARshows that the load is taking reactive power from the utilitygrid as solar only generates real power.
In Case 2, the voltage level across all the busses of a distri-bution network especially in N-M network on main loadBus21 is 98.18%, and on solar net-metering associated loadBus22 is 98.3%. In previous case (i.e., solar OFF), the voltagelevel on these two busses was 97.78% on Bus21 and 97.55%on Bus22 which clearly depicts that solar net-meteringimproves voltage profile across load as well as feeding surpluspower to the utility grid also improves voltage profile of thesystem that makes the power system more stable as well asimproves the quality of power supply to the consumer.
In Case 2, a complete feeder is drawing 3105 kW realpower and 463.2 kVAR reactive power from the utility gridas shown in Figures 4(a) and 4(b), while in Case 1 (i.e., solarOFF), the power drawn by the utility grid is 3274 kW and469.8 kVAR. The solar power is generating 170 kW out ofwhich 110.1 kW is consumed by the associated PC Burewalaload, and extra power of 60.64 kW is fed to the utility grid.Table 7 shows the comparison between nominal voltagesand the observed voltage profile at different busses in Case 2.
The load flow shown in Table 8 shows the load flow andvoltage profile on relevant buses, i.e., Bus20, Bus21, andBus22 of N-M network for Case 2.
It can be observed from the Table 8 when solar powergeneration of 170.8 kW is on Bus22 and voltage profile on
Table 7: Voltage profile in Case 2.
Bus ID Nominal voltage (V) Observed voltage level (% age)
Bus1 11000 100
Bus2 11000 99.39
Bus3 11000 99.21
Bus4 415 97.72
Bus5 415 98.81
Bus6 11000 98.92
Bus7 11000 99.03
Bus8 11000 98.69
Bus9 415 97.61
Bus10 415 98
Bus11 11000 99.08
Bus12 11000 99.19
Bus13 11000 98.83
Bus14 415 97.88
Bus15 415 97.75
Bus16 11000 98.86
Bus17 11000 99.08
Bus18 11000 98.96
Bus19 11000 97.99
Bus20 11000 99.15
Bus21 415 98.18
Bus22 415 98.3
Table 8: Load Flow of N-M Network for Case 2.
Bus IDVoltage Load flow
kV % mag. MW MVAR
20 11.000 99.155 -0.086 -0.095
21 0.415 98.180 -0.085 -0.093
22 0.415 98.296 0.061 -0.036
Table 9: Branch losses for Case 2.
Branch IDLosses
Branch IDLosses
kW kW
Line1 17.7 Line12 0.1
Line2 0.8 Cable1 0.1
Line3 2.1 T1 2.8
Line4 0.2 T2 0.1
Line5 1.4 T3 1.4
Line6 3.1 T4 1.5
Line7 0.3 T5 1.4
Line8 1.6 T6 1.8
Line9 0.9 T7 1.5
Line10 1.0 T8 0.3
Line11 0.4
Total losses (kW) 40.5
Table 10: Branch losses comparison of Case 1 and Case 2.
Branch losses in Case 1, when solar OFF 45.6 kW
Branch losses in Case 2, when solar ON 40.5 kW
Improved branch losses by solar net-metering mechanism 5.1 kW
8 International Journal of Photoenergy
LFA, with bus22 load OFF/solar ON
Gen12 MW
Load22 MVA
Bus50.415 kV
Bus611 kV
156 kW10.8 Kvar
T22 MVA
Bus111 kV
2998 kW425.1 kvar
2997.7 kW425.1 kvar
2998 kW425.1 kvar
Load40.4 MVA
Bus100.415 kV
Bus1111 kV
Bus1211 kV
1831 kW–89.9 kvar
Bus1311 kV
Bus140.415 kV
Bus190.415 kV97.88 %
98.03 %
98.01 %
99.08 %99.23 %
99.12 %
98.04 %
98.9 %
97.79 %
98.87 %Bus1811 kV
CAP10.9 MVAR
0 kW886.3 kvar
961.6 kW340.3 kvar36
7.1
kW12
9.1
kvar
520.
8 kW
262.
1 kv
ar
366.8 kW128.8 kvar
365.3 kW120.1 kvar
132 kV G.S Burewala10 MVAsc
Bus1711 kV
Bus1611 kV
Bus150.415 kV
Load60.55 MVA
T41 MVA
100%
1700 kW600 kvar
1855 kW610 kvar
Bus711 kV
Bus811 kV
Bus90.415 kV
Load30.6 MVA
Load10.55 MVA
Load50.6 MVA
Load70.5 MVA
T52 MVA
T71.3 MVA
T61.26 MVA
517.8 kW250.6 kvar
456.5 kW150 kvar
458 kW160.6 kvar
519.2 kW250.6 kvar
502.5 kW178.2 kvar
501.5 kW177.3 kvar
499.7 kW164.2 kvar
458.3 kW161.2 kvar
Bus40.415 kV
Bus311 kV
Bus211 kV
488.9 kW312.4 kvar
486.1 kW301.3 kvar
T32 MVA
487.5 kW311 kvar
T11 MVA
22.1 kW–57.8 kvar
502 kW180.4 kvar
99.23 %
502.5 kW181.1 kvar
99.39 %156.1 kW10.6 kvar
499.2 kW164.1 kvar
97.74 %97.63 %
98.72 %
99.05 %
98.94 %
98.83 %
NM network
Net metering
647.
2 kW
324.
4 kv
ar
(a)
LFA (N-M network), with bus22 load OFF/solar ONBus2011 kV
Bus210.415 kV
Bus220.415 kV 170.8 kW
0 kvar
170.8 kW0 kvar
4.63
kW
1.52
kva
r
3.64
kW
2.32
kva
r
6.49
kW
2.13
kva
r
13.9
kW
4.57
kva
r
7.05
kW
4.24
kva
r
55.6
kW
18.3
kva
r
4.08
kW
1.34
kva
r
10.4
kW
5.91
kva
r
PVAIPC burewala load120 kVA
Line 12 T80.475 MVA
Load135 kVA
99.23 %
Load85 kVA
Load97 kVA
Load1160 kVA
Load1415.5 kVA
99.1 %
98.76 %
22.1 kW–57.8 kvar
22.2 kW–57.5 kvar
Load154 kVA
Load124.4 kVA
Load1015 kVA
Mtr14 HP
Mtr27 HP
Mtr312 HP
Mtr318 HP
Load164.5 kVA
15.4
kW
8.31
kva
r
Cable 1
4.63 kW1.52 kvar
4.17 kW1.37 kvar
14.4 kW4.72 kvar
3.71 kW1.22 kvar
170.8 kW0 kvar
Open
(b)
Figure 5: (a) Load flow analysis with Bus22 load OFF/solar ON. (b) Load flow analysis (N-M network) with Bus22 load OFF/solar ON.
9International Journal of Photoenergy
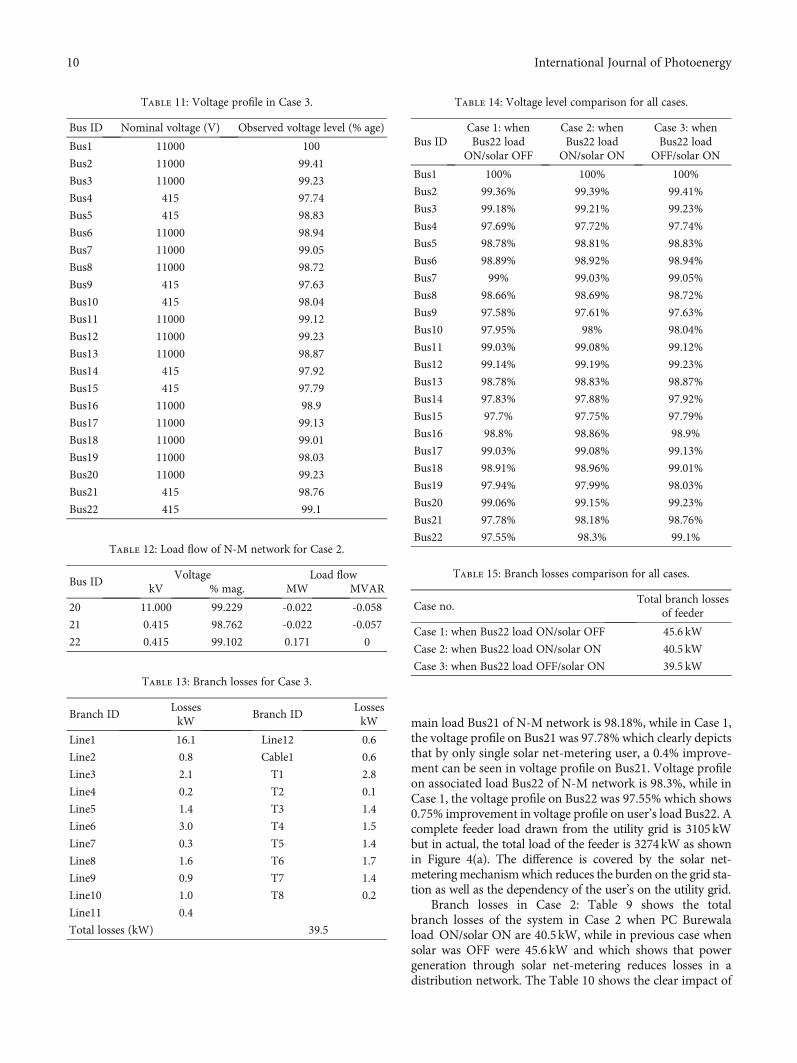
main load Bus21 of N-M network is 98.18%, while in Case 1,the voltage profile on Bus21 was 97.78% which clearly depictsthat by only single solar net-metering user, a 0.4% improve-ment can be seen in voltage profile on Bus21. Voltage profileon associated load Bus22 of N-M network is 98.3%, while inCase 1, the voltage profile on Bus22 was 97.55% which shows0.75% improvement in voltage profile on user’s load Bus22. Acomplete feeder load drawn from the utility grid is 3105kWbut in actual, the total load of the feeder is 3274kW as shownin Figure 4(a). The difference is covered by the solar net-meteringmechanismwhich reduces the burden on the grid sta-tion as well as the dependency of the user’s on the utility grid.
Branch losses in Case 2: Table 9 shows the totalbranch losses of the system in Case 2 when PC Burewalaload ON/solar ON are 40.5kW, while in previous case whensolar was OFF were 45.6kW and which shows that powergeneration through solar net-metering reduces losses in adistribution network. The Table 10 shows the clear impact of
Table 11: Voltage profile in Case 3.
Bus ID Nominal voltage (V) Observed voltage level (% age)
Bus1 11000 100
Bus2 11000 99.41
Bus3 11000 99.23
Bus4 415 97.74
Bus5 415 98.83
Bus6 11000 98.94
Bus7 11000 99.05
Bus8 11000 98.72
Bus9 415 97.63
Bus10 415 98.04
Bus11 11000 99.12
Bus12 11000 99.23
Bus13 11000 98.87
Bus14 415 97.92
Bus15 415 97.79
Bus16 11000 98.9
Bus17 11000 99.13
Bus18 11000 99.01
Bus19 11000 98.03
Bus20 11000 99.23
Bus21 415 98.76
Bus22 415 99.1
Table 12: Load flow of N-M network for Case 2.
Bus IDVoltage Load flow
kV % mag. MW MVAR
20 11.000 99.229 -0.022 -0.058
21 0.415 98.762 -0.022 -0.057
22 0.415 99.102 0.171 0
Table 13: Branch losses for Case 3.
Branch IDLosses
Branch IDLosses
kW kW
Line1 16.1 Line12 0.6
Line2 0.8 Cable1 0.6
Line3 2.1 T1 2.8
Line4 0.2 T2 0.1
Line5 1.4 T3 1.4
Line6 3.0 T4 1.5
Line7 0.3 T5 1.4
Line8 1.6 T6 1.7
Line9 0.9 T7 1.4
Line10 1.0 T8 0.2
Line11 0.4
Total losses (kW) 39.5
Table 14: Voltage level comparison for all cases.
Bus IDCase 1: whenBus22 load
ON/solar OFF
Case 2: whenBus22 load
ON/solar ON
Case 3: whenBus22 load
OFF/solar ON
Bus1 100% 100% 100%
Bus2 99.36% 99.39% 99.41%
Bus3 99.18% 99.21% 99.23%
Bus4 97.69% 97.72% 97.74%
Bus5 98.78% 98.81% 98.83%
Bus6 98.89% 98.92% 98.94%
Bus7 99% 99.03% 99.05%
Bus8 98.66% 98.69% 98.72%
Bus9 97.58% 97.61% 97.63%
Bus10 97.95% 98% 98.04%
Bus11 99.03% 99.08% 99.12%
Bus12 99.14% 99.19% 99.23%
Bus13 98.78% 98.83% 98.87%
Bus14 97.83% 97.88% 97.92%
Bus15 97.7% 97.75% 97.79%
Bus16 98.8% 98.86% 98.9%
Bus17 99.03% 99.08% 99.13%
Bus18 98.91% 98.96% 99.01%
Bus19 97.94% 97.99% 98.03%
Bus20 99.06% 99.15% 99.23%
Bus21 97.78% 98.18% 98.76%
Bus22 97.55% 98.3% 99.1%
Table 15: Branch losses comparison for all cases.
Case no.Total branch losses
of feeder
Case 1: when Bus22 load ON/solar OFF 45.6 kW
Case 2: when Bus22 load ON/solar ON 40.5 kW
Case 3: when Bus22 load OFF/solar ON 39.5 kW
10 International Journal of Photoenergy

the solar net-metering mechanism on the reduction of lossesin a distribution network by the comparison of Case 1 andCase 2.
4.3. Case 3: Load Flow Analysis with Bus22 Load OFF/ Power.In Case 3, a consumer is not using any power, i.e., not athome. So, there will be no power consumption at consumerpremises, but solar is generating power, i.e., solar ON, whenall generated power by solar energy will be exported to thegrid as shown in Figures 5(a) and 5(b). This case is performedto check how the system will behave when all the generatedenergy from the solar system is fed to the utility grid.
From Figure 5(b), it can be seen that solar system isgenerating 170.8 kW and there is no any consumption ofpower at consumer premises because the PC Burewala loadon Bus22 is OFF, i.e., weekend or holidays. In this case, thecomplete generated power from the solar system is fed tothe distribution grid. The multi-meter on consumer side withinstalled solar net-metering mechanism shows a positiveactive power of 170.8 kW which means that the consumeris exporting all the generated power to the utility grid.
The voltage profile on Bus21 is 98.76%, while in Case 2, itwas 98.18% that means there is a further 0.58% improvementin voltage profile on Bus21 of the utility grid. By comparingthe Case 3 with the Case 1 when the voltage profile was97.78% on Bus21, a difference of 0.98% is observed which isimproved by an only single solar net-metering user.Table 11 shows the comparison of nominal voltages andthe observed voltage profile at different busses in Case 3.
The load flow report in Table 12 shows the load flow andvoltage profile on relevant buses of the net-metering networkfor Case 3.
The above Table 12 shows the load on Bus22 is OFF, andthe solar is generating power of 170.8 kW on Bus22 and isbeing exported to the utility grid. The voltage profile on loadBus21 of the N-M network is 98.76%, while in the previouscase, the voltage profile on Bus21 was 98.18%. So, in this case,there is 0.58% improvement in voltage profile. A completeload drawn from the utility grid in this case is 2998 kW, whilein Case 2, it was 3105 kW and, in Case 1, it was 3274 kW.
The total branch losses of the system in Case 3 shown inTable 13, when Bus22 load OFF/solar ON are muchimproved form previous case that 39.5 kW, while in Case 2,the losses were 40.5 kW, and in Case 1, the losses were45.6 kW. This clearly depicts that mechanism of a net-metering scheme for feeding extra power/complete powerto the utility shows that the bidirectional flow of power (fromthe utility grid side to consumer side and vice versa) is bene-ficial for both a consumer and for a power system from thelosses point of view.
5. Overall Voltage Profile and Branch LossesComparison for all Cases
5.1. Overall Voltage Profile Comparison at Buses for all Cases.The voltage profile comparison for all three cases is shown inTable 14. It can be seen that there is a notable improvementin voltage profile in Case 2 by Case 1 and more improvementin Case 3 by Case 2, which means as more as the solar is feed-ing to the utility grid by a solar net-metering mechanism, themore will be the improvement in voltage profile.
5.2. Overall Branch Losses Comparison for all Cases. Theoverall branch losses comparison for all Cases shows inTable 15 depicts that the more the solar power is feeding tothe utility grid by a solar net-metering mechanism, the morereduction in branch losses in a distribution network isobserved.
6. Harmonic Analysis
Whenever power is exported to the grid through a solar net-metering scheme, there is always a probability of harmonicsgeneration in a power system that causes some harmfuleffects on a power system. The power produced by solarenergy is DC in nature which is converted into AC with thehelp of invertor. An inverter is a nonlinear device with thehallmarks of harmonics generation. The harmonics genera-tion within any system can cause some serious problems,i.e., overheating of transmission lines and increased magnetic
–100
–50
00.1 0.2 0.3 0.4 0.5 0.6 0.7 0.8 0.9 1.0 1.1
50
100
Bus22 (0.41 kV)
Time (cycle)
Figure 6: Output wave representation at PV Bus22.
11International Journal of Photoenergy
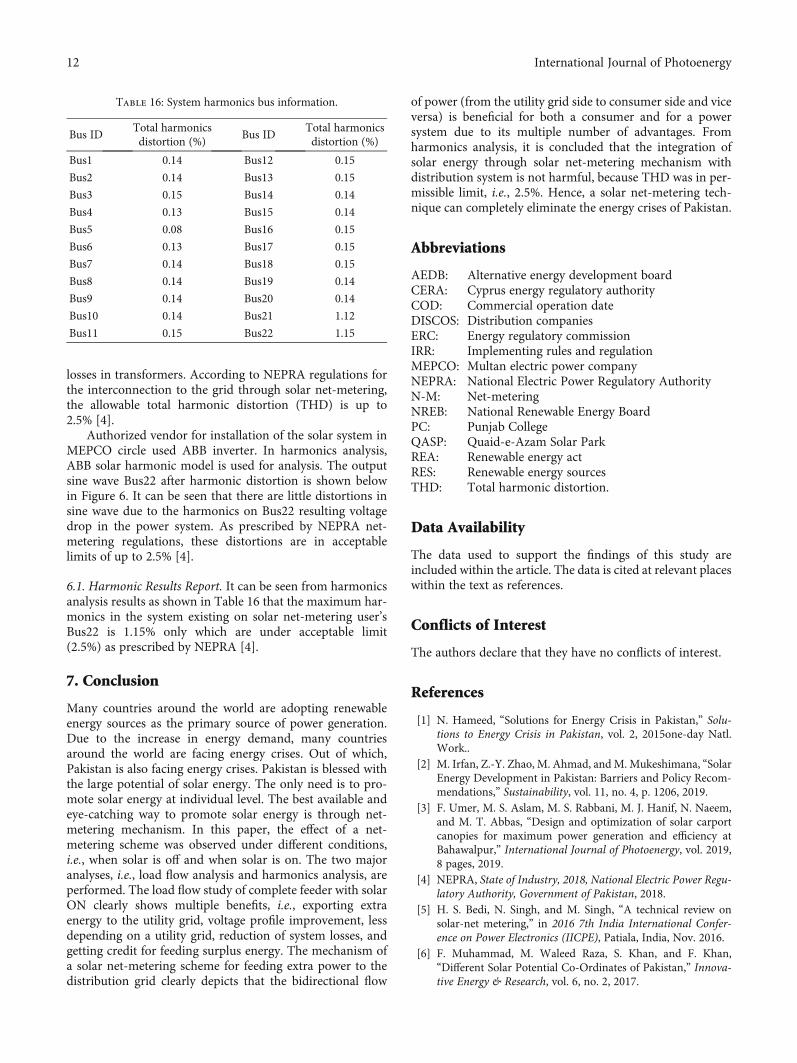
losses in transformers. According to NEPRA regulations forthe interconnection to the grid through solar net-metering,the allowable total harmonic distortion (THD) is up to2.5% [4].
Authorized vendor for installation of the solar system inMEPCO circle used ABB inverter. In harmonics analysis,ABB solar harmonic model is used for analysis. The outputsine wave Bus22 after harmonic distortion is shown belowin Figure 6. It can be seen that there are little distortions insine wave due to the harmonics on Bus22 resulting voltagedrop in the power system. As prescribed by NEPRA net-metering regulations, these distortions are in acceptablelimits of up to 2.5% [4].
6.1. Harmonic Results Report. It can be seen from harmonicsanalysis results as shown in Table 16 that the maximum har-monics in the system existing on solar net-metering user’sBus22 is 1.15% only which are under acceptable limit(2.5%) as prescribed by NEPRA [4].
7. Conclusion
Many countries around the world are adopting renewableenergy sources as the primary source of power generation.Due to the increase in energy demand, many countriesaround the world are facing energy crises. Out of which,Pakistan is also facing energy crises. Pakistan is blessed withthe large potential of solar energy. The only need is to pro-mote solar energy at individual level. The best available andeye-catching way to promote solar energy is through net-metering mechanism. In this paper, the effect of a net-metering scheme was observed under different conditions,i.e., when solar is off and when solar is on. The two majoranalyses, i.e., load flow analysis and harmonics analysis, areperformed. The load flow study of complete feeder with solarON clearly shows multiple benefits, i.e., exporting extraenergy to the utility grid, voltage profile improvement, lessdepending on a utility grid, reduction of system losses, andgetting credit for feeding surplus energy. The mechanism ofa solar net-metering scheme for feeding extra power to thedistribution grid clearly depicts that the bidirectional flow
of power (from the utility grid side to consumer side and viceversa) is beneficial for both a consumer and for a powersystem due to its multiple number of advantages. Fromharmonics analysis, it is concluded that the integration ofsolar energy through solar net-metering mechanism withdistribution system is not harmful, because THD was in per-missible limit, i.e., 2.5%. Hence, a solar net-metering tech-nique can completely eliminate the energy crises of Pakistan.
Abbreviations
AEDB: Alternative energy development boardCERA: Cyprus energy regulatory authorityCOD: Commercial operation dateDISCOS: Distribution companiesERC: Energy regulatory commissionIRR: Implementing rules and regulationMEPCO: Multan electric power companyNEPRA: National Electric Power Regulatory AuthorityN-M: Net-meteringNREB: National Renewable Energy BoardPC: Punjab CollegeQASP: Quaid-e-Azam Solar ParkREA: Renewable energy actRES: Renewable energy sourcesTHD: Total harmonic distortion.
Data Availability
The data used to support the findings of this study areincluded within the article. The data is cited at relevant placeswithin the text as references.
Conflicts of Interest
The authors declare that they have no conflicts of interest.
References
[1] N. Hameed, “Solutions for Energy Crisis in Pakistan,” Solu-tions to Energy Crisis in Pakistan, vol. 2, 2015one-day Natl.Work..
[2] M. Irfan, Z.-Y. Zhao, M. Ahmad, andM. Mukeshimana, “SolarEnergy Development in Pakistan: Barriers and Policy Recom-mendations,” Sustainability, vol. 11, no. 4, p. 1206, 2019.
[3] F. Umer, M. S. Aslam, M. S. Rabbani, M. J. Hanif, N. Naeem,and M. T. Abbas, “Design and optimization of solar carportcanopies for maximum power generation and efficiency atBahawalpur,” International Journal of Photoenergy, vol. 2019,8 pages, 2019.
[4] NEPRA, State of Industry, 2018, National Electric Power Regu-latory Authority, Government of Pakistan, 2018.
[5] H. S. Bedi, N. Singh, and M. Singh, “A technical review onsolar-net metering,” in 2016 7th India International Confer-ence on Power Electronics (IICPE), Patiala, India, Nov. 2016.
[6] F. Muhammad, M. Waleed Raza, S. Khan, and F. Khan,“Different Solar Potential Co-Ordinates of Pakistan,” Innova-tive Energy & Research, vol. 6, no. 2, 2017.
Table 16: System harmonics bus information.
Bus IDTotal harmonicsdistortion (%)
Bus IDTotal harmonicsdistortion (%)
Bus1 0.14 Bus12 0.15
Bus2 0.14 Bus13 0.15
Bus3 0.15 Bus14 0.14
Bus4 0.13 Bus15 0.14
Bus5 0.08 Bus16 0.15
Bus6 0.13 Bus17 0.15
Bus7 0.14 Bus18 0.15
Bus8 0.14 Bus19 0.14
Bus9 0.14 Bus20 0.14
Bus10 0.14 Bus21 1.12
Bus11 0.15 Bus22 1.15
12 International Journal of Photoenergy

[7] K. A. Alboaouh and S. Mohagheghi, “Impact of rooftop photo-voltaics on the distribution system,” Journal of RenewableEnergy, vol. 2020, 23 pages, 2020.
[8] AEDB, Alternative Energy Development Board , Ministry ofWater and Power, Government of Pakistan, 2018, http://www.aedb.org/index.php/ju-elibrary/distributed-generation/net-metering-reference-guide-for-the-discos.
[9] A. Khaliq, A. Ikram, and M. Salman, “Quaid-e-Azam SolarPower park: Prospects and challenges,” in 2015 Power Genera-tion System and Renewable Energy Technologies (PGSRET),Islamabad, Pakistan, June 2015.
[10] E. Doris, S. Busche, and S. Hockett, “Net Metering PolicyDevelopment and Distributed Solar Generation in Minnesota:Overview of Trends in Nationwide Policy Development andImplications of Increasing the Eligible System Size Cap,”National Renewable Energy Lab. (NREL) Tech. Reports,Golden, CO (United States), 2009.
[11] R. Pacudan, “The economics of net metering policy in the Phil-ippines,” International Energy Journal, vol. 18, no. 3, pp. 283–296, 2018.
[12] A. I. Nikolaidis and C. A. Charalambous, “A critical analysis ofthe net metering practice in cyprus,” in 2016 IEEE Interna-tional Energy Conference (ENERGYCON), Leuven, Belgium,Apr 2016.
[13] B. Yosiana, The Rise of the Energy Prosumers in the ASEAN,2018.
[14] N. Redfield and J. Redfield, “The garage of the future: maxi-mizing the economic value of solar panels,” in 2010 IEEEGreen Technologies Conference, Grapevine, TX, USA, April2010.
[15] B. Vikas, “Net metering for rooftop solar system: a review,”International Journal for Research in Applied Science andEngineering Technology, vol. 6, no. 3, pp. 524–528, 2018.
[16] A. Sharma, K. Srivastava, and S. K. Kar, “Jawaharlal Nehrunational solar mission in India,” Green Energy Technology,vol. 201, pp. 47–67, 2015.
[17] MEPCO, Multan Electric Power Company, Feeder Wise,http://www.mepco.com.pk/net-metering-feeder-wise.
13International Journal of Photoenergy