Crime situation in South Africa - South African Police Service · PDF fileThe source document...
119
Crime situation in South Africa 1 April 2016 - 31 March 2017
Transcript of Crime situation in South Africa - South African Police Service · PDF fileThe source document...

Crime situation in South Africa
1 April 2016 - 31 March 2017

TABLE OF CONTENTS
Introduction
Broad categories of crime
Methodology
Quality Improvement Initiatives
Crime Statistics Analysis
Serious Crime Classification
17 Community-Reported Serious Crimes
4 Crime Dependent on Police Action
Core Business Diversion
Strategic Approach
2

Introduction3

Police recorded crime statistics are derived from an administrative data
collection process.
All crimes are recorded as and when they are brought to the attention, or
detected by police, irrespective of when the crimes were committed.
A docket is opened for every crime brought to the attention of the police and
subsequently electronically transcribed on the Case Administrative System-CAS.
CAS numbers are allocated chronologically according to the month-year on
which the crime was reported.
Each reported crime incident is allocated a crime code, which are then
aggregated into Daily Summary of Serious Crime (DSSC) Code.
DSSC codes are used for classification and statistical reporting purposes.
Data Collection
INTRODUCTIONMethodology
4

The focus of this report is the raw number of counts per serious crime category,
they include 17 Community reported crimes and 4 Crimes dependent on police
action for detection .
All attempted crimes are included in the relevant categories.
Cases closed off as “Unfounded” in accordance with the Standing Order (G) 325
- closing of dockets, are excluded for crime statistics reporting purposes.
The annual report also provides percentage changes for each crime category.
Raw Figures
INTRODUCTIONMethodology
5

To enhance equitable comparisons of reported crimes across provinces the this
financial year Annual Crime report (2016/2017) will include population ratios per
hundred thousand.
The computation of ratios will cover only contact crimes, where the target is a
person i.e. Murder, Attempted Murder, Sexual Offences, Assault GBH, Common
Assault and Common Robbery.
Ratios
INTRODUCTIONMethodology
6

The source document for recording crime is a docket, and the counting unit is a
charge.
One docket may contain one or multiple charges i.e. there can be more than one
charge in one docket.
In case where multiple offences are committed within the same scenario, each
offence will be recorded in addition to the primary offence. These additional counts
also form part of the crime statistics (e.g. gang rape and common robbery).
Regardless of the manner in which the cases are closed (withdrawn by the
complainant or court and undetected), the recorded crime will still form part of the
crime statistics.
In this crime report the statistics represent the number of crime charges or counts
and not the number of registered case docket.
Crime Counting Rules
INTRODUCTIONMethodology
7

INTRODUCTIONCrime Data Quality Management
The quality assurance process is enhanced through SASQAF’s South African
National Statistics System (SANSS) framework of engagement. The latter has six
components namely Problem Identification, Diagnostic Assessment, Development
of Problem Solutions, Implementation of Solutions, SASQAF Self-Assessment and
SASQAF Independent Assessment.
Current crime statistics have complied fully with the first four components of the
framework and have currently reached the self-assessment stage.
Crime Statistics Management
8

INTRODUCTIONCrime Data Quality Management
The Clearance Committee assessed the previous two crime statistics publications
for quality. The findings of these assessments were presented to the Crime
Registrar for correction and implementation in the value chain of production.
The Crime Registrar has incorporated changes in line with the Clearance
Committee recommendations.
The SASQAF self–assessment process was undertaken during the current financial
year. The self–assessment is currently being discussed by the members of the
SANSS and feedback will be provided in due course.
Crime Statistics Management
9

• To ensure accurate reporting the reports will be revised to take into consideration
the changing of crime status during the course of the year.
• A draft crime statistics data dissemination policy has been developed to inform
the stakeholders about the advance release calendar and also clarify the terms
and conditions applicable to pre-release access. The draft document is still going
through a consultative process.
INTRODUCTIONCrime Statistics Dissemination
10
Dissemination policy
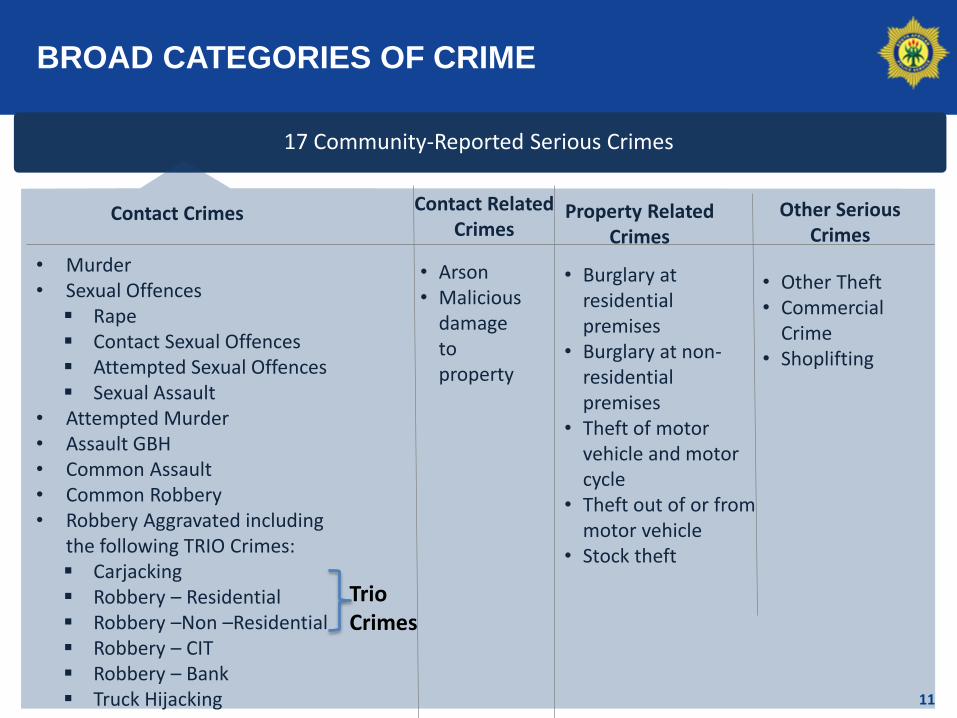
BROAD CATEGORIES OF CRIME
17 Community-Reported Serious Crimes
Contact Crimes
• Murder• Sexual Offences
Rape Contact Sexual Offences Attempted Sexual Offences Sexual Assault
• Attempted Murder• Assault GBH• Common Assault• Common Robbery• Robbery Aggravated including
the following TRIO Crimes: Carjacking Robbery – Residential Robbery –Non –Residential Robbery – CIT Robbery – Bank Truck Hijacking
Contact Related Crimes
• Arson• Malicious
damage to property
Property Related Crimes
• Burglary at residential premises
• Burglary at non-residential premises
• Theft of motor vehicle and motor cycle
• Theft out of or from motor vehicle
• Stock theft
Other Serious Crimes
• Other Theft• Commercial
Crime• Shoplifting
Trio Crimes
11

BROAD CATEGORIES OF CRIME
12
4 Crimes detected as result of Police action
• Illegal Possession of firearm and ammunition
• Drug Related Crimes
• Driving under the influence of alcohol and drugs
• Sexual offences detected as a result of police action

Crime Statistics Analysis

SERIOUS CRIME CLASSIFICATIONPercentage Contribution
17 Reported
Serious Crimes
83%
1 770 626
14

HIGHLIGHTS ON THE 4 CATEGORIES MAKING UP THE 17
COMMUNITY-REPORTED SERIOUS CRIMESOverview of Categories – Financial Year Comparison
15

HIGHLIGHTS ON THE 17 COMMUNITY-REPORTED
SERIOUS CRIMESTrend over ten year period
16
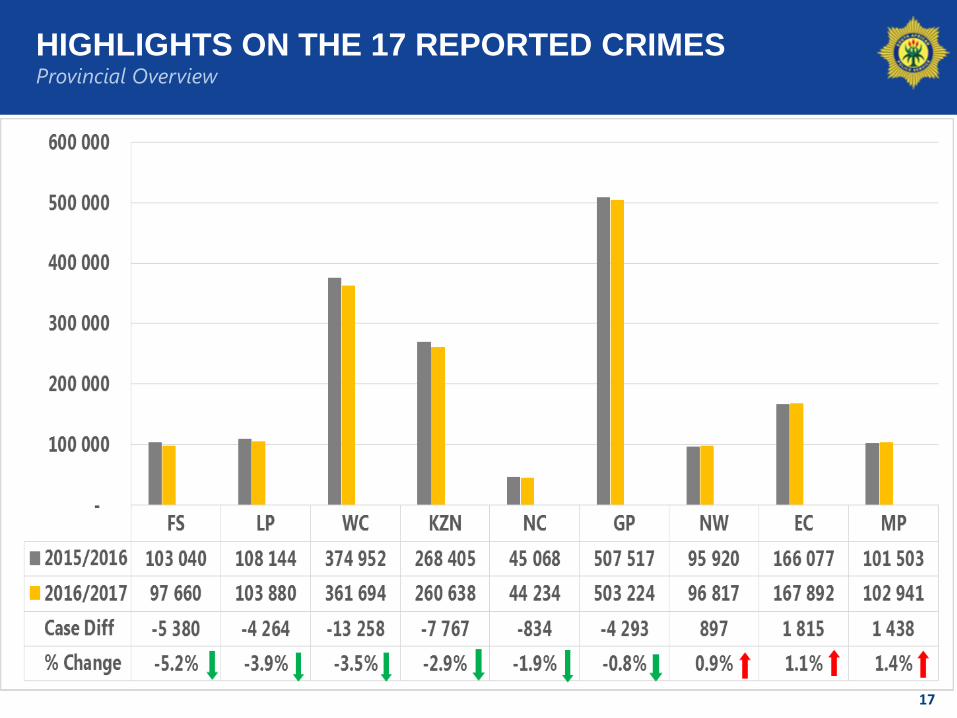
HIGHLIGHTS ON THE 17 REPORTED CRIMESProvincial Overview
17

18
HIGHLIGHTS ON THE 4 CATEGORIES MAKING UP THE 17 COMMUNITY-
REPORTED SERIOUS CRIMES
Provincial breakdown (total & percentage change)
Province Contact crimes
Contact-related crimes
Property-related crimes
Other Serious Crimes
17 Commreportedcrimes
Total Reds
Eastern Cape65 524- 2.6%
12 8102.5%
53 0973.9%
36 4613.5%
167 8921.1% 3
Free State37 741-8.2%
6 838-12.5%
29 733-2.9%
23 348-0.7%
97 660-5.2 %
0
Gauteng 171 466-0.8 %
34 023-3.7%
154 7612.5%
142 974-3.7%
503 224-0.8%
1
KwaZulu-Natal 95 153-2.8%
14 709-5.3%
83 492-3.3%
67 284-1.9%
260 638-2.9%
0
Limpopo 36 764-9.0%
7 352-10.6%
31 240-2.6%
28 5243.9%
103 880-3.9%
1
Mpumalanga 33 3812.0%
5 834-4.6%
36 6661.5%
27 0601.9%
102 9411.4%
3
Northern Cape 18 105-4.6%
3 103-4.7%
13 4071.5%
9 619-0.1%
44 234-1.9%
1
North West 35 4830.7%
6 064-0.2%
33 5036.5%
21 767-6.0%
96 8170.9%
2
Western Cape 114 704-1.8%
29 9970.1%
104 754-6.1%
112 239-3.7%
361 694-3.5%
1
Total RSA 608 321-2.4%
120 730-3.3%
540 653-0.5%
469 2762.0%
1 738 9801.8%
0

19
Contact crimesContact crime refers to those crimes in which the victims themselves are the targets
of violence or property is targeted and the victims in the vicinity during the
commission of the crime are subjected to threats of violence or the use of such
violence.
• Murder
• Sexual Offences
• Attempted Murder
• Assault GBH
• Common Assault
• Common Robbery

CONTACT CRIMESPercentage Change
20
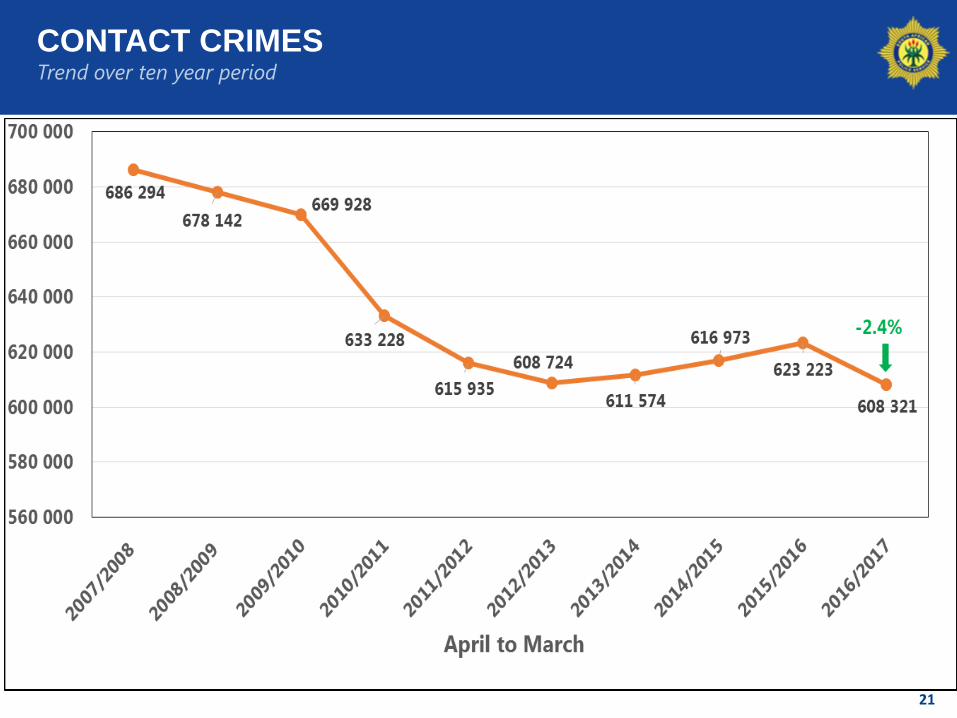
CONTACT CRIMESTrend over ten year period
21

HIGHLIGHTS ON THE CONTACT CRIMESProvincial Overview
22
23
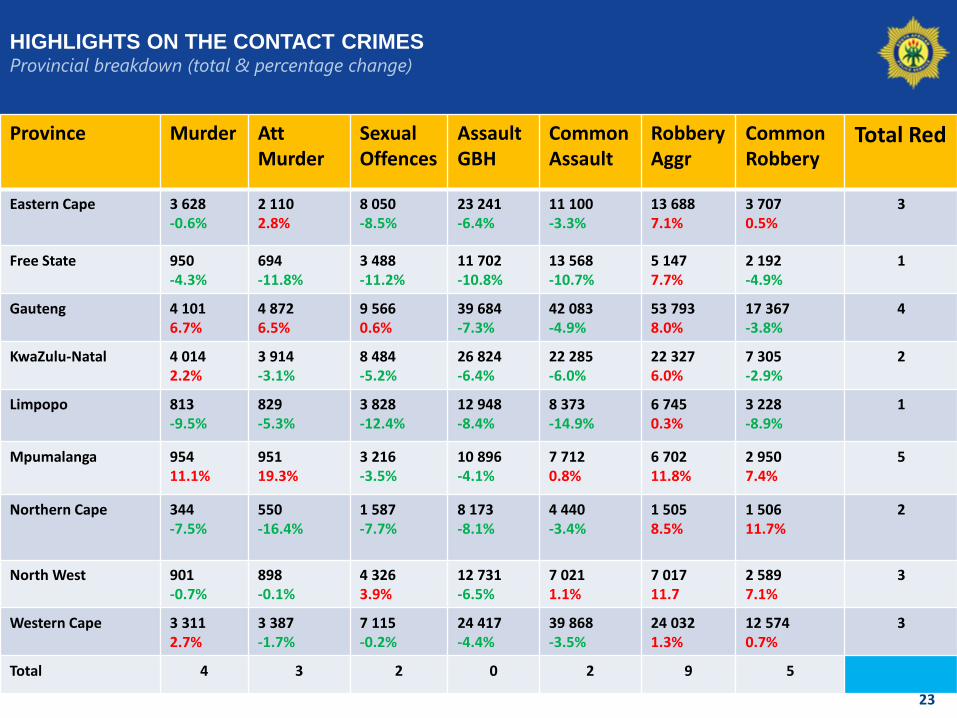
HIGHLIGHTS ON THE CONTACT CRIMES Provincial breakdown (total & percentage change)
Province Murder AttMurder
SexualOffences
AssaultGBH
Common Assault
Robbery Aggr
Common Robbery
Total Red
Eastern Cape 3 628-0.6%
2 1102.8%
8 050-8.5%
23 241-6.4%
11 100-3.3%
13 6887.1%
3 7070.5%
3
Free State 950-4.3%
694-11.8%
3 488-11.2%
11 702-10.8%
13 568-10.7%
5 1477.7%
2 192-4.9%
1
Gauteng 4 1016.7%
4 8726.5%
9 5660.6%
39 684-7.3%
42 083-4.9%
53 7938.0%
17 367-3.8%
4
KwaZulu-Natal 4 0142.2%
3 914-3.1%
8 484-5.2%
26 824-6.4%
22 285-6.0%
22 3276.0%
7 305-2.9%
2
Limpopo 813-9.5%
829-5.3%
3 828-12.4%
12 948-8.4%
8 373-14.9%
6 7450.3%
3 228-8.9%
1
Mpumalanga 95411.1%
95119.3%
3 216-3.5%
10 896-4.1%
7 7120.8%
6 70211.8%
2 9507.4%
5
Northern Cape 344-7.5%
550-16.4%
1 587-7.7%
8 173-8.1%
4 440-3.4%
1 5058.5%
1 50611.7%
2
North West 901-0.7%
898-0.1%
4 3263.9%
12 731-6.5%
7 0211.1%
7 01711.7
2 5897.1%
3
Western Cape 3 3112.7%
3 387-1.7%
7 115-0.2%
24 417-4.4%
39 868-3.5%
24 0321.3%
12 5740.7%
3
Total 4 3 2 0 2 9 5

24
Types of Contact crimes

MURDERTrend over ten year period
25

MURDERProvincial Overview-Actual
26
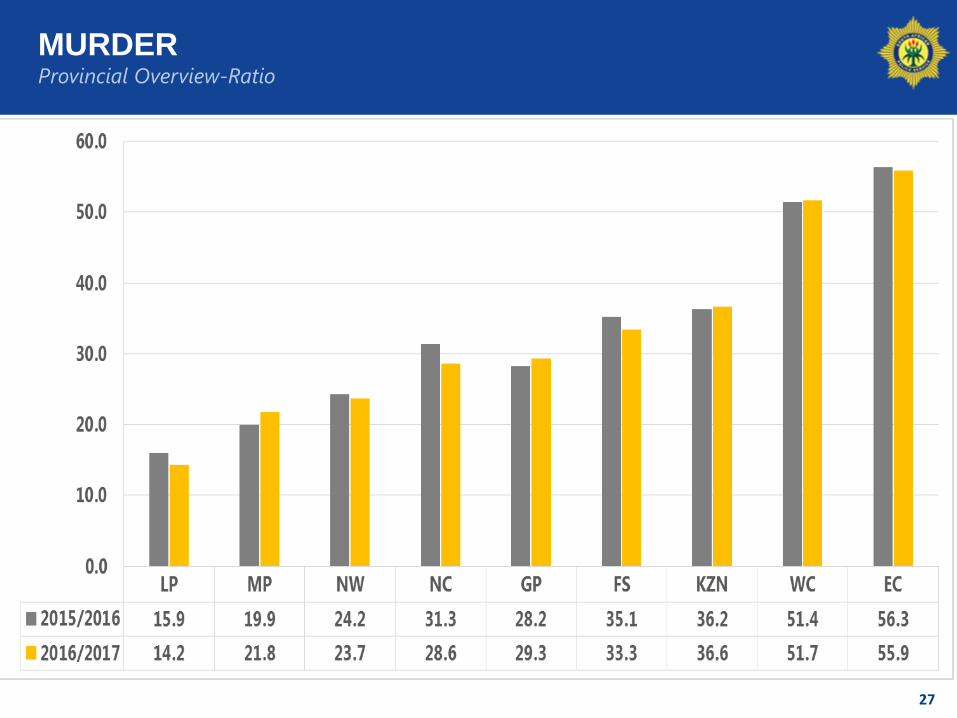
MURDERProvincial Overview-Ratio
27

SEXUAL OFFENCESTrend over ten year period
28

SEXUAL OFFENCESProvincial Overview
29

30
Sub-Categories of Sexual Offence
Consist of the following crime types:
Rape
Sexual Assault
Contact Sexual Assault
Attempted Sexual Offences

RAPETrend over nine year period
31

RAPEProvincial Overview-Actual
32

RAPEProvincial Overview-Ratio
33

SEXUAL ASSAULTTrend over nine year period
34

SEXUAL ASSAULTProvincial Overview-Actual
35

ATTEMPTED MURDERTrend over ten year period
36

ATTEMPTED MURDERProvincial Overview
37

ASSAULT WITH THE INTENT TO CAUSE GRIEVIOUS
BODILY HARMTrend over ten year period
38

ASSAULT WITH THE INTENT TO CAUSE GRIEVOUS
BODILY HARM Provincial Overview
39
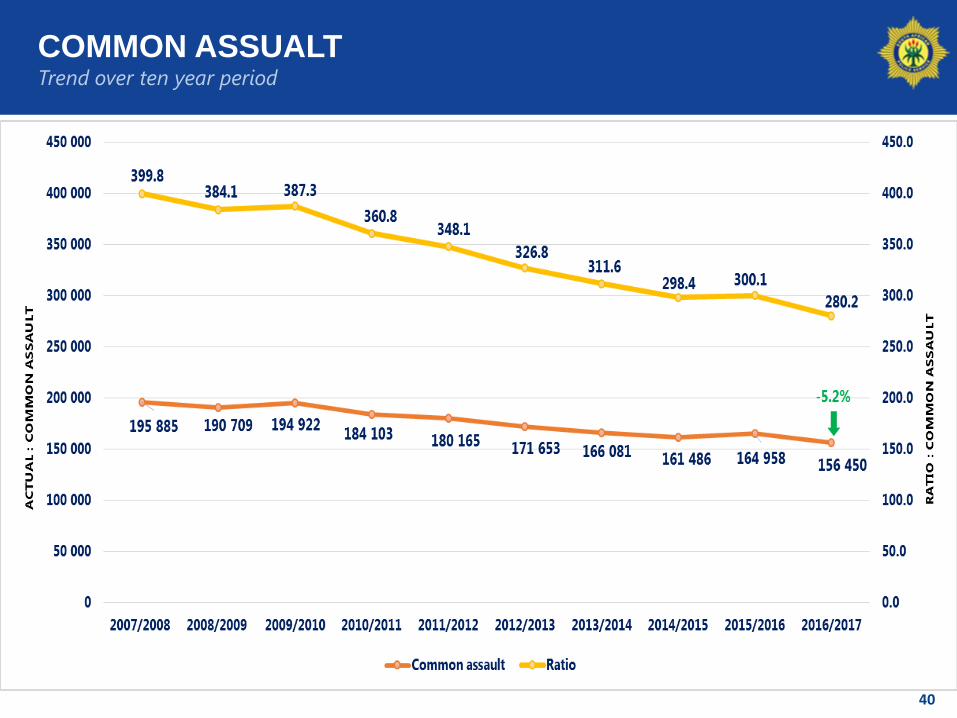
COMMON ASSUALTTrend over ten year period
40
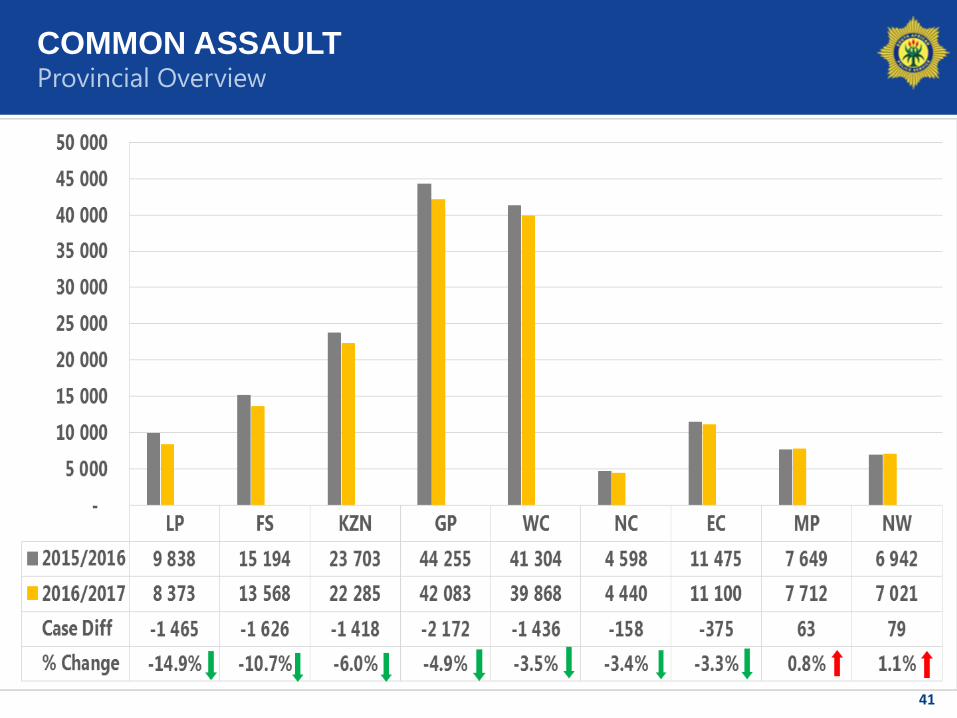
COMMON ASSAULTProvincial Overview
41
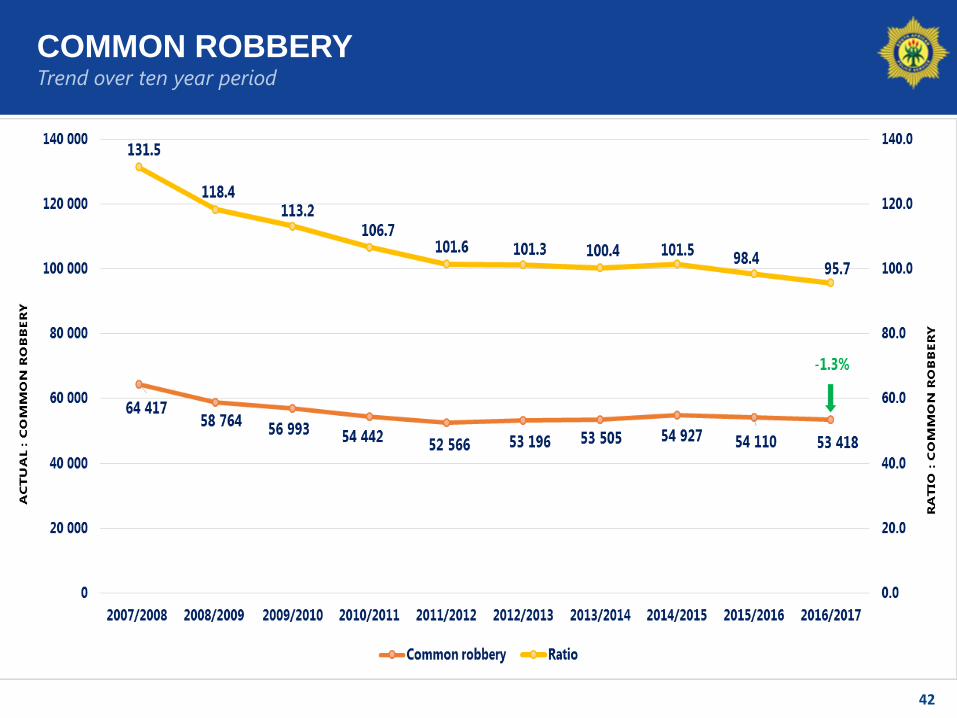
COMMON ROBBERYTrend over ten year period
42

COMMON ROBBERYProvincial Overview
43

ROBBERY WITH AGGRAVATING CIRCUMSTANCES Trend over ten year period
44

ROBBERY WITH AGGRAVATING CIRCUMSTANCESOverview of Provinces
45

46
Sub-Categories of Robbery
Aggravating
Consist of the following crime types:
Carjacking
Robbery – Residential
Robbery – Non –Residential
Truck Hijacking
Robbery of Cash-in-Transit (CIT)
Bank Robbery

TRIO CRIMESPercentage Change
47

CARJACKINGTrend over ten year period
48

CARJACKINGProvincial Overview
49

ROBBERY AT RESIDENTIAL PREMISESTrend over ten year period
50
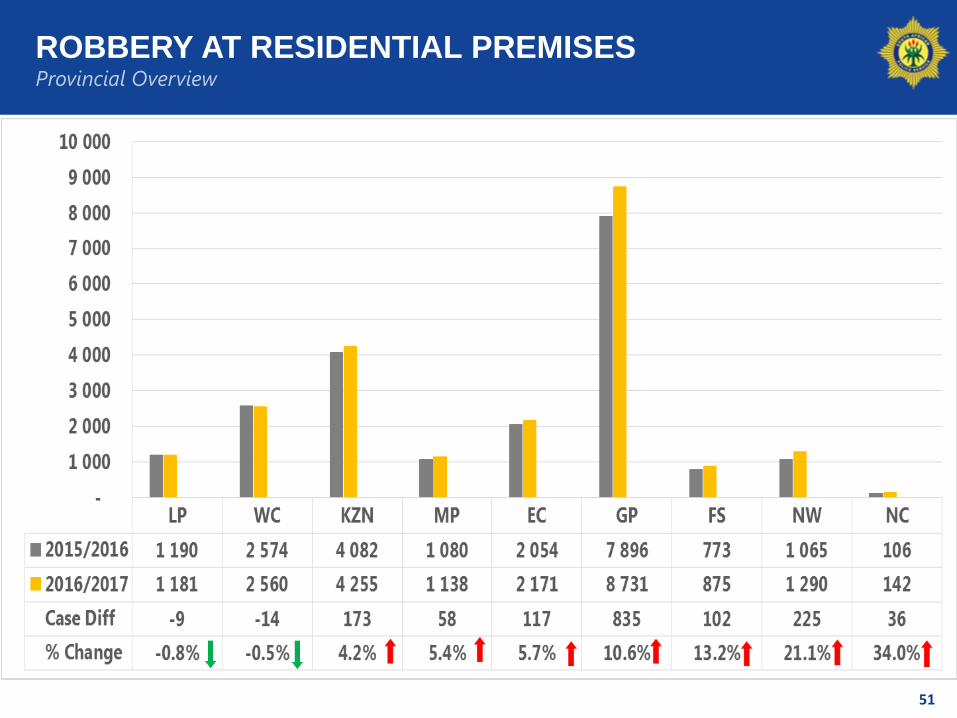
ROBBERY AT RESIDENTIAL PREMISESProvincial Overview
51

ROBBERY AT NON-RESIDENTIAL PREMISESTrend over ten year period
52

ROBBERY AT NON-RESIDENTIAL PREMISESProvincial Overview
53

54
HIGHLIGHTS ON THE TRIO CRIMES Provincial breakdown (total & percentage change)
Province Carjacking Robbery residential
Robbery non-residential
TRIO Crimes Total Red
EC 955-0.1%
2 1715.7%
2 3696.8%
5 4955.1%
3
FS 234-9.3
87513.2%
97328.7%
2 08216.5%
2
GP 8 61016.9%
8 73110.6%
7 1874.0%
24 52810.6%
3
KZN 3 02921.5%
4 2554.2%
2 9514.5%
10 2358.9%
3
LP 4592.0%
1 181-0.8%
1 750-2.9%
3 390-1.5%
1
MP 81028.8%
1 1385.4%
1 76412.9%
3 71213.5%
3
NC 29-38.8.4%
14234.0%
30417.8%
47515.6%
2
NW 3905.4%
1 29021.1%
1 4937.1%
3 17312.2%
3
WC 2 2018.3%
2 560-0.5%
1 889-4.3%
6 6501.1%
1
Total 7 7 7 2

TRUCK HIJACKINGTrend over ten year period
55
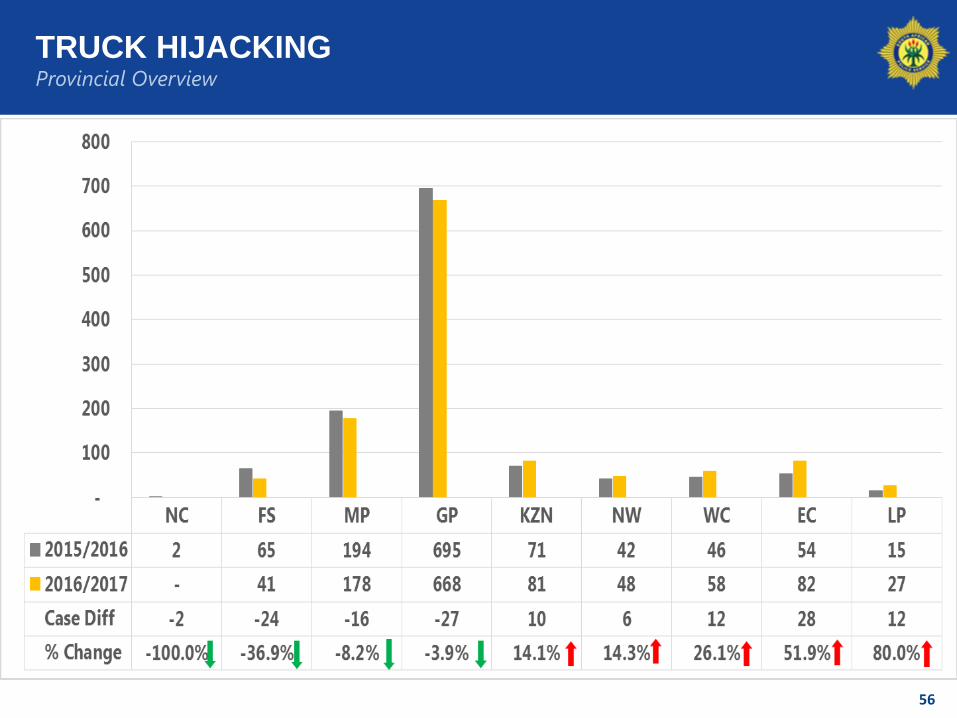
TRUCK HIJACKINGProvincial Overview
56

ROBBERY OF CASH IN TRANSITTrend over ten year period
57
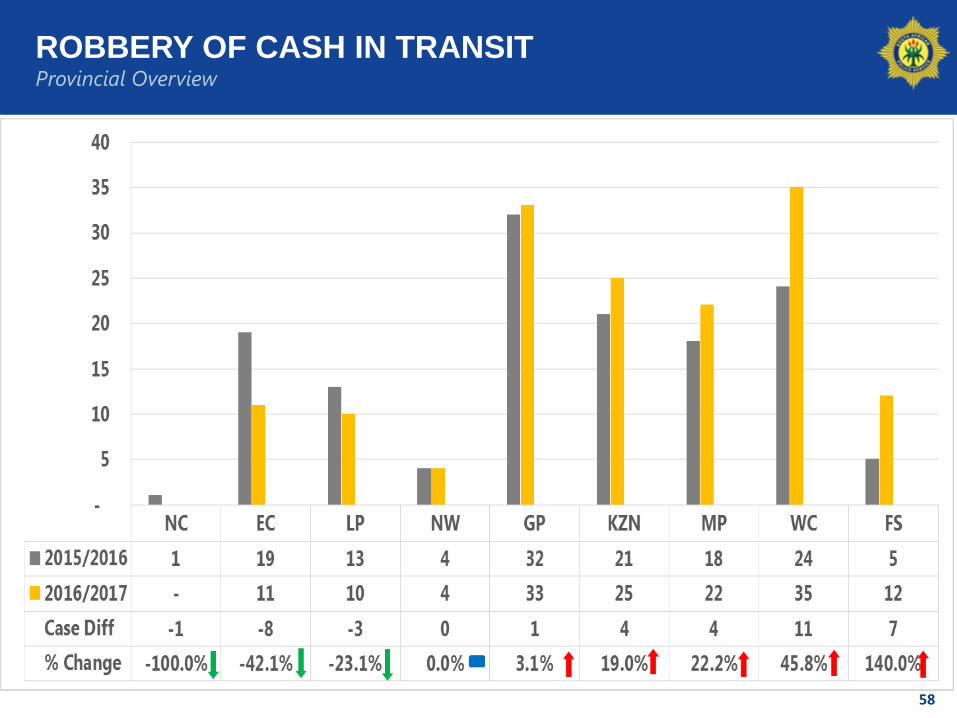
ROBBERY OF CASH IN TRANSITProvincial Overview
58
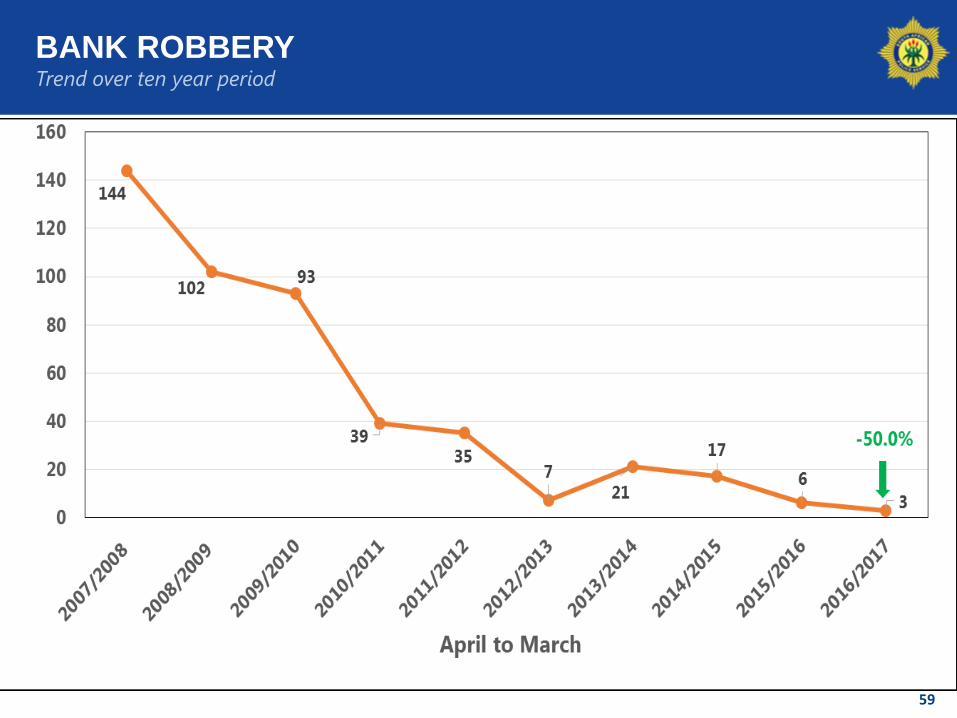
BANK ROBBERYTrend over ten year period
59
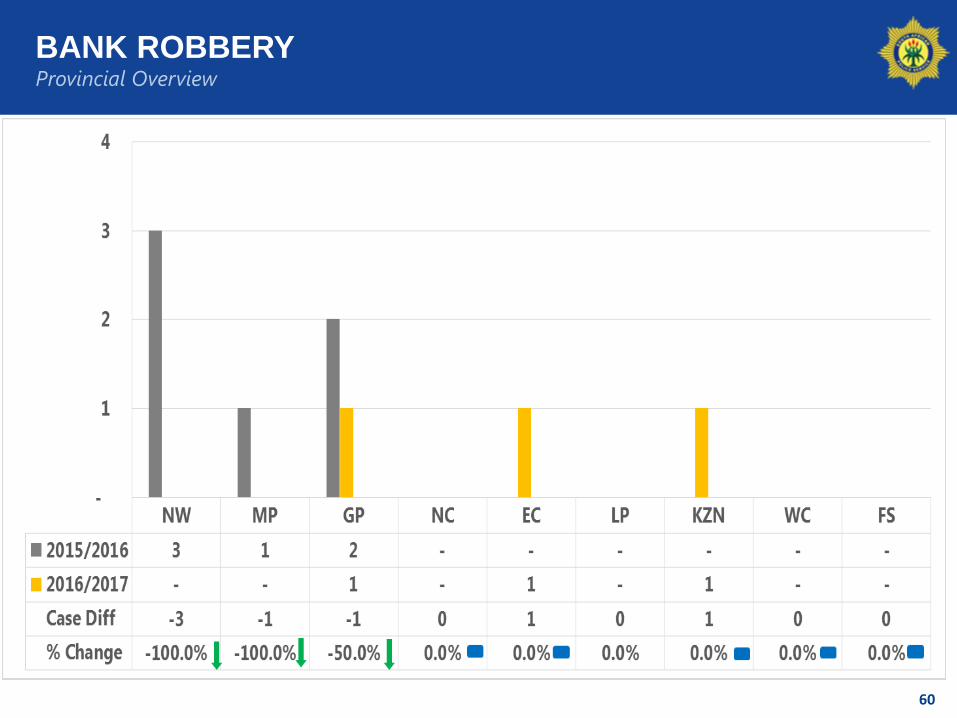
BANK ROBBERYProvincial Overview
60

61
Contact-related crimesContact-related crime includes arson and malicious damage to property. These two
crimes are closely related and involve damage to or the destruction of the property of
another (often in order to punish such a person or entity) - or to damage one’s own
property for the purpose of insurance claims.
• Arson
• Malicious damage to property

CONTACT RELATED CRIMESTrend over ten year period
62

CONTACT RELATED CRIMESPercentage Change
63

64
HIGHLIGHTS ON THE CONTACT RELATED CRIMESProvincial Overview
64

65
HIGHLIGHTS ON THE CONTACT-RELATED CRIMES Provincial breakdown (total & percentage change)
Province Arson Malicious damage to Property
Total Contract-Related Crimes
Total Red
EC 74810.2%
12 0622.1%
12 8102.5%
2
FS 186-29.8
6 652-11.9%
6 838-12.5%
0
GP 724-27.0%
33 299-3.0%
34 023-3.7%
0
KZN 699-15.3%
14 010-4.8%
14 709-5.3%
0
LP 484-21.0%
6 868-9.8%
7 352-10.6%
0
MP 260-9.1%
5 574-4.3%
5 834-4.6%
0
NC 149-13.4%
2 954-4.2%
3 103-4.7%
0
NW 290-7.6%
5 7740.2%
6 064-0.2%
1
WC 7813.2%
29 2160.0%
29 9970.1%
1
Total 2 2 2
66
Types of Contact-related
crimes
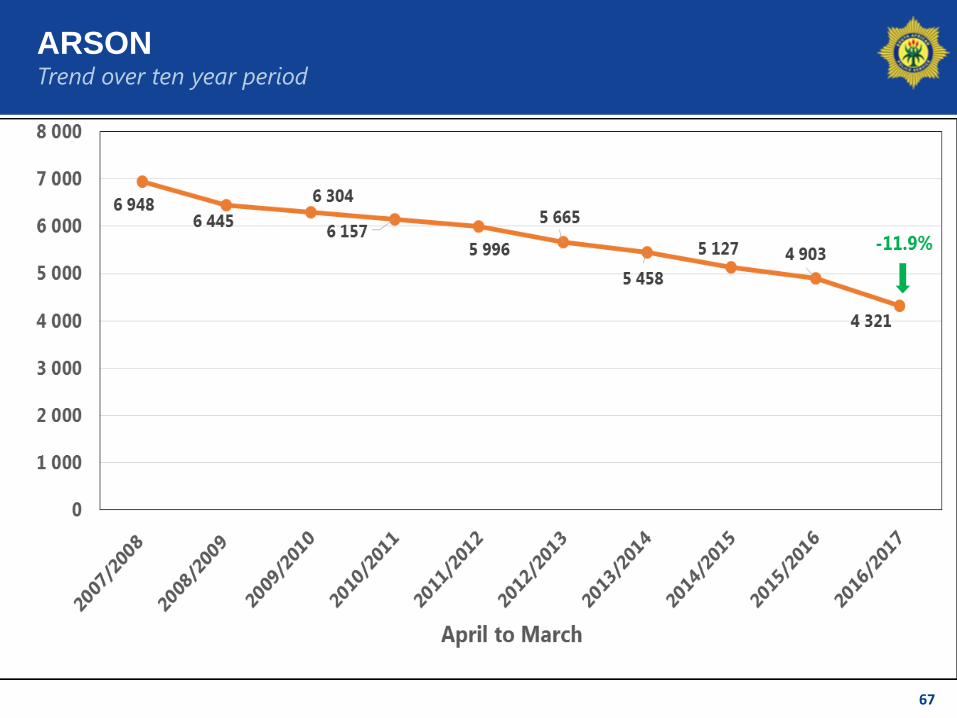
ARSONTrend over ten year period
67

ARSONProvincial Overview
68

MALICIOUS DAMAGE TO PROPERTYTrend over ten year period
69

MALICIOUS DAMAGE TO PROPERTYProvincial Overview
70

Property-related crimesProperty-related crime refers to crimes during which tangible property of an
individual or institution is taken by criminal elements without permission and in the
absence of the owner or custodian of such property. This type of crime includes
burglary at both residential and non-residential premises, theft of motor vehicles and
motorcycles, theft out of or from motor vehicles and stock-theft.
• Burglary at Residential premises
• Burglary at Non-Residential premises
• Theft of motor vehicle and motor cycle
• Theft out of or from motor vehicle
• Stock theft71
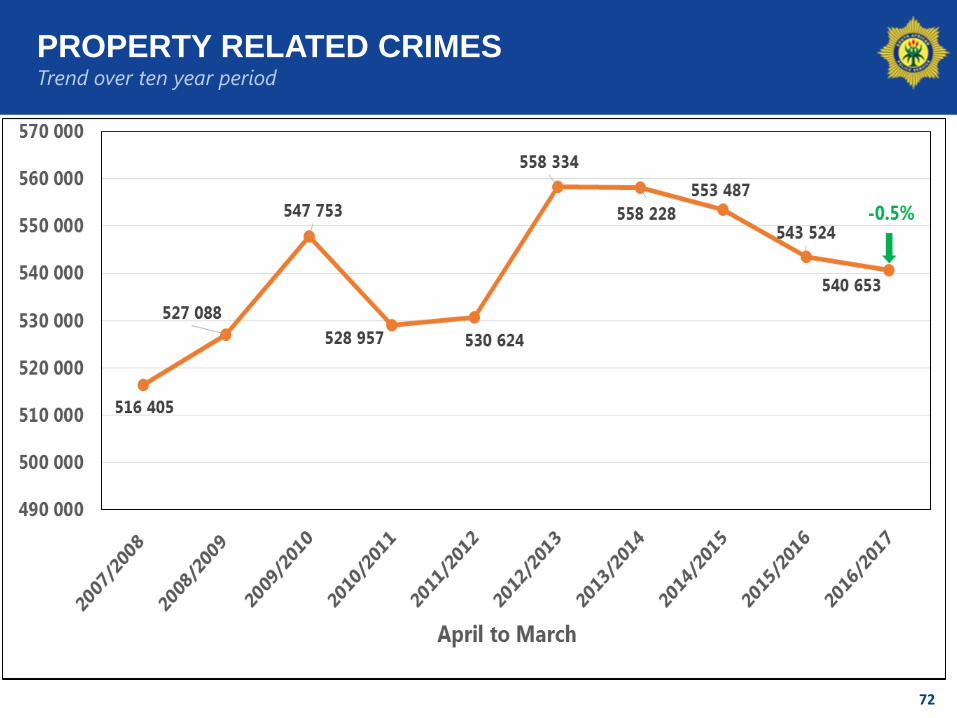
PROPERTY RELATED CRIMESTrend over ten year period
72

73
PROPERTY RELATED CRIMESPercentage Change

74
HIGHLIGHTS ON THE PROPERTY RELATED CRIMESProvincial Overview

75
HIGHLIGHTS ON THE PROPERTY-RELATED CRIMES Provincial breakdown (total & percentage change)
Province Burglarynon-res
Burglary residential
Theft of mv and mc
Theft out/ from mv
Stock-theft
TotalProperty-related
Total Red
Eastern Cape 7 7553.8%
24 3852.0%
2 7392.3%
12 1958.6%
6 0233.7%
53 0973.9%
5
Free State 5 011-3.8%
14 635-4.5%
1 588-9.0%
4 822-1.1%
3 6776.1%
29 733-2.9%
1
Gauteng 17 1734.6%
63 661-2.0%
27 6743.9%
45 2667.5%
98720.7%
154 7612.5%
4
KZN 11 253-3.5 %
41 013-3.3%
8 413-3.0%
16 854-5.8%
5 9594.0%
83 492-3.3%
1
Limpopo 7 288-1.3%
15 984-1.4%
1 017-11.6%
4 995-10.3%
1 95611.4%
31 240-2.6%
1
MP 6 1582.4%
18 5071.9%
2 208-0.6%
6 926-6.0%
2 86722.7%
36 6661.5%
3
NC 2 4039.1%
6 5180.8%
219-11.0%
2 911-1.7%
1 3561.8%
13 4071.5%
3
NW 6 04213.7%
15 9082.2%
2 068-0.1%
6 2936.4%
3 19222.5%
33 5036.5%
4
W C 12 535-6.1%
46 043-3.2%
7 381-11.9%
37 910-8.6%
8852.8%
104 754-6.1%
1
Total 5 4 2 3 9 5
76
Types of Property-related
crimes

BURGLARY AT NON-RESIDENTIAL PREMISESTrend over ten year period
77

BURGLARY AT NON-RESIDENTIAL PREMISESProvincial Overview
78

BURGLARY AT RESIDENTIAL PREMISESTrend over ten year period
79

BURGLARY AT RESIDENTIAL PREMISESProvincial Overview
80

THEFT OF MOTOR VEHICLE AND MOTORCYCLETrend over ten year period
81

THEFT OF MOTOR VEHICLE AND MOTORCYCLEProvincial Overview
82

THEFT OF OUT OF OR FROM MOTOR VEHICLETrend over ten year period
83

THEFT OF OUT OF OR FROM MOTOR VEHICLE Provincial Overview
84

STOCK THEFTTrend over ten year period
85

STOCK THEFT Provincial Overview
86

87
Other serious crimesInclude all Serious Crimes not mentioned in the above categories
• Other Theft
• Commercial Crime
• Shoplifting
88
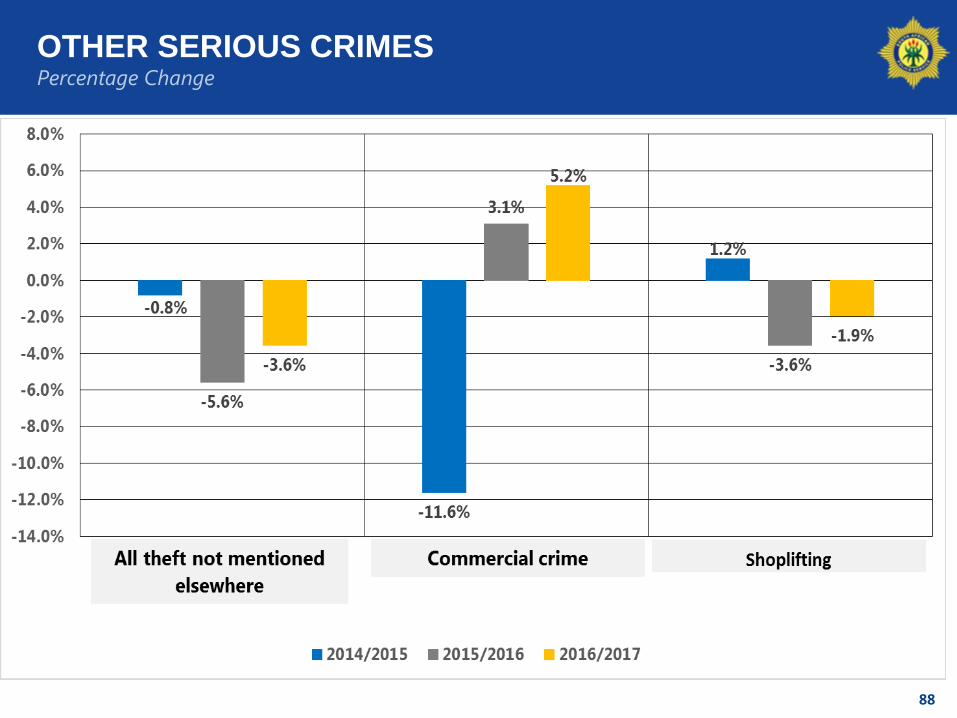
OTHER SERIOUS CRIMESPercentage Change

OTHER SERIOUS CRIMESTrend over ten year period
89

90
HIGHLIGHTS ON THE OTHER SERIOUS CRIMESProvincial Overview

91
HIGHLIGHTS ON OTHER SERIOUS CRIMES Provincial breakdown (total & percentage change)
Province All theft not mentioned elsewhere
Commercial crime
Shoplifting Total other serious crimes
Total Red
Eastern Cape 24 4864.5%
6 5676.7%
5 408-4.4%
36 4613.5%
2
Free State 15 623-4.4%
4 51113.2%
3 2141.2%
23 3480.7%
2
Gauteng 97 633-4.8%
24 1472.0%
21 194-4.3%
142 974-3.7%
1
KwaZulu-Natal 42 577-2.3%
12 4058.9%
12 302-9.9%
67 284-1.9%
1
Limpopo 20 7584.2%
4 0247.8%
3 742-1.5%
28 5243.9%
2
Mpumalanga 18 4570.2%
5 1498.8%
3 4541.7%
27 0601.9%
3
Northern Cape 7 104-2.9%
1 1086.8%
1 40710.3%
9 619-0.1%
2
North West 15 677-6.4%
3 914-7.1%
2 176-0.5%
21 767-6.0%
0
Western Cape 85 957-6.6%
11 7256.7%
14 5577.9%
112 239-3.7%
2
Total 3 8 4 2
92
Types of Other serious
crimes

ALL THEFT NOT MENTIONED ELSEWHERETrend over ten year period
93

ALL THEFT NOT MENTIONED ELSEWHEREProvincial Overview
94

COMMERCIAL CRIMESTrend over ten year period
95
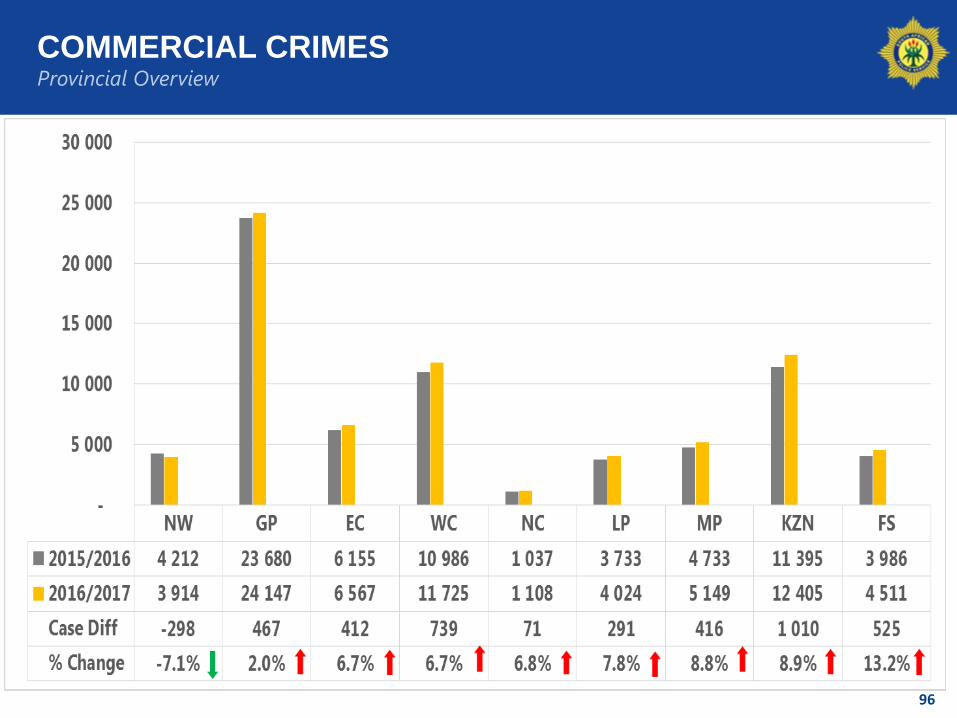
COMMERCIAL CRIMESProvincial Overview
96

SHOPLIFTINGTrend over ten year period
97

SHOPLIFTING Provincial Overview
98

99
Crimes Detected As A Result
Of Police ActionCrime detected as a result of police action is usually not reported to the police largely
deployment of law enforcement personnel and employment of intelligence. The
crime is usually recorded after the apprehension of suspects in connection with the
illegal possession of firearms and ammunition, drug-related crimes, driving under the
influence of alcohol and/or drugs and sexual offences detected as a result of police
action.

CRIMES DETECTED AS A RESULT OF POLICE ACTIONTrend over ten year period
100

CRIMES DETECTED AS A RESULT OF POLICE ACTIONPercentage Change
101

CRIMES DETECTED AS A RESULT OF POLICE ACTIONProvincial Overview
102

103
HIGHLIGHTS ON CRIMES DETECTED AS A RESULT OF POLICE ACTIONProvincial breakdown (total & percentage change)
Province Illegalpossession of firearms and ammunition
Drug-related crime
DUI and or drugs
Sexual offences detected
Totalcrimes detected
Total Red
Eastern Cape 204515.3%
17 7109.8%
6 090-7.0%
33728.5%
26 1826.0%
1
Free State 52712.4%
11 31417.6%
2 82815.5%
34637.8%
15 01517.4%
0
Gauteng 4 12614.6%
62 83713.3%
27 834-13.8%
60628.9%
95 4033.9%
1
KwaZulu-Natal 4 0002.4%
50 4298.8%
13 40311.2%
3 55838.9%
71 39010.0%
0
Limpopo 53316.9%
14 39327.7%
4 4206.7%
698-62.1%
20 04413.2%
1
Mpumalanga 1 13716.4%
11 51917.3%
4 20515.2%
41-55.9%
16 90216.3%
1
Northern Cape 10210.9%
5 13618.2%
7979.9%
49122.7%
6 08417.4%
0
North West 7358.4%
11 972-1.8%
2 562-0.8%
255193.1%
15 524-0.1%
2
Western Cape 2 9293.9%
107 37914.2 %
12 89510.0%
27413.2%
123 47713.5%
4
Total 0 1 3 2 1

104
Types of Crimes
Detected As A Result Of
Police Action

ILLEGAL POSSESSION OF FIREARMS AND AMMUNITIONTrend over ten year period
105
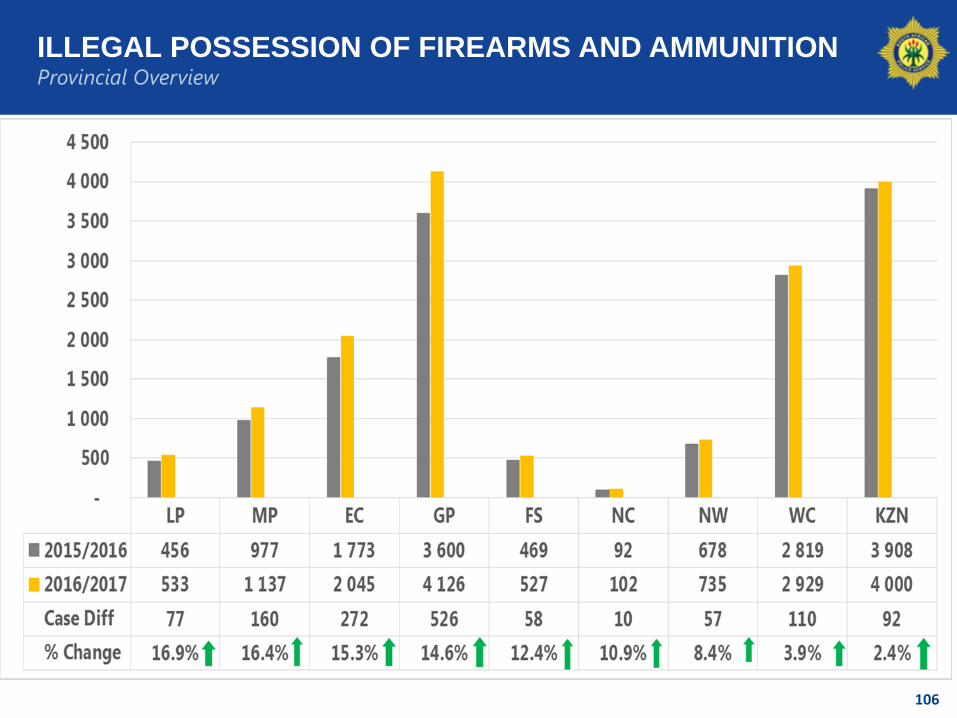
ILLEGAL POSSESSION OF FIREARMS AND AMMUNITION Provincial Overview
106

DRUG-RELATED CRIMETrend over ten year period
107

DRUG-RELATED CRIMEProvincial Overview
108

DRIVING UNDER THE INFLUENCE OF ALCOHOL OR DRUGSTrend over ten year period
109

DRIVING UNDER THE INFLUENCE OF ALCOHOL OR DRUGSProvincial Overview
110

SEXUAL OFFENCES DETECTED AS A RESULT OF POLICE
ACTIONTrend over six year period
111

SEXUAL OFFENCES DETECTED AS A RESULT OF POLICE
ACTION Provincial Overview
112

113
Core Business Diversion

CORE BUSINESS DIVERSION Public Order Incidents
114

PUBLIC ORDER RELATED INCIDENCES Peaceful: Break down per Province
NC
EC
115

PUBLIC ORDER RELATED INCIDENCES Unrest: Break down per Province
NC
EC
116

RSA
117
CRIME CATEGORY 2014/2015 2015/2016 2016/2017 Case Diff % Change
CONTACT CRIMES (CRIMES AGAINST A PERSON)
Murder 17805 18673 19016 343 1.8%
Sexual Offences 53617 51895 49660 -2235 -4.3%
Attempted murder 17537 18127 18205 78 0.4%
Assault with the intent to inflict grievous bodily harm 182556 182933 170616 -12317 -6.7%
Common assault 161486 164958 156450 -8508 -5.2%
Common robbery 54927 54110 53418 -692 -1.3%
Robbery with aggravating circumstances 129045 132527 140956 8429 6.4%
Total Contact Crimes 616973 623223 608321 -14902 -2.4%
SEXUAL OFFENCES
Rape 43195 41503 39828 -1675 -4.0%
Sexual Assault 6087 6212 6271 59 0.9%
Attempted sexual offences 2641 2573 2073 -500 -19.4%
Contact sexual offences 1694 1607 1488 -119 -7.4%
Sexual Offences 53617 51895 49660 -2235 -4.3%
Secret
Secret

RSA
118
CRIME CATEGORY 2014/2015 2015/2016 2016/2017 Case Diff % Change
PROPERTY-RELATED CRIMES
Burglary at non-residential premises 74 358 75 008 75 618 610 0.8%
Burglary at residential premises 253 716 250 606 246 654 -3 952 -1.6%
Theft of motor vehicle and motorcycle 55 090 53 809 53 307 -502 -0.9%
Theft out of or from motor vehicle 145 358 139 386 138 172 -1 214 -0.9%
Stock-theft 24 965 24 715 26 902 2 187 8.8%
Property-Related Crimes 553 487 543 524 540 653 -2 871 -0.5%
OTHER-SERIOUS CRIMES
All theft not mentioned elsewhere 360541 340372 328272 -12100 -3.6%
Commercial crime 67830 69917 73550 3633 5.2%
Shoplifting 71327 68786 67454 -1332 -1.9%
Other Serious Crimes 499698 479075 469276 -9799 -2.0%
17 Community-Reported Serious Crimes 1795947 1770626 1738980 -31646 -1.8%
CRIMES DETECTED AS A RESULT OF POLICE ACTION
Illegal possession of firearms and ammunition 15116 14772 16134 1362 9.2%
Drug-related crime 266902 259165 292689 33524 12.9%
Driving under the influence of alcohol or drugs 68561 76159 75034 -1125 -1.5%
Sexual Offences detected as a result of Police Action 6340 5830 6164 334 5.7%
Crime Detected As A Result Of Police Action 356919 355926 390021 34095 9.6%
Secret
Secret

END