Credit suisse industrials conference 12 1-2016-vff
26
The Manitowoc Company, Inc. CREDIT SUISSE 4 TH ANNUAL INDUSTRIALS CONFERENCE MANALAPAN, FL DECEMBER 1, 2016
-
Upload
manitowoccompany -
Category
Investor Relations
-
view
319 -
download
1
Transcript of Credit suisse industrials conference 12 1-2016-vff
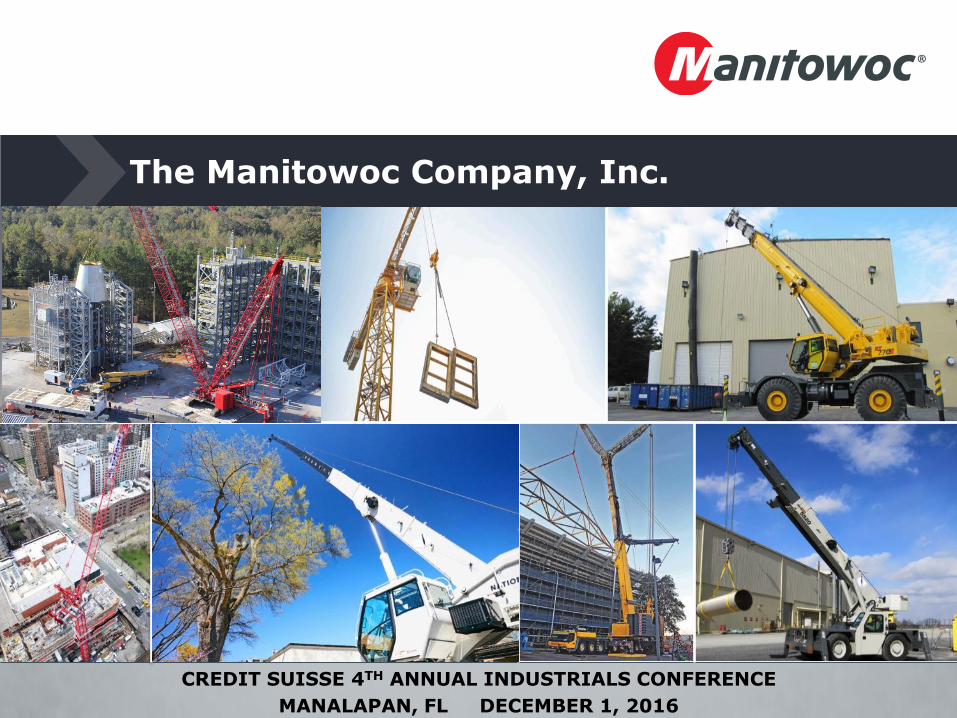
The Manitowoc Company, Inc.
CREDIT SUISSE 4TH ANNUAL INDUSTRIALS CONFERENCE
MANALAPAN, FL DECEMBER 1, 2016
2
Safe Harbor Statement
Any statements contained in this presentation that are not historical facts are “forward-looking statements.” These statements are based on the current expectations of the management of the company, only speak as of the date on which they are made, and are subject to uncertainty and changes in circumstances. We undertake no obligation to update or revise forward-looking statements, whether as a result of new information, future events, or otherwise. Forward-looking statements include, without limitation, statements typically containing words such as “intends,” “expects,” “anticipates,” “targets,” “estimates,” and words of similar import. By their nature, forward-looking statements are not guarantees of future performance or results and involve risks and uncertainties because they relate to events and depend on circumstances that will occur in the future.
There are a number of factors that could cause actual results and developments to differ materially from those expressed or implied by such forward-looking statements. These factors include, but are not limited to, those relating to revenue growth of the company, future market strength of the company’s business segments and products, market acceptance of existing products and new product introductions and technology, economic conditions, successful acquisitions, manufacturing and facility utilization efficiencies, risks relating to actions of activist shareholders, and other factors listed in the company’s preliminary offering circular with respect to the notes, dated May 5, 2016. Any “forward-looking statements” in this presentation are intended to qualify for the safe harbor from liability under the Private Securities Litigation Reform Act of 1995.
3
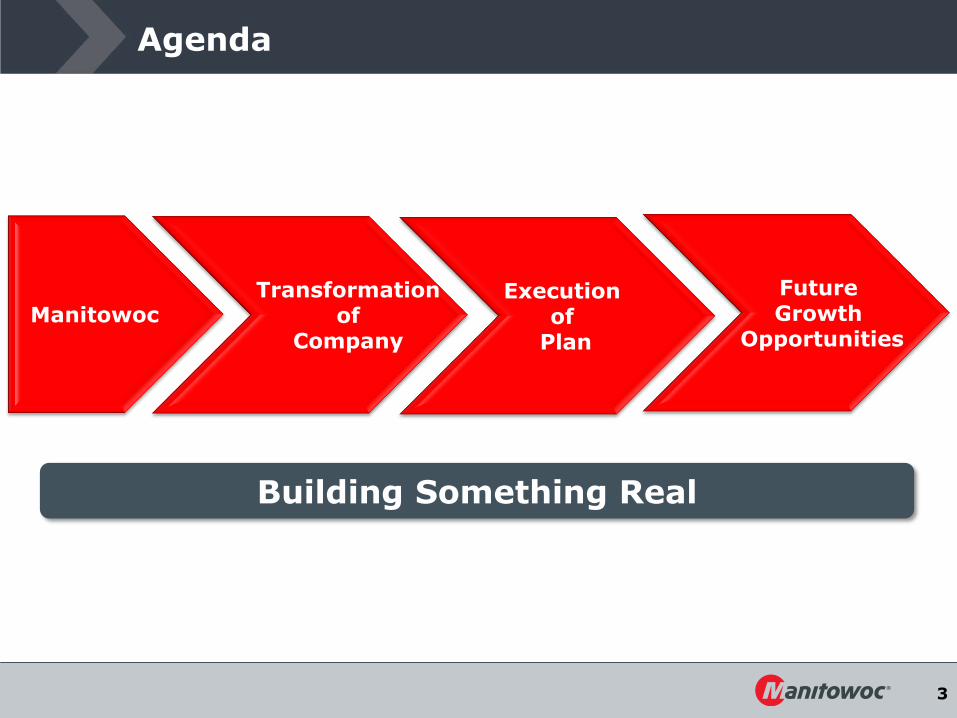
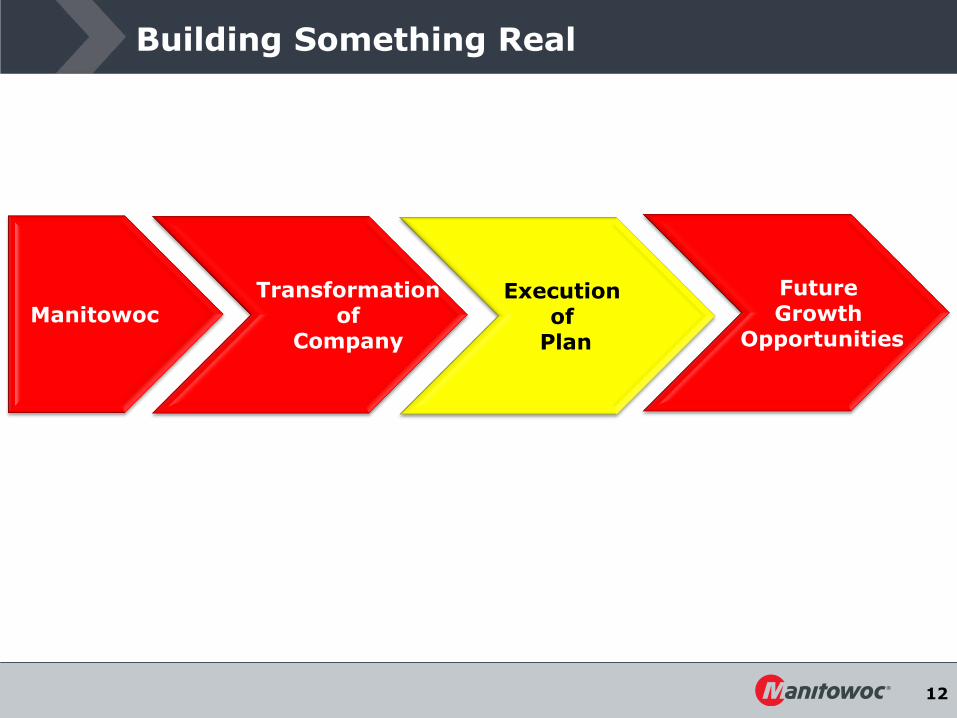
Agenda
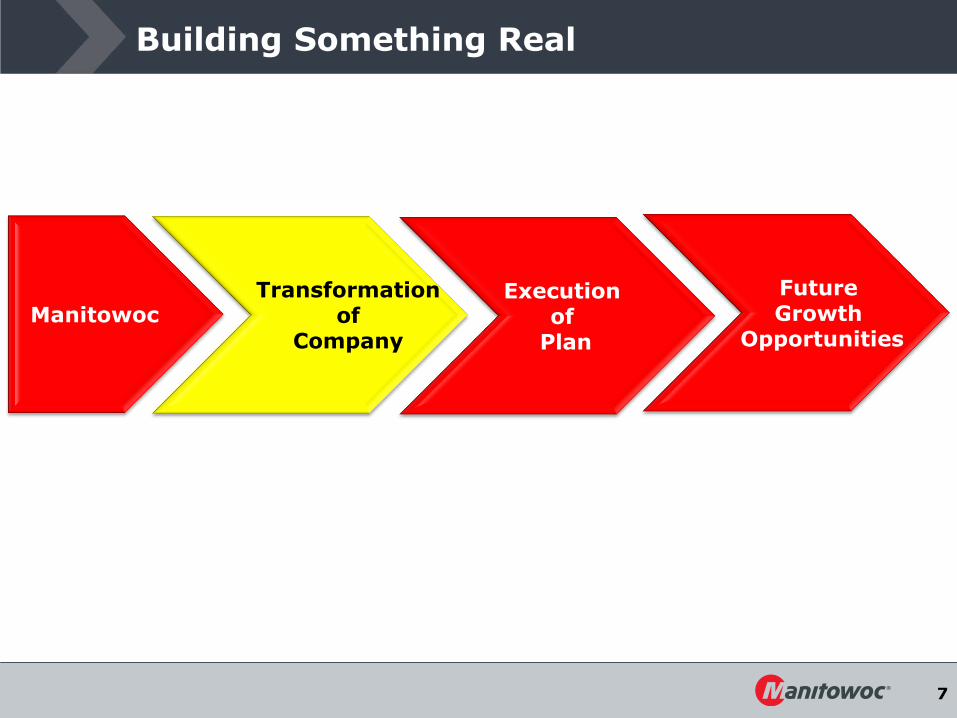
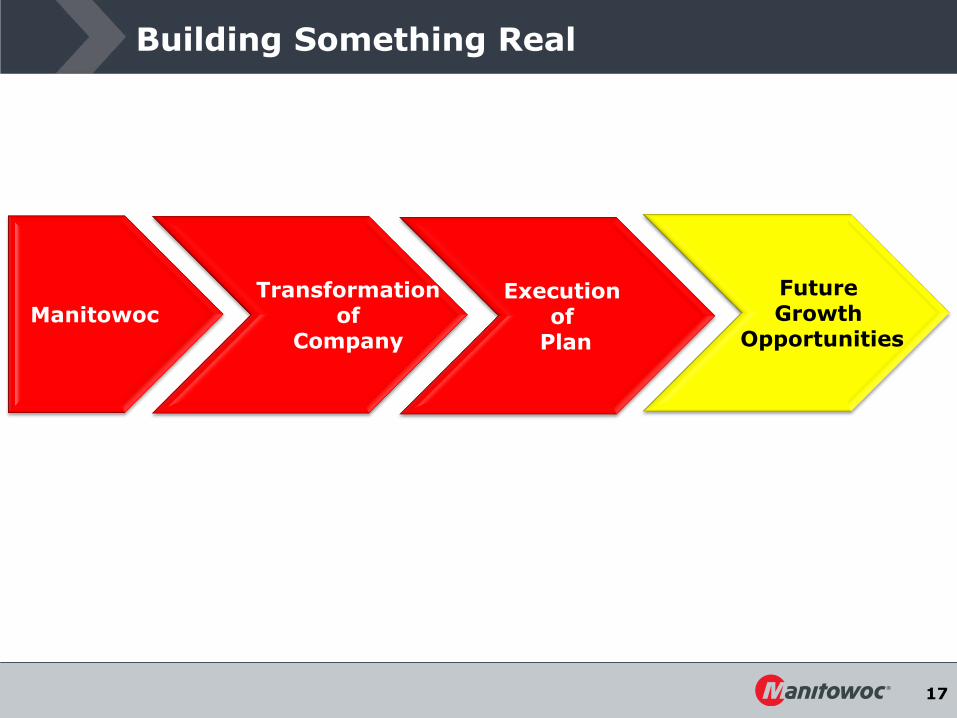
Building Something Real
Manitowoc Transformation
of Company
Execution of
Plan
Future Growth
Opportunities
4
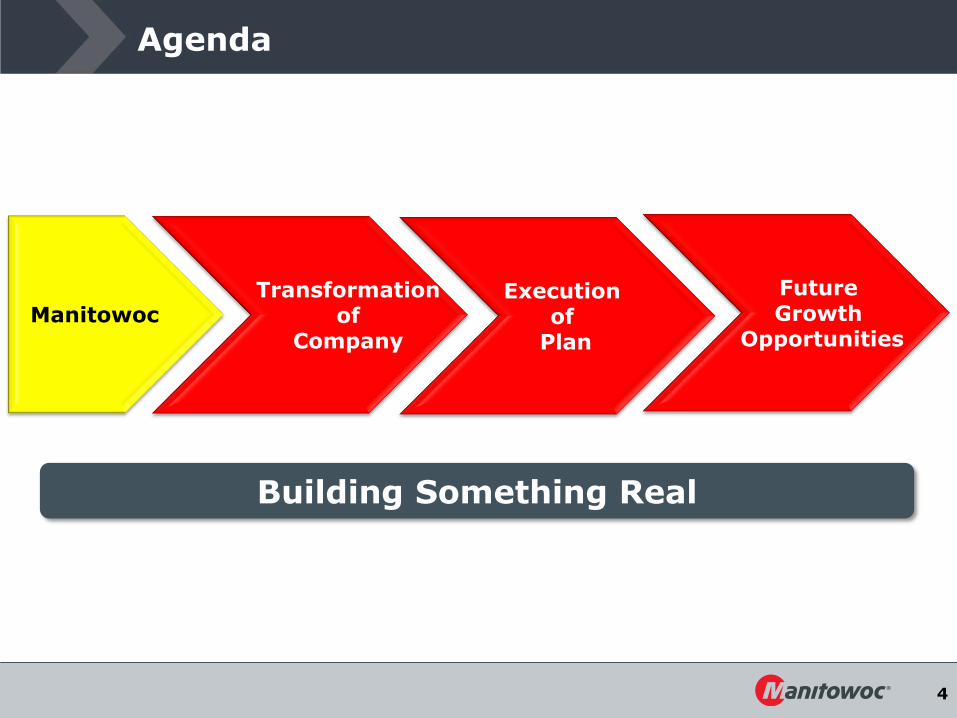
Agenda
Building Something Real
Manitowoc Transformation
of Company
Execution of
Plan
Future Growth
Opportunities
5
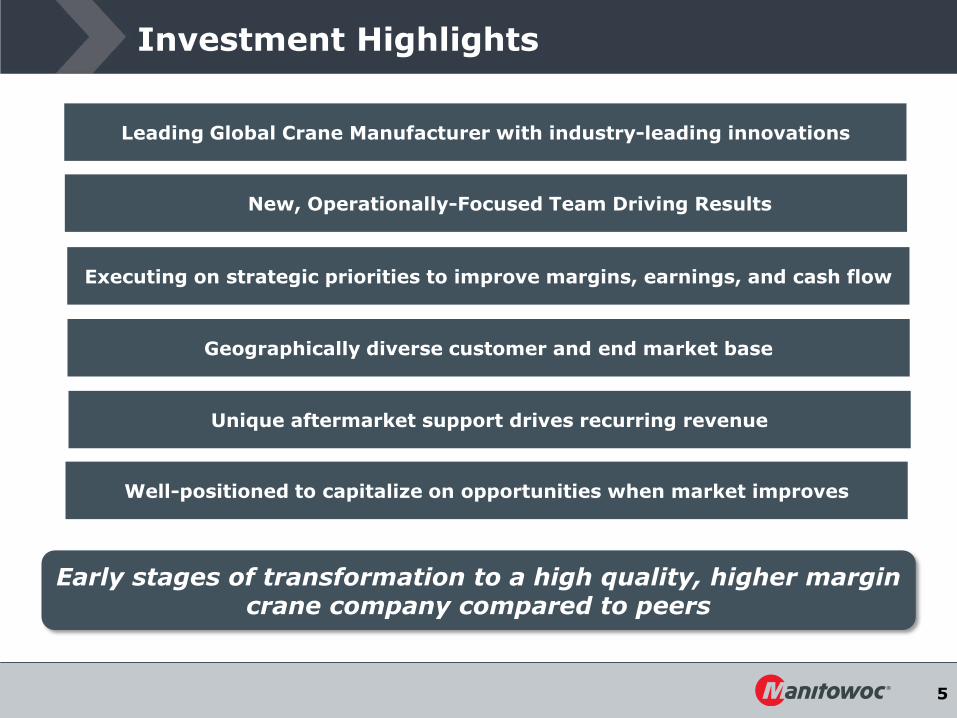
Investment Highlights
Leading Global Crane Manufacturer with industry-leading innovations
Well-positioned to capitalize on opportunities when market improves
Unique aftermarket support drives recurring revenue
Geographically diverse customer and end market base
Executing on strategic priorities to improve margins, earnings, and cash flow
New, Operationally-Focused Team Driving Results
Early stages of transformation to a high quality, higher margin crane company compared to peers
6
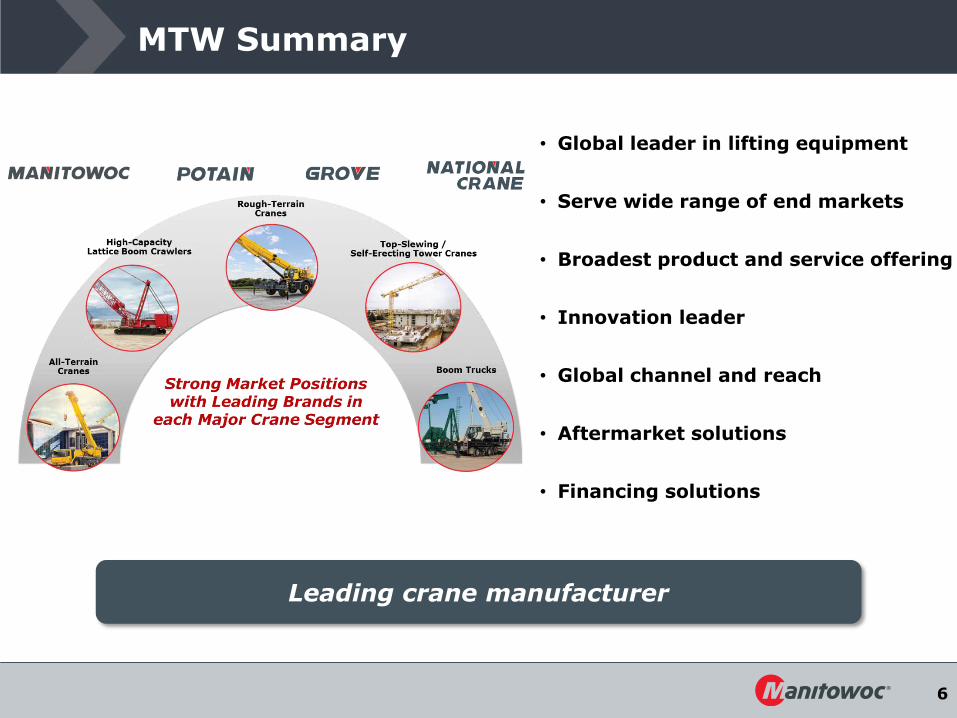
MTW Summary
• Global leader in lifting equipment
• Serve wide range of end markets
• Broadest product and service offering
• Innovation leader
• Global channel and reach
• Aftermarket solutions
• Financing solutions
Leading crane manufacturer
7
Manitowoc Transformation
of Company
Execution of
Plan
Future Growth
Opportunities
Building Something Real
8
Transformation: The Conditions are Right
Stand-alone Crane Company
• Foodservice spin-off complete
• Right-sizing for new company structure
Re-Capitalized Balance Sheet
• Sufficient liquidity
• Working capital focus
New Management Team
• Demonstrated record of turnarounds
• Lean acceleration to drive margin improvement
Cyclical Down-Turn
• Increasing manufacturing flexibility to manage through the cycle
10
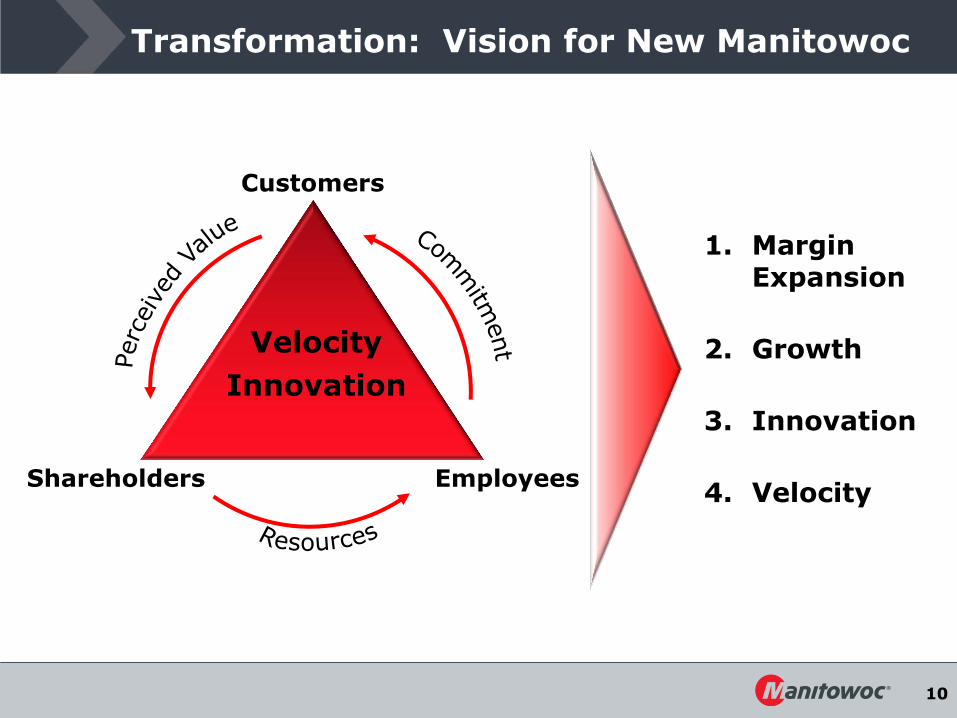
Transformation: Vision for New Manitowoc
Customers
Shareholders Employees
Velocity
Innovation
1. Margin Expansion
2. Growth
3. Innovation
4. Velocity
11
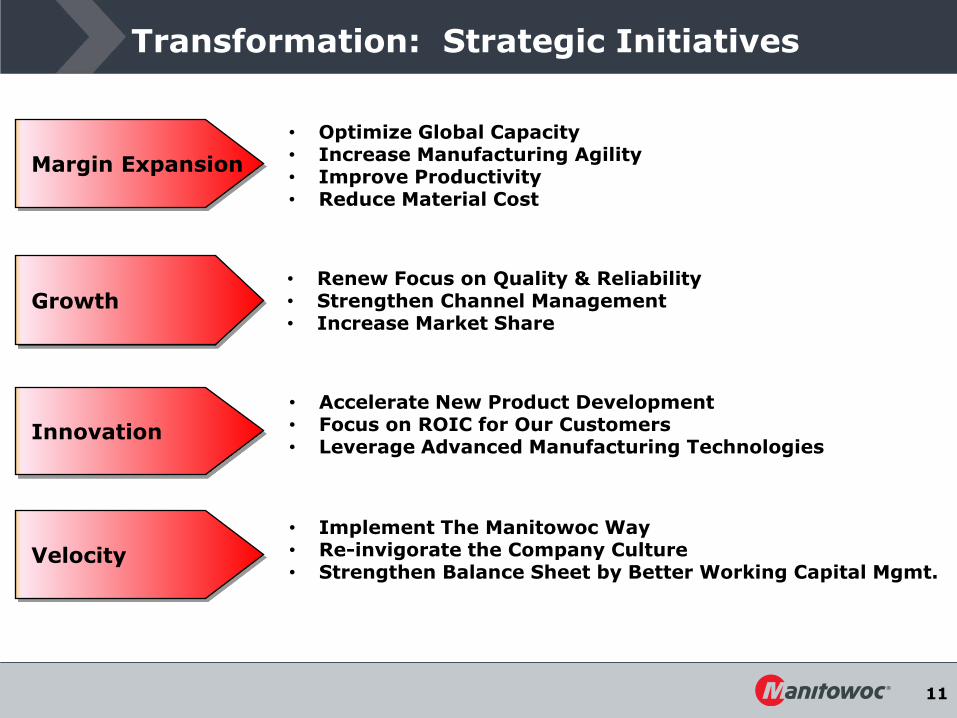
Transformation: Strategic Initiatives
• Renew Focus on Quality & Reliability • Strengthen Channel Management • Increase Market Share
• Optimize Global Capacity • Increase Manufacturing Agility • Improve Productivity • Reduce Material Cost
• Accelerate New Product Development • Focus on ROIC for Our Customers • Leverage Advanced Manufacturing Technologies
Margin Expansion
Growth
Innovation
Velocity
• Implement The Manitowoc Way • Re-invigorate the Company Culture • Strengthen Balance Sheet by Better Working Capital Mgmt.
12
Manitowoc Transformation
of Company
Execution of
Plan
Future Growth
Opportunities
Building Something Real
13
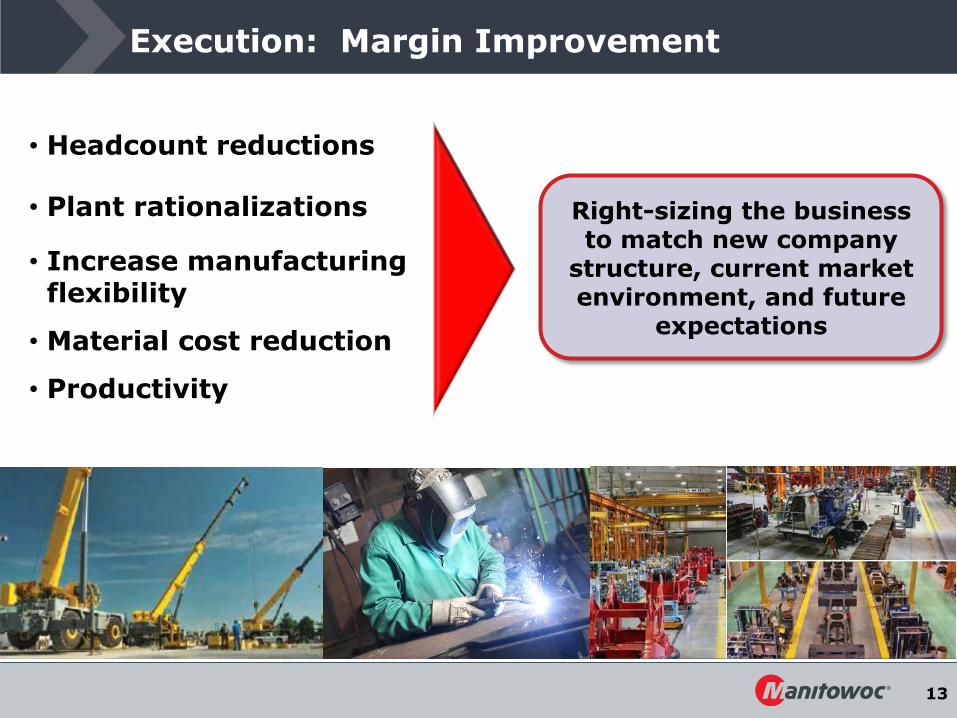
Execution: Margin Improvement
• Headcount reductions
• Plant rationalizations
• Increase manufacturing flexibility
• Material cost reduction
• Productivity
Right-sizing the business to match new company
structure, current market environment, and future
expectations
14
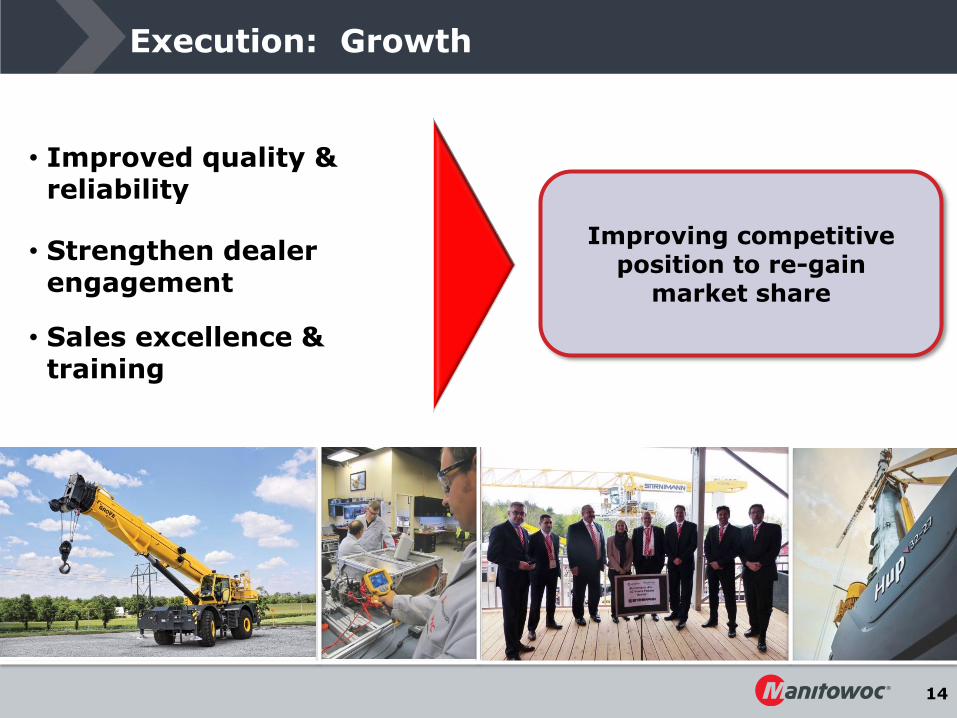
Execution: Growth
• Improved quality & reliability
• Strengthen dealer engagement
• Sales excellence & training
Improving competitive position to re-gain
market share
15
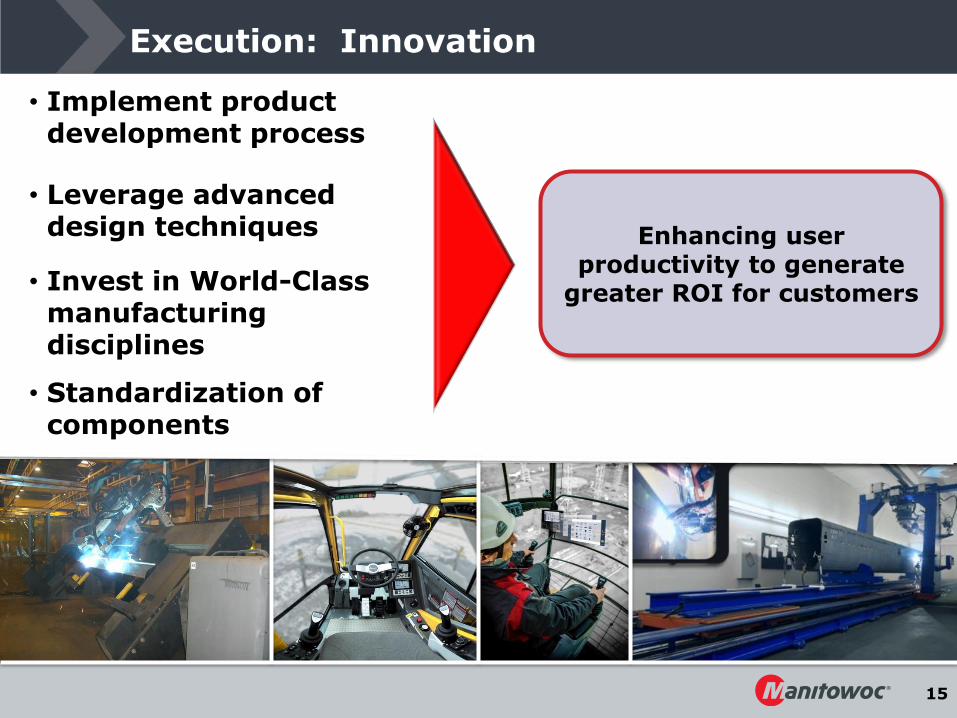
Execution: Innovation
• Implement product development process
• Leverage advanced design techniques
• Invest in World-Class manufacturing disciplines
• Standardization of components
Enhancing user productivity to generate
greater ROI for customers
16
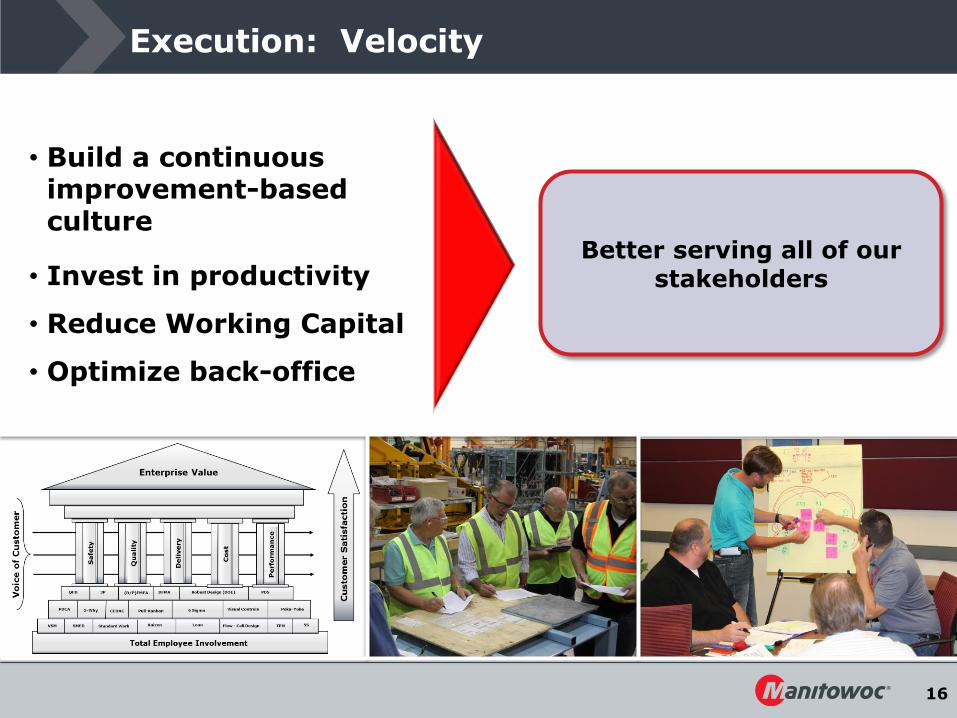
Execution: Velocity
• Build a continuous improvement-based culture
• Invest in productivity
• Reduce Working Capital
• Optimize back-office
Better serving all of our stakeholders
17
Manitowoc Transformation
of Company
Execution of
Plan
Future Growth
Opportunities
Building Something Real
18
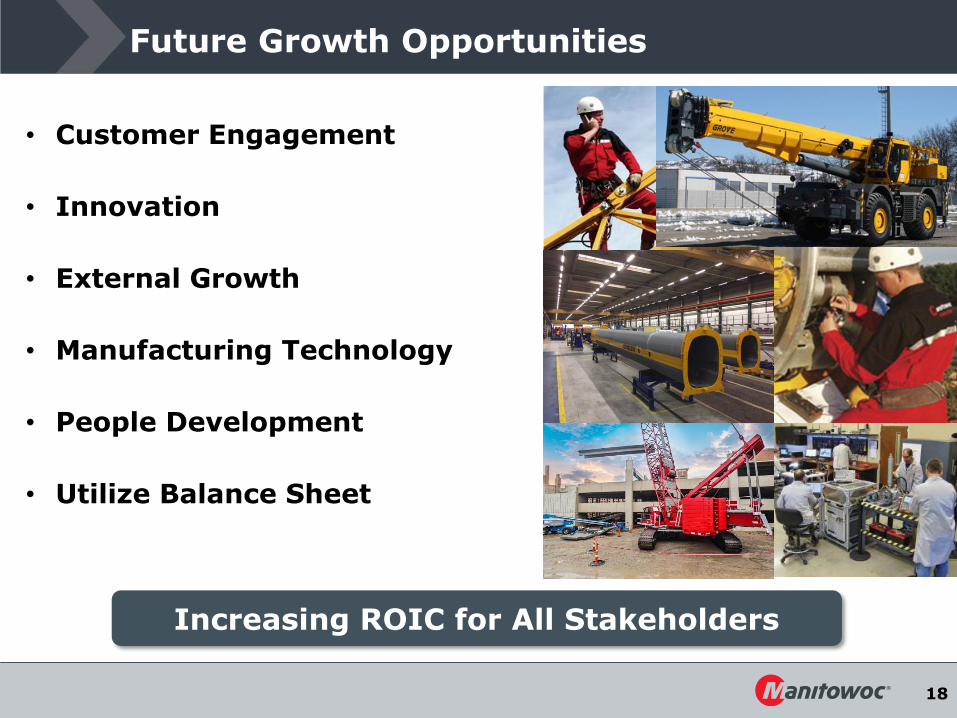
Future Growth Opportunities
• Customer Engagement
• Innovation
• External Growth
• Manufacturing Technology
• People Development
• Utilize Balance Sheet
Increasing ROIC for All Stakeholders
19
Additional Materials and Financials
20
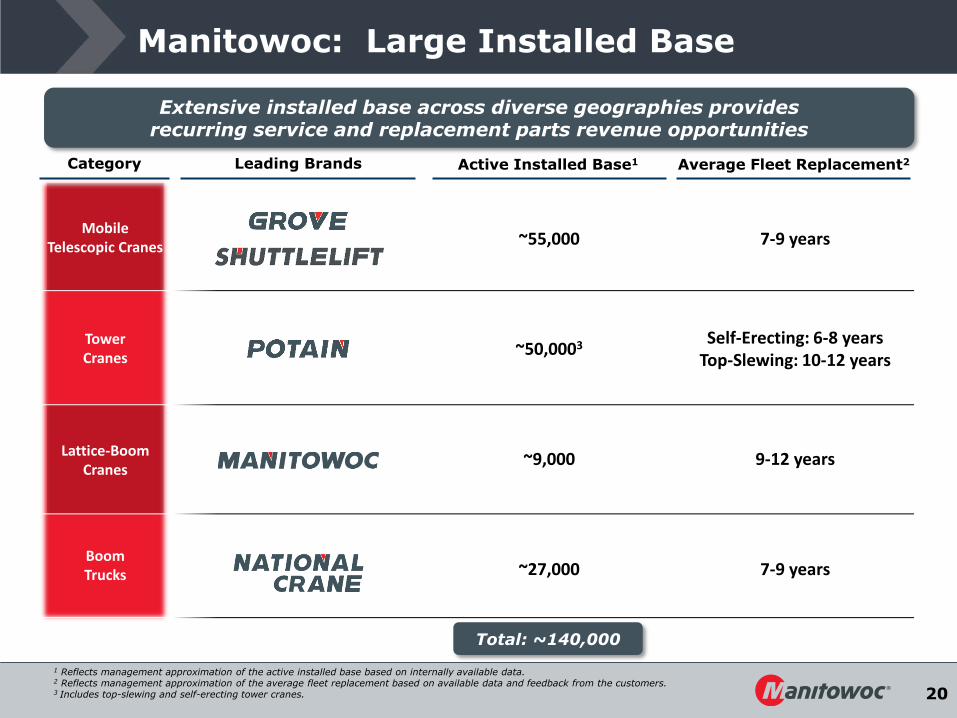
Manitowoc: Large Installed Base
~55,000 7-9 years
~50,0003 Self-Erecting: 6-8 years Top-Slewing: 10-12 years
~9,000 9-12 years
~27,000 7-9 years
Mobile Telescopic Cranes
Tower Cranes
Lattice-Boom Cranes
Boom Trucks
Leading Brands Active Installed Base1 Category
Extensive installed base across diverse geographies provides recurring service and replacement parts revenue opportunities
1 Reflects management approximation of the active installed base based on internally available data. 2 Reflects management approximation of the average fleet replacement based on available data and feedback from the customers. 3 Includes top-slewing and self-erecting tower cranes.
Average Fleet Replacement2
Total: ~140,000

21
Diversified by Region, End Market and Product
Key Brands
2015 Geographic Exposure
2015 End Market Exposure1
2016 YTD Revenue by Product3
Americas52%
APAC12%
EMEA36%
1 Includes new equipment sales only. 2 Represents 2015 gross sales. Includes new equipment sales only. Government sales do not reflect our recent $192 million contract with the U.S. Army which will impact revenue over the next several years. 3 Crane Products includes new equipment sales only.
Balanced Sales Footprint and Customer Segments We Serve
2015 Overall Customer Mix2
Industrial / Petrochemical
35%
Power / Utilities18%
Commercial25%
Residential5%
Infrastructure17%
Contractor13%
Dealer66%
Gov't0.2%
Other4%
Rental17%
Crane Care 17%
Crane Products 83%
22
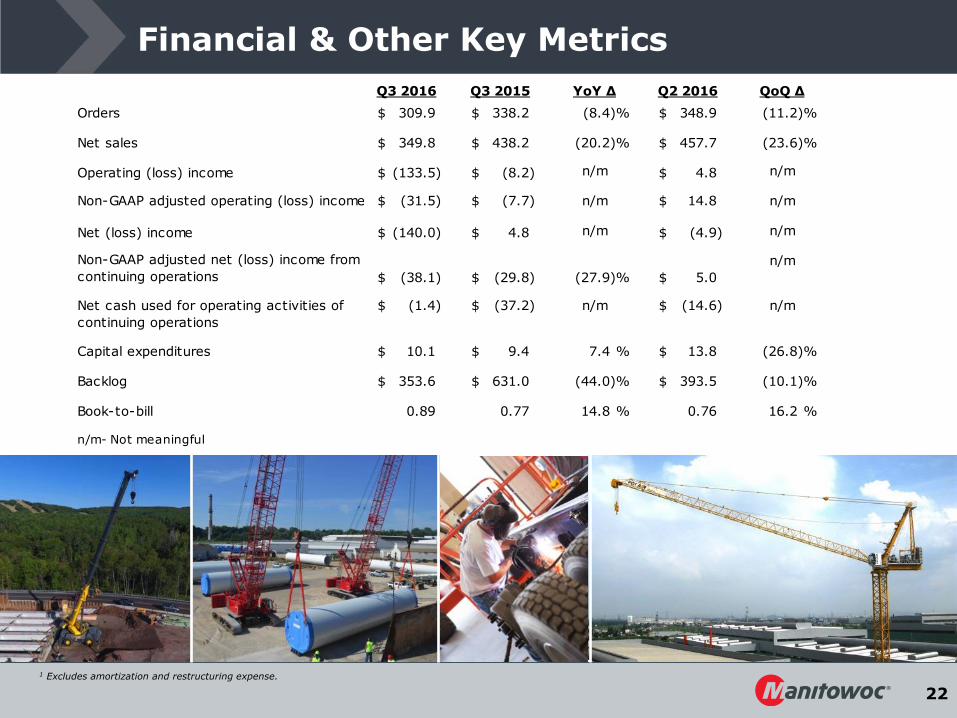
Q3 2016 Q3 2015 YoY ∆ Q2 2016 QoQ ∆
Orders 309.9$ 338.2$ (8.4)% 348.9$ (11.2)%
Net sales 349.8$ 438.2$ (20.2)% 457.7$ (23.6)%
Operating (loss) income (133.5)$ (8.2)$ n/m 4.8$ n/m
Non-GAAP adjusted operating (loss) income (31.5)$ (7.7)$ n/m 14.8$ n/m
Net (loss) income (140.0)$ 4.8$ n/m (4.9)$ n/m
Non-GAAP adjusted net (loss) income from
continuing operations (38.1)$ (29.8)$ (27.9)% 5.0$
n/m
Net cash used for operating activities of
continuing operations
(1.4)$ (37.2)$ n/m (14.6)$ n/m
Capital expenditures 10.1$ 9.4$ 7.4 % 13.8$ (26.8)%
Backlog 353.6$ 631.0$ (44.0)% 393.5$ (10.1)%
Book-to-bill 0.89 0.77 14.8 % 0.76 16.2 %
n/m- Not meaningful
Financial & Other Key Metrics
1 Excludes amortization and restructuring expense.

23
GAAP Reconciliation Summary
24
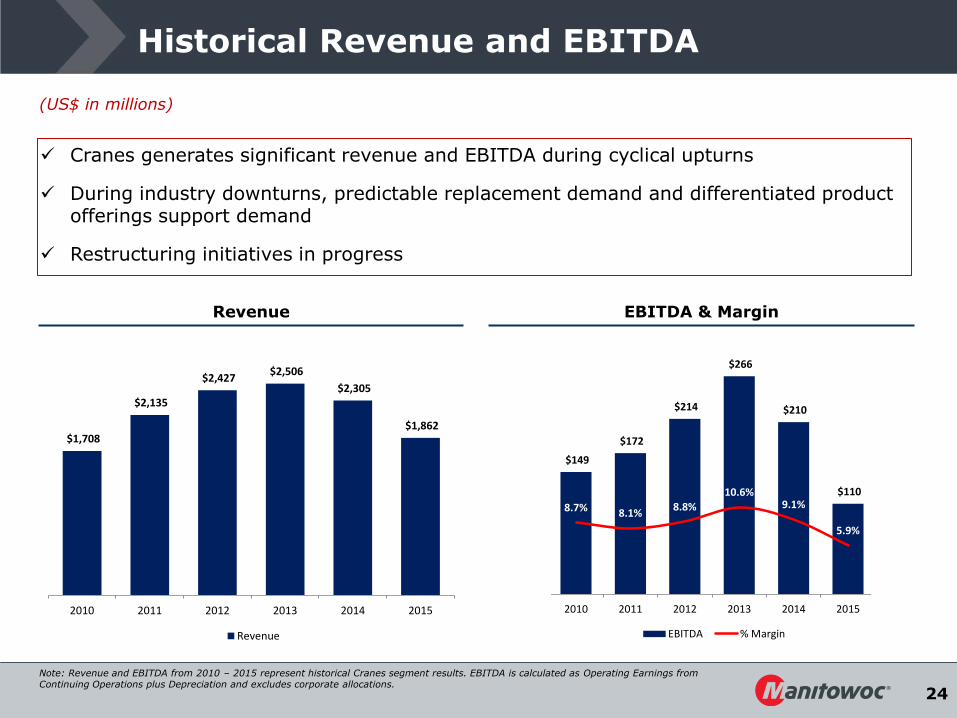
Historical Revenue and EBITDA
(US$ in millions)
Revenue EBITDA & Margin
Cranes generates significant revenue and EBITDA during cyclical upturns
During industry downturns, predictable replacement demand and differentiated product offerings support demand
Restructuring initiatives in progress
$1,708
$2,135
$2,427 $2,506
$2,305
$1,862
2010 2011 2012 2013 2014 2015
Revenue
$149
$172
$214
$266
$210
$110
8.7% 8.1%8.8%
10.6%9.1%
5.9%
0.0%
5.0%
10.0%
15.0%
20.0%
25.0%
30.0%
$-
$50
$100
$150
$200
$250
$300
2010 2011 2012 2013 2014 2015
EBITDA % Margin
Note: Revenue and EBITDA from 2010 – 2015 represent historical Cranes segment results. EBITDA is calculated as Operating Earnings from Continuing Operations plus Depreciation and excludes corporate allocations.
25
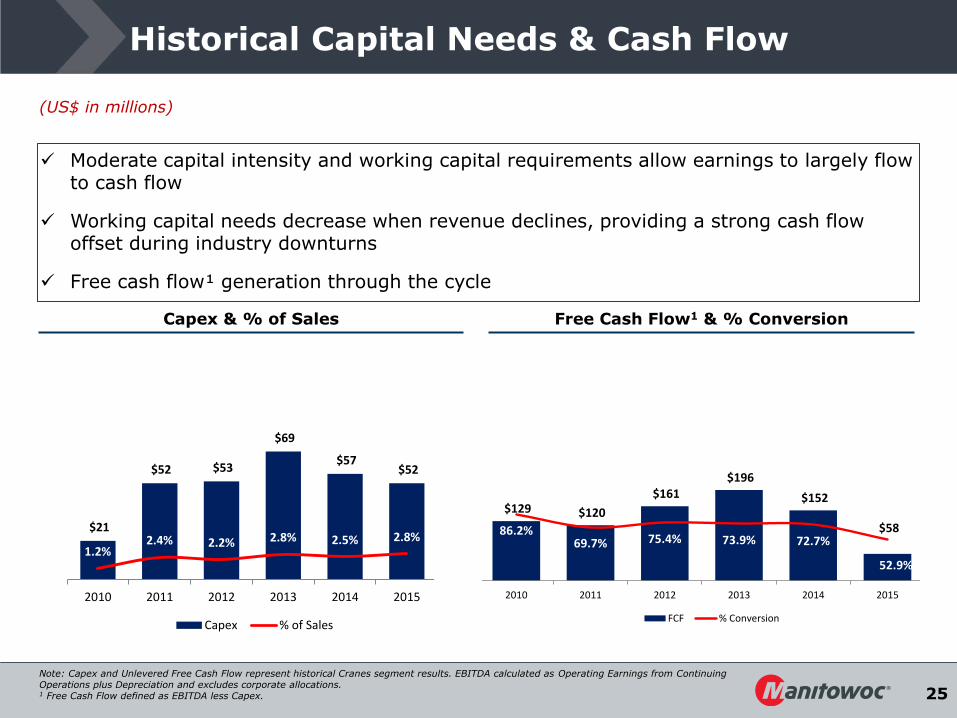
Historical Capital Needs & Cash Flow
(US$ in millions)
Capex & % of Sales
Note: Capex and Unlevered Free Cash Flow represent historical Cranes segment results. EBITDA calculated as Operating Earnings from Continuing Operations plus Depreciation and excludes corporate allocations. 1 Free Cash Flow defined as EBITDA less Capex.
Free Cash Flow1 & % Conversion
Moderate capital intensity and working capital requirements allow earnings to largely flow to cash flow
Working capital needs decrease when revenue declines, providing a strong cash flow offset during industry downturns
Free cash flow¹ generation through the cycle
$21
$52 $53
$69
$57 $52
1.2%2.4% 2.2% 2.8% 2.5% 2.8%
0.0%
5.0%
10.0%
15.0%
20.0%
25.0%
30.0%
$-
$20
$40
$60
$80
$100
$120
$140
2010 2011 2012 2013 2014 2015
Capex % of Sales
$129 $120
$161 $196
$152
$58 86.2%69.7% 75.4% 73.9% 72.7%
52.9%0.0%
50.0%
100.0%
150.0%
200.0%
250.0%
300.0%
0
50
100
150
200
250
300
350
400
450
500
2010 2011 2012 2013 2014 2015
FCF % Conversion
26
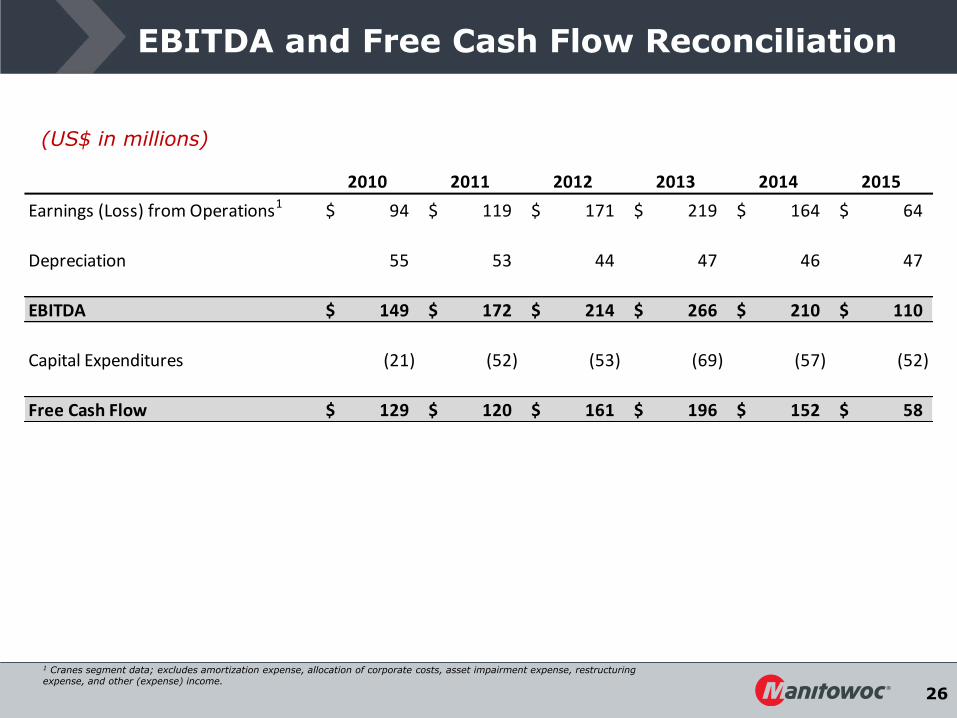
EBITDA and Free Cash Flow Reconciliation
(US$ in millions)
2010 2011 2012 2013 2014 2015
Earnings (Loss) from Operations1 94$ 119$ 171$ 219$ 164$ 64$
Depreciation 55 53 44 47 46 47
EBITDA 149$ 172$ 214$ 266$ 210$ 110$
Capital Expenditures (21) (52) (53) (69) (57) (52)
Free Cash Flow 129$ 120$ 161$ 196$ 152$ 58$
1 Cranes segment data; excludes amortization expense, allocation of corporate costs, asset impairment expense, restructuring expense, and other (expense) income.
27