CRECIMIENTO Y DESARROLLO DE ANTURIO (Anthurium …
78
UNIVERSIDAD AUTÓNOMA AGRARIA ANTONIO NARRO SUBDIRECCIÓN DE POSTGRADO CRECIMIENTO Y DESARROLLO DE ANTURIO (Anthurium andreanum Lind.) EN FUNCIÓN DEL BALANCE IÓNICO EN LA SOLUCIÓN NUTRITIVA Tesis Que presenta VIVIANA PAOLA SOSA FLORES como requisito parcial para obtener el Grado de DOCTOR EN CIENCIAS EN AGRICULTURA PROTEGIDA Saltillo, Coahuila Septiembre 2017
Transcript of CRECIMIENTO Y DESARROLLO DE ANTURIO (Anthurium …

UNIVERSIDAD AUTÓNOMA AGRARIA ANTONIO NARRO
SUBDIRECCIÓN DE POSTGRADO
CRECIMIENTO Y DESARROLLO DE ANTURIO (Anthurium andreanum Lind.)
EN FUNCIÓN DEL BALANCE IÓNICO EN LA SOLUCIÓN NUTRITIVA
Tesis
Que presenta VIVIANA PAOLA SOSA FLORES
como requisito parcial para obtener el Grado de
DOCTOR EN CIENCIAS EN AGRICULTURA PROTEGIDA
Saltillo, Coahuila Septiembre 2017
ii
ii

iii
AGRADECIMIENTOS
A la Universidad Autónoma Agraria Antonio Narro, por brindar la oportunidad
de superarme profesionalmente y reforzar valores en mí persona.
Al Consejo Nacional de Ciencia y Tecnología por otorgar el recurso económico
que permitió desarrollar mi investigación.
Al Dr. Luis Alonso Valdez Aguilar, Dr. Adalberto Benavides Mendoza, Dr.
Antonio Juárez Maldonado, Dr. Alberto Sandoval Rangel y Dra. Rosalinda Mendoza
Villarreal, por su apoyo, facilidades y contribuciones para la realización del presente
trabajo.
iii

iv
DEDICATORIA
A mis padres:
Sr. Miguel Sosa Morales
Sra. Dora Elia Flores Salas
A mis hermanas: Elia Mónica Sosa Flores
Mayra Alejandra Sosa Flores
Al Dr. Miguel Ángel Capo Arteaga, por su gran apoyo y amistad.
Al Ing. Oscar Alan Piña Angelino por su apoyo, confianza y cariño.
iv
v
ÍNDICE
Página
AGRADECIMIENTOS _________________________________________________ iii
DEDICATORIA _______________________________________________________ iv
INTRODUCCIÓN ______________________________________________________ 1
REVISIÓN DE LITERATURA ____________________________________________ 4
ARTÍCULO I
Response of potted anthurium (Anthurium andreanum Lind) plants to the ionic balance
in the nutrient solution: K+ : Ca+2 : Mg+2 __________________________________ 12
ARTÍCULO II
Anion proportion in the nutrient solution impacts the growth and nutrient status of
anthurium (Anthurium andraeanum Linden ex. André.) ________________________ 35
CONCLUSIONES _____________________________________________________ 67
REFERENCIAS _______________________________________________________ 68
v
vi
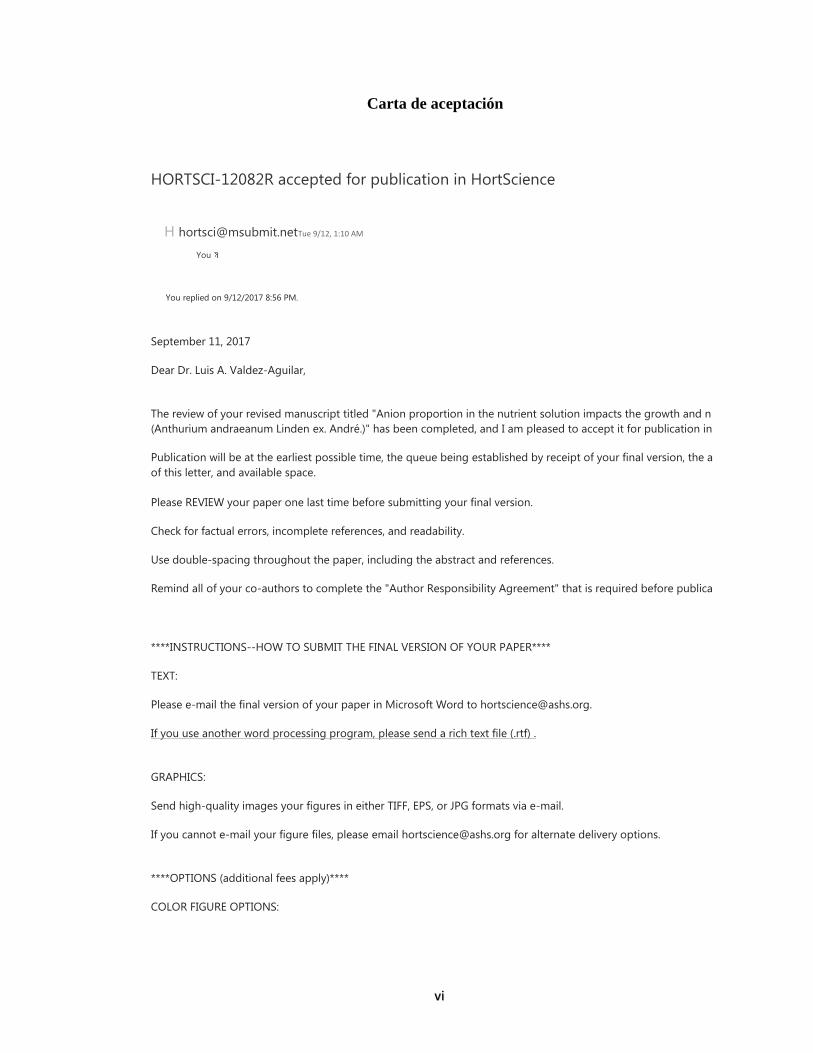
Carta de aceptación
HORTSCI-12082R accepted for publication in HortScience
H [email protected] 9/12, 1:10 AM
You
You replied on 9/12/2017 8:56 PM.
September 11, 2017
Dear Dr. Luis A. Valdez-Aguilar,
The review of your revised manuscript titled "Anion proportion in the nutrient solution impacts the growth and n (Anthurium andraeanum Linden ex. André.)" has been completed, and I am pleased to accept it for publication in
Publication will be at the earliest possible time, the queue being established by receipt of your final version, the a
of this letter, and available space.
Please REVIEW your paper one last time before submitting your final version.
Check for factual errors, incomplete references, and readability.
Use double-spacing throughout the paper, including the abstract and references.
Remind all of your co-authors to complete the "Author Responsibility Agreement" that is required before publica
****INSTRUCTIONS--HOW TO SUBMIT THE FINAL VERSION OF YOUR PAPER****
TEXT:
Please e-mail the final version of your paper in Microsoft Word to [email protected].
If you use another word processing program, please send a rich text file (.rtf) .
GRAPHICS:
Send high-quality images your figures in either TIFF, EPS, or JPG formats via e-mail.
If you cannot e-mail your figure files, please email [email protected] for alternate delivery options.
****OPTIONS (additional fees apply)****
COLOR FIGURE OPTIONS:
vi

vii
Please choose one of the following options for color figures:
1) Print and online color: $800 additional per printed color page.
2) Online-only color (print version in black-and-white): $25 per image file (online only color).
3) Black-and-white only (both print and online) : no charge. Production will be delayed if you do not provide this information, as we will need to contact you.
vii

viii
Carta de envío
1/7/2017 Gmail - Communications in Soil Science and Plant Analysis - Account Created in Manuscript Central
Communications in Soil Science and Plant Analysis - Account Created in Manuscript Central
Communications in Soil Science and Plant Analysis 14 de marzo de 2017,
<[email protected]> 15:30
Responder a: [email protected]
Para: [email protected]
14-Mar-2017
Dear Dr Paola Sosa-Flores:
A manuscript titled Response of potted anthurium (<i>Anthurium andreanum</i> Lind)
plants to the ionic balance in the nutrient solution: K<sup>+</sup> : Ca<sup>+2</sup> :
Mg<sup>+2</sup> (LCSS-2017-0135) has been submitted by Dr Paola Sosa-Flores to
Communications in Soil Science and Plant Analysis.
You are listed as a co-author for this manuscript. The online peer-review system,
Manuscript Central, has automatically created a user account for you.
The site URL and your USER ID for your account is as follows:
SITE URL: https://mc.manuscriptcentral.com/lcss USER ID: [email protected] https://mc.manuscriptcentral.com/lcss?URL_MASK=e7c78b67ba79482389b66e78930b14f6 Please note that your password is case-sensitive. When logged into the site you will be able to check the status of papers you have
authored/co-authored. Please do log in to https://mc.manuscriptcentral.com/lcss to
update your account information, and to change your password to one of your choice.
Thank you for your participation.
Sincerely,
Communications in Soil Science and Plant Analysis Editorial Office
Paola Sosa <[email protected]>
viii

1
INTRODUCCIÓN
El anturio (Anthurium andreanum Lind.) es una planta epífita sudamericana, valorada por
su brillante colorido y por su espata y espádice de larga duración. Pertenece a la familia
Araceae y es nativa de las zonas tropicales de Centro y Sur América. El nombre anturio
se deriva de la palabra griega 'anthos' y 'oura' que significa cola en referencia a su
inflorescencia (Mari, 2016). El comercio de anturios en EE.UU se valora alrededor de 50
millones de dólares y entre las flores cortadas tropicales ocupa el segundo lugar en
importancia sólo después de las orquídeas. Los Países Bajos y Hawaii son los principales
productores y Alemania, Italia, Japón, Francia y Estados Unidos son los principales
consumidores (Murguia et al., 2002).
En México, los anturios son cultivados desde hace cincuenta años, principalmente en el
estado de Veracruz (Castillo, 2012), principalmente para la producción de flores de corte
pero puede adecuarse a cultivos en maceta, es una planta habitualmente grande, de
disposición relativamente abierta. La durabilidad de estas flores y su belleza, hacen que
tengan un gran potencial para cultivarse en el trópico mexicano (Castillo, 2012) donde
existen condiciones climáticas que permiten producir flores tropicales, como el anturio
todo el año, sin embargo, la carencia de investigación básica y aplicada en estas especies
no permite identificar nuevas técnicas para aumentar la producción y calidad. El manejo
adecuado de soluciones nutritivas puede ser una de ellas. La nutrición es uno de los
factores culturales importantes que un cultivador de anturio comercial puede controlar.
Sin embargo, se sabe relativamente poco acerca de los requerimientos nutrimentales del
anturio (Higaki 1984). La fertilización de anturio crecido en cultivo sin suelo en los países
tropicales a menudo se realiza empíricamente.
Los métodos utilizados generalmente conducen al cultivador a sobre estimar las
necesidades de la planta y aplicar cantidades excesivas de nutrientes (Dufour y Guérin
2005). Por lo tanto, se pierden minerales y dinero, y hay un riesgo de contaminación de
las aguas subterráneas y las corrientes de agua. El ajuste del volumen de la solución
nutritiva y su composición, es el primer paso para mejorar el rendimiento de la flor, el uso
eficiente de los fertilizantes y la reducción de la contaminación. (Dufour y Guérin, 2005).
Las soluciones nutritivas que se utilizan para la producción de cultivos constan de seis

2
macronutrimentos esenciales: tres cationes (K+, Ca+2, Mg+2) y tres aniones (NO3-, H2PO4
-
y SO4-2), y en algunas soluciones NH4
+ en pequeñas concentraciones. Steiner en 1968
introdujo el concepto que se basa en la relación mutua que existe entre los aniones NO3-,
H2PO4- y SO4
-2, y los cationes K+, Ca+2, Mg+2 con los cuales se regula la solución nutritiva.
Tal relación no solo consiste en la cantidad absoluta de cada ión presente en la solución,
sino en la relación cuantitativa que guardan los iones entre sí, ya que de existir una relación
inadecuada entre ellos, puede disminuir el rendimiento (Steiner, 1968). La importancia
del balance iónico comienza cuando las plantas absorben los nutrimentos de la solución
nutritiva diferencialmente (Benton, 2015). La razón de esta variación se debe a las
diferentes necesidades de los cultivos especie y etapa de desarrollo y la diversidad de
condiciones ambientales.
El suministro de nutrientes es uno de los factores clave que afectan el crecimiento y
rendimiento de flores de anturio (Chang et al., 2010). El uso de soluciones nutritivas es
una opción viable que nos permite proporcionar al cultivo los nutrientes necesarios para
su óptimo desarrollo, sin embargo existen límites fisiológicos, que son los porcentajes
mínimos y máximos en que pueden presentarse los iones en la solución nutritiva, para que
la planta pueda absorberlos de acuerdo a su relación mutua específica. Si se rebasa estos
límites, la planta pudiese no tener los iones disponibles para absorberlos de acuerdo a sus
requerimientos específicos, resultando en una nutrición desbalanceada (Steiner 1984).
Además, la relación entre los aniones y cationes es de gran importancia, ya que de no
cuidar este aspecto, se pueden generar con relativa facilidad deficiencias de algún ion, por
lo que es importante no romper el balance entre ellos.
3
OBJETIVO GENERAL
Determinar el efecto de la modificación del balance de aniones y cationes en la solución
nutritiva en el cultivo de anturio en maceta.
Objetivos específicos
Identificar las soluciones nutritivas que contengan un balance de cationes y aniones
adecuado para el crecimiento y producción de flores de calidad de anturio en maceta.
Determinar si el efecto de la aplicación de aniones y cationes resulta adecuado para el
desarrollo de la planta y flores de anturio.
Hipótesis
El efecto de la modificación del balance de aniones y cationes en soluciones nutritivas
resultará en variaciones en el crecimiento de las plantas y en la calidad de flores de anturio
en maceta.
4
REVISIÓN DE LITERATURA
Solución nutritiva universal
Una solución nutritiva para sistemas hidropónicos es una solución acuosa que contiene
principalmente iones inorgánicos añadidos a partir de sales solubles de elementos
esenciales para plantas superiores. Algunos compuestos orgánicos tales como quelatos de
hierro pueden estar presentes. Las soluciones nutritivas más básicas consideran en su
composición sólo nitrógeno (N), fósforo (P), potasio (K+), calcio (Ca+2), magnesio (Mg+2)
y azufre (S) y se complementan con micronutrientes. Una característica importante de las
soluciones de nutrientes es que deben contener los iones en solución y en formas químicas
que pueden ser absorbidas por las plantas, por lo que en los sistemas hidropónicos la
productividad está estrechamente relacionada con la absorción de nutrientes y la
regulación del pH (Steiner, 1968). El pH es un parámetro que mide la acidez o alcalinidad
de una solución. Este valor indica la relación entre la concentración de iones libres H + y
OH- presentes en una solución y oscila entre 0 y 14, el cambio del pH de una solución
nutritiva afecta su composición, especiación y biodisponibilidad. El término "especiación"
indica la distribución de los elementos entre sus diversas formas químicas y físicas como:
iones libres, complejos solubles, quelatos, pares de iones, fases sólidas y gaseosas y
diferentes estados de oxidación (Trejo y Gómez, 2012). Los valores de pH adecuados de
la solución nutritiva para el desarrollo de los cultivos se encuentran en el rango de 5.5 y
6.5 (Marschner, 1995).
La concentración iónica total de una solución nutritiva determina el crecimiento, el
desarrollo y la producción de plantas (Steiner, 1961). La cantidad total de iones de sales
disueltas en la solución nutritiva resulta en una fuerza llamada presión osmótica (PO), que
es una propiedad coligativa de las soluciones nutritivas y es notoriamente dependiente de
la cantidad de solutos disueltos (Landowne, 2006). Una forma indirecta de estimar la
presión osmótica de la solución nutritiva es la conductividad eléctrica (CE), un índice de
concentración de sal que define la cantidad total de sales en solución. Por lo tanto, la CE
de la solución nutritiva es un buen indicador de la cantidad de iones disponibles para las
plantas en la zona de raíces (Nemali y Van Iersel, 2004).

5
La conductividad eléctrica ideal es específica para cada cultivo y depende de las
condiciones ambientales (Sonneveld y Voogt, 2009). Sin embargo, los valores de
conductividad eléctrica para sistemas hidropónicos oscilan entre 1.5 y 2.5 dS m (Trejo y
Gómez, 2012). La conductividad eléctrica más alta obstaculiza la absorción de nutrientes
al acrecentar la presión osmótica, mientras que una conductividad eléctrica más baja logra
afectar severamente la resistencia y el rendimiento de las plantas (Samarakoon et al.,
2006). La reducción en la absorción de agua está fuertemente y linealmente correlacionada
con la conductividad eléctrica. La composición nutritiva determina la conductividad
eléctrica y el potencial osmótico de la solución (Trejo y Gómez, 2012). .
Balance iónico en soluciones nutritivas.
El balance se refiere a la relación de un elemento con otro y sus formas en la planta,
pueden ser tan importantes como la concentración de cualquiera de los elementos en la
optimización del estado nutricional de la planta (Steiner, 1980). Existe un equilibrio crítico
entre los cationes K +, Ca+2 y Mg+2. Cuando no están en equilibrio, se produce el estrés en
la planta. Cuando el K+ es alto en comparación con Ca+2 o Mg+2, el primer efecto probable
es la deficiencia de Mg+2 (Benton, 2005). En algunos casos, el desequilibrio puede inducir
una deficiencia de Ca+2. Un desequilibrio entre estos tres cationes suele ser el resultado de
la fertilización excesiva de K+, ya que K+ es más fácilmente absorbido y transportado en
la planta que el Ca+2 o el Mg+2 (Benton, 2005). Este antagonismo es mayor entre K+ y
Mg+2 que entre K+ y Ca+2. A pesar de estas diferencias, debe tenerse cuidado de asegurar
que el equilibrio adecuado entre K+, Ca+2 y Mg+2 se mantenga de manera que no se
produzca una deficiencia inducida de cualquiera de estos dos elementos (Steiner, 1980).
Por ejemplo, para un mejor crecimiento y producción de fruta para el tomate, el contenido
de K+ y Ca+2 en hojas recientemente maduras debería ser aproximadamente el mismo
(Benton, 2005).
Steiner (1961) ha sugerido que sólo cierta cantidad de proporciones en la solución de
nutritiva son útiles. En el mejor de los casos, sólo una formulación sería suficiente para la
mayoría de las plantas mientras se mantenga el equilibrio iónico entre los elementos. La
solución nutritiva en que la mayoría de las plantas crecerán extremadamente bien debe
contar con el siguiente porcentaje de relaciones equivalentes de aniones y cationes: NO3-

6
, 50 a 70% de aniones; H2PO4-, 3 a 20% de aniones; SO4
-2, 25 a 40% de aniones; K+, 30 a
40% de cationes; Ca+2, 35 a 55% de cationes y Mg+2 15 a 30% de cationes.
La importancia del balance iónico comienza cuando las plantas absorben los nutrimentos
de la solución nutritiva diferencialmente (Benton, 1997). La razón de esta variación se
debe a las diferentes necesidades de los cultivos (especie y etapa de desarrollo) y la
diversidad de condiciones ambientales. La restricción de estos rangos, además de ser de
tipo fisiológico, es química, lo cual está determinado principalmente por la solubilidad de
los compuestos que se forman entre H2PO4- y Ca+2, y SO4
2- y Ca+2. El límite de solubilidad
del producto de los iones fosfato y calcio es de 2.2 mmol L-1, y del producto entre el sulfato
y el calcio, de 60 mmol L-1 (Steiner, 1984). Las plantas son selectivas al absorber
nutrimentos, lo cual significa que, a pesar de que la solución nutritiva tenga una relación
determinada entre aniones y/o cationes, las plantas no necesariamente las absorben en esa
misma proporción. La relación original entre iones en la solución nutritiva, en circuitos
cerrados, se modifica debido a la absorción selectiva de nutrimentos por las plantas:
generalmente se incrementan los SO4-2 respecto a los NO3, y el Ca+2 respecto al K+; sin
embargo, la modificación de la solución nutritiva no es siempre en el mismo sentido, ya
que depende también de las condiciones ambientales y de la etapa de desarrollo (Favela
et al., 2006).
La interacción de los nutrientes está influenciada por factores tales como la concentración,
la temperatura, la intensidad de la luz, la aireación , el pH, la arquitectura de la raíz, la tasa
de transpiración y respiración de la planta, la edad y la tasa de crecimiento de la planta.
La influencia neta de estas interacciones y procesos produce el rendimiento de un cultivo
(Fageria, 2001).
El ambiente influye más en la absorción de SO42- que en la de H2PO4
- y NO3-; mientras
que la absorción de Ca+2 la afecta en mayor medida que la de K+ y Mg+2, lo cual se debe
a los mecanismos de absorción de éstos últimos; el NO3-, el H2PO4
-, el K+, y en menor
proporción el Mg+2, las plantas los absorben en forma activa, lo que significa que invierten
energía metabólica. El desbalance entre los iones en la solución nutritiva puede ocasionar
antagonismo y/o precipitación entre algunos de ellos. La acumulación de SO42- favorece
la precipitación de Ca+2. El incremento de la acumulación de Ca+2 provoca la pérdida por
precipitación de SO4-2 y H2PO4
- (Favela et al., 2006).

7
La restricción del equilibrio iónico es la razón principal de la imposibilidad de añadir un
solo elemento a la solución nutritiva o al sustrato en crecimiento sin añadir o agotar otros
iones (Kläring, 2001). El reconocimiento de la importancia del balance de nutrientes en
la producción de cultivos es una referencia indirecta de la contribución de las interacciones
al rendimiento. Los rendimientos más altos se obtienen cuando el nutriente y otros factores
de crecimiento están en un estado favorable de equilibrio. A medida que uno se aleja de
este estado de equilibrio, los antagonismos de los nutrientes se reflejan, con rendimientos
reducidos. Las interacciones antagonistas y sinérgicas están determinadas por el nivel de
cada nutriente en la solución nutritiva, por las diferencias entre las especies vegetales e
incluso entre los cultivares de la misma especie. Además, las propiedades físicas, químicas
y biológicas del suelo o sustrato también cambian los patrones de interacción de los
nutrientes en las plantas (Fageria, 2001).
La calidad y la cantidad de fertilizantes aplicados son factores claves que afectan el
crecimiento, rendimiento y calidad de la flor de corte de anturio (Dufour y Gueırin, 2005).
Sin embargo, el cultivo intensivo de los cultivos normalmente implica una alta tasa de
aplicación de nutrientes. La cantidad de fertilizante que se lixivia del suelo afecta la
calidad tanto del medio ambiente como de la salud humana (Otero et al., 2005; Schröder
y Neeteson, 2008). Mantener la productividad y reducir la aplicación de fertilizantes
químicos es cada vez más importante para los cultivadores de flores.
Necesidades nutrimentales de Anthurium andreanum Lind.
Se han realizado diversos estudios con el objetivo de determinar las necesidades
nutrimentales del cultivo de anturio, por ejemplo al evaluar la influencia de diversas
concentraciones de nitrógeno (N) sobre el crecimiento y la absorción de nutrientes de
anturio cultivado en fibra de coco bajo diferentes condiciones estacionales. Los
tratamientos consistieron en cuatro niveles de concentración de N 79 mg L-1; 105 L-1
(control), 158 mg L-1 y 210 mg L-1 (Chang, 2012). Todos los tratamientos contenían la
misma concentración de P, K, Ca, Mg, S, Fe, Cu, Zn, Mo y B. Los resultados muestran
que las plantas de anturio tratado con 79 mg L-1 de N fueron insuficientes para el
crecimiento y rendimiento de anturio. La elevada tasa de aplicación de N (210 mg L-1)

8
también retardó el crecimiento de anturio y el rendimiento de la flor. La concentración de
N en el tratamiento de 210 mg L-1 fue el más alto, aunque el K+ y las concentraciones de
Mg+2 en estas plantas fueron las más bajas entre todos los tratamientos esto puede
atribuirse al efecto antagonista entre N y K o entre N y Mg. Las plantas tratadas con 158
mg L-1 de N produjeron una flor de corte más comercializable en comparación con las
plantas tratadas con 105 mg L-1 de N (Chang, 2012).
Higaki et al. (1992), determinaron los niveles óptimos de fertilizante de N, P y K para la
producción de flores de anturio en Hawaii. La producción óptima de flores se logró a
312N-448P-375K kg-1 ha-1 año. Una mayor aplicación de N y K dio lugar a un aumento
lineal en el tamaño de la flor. La longitud del tallo de la flor también aumentó con el
aumento de las tasas de N, P y K. El rendimiento máximo de la flor se produjo cuando los
niveles de tejido foliar fueron de 1.87% de N, 0.17% de P y 2.07% de K. La longitud del
tallo y el tamaño de la flor fueron máximos con N de hoja en 1.59% y 1.67% y K en
2.20%, respectivamente. No se observó relación entre el porcentaje de P en hoja, el tamaño
de la flor o la longitud del tallo.
Dufour y Guérin (2003), evaluaron el crecimiento, características de desarrollo y
producción de flores de Anthurium andreanum y para ello utilizaron plántulas cultivadas
in vitro del cv 'Cancan' en contenedores de 2.5 L rellenos con un sustrato compuesto de 1:
2 (v: v) de astillas de madera compostadas y grava volcánica de 5-15 mm. La solución
nutritiva fue suministrada con un sistema automatizado de riego por goteo. La
composición media de la solución fue: macronutrientes (mg L-1): NO3-N: 84; NH4
+-N: 21;
P: 46.5; K: 117; Ca: 60; Mg: 28.8. Micronutrients (mg L-1): Zn: 0.2; Mn: 0.5; Cu: 0.06;
B: 0.3; Mo: 0.2; Fe: 0.7; pH: 5.8; EC: 1.1 mS cm-1. Se encontró que el desarrollo de A.
andreanum comienza con una fase vegetativa monopodial seguida por un crecimiento
simpodial reproductivo. Además de que en condiciones tropicales, el desarrollo de A.
andreanum parece ser más regular que en condiciones templadas.
El desarrollo y rendimiento de Anthurium andreanum fueron evaluados con la aplicación
de la solución nutritiva que contenía 8.9 mmol N y 3.2 mmol K con una relación N-NH4+
/ N-NO3- de 0.37 y dio como resultado un período vegetativo más corto y una producción
de flores más grande (Dufour y Guerin, 2003). La solución nutritiva que tuvo la mejor
eficiencia en el uso de nutrientes fue N: K: Ca (1: 1: 0.5) en la fase vegetativa y N: K: Ca

9
(1: 1: 1) en la fase reproductiva. Las plantas del tratamiento N: K: Ca (1: 1: 0.5)
aparentemente pudieron almacenar más nutrientes durante la fase vegetativa. A partir de
los datos del análisis de la planta del tratamiento N: K: Ca (1: 1: 0.5) (que dio el mejor
rendimiento) se proponen dos composiciones diferentes de solución nutritiva, todas en
mmol L-1 (Dufour y Guerin, 2003):
1.-El primero se debe utilizar durante el período vegetativo cuando la planta crea su raíz
y más de una cuarta parte de su área foliar final su composición es: 2.5N-NH; 5.0N-NO3;
1.0 P; 5.3K; 2.6Ca; 2.1Mg.
2.-Para el período de producción, contiene menos P y K que el primero porque las plantas
en la fase reproductiva tienen una tasa menor de P y K: 2.5N- NH4+; 5.0 N- NO-
3; 0.5P;
3.5K; 2.6Ca; 2.1Mg.
Teniendo en cuenta la nutrición de Anthurium andreanum, un suministro insuficiente de
N y K pueden reducir severamente y retrasar el crecimiento, aumentar la longitud de la
fase vegetativa, y reducir el rendimiento. Además, las flores producidas son de peor
calidad. (Dufour y Guérin, 2005). Una concentración de 8.9 mmol N L-1 de solución
nutritiva es suficiente para un buen rendimiento y calidad de la flor. En cuanto a los
análisis de minerales, esta concentración podría incluso reducirse a 7.5 mmol L-1. Por otra
parte, el suministro de K debe ser alto, especialmente durante la fase reproductiva, cuando
hay una exportación intensiva de hojas maduras a flores y hojas jóvenes debido a la gran
producción de hojas y flores. Los resultados mostraron que un aumento en la
concentración de amonio en la solución nutritiva hasta al menos 1/3 del N total mejora el
crecimiento, desarrollo y rendimiento de la planta. Las macetas de 2.5 L rellenas con un
substrato que constaba de 5-15 mm de grava volcánica y virutas de madera compostadas
y desinfectadas (2:1 v / v) (Dufour y Guérin, 2005).
Kleiber y Komosa en 2006 investigaron la diferenciación del contenido de
macroelementos en la solución de nutrientes y en el agua lixiviada sobre el crecimiento
de anturio. Las plantas se cultivaron en arcilla expandida con la aplicación de
fertirrigación con una solución nutritiva estándar que contenía en mg dm3: N-NH4<14.0,
N-NO3 105.0, P 31.0,K 176.0, Ca 60.0, Mg 24.0, S-SO48.0, Fe 0.840, Mn 0.160, Zn 0.200,

10
B 0.220, Cu 0.032, Mo 0.048, pH 5.5–5.7, EC 1.5–1.8 mS·cm. La solución nutritiva se
distribuyó por líneas de riego por goteo con emisores situados cada 20 cm. La frecuencia
y el tiempo de fertirrigación dependían de la estación del año. En verano, la fertirrigación
se aplicó 6-8 veces al día, suministrando 4-5 dm3 de nutrientes por 1 m. En invierno, el
procedimiento se repitió 2-3 veces al día y 2-3 dm se aplicaron.
Posteriormente Kleiber y Komosa en 2010 realizaron la determinación de valores guía
para macro y microelementos, el estudio se realizó por tres años en dos granjas
comerciales donde usan una solución nutritiva estándar en fertirrigación por goteo. Los
valores guía se determinaron en las partes índice de las plantas, que estaban
completamente desarrolladas, hojas, después de cortar las flores. Los valores guía
incluyen +/- 10% de desviación de la media en el contenido de un nutriente. Se realizaron
estudios en 6 cultivares: Barón, Choco, Midori, Pistache, Presidente y Tropical. Los
valores medios de 6 cultivares sobre valores guía para Anthurium cultorum Birdsey fueron
(% en d.m): N 1.40-1.70, P 0.30-0.40, K 3.60-4.50, Ca 1.40-1.80, Mg 0.20-0.30, S 0.30-
0.40, y (ppm en d.m) Fe 46.0 – 60.0, Mn 35.0 – 47.0, Zn 54.0 - 72.0, Cu 5.10 – 6.50, B
64.0 - 83.0. También se establecieron valores guía para cv. 'Barón', 'Chocó', 'Midori',
Pistache, Presidente y Tropical. La variación varietal se muestra en relación a algunos
nutrientes. Cultivares 'Tropical' y 'Choco' se caracterizan por altas gamas de contenido de
potasio de 3.80-4.70% y 3.70-4.60% de K, espectacularmente, 'Barón' y 'Presidente' tienen
altos rangos de calcio de 1.50-1.90% y 1.50%-2.00% Ca, respectivamente. Cultivar
'Baron' exhibe altos contenidos de hierro que asciende a 52.4-67.0 ppm, 'Choco'
manganeso 49.0-64.0 ppm y de cobre 5,60-7,20 ppm, 'Midori' zinc 60.0-80.0 ppm,
mientras que 'Pistache' boro 69.0-88.0 ppm. Los valores guía obtenidos permitieron
modificar evaluación del estado nutricional de las plantas, así como la optimización del
composición de soluciones nutritivas para un determinado cultivar.
En seguida Kleiber y Komosa en 2010, determinaron el contenido de microelementos,
(Fe, Mn, Zn, Cu y B) en cultivares de anturio más populares cultivados en Polonia
(Anthurium cultorum Birdsey) como Baron, Choco, Midori, Pistache, Presidente y
Tropical, crecidos en arcilla expandida. Se utilizó fertirrigación por goteo. Se encontró un
efecto significativo por el cultivar y la edad de las plantas producidas sobre el contenido
de hierro, manganeso, zinc, cobre y boro en hojas de anturio, además que el contenido

11
medio de microelementos en los cultivares analizados fue en el rango para Fe 51.8-54.6,
Mn 41.1-1586, Zn 43.2–82.8, Cu 5.35–6.29, B 73.3–73.9 kg-1 dm en las partes
indicadoras. El contenido más alto de hierro en las partes indicadoras de la planta se
encontró en el cultivar Baron; Manganeso y cobre mostraron el mayor valor en cv. Choco.
El contenido de zinc fue el más alto en cv. Midori mientras que el contenido de boro fue
el más alto en cv. Pistacho. El cobre mostró ser el componente con la menor variabilidad
(CV 15.4%-24.3%); el boro fue moderadamente variable (CV 20.9-26.7%); el hierro
también se caracterizó por un valor medio de variabilidad (CV 25.1-31.4%), mientras Zinc
(CV 39.7-44.7%) y manganeso (cv 40.4-58.5%) mostraron la mayor variabilidad.
Estudios recientes se centran en el efecto de la conductividad eléctrica (EC) en el
crecimiento y producción de flores de anturio para ello se utilizaron dos variedades de
anturio (Reina Roja y Elizabeth) en condiciones de invernadero utilizando peat moss como
sustrato y dos tipos de agua, el primero tipo fue agua destilada y agua de grifo a la que se
agregaron algunas sales de fertilizante compuesto por N:P:K con 1:0.5:1.5 para crear
diferentes niveles de conductividad eléctrica (0-1 – 1.5-2 ds m-1). Los resultados
mostraron que cuando la CE se incrementó por encima de 1 ds m-1, el crecimiento de la
planta disminuyó incluyendo el número de flores y hojas. La conductividad eléctrica tiene
un efecto sobre la productividad de anturio. Esto era cierto en los dos cultivares
estudiados. Se observó que cuando el nivel de conductividad eléctrica se extendió hasta 1
ds m-1, aumentó el número de flores (número de racimos de flores), hojas y diámetro de
los grupos de flores. Sin embargo, disminuyeron cuando los niveles de conductividad
eléctrica aumentaron más de 1 ds m-1. Los resultados también mostraron que la
productividad de los dos cultivares fue mejor cuando se utilizó agua del grifo que el agua
destilada y se registraron los valores más altos de los parámetros anteriores en EC = 1 ds
m-1en el cultivar Elisabeth en número de racimos de flores y diámetro de racimos de flores
(Mohammad et al., 2016).

12
ARTÍCULO I
Response of potted anthurium (Anthurium andreanum Lind) plants to the ionic
balance in the nutrient solution: K+ : Ca+2 : Mg+2

13
Response of potted anthurium (Anthurium andreanum Lind) plants to the ionic
balance in the nutrient solution: K+ : Ca+2 : Mg+2
Sosa-Flores Viviana P.1; Valdez-Aguilar Luis A.1§; Cartmill, Donita2, Cartmill, Andrew
D.2, Benavides-Mendoza, Adalberto1
1Departamento de Horticultura. Universidad Autónoma Agraria Antonio Narro. Calzada
Antonio Narro 1923, Saltillo, Coah., México
2School of Agriculture, University of Wisconsin–Platteville, 1 University Plaza,
Platteville, WI 53818
CONTACT: Luis A. Valdez-Aguilar email: [email protected] Address:
Departamento de Horticultura, Universidad Autónoma Agraria Antonio Narro, Saltillo,
Coah., México
Abstract
The climatic conditions of the humid tropical areas of México allow the year-round
production of cut flowers and potted plants of anthurium. However, there is scarce basic
and applied research on tropical ornamental species, limiting the development of
technology to increase their productivity and quality. The present study was designed to
determine the effect of varying proportions of cations (K+, Ca+2, Mg+2) and anions (NO3-
, H2PO4- and SO4
-2) on the growth and nutrient status of potted anthurium plants. In this
paper we are reporting the information as to the effect of the proportions of K+, Ca+2, Mg+2
in the nutrient solution on plant growth responses Using mixture analysis and response

14
surface methodology. Response surface analysis detected that spathe and leaf areas
decreased when fed with solutions of high proportions of Mg+2. Total shoot and root fresh
weight, as well as total dry weight and root volume, also demonstrated the deleterious
effects of high Mg+2 ratios. In general, considering all the parameters measured, the best
growth of anthurium plants was obtained in two areas of the explored space; one area was
high in Ca+2, with optimum ranges from 0.24 – 0.44 for K+, 0.54 – 0.68 for Ca+2, and 0.01
– 0.08 for Mg+2, and another area that was high in K+, on which the optimum ranges were
0.54 – 0.65 for K+, 0.25 – 0.29 for Ca+2, and 0.10 – 0.21 for Mg+2. Shoot and root K+, Ca+2
and Mg+2 concentration was significantly affected by the cation ratios, however, there was
not a clear tendency as to the effect of each cation in the mixture; nonetheless, the internal
K+ : Ca+2 : Mg+2 ratios were affected by the external ratios, as in the shoot they were
located in a very specific area, indicating that anthurium plants accumulated more Mg+2
compared to what it is in the external solution, whereas Ca+2 ratio was lower than that of
the external solution. As for K+, plants accumulated it at high rates regardless of the
external balance. In conclusion, the optimum nutrient solutions for anthurium may contain
very wide ratios of K+ as long Ca+2 and Mg+2 are maintained at low proportions.
Keywords: Universal nutrient solution, mineral plant nutrition, ornamental plants, cation
balance.
Introduction
Anthurium is one of the most important potted plants cultivated worldwide, however,
compared to other tropical ornamental species, the cultivation of anthurium is still limited.
The climatic conditions of the humid tropical areas of México allow the year-round

15
cultivation of both, cut flowers and potted anthurium plants. However, there is scarce basic
and applied research on tropical ornamental species limiting the development of
technology to increase their productivity and quality (Hernández, 2005). High
productivity and quality are markedly affected by the nutrient status of ornamental plants;
Dudour and Guerín (2005) stated that the knowledge of nutrient requirements by
anthurium is an essential factor as growers usually overestimate plant demands, which in
turn leads to excessive application of fertilizers, low nutrient use efficiency,
environmental pollution and decreased profitability.
According to the principles of the universal nutrient solution by Steiner (1968), the total
concentration as well as the ionic balance is of outmost importance in delineating an
optimal nutritional program of soilless cultivated plants. The mutual relations of cations
(potassium [K+,], calcium [Ca+2] and magnesium [Mg+2]) is a key factor for plant growth
as an unbalanced combination may conduct to a decrease in biomass and yield due to
antagonistic relationships among these cations, as reported by Jakobsen (1993) and Ding
et al. (2006).
Anthurium is a species that demands a complete fertilization program even though it does
not tolerate high concentrations of salts. Özçelik, and Özkan (2000) reported that
anthurium is sensitive to an electrical conductivity (EC) higher than 1.0 to 1.5 dS m-1,
whereas Sonneveld and Voogt (1983, 1992) reported that it is very sensitive to salinity,
with a 22% decrease in growth in response to high EC. Nonetheless, no studies have been
performed to elucidate in anthurium the effect of the cation and anion balance in the
nutrient solution, which it should be specially considered in potted anthurium as it is
cultivated in a soilless medium.

16
The importance of the ionic balance is due to the facts that 1) plants differentially uptake
the nutrients diluted in the medium or nutrient solution (Benton, 2005), 2) the specific
needs depend on the developmental stage and environmental conditions on which each
plant species is growing. The present study was designed to determine the effect of
varying proportions of cations (K+, Ca+2, Mg+2) and anions (NO3-, H2PO4
- and SO4-2) on
the growth and nutrient status of potted anthurium plants. In this paper we are reporting
the information as to the effect of the proportions of K+, Ca+2, Mg+2 in the nutrient
solution.
Materials y methods
Cultural conditions and plant material. The experiment was conducted in a greenhouse
with temperature and relative humidity control located at the Universidad Autónoma
Agraria Antonio Narro, in Saltillo, Coah., México (25° 21’ 24.37” North Latitude, 101°
02’ 05.45” West Longitude, 1762 m above sea level). Environmental conditions
throughout the study were monitored with a data logger (Watch Dog 1000 Series,
Spectrum Tecnologies, Inc. Aurora, Illinois). Average temperature was 20 °C (maximum
31.5 °C, minimum 13.5 °C) and average relative humidity was 66% ± 20%. A black screen
was installed on the roof of the experimental site to provide a 50% shade, which render
an average photosynthetically active radiation of 177 µmol m2 s-1.
The growing medium consisted of a 1:1 mixture of sphagnum peat (PREMIER, Premier
Tech, Home and Garden. Toronto, Canada) (pH = 4.0-4.3, C.E = 0.25 dS m-1) and
horticultural-grade perlite (33% water capacity retention, 64% pore space with air, 0.25
g·cm-3 apparent density). The mixture was adjusted to a pH of 6.3 using sodium
bicarbonate prior placement in 15.2 cm pots. Anthurium (cv. Tropical) 12-15 cm plants

17
with 2-3 young leaves were used for this study. Transplant was performed on 17 Oct. 2014
and harvest on 20 Oct. 2015.
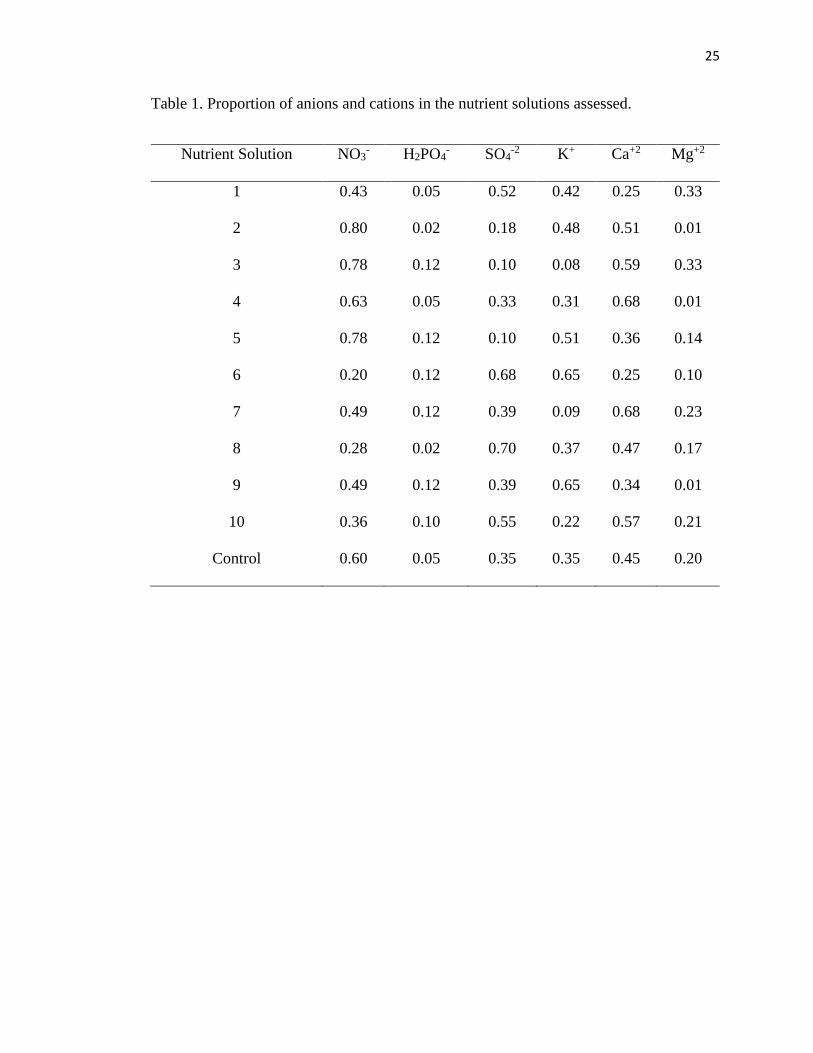
Nutrient solutions. The treatments consisted of 10 nutrient solutions whose total sum of
anions and cations was 20 meq L-1 each. The nutrient solutions were randomly selected
using Design Expert v. 9.0 (Company Stat Ease, Inc. Minneapolis, Minnesota) (Table 1).
The pH of the nutrient solutions was held from 5.5 to 6.0 and EC was 2.0 dS m-1. The
limits for K+ proportion in the nutrient solutions ranged from 0.08 to 0.65, whereas for
Ca+2 and Mg+2 were 0.25 to 0.68 and 0.01 to 0.33, respectively (Fig. 1). As a control
treatment, we included a nutrient solution with Steiner´s formulation (Steiner, 1973)
containing (in meq L-1): 12 NO3-, 1 H2PO4
-, 7 SO4-2, 9 de Ca+2, 7 K+, and 4 Mg+2.
Micronutrients in all the nutrient solutions were provided at the following concentrations:
4 ppm Fe-EDTA, 2 ppm Mn-EDTA, 0.37 ppm B, 0.32 ppm Zn-EDTA, 0.16 ppm Cu-
EDTA, and 0.11 ppm Mo. Plants were manually irrigated when needed maintaining a
leaching fraction of 30%.
Assessment of plant growth and nutrient status. At harvest, plants were separated into root
and shoot and washed with deionized water. Leaf and spathe areas were measured with
an Area Meter (Model LI-3100C, LI-COR Inc. Nebraska, USA). The length of the
flowering stem from all the flowers was also measured. Root volume was determined by
measuring water displacement in a graduated cylinder. After harvest, fresh shoot and root
weight was measured in all the plants. To determine the dry weight, shoots and roots were
placed in an oven at 70°C until constant weight was obtained. Dry tissues were weighed
and then digested in a 2:1 mixture of H2SO4:HClO4 plus 2 ml of 30 % H2O2 prior mineral
analysis. Mineral analysis included K+, Ca+2 and Mg+2 using inductively coupled plasma
emission spectrometer (ICP-AES, model Liberty; VARIAN, Santa Clara, CA).
18
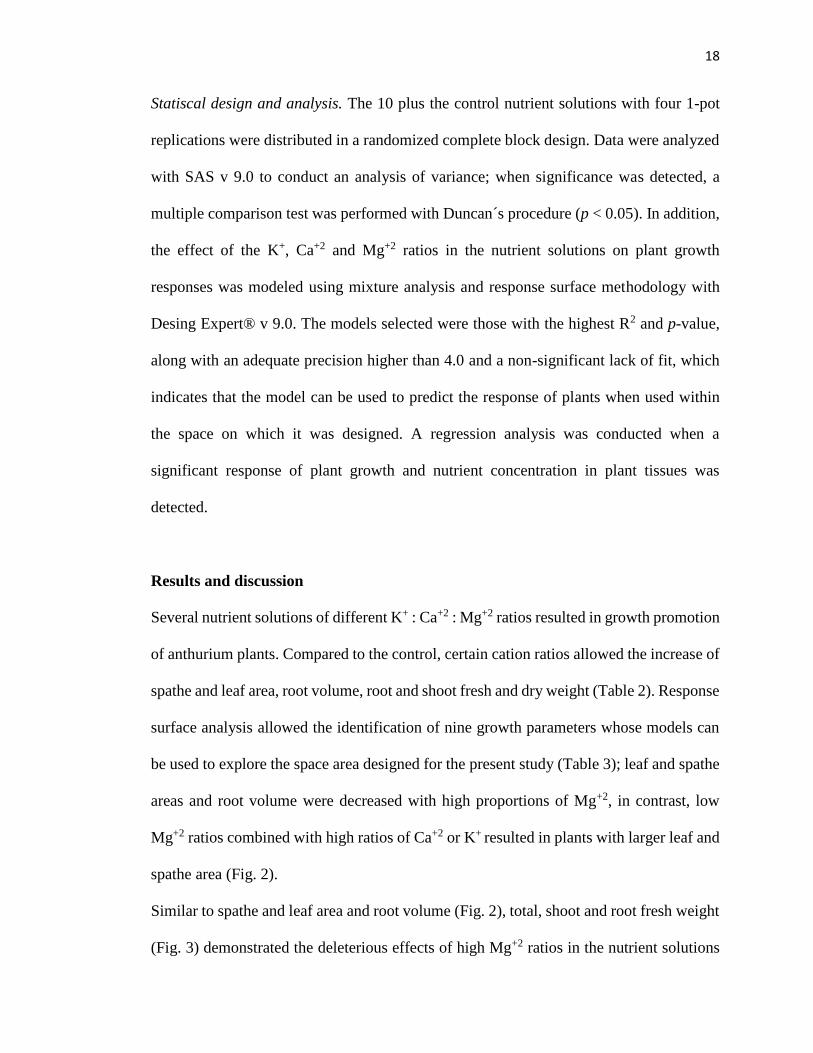
Statiscal design and analysis. The 10 plus the control nutrient solutions with four 1-pot
replications were distributed in a randomized complete block design. Data were analyzed
with SAS v 9.0 to conduct an analysis of variance; when significance was detected, a
multiple comparison test was performed with Duncan´s procedure (p < 0.05). In addition,
the effect of the K+, Ca+2 and Mg+2 ratios in the nutrient solutions on plant growth
responses was modeled using mixture analysis and response surface methodology with
Desing Expert® v 9.0. The models selected were those with the highest R2 and p-value,
along with an adequate precision higher than 4.0 and a non-significant lack of fit, which
indicates that the model can be used to predict the response of plants when used within
the space on which it was designed. A regression analysis was conducted when a
significant response of plant growth and nutrient concentration in plant tissues was
detected.
Results and discussion
Several nutrient solutions of different K+ : Ca+2 : Mg+2 ratios resulted in growth promotion
of anthurium plants. Compared to the control, certain cation ratios allowed the increase of
spathe and leaf area, root volume, root and shoot fresh and dry weight (Table 2). Response
surface analysis allowed the identification of nine growth parameters whose models can
be used to explore the space area designed for the present study (Table 3); leaf and spathe
areas and root volume were decreased with high proportions of Mg+2, in contrast, low
Mg+2 ratios combined with high ratios of Ca+2 or K+ resulted in plants with larger leaf and
spathe area (Fig. 2).
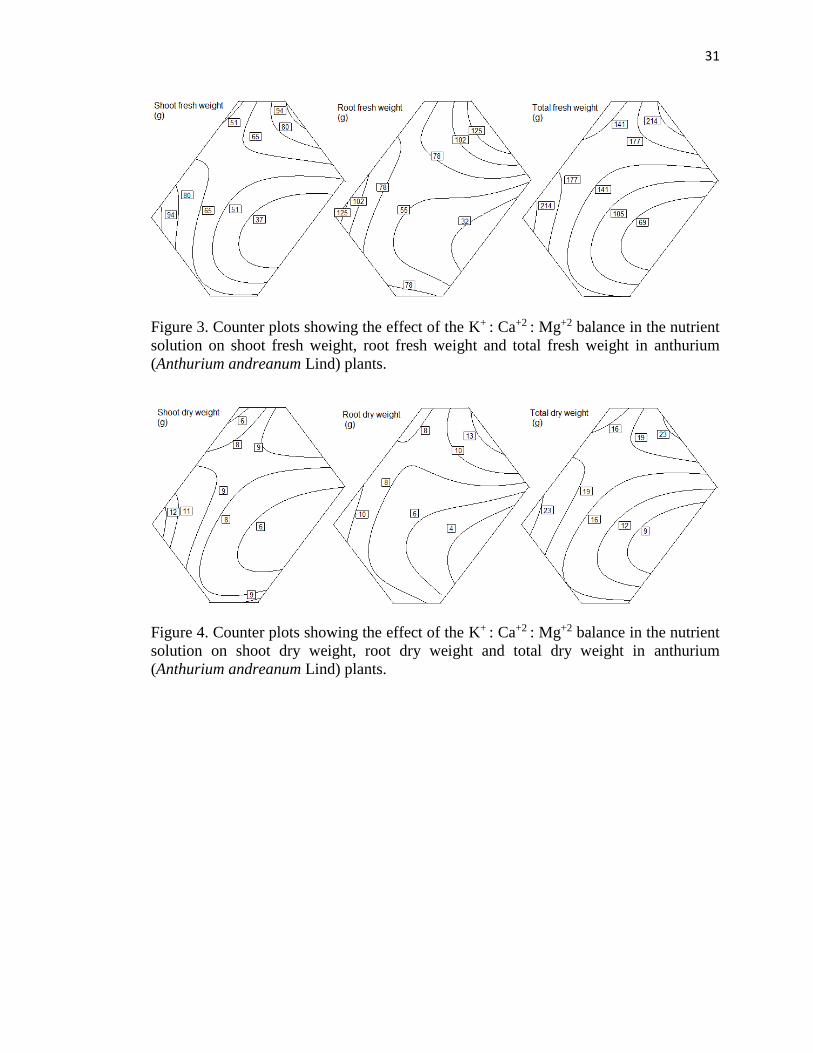
Similar to spathe and leaf area and root volume (Fig. 2), total, shoot and root fresh weight
(Fig. 3) demonstrated the deleterious effects of high Mg+2 ratios in the nutrient solutions
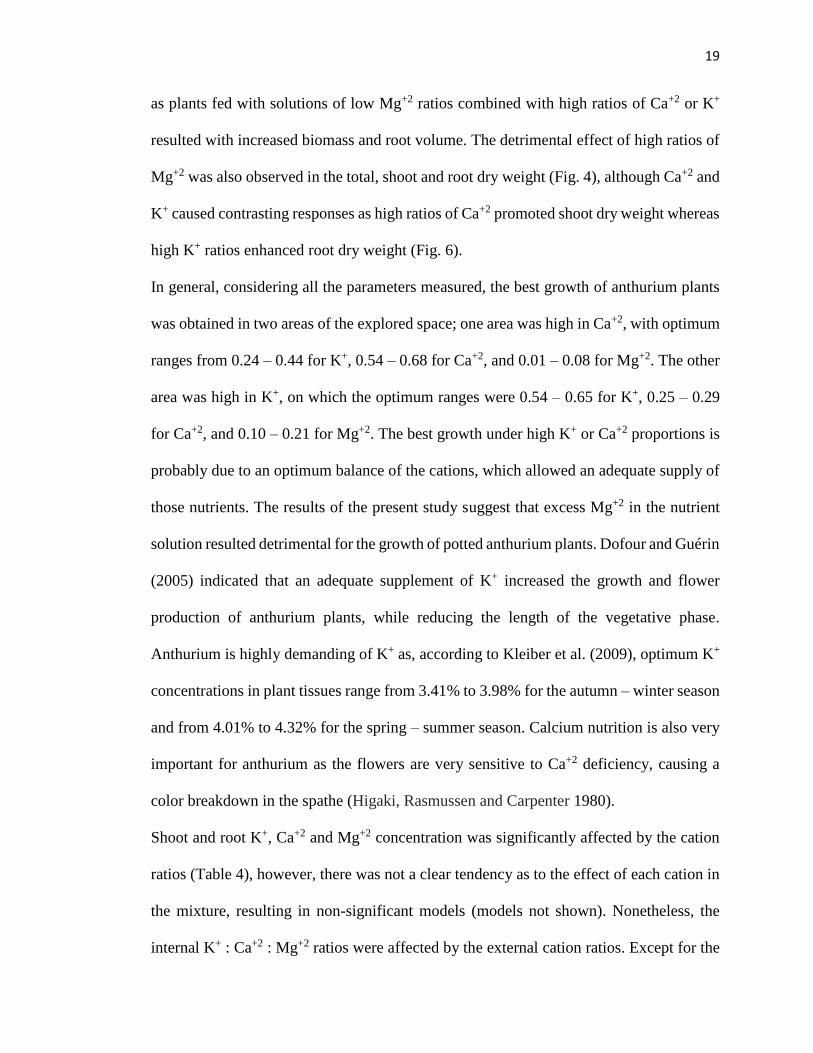
19
as plants fed with solutions of low Mg+2 ratios combined with high ratios of Ca+2 or K+
resulted with increased biomass and root volume. The detrimental effect of high ratios of
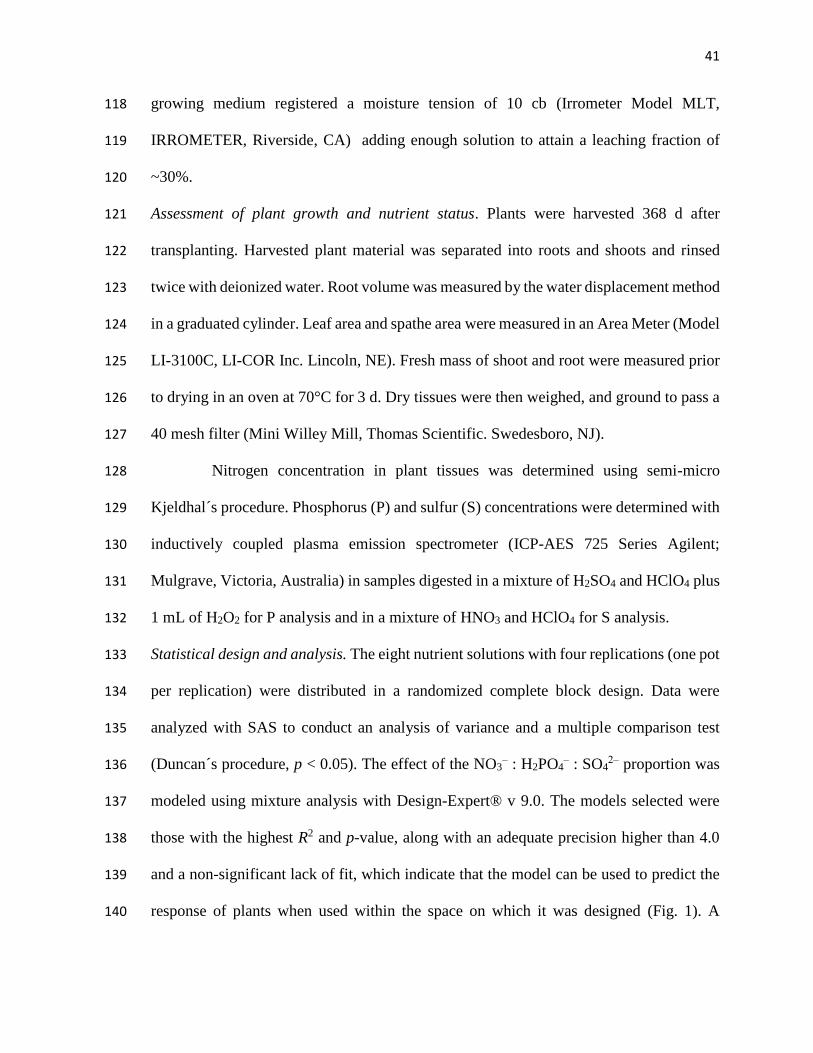
Mg+2 was also observed in the total, shoot and root dry weight (Fig. 4), although Ca+2 and
K+ caused contrasting responses as high ratios of Ca+2 promoted shoot dry weight whereas
high K+ ratios enhanced root dry weight (Fig. 6).
In general, considering all the parameters measured, the best growth of anthurium plants
was obtained in two areas of the explored space; one area was high in Ca+2, with optimum
ranges from 0.24 – 0.44 for K+, 0.54 – 0.68 for Ca+2, and 0.01 – 0.08 for Mg+2. The other
area was high in K+, on which the optimum ranges were 0.54 – 0.65 for K+, 0.25 – 0.29
for Ca+2, and 0.10 – 0.21 for Mg+2. The best growth under high K+ or Ca+2 proportions is
probably due to an optimum balance of the cations, which allowed an adequate supply of
those nutrients. The results of the present study suggest that excess Mg+2 in the nutrient
solution resulted detrimental for the growth of potted anthurium plants. Dofour and Guérin
(2005) indicated that an adequate supplement of K+ increased the growth and flower
production of anthurium plants, while reducing the length of the vegetative phase.
Anthurium is highly demanding of K+ as, according to Kleiber et al. (2009), optimum K+
concentrations in plant tissues range from 3.41% to 3.98% for the autumn – winter season
and from 4.01% to 4.32% for the spring – summer season. Calcium nutrition is also very
important for anthurium as the flowers are very sensitive to Ca+2 deficiency, causing a
color breakdown in the spathe (Higaki, Rasmussen and Carpenter 1980).
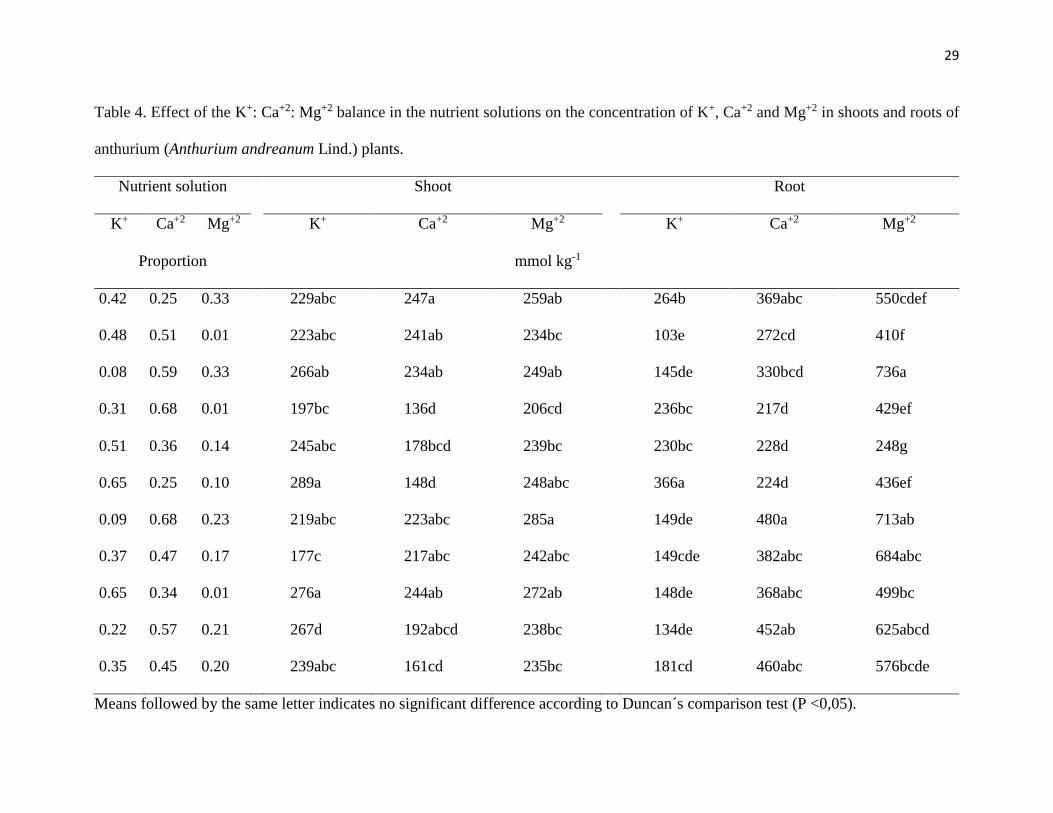
Shoot and root K+, Ca+2 and Mg+2 concentration was significantly affected by the cation
ratios (Table 4), however, there was not a clear tendency as to the effect of each cation in
the mixture, resulting in non-significant models (models not shown). Nonetheless, the
internal K+ : Ca+2 : Mg+2 ratios were affected by the external cation ratios. Except for the

20
plants fed with the 0.22 : 0.57 : 0.21 ratio, all the internal ratios in the shoot were located
in a very specific area (Fig. 5), indicating that anthurium plants regulate the accumulation
of cations according to its demands. Steiner (1973) reported similar trends in tomato
(Solanum lycopersicum L.) plants, concluding that this species have a strong selective
capacity for cations and anions uptake in a given ratio, regardless of the ratio in the nutrient
solution. The location of the area for the internal cation ratio suggests that anthurium
plants were highly selective for Mg+2 uptake as the internal ration was higher than that of
the external solution (Fig. 5). Anthurium plants showed a high selectivity for K+ uptake
as it was accumulated at high rates regardless of the external balance (Fig. 5). In contrast,
anthurium was selective for Ca+2 exclusion as suggested by the lower internal ratio
compared to that of the external solution (Fig. 5).
In the roots, anthurium plants also exhibited a high selectivity to exclude the uptake of
Mg+2 and Ca+2, however, in contrast to the shoot, there was a broad K+ internal ratio,
which was similar to that of the external solutions (Fig. 5). This differential response in
the roots may be due to the accumulation of the nutrient solution in the empty lumen of
the non-living velamen cells, a tissue specialized in water conservation in epiphytic
species (Higaki, Rasmussen and Carpenter, 1984).
The antagonism between K+, Ca+2 and Mg+2 has been well documented (Jakobsen, 1993;
Ding, Luo and Xu 2006). Similarly, in anthurium, Chang et al. (2010) reported results
indicating that, at a whole plant level, increasing K+ was associated with a decrease in
Ca+2, while increasing Ca+2 reduced that of Mg+2, confirming the antagonism between
these cations. However, the authors also presented results that did not suggest an
antagonistic relation between K+ and Mg+2 as the concentration of both tended to increase
(Chang et al., 2010). Similar results were reported by Kleiber et al. (2009) in a study
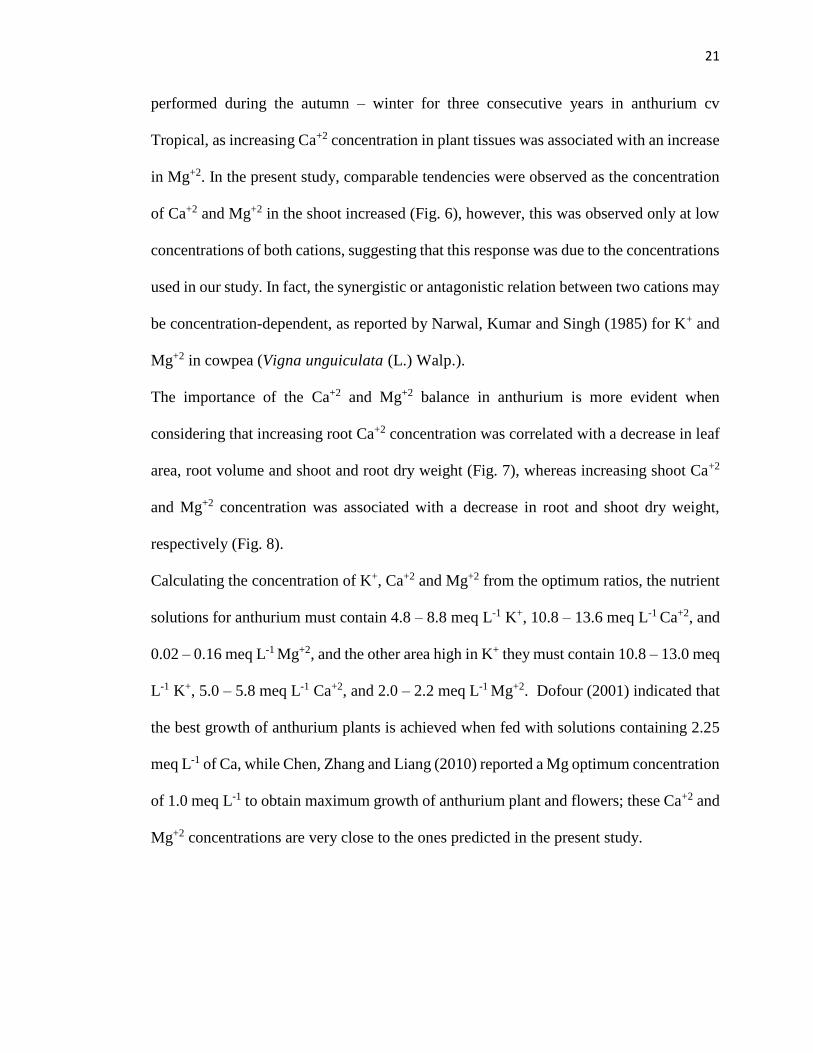
21
performed during the autumn – winter for three consecutive years in anthurium cv
Tropical, as increasing Ca+2 concentration in plant tissues was associated with an increase
in Mg+2. In the present study, comparable tendencies were observed as the concentration
of Ca+2 and Mg+2 in the shoot increased (Fig. 6), however, this was observed only at low
concentrations of both cations, suggesting that this response was due to the concentrations
used in our study. In fact, the synergistic or antagonistic relation between two cations may
be concentration-dependent, as reported by Narwal, Kumar and Singh (1985) for K+ and
Mg+2 in cowpea (Vigna unguiculata (L.) Walp.).
The importance of the Ca+2 and Mg+2 balance in anthurium is more evident when
considering that increasing root Ca+2 concentration was correlated with a decrease in leaf
area, root volume and shoot and root dry weight (Fig. 7), whereas increasing shoot Ca+2
and Mg+2 concentration was associated with a decrease in root and shoot dry weight,
respectively (Fig. 8).
Calculating the concentration of K+, Ca+2 and Mg+2 from the optimum ratios, the nutrient
solutions for anthurium must contain 4.8 – 8.8 meq L-1 K+, 10.8 – 13.6 meq L-1 Ca+2, and
0.02 – 0.16 meq L-1 Mg+2, and the other area high in K+ they must contain 10.8 – 13.0 meq
L-1 K+, 5.0 – 5.8 meq L-1 Ca+2, and 2.0 – 2.2 meq L-1 Mg+2. Dofour (2001) indicated that
the best growth of anthurium plants is achieved when fed with solutions containing 2.25
meq L-1 of Ca, while Chen, Zhang and Liang (2010) reported a Mg optimum concentration
of 1.0 meq L-1 to obtain maximum growth of anthurium plant and flowers; these Ca+2 and
Mg+2 concentrations are very close to the ones predicted in the present study.

22
Conclusions
The best nutrient solutions for anthurium may contain very wide ratios of K+ as long as
Ca+2 and Mg+2 are maintained at low proportions. Regardless of the K+ : Ca+2 : Mg+2 ratios
in the nutrient solution, anthurium plants regulated the accumulation of these cations,
achieving similar ratios in the shoot tissues, so that, even though Ca+2 ratio may be high
and Mg+2 may be low in the nutrient solutions, the plants tended to accumulate less Ca+2
but more Mg+2. Excess accumulation of Ca+2 and Mg+2 resulted in decreased growth.
References
Benton, J.J. 2005. Hydroponics : a practical guide for the soilless grower, Second edi. ed,
Statewide Agricultural Land Use Baseline 2015. CRC Press, United States of
America. doi:10.1017/CBO9781107415324.004
Chang, K.H., R.Y. Wu, K.C. Chuang, T.F. Hsieh, and R.S. Chung. 2010. Effects of
chemical and organic fertilizers on the growth, flower quality and nutrient uptake
of Anthurium andreanum, cultivated for cut flower production. Scientia
Horticulturae, 125(3), 434–441.
Chen, S.W., Z. S., Zhang, and J. N. Liang. 2010. Effects of magnesium on plant
morphology and physiological characteristics of Anthurium
andraeanum. Guangdong Agricultural Sciences 11: 40.
Ding, Y., W. Luo, and G. Xu. 2006. Characterisation of magnesium nutrition and
interaction of magnesium and potassium in rice. Annals of Applied Biology 149:
111–123.

23
Dufour, L. 2001. Optimization of Anthurium andreanum mineral nutrition in soilless
culture under tropical conditions. Plant Nutrition (pp. 784–785). 10.1007/0-306-
47624-X_381
Dufour, L., and V. Guérin. 2005. Nutrient solution effects on the development and yield
of Anthurium andreanum Lind. in tropical soilless conditions. Scientia Horticulture
105:269–282.
Higaki, T., H. P. Rasmussen, and W. J. Carpenter. 1980. Calcium deficiency of Anthurium
andreanum Lind. spathes. Journal of the American Society for Horticultural
Science 105(3), 438–440.
Higaki, T., H. P. Rasmussen, and W. J. Carpenter. 1984. A study of some morphological
and anatomical aspects of Anthurium andreanum Lind. Honolulu, USA: University
of Hawaii, HITAHR Research Series 030.
Hernández, L. 2005. El cultivo del Anthurium. Cultivos Tropicales 25: 41–51. In Spanish.
Jakobsen, S.T. 1993. Interaction between Plant Nutrients. Acta Agriculturae Scandinavica
Section B. Soil Plant Science 43(1): 37–41.
Kleiber, T., A. Komosa., J. Krzyszkowska., K. Molinski. 2009. Seasonal changes in the
nutritional status and yielding of Anthurium cultorum Birdsey. Part I.
Macroelements. Folia Horticulturae 21:81–93.
Narwal, R.P., V. Kumar. and J. Singh. 1985. Potassium and magnesium relationship in
cowpea (Vigna unguiculata L. Walp.). Plant and Soil 86:129–134.
Özçelik, A., and C. F. Özkan. 2000. EC and pH changes of the growing media and nutrient
solution during anthurium production in a closed system. Acta Horticulturae
573:91–96.

24
Sonneveld, C., and W. Voogt. 1983. Studies on the salt tolerance of some flower crops
grown under glass. Plant and Soil 74:41–52.
Sonneveld, C., and W. Voogt. 1992. The Concentration of nutrients for growing
Anthurium andreanum in substrate. Acta Horticulturae 342:61–68.
Steiner, A. A. 1968. Soiless culture. Proceedings of the 6th Colloquium of International
Potash Institute. pp: 324–321.
Steiner, A. A. (1973). The selective capacity of tomato plants for nutrient ions in a
solution. Proc. 3rd International Congress on Soilless Culture, IWOSC. Sassari,
Italy (pp. 43–53).
25
Table 1. Proportion of anions and cations in the nutrient solutions assessed.
Nutrient Solution NO3- H2PO4
- SO4-2 K+ Ca+2 Mg+2
1 0.43 0.05 0.52 0.42 0.25 0.33
2 0.80 0.02 0.18 0.48 0.51 0.01
3 0.78 0.12 0.10 0.08 0.59 0.33
4 0.63 0.05 0.33 0.31 0.68 0.01
5 0.78 0.12 0.10 0.51 0.36 0.14
6 0.20 0.12 0.68 0.65 0.25 0.10
7 0.49 0.12 0.39 0.09 0.68 0.23
8 0.28 0.02 0.70 0.37 0.47 0.17
9 0.49 0.12 0.39 0.65 0.34 0.01
10 0.36 0.10 0.55 0.22 0.57 0.21
Control 0.60 0.05 0.35 0.35 0.45 0.20

26
Table 2. Effect of the K+ : Ca+2 : Mg+2 balance in the nutrient solution on growth parameters of anthurium (Anthurium andreanum
Lind.) plants in response to the K+ : Ca+2 : Mg+2 balance in the nutrient solution
K+ Ca+2 Mg+2 Spathe
area
Leaf
area
Root
volume
Shoot Root Total Shoot Root Total
Proportion
fresh weight dry weight
(cm2) (cm2) (cm3) (g) (g)
0.42 0.25 0.33 118a 534bcd 52.0d 52.6cd 55.0b 108cde 5.86cd 7.26bc 13.6bcd
0.48 0.51 0.01 149a 758abc 117.0ab 88.3a 86.9ab 177abc 11.60ab 8.96abc 22.0a
0.08 0.59 0.33 133a 791ab 65.0cd 78.7ab 104.0ab 183ab 10.20abc 9.11abc 20.5ab
0.31 0.68 0.01 131a 1020a 143.0a 103.0a 125.0a 228a 13.10a 11.30ab 23.7a
0.51 0.36 0.14 150a 824ab 103.0bc 77.0ab 97.0ab 174abcd 9.68abc 10.10abc 19.2abc
0.65 0.25 0.10 169a 790ab 151.0a 85.7a 122.0a 208ab 9.94abc 12.70a 21.5a
0.09 0.68 0.23 153a 642bcd 100.0bc 74.3ab 77.4ab 152bcde 7.93bcd 8.52abc 17.9abcd
0.37 0.47 0.17 149a 430d 52.0d 36.9c 43.8b 81e 8.33abcd 5.49c 11.5d
0.65 0.34 0.01 54b 483cd 50.0d 46.9bc 59.0b 106cde 5.57cd 6.58c 12.9cd
0.22 0.57 0.21 62b 410d 42.5d 47.7cd 49.1b 97e 5.56cd 6.17c 10.9d
0.35 0.45 0.20 42b 412d 44.4d 28.4c 73.1b 101de 4.35d 6.89c 11.9d

27
Table 3. Models that estimate the spathe and leaf area, root volume and shoot, root, and total fresh (FW) and dry weight (DW) of
anthurium (Anthurium andreanum Lind.) plants to the K+ : Ca+2 : Mg+2 balance in the nutrient solution.
Growth parameter Model P < R2
Leaf area (cm2) = − 201K + 1615Ca + 4119Mg + 55.2KCa − 1060KMg − 5658CaMg − 23892KCaMg +
21726KMg(K−Mg)
0.01 0.72
Spathe area (cm2) = − 14.7K − 3.93Ca + 2685Mg + 70.6KCa − 4595KMg − 4857CaMg + 4357KCaMg +
2299KMg(K−Mg) + 2767CaMg(Ca−Mg)
0.01
0.80
Root volume (cm3) = 5.88K + 373Ca + 1376Mg − 427KCa − 2368KMg − 2432CaMg + 5767KMg(K−Mg) 0.01 0.64
Shoot FW (g) = 43.1K + 233Ca + 991Mg − 304KCa − 1578KMg − 1671CaMg + 2839KMg(K−Mg) 0.01 0.60
Root FW (g) = 33.1K + 299Ca − 4016Mg − 296KCa + 7488KMg + 7481CaMg − 10435KCaMg −
5066CaMg(Ca−Mg)
0.03 0.51
Total FW (g) = − 7.35K + 450Ca + 1644Mg − 261KCa − 2029KMg − 2649CaMg − 2703KCaMg +
6322KMg(K−Mg)
0.01 0.68
Shoot DW (g) = − 5.82K + 22.6Ca + 138Mg + 0.32KCa − 229KMg − 211CaMg + 45.1KCaMg +
382KMg(K−Mg)
0.01 0.41

28
Root DW (g) = 4.06K + 22.9Ca − 294Mg − 17.7KCa + 582KMg + 538CaMg − 831KCaMg −
316CaMg(Ca−Mg)
0.01 0.60
Total DW (g) = − 15.9K + 29.5Ca + 114Mg + 50.7KCa − 68.4KMg − 129CaMg − 522KCaMg +
590KMg(K−Mg)
0.01 0.62
To estimate a growth parameter, do select the respective model, then substitute the proportion of each cation in the mixture of interest
and multiply it by the corresponding coefficient. For example, to estimate leaf area of plants irrigated with a solution with a cation
balance of 0.42 K+, 0.25 Ca+2, 0.33 Mg+2, the model would be = -201*(0.42)+1615*(0.25)+4119*(0.33)+55.2*(0.42*0.25)-
1060*(0.42*0.33)-5658*(0.25*0.33)-23892*(0.42*0.25*0.33)+21726*(0.42*0.33)*(0.42-0.33)
29
Table 4. Effect of the K+: Ca+2: Mg+2 balance in the nutrient solutions on the concentration of K+, Ca+2 and Mg+2 in shoots and roots of
anthurium (Anthurium andreanum Lind.) plants.
Nutrient solution Shoot Root
K+ Ca+2 Mg+2 K+ Ca+2 Mg+2 K+ Ca+2 Mg+2
Proportion mmol kg-1
0.42 0.25 0.33 229abc 247a 259ab 264b 369abc 550cdef
0.48 0.51 0.01 223abc 241ab 234bc 103e 272cd 410f
0.08 0.59 0.33 266ab 234ab 249ab 145de 330bcd 736a
0.31 0.68 0.01 197bc 136d 206cd 236bc 217d 429ef
0.51 0.36 0.14 245abc 178bcd 239bc 230bc 228d 248g
0.65 0.25 0.10 289a 148d 248abc 366a 224d 436ef
0.09 0.68 0.23 219abc 223abc 285a 149de 480a 713ab
0.37 0.47 0.17 177c 217abc 242abc 149cde 382abc 684abc
0.65 0.34 0.01 276a 244ab 272ab 148de 368abc 499bc
0.22 0.57 0.21 267d 192abcd 238bc 134de 452ab 625abcd
0.35 0.45 0.20 239abc 161cd 235bc 181cd 460abc 576bcde
Means followed by the same letter indicates no significant difference according to Duncan´s comparison test (P <0,05).

30
Figure 1. Desing points corresponding to the mixtures of K+, Ca+2 and Mg+2 in the nutrient
solutions. The lines demarcate the minimum and maximum proportion of each cation.
Figure 2. Counter plots showing the effect of the K+ : Ca+2 : Mg+2 balance in the nutrient
solution on leaf area (cm2), spathe area (cm2) and root volume (cm3) in anthurium
(Anthurium andreanum Lind) plants.
31
Figure 3. Counter plots showing the effect of the K+ : Ca+2 : Mg+2 balance in the nutrient
solution on shoot fresh weight, root fresh weight and total fresh weight in anthurium
(Anthurium andreanum Lind) plants.
Figure 4. Counter plots showing the effect of the K+ : Ca+2 : Mg+2 balance in the nutrient
solution on shoot dry weight, root dry weight and total dry weight in anthurium
(Anthurium andreanum Lind) plants.

32
Figure 5. Relationship between the K+ : Ca+2 : Mg+2 balance in the nutrient solution (while
circles) with the K+ : Ca+2 : Mg+2 balance in the shoot (A) and root (B) (grey circles) tissues
of anthurium (Anthurium andreanum Lind) plants.
Figure 6. Relationship between the concentration of Ca+2 and Mg+2 in shoots of
anthurium (Anthurium andreanum Lind) plants.

33
Figure 7. Correlation between root calcium (Ca+2) concentration and growth parameters
in anthurium (Anthurium andreanum Lind) plants.

34
Figure 8. Correaltion between shoot calcium (Ca+2) and magnesium (Mg+2) concentration
on root fresh weight and shoot dry weight in anthurium (Anthurium andreanum Lind)
plants.

35
ARTÍCULO II
Anion proportion in the nutrient solution impacts the growth and nutrient status of
anthurium (Anthurium andraeanum Linden ex. André.)

36
Anion proportion in the nutrient solution impacts the growth and nutrient status of 1
anthurium (Anthurium andraeanum Linden ex. André.) 2
3
Viviana P. Sosa-Flores, Luis A. Valdez-Aguilar* 4
Departamento de Horticultura, Universidad Autónoma Agraria Antonio Narro, Calzada 5
Antonio Narro 1923, Buenavista, Saltillo, Coah., México 25315 6
7
Donita L. Cartmill, Andrew D. Cartmill 8
School of Agriculture, University of Wisconsin–Platteville, 1 University Plaza, Platteville, 9
WI 53818 10
11
Adalberto Benavides-Mendoza 12
Departamento de Horticultura, Universidad Autónoma Agraria Antonio Narro, Calzada 13
Antonio Narro 1923, Buenavista, Saltillo, Coah., México 25315 14
15
Antonio Juárez-Maldonado 16
Departamento de Botánica, Universidad Autónoma Agraria Antonio Narro, Calzada 17
Antonio Narro 1923, Buenavista, Saltillo, Coah., México 25315 18
19
Received for publication 20
Accepted for publication 21
*To whom reprint request should be addressed. Email address: 22
Subject Category: Soil Management, Fertilization, and Irrigation 24

37
Anion proportion in the nutrient solution impacts the growth and nutrient status of 25
anthurium (Anthurium andraeanum Linden ex. André.) 26
27
Additional index words. tropical ornamental plants, nitrate, sulfate, phosphate, mixture 28
experiments 29
30
Abstract. Anthurium is native to habitats characterized by low nutrient supply, however, 31
when cultivated, it demands a complete fertilization program. The objective of the present 32
study was to determine the effect of varying proportions of anions [nitrate (NO3‒), 33
phosphate (H2PO4‒) and sulphate (SO4
2‒)] in the nutrient solution on the growth and 34
nutrient status of container grown anthurium. The effect of the anion proportion was 35
modeled using mixture analysis. Plant growth increased when fertigated with solutions 36
containing an anion proportion of 0.78: 0.12: 0.10, 0.20 : 0.12 : 0.68 and 0.80 : 0.02 : 0.18. 37
The contour plots showed that optimum response may be achieved in two areas, an area 38
with high NO3‒ proportion (0.50 ‒ 0.80) and an area with high SO4
‒, provided H2PO4‒ was 39
high (0.09 – 0.12 for H2PO4‒ and 0.55 – 0.70 for SO4
2‒). The counter plots indicate that 40
high SO42‒ proportions combined with low NO3
‒ and H2PO4‒ were detrimental and that 41
optimum growth depends not only on N concentration, as it may be attained at either high 42
or low NO3‒. Nitrogen and S concentration was higher in plants fertigated with high NO3
‒ 43
(0.55 ‒ 0.80) and SO42‒ (0.40 – 0.70) solutions. Shoot P was higher when plants were 44
fertigated with solutions of low (as long as NO3- was at proportions of 0.50 and SO4
2- at 45
0.35) or high H2PO4‒ proportions (as long as SO4
2‒ proportion was at 0.35). At low 46
concentration of S in the shoot, increasing S resulted in increasing shoot N, however, 47

38
further S increments in the shoot were associated with a decrease in N. Plants fertigated 48
with the highest proportion of H2PO4‒ resulted in the lowest S concentrations despite some 49
solutions contained high SO42‒, suggesting that H2PO4
‒ counteracted the uptake of SO42‒. 50
Nitrogen and S were predominantly diverted to the roots in control plants, however, when 51
plants were fed with both high SO42‒ and high H2PO4
‒ solutions even more S was allocated 52
to the roots, which explains the increased growth due to the lower S concentrations. In 53
conclusion, the increased growth of anthurium was attained at either high or low NO3‒ 54
proportion and it is able to cope with high SO42‒ by avoiding the transport of S to the 55
shoot, decreasing SO42- intake, maintaining a favorable internal N/S and S/P proportion, 56
and increasing P tissue concentration. 57
58
Anthurium (Anthurium andraeanum Linden ex. André.) is a tropical ornamental species 59
of considerable beauty, which is cultivated for both the cut flower and potted plant 60
markets. In its natural habitat, anthurium is considered an epiphytic or lithophytic species 61
(Hull and Henny, 1995), and is usually found in habitats characterized by low light levels 62
and low nutrient supply, typically in shaded conditions and on the trunks of trees, where 63
the roots have no contact with the soil (Zotz and Hietz, 2001). Nutrients supply and 64
availability, particularly nitrogen (N), have been reported to be key factors that determine 65
anthurium growth, flower number, and quality/marketability (Chang et al., 2010). 66
Nitrogen is a major factor in determining final quality of anthurium plants 67
(Conover and Henny, 1995). In some species of anthurium, including A. acaule and A. 68
cordatum, similar N concentrations to that of terrestrial species have been reported, 1.87% 69
and 2.33%, respectively (Zotz and Hietz, 2001). Li and Zhang (2002) reported high quality 70

39
and maximum dry mass of anthurium plants fed with N concentrations ranging from 10 71
to 40 mg L-1, with 20 mg L-1 N producing the highest quality. 72
Nonetheless, the interaction of N with other nutrients must also be considered 73
when developing a feasible fertility program, as N may affect the availability and uptake 74
of other ions. For example, it has been reported that high quality in A. andraeanum is 75
obtained when fertilized at low N (1.85 g per 15 cm-pot per year) and high potassium (K) 76
(1.39 to 3.07 g per 15 cm-pot per year) rates; conversely, plants fertilized with high N and 77
K rates resulted in poor growth and marketability (Conover and Henny, 1995). Similarly, 78
rapid growth was reported in anthurium when N and K were supplied at 8.9 and 3.2 mmol 79
L‒1, respectively; however, when Ca was reduced from 2.3 to 1.2 mmol L‒1, a decrease in 80
the length of the vegetative phase was observed along with an increase in flower 81
production (Dufour and Guérin, 2005). 82
Therefore, the total nutrient concentration and the proportion of the ions dissolved 83
in the nutrient solution have to be considered (Steiner, 1968) when defining an optimal 84
fertility program. The mutual ion relations are also important for plant growth as an 85
unbalanced combination may result in decreased biomass and yield due to the antagonistic 86
relationships among ions (Ding et al., 2006; Jakobsen, 1993). There is limited information 87
as to the effect of the nutrients proportion and interactions on the growth and marketability 88
of anthurium, thus, the present study had the objective of determining the response of 89
container grown anthurium plants to varying proportions of anions [nitrate (NO3‒), 90
phosphate (H2PO4‒) and sulphate (SO4
2‒)] in the nutrient solution on the growth and 91
nutrient status. 92
Materials and methods 93

40
Cultural conditions and plant material. The experiment was conducted under greenhouse 94
at the Universidad Autónoma Agraria Antonio Narro, in Saltillo, Coah., México (25° 21’ 95
24.37” N latitude, 101° 02’ 05.45” W longitude; 1762 m above sea level). Environmental 96
parameters were recorded (Watch Dog 1000 Series, Spectrum Technologies, Inc. Aurora, 97
IL) throughout the study, recording an average daily temperature of 20°C (maximum 98
31.5°C, minimum 13.5°C), relative humidity 66% ± 20%, and photosynthetically active 99
radiation at 177 µmol m‒2 s‒1. 100
The growing medium consisted of a 1:1 mixture of sphagnum peat (PREMIER, 101
Premier Tech, Toronto, Canada) (NO3‒: 0.15 meq L‒1, H2PO4
‒: 0.08 meq L‒1, SO42‒: 0.22 102
meq L‒1, K+: 0.15 meq L‒1, Ca2+: 1.18 meq L‒1, Mg2+: 0.55 meq L‒1, HCO3‒: 0.70 meq L‒103
1) and horticultural-grade perlite (HORTIPERL, Termolita, Monterrey, México). The 104
medium pH was adjusted to 6.3 prior to transplanting to 17.8 cm black plastic standard 105
pots. Anthurium andraeanum cv. Tropical plants (12-15 cm in height, with 2-3 young 106
leaves) were transplanted into the medium on 17 Oct. 2014 and harvested on 20 Oct. 2015. 107
Nutrient solutions. The treatments consisted of eight nutrient solutions selected with 108
Design Expert v. 9.0 (Stat Ease, Inc. Minneapolis, MN) (Table 1). Electrical conductivity 109
and pH of the nutrient solutions was maintained at 2.0 dS m‒1 and 5.5 ‒ 6.0, respectively. 110
The sum of anions in all the nutrient solutions was held constant at 20 meq L‒1. However, 111
the proportions of NO3‒, H2PO4
‒ and SO42‒ varied from 0.20 – 0.80, 0.02 – 0.12 and 0.10 112
– 0.70, respectively, in order to explore the area shown in Fig. 1. The control treatment 113
corresponded to Steiner´s formulation, containing (meq L‒1): 12 NO3‒, 1 H2PO4
‒, 7 SO42‒114
, 9 Ca2+, 7 K+, and 4 Mg2+ (Steiner, 1973). Micronutrients in all the nutrient solutions were 115
provided at the following concentrations (mg L‒1): 4 Fe-EDTA, 2 Mn-EDTA, 0.37 B, 0.32 116
Zn-EDTA, 0.16 Cu-EDTA, and 0.11 Mo. Plants were manually irrigated when the 117
41
growing medium registered a moisture tension of 10 cb (Irrometer Model MLT, 118
IRROMETER, Riverside, CA) adding enough solution to attain a leaching fraction of 119
~30%. 120
Assessment of plant growth and nutrient status. Plants were harvested 368 d after 121
transplanting. Harvested plant material was separated into roots and shoots and rinsed 122
twice with deionized water. Root volume was measured by the water displacement method 123
in a graduated cylinder. Leaf area and spathe area were measured in an Area Meter (Model 124
LI-3100C, LI-COR Inc. Lincoln, NE). Fresh mass of shoot and root were measured prior 125
to drying in an oven at 70°C for 3 d. Dry tissues were then weighed, and ground to pass a 126
40 mesh filter (Mini Willey Mill, Thomas Scientific. Swedesboro, NJ). 127
Nitrogen concentration in plant tissues was determined using semi-micro 128
Kjeldhal´s procedure. Phosphorus (P) and sulfur (S) concentrations were determined with 129
inductively coupled plasma emission spectrometer (ICP-AES 725 Series Agilent; 130
Mulgrave, Victoria, Australia) in samples digested in a mixture of H2SO4 and HClO4 plus 131
1 mL of H2O2 for P analysis and in a mixture of HNO3 and HClO4 for S analysis. 132
Statistical design and analysis. The eight nutrient solutions with four replications (one pot 133
per replication) were distributed in a randomized complete block design. Data were 134
analyzed with SAS to conduct an analysis of variance and a multiple comparison test 135
(Duncan´s procedure, p < 0.05). The effect of the NO3‒ : H2PO4
‒ : SO42‒ proportion was 136
modeled using mixture analysis with Design-Expert® v 9.0. The models selected were 137
those with the highest R2 and p-value, along with an adequate precision higher than 4.0 138
and a non-significant lack of fit, which indicate that the model can be used to predict the 139
response of plants when used within the space on which it was designed (Fig. 1). A 140

42
regression analysis was conducted when a significant response of plant growth or nutrient 141
concentration in plant tissues was detected. 142
143
Results and discussion 144
Growth and biomass. Growth was increased when plants were fertigated with solutions 145
containing a NO3‒ : H2PO4
‒ : SO42‒ proportion of 0.78 : 0.12 : 0.10, 0.20 : 0.12 : 0.68 and 146
0.80 : 0.02 : 0.18; in general, all parameters measured were significantly higher when 147
compared to plants fertigated with Steiner´s nutrient solution (Table 2). 148
Mixture analysis allowed the identification of several parameters whose models 149
can be used to explore the space area designed (Table 3). The integration of the predictions 150
of each individual model allows the definition of specific areas in the contour plots that 151
include the nutrient solutions on which a threshold optimum response may be achieved; 152
in the present study, there were two areas of the explored space for highest leaf area (Fig. 153
2), shoot, root and total fresh (Fig. 3) and dry mass (Fig. 4): 154
a). An area with high proportions of NO3‒: 0.50 ‒ 0.80 for NO3
‒, 0.02 – 0.06 for H2PO4‒ 155
and 0.10 – 0.35 for SO42‒ 156
b). An area with high proportions of SO4‒ but provided the proportion of H2PO4
‒ was high: 157
0.20 to 0.35 for NO3‒, 0.09 – 0.12 for H2PO4
‒ and 0.55 – 0.70 for SO42‒. 158
Similarly, spathe area and root volume were highest when NO3‒ proportion ranged from 159
0.45 ‒ 0.60, H2PO4‒ proportion from 0.02 ‒ 0.06 and SO4
2‒ proportion from 0.27 ‒ 0.43 160
(Fig. 2). The counter plots obtained with mixture analysis suggests that high proportions 161
of SO42‒ combined with low proportions of NO3
‒ and H2PO4‒ were detrimental for plant 162
growth as fresh (Fig. 3) and dry mass (Fig. 4) were decreased. 163

43
These trends were comparable to those reported in anthurium by Dufour and 164
Guérin (2005) that reported that a higher concentration of N, 8.9 mmol L‒1, was associated 165
with increased growth. In our study, according to the mixture analysis, the high 166
concentrations of N for optimum growth ranged from 10 ‒ 16 meq L‒1 (NO3‒ proportions 167
from 0.50 to 0.80), which are considerably higher than those assessed by Dufour and 168
Guérin (2005). Furthermore, the models also indicate that a low NO3‒ proportion (0.20 ‒ 169
0.35) or concentration (4.0 to 7.0 meq L‒1) may also be associated with growth 170
enhancement provided a relatively high H2PO4‒ proportion is maintained, from 0.09 – 171
0.12 (1.8 to 2.4 meq L‒1), regardless of the high SO42‒ proportion or concentration 172
(proportion from 0.55 – 0.70, 11.0 to 14.0 meq L‒1). This may be because of the low N 173
concentrations at which we observed optimum growth (4.0 to 7.0 meq L‒1) were similar 174
to the high concentrations reported by Dufour and Guérin (2005) and because of the 175
greater supply of P, a nutrient which is usually found to be deficient in epiphytic plants 176
(Zotz, 2004). 177
Our results suggest that optimum growth of anthurium depended not only on N 178
concentration, as it may be attained at either high or low NO3‒, but also on the proportion 179
in which it is combined with H2PO4‒ and SO4
2‒. Similarly, Takano (1987) suggested that 180
the NO3‒, H2PO4
‒ and SO42‒ proportion and the proportion of SO4
2‒ and H2PO4‒ may be 181
useful in adjusting the uptake of NO3‒, and thereby improving the quality of edible 182
vegetables. 183
Nutrient status. Kleiber and Komosa (2010) reported that N, P and S in anthurium leaves 184
should range from 907 ‒ 1329, 94 ‒ 145 and 69 ‒ 141 mmol kg‒1, respectively. In the 185
present study, shoot and root N, P and S concentration were significantly affected by the 186
NO3‒ : H2PO4
‒ : SO42‒ proportions in the nutrient solution (Table 4); in the roots, N, P, 187

44
and S were similar to those reported for the leaves by Kleiber and Komosa (2010), while 188
in the shoot, they were within those ranges only for some treatments (Table 4). Our results 189
were similar to those reported by Chang et al. (2012) indicating that high N (7.5 and 11.3 190
meq L‒1) was associated with improved dry mass, leaf area, and number of flowers in 191
anthurium, when compared to plants fertigated with lower or higher N levels (5.6 and 15.0 192
meq L‒1). 193
Increasing the proportions of NO3‒, H2PO4
‒ and SO42‒ resulted in increased 194
concentration of N, P and S in anthurium plants. Plants fed with solutions containing the 195
highest SO42‒ proportions resulted in plants with the highest S content at a whole plant 196
level, except when plants were fed with high H2PO4‒ (NO3
‒ : H2PO4‒ : SO4
2‒ proportion 197
of 0.20 : 0.12 : 0.68). A similar trend in SO42‒ uptake was reported by López et al. (2002) 198
in tomato seedlings (Solanum lycopersicon L.), which is in line with reports by 199
Rennenberg (1984) suggesting that avoidance of S uptake is not a mechanism used by 200
plants under external or internal SO42‒ excess, being the influx of excess S was more 201
probable than restricted uptake (Rennenberg, 1984). 202
Dufour and Clairon (1997) reported that adequate supply of N for anthurium is 203
between 7.5 and 8.9 meq L‒1, as lower concentrations may reduce growth, affect the length 204
of the vegetative phase, and produce flowers of low quality. In our current study, we 205
observed that anthurium plants may grow even at lower NO3‒ proportions and 206
concentrations, 0.20 and 4.0 meq L‒1, provided H2PO4‒ is increased to counteract the 207
increase in SO42‒. 208
Anion interactions. Fageria and Oliveira (2014) suggested that information focused on the 209
interactions among nutrients is of utmost importance when formulating a balanced supply 210
of fertilizers to cultivated plants. Interactions among nutrients occur when the supply of 211

45
one nutrient influences the uptake and utilization of another one (Fageria, 2001). In the 212
current study, the interactions among the anions resulted in consistent trends and were 213
modeled with mixture analysis (Table 5). The explored area showed that N and S tended 214
to concentrate, for both, shoots (Fig. 5) and roots (Fig. 6), when plants were fertigated 215
with solutions containing high proportions of NO3‒ (0.55 ‒ 0.80) and SO4
2‒ (0.40 – 0.70). 216
Phosphorus concentration in the shoots was higher when plants were fertigated with 217
solutions of low (as long as NO3- was at proportions of 0.50 and SO4
2- at 0.35) or high 218
H2PO4‒ proportions (as long as SO4
2‒ proportion was at 0.35) (Fig. 5). In the roots, 219
increasing P concentrations were associated with increasing H2PO4‒ proportions (Fig. 6). 220
Nitrogen is a constituent of all the amino acids while S is a constituent in two of 221
them, cysteine and methionine; therefore, as N and S are both part of proteins, there is a 222
close relationship between their assimilation (Hawkesford et al., 2012). The uptake of N 223
and S is well coordinated, in that, for example, a deficiency of one may cause a decrease 224
in the assimilation of the other one (Kopriva and Rennenberg, 2004; Kruse et al., 2007). 225
A close relationship between N and S has been reported in several plant species; for 226
example, in wheat (Triticum aestivum L.) (Salvagiotti et al., 2009) and legumes (Scherer, 227
2001), increasing S fertilization under S deficiency conditions resulted in improved N use 228
efficiency and uptake, however, in tomato and cabbage (Brassica oleracea var. capitata 229
L.), N uptake was inhibited by high concentrations of SO42‒ (Takano, 1987). Sulfur 230
deficiency in wheat has also been related to lower sulfur-amino acids content and reduced 231
yield (Järvan et al., 2008). 232
In the present study, the association between N and S was also observed since at 233
low shoot concentration, increasing S resulted in increasing shoot N concentration (Fig. 234
7), however, further S increments in the shoot were associated with a decrease in shoot N 235

46
(Fig. 7). The decreased N concentration as a result of the high S concentration in the shoots 236
may explain the potentially toxic effects of SO42‒ observed in our current study, as 237
indicated by the lower root, shoot, and total plant fresh and dry mass at high S 238
concentrations (Fig. 8). 239
Nitrogen and S in shoots and roots were highest when the proportion of the 240
respective anion increased in the nutrient solution (Figs. 5-6), furthermore, SO42‒ uptake 241
rate was maintained as indicated by the high S concentration in the shoots and roots at 242
high SO42‒ proportions (Figs. 5-6), while shoot S concentration was low even at high SO4
2‒ 243
proportions as long as the proportion of H2PO4‒ in the nutrient solution and the 244
concentration of P in the shoot were high (Fig 5). Plants fertigated with nutrient solutions 245
containing NO3‒, H2PO4
‒ and SO42‒ at proportions of 0.20 : 0.12 : 0.68 (Table 4) resulted 246
in growth promotion (Table 2). 247
Anthurium plants fertigated with solutions containing the highest proportion of 248
H2PO4‒ resulted in shoots and roots with the lowest S concentration despite some of those 249
nutrient solutions were formulated with very high SO42‒ proportions (Table 2), suggesting 250
that high H2PO4‒ proportions counteracted the uptake of SO4
2‒. This hypothesis is 251
supported by reports indicating that SO42‒ -induced salinity has a more negative impact on 252
the growth of Brassica rapa L. at lower concentration of P (Reich et al., 2017), which also 253
suggests that higher H2PO4‒ proportion may reduce the negative impact of SO4
2‒ on 254
H2PO4‒ uptake. 255
Internal nitrogen/sulfur and phosphorus/sulfur proportion. High S concentrations in plant 256
tissues (Fig. 8) affected the internal N/S and S/P proportions. Our results showed that a 257
higher internal N/S proportion and a lower internal S/P proportion were associated with 258
higher shoot fresh mass (Fig. 9). Similarly, increasing S shoot concentration was 259
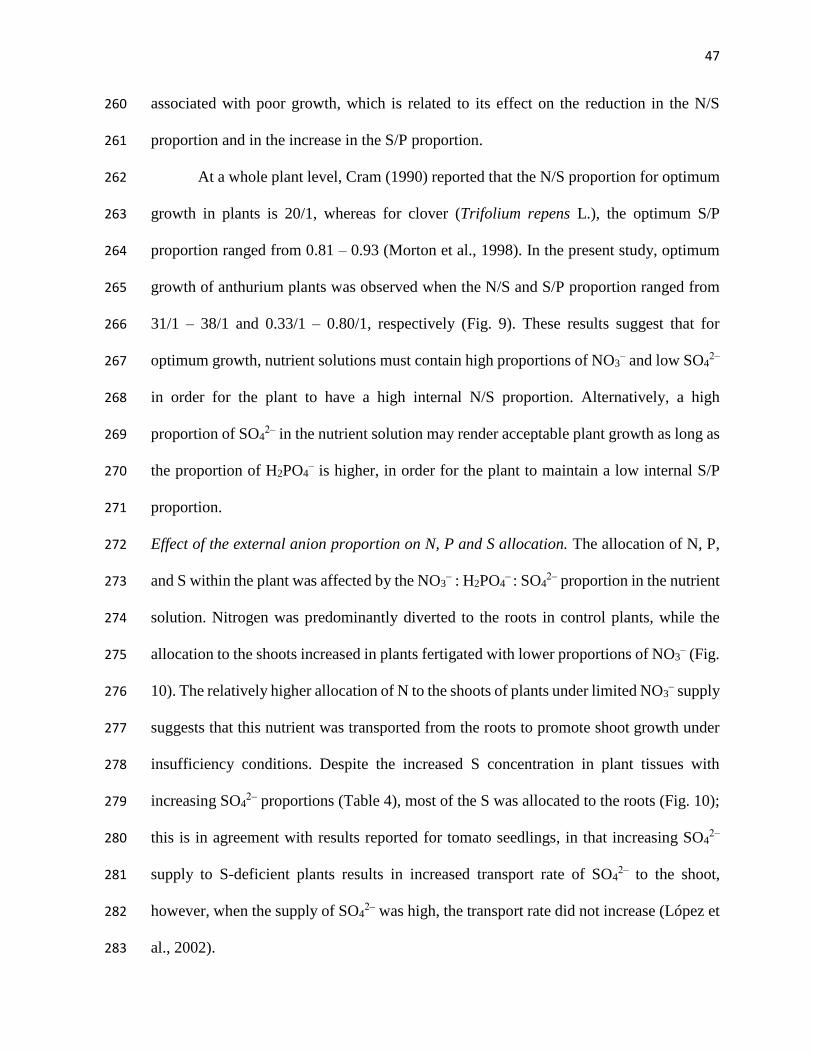
47
associated with poor growth, which is related to its effect on the reduction in the N/S 260
proportion and in the increase in the S/P proportion. 261
At a whole plant level, Cram (1990) reported that the N/S proportion for optimum 262
growth in plants is 20/1, whereas for clover (Trifolium repens L.), the optimum S/P 263
proportion ranged from 0.81 – 0.93 (Morton et al., 1998). In the present study, optimum 264
growth of anthurium plants was observed when the N/S and S/P proportion ranged from 265
31/1 – 38/1 and 0.33/1 – 0.80/1, respectively (Fig. 9). These results suggest that for 266
optimum growth, nutrient solutions must contain high proportions of NO3‒ and low SO4
2‒ 267
in order for the plant to have a high internal N/S proportion. Alternatively, a high 268
proportion of SO42‒ in the nutrient solution may render acceptable plant growth as long as 269
the proportion of H2PO4‒ is higher, in order for the plant to maintain a low internal S/P 270
proportion. 271
Effect of the external anion proportion on N, P and S allocation. The allocation of N, P, 272
and S within the plant was affected by the NO3‒ : H2PO4
‒ : SO42‒ proportion in the nutrient 273
solution. Nitrogen was predominantly diverted to the roots in control plants, while the 274
allocation to the shoots increased in plants fertigated with lower proportions of NO3‒ (Fig. 275
10). The relatively higher allocation of N to the shoots of plants under limited NO3‒ supply 276
suggests that this nutrient was transported from the roots to promote shoot growth under 277
insufficiency conditions. Despite the increased S concentration in plant tissues with 278
increasing SO42‒ proportions (Table 4), most of the S was allocated to the roots (Fig. 10); 279
this is in agreement with results reported for tomato seedlings, in that increasing SO42‒ 280
supply to S-deficient plants results in increased transport rate of SO42‒ to the shoot, 281
however, when the supply of SO42‒ was high, the transport rate did not increase (López et 282
al., 2002). 283
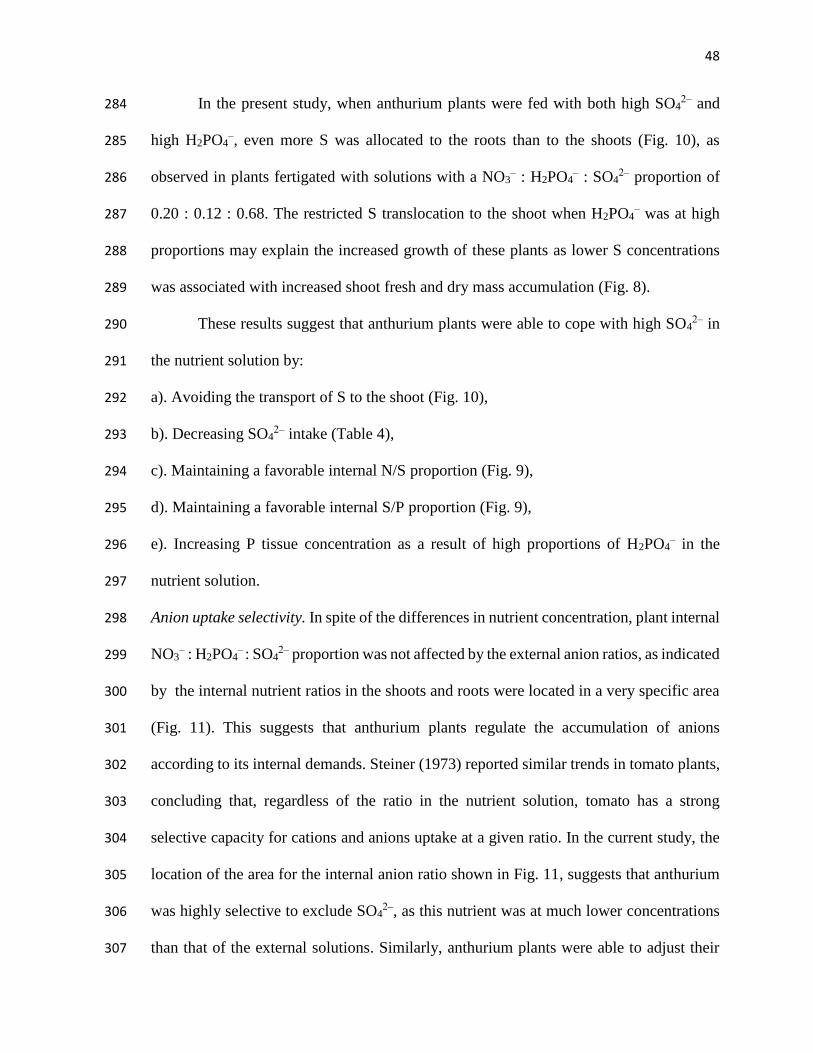
48
In the present study, when anthurium plants were fed with both high SO42‒ and 284
high H2PO4‒, even more S was allocated to the roots than to the shoots (Fig. 10), as 285
observed in plants fertigated with solutions with a NO3‒ : H2PO4
‒ : SO42‒ proportion of 286
0.20 : 0.12 : 0.68. The restricted S translocation to the shoot when H2PO4‒ was at high 287
proportions may explain the increased growth of these plants as lower S concentrations 288
was associated with increased shoot fresh and dry mass accumulation (Fig. 8). 289
These results suggest that anthurium plants were able to cope with high SO42‒ in 290
the nutrient solution by: 291
a). Avoiding the transport of S to the shoot (Fig. 10), 292
b). Decreasing SO42‒ intake (Table 4), 293
c). Maintaining a favorable internal N/S proportion (Fig. 9), 294
d). Maintaining a favorable internal S/P proportion (Fig. 9), 295
e). Increasing P tissue concentration as a result of high proportions of H2PO4‒ in the 296
nutrient solution. 297
Anion uptake selectivity. In spite of the differences in nutrient concentration, plant internal 298
NO3‒ : H2PO4
‒ : SO42‒ proportion was not affected by the external anion ratios, as indicated 299
by the internal nutrient ratios in the shoots and roots were located in a very specific area 300
(Fig. 11). This suggests that anthurium plants regulate the accumulation of anions 301
according to its internal demands. Steiner (1973) reported similar trends in tomato plants, 302
concluding that, regardless of the ratio in the nutrient solution, tomato has a strong 303
selective capacity for cations and anions uptake at a given ratio. In the current study, the 304
location of the area for the internal anion ratio shown in Fig. 11, suggests that anthurium 305
was highly selective to exclude SO42‒, as this nutrient was at much lower concentrations 306
than that of the external solutions. Similarly, anthurium plants were able to adjust their 307

49
uptake of NO3‒ as the internal proportion was maintained at relatively high concentration 308
regardless of the external ratio (Fig. 11). In contrast, the uptake of H2PO4‒ was not as 309
selective, as the internal and external ratios were very similar (Fig. 11). 310
In conclusion, increased growth of anthurium plants was attained at either high or 311
low NO3‒ proportions. Furthermore, we suggest that at low NO3
‒, the high H2PO4‒ 312
counteracted the deleterious effect of high SO42‒ proportions on P tissue concentration. 313
Increasing S concentration in plant tissues was associated with reduced growth, however, 314
excess SO42‒ uptake was prevented when P status in the plants was increased when H2PO4
‒ 315
proportions were augmented, resulting in lower S tissue concentrations and improved 316
growth. Our results also suggest that anthurium plants were able to cope with high SO42‒ 317
when H2PO4‒ in the nutrient solution was increased through limiting its transport to the 318
shoot, which in turn resulted in favorable N/S and S/P internal proportions. The internal 319
anion proportion was not affected by the NO3‒ : H2PO4
‒ : SO42‒ proportions in the nutrient 320
solution, demonstrating that anthurium possesses a high selective capacity for nutrient 321
uptake and allocation/partitioning. 322
323
Literature cited 324
Chang, K.H., R.Y. Wu, G.P. Chang, T.F. Hsieh, and R.S. Chung. 2012. Effects of nitrogen 325
concentration on growth and nutrient uptake of Anthurium andraeanum Lind. cultivated 326
in coir under different seasonal conditions. Hort. Sci. 47(4):515-521. 327
Chang, K.H., R.Y. Wu, K.C. Chuang, T.F. Hsieh, and R.S. Chung. 2010. Effects of 328
chemical and organic fertilizers on the growth, flower quality and nutrient uptake of 329
Anthurium andreanum, cultivated for cut flower production. Sci. Hort. 125(3):434-441. 330

50
Conover, C.A, and R.J Henny. 1995. Lowering N and K rates improves anthurium growth 331
and flowering. Proc. Fla. State Hort. Soc. 108:5-9. 332
Cram, W.J. 1990. Uptake and transport of sulphate, p. 3-11. In: Rennenberg H (ed.) 333
Sulphur Nutrition and Assimilation in Higher Plants. SPB Academic Publishing, The 334
Hague, The Netherlands. 335
Ding, Y., W. Luo, and G. Xu. 2006. Characterisation of magnesium nutrition and 336
interaction of magnesium and potassium in rice. Annals Appl. Biol. 149:111-123. 337
Dufour, L, and M. Clairon. 1997. Advances in fertilization of Anthurium hybrid in 338
Guadeloupe (FWI). International Symposium Growing Media and Plant Nutrition in 339
Horticulture. 450:433–437. 340
Dufour, L, and V. Guérin. 2005. Nutrient solution effects on the development and yield 341
of Anthurium andreanum Lind. in tropical soilless conditions. Sci. Hort. 105:269-282. 342
Fageria, N.K, and J.P Oliveira. 2014. Nitrogen, phosphorus and potassium interactions in 343
upland rice. J. Plant Nutr. 37(10):1586-1600. 344
Fageria, V.D. 2001. Nutrient interactions in crop plants. J. Plant Nutr. 24:1269-1290. 345
Hawkesford, M., W. Horst, T. Kichey, J. Schjoerring, I.S. Moller, and P. White. 2012. 346
Functions of macronutrients, p.135-189. In: P. Marschner (ed.) Marschner's Mineral 347
Nutrition of Higher Plants. Academic Press. 348
Hull, D.L, and R.J Henny. 1995. Anthurium and Aglaonema production in Dade county, 349
Florida. Proc. Fla State Hort. Soc. 108:4-5. 350
Jakobsen, S.T. 1993. Interaction between plant nutrients: III. Antagonism between 351
potassium, magnesium and calcium. Acta Agric. Scand. Sec. B. 43:1-5. 352
51
Järvan, M., L. Edesi, A. Adamson, L. Lukme, and A. Akk. 2008. The effect of sulphur 353
fertilization on yield, quality of protein and baking properties of winter wheat. J. Agron. 354
Res. 6:459-469. 355
Kleiber, T, and A. Komosa. 2010. Guide values for anthurium (Anthurium cultorum 356
Birdsey) grown in expanded clay. J. Plant Nutr. 33(10):1506-1518. 357
Kopriva, S., and H. Rennenberg. 2004. Control of sulphate assimilation and glutathione 358
synthesis: interaction with N and C metabolism. J. Exp. Bot. 55:1831-1842. 359
Kruse, J., S. Kopriva, R. Hänsch, G.J. Krauss, R.R. Mendel, and H. Rennenberg. 2007. 360
Interaction of sulfur and nitrogen nutrition in tobacco (Nicotiana tabacum) plants: 361
significance of nitrogen source and root nitrate reductase. Plant Biol. 9:638-646. 362
Li, Y., and M. Zhang. 2002. Effects of urea and nitric acid on water and medium quality 363
and on response of Anthurium. HortTechnology 12:131-134. 364
López, J, C.I. Bell, N. Tremblay, M. Dorais, and A. Gosselin. 2002. Uptake and 365
translocation of sulphate in tomato seedlings in relation to sulphate supply. J. Plant. Nutr. 366
25:1471-1485. 367
Morton, J.D., A.G. Sinclair, J.D. Morrison, L.C. Smith, and K.G Dodds. 1998. Balanced 368
and adequate nutrition of phosphorus and sulphur in pasture. New Zealand J. Agr. Res. 369
41:487-496. 370
Reich, M., T. Aghajanzadeh, J. Helm, S. Parmar, M.J. Hawkesford, and L.J De Kok. 2017. 371
Chloride and sulfate salinity differently affect biomass, mineral nutrient composition and 372
expression of sulfate transport and assimilation genes in Brassica rapa. Plant Soil. 411:1-373
14. 374
Rennenberg, H. 1984. The fate of excess sulfur in higher plants. Annu. Rev. Plant. Physiol. 375
35:121-153. 376

52
Salvagiotti, F., J.M. Castellarín, D.J. Miralles, and H.M. Pedrol. 2009. Sulfur fertilization 377
improves nitrogen use efficiency in wheat by increasing nitrogen uptake. Field Crop Res. 378
113:170-177. 379
Scherer, H.W. 2001. Sulphur in crop production. European J. Agron. 14(2):81-111. 380
Steiner, A.A. 1968. Soiless culture. In The fertilization of potted crops. Proc. 6th 381
Colloquium Int Potash Inst, Berne, Switzerland. Pp: 324-321. 382
Steiner, A.A. 1973. Selective capacity of tomato plants for ions in a nutrient solution. 383
Proc. International Congress on Soilless Culture, 3d, Sassari. 384
Takano, T. 1987. Physiology: on an anionic balance in plant inorganic nutrition. J. Plant 385
Nutr. 10:1605-1611. 386
Zotz, G. 2004. The resorption of phosphorus is greater than that of nitrogen in senescing 387
leaves of vascular epiphytes from lowland Panama. J. Trop. Ecol. 20:693-696. 388
Zotz, G., and P. Hietz. 2001. The physiological ecology of vascular epiphytes: current 389
knowledge, open questions. J. Exp. Bot. 52:2067-2078. 390
391
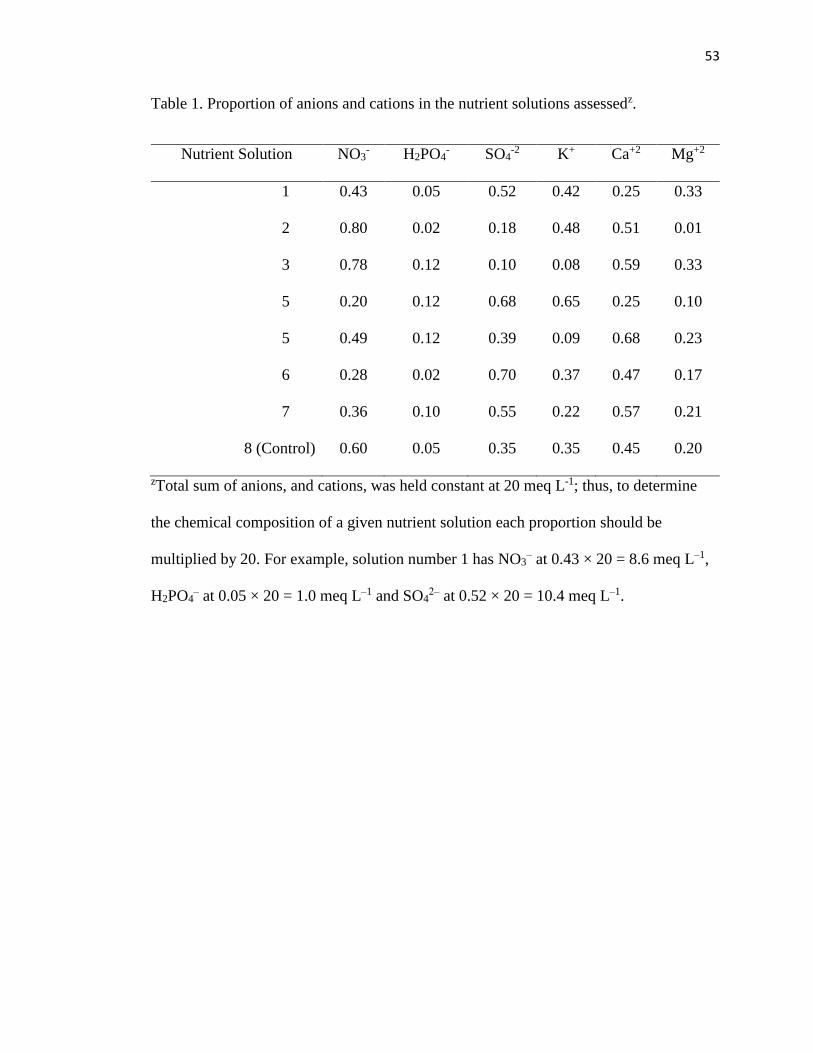
53
Table 1. Proportion of anions and cations in the nutrient solutions assessedz.
Nutrient Solution NO3- H2PO4
- SO4-2 K+ Ca+2 Mg+2
1 0.43 0.05 0.52 0.42 0.25 0.33
2 0.80 0.02 0.18 0.48 0.51 0.01
3 0.78 0.12 0.10 0.08 0.59 0.33
5 0.20 0.12 0.68 0.65 0.25 0.10
5 0.49 0.12 0.39 0.09 0.68 0.23
6 0.28 0.02 0.70 0.37 0.47 0.17
7 0.36 0.10 0.55 0.22 0.57 0.21
8 (Control) 0.60 0.05 0.35 0.35 0.45 0.20
zTotal sum of anions, and cations, was held constant at 20 meq L-1; thus, to determine
the chemical composition of a given nutrient solution each proportion should be
multiplied by 20. For example, solution number 1 has NO3‒ at 0.43 × 20 = 8.6 meq L‒1,
H2PO4‒ at 0.05 × 20 = 1.0 meq L‒1 and SO4
2‒ at 0.52 × 20 = 10.4 meq L‒1.

54
Table 2. Effect of the NO3‒ : H2PO4
‒ : SO42‒ proportion in the nutrient solution on growth parameters of anthurium (Anthurium
andraeanum Linden ex André) plants.
NO3- H2PO4
- SO4-2 Spathe
area
Leaf
area
Root
volume
Shoot
fresh mass
Root
fresh mass
Shoot
dry mass
Root
dry mass
Total
fresh mass
Total
dry mass
Proportion (cm2) (cm2) (cm3) (g) (g) (g) (g) (g) (g)
0.43 0.05 0.53 119bc 534b 53cd 52.6bc 55cd 5.85bc 7.26cd 108c 13.6b
0.80 0.02 0.18 145abc 770a 107b 83.5a 91abc 10.9a 8.93bc 178ab 21.1a
0.78 0.12 0.10 155ab 799a 118b 81.8a 111ab 9.93ab 11.1ab 193a 20.7a
0.20 0.12 0.68 169a 790a 151a 85.7a 122a 9.94ab 12.7a 208a 21.5a
0.49 0.12 0.39 104cd 563b 75c 60.6ab 68bcd 6.75abc 7.55cd 129bc 15.4b
0.28 0.02 0.70 149abc 430b 52cd 36.9bc 44d 8.33abc 5.49d 81c 11.5b
0.36 0.10 0.55 62de 410b 43d 47.7bc 49cd 5.56bc 6.17cd 97c 10.9b
0.60 0.05 0.35 42e 412b 44d 28.4c 73bcd 4.35c 6.89cd 101c 11.9b

55
Table 3. Models that estimate the spathe and leaf area, root volume and shoot, root, and total fresh and dry mass of anthurium
(Anthurium andraeanum Linden Ex André) plants in response to the NO3‒ : H2PO4
‒ : SO42‒ proportion in the nutrient solution.
Growth parameterz Model P < Lack
of
Fit
R2 Adequate
precision
Spathe area (cm2) = +118NO3+40935H2PO4+90.3SO4−45838(NO3×H2PO4)+1063(NO3
×SO4)−44632(H2PO4×SO4)−13956(NO3×H2PO4×SO4)
0.01 0.03 0.79 10.3
Leaf area (cm2) = +1696NO3+62612H2PO4+692SO4−77957(NO3×H2PO4)−1907(NO3
×SO4)−66479(H2PO4×SO4)
0.01 0.04 0.66 9.08
Root volume (cm3) = +159NO3+29916H2PO4−156SO4−34313(NO3×H2PO4)+928(NO3×S
O4)−30293(H2PO4×SO4)−11946(NO3×H2PO4×SO4)
0.01 0.67 0.91 16.4
Shoot fresh mass (g) = +192NO3+8011H2PO4+72.8SO4−9839(NO3×H2PO4)−249(NO3×SO
4)−8487(H2PO4×SO4)
0.01 0.03 0.61 7.87
Root fresh mass (g) = +217NO3+2941H2PO4+71.7SO4−4245(NO3×H2PO4)−351(NO3×SO
4)−2240(H2PO4×SO4)
0.02 0.18 0.51 5.88
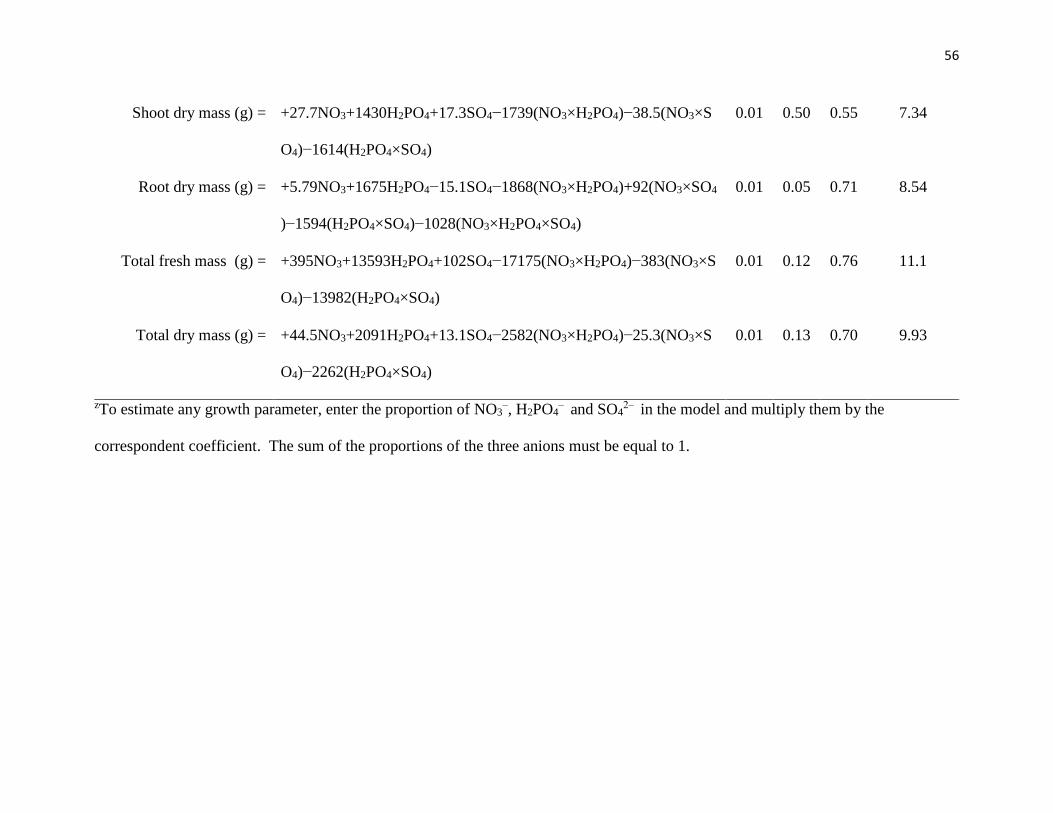
56
Shoot dry mass (g) = +27.7NO3+1430H2PO4+17.3SO4−1739(NO3×H2PO4)−38.5(NO3×S
O4)−1614(H2PO4×SO4)
0.01 0.50 0.55 7.34
Root dry mass (g) = +5.79NO3+1675H2PO4−15.1SO4−1868(NO3×H2PO4)+92(NO3×SO4
)−1594(H2PO4×SO4)−1028(NO3×H2PO4×SO4)
0.01 0.05 0.71 8.54
Total fresh mass (g) = +395NO3+13593H2PO4+102SO4−17175(NO3×H2PO4)−383(NO3×S
O4)−13982(H2PO4×SO4)
0.01 0.12 0.76 11.1
Total dry mass (g) = +44.5NO3+2091H2PO4+13.1SO4−2582(NO3×H2PO4)−25.3(NO3×S
O4)−2262(H2PO4×SO4)
0.01 0.13 0.70 9.93
zTo estimate any growth parameter, enter the proportion of NO3‒, H2PO4
‒ and SO42‒ in the model and multiply them by the
correspondent coefficient. The sum of the proportions of the three anions must be equal to 1.
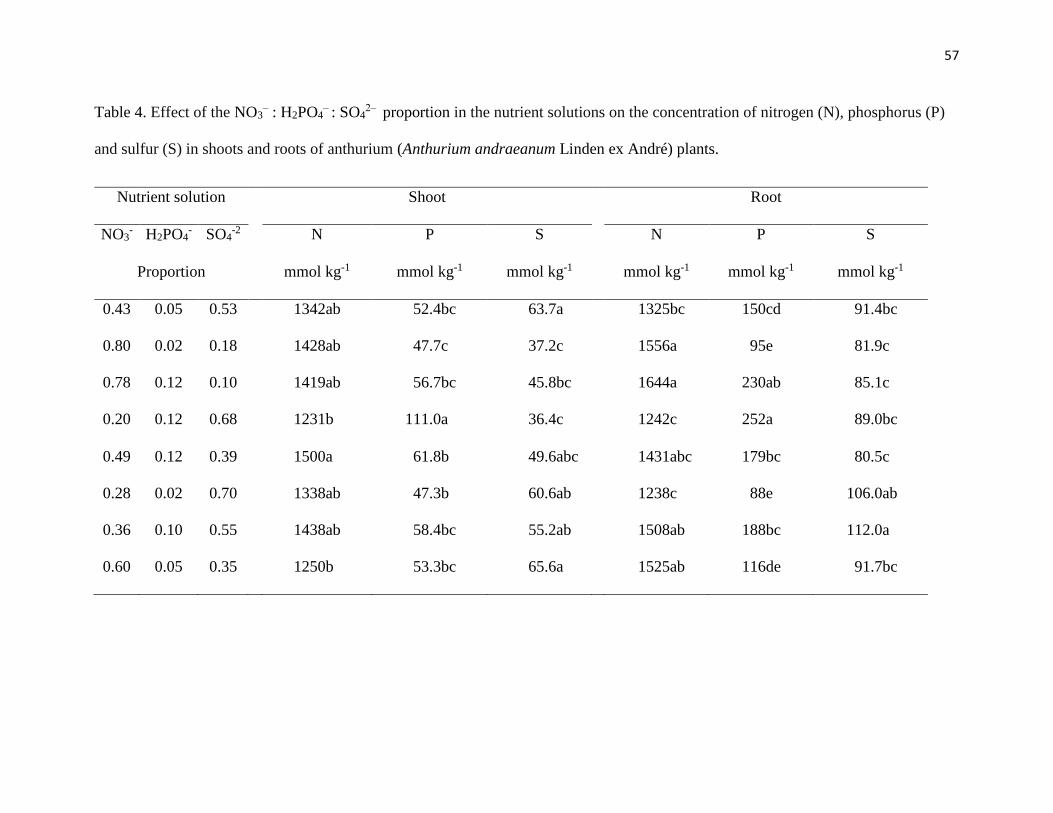
57
Table 4. Effect of the NO3‒ : H2PO4
‒ : SO42‒ proportion in the nutrient solutions on the concentration of nitrogen (N), phosphorus (P)
and sulfur (S) in shoots and roots of anthurium (Anthurium andraeanum Linden ex André) plants.
Nutrient solution Shoot Root
NO3- H2PO4
- SO4-2 N P S N P S
Proportion mmol kg-1 mmol kg-1 mmol kg-1 mmol kg-1 mmol kg-1 mmol kg-1
0.43 0.05 0.53 1342ab 52.4bc 63.7a 1325bc 150cd 91.4bc
0.80 0.02 0.18 1428ab 47.7c 37.2c 1556a 95e 81.9c
0.78 0.12 0.10 1419ab 56.7bc 45.8bc 1644a 230ab 85.1c
0.20 0.12 0.68 1231b 111.0a 36.4c 1242c 252a 89.0bc
0.49 0.12 0.39 1500a 61.8b 49.6abc 1431abc 179bc 80.5c
0.28 0.02 0.70 1338ab 47.3b 60.6ab 1238c 88e 106.0ab
0.36 0.10 0.55 1438ab 58.4bc 55.2ab 1508ab 188bc 112.0a
0.60 0.05 0.35 1250b 53.3bc 65.6a 1525ab 116de 91.7bc

58
Table 5. Models that estimate nitrogen (N), phosphorus (P) and sulfur (S) concentration in shoots and roots of anthurium (Anthurium
andraeanum Linden ex André) plants in response to the NO3‒ : H2PO4
‒ : SO42‒ proportion in the nutrient solution.
Nutrient
concentration
(mmol kg-1)z
Model P < Lack
of Fit
R2 Adequate
precision
Root
N = +2534NO3−135050H2PO4+2923SO4+148441(NO3×H2PO4)−9768(NO3×
SO4) + 137289(H2PO4×SO4)+85850(NO3× H2PO4×SO4)
0.01 0.44 0.74 10.46
P = +59.0NO3+1317H2PO4+80.8SO4 0.01 0.11 0.65 11.1
S = +163NO3−15221H2PO4+346SO4+16786(NO3×H2PO4)−1072(NO3×SO4)
+15387(H2PO4×SO4)+8283(NO3× H2PO4×SO4)
0.01 0.77 0.72 8.3
Shoot
N = +2030NO3−21659H2PO4+2440SO4+20061(NO3×H2PO4)−5201(NO3×S
O4)+12316(H2PO4×SO4)+60648(NO3× H2PO4×SO4)
0.01 0.10 0.54 6.23
P = −28.7NO3+9569H2PO4−135SO4−10014(NO3×H2PO4)+833(NO3×SO4)−
8145(H2PO4×SO4)+−9120(NO3× H2PO4×SO4)
0.01 0.29 0.88 16.8
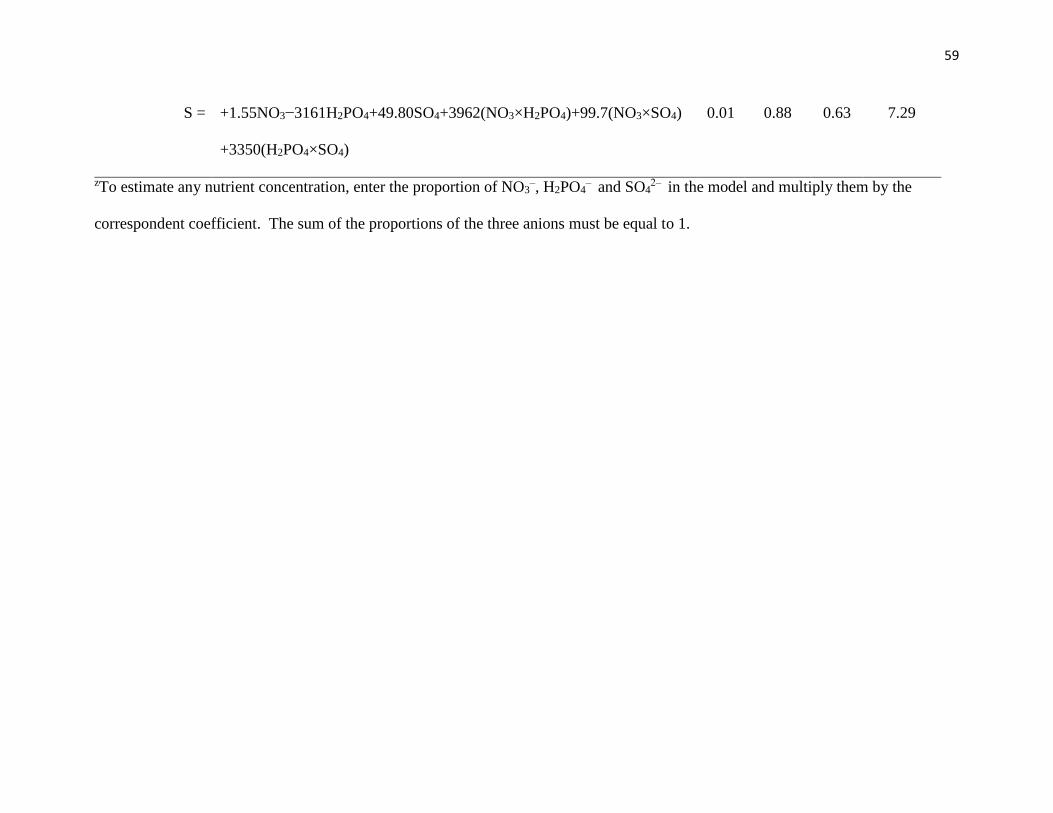
59
S = +1.55NO3−3161H2PO4+49.80SO4+3962(NO3×H2PO4)+99.7(NO3×SO4)
+3350(H2PO4×SO4)
0.01 0.88 0.63 7.29
zTo estimate any nutrient concentration, enter the proportion of NO3‒, H2PO4
‒ and SO42‒ in the model and multiply them by the
correspondent coefficient. The sum of the proportions of the three anions must be equal to 1.
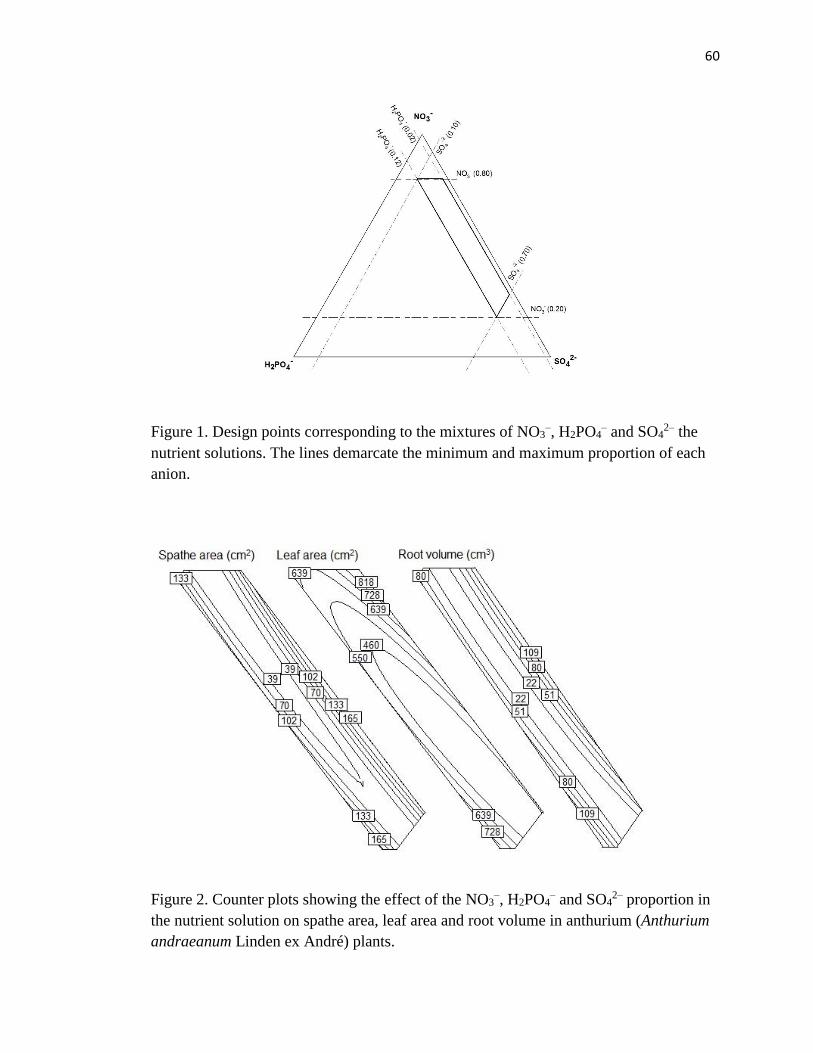
60
Figure 1. Design points corresponding to the mixtures of NO3‒, H2PO4
‒ and SO42‒ the
nutrient solutions. The lines demarcate the minimum and maximum proportion of each
anion.
Figure 2. Counter plots showing the effect of the NO3‒, H2PO4
‒ and SO42‒ proportion in
the nutrient solution on spathe area, leaf area and root volume in anthurium (Anthurium
andraeanum Linden ex André) plants.

61
Figure 3. Counter plots showing the effect of the NO3‒, H2PO4
‒ and SO42‒ proportion in
the nutrient solution on shoot, root and total fresh mass in anthurium (Anthurium
andraeanum Linden ex André) plants.
Figure 4. Counter plots showing the effect of the NO3‒, H2PO4
‒ and SO42‒ proportion in
the nutrient solution on shoot, root and total dry mass in anthurium (Anthurium
andraeanum Linden ex André) plants.
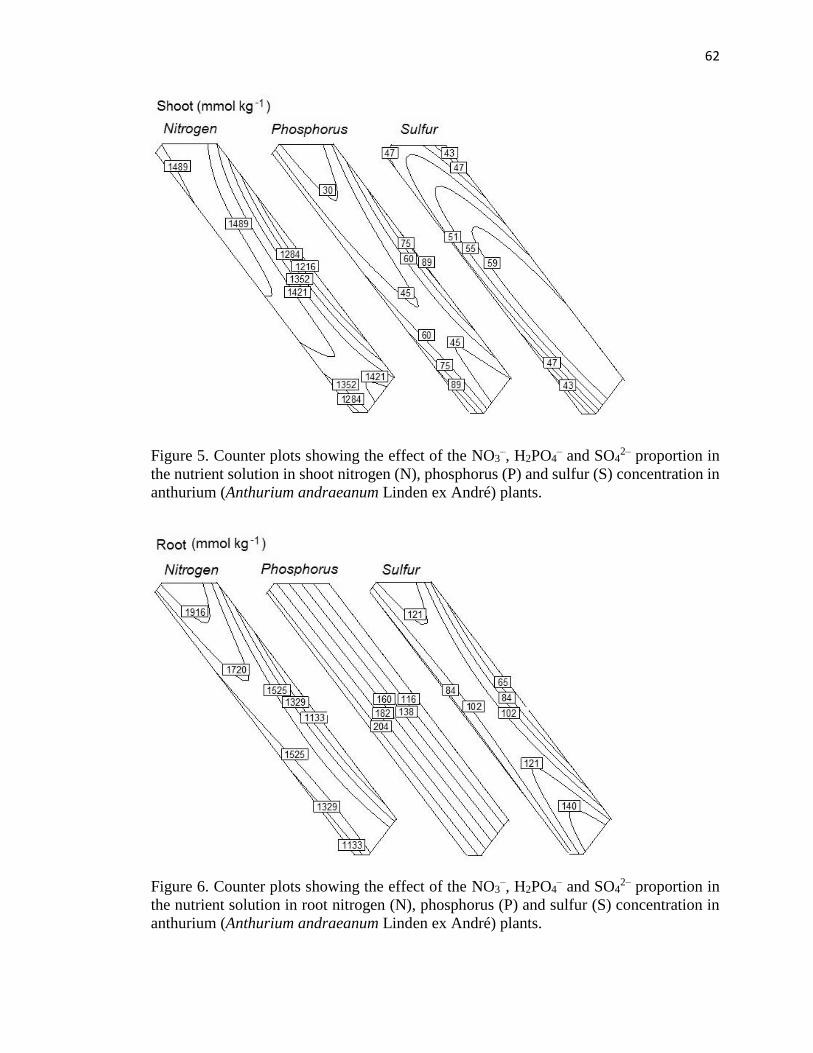
62
Figure 5. Counter plots showing the effect of the NO3‒, H2PO4
‒ and SO42‒ proportion in
the nutrient solution in shoot nitrogen (N), phosphorus (P) and sulfur (S) concentration in
anthurium (Anthurium andraeanum Linden ex André) plants.
Figure 6. Counter plots showing the effect of the NO3‒, H2PO4
‒ and SO42‒ proportion in
the nutrient solution in root nitrogen (N), phosphorus (P) and sulfur (S) concentration in
anthurium (Anthurium andraeanum Linden ex André) plants.
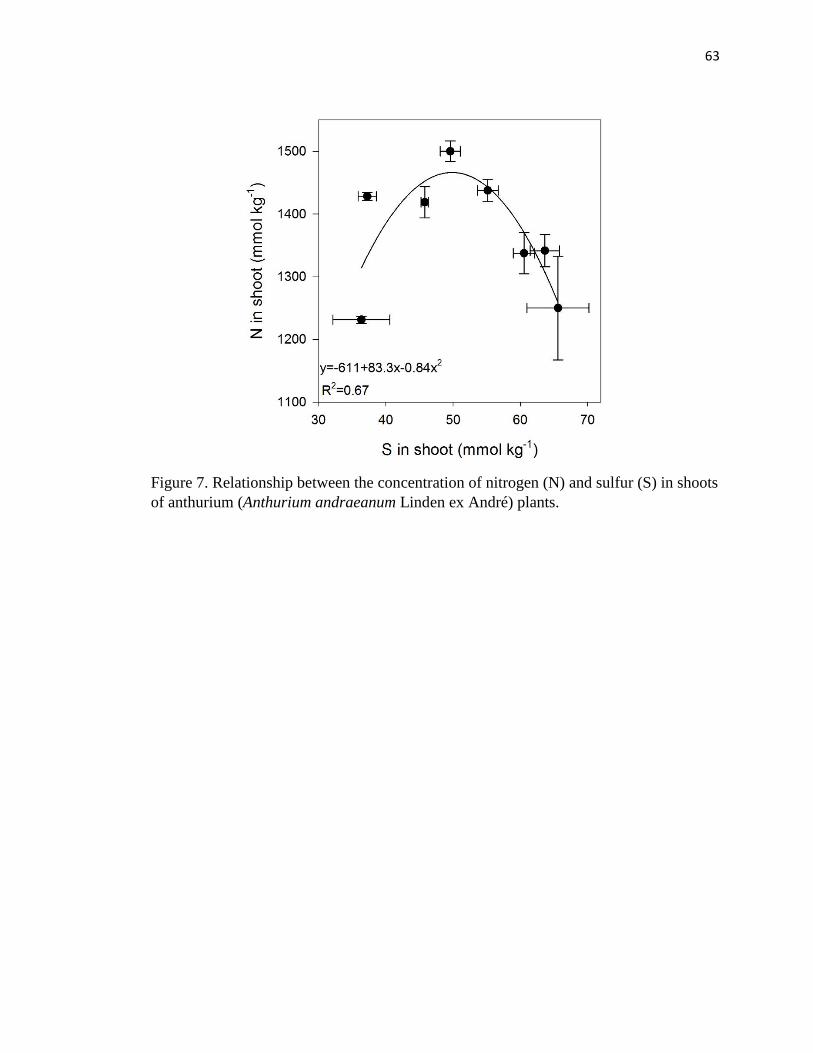
63
Figure 7. Relationship between the concentration of nitrogen (N) and sulfur (S) in shoots
of anthurium (Anthurium andraeanum Linden ex André) plants.

64
Figure 8. Correlation between shoot and root sulfur concentration on fresh weight and
dry mass of shoots in anthurium (Anthurium andraeanum Linden ex André) plants.
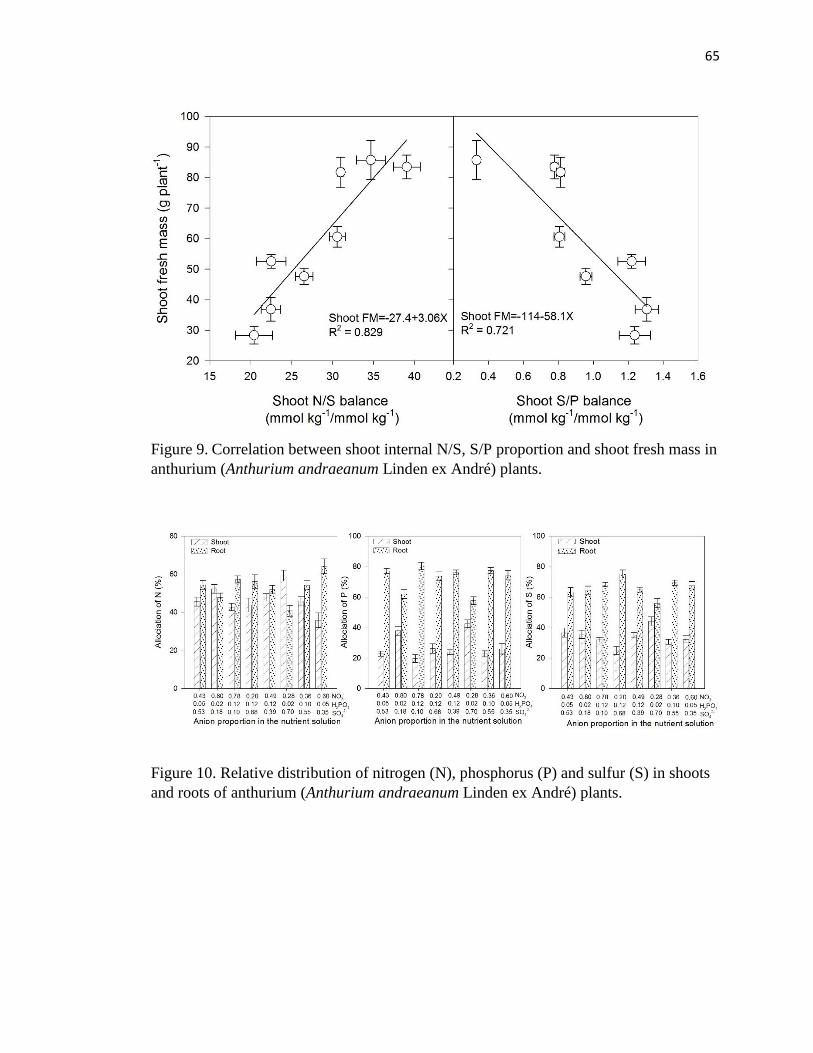
65
Figure 9. Correlation between shoot internal N/S, S/P proportion and shoot fresh mass in
anthurium (Anthurium andraeanum Linden ex André) plants.
Figure 10. Relative distribution of nitrogen (N), phosphorus (P) and sulfur (S) in shoots
and roots of anthurium (Anthurium andraeanum Linden ex André) plants.

66
Figure 11. Relationship between the NO3‒, H2PO4
‒ and SO42‒ proportion in the nutrient
solution (while symbols) with the NO3‒, H2PO4
‒ and SO42‒ proportion (grey symbols) in
the shoot and root of anthurium (Anthurium andraeanum Linden ex André) plants.
Numbers indicate the treatment nutrient solution as shown in Table 1. Data for shoot and
root balance calculated on meq kg‒1.

67
CONCLUSIONES
La modificación del balance de aniones y cationes en la solución nutritiva permitió
establecer rangos específicos de K+: Ca2+: Mg2+ y NO3- : H2PO4
- : SO42- con los cuales se
obtener mejores características morfológicas en las plantas de anturio cultivadas en
maceta. La solución optima puede contener proporciones muy variadas de K+, nivel medio
4.8-8.8 meq L-1, nivel alto 10.8-13.0 meq L-1, Ca2+ alto (10.8-13.6 meq L-1) y Mg2+ bajo
(0.02-0.16 meq L-1), ó Ca2+ bajo (5.0-5.8 meq L-1) y Mg2+ alto (2.0-2.2 meq L-1). En cuanto
a aniones un aumento en el crecimiento se obtuvo a baja (4.0 meq L-1) o alta (15.6-16 meq
L-1) proporción de NO3-, amplio rango de H2PO4
- (0.4-2.4 meq L-1) y bajo (2.0-3.6 meq
L-1) o alto (13.6 meq L-1) nivel de SO4-2.
Se observó que el balance de cationes y aniones interno no se vio afectado al modificar
las proporciones de K+: Ca+2: Mg+2 y NO3- : H2PO4
- : SO42- en la solución nutritiva, lo que
demuestra que el anturio posee una alta capacidad selectiva para estos iones.

68
REFERENCIAS
Benton, J.J. 1997. Hydroponics : a practical guide for the soilless grower, CRC Press,
United States of America.
Benton, J.J. 2005. Hydroponics : a practical guide for the soilless grower, Second edi. ed,
Statewide Agricultural Land Use Baseline 2015. CRC Press, United States of
America. doi:10.1017/CBO9781107415324.004
Castillo Diego, T.2012. Ensayos. Viabilidad económica del cultivo de la flor de anturio y
esquemas de comercialización. Temas de Ciencia y Tecnología 15(48). pp 19 –
25. http://www.utm.mx/edi_anteriores/temas48/T48_1Ensayo3-
Viabilidad_economica.pdf
Chang K.H., Wu R.Yi., Chang G. P., Hsieh T.F., Chung R. S. 2012. Effects of Nitrogen
Concentration on Growth and Nutrient Uptake of Anthurium andraeanum Lind.
Cultivated in Coir under Different Seasonal Conditions HortScience, 47(4):515-
521.
Chang, K.H., Wu, R.Y., Chuang, K.C., Hsieh, T.F., Chung, R.S., 2010. Effects of
chemical and organic fertilizers on the growth, flower quality and nutrient uptake
of Anthurium andreanum, cultivated for cut flower production. Scientia
Horticulturae. 125: 434–441.
Dufour, L., Guérin, V., 2003. Growth, developmental features and flower production of
Anthurium andreanum Lind. in tropical conditions. Scientia Horticulturae. 98: 25–
35.
Dufour, L., Guérin, V., 2005. Nutrient solution effects on the development and yield of
Anthurium andreanum Lind. in tropical soilless conditions. Scientia Horticulturae.
105: 269–282.
Fageria, V. D. (2001). Nutrient interactions in crop plants. Journal of plant nutrition,
24(8):1269-1290.
Favela, E., Preciado, R. P., y Benavides, A. 2006. Manual para la preparación de
soluciones nutritivas. Departamento de Horticultura. Universidad Autonoma
Agraria Antonio Narro Unidad Torreón,
Higaki, T., Imamura, J.S., Paull, R.E., Street, W.L., 1992. N, P, and K Rates and Leaf
Tissue Standards for Optimum Anthurium andraeanum Flower Production
HortScience, 27(8):909-912.

69
Higaki, T., Rasmussen, H.P., Carpenter, W.J., 1984. A study of some morphological and
anatomical aspects of Anthurium andreanum Lind. University of Hawaii,
HITAHR Res. Ser. 030, 12 pp.
Kläring, H. P. (2001). Strategies to control water and nutrient supplies to greenhouse
crops. A review. Agronomie, 21(4):311-321.
Kleiber, T., Komosa, A. 2010. Guide values for anthurium ( Anthurium cultorum Birdsey)
grown in expanded clay. Journal of. Plant Nutrition. 33: 1506–1518.
Kleiber, T., Komosa. A. 2006. Differentiation of macroelement contents in nutrient
solution and drainage water in growing of Anthurium ( Anthurium cultorum
Birdsey ) in expanded clay. Acta Scientiarum Polonorum., Hortorum Cultus 5(2):
69-78.
Kleiber, T., Komosa. A. 2010. Differentiated Microelement Content in Anthurium
(Anthurium Cultorum Birdsey) Leaves Journal of Elementology, 15(2): 301–311.
Landowne, D. 2006. Cell Physiology, McGraw-Hill Medical Publishing Division, ISBN
0071464743, Miami, FL., U. S. A.
Mari, M. J. 2016. Etimología de los géneros de plantas en Puerto Rico. p.p.13
edicionesdigitales.info/etimologia/etimologia.pdf
Marschner, H. 1995. Mineral Nutrition of Higher Plants. Academic Press. ISBN 0-12-
473542-8, New York, U. S. A.
Mohammad E., Albatal N., Haddad S. 2016. Effect of Electrical Conductivity (EC) on
the Growth and Flower Production of Anthurium ( Anthurium andreanum ).
Journal of Horticulture, 6(15): 1-7.
Murguía, G. J., Riestra, D., Gallardo L.F., Alonso, L.A., Olguín, P. C., Cruz, C.J., G.,
Rodríguez, D.A., Flores, A., 2003. Caracterización de Factores Socioeconómicos
del Cultivo de Anturio (Anthurium andreanum Lin.). Revista Chpingo Serie
Horticultura, 9:163–170.
Nemali, K. S. and Van Iersel, M. W. 2004. Light Intensity and Fertilizer Concentration:
I.Estimating Optimal Fertilizer Concentration from Water-Use Efficiency of Wax
Begonia. HortScience, 39(6):1287-1292.
Otero, N., Vitoria, L., Soler, A., Canals, A. 2005. Fertilizer characterization: major, trace
and rare earth elements. Applied Geochemistry, 20: 1473–1488.
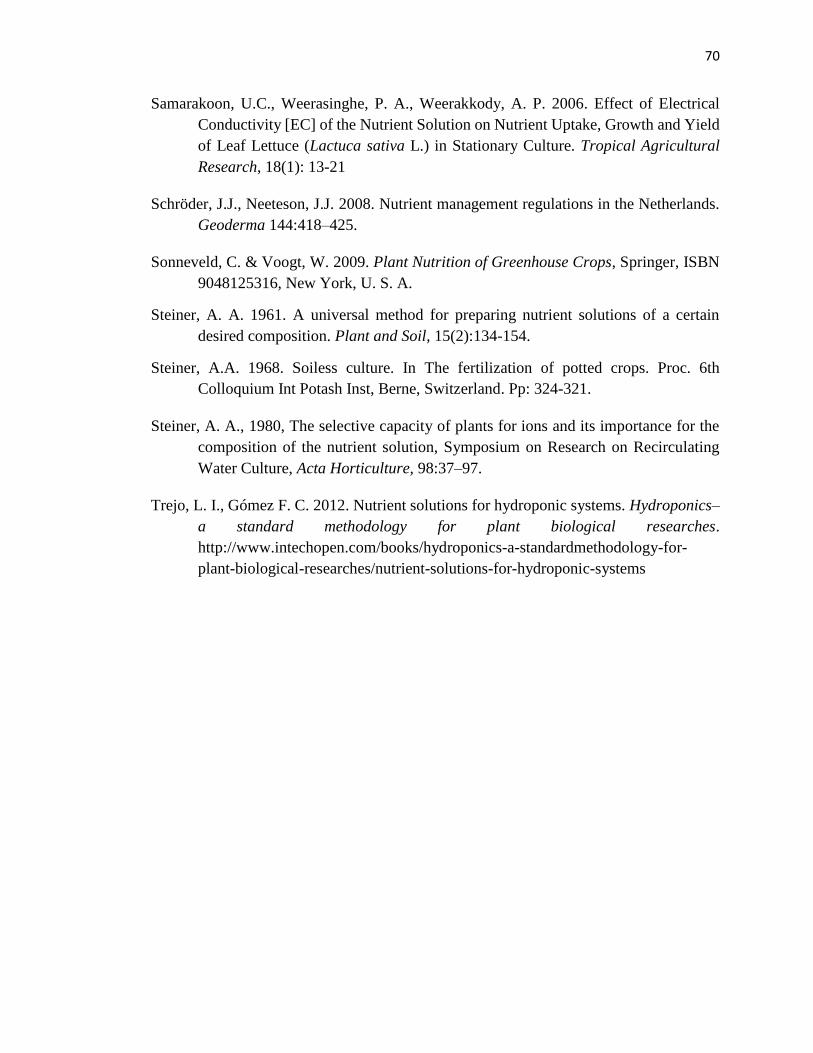
70
Samarakoon, U.C., Weerasinghe, P. A., Weerakkody, A. P. 2006. Effect of Electrical
Conductivity [EC] of the Nutrient Solution on Nutrient Uptake, Growth and Yield
of Leaf Lettuce (Lactuca sativa L.) in Stationary Culture. Tropical Agricultural
Research, 18(1): 13-21
Schröder, J.J., Neeteson, J.J. 2008. Nutrient management regulations in the Netherlands.
Geoderma 144:418–425.
Sonneveld, C. & Voogt, W. 2009. Plant Nutrition of Greenhouse Crops, Springer, ISBN
9048125316, New York, U. S. A.
Steiner, A. A. 1961. A universal method for preparing nutrient solutions of a certain
desired composition. Plant and Soil, 15(2):134-154.
Steiner, A.A. 1968. Soiless culture. In The fertilization of potted crops. Proc. 6th
Colloquium Int Potash Inst, Berne, Switzerland. Pp: 324-321.
Steiner, A. A., 1980, The selective capacity of plants for ions and its importance for the
composition of the nutrient solution, Symposium on Research on Recirculating
Water Culture, Acta Horticulture, 98:37–97.
Trejo, L. I., Gómez F. C. 2012. Nutrient solutions for hydroponic systems. Hydroponics–
a standard methodology for plant biological researches.
http://www.intechopen.com/books/hydroponics-a-standardmethodology-for-
plant-biological-researches/nutrient-solutions-for-hydroponic-systems