Creating winning destinations · Abercrombie & Fitch growing their UK presence in these centres in...
180
intu properties plc Annual report 2018 Creating winning destinations
Transcript of Creating winning destinations · Abercrombie & Fitch growing their UK presence in these centres in...

intu properties plcAnnual report 2018
Creating winning destinations
intu properties plc Annual report 2018
Contents
Our purpose is to create compelling, joyful experiences that make our customers smile and help brands flourish
This creates value for our shareholders, benefits our communities and delivers long-term success
Go online intugroup.co.uk/en/ investors/intu-annual-report-2018/
About us IFC
Strategic reportChairman’s statement 12019 strategy 2Market trends 4Chief Executive’s review 6Our top properties 8Our growth story 10Highlights of 2018 12Investment case 14
Creating winning destinationsInside intu 16Our view of the market 18Making customers smile 20Helping retailers flourish 22Creating compelling experiences 24intu Watford – a winning destination 26At the heart of communities 28
Our business model 30Relationships 32Strategy overview 34Key performance indicators 36Focus on risk 38Principal risks and uncertainties 40Operating review 42Financial review 48Our people 54Corporate responsibility 57
GovernanceIntroduction 60Board of Directors 62Executive Committee 64The Board 65Viability statement 70Audit Committee 71Nomination and Review Committee 76Directors’ remuneration report 78Directors’ report 94Statement of Directors’ responsibilities 96
Financial statementsIndependent auditors’ report 98Consolidated income statement 105Consolidated statement of comprehensive income 106Balance sheets 107Statements of changes in equity 108Statements of cash flows 110Notes to the financial statements 111
Other informationInvestment and development property 160Financial covenants 163Financial information including share of joint ventures 165Underlying profit statement 169EPRA performance measures 170Financial record 172Glossary 173Shareholder information 175
Welcome to our annual report 2018

About us…We own, develop and manage some of the most popular retail and leisure destinations in some of the strongest locations in the UK and Spain
8of the UK’s top-20 shopping centres
£4.8bntotal economic contribution in 2018
£428mpipeline of projects in the next three years
97%occupancy
400mcustomer visits per annum
64%reduction in carbon emission intensity since 2010

£201minvested in capital projects in 2018
18%of units are catering and leisure
75consistently high net promoter score
76%prompted brand awareness
5,000potential residential units

Chairman’s statement
In a challenging retail environment we have delivered a robust operational performance in 2018
We are meeting the demands of a challenging retail property sector with a revised strategy
focusing on winning destinations and strengthening our balance sheet. This strategy, along with our best-in-class centres, positions us well for the future.
The last 12 months2018 has been a challenging year for the retail property market. Sentiment towards our sector has been negative, with headwinds from Brexit uncertainty and challenges facing the retail sector from increased costs and online sales growth.
However, we own many of the best centres in the UK such as intu Trafford Centre, intu Lakeside, intu Merry Hill and intu Metrocentre and it is these centres where retailers want to focus their physical retail. This can be seen by the likes of Next, Zara and Primark upsizing and international retailers such as Abercrombie & Fitch growing their UK presence in these centres in the last year.
We have a concentrated portfolio, with our eight top-20 UK centres and three top-10 Spanish centres accounting for around 75 per cent of our asset base by value. Despite the headwinds in the general market, our centres continued to deliver strong operational metrics with robust income streams.
It is this quality that attracted two bids for the Company in 2018. As a Board, we engaged with both bidders as we believed it was in the best interest of shareholders, but we were unable to conclude an offer satisfactory to all parties.
Our peopleI would like to convey my thanks to all our staff for their commitment in what has been an extremely busy year for the Company.
David Fischel announced earlier in 2018 that he would be stepping down as Chief Executive and on behalf of the Board I would like to thank him for his tireless service to the business for over 30 years including the last 18 as Chief Executive. Over this period, he has been instrumental in transforming the business into the UK’s leading owner, manager and developer of prime, regional shopping centres. We are progressing well with appointing David’s successor which we would hope to announce in the near future and until then he is continuing to lead the business.
Richard Gordon and Louise Patten have stepped down from the Board and I would like to thank them for their deliberations over the past several years, in particular Richard who has had a long association with intu going back to 1996.
DividendIn November we announced we would significantly reduce the dividend paid in 2019. In line with our revised strategy, the Board are not recommending the payment of a final dividend for 2018, meaning the total amount paid in respect of 2018 is 4.6 pence per share.
Our revised strategy – looking to 2019As I have already noted, we own many fantastic centres with robust income streams delivering strong operating metrics. However, in the evolving environment in which we operate, we cannot stand still and need to continue with our disposals programme. I remain confident in intu’s future on a standalone basis and believe that our revised strategy of delivering strong underlying individual centre performance, adapting fast to a changing retail environment and making smart use of capital will position us well for the coming years.
Read about our strategy going forward on pages 2 and 3
John StrachanChairman
intu Merry Hill: Next opened their new 80,000 sq ft flagship store in August 2018, doubling its size. Other retailers upsizing in the centre include JD Sports and Primark
Strategic reportFin
ancial statem
ents
Other in
formation
Govern
ance
1intu properties plc Annual report 2018

Priorities in 2019 — continued focus on like-for-like net
rental income — maintain high occupancy — increase rents from new lettings and
rent reviews — deliver investment projects pipeline
Delivering strong underlying individual centre performance
Improving centre performance has been and will continue to be our driving force. Getting this right delivers growing rents and benefits us for the long term through income and capital growth. Future performance also includes looking at the best use for every area of our assets, which as we look ahead, is wider than just retail.
2019 strategy
Our strategy is to focus on winning destinations
Our strategy is to focus on winning destinations delivering resilient income streams, investing where
there is the greatest potential, and reducing our debt to assets ratio to below 50 per cent through disposals, part disposals and introducing partners to assets. In recent years we have successfully recycled capital through this approach, disposing of over £1 billion of assets.
The retail environment remains challenging. Our response is to adapt our strategy, protecting shareholder value in the short term and maximising growth in the medium term as we progress the repositioning process.
Our strategy will ensure that we focus on the centres with the greatest potential, with a capital structure that enables us to make the required investment.
Optimal positioning in a fast-moving environment We operate in a fast-moving retail and leisure environment and to ensure we are optimally positioned we will:
— refine the portfolio to concentrate on regional destinations, making high- impact investments to ensure they remain winning locations where customers love to come often and are great locations for retailers where it is easy for them to do business
— leverage the brand, aided by the delivery of world class service, compelling experiences and innovative digital initiatives
— deliver a compelling value proposition for our tenants, ensuring their locations in our centres are among their top quintile in the UK
— actively pursuing complimentary non-retail development alternatives to maximise the potential from our significant land holdings around our centres which offer many opportunities for alternative uses, including residential and hotels
A capital structure to meet our needs To deliver this transformation, we will create a capital structure to meet our needs, refinancing debt both as required and where attractive for the Group to do so, targeting a reduction in our debt to assets ratio to below 50 per cent over time. This will be delivered by:
— significantly reducing the dividend paid and disposing of sundry assets
— the disposal and part disposals of centres which do not meet our winning destination criteria over the medium term. We have the flexibility to introduce partners into some of our flagship centres, with around two-thirds, by value, of our total assets 100 per cent owned
Strategic objectives for 2019 Our three strategic objectives for 2019 are:
1. Delivering strong underlying individual centre performance
2. Adapting fast to a changing retail environment
3. Making smart use of capital
Read about how markets are affecting our strategy on pages 4 and 5
Strategic report
2 intu properties plc Annual report 2018

Delivering strong underlying
individual centre performance
Mak
ing
smart
use
of ca
pital
Adapting fast toa changing retail environment
Winningdestinations
Priorities in 2019 — identify further transformational
projects — progress opportunities identified
for alternative uses — increase concentration of retailers’
top-quintile stores — continuing to develop the intu
brand experience
Priorities in 2019 — restore debt to assets ratio to below
50 per cent — revised dividend policy — optimise portfolio, with capital recycling
as necessary — maintain adequate financial headroom
Adapting fast to a changing retail environment
Retail has always been dynamic, but the speed of change is increasing. It is our job to know what is coming next and partner with our tenants to deliver what they need. Providing the right environment for top retailers will ensure we have their best stores which will continue to prosper as their portfolios concentrate on the very best locations.
Making smart use of capital
To enable us to transform the business, we need a capital structure that will allow us to make the required changes. Reducing leverage and increasing financial headroom, which will only be meaningfully changed by disposals, part disposals and the introduction of partners, will give us more flexibility for future investment opportunities and refinancing activity.
Our strategic focus
See our business model on pages 30 and 31
Our overall business model remains unchanged. Our assets and resources and what we do remain the same but the strategy that delivers sustainable value for our shareholders and stakeholders has been adapted to better represent today’s opportunities and challenges at our winning destinations.
Strategic reportFin
ancial statem
ents
Other in
formation
Govern
ance
3intu properties plc Annual report 2018

Market trends
We closely monitor market trends to enable us to respond to new opportunities and challenges and to ensure our centres are well-positioned both now and for the future
Today’s marketA cautious consumerThe continuing Brexit uncertainty is weighing heavily on consumer confidence. The GfK measure of consumer confidence has been subdued since the EU referendum and reduced further in the last few months of 2018. In particular, the measure of how consumers feel about the general economic situation over the next 12 months has slipped.
Against this, employment is at its highest level since 1971 and wage growth has outpaced inflation since February 2018. This has translated to growth in disposable income in 2018, an increase of 6 per cent according to the Asda disposable income tracker, giving a more positive outlook than in the last few years.
A challenging time for weaker retailersEconomic uncertainty and changes in what customers are spending their money on has impacted sales growth, with non-food retailer sales marginally down (0.3 per cent) on average in 2018 according to the British Retail Consortium (BRC).
Shopping behaviours are also changing. The trend of growth in online sales (BRC 2018: +1.7 per cent), offset by falling in-store sales (BRC 2018: -2.0 per cent) has continued, but it is clear the store still plays a vital role irrespective of how the product is bought.
Store profitability is under pressure from limited sales growth and increased costs from business rates, national living wage and distribution costs of online sales. The weakness in Sterling has also raised the cost of retailers’ goods sold.
2018 has seen a higher level of administrations and CVAs than in recent years with over 2,500 stores affected according to the Centre for Retail Research. High profile closures and CVAs include Toys R Us, House of Fraser, New Look and HMV, adding to the negative retail sentiment.
A widening gap between the best and the restAs we operate in many of the top UK retail destinations where retailers want to maintain their best stores, we have been relatively unaffected by the problems faced by the recent administrations and CVAs.
The administrations and CVAs in the year relate to around 6 per cent of our passing rent. The majority of these (72 per cent) have had minimal impact, with the retailer keeping their best performing stores in our portfolio open on the existing rent. Of the remainder, 9 per cent are trading on discounted rents, 14 per cent have closed and 5 per cent have been re-let.
Reduced demand from investors in shopping centresThe uncertainty of Brexit, the structural change in retail and higher than normal level of administrations and CVAs has significantly reduced demand for prime shopping centres in 2018. With this weakening sentiment, valuation yields have risen throughout the year.
For transactions completed in 2018, there has been a greater focus on the quality of income, with investors seeking a higher net initial yield to protect returns where capital growth is seen as harder to deliver.
More certainty in the course of 2019 over what Brexit means, and retailers addressing the structural changes in their sector, will enable investors to make better informed decisions.
The US is now emerging from similar issuesThe US has also seen significant retailer failures, in particular the well-publicised weaker department stores, over the last 18 months with a clear differentiation between the prime and failing malls. This, coupled with a stabilising multichannel model and online retailers such as Amazon taking more physical space, has increased investor confidence in the best centres.
With the UK typically running some two years behind the US in terms of market trends, we would expect to see similar patterns emerge as the prime malls take market share from weaker locations, which should reignite investor demand.
Tomorrow’s demandsThe shopping journey is changing, but stores are still criticalIn our dynamic multichannel world, how people shop and what they want from a visit to a shopping centre is evolving rapidly.
There are now many routes for customers to take on their shopping journeys. They may see a retailer’s store as a showroom to view and try a product or the retailer’s online presence as a medium to consume product information – but both have an important part to play. A key driver for customers is convenience, whether that is smartphone access to a retailer whenever it suits them or physical access to a store’s
Strategic report
4 intu properties plc Annual report 2018

full range as part of a retail experience incorporating leisure as part of a day out.
So, a visit to a shopping centre must offer all the things our customer wants. While online sales continue to increase, GlobalData estimate that around 85 per cent of all transactions still touch a store. What is important to the customer is that their chosen shopping location has all the best stores offering a full range of their products.
Flexibility is key for changing customer visitsAdditionally, as the proportion of consumer spend on leisure is increasing, customers want places to offer a more experiential day out, be it cafes, restaurants, cinemas or activities such as bowling, mini-golf, climbing or skiing.
Finally, shoppers are not all the same: different age groups and different demographics want different things, so ensuring the mix caters for all their requirements is a further important step.
Tenants focus on brand, perception and customer serviceAs the demands of their customers increase, retailers are looking to further integrate their online and in-store models, with the best retailers moving to seamless propositions for shoppers. Key to this is a detailed understanding of their customers and faultless customer service whatever the channel.
Managing their brands and the perceptions of them is also critical, whether it be the physical proposition or social media where the position of influencers becomes more important.
Similarly, for leisure operators who are now taking a higher proportion of a customer’s disposable income, the challenges and opportunities are the same.
We are responding with an adapted strategyA tenant-centric approachMaking customers smile and helping retailers flourish is key.
This is not a one-size-fits-all business. Different centres have different customer bases and we use our unique insight, assembled from extensive data, to help our retailers and deliver what our customers want.
As owners and curators of shopping centre space and the main landlord for many of the best retailers in the UK from Apple to Zara, we can ensure that our tenants are in the right space to maximise their ability to generate profits. We can guarantee them a level of quality from clean, secure and safe space with high footfall and long dwell times. By contrast, high streets have suffered where they are owned by multiple landlords or managed by budget-constrained local authorities.
Adapting fast in a changing retail environmentAs the role of the store evolves, for example with the increase in click and collect, we can offer our tenants a configuration that works successfully for their business model, be it more back of house space for storage and distribution or direct access to car parks for delivery pick-ups.
We are seeing this in a new generation of upsized flagship stores in our centres from Next at intu Metrocentre and intu Merry Hill, Zara at intu Lakeside to Primark at intu Merry Hill and intu Trafford Centre. All this helps to ensure that when customers visit our centres they have access to all the brands they want offering their full ranges.
On top of this, around 600 of our 3,300 units offer catering and leisure and the demand continues to increase. For instance, at intu Watford we are bringing an evening economy to its affluent catchment and at the family- oriented intu Lakeside we are introducing the likes of Nickelodeon, Hollywood Bowl and Puttshack.
A focus on the best destinationsWe remain focused on the best destinations, with a portfolio concentrated on the top centres in the UK and Spain which offer day-out destinations for customers and superior footfall for our tenants.
We continue to invest in the centres offering the maximum potential, including ongoing leisure projects at intu Lakeside and intu Xanadú. Additionally, we are progressing mixed-use opportunities from our significant land holdings around centres.
Ensuring our centres remain appealing to customers and retailers will mean that they should become more attractive to investors once the current negative sentiment abates.
18%of our 3,300 units are catering and leisure
85%of all transactions touch a store(source: GlobalData)
Strategic reportFin
ancial statem
ents
Other in
formation
Govern
ance
5intu properties plc Annual report 2018

2018 has been an eventful and challenging year for intu.
The UK economy has struggled through a third year of pre-Brexit political uncertainty. Specific to intu, we had to overcome the disruption from two public company offers, neither of which, for reasons outside our control, ultimately concluded.
I would like to thank the executive team and all intu staff for their outstandingly resolute and determined performance through these events which coincided with significant industry challenges.
In terms of UK economic data most relevant to intu, non-food retail sales were essentially static year-on-year, but online sales continued to grow so physical sales shrank. In fact, in-store non-food retail sales in the UK have shown a year-on-year reduction every month for the last two years. Retailer costs, by contrast, have not declined, not least as a result of the significant burden of the UK’s property tax known as business rates.
Retailer failures therefore picked up substantially, impacting our net rental income by an estimated 1.9 per cent. Increasingly negative investor sentiment towards retail property fed through to a 13.3 per cent fall in the valuations of our UK assets.
In the face of this adversity, shareholders have seen the share price decline to a level representing for intu a virtually unprecedented discount to NAV per share (diluted, adjusted) of over 60 per cent.
intu’s strengths — leading owner, manager and developer of prime regional shopping centres with eight of the UK’s top-20 and three of Spain’s top-10
— consistently invested in centres with over £1 billion invested over the last four years
— resilient operating performance with occupancy at 97 per cent and 400 million customer visits per year
— clear 2019 objectives to return the debt to asset ratio to below 50 per cent and focus on winning destinations
Read more about winning destinations on pages 26 and 27
Plans to reduce debt to assets ratioOur debt to assets ratio at 31 December 2018 was 53 per cent, exceeding the Board’s target maximum of 50 per cent.
We propose to take the following steps to lower the Group’s debt to assets ratio over time to back below 50 per cent and lower the share price discount:
— retaining for the time being the cash generated by our activities rather than distributing it as dividend, commencing with no final dividend for 2018 (2017 final dividend: 9.4 pence). In 2018 we paid dividends of £188 million based on an annual dividend per share of 14.0 pence. Retaining the dividend will enable us to continue to invest in our winning destinations
— through further disposals and part disposals in due course in both the UK and Spain. Following £171 million of disposals in 2018, we will continue to recycle capital from individual assets. We consider substantial sales in the UK as challenging until a political resolution on the Brexit issue is achieved and not in shareholders’ interest while market sentiment towards UK retail property is so negative. In Spain we have received a number of unsolicited offers which we are evaluating
Resilient 2018 operating performanceDespite negative external factors, intu demonstrated considerable resilience in its operating performance through a challenging period, evidence of the underlying quality of the intu business. This includes ownership of eight of the
Chief Executive’s review
intu has again delivered a resilient operational performance which demonstrates how our centres differentiate themselves as winning destinations
Strategic report
6 intu properties plc Annual report 2018

UK’s top-20 centres, which amount to 69 per cent of our property assets by value, and three of the top-10 centres in Spain.
intu has reported a 0.6 per cent increase in like-for-like net rental income despite the retailer failures referred to above, stable occupancy around 97 per cent, and 248 new leases signed (2017: 217) at 6 per cent above previous rents. Lettings included an attractive mix of new and established names, significantly refreshing the centres, among them Abercrombie & Fitch, Uniqlo, Bershka and Monki, with the likes of Next, Primark, Zara and River Island all upsizing.
As we operate in many of the top UK retail destinations where retailers want to maintain their best stores, like-for-like net rental income performance was robust despite recent administrations and CVAs. The administrations and CVAs in the year relate to around 6 per cent of our passing rent, but the majority of these (72 per cent) have had minimal impact with the retailer keeping their stores open on the existing rent or with a small reduction.
Underlying earnings per share reduced from 15.0p to 14.4p mainly as a result of the income impact from disposals.
Fall in property valuationsAfter two years of essentially unchanged valuations for our UK centres, 2018 saw investor sentiment turn against retail property.
We reported a 6.2 per cent fall in property values in the six months to 30 June 2018 and a further 3.0 per cent in the quarter to 30 September 2018, with the full year reduction in our assets amounting to 13.3 per cent. Net initial yield (topped-up) climbed over the year from 4.36 per cent to 4.98 per cent and was the primary factor driving NAV per share (diluted, adjusted) down in the year from 411 pence to 312 pence.
By way of illustration of the impact on intu, a further 10 per cent fall in valuations, amounting to approximately a further £920 million reduction and 22 per cent overall since the beginning of 2018, would reduce NAV per share (diluted, adjusted) to around 243 pence from 312 pence and EPRA NNNAV per share to around 202 pence from 271 pence.
Focus on winning destinationsWith the structural changes going on in our industry, we regard it as increasingly important that intu focuses on centres which rank as winning destinations where customers love to come and retailers want to be.
Alongside the best retail, food, beverage and leisure, we intend to add further mixed-use attractions to these centres in the form of improved public space with more frequent experiences, residential space, hotels and other uses such as state-of-the-art office and co-working space.
Our retailers regularly confirm to us the importance of flagship physical stores in centres such as ours for their overall offer to consumers, with around 85 per cent of all transactions estimated to still touch a store. Our target is that every store in our centres should rank in the retailer’s top quintile of UK stores – ideally as many as possible in their top-20 stores.
Continuing investment programmeWe and our tenants have continued to invest in our centres in 2018. We invested £201 million which included completing the transformational extension of intu Watford that promotes Watford to a top-20 UK retail destination and handing over units to be fitted out at our exciting leisure extension at intu Lakeside which is 93 per cent pre-let and due to open in spring 2019. Our tenants invested around a further £161 million – £144 million introducing their latest shopfits and £17 million on maintenance expenditure.
Our pipeline over the next three years of £428 million includes £82 million on the regeneration of intu Broadmarsh which will be anchored by The Light cinema, the transformation and expansion of Barton Square at intu Trafford Centre, introducing Primark to the centre, and the creation of the new generation 255,000 sq m shopping resort intu Costa del Sol, near Málaga in Spain.
2019 objectivesWe have set three strategic objectives for 2019:
— delivering strong underlying individual centre performance
— adapting fast to a changing retail environment
— making smart use of capital
The first two objectives are to be measured by a number of key performance indicators, similar to those currently reported.
In terms of the third objective, making smart use of capital, the events of 2018 have impacted our views on capital allocation, especially as a result of the discount to NAV per share (diluted, adjusted) widening to an unprecedented 64 per cent between the reported NAV per share (diluted, adjusted) of 312 pence and the share price of 113 pence as at 31 December 2018.
Expressed another way, the year-end share price reflects a 29 per cent discount to gross assets of £9.2 billion. The implied initial yield on our assets to a shareholder at this share price is currently 7.03 per cent rather than the published net initial yield (topped-up) according to the year-end property valuations of 4.98 per cent.
Financial strengthWe have cash and available facilities of £548 million. Net external debt was largely unchanged at £4,867 million and we have refinanced or entered new facilities of over £500 million in 2018 illustrating that debt markets continue to be supportive of our highest quality retail property. We consider the structure of our borrowings, predominantly using flexible asset specific non-recourse arrangements, to be appropriate for our concentrated portfolio.
These facilities have significant covenant headroom. For example, a further fall of 10 per cent in capital values would create a covenant shortfall of only £1 million.
The table below shows the covenant shortfalls on our non-recourse debt that could be remedied from our available facilities for further falls in capital values:
Reduction in capital values from 31 December 2018
Total reduction in
capital values from
31 December 2017
Covenant shortfall
Implied Group
debt to assets ratio
10% 22% £1m 59%15% 26% £4m 62%20% 31% £43m 66%25% 35% £123m 71%
David FischelChief Executive
Strategic reportFin
ancial statem
ents
Other in
formation
Govern
ance
7intu properties plc Annual report 2018

Market value Size (sq ft 000) Ownership Number of storesAnnual
property incomeHeadline rent ITZA
ABC1 customers Key tenants
UK super-regional centresintu Trafford Centre £2,098m 2,020 100% 228 £94.7m £450 60% Debenhams, Topshop, Selfridges, John Lewis, Next, Apple, Ted Baker, Victoria’s Secret, Odeon,
Legoland Discovery Centre, H&M, Hamleys, Marks & Spencer, Zara, Sea Life, Abercrombie & Fitch
intu Lakeside £1,250m 1,612 100% 259 £55.8m £344 55% House of Fraser, Debenhams, Marks & Spencer, Topshop, Zara, Primark, Vue, Victoria’s Secret, H&M, Next, Apple, Nickelodeon
intu Metrocentre £842m 2,076 90% 306 £46.4m £280 55% House of Fraser, Marks & Spencer, Debenhams, Next, Apple, H&M, Odeon, Topshop, Zara, Primark, River Island
intu Merry Hill £777m 1,671 100% 217 £41.3m £200 42% Marks & Spencer, Debenhams, Primark, Next, Topshop, Asda, Boots, H&M, Odeon
intu Braehead £430m 1,123 100% 123 £29.0m £190 57% Marks & Spencer, Primark, Apple, Next, H&M, Topshop, Hollister, Superdry, Sainsbury’s
Cribbs Causeway £217m 1,076 33% 154 £12.8m £305 80% John Lewis, Marks & Spencer, Apple, Next, Topshop, Hugo Boss, H&M, Tesla, The White Company
UK major city centresManchester Arndale £410m 1,811 48% 258 £22.2m £285 57% Harvey Nichols, Apple, Burberry, Topshop, Next, Ugg, Hugo Boss, Superdry, Zara, Victoria’s Secret,
Paul Smith, Monki
intu Watford £407m 1,089 93% 166 £18.7m £200 81% John Lewis, Marks & Spencer, Next, Debenhams, Apple, Zara, Primark, Lego, H&M, Topshop, Hugo Boss, Cineworld
intu Derby £373m 1,302 100% 208 £27.9m £110 53% Marks & Spencer, Next, Debenhams, Sainsbury’s, Boots, Topshop, Cinema de Lux, Zara, H&M, Hollywood Bowl
St David’s, Cardiff £295m 1,391 50% 203 £16.7m £212 71% John Lewis, Debenhams, Marks & Spencer, Apple, Hugo Boss, H&M, River Island, Hamleys, Primark, Victoria’s Secret
intu Eldon Square £281m 1,385 60% 142 £16.3m £295 57% John Lewis, Fenwick, Debenhams, Waitrose, Apple, Hollister, Topshop, Boots, River Island, Next
intu Victoria Centre £261m 976 100% 118 £19.0m £225 57% John Lewis, House of Fraser, Next, Topshop, River Island, Boots, Urban Outfitters, Superdry
Spanish centres
Market value Size1(sq m 000) Ownership Number of storesAnnual
property income Key tenants
intu Xanadú €271m 120 50% 206 €13.4m El Corte Inglés, Zara, Primark, Apple, H&M, Mango, SnowZone, Cinesa, Bricor, Decathlon
intu Puerto Venecia €268m 119 50% 201 €12.2m El Corte Inglés, Primark, Ikea, Apple, Decathlon, Cinesa, H&M, Mediamarkt, Zara, Hollister, Toys R Us
intu Asturias €161m 74 50% 146 €8.1m Primark, Zara, H&M, Cinesa, Eroski, Mango, Fnac, Mediamarkt, Sfera
1 Excludes owner occupied space.
Our top properties
intu Merry HillSince taking full ownership in 2016 we have cemented intu Merry Hill’s position as the regional out-of-town centre for the West Midlands. In 2018, Next opened a new 80,000 sq ft flagship store, with Primark and Sports Direct also upsizing in the year. The centre will be further enhanced by our planned multimillion-pound refurbishment of the external facade.
Customers who visit at least weekly
49%
intu Trafford Centreintu Trafford Centre is the only UK location other than Oxford Street where you can find Selfridges, John Lewis, Debenhams and Marks & Spencer in one place. As the prime shopping destination in the northwest, it is no wonder that Abercrombie & Fitch are following many others in making it their first stop as they expand outside central London.
intu Lakesideintu Lakeside offers a compelling mix of retail, catering and leisure with something for all the family. Zara and River Island recognise the centre as a key retail destination and have upsized their flagship stores. There will be even more entertainment when the leisure extension opens in spring 2019, introducing Nickelodeon, Puttshack, Hollywood Bowl and Flip Out to the mix.
Average dwell time
2.5 hoursFootfall
30m
We own, develop and manage some of the best shopping centres, in some of the strongest locations, across the UK and in Spain
Strategic report
8 intu properties plc Annual report 2018

1
2
3
45
67
8
9
10
11
12
13
1415
16 **
Market value Size (sq ft 000) Ownership Number of storesAnnual
property incomeHeadline rent ITZA
ABC1 customers Key tenants
UK super-regional centresintu Trafford Centre £2,098m 2,020 100% 228 £94.7m £450 60% Debenhams, Topshop, Selfridges, John Lewis, Next, Apple, Ted Baker, Victoria’s Secret, Odeon,
Legoland Discovery Centre, H&M, Hamleys, Marks & Spencer, Zara, Sea Life, Abercrombie & Fitch
intu Lakeside £1,250m 1,612 100% 259 £55.8m £344 55% House of Fraser, Debenhams, Marks & Spencer, Topshop, Zara, Primark, Vue, Victoria’s Secret, H&M, Next, Apple, Nickelodeon
intu Metrocentre £842m 2,076 90% 306 £46.4m £280 55% House of Fraser, Marks & Spencer, Debenhams, Next, Apple, H&M, Odeon, Topshop, Zara, Primark, River Island
intu Merry Hill £777m 1,671 100% 217 £41.3m £200 42% Marks & Spencer, Debenhams, Primark, Next, Topshop, Asda, Boots, H&M, Odeon
intu Braehead £430m 1,123 100% 123 £29.0m £190 57% Marks & Spencer, Primark, Apple, Next, H&M, Topshop, Hollister, Superdry, Sainsbury’s
Cribbs Causeway £217m 1,076 33% 154 £12.8m £305 80% John Lewis, Marks & Spencer, Apple, Next, Topshop, Hugo Boss, H&M, Tesla, The White Company
UK major city centresManchester Arndale £410m 1,811 48% 258 £22.2m £285 57% Harvey Nichols, Apple, Burberry, Topshop, Next, Ugg, Hugo Boss, Superdry, Zara, Victoria’s Secret,
Paul Smith, Monki
intu Watford £407m 1,089 93% 166 £18.7m £200 81% John Lewis, Marks & Spencer, Next, Debenhams, Apple, Zara, Primark, Lego, H&M, Topshop, Hugo Boss, Cineworld
intu Derby £373m 1,302 100% 208 £27.9m £110 53% Marks & Spencer, Next, Debenhams, Sainsbury’s, Boots, Topshop, Cinema de Lux, Zara, H&M, Hollywood Bowl
St David’s, Cardiff £295m 1,391 50% 203 £16.7m £212 71% John Lewis, Debenhams, Marks & Spencer, Apple, Hugo Boss, H&M, River Island, Hamleys, Primark, Victoria’s Secret
intu Eldon Square £281m 1,385 60% 142 £16.3m £295 57% John Lewis, Fenwick, Debenhams, Waitrose, Apple, Hollister, Topshop, Boots, River Island, Next
intu Victoria Centre £261m 976 100% 118 £19.0m £225 57% John Lewis, House of Fraser, Next, Topshop, River Island, Boots, Urban Outfitters, Superdry
Spanish centres
Market value Size1(sq m 000) Ownership Number of storesAnnual
property income Key tenants
intu Xanadú €271m 120 50% 206 €13.4m El Corte Inglés, Zara, Primark, Apple, H&M, Mango, SnowZone, Cinesa, Bricor, Decathlon
intu Puerto Venecia €268m 119 50% 201 €12.2m El Corte Inglés, Primark, Ikea, Apple, Decathlon, Cinesa, H&M, Mediamarkt, Zara, Hollister, Toys R Us
intu Asturias €161m 74 50% 146 €8.1m Primark, Zara, H&M, Cinesa, Eroski, Mango, Fnac, Mediamarkt, Sfera
1 Excludes owner occupied space.
Asset valuation at 31 December 2018
£9.2bn*(2017: £10.5bn)
Management viewpoint
The quality, popularity and status of intu centres as places where brands flourish is demonstrated by a record shopfit investment of £144 million by those brands, through new concepts and upsizing and upgrading in our centres.” Julian Wilkinson Asset Management Directorintu Watford
We have transformed intu Watford over the last few years. The new 380,000 sq ft extension opened in October 2018, making Watford a top-20 UK retail destination alongside the likes of Edinburgh and introducing some great retail names. A state-of-the-art cinema and new restaurants are creating an evening economy in the town.
intu Xanadúintu Xanadú is the retail and leisure destination for southwest Madrid. It is home to Spain’s only indoor ski slope, a 15-screen cinema and all the retailers you would wish. Its catchment will grow with the recently opened aquarium and Nickelodeon theme park and plans are advancing to upgrade the catering.
30-minute drive time catchment
4.6mABC1
81%
UK super-regional centres1. intu Trafford Centre (£2,098m) 2. intu Lakeside (£1,250m)3. intu Metrocentre (£842m) 4. intu Merry Hill (£777m) 5. intu Braehead (£430m)6. Cribbs Causeway (£217m)
66%
UK major city centres7. Manchester Arndale (£410m) 8. intu Watford (£407m) 9. intu Derby (£373m)10. St David’s, Cardiff (£295m) 11. intu Eldon Square (£281m) 12. intu Victoria Centre (£261m) 13. intu Milton Keynes (£257m)
27%
Spanish centres14. intu Xanadú (£243m)15. intu Puerto Venecia (£241m)16. intu Asturias (£145m)
7%
* Including Group’s share of joint ventures and assets held for sale.
** Other UK properties < £200m (£643m).
Strategic reportFin
ancial statem
ents
Other in
formation
Govern
ance
9intu properties plc Annual report 2018

Near termOver the next three years we will focus on projects with proven tenant demand. With significant levels of pre-letting, we are on site at intu Lakeside and intu Trafford Centre’s Barton Square.
Alternative uses We continue to look at opportunities within the portfolio for alternative uses for some of our available land. Our six out-of-town centres have some 470 acres of surface level car parks and other potentially developable land and our city centre locations offer opportunities for intensification of use. Initial work on mixed-use opportunities have highlighted the potential for around 5,000 residential units and nearly 600 hotel rooms, with further opportunities under consideration.
intu Costa del SolWith final planning consents expected shortly and strong demand from retailers, we expect to be on site with this shopping resort development in the next 12 months. intu Costa del Sol will have a high proportion of leisure and will be a must-visit destination for both residents and tourists from the whole of the region.
intu BroadmarshThe second phase of our Nottingham vision is to redevelop the 500,000 sq ft existing centre to provide a complementary offer to that of intu Victoria Centre. The redevelopment will focus on bringing new brands to the city, with a cinema and restaurant-led upper level and convenience-driven lower level. The Light cinema and Hollywood Bowl will anchor the leisure element of the redevelopment.
Management viewpoint
We combine our placemaking and events skills with the best architecture and retail mix to create a wow factor which draws people in and gets them to stay for longer. The extension at intu Lakeside, 80 per cent leisure and 20 per cent catering by area, will be a great example of this, complementing the existing offer to provide a full day-out experience.”Martin Breeden Development Director
We have a strong pipeline of organic growth opportunities for the next decade in the UK and Spain
Our growth story
Strategic report
10 intu properties plc Annual report 2018
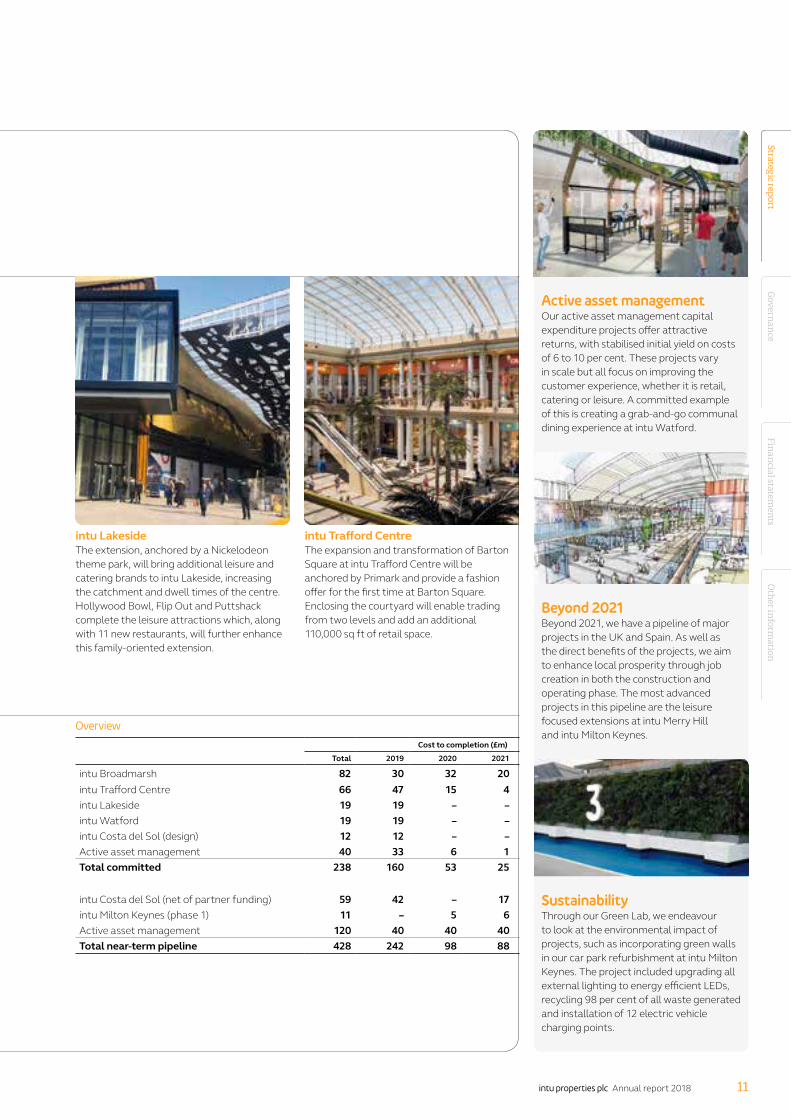
Active asset managementOur active asset management capital expenditure projects offer attractive returns, with stabilised initial yield on costs of 6 to 10 per cent. These projects vary in scale but all focus on improving the customer experience, whether it is retail, catering or leisure. A committed example of this is creating a grab-and-go communal dining experience at intu Watford.
Beyond 2021 Beyond 2021, we have a pipeline of major projects in the UK and Spain. As well as the direct benefits of the projects, we aim to enhance local prosperity through job creation in both the construction and operating phase. The most advanced projects in this pipeline are the leisure focused extensions at intu Merry Hill and intu Milton Keynes.
SustainabilityThrough our Green Lab, we endeavour to look at the environmental impact of projects, such as incorporating green walls in our car park refurbishment at intu Milton Keynes. The project included upgrading all external lighting to energy efficient LEDs, recycling 98 per cent of all waste generated and installation of 12 electric vehicle charging points.
Overview
Cost to completion (£m)
Total 2019 2020 2021
intu Broadmarsh 82 30 32 20intu Trafford Centre 66 47 15 4intu Lakeside 19 19 – –intu Watford 19 19 – –intu Costa del Sol (design) 12 12 – –Active asset management 40 33 6 1Total committed 238 160 53 25
intu Costa del Sol (net of partner funding) 59 42 – 17intu Milton Keynes (phase 1) 11 – 5 6Active asset management 120 40 40 40Total near-term pipeline 428 242 98 88
intu Trafford CentreThe expansion and transformation of Barton Square at intu Trafford Centre will be anchored by Primark and provide a fashion offer for the first time at Barton Square. Enclosing the courtyard will enable trading from two levels and add an additional 110,000 sq ft of retail space.
intu LakesideThe extension, anchored by a Nickelodeon theme park, will bring additional leisure and catering brands to intu Lakeside, increasing the catchment and dwell times of the centre. Hollywood Bowl, Flip Out and Puttshack complete the leisure attractions which, along with 11 new restaurants, will further enhance this family-oriented extension.
Strategic reportFin
ancial statem
ents
Other in
formation
Govern
ance
11intu properties plc Annual report 2018

Our results for the year show a resilient operating performance with continued like-for-like net rental income growth. The uncertainty around the UK economy and the challenging retail background are leading to weakening sentiment in the retail property investment market, impacting property valuations:
— property values reduced in the year by 13.3 per cent with a total revaluation deficit of £1,405.0 million (see below)
— like-for-like net rental income growth of 0.6 per cent (£2.3 million) driven by increased rents from new lettings (+6 per cent ahead of previous rent) and rent reviews (+7 per cent ahead of previous rent) partially offsets £11.8 million impact from disposals and developments
— underlying earnings of £193.1 million, impacted by disposals and development activity in 2018
— loss for the year of £1,173.7 million, an increase of £1,377.0 million, primarily from the property revaluation deficit
— underlying earnings per share of 14.4 pence, 0.6 pence lower than 2017 reflecting the impact of disposals and developments
— NAV per share (diluted, adjusted) of 312 pence, down 99 pence, the decrease due to the property revaluation deficit. NNNAV per share is 271 pence, reducing by 78 pence
— debt to assets ratio is 53.1 per cent. Net external debt largely unchanged at £4,867 million, with cash and available facilities of £548 million
Property valuationsIn a challenging year for the whole retail real estate sector, intu reported a 6.2 per cent valuation fall in the period to 30 June 2018 and a further 3.0 per cent in the quarter to 30 September 2018 with the full year reduction in our assets amounting to 13.3 per cent (£1,405.0 million).
This is driven by weakening sentiment in the UK retail property investment market as illustrated by the low levels of transactions (see market trends). The valuers’ assumption is that investors will focus on and seek higher net initial yields. In the year, intu’s average net initial yield (topped-up) has increased by 62 basis points to 4.98 per cent.
Additionally, given the current challenges for certain department stores, the valuers have taken a more conservative view on ERVs for larger space units. On a like-for-like basis, ERVs decreased by 3.9 per cent.
Highlights of 2018
We delivered a resilient operating performance despite the uncertainty around the UK economy
Net rental income1
£451m(2017: £460m)
Property revaluation (deficit)/surplus1
£(1,405)m(2017: £47m surplus)
Underlying EPS3
14.4p(2017: 15.0p)
NAV per share (diluted, adjusted)3
312p(2017: 411p)
Market value of investment and development property1 2
£9,167m(2017: £10,529m)
Underlying earnings
£193m(2017: £201m)
IFRS (loss)/profit for the year
£(1,174)m(2017: £203m profit)
Debt to assets ratio 1 4
53.1%(2017: 45.2%)
Dividend per share
4.6p(2017: 14.0p)
IFRS net assets attributable to owners of intu properties plc
£3,812m(2017: £5,075m)
1 Including Group’s share of joint ventures. See other information section for reconciliations between presented figures and IFRS figures.2 31 December 2017 including intu Chapelfield which was classified as an asset held for sale.3 See notes 12 and 13 for reconciliations between presented figures and IFRS figures.4 31 December 2017 figure pro forma for the net initial consideration of £148 million on 50 per cent disposal of intu Chapelfield which completed on 31 January 2018.
Strategic report
12 intu properties plc Annual report 2018

— like-for-like net rental income increased by 0.6 per cent in the year, driven by increased rents from new lettings and rent reviews and impacted by some 1.9 per cent from tenant failures
— anticipate 2019 full year change in like-for-like net rental income, including the impact of House of Fraser, to be down by 1 to 2 per cent (subject to no new material tenant failures)
— signed 248 long-term leases (187 in the UK and 61 in Spain) delivering £39 million of annual rent at an average of 6 per cent above previous passing rent (like-for-like units) and in line with valuers’ assumptions (2017: 217 leases; £38 million of annual rent; 7 per cent above previous passing rent)
— rent reviews settled in the year on average 7 per cent above previous passing rent (2017: 9 per cent) — sustained high occupancy of 96.7 per cent (December 2017: 97.0 per cent)
— footfall decreased by 1.6 per cent (2017: up 0.1 per cent) outperforming the national ShopperTrak retail average which fell by 3.5 per cent in the year
— net promoter score, our measure of customer service, improved in the year averaging 75 (2017: 70) — brand awareness increased to 28 per cent on an unprompted basis (December 2017: 26 per cent) and
to 76 per cent on a prompted basis (December 2017: 71 per cent)
— capital investment by intu of £201 million in the year including £67 million on the 380,000 sq ft extension of intu Watford which opened in September 2018 and £40 million on the leisure extension at intu Lakeside, anchored by Nickelodeon, Puttshack and Hollywood Bowl
— record tenant investment of £144 million on new shopfits in 2018, with 262 stores opened in the year (2017: £89 million; 259 stores)
— commenced the £75 million extension and enclosure of Barton Square at intu Trafford Centre which will be anchored by Primark and is due to open in early 2020
— appointed the main contractor on the £89 million mixed-use regeneration of intu Broadmarsh which will be anchored by The Light cinema and Hollywood Bowl
— near-term committed and pipeline of projects through to the end of 2021 of £428 million — actively pursuing non-retail development opportunities, particularly around super-regional centres, including
residential with, for example, the potential for over 1,000 private-rented-sector residential units at intu Lakeside
— completed the disposal of 50 per cent of intu Chapelfield for net initial consideration of £148 million, in line with the December 2016 market value. Other disposals of sundry assets amounted to £23 million, 6 per cent ahead of December 2017 valuations
— we have refinanced or entered new facilities of over £500 million, including development finance loans on intu Trafford Centre’s Barton Square and intu Broadmarsh
— cash and available facilities of £548 million (31 December 2017: £833 million). Weighted average debt maturity of 5.8 years, with minimal debt maturities until 2021
— substantial headroom on our loan to value debt covenants. By way of example, a further 10 per cent fall in capital values would create a covenant shortfall of only £1 million which could be cured from available facilities
Presentation of informationAmounts are presented including the Group’s share of joint ventures. Underlying earnings is used by management to assess the underlying performance of the business and is based on an industry standard comparable measure. It excludes valuation movements, exceptional items and related tax.
See financial review on page 48 for more details on the presentation of information and alternative performance measures used
Operating highlights
Growing like-for-like net rental income
Delivering operational excellence
Optimising our winning destinations
Making smart use of capital
See our strategy on pages 34 and 35
Strategic reportFin
ancial statem
ents
Other in
formation
Govern
ance
13intu properties plc Annual report 2018

Investment case
We are the market-leading owner, developer and manager of some of the best shopping centres in the UK and Spain…
…and we use our experience and insight to make customers smile…
…which helps retailers flourish…
…and delivers strong long-term performance
We create compelling, experience-led destinations where customers love to come often – which make them great locations for brands
— high-quality centres, an attractive asset class
— a much-loved brand with high brand loyalty
— world class service provided by our talented, motivated and empowered people
— a responsible and sustainable business, that contributes to our communities
— experts in creating compelling customer experiences both in centre and online
— unique insight into customer trends and demands for the perfect shopping and leisure experience
— the best examples of the best brands in retail, leisure and catering
— dynamic operator adapting fast to a changing retail environment
— thriving environments with high occupancy and high footfall
— a programme of development to increase the attractiveness of our centres
— strong, stable income streams from long-term lease structures
— significant development potential including mixed-use opportunities
8 of the UK’s top 20
3 of Spain’s top 10
76% prompted brand awareness
£4.8bn total economic contribution
½ UK population visit an intu centre each year
26m website visits
75 net promoter score
¾ of our customers prefer intu centres to any other
400m customer visits
£5.9bn of retailer sales
£428m pipeline of development projects over next three years
97% occupancy
+0.6% like-for-like net rental income growth
7.2 years weighted average unexpired lease term
470 acres of developable land
Strategic report
14 intu properties plc Annual report 2018

How we make the difference
Creating winning destinations
Our view of the marketpage 18
Making customers smilepage 20
Creating compelling experiencespage 24
intu Watford: expertise in actionpage 26
15intu properties plc Annual report 2018

Inside intuWith the whole business centred around our customers, we bring together our experience, insight and expertise to create compelling experiences, in centre and online, which deliver real results for our retailers, caterers and leisure operators
75 net promoter score
1/2 of UK population visit an intu centre each year
100%waste diverted from landfill
400m customer visits per annum
1m social media followers
28% spontaneous brand awareness
64%reduction in carbon
emission intensity since 2010
£4.8bn total economic
contribution in 2018
16 intu properties plc Annual report 2018

We have 22 million sq ft of retail, leisure and catering space in the UK
We own three of Spain’s top-10 shopping centres
intu centres
development sites
Encouraging innovation
Driven by our values of bold, creative and genuine we encourage effective experimentation both by individuals and
through group initiatives such as intu Accelerate and Green Lab.
Employee innovation is captured through our Great Ideas portal and success is recognised and rewarded through Win Your Dream.
Our culture
In one way, we are a simple business, with a focus on creating the best shopping centre experience for our 35 million customers.
Our culture is driven by a single-minded purpose to make our customers feel better about life through a visit to one of our centres.
17intu properties plc Annual report 2018

Our view of the market
Retail has always been dynamic, but over the past few years change in the sector has picked up speed, with new technologies influencing how customers shop and what retailers have to do to keep up with the evolving retail landscape
18 intu properties plc Annual report 2018

Much is spoken about the impact of online shopping on physical stores, but even in the UK, the
most mature online shopping market in Europe, less than a quarter of retail sales are online. They are predicted to plateau at 30 per cent.
Customers still love physical shopping and really like the experience of shopping in store. They want to touch what they buy, try it on, talk to someone about it. They may be web-savvy and price-conscious, but with around 85 per cent of all transactions touching the physical store at some point between browsing and purchase, there’s plenty retailers and intu can do to entice customers to stores in our centres.
As part of their multichannel strategies, retailers are creating full-range showroom stores in the winning destinations with the highest footfalls, dwell times and spend. Over the last 18 months, Zara has doubled the size of its intu Trafford Centre store and tripled the size of its intu Lakeside one. Next has opened 80,000 sq ft flagships at intu Merry Hill and intu Metrocentre.
Pulling in the crowds has never been more important and intu’s focus is on making our centres great places to visit for everyone. Whether that’s the baby boomer who likes the traditional shopping experience and has plenty to spend, the family-focused Generation X, or the younger crowd who spend more on leisure and dining and are after great Instagrammable experiences.
We build close relationships with our customers and retailers to ensure we deliver what they both want.
Getting this right means customers flock to our centres and stay. Independent research by GlobalData* reveals what means most to customers and retailers.
Must-have destinations
What customers want…
great range of retailers and the best shops of those retailers
easy to access
lots of dining choice
clean and stylish malls with a great atmosphere and customer service
always something new and interesting
What retailers want…
good sales
lots of footfall
busy malls without empty stores
potential to grow market share
best space to showcase their brand
* GlobalData Consulting; Top 50 UK Shopping Centres, October 2018
19intu properties plc Annual report 2018

100
80
60
40
20
0
<1 1–2 2–4 4–6 >6
Net
pro
mot
er s
core
Dwell time (hours)
Size of bubble represents spend.
We want our customers to really love coming to our centres, to tell their friends and to come back, and it is through our brand that we create the emotional engagement that translates into customer loyalty.
Our brand is about making joyful memories, so that next time our potential customers are thinking about how to spend their time they choose intu. Those memories may come from one great event or a particular moment during their visit. So we make sure every visit is memorable – with world class customer service, excellent facilities, the best examples of the best brands, and our signature products and services.
We measure customer satisfaction through Tell intu, a net promoter score (NPS) system, as there is a strong link between high NPS, dwell time and spend. Events have a great impact on this measure and those we’ve run this year, such as the Stylist Live weekend, the Big Bug tour, the Nickelodeon slime events and the Sun tour, have driven both engagement and hard measures, with a clear rise in footfall, spend and NPS – see case study, right.
Customers’ contact with our people has a very positive impact on NPS and our people are encouraged to interact with customers as often as possible, during our regular chatty hours and more spontaneously.
As well as the NPS, Tell intu provides invaluable customer insight which enables us to introduce, tweak or improve our offer. We recently relaunched our Family Club because mums and dads told us they wanted to have fun with their kids rather than leave them in a club. So we redesigned the club around that shared experience and 35,000 families have signed up.
The value of a strong brand is well documented. Since we rebranded to intu in 2013 we have measured not only brand awareness but also efficacy, through independent insight consultancy Hall & Partners. Five years on, partner Kurt Stuhllemmer explains their findings:
“intu has successfully captured a strong sense of momentum with UK consumers in a relatively short space of time. intu ensures that brands are able to deliver to consumers’ needs in destinations that they want to visit and that are already being talked about as destinations on the way up.
“This has manifested itself in a consistently strong sense of ‘brand advocacy’, with 60 per cent* of consumers aware of the intu brand saying they would recommend it to a friend. Those that would recommend the brand are over 14 times more likely to ‘go far out of their way to visit’ the centres than those that would not recommend, highlighting the importance of the brand’s successful focus on delivering experiences that delight and drive advocacy.
“This is also helping to drive repeat footfall, with 73 per cent* of intu brand advocates considering visiting a centre as ‘the only one I would consider shopping at’ or ‘it’s one I would consider shopping at above most others’. In contrast, it is just 11 per cent* for non-advocates.”
Continuous category brand equity study, Hall & Partners
* All data quoted represents the full year average January – December 2018
Making customers smileWe aim to make our customers smile because happy customers stay longer and spend more
Relative consumer spendOur insight shows that happier customers who stay longer spend more
20 intu properties plc Annual report 2018

Stylist Live
To celebrate intu Trafford Centre’s 20th birthday, we partnered with Shortlist Media to host the first-ever Stylist Live event outside London.
Fashion and beauty brands including Radley, Pandora, Max Factor and Dermalogica filled the centre and were complemented by workshops, interviews with celebrities and influencers and a stunning catwalk showpiece, which attracted 200,000 visitors over the two days – a 5 per cent increase in footfall.
Retailers reported excellent sales – almost double their expected targets in some cases – and huge increases in footfall.
With the great activities, along with offers and experiences such as personal styling and make-up demonstrations, the NPS score of 100 shows that events that make our customers happy also help our retailers flourish.
200,000visitors over the two days
5%increase in footfall
400,000social media impressions
100net promoter score
21intu properties plc Annual report 2018

intu’s portfolio of centres welcomed many new brands this year, with 248 new leases signed. Many of the new
entrants are leading international brands such as Victoria’s Secret, Abercrombie & Fitch and H&M’s Monki, who are rolling out their brands across the UK, and choosing intu centres to optimise their chances of success.
They know they will flourish in our high-quality and well-managed centres, eight of which are in the UK’s top 20. With a million visitors every day, and footfall consistently above the national average, their stores will be in some of the busiest, most thriving retail spaces in the country.
They will be in good company: many of our retailers’ top-performing stores are at
intu centres. They are the places retailers want to be and they are showing their confidence in the future with intu by investing for the long term. In 2018 retailers spent around £144 million of their own money on upgrading their flagship stores, among them River Island, which has doubled the size of its intu Lakeside store and is upsizing at intu Watford.
Retailers’ investment complements our own – this year we spent £201 million upgrading and extending our centres, including £67 million to complete the intu Watford extension, which Debenhams chose as the place to launch its innovative concept department store.
We work in partnership with our retailers, making sure they are in the right place
and the right size of store and giving them access to all the great services we provide: our experience and events programmes designed to engage customers and keep them coming back; our great digital offering including our online shopping centre which allows us to help with their omnichannel strategies; and our innovative approach to change.
In a fast-changing retail environment retailers want a landlord that is able to adapt swiftly. At intu we are ahead of the game, thinking three, five, 10 years ahead – our innovation lab intu Accelerate means we are constantly on the look-out for the latest ideas that will continue to keep our centres ahead and help our retailers flourish.
Helping retailers flourish
22 intu properties plc Annual report 2018

intu has been one of the most forward-thinking landlords, recognising the need to have leisure offerings, such as cinemas, bowling alleys and trampoline parks alongside traditional retail to drive footfall.”Stephen Burns CEO, Hollywood Bowl
Inditex rolls out with intu
Inditex is one of the world’s largest fashion retailers, with a portfolio of brands that includes Zara, Zara Home, Stradivarius, Bershka and Pull&Bear.
It is a globally successful company with a well-thought-out strategy for rolling out its brands across the UK, and intu is often its first port of call when choosing locations outside London. A fifth of its stores outside the capital are in intu centres, including eight of the 50 Zaras and half the Stradivarius branches. Our three Spanish centres all have stores of all nine Inditex brands.
The retailer’s confidence in intu is demonstrated by its investment in its stores in our centres, doubling the size of its Zara store at intu Trafford Centre, and tripling the Zara space at intu Lakeside.
23intu properties plc Annual report 2018

Creating compelling experiences
Every day at an intu centre is like putting on a theatrical extravaganza. To fill all the seats, make sure our
audience go home with great memories that make them want to return and have retailers continue to flock to our centres, we have to run the show perfectly.
We are the experts at creating great retail and leisure experiences that make our centres places people want to keep coming back to: from our razor-sharp focus on creating joyful experiences to our long-term vision that keeps our
centres at the cutting edge, aided by our mastery of tenant mix, centre management and development planning.
For more than two decades we have been putting on a show at our centres to give customers a memorable time. The daily performance includes exciting events, positive interactions with our passionate people, access to the best retail and leisure – elements that together create a sense of enjoyment and belonging. The iconic intu Trafford Centre was one of the first shopping centres to offer the wow
factor and it has been drawing in crowds ever since. We are creating a retail and leisure destination for the 21st century at intu Lakeside, where the new £72 million development is set to create the biggest retail resort in the south of England.
Over in Spain, our plans for intu Costa del Sol bring together all our expertise to create the world’s most advanced retail and leisure resort. It will have a high proportion of leisure and will be a must-visit destination for both residents and tourists from the whole of the region.
24 intu properties plc Annual report 2018

Compelling shopping experiences don’t happen by accident – it’s the expertise and passion of our
in-house facilities management and customer experience teams that make all the difference, providing great customer service and offering value for money for retailers.
Uniquely among shopping centre landlords we manage our intu-branded UK centres ourselves, directly employing all backroom and front-of-house staff because we know no one else will go as far as we will to deliver the perfect experience.
This model has many advantages over contracted-out centre teams, particularly with our people for whom working directly for intu means they are totally committed to our ethos of delivering excellent customer service.
Our scale means we can attract the leading industry specialists in security, environmental services, procurement and design. And with 14 centres under the intu banner we can trial new projects and roll out the best, to ensure retailers get superior service and great value. For example, our solar energy programme trial at intu Chapelfield exceeded expectations and we are planning to roll it out to three more centres in 2019.
Retailers are buying into our expertise: Next has been testing our facilities management services at its intu Trafford Centre store. The pilot proved so successful that Next is now looking at a comprehensive maintenance arrangement for all its stores in the intu portfolio and we are in discussions with a number of other retailers to provide a similar service in 2019.
Centres of expertise
We continue to use our expertise to surprise and delight our customers and find new ways to help our retailers flourish. It works, as testified by 400 million customer visits each year, our highest average NPS of 75 (up from 70 last year), and the commitment of a succession of international retailers for whom intu is the first port of call when it comes to making their nationwide expansion plans. With 35 million customers, over half the UK population can’t be wrong.
25intu properties plc Annual report 2018

intu Watford – expertise in action
Creating winning destinations
The stunning Charter Place extension at intu Watford that opened in September 2018 shows
just what our expertise as shopping centre landlords can achieve.
With the 380,000 sq ft, £180 million extension we have created a 1.4 million sq ft centre, with new leisure and dining opportunities, aspirational shopping and a spectacular new public space that is predicted to catapult Watford into the top-20 most desirable retail locations in the UK and is reinvigorating the town.
Our expertise and experience have been evident from the first – from our skill in building the state-of-the-art extension
at the Charter Place end of the centre to introducing new stores and family-friendly leisure that will draw in new visitors from this most affluent of Home Counties catchments and boost the daytime and evening economy.
We have curated a tenant mix to meet shoppers’ expectations, with the new-concept Debenhams, the nine-screen IMAX Cineworld, aspirational brands such as Hugo Boss, a range of leisure options and enhanced stores for H&M and Uniqlo. The £13 million refurbishment of the existing centre, with new flooring, lighting, decoration, toilets and car parking, provides the perfect backdrop for major retailers Primark, Zara and Next.
With stylish new places to eat and drink such as The Florist, which opens in spring 2019, the centre has plenty of reasons to visit from early in the morning right through to the evening. Footfall has increased by 15 per cent since opening and there has been an increase of 9 per cent in NPS since the development opened. The new leisure and retail mix, along with the fantastic architecture and new Christmas decorations, proved very popular.
26 intu properties plc Annual report 2018

Creating winning destinations
At the heart of the town
Much of the success of the new extension is down to relationships we have nurtured over many years.
Through previous collaboration our retailers trust us to offer them the right locations and size of units which is why many of them are investing heavily in new stores at intu Watford.
Our commitment to Watford and our close ties with Watford Borough Council have seen them also invest £2 million to pedestrianise the high street and for the work to complement our own, resulting in a dovetailed project that enhances people’s experience of both the town and the shopping centre.
We have been part of the town for 20 years, involved with many community bodies including schools, charities and the local Business Improvement District – local people know we care about the town. We have been transparent and open about our development plans and our widespread communication and consultation led to a resounding 91 per cent public approval rating for our plans.
166stores
9,260local people employed
£379mannual contribution to the local economy
£180m invested in new extension
27intu properties plc Annual report 2018

At the heart of communities
Being at the heart of local communities we are well positioned to work with retailers, local organisations and charity partners on initiatives that bring prosperity,
encourage inclusivity and improve the environment.
We focus on improving skills and creating employment opportunities to support economic inclusion and help equip people for work.
We want the almost one-fifth of the UK population known to have a disability to be able to enjoy our centres. We work with specialist charities such as the National Autistic Society and dementia charities to provide support that allows all our customers to visit our centres as independently as possible.
Operating and developing our centres sustainably means responding to long-term global challenges that will affect our business, including saving energy and carbon, reducing waste, water efficiency, sustainable transport and sustainable construction. We are always looking for new ways to increase our sustainability. Our ambitious energy reduction programmes, such as LED roll-out and installation of solar panels, reduce our carbon footprint and help to provide stable energy pricing for ourselves and our retailers.
Our centres are forces for good in their communities. By providing employment, supporting local good causes, encouraging wellbeing and managing natural resources well, they bring benefits which help guarantee the long-term success of our business
28 intu properties plc Annual report 2018

Our Retail Gold programmes work with our retailers, Employers in Education, schools, colleges and
Jobcentre Plus to offer students and unemployed people the opportunity to develop the skills they need for a career in retail, hospitality or leisure. The programmes provide training for potential job applicants to fulfil the needs of intu and its retailers.
Since 2005, retailers at intu Eldon Square and intu Metrocentre have provided 54,000 hours of onsite training for more than 500 students with 30 retailers. The Department for Education called Retail Gold “an excellent example of practice and impact in careers education”. In 2019 we hope to help 200 people into employment or further training in the northeast and are developing training to support individuals with additional needs.
We recently launched our Retail Gold handbook to support the expansion of Retail Gold and planning is underway at intu Merry Hill, intu Trafford Centre and intu Uxbridge for 2019.
intu Chapelfield is pioneering our first Compost Café, an innovative scheme where coffee grounds
that make thousands of cups of coffee in the centre every day are collected to be reused for compost by local gardeners.
The concept is simple: centre retailers refill their non-recyclable coffee bean bags with their waste coffee grounds. The bags are collected by the centre team, labelled and displayed in the centre’s Compost Café shop for visitors to take free of charge. Retailers participating in the scheme and donating their waste coffee include Caffè Nero and Starbucks.
In the first six months 2,400 bags have been collected with 3,600 kg of coffee grounds saved from general waste. The scheme has been rolled out to intu Potteries and our London office.
Compost Café received a silver award for environmental management improvement at the Green Apple Environment Awards and we will be growing this initiative in 2019.
Over the last 10 years, mental health has become a topic of increasing concern in higher
education. Those aged between 16 and 24 are particularly vulnerable to mental health issues and there is a growing demand for counselling services to meet their needs.
As part of our drive to improve the wellbeing of our communities, we have teamed up with mental health foundation Blurt. Our first initiative together was at our centre student nights which were visited by over 90,000 young people.
We gave Blurt space at nine centres to open up conversations and help remove the stigma of talking about mental health. Through the project they spoke to 430 students, reached 6,630 and recruited 23 volunteers to become ‘Blurters’, as part of their new university-focused, peer-led programme. The event increased awareness of mental health, and young people reported being able to talk about their emotions and feeling less alone.
Building tomorrow’s workforce today
It’s good to Blurt Green Lab 2018: Compost Café
29intu properties plc Annual report 2018

Our business model
See how we help retailers flourish on pages 22 and 23
See how we are making customers smile on pages 20 and 21
Behaving responsibly
See more on corporate responsibility on pages 57 to 59
Underpinned by our culture
Our focus is on creating shopping centres that are loved by customers and where retailers flourish. This builds a long-term business that delivers value for our shareholders and stakeholders
Our assets and resourcesWe have unique assets and resources that provide the foundations for our business
Our centresNational presence with high-quality retail and leisure destinations visited by half the UK’s population each year
See top properties on pages 8 and 9
Our peopleProfessional, empowered and motivated teams that are specialists in their fields
See our people on pages 54 to 56
Our relationshipsEnduring, creative and collaborative relationships with retailers, customers, employees, partners and communities
See relationships on pages 32 and 33
Our brandRespected shopping centre brand focused on enriching the customer experience both in centre and online
See the intu difference on pages 15 to 29
Our financial strengthCapital structure provides capacity to deliver our objectives from a range of funding sources
See financial review on page 48 to 53
What we doWe apply the intu difference – our specialist knowledge, expertise and market insight – to create the most popular shopping centres by:
making customers smileOur insight and management of centres attract customers more often, for longer and from further away by offering the right mix of retail, leisure and catering alongside our distinctive brand proposition
helping retailers flourishOur high-footfall locations, flexibility and strong brand give retailers the confidence that they will trade successfully with intu, which drives rental income and capital growth
Strategic report
30 intu properties plc Annual report 2018

Growing like-for-likenet rental incom
e
Making
smar
t use
of capital
operational excellence
Delivering
winning destin
atio
ns
Optimisi
ng ou
r
Ourcustomers
For more details on how we achieved this in 2018 see the strategy overview on pages 34 and 35. For details of our 2019 strategy see pages 2 and 3
Our investorsGenerating strong stable income
+0.6%like-for-like net rental income growth
Our retailersEnvironments that help retailers flourish
+190bpsoutperformance of national footfall benchmark
Our customersCompelling experiences
75average net promoter score
Our peopleProfessional and empowered
85%of staff find ways to bring joy to customers and colleagues
Our communitiesSignificant economic contribution
£4.8bngross value added
Our environmentOperational and environmental efficiency
64% reduction in carbon intensity since 2010
The value we addWe deliver sustainable value for our shareholders and stakeholders
Being a good employer
See more on our people on pages 54 to 56
Living our values
See more on our culture on page 54
How our strategy helps us create value
Strategic reportFin
ancial statem
ents
Other in
formation
Govern
ance
31intu properties plc Annual report 2018

We maintain close relationships with our stakeholders, checking in with them regularly to find
out what we are doing well, what we can do better, and where their needs have changed. Our materiality process takes a formal sounding of the issues around our business that are most relevant to them.
We use our reputation management framework to measure how we are perceived by our stakeholders so that we can ensure that our strategy reflects their needs and perceptions. It focuses on the five primary groups – customers, tenants, investors, local and national government and employees – and measures against a number of core competencies.
In 2018, the third year of measuring, saw an industry-wide drop in reputation, and we too saw a slight drop in overall reputation, driven by the uncertainty around the failed corporate transactions and, particularly, the negative media sentiment that surrounded them. Among the general public, the perception of products and services, intu as an innovative company and as employers all rose.
Next year we will look to supplement the reputation framework by implementing media RepTrak mining. We will introduce new studies for employees and tenant clients, and more clearly link our CR programme with intu in the minds of the general public.
Working with our stakeholdersCustomersOur customers are at the heart of everything we do, so we listen to them carefully to keep our centres continually evolving and meeting their requirements. Our net promoter score, which we assess from Tell intu and is consistently high at 75, shows where we are succeeding and where we could make improvements.
In 2018 we introduced mystery shopping at all UK intu-branded centres. From 216 visits over the year, during which nine touchpoints were scored, we gathered key information into how our centres are performing through the eyes of customers. Changes already made as a result have had a tangible impact on our NPS.
This year we continued our research into the customer journey which aims to enhance customer experience in our centres. Our brand tracker measures awareness, advocacy and consideration of our brand by customers – spontaneous awareness was 28 per cent at the end of 2018. We heard from 22,000 shoppers through our Tell intu customer feedback programme and our Shopper View research panel of 300 customers participated in 12 projects.
TenantsGood relationships with our tenants are essential to understanding their requirements and helping them flourish.
In 2018 we carried out two types of tenant research. The first was a qualitative research project into a number
of areas relevant to tenants including reputation, service, products, innovation, relationships and value for money. We also interviewed senior retailer executives to gain a wider perspective about their views and requirements. The research has delivered valuable insights which have been used to inform our revised strategy.
As well as day-to-day contact we hold regular client reviews with customer relationship managers. We have an annual service charge roadshow to present and discuss the service charge. We host regular Merchants Associations meetings and other events around the country. We also attend a wide range of industry conferences and exhibitions giving retailers the opportunity to meet the intu team.
InvestorsWe deliver long-term value to our investors through strong, stable income streams from our high-quality shopping centres. Understanding the requirements and concerns of both existing and potential investors is key.
This year we conducted 370 meetings with investment institutions. We hosted regular investor visits to our centres to show how we are meeting our objectives and attended investor conferences in the UK and internationally. We visited intu Asturias, intu Xanadú and intu Watford with analysts and investors in 2018.
We also engaged in environmental, social and governance indices which show high performance year-on-year.
Relationships
People are what make us tick. Our relationships and reputation with our stakeholders are important to the overall sustainable success of our business
Strategic report
32 intu properties plc Annual report 2018

SuppliersWe rely on our suppliers to help our business run smoothly, from day-to-day operations through to the construction of major developments. We have open, transparent and long-term relationships with suppliers to ensure they maintain the same high standards we set ourselves. We also encourage new suppliers into the market, both through our intu Accelerate innovation initiative and through general procurement. We created our Longevity lifecycle management programme with new start-up Invida which has since gone on to win awards for its effectiveness.
Local and national government Successful relationships with local authorities, MPs and city centre management bodies such as Business Improvement Districts (BIDs) are vital to our sustainability as a long-term business.
We contribute management time and financially to a number of BIDs covering intu centres. We play a leadership role in some BIDs, for example Uxbridge. Such partnerships, including links with local chambers of commerce and branches of national industry bodies such as the CBI, reinforce our substantial and long-term commercial and social engagement at the heart of many UK towns and cities. In some the local authority is our investment partner.
A number of our centres are in areas covered by elected mayors and combined authorities and we have quickly forged good relations with these influential regional representatives.
Management viewpoint
By listening closely to our tenants intu Experiences creates bespoke packages of opportunities from traditional mall merchandising to experiential and digital activations to offer new experiences to customers. The value brands place on this is shown by the growth in income of intu Experiences to £23 million a year.”Roger BinksCustomer Experience Director
We host an annual parliamentary dinner for MPs with an intu centre in their constituency. The event allows senior members of the intu management team to hear first hand from MPs and provides an opportunity for us to raise industry concerns such as business rates and the skills agenda.
We regularly participate in relevant government consultations that have a potential impact on our business.
Our peopleOur employees are the experts behind the success of the business. In centres, they are the face of intu and delivering our brand promise is central to making both customers and retailers happy. Our commitment to employee engagement is the key to our motivated workforce.
This year all staff participated in new brand training, designed to give our people an enhanced understanding of the core principles of the brand and how they can contribute to driving intu’s reputation.
We engaged with our employees through many channels including the roll out of the intranet to all staff, presentations, briefings and consultation forums and provided many opportunities for them to feed back. We have noted an increase in employee engagement as a result of the many communications in 2018 to ensure staff were kept informed during the potential corporate transactions.
Local communitiesintu centres are at the heart of the communities where they are located. Good community engagement benefits our customers and local people and ultimately is good for our business.
This year intu staff spent almost 11,000 hours helping local community groups. We held 250 community activities in our centres and engaged with over 650 charities. 800 people reported that they had developed new skills through our various employment and other community partnerships. In total, we donated almost £1.7 million in community support through time, space, money and leverage.
Strategic reportFin
ancial statem
ents
Other in
formation
Govern
ance
33intu properties plc Annual report 2018
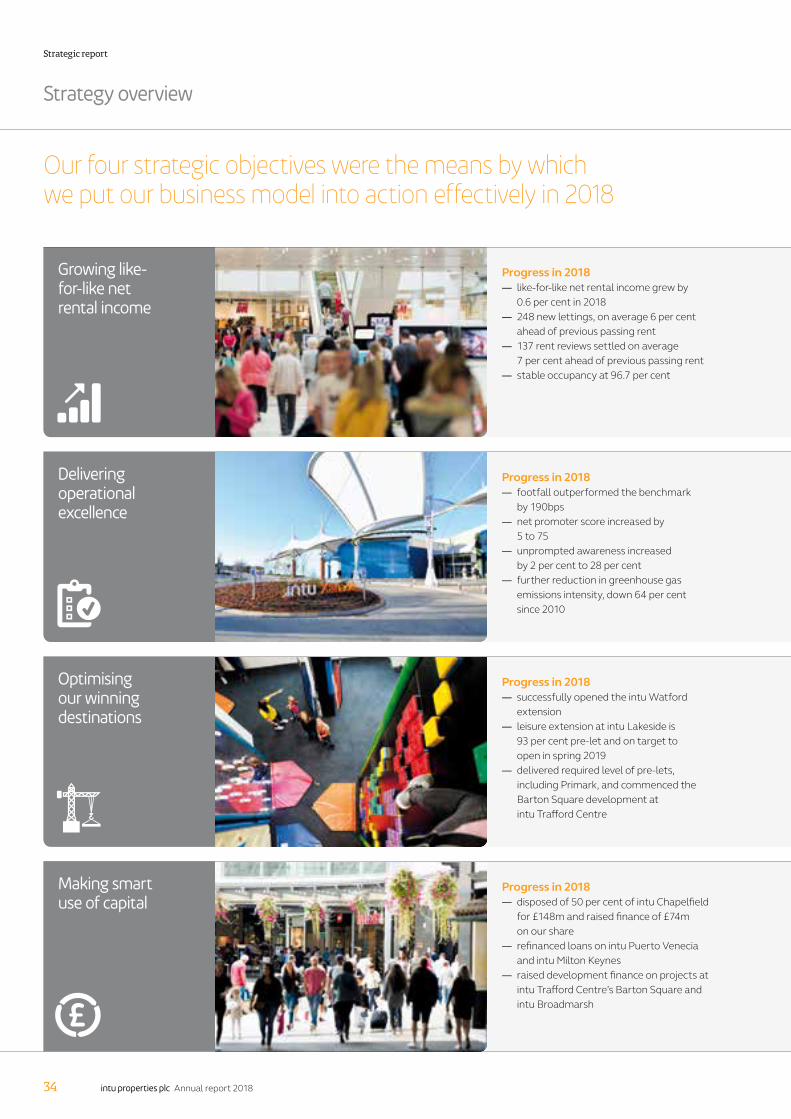
Progress in 2018 — like-for-like net rental income grew by
0.6 per cent in 2018 — 248 new lettings, on average 6 per cent
ahead of previous passing rent — 137 rent reviews settled on average
7 per cent ahead of previous passing rent — stable occupancy at 96.7 per cent
Progress in 2018 — footfall outperformed the benchmark
by 190bps — net promoter score increased by
5 to 75 — unprompted awareness increased
by 2 per cent to 28 per cent — further reduction in greenhouse gas
emissions intensity, down 64 per cent since 2010
Progress in 2018 — successfully opened the intu Watford
extension — leisure extension at intu Lakeside is
93 per cent pre-let and on target to open in spring 2019
— delivered required level of pre-lets, including Primark, and commenced the Barton Square development at intu Trafford Centre
Progress in 2018 — disposed of 50 per cent of intu Chapelfield
for £148m and raised finance of £74m on our share
— refinanced loans on intu Puerto Venecia and intu Milton Keynes
— raised development finance on projects at intu Trafford Centre’s Barton Square and intu Broadmarsh
Strategy overview
Our four strategic objectives were the means by which we put our business model into action effectively in 2018
Growing like- for-like net rental income
Delivering operational excellence
Optimising our winning destinations
Making smart use of capital
Strategic report
34 intu properties plc Annual report 2018

We achieved this by — delivering new lettings ahead of previous passing rent — increasing rent through the rent review cycle — reducing vacancy levels
KPIs we use to measure our success — occupancy — like-for-like net rental income — shareholder return — total financial return — underlying earnings per share
Key stakeholders we engage Managing risk — tenants — investors
— suppliers — our people
— property market — operations
We achieved this by — delivering footfall ahead of the national benchmark — ensuring consistency of our high-quality customer service — enhancing the recognition of the intu brand — ensuring our centres are at the heart of their communities
KPIs we use to measure our success — footfall — GVA of community investment — greenhouse gas emission intensity
Key stakeholders we engage Managing risk — customers — tenants — suppliers
— our people — local communities
— operations — brand
We achieved this by — understanding the latest requirements of our customers and retailers — generating the required level of demand to commence new projects — delivering projects on time and on budget
KPIs we use to measure our success — footfall — occupancy — shareholder return — total financial return — prime property assets
Key stakeholders we engage Managing risk — tenants — suppliers
— local and national government — our people — local communities
— property market — operations
— developments — brand
We achieved this by — continuing the recycling of capital from our smaller/mature assets — refinancing debt to reduce the cost and increase the maturity — ensuring we have the funding to progress the pipeline
KPIs we use to measure our success — shareholder return — total financial return — prime property assets
Key stakeholders we engage Managing risk — investors — suppliers
— financing — developments
Strategic reportFin
ancial statem
ents
Other in
formation
Govern
ance
35intu properties plc Annual report 2018

Key to strategic objectives
Growing like-for-like net rental income
Delivering operational excellence
Optimising our winning destinations
Making smart use of capital
Key performance indicators
We measure progress against strategic objectives using the following financial and non-financial performance measures
Footfall (%)
Why is this important?Footfall is an important measure of a centre’s popularity with customers. Retailers use this measure as a key part of their decision-making process on where to locate their stores.
How is this measured?Footfall numbers across intu’s centres are captured using a combination of person or car counting cameras located at specific entrance and exit points within the centre.
How have we performed?Footfall in our centres was robust considering the unusual weather events in 2018. We significantly outperformed the ShopperTrak measure of UK national retail footfall.
2014 2015 2016 2017 2018
-1.6%
-3.5%
intu ShopperTrak
-5
-3-4
-2-1012
Like-for-like net rental income (%)
Why is this important?Measures the organic growth in income generated from our centres in the year.
How is this measured?Year-on-year movement in net rental income with the impact of acquisitions, developments and disposals removed.
How have we performed?Like-for-like net rental income grew in 2018 driven by increased rents from new lettings and rent reviews. The growth was adversely impacted by some 1.9 per cent from administrations and CVAs.
2014 2015 2016 2017 2018
+0.6%+0.5%+3.6%+1.8%-3.2%
-2
-4
0
2
4
Shareholder return (%)
Why is this important?Combines share price movement and dividends to produce a direct measure of the change in shareholder value in the year.
How is this measured?Uses the movement in share price during the year plus dividends paid in the year.
How have we performed?The Group showed a more negative shareholder return in 2018 compared to the overall REIT sector. This was driven by negative sentiment to retail and retail property despite a solid income performance in the year.
2014 2015 2016 2017 2018
-12%
-52%
intu FTSE REIT index
-60-45-30
0-15
1530
Total financial return (%)
Why is this important?This is a measure of the movement in the underlying value of assets and liabilities underpinning the value of a share plus the dividend paid to shareholders.
How is this measured?The change in NAV per share (diluted, adjusted) plus dividends per share paid in the year expressed as a percentage of opening NAV per share (diluted, adjusted).
How have we performed?Total financial return in the year was negative, driven by a revaluation deficit of 13 per cent against a small surplus in 2017.
2014 2015 2016 2017 2018
-20.7%+5.2%+3.4%+10.2%+13.5%
-20
-15
-10
-5
0
5
10
15
Occupancy (%)
Why is this important?Attracting and retaining the right mix of retail, catering and leisure operators will enhance our centres’ appeal and trading environment.
How is this measured?The ERV of let and under-offer units expressed as a percentage of the total ERV.
How have we performed?Occupancy remained stable during the year at 97 per cent and remains above the MSCI monthly property benchmark figure (retail).
2014 2015 2016 2017 2018 intu MSCI (retail)
100
98
96
94
92
90
95%
97%
Strategic objective
Strategic objective Strategic objective Strategic objective
Strategic objective
Strategic report
36 intu properties plc Annual report 2018

GVA of community investment (£bn)
Why is this important?Shopping centres create wealth and employment for their local communities. Gross value added (GVA) measures the economic contribution of intu to local communities in the UK.
How is this measured?GVA is calculated on a range of different activities and types of economic output of our UK assets, including: investment expenditure, intu operational jobs, tenant jobs and tax contributions. This data is independently assured.
How have we performed?GVA has increased by £0.2 billion predominantly as a result of the opening of the extension at intu Watford.
2014 2015
4.84.64.94.23.5
0
1
2
3
5
4
2016 2017 2018
Greenhouse gas emissions intensity1 (kg CO2e/m2)
Why is this important?Measures our operational efficiency and performance of our existing assets. It also measures performance against our carbon intensity reduction target of 50 per cent by 2020 against the 2010 baseline.
How is this measured?Greenhouse gas equivalents are calculated to work out the greenhouse gas intensity of the energy we use. These include the direct and indirect emissions of our directly managed UK centres.
How have we performed?Since 2010 we have reduced emissions by 64 per cent, having met our target of a 50 per cent reduction by 2020 three years early.
1 2017 figure restated
2014 2015
4250567384
0
30
60
90
2016 2017 2018
Underlying earnings per share (p)
Why is this important?Underlying earnings per share is based on the underlying income generated in the year which gives an indication of the Group’s recurring performance.
How is this measured?Underlying earnings exclude property and derivative valuation movements, exceptional items and related tax.
How have we performed?Underlying earnings per share reduced slightly impacted by disposals and developments in the year.
2014 2015 2016 2017 2018
14.4p15.0p15.0p14.2p13.3p
0
5
10
15
Prime property assets (%)
Why is this important?Measures the capital return on the Group’s property assets and compares this with the MSCI index, a recognised industry benchmark.
How is this measured?The valuation gain or loss in the year expressed as a percentage of the book value pre-valuation assessed on a like-for-like basis for the Group’s investment property.
How have we performed?Like-for-like valuation deficit of 11.8 per cent was greater than the MSCI deficit of 5.7 per cent. The divergence is considered most likely to represent a timing difference with intu’s valuations.
2014 2015 2016 2017 2018
-11.8%
-5.7%
intu MSCI monthly index (retail)
-12-9-6-3
30
69
Strategic objective Strategic objective
Strategic objective Strategic objective
Strategic reportFin
ancial statem
ents
Other in
formation
Govern
ance
37intu properties plc Annual report 2018
Focus on risk
The effective assessment and management of risk is key to the delivery of our strategy
intu’s Board has responsibility for establishing the Group’s appetite for risk on the balance of potential risks and
returns, and has overall responsibility for identifying and managing risks. The Board has undertaken a robust assessment of the principal risks and uncertainties facing the Group, including those that would impact the business model, future performance, solvency or liquidity.
Risk appetiteAn assessment of the Group’s risk appetite in 2018 showed that the business has delivered some of the reduction in risk exposure that the Board desired, but this has also been impacted by increases in some external risks. The Board continues to want to reduce risk in the future across a number of categories and is working on plans to deliver this. As experts in our sector we are able to mitigate the risk involved in growing the business through development, our active asset management strategy, brand focus and maximising future opportunities for revenue growth. This focus on our core strengths is balanced by a more cautious approach to risk in other areas.
While the macroeconomic and retail environment is difficult at present, particularly with the uncertainty surrounding Brexit, we have proven expertise in this area and continue to innovate to mitigate risks. Additionally, as brand awareness continues to grow we become more exposed to media and social media news stories, which have a greater impact. The intu operational control framework is robust and we have processes and procedures in place to manage reputational risk.
Risk management processintu’s Board has overall responsibility for risk management. The effectiveness of the risk management system is monitored and reviewed by the Audit Committee and through periodic external review. Our ongoing assessment of risk is underpinned by a formal risk review process conducted for each area and every level of the business including each centre, each department, internal committee and the executive team. These reviews provide an opportunity to identify risks and assess their impact and likelihood. The assessment also includes how quickly the risks would impact our business and for how long.
The risk registers created through this process are subject to at least an annual review, facilitated by the risk and assurance team. Operational management is responsible for managing the risks and for updating the risk registers.
The Audit Committee oversees the risk management process, with the Director of Risk and Assurance reporting directly to the Audit Committee Chairman, ensuring independence and objectivity. Four risk updates are provided each year.
Principal risks and uncertaintiesWe have identified principal risks and uncertainties under five key headings: property market; operations; financing; developments; and brand. These are discussed in detail on the following pages. A principal risk is one which has the potential to significantly affect our strategic objectives, financial position or future performance and includes both internal and external factors. We monitor movements in likelihood and severity such that the risks are appropriately managed in line with the Group’s risk appetite.
There was an increased risk profile in 2018, with increases in both property market sub-risks. Additionally, there have been some changes to existing principal risks. Acquisitions has been removed as the business has not engaged in acquisitions in the year and people has been added as a sub-category within the operations risk.
The main impact from the UK’s decision to exit the EU on the risks that the Group faces continues to be the potential negative impact on the macroeconomic environment, as a result of the continuing uncertainty around transitional and post-Brexit arrangements. Specifically, the risks we face are affected by any changes in sentiment in the investment and occupier markets in which we operate, in our ability to execute our recycling and investment plans and in broader consumer confidence and expenditure. intu’s Brexit risk review, initially conducted in 2016, has been reviewed and updated during the year.
The intu risk framework has been updated in the year. It is based on recognised codes and best practice, including ISO 31000 & COSO.
The intu risk and assurance team provide an overview of key risks to the Board and Executive Committee. This includes horizon-scanning for new risks (including legislative changes), highlighting the output of bottom-up risk reviews and identifying risks that could impact delivery of corporate objectives.
Strategic report
38 intu properties plc Annual report 2018
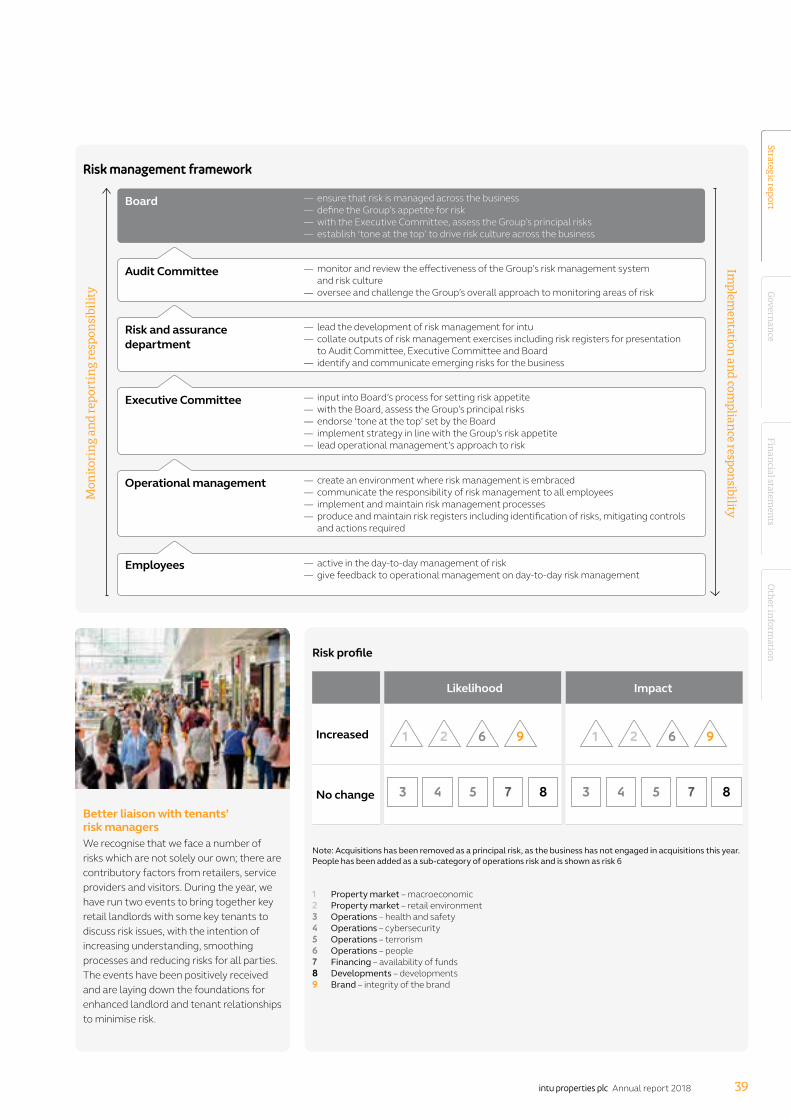
Mon
itori
ng
and
repo
rtin
g re
spon
sibi
lity
Implem
entation and compliance respon
sibility
Board
Risk management framework
Risk profile
1 Property market – macroeconomic2 Property market – retail environment3 Operations – health and safety4 Operations – cybersecurity5 Operations – terrorism6 Operations – people7 Financing – availability of funds8 Developments – developments9 Brand – integrity of the brand
Better liaison with tenants’ risk managersWe recognise that we face a number of risks which are not solely our own; there are contributory factors from retailers, service providers and visitors. During the year, we have run two events to bring together key retail landlords with some key tenants to discuss risk issues, with the intention of increasing understanding, smoothing processes and reducing risks for all parties. The events have been positively received and are laying down the foundations for enhanced landlord and tenant relationships to minimise risk.
Audit Committee — monitor and review the effectiveness of the Group’s risk management system and risk culture
— oversee and challenge the Group’s overall approach to monitoring areas of risk
Risk and assurance department
— lead the development of risk management for intu — collate outputs of risk management exercises including risk registers for presentation to Audit Committee, Executive Committee and Board
— identify and communicate emerging risks for the business
Executive Committee — input into Board’s process for setting risk appetite — with the Board, assess the Group’s principal risks — endorse ‘tone at the top’ set by the Board — implement strategy in line with the Group’s risk appetite — lead operational management’s approach to risk
Operational management — create an environment where risk management is embraced — communicate the responsibility of risk management to all employees — implement and maintain risk management processes — produce and maintain risk registers including identification of risks, mitigating controls and actions required
Employees — active in the day-to-day management of risk — give feedback to operational management on day-to-day risk management
— ensure that risk is managed across the business — define the Group’s appetite for risk — with the Executive Committee, assess the Group’s principal risks — establish ‘tone at the top’ to drive risk culture across the business
Note: Acquisitions has been removed as a principal risk, as the business has not engaged in acquisitions this year. People has been added as a sub-category of operations risk and is shown as risk 6
Likelihood Impact
Increased
No change
21 6 9 21 6 9
3 4 5 7 8 3 4 5 7 8
Strategic reportFin
ancial statem
ents
Other in
formation
Govern
ance
39intu properties plc Annual report 2018

Principal risks and uncertainties
Risk and impact Mitigation Change 2018 commentary Strategic objectives affected
Property market
1 Macroeconomic Weakness in the macroeconomic environment could undermine rental income levels and property values, reducing return on investment and covenant headroom
— focus on high-quality shopping centres together with their upgrading — covenant headroom monitored and stress-tested — make representation on key policies, for example business rates — portfolio-wide marketing events to attract footfall — use our respected brand to attract and retain aspirational retailers — geographic diversification across the UK and Spain — review and update of Brexit risk review
Likelihood and impact of macroeconomic weakness continues to be a risk with continued political uncertainty in the UK and Brexit arrangements not yet detailed, which has increased investor caution resulting in a reduction in property values and lower transaction volumes in the year
— reduction in like-for-like property values, and continued pressure at the lower end of the market
— substantial covenant headroom — no significant debt maturities until 2021 and average
unexpired term of 5.8 years — long-term lease structures with average unexpired term
of 7.2 years
2 Retail environment Failure to react to changes in the retail environment could undermine intu’s ability to attract customers and tenants
— active management of tenant mix — regular monitoring of tenant strength and diversity — upgrading assets to meet market demand — Tell intu customer feedback programme helps identify changes
in customer preferences — work closely with retailers, including increased focus on managing
shared risks — digital strategy that embraces technology and digital customer
engagement. This enables intu to engage in and support multichannel retailing, and to take the opportunities offered by ecommerce
— intu Accelerate programme to identify and implement innovations in the retail environment
— contingency plans for potential future vacant units — future diversification of land use, for example residential
Due to continued macroeconomic uncertainty, the likelihood and impact of changes to the retail environment resulting in potential tenant failures continues to increase. intu monitored this closely in 2018 with intu’s strategy continuing to deliver solid footfall numbers and occupancy
— increased level of administrations and retailer CVAs — significant progress on planning and pre-letting of near-
term pipeline with a focus on leisure — continuing digital investment to improve relevance
as shopping habits change — occupancy remains strong at 97 per cent — footfall growth continues to beat the benchmark — completion of the intu Watford development — on site with the £72m intu Lakeside leisure extension and
the £75m expansion and transformation of intu Trafford Centre’s Barton Square
Operations
3 Health and safety Accidents or system failure leading to financial and/or reputational loss
— strong business process and procedures, including compliance with OHSAS 18001, supported by regular training and exercises
— annual audits of operational standards carried out internally and by external consultants
— culture of visitor, staff and contractor safety — crisis management and business continuity plans in place and tested — retailer liaison and briefings — appropriate levels of insurance — staff succession planning and development in place to ensure
continued delivery of world class service — health and safety managers or coordinators in all centres — implementation of new risk mitigators such as acid attack response
kits in our shopping centres
Likelihood and severity of potential impact has not changed significantly during 2018
— retained OHSAS 18001, demonstrating consistent health and safety management process and procedures across the portfolio
— gold award from RoSPA — full review undertaken of each centre’s fire strategy
and building specifications post-Grenfell and Liverpool Echo Arena has provided appropriate assurance across the portfolio
— Primary Authority audits for both health and safety and fire safety are being conducted. These provide assurances surrounding compliance
4 Cybersecurity Loss of data and information or failure of key systems resulting in financial and/or reputational loss
— data and cybersecurity strategies — regular testing programme and cyber scenario exercise
and benchmarking — appropriate levels of insurance — crisis management and business continuity plans in place and tested — data committee and data protection officer in place — internal and external assessment of GDPR compliance — monitoring of regulatory environment and best practice — cybersecurity assessment performed by external consultancy and full
action plan in place — managing of supply chain and service providers who hold intu data
Likelihood continues to rely on operational and third party systems and data. Severity of potential impact managed through continued development of tools and controls. Hacking attempts have not resulted in data loss or major operational impacts
— ongoing Group-wide cybersecurity project with investment in tools, consultancy and staff to mitigate impact of threats from evolving cybersecurity landscape
— implemented updated GDPR policies and procedures
5 Terrorism Terrorist incident at an intu centre or another major shopping centre resulting in loss of consumer confidence with consequent impact on lettings and rental growth
— strong business processes and procedures, supported by regular training and exercises, designed to adapt and respond to changes in risk levels
— trained security staff who are alert and vigilant — extraordinary pre-planned operational responses to changes in
national threat level — annual audits of operational standards carried out internally and
by external agencies — culture of visitor, staff and contractor safety — crisis management and business continuity plans in place and tested
with involvement of multiple external agencies — retailer liaison and briefings — appropriate levels of insurance — strong relationships and frequent liaison with police, NaCTSO,
CPNI and other agencies — NaCTSO approved to train staff in counter-terrorism awareness
programme — trial of airport style screening technology at the Arena, intu Braehead
Overall likelihood and severity of potential impact unchanged. The NaCTSO and the intelligence community continue to be as busy as ever in protecting the UK from terror attacks and 2018 has seen a continuation of terror attacks in mainland Europe. Our Group Head of Security is a member of the Crowded Places Information Exchange. This group meets quarterly and ensures that intu is abreast of all the current threats and work undertaken by the Counter Terrorism Policing teams in the UK
— national threat level remains at Severe — major multiagency security exercises held at all five
super-regional intu shopping centres — operating procedures in place for the introduction of
further security measures if required
Strategic report
40 intu properties plc Annual report 2018
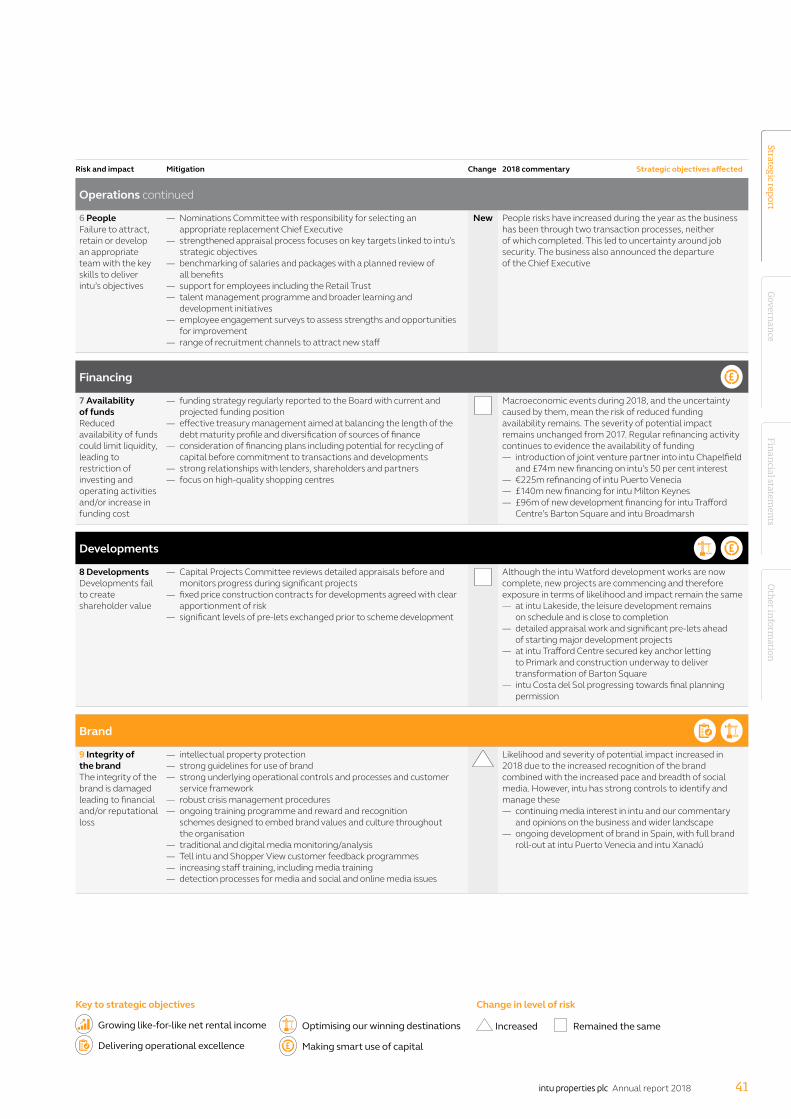
Risk and impact Mitigation Change 2018 commentary Strategic objectives affected
Operations continued
6 PeopleFailure to attract, retain or develop an appropriate team with the key skills to deliver intu’s objectives
— Nominations Committee with responsibility for selecting an appropriate replacement Chief Executive
— strengthened appraisal process focuses on key targets linked to intu’s strategic objectives
— benchmarking of salaries and packages with a planned review of all benefits
— support for employees including the Retail Trust — talent management programme and broader learning and
development initiatives — employee engagement surveys to assess strengths and opportunities
for improvement — range of recruitment channels to attract new staff
New People risks have increased during the year as the business has been through two transaction processes, neither of which completed. This led to uncertainty around job security. The business also announced the departure of the Chief Executive
Financing
7 Availability of funds Reduced availability of funds could limit liquidity, leading to restriction of investing and operating activities and/or increase in funding cost
— funding strategy regularly reported to the Board with current and projected funding position
— effective treasury management aimed at balancing the length of the debt maturity profile and diversification of sources of finance
— consideration of financing plans including potential for recycling of capital before commitment to transactions and developments
— strong relationships with lenders, shareholders and partners — focus on high-quality shopping centres
Macroeconomic events during 2018, and the uncertainty caused by them, mean the risk of reduced funding availability remains. The severity of potential impact remains unchanged from 2017. Regular refinancing activity continues to evidence the availability of funding
— introduction of joint venture partner into intu Chapelfield and £74m new financing on intu’s 50 per cent interest
— €225m refinancing of intu Puerto Venecia — £140m new financing for intu Milton Keynes — £96m of new development financing for intu Trafford
Centre’s Barton Square and intu Broadmarsh
Developments
8 Developments Developments fail to create shareholder value
— Capital Projects Committee reviews detailed appraisals before and monitors progress during significant projects
— fixed price construction contracts for developments agreed with clear apportionment of risk
— significant levels of pre-lets exchanged prior to scheme development
Although the intu Watford development works are now complete, new projects are commencing and therefore exposure in terms of likelihood and impact remain the same
— at intu Lakeside, the leisure development remains on schedule and is close to completion
— detailed appraisal work and significant pre-lets ahead of starting major development projects
— at intu Trafford Centre secured key anchor letting to Primark and construction underway to deliver transformation of Barton Square
— intu Costa del Sol progressing towards final planning permission
Brand
9 Integrity of the brand The integrity of the brand is damaged leading to financial and/or reputational loss
— intellectual property protection — strong guidelines for use of brand — strong underlying operational controls and processes and customer
service framework — robust crisis management procedures — ongoing training programme and reward and recognition
schemes designed to embed brand values and culture throughout the organisation
— traditional and digital media monitoring/analysis — Tell intu and Shopper View customer feedback programmes — increasing staff training, including media training — detection processes for media and social and online media issues
Likelihood and severity of potential impact increased in 2018 due to the increased recognition of the brand combined with the increased pace and breadth of social media. However, intu has strong controls to identify and manage these
— continuing media interest in intu and our commentary and opinions on the business and wider landscape
— ongoing development of brand in Spain, with full brand roll-out at intu Puerto Venecia and intu Xanadú
Key to strategic objectives
Growing like-for-like net rental income
Delivering operational excellence
Optimising our winning destinations
Making smart use of capital
Change in level of risk
Remained the same Increased
Strategic reportFin
ancial statem
ents
Other in
formation
Govern
ance
41intu properties plc Annual report 2018

Valuation Property values fell in the year driven by adverse conditions in the UK retail market and weakening sentiment in the retail property investment market as illustrated by the low levels of transactions. With valuers assuming that investors have increased their focus on current income, their valuations reflect a greater weighting in the overall opinion towards net initial yields.
The table below shows the main components of the £1,405.0 million property revaluation deficit:
— UK super-regional centres: performed stronger than other intu UK assets, recognising the continuing attraction of this asset class which remains key to retailers’ requirements. These centres have reduced in value by 13 per cent in aggregate, with intu Braehead an outlier, down 20 per cent, as it continues to be impacted by the relatively weaker economic and uncertain political situation in Scotland
— UK major city centres: on average values have fallen by 16 per cent reflecting weaker investor demand for some of these centres. Within this category, those super-prime assets in the busiest city centres have performed better, with smaller reductions at the likes of Manchester Arndale, intu Eldon Square, Newcastle and intu Milton Keynes
— Spanish centres: valuations have increased marginally given the continued demand for top-quality Spanish centres
— Spanish developments: small decrease due to pre-development expenditure in the year on intu Costa del Sol
— UK other including developments: predominantly represents valuation movements on developments and assets valued below £200 million each. These assets, which represent only a small proportion of the portfolio, have seen higher revaluation deficits due to lower levels of potential asset management opportunities. This category also includes intu Watford (non like-for-like) and intu Chapelfield (31 December 2017 included at 100 per cent and 31 December 2018 included at 50 per cent)
Valuation
Market value Like-for-like revaluation
At 31 December2018
£m
At 31 December 2017
£m
(Deficit)/surplus
£m
(Deficit)/surplus
%
UK super-regional centres 5,613.6 6,373.7 (824.7) (13.0)UK major city centres 1,875.2 2,223.4 (363.1) (16.3)Spanish centres 628.8 606.8 8.8 1.5Total like-for-like 8,117.6 9,203.9 (1,179.0) (11.8)Spanish developments 232.3 212.8 (7.2) (3.4)UK other including developments 817.5 1,112.5 (218.8) (20.3)Total 9,167.4 10,529.2 (1,405.0) (13.3)
The weighted average net initial yield (topped-up) at 31 December 2018 increased by 62 basis points in the year to 4.98 per cent.
On a like-for-like basis, ERV decreased by 3.9 per cent as valuers have in general taken a more conservative view on rental values for larger space units and on the overall rental values at intu Braehead, intu Victoria Centre and intu Potteries.
Operating review
Our operating review analyses how we have performed in the year against our strategy
intu Puerta Venecia: there is continued demand for quality shopping centres in Spain
Strategic report
42 intu properties plc Annual report 2018

The MSCI UK monthly property index (retail) indicated a 5.7 per cent decrease in capital values and a 2.5 per cent decrease in market rentals. The divergence from intu’s performance is considered most likely to represent a timing difference with intu’s valuations.
In our view, once the near-term yield correction has taken place, income performance rather than changing yields is then likely to be, for a time, the main driver of valuations.
Growing like-for-like net rental incomeLike-for-like net rental income growth is our key income measure. In the year, we grew like-for-like net rental income by 0.6 per cent, similar to the increase of 0.5 per cent in 2017. The key components of the growth are shown in the table below:
Group like-for-like net rental income
2018%
2017%
Rent reviews and improved lettings +1.3 +2.2Capital investment +0.2 +0.4Vacancy impact -0.1 -0.4Administrations and CVAs1 -1.9 -1.4Other (eg: bad debt; surrender premiums; headlease adjustments) +1.1 -0.3Increase in like-for-like net rental income +0.6 +0.5
1 2017 was originally disclosed as units held for redevelopment. Primarily related to units in administration, so disclosed on this basis in 2018.
Rent from lettings and rent reviews delivered 1.3 per cent rental growth. Against previous passing rent, lettings were on average up 6 per cent and rent reviews up 7 per cent.
Vacancy increased marginally in 2018, resulting in a 0.1 per cent impact on net rental income.
The effect of administrations and CVAs was 1.9 per cent. This movement has been minimal given 6 per cent of our rent roll could have been impacted by administrations and CVAs in 2018 (see market trends) and illustrates the strength of our stores in the retailers’ portfolios.
Other delivered 1.1 per cent growth from non-recurring items, including a higher level of premiums received in 2018 against the prior year.
Like-for-like net rental income operating metrics
2018 2017
Occupancy 96.7% 97.0%– of which, occupied by tenants trading in administration 2.0% 0.6%Leasing activity– number, new rent 248, £39m 217, £38m– new rent relative to previous passing rent +6% +7%Rental uplift on rent reviews settled +7% +9%
Occupancy is 96.7 per cent, in line with 31 December 2017, with new lettings offsetting the closures in the year.
We agreed 248 long-term leases in the year, amounting to £39 million annual rent, at an average of 6 per cent above previous passing rent (like-for-like units) and in line with valuers’ assumptions. On a net effective basis (net of rent free and incentives), rents were also 6 per cent ahead of previous rents. River Island is one of many top retailers
investing in their intu stores
Strategic reportFin
ancial statem
ents
Other in
formation
Govern
ance
43intu properties plc Annual report 2018

Retailers continue to focus on increasing their space in prime, high-footfall retail destinations. While the UK letting market is challenging, our winning destinations continue to be in demand from quality retailers. Significant activity in 2018 included:
— new retail anchors, in the shape of key fashion brands, upsizing to optimise their offering and configuration. At intu Lakeside, River Island and Zara are both upsizing, doubling and trebling their space respectively, and Next opened new flagship stores of around 80,000 sq ft each at intu Metrocentre and intu Merry Hill
— key international fashion brands expanding their portfolio of brands with H&M opening two of its eight Monki stores in the UK at intu Eldon Square and Manchester Arndale and Inditex, the parent company of Zara, followed openings of Stradivarius and Pull&Bear at intu Trafford Centre last year with Bershka at St David’s, Cardiff
— international brands’ ongoing appreciation of the attractiveness of intu’s destination shopping centres to gain nationwide exposure. Abercrombie & Fitch opened only its second UK store at intu Trafford Centre, Uniqlo is planning to open two of its first stores outside London at intu Watford and Manchester Arndale and Xiaomi, the Chinese mobile phone company, opened its fifth store in Spain (and second in our portfolio) at intu Puerto Venecia
— brands recognising the benefit of standalone stores as part of their customer acquisition, including brands which historically would be department store concessions such as Jo Malone. Mitsubishi and Silent Night have opened stores at intu Lakeside and The White Company at Cribbs Causeway
We settled 137 rent reviews in the year for new rents totalling £47 million, an average uplift of 7 per cent on the previous rents.
The weighted average unexpired lease term is 7.2 years (31 December 2017: 7.5 years) illustrating the longevity of our income streams.
The difference between our annual property income of £474 million and ERV of £566 million represents £25 million from units subject to a rent free period, £41 million from vacant and development units and reversion of £26 million, 5 per cent, from rent reviews and lease expiry.
Delivering operational excellenceThe objective of delivering operational excellence underpins how we operate our centres. Through a range of metrics, we monitor our performance to ensure we are meeting both our customer and retailer requirements.
Operational metrics
2018 2017
Footfall -1.6% +0.1%Retailer sales (like-for-like centres) -2.3% -2.1%Rent to estimated sales (excluding anchors and major space users) 12.4% 12.1%Net promoter score 75 70Unprompted brand awareness 28% 26%Prompted brand awareness 76% 71%
Footfall in our centres has been robust considering the unusual weather events in 2018 with periods of severe snow followed by the high temperatures through the summer. Overall, our footfall decreased by 1.6 per cent in 2018, but significantly outperformed the ShopperTrak measure of UK national retail footfall which was down on average by 3.5 per cent, highlighting the continued attractiveness of our compelling destinations against the wider market.
Like-for-like net rental income growth
+0.6%Footfall
+190bpsOutperformance of ShopperTrak benchmark
Operating review continued
Footfall in our centres has been robust – despite the unusual weather in the year
Strategic report
44 intu properties plc Annual report 2018
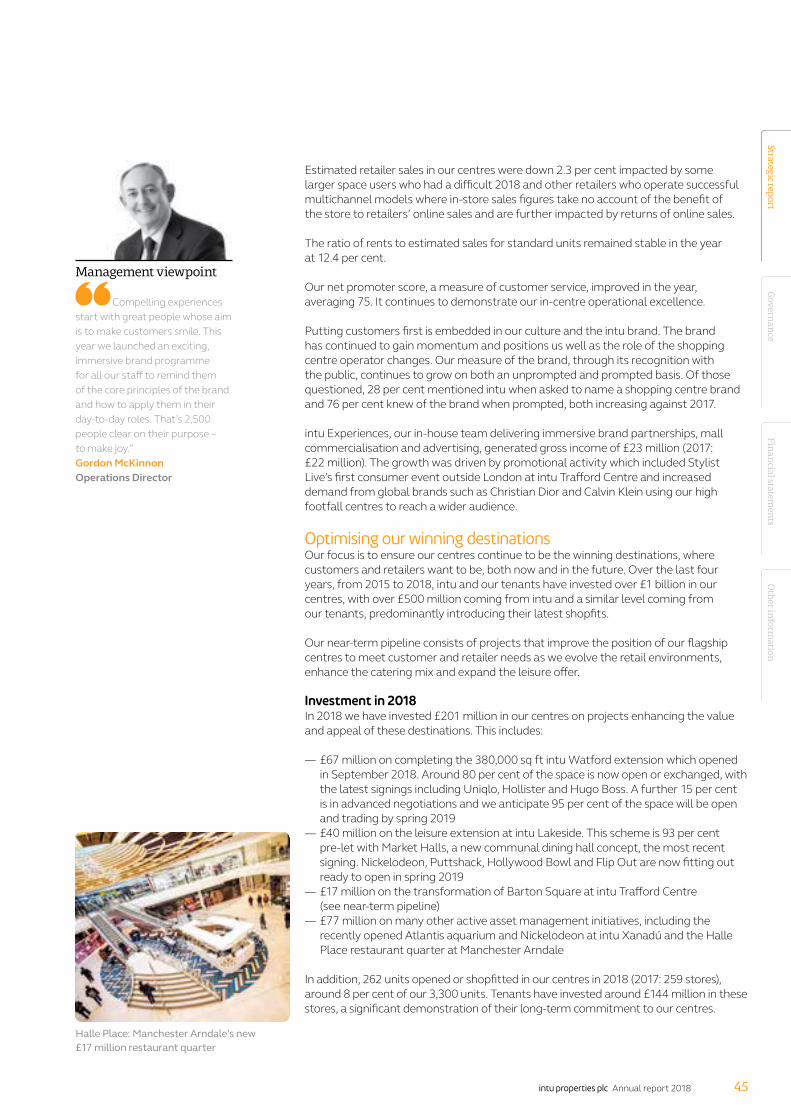
Estimated retailer sales in our centres were down 2.3 per cent impacted by some larger space users who had a difficult 2018 and other retailers who operate successful multichannel models where in-store sales figures take no account of the benefit of the store to retailers’ online sales and are further impacted by returns of online sales.
The ratio of rents to estimated sales for standard units remained stable in the year at 12.4 per cent.
Our net promoter score, a measure of customer service, improved in the year, averaging 75. It continues to demonstrate our in-centre operational excellence.
Putting customers first is embedded in our culture and the intu brand. The brand has continued to gain momentum and positions us well as the role of the shopping centre operator changes. Our measure of the brand, through its recognition with the public, continues to grow on both an unprompted and prompted basis. Of those questioned, 28 per cent mentioned intu when asked to name a shopping centre brand and 76 per cent knew of the brand when prompted, both increasing against 2017.
intu Experiences, our in-house team delivering immersive brand partnerships, mall commercialisation and advertising, generated gross income of £23 million (2017: £22 million). The growth was driven by promotional activity which included Stylist Live’s first consumer event outside London at intu Trafford Centre and increased demand from global brands such as Christian Dior and Calvin Klein using our high footfall centres to reach a wider audience.
Optimising our winning destinationsOur focus is to ensure our centres continue to be the winning destinations, where customers and retailers want to be, both now and in the future. Over the last four years, from 2015 to 2018, intu and our tenants have invested over £1 billion in our centres, with over £500 million coming from intu and a similar level coming from our tenants, predominantly introducing their latest shopfits.
Our near-term pipeline consists of projects that improve the position of our flagship centres to meet customer and retailer needs as we evolve the retail environments, enhance the catering mix and expand the leisure offer.
Investment in 2018In 2018 we have invested £201 million in our centres on projects enhancing the value and appeal of these destinations. This includes:
— £67 million on completing the 380,000 sq ft intu Watford extension which opened in September 2018. Around 80 per cent of the space is now open or exchanged, with the latest signings including Uniqlo, Hollister and Hugo Boss. A further 15 per cent is in advanced negotiations and we anticipate 95 per cent of the space will be open and trading by spring 2019
— £40 million on the leisure extension at intu Lakeside. This scheme is 93 per cent pre-let with Market Halls, a new communal dining hall concept, the most recent signing. Nickelodeon, Puttshack, Hollywood Bowl and Flip Out are now fitting out ready to open in spring 2019
— £17 million on the transformation of Barton Square at intu Trafford Centre (see near-term pipeline)
— £77 million on many other active asset management initiatives, including the recently opened Atlantis aquarium and Nickelodeon at intu Xanadú and the Halle Place restaurant quarter at Manchester Arndale
In addition, 262 units opened or shopfitted in our centres in 2018 (2017: 259 stores), around 8 per cent of our 3,300 units. Tenants have invested around £144 million in these stores, a significant demonstration of their long-term commitment to our centres.
Halle Place: Manchester Arndale’s new £17 million restaurant quarter
Management viewpoint
Compelling experiences start with great people whose aim is to make customers smile. This year we launched an exciting, immersive brand programme for all our staff to remind them of the core principles of the brand and how to apply them in their day-to-day roles. That’s 2,500 people clear on their purpose – to make joy.”Gordon McKinnonOperations Director
Strategic reportFin
ancial statem
ents
Other in
formation
Govern
ance
45intu properties plc Annual report 2018

Annual maintenance expenditure in our centres is substantially recovered from tenants via the service charge. In 2018, a total of £17 million across our assets was recovered.
Near-term pipelineLooking ahead, we are progressing our near-term investment pipeline of £428 million through to the end of 2021.
We are committed to investing £238 million:
— at intu Broadmarsh we appointed the main contractor for this mixed-use regeneration project which is anticipated to cost £89 million in total and expected to deliver a stabilised initial yield of around 7 per cent. We have signed The Light cinema and Hollywood Bowl, with 45 per cent of the project either exchanged or in advanced negotiations. The redevelopment is expected to complete in the second half of 2021
— at intu Trafford Centre, we have commenced construction of the expansion and transformation of Barton Square with 62 per cent of the space pre-let and a further 11 per cent in advanced negotiations. The £75 million project, expected to deliver a return of between 6 and 7 per cent, involves enclosing the courtyard, enhancing interiors, trading from an additional level and providing a fashion offer for the first time at Barton Square with Primark anchoring the development, which is expected to open in early 2020
— at intu Lakeside and intu Watford, we have the remaining costs to complete these projects
— at intu Costa del Sol, we have committed £12 million to complete the final designs and resolve any outstanding planning matters. We have started the tendering process for some of the key construction packages (see below for more details on the full project)
— active asset management projects total £40 million and include £12 million for enhancing the look and feel of intu Merry Hill and £8 million for a mall refresh at intu Lakeside to tie in with the opening of the leisure extension. Other projects are across all centres and are expected to deliver a range of returns between 6 and 10 per cent dependent on the nature of the individual project
Our pipeline of planned projects amounts to £190 million:
— at intu Costa del Sol, we expect to clear the final planning matters in 2019. With work on the final design ongoing, we are also targeting our required level of pre-lets in the next 12 months. This 255,000 sq m development is expected to cost around £670 million. Our business plan provides for the introduction of a joint venture partner at the start of construction and limits our outlay on the project to around £188 million which we expect to be mostly funded by borrowings specific to the project
— active asset management projects total £120 million and are for projects of varying sizes across all centres
Mixed-use opportunitiesIn addition to the pipeline above, we have significant opportunities within the portfolio for alternative uses of some of our available land.
We have extensive available land. Our six major out-of-town centres comprise some 760 acres of land, of which less than 40 per cent has buildings, multistorey car parks or distribution roads upon it, leaving 470 acres of surface car parks and other potentially developable land. The city centre locations also offer opportunities for intensification of uses.
Mixed-use opportunities being evaluated include residential, hotels and other uses. Initial work has highlighted the potential for around 5,000 residential units and nearly 600 hotel rooms.
Initially, private-rented-sector residential opportunities to create a total of circa 1,700 units have been identified which, if fully developed, could in aggregate produce a yield
Operating review continued
Prompted awareness
+76%Revenue generated by intu Experiences
£23m
Management viewpoint
There is no doubt that there is great synergy between hotel and residential uses and our unique destinations such as intu Lakeside. Our range of uses support a wider community with places to shop, eat and relax at the forefront of the offer. This wider appeal reinforces our strategy of ensuring that our retailers flourish and our destinations thrive.”Rebecca RymanRegional Managing Director
Strategic report
46 intu properties plc Annual report 2018

of around 5 per cent on total development costs, excluding land, of around £240 million. The most advanced of these projects is at intu Lakeside, where we could deliver around 1,000 residential units.
In addition to the residential and hotel opportunities, further mixed-use opportunities relating to office, flexible working spaces, business lounges and service-oriented uses have been identified that could generate attractive incremental returns to our current rental income stream. Many of these options have a relatively low capital outlay, are quick to implement and take advantage of the current configuration of the centres.
All these opportunities, which are under active consideration, would create value directly but moreover would increase the overall attractiveness and catchment of the centres.
Making smart use of capitalIn line with our strategy, we continue to recycle capital to focus on our winning destinations where we have the opportunity to deliver superior returns.
Financial strengthWe consider the structure of our borrowings, predominantly using flexible asset specific non-recourse arrangements (84 per cent of overall debt), to be appropriate for our concentrated portfolio.
We have refinanced or entered new facilities of over £500 million in 2018 (see financial review) at competitive rates illustrating that debt markets continue to be supportive of the highest quality retail property. We will continue to undertake debt refinancing activity on a timely basis or where it is attractive for the Group to do so.
Cash and available facilities at 31 December 2018 were £548 million and our debt to assets ratio was 53.1 per cent. As stated in our strategy, we are targeting to reduce this to below 50 per cent over time and ensure we maintain adequate financial headroom.
Our facilities have covenant headroom to deal with falls in valuations. By way of example, a 10 per cent fall in capital values, from the December 2018 valuations, would create a covenant shortfall of only £1 million which could be cured from available facilities.
We have minimal debt maturities before 2021, with a weighted average debt maturity of 5.8 years at 31 December 2018.
With more than £5 billion of debt refinanced over the last six years, we have proven we have very good access to both the public and private capital markets and over this period reduced our weighted average cost of debt from 5.2 per cent to 4.2 per cent. Our average cost of debt includes legacy debt on intu Trafford Centre (£0.7 billion; cost of debt 6.0 per cent), which pre-dates the asset becoming part of the intu portfolio in 2011 and a first mortgage debenture stock 2027 (£0.2 billion; cost of debt 9.9 per cent) originally issued over 25 years ago. Excluding these two facilities, the weighted average cost of debt of all other facilities is 3.5 per cent.
DisposalsIn January 2018, we completed the formation of a joint venture with LaSalle Investment Management for them to take ownership of 50 per cent of intu Chapelfield, Norwich for an initial net consideration of £148 million.
In line with our strategy, in late 2018 we disposed of £23 million of sundry assets at 6 per cent above their December 2017 book values.
Our disposals in the last four years are over £1 billion as we have disposed of non-core assets and introduced partners on other centres. We have flexibility for further disposals or part disposals, as around two-thirds, by value, of our portfolio is 100 per cent owned.
Our plan for 1,000 residential units at intu Lakeside
intu Milton Keynes successfully refinanced in 2018
Strategic reportFin
ancial statem
ents
Other in
formation
Govern
ance
47intu properties plc Annual report 2018
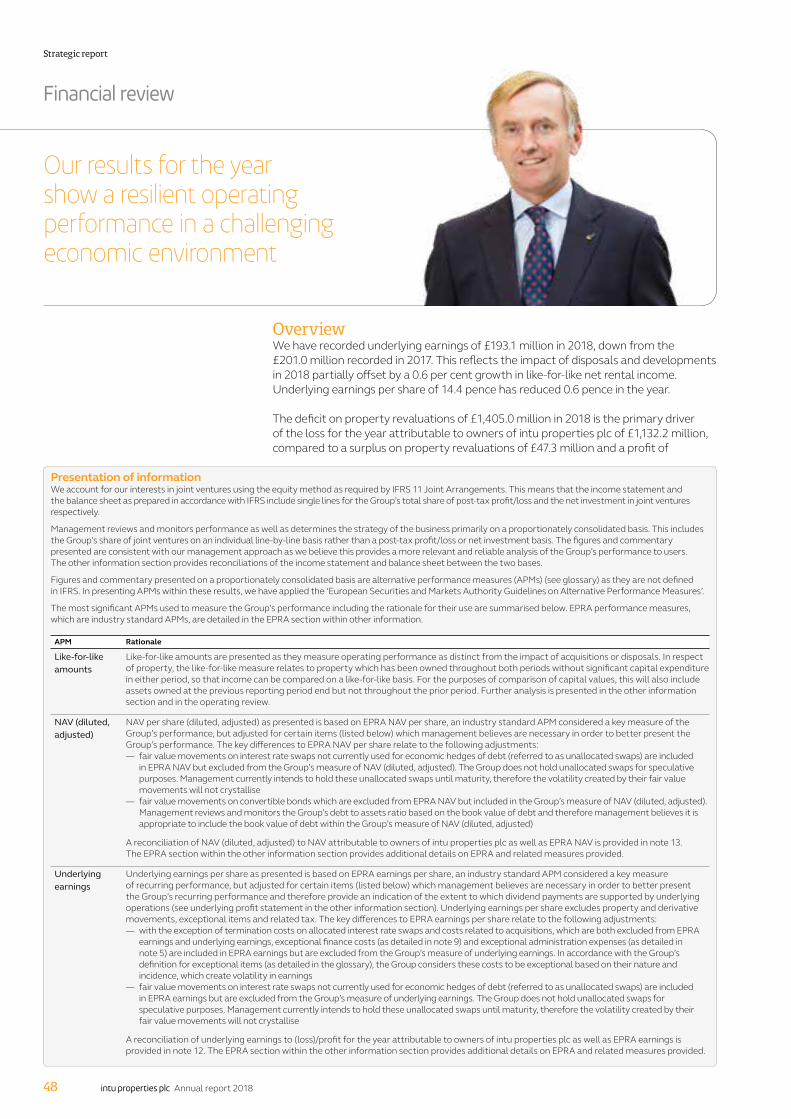
OverviewWe have recorded underlying earnings of £193.1 million in 2018, down from the £201.0 million recorded in 2017. This reflects the impact of disposals and developments in 2018 partially offset by a 0.6 per cent growth in like-for-like net rental income. Underlying earnings per share of 14.4 pence has reduced 0.6 pence in the year.
The deficit on property revaluations of £1,405.0 million in 2018 is the primary driver of the loss for the year attributable to owners of intu properties plc of £1,132.2 million, compared to a surplus on property revaluations of £47.3 million and a profit of
Presentation of informationWe account for our interests in joint ventures using the equity method as required by IFRS 11 Joint Arrangements. This means that the income statement and the balance sheet as prepared in accordance with IFRS include single lines for the Group’s total share of post-tax profit/loss and the net investment in joint ventures respectively.
Management reviews and monitors performance as well as determines the strategy of the business primarily on a proportionately consolidated basis. This includes the Group’s share of joint ventures on an individual line-by-line basis rather than a post-tax profit/loss or net investment basis. The figures and commentary presented are consistent with our management approach as we believe this provides a more relevant and reliable analysis of the Group’s performance to users. The other information section provides reconciliations of the income statement and balance sheet between the two bases.
Figures and commentary presented on a proportionately consolidated basis are alternative performance measures (APMs) (see glossary) as they are not defined in IFRS. In presenting APMs within these results, we have applied the ‘European Securities and Markets Authority Guidelines on Alternative Performance Measures’.
The most significant APMs used to measure the Group’s performance including the rationale for their use are summarised below. EPRA performance measures, which are industry standard APMs, are detailed in the EPRA section within other information.
APM Rationale
Like-for-like amounts
Like-for-like amounts are presented as they measure operating performance as distinct from the impact of acquisitions or disposals. In respect of property, the like-for-like measure relates to property which has been owned throughout both periods without significant capital expenditure in either period, so that income can be compared on a like-for-like basis. For the purposes of comparison of capital values, this will also include assets owned at the previous reporting period end but not throughout the prior period. Further analysis is presented in the other information section and in the operating review.
NAV (diluted, adjusted)
NAV per share (diluted, adjusted) as presented is based on EPRA NAV per share, an industry standard APM considered a key measure of the Group’s performance, but adjusted for certain items (listed below) which management believes are necessary in order to better present the Group’s performance. The key differences to EPRA NAV per share relate to the following adjustments:
— fair value movements on interest rate swaps not currently used for economic hedges of debt (referred to as unallocated swaps) are included in EPRA NAV but excluded from the Group’s measure of NAV (diluted, adjusted). The Group does not hold unallocated swaps for speculative purposes. Management currently intends to hold these unallocated swaps until maturity, therefore the volatility created by their fair value movements will not crystallise
— fair value movements on convertible bonds which are excluded from EPRA NAV but included in the Group’s measure of NAV (diluted, adjusted). Management reviews and monitors the Group’s debt to assets ratio based on the book value of debt and therefore management believes it is appropriate to include the book value of debt within the Group’s measure of NAV (diluted, adjusted)
A reconciliation of NAV (diluted, adjusted) to NAV attributable to owners of intu properties plc as well as EPRA NAV is provided in note 13. The EPRA section within the other information section provides additional details on EPRA and related measures provided.
Underlying earnings
Underlying earnings per share as presented is based on EPRA earnings per share, an industry standard APM considered a key measure of recurring performance, but adjusted for certain items (listed below) which management believes are necessary in order to better present the Group’s recurring performance and therefore provide an indication of the extent to which dividend payments are supported by underlying operations (see underlying profit statement in the other information section). Underlying earnings per share excludes property and derivative movements, exceptional items and related tax. The key differences to EPRA earnings per share relate to the following adjustments:
— with the exception of termination costs on allocated interest rate swaps and costs related to acquisitions, which are both excluded from EPRA earnings and underlying earnings, exceptional finance costs (as detailed in note 9) and exceptional administration expenses (as detailed in note 5) are included in EPRA earnings but are excluded from the Group’s measure of underlying earnings. In accordance with the Group’s definition for exceptional items (as detailed in the glossary), the Group considers these costs to be exceptional based on their nature and incidence, which create volatility in earnings
— fair value movements on interest rate swaps not currently used for economic hedges of debt (referred to as unallocated swaps) are included in EPRA earnings but are excluded from the Group’s measure of underlying earnings. The Group does not hold unallocated swaps for speculative purposes. Management currently intends to hold these unallocated swaps until maturity, therefore the volatility created by their fair value movements will not crystallise
A reconciliation of underlying earnings to (loss)/profit for the year attributable to owners of intu properties plc as well as EPRA earnings is provided in note 12. The EPRA section within the other information section provides additional details on EPRA and related measures provided.
Financial review
Our results for the year show a resilient operating performance in a challenging economic environment
Strategic report
48 intu properties plc Annual report 2018

201.0 -11.8+2.3 +2.1 -2.4 +1.9 193.1
2017
Net
rent
al in
com
e –
disp
osal
s/de
velo
pmen
ts
Net
rent
al in
com
e –
like-
for-
like
Net
fina
nce
cost
s
Adm
inis
trat
ion
expe
nses
Oth
er
201
8
Underlying earnings (£m)
100
125
150
175
200
£216.7 million in 2017. Further commentary on the deficit on property revaluations is provided in the operating review.
Our measure of NAV per share (diluted, adjusted) of 312 pence has decreased 99 pence during the year due to the deficit on property revaluations, which impact the movement by 102 pence.
In January 2018 we continued our programme of recycling capital, completing the 50 per cent sale of intu Chapelfield to a new joint venture partner, LaSalle Investment Management (acting on behalf of Greater Manchester Pension Fund and West Yorkshire Pension Fund), for initial net consideration of £148.0 million. In accordance with IFRS, following the completion date, intu Chapelfield is now presented as a joint venture in our financial statements.
We have refinanced or entered new facilities of over £500 million in 2018. Our interest cover ratio of 1.91x is slightly lower in the year (31 December 2017: 1.94x) with satisfactory headroom above our target minimum level of 1.60x.
Income statementUnderlying earnings and underlying earnings per share of £193.1 million and 14.4 pence respectively in 2018 have decreased from £201.0 million and 15.0 pence respectively in 2017. The key movements of underlying earnings are shown in the chart to the left.
Net rental income decreased £9.5 million in 2018 to £450.5 million primarily due to the part disposal of intu Chapelfield in January 2018 and the acquisition and part disposal of intu Xanadú in 2017, partially offset by growth in like-for-like net rental income.
Like-for-like net rental income increased by £2.3 million, 0.6 per cent in the year, driven by rent reviews and new lettings partially offset by administrations and CVAs (see operating review).
Administration expenses increased by £2.4 million during the year to £44.0 million, predominantly from increased corporate overheads and depreciation on IT capital projects.
Income statement summary2018 2017
Group£m
Share of joint ventures£m
Group includingshare of joint ventures
£m
Group includingshare of joint ventures
£m
Underlying earnings 193.1 n/a 193.1 201.0Adjusted for:Revaluation of investment and development property (1,332.8) (72.2) (1,405.0) 47.3Loss on disposal of subsidiaries (8.5) – (8.5) (1.8)Gain on sale of investment and development property 1.4 – 1.4 –Loss on sale of other investments – – – (0.3)Administration expenses – exceptional (13.1) (0.1) (13.2) (6.6)Exceptional finance costs (32.9) 4.5 (28.4) (33.0)Change in fair value of financial instruments 87.3 (1.0) 86.3 23.0Tax on the above 5.8 (2.2) 3.6 (22.7)Share of joint ventures’ adjusted items (71.3) 71.3 – –Share of associates’ adjusted items 1.1 – 1.1 0.4Non-controlling interests in respect of the above 37.7 (0.3) 37.4 9.4(Loss)/profit for the year attributable to owners of intu properties plc (1,132.2) n/a (1,132.2) 216.7
Underlying earnings per share (pence) 14.4p n/a 14.4p 15.0p
Strategic reportFin
ancial statem
ents
Other in
formation
Govern
ance
49intu properties plc Annual report 2018
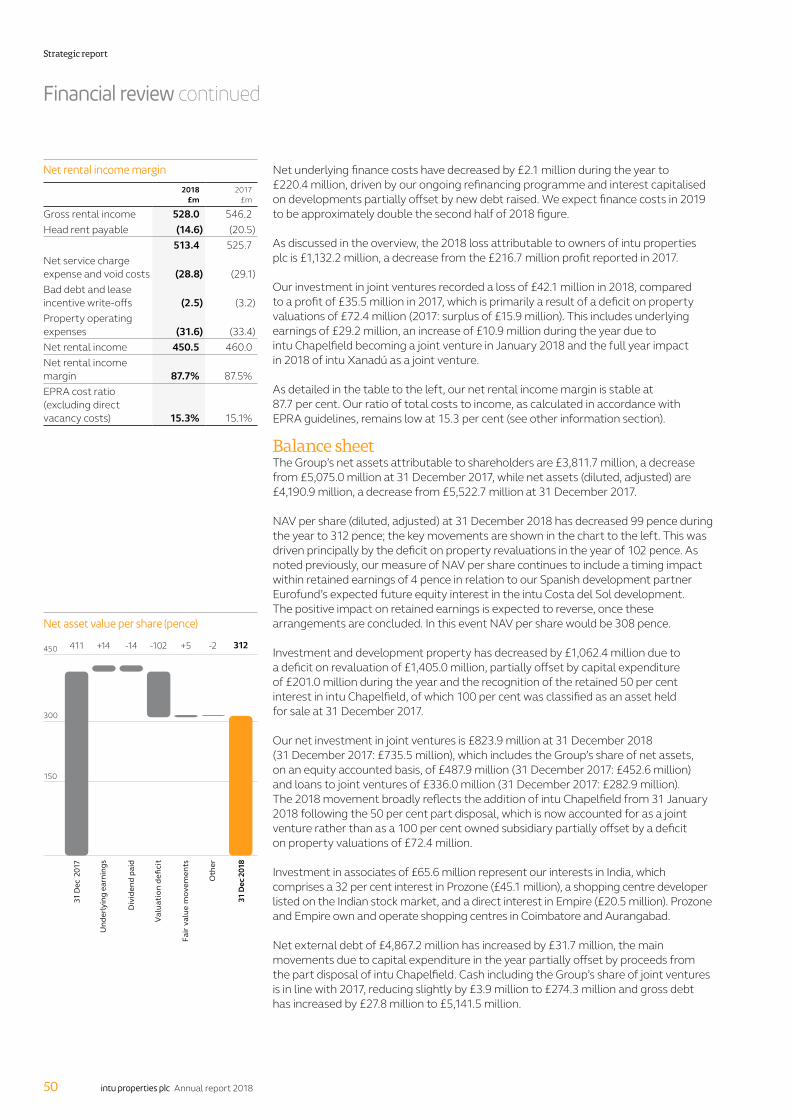
411 -14+14 -102 +5 -2 312
31 D
ec 2
017
Div
iden
d pa
id
Und
erly
ing
earn
ings
Val
uati
on d
efici
t
Fair
valu
e m
ovem
ents
Oth
er
31 D
ec 2
018
Net asset value per share (pence)
150
300
450
Net underlying finance costs have decreased by £2.1 million during the year to £220.4 million, driven by our ongoing refinancing programme and interest capitalised on developments partially offset by new debt raised. We expect finance costs in 2019 to be approximately double the second half of 2018 figure.
As discussed in the overview, the 2018 loss attributable to owners of intu properties plc is £1,132.2 million, a decrease from the £216.7 million profit reported in 2017.
Our investment in joint ventures recorded a loss of £42.1 million in 2018, compared to a profit of £35.5 million in 2017, which is primarily a result of a deficit on property valuations of £72.4 million (2017: surplus of £15.9 million). This includes underlying earnings of £29.2 million, an increase of £10.9 million during the year due to intu Chapelfield becoming a joint venture in January 2018 and the full year impact in 2018 of intu Xanadú as a joint venture.
As detailed in the table to the left, our net rental income margin is stable at 87.7 per cent. Our ratio of total costs to income, as calculated in accordance with EPRA guidelines, remains low at 15.3 per cent (see other information section).
Balance sheetThe Group’s net assets attributable to shareholders are £3,811.7 million, a decrease from £5,075.0 million at 31 December 2017, while net assets (diluted, adjusted) are £4,190.9 million, a decrease from £5,522.7 million at 31 December 2017.
NAV per share (diluted, adjusted) at 31 December 2018 has decreased 99 pence during the year to 312 pence; the key movements are shown in the chart to the left. This was driven principally by the deficit on property revaluations in the year of 102 pence. As noted previously, our measure of NAV per share continues to include a timing impact within retained earnings of 4 pence in relation to our Spanish development partner Eurofund’s expected future equity interest in the intu Costa del Sol development. The positive impact on retained earnings is expected to reverse, once these arrangements are concluded. In this event NAV per share would be 308 pence.
Investment and development property has decreased by £1,062.4 million due to a deficit on revaluation of £1,405.0 million, partially offset by capital expenditure of £201.0 million during the year and the recognition of the retained 50 per cent interest in intu Chapelfield, of which 100 per cent was classified as an asset held for sale at 31 December 2017.
Our net investment in joint ventures is £823.9 million at 31 December 2018 (31 December 2017: £735.5 million), which includes the Group’s share of net assets, on an equity accounted basis, of £487.9 million (31 December 2017: £452.6 million) and loans to joint ventures of £336.0 million (31 December 2017: £282.9 million). The 2018 movement broadly reflects the addition of intu Chapelfield from 31 January 2018 following the 50 per cent part disposal, which is now accounted for as a joint venture rather than as a 100 per cent owned subsidiary partially offset by a deficit on property valuations of £72.4 million.
Investment in associates of £65.6 million represent our interests in India, which comprises a 32 per cent interest in Prozone (£45.1 million), a shopping centre developer listed on the Indian stock market, and a direct interest in Empire (£20.5 million). Prozone and Empire own and operate shopping centres in Coimbatore and Aurangabad.
Net external debt of £4,867.2 million has increased by £31.7 million, the main movements due to capital expenditure in the year partially offset by proceeds from the part disposal of intu Chapelfield. Cash including the Group’s share of joint ventures is in line with 2017, reducing slightly by £3.9 million to £274.3 million and gross debt has increased by £27.8 million to £5,141.5 million.
Net rental income margin
2018£m
2017£m
Gross rental income 528.0 546.2Head rent payable (14.6) (20.5)
513.4 525.7Net service charge expense and void costs (28.8) (29.1)Bad debt and lease incentive write-offs (2.5) (3.2)Property operating expenses (31.6) (33.4)Net rental income 450.5 460.0Net rental income margin 87.7% 87.5%EPRA cost ratio (excluding direct vacancy costs) 15.3% 15.1%
Financial review continued
Strategic report
50 intu properties plc Annual report 2018

Derivative financial instruments comprise the fair value of the Group’s interest rate swaps (referred to as allocated and unallocated swaps). The net liability at 31 December 2018 is £284.0 million, a decrease of £65.8 million in the year, due to cash payments in the year and increases in interest rates, with the Sterling five-year and 10-year swap rates increasing by 24bps and 13bps respectively. Cash payments in 2018 totalled £44.9 million, £28.1 million of which has been classified as an exceptional finance cost as it relates to payments in respect of unallocated swaps (see below). The balance of the payments has been included as underlying finance costs as it relates to ongoing allocated swaps used to hedge debt.
We hold a number of interest rate swaps, entered into some years ago, which are unallocated due to a change in lenders’ practice. Lenders previously would allow the allocation of existing long-dated swap cover to new debt; however, this practice changed where lenders began to require lender specific swaps on new debt to be put in place as a hedge when entering into new variable interest rate debt. As a consequence of our significant refinancing activity carried out in recent years (see financing section), this historical long-dated swap cover is no longer acting as a hedge to any debt interests and is therefore unallocated.
At 31 December 2018 these unallocated swaps have a market value liability of £184.4 million (31 December 2017: £235.4 million). It is estimated that we will be required to make cash payments on these unallocated swaps of around £26.7 million in 2019, reducing to below £20 million per annum in 2021. Cash payments on these unallocated swaps will continue until their maturity dates, which range between 2020 and 2037, but will cease in the event a swap is closed early. Management intends to hold these until maturity as there is currently no economic benefit to closing these unallocated swap contracts early as this would require an upfront cash settlement in full.
The non-controlling interest at 31 December 2018 relates primarily to our partner’s 40 per cent stake in intu Metrocentre.
We are exposed to foreign exchange movements on our overseas investments. At 31 December 2018 the exposure is 15.0 per cent of net assets attributable to shareholders of the Group (31 December 2017: 10.6 per cent), with the increase from 31 December 2017 being primarily due to the declines in our UK property valuations during the year. Once the Eurofund expected future interest in the intu Costa del Sol development concludes, we expect the exposure to reduce to 13.9 per cent, after which the appropriate level of exposure will be assessed.
Balance sheet summary
2018 2017
Group£m
Share ofjoint ventures
£m
Group includingshare of joint ventures
£m
Group includingshare of joint ventures
£m
Investment and development property 8,021.8 1,108.3 9,130.1 10,192.5Investment in joint ventures 823.9 (823.9) – –Assets and associated liabilities classified as held for sale – – – 302.9Investment in associates and other investments 76.1 – 76.1 81.6Net external debt (4,606.3) (260.9) (4,867.2) (4,835.5)Derivative financial instruments (280.5) (3.5) (284.0) (349.8)Other assets and liabilities (210.6) (16.3) (226.9) (259.3)Net assets 3,824.4 3.7 3,828.1 5,132.4Non-controlling interest (12.7) (3.7) (16.4) (57.4)Attributable to shareholders 3,811.7 n/a 3,811.7 5,075.0Fair value of derivative financial instruments 280.5 3.5 284.0 349.8Other adjustments 98.7 (3.5) 95.2 97.9Net assets (diluted, adjusted) 4,190.9 n/a 4,190.9 5,522.7
NAV per share (diluted, adjusted) (pence) 312p n/a 312p 411p
Strategic reportFin
ancial statem
ents
Other in
formation
Govern
ance
51intu properties plc Annual report 2018

Debt measures
2018 2017
Debt to assets ratio 53.1% 45.2%1
Interest cover 1.91x 1.94xWeighted average debt maturity 5.8 years 6.6 yearsWeighted average cost of gross debt 4.2% 4.2%Proportion of gross debt with interest rate protection 84% 95%Cash and available facilities £548.5m £833.1m1
1 Pro forma for the net initial consideration of £148 million on 50 per cent disposal of intu Chapelfield.
Cash flowDuring 2018 cash and cash equivalents increased by £13.3 million.
Cash flows from operating activities of £102.6 million are £38.3 million lower than the same period in 2017, primarily due to the timing of payments.
Cash flows from investing activities reflects the cash outflows related to capital expenditure in 2018 offset by the cash inflow for the 50 per cent sale of intu Chapelfield in January and net cash inflows from joint ventures during the year.
The main elements of cash flows from financing activities are the cash dividends paid in 2018 of £187.6 million, partially offset by net borrowings drawn in the year.
Financing Debt structure We have carried out significant refinancing activity in recent years which has resulted in diversified sources of funding, including secured bonds plus syndicated bank debt secured on individual or pools of assets, with limited or no recourse from the borrowing entities to other Group companies outside of these arrangements. Our corporate-level debt remains limited to the Revolving Credit Facility (RCF) as well as the £375 million 2.875 per cent convertible bonds due 2022. In October 2018 we settled in cash the remaining £160.4 million outstanding in respect of the 2.5 per cent convertible bonds.
During the year we undertook the following financing activities:
— agreed a new £74 million facility secured against our remaining 50 per cent interest in intu Chapelfield, maturing in 2023
— refinanced the €225 million facility secured against intu Puerto Venecia (our share: €112.5 million), now maturing in 2025
— extended the £140 million facility secured against intu Milton Keynes by 18 months, now maturing in 2021
— agreed a new £46 million facility secured against our development at intu Broadmarsh, maturing in 2022. At 31 December 2018, this development finance loan was undrawn
— agreed a new £50 million facility secured against our development at intu Trafford Centre’s Barton Square, maturing in 2021. This facility is split as a £25 million term loan, which was fully drawn at 31 December 2018 and a £25 million development finance loan, of which £3.3 million was drawn at 31 December 2018
The chart below illustrates that we have no major refinancing requirement due until 2021.
0
200
400
600
800
1,000
1,20047 80 1,163 775 1,032 593 128 28 262 843 493 199
Debt maturity (£m)
2019 2020 2021 2022 2023 2024 2025 2026 2027 2028 2029-2033
2034+
Debt measuresOur debt to assets ratio has increased to 53.1 per cent since 31 December 2017 due to the deficit on property revaluation in the year. As part of our revised strategy, we will be looking to reduce this to below 50 per cent. Our weighted average debt maturity has reduced to 5.8 years and the weighted average cost of gross debt is stable at 4.2 per cent (excluding the RCF).
Interest cover of 1.91x has remained stable and above our target minimum level of 1.60x.
Financial review continued
Cash flow summary
2018£m
2017£m
Group cash flow as reportedCash flows from operating activities 102.6 140.9Cash flows from investing activities (0.4) (518.1)Cash flows from financing activities (89.0) 350.2Foreign exchange movements 0.1 0.4Net increase/(decrease) in cash and cash equivalents 13.3 (26.6)
Strategic report
52 intu properties plc Annual report 2018

We use interest rate swaps to fix interest obligations, reducing any cash flow volatility caused by changes in interest rates. The proportion of debt with interest rate protection has decreased in the year to 84 per cent within our policy range of between 75 per cent and 100 per cent.
CovenantsFurther details of the debt financial covenants are included in the other information section of this report. We are in compliance with all of our covenants and regularly stress test them for changes in capital values and income. By way of example, a 10 per cent fall in capital values would create a covenant shortfall of only £1 million.
Capital commitmentsWe have an aggregate Board-approved commitment to capital projects of £238.0 million at 31 December 2018 (31 December 2017: £267.6 million). Of this, £191.2 million (31 December 2017: £158.6 million) is contractually committed.
In addition to the committed expenditure, we have an identified uncommitted pipeline of active asset management projects, major extensions and developments that may become committed over the coming years (see operating review).
OtherTax policy positionThe Group has tax exempt status in the UK (REIT) and for two of our joint ventures in Spain (SOCIMI) which provide exemption from corporation tax on rental income and gains arising on property sales, with tax instead being paid at shareholder level. See glossary for further information on REITs.
The Group looks to minimise the level of tax risk and at all times seeks to comply fully with our regulatory and other tax obligations and to act in a way which upholds intu’s reputation as a responsible corporate citizen. This is achieved through regularly carrying out risk reviews, seeking pre-clearance from taxing authorities in complex areas and actively engaging in discussions regarding proposed changes in the taxation system that might affect the Group.
We have updated ‘intu’s Approach to Tax’ for 2018 which is published on the Group’s website intugroup.co.uk and provides further information about the Group’s tax strategy.
Despite being a REIT, we pay tax directly on non-SOCIMI overseas earnings, any UK non-property income, business rates and transaction taxes such as stamp duty land tax. In 2018 the total of such payments to tax authorities was £28.2 million (2017: £28.5 million), of which £25.4 million (2017: £26.0 million) was in the UK and £2.8 million (2017: £2.5 million) in Spain. We also collect VAT, employment taxes and withholding tax on dividends for HMRC and the Spanish tax authorities.
DividendsThe Directors are not recommending a final dividend for 2018. The total paid in respect of 2018 is 4.6 pence, a reduction of the 14.0 pence paid in respect of 2017.
A UK REIT is expected to pay dividends (PIDs) of at least 90 per cent of its taxable profits from its UK property rental business by the first anniversary of each accounting date. In view of the announced short term reduction of dividends it is expected that there will be an underpayment of the minimum PID, and so for the Group to incur UK corporation tax payable at 19 per cent. Any corporation tax payable would form part of underlying earnings and in 2019 we would expect this to be in the range of £15 million to £20 million. The Group intends to remain a UK REIT for the foreseeable future.
At 31 December 2018, the Company has distributable reserves of £604 million.
Matthew RobertsChief Financial Officer20 February 2019
We agreed a £46 million debt facility for our development of intu Broadmarsh
Strategic reportFin
ancial statem
ents
Other in
formation
Govern
ance
53intu properties plc Annual report 2018

We have run an annual employee engagement survey since 2011. This year’s results show greater participation and stable levels of employee engagement, improved perception of how we can all bring joy to customers and colleagues alike, together with high levels of respect for intu’s reputation.
This year, after listening to feedback from staff and customers, we have introduced a new uniform that more closely reflects the intu brand. Comfortable and practical, it has been well received by staff who say it makes them feel proud to work at intu. Customers say it makes our centre teams more visible and increases their sense of security. The uniform has been adapted for our Spanish teams to suit the local climate.
Diverse and inclusiveAs a people business with over 400 million customer visits a year our workforce should reflect our customers and the communities around our centres, so diversity is incredibly important to us. Ethnicity reporting is still voluntary but our latest staff survey suggests we closely mirror the national profile for ethnicity. Over 45 different nationalities are represented at intu.
We continue to work hard to achieve gender balance at every level of our business. We maintained our position in the top quartile of FTSE 250 and 350 companies for the number of women at board, senior and executive management levels – with almost 30 per cent of female staff at this level (FTSE Women Leaders, Hampton-Alexander Review 2018). We also
Our people
We are proud of our employees’ commitment to our purpose – creating compelling and joyful experiences for customers and helping retailers flourish
Highlights of the year — staff survey shows 85 per cent of staff
find ways to bring joy to customers and colleagues
— whole-company brand training programme
— all staff can now access company intranet
— new uniform introduced
Our culture in action Our culture permeates our business. Everyone, regardless of role or seniority, goes through the same brand immersion to understand our purpose and our values.
Our purpose is simple – to create compelling, joyful experiences that make our customers smile and help our retailers flourish. It is an intentionally simple focus that can be understood and delivered by everyone in the organisation.
Our values – bold, creative, genuine – encourage us all to behave in the right way and do the right thing: for our customers, our retailers, the environment and society. Our people understand if they apply our values in their work they will help create a successful and responsible business.
In 2017 we conducted a culture audit, and this year we produced a comprehensive guide to our culture for every member of staff and all new staff, to complement and reinforce the brand refresh.
As the brand is now five years old, and more than 50 per cent of staff are new to intu since it was introduced, we have invested in a brand engagement programme, designed to remind people of the core principles of the brand and how they can contribute to driving intu’s reputation. Over 200 sessions were held, and 96 per cent of staff attended.
Our employees are vital to fulfilling our purpose. In-centre or behind the scenes, the experiences they
create for our 35 million visitors and thousands of retailers are at the heart of what makes intu different.
Our people are talented individuals, and our culture empowers them to be bold, creative and genuine in their work and to come together to create high performance teams that drive intu’s success.
Our role is to be a great employer, promoting diversity and inclusion, treating our employees fairly and enabling them to grow professionally and personally. 2018 has been a busy year with many activities to inspire, motivate and support our people.
A united and successful teamWe employ 2,654 staff. In the UK 2,538 are employed across 16 centres and our head office in London. 2,091 of these are directly employed by our in-house facilities company, intu Retail Services. In Spain we have 38 people in our Madrid office and 78 at intu Xanadú.
Strategic report
54 intu properties plc Annual report 2018

Pay gapDifference between the average pay of men and women
Bonus gapDifference between the average bonus paid to men and women
Proportion of women receiving a bonus
Proportion of men receiving a bonus
Median 4.7% 0.0% 85.5% 83.0%
Mean 9.7% 54.4%
The chart below shows the gender pay gap for different groups of employees within the business. In a number of areas the average pay of women is higher than that of men.
Super regionals Larger city centres Smaller city centres
Overall gender pay gap(based on mean hourly rate)
Total employees 1,147
–7.97%
–8.63%
9.4%
Total employees 592
–7.97%
–8.63%
1.3%
Total employees 289
–7.97%
–8.63%
5.2%
Regional centre directors, general managers, senior asset managers
1.1%
8.4%
52.6% 1.8%
2.4%
4.9%
3.0%
4.6%
2.7%
Asset managers, marketing managers, operations managers, centre-based management roles
1.1%
8.4%
52.6% 1.8%
2.4%
4.9%
3.0%
4.6%
2.7%Supervisory, admin, front line delivery roles (including technicians)
1.1%
8.4%
52.6% 1.8%
2.4%
4.9%
3.0%
4.6%
2.7%
Female employees Male employees Men paid more Women paid more Read more at intugroup.co.uk
61%
39%
64%
36%
63%
37%
continue to work with the Mentoring Foundation, to enhance the opportunities for women to reach executive roles.
Inspire me, an informal network created and driven by an employee, was set up to give access to senior people so that others can learn from their experience (see case study, page 56). We also sponsor Retail Week’s Be Inspired initiative, with three of our senior women acting as ambassadors.
Our drive for inclusion goes further than our staff. By signing up as a Disability Confident Committed employer we aim to make sure our recruitment, training and development processes are equally accessible by people with a disability – as well as enabling all our staff to treat both colleagues and customers with respect. We hope to achieve the Disability Confident standard in 2019.
Through Pathways to Property, providing work experience for school students from less traditional backgrounds, and participation in a property industry research project sponsored by the JLL Foundation, we aim to improve socio-economic diversity in the sector.
Gender pay gap
We aim to be an employer of choice and to treat our employees fairly and pay them appropriately for their work. We welcomed the gender pay gap legislation introduced in 2017 and the increased pay transparency that can result. This is the second annual disclosure of the gender pay gap, which compares the average pay of men and
women within the organisation. This is different to equal pay, which takes into account the nature of a role and its seniority. If there are more men than women in senior positions, as is currently the case at intu, this results in the overall average of the pay of men being higher than the overall average of the pay of women.
intu also has two very different populations in our management services (MSL) and retail services (RSL) businesses and full details for each business are on our Group website. Overall, our median pay and bonus gaps are significantly smaller than the national picture with a slightly higher proportion of women than men receiving bonuses.
Strategic reportFin
ancial statem
ents
Other in
formation
Govern
ance
55intu properties plc Annual report 2018

Under 35 32%35 – 55 45%Over 55 23%
A good jobPart of being a great employer is treating our staff members well and going beyond statutory requirements where possible. All our staff over 18 who have completed their probation are paid above the National Living Wage, even staff not strictly covered by regulation. We do not use zero-hour contracts.
We are committed to ending the gender pay gap and we comply fully with the Equality Act Gender Pay Gap Information regulations. (See infographic on page 55).
Talent developmentWe are continuing to invest in our talent pipeline. Our learning and development team run a programme of internal and external training to keep business skills up to date as well as non-vocational activities such as those offered by the London Business Forum. This year we have created a bespoke programme for our centre marketing teams.
Employee engagementEnsuring our staff understand our business and know how they can contribute to intu’s success is crucial to our progress and was part of our promise to our staff when we rebranded to intu.
Our people continued
Human rightsAt intu we respect the dignity, liberty and equality of everyone we work with. We only work with people who choose to work freely and we respect their rights to equal opportunities and freedom of association.
We work with our suppliers, retailers and associated companies to ensure they meet acceptable standards of human dignity in their own sourcing policies. We will continue to evaluate the pay and conditions of all our employees, to ensure all staff earn above the National Living Wage and enjoy fair working conditions. Fair treatment of people who work for intu or our suppliers is a key focus of our corporate responsibility approach.
Modern Slavery ActWe are aware of our responsibilities under the Modern Slavery Act and continue to conduct due diligence on our suppliers. Details of our approach can be found in our Modern Slavery and Human Rights policy which is communicated to all those working on our behalf.
Read more at intugroup.co.uk
Inspire meGroup accountant Samantha Spiers (above centre, sharing experiences with colleagues) had the idea to set up the informal network Inspire me to create a forum where people could be inspired by each other’s stories. “I’ve had great support from senior management to get my idea off the ground,” she says. “It shows that there is a really open and supportive culture at intu for new ideas.” Growing numbers are joining the forum at the London head office and Sam is now hoping to roll the idea out across our centres. “It’s been an amazing success and people say it opens their eyes to what they themselves could achieve.”
Our commitment to employee engagement has been recognised externally through two awards – the Institute of Workplace and Facilities Management Employee Experience Award and the Employer Brand Management Award for best employer brand management programme.
We use a range of channels to communicate with our staff – magazines, digital channels and face-to-face meetings and briefings. Our inhouse magazine Chorus is written and produced by staff volunteers from across the business. We hold an all-staff video-linked presentation with the Chief Executive at least three times a year and a national all-centre roadshow to share the business plan.
In February 2018 we launched a new and improved version of our intranet, mint, and started to roll it out to all staff without a company computer. With the addition of new functionality such as comments, blogs and videos the new mint is a place for colleagues to interact with each other, regardless of location or job role.
It is a modern, easy-to-use platform that provides a greater understanding of the whole business and enables staff to feel part of the intu family, whether that is discovering new things about colleagues or the business, celebrating achievements or connecting and providing information to help people to do their jobs.
We continue to encourage staff to achieve their personal and professional goals and to take part in our corporate responsibility, community support and sustainability programmes. More than one in five took advantage of the working days intu makes available for volunteering activity in 2018.
Our plans for 2019 — roll out my intu, our employee self-service portal, to staff across the business
— reaccreditation of Investors in People at all our centres
— invest in new skills and capabilities, especially data analytics
Age profile
UK gender profile
UK gender profile senior managers
Female
1,006(2017: 1,017)
Female
9(2017: 10)
Male
24(2017: 31)
Male
1,532(2017: 1,450)
Strategic report
56 intu properties plc Annual report 2018

A t intu we have a culture of behaving responsibly. We work with our stakeholders to address
social and environmental issues that deliver value beyond immediate financial return. We focus on delivering positive change in our communities and respecting the environment. Good relationships and partnerships are integral to everything we do. We also recognise the part we have to play in keeping within the 1.5°c rise in temperature needed to mitigate the worst impacts of climate change.
Operational reviewWe have had a successful year in both our work with communities and our efforts to reduce our environmental impact.
Community development and economic contributionOur strong and open relationships with our stakeholders enable us to deliver real and lasting change in our communities. This year our community investment – which focuses on skills and employment, accessibility, health and wellbeing and social inclusion – benefited 1,400 people. Feedback showed 86 per cent of responders reported experiencing a positive change in their quality of life.
Jobs in our centres continue to form a significant proportion of the UK’s retail sector employment – we are responsible for about 3 per cent of all jobs in the sector. The majority of these are locally employed, meaning the wealth we create is captured locally.
Our centres had 400 million customer visits in 2018 and by bringing a range of charities into our centres we provide an opportunity for those charities to not only raise their profile but also to raise awareness around issues that are of real importance to our communities. Since 2015 we have been actively engaging with relevant groups to work to make our centres more accessible for people with disabilities. In 2018 we signed up as a Disability Confident Committed employer and hope to achieve the Disability Confident standard in 2019.
Environmental efficiencyWe have reduced our carbon intensity by 64 per cent since 2010, exceeding our already ambitious target of 50 per cent by 2020. Using a mix of technology and behaviour change interventions, we have reduced our absolute carbon emissions by 16 per cent in 2018 to 26,499 tCO2e (2017: 31,628 tCO2e). In 2019 we will explore opportunities to increase our renewable energy generation.
We maintained our ‘zero waste to landfill’ status, diverting 27,000 tonnes of waste from landfill, saving £2.4 million in associated landfill costs. We also introduced a new waste reporting and auditing system to improve the accuracy of our data. This new methodology has been introduced across our portfolio and has led to a readjustment in how we categorise our waste. As a result, our reported recycling rate fell from 63 per cent in 2017 to 43 per cent in 2018. We will continue to focus on improving waste segregation at our centres in 2019.
Corporate responsibility
Making a meaningful difference is important to us. Together with our stakeholders, we work to create shared benefit through community investment, economic value generation and sustainable use of resources
Accessible intu We formed a dedicated focus group in 2017 to look at intu’s approach to accessibility.
Our continued commitment to autism awareness was recognised by Autism East Midlands which gave intu Victoria Centre and intu Broadmarsh the Business of the Year award. We continue to deliver autism-awareness training to all new shopping centre staff and hold regular quiet hours at many of our centres. We aim to roll out quiet hours to every UK intu centre in 2019.
In May we partnered with the Alzheimer’s Society to encourage our staff and retailers to become dementia friends so that we can welcome customers with dementia and make them feel safe and understood. We hosted community events such as singing for the brain and knitting sessions that also raised awareness of the disease.
We have continued to build our personal shopping service for visually impaired customers, with trials in three centres in 2018.
Read more in our 2018 CR report
Strategic reportFin
ancial statem
ents
Other in
formation
Govern
ance
57intu properties plc Annual report 2018

Water use at directly managed centres
2014 20182015 2016 2017
500,000
300,000
350,000
400,000
450,000
250,000m3
Absolute water consumption (m3)
Waste disposal at directly managed centres
201460
%20182015 2016 2017
32,000
8,000
16,000
24,000
70
80
90
100
0tonnes
Waste recycled (tonnes) Waste to landfill (tonnes) Waste to energy (tonnes)
Waste diverted from landfill (%)
500
0
1,000
1,500
Change in behaviour Change in skills Change in quality of life
Total beneficiaries
Positive change
In-kind Cash Facilitated
£525,914£256,489£616,798
£1.7mdonated
Value of time
£271,039
Donations
Making a meaningful difference: our contributions in 2018
£4.8 billion GVAWe are investing in the future
£600mUK development pipeline over 10 years
Recognised by:
Economic value we generate
Our centres directly support a
£2bnwage bill per annum
Corporate responsibility continued
Community
Environment
Employee engagement10,850 hrsgiven to the community by intu staff
Our commitments — support community issues relevant to our customers
— extend employability programmes to all centres by 2025
Our 2020 targets already achieved — 50% reduction in carbon emissions — 99% of waste diverted from landfill
Employee engagement in our responsibility programmes contributes to the development, engagement and wellbeing of our staff
We contribute to the local and national economy
£275mbusiness rates paid by intu and our tenants
64%reduction in carbon emissions intensity tCO2e since 2010
100%waste diverted from landfill
Strategic report
58 intu properties plc Annual report 2018
Green Lab, our sustainability innovation group, continues to drive forward a range of sustainability initiatives across the business. We have invested further in onsite renewable generation at intu Lakeside with the installation of 335 solar panels. Compost Café, our industry-leading coffee ground recycling initiative, has so far enabled 2,400 bags of waste coffee grounds to be given away to customers (read more on page 29). We will continue to explore and trial new ideas.
External benchmarkingResponding to relevant indices provides clear and accurate performance data to our investors. This information allows our investors to assess our long-term risk management, operational performance and added value. It also provides us with valuable information to help us respond to emerging trends and review our performance.
This year, due to an increase in our score, we are now included in not only the DJSI World Sustainability Index but also the DJSI Europe Sustainability Index. We have also maintained our membership of the FTSE4Good index and a range of other responsible investment indices.
Further developing our CR strategyWe previously committed to launching a new 2030 vision in 2018 however, due to corporate activity over that period, strategy development has been delayed. We are now looking to fully develop our 2030 vision, including key areas and new targets that will sit beneath, during 2019.
We have already conducted a significant amount of scoping work as part of developing our 2030 vision. We have considered our contribution towards the Sustainable Development Goals (SDGs) and a variety of responsible business frameworks. We are now developing our understanding of how intu will fit into those spaces. We have already identified which SDGs we can contribute to most actively: decent work and economic growth, sustainable cities and communities and partnerships for goals.
In 2019 we will assemble panels of internal and external stakeholders including investors, retailers, sustainability professionals, customers, community groups and employees from across our business, to set our vision to 2030. From these discussions we will develop specific targets and broader objectives for achieving our new vision.
Management viewpoint
Our centres make a tangible contribution to their communities. Our local partnerships set out to create meaningful change. In 2018 our commitment was recognised with an EPRA award for ‘Outstanding Contribution to Society’ in recognition of our 10-year partnership with The Conservation Volunteers. This partnership has created 10 Green Gyms in communities close to our centres.”Alexander NicollCR Director
Non-financial information statement
Reporting requirement Relevant policies* Read more in this report Page
Environmental matters Energy management policyEnvironmental policySupply chain policy
Corporate responsibilityOur growth story
57 – 59 10-11
Employees Business code of practice Importance of people policyCode of professional conductDiversity policyWhistleblowing policy
Our people Relationships – Our people Operations risk – People Audit Committee – Whistleblowing
54 – 56334175
Human rights Data protection policyModern slavery and human rights policySupply chain policy
Our people 54 – 56
Social matters intu's approach to taxPolicy towards occupiers and shoppersSupply chain policyVolunteering policy
Corporate responsibilityAt the heart of communitiesRelationships – Local communitiesFinancial review – Tax policy position
57 – 5928-29
3353
Anti-corruption and anti-bribery Business code of practiceSupply chain policy
Our culture and valuesOur people
1754 – 56
Principal risks Focus on risk, principal risks and uncertainties 38-41
Business model Our business model 30-31
Non-financial key performance indicators
KPI GVA of community investment KPI Greenhouse gas emissions intensity
3737
* All our policies can be found on our website intugroup.co.uk/en/investors/reports-results-and-policies
Strategic reportFin
ancial statem
ents
Other in
formation
Govern
ance
59intu properties plc Annual report 2018

Dear shareholder
Throughout the year we have continued to ensure that our governance structures at Board, Committee, subsidiary and joint venture levels continue to be appropriate and support our business and culture in an ever-changing regulatory environment. In the next few pages we provide details of our Board members, the role of the Board and its performance and oversight. We also provide the information on our governance framework which we consider is appropriate for a UK premium-listed company.
New Corporate Governance CodeIn the second half of the year the FRC released a new UK Corporate Governance Code, effective for financial years beginning on or after 1 January 2019. The Board, through the Audit and Remuneration Committees, received comprehensive briefings on the new Code and have taken steps to ensure we are placed to fully comply with the new Code. We will report to shareholders on our application of the new Code next year.
The Board has resolved that I will be the designated director for the workforce as required under the new Corporate Governance Code. Existing employee engagement activities at intu will be used to facilitate engagement, drawn from employee forums at intu’s centres, quarterly centre management meetings, a head office staff participation forum to be established and Q&A sessions following full-year and half-year results presentations.
Potential transactionsPotential transactions, first with Hammerson and then with a Consortium comprising the Peel Group, the Olayan Group and Brookfield Property Group, resulted in intu being engaged in a restricted offer period for some 25 weeks of 2018. Although this was an inevitable distraction for the Board and the senior leadership team, we remained focused on the governance of the Group. During this time the Board received detailed briefing on Takeover Code issues and directors’ responsibilities and held several non-scheduled Board meetings, often called at short notice, as required in a restricted offer period.
Succession planningAs described more fully in the Nomination and Review Committee report, we have continued to focus on succession planning. Following the announcement last year that David Fischel would be stepping down as Chief Executive we are well-advanced with the search for his successor. The Board has also devoted time to succession planning of Non-Executive Directors following Andrew Strang’s resignation in 2019 and the subsequent appointment of Ian Burke in October 2018. Rakhi Goss-Custard will not be seeking re-election at the forthcoming annual general meeting. Richard Gordon and Louise Patten resigned on 18 February 2019. A search for at least one new Non-Executive Director is well underway. We expect to announce the appointment of a new independent Non-Executive Director to replace Rakhi Goss-Custard before the annual general meeting, in order to preserve the required balance on the Board of 50 per cent independent and 50 per cent non-independent directors excluding the Chairman.
We ensure that our governance structures continue to be appropriate and support our business and culture in an ever-changing regulatory environment
Compliance with the UK Corporate Governance Code (‘the Code’)The following governance pages explain how the Company applies the main principles of the Code, issued by the Financial Reporting Council (FRC) in April 2016, and how it meets other relevant governance requirements including provisions of the Disclosure Guidance and Transparency Rules of the Financial Conduct Authority. Both documents are publicly available on the FRC website (frc.org.uk).
The Board considers that the Company complied in full with the provisions of the Code during the year.
Effectiveness and evaluationAs Chairman, it is my role to provide leadership to ensure the operation of an effective Board. The Board consists of seven directors. The directors bring a wide range of skills and perspectives to the Board’s deliberations, as described on the following pages. In relation to gender diversity, we currently have two female Board members. As highlighted in the Nomination and Review Committee’s report on page 76, the Board considers that broader aspects of diversity, rather than purely gender, are key to stimulating constructive debate. For the year under review we conducted an externally facilitated Board performance evaluation, the findings of which are set out on page 77.
John StrachanChairman20 February 2019
Governance
60 intu properties plc Annual report 2018
Governance

Governance at a glance
Areas of focus in 2019 — chief executive succession and induction — strategic planning and delivery of 2019 objectives — capital investment programme, debt to assets ratio and
financial headroom — impact of Brexit
Other key matters discussed — devoted significant time to the two potential offers which
arose in 2018, paying full attention to governance and legal requirements relevant to an offer period
— reviewed strategic options for the future in the light of current retail property market conditions and changing shoppers’ behaviour
— the Nomination and Review Committee devoted time to succession planning for the chief executive’s role, a process which is well advanced
Growing like-for-like net rental income
— reviewed and approved intu’s strategic plan
— monitored operating performance at every Board meeting, including occupancy, new lettings and rent reviews
Optimising our winning destinations
— considered trends in consumer shopping habits and behaviours
— debated the possibility of new and alternative uses of space
— monitored ongoing development projects, including intu Watford
— approved new capital projects
Delivering operational excellence
— monitored operating performance at every Board meeting, including footfall, net promoter score, brand awareness and retailer sales
Making smart use of capital
— approved several debt refinancings and new facilities
— reviewed and approved intu’s strategic plan
Key strategic matters discussed in 2018
61
Strategic reportFin
ancial statem
ents
Other in
formation
Govern
ance
intu properties plc Annual report 2018

Board structure
Chairman 1Executives 2
Non-Executives 6
Board independence (excluding Chairman)
Executives 2 Non-Executives 4 Non Independents 2
Board of Directors
Chairman, Deputy Chairman and Executive Directors Non-Executive Directors
John Strachan ChairmanAge 68
Appointed to the Board: 7 October 2015 and as Chairman on 3 May 2017
Career: John was Global Head of Retail Services and Chairman of the Retail Board at Cushman & Wakefield until 2015. John’s career commenced at Healey & Baker in 1972
Skills and experience: John brings a wealth of experience from the retail property sector, an international perspective and extensive knowledge of the Spanish retail property market. He is known for his creative and entrepreneurial approach to developing new business opportunities. He is a fellow of the Royal Institution of Chartered Surveyors (RICS)
Other appointments: Advisory Board member of True Private Equity; Vice-Chairman European Board of the International Council of Shopping Centres
David FischelChief ExecutiveAge 60
Appointed to the Board: Appointed Finance Director in 1988, Managing Director in 1992 and Chief Executive in March 2001
Career: David qualified as a chartered accountant in 1983 at Touche Ross & Co before joining intu in 1985
Skills and experience: During his 33-year career with intu, David has gained significant executive experience in numerous aspects of the shopping centre industry including shopping centre acquisitions and developments
Other appointments: Non-Executive Director of Prozone Intu Properties Limited
As announced on 26 July 2018, David will be standing down from the Board once a successor has been appointed
John WhittakerDeputy ChairmanAge 76
Appointed to the Board: 28 January 2011
Career: John is the Chairman of the Peel Group which he founded in 1971 and developed into a leading UK infrastructure, transport and real estate enterprise
Skills and experience: John is a highly regarded real estate investor, and has overseen the growth of the Peel Group across many sectors such as land, real estate, ports, airports, renewable energy and media. John is an experienced property developer and business leader, illustrated by projects such as The Trafford Centre, MediacityUK and Liverpool2. His appointment to the Board followed the acquisition by intu of The Trafford Centre from the Peel Group
Other appointments: Chairman of the Peel Group
Matthew RobertsChief Financial OfficerAge 55
Appointed to the Board: 3 June 2010
Career: Matthew qualified as a chartered accountant in 1989 and was previously the Finance Director of Debenhams plc from 1996 to 2003, and Chief Financial Officer of Gala (subsequently Gala Coral Group) from 2004 to 2008
Skills and experience: Matthew was part of the team which acquired The Trafford Centre, Manchester, in the UK’s largest ever single property transaction. He led the establishment of intu’s Secured Group Structure and further transactions which have raised over £6 billion of leverage. In January 2016 Matthew also assumed responsibility for intu’s centre-based operations
Other appointments: Non-Executive Director and Audit Committee Chairman of Marston’s PLC
Adèle AndersonChairman of the Audit CommitteeSenior Independent Director Age 53
Appointed to the Board: 22 February 2013, Audit Committee Chairman from 1 August 2013 and Senior Independent Director on 3 May 2017
Career: Adèle commenced her career at KPMG where she became a partner and held senior roles including Chief Financial Officer. She is currently Audit Committee Chairman at Spire Healthcare Group plc and an Audit Committee member at the Wellcome Trust
Skills and experience: Adèle graduated from Kent University and is a qualified ACA. She has gained extensive financial and significant Audit Committee experience throughout her career
Other appointments: Audit Committee Chairman at Spire Healthcare Group plc and Audit Committee member at the Wellcome Trust
Structure of the Board and independence at 31 December 2018
62 intu properties plc Annual report 2018

Gender split
Men 6 Women 3
Length of tenure of Directors
0 – 3 years 3 – 6 years 6 – 9 years9+ years
1341
Rakhi Goss-CustardAge 44
Appointed to the Board: 7 October 2015
Career: Rakhi’s early career included roles at TomTom, content management provider Article27 and 11 years at Amazon until 2014, where she held a number of key roles including responsibility for the Amazon UK Media category
Skills and experience: Rakhi has an up-to-date perspective on retail and consumer trends, as well as deep insight and knowledge of the digital environment. Rakhi has a BA in marketing and communications from the University of Pennsylvania
Other appointments: Non-Executive Director of Rightmove plc, Kingfisher plc and Schroders plc
As announced on 29 January 2019, Rakhi will not be seeking re-election at the 2019 annual general meeting
Ian Burke Chairman of the Remuneration Committee (from 12 February 2019)Age 62
Appointed to the Board: 1 October 2018
Career: Ian’s background is predominantly in the leisure and retail sectors. He spent the majority of his career in the leisure industry, having been the Chief Executive of Rank Group plc between 2006 and 2014, Holmes Place Health Clubs from 2003 to 2006 and prior to that, Thistle Hotels plc from 1998 to 2003
Skills and experience: Ian brings a wealth of experience from the leisure and retail sectors. He commenced his career in 1978 at Lever Bros. He has a degree in mathematics from Imperial College, an MSc from the London Business School and is a qualified ACMA. He has significant prior experience of participation in audit and remuneration committees
Other appointments: Non-Executive Chairman of Rank Group plc and Findel plc; member of the Board of Governors of Birmingham City University
Key to Committees
Audit Committee Remuneration Committee Nomination and Review Committee Executive Committee Corporate Responsibility Committee Capital Projects Committee
Board relevant sector experience (percentage of Board)
Property 78%
Retail 78%
Governance 22%
Digital 11%
Financial 33%
Richard Gordon and Louise Patten were Non-Executive Directors during the year ended 31 December 2018. Richard Gordon and Louise Patten resigned from the Board on 18 February 2019
63
Strategic reportFin
ancial statem
ents
Other in
formation
Govern
ance
intu properties plc Annual report 2018

Senior management team Biographies of the senior management team are available on our website at:
intugroup.co.uk/en/about-us/our-people/
Executive Committee
Barbara GibbesDirector of FinanceJoined the Group as Director of Finance in January 2017 from Domino’s Pizza Group Plc where she was Group Financial Controller. Previously she held other senior finance roles and was a Director at Deloitte. She qualified as a chartered accountant in 2000
Gordon McKinnon Operations DirectorJoined the Group in January 2011 and was appointed Operations Director in November 2013. He spent 20 years in various roles with Marks & Spencer before taking up an assignment with Manchester Millennium Limited, the taskforce rebuilding Manchester city centre following the 1996 IRA bomb. He was appointed Director of Operations at The Trafford Centre in 2004
Hugh FordGeneral Counsel and Group TreasurerJoined the Group as General Counsel in 2003. Appointed General Counsel and Group Treasurer in April 2015. Previously he was General Manager Legal at Virgin Atlantic Airways, and before that a commercial lawyer with British Airways plc. He qualified as a solicitor in 1992 with Freshfields
Trevor PereiraDigital and Commercial DirectorJoined the Group in 2007 as Commercial Director. He was subsequently appointed Group Digital and Commercial Director, responsible for digital activities, commercialisation, marketing and customer experience. He previously worked for airport group BAA plc for 21 years, latterly as Retail and Commercial Director for Heathrow Airport
Martin BreedenDevelopment DirectorJoined the Group in 2002 and was appointed Group Development Director in January 2016. Martin has direct responsibility for intu’s development programme across the UK and intu’s Spanish business. Martin has over 25 years’ experience in the retail property industry. He is a fellow of the RICS and a member of the advisory panel of Revo
Susan MarsdenGroup Company SecretaryJoined the Group as Company Secretary in 2000. A fellow of the Institute of Chartered Secretaries and Administrators, Susan began her career at the London Stock Exchange, and was Company Secretary of two FTSE real estate sector companies before joining intu
Dushyant SangarCorporate Development DirectorJoined the Group in 2010 and appointed Corporate Development Director in 2014. He has been closely involved in all of the Group’s major acquisitions in the UK and Spain. He previously worked for MGPA, a real estate private equity investment advisory business and for UBS. He is a Non-Executive Director of Prozone Intu Properties Limited
Julian WilkinsonAsset Management DirectorJoined the Group in 2011 and was appointed Asset Management Director in January 2016. Julian has responsibility for optimising the performance of intu’s shopping centres. He has held similar positions at director level over the last 25 years on behalf of both retailers and landlords and is a fellow of the RICS
64 intu properties plc Annual report 2018

The Board
The role of the Board and its committees
Led by the Chairman, the Board takes primary responsibility for defining the Group’s strategic objectives, risk appetite and control environment; monitoring delivery of strategy by the Executive Directors; and shaping the resourcing, culture and values by which the wider business delivers targeted performance.
See pages 71 to 75 for more information
See pages 57 to 59 for more information
See pages 76 and 77 for more information
See pages 78 to 93 for more information
The Board
Chairman John Strachan
Members David Fischel, Matthew Roberts, John Whittaker, Martin Breeden
Key responsibilities Reviews new projects and expenditure in detail and makes recommendations to the Board on certain projects, as appropriate. Has no power to approve proposals or authorise expenditureThe Capital Projects Committee is not a formal committee of the Board
Chairman David Fischel
Members Matthew Roberts, Martin Breeden, Hugh Ford, Barbara Gibbes, Susan Marsden, Gordon McKinnon, Trevor Pereira, Dushyant Sangar, Julian Wilkinson
Key responsibilities Considers investment proposals, reviews progress on projects and project expenditure in detail and receives updates on other business matters. Has delegated authority, within limits, to authorise initiatives and expenditureThe Executive Committee is not a formal committee of the Board
Nomination and Review Committee
Chairman John Strachan
Members* Adèle Anderson, Ian Burke, Rakhi Goss-Custard, Steven Underwood, Louise Patten (to 18 February 2019)
Key responsibilities Ensures the Board comprises people with an appropriate balance of skills, knowledge and experience * all independent Non-Executive
Directors are invited to attend when discussing Board succession
Audit Committee
Chairman Adèle Anderson
Members Ian Burke, Rakhi Goss-Custard
Key responsibilities Monitors the integrity of financial statements, internal controls and risk management process and reviews the effectiveness of the internal and external auditors
Corporate Responsibility Committee
Chairman John Strachan
Members Adèle Anderson, David Fischel, Alexander Nicoll, Kathryn Barber, Jennifer Sandars
Key responsibilities Oversees the management of the Group’s CR activities
Remuneration Committee
Chairman Ian Burke (from 12 February 2019). Louise Patten (to 12 February 2019)
Members Adèle Anderson, Rakhi Goss-Custard
Key responsibilities Sets remuneration policy for the Executive Directors and the Chairman and recommends and monitors the level and structure of remuneration for senior management
Capital Projects Committee
Executive Committee
65
Strategic reportFin
ancial statem
ents
Other in
formation
Govern
ance
intu properties plc Annual report 2018

The Board continued
LeadershipThe Board and its governance frameworkThe Board is responsible for setting intu’s strategic aims and then monitoring management’s performance against those aims as well as setting the strategic framework within which those aims can be achieved. The business model described on pages 30 and 31 illustrates the key value creation and operational drivers for intu’s strategy and the means by which the Board ultimately delivers long-term growth and sustainable returns for shareholders and debt investors.
Appropriate and effective corporate governance is intrinsic to all aspects of the Board’s activities. Consequently, governance is interwoven into the activities of management, who are accountable to the Board, and all employees, who are in turn accountable to management. This is reinforced by the established coherent governance framework which underpins the culture and workings of the Group with clearly defined responsibilities and accountabilities, consisting of:
— Board committees to enable the Board to operate effectively and give full consideration to key matters (as shown in the diagram on page 65)
— delegated authority limits, which apply at all levels of the business and are incorporated into all operational procedures ensuring matters are dealt with at the appropriate level
— internal policies, procedures and controls (including risk management arrangements, delegated authority limits and a related parties protocol) which are regularly reported on, reviewed and updated by the Board and relevant committees
— internal processes which are communicated to all staff and are available at all times on the Group’s intranet
Each aspect is routinely reviewed by the Board and updated to satisfy the needs of the business. The Board has continued to review its governance framework and has adjusted, where necessary, the roles, structure and accountabilities of senior management to reflect the demands of the business.
Board cultureThe Chairman is directly accountable for the culture of the Board, which is defined by:
— highly experienced and knowledgeable directors, with a wide range of skills and diverse perspectives who act confidently and with integrity
— a conservative, measured approach to business, allied with a willingness to take considered risks through insightful investment to achieve strategic goals
— the relationships between individual directors and the senior executives, which encourage beneficial debate and open discussion of views
The Board’s culture permeates throughout the Group’s operations and is enshrined within intu’s values, which encourage staff to be bold, creative and genuine.
Further information on intu’s culture and values can be found on page 54
Our approach to CRCR underpins the strategic aims of our business, creating a long-term and sustainable business that brings value to all our stakeholders. The Board fully supports the Group’s approach to CR with the Chairman of the Board chairing the Board CR Committee. The Board CR Committee’s members also include the Chief Executive and the Chairman of the Audit Committee.
Further details of our CR activities can be found in the 2018 CR report
66 intu properties plc Annual report 2018

Roles and responsibilitiesRole Responsibility
Chairman John Strachan Leading the Board, setting agendas, achieving clarity of decision-making, ensuring effectiveness in all aspects of the Board’s remit, driving the culture of accountability and openness and ensuring effective two-way communication with stakeholders including shareholders and between Non-Executive Directors and senior management
Chief Executive David Fischel Delivery of Group strategy, primary accountability for day-to-day operational management, implementation of policies and strategies developed by the Board, modelling and setting the Company’s culture and developing the abilities and skills of the Group’s personnel to their maximum potential
Chief Financial Officer Matthew Roberts Managing the Group’s funding strategy, financing, reporting and investor programme, encompassing leadership of the finance function. From January 2016 also responsible for intu’s centre-based operations
Independent Non-Executive Directors*
Adèle Anderson Ian Burke Rakhi Goss-Custard Louise Patten
Bringing an external and independent view to the Board’s discussions, objectively scrutinising the performance of management, providing rigorous and constructive challenge to executive management when appropriate, ensuring financial controls and risk management are robust, determining appropriate levels of remuneration for management. Independent Non-Executive Directors are entitled to attend any committee meeting if they wish
Senior Independent Director
Adèle Anderson Providing advice, additional support and experience to the Chairman as required. Available to act as an intermediary for the other directors if necessary. Leads the appraisal of the Chairman’s performance annually in conjunction with the other Non-Executive Directors and is available as an additional point of contact to shareholders
Non-Independent Non-Executive Directors
Richard GordonJohn Whittaker
intu currently has a representative of one major shareholder on its Board, the Deputy Chairman, John Whittaker. Richard Gordon was formerly a representative of the Gordon Family interests. The trusts controlling the Gordon Family interests have been restructured and are no longer represented by Richard Gordon. Direct shareholder Board representation, with appropriate management of conflicts, ensures that key strategic, operational and governance decision-making is more closely aligned with the interests of the major shareholder and other institutional and retail investors generally. In this respect the Group surpasses the expectations of the Stewardship Code.
The representative director also contributes strongly to the Board’s culture and personality, adding insight and constructive challenge from a strong commercial background, experience and expertise
Alternate Director Steven Underwood In accordance with the Company’s Articles of Association John Whittaker has appointed Steven Underwood as his alternate. The Board has generally invited Steven Underwood to attend Board meetings
* The Board reviews the independence of its Non-Executive Directors on an annual basis. With the exception of John Whittaker and Richard Gordon, the Board has concluded that all Non-Executive Directors are independent.
Biographical details of each director are set out on pages 62 and 63
67
Strategic reportFin
ancial statem
ents
Other in
formation
Govern
ance
intu properties plc Annual report 2018

The Board continued
John Whittaker and his alternate, Steven Underwood, did not attend any Board or committee meetings during the potential transaction with the Consortium comprising the Peel Group, the Olayan Group and Brookfield Property Group.
EffectivenessBalance and compositionThe Nomination and Review Committee regularly reviews the composition of the Board to ensure that it operates efficiently and has access to a broad range of knowledge and viewpoints. The Board determined that new candidates for the role of Non-Executive Director should have sector-relevant qualifications and experience – notably in property, retail, finance or digital, to ensure that these key areas are well-represented – while also having regard to wider business knowledge and diverse backgrounds which can be beneficial to the Group.
The appropriate balance of skills, independence, experience and knowledge does not in itself ensure the efficient operation of a board. To this end, the Chairman’s style and leadership of the Board are essential to creating an environment where the Non-Executive Directors are able to draw on their own experience to constructively challenge the views of the executive management. The Chairman facilitates this by drawing on the Non-Executive Directors’ range of experiences to provide insight and alternative perspectives and has invited all independent Non-Executive Directors to attend any committee, irrespective of whether they are formally a member of such committee.
The balance of the Board is illustrated on page 63.
Time commitment and external activities Non-Executive Directors are appointed for a three-year term and their continuing service thereafter is subject to review by the Board. All directors are submitted for annual re-election by shareholders.
Their annual time commitment varies with specified minimum requirements within the terms of their appointment and is assessed as part of each director’s annual review.
Each Director has demonstrated that he or she has sufficient time to devote to their present role at intu.
Conflicts of interestThe Board has adopted a formal procedure under which directors must notify the Chairman of the Board of any potential conflicts. The Chairman then decides whether a conflict exists and recommends its authorisation by the Board where appropriate. In certain circumstances, the conflicted director may be required to recuse themselves from the Board’s discussions on a matter in which he or she is conflicted. Directors must also notify the Chairman when they take on any additional responsibilities or external appointments, and it is their responsibility to ensure that such appointments will not prevent them from meeting the time commitments discussed above.
Board meetingsBoard agendas are shaped to create time for strategic discussion and debate with time allocated to routine matters being closely managed.
Board attendance table 20181
Board AuditNomination and Review Remuneration
John Strachan 4/44 – 2/24 –John Whittaker 3/42 – – –David Fischel 4/4 – – –Matthew Roberts 4/4 – – –Adèle Anderson 4/4 4/44 2/2 4/4Ian Burke3 1/1 1/1 1/1 1/1Richard Gordon6 4/4 – – –Rakhi Goss-Custard 4/4 4/4 2/2 4/4Louise Patten6 4/4 – 2/2 4/44
Andrew Strang5 3/3 3/3 1/1 –
1 Scheduled meetings only, excludes Board away day, Board and Committee update conference calls and ad hoc meetings.
2 John Whittaker did not attend the scheduled October 2018 Board Meeting as the Peel Group were part of the Consortium considering a potential offer for intu.
3 Ian Burke was appointed to the Board on 1 October 2018. He joined the Audit Committee, the Nomination and Review Committee and the Remuneration Committee in early October 2018. Appointed Chairman of the Remuneration Committee from 12 February 2019.
4 Board or Committee chairman.5 Andrew Strang resigned from the Board on 30 September 2018.6. Richard Gordon and Louise Patten resigned from the Board on 18 February 2019.
At each scheduled Board meeting, the Executive Directors provide updates on their key areas of responsibility. In addition, the chairmen of the Audit, Remuneration and Nomination and Review Committees give updates on the workings of and progress made by those Committees, highlighting any areas requiring escalation to, or consideration by, the full Board. Other matters for discussion are added to the agenda for scheduled Board meetings, or discussed at additionally convened Board meetings, as required.
Appropriate and effective corporate governance is intrinsic to all aspects of the Board’s activities.”
68 intu properties plc Annual report 2018

CommunicationDirectors are kept fully informed of progress on key matters, including operational and financial performance, between formal meetings. This is achieved by way of either scheduled conference calls or less formal update meetings in months where there is no formal Board meeting scheduled. Ad hoc meetings and working visits to centres are also regularly arranged to support the Chairman’s policy of open communication. The Chairmen of the Audit Committee and Remuneration Committee communicate regularly and directly with relevant staff and external advisers, including but not limited to, the Director of Risk and Assurance, the Company Secretary and Korn Ferry, who act as the Remuneration Committee’s consultants.
The Chairman of the Board and Company Secretary ensure that all Directors are provided with accurate and timely information to facilitate informed discussion at Board meetings.
Relations with shareholdersWe place considerable emphasis on maintaining an open and frank dialogue with investors. Our programme of investor relations activities involves members of the Executive Committee (including, on occasion, the Chairman) and the Head of Investor Relations. We seek to develop existing and potential investors’ understanding of intu’s business strategy, operations, performance and investment case. This provides the Board and Executive Committee with an insight into the differing views of intu’s institutional and other significant investors as well as those of retail shareholders.
Key activities in 2018 included:
— results meetings and update calls: an average of 80 institutions attended each event
— road show meetings: following results announcements we conducted around 140 meetings in the UK, South Africa and Europe
— investor conferences: we attended five real estate conferences organised by investment banks, meeting around 70 institutions
— site visits: toured intu Asturias, intu Xanadú, intu Watford and intu Lakeside with 30 investors
— interaction with sell-side analysts: engaged with analysts from around 20 institutions to ensure the insight of their research was accurate
370investor interactions in 2018
Board oversight of risk management The effective assessment and management of risk is key to the delivery of the Group’s strategy. The setting of the Group’s risk appetite by the Board provides the framework within which the Group’s risk management process operates.
The Board has overall responsibility for risk management and the Audit Committee monitors and reviews the effectiveness of the risk management process ensuring that the appropriate governance and challenge around risk is embedded throughout the business.
The Group’s risk management process is set out in more detail on pages 38 and 39, and the Group’s principal risks are discussed on pages 40 and 41. As part of the Governance Framework all recommendations to the Board must include specific consideration of potential risks to ensure this aspect is given due consideration while still permitting the Board to act decisively.
There was an increased risk profile in 2018, with increases in both property market sub-risks. Additionally, there have been some changes to existing principal risks. Acquisitions has been removed as a principal risk as the business has not engaged in acquisitions in the year and people has been added as a sub-category within the operations risk.
Principal risks and uncertainties are discussed in further detail on pages 40 and 41
69
Strategic reportFin
ancial statem
ents
Other in
formation
Govern
ance
intu properties plc Annual report 2018

In accordance with provision C.2.2 of the UK Corporate Governance Code, the Directors have assessed the prospects of the Company over a longer period than that required in adopting the going concern basis of accounting. Based on the result of this analysis, the Directors have a reasonable expectation that the Company will be able to continue in operation and meet its liabilities as they fall due over the next five calendar years. This period is considered appropriate because of the combination of the following factors:
— the Group’s strategic plan covers 10 years, with a greater degree of detail and rigor applied to the first five years
— the Group’s weighted average unexpired lease term, which at 31 December 2018 was 7.2 years
— the Group’s weighted average debt maturity, which at 31 December 2018 was 5.8 years
The strategic plan incorporates the Group’s strategic objectives and considers the impact of the principal risks. The plan considers net rental income, cash flows, development expenditure, as well as corporate transactions including the recycling of capital and refinancing plans over the 10-year period. It highlights the impact of the relevant principal risks on key metrics such as debt to assets ratio, underlying earnings per share and financial headroom.
Principal risks are set out in detail on pages 40 and 41, and the relevant risks for assessing viability have been identified as:
— macroeconomic (including Brexit); specifically impact on rental income levels, property values and covenant headroom (Risk 1)
— availability of funds; specifically impact on liquidity (Risk 7)
— retail environment; specifically impact on occupancy and pipeline (Risk 2)
— terrorism; specifically negative impact on lettings and rental growth (Risk 5)
Viability statement
All of the above would impact on rental income and/or valuation, which is factored into our viability assessment below. We acknowledge that Brexit may have an adverse impact on property valuations or availability of funds, with any such impact factored into the potential downsides of the risks noted above, whether these be driven by Brexit or other macroeconomic factors. We have based our downside assumptions on data from previous property cycles. Given our strong underlying operational performance in 2018, with stable occupancy around 97 per cent, 248 new leases signed at 6 per cent above previous rents and tenants continuing to invest in our centres, we have assumed that once the period of uncertainty and the associated downturn has passed, there is a reasonable expectation that property values will recover, even if perhaps not to the full extent of the 2017 peak.
The Directors also consider the impact on the Group’s financial position of adverse but plausible changes in key input assumptions, together with mitigating actions not included in the strategic plan which are available to the Group. 2018 saw a 13 per cent reduction in the market value of the property portfolio and for viability modelling purposes total peak to trough declines of 25 per cent from December 2017 valuations have been assumed. Recovery is assumed to reach 90 per cent of peak values by 2022. Other key assumptions to which sensitivities are applied include:
— ability to recycle capital as planned — refinancing of debt; £3.1 billion (around 64 per cent) of the Group’s debt is due for repayment in the next five years, which the Directors have assumed can be refinanced, although subject to valuation driven loan reductions
— falls in income of up to 8 per cent
The Company has a range of potential mitigating actions available which could include some but not necessarily all of the following: reductions in future capital spend, some asset disposals and/or a further temporary reduction of cash dividend payments, subject to REIT requirements as the Company is intending to maintain its REIT status. Such mitigating actions should only be required towards the later stages of the viability period. The Company’s facilities have covenant headroom, as described in the Strategic Report on page 47, while the Company’s strategy includes deleveraging the balance sheet through asset disposals in order to provide sufficient headroom throughout the viability period.
70 intu properties plc Annual report 2018
Dear shareholder
As the Chairman of the Audit Committee it is my role to present to you the Audit Committee report for 2018.
The Audit Committee has this year continued to focus on risk management, specifically in relation to our cash flows, developments in the UK, cyber risks as well as the impact of potential transactions in 2018, which did not complete.
The Group’s approach to risk management is described in detail on pages 38 and 39 and the principal risks are detailed on pages 40 and 41.
PricewaterhouseCoopers (PwC) has been intu’s audit firm for more than 30 years and a tender process was commenced in 2016 and concluded during 2017, with Deloitte being selected for appointment. After a one-year deferral owing to the potential transaction for the business announced in December 2017 and aborted in April 2018, we have recommended that Deloitte be appointed for the 2019 audit.
ResponsibilitiesThe Audit Committee’s key responsibilities are to monitor and review:
— the integrity of the financial statements, including a review of the significant financial reporting judgements and accounting policies
— the Company’s relationship with the external auditor, including its independence
— the effectiveness of the Group’s internal control and risk management
— the Group’s overall approach to monitoring areas of risk
— the effectiveness of the internal audit function, including the work programme undertaken by the function
— the Group’s policy on and approach to whistleblowing
Main activities during the yearThe Audit Committee considered the following key matters in 2018:
— regular review of cash flow forecasting — valuation of the Group’s investment and development property
— the Group’s culture — the Group’s cybersecurity plans — accounting treatment of the most significant transactions including the part disposal of intu Chapelfield, the refinancing of intu Puerto Venecia and the new debt raised on Barton Square
— the 2018 internal audit plan and audit charter
— the viability statement — completed a review of supplier payment policy and compliance with Prompt Payment Code
— appropriateness of Q3 profit estimate included in intu’s October 2018 trading update
Audit Committee
Areas of focus in 2018 — financial information and risk
management in relation to two potential offers which did not complete
— cash flow forecasting — property valuations — procurement — cybersecurity — culture — developments
Members in 2018
Chairman Adèle Anderson (Independent Non-Executive Director) Members Rakhi Goss-Custard (Independent Non-Executive Director) Andrew Strang (to 30 September 2018) (Independent Non-Executive Director) Ian Burke (from 1 October 2018) (Independent Non-Executive Director)
For members’ other Board appointments, skills and experience see Board of Directors on pages 62 and 63
Areas of focus in 2019 — cash flow forecasting — effective transition of external audit
process from PwC to Deloitte — property valuations — developments — cybersecurity — culture
We continue to focus on risk management in a changing and uncertain environment
71
Strategic reportFin
ancial statem
ents
Other in
formation
Govern
ance
intu properties plc Annual report 2018

Key financial reporting and significant judgementsDuring the year the Audit Committee discussed the planning, progress and final conclusions of the external audit process. The audit plan was reviewed and approved at the July 2018 Audit Committee meeting. The significant risk areas identified were: investment and development property valuations; significant transactions during the year; revenue recognition; and management override of controls. International Standards on Auditing (UK) identify these latter two risks as significant for all companies.
These matters were discussed by the Audit Committee following finalisation of the audit.
The Audit Committee takes into account the views of the external auditor in understanding and assessing whether suitable accounting policies have been adopted, whether management has made appropriate estimates and judgements and whether disclosures are balanced and fair. The main issues discussed by the Audit Committee in the year are detailed in the table below.
Issue Action taken
Valuation of investment and development property
For the interim results at 30 June 2018 the Audit Committee carried out a review of the investment property valuations. The full Board carried out a review of the 31 December 2018 valuations included in this report.
Due to the overall importance of the valuations to the Group’s results, the relevant Audit Committee meeting included a presentation from and discussion with Knight Frank as part of the valuation process and the relevant Board meeting included presentations from Knight Frank and CBRE.
The Audit Committee review included discussion with management and the external auditor of the key assumptions and results of the valuation process undertaken by the independent third party valuers.
This review also included understanding which general factors had influenced the valuers in concluding on appropriate yields to use in the valuations. This involved factors affecting both the investment and occupier markets and recent comparable market transactions.
Particular emphasis was given to understanding the factors that had resulted in individual property valuations being either significantly above or below the average movement in the Group’s valuations.
Presentation of information
Operating through joint ventures is a core part of intu’s strategy. Management both reviews and monitors the business, including the Group’s share of joint ventures, on an individual line basis not on a post-tax profit/loss or net investment basis. The figures and commentary presented in the strategic report have therefore been presented consistently with this management approach. Reconciliations between the management and statutory bases are provided in the other information section on pages 165 to 169.
The Committee has reviewed the prominence given to both statutory information and information on a management basis, and concluded that the approach adopted provides the most useful analysis of the results for the year.
Going concern The Company’s ‘going concern’ review, which is based on 18-month cash flow projections following the balance sheet date with particular focus on the next 12 months from the date of this report, was discussed with management. The projections cover the major trading cash flows, being rental income and interest expense, and capital expenditure plans in the context of the latest debt maturity profile.
Stress tests of the projections were considered, covering potential further reductions in the value of the Group’s properties, a fall in income as well as the inability to execute the capital recycling transactions, and what impact such changes may have on both the Group’s liquidity and its ability to meet the financial covenants on its debt facilities. The discussion and analysis also considered what actions were available to the Group to mitigate the impact of such reductions on the cash flow projections.
Viability statement
In accordance with provision C.2.2 of the UK Corporate Governance Code, the Board has assessed the prospects of the Company over a longer period than that required in adopting the going concern basis of accounting. The viability statement is included on page 70 and sets out the conclusion of that assessment.
The same stress tests as outlined in the Going concern section above were conducted on the projections underpinning the five-year viability assessment.
The Audit Committee assessed the viability position and reported its recommendations to the Board.
Audit Committee continued
Governance
72 intu properties plc Annual report 2018
External auditorThe Audit Committee has assessed the effectiveness of the external auditor, PwC, in line with the approach set out in the FRC’s Audit Quality Practice Aid. In carrying out the evaluation the Audit Committee has held discussions without the auditor, asked the auditor to explain the risks to audit quality that they have identified and their firm-wide controls relied upon, enquired about the findings from internal and external inspections of their audit, challenged the auditor’s strategy and plan and discussed the outputs of the audit with the auditor. This included direct meetings, review of reporting issued by the external auditor and review of independent reports:
— senior finance staff reviewed the detailed execution of the 2017 audit plan with the engagement team and incorporated any findings into the 2018 plan
— the Chair of the Audit Committee and the Chief Financial Officer each met privately with a senior partner of PwC unrelated to the engagement to review the performance of the firm
— the Audit Committee reviewed the audit plan provided by PwC, including the risks identified and its approach to these
The Company has complied with the provisions of The Statutory Audit Services for Large Companies Market Investigation (Mandatory Use of Competitive Tender Processes and Audit Committee Responsibilities) Order 2014 and in doing so has applied the transitional provisions related to the audit tender process.
The tender process commenced during 2016 and concluded during the first half of 2017 with Deloitte being selected for appointment. After a one-year deferral owing to the potential transaction
announced in December 2017 and aborted in April 2018, we have recommended that Deloitte be appointed for the 2019 audit, subject to shareholder approval at the 2019 annual general meeting.
The Audit Committee will continue to review the effectiveness and independence of the external auditor each year.
Non-audit servicesOn 1 January 2017 the Group implemented the FRC’s Ethical Standard for Auditors which imposes restrictions on certain non-audit services. A number of non-audit services are prohibited and others require approval by the Audit Committee. There is an overall fee limit of 70 per cent of the average of audit fees charged in the past three years, and hence the fee limit comes into force for the financial year to 31 December 2020.
The Audit Committee has sole authority to approve contracts for non-audit services with the external auditor subject to observing certain guidelines including:
— the Audit Committee must consider whether the proposed arrangements will maintain audit independence
— the external auditor must satisfy the Company that it is acting independently
The table below summarises the fees paid to the auditor over the last three years. The three-year average ratio of non-audit fees to audit fees is 16 per cent. 2018 non-audit fees primarily relate to reporting accountants’ work in relation to profit estimates required under Takeover Code rules.
2018£000
2017£000
2016£000
Audit fees 823 789 705Non-audit fees 281 49 48Total fees paid to auditor 1,104 838 753Ratio of non-audit fees to audit fees 34% 6% 7%
Fair, balanced and understandableAt the request of the Board, the Audit Committee considered whether the 2018 annual report was fair, balanced and understandable and whether it provided the necessary information for shareholders to assess intu’s performance, business model, position and strategy. As part of its considerations the Audit Committee took into account the preparation process detailed below which, together with opinions of key executives and the external auditor, has been designed to assist the Audit Committee in reaching its view:
— at an early stage, a matrix is produced identifying key themes and the sections in which those themes should be reflected
— individual sections of the annual report are drafted by appropriate senior management with regular review meetings to ensure consistency across the whole document
— a verification process is undertaken to ensure that information contained is appropriately supported and factually accurate
— detailed reviews of drafts of the annual report are undertaken by members of the Executive Committee and other senior management
— drafts are discussed with the Group’s legal advisers and brokers
— a final draft is reviewed by the Audit Committee and discussed with senior management prior to consideration by the Board
As a result of its considerations the Audit Committee is satisfied that, taken as a whole, the annual report is fair, balanced and understandable and has recommended it as such to the Board.
73
Strategic reportFin
ancial statem
ents
Other in
formation
Govern
ance
intu properties plc Annual report 2018
Risk management and internal controlThe Board has overall responsibility to oversee the Group’s system of internal control and to keep its effectiveness under review, as well as to determine the nature and extent of the risks it is willing to take in achieving its strategic objectives based on the balance of potential risks and reward. The Group’s approach to risk management is described in detail on pages 38 and 39 and the principal risks are detailed on pages 40 and 41.
The Audit Committee oversees the Board’s annual review of the effectiveness of the risk management and internal control systems. During this review the Board has not identified nor been made aware of any failing or weakness which it has determined to be significant.
The key elements taken into account in this review include:
— the Group’s internal audit function’s work during the year (see right)
— the Group’s risk management process — the Group’s controls over its financial reporting process including: the comprehensive system for reporting results to the Board for review and consideration; the review process underlying the production of the consolidated financial statements; and the experience and quality of the team involved in the financial reporting processes
Following on from the review of culture in 2017, which helped the Audit Committee contexualise risks and risk management practices, a follow-up review was performed by the risk and assurance team during 2018. A number of actions have been completed, including the development and distribution of an employee culture guide and the internal relaunch of the intu brand. Additionally, the employee appraisal process has been enhanced and communicated. A number of other actions are scheduled to be completed in 2019.
Internal auditThe Group has an internal audit function within the risk and assurance team which reports to the Audit Committee. The internal audit function reviews internal controls and reports to the Audit Committee on whether such controls are in place and are being operated effectively. The function covers intu properties plc and its subsidiaries and internal audits are also occasionally conducted at joint ventures.
The internal audit function has a rolling programme of reviews ensuring that all centres, functions and areas of the business are reviewed regularly. The most significant areas covered in 2018 included shopping centre health checks, treasury process, GDPR compliance, letting process, life-cycle maintenance process, HR and payroll processes, new processes and tax compliance and procedures. Additionally, annual assurance activities were performed, including a review of the assurance map.
The Audit Committee regularly reviews the effectiveness of the risk and internal audit function and in particular ensures that the function remains sufficiently independent of the wider business to ensure it can carry out its work effectively. An independent review of the internal audit function is carried out every five years and was last performed at the end of 2013. A further review is currently in progress and results will be reported to the Audit Committee during 2019. The key recommendations from an external review of the Group’s risk management process at the end of 2015 have all been implemented.
Audit Committee continued
Committee membership The Audit Committee members have been selected to provide the wide range of financial and commercial expertise necessary to fulfil the Committee’s duties and responsibilities. The Board is satisfied that the Audit Committee has recent and relevant financial experience for the purposes of the UK Corporate Governance Code. Additionally, in accordance with the 2016 Corporate Governance Code the Board has determined that the current composition of the Audit Committee as a whole has competence relevant to the sector in which the Company operates. For full detail of the members’ experience and skills please see Directors’ biographies on pages 62 and 63.
Governance
74 intu properties plc Annual report 2018

Whistleblowing policyThe Audit Committee is responsible for overseeing the Group’s whistleblowing policy and procedures, under which employees can raise concerns about possible improprieties (whether financial or otherwise) within the Group on a confidential basis.
During the year the Audit Committee reviewed and strengthened the policy and procedures and a Whistleblowing Committee was established with set terms of reference, with key representatives from HR, operations and finance, which reports regularly to the Audit Committee. All whistleblowing incidents are reported to this Whistleblowing Committee which fully investigates each event deemed a whistleblower incident and agrees any remedial action such as procedures being reviewed and improved where appropriate.
There were six whistleblowing disclosures relating to the intu Group during 2018. These included:
— report of alleged breach of environmental regulations, where the individual concerned has now received additional training
— two reports that resulted in disciplinary hearings and appropriate disciplinary action
— one disclosure which was deemed not to be a whistleblowing incident
— two further disclosures which, upon investigation, could not be substantiated
FRC communicationsOn 20 December 2018, the FRC wrote to the Company to ask for certain explanations in respect of the 2017 annual report. We have reviewed the responses provided to the FRC, including explanations and certain proposed enhancements to disclosure which have been included in this annual report. The related correspondence has subsequently been closed.
The FRC notes that they only reviewed certain aspects of the 2017 annual report and the review did not benefit from a detailed knowledge of the business and the underlying transactions. Further, the FRC also notes that their review provides no assurance that the 2017 annual report is correct in all material respects, and that the FRC’s role is not to verify the information provided but to consider compliance with reporting requirements.
Audit Committee effectivenessAs part of the Board evaluation process, the effectiveness of the Audit Committee was reviewed and this confirmed that the Committee remained effective at meeting its objectives.
Adèle AndersonChairman of the Audit Committee20 February 2019
75
Strategic reportFin
ancial statem
ents
Other in
formation
Govern
ance
intu properties plc Annual report 2018

Nomination and Review Committee
Dear shareholder
2018 was an important and busy year for the Nomination and Review Committee.
As Chair of the Committee it is my responsibility to ensure that we continue to follow a robust process and best governance practice whenever key decisions are taken, in particular relating to new appointments and when considering the composition of the Board.
Responsibilities and how they were discharged in 2018 The principal role of the Nomination and Review Committee is to evaluate the skills available on the Board and to determine when appointments and retirements are appropriate.
In addition to its key responsibilities set out above, the Committee is also responsible for carrying out the annual performance evaluation of the Board, its committees and individual directors, as well as making recommendations on appointments to the Board, including the induction programme for newly appointed directors, and on succession planning. Those Non-Executive Directors who have served on the Board for six years or more have been subject to a particularly rigorous review.
The Committee carried out a formal Board performance evaluation process, by way of an externally facilitated questionnaire. The outcome of the review is summarised on page 77.
The Committee met twice in 2018 with its main focus on the composition of the Board and succession planning, in particular in relation to the succession of the Chief Executive and planned Non-Executive Director changes.
A sub-committee of the Committee was established to lead the process to find a successor to the Chief Executive and to
find successors to retiring Non-Executive Directors. The sub-committee met frequently to progress matters.
Statement on diversity policy The Nomination and Review Committee, and the Board, have always recognised the importance of boardroom diversity, providing a wide range of perspectives, and the Committee’s policy is to seek to ensure that a range of suitable candidates is taken into account when drawing up longlists and shortlists. The priority of the Committee is to ensure that the Group continues to have the most effective Board possible and all appointments to the Board are made on merit against objective criteria. A description of intu’s approach to diversity can be found on pages 54 and 55.
Board compositionThe Committee is satisfied that the balance of skills, knowledge and experience on the Board and its committees continues to be appropriate.
The Board is supportive of Lord Davies’ aspirational target of 33 per cent female Board representation by 2020 and is pleased to confirm that the Board’s female representation in the year was at 33 per cent. Further information regarding our diversity policy is set out above.
Succession planning Following the announcement that David Fischel will be standing down as Chief Executive, the Committee engaged Heidrich & Struggles in the search for his successor. The process was deferred pending the outcome of the potential offer for intu by the Consortium comprising of the Peel Group, the Olayan Group and Brookfield Property Group. Following the withdrawal of the potential offer, the search was resumed. Good progress is being made and we expect to make an announcement in the near future.
Highlights of 2018 — chief executive succession planning — Non-Executive Director succession
planning
Members in 2018
Chairman John Strachan (Chairman of the Board)
Members Adèle Anderson (Senior Independent Non-Executive Director)
Ian Burke (from 1 October 2018) (Independent Non-Executive Director)
Rakhi Goss-Custard (Independent Non-Executive Director)
Louise Patten (Independent Non-Executive Director)
Andrew Strang (to 30 September 2018) (Independent Non-Executive Director)
Steven Underwood (Alternate Director to John Whittaker)
Areas of focus in 2019 — ensure smooth succession of the
chief executive — ensure smooth succession of Non-
Executive Directors to ensure optimal Board composition
We continue to follow a robust process and best governance practice whenever key decisions are taken
Governance
76 intu properties plc Annual report 2018

Heidrich & Struggles has no other connection with the Company other than in connection with the Chief Executive appointment.
The Committee also engaged Korn Ferry to assist with the appointment of Ian Burke as an Independent Non-Executive Director.
Subsequent to their engagement in this search, Korn Ferry was appointed as the Remuneration Committee’s independent remuneration adviser with effect from 1 January 2019. Prior to this appointment they had no other connection with the Company other than providing input into the Board’s succession planning.
The Board, through the Nomination and Review Committee, has focused on succession planning of Non-Executive Directors following Andrew Strang’s resignation in September 2018. Rakhi Goss-Custard will not be seeking re-election at the forthcoming annual general meeting and the Company announced on 18 February 2019 the resignations of Louise Patten and Richard Gordon. A search for at least one new Non-Executive Director is well underway. We expect to announce the new appointment of a new independent Non-Executive Director to replace Rakhi Goss-Custard before the annual general meeting. Full details will be provided in the Notice of annual general meeting which will be distributed to shareholders in due course.
Talent, training and development Talent development is a key focus of the Committee and a comprehensive talent and leadership programme, including succession planning, has been implemented for senior management across the Group. The Committee receives regular update reports regarding progress and remains confident in the future potential of the Group’s most promising executives and staff.
As Chairman, with the assistance of the Nomination and Review Committee, I regularly consider the need for Directors to update and expand their skills and knowledge. Training is provided for Non-Executive Directors in the form of presentations at Board meetings, attendance at relevant seminars and courses.
Performance evaluation Every year, the Board conducts a performance evaluation of the performance of the Board and its committees. In addition, the Chairman reviews the performance of each Director and the Senior Independent Director oversees the review of the Chairman’s performance. The areas identified for attention during 2018 were as shown in the table below:
Areas identified for attention Action taken
Board succession planning Ian Burke was appointed as a Non-Executive Director in place of Andrew Strang who resigned in September 2018. The Board also commenced a comprehensive search for a new Chief Executive
Balance between presentations and discussion at meetings
Considerably more time has been devoted to discussion of key matters relating to the day-to-day operation of the business
Time discussing strategic topics
A significant amount of time was spent discussing strategic topics, particularly given the challenging market conditions
2018 performance evaluation This involved an external independent facilitator, Lintstock, engaging with the Chairman and Company Secretary to set the context for the evaluation and tailor surveys for all directors to the specific circumstances of intu. Lintstock is a specialist corporate governance consultancy and has no commercial dealings with the Group, other than for the provision of corporate governance services to the Board. The anonymity of all respondents was ensured throughout the process in order to promote the open and frank exchange of views.
As a result of the review, among other things the Board agreed that it should continue to devote attention to ensuring a successful transition to a new Chief Executive, focus on succession planning for Non-Executive Directors and consider the overall role played by the Board in relation to corporate transactions involving Hammerson and the Consortium comprising the Peel Group, the Olayan Group and Brookfield Property Group, including lessons that the Board can draw from these processes.
Induction for new Directors There is a comprehensive induction programme for new Directors which is tailored by the Chairman, in consultation with the Chief Executive and Company Secretary, depending on the type of appointment. The programme ordinarily includes meetings with Board members, senior management and external advisers, as well as a high-level review of all current projects, Board strategy and an in-depth review of the Group’s assets. Additional elements are added to the programme as needed following discussion between the Chairman and the individual Director.
Where required, the Company Secretary provides guidance and facilitates the provision of training on directors’ duties under the Companies Act 2006 and on legal, regulatory and governance matters with which the Company, Board and individual Directors must comply.
The Board also recognises the need for Directors to keep up-to-date with relevant legislative and regulatory developments as well as changes to corporate governance best practice and investor expectations. The Company Secretary reports to each Board meeting on these matters, drawing attention to any issues of particular relevance.
Re-election of Directors All Directors will submit themselves for re-election at the forthcoming annual general meeting in May 2019, other than Rakhi Goss-Custard who, having reached the end of her tenure, is not seeking re-election.
John StrachanChairman20 February 2019
77
Strategic reportFin
ancial statem
ents
Other in
formation
Govern
ance
intu properties plc Annual report 2018

Members and meetings in 2018Remuneration
Committee(4 meetings)
A B
Louise Patten (Chairman) (Independent Non-Executive Director)
4 4
Adèle Anderson (Independent Non-Executive Director)
4 4
Rakhi Goss-Custard (Independent Non-Executive Director)
4 4
Ian Burke (appointed 1 October 2018) (Independent Non-Executive Director)
2 2
A Maximum number of meetings eligible to attend B Number of meetings actually attended
The Chairman of the Board, the Chief Executive, the Company Secretary and the HR director normally attend scheduled meetings at the invitation of the Committee. No individual was present when his or her remuneration was being determined.
Having succeeded Louise Patten in February 2019 as Remuneration Committee Chairman, I would like to thank Louise and the Committee for their work in the year
200 per cent of salary rather than the normal 250 per cent). The 2019 award will also comply with best practice guidelines via the introduction of a full five-year holding period
Remuneration policyOur Directors’ remuneration policy was approved by shareholders at the 2017 annual general meeting, which received 99.5 per cent support from our shareholders.
The Committee will undertake a review of the policy in 2019 and will table a revised policy for shareholder approval at the 2020 annual general meeting.
A summary of the current remuneration policy is presented at the end of this report.
Alignment with long-term successThe Committee believes that our remuneration philosophy and incentive policy is aligned with the long-term success of the Company. Our long-term incentive plan has time horizons extending to five years, and 50 per cent of our annual bonus is deferred into shares. Taking into account the revised UK Corporate Governance Code, the Committee has introduced additional holding periods on our PSP awards, further enhancing this alignment. We also formalised our policy for leavers, so that the time horizon for vested and unvested shares from our long-term incentive plans would normally continue post-cessation.
Dear shareholder
I am pleased to present intu’s 2018 Directors’ remuneration report to you, my first as Chairman of the Committee, which has been prepared by the Remuneration Committee and approved by the Board.
Results and context of remunerationThe results for the year show a resilient operating performance. However, uncertainty around the UK economy and a challenging retail background is leading to a weakening sentiment in the retail property investment market, impacting property valuations. In addition, the Company had two separate offers that ultimately were not concluded.
As explained more fully later in this report, the Committee has reflected this challenging environment in the decisions it has taken, which include:
— no salary increases for the Executive Directors for 2019
— to reflect shareholders’ overall experience during the year, exercising discretion to reduce by 50 per cent the portion of the annual bonus that would (reflecting the resilient operating performance in 2018) otherwise have been fully payable based on a formulaic assessment of performance against the EPS versus budget element of the annual bonus (and also determining that no bonus is payable in relation to the other two elements of the bonus, namely the EPS versus prior year element and strategic/operational element)
— to take account of the current share price, a reduction in the size of awards to be made to incumbent senior management under the PSP (for example, the Chief Financial Officer’s 2019 award will be over shares worth
Remuneration governance aligned featuresMalus provisions for both the annual bonus and PSPClawback provisions for both the annual bonus and PSPPerformance period extending to five years for a proportion of PSPTotal vesting and holding period of five years for all tranches of the PSPFull retrospective disclosure of annual bonus financial targets including minimum and maximum target rangeShareholding requirement of 200 per cent of salary
Directors’ remuneration report
Governance
78 intu properties plc Annual report 2018

Performance pay is linked to:
— out-performance of total shareholder return (TSR) against our peers
— delivering absolute growth for our shareholders
— annual EPS performance — achievement of our strategic initiatives that will build value for the longer term
Both Executive Directors are required to build up a shareholding in intu shares worth 200 per cent of salary.
Key areas of focus and decisions in 2018 and for 2019
The Remuneration Committee made a number of decisions regarding the application of our policy in 2018 and for 2019. As noted above, key decisions included the following:
— the Executive Directors’ base salaries will remain unchanged
— fees for our Chairman will remain unchanged at £275,000 per annum
— the annual bonus awarded to the Executive Directors for the year ended 31 December 2018 was 20 per cent
of salary representing 16.66 per cent of maximum opportunity (compared to 72 per cent and 60 per cent respectively in 2017). As noted overleaf, the Committee exercised discretion to reduce the portion of the annual bonus provisionally payable under the EPS versus budget element of the annual bonus (with no bonus payable in relation to the other two elements of the plan).
— nil vesting of the relevant tranches of the 2014, 2015 and 2016 PSP awards
— for 2019, no changes have been made to the performance measurement framework for the annual bonus
— PSP awards of 250 per cent of salary were made to each of the Executive Directors in March 2018. These will only vest subject to the achievement of stretching TSR and total financial return performance conditions, over three, four and five years
— reflecting the current share price, smaller PSP awards (in percentage of salary terms) will be made to incumbent senior management in 2019 than in prior years (for example, the Chief Financial Officer’s 2019 award will be over shares worth
200 per cent of salary rather than the normal 250 per cent), with this award subject to a full five-year holding period
Chief Executive leaving arrangementsAs announced in July 2018, David Fischel will be standing down as Chief Executive once a suitable successor has been appointed. His remuneration on leaving will be in line with our approved policy as well as good practice principles. To ensure an orderly succession process and to take account of the unusual circumstances that have prevailed, formal notice was given on 31 December 2018 though it is expected that a successor will be appointed prior to the expiry of the notice period. More details are set out on page 84.
— salaries for 2019 are: – David Fischel, Chief Executive: £617,916 – Matthew Roberts, Chief Financial Officer: £487,713
— no salary increases for the Executive Directors
— the Company operates a defined contribution pension or salary supplement, where the contribution is 24 per cent of salary. The Chief Executive receives an additional six per cent in recognition of the benefit foregone on the closure of the defined benefit scheme. Benefits include a car allowance (up to £18,000), private medical insurance, life assurance and long-term sickness insurance
— maximum opportunity of 120 per cent of salary — 50 per cent of the award earned will be deferred into intu shares, which normally vest over two and three
years subject to continued employment (with standard ‘good’ and ‘bad’ leaver provisions applying) — for 2019, performance is based two-thirds on EPS and one-third on strategic and operational objectives.
This is the same framework which applied for 2017 and 2018
— normal maximum grant size of 200 per cent of salary in 2019 for incumbents — three, four and five year performance periods (with full five-year holding period) — the precise performance targets for the 2019 awards have yet to be agreed. However, the current intention
is that, as per previous years, targets will be employed relating to relative TSR and/or absolute growth targets (with the metric used to measure absolute growth yet to be determined) measured over three, four and five years. Full details of the targets will be set out in the Stock Exchange announcement that is issued in relation to these awards
Summary of policy for 2019 Timing of payoutKey elements
Overview of Executive Director remuneration An overview of the key remuneration elements in place for Executive Directors in 2019 is set out below:
2019 2020 2021 2022 2023
Salary
Pension and benefits
Annual bonus
Long-term incentives
Shareholdingrequirement
— Executive Directors must build up a holding with a value equivalent to 200 per cent of salary
79
Strategic reportFin
ancial statem
ents
Other in
formation
Govern
ance
intu properties plc Annual report 2018

Directors’ remuneration report continued
Compliance statementThis is the Directors’ remuneration report of the Company which has been produced pursuant to, and in accordance with, the Listing Rules, section 420 of the Companies Act 2006 and Schedule 8 to the Large and Medium-sized Companies and Groups (Accounts and Reports) Regulations 2008 (as amended 2013). The Company also complies with the requirements of the UK Corporate Governance Code applicable in 2018 (save where indicated otherwise).
This report contains both auditable and non-auditable information. The information subject to audit is set out in the Directors’ remuneration report, in sections marked with §.
Code changes in relation to executive pensionsTaking into account legacy arrangements, the current Executive Director pensions are not aligned with the wider workforce. The pension policy for Executive Directors will form part of next year’s policy review for approval by shareholders, taking into account the new UK Corporate Governance Code provision that Executive Director pensions should be aligned with those of the wider workforce. The Committee will also be mindful of this change in the new Code when considering the remuneration package for a new chief executive.
Our employeesThe Committee oversees any significant changes to the remuneration policy for all intu employees. intu also operates a number of share plans so that all of our employees have the opportunity to acquire shares in intu:
— for a number of years now we have operated an HMRC share incentive plan (SIP), under which employees may participate in a ‘partnership’ share plan
— in 2016, we introduced the intu Retail Services Sharesave Plan, which is another HMRC plan, and provides employees with the opportunity to purchase shares at a discount following an initial savings period
Following the revised UK Corporate Governance Code, the Committee reviewed its process for reviewing workforce remuneration and related policies. As a Committee we have, for many years now, been provided as part of the annual review with significant detail of the pay and incentive practices across all intu employees. Notwithstanding this, during 2019 we will be increasing and enhancing the information that the Committee receives on workforce pay and policies to ensure that we have this important context when making decisions on our executive pay. In addition, John Strachan has been designated to engage with the workforce to ensure that the ‘employee voice’ is taken into account in our remuneration policies and practices. Also, as part of our wider commitment to our employees, the Committee has decided to voluntarily publish our Chief Executive to employee pay ratio a year in advance of the regulations coming into force. Further details on page 85.
Ian BurkeChairman of the Remuneration Committee20 February 2019
Governance
80 intu properties plc Annual report 2018
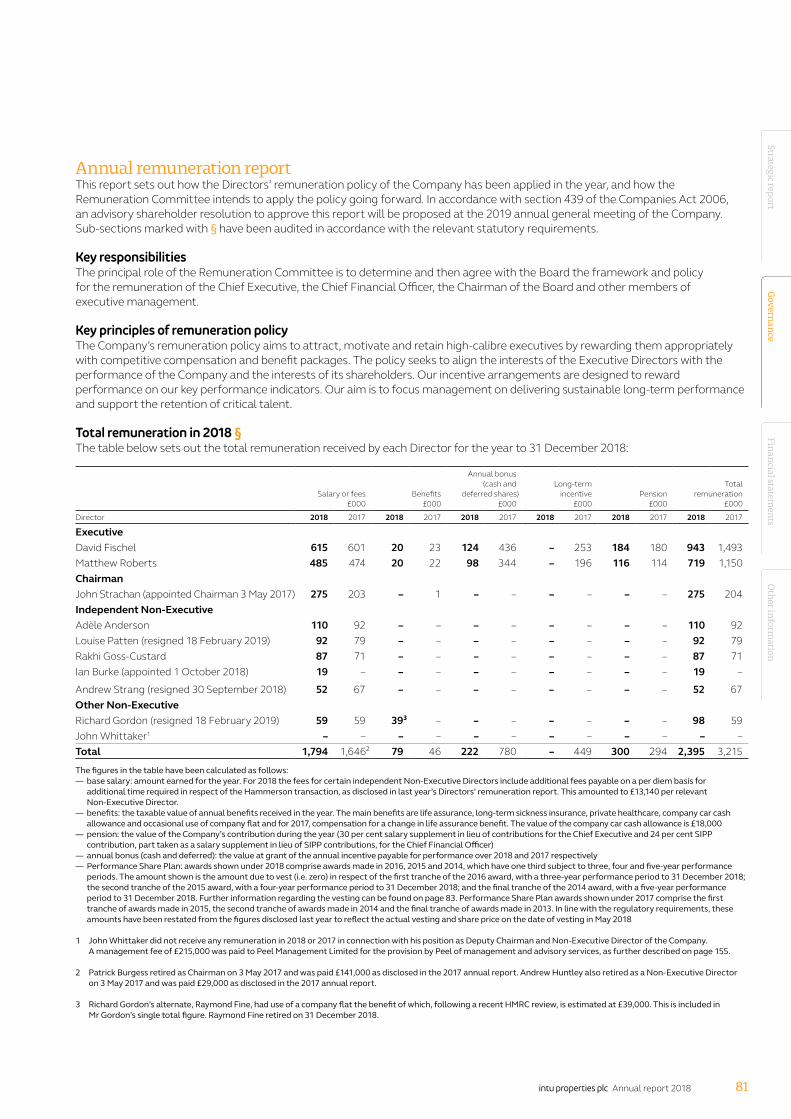
Annual remuneration report This report sets out how the Directors’ remuneration policy of the Company has been applied in the year, and how the Remuneration Committee intends to apply the policy going forward. In accordance with section 439 of the Companies Act 2006, an advisory shareholder resolution to approve this report will be proposed at the 2019 annual general meeting of the Company. Sub-sections marked with § have been audited in accordance with the relevant statutory requirements.
Key responsibilitiesThe principal role of the Remuneration Committee is to determine and then agree with the Board the framework and policy for the remuneration of the Chief Executive, the Chief Financial Officer, the Chairman of the Board and other members of executive management.
Key principles of remuneration policyThe Company’s remuneration policy aims to attract, motivate and retain high-calibre executives by rewarding them appropriately with competitive compensation and benefit packages. The policy seeks to align the interests of the Executive Directors with the performance of the Company and the interests of its shareholders. Our incentive arrangements are designed to reward performance on our key performance indicators. Our aim is to focus management on delivering sustainable long-term performance and support the retention of critical talent.
Total remuneration in 2018 §The table below sets out the total remuneration received by each Director for the year to 31 December 2018:
Salary or fees£000
Benefits£000
Annual bonus(cash and
deferred shares)£000
Long-termincentive
£000Pension
£000
Totalremuneration
£000
Director 2018 2017 2018 2017 2018 2017 2018 2017 2018 2017 2018 2017
ExecutiveDavid Fischel 615 601 20 23 124 436 – 253 184 180 943 1,493Matthew Roberts 485 474 20 22 98 344 – 196 116 114 719 1,150 ChairmanJohn Strachan (appointed Chairman 3 May 2017) 275 203 – 1 – – – – – – 275 204Independent Non-ExecutiveAdèle Anderson 110 92 – – – – – – – – 110 92Louise Patten (resigned 18 February 2019) 92 79 – – – – – – – – 92 79Rakhi Goss-Custard 87 71 – – – – – – – – 87 71Ian Burke (appointed 1 October 2018) 19 – – – – – – – – – 19 –
Andrew Strang (resigned 30 September 2018) 52 67 – – – – – – – – 52 67Other Non-ExecutiveRichard Gordon (resigned 18 February 2019) 59 59 39³ – – – – – – – 98 59John Whittaker1 – – – – – – – – – – – –Total 1,794 1,646² 79 46 222 780 – 449 300 294 2,395 3,215
The figures in the table have been calculated as follows: — base salary: amount earned for the year. For 2018 the fees for certain independent Non-Executive Directors include additional fees payable on a per diem basis for additional time required in respect of the Hammerson transaction, as disclosed in last year’s Directors’ remuneration report. This amounted to £13,140 per relevant Non-Executive Director.
— benefits: the taxable value of annual benefits received in the year. The main benefits are life assurance, long-term sickness insurance, private healthcare, company car cash allowance and occasional use of company flat and for 2017, compensation for a change in life assurance benefit. The value of the company car cash allowance is £18,000
— pension: the value of the Company’s contribution during the year (30 per cent salary supplement in lieu of contributions for the Chief Executive and 24 per cent SIPP contribution, part taken as a salary supplement in lieu of SIPP contributions, for the Chief Financial Officer)
— annual bonus (cash and deferred): the value at grant of the annual incentive payable for performance over 2018 and 2017 respectively — Performance Share Plan: awards shown under 2018 comprise awards made in 2016, 2015 and 2014, which have one third subject to three, four and five-year performance periods. The amount shown is the amount due to vest (i.e. zero) in respect of the first tranche of the 2016 award, with a three-year performance period to 31 December 2018; the second tranche of the 2015 award, with a four-year performance period to 31 December 2018; and the final tranche of the 2014 award, with a five-year performance period to 31 December 2018. Further information regarding the vesting can be found on page 83. Performance Share Plan awards shown under 2017 comprise the first tranche of awards made in 2015, the second tranche of awards made in 2014 and the final tranche of awards made in 2013. In line with the regulatory requirements, these amounts have been restated from the figures disclosed last year to reflect the actual vesting and share price on the date of vesting in May 2018
1 John Whittaker did not receive any remuneration in 2018 or 2017 in connection with his position as Deputy Chairman and Non-Executive Director of the Company. A management fee of £215,000 was paid to Peel Management Limited for the provision by Peel of management and advisory services, as further described on page 155.
2 Patrick Burgess retired as Chairman on 3 May 2017 and was paid £141,000 as disclosed in the 2017 annual report. Andrew Huntley also retired as a Non-Executive Director on 3 May 2017 and was paid £29,000 as disclosed in the 2017 annual report.
3 Richard Gordon’s alternate, Raymond Fine, had use of a company flat the benefit of which, following a recent HMRC review, is estimated at £39,000. This is included in Mr Gordon’s single total figure. Raymond Fine retired on 31 December 2018.
81
Strategic reportFin
ancial statem
ents
Other in
formation
Govern
ance
intu properties plc Annual report 2018

Performance outturns and incentivesAnnual bonus §The maximum award for both the Chief Executive and Chief Financial Officer in 2018 was 120 per cent of salary, of which 50 per cent is deferred for two and three years. This will remain unchanged for 2019.
Annual bonus payments are based on pre-determined performance measures. Given the commercial sensitivity, the Remuneration Committee provides retrospective disclosure of targets. Two-thirds is based on adjusted EPS performance in the year, split evenly between performance versus budget and prior year figures. The overall structure ensures that the maximum EPS related bonus is only achievable if management outperform against both the Board’s expectations for the year and if there is an increase in EPS on the prior year.
The remaining third is based on achievement of strategic and operational objectives against a scorecard of measures. The Remuneration Committee considers the objectives carefully each year to align with intu’s strategic objectives, and the objectives include quantitatively assessed financial and operational measures and milestones.
For 2019, the objectives of the incumbent Executive Directors will focus on ensuring that key strategic initiatives relating to asset performance, operational excellence, optimising intu’s winning destinations and smart use of capital are kept on track/delivered during what is likely to be a year of transition.
Annual bonus – 2018 outturn§The targets for the 2018 bonus are set out below. As in previous years, full retrospective disclosure of the targets is given:
EPS elementTargets
Performance element
Weighting (% of total
opportunity) Threshold Target Maximum2018
performance
Provisional outturn
(% of max element)
Adjusted EPS vs budget 33.3% 13.0p 13.7p 14.4p 14.4p 100%Adjusted EPS vs prior year 33.3% 100% 102.5% 105% 96% 0%
David Fischel
Matthew Roberts
Total provisional out-turn (% of max bonus) 33.33% 33.33%
Therefore, no bonus was payable under the EPS vs prior year element. However, reflecting intu’s resilient operating performance, a bonus equalling 33.3 per cent of the maximum bonus opportunity (i.e. 40 per cent of salary) was provisionally payable based on a formulaic assessment of performance against the EPS vs budget element. However, mindful of shareholders’ experience during the year, the Committee exercised discretion to reduce the payout under this element of the bonus by 50 per cent, thereby resulting in the payment of a bonus equalling 20 per cent of salary.
Strategic/operational elementThe strategic objectives in the annual bonus are a key part of the remuneration framework for incentivising and rewarding achievements and milestones which are the foundation for value creation in the future. The Committee follows a rigorous process in the setting and monitoring of scorecard objectives and then exercises judgement in assessing performance in the key areas selected. This includes determination of objectives by reference to the approved Board strategy, quarterly reviews of quantitative and qualitative data, and an end-of-year full review with supporting evidence, to ensure a robust assessment of performance against the objectives.
For 2018, the scorecard and weightings were as follows:
Element Performance indicators Weighting
Underlying performance of assetsKPIs considered included net rental income growth of 0.6% LFL 25%
Digital and the customer experienceNPS, brand awareness, performance of intu Experiences 25%
Implementation of strategic priorities, including the Hammerson transaction
Transaction not concluded (nor was consortium offer), albeit both requiring significant management time 50%
Despite intu’s resilient operating performance during the year, the Committee determined that no bonus was payable in relation to this element. Therefore, in total, a bonus equal to 20 per cent of salary (i.e. 16.66 per cent of the maximum bonus) was payable to the two Executive Directors for 2018 (compared to 72 per cent of salary/60 per cent of the maximum in 2017).
Directors’ remuneration report continued
Governance
82 intu properties plc Annual report 2018

Deferral into shares50 per cent of the 2018 short-term incentive for both David Fischel and Matthew Roberts was deferred into shares of the Company. Executive directors must remain in employment with the Company for a period of two years (25 per cent) and three years (25 per cent) after the date of award before such shares are released (subject to the normal ‘good’ and ‘bad’ leaver provisions).
Deferred bonus awards granted in the year §The table below summarises the deferred bonus awards granted during the year. These awards were made in March 2018 in respect of the 2017 bonus:
Individual Type of interest
Face value of 2018 award*
£
David FischelDeferred bonus award
£218,461Matthew Roberts £172,131
* Face value calculated using five-day average share price prior to date of grant of £2.08. Awards are granted in the form of nil cost options.
Long-term incentives §Awards with performance periods ending in the year – Performance Share Plan (PSP)The PSP awards shown in the single figure relate to awards due to vest in 2019. These relate to the first, second and final tranche of the 2016, 2015 and 2014 PSP awards, respectively. The following table summarises vesting under these awards:
Award Tranche Performance periodTSR
ranking
Vesting ofTSR portion
(% of max)
TotalFinancial
Return (per annum)
Vesting of Total
Financial Return
portion (% of max)
Totalvesting
(% of max)
2016 PSP award First trancheThree years to 31 December 2018 6th Nil -4.3% Nil Nil
2015 PSP award Second trancheFour years to 31 December 2018 6th Nil -0.8% Nil Nil
2014 PSP award Final trancheFive years to 31 December 2018 6th Nil 2.6% Nil Nil
The performance conditions for the above awards were as follows:
— half of awards vest by reference to TSR relative to the top-five UK-listed REITs with 25 per cent minimum vesting for TSR in line with the third-ranked company; vesting of 60 per cent for TSR in line with the second-ranked company; full vesting for TSR in line with the top-ranked company; and straight line vesting between points, proportionate to TSR achieved. This portion is also subject to a committee-operated discretionary assessment of underlying financial performance
— half of the awards vest by reference to Total Financial Return (NAV growth per share plus dividends) with 25 per cent minimum vesting for 6 per cent per annum; full vesting for 10 per cent per annum; straight-line vesting in between. Awards lapse for growth of less than 6 per cent per annum
PSP awards granted during the year §The table below summarises PSP awards granted during the year, in March 2018:
Individual Type of interest
Face value of 2018 award* % vestingat threshold
Performance period end
£ % of salary 3 years 4 years 5 years
David Fischel PSP** 1,514,500 250% 25%31 December
202031 December
202131 December
2022
Matthew Roberts PSP** 1,195,373 250% 25%31 December
202031 December
202131 December
2022
* Face value calculated using a five day average share price prior to date of grant of £2.08.** Vesting of awards is based 50 per cent on relative TSR and 50 per cent on Total Financial Return (NAV growth per share plus dividends) performance, with targets equivalent
to the 2018 award (see page 86).
83
Strategic reportFin
ancial statem
ents
Other in
formation
Govern
ance
intu properties plc Annual report 2018

Awards for 2019To take account of the current share price, PSP awards to be made to incumbent senior management in 2019 will be at a reduced level (for example, the Chief Financial Officer’s 2019 award will be over shares worth 200 per cent of salary rather than the normal 250 per cent). The precise performance targets for the 2019 awards have yet to be agreed. However, the current intention is that, as per previous years, targets will be employed relating to relative TSR and/or absolute growth targets (with the metric used to measure absolute growth yet to be determined) measured over three, four and five years. Full details of the targets will be set out in the Stock Exchange announcement that is issued in relation to these awards. Under the plan, awards will vest as to one-third each based on performance measured over three, four and five years.
Following the publication of the revised UK Corporate Governance Code the Committee determined that for future awards under the PSP, a two-year holding period would apply to the portion vesting after three years, and a one-year holding period would apply for the portion vesting after four years. This extends the time horizon for the entire award to five years, aligning Executive Directors to the long-term success of the business. The holding period will apply for awards granted in 2019 and onwards.
Departure of Chief Executive As announced in July 2018, David Fischel will be standing down as Chief Executive once a suitable successor has been appointed. David agreed to remain in post for a longer period than he had envisaged, giving the Board sufficient time to search for a suitable successor. To ensure an orderly succession process and to take account of the unusual circumstances that have prevailed, formal notice was given on 31 December 2018 though it is expected that a successor will be appointed significantly before the expiry of his 12-month notice period. Details of his remuneration on leaving will be announced in accordance with S430 (2B) of the Companies Act 2006 and reported in next year’s Directors’ remuneration report. His remuneration on leaving will be in line with our approved policy as well as good practice principles:
— David will continue to receive salary, pension and benefits throughout his notice period — David will continue to participate in the annual bonus plan for 2019, with pro-rating dependent on the timing of his departure — he will not receive a PSP award during 2019 — having taken account of the circumstances, it is anticipated that David will be treated as a good leaver pursuant to the rules of the PSP, with awards subject to pro-rating and assessment of performance at the normal time. David will also be treated as a good leaver for the purposes of his deferred share awards (which will vest on cessation, pursuant to the rules of that plan)
Malus and clawbackShares awarded under the deferred bonus plan and PSP are subject to malus provisions. The Committee may apply malus at its discretion in circumstances including (but not limited to):
— a material misstatement of the Company’s audited financial results — a material failure of risk management by the Company, any Group company or business unit — a material breach of any applicable health and safety or environmental regulations by the Company, any Group company or business unit
— serious reputational damage to the Company, any Group company or business unit — serious misconduct of the individual
The annual bonus and PSP awards are also subject to clawback provisions. The Committee may at its discretion seek to apply clawback in circumstances of:
— a material misstatement of the Company’s audited financial results where the individual is responsible or accountable (and where Executive Directors would always be deemed to have management responsibility)
— serious misconduct of the individual
Clawback provisions may be applied up to two years following the determination of the annual incentive and up to one further year following vesting for awards under the PSP. Taking into account the three, four and five year-vesting timescales, this means that PSP awards may be reclaimed for up to four, five and six years, respectively, from the date of award.
Other share scheme informationThe Company operates a share incentive plan (SIP) for all eligible employees, including Executive Directors, who may receive up to £3,600 worth of shares as part of their annual bonus arrangements. As part of the SIP arrangements, the Company offers eligible employees the opportunity to participate in a ‘partnership’ share scheme, the terms of which are governed by HM Revenue & Customs (HMRC) regulations.
In 2016, intu implemented an HMRC-approved Sharesave Plan (the intu Retail Services Sharesave Plan), offering a potential savings contract of up to £500 a month for a period of three to five years. Participants are granted an option to acquire ordinary shares in
Directors’ remuneration report continued
Governance
84 intu properties plc Annual report 2018

intu using the proceeds of their saving contract. The exercise price is set at the time of invitation to apply for the plan, with a discount of 10 per cent of the market value.
The Company operates an employee share ownership plan (ESOP) which has in the past used funds provided to purchase shares required under the annual bonus scheme.
Season ticket loanAll employees of the Group are entitled to an interest-free travel season ticket loan which is repaid over the year via deductions from salary. Neither David Fischel nor Matthew Roberts received a season ticket or other loan from the Group during 2018.
Chief Executive pay increase in relation to all employeesThe table below sets out details of the percentage change in salary, benefits and annual bonus for the Chief Executive and the average for all of intu’s staff:
Percentage change in remuneration from31 December 2017 to 31 December 2018
Percentage changein base salary
Percentage changein benefits
Percentage change in annual bonus
Chief Executive 2% (15%) (72%)All employees 3% (24%) (2%)
Shareholding and share interests §Executive directors must build up over time a holding of intu shares with a value equivalent to 200 per cent of salary. The Remuneration Committee reviews shareholdings against the requirement on an annual basis to ensure they are met within an appropriate timeframe.
The graph below illustrates the shareholdings of the Executive Directors as a percentage of salary. Note that only actual holdings count towards the shareholding requirements. Shares subject to deferral and/or performance conditions have also been shown for reference.
Shareholding of intu ordinary shares as at 31 December 2018 (% of salary)*
David Fischel
Matthew Roberts
Actual shareholding
% of salary0
Deferred shares Unexercised share options (vested) Shares subject to performance conditions Shareholding requirement
200 400 600 800 1,000 1,200 1,400 1,600
* Value of shareholding calculated based on 12-month average share price to 31 December 2018. Shareholdings of Non-Executive Directors are shown in note 42 on page 158.
As shown above David Fischel fulfils his shareholding requirement. Matthew Roberts almost meets his requirement (which was increased to 200 per cent of salary two years ago) and expects to reach a value of 200 per cent of salary in the next year or so.
In line with the new UK Corporate Governance Code requirement, the Committee formalised its policy for post-employment unvested and vested share interests. For the PSP, any awards which vest will generally continue post-cessation, with performance measured at the normal time. Since the PSP has time horizons of three, four and five years, this means that good leavers would generally have a substantive interest in shares for a period post-leaving. Any holding period applying to PSP awards from 2019 onwards would continue to apply post-cessation of employment. The Committee will review its policy in connection with post-cessation shareholdings in light of developing market and good governance practice as part of its review of the overall policy during 2019.
85
Strategic reportFin
ancial statem
ents
Other in
formation
Govern
ance
intu properties plc Annual report 2018

The table below sets out the Executive Directors’ interests in shares as at 31 December 2018:
Number of shares owned (including connected persons)
Unvested awards Vested awards
Conditional shares not subjectto performance conditions
Held inown name
Held in SIPtrust for
> 5 yearsDeferred
shares
Held in SIPtrust for
< 5 years
PSPsubject to
performanceconditions
Optionssubject to
performanceconditions
Unexercisedunapproved
options1
Unexercisedapproved
options
Optionsexercised in
the year
ExecutiveDavid Fischel 1,272,433 12,374 273,918 11,302 2,132,221 – 1,382,972 12,906 –Matthew Roberts 433,387 4,564 216,616 10,009 1,679,227 – 481,387 11,203 –
1 Held as jointly owned shares. The outstanding options represent the unexercised 2009 and 2010 unapproved options held as jointly-owned shares. No changes in the interests of Directors have occurred between 31 December 2018 and 19 February 2019.
Vested2009 ESOS awards Awards of market value share options, with an exercise price of 232.41 pence. These awards became
exercisable on 28 February 2013 and may be exercised until 28 May 2019.
2010 ESOS awards Awards of market value share options, with an exercise price of 267.75 pence. These awards became exercisable on 26 May 2013 and may be exercised until 26 May 2020.
Unvested2014 PSP (third tranche)
Awards of performance shares, granted on 12 May 2014. Vesting is based on TSR (relative to the top five UK-listed REITs) and Total Financial Return performance (ranging from 6 per cent per annum to 10 per cent per annum), in three equal tranches over three, four and five years. Any awards that vest may be exercised until 12 May 2024.
2015 PSP (second and third tranche)
Awards of performance shares, granted on 11 March 2015. Vesting is based on TSR (relative to the top five UK-listed REITs) and Total Financial Return performance (ranging from 6 per cent per annum to 10 per cent per annum), in three equal tranches over three, four and five years. Any awards that vest may be exercised until 11 March 2025.
2016 PSP Awards of performance shares, granted on 7 March 2016. Vesting is based on TSR (relative to the top five UK-listed REITs) and Total Financial Return performance (ranging from 6 per cent per annum to 10 per cent per annum), in three equal tranches over three, four and five years. Any awards that vest may be exercised until 7 March 2026.
2017 PSP Awards of performance shares, granted on 10 March 2017. Vesting is based on TSR (relative to the top five UK-listed REITs) and Total Financial Return performance (ranging from 6 per cent per annum to 10 per cent per annum), in three equal tranches over three, four and five years. Any awards that vest may be exercised until 10 March 2027.
2018 PSP Awards of performance shares, granted on 9 March 2018. Vesting is based on TSR (relative to the top five UK-listed REITs) and Total Financial Return performance (ranging from 6 per cent per annum to 10 per cent per annum), in three equal tranches over three, four and five years. Any awards that vest may be exercised until 10 March 2028.
Directors’ remuneration report continued
Governance
86 intu properties plc Annual report 2018

Ten-year TSR chartThe following graph shows the TSR for intu properties plc over the ten-year period ended 31 December 2018, compared with our closest comparator group for this purpose, the FTSE 350 Real Estate. TSR is defined as share price growth plus reinvested dividends:
0
50
100
150
200
250
31 Dec 2009 31 Dec 201131 Dec 201031 Dec 2008 31 Dec 2012 31 Dec 2013 31 Dec 2014 31 Dec 2015 31 Dec 201831 Dec 201731 Dec 2016
0
50
100
150
250
200
intu properties plcFTSE 350 Real Estate
Ten-year Total Shareholder Return (TSR) performance
UK real estate is a cyclical sector. Since 2009, a key driver for growth in value within the UK real estate market has been exposure to central London properties. As a result of the demerger of Capital & Counties from Liberty International (now intu properties plc) in 2010, intu’s portfolio does not include properties in central London and intu has therefore not benefited from the uplift experienced by those property companies with exposure to London. However, given the cyclical nature of the property sector, we would not expect this trend to endure over the long-term cycle.
For additional context, the following two charts have been provided to show intu’s total financial return (NAV growth plus dividends) and prime property assets (capital value growth adjusted for capex and net income expressed as a percentage of capital employed) over the same period. intu’s prime property return is shown relative to the MSCI monthly retail index. These two charts have been provided as growth in these metrics supports the delivery of long-term returns to our shareholders and are included in our key performance indicators (see pages 36 and 37).
2012201120102009 2013 2014 2015 2016 2017 2018
90
100
110
120
130
170
140
150
160
Total Financial Return
87
Strategic reportFin
ancial statem
ents
Other in
formation
Govern
ance
intu properties plc Annual report 2018

Chief Executive remuneration historyThe table below sets out historical details of Chief Executive pay:
2009 2010 2011 2012 2013 2014 2015 2016 2017 2018
CE single figure of total remuneration £1,044k £1,350k £1,275k £1,810k £1,081k £1,154k £1,653k £1,814k £1,493k £943kAnnual bonus payout (% maximum) 50% 100% 83% 70% 55% 65% 95.3% 95.3% 60% 16.6%Long-term incentive plan vesting in year (% maximum) 0% 0% 0% 100% 0% 0% 37.6% 36.4% 23% 0%
Chief Executive to employee pay ratioNew legislation requires companies with more than 250 employees to publish the pay ratio between the chief executive and employees at the 25th, 50th and 75th percentile of all staff. This legislation came into force in January 2019 with mandatory reporting from 2020, however the Committee has decided to voluntarily publish the ratios for 2018 in this year’s report.
The Chief Executive’s ‘single figure’ remuneration for 2018 (£943,000) equates to the following ratios:
— At the 75th percentile: 1:31 — At the 50th percentile (median): 1:46 — At the 25th percentile: 1:53
Shareholder contextThe table below shows the advisory vote on the 2017 Annual remuneration report (including the Committee Chairman’s statement) at the 2018 annual general meeting and the binding vote on the Directors’ remuneration policy at the 2017 annual general meeting. It is the Committee’s policy to consult with major shareholders prior to any major changes, and to maintain an ongoing dialogue on executive remuneration matters.
For Against Abstentions
2017 Annual remuneration report (2018 AGM) 97.3% 2.7% 5.8mDirectors’ remuneration policy (2017 AGM) 99.5% 0.5% 0.8m
Additional disclosuresOther directorshipsExecutive directors are not generally encouraged to hold external directorships unless the Chairman of the Board determines that such appointment is in the Group’s interest and does not cause any conflict of interest. Where such appointments are approved and held, it is a matter for the Chairman to agree whether fees paid in respect of the appointment are retained by the individual or paid to the Company.
2018
100
105
115
110
120
130
125
intuMSCI monthly retail index
Prime Property Assets
201120102009 2012 2013 2014 2015 20172016
Directors’ remuneration report continued
Governance
88 intu properties plc Annual report 2018

During 2018, David Fischel’s principal external appointment was with Prozone Intu Properties Limited. Prozone Intu Properties Limited is an Indian shopping centre owner and developer in which intu has a 32 per cent interest. David Fischel also holds an external appointment as a Non-Executive Director of Marlowe Investments (Kent) Limited, a UK private company which relates to his family affairs, does not require any significant time commitment and does not conflict in any way with his role as Chief Executive of intu.
During 2018, David Fischel did not receive a fee in respect of his appointment as a Non-Executive Director of Prozone Intu Properties Limited. He received and retained a fee of £5,000 in respect of his Non-Executive Directorship of Marlowe Investments (Kent) Limited.
Matthew Roberts is a Non-Executive Director of Marston’s PLC and Chairman of its Audit Committee. He received and retained an aggregate fee of £56,625 per annum in respect of this role.
Payments to former Directors §A life-presidency fee of £150,000 per annum (2017: £150,000) was paid to Sir Donald Gordon, the Group’s Life President and former Chairman who founded the Company in 1980. The life-presidency fee was agreed by the Board at the time of his retirement in June 2005 in recognition of his outstanding contribution to the Group. The payment is payable for the remainder of Sir Donald’s life and is secured by deed.
Payments for loss of office §There were no payments for loss of office made to any director in the year.
Alternate Directors §Steven Underwood serves as Alternate Director to John Whittaker. Steven Underwood did not receive a fee in 2018 in respect of his services as an Alternate Director. Raymond Fine was, until his retirement on 31 December 2018, an Alternate Director to Richard Gordon. Raymond Fine did not receive any fee in respect of his services as an Alternate Director. Raymond Fine received a fee of £173,222 in respect of consultancy services provided to the Company in connection with South African tax and shareholder issues, liaison with the Gordon Family and other related matters. Raymond Fine also had use of a company flat, the benefit of which, following a recent HMRC review, is estimated at £39,000 in respect of 2018.
Service contractsExecutive Directors and the Chairman have rolling service contracts which are terminable on 12 months’ notice on either side.
All Non-Executive Directors have been appointed under letters of appointment on fixed terms of two or three years, subject to renewal thereafter. All are subject to annual re-election by shareholders.
Notice periodDavid Fischel 12 monthsMatthew Roberts 12 monthsJohn Strachan 12 months
Contract term expiresAdèle Anderson 2019 AGMIan Burke (appointed 1 October 2018) 2022 AGMRakhi Goss-Custard 2019 AGMJohn Whittaker 2020 AGM
89
Strategic reportFin
ancial statem
ents
Other in
formation
Govern
ance
intu properties plc Annual report 2018

Chairman and Non-Executive Director fees for 2019 §The Chairman receives a fee of £275,000 per annum.
The basic Non-Executive Director fee is £59,000 per annum. The Senior Independent Director receives an additional fee of £10,000 per annum. Remuneration Committee and Audit Committee chairmen receive £15,000 per annum, and Committee members receive £5,000 per annum. Fees were last increased in April 2015 and will remain unchanged in 2019.
John Whittaker does not receive a fee in respect of his position as Deputy Chairman and Non-Executive Director. The Board has authorised the payment of a management fee of £215,000 per annum to Peel Management Limited for the provision by Peel of a Non-Executive Director and an alternate director and other management and advisory services, together with reasonable costs and out-of-pocket expenses. This payment is disclosed in the related party transactions note on pages 155 and 156.
The Non-Executive Directors’ letters of appointment previously provided for additional fees to be payable on a per diem basis to reflect increased time commitment in certain limited circumstances. These were paid in relation to the additional time commitment arising from the Hammerson transaction but, at the request of the Non-Executive Directors,
their letters of appointment were subsequently amended to remove their entitlement to such additional fees. Accordingly, no such fees were paid for the additional time commitment arising from the Consortium transaction.
Remuneration Committee membership in 2018The principal responsibilities of the Committee, which take full account of the recommendations contained within the Code and now include provisions from the Code which come into effect on 1 January 2019, include:
— determining the remuneration policy for the Company’s Executive Directors and senior executives
— determining individual remuneration packages for the chairman of the Board, Executive Directors and senior executives
— setting appropriately stretching and achievable targets for the Company’s incentive schemes in order to motivate executives to deliver high levels of performance in the interests of our shareholders, customers and employees
— overseeing any significant changes to remuneration policy for the wider employee population
The full duties and responsibilities of the Committee are set out in its terms of reference which are available on the Group’s website, intu.co.uk.
The Remuneration Committee currently comprises three independent Non-Executive Directors. Throughout the year the Committee consisted of Louise Patten, Adèle Anderson and Rakhi Goss-Custard. I was appointed to the Remuneration Committee on 4 October 2018 and became Chairman of the Committee on 12 February 2019, when Louise Patten stepped down.
The Chairman of the Board, Chief Executive, Company Secretary, HR Director and on occasion Chief Financial Officer are invited to attend Committee meetings to contribute to the Committee in its deliberations. However, no individual is present when his or her remuneration is being determined.
The Remuneration Committee had four scheduled meetings in 2018 and had a number of additional unscheduled meetings and calls in relation to remuneration matters arising during the two separate offer periods in 2018. A summary of attendance is set out on page 78.
Advisers to the CommitteeDeloitte LLP was appointed as the Committee’s independent remuneration adviser in October 2013, following a competitive tender process. During the year, Deloitte provided advice on remuneration governance developments, corporate reporting and investor engagement, market data and other remuneration matters that materially assisted the Committee.
Distribution statementThe charts below show the percentage change in dividends and total employee compensation spend from the financial year ended 31 December 2017 to the financial year ended 31 December 2018. A similar comparison has been made in relation to underlying earnings to provide further context:
The average number of staff employed by the Group during the financial year to 31 December 2018 was 2,570 (2017: 2,603).
Underlying earnings (£m) -3.9%
0
40
80
120
200
160
£201.0m £193.1m
2017 2018
Total employee pay expenditure (£m) +4.6%
25
0
75
50
100 £91.0m £95.2m
2017 20180
40
80
120
200
160
Dividend paid (£m) +0.1%£188.0m £188.1m
2017 2018
Directors’ remuneration report continued
Governance
90 intu properties plc Annual report 2018

Policy table extract from the Directors’ remuneration policy approved by shareholders on 3 May 2017A full copy of our Directors’ remuneration policy, binding for three years from May 2017, is included in the 2016 annual report (starting on page 88), which can be found on the Group’s website, at intugroup.co.uk/en/investors/intu-annual-report-2016/. The Directors’ remuneration policy was approved by 99.5 per cent of shareholders at the 2017 annual general meeting.
Element and link to strategy Operation Maximum potential value Performance metrics
Executive directorsBase salary To provide an appropriately competitive level of base pay to attract and retain talent.
Reviewed annually.
Salary levels take account of:
— size and nature of the responsibilities of each role
— market pay levels for the role — increases for the rest of the Group — the executive’s experience — changes to the size and complexity of the Group
— implications for total remuneration — overall affordability — individual and Company performance
The Committee may award an out-of-cycle increase if it considers it appropriate.
Base salary increases may be applied, taking into account the factors considered as part of the annual review. There is no maximum increase or opportunity.
For new appointments salaries may be set at a lower level. In such cases, there may be scope for higher than usual salary increases in the first three years as the individual progresses in the role.
None.
Pension To help provide for an appropriate retirement benefit.
The Company operates an approved defined contribution pension arrangement.
A cash alternative may be offered in certain circumstances, for example where HMRC statutory limits have been reached.
Company pension contribution (or cash alternative) is up to 24 per cent of base salary.
The Chief Executive receives an additional 6 per cent of salary in recognition of the additional value of the benefit foregone on the closure of the defined benefit scheme. This amount was actuarially determined to be cost-neutral to the Company.
None.
Other benefits To provide an appropriately competitive level of benefits.
Benefits include a car allowance, private medical insurance, life assurance and long-term sickness insurance. Other benefits may be provided if the Committee considers it appropriate.
In the event that an executive director is required by the Group to relocate, benefits may include, but are not limited to, relocation allowance and housing allowance.
Car allowance of up to £18,000 per annum.
The cost of insurance benefits may vary from year to year depending on the individual’s circumstances.
There is no overall maximum benefit value but the Committee aims to ensure that the total value of benefits remains proportionate.
None.
Representatives from Deloitte also attended Committee meetings during the year. The fees paid to Deloitte in respect of this work in 2018 totalled £96,650, on a time and materials basis. During the year Deloitte also provided to the Group tax compliance and advisory services, share scheme advice and financial advisory planning services in relation to the UK-based properties. Deloitte is a founding member of the Remuneration Consultants Group and adheres to its Code of Conduct. Deloitte was appointed directly by the Committee and the Committee is satisfied that the advice received was objective and independent.
Approval will be sought for Deloitte LLP to be appointed as auditors of intu at the 2019 annual general meeting. Consequently, Deloitte stepped down as full adviser to the Committee from 31 December 2018. Following a tender process, the Committee appointed Korn Ferry as adviser to the Committee from 1 January 2019. Korn Ferry are members of the Remuneration Consultants Group and adhere to the Code of Conduct in relation to executive remuneration consulting in the UK. During the transition period from 1 January 2019 Deloitte continued to provide some limited services to the Committee.
The Committee also makes use of various published surveys to help determine appropriate remuneration levels.
The annual remuneration report, including my letter, will be put to an advisory shareholder vote at our 2019 annual general meeting and we look forward to receiving your views and support.
On behalf of the Board
Ian Burke Chairman of the Remuneration Committee20 February 2019
91
Strategic reportFin
ancial statem
ents
Other in
formation
Govern
ance
intu properties plc Annual report 2018
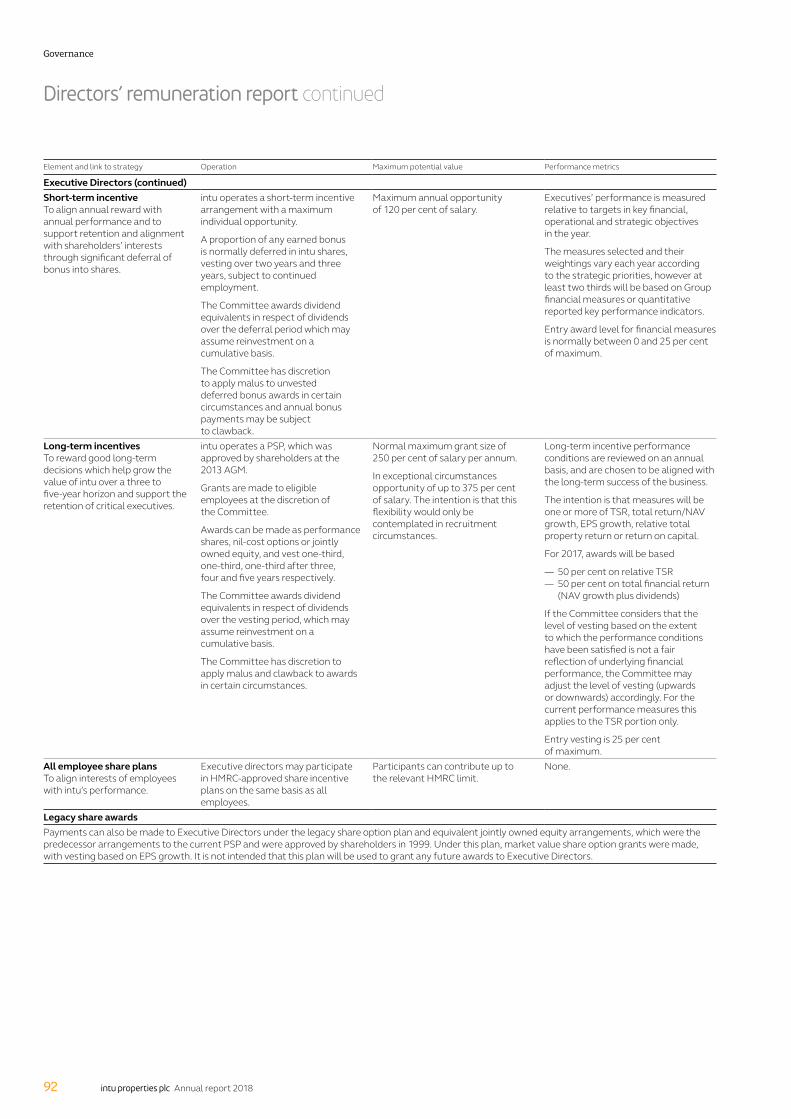
Element and link to strategy Operation Maximum potential value Performance metrics
Executive Directors (continued)Short-term incentive To align annual reward with annual performance and to support retention and alignment with shareholders’ interests through significant deferral of bonus into shares.
intu operates a short-term incentive arrangement with a maximum individual opportunity.
A proportion of any earned bonus is normally deferred in intu shares, vesting over two years and three years, subject to continued employment.
The Committee awards dividend equivalents in respect of dividends over the deferral period which may assume reinvestment on a cumulative basis.
The Committee has discretion to apply malus to unvested deferred bonus awards in certain circumstances and annual bonus payments may be subject to clawback.
Maximum annual opportunity of 120 per cent of salary.
Executives’ performance is measured relative to targets in key financial, operational and strategic objectives in the year.
The measures selected and their weightings vary each year according to the strategic priorities, however at least two thirds will be based on Group financial measures or quantitative reported key performance indicators.
Entry award level for financial measures is normally between 0 and 25 per cent of maximum.
Long-term incentives To reward good long-term decisions which help grow the value of intu over a three to five-year horizon and support the retention of critical executives.
intu operates a PSP, which was approved by shareholders at the 2013 AGM.
Grants are made to eligible employees at the discretion of the Committee.
Awards can be made as performance shares, nil-cost options or jointly owned equity, and vest one-third, one-third, one-third after three, four and five years respectively.
The Committee awards dividend equivalents in respect of dividends over the vesting period, which may assume reinvestment on a cumulative basis.
The Committee has discretion to apply malus and clawback to awards in certain circumstances.
Normal maximum grant size of 250 per cent of salary per annum.
In exceptional circumstances opportunity of up to 375 per cent of salary. The intention is that this flexibility would only be contemplated in recruitment circumstances.
Long-term incentive performance conditions are reviewed on an annual basis, and are chosen to be aligned with the long-term success of the business.
The intention is that measures will be one or more of TSR, total return/NAV growth, EPS growth, relative total property return or return on capital.
For 2017, awards will be based
— 50 per cent on relative TSR — 50 per cent on total financial return (NAV growth plus dividends)
If the Committee considers that the level of vesting based on the extent to which the performance conditions have been satisfied is not a fair reflection of underlying financial performance, the Committee may adjust the level of vesting (upwards or downwards) accordingly. For the current performance measures this applies to the TSR portion only.
Entry vesting is 25 per cent of maximum.
All employee share plans To align interests of employees with intu’s performance.
Executive directors may participate in HMRC-approved share incentive plans on the same basis as all employees.
Participants can contribute up to the relevant HMRC limit.
None.
Legacy share awardsPayments can also be made to Executive Directors under the legacy share option plan and equivalent jointly owned equity arrangements, which were the predecessor arrangements to the current PSP and were approved by shareholders in 1999. Under this plan, market value share option grants were made, with vesting based on EPS growth. It is not intended that this plan will be used to grant any future awards to Executive Directors.
Directors’ remuneration report continued
Governance
92 intu properties plc Annual report 2018

Element and link to strategy Operation Performance metrics
Non-Executive DirectorsFees To remunerate non- Executive Directors.
Independent Non-Executive Directors The chairman’s fees are determined by the Remuneration Committee.
The Non-Executive Directors’ fees are determined by the Board.
The level of fees takes into account the time commitment, responsibilities, market levels and the skills and experience required.
Non-Executive Directors normally receive a basic fee and an additional fee for specific Board responsibilities, including membership and chairmanship of committees.
The chairman is entitled to receive certain benefits in addition to fees.
Additional fees may be paid to Non-Executive Directors on a per diem basis to reflect increased time commitment in certain limited circumstances.
Expenses incurred in the performance of non-executive duties for the Company may be reimbursed or paid for directly by the Company, as appropriate, including any tax due on the expenses. Non-Executive Directors do not currently receive any benefits however these may be provided in the future if in the view of the Board this was considered appropriate.
None.
Other Non-Executive Directors In addition to the above, in certain circumstances Non-Executive Directors (other than those deemed to be independent) may receive a fee in relation to consultancy services (including alternate directors).
Such fees may be provided directly to the director or, in certain circumstances, paid to a third party company under a consultancy services agreement. Such agreements may provide for the payment of an annual fee and reimbursement of expenses.
Such an agreement is currently in place with the Peel Group for the provision of Non-Executive Director services (including alternative director services).
None.
93
Strategic reportFin
ancial statem
ents
Other in
formation
Govern
ance
intu properties plc Annual report 2018
shareholders known to the Company which may result in restrictions on the transfer of shares or on voting rights.
Under a £600 million revolving facility agreement dated 25 February 2009 (as amended and restated on 19 February 2010, 18 November 2011 and 30 October 2014) between, among others, the Company and HSBC Bank PLC (as ‘Agent’) on a change of control, if directed by a lender, the Agent may by notice to the Company cancel the commitment of that lender and declare the participation of that lender in all outstanding loans, together with accrued interest and all other amounts accrued and owing to that lender under the finance documents, immediately due and payable.
Under the terms and conditions of the £375 million 2.875 per cent Guaranteed Convertible Bonds issued on 1 November 2016 by Intu (Jersey) 2 Limited, which are guaranteed by the Company, on a change of control of the Company bondholders would have a right for a limited period of 60 days to exercise their exchange rights at an enhanced exchange price (i.e. lower than the prevailing exchange price). In addition, bondholders would become entitled for a limited period of 60 days to require the relevant issue to redeem their bonds at their principal amount, together with accrued and unpaid interest.
Under the £351.8 million term facility agreement dated 19 March 2013 (as amended and restated on 19 June 2015) between, among others, Intu (SGS) Finco Limited (SGS Finco) and HSBC Bank plc (as ‘Facility Agent’), on a change of control of the Company, if directed by a lender, the Facility Agent may by notice to SGS Finco declare all outstanding loans of that lender, together with accrued interest and all other amounts accrued and owing to that lender under the finance documents, immediately due and payable.
The Company is not party to any other significant agreements that would take effect, alter or terminate following a change of control of the Company.
The Company does not have any specific agreements with any executive director or employee that would provide compensation for loss of office or employment resulting from a takeover except that provisions of the Company
The Directors present their annual report and the audited financial statements of the Group and Company for the year ended 31 December 2018. Pages 1 to 95 inclusive of this annual report comprise the Directors’ report that has been drawn up and presented in accordance with English company law and the liabilities of the Directors in connection with that report will be subject to the limitations and restrictions provided by such law.
Use of financial instrumentsThe financial review on pages 48 to 53, accounting policies on pages 111 to 115 and note 28 on pages 139 to 144 contain information on the use of financial instruments.
DividendsThe Directors declared an interim ordinary dividend of 4.6 pence (2017: 4.6 pence) per share on 26 July 2018, which was paid on 20 November 2018. The Directors are not recommending a final dividend for 2018. The total paid for 2018 is 4.6 pence (2017: 14.0 pence). A UK REIT is expected to pay dividends (PIDs) of at least 90 per cent of its taxable profits from its UK property rental business by the first anniversary of each accounting date. In view of the announced short-term reduction of dividends it is expected that there will be an underpayment of the minimum PID, and so for the Group to incur UK corporation tax payable at 19 per cent. The Group intends to remain a UK REIT for the foreseeable future.
Share capital and control of the CompanyDetails of the Company’s share capital including changes during the year in the issued share capital and details of the rights attaching to the Company’s ordinary shares are set out in note 30 on pages 146.
No shareholder holds securities carrying special rights with regard to control of the Company. Shares held by the Company’s employee share ownership plan rank pari passu with the shares in issue and have no special rights, but voting rights and rights of acceptance of any offer relating to the shares rest with the plan’s Trustee and are not exercisable by the employees. There are no restrictions on voting rights or any arrangements by which, with the Company’s co-operation, financial rights are held by a person other than the shareholder, or any agreements between
share schemes may cause options and awards outstanding under such schemes to vest on a takeover. The terms of appointment of the non-executive directors provided that in the event of change of control, these directors may be compensated for any additional time commitment in certain limited circumstances, to be calculated on a per diem basis.
Internal controlThe statement on corporate governance on pages 60 to 95 includes the Board’s assessment following a review of internal controls and consideration of the FRC Guidance on risk management, internal control and related financial and business reporting.
DirectorsThe Directors of intu who held office during the year were as follows:
Chairman Non-ExecutiveJohn Strachan Adèle AndersonDeputy Chairman Ian Burke1
John Whittaker2 Richard Gordon2 4
Executive Rakhi Goss-Custard3 David Fischel Louise Patten4
Matthew Roberts Andrew Strang4
1 Ian Burke was appointed as a director with effect from 1 October 2018.
2 John Whittaker appointed Steven Underwood as his alternate under the terms of the Company’s Articles of Association. Richard Gordon had appointed Raymond Fine as his alternate. Raymond Fine retired on 31 December 2018.
3 Rakhi Goss-Custard will not be seeking re-election at the forthcoming annual general meeting.
4 Andrew Strang resigned as a director with effect from 30 September 2018. Louise Patten and Richard Gordon resigned from the Board on 18 February 2019.
Pursuant to the Articles of Association of the Company, the Company has indemnified the Directors to the full extent allowed by law. The Company maintains directors’ and officers’ insurance which is reviewed annually.
Additional information relating to the Directors can be found in note 42 on pages 158 and 159 on Directors’ interests, in the governance section on pages 60 to 77, and in the Directors’ remuneration report on pages 78 to 93.
The powers of the Directors are determined by UK legislation and the Articles of Association of the Company, together with any specific authorities that may be given to the Directors by
Directors’ report
94
Governance
intu properties plc Annual report 2018

shareholders from time to time, such as the power to allot shares and the power to make market purchases of the Company’s shares which are described in note 30 on page 146.
Articles of AssociationThe rules governing the appointment and replacement of Directors are contained in the Company’s Articles of Association. Changes to the Articles of Association must be approved by shareholders in accordance with the legislation in force from time to time.
Substantial shareholdingsThe table at the foot of the page shows the holdings of major shareholders in accordance with the Disclosure Guidance and Transparency Rules of the FCA at 31 December 2018 and 18 February 2019.
Employeesintu actively encourages employee involvement and consultation and places emphasis on keeping its employees informed of the Group’s activities and financial performance by such means as employee briefings and publication to all staff of relevant information and corporate announcements. Details of the intu all-employee survey are provided in the our people section on pages 54 to 56.
The annual bonus plan arrangements help develop employees’ interest in the Company’s performance; full details of these arrangements are given in the
Directors’ remuneration report on pages 78 to 93. Note 40 on pages 156 to 158 contains information on conditional awards of shares under the annual bonus scheme and bonus shares currently outstanding.
intu operates a non-discriminatory employment policy and full and fair consideration is given to applications for employment from people with disabilities or other protected characteristics under the Equality Act where they have the appropriate skills and abilities, and to the continued employment of staff who become disabled.
intu encourages the continuous development and training of its employees and the provision of equal opportunities for the training and career development of disabled employees and those with protected characteristics.
Further information relating to employees is given on pages 54 to 56 and in note 7 on page 118. The Group provides retirement benefits for the majority of its employees. Details of the Group pension arrangements are set out in note 41 on page 158.
The environmentWe have a CR strategy and details of our policies and the Group’s aims and the latest version of our annual CR report are to be found on the Company’s website. An overview of the Group’s CR activity, which includes disclosures relating to greenhouse gas emissions, is on pages 57 to 59.
The Company recognises the importance of minimising the adverse impact on the environment of its operations and the obligation to carefully manage energy, water consumption and waste recycling.
The Company strives continuously to improve its environmental performance. The environmental management system and associated environmental policy and guide are regularly reviewed to ensure that the Company maintains its commitment to environmental matters.
Additional disclosuresFor the purpose of LR 9.8.4CR, the only information required to be disclosed by LR 9.8.4R relates to sub-section (1) thereof (interest capitalised) where the amount is £10.5 million (2017: £4.9 million) (see note 9). All other sub-sections of LR 9.8.4R are not applicable.
Directors’ disclosure of information to the auditors So far as the Directors are aware, there is no relevant audit information of which the auditors are unaware and each Director has taken all reasonable steps to make himself or herself aware of any relevant audit information and to establish that the auditors are aware of that information.
AuditorsAs previously announced it is proposed that Deloitte LLP will succeed PricewaterhouseCoopers LLP as intu’s auditor for the financial year commencing 1 January 2019.
A resolution to appoint Deloitte LLP will be proposed at the forthcoming annual general meeting.
Annual general meetingThe notice convening the 2019 annual general meeting of the Company will be published separately and will be available on the Company’s website and distributed to those shareholders who have elected to receive hard copies of shareholder information.
By order of the Board Susan Marsden Company Secretary 20 February 2019
At 31 December 2018 At 18 February 2019
ShareholderNumber of
shares notified% interest in share capital
Number of shares notified
% interest in share capital
The Peel Group1 370,220,322 27.32 370,220,322 27.32Coronation Asset Management (Pty) Limited 264,281,004 19.50 264,281,004 19.50JPMorgan Chase & Co2 83,851,895 6.19 80,591,881 5.95Public Investment Corporation 78,782,807 5.81 78,782,807 5.81BlackRock, Inc. 71,386,632 5.26 71,386,632 5.26STC International Limited and Novatrust Limited3 67,330,159 4.97 67,330,159 4.97Auriga V Lux Sarl n/a n/a 47,077,177 3.47Tameside MBC re Greater Manchester Pension Fund n/a n/a 42,157,711 3.11
1 This shows the latest beneficial shareholding of John Whittaker, Deputy Chairman of intu properties plc, (including the Peel Group and Persons Closely Associated with Mr Whittaker) as disclosed in a regulatory announcement made 27 December 2018.
2 0.11 per cent of the voting rights are attached to shares, the remaining voting rights are through financial instruments.
3 As a result of a reorganisation of the trusts holding the original 8.2 per cent interest in the Company on behalf of Sir Donald Gordon and his family, the only entities now required to disclose a holding over 3 per cent are STC International Limited and Novatrust Limited, in respect of whom the Company has received recent TR1 notifications. The remainder of their interest is held by individual family members or their nominee companies, none of whom is currently required to make a disclosure under the DTRs.
95
Strategic reportFin
ancial statem
ents
Other in
formation
Govern
ance
intu properties plc Annual report 2018
The Directors are responsible for the maintenance and integrity of the Company’s website. Legislation in the United Kingdom governing the preparation and dissemination of financial statements may differ from legislation in other jurisdictions.
Directors’ confirmationsThe Directors consider that the annual report and financial statements, taken as a whole, is fair, balanced and understandable and provides the information necessary for shareholders to assess the Company’s and the Group’s position and performance, business model and strategy. Each of the Directors, whose names and functions are listed in the governance section on pages 62 and 63 confirm that, to the best of their knowledge:
(a) the Company financial statements, which have been prepared in accordance with IFRSs as adopted by the European Union, give a true and fair view of the assets, liabilities, financial position and loss of the Company
(b) the Group financial statements, which have been prepared in accordance with IFRSs as adopted by the European Union, give a true and fair view of the assets, liabilities, financial position and loss of the Group
(c) the strategic report includes a fair review of the development and performance of the business and the position of the Group, together with a description of the principal risks and uncertainties that it faces
Signed on behalf of the Board on 20 February 2019
David Fischel Chief Executive
Matthew Roberts Chief Financial Officer
The Directors are responsible for preparing the annual report and the financial statements in accordance with applicable law and regulations.
Company law requires the Directors to prepare financial statements for each financial year. Under that law the Directors have prepared the Group and Company financial statements in accordance with International Financial Reporting Standards (IFRSs) as adopted by the European Union. Under company law the Directors must not approve the financial statements unless they are satisfied that they give a true and fair view of the state of affairs of the Group and the Company and of the profit or loss of the Group and Company for that period. In preparing these financial statements, the Directors are required to:
(a) select suitable accounting policies and then apply them consistently
(b) state whether applicable IFRSs as adopted by the European Union have been followed, subject to any material departures disclosed and explained in the financial statements
(c) make judgements and accounting estimates that are reasonable and prudent
(d) prepare the financial statements on the going concern basis unless it is inappropriate to presume that the Company will continue in business
The Directors are also responsible for safeguarding the assets of the Group and Company and hence for taking reasonable steps for the prevention and detection of fraud and other irregularities.
The Directors are responsible for keeping adequate accounting records that are sufficient to show and explain the Company’s transactions and disclose with reasonable accuracy at any time the financial position of the Company and the Group and enable them to ensure that the financial statements and the Directors’ remuneration report comply with the Companies Act 2006 and, as regards the Group financial statements, Article 4 of the IAS Regulation.
Statement of Directors’ responsibilities
96
Governance
intu properties plc Annual report 2018
Financial statements
Independent auditors’ report 98
Consolidated income statement 105
Consolidated statement of comprehensive income 106
Balance sheets 107
Statements of changes in equity 108
Statements of cash flows 110
Notes to the financial statements 111
97intu properties plc Annual report 2018

Independent auditors’ report to the members of intu properties plc
98 intu properties plc Annual report 2018
Report on the audit of the financial statements Opinion In our opinion, intu properties plc’s Group financial statements and Company financial statements (the ‘financial statements’):
— give a true and fair view of the state of the Group’s and of the Company’s affairs as at 31 December 2018 and of the Group’s loss and the Group’s and the Company’s cash flows for the year then ended;
— have been properly prepared in accordance with International Financial Reporting Standards (IFRSs) as adopted by the European Union and, as regards the Company’s financial statements, as applied in accordance with the provisions of the Companies Act 2006; and
— have been prepared in accordance with the requirements of the Companies Act 2006 and, as regards the Group financial statements, Article 4 of the IAS Regulation.
We have audited the financial statements, included within the Annual Report, which comprise: the Group and Company balance sheets as at 31 December 2018; the consolidated income statement, the consolidated statement of comprehensive income, the Group and Company statements of cash flows, and the Group and Company statements of changes in equity for the year then ended; and the notes to the financial statements, which include a description of the significant accounting policies.
Our opinion is consistent with our reporting to the Audit Committee.
Basis for opinion We conducted our audit in accordance with International Standards on Auditing (UK) (‘ISAs (UK)’) and applicable law. Our responsibilities under ISAs (UK) are further described in the Auditors’ responsibilities for the audit of the financial statements section of our report. We believe that the audit evidence we have obtained is sufficient and appropriate to provide a basis for our opinion.
Independence We remained independent of the Group in accordance with the ethical requirements that are relevant to our audit of the financial statements in the UK, which includes the FRC’s Ethical Standard, as applicable to listed public interest entities, and we have fulfilled our other ethical responsibilities in accordance with these requirements.
To the best of our knowledge and belief, we declare that non-audit services prohibited by the FRC’s Ethical Standard were not provided to the Group or the Company.
Other than those disclosed in note 8 to the financial statements, we have provided no non-audit services to the Group or the Company in the period from 1 January 2018 to 31 December 2018.
Our audit approach
Context During the year to 31 December 2018, there have been no significant changes to business operations, however, we note that shopping centre valuations have been impacted by weakened sentiment toward the retail market given changing consumer behaviours and the increased number of retailers entering into administration or Company Voluntary Arrangements (CVAs), resulting in an outward shift in yields and lower assumed rental cash flows. A 13.3 per cent revaluation deficit has been recognised in respect of the investment and development property portfolio, including property held by joint ventures. The most significant transactional activity was in the completion of the disposal of a 50 per cent interest in intu Chapelfield. Our audit approach is largely consistent with the prior year.
Overview
— Overall Group materiality: £94.4m (2017: £107.9m), based on 1% of Total Assets. — Overall Company materiality: £34.6m (2017: £38.8m), based on 1% of Total Assets.
— The Group and Company financial statements are produced by the Group’s central finance department using a single, consolidated general ledger, and the whole business was subject to the same audit scope.
— Valuation of investment and development property.
Materiality
Audit scope
Key auditmatters
Financial statements
98 intu properties plc Annual report 2018
intu properties plc Annual report 2018 99
Financial statements
The scope of our audit As part of designing our audit, we determined materiality and assessed the risks of material misstatement in the financial statements. In particular, we looked at where the Directors made subjective judgements, for example in respect of significant accounting estimates that involved making assumptions and considering future events that are inherently uncertain.
Capability of the audit in detecting irregularities, including fraud Based on our understanding of the Group and the Company and its industry, we identified that the principal risks of non-compliance with laws and regulations related to the Real Estate Investment Trust (REIT) status, and we considered the extent to which non-compliance might have a material effect on the financial statements of the Group and Company. We also considered those laws and regulations that have a direct impact on the financial statements of the Group and the Company such as the Companies Act 2006, the Listing Rules and UK tax legislation. We evaluated management incentives and opportunities for fraudulent manipulation of the financial statements (including the risk of override of controls) and determined that the principal risks were related to posting inappropriate manual journal entries to revenue and intentional bias or manipulation of accounting estimates, particularly valuation of investment and development properties. Audit procedures performed by the Group engagement team included:
— discussions with management and internal audit, including consideration of known or suspected instances of non-compliance with laws and regulation and fraud and review of the reports made by internal audit;
— consideration over matters reported on the Group’s whistleblowing helpline and the results of management’s investigation of such matters;
— discussions with the Group’s internal legal counsel in relation to identified or potential non-compliance with laws and regulations and fraud;
— reviewing relevant meeting minutes including those of the Audit Committee; — review of tax compliance with the involvement of our tax specialists in the audit; — designing audit procedures to incorporate unpredictability around the nature, timing or extent of our testing of rental income
and debtors; — procedures relating to the valuation of investment properties described in the related key audit matter below; and — identifying and testing journal entries, in particular any journal entries posted with unusual account combinations.
There are inherent limitations in the audit procedures described above and the further removed non-compliance with laws and regulations is from the events and transactions reflected in the financial statements, the less likely we would become aware of it. Also, the risk of not detecting a material misstatement due to fraud is higher than the risk of not detecting one resulting from error, as fraud may involve deliberate concealment by, for example, forgery or intentional misrepresentations, or through collusion.
Key audit matters Key audit matters are those matters that, in the auditors’ professional judgement, were of most significance in the audit of the financial statements of the current period and include the most significant assessed risks of material misstatement (whether or not due to fraud) identified by the auditors, including those which had the greatest effect on: the overall audit strategy; the allocation of resources in the audit; and directing the efforts of the engagement team. These matters, and any comments we make on the results of our procedures thereon, were addressed in the context of our audit of the financial statements as a whole, and in forming our opinion thereon, and we do not provide a separate opinion on these matters. This is not a complete list of all risks identified by our audit.
Key audit matter How our audit addressed the key audit matter
Valuation of Investment and Development Property Refer to page 72 (Audit Committee report), pages 113 – 114 (Accounting policies), page 111 (significant use of estimates and assumptions) and note 14 to the financial statements. Retail is going through a period of structural change, which combined with the current macroeconomic uncertainty has resulted in a number of retailer administrations and CVAs and a particularly low level of shopping centre transactions in the current year. Although it is not unusual for there to be limited transactional activity at the prime level, this adds to the uncertainty which always exists around valuations. The existence of significant estimation uncertainty, coupled with the fact that only a small percentage difference in individual property valuations, when aggregated, could result in a material change, warrants specific audit focus in this area.
Assessing the Valuer’s expertise and objectivity We assessed the Valuers’ qualifications and expertise and read their terms of engagement with the Group to determine whether there were any matters that might have affected their objectivity or may have imposed scope limitations upon their work. We also considered other engagements which might exist between the Group and the Valuers. We found no evidence to suggest that the objectivity of any Valuer in their performance of the valuations was compromised. Data provided to the Valuers – Investment Property We carried out procedures, on a sample basis, to test whether property specific current information supplied to the Valuers by management reflected the underlying property records held by the Group and which have been tested during our audit. Assumptions and estimates used by the Valuers – Investment properties We read the valuation reports for all properties and attended meetings with each of the Valuers. Our testing also involved the use of our internal real estate valuation experts who are qualified chartered surveyors.
Strategic reportFin
ancial statem
ents
Other in
formation
Govern
ance
99intu properties plc Annual report 2018

Independent auditors’ report to the members of intu properties plc continued
100 intu properties plc Annual report 2018
Key audit matter How our audit addressed the key audit matter
The Group’s Investment and Development Properties are shopping centres and development projects and comprise the majority of the assets in the Group balance sheet, their carrying value amounting to £8.0 billion. The valuation of the Group’s property portfolio is inherently subjective due to, among other factors, the individual nature of each property, its location and the expected future rental revenues for that particular property. Moreover, in 2018 there were relatively few relevant UK shopping centre transactions against which to compare yield assessments. The valuations were carried out by four ‘third party’ Valuers: CBRE, Knight Frank, Cushman & Wakefield and Jones Lang LaSalle (the “Valuers”). The Valuers were engaged by the Directors, and performed their work in accordance with the Royal Institution of Chartered Surveyors (“RICS”) Valuation – Global Standards 2017. The Valuers used by the Group are well-known firms, with considerable experience of the market in which the Group operates. Investment Property – In determining a property’s valuation the Valuers take into account property specific current information such as the current tenancy agreements and rental income attached to the asset. They then apply other assumptions such as yield and current market rent, which are influenced by prevailing market yields and comparable market transactions, to arrive at the final valuation. Due to the unique nature of each shopping centre, the assumptions to be applied are determined having regard to the individual property characteristics at a granular, unit by unit level, as well as considering the qualities of the shopping centre as a whole. Development Property – Development properties are valued using the residual appraisal method (i.e. by estimating the fair value of the completed project using the income capitalisation method less estimated costs to completion including a market-based profit margin providing a return on development risk).
We confirmed that the valuation approach for each property was in accordance with RICS and suitable for use in determining the carrying value in the Group balance sheet. We challenged each of the Valuers on the impact on their valuations of the lack of directly comparable shopping centre transactions, each of whom stated that there remains sufficient information available from deals transacted or marketed, alongside wider market analysis and commentary, to form a view on market value. Our work focused on the larger properties in the portfolio and those properties where the assumptions used and/or year on year capital value movement suggested a possible outlier versus the rest of the portfolio or the wider shopping centre market, after taking account of property specific factors. We questioned the Valuers as to how they had factored in the impact of tenant administrations and CVAs in to their valuations, obtaining understanding of how and why the methodology differed across specific tenants and centres. We assessed the investment yields assumed by the Valuers by comparing to an estimated range of expected yields, determined via reference to published benchmarks, and analysing the variances in yields between centres across the portfolio. We also considered the reasonableness of other assumptions such as Estimated Rental Value, void rates and rent-free periods, based on our accumulated knowledge of property specific activity and performance and with reference to work performed over rental income, including focus on recent letting transactions. Finally, we evaluated year-on-year movements in capital value with reference to published benchmarks market data for the shopping centre sector. Where assumptions were outside the expected range or were otherwise deemed unusual, and/or there were unexpected movements, we undertook further investigations and, when necessary, held further discussions with the Valuers. It was evident from our interaction with management and the Valuers and our review of the valuation reports that close attention had been paid to each property’s individual characteristics at a granular, unit by unit level, as well as considering the overall quality, geographic location and desirability of the asset as a whole, with wider market analysis, commentary and sentiment also considered. Development Property In 2018, the principal development property was intu Costa del Sol, which has been valued on a development appraisal basis using an assumption of obtaining final planning permissions for the project. In relation to this property the Group used external expert reports to assist them in arriving at estimated rental cash flows (used for income capitalisation) and construction cost assumptions for the development appraisal. We carried out procedures to assess whether this property specific information supplied to the Valuers by the Group was reasonable and in line with the external expert reports. We also considered the reasonableness of market assumptions such as investment yields and market-based profit margin, involving our internal real estate valuation experts. Overall findings Our procedures indicated that the estimates and assumptions used were appropriate in the context of the Group’s investment and development property portfolio and reflected recent market transactions and the market circumstances as at year end.
We determined that there were no key audit matters applicable to the Company to communicate in our report.
Financial statements
100 intu properties plc Annual report 2018

intu properties plc Annual report 2018 101
Financial statements
How we tailored the audit scope We tailored the scope of our audit to ensure that we performed enough work to be able to give an opinion on the financial statements as a whole, taking into account the structure of the Group and the Company, the accounting processes and controls, and the industry in which they operate.
Although the Group has some interests in shopping centre operations outside the UK and the Group is structured as two operating segments, it operates a single reporting process with a centralised accounting function, therefore the whole business was subject to the same audit scope. The Group and Company financial statements are produced using numbers which are maintained on a single, consolidated trial balance, by the Group’s finance department. The majority of the underlying accounting records are maintained on the Group’s single general ledger.
For Manchester Arndale, Cribbs Causeway, Centaurus Retail Park and St David’s, Cardiff their rental income and property expense numbers are submitted quarterly by external property managers to the Group’s finance department, who then review and enter the numbers onto the Group’s general ledger. We perform tests of controls over the review of the quarterly submissions and entry onto the Group’s general ledger, and tests of details over the numbers within those submissions.
Quarterly submissions are also submitted to the Group’s finance department for intu Asturias, intu Puerto Venecia and intu Xanadú, by the intu Spain finance team. We carry out controls testing over these submissions in the same manner as for the UK submissions as above. We instructed the PwC Spain audit team to perform specified substantive procedures on the submission packs prepared by intu Spain, and held regular discussions with PwC Spain throughout the planning and execution phases of the audit. We assessed the findings of the work performed by them in order to conclude whether sufficient appropriate audit evidence had been obtained as a basis for our opinion on the Group financial statements as a whole.
Materiality The scope of our audit was influenced by our application of materiality. We set certain quantitative thresholds for materiality. These, together with qualitative considerations, helped us to determine the scope of our audit and the nature, timing and extent of our audit procedures on the individual financial statement line items and disclosures and in evaluating the effect of misstatements, both individually and in aggregate on the financial statements as a whole.
Based on our professional judgement, we determined materiality for the financial statements as a whole as follows:
Group financial statements Company financial statements
Overall materiality Specific materiality Overall materiality
Materiality level £94.4m (2017: £107.9m). £9.5m (2017: £9.8m). £34.6m (2017: £38.8m).
How we determined it 1% of Total Assets. 5% of Underlying Earnings Before Tax and Associates.
1% of Total Assets.
Rationale for benchmark applied In arriving at this judgement we have had regard to the carrying value of the Group’s assets, acknowledging that the primary measurement attribute of the Group is the carrying value of investment property. This represents a consistent year-on-year basis for determining materiality.
We have applied this lower materiality to line items that make up underlying earnings before tax and associates, plus other finance costs, on the basis that they merit more detailed audit work than the overall materiality level would require, given heightened focus from users of the accounts. We have used underlying earnings before tax and associates as a more consistent benchmark, which is not impacted by valuation movements.
In arriving at this judgement we have had regard to the carrying value of the Company’s assets, acknowledging that the primary measurement attribute of the Company is the carrying value of its investment in subsidiaries. This represents a consistent year-on-year basis for determining materiality.
We agreed with the Audit Committee that we would report to them misstatements identified during our audit above £9.4m (Group audit) (2017: £10.8m) and £3.5m (Company audit) (2017: £3.8m) as well as misstatements below those amounts that, in our view, warranted reporting for qualitative reasons.
Strategic reportFin
ancial statem
ents
Other in
formation
Govern
ance
101intu properties plc Annual report 2018

Independent auditors’ report to the members of intu properties plc continued
102 intu properties plc Annual report 2018
Going concern In accordance with ISAs (UK) we report as follows:
Reporting obligation Outcome
We are required to report if we have anything material to add or draw attention to in respect of the Directors’ statement in the financial statements about whether the Directors considered it appropriate to adopt the going concern basis of accounting in preparing the financial statements and the Directors’ identification of any material uncertainties to the Group’s and the Company’s ability to continue as a going concern over a period of at least twelve months from the date of approval of the financial statements.
We have nothing material to add or to draw attention to. However, because not all future events or conditions can be predicted, this statement is not a guarantee as to the Group’s and Company’s ability to continue as a going concern. For example, the terms on which the United Kingdom will withdraw from the European Union, which is currently due to occur on 29 March 2019, are not clear, and it is difficult to evaluate all of the potential implications on the Group’s and Company’s trade, customers, suppliers and the wider economy.
We are required to report if the Directors’ statement relating to Going Concern in accordance with Listing Rule 9.8.6R(3) is materially inconsistent with our knowledge obtained in the audit.
We have nothing to report.
Reporting on other information The other information comprises all of the information in the Annual Report other than the financial statements and our auditors’ report thereon. The Directors are responsible for the other information. Our opinion on the financial statements does not cover the other information and, accordingly, we do not express an audit opinion or, except to the extent otherwise explicitly stated in this report, any form of assurance thereon.
In connection with our audit of the financial statements, our responsibility is to read the other information and, in doing so, consider whether the other information is materially inconsistent with the financial statements or our knowledge obtained in the audit, or otherwise appears to be materially misstated. If we identify an apparent material inconsistency or material misstatement, we are required to perform procedures to conclude whether there is a material misstatement of the financial statements or a material misstatement of the other information. If, based on the work we have performed, we conclude that there is a material misstatement of this other information, we are required to report that fact. We have nothing to report based on these responsibilities.
With respect to the Strategic Report, Directors’ Report and Corporate Governance Statement, we also considered whether the disclosures required by the UK Companies Act 2006 have been included.
Based on the responsibilities described above and our work undertaken in the course of the audit, the Companies Act 2006 (CA06), ISAs (UK) and the Listing Rules of the Financial Conduct Authority (FCA) require us also to report certain opinions and matters as described below (required by ISAs (UK) unless otherwise stated).
Financial statements
102 intu properties plc Annual report 2018

intu properties plc Annual report 2018 103
Financial statements
Strategic Report and Directors’ Report In our opinion, based on the work undertaken in the course of the audit, the information given in the Strategic Report and Directors’ Report for the year ended 31 December 2018 is consistent with the financial statements and has been prepared in accordance with applicable legal requirements. (CA06)
In light of the knowledge and understanding of the Group and Company and their environment obtained in the course of the audit, we did not identify any material misstatements in the Strategic Report and Directors’ Report. (CA06)
Corporate Governance Statement In our opinion, based on the work undertaken in the course of the audit, the information given in the Corporate Governance Statement (on pages 60 to 96) about internal controls and risk management systems in relation to financial reporting processes and about share capital structures in compliance with rules 7.2.5 and 7.2.6 of the Disclosure Guidance and Transparency Rules sourcebook of the FCA (DTR) is consistent with the financial statements and has been prepared in accordance with applicable legal requirements. (CA06)
In light of the knowledge and understanding of the Group and Company and their environment obtained in the course of the audit, we did not identify any material misstatements in this information. (CA06)
In our opinion, based on the work undertaken in the course of the audit, the information given in the Corporate Governance Statement (on pages 60 to 96) with respect to the Company’s corporate governance code and practices and about its administrative, management and supervisory bodies and their committees complies with rules 7.2.2, 7.2.3 and 7.2.7 of the DTR. (CA06)
We have nothing to report arising from our responsibility to report if a corporate governance statement has not been prepared by the Company. (CA06)
The Directors’ assessment of the prospects of the Group and of the principal risks that would threaten the solvency or liquidity of the Group We have nothing material to add or draw attention to regarding:
— The Directors’ confirmation on page 38 of the Annual Report that they have carried out a robust assessment of the principal risks facing the Group, including those that would threaten its business model, future performance, solvency or liquidity.
— The disclosures in the Annual Report that describe those risks and explain how they are being managed or mitigated. — The Directors’ explanation on page 70 of the Annual Report as to how they have assessed the prospects of the Group, over
what period they have done so and why they consider that period to be appropriate, and their statement as to whether they have a reasonable expectation that the Group will be able to continue in operation and meet its liabilities as they fall due over the period of their assessment, including any related disclosures drawing attention to any necessary qualifications or assumptions.
We have nothing to report having performed a review of the Directors’ statement that they have carried out a robust assessment of the principal risks facing the Group and statement in relation to the longer-term viability of the Group. Our review was substantially less in scope than an audit and only consisted of making inquiries and considering the Directors’ process supporting their statements; checking that the statements are in alignment with the relevant provisions of the UK Corporate Governance Code (the “Code”); and considering whether the statements are consistent with the knowledge and understanding of the Group and Company and their environment obtained in the course of the audit. (Listing Rules)
Other Code Provisions We have nothing to report in respect of our responsibility to report when:
— The statement given by the Directors, on page 96, that they consider the Annual Report taken as a whole to be fair, balanced and understandable, and provides the information necessary for the members to assess the Group’s and Company’s position and performance, business model and strategy is materially inconsistent with our knowledge of the Group and Company obtained in the course of performing our audit.
— The section of the Annual Report on pages 71 to 75 describing the work of the Audit Committee does not appropriately address matters communicated by us to the Audit Committee.
— The Directors’ statement relating to the Company’s compliance with the Code does not properly disclose a departure from a relevant provision of the Code specified, under the Listing Rules, for review by the auditors.
Directors’ Remuneration In our opinion, the part of the Directors’ Remuneration Report to be audited has been properly prepared in accordance with the Companies Act 2006. (CA06)
Strategic reportFin
ancial statem
ents
Other in
formation
Govern
ance
103intu properties plc Annual report 2018

Independent auditors’ report to the members of intu properties plc continued
104 intu properties plc Annual report 2018
Responsibilities for the financial statements and the audit Responsibilities of the Directors for the financial statements As explained more fully in the Statement of Directors’ responsibilities set out on page 96, the Directors are responsible for the preparation of the financial statements in accordance with the applicable framework and for being satisfied that they give a true and fair view. The Directors are also responsible for such internal control as they determine is necessary to enable the preparation of financial statements that are free from material misstatement, whether due to fraud or error.
In preparing the financial statements, the Directors are responsible for assessing the Group’s and the Company’s ability to continue as a going concern, disclosing as applicable matters related to going concern and using the going concern basis of accounting unless the Directors either intend to liquidate the Group or the Company or to cease operations, or have no realistic alternative but to do so.
Auditors’ responsibilities for the audit of the financial statements Our objectives are to obtain reasonable assurance about whether the financial statements as a whole are free from material misstatement, whether due to fraud or error, and to issue an auditors’ report that includes our opinion. Reasonable assurance is a high level of assurance, but is not a guarantee that an audit conducted in accordance with ISAs (UK) will always detect a material misstatement when it exists. Misstatements can arise from fraud or error and are considered material if, individually or in the aggregate, they could reasonably be expected to influence the economic decisions of users taken on the basis of these financial statements.
A further description of our responsibilities for the audit of the financial statements is located on the FRC’s website at: www.frc.org.uk/auditorsresponsibilities. This description forms part of our auditors’ report.
Use of this report This report, including the opinions, has been prepared for and only for the Company’s members as a body in accordance with Chapter 3 of Part 16 of the Companies Act 2006 and for no other purpose. We do not, in giving these opinions, accept or assume responsibility for any other purpose or to any other person to whom this report is shown or into whose hands it may come save where expressly agreed by our prior consent in writing.
Other required reporting Companies Act 2006 exception reporting Under the Companies Act 2006 we are required to report to you if, in our opinion:
— we have not received all the information and explanations we require for our audit; or
— adequate accounting records have not been kept by the Company, or returns adequate for our audit have not been received from branches not visited by us; or
— certain disclosures of Directors’ remuneration specified by law are not made; or
— the Company financial statements and the part of the Directors’ remuneration report to be audited are not in agreement with the accounting records and returns.
We have no exceptions to report arising from this responsibility.
Appointment On its formation, we were appointed as auditors of Liberty International plc (the Company’s predecessor) for the year ended 31 December 1999 and subsequent financial periods. Our predecessor firm were auditors of the pre-existing Group, prior to group restructurings and renamings, for the period ended 31 December 1980 and subsequent financial periods. Considering this, the period of total uninterrupted engagement with the Group is at least 38 years, covering the period ended 31 December 1980 to the year ended 31 December 2018.
Mark Pugh (Senior Statutory Auditor)
For and on behalf of PricewaterhouseCoopers LLP Chartered Accountants and Statutory Auditors London 20 February 2019
Financial statements
104 intu properties plc Annual report 2018

Consolidated income statement for the year ended 31 December 2018
intu properties plc Annual report 2018 105
Financial statements
Notes 2018
£m 2017
£m
Revenue 3 581.1 616.0
Net rental income 3 398.5 423.4
Net other income 5.3 3.0
Revaluation of investment and development property 14 (1,332.8) 30.8
Loss on disposal of subsidiaries 4 (8.5) (1.8)
Gain on sale of investment and development property 1.4 –
Administration expenses – ongoing (42.9) (40.9)
Administration expenses – exceptional 5 (13.1) (5.9)
Operating (loss)/profit 6 (992.1) 408.6
Finance costs 9 (210.8) (213.9)
Finance income 9 14.8 12.6
Other finance costs 9 (38.8) (38.9)
Change in fair value of financial instruments 9 87.3 22.0
Net finance costs 9 (147.5) (218.2)
(Loss)/profit before tax, joint ventures and associates (1,139.6) 190.4
Share of post-tax (loss)/profit of joint ventures 16 (42.1) 35.5
Share of post-tax profit of associates 18 2.3 1.3
(Loss)/profit before tax (1,179.4) 227.2
Current tax 10 (0.1) 0.1
Deferred tax 10 5.8 (24.0)
Taxation 10 5.7 (23.9)
(Loss)/profit for the year (1,173.7) 203.3
Attributable to:
Owners of intu properties plc (1,132.2) 216.7
Non-controlling interests (41.5) (13.4)
(1,173.7) 203.3
Basic (loss)/earnings per share 12 (84.3)p 16.1p
Diluted (loss)/earnings per share 12 (84.3)p 15.0p
Details of underlying earnings are presented in the underlying profit statement on page 169. Underlying earnings per share is shown in note 12(b).
Strategic reportFin
ancial statem
ents
Other in
formation
Govern
ance
105intu properties plc Annual report 2018

Consolidated statement of comprehensive income for the year ended 31 December 2018
106 intu properties plc Annual report 2018
Notes 2018
£m 2017
£m
(Loss)/profit for the year (1,173.7) 203.3
Other comprehensive income
Items that may be reclassified subsequently to the income statement:
Exchange differences 4.1 16.9
Total items that may be reclassified subsequently to the income statement 4.1 16.9
Items that will not be reclassified subsequently to the income statement:
Revaluation of other investments 19 (6.4) (0.2)
Change in fair value of financial instruments 26 43.4 –
Tax relating to components of other comprehensive income 10 – 0.1
Total items that will not be reclassified subsequently to the income statement 37.0 (0.1)
Other comprehensive income for the year 41.1 16.8
Total comprehensive (loss)/income for the year (1,132.6) 220.1
Attributable to:
Owners of intu properties plc (1,091.1) 233.5
Non-controlling interests (41.5) (13.4)
(1,132.6) 220.1
Financial statements
106 intu properties plc Annual report 2018

Balance sheets at 31 December 2018
intu properties plc Annual report 2018 107
Financial statements
Notes
Group 2018
£m
Group 2017
£m
Company 2018
£m
Company 2017
£m
Non-current assets Investment and development property 14 8,021.8 9,179.4 – – Plant and equipment 11.8 12.2 9.3 10.4 Investment in Group companies 15 – – 2,719.1 2,892.3 Investment in joint ventures 16 823.9 735.5 – –
Investment in associates 18 65.6 64.8 – – Other investments 19 10.5 16.8 – – Goodwill 4.0 4.0 – – Derivative financial instruments 22 4.3 0.3 – – Trade and other receivables 20 105.5 102.5 – –
9,047.4 10,115.5 2,728.4 2,902.7
Current assets Assets classified as held for sale 35 – 309.1 – – Derivative financial instruments 22 0.4 – – – Trade and other receivables 20 155.2 141.9 727.4 980.2 Cash and cash equivalents 21 239.5 228.0 0.4 0.8
395.1 679.0 727.8 981.0
Total assets 9,442.5 10,794.5 3,456.2 3,883.7
Current liabilities Liabilities associated with assets classified as held for sale 35 – (6.2) – – Trade and other payables 23 (278.4) (288.5) (387.9) (573.7) Current tax liabilities – (0.1) – – Borrowings 24 (51.1) (186.7) – –
Derivative financial instruments 22 (39.0) (8.0) – (4.9) (368.5) (489.5) (387.9) (578.6)
Non-current liabilities Borrowings 24 (4,984.2) (4,811.1) (393.9) (233.8) Derivative financial instruments 22 (246.2) (339.8) (4.6) (28.3) Deferred tax liabilities 29 (18.0) (23.7) – – Other payables (1.2) (1.2) – –
(5,249.6) (5,175.8) (398.5) (262.1)
Total liabilities (5,618.1) (5,665.3) (786.4) (840.7)
Net assets 3,824.4 5,129.2 2,669.8 3,043.0
Equity
Share capital 30 677.5 677.5 677.5 677.5 Share premium 30 1,327.4 1,327.4 1,327.4 1,327.4 ESOP shares 31 (37.0) (39.1) (37.0) (39.1) Other reserves 32 402.2 361.1 61.4 61.4 Retained earnings 1,441.6 2,748.1 640.5 1,015.8
Attributable to owners of intu properties plc 3,811.7 5,075.0 2,669.8 3,043.0 Non-controlling interests 12.7 54.2 – –
Total equity 3,824.4 5,129.2 2,669.8 3,043.0
A loss of £187.0 million is recorded in the financial statements of the Company in respect of the year (2017: profit of £36.3 million). No income statement or statement of comprehensive income is presented for the Company as permitted by Section 408 of the Companies Act 2006.
These consolidated financial statements have been approved for issue by the Board of Directors on 20 February 2019.
David Fischel Matthew Roberts Chief Executive Chief Financial Officer
The notes on pages 111 to 159 form part of these consolidated financial statements.
Strategic reportFin
ancial statem
ents
Other in
formation
Govern
ance
107intu properties plc Annual report 2018

Statements of changes in equity for the year ended 31 December 2018
108 intu properties plc Annual report 2018
Attributable to owners of intu properties plc
Group
Share capital
£m
Share premium
£m
ESOP shares
£m
Other reserves
£m
Retained earnings
£m Total
£m
Non- controlling
interests £m
Total equity
£m
At 1 January 2018 677.5 1,327.4 (39.1) 361.1 2,748.1 5,075.0 54.2 5,129.2
Adjustment on adoption of new accounting standard (note 1) – – – – 14.0 14.0 – 14.0
Adjusted 1 January 2018 677.5 1,327.4 (39.1) 361.1 2,762.1 5,089.0 54.2 5,143.2
Loss for the year – – – – (1,132.2) (1,132.2) (41.5) (1,173.7)
Other comprehensive income:
Revaluation of other investments (note 19) – – – (6.4) – (6.4) – (6.4)
Change in fair value of financial instruments (note 26) – – – 43.4 – 43.4 – 43.4
Exchange differences – – – 4.1 – 4.1 – 4.1
Total comprehensive loss for the year – – – 41.1 (1,132.2) (1,091.1) (41.5) (1,132.6)
Dividends (note 11) – – – – (188.1) (188.1) – (188.1)
Share-based payments (note 40) – – – – 2.8 2.8 – 2.8
Acquisition of ESOP shares – – (0.9) – – (0.9) – (0.9)
Disposal of ESOP shares – – 3.0 – (3.0) – – –
– – 2.1 – (188.3) (186.2) – (186.2)
At 31 December 2018 677.5 1,327.4 (37.0) 402.2 1,441.6 3,811.7 12.7 3,824.4
Attributable to owners of intu properties plc
Group
Share capital
£m
Share premium
£m
ESOP shares
£m
Other reserves
£m
Retained earnings
£m Total
£m
Non- controlling
interests £m
Total equity
£m
At 1 January 2017 677.5 1,327.4 (40.8) 344.3 2,670.4 4,978.8 67.6 5,046.4
Profit/(loss) for the year – – – – 216.7 216.7 (13.4) 203.3
Other comprehensive income:
Revaluation of other investments (note 19) – – – (0.2) – (0.2) – (0.2)
Exchange differences – – – 16.9 – 16.9 – 16.9
Tax relating to components of other comprehensive income (note 10) – – – 0.1 – 0.1 – 0.1
Total comprehensive income for the year – – – 16.8 216.7 233.5 (13.4) 220.1
Dividends (note 11) – – – – (187.9) (187.9) – (187.9)
Share-based payments (note 40) – – – – 2.3 2.3 – 2.3
Other share related transaction (note 40) – – – – 49.4 49.4 – 49.4
Acquisition of ESOP shares – – (1.3) – – (1.3) – (1.3)
Disposal of ESOP shares – – 3.0 – (2.8) 0.2 – 0.2
– – 1.7 – (139.0) (137.3) – (137.3)
At 31 December 2017 677.5 1,327.4 (39.1) 361.1 2,748.1 5,075.0 54.2 5,129.2
Financial statements
108 intu properties plc Annual report 2018

intu properties plc Annual report 2018 109
Financial statements
Attributable to owners of intu properties plc
Company
Share capital
£m
Share premium
£m
ESOP shares
£m
Other reserves
£m
Retained earnings
£m
Total equity
£m
At 1 January 2018 677.5 1,327.4 (39.1) 61.4 1,015.8 3,043.0
Loss for the year – – – – (187.0) (187.0)
Total comprehensive loss for the year – – – – (187.0) (187.0)
Dividends (note 11) – – – – (188.1) (188.1)
Share-based payments (note 40) – – – – 2.8 2.8
Acquisition of ESOP shares – – (0.9) – – (0.9)
Disposal of ESOP shares – – 3.0 – (3.0) –
– – 2.1 – (188.3) (186.2)
At 31 December 2018 677.5 1,327.4 (37.0) 61.4 640.5 2,669.8
Attributable to owners of intu properties plc
Company
Share capital
£m
Share premium
£m
ESOP shares
£m
Other reserves
£m
Retained earnings
£m
Total equity
£m
At 1 January 2017 677.5 1,327.4 (40.8) 61.4 1,167.9 3,193.4
Profit for the year – – – – 36.3 36.3
Total comprehensive income for the year – – – – 36.3 36.3
Dividends (note 11) – – – – (187.9) (187.9)
Share-based payments (note 40) – – – – 2.3 2.3
Acquisition of ESOP shares – – (1.3) – – (1.3)
Disposal of ESOP shares – – 3.0 – (2.8) 0.2
– – 1.7 – (188.4) (186.7)
At 31 December 2017 677.5 1,327.4 (39.1) 61.4 1,015.8 3,043.0
Strategic reportFin
ancial statem
ents
Other in
formation
Govern
ance
109intu properties plc Annual report 2018

Statements of cash flows for the year ended 31 December 2018
110 intu properties plc Annual report 2018
Notes
Group 2018
£m
Group 2017
£m
Company 2018
£m
Company 2017
£m
Cash generated from operations 37 319.7 365.6 43.8 2.2
Interest paid (236.1) (232.4) (20.5) (22.8)
Interest received 19.3 7.6 8.7 –
Taxation (0.3) 0.1 – –
Cash flows from operating activities 102.6 140.9 32.0 (20.6)
Cash flows from investing activities
Purchase and development of property, plant and equipment (193.5) (189.5) (2.9) (6.9)
Sale of investment and development property 24.4 3.7 – –
Acquisition of businesses net of cash acquired 33 – (446.7) – –
Cash transferred to assets classified as held for sale 35 – (0.5) – –
Additions to other investments 19 (0.1) (1.5) – –
Additions to investment in subsidiaries 15 – – – (4.4)
Disposal of subsidiaries net of cash sold 34 143.2 104.1 – –
Investment of capital in joint ventures 16 (7.7) (0.7) – –
Repayment of capital in joint ventures 16 7.1 – – –
Loan advances to joint ventures 16 (2.0) (3.0) – –
Loan repayments by joint ventures 16 25.3 14.8 – –
Distributions from joint ventures 16 2.9 1.2 – –
Cash flows from investing activities (0.4) (518.1) (2.9) (11.3)
Cash flows from financing activities
Acquisition of ESOP shares (0.9) (1.3) (0.9) (1.3)
Sale of ESOP shares – 0.2 – 0.2
Cash transferred from restricted accounts 1.8 0.1 – –
Borrowings drawn 302.0 1,199.2 159.0 220.9
Borrowings repaid (204.3) (660.0) – –
Equity dividends paid (187.6) (188.0) (187.6) (188.0)
Cash flows from financing activities (89.0) 350.2 (29.5) 31.8
Effects of exchange rate changes on cash and cash equivalents 0.1 0.4 – –
Net increase/(decrease) in cash and cash equivalents 13.3 (26.6) (0.4) (0.1)
Cash and cash equivalents at 1 January 21 225.1 251.7 0.8 0.9
Cash and cash equivalents at 31 December 21 238.4 225.1 0.4 0.8
Financial statements
110 intu properties plc Annual report 2018

Notes to the financial statements
intu properties plc Annual report 2018 111
Financial statements
1 Accounting convention and basis of preparation These consolidated financial statements have been prepared in accordance with International Financial Reporting Standards as adopted by the European Union (IFRS), interpretations issued by the International Financial Reporting Standards Interpretations Committee and with those parts of the Companies Act 2006 applicable to companies reporting under IFRS.
These consolidated financial statements have been prepared under the historical cost convention as modified by investment and development property, derivative financial instruments and certain other assets and liabilities that have been measured at fair value. A summary of the significant accounting policies applied is set out in note 2.
These accounting policies are consistent with those applied in the last annual financial statements, as amended when relevant to reflect the adoption of new standards, amendments and interpretations which became effective in the year. Except as described below, these changes have not had an impact on the financial statements.
This is the Group’s first set of annual financial statements where IFRS 9 Financial Instruments and IFRS 15 Revenue from Contracts with Customers have been applied. The impacts on the financial statements on adoption of these standards are set out below. Significant accounting policies in respect of these standards are provided in note 2.
IFRS 9 Financial Instruments – the standard applies to classification and measurement of financial assets and financial liabilities, impairment provisioning and hedge accounting. The most significant presentation changes to the Group on adoption are as follows:
— financial instruments designated as at fair value through profit or loss (e.g. convertible bonds) – changes in fair value related to own credit risk will now be recognised in other comprehensive income, as opposed to the income statement under the previous standard
— modifications to financial liabilities (e.g. borrowings) – a one off gain or loss will now be recognised in the income statement at the date of modification, as opposed to recognising the gain or loss over the modified term of the financial liability
— other investments – an irrevocable election has been made to recognise movements in other investments through other comprehensive income, consistent with the accounting treatment under the previous standard
On adoption, the Group has made an opening adjustment to retained earnings of £14.0 million, with the 2017 comparative period not restated. The adoption of the standard has not had any other material impact on the financial statements.
IFRS 15 Revenue from Contracts with Customers – the standard is applicable to service charge income and facilities management income but excludes lease rental income arising from contracts with the Group’s tenants. The adoption of this standard has not had a material impact on the financial statements.
A number of standards and amendments to standards have been issued but are not yet effective for the current year. The most significant of these is set out below:
IFRS 16 Leases (effective 1 January 2019) – this standard requires lessees to recognise a right-of-use asset representing its right to use the underlying asset and a lease liability representing its obligation to make lease payments. Depreciation on the right-of-use asset and finance costs on the lease liability will be recognised in the income statement. This standard does not affect the current accounting for rental income earned. The Group has completed its impact assessment of the standard, where the most significant operating leases identified are the Group’s London and Madrid office leases. On adoption, the Group expects to apply the modified retrospective approach and will elect to not re-assess existing leases under the new standard. The Group expects to recognise a right-of-use asset and corresponding lease liability on its balance sheet of less than £5 million on adoption, alongside amendments to related disclosures.
Significant estimates and judgements The preparation of financial statements in conformity with the Group’s accounting policies requires management to make judgements and use estimates that affect the reported amounts of assets and liabilities at the date of the financial statements and the reported amounts of income and expenses during the reporting period. Although these judgements and estimates are based on management’s best knowledge of the amount, event or action, the actual result ultimately may differ from those judgements and estimates.
– significant use of estimates and assumptions Valuation of investment and development property – see investment and development property accounting policy in note 2 as well as note 14 for details on estimates and assumptions used in the valuation process and sensitivities.
Valuation of derivative financial instruments – see derivative financial instruments accounting policy in note 2 as well as note 28 for details on sensitivities of estimates and assumptions used.
– significant areas of judgement Accounting for acquisitions – management uses significant judgement to determine whether an acquisition of property should be accounted for as an asset acquisition or a business combination. See business combinations accounting policy in note 2 as well as further detail on judgements made in note 33.
Assessing control over joint arrangements – management uses significant judgement to assess control of joint arrangements (e.g. part disposals of subsidiaries). See basis of consolidation in note 2 as well as further detail on judgements made in note 34.
Non-current assets and disposal groups held for sale – management uses significant judgement to determine whether an asset in the process of being disposed of (including part disposals) should be classified as an asset held for sale. See assets held for sale accounting policy in note 2 as well as further detail on judgements made in note 35.
Strategic reportFin
ancial statem
ents
Other in
formation
Govern
ance
111intu properties plc Annual report 2018

Notes to the financial statements continued
112 intu properties plc Annual report 2018
1 Accounting convention and basis of preparation (continued) Going concern The Group’s business activities, together with the factors likely to affect its future development, performance and position are set out in the strategic report on pages 1 to 59. The financial position of the Group, its cash flows, liquidity position and borrowing facilities are described in the financial review on pages 48 to 53. In addition, note 28 includes the Group’s risk management objectives, details of its financial instruments and hedging activities, its exposure to liquidity risk and details of its capital structure.
The Group prepares regular forecasts and projections which include sensitivity analysis taking into account a number of downside risks to the forecast including reasonably possible changes in trading performance and asset values and assesses the potential impact of these on the Group’s liquidity position and available resources.
In preparing the most recent projections, factors taken into account include £274.3 million of cash (including the Group’s share of cash in joint ventures of £34.8 million) and £274.2 million of undrawn facilities at 31 December 2018. The Group’s weighted average debt maturity of 5.8 years and the relatively long-term and stable nature of the cash flows receivable under tenant leases were also factored into the forecasts.
After reviewing the most recent projections and the sensitivity analysis, the Directors consider it appropriate to continue to adopt the going concern basis of accounting in preparing the Group’s financial statements.
2 Accounting policies – Group and Company Basis of consolidation The consolidated financial information includes the Company and its subsidiaries and their interests in joint arrangements and associates.
All intra-group transactions, balances and unrealised gains on transactions between Group companies are eliminated on consolidation.
– subsidiaries A subsidiary is an entity which the Company controls. Control exists when the Company is exposed, or has rights, to variable returns from its involvement with the entity and has the ability to affect those returns through its power over the investee. Subsidiaries are fully consolidated from the date on which control is transferred to the Group and are de-consolidated from the date that control ceases.
The Company’s investment in Group companies is carried at cost less accumulated impairment losses.
– joint arrangements A joint arrangement is an arrangement over which two or more parties have joint control. Joint control is the contractually agreed sharing of control of an arrangement where decisions about the relevant activities require the unanimous consent of the parties sharing joint control.
A joint operation is a joint arrangement where the parties that have joint control of the arrangement have rights to the assets, and obligations for the liabilities, relating to the arrangement.
The Group’s interest in a joint operation is accounted for by consolidating the Group’s share of the assets, liabilities, income and expenses on a line-by-line basis.
A joint venture is a joint arrangement where the parties that have joint control of the arrangement have rights to the net assets of the arrangement.
The Group’s interest in a joint venture is accounted for using the equity method as described below.
– associates An associate is an entity over which the Company, either directly or indirectly, is in a position to exercise significant influence. Significant influence is the power to participate in the financial and operating policies of the entity but is not control or joint control of those policies.
The Group’s interest in an associate is accounted for using the equity method as described below.
– the equity method Under the equity method of accounting, interests in joint ventures and associates are initially recognised at cost and adjusted thereafter to recognise the Group’s share of the post-acquisition profits or losses and movements in other comprehensive income.
Loan balances relating to long-term funding from Group companies to joint ventures and associates are presented on the face of the balance sheet as part of the investment.
– non-controlling interest A non-controlling interest is the equity in a subsidiary not attributable, directly or indirectly, to the Company. Non-controlling interests are presented within equity, separately from the amounts attributable to owners of the Company. Profit or loss and each component of other comprehensive income is attributed to owners of the Company and to non-controlling interests in the appropriate proportions.
Foreign currencies Items included in the financial statements of each of the Group’s entities are measured using the currency of the primary economic environment in which it operates. The consolidated financial statements are presented in pounds sterling, which is the Group’s presentational currency.
The assets and liabilities of foreign entities are translated into pounds sterling at the rate of exchange ruling at the reporting date and their income statement and cash flows are translated at the average rate for the period. Exchange differences arising are recorded in other comprehensive income.
At entity level, transactions in currencies other than an entity’s functional currency are recorded at the exchange rate prevailing at the transaction dates. Foreign exchange gains and losses resulting from settlement of these transactions and from retranslation of monetary assets and liabilities denominated in foreign currencies are recognised in the income statement except if they relate to hedging of net investments in a foreign operation or for loans to foreign subsidiary entities considered to be part of the net investment in those entities, in which case these amounts are recorded in other comprehensive income.
Financial statements
112 intu properties plc Annual report 2018

intu properties plc Annual report 2018 113
Financial statements
2 Accounting policies – Group and Company (continued) Revenue Revenue comprises rental income receivable, service charge income and facilities management income.
Rental income receivable is recognised on a straight-line basis over the term of the lease. Directly attributable lease incentives (e.g. rent-free periods or cash contributions for tenant fit out) are recognised within rental income on the same basis as the underlying rental income received.
Contingent rents, being those lease payments that are not fixed at the inception of a lease, the most significant being rents linked to tenant revenues or increases arising on rent reviews, are recorded as income in the periods in which they are earned. In respect of rents linked to tenant revenues, where information is not available, management uses estimates based on knowledge of the tenant and past data. Rent reviews are recognised as income from the date of the rent review, based on management’s estimates. Estimates are derived from knowledge of market rents for comparable properties determined on an individual property basis and updated for progress of negotiations.
Service charge income and management fee income are recognised on an accruals basis in line with the performance obligations being satisfied.
Exceptional items Exceptional items are those items that in the Directors’ view are required to be separately disclosed by virtue of their size, nature or incidence. Underlying earnings is considered to be a key measure in understanding the Group’s financial performance and excludes exceptional items. Underlying earnings are explained further in the financial review on page 48 and reconciled to the (loss)/profit attributable to owners of intu properties plc in note 12(b).
Employee benefits – Share-based payments The cost of granting share awards is recognised through the income statement with reference to the fair value of the equity instrument, assessed at the date of grant. This cost is charged to the income statement over the vesting period of the awards. All awards are accounted for as equity settled with the credit entry being taken directly to equity. For awards with non-market related criteria, the charge is reversed if it is expected that the performance criteria will not be met.
For share awards an option pricing model is used applying assumptions around expected yields, forfeiture rates, exercise price and volatility. Where the share awards have non-market related performance criteria the Group has used the Black-Scholes option valuation model to establish the relevant fair values. Where the share awards have market-related performance criteria the Group has used the Monte Carlo simulation valuation model to establish the relevant fair values.
– Pensions The costs of defined contribution schemes and contributions to personal plans are charged to the income statement in the year in which they are incurred.
Taxation Current tax is the expected tax payable on the taxable income for the year and any adjustment in respect of prior years. It is calculated using rates applicable at the balance sheet date.
Deferred tax is provided for temporary differences between the carrying amounts of assets and liabilities in the balance sheet and the amounts used for tax purposes. Deferred tax is determined using tax rates that have been enacted or substantively enacted by the reporting date and are expected to apply when the asset is realised, or the liability settled.
Temporary differences are not provided on: goodwill not deductible for tax purposes, the initial recognition of assets or liabilities that affect neither accounting nor taxable profit, and differences relating to investments in subsidiaries to the extent that they will not reverse in the foreseeable future.
Deferred tax assets are recognised only to the extent that management believe it is probable that future taxable profit will be available against which the temporary differences can be utilised.
Tax is included in the income statement except when it relates to items recognised directly in other comprehensive income or equity, in which case the related tax is also recognised directly in other comprehensive income or equity.
Investment and development property Investment and development property is owned or leased by the Group and held for long-term rental income and capital appreciation.
The Group has elected to use the fair value model. Properties are initially recognised at cost and subsequently revalued at the balance sheet date to fair value as determined by professionally qualified external valuers on the basis of market value with the exception of certain development land where an assessment of fair value may be made internally. External valuations are received for significant development land once required planning permissions are obtained. Valuations conform with the Royal Institution of Chartered Surveyors (RICS) Valuation – Global Standards 2017.
The main estimates and assumptions underlying the valuations are described in note 14.
Properties held under leases are stated gross of the recognised finance lease liability.
Strategic reportFin
ancial statem
ents
Other in
formation
Govern
ance
113intu properties plc Annual report 2018

Notes to the financial statements continued
114 intu properties plc Annual report 2018
2 Accounting policies – Group and Company (continued) Investment and development property (continued) The cost of investment and development property includes capitalised interest and other directly attributable outgoings incurred during development. Interest is capitalised on the basis of the average interest rate on the relevant debt outstanding. Interest ceases to be capitalised on the date of practical completion.
Gains or losses arising from changes in the fair value of investment and development property are recognised in the income statement.
Depreciation is not provided in respect of investment and development property.
Gains or losses arising on the sale of investment and development property are recognised when the significant risks and rewards of ownership have been transferred to the buyer. The gain or loss recognised is the proceeds received less the carrying value of the property and costs directly associated with the sale.
Leases Leases are classified as a finance or operating lease according to the substance of the transaction. A lease that transfers substantially all the risks and rewards of ownership to the lessee is classified as a finance lease. All other leases are normally classified as operating leases.
– Group as lessee Leases of investment property are accounted for as finance leases and recognised as an asset and an obligation to pay future minimum lease payments. The investment property asset is included in the balance sheet at fair value, gross of the recognised finance lease liability. Contingent rents are recognised as they accrue.
Other finance lease assets are capitalised at the lower of the fair value of the leased asset or the present value of the minimum lease payments and depreciated over the shorter of the lease term and the useful life of the asset.
Lease payments are allocated between the liability and finance charges so as to achieve a constant financing rate.
Rentals payable under operating leases are charged to the income statement on a straight-line basis over the lease term.
– Group as lessor Investment properties are leased to tenants under operating leases, with rental income being recognised on a straight-line basis over the lease term. For more detail see the revenue accounting policy.
Plant and equipment Plant and equipment consists of vehicles, fixtures, fittings and other equipment. Plant and equipment is stated at cost less accumulated depreciation and any accumulated impairment losses.
Depreciation is charged to the income statement on a straight-line basis over an asset’s estimated useful life up to a maximum of five years.
Goodwill Goodwill arising on business combinations is carried at cost less accumulated impairment losses. Goodwill is assessed for impairment on an annual basis.
Impairment of assets The Group’s assets are reviewed at each balance sheet date to determine whether events or changes in circumstances exist that indicate that their carrying amount may not be recoverable. If such an indication exists, the asset’s recoverable amount is estimated. The recoverable amount is the higher of an asset’s fair value less costs to sell and its value in use. An impairment loss is recognised in the income statement for the amount by which the asset’s carrying amount exceeds its recoverable amount. For the purposes of assessing impairment, assets are grouped at the lowest levels for which there are separately identifiable cash flows.
At each balance sheet date the Group reviews whether there is any indication that an impairment loss recognised in previous periods may have decreased. If such an indication exists the asset’s recoverable amount is estimated. An impairment loss recognised in prior periods is reversed if, and only if, there has been a change in the estimates used to determine the asset’s recoverable amount. In this case the asset’s carrying amount is increased to its recoverable amount but not exceeding the carrying amount that would have been determined had no impairment loss been recognised. The reversal of an impairment loss is recognised in the income statement. No impairment reversals are permitted to be recognised on goodwill.
For financial assets within the scope of IFRS 9 Financial Instruments, the Group applies the expected credit loss model. See note 28 credit risk section for further details.
Other investments Investments in equity instruments intended to be held for an indefinite period are initially and subsequently measured at fair value. For listed investments, fair value is the current bid market value at the reporting date. For unlisted investments where there is no active market, fair value is assessed using an appropriate methodology.
The Group has elected to include gains or losses arising from changes in fair value of equity instruments in other comprehensive income.
Trade receivables Trade receivables are recognised initially at their transaction price and subsequently measured at amortised cost less loss allowance.
When applying a loss allowance, the Directors exercise judgement as to the collectability of trade receivables and determine if it is appropriate to impair these assets. Factors such as days past due, credit status of the counterparty and historical evidence of collection are considered.
Financial statements
114 intu properties plc Annual report 2018
intu properties plc Annual report 2018 115
Financial statements
2 Accounting policies – Group and Company (continued) Cash and cash equivalents Cash and cash equivalents comprise cash in hand, deposits with banks, whether restricted or unrestricted, and other short-term liquid investments with original maturities of three months or less.
Trade payables Trade payables are recognised initially at fair value and subsequently measured at amortised cost.
Borrowings Borrowings are recognised initially at their net proceeds on issue and subsequently carried at amortised cost with any transaction costs, premiums or discounts recognised over the contractual life in the income statement using the effective interest method. This excludes certain financial instruments such as convertible bonds as detailed in note 26.
In the event of early repayment, all unamortised transaction costs are recognised immediately in the income statement.
Convertible bonds Convertible bonds are assessed on issue, as to whether they should be classified as a financial liability, as equity or as a compound financial instrument with both debt and equity components. This assessment is based on the terms of the bond and in accordance with IAS 32 Financial Instruments Presentation. Each bond is assessed separately and the detailed accounting treatment is given in note 26.
Derivative financial instruments The Group uses derivative financial instruments to manage exposure to interest rate risk. They are initially recognised on the trade date at fair value and subsequently re-measured at fair value. In assessing fair value the Group uses its judgement to select suitable valuation techniques and make assumptions which are mainly based on market conditions existing at the balance sheet date. The fair value of interest rate swaps is calculated by discounting estimated future cash flows based on the terms and maturity of each contract and using market interest rates for similar instruments at the measurement date. These values are tested for reasonableness based upon broker or counterparty quotes.
Amounts paid under interest rate swaps, both on obligations as they fall due and on early settlement, are recognised in the income statement as finance costs. Fair value movements on revaluation of derivative financial instruments are shown in the income statement through changes in fair value of financial instruments.
The Group does not currently apply hedge accounting to its interest rate swaps.
Share capital Ordinary shares are classified as equity. Incremental costs directly attributable to the issue of new ordinary shares are shown in equity as a deduction, net of tax, from the proceeds.
Dividends Dividends are recognised when they become legally payable. In the case of interim dividends to owners, this is the date of payment. In the case of final dividends, this is when declared by shareholders at the annual general meeting.
ESOP shares Investments held in the Company’s own shares in connection with employee share plans and other share-based payment arrangements are deducted from equity at cost. Where such shares are subsequently sold, any consideration received is recognised directly in equity.
Current/non-current classification Current assets include assets held primarily for trading purposes, cash and cash equivalents, and assets expected to be realised in, or intended for sale or consumption within one year of the reporting date. All other assets are classified as non-current assets.
Current liabilities include liabilities held primarily for trading purposes, associated with assets held for sale and expected to be settled within one year of the reporting date. All other liabilities are classified as non-current liabilities.
Business combinations Business combinations are accounted for in accordance with IFRS 3 Business Combinations using the acquisition method of accounting. The consideration for the acquisition of a subsidiary is the total of the fair values of the assets transferred, the liabilities incurred and the equity interests issued by the Group. The consideration includes the fair value of any asset or liability resulting from a contingent consideration arrangement. Costs associated with the acquisition are expensed as incurred. Identifiable assets and liabilities assumed in a business combination are measured initially at their fair values at the acquisition date.
Goodwill arising on an acquisition is the excess of the consideration over the fair value of the identifiable assets and liabilities acquired. Where the fair value of the identifiable assets and liabilities acquired exceeds the consideration this difference is recognised in the income statement at the date of the acquisition.
Non-current assets and disposal groups held for sale Non-current assets and corresponding disposal groups are classified as held for sale when their carrying amount is to be recovered principally through a sale which is considered highly probable. They are stated at the lower of carrying amount and fair value less costs to sell. Assets and liabilities are separately grouped and presented on single lines in the balance sheet.
Strategic reportFin
ancial statem
ents
Other in
formation
Govern
ance
115intu properties plc Annual report 2018

Notes to the financial statements continued
116 intu properties plc Annual report 2018
3 Segmental reporting Operating segments are determined based on the strategic and operational management of the Group. The Group is primarily a shopping centre-focused business and has two reportable operating segments being the UK and Spain. Although certain areas of business performance are reviewed and monitored on a centre-by-centre basis, the operating segments are consistent with the strategic and operational management of the Group by the Executive Committee (the chief operating decision makers of the Group).
As mentioned in the financial review, management review and monitor the business primarily on a proportionately consolidated basis. As such, the segmental analysis has been prepared on a proportionately consolidated basis.
The key driver of underlying earnings which is used to measure performance is net rental income. An analysis of net rental income is provided below:
2018
Group including share of joint ventures Less share of
joint ventures £m
UK £m
Spain £m
Total £m
Group total £m
Rent receivable 494.6 33.4 528.0 (60.7) 467.3 Service charge income 113.2 7.3 120.5 (13.5) 107.0 Facilities management income from joint ventures 4.5 – 4.5 2.3 6.8
Revenue 612.3 40.7 653.0 (71.9) 581.1 Rent payable (14.6) – (14.6) 1.1 (13.5) Service charge costs (131.0) (8.0) (139.0) 15.0 (124.0) Facilities management costs recharged to joint ventures (4.5) – (4.5) (2.3) (6.8) Other non-recoverable costs (40.0) (4.4) (44.4) 6.1 (38.3)
Net rental income 422.2 28.3 450.5 (52.0) 398.5
(Loss)/profit for the year (1,175.1) 1.9 (1,173.2) (0.5)1 (1,173.7)
2017
Group including share of joint ventures Less share of
joint ventures £m
UK £m
Spain £m
Total £m
Group total £m
Rent receivable 513.5 32.7 546.2 (42.8) 503.4
Service charge income 109.7 8.1 117.8 (8.7) 109.1
Facilities management income from joint ventures 2.8 – 2.8 0.7 3.5
Revenue 626.0 40.8 666.8 (50.8) 616.0
Rent payable (20.5) – (20.5) 1.0 (19.5)
Service charge costs (128.1) (8.8) (136.9) 9.6 (127.3)
Facilities management costs recharged to joint ventures (2.8) – (2.8) (0.7) (3.5)
Other non-recoverable costs (43.4) (3.2) (46.6) 4.3 (42.3)
Net rental income 431.2 28.8 460.0 (36.6) 423.4
Profit for the year 140.4 63.5 203.9 (0.6)1 203.3
1 Relates to profit attributable to non-controlling interests within the Group’s investment in joint ventures.
There were no significant transactions within net rental income between operating segments.
Financial statements
116 intu properties plc Annual report 2018
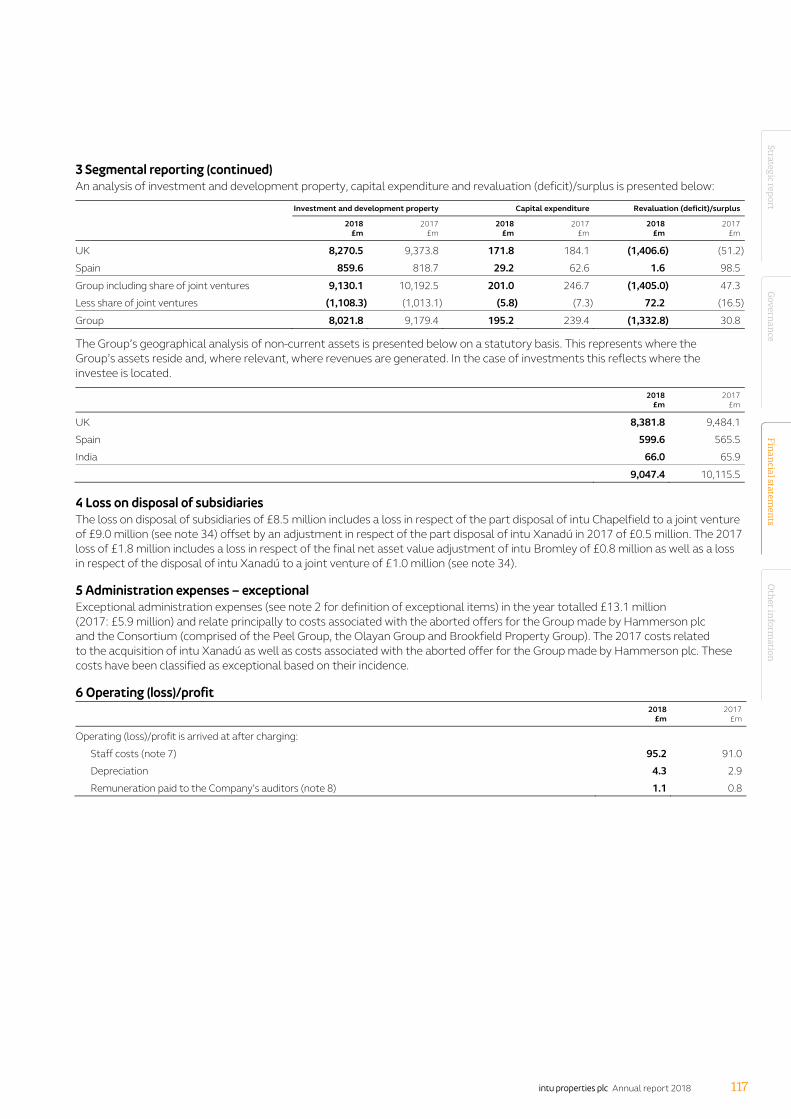
intu properties plc Annual report 2018 117
Financial statements
3 Segmental reporting (continued) An analysis of investment and development property, capital expenditure and revaluation (deficit)/surplus is presented below:
Investment and development property Capital expenditure Revaluation (deficit)/surplus
2018
£m 2017
£m 2018
£m 2017
£m 2018
£m 2017
£m
UK 8,270.5 9,373.8 171.8 184.1 (1,406.6) (51.2)
Spain 859.6 818.7 29.2 62.6 1.6 98.5
Group including share of joint ventures 9,130.1 10,192.5 201.0 246.7 (1,405.0) 47.3
Less share of joint ventures (1,108.3) (1,013.1) (5.8) (7.3) 72.2 (16.5)
Group 8,021.8 9,179.4 195.2 239.4 (1,332.8) 30.8
The Group’s geographical analysis of non-current assets is presented below on a statutory basis. This represents where the Group’s assets reside and, where relevant, where revenues are generated. In the case of investments this reflects where the investee is located.
2018
£m 2017
£m
UK 8,381.8 9,484.1
Spain 599.6 565.5
India 66.0 65.9
9,047.4 10,115.5
4 Loss on disposal of subsidiaries The loss on disposal of subsidiaries of £8.5 million includes a loss in respect of the part disposal of intu Chapelfield to a joint venture of £9.0 million (see note 34) offset by an adjustment in respect of the part disposal of intu Xanadú in 2017 of £0.5 million. The 2017 loss of £1.8 million includes a loss in respect of the final net asset value adjustment of intu Bromley of £0.8 million as well as a loss in respect of the disposal of intu Xanadú to a joint venture of £1.0 million (see note 34).
5 Administration expenses – exceptional Exceptional administration expenses (see note 2 for definition of exceptional items) in the year totalled £13.1 million (2017: £5.9 million) and relate principally to costs associated with the aborted offers for the Group made by Hammerson plc and the Consortium (comprised of the Peel Group, the Olayan Group and Brookfield Property Group). The 2017 costs related to the acquisition of intu Xanadú as well as costs associated with the aborted offer for the Group made by Hammerson plc. These costs have been classified as exceptional based on their incidence.
6 Operating (loss)/profit
2018
£m 2017
£m
Operating (loss)/profit is arrived at after charging:
Staff costs (note 7) 95.2 91.0
Depreciation 4.3 2.9
Remuneration paid to the Company’s auditors (note 8) 1.1 0.8
Strategic reportFin
ancial statem
ents
Other in
formation
Govern
ance
117intu properties plc Annual report 2018
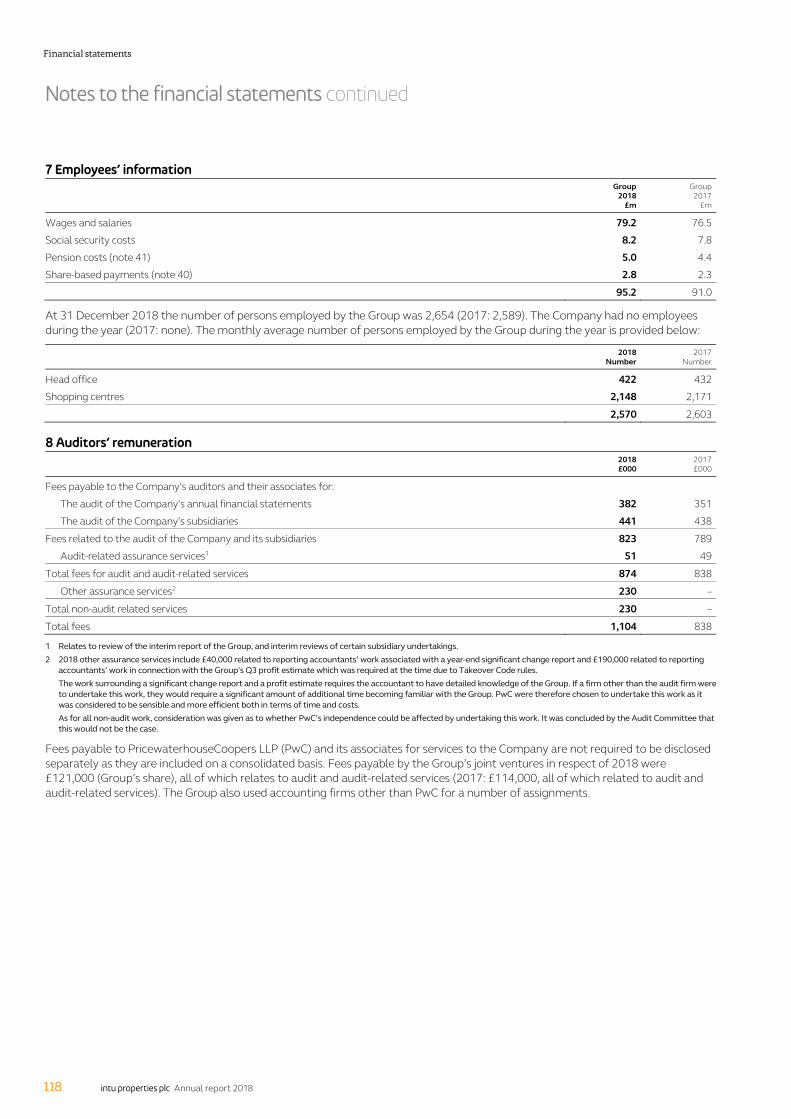
Notes to the financial statements continued
118 intu properties plc Annual report 2018
7 Employees’ information
Group 2018
£m
Group 2017
£m
Wages and salaries 79.2 76.5
Social security costs 8.2 7.8
Pension costs (note 41) 5.0 4.4
Share-based payments (note 40) 2.8 2.3
95.2 91.0
At 31 December 2018 the number of persons employed by the Group was 2,654 (2017: 2,589). The Company had no employees during the year (2017: none). The monthly average number of persons employed by the Group during the year is provided below:
2018
Number 2017
Number
Head office 422 432
Shopping centres 2,148 2,171
2,570 2,603
8 Auditors’ remuneration
2018 £000
2017 £000
Fees payable to the Company’s auditors and their associates for:
The audit of the Company’s annual financial statements 382 351
The audit of the Company’s subsidiaries 441 438
Fees related to the audit of the Company and its subsidiaries 823 789
Audit-related assurance services1 51 49
Total fees for audit and audit-related services 874 838
Other assurance services2 230 –
Total non-audit related services 230 –
Total fees 1,104 838
1 Relates to review of the interim report of the Group, and interim reviews of certain subsidiary undertakings. 2 2018 other assurance services include £40,000 related to reporting accountants’ work associated with a year-end significant change report and £190,000 related to reporting
accountants’ work in connection with the Group’s Q3 profit estimate which was required at the time due to Takeover Code rules. The work surrounding a significant change report and a profit estimate requires the accountant to have detailed knowledge of the Group. If a firm other than the audit firm were
to undertake this work, they would require a significant amount of additional time becoming familiar with the Group. PwC were therefore chosen to undertake this work as it was considered to be sensible and more efficient both in terms of time and costs.
As for all non-audit work, consideration was given as to whether PwC’s independence could be affected by undertaking this work. It was concluded by the Audit Committee that this would not be the case.
Fees payable to PricewaterhouseCoopers LLP (PwC) and its associates for services to the Company are not required to be disclosed separately as they are included on a consolidated basis. Fees payable by the Group’s joint ventures in respect of 2018 were £121,000 (Group’s share), all of which relates to audit and audit-related services (2017: £114,000, all of which related to audit and audit-related services). The Group also used accounting firms other than PwC for a number of assignments.
Financial statements
118 intu properties plc Annual report 2018

intu properties plc Annual report 2018 119
Financial statements
9 Net finance costs
2018
£m 2017
£m
On bank loans, overdrafts and allocated interest rate swaps 192.6 192.0
On convertible bonds (note 26) 13.8 17.5
On obligations under finance leases 4.4 4.4
Finance costs1 210.8 213.9
Finance income (14.8) (12.6)
Amortisation of Metrocentre compound financial instrument 5.9 5.9
Payments on unallocated interest rate swaps and other costs2 31.8 34.6
Foreign currency movements2 1.1 (1.6)
Other finance costs 38.8 38.9
Gain on derivative financial instruments3 (67.5) (28.3)
(Gain)/loss on convertible bonds designated as at fair value through profit or loss (note 26) (19.8) 6.3
Change in fair value of financial instruments (87.3) (22.0)
Net finance costs 147.5 218.2
1 Finance costs of £10.5 million were capitalised in the year ended 31 December 2018 (2017: £4.9 million). 2 Amounts totalling £32.9 million in the year ended 31 December 2018 (2017: £33.0 million) are treated as exceptional items, as defined in note 2, due to their nature and are
therefore excluded from underlying earnings (see note 12(b)). These finance costs include payments on unallocated interest rate swaps, payments on termination of interest rate swaps, amounts associated with modifications and extinguishments of borrowings, foreign currency movements and other fees.
3 Included within the gain on derivative financial instruments are gains totalling £44.9 million (2017: £47.1 million) resulting from the payment of obligations under derivative financial instruments during the year. Of these £28.1 million related to unallocated interest rate swaps (2017: £26.1 million).
10 Taxation Taxation for the year:
2018
£m 2017
£m
Current tax:
Overseas taxation 0.1 0.2
Overseas taxation – adjustment in respect of prior years – (0.1)
UK taxation – adjustment in respect of prior years – (0.2)
Current tax 0.1 (0.1)
Deferred tax:
On investment and development property (5.5) 24.8
On other temporary differences (0.3) (0.8)
Deferred tax (5.8) 24.0
Total tax (credit)/charge (5.7) 23.9
Tax relating to components of other comprehensive income of nil (2017: credit of £0.1 million) relates entirely to deferred tax in respect of other investments.
Strategic reportFin
ancial statem
ents
Other in
formation
Govern
ance
119intu properties plc Annual report 2018

Notes to the financial statements continued
120 intu properties plc Annual report 2018
10 Taxation (continued) The tax (credit)/charge for 2018 and 2017 is lower than the standard rate of corporation tax in the UK. The differences are explained below:
2018
£m 2017
£m
(Loss)/profit before tax, joint ventures and associates (1,139.6) 190.4
(Loss)/profit before tax multiplied by the standard rate of tax in the UK of 19% (2017: 19.25%) (216.6) 36.7
Exempt property rental profits and revaluations 214.9 (32.8)
(1.7) 3.9
Additions and disposals of property and investments 0.3 6.2
Prior year corporation tax items – (0.3)
Non-deductible and other items 3.4 2.8
Overseas taxation (0.4) 4.3
Unprovided deferred tax (7.3) 7.0
Total tax (credit)/charge (5.7) 23.9
Details of deferred tax balances are given in note 29.
Factors that may affect future current and total tax charges The Group continued to operate as a UK REIT throughout the year, under which any profits and gains from the UK property investment business are exempt from corporation tax, provided certain conditions continue to be met. The Group fulfilled these UK REIT conditions throughout the year. In view of the announced short-term reduction of dividends it is expected that there will be an underpayment of the minimum PID, and so for the Group to incur UK corporation tax payable at 19 per cent.
Certain of the Group’s Spanish joint ventures have elected into the SOCIMI regime, and these continued to operate as and fulfil the relevant conditions of the SOCIMI regime throughout the year.
11 Dividends
2018
£m 2017
£m
Ordinary shares:
Prior year final dividend paid of 9.4 pence per share (2017: 9.4 pence per share) 126.3 126.2
Interim dividend paid of 4.6 pence per share (2017: 4.6 pence per share) 61.8 61.7
Dividends paid 188.1 187.9
The Directors are not recommending a final dividend for 2018. See financial review on page 53 and note 10 for further information.
Details of the shares in issue and dividends waived are given in notes 30 and 31 respectively.
As a REIT, dividends are declared and paid in accordance with REIT legislation. See glossary for further information as well as the financial review on page 53 for information on distributable reserves.
12 Earnings per share (a) Number of shares
2018
million shares 2017
million shares
Basic1/2 1,343.7 1,343.2
Diluted3 1,343.7 1,427.6
1 The weighted average number of shares used has been adjusted to remove shares held in the ESOP. 2 Basic shares is used to calculate EPRA earnings per share and underlying earnings per share. 3 Diluted shares includes the impact of dilutive convertible bonds, share options and share awards.
Financial statements
120 intu properties plc Annual report 2018

intu properties plc Annual report 2018 121
Financial statements
12 Earnings per share (continued) (b) Earnings per share Basic and diluted earnings per share is calculated in accordance with IAS 33 Earnings Per Share.
Underlying earnings per share as presented is based on EPRA earnings per share, an industry standard APM considered a key measure of recurring performance, but adjusted for certain items (listed below) which management believes are necessary in order to better present the Group’s recurring performance and therefore provide an indication of the extent to which dividend payments are supported by underlying operations (see underlying profit statement in the other information section). Underlying earnings per share excludes property and derivative movements, exceptional items and related tax. The key differences to EPRA earnings per share relate to the following adjustments:
— with the exception of termination costs on allocated interest rate swaps and costs related to acquisitions, which are both excluded from EPRA earnings and underlying earnings, exceptional finance costs (as detailed in note 9) and exceptional administration expenses (as detailed in note 5) are included in EPRA earnings but are excluded from the Group’s measure of underlying earnings. In accordance with the Group’s definition for exceptional items (as detailed in the glossary), the Group considers these costs to be exceptional based on their nature and incidence, which create volatility in earnings
— fair value movements on interest rate swaps not currently used for economic hedges of debt (referred to as unallocated swaps) are included in EPRA earnings but are excluded from the Group’s measure of underlying earnings. The Group does not hold unallocated swaps for speculative purposes. Management currently intends to hold these unallocated swaps until maturity, therefore the volatility created by their fair value movements will not crystallise
A reconciliation of underlying earnings to (loss)/profit for the year attributable to owners of intu properties plc as well as EPRA earnings is provided below. The EPRA section within the other information section provides additional details on EPRA and related measures provided.
2018 20171
(Loss)/ earnings
£m Pence per
share
Earnings
£m Pence per
share
Basic (loss)/earnings per share (1,132.2) (84.3)p 216.7 16.1p
Dilutive convertible bonds, share options and share awards – (1.9)
Diluted (loss)/earnings per share (1,132.2) (84.3)p 214.8 15.0p
Basic (loss)/earnings per share (1,132.2) (84.3)p 216.7 16.1p
Adjusted for:
Revaluation of investment and development property (note 14) 1,332.8 99.2p (30.8) (2.3)p
Loss on disposal of subsidiaries (note 4) 8.5 0.6p 1.8 0.1p
Gain on sale of investment and development property (1.4) (0.1)p – –
Administration expenses – exceptional (acquisition and disposal related) 8.0 0.6p 4.9 0.4p
Change in fair value of financial instruments (36.6) (2.7)p (3.7) (0.3)p
Tax on the above (5.8) (0.4)p 23.9 1.8p
Share of joint ventures’ adjusted items 77.1 5.7p (17.2) (1.3)p
Share of associates’ adjusted items (2.2) (0.2)p (1.1) (0.1)p
Non-controlling interests in respect of the above (37.7) (2.7)p (10.0) (0.7)p
EPRA earnings per share3 210.5 15.7p 184.5 13.7p
Adjusted for:
Other exceptional items2 38.0 2.8p 34.0 2.5p
Other change in fair value of financial instruments2 (50.7) (3.8)p (18.3) (1.3)p
Other exceptional tax – – 0.1 –
Share of joint ventures’ adjusted items (5.8) (0.4)p – –
Share of associates’ adjusted items 1.1 0.1p 0.7 0.1p
Underlying earnings per share 193.1 14.4p 201.0 15.0p
1 2017 EPRA earnings per share has been adjusted to remove the fair value movements of unallocated interest rate swaps not related to cash payments on the respective swaps. 2 Includes the impact of payments on unallocated interest rate swaps and changes in fair value of unallocated interest rate swaps as detailed in note 9. 3 Diluted EPRA earnings for the year ended 31 December 2018 is 15.7p (2017: 12.8p).
Strategic reportFin
ancial statem
ents
Other in
formation
Govern
ance
121intu properties plc Annual report 2018

Notes to the financial statements continued
122 intu properties plc Annual report 2018
12 Earnings per share (continued) (c) Headline earnings per share Headline earnings per share is an APM and has been calculated and presented as required by the Johannesburg Stock Exchange listing requirements.
2018 2017
Gross
£m Net1 £m
Gross £m
Net1 £m
Basic (loss)/earnings (1,132.2) 216.7
Adjusted for:
Revaluation of investment and development property (note 14) 1,332.8 1,289.3 (30.8) (16.1)
Loss on disposal of subsidiaries (note 4) 8.5 8.5 1.8 1.8
Gain on sale of investment and development property (1.4) (1.4) – –
Share of joint ventures’ adjusted items 72.4 74.6 (15.9) (17.2)
Share of associates’ adjusted items (2.2) (2.2) (1.1) (1.1)
Headline earnings 236.6 184.1
Dilution2 – (1.9)
Diluted headline earnings 236.6 182.2
Weighted average number of shares (million) 1,343.7 1,343.2
Dilution2 1.8 84.4
Diluted weighted average number of shares (million) 1,345.5 1,427.6
Headline earnings per share (pence) 17.6p 13.7p
Diluted headline earnings per share (pence) 17.6p 12.8p
1 Net of tax and non-controlling interests. 2 The dilution impact is required to be included as calculated in note 12(a/b) even where this is not dilutive for headline earnings per share.
13 NAV per share (a) Number of shares
2018
shares million 2017
shares million
Basic1 1,343.8 1,343.4
Diluted2/3 1,345.6 1,345.2
1 The number of shares used has been adjusted to remove shares held in the ESOP. 2 Diluted shares is used to calculate EPRA NAV per share and NAV per share (diluted, adjusted). 3 Diluted shares includes the impact of dilutive convertible bonds, share options and share awards.
Financial statements
122 intu properties plc Annual report 2018
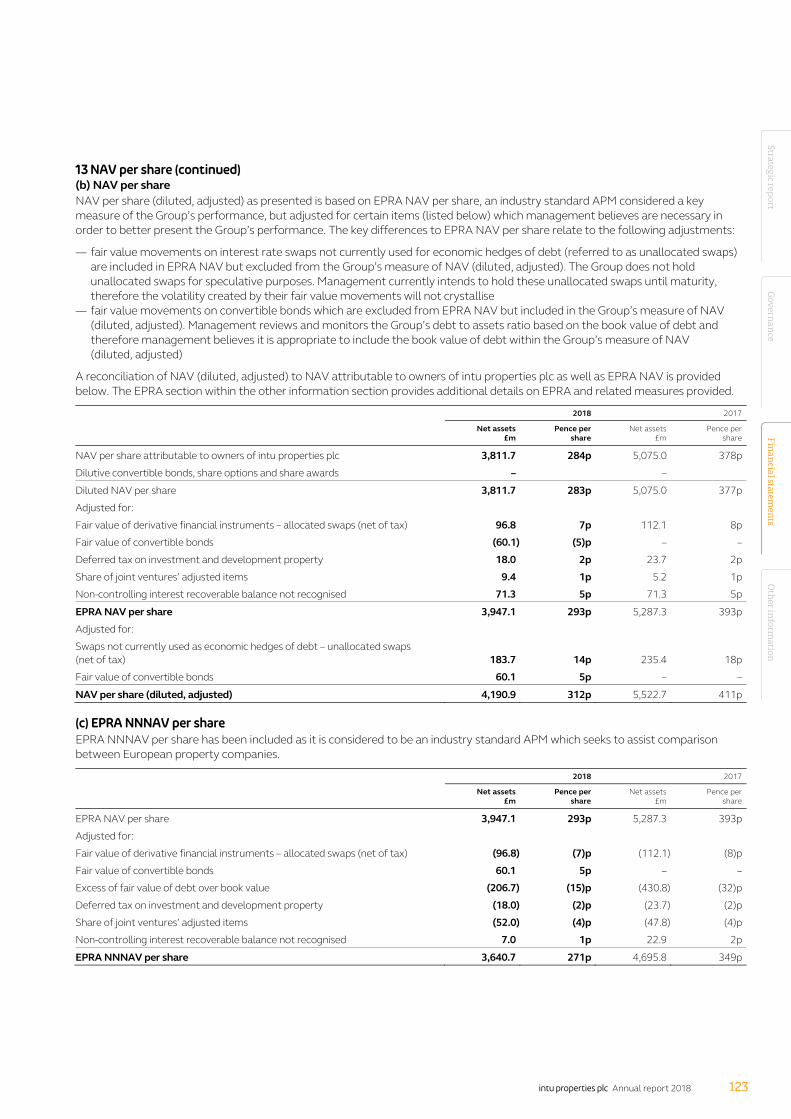
intu properties plc Annual report 2018 123
Financial statements
13 NAV per share (continued) (b) NAV per share NAV per share (diluted, adjusted) as presented is based on EPRA NAV per share, an industry standard APM considered a key measure of the Group’s performance, but adjusted for certain items (listed below) which management believes are necessary in order to better present the Group’s performance. The key differences to EPRA NAV per share relate to the following adjustments:
— fair value movements on interest rate swaps not currently used for economic hedges of debt (referred to as unallocated swaps) are included in EPRA NAV but excluded from the Group’s measure of NAV (diluted, adjusted). The Group does not hold unallocated swaps for speculative purposes. Management currently intends to hold these unallocated swaps until maturity, therefore the volatility created by their fair value movements will not crystallise
— fair value movements on convertible bonds which are excluded from EPRA NAV but included in the Group’s measure of NAV (diluted, adjusted). Management reviews and monitors the Group’s debt to assets ratio based on the book value of debt and therefore management believes it is appropriate to include the book value of debt within the Group’s measure of NAV (diluted, adjusted)
A reconciliation of NAV (diluted, adjusted) to NAV attributable to owners of intu properties plc as well as EPRA NAV is provided below. The EPRA section within the other information section provides additional details on EPRA and related measures provided.
2018 2017
Net assets
£m Pence per
share Net assets
£m Pence per
share
NAV per share attributable to owners of intu properties plc 3,811.7 284p 5,075.0 378p
Dilutive convertible bonds, share options and share awards – –
Diluted NAV per share 3,811.7 283p 5,075.0 377p
Adjusted for:
Fair value of derivative financial instruments – allocated swaps (net of tax) 96.8 7p 112.1 8p
Fair value of convertible bonds (60.1) (5)p – –
Deferred tax on investment and development property 18.0 2p 23.7 2p
Share of joint ventures’ adjusted items 9.4 1p 5.2 1p
Non-controlling interest recoverable balance not recognised 71.3 5p 71.3 5p
EPRA NAV per share 3,947.1 293p 5,287.3 393p
Adjusted for:
Swaps not currently used as economic hedges of debt – unallocated swaps (net of tax) 183.7 14p 235.4 18p
Fair value of convertible bonds 60.1 5p – –
NAV per share (diluted, adjusted) 4,190.9 312p 5,522.7 411p
(c) EPRA NNNAV per share EPRA NNNAV per share has been included as it is considered to be an industry standard APM which seeks to assist comparison between European property companies.
2018 2017
Net assets
£m Pence per
share Net assets
£m Pence per
share
EPRA NAV per share 3,947.1 293p 5,287.3 393p
Adjusted for:
Fair value of derivative financial instruments – allocated swaps (net of tax) (96.8) (7)p (112.1) (8)p
Fair value of convertible bonds 60.1 5p – –
Excess of fair value of debt over book value (206.7) (15)p (430.8) (32)p
Deferred tax on investment and development property (18.0) (2)p (23.7) (2)p
Share of joint ventures’ adjusted items (52.0) (4)p (47.8) (4)p
Non-controlling interest recoverable balance not recognised 7.0 1p 22.9 2p
EPRA NNNAV per share 3,640.7 271p 4,695.8 349p
Strategic reportFin
ancial statem
ents
Other in
formation
Govern
ance
123intu properties plc Annual report 2018

Notes to the financial statements continued
124 intu properties plc Annual report 2018
14 Investment and development property
Investment property
£m
Development property
£m Total
£m
At 1 January 2017 9,003.0 209.1 9,212.1
Acquisition of intu Xanadú (note 33) 461.4 – 461.4
Additions 109.6 129.8 239.4
Disposals (3.1) (0.3) (3.4)
Disposal of intu Xanadú to joint venture (note 34) (472.3) – (472.3)
Transfer of intu Chapelfield to assets held for sale (note 35) (302.0) – (302.0)
(Deficit)/surplus on revaluation (59.0) 89.8 30.8
Foreign exchange movements 9.4 4.0 13.4
At 31 December 2017 8,747.0 432.4 9,179.4
Additions 64.3 130.9 195.2
Disposals (21.7) – (21.7)
Disposal of development property to joint venture – (1.2) (1.2)
Transfer 165.5 (165.5) –
Deficit on revaluation (1,268.8) (64.0) (1,332.8)
Foreign exchange movements – 2.9 2.9
At 31 December 2018 7,686.3 335.5 8,021.8
A reconciliation to market value is given in the table below:
2018
£m 2017
£m
Balance sheet carrying value of investment and development property 8,021.8 9,179.4
Tenant incentives included within trade and other receivables (note 20) 116.5 109.2
Head leases included within finance leases in borrowings (note 24) (80.2) (80.2)
Market value of investment and development property 8,058.1 9,208.4
The market value of investment and development property at 31 December 2018 includes £7,718.7 million (31 December 2017: £8,831.9 million) in respect of investment property and £339.4 million (31 December 2017: £376.5 million) in respect of development property.
Investment and development property is measured at fair value in the Group’s balance sheet and categorised as Level 3 in the fair value hierarchy (see note 28 for definition) as one or more significant inputs to the valuation are partly based on unobservable market data.
Transfers into and transfers out of the fair value hierarchy levels are recognised on the date of the event or change in circumstances that caused the transfer. There were no transfers in or out of Level 3 for investment and development property during the year.
The Group has only one class of investment and development property asset. All the Group’s significant investment and development property relates to prime shopping centres which are of a similar nature and share characteristics and risks.
Valuation process It is the Group’s policy to engage independent external valuers to determine the market value of its investment and development property at both 30 June and 31 December. The Group provides information to the valuers, including current lease and tenant data along with asset-specific business plans. The valuers use this and other inputs including market transactions for similar properties to produce valuations (see valuation methodology below). These valuations and the assumptions they have made are then discussed and reviewed with the Group’s asset management team and Directors.
Financial statements
124 intu properties plc Annual report 2018

intu properties plc Annual report 2018 125
Financial statements
14 Investment and development property (continued) The Group engages independent valuation experts to undertake the Group’s property valuations. A summary of the valuers and the value of property assets they have been engaged to value is presented below:
2018
£m 2017
£m
Cushman & Wakefield 4,029.2 4,609.6
CBRE 2,160.6 2,420.8
Knight Frank 1,635.1 1,964.0
Jones Lang LaSalle 210.0 197.7
Assets not valued externally held at cost 23.2 16.3
8,058.1 9,208.4
In addition to the above, investment properties in the Group’s joint ventures were valued by CBRE, Cushman & Wakefield, Knight Frank and Jones Lang LaSalle.
Assets not valued externally held at cost relate to certain development land. These amounts have been reviewed internally and it has been concluded that the cost is the appropriate carrying value and so no valuation adjustment is needed. As the developments advance these will be valued by independent external valuers.
In respect of the intu Costa del Sol development site near Málaga, Spain, as the General Plan of Torremolinos was approved in December 2017, with the remaining consents expected in the coming months, the Group obtained an independent external valuation at 31 December 2017 as cost was no longer an appropriate approximation of fair value. At 31 December 2018 the remaining consents are yet to be finalised; however, we continue to expect these to be received. Therefore, consistent with the 31 December 2017 valuation, the 31 December 2018 valuation is based on the assumption that planning approval is in place at the valuation date.
Valuation fees are a fixed amount agreed between the Group and the valuers in advance of the valuation and are not linked to the valuation output.
Valuation methodology The fair value of the Group’s investment and development property at 31 December 2018 was determined by independent external valuers at that date other than certain development land as detailed above. The valuations are in accordance with the Royal Institution of Chartered Surveyors (RICS) Valuation – Global Standards 2017 and were arrived at by reference to market transactions for similar properties and rent profiles. Fair values for investment properties are calculated using the present value income approach. The main assumptions underlying the valuations are in relation to rent profile and yields as discussed below.
The key driver of the property valuations is the terms of the leases in place at the valuation date. These determine the majority of the cash flow profile of the property for a number of years and therefore form the base of the valuation. The valuation assumes adjustments from these rental values in place at the valuation date to current market rent at the time of the next rent review (where a typical lease allows only for upward adjustment) and as leases expire and are replaced by new leases. The current market level of rent is assessed based on evidence provided by the most recent relevant leasing transactions and negotiations. This is based on evidence available at the date of valuation and does not assume future increases in market rent.
The nominal equivalent yield is applied as a discount rate to the rental cash flows which, after taking into account other input assumptions such as vacancies and costs, generates the market value of the property. The nominal equivalent yield applied is assessed by reference to market transactions for similar properties and takes into account, amongst other things, any risks associated with the rent uplift assumptions.
In respect of development valuations, deductions are made for anticipated costs, including an allowance for developer’s profit and any other assumptions before arriving at a valuation.
Annual property income as disclosed in the following table reflects current annualised gross income.
The net initial yield is calculated as the current net income over the gross market value of the asset and is used as a sense check and to compare against market transactions for similar properties.
Full definitions of nominal equivalent yield, annual property income and net initial yield are provided in the glossary.
The valuation output, inputs and assumptions are reviewed to ensure that they are in line with those of market participants.
Strategic reportFin
ancial statem
ents
Other in
formation
Govern
ance
125intu properties plc Annual report 2018

Notes to the financial statements continued
126 intu properties plc Annual report 2018
14 Investment and development property (continued) A significant change in the nominal equivalent yield of investment property in isolation would result in a significant change in the value of investment and development property. A decrease in nominal equivalent yield of 50 basis points would result in an increase in the total market value of £818.9 million (31 December 2017: £1,055.5 million), while a 50 basis point increase would result in a decrease in the total market value of £669.1 million (31 December 2017: £806.5 million). Additionally, development property is sensitive to income, cost and developer’s profit assumptions included in the valuations.
The table below provides details of the assumptions used in the valuation of the core portfolio and key unobservable inputs:
2018 2017
Market value £m
Net initial yield (EPRA)
Nominal equivalent yield
Annual property income
£m Market value
£m Net initial
yield (EPRA) Nominal
equivalent yield
Annual property income
£m
intu Trafford Centre 2,098.0 4.4% 4.7% 94.7 2,324.0 3.7% 4.3% 93.7
intu Lakeside 1,250.0 3.9% 4.9% 55.8 1,416.5 3.3% 4.5% 53.2
intu Metrocentre 841.8 4.8% 5.7% 46.4 929.0 4.7% 5.3% 48.1
intu Merry Hill 777.2 4.5% 5.6% 41.3 931.1 3.8% 5.0% 42.4
intu Braehead 429.9 6.1% 6.3% 29.0 533.1 5.1% 6.1% 28.1
Manchester Arndale 409.9 4.6% 5.6% 22.2 456.4 4.1% 5.1% 21.3
intu Watford 407.4 3.7% 5.3% 18.7 336.0 4.0% 5.1% 15.8
intu Derby 372.5 6.6% 7.2% 27.9 458.0 6.0% 6.2% 28.9
intu Eldon Square 280.7 5.4% 5.5% 16.3 322.7 4.9% 5.0% 16.1
intu Victoria Centre 261.0 6.1% 6.5% 19.0 355.5 4.7% 5.7% 19.5
intu Milton Keynes 256.5 5.0% 5.3% 13.6 285.0 4.4% 4.9% 13.7
Cribbs Causeway 216.7 5.3% 5.6% 12.8 240.0 4.9% 5.2% 12.9
15 Investment in Group companies
Company
2018 2017
Cost £m
Accumulated impairment
£m Net £m
Cost £m
Accumulated impairment
£m Net £m
At 1 January 3,342.5 (450.2) 2,892.3 3,338.1 (517.2) 2,820.9
Additions – – – 4.4 – 4.4
Impairment (charge)/reversal in the year – (173.2) (173.2) – 67.0 67.0
At 31 December 3,342.5 (623.4) 2,719.1 3,342.5 (450.2) 2,892.3
The impairment charge in the year and reversal in prior year are principally the result of property valuation movements seen in the relevant subsidiaries. The valuation of investment and development property is a significant estimate as referenced in note 1. Impairment is assessed by comparing the carrying value against the underlying assets and liabilities of the respective subsidiaries. Details of related undertakings are provided in note 38.
Financial statements
126 intu properties plc Annual report 2018

intu properties plc Annual report 2018 127
Financial statements
16 Investment in joint ventures The Group’s principal joint ventures own and manage investment and development property.
2018
St David’s, Cardiff
£m
intu Chapelfield
£m
intu Puerto Venecia
£m
intu Xanadú
£m
intu Asturias
£m Other
£m Total
£m
At 1 January 2018 347.0 – 133.9 119.4 95.6 39.6 735.5
Acquisition of joint venture interest (note 34) – 151.9 – – – – 151.9
Group’s share of underlying profit 13.2 5.3 2.0 5.1 3.2 0.4 29.2
Group’s share of other net (loss)/profit (49.8) (20.3) 9.8 (0.8) 0.5 (10.7) (71.3)
Group’s share of (loss)/profit (36.6) (15.0) 11.8 4.3 3.7 (10.3) (42.1)
Investment of capital – – – 7.7 – – 7.7
Repayment of capital – – – (7.1) – – (7.1)
Distributions – (2.2) – – – (0.7) (2.9)
Loan advances – – – – – 2.0 2.0
Loan repayments (14.0) – (2.0) – (9.3) – (25.3)
Foreign exchange movements – – 2.0 1.0 1.2 – 4.2
At 31 December 2018 296.4 134.7 145.7 125.3 91.2 30.6 823.9
Represented by:
Loans to joint ventures 69.6 74.0 98.3 58.5 26.0 9.6 336.0
Group’s share of net assets 226.8 60.7 47.4 66.8 65.2 21.0 487.9
2017
St David’s, Cardiff
£m
intu Puerto Venecia
£m
intu Xanadú
£m
intu Asturias
£m Other
£m Total
£m
At 1 January 2017 355.2 119.4 – 76.0 37.0 587.6
Acquisition of joint venture interest (note 34) – – 117.1 – – 117.1
Group’s share of underlying profit 13.4 0.6 1.4 2.0 0.9 18.3
Group’s share of other net profit/(loss) (6.8) 8.9 0.4 14.7 – 17.2
Group’s share of profit 6.6 9.5 1.8 16.7 0.9 35.5
Investment of capital – – 0.7 – – 0.7
Distributions – – – – (1.2) (1.2)
Loan advances – – – – 3.0 3.0
Loan repayments (14.8) – – – – (14.8)
Foreign exchange movements – 5.0 (0.2) 2.9 (0.1) 7.6
At 31 December 2017 347.0 133.9 119.4 95.6 39.6 735.5
Represented by:
Loans to joint ventures 83.6 99.1 57.7 35.0 7.5 282.9
Group’s share of net assets 263.4 34.8 61.7 60.6 32.1 452.6
At 31 December 2018, the boards of joint ventures had approved £5.0 million (2017: £13.8 million) of future expenditure for the purchase, construction, development and enhancement of investment property. Of this, £2.7 million (2017: £12.7 million) is contractually committed. These amounts represent the Group’s share.
Strategic reportFin
ancial statem
ents
Other in
formation
Govern
ance
127intu properties plc Annual report 2018

Notes to the financial statements continued
128 intu properties plc Annual report 2018
16 Investment in joint ventures (continued) Set out below is the summarised information of the Group’s joint ventures with financial information presented at 100 per cent. The 2018 summary information and the summarised income statement of intu Chapelfield is presented for the period from 1 February 2018, the date at which it ceased being a 100 per cent owned subsidiary of the Group.
2018
St David’s, Cardiff
£m
intu Chapelfield
£m
intu Puerto Venecia
£m
intu Xanadú
£m
intu Asturias
£m Other
£m Total
£m
Summary information
Group’s interest 50% 50% 50% 50% 50%
Principal place of business Wales England Spain Spain Spain
Summarised income statement
Revenue 41.0 22.2 26.6 32.6 18.0 17.9 158.3
Net rental income 26.6 15.1 20.3 23.0 13.5 11.4 109.9
Revaluation of investment and development property (99.6) (40.7) 11.4 4.3 1.7 (50.0) (172.9)
Administration expenses – underlying (0.1) (0.1) (2.0) (2.0) (1.3) (2.6) (8.1)
Administration expenses – exceptional – – – (0.1) – – (0.1)
Finance costs – (4.4) (14.2) (9.7) (5.7) (5.9) (39.9)
Other finance income – exceptional – – 9.4 – – – 9.4
Change in fair value of financial instruments – – (0.5) (1.2) (0.8) 1.3 (1.2)
Taxation – – – (5.7) 0.1 – (5.6)
(Loss)/profit (73.1) (30.1) 24.4 8.6 7.5 (45.8) (108.5) Attributable to non-controlling interests – – (0.8) – (0.2) – (1.0)
(Loss)/profit attributable to owners (73.1) (30.1) 23.6 8.6 7.3 (45.8) (109.5)
Group’s share of (loss)/profit (36.6) (15.0) 11.8 4.3 3.7 (10.3) (42.1)
Summarised balance sheet
Investment and development property 592.1 266.6 480.7 485.5 288.3 221.4 2,334.6
Other non-current assets 0.2 0.4 1.1 82.0 5.1 2.5 91.3
Total non-current assets 592.3 267.0 481.8 567.5 293.4 223.9 2,425.9
Cash and cash equivalents 9.7 7.0 13.4 19.8 16.7 5.9 72.5
Other current assets 19.4 2.6 2.1 1.1 0.9 13.6 39.7
Total current assets 29.1 9.6 15.5 20.9 17.6 19.5 112.2
Current financial liabilities (0.1) (0.9) (10.4) (9.5) (4.7) (1.8) (27.4)
Other current liabilities (12.4) (6.4) (5.4) (7.0) (1.7) (7.7) (40.6)
Total current liabilities (12.5) (7.3) (15.8) (16.5) (6.4) (9.5) (68.0)
Partners’ loans (139.1) (148.0) (196.6) (116.9) (52.2) (19.4) (672.2)
Non-current financial liabilities – – (186.1) (236.1) (107.5) (130.5) (660.2)
Other non-current liabilities (16.2) – – (85.3) (11.4) – (112.9)
Total non-current liabilities (155.3) (148.0) (382.7) (438.3) (171.1) (149.9) (1,445.3)
Net assets 453.6 121.3 98.8 133.6 133.5 84.0 1,024.8 Non-controlling interests – – (4.1) – (3.2) – (7.3)
Net assets attributable to owners 453.6 121.3 94.7 133.6 130.3 84.0 1,017.5
Group’s share of net assets 226.8 60.7 47.4 66.8 65.2 21.0 487.9
Financial statements
128 intu properties plc Annual report 2018

intu properties plc Annual report 2018 129
Financial statements
16 Investment in joint ventures (continued) The 2017 summary information and the summarised income statement of intu Xanadú is presented for the period from 31 July 2017, the date at which it ceased being a 100 per cent owned subsidiary of the Group.
2017
St David’s, Cardiff
£m
intu Puerto Venecia
£m
intu Xanadú
£m
intu Asturias
£m Other
£m Total
£m
Summary information
Group’s interest 50% 50% 50% 50%
Principal place of business Wales Spain Spain Spain
Summarised income statement
Revenue 39.6 25.1 13.0 17.0 18.8 113.5
Net rental income 26.7 19.2 8.6 12.5 12.9 79.9
Revaluation of investment and development property (13.6) 18.1 2.0 26.6 – 33.1
Loss on sale of other investments – (0.4) – (0.3) – (0.7)
Administration expenses – underlying – (1.9) (1.1) (1.0) (2.3) (6.3)
Administration expenses – exceptional – – (1.0) – – (1.0)
Finance costs – (15.9) (4.4) (7.5) (5.0) (32.8)
Change in fair value of financial instruments – 0.6 0.4 0.6 0.7 2.3
Taxation – (0.1) (0.9) 3.2 – 2.2
Profit 13.1 19.6 3.6 34.1 6.3 76.7
Attributable to non-controlling interests – (0.6) – (0.7) – (1.3)
Profit attributable to owners 13.1 19.0 3.6 33.4 6.3 75.4
Group’s share of profit 6.6 9.5 1.8 16.7 0.9 35.5
Summarised balance sheet
Investment and development property 692.0 460.4 470.5 281.0 265.3 2,169.2
Other non-current assets 14.0 0.8 81.2 5.3 3.7 105.0
Total non-current assets 706.0 461.2 551.7 286.3 269.0 2,274.2
Cash and cash equivalents 8.9 38.2 18.9 31.2 6.0 103.2
Other current assets 7.7 2.5 – 1.5 9.4 21.1
Total current assets 16.6 40.7 18.9 32.7 15.4 124.3
Current financial liabilities – (17.0) (6.1) (6.2) (0.5) (29.8)
Other current liabilities (12.6) (13.9) (15.2) (1.9) (5.8) (49.4)
Total current liabilities (12.6) (30.9) (21.3) (8.1) (6.3) (79.2)
Partners’ loans (167.2) (198.3) (115.4) (70.0) (15.0) (565.9)
Non-current financial liabilities – (199.6) (230.9) (105.2) (131.6) (667.3)
Other non-current liabilities (16.1) – (79.7) (11.4) – (107.2)
Total non-current liabilities (183.3) (397.9) (426.0) (186.6) (146.6) (1,340.4)
Net assets 526.7 73.1 123.3 124.3 131.5 978.9
Non-controlling interests – (3.4) – (3.1) – (6.5)
Net assets attributable to owners 526.7 69.7 123.3 121.2 131.5 972.4
Group’s share of net assets 263.4 34.8 61.7 60.6 32.1 452.6
Strategic reportFin
ancial statem
ents
Other in
formation
Govern
ance
129intu properties plc Annual report 2018

Notes to the financial statements continued
130 intu properties plc Annual report 2018
17 Joint operations The Group’s interests in Cribbs Causeway and Manchester Arndale are accounted for as joint operations. The Group holds 50 per cent beneficial interests in the relevant freehold or leasehold of these properties. Each joint arrangement is governed by a Trust Deed giving each party rights to income and obligations for expenses in respect of their beneficial interest in the property. The management of the property is established under the Trust Deed as being undertaken by an entity jointly controlled by the beneficial owners of the property. This entity does not have the right to a share of the income or expenditure from the property, other than the receipt of a management fee. Therefore these interests are accounted for as joint operations. The principal place of business of both joint operations is England.
18 Investment in associates
2018
£m 2017
£m
At 1 January 64.8 65.2
Share of post-tax profit of associates 2.3 1.3
Foreign exchange movements (1.5) (1.7)
At 31 December 65.6 64.8
Investment in associates comprises a 32.4 per cent holding in the ordinary shares of Prozone Intu Properties Limited (Prozone), a listed Indian shopping centre developer, and a 26.8 per cent holding in the ordinary shares of Empire Mall Private Limited (Empire). Both companies are incorporated in India.
The equity method of accounting is applied to the Group’s investments in Prozone and Empire in line with the requirements of IAS 28 Investments in Associates and Joint Ventures. The results for the year to 30 September have been used as 31 December information is not available in time for these financial statements. Those results are adjusted to be in line with the Group’s accounting policies and include the most recent property valuations, determined at 30 September 2018, by independent professionally qualified external valuers in line with the valuation methodology described in note 14.
The market price per share of Prozone at 31 December 2018 was INR29 (31 December 2017: INR72), valuing the Group’s interest at £16.4 million (31 December 2017: £41.1 million) compared to the carrying value of £45.1 million (31 December 2017: £45.1 million). As the share price of Prozone is lower than its carrying value, a review of the carrying value has been undertaken. The net assets of Prozone principally comprise investment property which is held at fair value within the investment in associates line. As with other Group investment property, it is subject to independent valuation to fair value and that valuation reflects the future cash flows expected to be generated from those assets. As such the net asset carrying value recorded in the financial statements is deemed to be a reasonable approximation of the value in use of the business and so no adjustment to that carrying value is considered necessary.
Financial statements
130 intu properties plc Annual report 2018

intu properties plc Annual report 2018 131
Financial statements
18 Investment in associates (continued) Set out below is the summarised information of the Group’s investment in associates with financial information presented at 100 per cent.
Prozone 2018
£m
Empire 2018
£m
Total 2018
£m
Prozone 2017
£m
Empire 2017
£m
Total 2017
£m
Summary information
Group’s interest 32.4% 26.8% 32.4% 26.8%
Summarised income statement
Revenue 14.8 10.1 24.9 9.1 4.8 13.9
Revaluation of investment and development property 8.1 3.7 11.8 5.5 (1.0) 4.5
Other income statement items (13.5) (9.2) (22.7) (10.8) (1.8) (12.6)
Profit reported by associate 9.4 4.6 14.0 3.8 2.0 5.8
Attributable to non-controlling interests (5.9) – (5.9) (1.5) – (1.5)
Profit attributable to owners 3.5 4.6 8.1 2.3 2.0 4.3
Group’s share of profit 1.1 1.2 2.3 0.8 0.5 1.3
Summarised balance sheet
Investment and development property 271.3 81.5 352.8 270.3 79.3 349.6
Other non-current assets 31.3 3.2 34.5 24.2 2.9 27.1
Current assets 4.0 4.0 8.0 7.6 4.0 11.6
Current liabilities (8.7) (1.6) (10.3) (10.7) (1.2) (11.9)
Non-current liabilities (41.6) (10.7) (52.3) (35.8) (11.5) (47.3)
Net assets 256.3 76.4 332.7 255.6 73.5 329.1
Non-controlling interests (117.2) – (117.2) (116.4) – (116.4)
Net assets attributable to owners 139.1 76.4 215.5 139.2 73.5 212.7
Group’s share of net assets attributable to owners 45.1 20.5 65.6 45.1 19.7 64.8
Strategic reportFin
ancial statem
ents
Other in
formation
Govern
ance
131intu properties plc Annual report 2018

Notes to the financial statements continued
132 intu properties plc Annual report 2018
19 Other investments
2018
£m 2017
£m
At 1 January 16.8 15.5
Additions 0.1 1.5
Revaluation (6.4) (0.2)
At 31 December 10.5 16.8
These investments in equity instruments are analysed by type as follows:
2018
£m 2017
£m
Listed securities – equity 8.9 15.3
Unlisted securities – equity 1.6 1.5
10.5 16.8
Listed investments are accounted for at fair value using the bid market value at the reporting date.
20 Trade and other receivables
Group 2018
£m
Group 2017
£m
Company 2018
£m
Company 2017
£m
Current
Trade receivables 35.8 26.4 1.3 1.8
Amounts owed by subsidiary undertakings – – 719.1 972.9
Amounts owed by joint ventures 8.5 13.6 – –
Other receivables 16.3 17.2 4.5 3.9
Net investment in finance leases 0.4 0.4 – –
Prepayments and accrued income 94.2 84.3 2.5 1.6
Trade and other receivables – current 155.2 141.9 727.4 980.2
Non-current
Amounts owed by associates 5.0 4.7 – –
Other receivables 0.4 – – –
Net investment in finance leases 0.8 1.2 – –
Prepayments and accrued income 99.3 96.6 – –
Trade and other receivables – non-current 105.5 102.5 – –
Included within prepayments and accrued income for the Group of £193.5 million (2017: £180.9 million) are tenant lease incentives of £116.5 million (2017: £109.2 million), of which £17.2 million are classified as current (2017: £12.6 million) and £99.3 million as non-current (2017: £96.6 million).
Amounts owed by subsidiary undertakings are unsecured and repayable on demand.
Financial statements
132 intu properties plc Annual report 2018
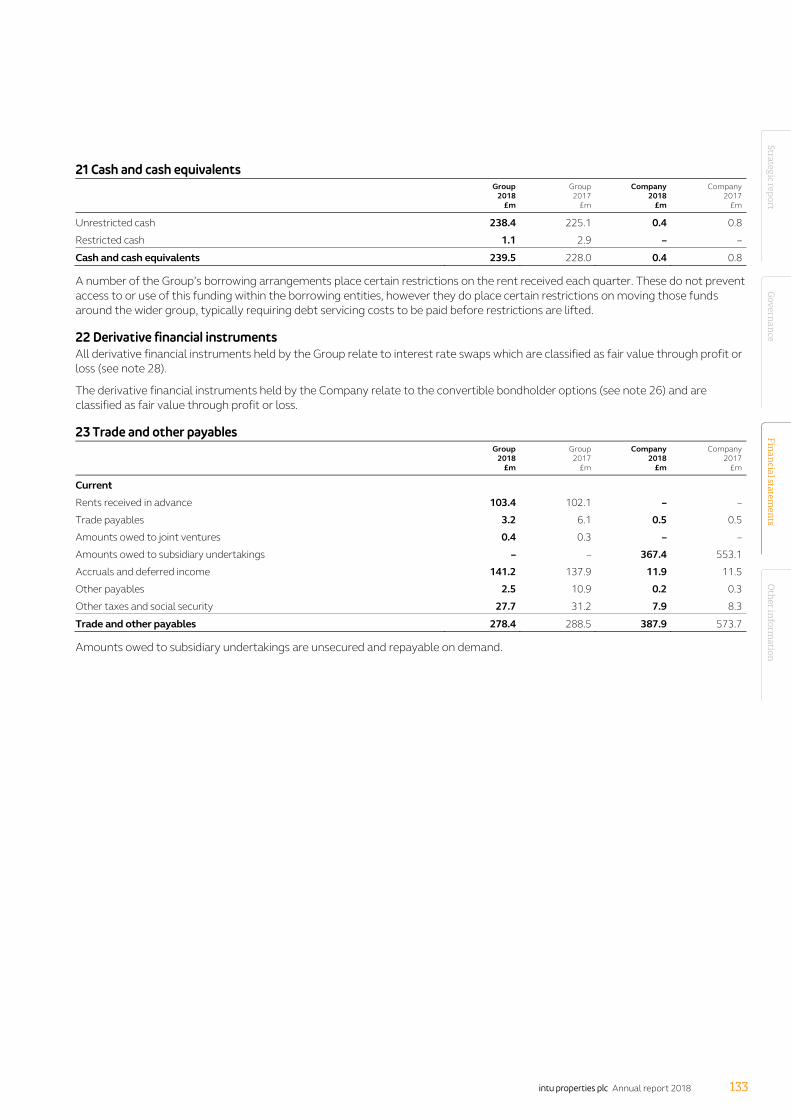
intu properties plc Annual report 2018 133
Financial statements
21 Cash and cash equivalents
Group 2018
£m
Group 2017
£m
Company 2018
£m
Company 2017
£m
Unrestricted cash 238.4 225.1 0.4 0.8
Restricted cash 1.1 2.9 – –
Cash and cash equivalents 239.5 228.0 0.4 0.8
A number of the Group’s borrowing arrangements place certain restrictions on the rent received each quarter. These do not prevent access to or use of this funding within the borrowing entities, however they do place certain restrictions on moving those funds around the wider group, typically requiring debt servicing costs to be paid before restrictions are lifted.
22 Derivative financial instruments All derivative financial instruments held by the Group relate to interest rate swaps which are classified as fair value through profit or loss (see note 28).
The derivative financial instruments held by the Company relate to the convertible bondholder options (see note 26) and are classified as fair value through profit or loss.
23 Trade and other payables
Group 2018
£m
Group 2017
£m
Company 2018
£m
Company 2017
£m
Current
Rents received in advance 103.4 102.1 – –
Trade payables 3.2 6.1 0.5 0.5
Amounts owed to joint ventures 0.4 0.3 – –
Amounts owed to subsidiary undertakings – – 367.4 553.1
Accruals and deferred income 141.2 137.9 11.9 11.5
Other payables 2.5 10.9 0.2 0.3
Other taxes and social security 27.7 31.2 7.9 8.3
Trade and other payables 278.4 288.5 387.9 573.7
Amounts owed to subsidiary undertakings are unsecured and repayable on demand.
Strategic reportFin
ancial statem
ents
Other in
formation
Govern
ance
133intu properties plc Annual report 2018

Notes to the financial statements continued
134 intu properties plc Annual report 2018
24 Borrowings 2018
Group
Carrying value
£m Secured
£m Unsecured
£m
Fixed rate £m
Floating rate £m
Fair value
£m
Current
Commercial mortgage backed securities (CMBS) notes 46.7 46.7 – 46.7 – 51.1
Current borrowings, excluding finance leases 46.7 46.7 – 46.7 – 51.1
Finance lease obligations 4.4 4.4 – 4.4 – 4.4
51.1 51.1 – 51.1 – 55.5
Non-current
Revolving credit facility 2021 (including £89.9 million drawn in euros) 393.9 393.9 – – 393.9 393.9
CMBS notes 2022 33.4 33.4 – 33.4 – 37.1
CMBS notes 2024 88.3 88.3 – 88.3 – 96.8
CMBS notes 2029 67.5 67.5 – 67.5 – 77.0
CMBS notes 2033 296.3 296.3 – 296.3 – 364.7
CMBS notes 2035 195.1 195.1 – – 195.1 201.9
Bank loan 2020 25.0 25.0 – – 25.0 25.0
Bank loans 2021 668.7 668.7 – – 668.7 668.7
Bank loan 2022 247.5 247.5 – 247.5 – 282.8
Bank loan 2023 73.1 73.1 – – 73.1 73.1
Bank loan 2024 473.8 473.8 – – 473.8 473.8
3.875% bonds 2023 444.6 444.6 – 444.6 – 454.7
4.125% bonds 2023 479.5 479.5 – 479.5 – 496.9
4.625% bonds 2028 342.9 342.9 – 342.9 – 363.0
4.250% bonds 2030 345.3 345.3 – 345.3 – 349.7
Debenture 2027 229.1 229.1 – 229.1 – 247.2
2.875% convertible bonds 2022 (note 26) 314.9 – 314.9 314.9 – 314.9
Non-current borrowings, excluding finance leases and Metrocentre compound financial instrument 4,718.9 4,404.0 314.9 2,889.3 1,829.6 4,921.2
Metrocentre compound financial instrument 189.5 – 189.5 189.5 – 189.5
Finance lease obligations 75.8 75.8 – 75.8 – 75.8
4,984.2 4,479.8 504.4 3,154.6 1,829.6 5,186.5
Total borrowings 5,035.3 4,530.9 504.4 3,205.7 1,829.6 5,242.0
Cash and cash equivalents (note 21) (239.5)
Net debt 4,795.8
Analysis of the Group’s net external debt is provided in the other information section.
The Group substantially eliminates its interest rate exposure to floating rate debt through interest rate swaps as described in note 28.
The market value of investment property secured, either directly or indirectly, as collateral against borrowings at 31 December 2018 is £8,774.6 million including £1,096.8 million of investment property held within joint ventures (2017: £9,802.2 million including £1,001.0 million held within joint ventures). In most circumstances the Group can realise up to 50 per cent without restriction providing the Group continues to manage the asset. Realising an amount in excess of this would trigger a change of control and mandatory repayment of the facility.
The fair values of fixed rate borrowings and CMBS are assessed based on quoted market prices, and as such are categorised as Level 1 in the fair value hierarchy (see note 28 for definition). The fair values of unlisted floating rate borrowings are equal to their carrying values.
Financial statements
134 intu properties plc Annual report 2018

intu properties plc Annual report 2018 135
Financial statements
24 Borrowings (continued) 2017
Group
Carrying value
£m Secured
£m Unsecured
£m
Fixed rate £m
Floating rate £m
Fair value
£m
Current
Commercial mortgage backed securities (CMBS) notes 23.3 23.3 – 23.3 – 28.1
2.5% convertible bonds 2018 (note 26) 161.0 – 161.0 161.0 – 161.0
Current borrowings, excluding finance leases 184.3 23.3 161.0 184.3 – 189.1
Finance lease obligations 2.4 2.4 – 2.4 – 2.4
186.7 25.7 161.0 186.7 – 191.5
Non-current
Revolving credit facility 2021 (including £88.8 million drawn in euros) 233.8 233.8 – – 233.8 233.8
CMBS notes 2019 19.9 19.9 – 19.9 – 20.4
CMBS notes 2022 43.0 43.0 – 43.0 – 49.5
CMBS notes 2024 88.0 88.0 – 88.0 – 98.6
CMBS notes 2029 73.2 73.2 – 73.2 – 85.9
CMBS notes 2033 311.2 311.2 – 311.2 – 393.1
CMBS notes 2035 192.8 192.8 – – 192.8 212.1
Bank loan 2019 139.7 139.7 – – 139.7 139.7
Bank loan 2020 32.9 32.9 – – 32.9 32.9
Bank loans 2021 470.2 470.2 – – 470.2 470.2
Bank loan 2022 246.8 246.8 – 246.8 – 277.3
Bank loan 2024 482.7 482.7 – – 482.7 482.7
3.875% bonds 2023 443.5 443.5 – 443.5 – 486.2
4.125% bonds 2023 478.5 478.5 – 478.5 – 535.7
4.625% bonds 2028 342.3 342.3 – 342.3 – 410.0
4.250% bonds 2030 345.0 345.0 – 345.0 – 402.3
Debenture 2027 228.8 228.8 – 228.8 – 267.9
2.875% convertible bonds 2022 (note 26) 377.3 – 377.3 377.3 – 377.3
Non-current borrowings, excluding finance leases and Metrocentre compound financial instrument 4,549.6 4,172.3 377.3 2,997.5 1,552.1 4,975.6
Metrocentre compound financial instrument 183.7 – 183.7 183.7 – 183.7
Finance lease obligations 77.8 77.8 – 77.8 – 77.8
4,811.1 4,250.1 561.0 3,259.0 1,552.1 5,237.1
Total borrowings 4,997.8 4,275.8 722.0 3,445.7 1,552.1 5,428.6
Cash and cash equivalents (note 21) (228.0)
Net debt 4,769.8
The maturity profile of debt (excluding finance leases) is as follows:
Group 2018
£m
Group 2017
£m
Repayable within one year 46.7 184.3
Repayable in more than one year but not more than two years 30.5 175.5
Repayable in more than two years but not more than five years 2,722.0 1,445.9
Repayable in more than five years 2,155.9 3,111.9
4,955.1 4,917.6
Certain borrowing agreements contain financial and other conditions that, if contravened, could alter the repayment profile. During the year there were no breaches of these conditions (see financial covenants in the other information section).
Strategic reportFin
ancial statem
ents
Other in
formation
Govern
ance
135intu properties plc Annual report 2018

Notes to the financial statements continued
136 intu properties plc Annual report 2018
24 Borrowings (continued) At 31 December 2018 the Group had committed undrawn borrowing facilities of £274.2 million (2017: £406.9 million), maturing in 2021 and 2022.
The Company had non-current borrowings of £393.9 million at 31 December 2018 consisting of a revolving credit facility expiring in 2021 (2017: £233.8 million). This debt is floating rate, secured and its fair value is equal to book value.
Finance lease disclosures:
Group 2018
£m
Group 2017
£m
Minimum lease payments under finance leases fall due:
Not later than one year 4.4 2.4
Later than one year and not later than five years 17.8 9.5
Later than five years 104.8 115.1
127.0 127.0
Future finance charges on finance leases (46.8) (46.8)
Present value of finance lease liabilities 80.2 80.2
Present value of finance lease liabilities:
Not later than one year 4.4 2.4
Later than one year and not later than five years 17.8 9.5
Later than five years 58.0 68.3
80.2 80.2
Finance lease liabilities are in respect of head leases on investment and development property. A number of these leases provide for payment of contingent rent, usually a proportion of net rental income, in addition to the rents above.
25 Movement in net debt 2018
Liabilities from financing activities
Group
Cash and cash
equivalents £m
Current borrowings
£m
Non- current
borrowings £m
Net debt
£m
At 1 January 228.0 (186.7) (4,811.1) (4,769.8) Adjustment on adoption of new accounting standard (note 1) – – 14.0 14.0
Adjusted at 1 January 228.0 (186.7) (4,797.1) (4,755.8) Disposal of subsidiaries 143.2 – – 143.2 Borrowings drawn 302.0 – (302.0) – Borrowings repaid (204.3) 160.4 43.9 – Other net cash movements (229.4) – – (229.4) Other non-cash movements – (24.8) 71.0 46.2
At 31 December 239.5 (51.1) (4,984.2) (4,795.8)
Financial statements
136 intu properties plc Annual report 2018

intu properties plc Annual report 2018 137
Financial statements
25 Movement in net debt (continued) 2017
Liabilities from financing activities
Group
Cash and cash
equivalents £m
Current borrowings
£m
Non- current
borrowings £m
Net debt
£m
At 1 January 254.7 (142.4) (4,520.2) (4,407.9)
Acquisition of businesses (216.0) – (230.7) (446.7)
Disposal of subsidiaries 104.1 – 231.4 335.5
Borrowings drawn 968.5 – (968.5) –
Borrowings repaid (660.0) – 660.0 –
Other net cash movements (223.3) – – (223.3)
Other non-cash movements – (44.3) 16.9 (27.4)
At 31 December 228.0 (186.7) (4,811.1) (4,769.8)
26 Convertible bonds 2.875 per cent convertible bonds (the 2.875 per cent bonds) On 1 November 2016 Intu (Jersey) 2 Limited (the ‘Issuer’) issued £375.0 million 2.875 per cent Guaranteed Convertible Bonds due 2022 at par, all of which remain outstanding at 31 December 2018. At 31 December 2018 the exchange price was £3.7506 per ordinary share (2017: £3.7506). intu properties plc has unconditionally and irrevocably guaranteed the due and punctual performance by the Issuer of all of its obligations (including payments) in respect of the 2.875 per cent bonds and the obligations of the Company, as guarantor, constitute direct, unsubordinated and unsecured obligations of the Company.
Subject to certain conditions, the 2.875 per cent bonds are convertible into preference shares of the Issuer which are automatically transferred to the Company in exchange for ordinary shares in the Company or (at the Company’s election) any combination of ordinary shares and cash. The 2.875 per cent bonds can be converted at any time from the date which is 180 days prior to the Final Maturity Date of 1 November 2022, to the 20th dealing date prior to the Final Maturity Date.
The initial exchange price was £3.7506 per ordinary share, a conversion rate of approximately 26,662 ordinary shares for every £100,000 nominal of the 2.875 per cent bonds. Under the terms of the 2.875 per cent bonds, the exchange price is adjusted upon certain events including the payment of dividends by the Company over a certain threshold.
The 2.875 per cent bonds may be redeemed at par at the Company’s option subject to the Company’s ordinary share price having traded at 30 per cent above the conversion price for a specified period, or at any time once 85 per cent by nominal value of the 2.875 per cent bonds originally issued have been converted or cancelled. If not previously converted, redeemed or purchased and cancelled, the 2.875 per cent bonds will be redeemed at par on 1 November 2022.
The 2.875 per cent bonds are listed on the Channel Islands Securities Exchange and the Open Market (Freiverkehr) of the Frankfurt Stock Exchange.
The 2.875 per cent bonds are designated as at fair value through profit or loss and so are presented on the balance sheet at fair value. Gains and losses in respect of own credit risk are recognised in other comprehensive income and all other gains and losses are recognised in the income statement through the change in fair value of financial instruments line.
At 31 December 2018, the fair value of the 2.875 per cent bonds was £314.9 million (2017: £377.3 million). During the year interest of £10.8 million (2017: £10.8 million) in respect of these bonds has been recognised within finance costs.
In the Company’s balance sheet the bondholder option is held at its fair value of £4.6 million as a derivative financial instrument (2017: £28.3 million).
2.5 per cent convertible bonds (the 2.5 per cent bonds) On 4 October 2012 Intu (Jersey) Limited (the ‘Issuer’) issued £300.0 million 2.5 per cent Guaranteed Convertible Bonds due 2018 at par, £160.4 million of which were outstanding at 31 December 2017. The outstanding 2.5 per cent bonds were settled in cash on the 4 October 2018, the Final Maturity Date.
At 31 December 2017 the exchange price was £3.1164 per ordinary share. intu properties plc unconditionally and irrevocably guaranteed the due and punctual performance by the Issuer of all of its obligations (including payments) in respect of the 2.5 per cent bonds and the obligations of the Company, as guarantor, constitute direct, unsubordinated and unsecured obligations of the Company.
Strategic reportFin
ancial statem
ents
Other in
formation
Govern
ance
137intu properties plc Annual report 2018
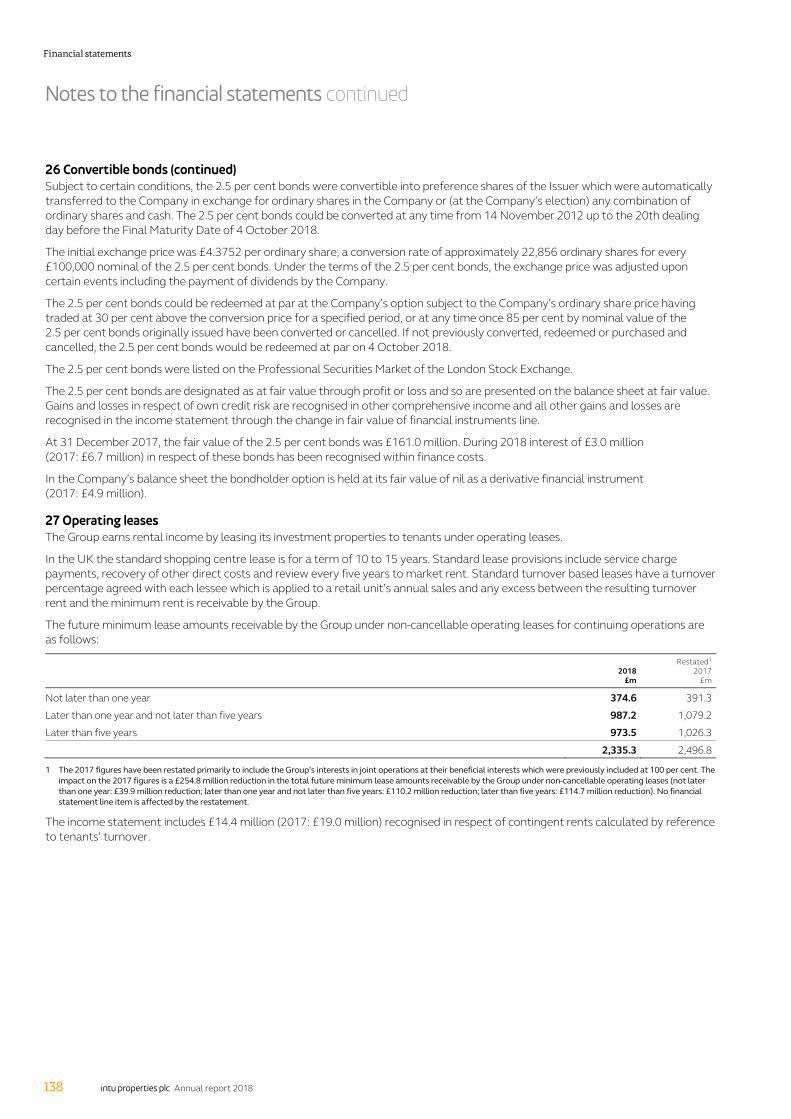
Notes to the financial statements continued
138 intu properties plc Annual report 2018
26 Convertible bonds (continued) Subject to certain conditions, the 2.5 per cent bonds were convertible into preference shares of the Issuer which were automatically transferred to the Company in exchange for ordinary shares in the Company or (at the Company’s election) any combination of ordinary shares and cash. The 2.5 per cent bonds could be converted at any time from 14 November 2012 up to the 20th dealing day before the Final Maturity Date of 4 October 2018.
The initial exchange price was £4.3752 per ordinary share, a conversion rate of approximately 22,856 ordinary shares for every £100,000 nominal of the 2.5 per cent bonds. Under the terms of the 2.5 per cent bonds, the exchange price was adjusted upon certain events including the payment of dividends by the Company.
The 2.5 per cent bonds could be redeemed at par at the Company’s option subject to the Company’s ordinary share price having traded at 30 per cent above the conversion price for a specified period, or at any time once 85 per cent by nominal value of the 2.5 per cent bonds originally issued have been converted or cancelled. If not previously converted, redeemed or purchased and cancelled, the 2.5 per cent bonds would be redeemed at par on 4 October 2018.
The 2.5 per cent bonds were listed on the Professional Securities Market of the London Stock Exchange.
The 2.5 per cent bonds are designated as at fair value through profit or loss and so are presented on the balance sheet at fair value. Gains and losses in respect of own credit risk are recognised in other comprehensive income and all other gains and losses are recognised in the income statement through the change in fair value of financial instruments line.
At 31 December 2017, the fair value of the 2.5 per cent bonds was £161.0 million. During 2018 interest of £3.0 million (2017: £6.7 million) in respect of these bonds has been recognised within finance costs.
In the Company’s balance sheet the bondholder option is held at its fair value of nil as a derivative financial instrument (2017: £4.9 million).
27 Operating leases The Group earns rental income by leasing its investment properties to tenants under operating leases.
In the UK the standard shopping centre lease is for a term of 10 to 15 years. Standard lease provisions include service charge payments, recovery of other direct costs and review every five years to market rent. Standard turnover based leases have a turnover percentage agreed with each lessee which is applied to a retail unit’s annual sales and any excess between the resulting turnover rent and the minimum rent is receivable by the Group.
The future minimum lease amounts receivable by the Group under non-cancellable operating leases for continuing operations are as follows:
2018
£m
Restated1 2017
£m
Not later than one year 374.6 391.3
Later than one year and not later than five years 987.2 1,079.2
Later than five years 973.5 1,026.3
2,335.3 2,496.8
1 The 2017 figures have been restated primarily to include the Group’s interests in joint operations at their beneficial interests which were previously included at 100 per cent. The impact on the 2017 figures is a £254.8 million reduction in the total future minimum lease amounts receivable by the Group under non-cancellable operating leases (not later than one year: £39.9 million reduction; later than one year and not later than five years: £110.2 million reduction; later than five years: £114.7 million reduction). No financial statement line item is affected by the restatement.
The income statement includes £14.4 million (2017: £19.0 million) recognised in respect of contingent rents calculated by reference to tenants’ turnover.
Financial statements
138 intu properties plc Annual report 2018

intu properties plc Annual report 2018 139
Financial statements
28 Financial risk management The Group is exposed to a variety of financial risks arising from the Group’s operations being principally market risk (including interest rate risk and foreign exchange risk), liquidity risk and credit risk.
The majority of the Group’s financial risk management is carried out by the Group’s treasury department. The policies for managing each of these risks and their impact on the results for the year are summarised below.
Market risk a) Interest rate risk Interest rate risk comprises both cash flow and fair value risks. Cash flow interest rate risk is the risk that the future cash flows of a financial instrument will fluctuate due to changes in market interest rates. Fair value interest rate risk is the risk that the fair value of financial instruments will fluctuate as a result of changes in market interest rates.
The Group’s interest rate risk arises from borrowings issued at floating rates that expose the Group to cash flow interest rate risk, whereas borrowings issued at fixed interest rates expose the Group to fair value interest rate risk. Bank debt is typically issued at floating rates linked to LIBOR. Bond debt and other capital market debt is generally issued at fixed rates.
It is Group policy, and often a requirement of the Group’s lenders, to eliminate substantially all exposure to interest rate fluctuations by using floating to fixed interest rate swaps (referred to as allocated swaps) in order to establish certainty over cash flows. Such allocated swaps have the economic effect of converting borrowings from floating to fixed rates. The Group also holds interest rate swaps that are not actively used as a hedge against borrowings (referred to as unallocated swaps).
As a consequence, the Group is exposed to market price risk in respect of the fair value of its fixed rate interest rate swaps, as discussed in the financial review on pages 50 to 51.
The table below shows the effects of allocated swaps on the borrowings profile of the Group:
Fixed 2018
£m
Floating 2018
£m
Fixed 2017
£m
Floating 2017
£m
Borrowings1 2,998.3 1,884.1 2,998.2 1,607.0
Derivative impact (nominal value of allocated swaps) 1,112.6 (1,112.6) 1,371.6 (1,371.6)
Net borrowings profile 4,110.9 771.5 4,369.8 235.4
Interest rate protection 84.2% 94.9%
1 Borrowings are stated at nominal value and exclude the Metrocentre compound financial instrument and finance leases. At 31 December 2018 they include the £393.9 million (2017: £233.8 million) drawn under the revolving credit facility (RCF) which incurs interest at a floating rate. Excluding the revolving credit facility, interest rate protection is 92 per cent (2017: 100 per cent).
Group policy is to target interest rate protection within the range of 75 per cent to 100 per cent.
The weighted average rate for allocated swaps currently effective is 1.89 per cent (2017: 1.71 per cent).
The nominal value of unallocated swaps, which are excluded from the above table, is £566.7 million (2017: £566.7 million). Their fair value of £184.4 million (2017: £235.4 million) is included as a liability in the balance sheet.
The approximate impact on the total fair value of derivatives liability (allocated and unallocated swaps) of a 50 basis point increase in the level of interest rates would be a reduction to the liability of £78.8 million (2017: £87.6 million). The approximate impact of a 50 basis point reduction in the level of interest rates would be an increase to the liability of £78.8 million (2017: £87.6 million). In practice, a parallel shift in the yield curve is highly unlikely. However, the above sensitivity analysis is a reasonable illustration of the possible effect from the changes in slope and shifts in the yield curve that may occur. Where the fixed rate derivative financial instruments are matched by floating rate debt, the overall effect on Group cash flow of such a movement would be very small.
b) Foreign exchange risk Foreign exchange risk arises when future commercial transactions or recognised assets or liabilities are denominated in a functional currency other than pounds sterling. At 31 December 2018 the exposure is 15.0 per cent of net assets attributable to shareholders of the Group (31 December 2017: 10.6 per cent), the increase from 31 December 2017 being primarily due to the declines in UK property valuations during the year. Once the Eurofund expected future interest in the intu Costa del Sol development concludes, we expect this to reduce to 13.9 per cent, after which the appropriate level of exposure will be assessed.
Strategic reportFin
ancial statem
ents
Other in
formation
Govern
ance
139intu properties plc Annual report 2018

Notes to the financial statements continued
140 intu properties plc Annual report 2018
28 Financial risk management (continued) The table summarises the Group’s exposure to foreign currency risk:
2018
€m 2017
€m 2018
INRm 2017
INRm
Net exposure 555.7 524.2 6,274.5 6,067.3
The following foreign exchange rates, at 31 December 2018, apply to the Group’s foreign exchange risk:
2018
€m 2017
€m 2018
INRm 2017
INRm
Foreign exchange rate 1.1126 1.1266 88.3432 86.0441
The approximate impact of a 10 per cent appreciation in foreign exchange rates would be a positive movement of £63.4 million (2017: £59.6 million) to equity attributable to owners of the Group. The approximate impact of a 10 per cent depreciation in foreign exchange rates would be a negative movement of £51.9 million (2017: £48.8 million) to equity attributable to owners of the Group.
As part of the strategy to comply with the Group’s policy, the Group is able to borrow part of its RCF in euros, up to €100 million. The RCF borrowings denominated in euros have been designated as a hedging instrument (net investment hedge) against the Group’s net investment in Spain with the hedged risk being the changes in the euro/pounds sterling spot rate that will result in changes in the value of the Group’s net investments in Spain. At 31 December 2018, €100 million (2017: €100 million) was drawn in euros.
Liquidity risk Liquidity risk is managed to ensure that the Group is able to meet future payment obligations when financial liabilities fall due. Liquidity analysis is conducted to ensure that sufficient headroom is available to meet the Group’s operational requirements and committed investments. The Group treasury policy aims to meet this objective by maintaining adequate cash, marketable securities and committed facilities. Undrawn borrowing facilities are detailed in note 24. The Group’s policy is to seek to optimise its exposure to liquidity risk by balancing its exposure to interest rate risk and to refinancing risk. In effect the Group seeks to borrow for as long as possible at the lowest acceptable cost.
Group policy is to maintain a weighted average debt maturity of over five years. At 31 December 2018, the maturity profile of Group debt showed an average maturity of six years (2017: seven years). The Group regularly reviews the maturity profile of its borrowings and seeks to avoid bunching of maturities through the regular replacement of facilities and by arranging a selection of maturity dates. Refinancing risk may be reduced by doing so prior to the contracted maturity date, effectively switching liquidity risk for market risk.
The Group does not use supplier financing arrangements to manage liquidity risk.
The tables below set out the maturity analysis of the Group’s financial liabilities based on the undiscounted contractual obligations to make payments of interest and to repay principal. Where interest payment obligations are based on a floating rate, the rates used are those implied by the par yield curve for the relevant currency. Where payment obligations are in foreign currencies, the spot exchange rate at the balance sheet date is used.
2018
Group Within 1 year
£m 1–2 years
£m 2–5 years
£m Over 5 years
£m Total
£m
Borrowings (including interest) (237.8) (245.2) (3,259.1) (2,408.0) (6,150.1) Finance lease obligations (4.4) (4.4) (13.4) (104.8) (127.0) Other financial liabilities (6.1) (1.2) – – (7.3) Derivative payments (52.9) (50.2) (124.2) (364.1) (591.4) Derivative receipts 15.7 16.7 50.2 115.9 198.5
(285.5) (284.3) (3,346.5) (2,761.0) (6,677.3)
Financial statements
140 intu properties plc Annual report 2018
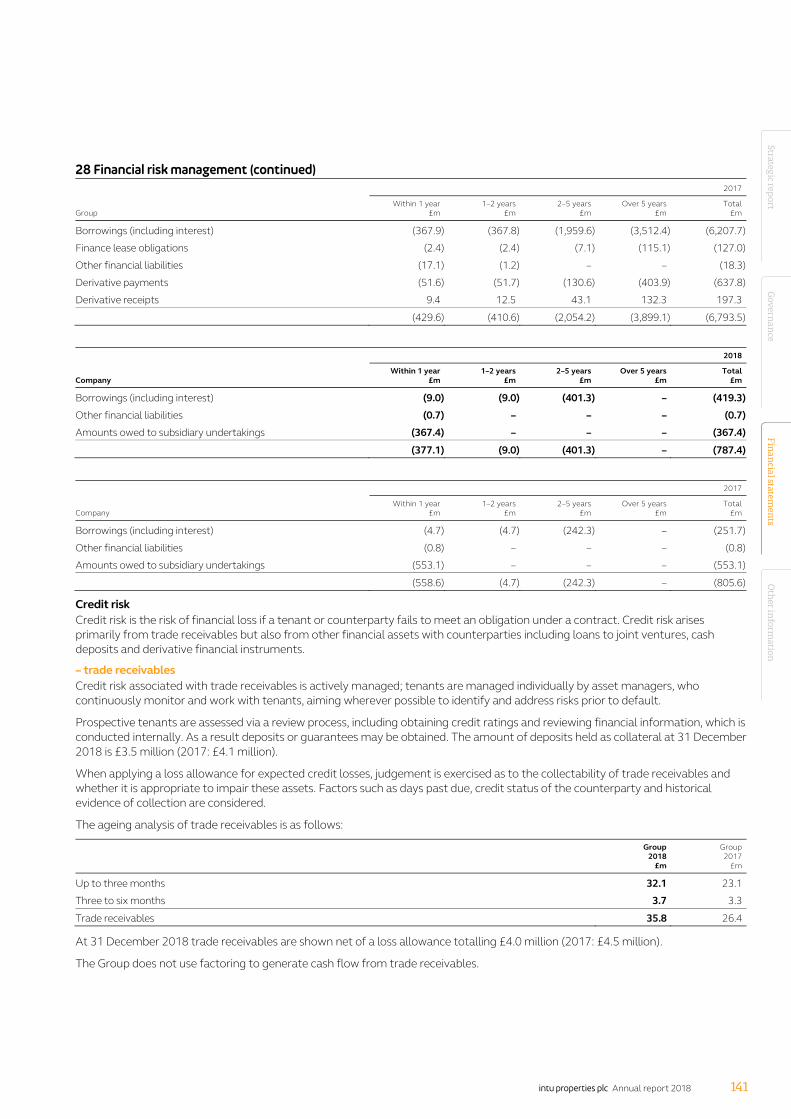
intu properties plc Annual report 2018 141
Financial statements
28 Financial risk management (continued) 2017
Group Within 1 year
£m 1–2 years
£m 2–5 years
£m Over 5 years
£m Total
£m
Borrowings (including interest) (367.9) (367.8) (1,959.6) (3,512.4) (6,207.7)
Finance lease obligations (2.4) (2.4) (7.1) (115.1) (127.0)
Other financial liabilities (17.1) (1.2) – – (18.3)
Derivative payments (51.6) (51.7) (130.6) (403.9) (637.8)
Derivative receipts 9.4 12.5 43.1 132.3 197.3
(429.6) (410.6) (2,054.2) (3,899.1) (6,793.5)
2018
Company Within 1 year
£m 1–2 years
£m 2–5 years
£m Over 5 years
£m Total
£m
Borrowings (including interest) (9.0) (9.0) (401.3) – (419.3) Other financial liabilities (0.7) – – – (0.7) Amounts owed to subsidiary undertakings (367.4) – – – (367.4)
(377.1) (9.0) (401.3) – (787.4)
2017
Company Within 1 year
£m 1–2 years
£m 2–5 years
£m Over 5 years
£m Total
£m
Borrowings (including interest) (4.7) (4.7) (242.3) – (251.7)
Other financial liabilities (0.8) – – – (0.8)
Amounts owed to subsidiary undertakings (553.1) – – – (553.1)
(558.6) (4.7) (242.3) – (805.6)
Credit risk Credit risk is the risk of financial loss if a tenant or counterparty fails to meet an obligation under a contract. Credit risk arises primarily from trade receivables but also from other financial assets with counterparties including loans to joint ventures, cash deposits and derivative financial instruments.
– trade receivables Credit risk associated with trade receivables is actively managed; tenants are managed individually by asset managers, who continuously monitor and work with tenants, aiming wherever possible to identify and address risks prior to default.
Prospective tenants are assessed via a review process, including obtaining credit ratings and reviewing financial information, which is conducted internally. As a result deposits or guarantees may be obtained. The amount of deposits held as collateral at 31 December 2018 is £3.5 million (2017: £4.1 million).
When applying a loss allowance for expected credit losses, judgement is exercised as to the collectability of trade receivables and whether it is appropriate to impair these assets. Factors such as days past due, credit status of the counterparty and historical evidence of collection are considered.
The ageing analysis of trade receivables is as follows:
Group 2018
£m
Group 2017
£m
Up to three months 32.1 23.1
Three to six months 3.7 3.3
Trade receivables 35.8 26.4
At 31 December 2018 trade receivables are shown net of a loss allowance totalling £4.0 million (2017: £4.5 million).
The Group does not use factoring to generate cash flow from trade receivables.
Strategic reportFin
ancial statem
ents
Other in
formation
Govern
ance
141intu properties plc Annual report 2018

Notes to the financial statements continued
142 intu properties plc Annual report 2018
28 Financial risk management (continued) – other financial assets including loans to joint ventures The Group applies the expected credit loss model in respect of other financial assets. Financial assets are individually assessed as to whether the credit risk has increased significantly in the period and therefore whether there is a need to apply the lifetime expected credit loss model as opposed to the 12-month expected credit loss model.
At 31 December 2018 there is no loss allowance recognised for other financial assets as it has been concluded as an immaterial risk of credit loss other financial assets in the next 12 months.
– cash deposits and derivative financial instruments The credit risk relating to cash deposits and derivative financial instruments is actively managed by the Group’s treasury department. Relationships are maintained with a number of tier one institutional counterparties, ensuring compliance with Group policy relating to limits on the credit ratings of counterparties (between BBB+ and AAA).
Excessive credit risk concentration is avoided through adhering to authorised limits for all counterparties.
Counterparty Credit rating Authorised limit
£m
Group exposure 31 December 2018
£m
Counterparty #1 AA- 125.0 111.9
Counterparty #2 A+ 100.0 44.1
Counterparty #3 A 100.0 27.2
Counterparty #4 AAA 150.0 22.3
Counterparty #5 AAA 150.0 12.3
Sum of five largest exposures 217.8
Sum of cash deposits and derivative financial instrument assets 244.2
Five largest exposures as a percentage of risk 89%
Classification of financial assets and liabilities The tables below set out the Group’s accounting classification of each class of financial assets and liabilities and their fair values at 31 December 2018 and 31 December 2017.
The fair values of derivative financial instruments are determined from observable market prices or estimated using appropriate yield curves at 31 December each year by discounting the future contractual cash flows to the net present values. The determination of the fair values of borrowings is defined in note 24.
2018
Carrying value
£m
Fair value
£m
Gain to income
statement £m
(Loss)/gain to other
comprehensive income
£m
Loans to joint ventures 336.0 336.0 – – Trade and other receivables 65.6 65.6 – – Cash and cash equivalents 239.5 239.5 – –
Total assets – amortised cost 641.1 641.1 – –
Other investments 10.5 10.5 – (6.4)
Total assets – fair value through other comprehensive income 10.5 10.5 – (6.4)
Derivative financial instruments (280.5) (280.5) 67.5 –
Total net liabilities – fair value through profit or loss (280.5) (280.5) 67.5 –
Convertible bonds (314.9) (314.9) 19.8 43.4
Total liabilities – designated as at fair value through profit or loss (314.9) (314.9) 19.8 43.4
Trade and other payables (7.3) (7.3) – – Borrowings (4,640.2) (4,846.9) – –
Total liabilities – amortised cost (4,647.5) (4,854.2) – –
Financial statements
142 intu properties plc Annual report 2018
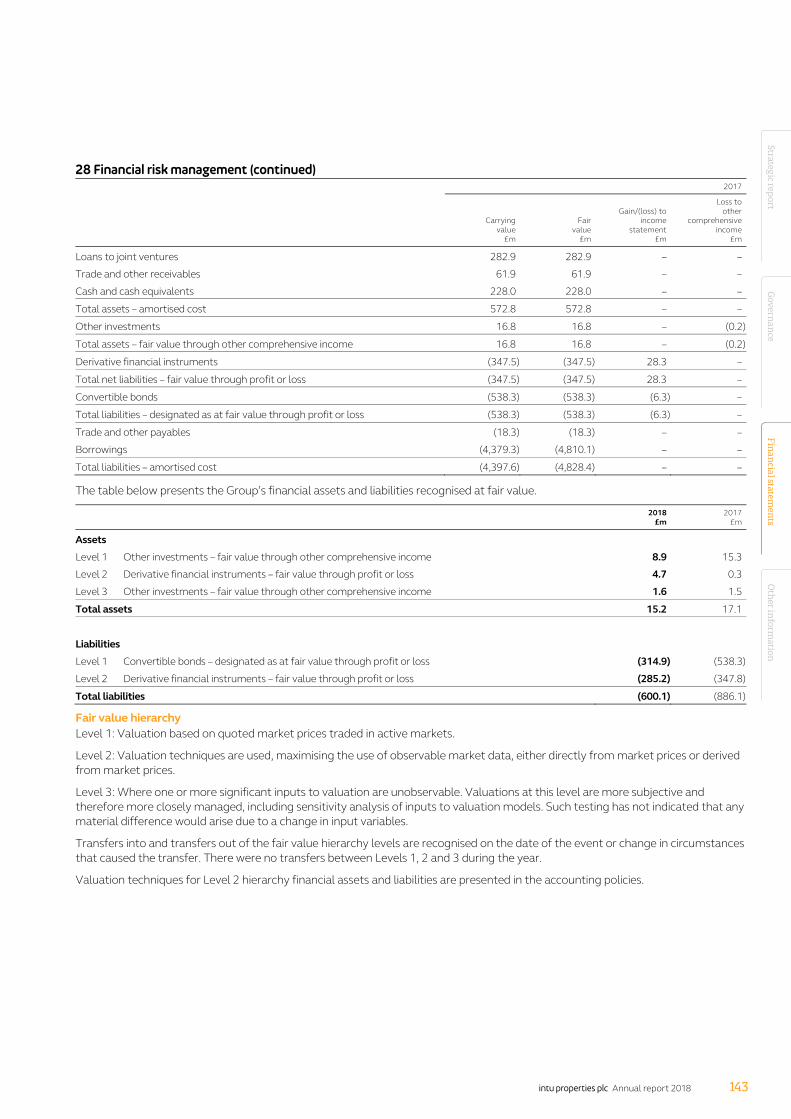
intu properties plc Annual report 2018 143
Financial statements
28 Financial risk management (continued) 2017
Carrying value
£m
Fair value
£m
Gain/(loss) to income
statement £m
Loss to other
comprehensive income
£m
Loans to joint ventures 282.9 282.9 – –
Trade and other receivables 61.9 61.9 – –
Cash and cash equivalents 228.0 228.0 – –
Total assets – amortised cost 572.8 572.8 – –
Other investments 16.8 16.8 – (0.2)
Total assets – fair value through other comprehensive income 16.8 16.8 – (0.2)
Derivative financial instruments (347.5) (347.5) 28.3 –
Total net liabilities – fair value through profit or loss (347.5) (347.5) 28.3 –
Convertible bonds (538.3) (538.3) (6.3) –
Total liabilities – designated as at fair value through profit or loss (538.3) (538.3) (6.3) –
Trade and other payables (18.3) (18.3) – –
Borrowings (4,379.3) (4,810.1) – –
Total liabilities – amortised cost (4,397.6) (4,828.4) – –
The table below presents the Group’s financial assets and liabilities recognised at fair value.
2018
£m 2017
£m
Assets
Level 1 Other investments – fair value through other comprehensive income 8.9 15.3
Level 2 Derivative financial instruments – fair value through profit or loss 4.7 0.3
Level 3 Other investments – fair value through other comprehensive income 1.6 1.5
Total assets 15.2 17.1
Liabilities
Level 1 Convertible bonds – designated as at fair value through profit or loss (314.9) (538.3)
Level 2 Derivative financial instruments – fair value through profit or loss (285.2) (347.8)
Total liabilities (600.1) (886.1)
Fair value hierarchy Level 1: Valuation based on quoted market prices traded in active markets.
Level 2: Valuation techniques are used, maximising the use of observable market data, either directly from market prices or derived from market prices.
Level 3: Where one or more significant inputs to valuation are unobservable. Valuations at this level are more subjective and therefore more closely managed, including sensitivity analysis of inputs to valuation models. Such testing has not indicated that any material difference would arise due to a change in input variables.
Transfers into and transfers out of the fair value hierarchy levels are recognised on the date of the event or change in circumstances that caused the transfer. There were no transfers between Levels 1, 2 and 3 during the year.
Valuation techniques for Level 2 hierarchy financial assets and liabilities are presented in the accounting policies.
Strategic reportFin
ancial statem
ents
Other in
formation
Govern
ance
143intu properties plc Annual report 2018

Notes to the financial statements continued
144 intu properties plc Annual report 2018
28 Financial risk management (continued) Capital structure The Group seeks to enhance shareholder value both by investing in the business so as to improve the return on investment and by managing the capital structure. The capital of the Group consists of equity, debt and a compound financial instrument. The Group aims to access both debt and equity capital markets with maximum efficiency and flexibility.
The key ratios used to monitor the capital structure of the Group are the debt to assets ratio and interest cover. The Group’s stated medium to long-term preference is for the debt to assets ratio to be within the 40 to 50 per cent range and interest cover to be greater than 1.60x. The debt to assets ratio has increased to 53.1 per cent since 31 December 2017 due to the deficit on property revaluation in the year. As detailed in the financial review, the Group will be looking to reduce this to below 50 per cent. The interest cover ratio continues to be above the preferred level.
As the Group’s debt is sometimes secured on its interests in joint ventures, these ratios are monitored for the Group including share of joint ventures. A reconciliation from the relevant IFRS amounts as presented to those including the Group’s share of joint ventures is included in the other information section.
Debt to assets ratio
Group 2018
£m
Group 2017
£m
Market value of investment and development property 9,167.4 10,222.7
Add market value of investment and development property classified as held for sale – 306.5
9,167.4 10,529.2
Net external debt (4,867.2) (4,835.5)
Debt to assets ratio 53.1% 45.9%
Interest cover
Group 2018
£m
Group 2017
£m
Finance costs (217.1) (219.9)
Finance income 2.6 3.3
(214.5) (216.6)
Underlying operating profit 409.4 419.3
Interest cover 1.91x 1.94x
Financial statements
144 intu properties plc Annual report 2018

intu properties plc Annual report 2018 145
Financial statements
29 Deferred tax Under IAS 12 Income Taxes, provision is made for the deferred tax assets and liabilities associated with the revaluation of assets and liabilities at the corporate tax rate expected to apply to the Group at the time the temporary differences are expected to reverse. For those UK assets and liabilities benefiting from REIT exemption the relevant tax rate will be 0 per cent (2017: 0 per cent), and for other UK assets and liabilities the relevant rate will be 19 per cent if the temporary difference is expected to be realised before 1 April 2020 and 17 per cent if it is expected to be realised on or after 1 April 2020 (2017: 19 per cent before 1 April 2020, 17 per cent thereafter). For Spanish assets and liabilities the relevant tax rate will be 25 per cent (2017: 25 per cent).
Movements in the provision for deferred tax:
Group
Investment and development
property £m
Other investments
£m
Other temporary
differences £m
Total £m
Provided deferred tax provision/(asset):
At 1 January 2017 – 0.1 (0.1) –
Acquisition of intu Xanadú (note 33) 84.5 – (6.8) 77.7
Recognised in the income statement 24.8 – (0.8) 24.0
Recognised in other comprehensive income – (0.1) – (0.1)
Foreign exchange movements 1.8 – (0.1) 1.7
Disposal of subsidiaries (note 34) (86.5) – 6.9 (79.6)
At 31 December 2017 24.6 – (0.9) 23.7
Recognised in the income statement (5.5) – (0.3) (5.8)
Foreign exchange movements 0.1 – – 0.1
At 31 December 2018 19.2 – (1.2) 18.0
The net deferred tax provision of £18.0 million arises in respect of the revaluation of development property at intu Costa del Sol, partially offset by tax losses in the same company.
At 31 December 2018, the Group had unrecognised deferred tax assets calculated at a tax rate of 17 per cent (2017: 17 per cent) of £51.1 million (2017: £43.1 million) for surplus UK revenue tax losses carried forward, £31.4 million (2017: £45.6 million) for temporary differences on derivative financial instruments, £0.5 million (2017: £0.5 million) for temporary differences on capital allowances, £1.2 million (2017: nil) for other investments and £5.8 million (2017: £5.8 million) for capital losses.
In accordance with the requirements of IAS 12 Income Taxes, the deferred tax asset has not been recognised on the Group’s balance sheet due to uncertainty over the level of profits that will be available in the non-REIT elements of the Group in future periods.
The Company recognises no deferred tax asset or liability (2017: nil).
Strategic reportFin
ancial statem
ents
Other in
formation
Govern
ance
145intu properties plc Annual report 2018

Notes to the financial statements continued
146 intu properties plc Annual report 2018
30 Share capital and share premium
Share capital
£m
Share premium
£m
Issued and fully paid:
At 31 December 2018 and 31 December 2017: 1,355,040,243 ordinary shares of 50 pence each 677.5 1,327.4
Full details of the rights and obligations attaching to the ordinary shares are contained in the Company’s Articles of Association. These rights include an entitlement to receive the Company’s annual report and financial statements, to attend and speak at general meetings of the Company, to appoint proxies and to exercise voting rights. Holders of ordinary shares may also receive dividends and may receive a share of the Company’s assets on the Company’s liquidation. There are no restrictions on the transfer of the ordinary shares.
At 20 February 2019 the Company had an unexpired authority to repurchase shares up to a maximum of 135,504,024 shares with a nominal value of £67.8 million, and the Directors have an unexpired authority to allot up to a maximum of 451,608,081 shares with a nominal value of £225.8 million.
Included within the issued share capital at 31 December 2018 are 11,216,115 ordinary shares (2017: 11,633,680) held by the Trustee of the ESOP which is operated by the Company (see note 31). The nominal value of these shares at 31 December 2018 is £5.6 million (2017: £5.8 million).
31 Employee Share Ownership Plan (ESOP) The cost of shares in intu properties plc held by the Trustee of the Employee Share Ownership Plan operated by the Company is accounted for as a deduction from equity.
The purpose of the ESOP is to acquire and hold shares which will be transferred to employees in the future under the Group’s employee incentive arrangements as described in note 40 and the Directors’ remuneration report on pages 78 to 93 including joint ownership of shares in its role as Trustee of the Joint Share Ownership Plan. Dividends of £1.6 million (2017: £1.7 million) in respect of these shares have been waived by agreement.
2018 2017
Group and Company Shares million
£m
Shares million
£m
At 1 January 11.6 39.1 12.1 40.8
Acquisitions 0.6 0.9 0.4 1.3
Disposals (1.0) (3.0) (0.9) (3.0)
At 31 December 11.2 37.0 11.6 39.1
32 Other reserves
Group
Capital redemption
£m
Translation reserve
£m Other
£m Total
£m
At 1 January 2017 61.4 25.9 257.0 344.3
Revaluation of other investments (note 19) – – (0.2) (0.2)
Exchange differences – 16.9 – 16.9
Tax relating to components of other comprehensive income (note 10) – – 0.1 0.1
At 31 December 2017 61.4 42.8 256.9 361.1
Revaluation of other investments (note 19) – – (6.4) (6.4)
Change in fair value of financial instruments (note 26) – – 43.4 43.4
Exchange differences – 4.1 – 4.1
At 31 December 2018 61.4 46.9 293.9 402.2
Other reserves in respect of the Company relate to the capital redemption reserve of £61.4 million (2017: £61.4 million).
Financial statements
146 intu properties plc Annual report 2018

intu properties plc Annual report 2018 147
Financial statements
33 Business combinations Accounting for acquisitions is a significant judgement as referenced in note 1. The Group individually assesses each acquisition to determine if it should be accounted for as a business combination in accordance with IFRS 3 Business Combinations. In respect of the below acquisition, the Group has concluded the assets and liabilities acquired constitute a business. They include the shopping centre asset itself along with the employees and processes that operate the centre on a day-to-day basis. These inputs and processes in turn drive the operation of the centre and the related output for its beneficial owner. As a result, this acquisition is to be accounted for as a business combination in accordance with IFRS 3.
Acquisition during 2017 On 10 March 2017 the Group acquired 100 per cent interests in three entities, which together own and manage intu Xanadú shopping centre, for total cash consideration of €517.3 million (£453.9 million). The cash flow statement outflow of £446.7 million reflects the £453.9 million less the unrestricted cash acquired of £7.2 million. Acquisition related costs of £0.8 million were incurred and recognised in the income statement in exceptional administration expenses during 2018 and 2017.
The fair value of assets and liabilities acquired, at 100 per cent, are set out in the table below:
Fair value
£m
Assets
Investment and development property 461.4
Cash and cash equivalents (including restricted cash of £3.1 million) 10.3
Trade and other receivables 0.1
Total assets 471.8
Liabilities
Trade and other payables (21.3)
Deferred tax (77.7)
Total liabilities (99.0)
Net assets 372.8
Fair value of consideration paid 453.9
Goodwill on acquisition of business 81.1
The fair value of the consideration is greater than the fair value of the assets and liabilities acquired, resulting in goodwill of £81.1 million being recognised on acquisition. The goodwill balance is primarily attributable to the recognition of a deferred tax balance which is required to be recorded in accordance with IAS 12 Income Taxes but has not been taken into account as part of the purchase price as it is not expected to be realised.
From the date of acquisition to the end of 2017, the acquired subsidiaries and subsequent joint venture interest (see note 34) contributed £13.2 million of revenue and £3.1 million of profit to the Group.
Had the entities been acquired on 1 January 2017, the Group would have reported revenue of £622.9 million and profit of £206.0 million for 2017.
Strategic reportFin
ancial statem
ents
Other in
formation
Govern
ance
147intu properties plc Annual report 2018

Notes to the financial statements continued
148 intu properties plc Annual report 2018
34 Disposal of subsidiaries Disposal during 2018 On 31 January 2018 the Group sold 50 per cent of its interest in intu Chapelfield, a wholly owned subsidiary, to LaSalle Investment Management (acting on behalf of Greater Manchester Pension Fund and West Yorkshire Pension Fund) for final cash consideration of £145.1 million before expenses of £1.6 million. Following this transaction intu Chapelfield ceased to be accounted for as a subsidiary and is now a joint venture. Therefore the assets and liabilities of intu Chapelfield are no longer recorded at 100 per cent in the Group’s balance sheet but the remaining 50 per cent interest is included in investment in joint ventures at an initial value of £151.9 million. As a result of this transaction the Group has recorded a loss on disposal of £9.0 million in the income statement. The cash flow statement records a net inflow of £143.2 million comprising the net consideration received of £143.5 million less cash in the business of £0.8 million reclassified to investment in joint venture, net of cash classified as held for sale at 31 December 2017 of £0.5 million.
Assessing control over joint arrangements is a significant judgement as referenced in note 1. Based on the terms set out in the joint venture agreement, the Group has classified its retained 50 per cent interest as a joint venture as key decisions require the consent of both partners.
The assets and liabilities of the subsidiaries disposed of, at 100 per cent, are set out below:
£m
Assets
Investment and development property 302.0
Cash and cash equivalents 0.8
Trade and other receivables 6.6
Total assets 309.4
Liabilities
Trade and other payables (5.0)
Total liabilities (5.0)
Net assets 304.4
Net assets (at 50 per cent) 152.2
Fair value of consideration received (including fair value adjustments of £0.3 million) 143.2
Loss on disposal of subsidiaries 9.0
Financial statements
148 intu properties plc Annual report 2018

intu properties plc Annual report 2018 149
Financial statements
34 Disposal of subsidiaries (continued) Disposal during 2017 On 31 July 2017 the Group sold 50 per cent of its interest in Xanadú Retail and Leisure S.L.U., a wholly owned subsidiary, to TH Real Estate for total consideration of €131.7 million (£117.9 million) before expenses of £1.0 million. Xanadú Retail and Leisure S.L.U. owns, through its wholly owned subsidiaries, intu Xanadú. Following this transaction intu Xanadú ceased to be accounted for as a subsidiary and is now a joint venture. Therefore the assets and liabilities of intu Xanadú are no longer recorded at 100 per cent in the Group’s balance sheet but the remaining 50 per cent interest is included in investment in joint ventures at an initial value of £117.1 million. As a result of this transaction the Group has recorded a loss on disposal of £1.0 million in the income statement. The cash flow statement inflow of £104.1 million represents the net consideration received of £116.9 million net of unrestricted cash in the business of £12.8 million.
Assessing control over joint arrangements is a significant judgement as referenced in note 1. Based on the terms set out in the partnership agreement, the Group has classified its retained 50 per cent interest as a joint venture as key decisions require the consent of both partners.
The assets and liabilities of the subsidiaries disposed of, at 100 per cent, are set out below:
£m
Assets
Investment and development property 472.3
Goodwill 81.1
Cash and cash equivalents (including restricted cash of £3.2 million) 16.0
Trade and other receivables 7.3
Total assets 576.7
Liabilities
Trade and other payables (28.4)
Deferred tax (79.6)
Derivative financial instruments (1.6)
Borrowings (231.4)
Total liabilities (341.0)
Net assets 235.7
Net assets (at 50 per cent) 117.9
Fair value of consideration received 116.9
Loss on disposal of subsidiaries 1.0
35 Assets classified as held for sale In November 2017 the Group announced the formation of a joint venture with LaSalle Investment Management (acting on behalf of Greater Manchester Pension Fund and West Yorkshire Pension Fund) for them to take ownership of 50 per cent of intu Chapelfield. This transaction completed on 31 January 2018 (see note 34) following the receipt of EU merger approval. As a result, at 31 December 2017 in accordance with IFRS the Group classified 100 per cent of intu Chapelfield (which is part of the UK operating segment) and all its related assets and liabilities as held for sale. Assessing non-current assets and disposal groups held for sale is a significant judgement as referenced in note 1.
The assets and liabilities below at 31 December 2017 are presented at their carrying amount. There were no material differences between their carrying amount and fair value less costs to sell.
£m
Assets of disposal groups classified as held for sale
Investment and development property 302.0
Cash and cash equivalents 0.5
Trade and other receivables 6.6
Total 309.1
Liabilities of disposal groups classified as held for sale
Trade and other payables (6.2)
Total (6.2)
Strategic reportFin
ancial statem
ents
Other in
formation
Govern
ance
149intu properties plc Annual report 2018

Notes to the financial statements continued
150 intu properties plc Annual report 2018
36 Capital commitments At 31 December 2018 the Board had approved £233.0 million (2017: £253.8 million) of future expenditure for the purchase, construction, development and enhancement of investment property. Of this, £188.5 million (2017: £145.9 million) is contractually committed. The majority of this is expected to be spent during 2019 and 2020.
37 Cash generated from operations
Notes
Group 2018
£m
Group 2017
£m
Company 2018
£m
Company 2017
£m
(Loss)/profit before tax, joint ventures and associates (1,139.6) 190.4 (187.0) 36.0
Adjusted for:
Revaluation of investment and development property 14 1,332.8 (30.8) – –
Loss on disposal of subsidiaries 4 8.5 1.8 – –
Gain on sale of investment and development property (1.4) – – –
Depreciation 4.3 2.9 4.0 2.5
Share-based payments 40 2.8 2.3 2.8 2.3
Lease incentives and letting costs (9.3) (4.1) – –
Reversal of impairment of investment in Group companies 15 – – 173.2 (67.0)
Reversal of impairment of amounts owed by subsidiary undertakings – – – (24.4)
Net finance costs/(income) 9 147.5 218.2 (16.5) 36.4
Changes in working capital:
Change in trade and other receivables (5.3) (0.6) 253.9 151.4
Change in trade and other payables (20.6) (14.5) (186.6) (135.0)
Cash generated from operations 319.7 365.6 43.8 2.2
Financial statements
150 intu properties plc Annual report 2018
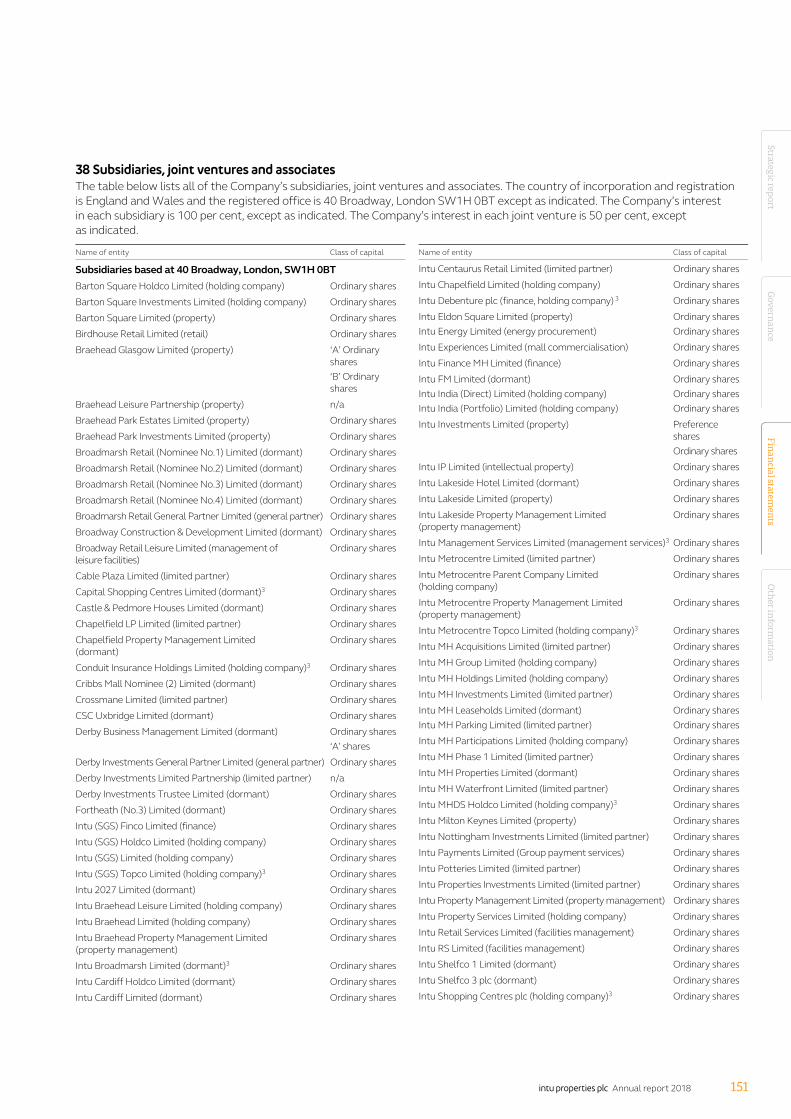
intu properties plc Annual report 2018 151
Financial statements
38 Subsidiaries, joint ventures and associates The table below lists all of the Company’s subsidiaries, joint ventures and associates. The country of incorporation and registration is England and Wales and the registered office is 40 Broadway, London SW1H 0BT except as indicated. The Company’s interest in each subsidiary is 100 per cent, except as indicated. The Company’s interest in each joint venture is 50 per cent, except as indicated.
Name of entity Class of capital
Subsidiaries based at 40 Broadway, London, SW1H 0BT Barton Square Holdco Limited (holding company) Ordinary shares
Barton Square Investments Limited (holding company) Ordinary shares
Barton Square Limited (property) Ordinary shares
Birdhouse Retail Limited (retail) Ordinary shares
Braehead Glasgow Limited (property) ‘A’ Ordinary shares ‘B’ Ordinary shares
Braehead Leisure Partnership (property) n/a
Braehead Park Estates Limited (property) Ordinary shares
Braehead Park Investments Limited (property) Ordinary shares
Broadmarsh Retail (Nominee No.1) Limited (dormant) Ordinary shares
Broadmarsh Retail (Nominee No.2) Limited (dormant) Ordinary shares
Broadmarsh Retail (Nominee No.3) Limited (dormant) Ordinary shares
Broadmarsh Retail (Nominee No.4) Limited (dormant) Ordinary shares
Broadmarsh Retail General Partner Limited (general partner) Ordinary shares
Broadway Construction & Development Limited (dormant) Ordinary shares
Broadway Retail Leisure Limited (management of leisure facilities)
Ordinary shares
Cable Plaza Limited (limited partner) Ordinary shares
Capital Shopping Centres Limited (dormant)3 Ordinary shares
Castle & Pedmore Houses Limited (dormant) Ordinary shares
Chapelfield LP Limited (limited partner) Ordinary shares
Chapelfield Property Management Limited (dormant)
Ordinary shares
Conduit Insurance Holdings Limited (holding company)3 Ordinary shares
Cribbs Mall Nominee (2) Limited (dormant) Ordinary shares
Crossmane Limited (limited partner) Ordinary shares
CSC Uxbridge Limited (dormant) Ordinary shares
Derby Business Management Limited (dormant) Ordinary shares ‘A’ shares
Derby Investments General Partner Limited (general partner) Ordinary shares
Derby Investments Limited Partnership (limited partner) n/a
Derby Investments Trustee Limited (dormant) Ordinary shares
Fortheath (No.3) Limited (dormant) Ordinary shares
Intu (SGS) Finco Limited (finance) Ordinary shares
Intu (SGS) Holdco Limited (holding company) Ordinary shares
Intu (SGS) Limited (holding company) Ordinary shares
Intu (SGS) Topco Limited (holding company)3 Ordinary shares
Intu 2027 Limited (dormant) Ordinary shares
Intu Braehead Leisure Limited (holding company) Ordinary shares
Intu Braehead Limited (holding company) Ordinary shares
Intu Braehead Property Management Limited (property management)
Ordinary shares
Intu Broadmarsh Limited (dormant)3 Ordinary shares
Intu Cardiff Holdco Limited (dormant) Ordinary shares
Intu Cardiff Limited (dormant) Ordinary shares
Name of entity Class of capital
Intu Centaurus Retail Limited (limited partner) Ordinary shares
Intu Chapelfield Limited (holding company) Ordinary shares
Intu Debenture plc (finance, holding company) 3 Ordinary shares
Intu Eldon Square Limited (property) Intu Energy Limited (energy procurement)
Ordinary shares Ordinary shares
Intu Experiences Limited (mall commercialisation) Ordinary shares
Intu Finance MH Limited (finance) Ordinary shares
Intu FM Limited (dormant) Intu India (Direct) Limited (holding company) Intu India (Portfolio) Limited (holding company)
Ordinary shares Ordinary shares Ordinary shares
Intu Investments Limited (property) Preference shares Ordinary shares
Intu IP Limited (intellectual property) Ordinary shares
Intu Lakeside Hotel Limited (dormant) Ordinary shares
Intu Lakeside Limited (property) Ordinary shares
Intu Lakeside Property Management Limited (property management)
Ordinary shares
Intu Management Services Limited (management services)3 Ordinary shares
Intu Metrocentre Limited (limited partner) Ordinary shares
Intu Metrocentre Parent Company Limited (holding company)
Ordinary shares
Intu Metrocentre Property Management Limited (property management)
Ordinary shares
Intu Metrocentre Topco Limited (holding company)3 Ordinary shares
Intu MH Acquisitions Limited (limited partner) Ordinary shares
Intu MH Group Limited (holding company) Ordinary shares
Intu MH Holdings Limited (holding company) Ordinary shares
Intu MH Investments Limited (limited partner) Ordinary shares
Intu MH Leaseholds Limited (dormant) Intu MH Parking Limited (limited partner)
Ordinary shares Ordinary shares
Intu MH Participations Limited (holding company) Ordinary shares
Intu MH Phase 1 Limited (limited partner) Ordinary shares
Intu MH Properties Limited (dormant) Ordinary shares
Intu MH Waterfront Limited (limited partner) Ordinary shares
Intu MHDS Holdco Limited (holding company)3 Ordinary shares
Intu Milton Keynes Limited (property) Ordinary shares
Intu Nottingham Investments Limited (limited partner) Ordinary shares
Intu Payments Limited (Group payment services) Ordinary shares
Intu Potteries Limited (limited partner) Ordinary shares
Intu Properties Investments Limited (limited partner) Ordinary shares
Intu Property Management Limited (property management) Ordinary shares
Intu Property Services Limited (holding company) Ordinary shares
Intu Retail Services Limited (facilities management) Ordinary shares
Intu RS Limited (facilities management) Ordinary shares
Intu Shelfco 1 Limited (dormant) Ordinary shares
Intu Shelfco 3 plc (dormant) Ordinary shares
Intu Shopping Centres plc (holding company)3 Ordinary shares
Strategic reportFin
ancial statem
ents
Other in
formation
Govern
ance
151intu properties plc Annual report 2018

Notes to the financial statements continued
152 intu properties plc Annual report 2018
38 Subsidiaries, joint ventures and associates (continued) Name of entity Class of capital
Intu Spain Limited (holding company) Ordinary shares
Intu The Hayes Limited (limited partner) Ordinary shares
Intu Trafford Centre Group (UK) Limited (holding company) Ordinary shares
Intu Trafford Centre Limited (dormant) Ordinary shares
Intu Ventures Limited (dormant) Ordinary shares
Intu Victoria Centre Limited (dormant)3 Ordinary shares
Intu Watford Holdco Limited (dormant) Ordinary shares
Intu Watford Limited (property) Ordinary shares
Intu Watford Property Management Limited (property management)
Ordinary shares
IntuDigital Holdco Limited (holding company) ‘A’ Ordinary shares ‘B’ Ordinary shares
IntuDigital Limited (digital services) Ordinary shares
Kindmotive Limited (dormant) Cumulative redeemable preference shares Ordinary shares
Lakeside 1988 Limited (dormant) ‘A’ Ordinary shares ‘B’ Redeemable preference shares ‘C’ Preference shares
Liberty Capital PLC (dormant)3 Ordinary shares
Liberty International Construction and Development Limited (dormant)3
Ordinary shares
Liberty International Financial Services Limited (holding company)
Ordinary shares
Liberty International Group Treasury Limited (treasury management)
Ordinary shares
Liberty International Holdings Limited (holding company)1 Ordinary shares
Manchester Nominee (2) Limited (dormant) Ordinary shares
Merry Hill Management Services Limited (dormant) Ordinary shares
Merry Hill Services Limited (dormant) Ordinary shares
Merry Hill Trading Limited (dormant) Ordinary shares
Metrocentre (GP) Limited (general partner) Ordinary shares
Metrocentre (Holdco) Limited (holding company) Ordinary shares
Metrocentre (Nominee No.1) Limited (dormant) Ordinary shares
Metrocentre (Nominee No.2) Limited (dormant) Ordinary shares
Metrocentre (Subco) Limited (holding company) Ordinary shares
Metrocentre Lancaster LLP (property)4 n/a
Metrocentre Lancaster No.1 Limited (limited partner) Ordinary shares
Metrocentre Lancaster No.2 Limited (dormant) Ordinary shares
MH (No.1) General Partner Limited (general partner) Ordinary shares
MH (No.1) Limited Partnership (property) n/a
MH (No.1) Nominee A Limited (dormant) Ordinary shares
MH (No.1) Nominee B Limited (dormant) Ordinary shares
MH (No.2) General Partner Limited (general partner) Ordinary shares
MH (No.2) Limited Partnership (property) n/a
MH (No.2) Nominee A Limited (dormant) Ordinary shares
Name of entity Class of capital
MH (No.2) Nominee B Limited (dormant) Ordinary shares
MH (No.3) General Partner Limited (general partner) Ordinary shares
MH (No.3) Limited Partnership (property) n/a
MH (No.3) Nominee A Limited (dormant) Ordinary shares
MH (No.3) Nominee B Limited (dormant) Ordinary shares
MH (No.4) General Partner Limited (general partner) Ordinary shares
MH (No.4) Limited Partnership (property) n/a
MH (No.4) Nominee A Limited (dormant) Ordinary shares
MH (No.4) Nominee B Limited (dormant) Ordinary shares
MH (No.5) General Partner Limited (general partner) Ordinary shares
MH (No.5) Limited Partnership (property) n/a
MH (No.5) Nominee A Limited (dormant) Ordinary shares
MH (No.5) Nominee B Limited (dormant) Ordinary shares
MH (No.6) General Partner Limited (general partner) Ordinary shares
MH (No.6) Limited Partnership (property) n/a
MH (No.6) Nominee A Limited (dormant) Ordinary shares
MH (No.6) Nominee B Limited (dormant) Ordinary shares
MH (No.7) General Partner Limited (general partner) Ordinary shares
MH (No.7) Limited Partnership (property) n/a
MH (No.7) Nominee A Limited (dormant) Ordinary shares
MH (No.7) Nominee B Limited (dormant) Ordinary shares
MH (No.8) General Partner Limited (general partner) Ordinary shares
MH (No.8) Limited Partnership (dormant) n/a
MH (No.8) Nominee A Limited (dormant) Ordinary shares
MH (No.8) Nominee B Limited (dormant) Ordinary shares
Middleford Property Investments Limited (dormant) Ordinary shares
Potteries (GP) Limited (general partner) Ordinary shares
Potteries (Nominee No.1) Limited (dormant) Ordinary shares
Potteries (Nominee No.2) Limited (dormant) Ordinary shares
Runic Nominees Limited (dormant) Ordinary shares
Sandal Investments Limited (dormant) Ordinary shares
Staffordshire Property Management Limited (property) Ordinary shares
TAI Investments Limited (holding company)2 ‘B’ Deferred shares Ordinary shares
TAI Nominees Limited (dormant) Ordinary shares
The Broadmarsh Retail Limited Partnership (property) n/a
The Bullfinch Company Limited (dormant) Ordinary shares
The Metrocentre Partnership (property)4 n/a
The Potteries Shopping Centre Limited Partnership (property)
n/a
The Trafford Centre Holdings Limited (holding company) Ordinary shares
The Trafford Centre Investments Limited (holding company) Ordinary shares
The Trafford Centre Limited (property) ‘A’ Preference shares ‘B’ Preference shares Ordinary shares
The Victoria Centre Partnership (property) n/a
The Wilmslow (No.3) Limited Partnership (property) n/a
TransAtlantic Holdings Limited (dormant) Ordinary shares
Transol Investments Limited (dormant) Ordinary shares
Financial statements
152 intu properties plc Annual report 2018

intu properties plc Annual report 2018 153
Financial statements
38 Subsidiaries, joint ventures and associates (continued) Name of entity Class of capital
VCP (GP) Limited (general partner) Ordinary shares
VCP Nominees No.1 Limited (dormant) Ordinary shares
VCP Nominees No.2 Limited (dormant) Ordinary shares
Westgate Oxford Investments Limited (dormant) Whitesun Limited (dormant)
Ordinary shares Ordinary shares
Wilmslow (No.3) (Nominee A) Limited (dormant) Ordinary shares
Wilmslow (No.3) (Nominee B) Limited (dormant) Ordinary shares
Wilmslow (No.3) General Partner Limited (general partner) ‘A’ Ordinary shares ‘B’ Ordinary shares
WRP Management Limited (property) Ordinary shares
Subsidiaries based at 27 Esplanade, St Helier, Jersey, JE1 1SG Belside Limited (property) Ordinary shares
Curley Limited (property) Ordinary shares
Steventon Limited (property) Ordinary shares
Subsidiaries based at 22 Grenville Street, St Helier, Jersey, JR4 8PX Intu (Jersey) 2 Limited (finance)3 Ordinary shares
Intu (Jersey) Limited (finance)3 Ordinary shares
Intu Derby 2 Limited (holding company) Ordinary shares
Intu Derby Jersey Unit Trust (limited partner) Units
Intu Derby Limited (holding company) Ordinary shares
Intu Merry Hill 2 Limited (holding company) Ordinary shares
Intu Merry Hill Limited (holding company) Ordinary shares
Intu MH (No.1) Jersey Unit Trust (limited partner) Units
Intu MH (No.1) Sub-Trust (limited partner) Units
Intu MH (No.2) Jersey Unit Trust (limited partner) Units
Intu MH (No.2) Sub-Trust (limited partner) Units
Intu MH (No.3) Jersey Unit Trust (limited partner) Units
Intu MH (No.3) Sub-Trust (limited partner) Units
Intu MH (No.4) Jersey Unit Trust (limited partner) Units
Intu MH (No.4) Sub-Trust (limited partner) Units
Intu MH (No.5) Jersey Unit Trust (limited partner) Units
Intu MH (No.5) Sub-Trust (limited partner) Units
Intu MH (No.6) Jersey Unit Trust (limited partner) Units
Intu MH (No.6) Sub-Trust (limited partner) Units
Intu MH (No.7) Jersey Unit Trust (limited partner) Units
Intu MH (No.7) Sub-Trust (limited partner) Units
Intu MH (No.8) Jersey Unit Trust (limited partner) Units
Intu Sprucefield 2 Limited (holding company) Ordinary shares
Intu Sprucefield Limited (holding company) Ordinary shares
Intu Uxbridge Holdco Limited (holding company) Ordinary shares
Midlands Shopping Centre Jersey Unit Trust (No.1) (limited partner)
Units
Sprucefield No.1 Nominee Limited (dormant) Ordinary shares
Sprucefield No.2 General Partner Limited (general partner) Ordinary shares
Sprucefield No.2 Limited Partnership (property) n/a
Sprucefield No.2 Nominee Limited (dormant) Ordinary shares
Name of entity Class of capital
Sprucefield Unit Trust (limited partner) Units
W (No.3) GP (Nominee A) Limited (dormant) Ordinary shares
W (No.3) GP (Nominee B) Limited (dormant) Ordinary shares
Subsidiaries based at 7 Rue Robert Stumper, L-2557, Luxembourg ICS Holding S.à r.l. (holding company) Ordinary shares
ICS InvestCo S.à r.l. (holding company) Ordinary shares
ICS JV S.à r.l. (holding company) Ordinary shares
Intu Holding S.à r.l. (holding company) Ordinary shares
Subsidiaries based at Paseo de la Castellana 64, 28046, Madrid, Spain Daytrade Inversiones 2014 S.L. (intellectual property) Ordinary shares
Gravois Desarrollos S.L. (property) Ordinary shares
Intu Costa del Sol Resort Holdco S.A. (holding company) Ordinary shares
Intu Costa del Sol Resort S.L. (property) Ordinary shares
Intu Management Spain S.L. (property management and management services)
Ordinary shares
Ocio y Nieve S.L. (property management) Ordinary shares
Rosholt Invest S.L. (property) Ordinary shares
Wattenberg Invest S.L. (property) Ordinary shares
Other subsidiaries Intu Management Spain Holding S.à r.l. (holding company) (6 Rue Eugène Ruppert, L-2453 Luxembourg)
Ordinary shares
Intu Trafford Centre Group Limited (holding company)3 (Cains Fiduciary, Fort Anne, Douglas, Isle of Man, IM1 1LB)
Ordinary shares
Libint (Proprietary) Limited (local administration services) (Liberty Life Centre, 1 Ameshoff Street, Braamfontein, Johannesburg 2007, South Africa)3
Ordinary shares
Libtai Holdings (Jersey) Limited (holding company) (PO Box 761 Ordnance House 31 Pier Road, St Helier, Jersey, JE4 8ZZ)3
Ordinary shares
Merry Hill Finance Designated Activity Company (finance) (6th Floor, Pinnacle 2, Eastpoint Business Park, Dublin, Republic of Ireland) (in liquidation)
Ordinary shares
Nailsfield Limited (holding company) (IFS Court, Twentyeight, Cybercity, Ebene, Mauritius)3
Ordinary shares
The Trafford Centre Finance Limited (finance) (190 Elgin Avenue, George Town, Grand Cayman, KY1-9007, Cayman Islands)
Ordinary shares
Joint ventures based at 40 Broadway, London, SW1H 0BT Centaurus Retail LLP (property) n/a
Chapelfield GP Limited (general partner) Ordinary shares
Chapelfield Nominee Limited (dormant) Ordinary shares
Cribbs Causeway JV Limited (property management) ‘A’ Ordinary shares ‘B’ Ordinary shares
Intu Chapelfield Residential Limited (property) Ordinary shares
The Chapelfield Partnership (property) n/a
Manchester JV Limited (property management) ‘A’ Ordinary shares ‘B’ Ordinary shares
Strategic reportFin
ancial statem
ents
Other in
formation
Govern
ance
153intu properties plc Annual report 2018

Notes to the financial statements continued
154 intu properties plc Annual report 2018
38 Subsidiaries, joint ventures and associates (continued) Name of entity Class of capital
Joint ventures based at 100 Victoria Street, London, SW1E 5JL St. David’s (Cardiff Residential) Limited (property) Ordinary shares
St. David’s (General Partner) Limited (general partner) ‘A’ Ordinary shares ‘B’ Ordinary shares
St. David’s (No.1) Limited (dormant) Ordinary shares
St. David’s (No.2) Limited (dormant) Ordinary shares
St. David’s Limited Partnership (property) n/a
Joint ventures based at Paseo de la Castellana 64, 28046, Madrid, Spain Asturias Propco Numero Uno S.L. (property) Ordinary shares
Asturias Retail and Leisure SOCIMI S.A. (holding company) Ordinary shares
Intu Eurofund Valencia S.L. (property development) Ordinary shares
Intu Eurofund Vigo S.L. (property development) Ordinary shares
Madrid Xanadú 2003 S.L. (property) Ordinary shares
Puerto Venecia Investments SOCIMI S.A. (property) Ordinary shares
SnowZone S.L. (leisure) Ordinary shares
Xanadú Retail and Leisure S.L. (holding company) Ordinary shares
Zaragoza Properties SOCIMI S.A. (holding company) Ordinary shares
Name of entity Class of capital
Joint ventures based at 7 Rue Robert Stumper, L-2557, Luxembourg Intu Eurofund Developments S.à r.l. (holding company) Ordinary shares
Intu Zaragoza Holding S.à r.l. (holding company) Ordinary shares
Intu Zaragoza S.à r.l. (holding company) Ordinary shares
Parque Principado S.à r.l. (holding company) ‘A’ shares ‘B’ shares
Other joint ventures Metropolitan Retail JV (Jersey) Unit Trust (property) 7 (28 – 30 The Parade, St Helier, Jersey, JE1 1EQ)
‘A’ units ‘B’ units
St. David’s Unit Trust (limited partner) (22 Grenville Street, St Helier, Jersey, JR4 8PX)
Units
Associates based at 105-106 Provogue House, Off New Link Road, Andheri (West) Mumbai, 400 053 India Empire Mall Private Limited (property)5 Ordinary shares
Prozone Intu Properties Limited (property)6 Ordinary shares
1 40.2 per cent is held by intu properties plc, 31.1 per cent is held by Conduit Insurance Holdings Limited and 28.7 per cent is held by TAI Investments Limited. 2 95.4 per cent is held by Libtai Holdings (Jersey) Limited and 4.6 per cent is held by intu properties plc. 3 Related undertaking held directly by intu properties plc. 4 Group’s interest is 60 per cent. 5 Group’s interest is 26.8 per cent. 6 Group’s interest is 32.4 per cent. 7 Group’s interest is 20 per cent. This is classified as a joint venture due to an equal voting interest.
Financial statements
154 intu properties plc Annual report 2018

intu properties plc Annual report 2018 155
Financial statements
38 Subsidiaries, joint ventures and associates (continued) Other entities Intu (SGS) Finance plc and Intu Metrocentre Finance plc are consolidated as subsidiaries in these financial statements but are not listed in the table above as the Group does not own the shares in these companies. These companies are vehicles set up on behalf of the Group for the sole purpose of issuing some of the Group’s listed debt. The Group’s obligations in respect of this debt via a back-to-back intercompany loan agreement between these companies and other Group companies, and security over investment property via a deed of charge between the security trustees and other Group companies, mean that the Group is deemed to have control of these companies.
Non-controlling interests By virtue of their 40 per cent interest in The Metrocentre Partnership, GIC Real Estate is entitled to appoint 40 per cent of the directors of Metrocentre (GP) Limited. £12.4 million of the non-controlling interest shown in the balance sheet at 31 December 2018 (2017: £53.9 million) and £41.5 million of the non-controlling interest share of loss shown in the income statement for the year ended 31 December 2018 (2017: share of loss £13.5 million) relates to GIC Real Estate’s interest. Set out below is the summarised financial information of The Metrocentre Partnership at 100 per cent, as consolidated:
2018
£m 2017
£m
Summarised income statement
Revenue 68.2 68.5
Loss for the year (103.4) (33.7)
Summarised balance sheet
Investment and development property 819.8 908.3
Borrowings (953.8) (938.1)
Other net liabilities (11.7) (12.5)
Net liabilities (145.7) (42.3)
During 2017 the Group acquired the 49 per cent non-controlling interest in Intu Retail Services Limited from Bilfinger Europa Facilities Management Limited for consideration of £1. Prior to the transaction, no amount was included within the non-controlling interest shown in the balance sheet and nil of the non-controlling interest share of loss shown in the income statement for the year ended 31 December 2017 related to their interest.
39 Related party transactions Key management1 compensation is analysed below:
2018
£m 2017
£m
Salaries and short-term employee benefits 4.9 5.4
Pensions and other post-employment benefits 0.8 0.7
Share-based payments 1.7 2.0
7.4 8.1
1 Key management comprises the Directors of intu properties plc and the Executive Committee who have been designated as persons discharging managerial responsibility (PDMR).
During 2017 the Group’s joint ventures in intu Puerto Venecia and intu Asturias sold shares in subsidiaries, previously wholly owned by the respective joint ventures, listed on the Spanish MaB to PDMR’s of the Group. The total value of the shares at 31 December 2018 is €1.3 million for each joint venture, representing 1 per cent of the respective outstanding share capital. The sale of shares in these entities was required to comply with Spanish MaB free float listing requirements. The Group provided an interest-free loan to PDMR’s to enable them to purchase the shares. The loans are treated as a taxable benefit which accordingly is included in the above table.
As John Whittaker, Deputy Chairman and Non-Executive Director of intu properties plc, is the Chairman of the Peel Group (Peel), members of Peel are considered to be related parties. Total transactions between the Group and members of Peel are shown below:
2018
£m 2017
£m
Income 1.3 1.3
Expenditure (0.7) (0.6)
Strategic reportFin
ancial statem
ents
Other in
formation
Govern
ance
155intu properties plc Annual report 2018

156
Notes to the financial statements continued
156 intu properties plc Annual report 2018
intu properties plc Annual report 2018
39 Related party transactions (continued) Income predominantly relates to leases of office space and contracts to provide advertising services. Expenditure predominantly relates to costs incurred under a management services agreement, travel costs and the supply of utilities. All contracts are on an arm’s length basis at commercial rates.
Balances outstanding between the Group and members of Peel at 31 December 2018 and 31 December 2017 are shown below:
2018
£m 2017
£m
Net investment in finance lease 1.2 1.6
Amounts owed by members of Peel 0.3 1.0
Amounts owed to members of Peel (0.1) –
Under the terms of the Group’s acquisition of intu Trafford Centre from Peel in 2011, Peel have provided a guarantee in respect of Section 106 planning obligation liabilities at Barton Square which at 31 December 2018 totalled £12.4 million (2017: £12.4 million).
During 2016, the Group agreed terms on three advertising services agreements related to digital screens with Peel Advertising Limited (a member of Peel) under which Peel will procure advertising on behalf of the Group. The minimum fixed payments in these agreements have been classified as a finance lease (see net investment in finance lease above).
Transactions between the Company and its subsidiaries, which are related parties, have been eliminated on consolidation in the Group’s financial information.
Significant transactions between the Company and its subsidiaries are shown below:
2018
£m 2017
£m
Interest expense (16.9) (24.4)
Interest income 9.8 12.2
Additions to investment in subsidiaries – 4.4
The Company has provided Intu (Jersey) 2 Limited a guarantee over obligations in relation to the 2.875 per cent convertible bonds and Intu (Jersey) Limited over obligations in relation to the 2.5 per cent convertible bonds, which matured in 2018 (see note 26).
Significant balances outstanding between the Company and its subsidiaries are shown within notes 15, 20 and 23.
40 Share-based payments The Group operates a number of share-based payment arrangements providing employee benefits and incentives. All schemes are equity settled, and as such the expense recognised in the income statement is based on the fair value of the equity instruments awarded as determined at their grant date. The expense is recognised on a straight-line basis over the vesting period based on Group estimates of the number of shares that are expected to vest.
In 2018 the total share-based payment charge was £2.8 million (2017: £2.3 million). Details of share options outstanding under each of the Group’s schemes is set out below:
Note
Outstanding 1 January 2018
Granted during the year
Exercised during the year
Expired/forfeited during the year
Outstanding 31 December 2018
Exercisable 31 December 2018
Share Option Scheme1 A 11,015,807 – – (3,077,206) 7,938,601 4,846,101 Performance Share Plan1 B 6,047,934 2,519,983 (348,828)2 (1,210,829) 7,008,260 n/a Bonus Share Scheme C 1,343,098 1,039,095 (509,659)2 (45,168) 1,827,366 n/a Share incentive plan3 D 360,533 – (28,470)2 (88,936) 243,127 n/a Save as you earn scheme E 207,518 65,319 – (53,701) 219,136 –
1 Includes share interests held jointly under the Joint Share Ownership Plan. See F below for further details. 2 Shares ordinarily exercised immediately on vested date. 3 Relates to non-vested SIP bonus shares granted.
In respect of the Share Option Scheme, the weighted average exercise prices of the outstanding options and outstanding options exercisable at 31 December 2018 are 302 pence and 309 pence respectively (2017: 293 pence and 274 pence respectively). No options were exercised during the year.
In respect of the save as you earn scheme, the weighted average exercise prices of the outstanding options and outstanding options exercisable at 31 December 2018 are 224 pence and nil respectively (2017: 260 pence and nil respectively).
Financial statements
156 intu properties plc Annual report 2018

intu properties plc Annual report 2018 157
Financial statements
40 Share-based payments (continued) During 2017 the Group incurred a £49.4 million share related charge in relation to its Spanish development partner Eurofund’s future interests in the share capital of the intu Costa del Sol development company. The positive impact of this share related charge on equity attributable to owners of intu properties plc, a credit to retained earnings of £49.4 million, is expected to reverse once these arrangements are concluded.
A Share Option Scheme Options to subscribe for ordinary shares may be awarded under the intu properties plc Company Share Option Plan and the intu properties plc non-approved Executive Share Option Scheme.
Such options may not be exercised within three years of grant or before the satisfaction or waiver of any applicable performance conditions, and will be forfeited if the employee leaves the Group before their options become capable of exercise, except in certain circumstances. The options will lapse if not exercised within 10 years of the date of grant.
B Performance Share Plan (PSP) The Company operates a PSP for eligible employees at the discretion of the Remuneration Committee.
Awards may be made in the form of nil cost options, a conditional share award or a joint share ownership award and fixed-value zero-cost option, and eligible employees may be granted any combination of such awards subject to any individual limits.
Vesting of PSP awards is based on Total Shareholder Return (TSR) and Total Financial Return (TFR). Half of the awards vest by reference to TFR (25 per cent vesting for 6 per cent per annum return; full vesting for 10 per cent per annum; straight-line vesting in between). The remaining half of the awards vest by reference to TSR relative to the top-five UK-listed REITs (25 per cent return vesting for TSR in line with the third-rated company; full vesting for TSR in line with the top-rated company; straight-line vesting in between) subject to a Remuneration Committee-operated discretionary assessment of underlying financial performance. One third of each award will vest in line with performance measured over three years, four years and five years respectively.
C Bonus Share Scheme (Bonus Scheme) Under the Company’s Bonus Scheme, shares may be awarded on a deferred basis as part of a bonus award (Deferred Share Awards).
Deferred Share Awards comprise ‘Restricted Shares’ and ‘Additional Shares’. Restricted Shares will vest two or three years after the date of their award and Additional Shares will vest four or five years after the date of award. Vesting is subject, under normal circumstances, to continued employment during the vesting or ‘restricted’ period. There are no further performance conditions applicable to either Restricted Shares or Additional Shares.
Where awarded, the number of Additional Shares would be equal to 50 per cent of the combined total of shares awarded as Restricted Shares and under the Share Incentive Plan (see below). No Additional Shares were outstanding at 1 January 2017 and no awards of Additional Shares have been made in 2017 or 2018.
D Share Incentive Plan (SIP) The Company operates a SIP for all eligible employees, who may receive up to £3,600 worth of shares (Free Shares) as part of their annual bonus. The SIP is an HM Revenue & Customs (HMRC) tax advantaged scheme.
Any Free Shares awarded under the SIP will be held in trust on behalf of each employee for three years following grant, after which time they may be withdrawn, provided the individual employee has remained in employment with the Company. If the Free Shares are held in trust for a further two years, they will qualify for HMRC approved tax advantages.
As part of the SIP arrangements, the Company also offers eligible employees the opportunity to participate in a ‘Partnership’ share scheme, under which employees can invest up to £150 of salary each month which will be used to purchase ordinary shares in the Company (Partnership Shares) at the end of a 12-month period. The Group will give each employee one ordinary share (a ‘Matching Share’) for every two Partnership Shares purchased by the employee. Matching Shares will be forfeited if the employee leaves the Group within three years of the date of award, and will qualify for HMRC tax advantages if they are held in the SIP for five years.
E Save As You Earn Scheme (SAYE) The Group operates a SAYE under which all eligible UK employees may save up to a maximum of £500 per month for a period of three or five years and use the proceeds at the end of their saving period to purchase shares in the Company. At the start of the saving period, each SAYE participant will be granted an option to purchase such shares at a price usually determined as the average mid-market closing share price of an ordinary share in the Company over the three consecutive dealing days preceding the SAYE invitation date, discounted by up to 20 per cent. Options may normally be exercised within six months following the end of the savings period.
Strategic reportFin
ancial statem
ents
Other in
formation
Govern
ance
157intu properties plc Annual report 2018

158
Notes to the financial statements continued
158 intu properties plc Annual report 2018
intu properties plc Annual report 2018
40 Share-based payments (continued) F Joint Share Ownership Plan (JSOP) Eligible employees were invited to participate in the JSOP which forms part of the intu properties plc unapproved share option scheme and the PSP. Under the JSOP, shares are held jointly by the employee and the employee share ownership plan trustee with any increases in the share price and dividends paid on those shares being allocated between the joint owners in accordance with the terms of the scheme.
Conditions under which JSOP interests may be exercised (including applicable performance conditions), are the same as those for the unapproved share option scheme and PSP as outlined above.
41 Pensions The Group operates defined contribution group pension plans for its staff. All contributions are invested in funds administered outside of the Group. The Group has no defined benefit schemes.
The pension charge for the Group’s contributions to these arrangements is the amount paid which totalled £5.0 million for the year ended 31 December 2018 (2017: £4.4 million).
42 Directors’ interests and emoluments (a) Shares in the Company The number of ordinary shares of the Company in which the Directors were beneficially interested at 31 December 2018 were:
2018 2017
Chairman:
John Strachan 30,000 30,000
Deputy Chairman:
John Whittaker1 370,220,322 368,635,097
Executive:
David Fischel 1,272,433 1,155,030
Matthew Roberts 433,387 341,992
Non-Executive:
Adèle Anderson 32,504 32,504
Ian Burke2 – n/a
Richard Gordon3 7,005,211 7,005,211
Rakhi Goss-Custard 7,383 7,383
Louise Patten3 12,857 12,857
Andrew Strang2 n/a –
1 Total beneficial interest includes shares held by subsidiaries of the Peel Group of which John Whittaker is the Chairman. 2 Andrew Strang stepped down from the Board on 30 September 2018 and Ian Burke was appointed to the Board on 1 October 2018. 3 Richard Gordon stepped down from the Board and Louise Patten retired from the Board on 18 February 2019.
Conditional awards of shares have previously been made to executive directors under the Company’s Bonus Scheme.
Executive directors were required to retain the shares, net of shares sold to meet tax and PAYE deductions, which vested ahead of the normal vesting date.
Financial statements
158 intu properties plc Annual report 2018

intu properties plc Annual report 2018 159
Financial statements
42 Directors’ interests and emoluments (continued) Awards to executive directors under the Bonus Scheme are as follows:
Award date
Market price at
award (pence)
Original vesting
date
Market price at vesting (pence)
Number of shares at
31 December 2017
Number of shares
awarded during 2018
Number of shares vested
during 2018
Number of shares at
31 December 2018
David Fischel 11/03/2015 349 11/03/2018 212 29,446 4,349* (33,795) – 07/03/2016 300 07/03/2018 209 53,863 5,625* (59,488) – 07/03/2016 300 07/03/2019 – 52,663 – – 52,663 07/03/2017 285 07/03/2019 – 58,905 – – 58,905 07/03/2017 285 07/03/2020 – 57,642 – – 57,642 09/03/2018 208 09/03/2020 – – 52,354 – 52,354 09/03/2018 208 09/03/2021 – – 52,354 – 52,354
Matthew Roberts 11/03/2015 349 11/03/2018 212 23,122 3,415* (26,537) – 07/03/2016 300 07/03/2018 209 42,471 4,435* (46,906) – 07/03/2016 300 07/03/2019 – 41,271 – – 41,271 07/03/2017 285 07/03/2019 – 46,982 – – 46,982 07/03/2017 285 07/03/2020 – 45,719 – – 45,719 09/03/2018 208 09/03/2020 – – 41,322 – 41,322 09/03/2018 208 09/03/2021 – – 41,322 – 41,322 * Dividend received for their two and three year holding period.
Details of Restricted and Additional shares awarded in respect of the year ended 31 December 2018 are given in the Directors’ remuneration report on pages 78 to 93.
(b) Share options in the Company Executive directors’ interests in share options, the PSP and the SIP are given in the Directors’ remuneration report on pages 78 to 93.
(c) Other disclosures No Director had any dealings in the shares of any Group company between 31 December 2018 and 20 February 2019, being the latest practicable date.
Other than as disclosed in these financial statements, no Director of the Company had a material interest in any contract (other than service contracts (as defined by s227 Companies Act 2006)), transaction or arrangement with any Group company during the year ended 31 December 2018.
(d) Emoluments The details of individual Directors’ remuneration and pension benefits, as set out in the tables contained in the Directors’ remuneration report on pages 78 to 93, form part of these financial statements.
Strategic reportFin
ancial statem
ents
Other in
formation
Govern
ance
159intu properties plc Annual report 2018
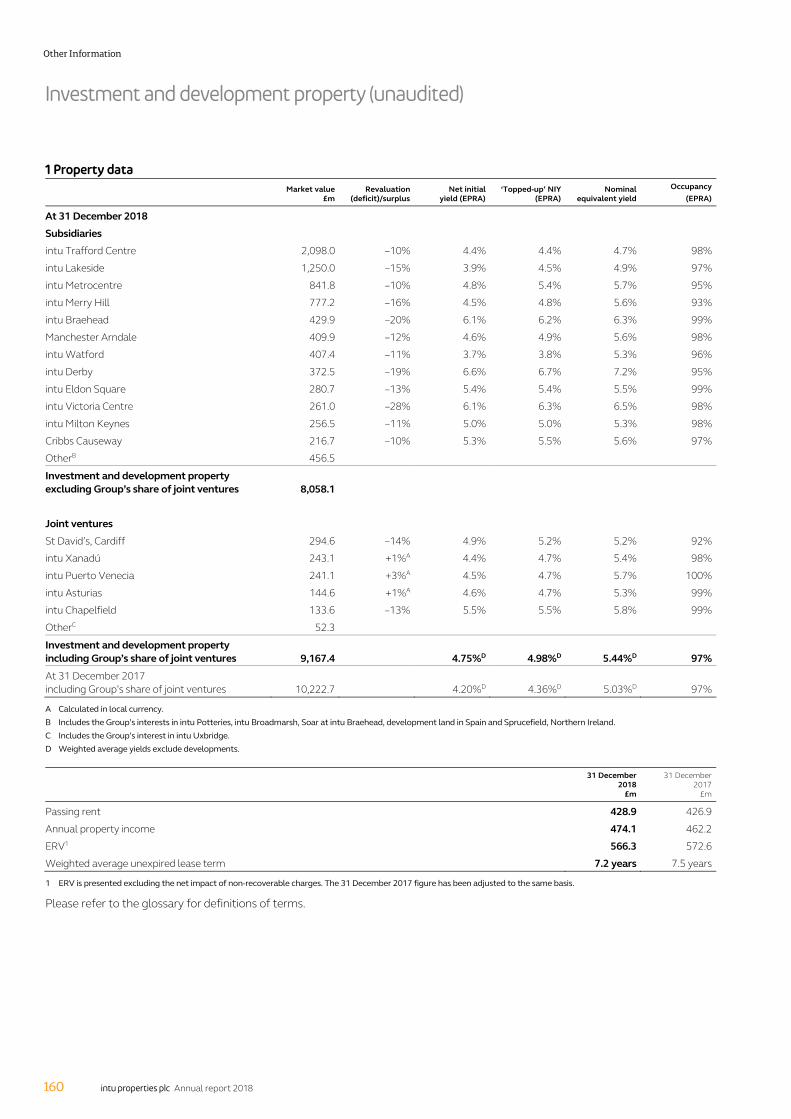
Investment and development property (unaudited)
160 intu properties plc Annual report 2018
1 Property data
Market value
£m Revaluation
(deficit)/surplus Net initial
yield (EPRA) ‘Topped-up’ NIY
(EPRA) Nominal
equivalent yield Occupancy
(EPRA)
At 31 December 2018
Subsidiaries
intu Trafford Centre 2,098.0 –10% 4.4% 4.4% 4.7% 98%
intu Lakeside 1,250.0 –15% 3.9% 4.5% 4.9% 97%
intu Metrocentre 841.8 –10% 4.8% 5.4% 5.7% 95%
intu Merry Hill 777.2 –16% 4.5% 4.8% 5.6% 93%
intu Braehead 429.9 –20% 6.1% 6.2% 6.3% 99%
Manchester Arndale 409.9 –12% 4.6% 4.9% 5.6% 98%
intu Watford 407.4 –11% 3.7% 3.8% 5.3% 96%
intu Derby 372.5 –19% 6.6% 6.7% 7.2% 95%
intu Eldon Square 280.7 –13% 5.4% 5.4% 5.5% 99%
intu Victoria Centre 261.0 –28% 6.1% 6.3% 6.5% 98%
intu Milton Keynes 256.5 –11% 5.0% 5.0% 5.3% 98%
Cribbs Causeway 216.7 –10% 5.3% 5.5% 5.6% 97%
OtherB 456.5
Investment and development property excluding Group’s share of joint ventures 8,058.1
Joint ventures
St David’s, Cardiff 294.6 –14% 4.9% 5.2% 5.2% 92%
intu Xanadú 243.1 +1%A 4.4% 4.7% 5.4% 98%
intu Puerto Venecia 241.1 +3%A 4.5% 4.7% 5.7% 100%
intu Asturias 144.6 +1%A 4.6% 4.7% 5.3% 99%
intu Chapelfield 133.6 –13% 5.5% 5.5% 5.8% 99%
OtherC 52.3
Investment and development property including Group’s share of joint ventures 9,167.4 4.75%D 4.98%D 5.44%D 97%
At 31 December 2017 including Group’s share of joint ventures 10,222.7 4.20%D 4.36%D 5.03%D 97%
A Calculated in local currency. B Includes the Group’s interests in intu Potteries, intu Broadmarsh, Soar at intu Braehead, development land in Spain and Sprucefield, Northern Ireland. C Includes the Group’s interest in intu Uxbridge. D Weighted average yields exclude developments.
31 December 2018
£m
31 December 2017
£m
Passing rent 428.9 426.9
Annual property income 474.1 462.2
ERV1 566.3 572.6
Weighted average unexpired lease term 7.2 years 7.5 years
1 ERV is presented excluding the net impact of non-recoverable charges. The 31 December 2017 figure has been adjusted to the same basis.
Please refer to the glossary for definitions of terms.
Other Information
160 intu properties plc Annual report 2018

intu properties plc Annual report 2018 161
Other inform
ation
2 Analysis of capital return in the year – including Group’s share of joint ventures Market value Revaluation (deficit)/surplus
2018
£m 2017
£m 2018
£m 2018
%
Like-for-like property 8,117.6 9,203.8 (1,178.9) (11.8) 50% retained interest in intu Chapelfield (classified as held for sale at 31 December 2017) 133.6 – (20.6) (13.4) Spain developments 232.3 212.8 (7.2) (3.4) UK other including developments1 683.9 806.1 (198.3) (21.5)
Total investment and development property 9,167.4 10,222.7 (1,405.0) (13.3)
1 UK other including developments represents valuation movements on investment and development property valued below £200 million each. This category also includes intu Watford (non like-for-like).
3 Additional property information
Ownership Note Form of
ownershipE Gross area million
sq ftF Year
opened Acquisition
dateG
At 31 December 2018
intu Trafford Centre 100% FH 2.0 1998 2011
intu Lakeside 100% FH 1.6 1990 –
intu Metrocentre 90% A LH 2.1 1986 1995
intu Merry Hill 100% FH 1.7 1985 2016I
intu Braehead 100% FH 1.1 1999 –
Manchester Arndale 48% B LH 1.8 1976 2005
intu Watford 93% LH 1.1 1992 –
intu Derby 100% FH/LH 1.3 2007 2014
intu Eldon Square 60% FH/LH 1.4 1976 –
intu Victoria Centre 100% FH 1.0 1972 2002H
intu Milton Keynes 100% FH 0.4 2000 2013
Cribbs Causeway 33% C FH/LH 1.1 1998 2005
St David’s, Cardiff 50% FH/LH 1.4 2009 2006
intu Xanadú 50% FH 1.3 2003 2017
intu Puerto Venecia 50% FH 1.3 2012 2015
intu Asturias 50% FH 0.8 2001 2013
intu Chapelfield 50% FH 0.5 2005 –
Other D 1.5
Investment and development property including Group’s share of joint ventures 24.0
At 31 December 2017 including Group’s share of joint ventures 22.9
A Interest shown is that of The Metrocentre Partnership in intu Metrocentre (90 per cent) and the Metro Retail Park (100 per cent). The Group has a 60 per cent interest in The Metrocentre Partnership which is consolidated as a subsidiary of the Group.
B The Group’s interest is through a joint operation ownership of a 95 per cent interest in Manchester Arndale, and a 90 per cent interest in New Cathedral Street, Manchester. C The Group’s interest is through a joint operation ownership of a 66 per cent interest in The Mall at Cribbs Causeway and a 100 per cent interest in The Retail Park, Cribbs
Causeway. D Includes intu Potteries, intu Uxbridge, intu Broadmarsh, Soar at intu Braehead and Sprucefield, Northern Ireland. E Form of ownership is shown as either freehold (FH), leasehold (LH) or freehold and leasehold (FH/LH). F Area shown is not adjusted for the proportion of ownership. G The acquisition date is presented only where the centre was not built by the Group. H intu held a 20 per cent stake in intu Victoria Centre prior to 2002 when it acquired the remaining 80 per cent to take its holding to 100 per cent. I intu held a 50 per cent stake in intu Merry Hill from 2014. In 2016 it acquired the remaining 50 per cent to take its holding to 100 per cent.
Strategic reportFin
ancial statem
ents
Other in
formation
Govern
ance
161intu properties plc Annual report 2018

Investment and development property (unaudited) continued
162 intu properties plc Annual report 2018
4 Analysis of net rental income in the year – including Group’s share of joint ventures Year ended 31 December Movement
2018
£m 2017
£m
£m
%
Like-for-like property 420.1 417.8 2.3 0.6 Acquisition and part disposal: intu Xanadú 11.5 13.0 (1.5) n/a Part disposal: intu Chapelfield (50%) – 7.0 (7.0) n/a Developments 18.9 22.2 (3.3) n/a
Net rental income 450.5 460.0 (9.5) (2.1)
Other Information
162 intu properties plc Annual report 2018

Financial covenants (unaudited)
intu properties plc Annual report 2018 163
Other inform
ation
Intu (SGS) Finance plc and Intu (SGS) Finco Limited (Secured Group Structure)
Loan
£m Maturity LTV
covenant LTV
actual
Interest cover
covenant
Interest cover
actual
Term loan 351.8 2021
3.875 per cent bonds 450.0 2023
4.625 per cent bonds 350.0 2028
4.250 per cent bonds 350.0 2030
1,501.8 80% 57% 125% 228%
Covenants are tested on the Security Group, the principal assets of which are intu Lakeside, intu Braehead, intu Watford, intu Derby and intu Victoria Centre.
The structure has a tiered operating covenant regime giving the Group a significant degree of flexibility when the covenants are below certain levels. In higher tiers the level of flexibility is reduced. The Group retains operating control at loan to value below 72.5 per cent and interest cover above 1.4x. No financial covenant default occurs unless the loan to value exceeds 80 per cent or the interest cover falls below 1.25x.
The Trafford Centre Finance Limited There are no financial covenants on the intu Trafford Centre debt of £744.4 million at 31 December 2018. However, a debt service cover ratio is assessed quarterly and where this falls below specified levels restrictions come into force. The loan to 31 December 2018 market value ratio is 37 per cent. No restrictions are in place at present.
Intu Metrocentre Finance plc
Loan
£m Maturity LTV
covenant LTV
actual
Interest cover
covenant
Interest cover
actual
4.125 per cent bonds 485.0 2023 100% 58% 125% 217%
The structure’s covenant regime gives the Group a significant degree of flexibility when the covenants are below certain levels. The Group retains operating control at loan to value below 70 per cent and interest cover above 1.4x. No financial covenant default occurs unless loan to value exceeds 100 per cent or the interest cover falls below 1.25x.
Other asset-specific debt
Loan outstanding at 31 December
20181
£m Maturity LTV
covenant
Loan to 31 December
2018 market value2
Interest cover
covenant
Interest cover actual3
Sprucefield 25.2 2020 65% 57% 150% 332%
intu Uxbridge4 26.0 2020 70% 65% 125% 244%
St David’s, Cardiff 163.2 2021 65% 55% 150% 230%
intu Milton Keynes 140.5 2021 65% 55% 150% 280%
intu Trafford Centre, Barton Square5 25.0 2021 65% 38% 150% 432%
intu Trafford Centre 250.0 2022 65% 49% 103%6 119%6
intu Chapelfield 74.0 2023 65% 55% 150% 266%
intu Merry Hill 478.1 2024 75% 62% 150% 262%
intu Asturias4 (€) 60.5 2021 65% 38% 150% 653%
intu Xanadú4 (€) 131.5 2022 65% 49% 150% 433%
intu Puerto Venecia4 (€) 112.5 2025 65% 42% 150% 441%
1 The loan values are the actual principal balances outstanding at 31 December 2018, which take into account any principal repayments made up to 31 December 2018. The balance sheet value of the loans includes unamortised fees.
2 The loan to 31 December 2018 market value provides an indication of the impact the 31 December 2018 property valuations could have on the LTV covenants. The actual timing and manner of testing LTV covenants varies and is loan specific.
3 Based on latest certified figures, calculated in accordance with loan agreements, which have been submitted between 31 December 2018 and 7 February 2019. The calculations are loan specific and include a variety of historical, forecast and in certain instances a combined historical and forecast basis.
4 Debt shown is consistent with the Group’s economic interest. 5 In addition to this term facility, we have a committed development funding facility of £25 million of which £3.3 million was drawn at 31 December 2018. 6 Covenant is a debt service cover ratio (includes interest and scheduled debt repayments).
Strategic reportFin
ancial statem
ents
Other in
formation
Govern
ance
163intu properties plc Annual report 2018
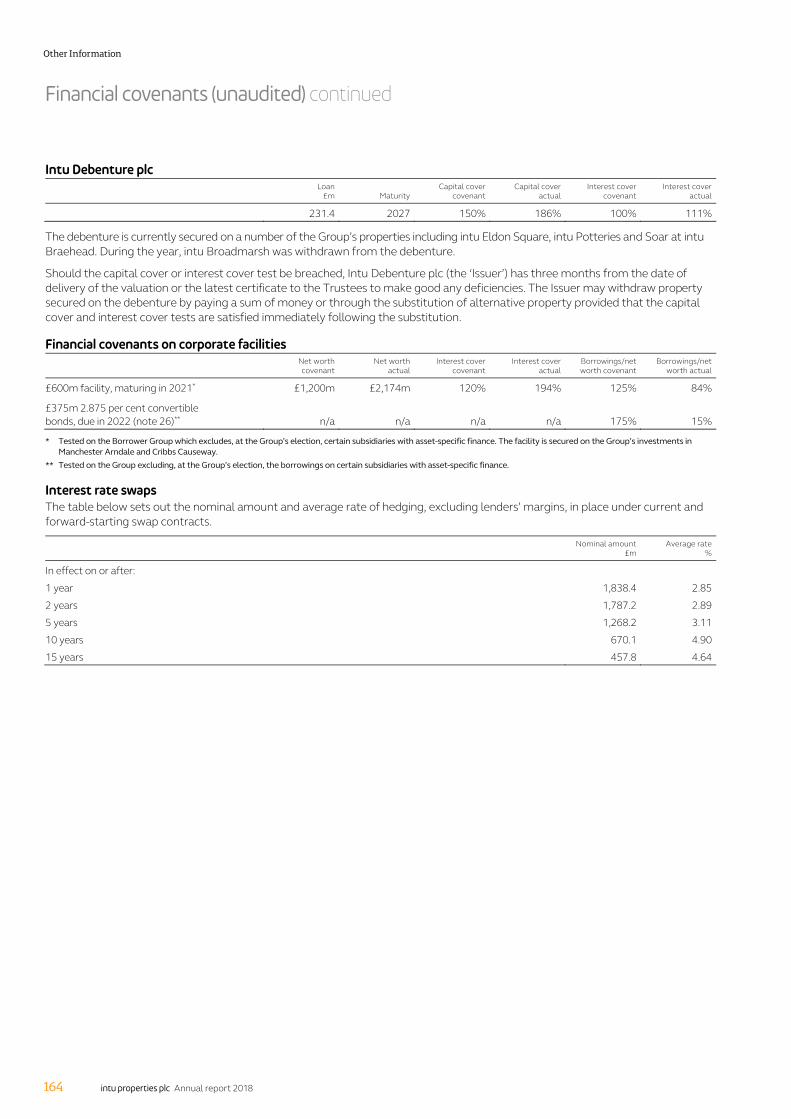
Financial covenants (unaudited) continued
164 intu properties plc Annual report 2018
Intu Debenture plc
Loan
£m Maturity Capital cover
covenant Capital cover
actual Interest cover
covenant Interest cover
actual
231.4 2027 150% 186% 100% 111%
The debenture is currently secured on a number of the Group’s properties including intu Eldon Square, intu Potteries and Soar at intu Braehead. During the year, intu Broadmarsh was withdrawn from the debenture.
Should the capital cover or interest cover test be breached, Intu Debenture plc (the ‘Issuer’) has three months from the date of delivery of the valuation or the latest certificate to the Trustees to make good any deficiencies. The Issuer may withdraw property secured on the debenture by paying a sum of money or through the substitution of alternative property provided that the capital cover and interest cover tests are satisfied immediately following the substitution.
Financial covenants on corporate facilities
Net worth covenant
Net worth actual
Interest cover covenant
Interest cover actual
Borrowings/net worth covenant
Borrowings/net worth actual
£600m facility, maturing in 2021* £1,200m £2,174m 120% 194% 125% 84%
£375m 2.875 per cent convertible bonds, due in 2022 (note 26)**
n/a
n/a
n/a
n/a
175%
15%
* Tested on the Borrower Group which excludes, at the Group’s election, certain subsidiaries with asset-specific finance. The facility is secured on the Group’s investments in Manchester Arndale and Cribbs Causeway.
** Tested on the Group excluding, at the Group’s election, the borrowings on certain subsidiaries with asset-specific finance.
Interest rate swaps The table below sets out the nominal amount and average rate of hedging, excluding lenders’ margins, in place under current and forward-starting swap contracts.
Nominal amount
£m Average rate
%
In effect on or after:
1 year 1,838.4 2.85
2 years 1,787.2 2.89
5 years 1,268.2 3.11
10 years 670.1 4.90
15 years 457.8 4.64
Other Information
164 intu properties plc Annual report 2018

Financial information including share of joint ventures (unaudited) for the year ended 31 December 2018
intu properties plc Annual report 2018 165
Other inform
ation
The information in this section is presented to show the Group including share of joint ventures. A reconciliation from the amounts shown in the Group’s income statement and balance sheet is provided on the following pages.
Underlying earnings 2018 2017
Group underlying profit
£m
Share of joint ventures
£m
Group including share of joint
ventures £m
Group underlying profit
£m
Share of joint
ventures £m
Group including share of joint
ventures £m
Rent receivable 467.3 60.7 528.0 503.4 42.8 546.2
Service charge income 107.0 13.5 120.5 109.1 8.7 117.8
Facilities management income from joint ventures 6.8 (2.3) 4.5 3.5 (0.7) 2.8
Revenue 581.1 71.9 653.0 616.0 50.8 666.8
Net rental income 398.5 52.0 450.5 423.4 36.6 460.0
Net other income 5.3 (2.4) 2.9 3.0 (2.1) 0.9
Administration expenses (42.9) (1.1) (44.0) (40.9) (0.7) (41.6)
Underlying operating profit 360.9 48.5 409.4 385.5 33.8 419.3
Finance costs (210.8) (6.3) (217.1) (213.9) (6.0) (219.9)
Finance income 14.8 (12.2) 2.6 12.6 (9.3) 3.3
Other finance costs (5.9) – (5.9) (5.9) – (5.9)
Underlying net finance costs (201.9) (18.5) (220.4) (207.2) (15.3) (222.5)
Underlying profit before tax, joint ventures and associates 159.0 30.0 189.0 178.3 18.5 196.8
Tax on underlying profit (0.1) (0.6) (0.7) 0.1 (0.2) (0.1)
Share of underlying profit of joint ventures 29.2 (29.2) – 18.3 (18.3) –
Share of underlying profit of associates 1.2 – 1.2 0.9 – 0.9
Remove amounts attributable to non-controlling interests 3.8 (0.2) 3.6 3.4 – 3.4
Underlying earnings 193.1 – 193.1 201.0 – 201.0
A reconciliation from the Group’s (loss)/profit attributable to owners of intu properties plc to underlying earnings is provided in note 12(b).
Strategic reportFin
ancial statem
ents
Other in
formation
Govern
ance
165intu properties plc Annual report 2018

Financial information including share of joint ventures (unaudited) continued for the year ended 31 December 2018
166 intu properties plc Annual report 2018
Consolidated income statement 2018 2017
Group income statement
£m
Share of joint ventures
£m
Group including share of joint
ventures £m
Group income statement
£m
Share of joint ventures
£m
Group including share of joint
ventures £m
Revenue 581.1 71.9 653.0 616.0 50.8 666.8
Net rental income 398.5 52.0 450.5 423.4 36.6 460.0
Net other income 5.3 (2.4) 2.9 3.0 (2.1) 0.9
Revaluation of investment and development property (1,332.8) (72.2) (1,405.0) 30.8 16.5 47.3
Loss on disposal of subsidiaries (8.5) – (8.5) (1.8) – (1.8)
Gain on sale of investment and development property 1.4 – 1.4 – – –
Loss on sale of other investments – – – – (0.3) (0.3)
Administration expenses – ongoing (42.9) (1.1) (44.0) (40.9) (0.7) (41.6)
Administration expenses – exceptional (13.1) (0.1) (13.2) (5.9) (0.7) (6.6)
Operating (loss)/profit (992.1) (23.8) (1,015.9) 408.6 49.3 457.9
Finance costs (210.8) (6.3) (217.1) (213.9) (6.0) (219.9)
Finance income 14.8 (12.2) 2.6 12.6 (9.3) 3.3
Other finance costs (38.8) 4.5 (34.3) (38.9) – (38.9)
Change in fair value of financial instruments 87.3 (1.0) 86.3 22.0 1.0 23.0
Net finance costs (147.5) (15.0) (162.5) (218.2) (14.3) (232.5)
(Loss)/profit before tax, joint ventures and associates (1,139.6) (38.8) (1,178.4) 190.4 35.0 225.4
Share of post-tax (loss)/profit of joint ventures (42.1) 42.1 – 35.5 (35.5) –
Share of post-tax profit of associates 2.3 – 2.3 1.3 – 1.3
(Loss)/profit before tax (1,179.4) 3.3 (1,176.1) 227.2 (0.5) 226.7
Current tax (0.1) (0.6) (0.7) 0.1 (0.2) (0.1)
Deferred tax 5.8 (2.2) 3.6 (24.0) 1.3 (22.7)
Taxation 5.7 (2.8) 2.9 (23.9) 1.1 (22.8)
(Loss)/profit for the year (1,173.7) 0.5 (1,173.2) 203.3 0.6 203.9
Non-controlling interests 41.5 (0.5) 41.0 13.4 (0.6) 12.8
(Loss)/profit for the year attributable to owners of intu properties plc (1,132.2) – (1,132.2) 216.7 – 216.7
Other Information
166 intu properties plc Annual report 2018

intu properties plc Annual report 2018 167
Other inform
ation
Consolidated balance sheet 2018 2017
Group balance sheet
£m
Share of joint ventures
£m
Group including share of joint
ventures £m
Group balance sheet
£m
Share of joint ventures
£m
Group including share of joint
ventures £m
Assets
Investment and development property 8,021.8 1,108.3 9,130.1 9,179.4 1,013.1 10,192.5
Investment in joint ventures 823.9 (823.9) – 735.5 (735.5) –
Derivative financial instruments 4.7 – 4.7 0.3 0.2 0.5
Assets classified as held for sale – – – 309.1 – 309.1
Cash and cash equivalents 239.5 34.8 274.3 228.0 50.2 278.2
Other assets 352.6 59.9 412.5 342.2 54.3 396.5
Total assets 9,442.5 379.1 9,821.6 10,794.5 382.3 11,176.8
Liabilities
Borrowings (5,035.3) (295.7) (5,331.0) (4,997.8) (300.1) (5,297.9)
Derivative financial instruments (285.2) (3.5) (288.7) (347.8) (2.5) (350.3)
Liabilities associated with assets classified as held for sale – – – (6.2) – (6.2)
Other liabilities (297.6) (76.2) (373.8) (313.5) (76.5) (390.0)
Total liabilities (5,618.1) (375.4) (5,993.5) (5,665.3) (379.1) (6,044.4)
Net assets 3,824.4 3.7 3,828.1 5,129.2 3.2 5,132.4
Non-controlling interests (12.7) (3.7) (16.4) (54.2) (3.2) (57.4)
Net assets attributable to owners of intu properties plc 3,811.7 – 3,811.7 5,075.0 – 5,075.0
Strategic reportFin
ancial statem
ents
Other in
formation
Govern
ance
167intu properties plc Annual report 2018

Financial information including share of joint ventures (unaudited) continued for the year ended 31 December 2018
168 intu properties plc Annual report 2018
Investment and development property
2018
£m 2017
£m
Balance sheet carrying value of investment and development property 9,130.1 10,192.5
Tenant incentives included within trade and other receivables 125.6 118.5
Head leases included within finance leases in borrowings (88.3) (88.3)
Market value of investment and development property 9,167.4 10,222.7
Net external debt The table below provides a reconciliation between the components of net debt included on the Group’s balance sheet and net external debt including the Group’s share of joint ventures’ debt and cash.
2018
£m 2017
£m
Total borrowings 5,035.3 4,997.8
Cash and cash equivalents (239.5) (228.0)
Net debt 4,795.8 4,769.8
Less Metrocentre compound financial instrument (189.5) (183.7)
Less cash and cash equivalents within assets classified as held for sale – (0.5)
Net external debt – before Group’s share of joint ventures 4,606.3 4,585.6
Add share of borrowings of joint ventures 295.7 300.1
Less share of cash of joint ventures (34.8) (50.2)
Net external debt – including Group’s share of joint ventures 4,867.2 4,835.5
Analysed as:
Debt including Group’s share of joint ventures 5,141.5 5,113.7
Cash including Group’s share of joint ventures (274.3) (278.2)
Net external debt – including Group’s share of joint ventures 4,867.2 4,835.5
Debt to assets ratio
2018
£m 2017
£m
Market value of investment and development property 9,167.4 10,222.7
Add market value of investment and development property classified as assets held for sale – 306.5
9,167.4 10,529.2
Net external debt (4,867.2) (4,835.5)
Debt to assets ratio 53.1% 45.9%
Interest cover
2018
£m 2017
£m
Finance costs (217.1) (219.9)
Finance income 2.6 3.3
(214.5) (216.6)
Underlying operating profit 409.4 419.3
Interest cover 1.91x 1.94x
Other Information
168 intu properties plc Annual report 2018

Underlying profit statement (unaudited) for the year ended 31 December 2018
intu properties plc Annual report 2018 169
Other inform
ation
The underlying profit information in the table below shows the Group including share of joint ventures on a line-by-line basis.
Year ended 31 December
2018 £m
Year ended 31 December
2017 £m
Six months ended
31 December 2018
£m
Six months ended
31 December 2017
£m
Six months ended
30 June 2018
£m
Six months ended
30 June 2017
£m
Net rental income 450.5 460.0 227.4 233.8 223.1 226.2
Net other income 2.9 0.9 0.9 0.8 2.0 0.1
Administration expenses (44.0) (41.6) (22.3) (21.0) (21.7) (20.6)
Underlying operating profit 409.4 419.3 206.0 213.6 203.4 205.7
Finance costs (217.1) (219.9) (111.4) (112.4) (105.7) (107.5)
Finance income 2.6 3.3 1.3 2.2 1.3 1.1
Other finance costs (5.9) (5.9) (3.0) (3.0) (2.9) (2.9)
Underlying net finance costs (220.4) (222.5) (113.1) (113.2) (107.3) (109.3)
Underlying profit before tax and associates 189.0 196.8 92.9 100.4 96.1 96.4
Tax on underlying profit (0.7) (0.1) (0.3) 0.1 (0.4) (0.2)
Share of underlying profit of associates 1.2 0.9 0.6 0.5 0.6 0.4
Remove amounts attributable to non-controlling interests 3.6 3.4 1.4 1.5 2.2 1.9
Underlying earnings 193.1 201.0 94.6 102.5 98.5 98.5
Underlying EPS (pence) 14.4p 15.0p 7.0p 7.6p 7.3p 7.3p
Weighted average number of shares (million) 1,343.7 1,343.2 1,343.8 1,343.4 1,343.6 1,343.1
For the reconciliation from basic EPS see note 12(b).
Strategic reportFin
ancial statem
ents
Other in
formation
Govern
ance
169intu properties plc Annual report 2018

EPRA performance measures (unaudited)
170 intu properties plc Annual report 2018
1 Summary The EPRA Best Practice Recommendations identify six key performance measures, including the EPRA cost ratios. The measures are deemed to be of importance for investors in European property companies and aim to encourage more consistent and widespread disclosure. The Group is supportive of this initiative but continues to disclose additional APMs throughout this report which it believes are more appropriate to the Group’s current circumstances. These EPRA measures are calculated in accordance with the EPRA Best Practices Recommendations Guidelines.
In 2018, the Group retained its EPRA Gold Award for exceptional compliance with the EPRA Best Practice Recommendations.
The EPRA measures are summarised below and detailed in the tables following and notes referenced:
Table/note 2018 2017
EPRA cost ratio (including direct vacancy costs) table 2 20.1% 19.4%
EPRA cost ratio (excluding direct vacancy costs) table 2 15.3% 15.1%
EPRA earnings note 12(b) £210.5m £184.5m
— per share note 12(b) 15.7p 13.7p
EPRA NAV note 13(b) £3,947.1m £5,287.3m
— per share note 13(b) 293p 393p
EPRA NNNAV note 13(c) £3,640.7m £4,695.8m
— per share note 13(c) 271p 349p
EPRA NIY table 3 4.8% 4.2%
EPRA ‘topped-up’ NIY table 3 5.0% 4.4%
EPRA vacancy rate table 4 3.3% 3.0%
Details of the Group’s performance against the EPRA Best Practice Recommendations on Sustainability Reporting can be found in full in the 2018 corporate responsibility report. In 2018, the Group retained its Gold EPRA Sustainability Best Practice Recommendations award.
2 EPRA cost ratios
2018
£m 2017
£m
Administration expenses – ongoing 44.0 41.6
Net service charge costs 18.5 19.1
Other non-recoverable costs 44.4 46.6
Remove:
Service charge costs recovered through rents (4.6) (6.5)
EPRA costs – including direct vacancy costs 102.3 100.8
Direct vacancy costs (24.3) (22.6)
EPRA costs – excluding direct vacancy costs 78.0 78.2
Rent receivable 528.0 546.2
Rent payable (14.6) (20.5)
Gross rental income less ground rent payable 513.4 525.7
Remove:
Service charge costs recovered through rents (4.6) (6.5)
Gross rental income 508.8 519.2
EPRA cost ratio (including direct vacancy costs) 20.1% 19.4%
EPRA cost ratio (excluding direct vacancy costs) 15.3% 15.1%
Other Information
170 intu properties plc Annual report 2018
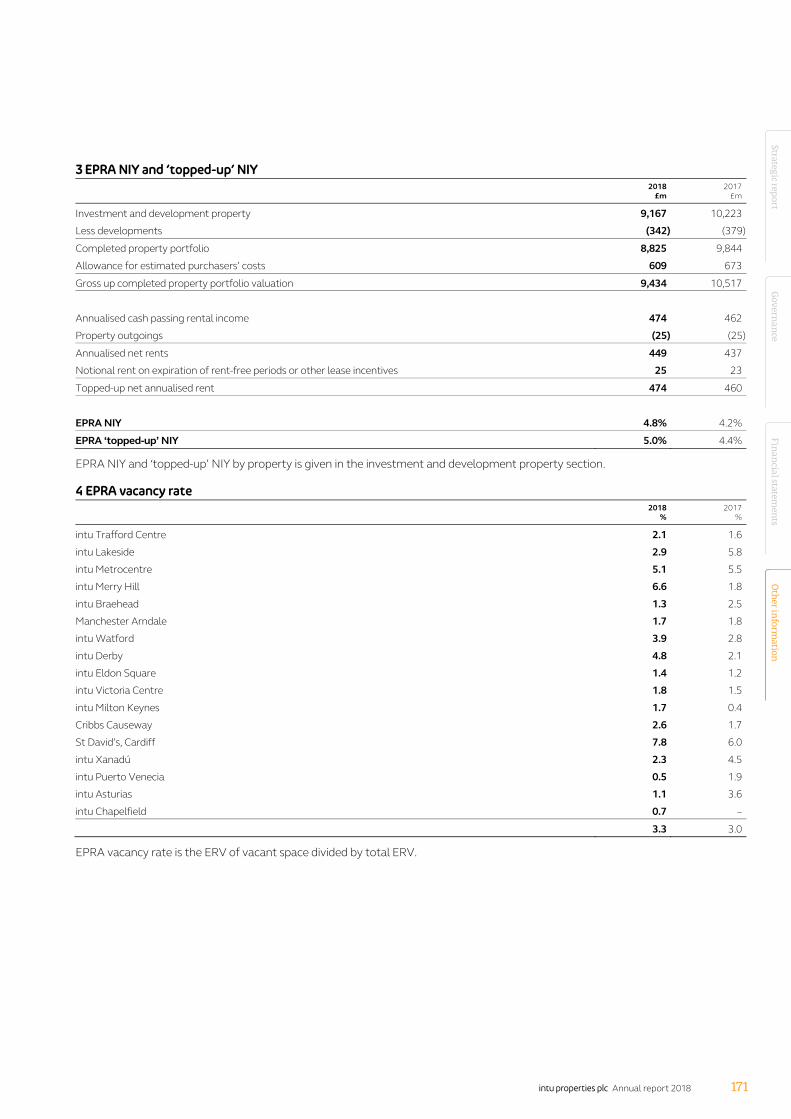
intu properties plc Annual report 2018 171
Other inform
ation
3 EPRA NIY and ‘topped-up’ NIY
2018
£m 2017
£m
Investment and development property 9,167 10,223
Less developments (342) (379)
Completed property portfolio 8,825 9,844
Allowance for estimated purchasers’ costs 609 673
Gross up completed property portfolio valuation 9,434 10,517
Annualised cash passing rental income 474 462
Property outgoings (25) (25)
Annualised net rents 449 437
Notional rent on expiration of rent-free periods or other lease incentives 25 23
Topped-up net annualised rent 474 460
EPRA NIY 4.8% 4.2%
EPRA ‘topped-up’ NIY 5.0% 4.4%
EPRA NIY and ‘topped-up’ NIY by property is given in the investment and development property section.
4 EPRA vacancy rate
2018
% 2017
%
intu Trafford Centre 2.1 1.6
intu Lakeside 2.9 5.8
intu Metrocentre 5.1 5.5
intu Merry Hill 6.6 1.8
intu Braehead 1.3 2.5
Manchester Arndale 1.7 1.8
intu Watford 3.9 2.8
intu Derby 4.8 2.1
intu Eldon Square 1.4 1.2
intu Victoria Centre 1.8 1.5
intu Milton Keynes 1.7 0.4
Cribbs Causeway 2.6 1.7
St David’s, Cardiff 7.8 6.0
intu Xanadú 2.3 4.5
intu Puerto Venecia 0.5 1.9
intu Asturias 1.1 3.6
intu Chapelfield 0.7 –
3.3 3.0
EPRA vacancy rate is the ERV of vacant space divided by total ERV.
Strategic reportFin
ancial statem
ents
Other in
formation
Govern
ance
171intu properties plc Annual report 2018

Financial record 2014-2018
172 intu properties plc Annual report 2018
2014 2015 2016 2017 2018
Net rental income £397m £428m £447m £460m £451m Underlying earnings £162m £187m £200m £201m £193m Underlying earnings per share 13.3p 14.2p 15.0p 15.0p 14.4p Dividend per share 13.7p 13.7p 14.0p 14.0p 4.6p Property revaluation (deficit)/surplus £648m £351m £(64m) £47m £(1,405m) NAV per share (diluted, adjusted) 379p 404p 404p 411p 312p Market value of investment and development property £8,963m £9,602m £9,985m £10,223m £9,167m Net external debt £3,963m £4,139m £4,364m £4,836m £4,867m Debt to assets ratio 44.2% 43.1% 43.7% 45.9% 53.1% Interest cover 1.82x 1.91x 1.97x 1.94x 1.91x Change in like-for-like net rental income (3.2)% 1.8% 3.6% 0.5% 0.6% Occupancy 95% 96% 96% 97% 97% Change in footfall (like-for-like) +0% +0% +1.3% +0% -1.6%
Amounts presented include the Group’s share of joint ventures.
Other Information
172 intu properties plc Annual report 2018
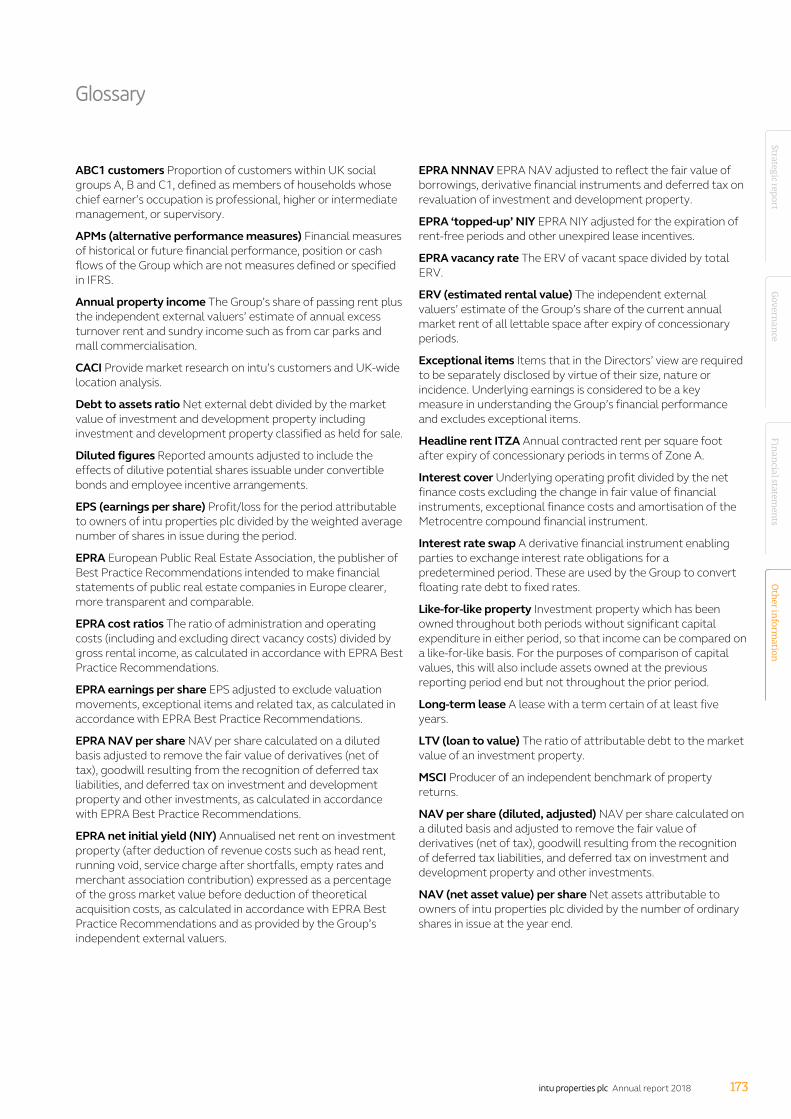
Glossary
intu properties plc Annual report 2018 173
Other inform
ation
ABC1 customers Proportion of customers within UK social groups A, B and C1, defined as members of households whose chief earner’s occupation is professional, higher or intermediate management, or supervisory.
APMs (alternative performance measures) Financial measures of historical or future financial performance, position or cash flows of the Group which are not measures defined or specified in IFRS.
Annual property income The Group’s share of passing rent plus the independent external valuers’ estimate of annual excess turnover rent and sundry income such as from car parks and mall commercialisation.
CACI Provide market research on intu’s customers and UK-wide location analysis.
Debt to assets ratio Net external debt divided by the market value of investment and development property including investment and development property classified as held for sale.
Diluted figures Reported amounts adjusted to include the effects of dilutive potential shares issuable under convertible bonds and employee incentive arrangements.
EPS (earnings per share) Profit/loss for the period attributable to owners of intu properties plc divided by the weighted average number of shares in issue during the period.
EPRA European Public Real Estate Association, the publisher of Best Practice Recommendations intended to make financial statements of public real estate companies in Europe clearer, more transparent and comparable.
EPRA cost ratios The ratio of administration and operating costs (including and excluding direct vacancy costs) divided by gross rental income, as calculated in accordance with EPRA Best Practice Recommendations.
EPRA earnings per share EPS adjusted to exclude valuation movements, exceptional items and related tax, as calculated in accordance with EPRA Best Practice Recommendations.
EPRA NAV per share NAV per share calculated on a diluted basis adjusted to remove the fair value of derivatives (net of tax), goodwill resulting from the recognition of deferred tax liabilities, and deferred tax on investment and development property and other investments, as calculated in accordance with EPRA Best Practice Recommendations.
EPRA net initial yield (NIY) Annualised net rent on investment property (after deduction of revenue costs such as head rent, running void, service charge after shortfalls, empty rates and merchant association contribution) expressed as a percentage of the gross market value before deduction of theoretical acquisition costs, as calculated in accordance with EPRA Best Practice Recommendations and as provided by the Group’s independent external valuers.
EPRA NNNAV EPRA NAV adjusted to reflect the fair value of borrowings, derivative financial instruments and deferred tax on revaluation of investment and development property.
EPRA ‘topped-up’ NIY EPRA NIY adjusted for the expiration of rent-free periods and other unexpired lease incentives.
EPRA vacancy rate The ERV of vacant space divided by total ERV.
ERV (estimated rental value) The independent external valuers’ estimate of the Group’s share of the current annual market rent of all lettable space after expiry of concessionary periods.
Exceptional items Items that in the Directors’ view are required to be separately disclosed by virtue of their size, nature or incidence. Underlying earnings is considered to be a key measure in understanding the Group’s financial performance and excludes exceptional items.
Headline rent ITZA Annual contracted rent per square foot after expiry of concessionary periods in terms of Zone A.
Interest cover Underlying operating profit divided by the net finance costs excluding the change in fair value of financial instruments, exceptional finance costs and amortisation of the Metrocentre compound financial instrument.
Interest rate swap A derivative financial instrument enabling parties to exchange interest rate obligations for a predetermined period. These are used by the Group to convert floating rate debt to fixed rates.
Like-for-like property Investment property which has been owned throughout both periods without significant capital expenditure in either period, so that income can be compared on a like-for-like basis. For the purposes of comparison of capital values, this will also include assets owned at the previous reporting period end but not throughout the prior period.
Long-term lease A lease with a term certain of at least five years.
LTV (loan to value) The ratio of attributable debt to the market value of an investment property.
MSCI Producer of an independent benchmark of property returns.
NAV per share (diluted, adjusted) NAV per share calculated on a diluted basis and adjusted to remove the fair value of derivatives (net of tax), goodwill resulting from the recognition of deferred tax liabilities, and deferred tax on investment and development property and other investments.
NAV (net asset value) per share Net assets attributable to owners of intu properties plc divided by the number of ordinary shares in issue at the year end.
Strategic reportFin
ancial statem
ents
Other in
formation
Govern
ance
173intu properties plc Annual report 2018

Glossary continued
174 intu properties plc Annual report 2018
Net external debt Net debt after removing the Metrocentre compound financial instrument and including net debt within liabilities associated with assets classified as held for sale.
Net rental income The Group’s share of net rents receivable as shown in the income statement, having taken due account of non-recoverable costs, bad debt provisions and adjustments to comply with IFRS including those regarding tenant incentives.
Nominal equivalent yield Effective annual yield to a purchaser from an asset at market value before taking account of notional acquisition costs assuming rent is receivable annually in arrears, reflecting ERV but disregarding potential changes in market rents, as determined by the Group’s independent external valuers.
Occupancy The ERV of let and under-offer units divided by total ERV, excluding development and recently completed properties. Units let to tenants in administration and still trading are treated as let and those no longer trading are treated as un-let.
Passing rent The Group’s share of contracted annual rents receivable at the balance sheet date. This takes no account of accounting adjustments made in respect of rent-free periods or tenant incentives, the reclassification of certain lease payments as finance charges or any irrecoverable costs and expenses, and does not include excess turnover rent, additional rent in respect of unsettled rent reviews or sundry income such as from car parks etc. Contracted annual rents in respect of tenants in administration are excluded.
PMA Property Market Analysis LLP, a producer of property market research and forecasting.
PID (Property Income Distribution) A dividend, generally subject to UK withholding tax at the basic rate of income tax, that a UK REIT is required to pay to its shareholders from its qualifying rental profits. Certain classes of shareholder may qualify to receive a PID gross; shareholders should refer to intugroup.co.uk for further information. The Group can also pay non-PID dividends which are not subject to UK withholding tax.
REIT (Real Estate Investment Trust) REITs are internationally recognised property investment vehicles which have now been introduced in many countries around the world. Each country has its own rules, but the broad intention of REITs is to encourage investment in domestic property by removing tax distortions for investors.
In order for profits of UK property rental businesses to be exempt from corporation tax, a REIT must meet certain ongoing rules and regulations, including the requirement to distribute at least 90 per cent of qualifying rental profits to shareholders. Withholding tax of 20 per cent is deducted from these PIDs. Profits from a REIT’s non-property business remain subject to normal corporation tax. The Group elected for REIT status in the UK with effect from 1 January 2007.
Scrip Dividend Scheme The Group may offer shareholders the opportunity to participate in the Scrip Dividend Scheme. This enables participating shareholders to receive shares instead of cash when a Scrip Alternative is offered for a particular dividend.
Short-term lease A lease with a term certain of less than five years.
SOCIMI The Spanish equivalent of a Real Estate Investment Trust.
Tenant (or lease) incentives Any incentives offered to occupiers to enter into a lease. Typically, incentives are in the form of an initial rent-free period and/or a cash contribution to fit out the premises. Under IFRS the value of incentives granted to tenants is amortised through the income statement on a straight-line basis over the lease term.
‘Topped-up’ NIY Equivalent to EPRA ‘topped-up’ NIY (see definition).
Total financial return The change in NAV per share (diluted, adjusted) plus dividends per share paid in the year expressed as a percentage of opening NAV per share (diluted, adjusted).
Total property return The change in capital value, less any capital expenditure incurred, plus net income in the year expressed as a percentage of the capital employed (opening capital value plus capital expenditure incurred) in the year as calculated by MSCI.
Underlying EPS EPS adjusted to exclude valuation movements, exceptional items and related tax.
Underlying figures Amounts described as underlying exclude valuation movements, exceptional items and related tax.
Other Information
174 intu properties plc Annual report 2018

Printed in the UK by Pureprint Group, a CarbonNeutral® company, certificated to Environmental Management System ISO14001 and holders of FSC® chain of custody certification.
100% of the inks used are vegetable oil-based. This document is printed on Claro Bulk, a paper containing 100% virgin fibre sourced from well-managed, sustainable, FSC certified forests and other controlled sources. The pulp used in this product is bleached using an elemental chlorine free (ECF) process.
Designed and produced by
This report contains ‘forward-looking statements’ regarding the belief or current expectations of intu properties plc, its Directors and other members of its senior management about intu properties plc’s businesses, financial performance and results of operations. These forward-looking statements are not guarantees of future performance. Rather, they are based on current views and assumptions and involve known and unknown risks, uncertainties and other factors, many of which are outside the control of intu properties plc and are difficult to predict, that may cause actual results, performance or developments to differ materially from any future results, performance or developments expressed or implied by the forward-looking statements.
These forward-looking statements speak only as at the date of this report. Except as required by applicable law, intu properties plc makes no representation or warranty in relation to them and expressly disclaims any obligation to update or revise any forward-looking statements contained herein to reflect any change in intu properties plc’s expectations with regard thereto or any change in events, conditions or circumstances on which any such statement is based.
Any information contained in this report on the price at which shares or other securities in intu properties plc have been bought or sold in the past, or on the yield on such shares or other securities, should not be relied upon as a guide to future performance.
Copyright © intu properties plc March 2019
Share dealingExisting UK shareholders may trade intu properties plc shares through Link Share Dealing Services who provide a real-time online, telephone and postal dealing service.
Contact details are:www.linksharedeal.comTelephone (within UK) 0371 664 04475 (calls are charged at the standard geographic rate and will vary by provider; lines are open 8.00 am to 4.30 pm Monday to Friday)(Ireland) Lo-call 1 890 946 375 (outside UK) +44 (0) 371 664 04475 (calls outside the UK are charged at the applicable international rate)
SharegiftShareholders with a small number of shares, which may be uneconomic to sell on a commission basis, may wish to consider donating them to the charity Sharegift (registered charity no. 1052686). Further information can be found on Sharegift’s website sharegift.org or by calling them on 020 7930 3737.
Strate Charity SharesSouth African shareholders for whom the cost of selling their shares would exceed the market value of such shares may wish to consider donating them to charity. An independent non-profit organisation called Strate Charity Shares has been established to administer this process. The South African Revenue Service (SARS) has advised Strate Charity Shares that the value of any shares donated may be deducted from taxable income, as the scheme is registered under section 18A of the Income Tax Act. For further details, queries and/or donations contact the Strate Share Care toll free help line on 0800 202 363 or +27 (0) 11 870 8207 if you are phoning from outside South Africa or email [email protected]
Electronic communicationThe Company supplies information such as the annual report via its website to shareholders who have consented to such communication. Shareholders will be notified by email or post when new information is available on the website.
Shareholders can at any time revoke a previous instruction in order to receive hard copies of shareholder information.
UK shareholders may register to receive email alerts by logging on to the website of the UK Registrars (www.signalshares.com)
and following the instructions given to register an email address.
South African shareholders may register to receive email alerts by written instruction to the South African Registrar, Link Market Services, by email ([email protected]). Once registered, shareholders are sent a ‘Notice of Availability’ email highlighting that the annual report or other information is available for viewing on the website.
Registered Office40 Broadway, London SW1H 0BTRegistered in England & Wales no. 3685527LEI: 213800JSNTERD5CJZO95
Websitesintugroup.co.ukintu.co.uk
RegistrarsAll enquiries concerning shares or shareholdings, including notification of change of address, queries regarding loss of a share certificate and dividend payments should be addressed to:
For shareholders registered in the UKLink Asset Services PXS, 34 Beckenham Road, Beckenham, Kent BR3 4TU. Calls are charged at the standard geographic rate and will vary by provider; lines are open 9.00am to 5.30pm Monday to Friday Telephone +44 (0) 371 664 0300Email: [email protected]
For shareholders registered in South AfricaLink Market Services13th Floor, 19 Ameshoff Street, Braamfontein 1709South AfricaPostal address:PO Box 4844Johannesburg 2000, South AfricaEmail: [email protected]
Share price informationThe latest information on the intu properties plc share price is available on the website intugroup.co.uk.
Web-based enquiry service for shareholders Shareholders registered in the UK can go to signalshares.com to obtain details of their shareholdings and dividends. The shareholder’s surname, Investor Code and postcode are required to use this service. Shareholders may also use this service to amend or change their address and dividend mandate details.
Shareholders registered in South Africa can go to investorcentre.linkmarketservices.co.za to obtain details of their shareholdings. Shareholders will need to follow a registration process in order to access such information. Unfortunately, due to South African legal requirements, shareholders may not update records, but will be able to view their entire holding of shares globally.
Shareholder information
Strategic reportFin
ancial statem
ents
Other in
formation
Govern
ance
175intu properties plc Annual report 2018

intugroup.co.uk
intu properties plc 40 Broadway, London SW1H 0BT
intu properties plc Annual report 2018