Creating opportunities for customers and shareholders · Creating opportunities for customers and...
38
Creating opportunities for customers and shareholders Peter Hackel, CFO 7 December 2017
-
Upload
doannguyet -
Category
Documents
-
view
219 -
download
0
Transcript of Creating opportunities for customers and shareholders · Creating opportunities for customers and...

Creating opportunities for customers and
shareholders
Peter Hackel, CFO
7 December 2017

Disclaimer
This presentation contains certain forward-looking statements that reflect the current views of
management. Such statements are subject to known and unknown risks, uncertainties and other
factors that may cause actual results, performance or achievements of the Straumann Group to
differ materially from those expressed or implied in this presentation. The Group is providing the
information in this presentation as of this date and does not undertake any obligation to update
any statements contained in it as a result of new information, future events or otherwise.
The availability and indications/claims of the products illustrated and mentioned in this
presentation may vary according to country.
2

Our tooth replacement solutions
Abutment / bars & bridges(titanium/cobalt chrome/ceramic)
Implant (Titanium/titanium
alloy/ceramic)
CAD/CAM prosthetics
incl. digital equipment
3
Bone and tissue
regeneration(Human/Animal/synthetic bone
substitutes & membranes)
Main other players
by segment:

The ClearCorrect acquisition extends our offering in
esthetic dentistry
4
One of the leading providers of full clear-aligner tooth-
correction solutions
Privately-held; fast-growing; 2016 sales: USD 32m
Products sold directly in North America and through
distributors in Australia, the UK and other countries
Approx. 200 employees; HQ in Round Rock, Texas
Straumann acquires all outstanding shares in
ClearCorrect Holdings Inc. and subsidiaries for total
consideration of approximately USD 150m
ClearCorrect acquired and consolidated as of 1 October

Financial performance

6
Momentum sustained in Q3 with accelerations in APAC
and LATAM
North America28% of Group
17.0 17.2
Q3 9MLATAM
11% of Group
APAC17% of Group
15.914.8
Q3 9M
Straumann Group
9.9 10.0
Q3 9M
EMEA 44% of Group
18.9
15.7
Q3 9M
Growth year-on-year (in %)
27.924.2
Q3 9M

Winning share in all segments
Organic revenue growth since 2012
7
-1.0%
1.2%
6.4%
9.1%
13.1%
14.8%
2012 2013 2014 2015 2016 9M 2017
Average
7.2%
market growth
(incl. Straumann Group)
Double-digit growth over the first 9 months
supported across all segments
>3x
++Biomaterials
++Implants
++Restorative

2012 2013 2014 2015 2016 2017
8
Above-market growth driven by new products and
entry into new geographies & segmentsO
rganic
revenu
e g
row
th 2
012
-20
17
BLT implant
PURE ceramic
implant
Variobase
abutments
ProAch
edentulous
solution
GBR
biomaterials
Roxolid implant
material
Lab & chairside
CADCAM offering
‘Roxolid
for all’
Premium
Non-premium

2'2172'387
3'471
3'797
4'290
2013 2014 2015 2016 9M 2017
Number of employees Medentika & Equinox Dental Wings & ClearCorrect
CH (incl. HQ)20%
Rest of EMEA26%
LATAM25%
NAM19%
APAC10%
Growth strategy reflected in an increasingly diverse
team
Employees by region (in % of total1)
9 1 Incl. Dental Wings and ClearCorrect, which were consolidated as of 01.10.2017
Headcount development (pro forma1)
4’779
+982

Facility 2017 2018 2019Output
increase1
Villeret (CH) +70%
Andover (US) +60%
Curitiba (BR) +35%
New production building (brownfield)
Capacity expansion to meet growing demand
1 Expected capacity increase from H1 2017 – Q4 201910
New production area in Curitiba Impression of new production building in Villeret
+50% space
New building/
modification
Additional machine capacity
or working hours

Strategic progress

Strategic priorities of the Straumann Group
12
Expand scope to become a Total
Solution Provider for esthetic dentistry
Target unexploited growth markets &
segments
Drive our high performance STMN Group
culture and organization

201820152012
13
Addressable market 2018 vs. 2012
Addressable market
Areas not covered by Straumann
BLT
implantNeodent
consolidation Fully-tapered
implant expectedMilestones:
Non-
premium
Premium:
fully tapered
Premium:
apically tapered
Premium:
parallel walled
Variobase
abutment
1 Straumann Group incl. Neodent, Medentika and Anthogyr China 2 Implant dentistry market segment includes implant fixtures,
abutments and related instruments; information based on DRG 2015 and Straumann estimates
Premium:
fully tapered
Clear aligners &
Lab- and chairside
CAD/CAM equipment
Clear
AlignersLab- and chairside
CAD/CAM systems
Biomaterials
(grafts & membranes)
Traditional implant &
abutment market
Total market:
CHF 3.4bn
Addressed:
~1.0bn
Total market:
CHF 4.0bn
Addressed:
~3.6bn
Total market:
CHF 8.3bn
Addressed:
~7.5bn

Straumann Straumann Straumann Straumann
Neodent Neodent Neodent Neodent
Our present implant portfolio
Tissue Level Bone Level Bone Level Bone Level Bone Level Tissue Levelparallel-walled parallel-walled apically tapered fully tap./external fixation fully tap./internal fixation Ceramic / Monotype

Tissue Level
Bone Level
Tissue Level
Bone Level
Tissue Level
Bone Level
Fully
tap
ered
Ap
ical
ly t
aper
edP
aral
lel w
alle
d
STMN share Potential to grow Lower priced implants
Substantial growth potential in the tapered implant
segment in 2018 and beyond
Combined implant market in our 2 largest subsidiaries US & Germany
(market size 3.7m implants) in 1’000 implants
2007
1986
Date of
launch
15
2015
LMR
Q42018
Low teens premium
segment share
Growth of tapered
implants driven by
trend towards
immediacy

Neodent launches ‘Grand Morse’ in Brazil – a 2nd
generation fully-tapered implant system
Complete new implant system for all clinical needs, developed from the
inside out, starting with the prosthetic interface
Fully tapered design with cutting threads
Comprehensive prosthetic range, including angulated rounded abutments
for full-arch restorations, ti-bases and ‘ProPeek’ temporary abutments
1-year clinical evidence: 100% survival of 277 implants in 57 patients1
200 new customers attracted in first month
Roll-out in other regions beginning mid 2018
Grand Morse is expected to become the preferred choice of Neodent
customers and to supersede the Cone Morse in the next two years.
161 Data on file

Continuously expanding our footprint in the non-
premium segment
Premium
Non-
premiumNeodent home
market
Medentika home market
Equinox home
market
Premium
Non-
premium
Non-
premium
Premium
17
Premium
Non-
Premium
Non-premium offering (current)
Future non-premium markets

The ClearCorrect acquisition extends our offering in
esthetic dentistry
18
One of the leading providers of full clear-aligner tooth-
correction solutions
Privately-held; fast-growing; 2016 sales: USD 32m
Products sold directly in North America and through
distributors in Australia, the UK and other countries
Approx. 200 employees; HQ in Round Rock, Texas
Straumann acquires all outstanding shares in
ClearCorrect Holdings Inc. and subsidiaries for total
consideration of approximately USD 150m
ClearCorrect acquired and consolidated as of 1 October

T o o t h r e p l a c e m e n t m a r k e t
0
1000
2000
3000
Imaging & Planing Implants Abutments CADCAM-Prosthetics
Biomaterials CADCAM-Equipment
Scanners Clear Aligner
Winning share and growing the market
Straumann Group market share
Growth potential in respective segment
CHF m CHF 3.5 bn
19
Imaging &
planningImplants Abutments CADCAM
equipmentBiomaterials Scanners
Clear
alignersCADCAM
prosthetics
Source: Based on 2015 data
E s t h e t i c d e n t i s t r y

Attractive clear-aligner market worth USD 1.5bn
20
Clear aligners vs. conventional braces & wires: worldwide cases per year
Traditional cases Clear Aligners
North America:
Clear-aligner
penetration ~14-18%
Outside N. America:
Clear-aligner
penetration ~5-8%
9mOrthodontic cases
annually
Clear aligner adoption drivers
More dentists trained (GPs &
orthodontists)
More GPs offer/promote treatment
Current users expand business
(utilization rate)
Attention to esthetics increasing
Geographic availability
Teenager segment penetration
Product improvement (ease-of-
use, more indications)
Digitalization simplifies workflow
and drive penetration
Potential:
4-5m cases
Source: World Statistics; Global Industry Analysts Inc. 2016; company fillings as well as broker research reports: Robert W. Baird 2015, William Blair 2017,
Stiefel 2017, Leerink 2017.

Commonalities in restorative and clear-aligner workflows
21
Prosthetic
workflowOrthodontic
workflow
Data capturing
Case designTreatment design
Milling
Model
production (3D prints)Aligner production
(thermo-foiling process)Restorations
Doctor
approvalDoctor
approval
Implant -borneTooth-borne
Doctor

22
New Group set-up
Digital
Fully consolidated Associate (equity method) Partnership
Local/regionalImplants & prosthetics
Orthodontics
Other technology
partners
Biomaterials
Premium Non-Premium

23
Key steps to put stategy into action
Create Digital
business unit
Market entry
Orthodontics
Build global
DSO team
Leverage
commercial
synergies
35%
100%
100%
38%
Ownership
>500 employees
worldwide
>200
employees
~10% of global
implant volumes
growing at 20%
1 DSO = Dental Service Organization

Outlook 2017 and beyond

1 Market growth assessment incl. Straumann Group 2 excl. currency and acquisition effects (ClearCorrect, Dental Wings, Medentika, and Equinox).25
Full-year outlook raised in Q3Barring unforeseen circumstances
Market growth
Straumann
Profitability
We expect the global implant market
to grow at approx. 3-4%1 in 2017
Further improvements in the underyling2 operating
profit margin despite further investments in
strategic growth initiatives
Confident that we can continue to outperform
by achieving organic2 revenue growth of 13-15%

Favorable secular trend driven by demographics, adoption and
awareness
US2 400
(74)
Estimated implants placed in 2016 (in thousand units) and per 10 000
inhabitants (small number in italic)
Brazil2 300
(112)
Japan430
(34)
Greater
China1 200
(9)
Russia615 (43)Germany
1 300 (158)
S.Korea3 100
(632)
Spain1 300
(271)
Argentina430(99) Underpenetrated Mature
India240 (2)
26
Turkey500(62)
Iran600(75)

Convincing growth drivers for the upcoming years
Industry Straumann Group specific
Favorable sociodemographic trend Expansion of the non-premium offering
Underpenetrated markets(expanding provider base through T&E, ITI
network, female programs and patient campaigns)
Develop ceramic and fully-tapered implant
solutions
Substitution of conventional
technologies(crown & bridges, wires & brackets)
Worldwide ‘biomaterials’ offering
Reducing medical & acceptance
barriers (predictability, affordability, easy to perform)
Expand digital dentistry offering (CADCAM materials & equipment)
Improved materials (ceramics, polymers and hybrids)
Systematic outreach to dental chains/ DSO
customers
New manufacturing technologies (additive manufacturing, injection molding)
Penetrate clear aligner market worldwide
Market share gains in high-growth markets (NAM, Russia, Argentina, India, Turkey, Iran etc.)
27

Questions & answers &

29
2017 Event Location
07 December Berenberg Equities conference Pennyhill (UK)
2018 Event Location
08 January Investor meetings Denver (US)
11-12 January Baader Helvea Swiss conference Bad Ragaz (CH)
15 February Full-year 2017 results conference Straumann Group Headquarters, Basel
04 April AGM 2018 Messe Basel
26 April Q1 2018 results Webcast
14 August Half-year 2018 results conference Straumann Group Headquarters, Basel
30 October Q3 2018 results Webcast
Calendar of upcoming events

The Straumann Group
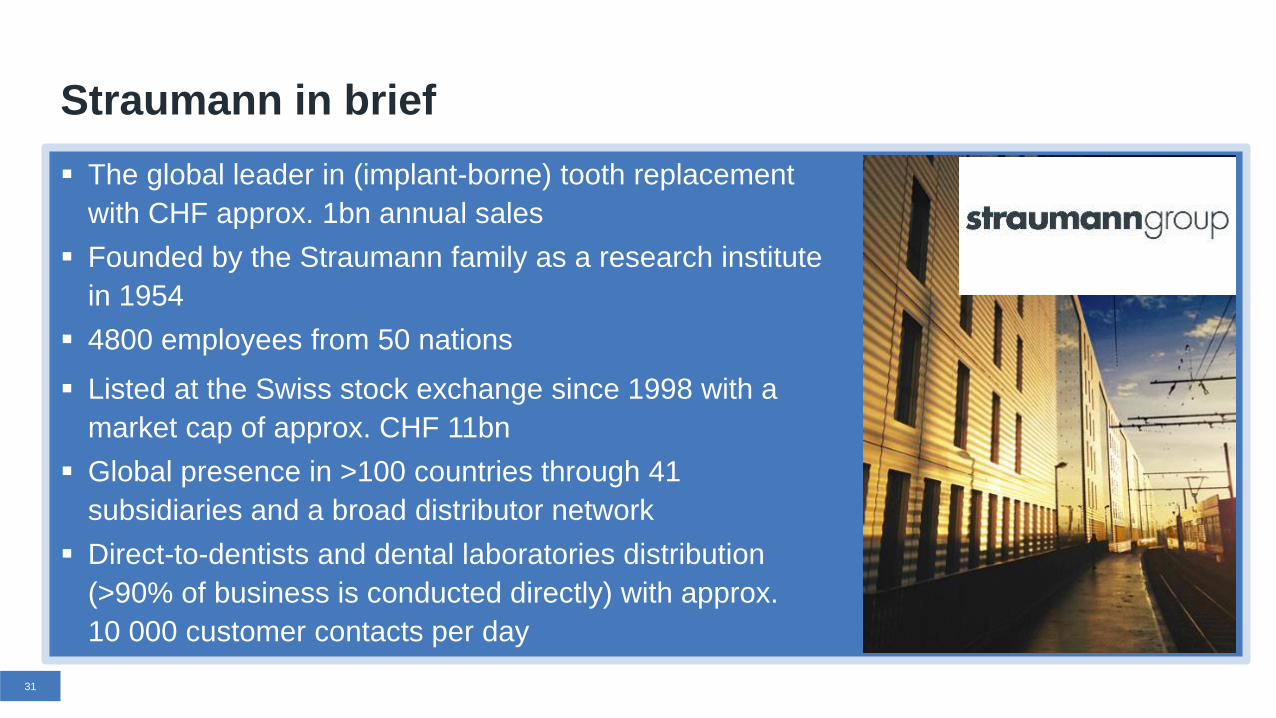
Straumann in brief
The global leader in (implant-borne) tooth replacement
with CHF approx. 1bn annual sales
Founded by the Straumann family as a research institute
in 1954
4800 employees from 50 nations
Listed at the Swiss stock exchange since 1998 with a
market cap of approx. CHF 11bn
Global presence in >100 countries through 41
subsidiaries and a broad distributor network
Direct-to-dentists and dental laboratories distribution
(>90% of business is conducted directly) with approx.
10 000 customer contacts per day
31

33Source: 1 Market data based on Goldman Sachs, Renub Research, Marketsandmarkets, and Straumann estimates 2 Implant dentistry market segment includes implant fixtures, abutments and related instruments; information based on DRG 2015 and Straumann estimates
33
Bolstered leading position in an attractive market
Global market for
implant dentistry2
Global dentistry market
worth CHF 24bn in 20161
Others (400+)Dental specialties
(implants/endo/ortho)
Prosthetics
General
dentistry
Equipment
23%
19%
15%
10%
7%
6%
20%

34
Growth strategy pays off
1 In March 2015 Straumann acquired the remaining 51% stake of Neodent (Brazil) which added 930 employees to the Group. In 2017, the incorporation of Equinox in India and Medentika in
Germany added 160 employees. Note: 5-year average = 2013 – 9M 2017
in CHF million 2012 2013 2014 2015 2016 9M 2017 5-year average
Revenue 686.3 679.9 710.3 798.6 917.5 801.3
Organic revenue growth in % -1.0 1.2 6.4 9.1 13.1 14.8 8.9
Acquisiton / Divesture effect in % -0.6 -0.8 0.0 9.5 0.8 2.9 2.5
Change in l.c.% -1.6 0.4 6.4 18.6 13.9 17.7 11.4
FX effect in % 0.5 -1.3 -1.9 -6.1 1.0 1.0 -1.5
Growth in CHF % -1.1 -0.9 4.5 12.4 14.9 18.7 9.9
2012 2013 2014 2015 2016 H1 2017 CAGR 2012-16
Gross profit b. exceptionals 534.4 535.9 558.7 628.0 718.5 420.0 7.7
Underlying margin 77.9% 78.8% 78.7% 78.6% 78.3% 77.2%
EBIT b. exceptionals 102.1 123.8 148.3 185.7 227.2 139.8 22.1
Underlying margin 14.9% 18.2% 20.9% 23.3% 24.8% 25.7%
Underlying net profit1 72.7 107.9 130.9 144.7 186.8 117.2 26.6
Underlying margin 10.6% 15.9% 18.4% 18.1% 20.4% 21.6%
Earnings per share (adjusted) 4.71 6.98 8.42 9.19 11.94 7.57 26.2
2012 2013 2014 2015 2016 H1 2017 CAGR 2012-16
Operating cash flow 114.6 151.5 146.2 185.6 184.7 77.5 12.7
Capital expenditure (19.4) (12.6) (18.8) (35.2) (46.7) (32.8)
as % of revenue -2.8% -1.9% -2.6% -4.4% -5.1% -4.1%
Free cash flow 95.2 139.2 128.4 151.1 138.7 45.2 9.9
Number of employees (year-end)1 2'517 2'217 2'387 3'471 3'797 4'227 10.8

Straumann Group regional revenue split 2011 and H1 2017
35
More diversified and less dependency on mature
markets in Europe
Europe 55%North America
22%
APAC 15%
LATAM 5% Middle East & Eastern EU 3%
2011
Europe39%
North America
28%
APAC17%
LATAM11%
Middle East & Eastern EU
5%
Today

Entered the non-premium implant market with multiple brands: Neodent,
Medentika, Anthogyr and equinox
Expanded our geographical presence (previously European-centric) and
increased our addressable market (examples: tapered implants, chairside milling)
Regained innovation leadership (examples: ceramic implants, injection molding
manufacturing, additive prosthetic manufacturing, cement-free crowns)
Developed attractively priced premium solutions (examples: Variobase
abutments, cost-effective overdentures)
Expanded the business scope (Clear Aligners)
36
Actions taken in recent years to make our company
more resilient to economic downturns
$

Competitive landscape
Source: Global Industry Analysts Inc., Straumann estimates. Straumann Group incl. ClearCorrect and Geniova. Legend: Full offering () partially offered. Availability may vary regionally.37
DVT/
CBCT
Clear
Aligners
Traditional
wires &
brackets
Surgical
planningBiomaterials Implants
Intraoral
scanner
CADCAM
chairside
milling
CADCAM
in-lab milling
3D
printers
Straumann
Group1
Danaher () ()
Dentsply
Sirona ()
Henry
Schein ()
Align
Technology
Zimmer
Biomet
3M
ESPE ()
Planmeca

60
80
100
120
2014 2015 2016 2017
Development of Straumann’s main exchange rates since 2014
USDCHF EURCHF JPYCHF BRLCHF
CHF36%
EUR19%
USD/CAD/AUD23%
JPY4%
BRL9%
Other9%
CHF8%
EUR31%
USD/CAD/AUD30%
JPY7%
BRL10%
Other15%
Straumann’s currency exposure
1 These distribution charts represent the total net revenues and the total COGS, as well as OPEX in the various currencies. All numbers are rounded and based on FY 2016 figures.
Cost breakdown FY20161
Revenue breakdown FY20161
Average exchange rates (rounded)FX sensitivity
(+/- 10%) on full-year...
9M 2016 9M 2017 Latest trend Revenue EBIT
1 EURCHF 1.09 1.10 +/- 29m +/- 18m
1 USDCHF 0.98 0.98 +/- 23m +/- 11m
100 BRLCHF 27.72 30.89 +/- 9m +/- 3m
100 JPYCHF 0.90 0.88 +/- 6m +/- 4m
38

Thank [email protected]