Dear shareholders, colleagues, customers, and partners
94
Transcript of Dear shareholders, colleagues, customers, and partners

1
Dear shareholders, colleagues, customers, and partners:
Thank you for your continued commitment and investment in Microsoft. Our tremendous progress and impact over the past year would not have been possible without your trust and belief in our mission.
Fiscal 2019 was a record-breaking year for our company. We delivered more than $125 billion in revenue, $43 billion in operating income, and more than $50 billion in operating cash flow – and returned more than $30 billion to shareholders. Our commercial cloud business is the largest in the world, surpassing $38 billion in revenue for the year, with gross margin expanding to 63 percent. I am proud of how we are helping organizations of every size in every industry innovate and thrive using our platforms and tools. And I am proud of how we are empowering everyone – consumers, students, teachers, and the more than 2 billion firstline workers around the world – with experiences to help them always feel confident, capable, and in control.
Our mission to empower every person and every organization on the planet to achieve more has never been more important. At a time when many are calling attention to the role technology plays in society broadly, our mission remains constant. It grounds us in the enormous opportunity and responsibility we have to ensure that the technology we create always benefits everyone on the planet, including the planet itself. Our platforms and tools help make small businesses more productive, multinationals more competitive, nonprofits more effective, and governments more efficient. They improve healthcare and education outcomes, amplify human ingenuity, and allow people everywhere to reach higher.
Today, every company is a technology company, and every organization will increasingly need to build its own proprietary technology solutions to compete and grow. Organizations that embrace this approach – something I call “tech intensity” – will not only adopt best-in-class software and services but also build their own digital capability.
I believe the next big technology breakthroughs will come not only from technology companies like Microsoft, but from retailers, healthcare providers, and manufacturers, working in partnership with us. Every day, we work alongside our customers and partners to help them build their own digital capability – innovating with them, creating new businesses with them, and earning their trust. We want them to become independent with us, not dependent on us.
Our commitment to our customers’ success is resulting in deeper partnerships, larger, multiyear cloud agreements, and growing momentum across every layer of our differentiated technology stack – from application infrastructure, to data and artificial intelligence (AI), to business process, to productivity and collaboration. One of the great privileges of my job is seeing our customers’ tech intensity in action around the world:
• In rural South Africa, Dr. Raymond Campbell saw an opportunity to bring mobile healthcare to communities where it’s needed most to address pressing and preventable health issues like diabetes, heart disease, and tuberculosis. His company, Phulukisa Health Solutions, is now introducing basic healthcare screening to remote areas with an Azure-powered backpack.
• In Australia, Dr. David Kellerman, a senior lecturer at UNSW Sydney, is using Microsoft 365 to bring together all his students – those in his classroom and those watching online – so they can learn together no matter where they are. Students report that they are happier and more engaged and say they feel as though they are part of a single learning community.
• In the seaside city of Ise, Japan, a family-owned restaurant is relying on Azure ML, along with Power BI, to forecast sales so it can better tailor its menu to meet customers’ tastes. It was an initiative spearheaded by employee, Akiyoshi Shinobu, who went from waiting tables to teaching herself machine learning to digitally transform the restaurant where she worked.
• In Fjaroaal, Iceland, Birna Dögg, along with other firstline workers at the Alcoa smelting plant, are using Microsoft Teams to create a new culture of work. For the first time, any employee at the plant can schedule shifts on the go and share updates with colleagues, giving every worker a voice.
• In Detroit, Ford Motor Co. is using GitHub as its software development platform to build the cars of the future. More than 8,000 Ford Motor employees use it to innovate at a much faster pace and collaborate with a vast ecosystem of third-party software developers around the world.
2
• And, in nearly every country, leading companies – from AT&T and Daimler to Walgreens Boots Alliance and Walmart – are partnering with us to build the technology they need to compete and innovate in a time of unprecedented change.
TECHNOLOGY BREAKTHROUGHS AND PROGRESS
Computing is becoming embedded in the world – in every place and every thing. This era of the intelligent cloud and intelligent edge is shaping the next phase of innovation, powering intelligent systems and experiences that previously would have been unimaginable, and transforming nearly everything around us. Across our businesses, we are innovating to empower our customers, and investing in large and growing markets to help them digitally transform – today and long into the future.
Applications and Infrastructure
In a world where every company is a digital company, developers will play an increasingly vital role in value creation and growth across every industry, and GitHub is their home. Since our acquisition of GitHub last fall, growth has accelerated. Today it’s used by more than 40 million developers, including those who work at the majority of the Fortune 50. Beyond GitHub, we are investing to build the most complete toolchain for developers – independent of language, framework, or cloud. Visual Studio and Visual Studio Code are now the most popular code-editing tools in the world. And TypeScript is one of the fastest-growing programming languages.
We are building Azure as the world’s computer, addressing customers’ real-world operational sovereignty and regulatory needs. Today, 95 percent of the Fortune 500 trust Azure for their mission-critical workloads. We have more compliance certifications and more datacenter regions than any other cloud provider, and this year, we were the first to open cloud datacenters in the Middle East and in South Africa. We also opened new government regions to meet the public sector’s stringent requirements for maintaining the security and integrity of classified workloads. Azure remains the only cloud that extends to the edge, and our new cloud-to-edge services and devices – from Azure Data Box Edge to Azure Stack HCI – bring the full power of Azure to where data is generated.
Data and AI
The variety, velocity, and volume of data is increasing – with 50 billion connected devices coming online by 2030, more than double the number today – and Azure is the only cloud with limitless data and analytics capabilities across our customers’ entire data estate. We brought hyperscale capabilities to our relational database services for the first time this year, and we offer the most comprehensive cloud analytics – from Azure Data Factory to Azure SQL Data Warehouse to Power BI.
The quintessential characteristic for every application going forward will be AI, and we believe it cannot be the exclusive province of a few companies or countries. That’s why we are democratizing AI infrastructure, tools, and services with Azure Cognitive Services, so any developer can embed the ability to see, hear, respond, translate, reason, and more into their applications. Azure Cognitive Services is the most comprehensive portfolio of AI tools available, and this year, we added new speech-to-text, search, vision, and decision capabilities, as well as updates to Azure Machine Learning to streamline the building, training, and deployment of machine learning models.
Business Applications
Dynamics 365 uniquely enables any organization to create digital feedback loops that take data from one system and use it to optimize the outcomes of another, enabling any business to become AI-first. This year, we introduced Dynamics 365 AI, a new class of AI application built for an era where systems of record and engagement are converted into intelligence. And the Open Data Initiative we launched with Adobe and SAP last fall takes this even further, delivering on our vision to enable data to be exchanged and enriched across systems to provide unparalleled business insight.
3
We are enabling our customers to digitize not only their business processes but to bridge the physical and digital worlds with our investments in mixed-reality cloud. The new HoloLens 2 is the most advanced, intelligent edge device available, offering two times the field of view and three times the comfort as the previous version. And, together with Dynamics 365 and new Azure mixed-reality services, it enables organizations to digitize physical spaces and interactions and empower their firstline employees with the right information at the right time, in the context of their work.
Our Power Platform – spanning Power BI, PowerApps, and Flow – enables anyone in an organization to start building an intelligent app or workflow where none exists. It brings together low-code, no-code app development, robotic process automation, and self-service analytics into a single, comprehensive platform. This year, we introduced new capabilities to make it much easier and faster for anyone to build higher-quality PowerApps. And, with Power BI, we are the recognized leader in business intelligence in the cloud, with more than 25 million models hosted on the service and 12 million queries processed each hour.
LinkedIn now has more than 645 million members and is the most comprehensive solution for every organization to manage and engage their most important resource – their talent. Our Talent portfolio – from Talent Solutions and Talent Insights, to employee engagement with Glint and LinkedIn Learning – enables every organization to attract, retain, and develop the best talent in an increasingly competitive jobs market. And we are innovating with new experiences for customers that leverage the LinkedIn and Microsoft Graphs, introducing new integrations with Dynamics 365 and Microsoft 365.
Modern Workplace
Microsoft 365 empowers everyone – enterprises, small businesses, and firstline workers – with an integrated, secure experience that transcends any one device. We are helping every business build out their system of communication and collaboration to drive their productivity as well as their business transformation. We are infusing AI across Microsoft 365 to enable new automation, prediction, translation, and insights capabilities. Meetings are more inclusive in Microsoft Teams, presentations more accessible in PowerPoint, videos more searchable in Stream, and emails more relevant in Outlook. And with Workplace Analytics and Microsoft Search, we distill knowledge and insights from data to help people work smarter, not longer. Office 365 Commercial has 180 million users. Our EMS install base exceeded 100 million. And the Outlook apps on iOS and Android also surpassed more than 100 million users for the first time.
Microsoft Teams had a breakout year with more than 13 million daily active users and 19 million weekly active users. It brings together everything a team needs into a single, integrated user experience. And we are broadening our opportunity, bringing Teams for the first time to new and underpenetrated markets including healthcare, hospitality, and retail, as well as firstline workers. Windows 10 is active on more than 900 million devices, with accelerating adoption across both enterprise and consumer as the most secure and productive operating system. And, we expanded our family of Surface devices this year – including the new Surface Go and Surface Hub 2S. And, just this month, we unveiled the new Surface Duo and Surface Neo to inspire new categories focused on productivity and creativity.
Gaming
In gaming, we are pursuing our expansive opportunity to transform how games are distributed, played, and viewed. Our new breakthrough game streaming technology, Project xCloud, will enter public trials this fall. It will put gamers at the center of their gaming experience, enabling them to play games in high-fidelity wherever and whenever they want, on any device.
Microsoft Game Stack brings together our tools and services to empower game developers – from independent creators to the biggest game studios – to build, operate, and scale cloud-first games across mobile, PC, and console. Our growing Xbox Live community is key to our approach, and for the first time we are enabling developers to reach these highly engaged gamers on iOS and Android. Finally, we increased our first-party game studios to 15 this year to deliver differentiated content for our fast-growing subscription services like Xbox Game Pass, which is now available on both console and PC.
4
TRUST
Along with this expanding opportunity comes great responsibility. At its core, responsibility is about earning and sustaining the trust of the customers and partners we empower and the communities in which we live and work. Without trust, none of our progress is possible.
Trust begins with our commitment to shared success and prosperity. Our customers want a partner whose business model is fundamentally aligned to their success. No customer wants to be dependent on a provider that sells them technology on one end and competes with them on the other.
This focus on trust extends to ensuring that those who use our products and services have confidence in the underlying technology itself. There are three pillars to our approach: privacy, cybersecurity, and responsible AI. Across each, our commitment goes beyond words to real actions, providing tools and frameworks for our customers and working collaboratively with the public sector to drive policy change.
The first pillar is privacy. We believe privacy is a fundamental human right. Our approach to privacy and data protection is grounded in our belief that customers own their own data and ensuring any product or service we provide is built with privacy by design from the ground up. We’ve defined clear privacy principles that include a commitment to be transparent in our privacy practices, to offer meaningful privacy choices, and to always responsibly manage the data we store and process. It’s why we were early supporters of the European Union’s General Data Protection Regulation (GDPR), and why we were the first company to expand GDPR’s core rights to all our customers around the world. To date, some 26 million people have used these tools, including 10 million Americans. And it’s why we continue to advocate for new privacy laws to ensure customers enjoy the transparency and control they rightfully deserve.
The second pillar is cybersecurity – a central challenge for every customer. We are investing to protect customers in today’s “zero trust” environment. We analyze more than 6.5 trillion signals each day, and process 450 billion authentications and scan 400 billion emails for malware and phishing each month. This massive signal generates insight that fuels security innovation across Azure, Dynamics 365, Microsoft 365 – all our products and services. We are the only company that offers end-to-end security – spanning identity, device endpoints, information, cloud applications, and infrastructure. It starts with Azure Active Directory and builds with three new services we introduced this year: Microsoft Threat Protection, Azure Sentinel, and Azure Confidential Computing. We are also taking an ecosystem-wide approach, partnering across both the tech sector and the public sector to address new threats in an increasingly complex and heterogenous world. We have taken the lead in bringing together governments, technology companies, and nongovernmental organizations to work collaboratively to combat emerging cybersecurity threats and promote a safe and secure digital world. We know it’s only a start, but we are encouraged by what’s been achieved, including partnering with the government of France to mobilize more than 60 countries, 350 companies, and 130 international and nongovernmental organizations to join The Paris Peace Call for Trust and Security in Cyberspace.
And, finally, we build AI responsibly, taking a principled approach and asking difficult questions, like not what computers can do, but what computers should do. We’ve been inspired by what AI can do in the hands of changemakers who harness it to address society’s most pressing challenges. It’s why this year we announced two new programs in our AI for Good initiative: AI for Humanitarian Action and AI for Cultural Heritage as well as continuing to expand our efforts in AI for Earth and AI for Accessibility. At the same time, we must also guard against the unintended consequences of AI. We believe there is an important discussion to be convened about how these new technologies should be used. One example of this is our call for more thoughtful government regulation on facial recognition technology, because we believe a technology as powerful as this requires both the public and private sectors to develop norms around acceptable uses.

5
ENVIRONMENTAL AND CORPORATE SOCIAL RESPONSIBILITY
Beyond these three pillars, we are working to foster a sustainable future where everyone has access to the benefits and opportunities created by technology. As a reflection of the importance we place on advancing environmental and social progress, Microsoft’s board of directors has a Regulatory and Public Policy Committee that works together with me, my leadership team, and others across Microsoft to oversee our commitments to environmental sustainability and corporate social responsibility. No single company is going to solve macro challenges like climate change alone, but as a global technology company, we are well-positioned to enable and accelerate digital transformations that lead to a low-carbon future. That is why we are stepping up our commitment. Over the past year, we expanded our work through our operations, investments, partnerships, and advocacy across initiatives spanning both environmental and social responsibility.
• We continue to operate carbon neutral across our worldwide operations, driven by an internal carbon tax, as we have every year since 2012. And we’ve taken new steps over the past year to align our carbon-reduction efforts with the latest climate science by setting a goal to reduce our operational emissions by 75 percent by 2030, which puts us on a path to exceed the ambitions of the Paris Accord two decades ahead of schedule. This year, we raised our carbon fee to $15 per metric ton, a near doubling of the previous fee, to put sustainability at the core of every part of our business. We’re also extending our carbon reduction targets beyond our own operations. We will cut carbon emissions by 30 percent across our global supply chain by 2030. And in October, we extended our carbon-neutrality commitment to our products and devices with a pilot to make 825,000 Xbox consoles carbon neutral.
• We are committed to ensuring our datacenters are among the most sustainable in the world. By the end of this year, we will achieve our target of powering our datacenters with 60 percent renewable energy and will aim to reach 70 percent renewable energy within the next four years. In fact, when I was in Sweden this spring, we announced our plans to build some of the most advanced and sustainable datacenters to date, powered from 100 percent renewable energy and with zero-waste operations.
• And, we are also working with our customers and partners to help them use technology to reduce their own environmental footprints and create their own solutions for a more sustainable planet. Our AI for Earth program, as an example, has expanded access to massive environmental data sets that can help others generate valuable insights about the health of our planet, including the conditions of our air, water, land, and the well-being of our wildlife. And it supports organizations that are applying AI to environmental challenges, by helping them harness the full power of cloud computing.
• We are working with organizations around the world to enable young people – including those who identify as female and under-represented minorities – with the digital skills required for the future. For example, we are the largest funder of Code.org, which teaches coding skills and reaches students in almost every country. And this year marks the 10-year anniversary of our Technology Education and Literacy in Schools (TEALS) Program, which helps build and grow sustainable computer science programs by connecting volunteers from Microsoft and other firms with teachers to team teach computer science in hundreds of high schools in the U.S. and British Columbia, Canada.
• We know that there is a broadband gap, and that’s why, in the U.S., our Airband program is using a mixed-technology approach, including TV whitespaces, to connect 3 million people living in unserved rural areas to broadband by 2022. And we’re working in more than 20 countries, harnessing this same technology to bring broadband to rural communities elsewhere.
• We also know that access to affordable housing is a significant barrier for many, and this year, we launched a major initiative to expand housing options for people who work in the Puget Sound region where we are headquartered. We believe that everyone should be able to choose to live in the community where they work, not just our employees and business partners, but all those who serve the broader community, from teachers and small-business owners, to first responders and medical practitioners. It’s why we are putting $500 million to work in loans and grants to accelerate the construction of more affordable housing in the region.

6
• Finally, more broadly, we’ve expanded our support for the nonprofit sector. We work closely with nonprofit organizations to help them accelerate their organizational transformation with technology, and, in fiscal 2019, Microsoft donated or provided discounted software and services worth more than $1.5 billion via Microsoft Philanthropies. Our employees generously donated an additional $170 million (including company match) through our employee giving program to support nonprofits in local communities around the world.
CULTURE
At its core, Microsoft’s strength lies in our talented people. It is a privilege to lead Microsoft employees around the world who work every day to earn our customers’ trust and help them succeed. We’ve long recognized the importance of prioritizing the physical, emotional, and financial well-being of our employees and their families, providing industry-leading benefits, including paid vacation and sick leave, as well as paid leaves of absence for a variety of life situations, including welcoming a new child or taking care of a family member with a serious health condition.
We are on a journey to close the gap between our espoused culture and the lived experience for every employee at Microsoft. Each day we practice customer obsession – listening and then innovating to meet customers’ unarticulated needs. We operate as One Microsoft to build and deliver the best solutions for customers. And we strive to make our workplace more diverse and inclusive to serve our diverse customers around the world and create a workplace where everyone can do their best work. Since fiscal 2016, we have increased the number of women corporate vice presidents by 152 percent. We’ve increased the number of African American/Black and Hispanic/Latinx employees in nonretail roles by 54 percent. And this past fiscal year, more than half of our U.S.-based interns were women, African American/Black, or Hispanic/Latinx. Diversity and inclusion continue to be a core priority for every employee and leader at Microsoft as part of our annual performance and development approach. And this past year we strengthened the connection between our growth mindset culture and our approach to diversity and inclusion by introducing a science-based, global allyship program.
At the board level, the slate of directors nominated for election at the 2019 annual shareholders meeting includes five women (accounting for 38 percent of our directors) and two of our four board committees will be chaired by women. Overall, more than half of our nominees (54 percent) represent gender or ethnic diversity. Representation is only one measure of progress, and we must keep pushing to do more, but I’m encouraged by our progress. Culture transformation is a continuous process of learning, renewal, and having the everyday courage to confront our own fixed mindsets, while remaining true to our enduring values of respect, integrity, and accountability.
In closing, at our partner conference this year, I talked about how our more than 140,000 employees, combined with our 17 million partners and our 75 million customers, have a collective opportunity to improve the lives of the 7 billion people on the planet through the power of technology. Everything we do is driven by this deep sense of purpose. We will continue to work alongside our customers to help them build their own digital capability and work to earn their trust every day. We will continue to innovate across the cloud and edge to help our customers thrive – today and long into the future. And we will continue to invest in large and growing markets to expand our opportunity.
As I reflect on this fiscal year, I’m proud of our progress and impact. And I’m even more optimistic about the opportunity ahead.
Satya Nadella Chief Executive Officer October 16, 2019

7
FINANCIAL HIGHLIGHTS (In millions, except per share amounts)
Year Ended June 30, 2019 (a) 2018 2017 (d)(e) 2016 (d) 2015 Revenue $ 125,843 $ 110,360 $ 96,571 $ 91,154 $ 93,580 Gross margin 82,933 72,007 62,310 58,374 60,542 Operating income 42,959 35,058 29,025 (f) 26,078 (g) 18,161(h) Net income 39,240(b) 16,571(c) 25,489 (f) 20,539 (g) 12,193(h) Diluted earnings per share 5.06 (b) 2.13(c) 3.25 (f) 2.56 (g) 1.48(h) Cash dividends declared per share 1.84 1.68 1.56 1.44 1.24 Cash, cash equivalents, and short-term
investments 133,819 133,768 132,981 113,240 96,526 Total assets 286,556 258,848 250,312 202,897 174,303 Long-term obligations 114,806 117,642 106,856 66,705 44,574 Stockholders’ equity 102,330 82,718 87,711 83,090 80,083
(a) GitHub has been included in our consolidated results of operations starting on the October 25, 2018 acquisition date.
(b) Includes a $2.6 billion net income tax benefit related to intangible property transfers and a $157 million net charge related to the enactment of the Tax Cuts and Jobs Act (“TCJA”), which together increased net income and diluted earnings per share (“EPS”) by $2.4 billion and $0.31, respectively. Refer to Note 12 – Income Taxes of the Notes to Financial Statements for further discussion.
(c) Includes a $13.7 billion net charge related to the enactment of the TCJA, which decreased net income and diluted EPS by $13.7 billion and $1.75, respectively. Refer to Note 12 – Income Taxes of the Notes to Financial Statements for further discussion.
(d) Reflects the impact of the adoption of new accounting standards in fiscal year 2018 related to revenue recognition and leases.
(e) LinkedIn has been included in our consolidated results of operations starting on the December 8, 2016 acquisition date.
(f) Includes $306 million of employee severance expenses primarily related to our sales and marketing restructuring plan, which decreased operating income, net income, and diluted EPS by $306 million, $243 million, and $0.04, respectively.
(g) Includes $630 million of asset impairment charges related to our Phone business and $480 million of restructuring charges associated with our Phone business restructuring plans, which together decreased operating income, net income, and diluted EPS by $1.1 billion, $895 million, and $0.11, respectively.
(h) Includes $7.5 billion of goodwill and asset impairment charges related to our Phone business and $2.5 billion of integration and restructuring expenses, primarily associated with our Phone business restructuring plans, which together decreased operating income, net income, and diluted EPS by $10.0 billion, $9.5 billion, and $1.15, respectively.
ISSUER PURCHASES OF EQUITY SECURITIES, DIVIDENDS, AND STOCK PERFORMANCE
SHARE REPURCHASES AND DIVIDENDS
Share Repurchases
On September 16, 2013, our Board of Directors approved a share repurchase program (“2013 Share Repurchase Program”) authorizing up to $40.0 billion in share repurchases. The 2013 Share Repurchase Program became effective on October 1, 2013, and was completed on December 22, 2016.
On September 20, 2016, our Board of Directors approved a share repurchase program authorizing up to an additional $40.0 billion in share repurchases (“2016 Share Repurchase Program”). This share repurchase program commenced on December 22, 2016 following completion of the 2013 Share Repurchase Program, has no expiration date, and may be suspended or discontinued at any time without notice. As of June 30, 2019, $11.4 billion remained of the 2016 Share Repurchase Program.

8
We repurchased the following shares of common stock under the share repurchase programs: (In millions) Shares Amount Shares Amount Shares Amount
Year Ended June 30, 2019 2018 2017 First Quarter 24 $ 2,600 22 $ 1,600 63 $ 3,550 Second Quarter 57 6,100 22 1,800 59 3,533 Third Quarter 36 3,899 34 3,100 25 1,600 Fourth Quarter 33 4,200 21 2,100 23 1,600
Total 150 $ 16,799 99 $ 8,600 170 $ 10,283
Shares repurchased in the first and second quarter of fiscal year 2017 were under the 2013 Share Repurchase Program. All other shares repurchased were under the 2016 Share Repurchase Program. The above table excludes shares repurchased to settle employee tax withholding related to the vesting of stock awards of $2.7 billion, $2.1 billion, and $1.5 billion for fiscal years 2019, 2018, and 2017, respectively. All share repurchases were made using cash resources.
Dividends
Our Board of Directors declared the following dividends:
Declaration Date Record Date Payment Date Dividend
Per Share Amount
Fiscal Year 2019 (In millions) September 18, 2018 November 15, 2018 December 13, 2018 $ 0.46 $ 3,544 November 28, 2018 February 21, 2019 March 14, 2019 0.46 3,526 March 11, 2019 May 16, 2019 June 13, 2019 0.46 3,521 June 12, 2019 August 15, 2019 September 12, 2019 0.46 3,516
Total $ 1.84 $ 14,107
Fiscal Year 2018
September 19, 2017 November 16, 2017 December 14, 2017 $ 0.42 $ 3,238 November 29, 2017 February 15, 2018 March 8, 2018 0.42 3,232 March 12, 2018 May 17, 2018 June 14, 2018 0.42 3,226 June 13, 2018 August 16, 2018 September 13, 2018 0.42 3,220
Total
$ 1.68 $ 12,916
The dividend declared on June 12, 2019 was included in other current liabilities as of June 30, 2019.

9
STOCK PERFORMANCE
COMPARISON OF 5 YEAR CUMULATIVE TOTAL RETURN* Among Microsoft Corporation, the S&P 500 Index
and the NASDAQ Computer Index
6/14 6/15 6/16 6/17 6/18 6/19
Microsoft Corporation 100.00 108.67 129.46 178.71 260.63 359.85 S&P 500 100.00 107.42 111.71 131.70 150.64 166.33 NASDAQ Computer 100.00 112.28 115.54 159.97 209.89 229.01
* $100 invested on 6/30/14 in stock or index, including reinvestment of dividends.
10
Note About Forward-Looking Statements
This report includes estimates, projections, statements relating to our business plans, objectives, and expected operating results that are “forward-looking statements” within the meaning of the Private Securities Litigation Reform Act of 1995, Section 27A of the Securities Act of 1933, and Section 21E of the Securities Exchange Act of 1934. Forward-looking statements may appear throughout this report, including the following sections: “Business” and “Management’s Discussion and Analysis of Financial Condition and Results of Operations”. These forward-looking statements generally are identified by the words “believe,” “project,” “expect,” “anticipate,” “estimate,” “intend,” “strategy,” “future,” “opportunity,” “plan,” “may,” “should,” “will,” “would,” “will be,” “will continue,” “will likely result,” and similar expressions. Forward-looking statements are based on current expectations and assumptions that are subject to risks and uncertainties that may cause actual results to differ materially. We describe risks and uncertainties that could cause actual results and events to differ materially in “Risk Factors,” “Management’s Discussion and Analysis of Financial Condition and Results of Operations,” and “Quantitative and Qualitative Disclosures about Market Risk” in our fiscal year 2019 Form 10-K. Readers are cautioned not to place undue reliance on forward-looking statements, which speak only as of the date they are made. We undertake no obligation to update or revise publicly any forward-looking statements, whether because of new information, future events, or otherwise.
BUSINESS
GENERAL
Embracing Our Future
Microsoft is a technology company whose mission is to empower every person and every organization on the planet to achieve more. We strive to create local opportunity, growth, and impact in every country around the world. Our platforms and tools help drive small business productivity, large business competitiveness, and public-sector efficiency. They also support new startups, improve educational and health outcomes, and empower human ingenuity.
We continue to transform our business to lead in the new era of the intelligent cloud and intelligent edge. We bring technology and products together into experiences and solutions that unlock value for our customers. In this next phase of innovation, computing is more powerful and ubiquitous from the cloud to the edge. Artificial intelligence (“AI”) capabilities are rapidly advancing, fueled by data and knowledge of the world. Physical and virtual worlds are coming together with the Internet of Things (“IoT”) and mixed reality to create richer experiences that understand the context surrounding people, the things they use, the places they go, and their activities and relationships. A person’s experience with technology spans a multitude of devices and has become increasingly more natural and multi-sensory with voice, ink, and gaze interactions.
What We Offer
Founded in 1975, we develop and support software, services, devices, and solutions that deliver new value for customers and help people and businesses realize their full potential.
We offer an array of services, including cloud-based solutions that provide customers with software, services, platforms, and content, and we provide solution support and consulting services. We also deliver relevant online advertising to a global audience.
Our products include operating systems; cross-device productivity applications; server applications; business solution applications; desktop and server management tools; software development tools; and video games. We also design, manufacture, and sell devices, including PCs, tablets, gaming and entertainment consoles, other intelligent devices, and related accessories.

11
The Ambitions That Drive Us
To achieve our vision, our research and development efforts focus on three interconnected ambitions:
• Reinvent productivity and business processes.
• Build the intelligent cloud and intelligent edge platform.
• Create more personal computing.
Reinvent Productivity and Business Processes
We are in a unique position to empower people and organizations to succeed in a rapidly evolving workplace. Computing experiences are evolving, no longer bound to one device at a time. Instead, experiences are expanding to many devices as people move from home to work to on the go. These modern needs, habits, and expectations of our customers are motivating us to bring Microsoft Office 365, Windows platform, devices, including Microsoft Surface, and third-party applications into a more cohesive Microsoft 365 experience.
Our growth depends on securely delivering continuous innovation and advancing our leading productivity and collaboration tools and services, including Office, Microsoft Dynamics, and LinkedIn. Microsoft 365 brings together Office 365, Windows 10, and Enterprise Mobility + Security to help organizations empower their employees with AI-backed tools that unlock creativity, increase teamwork, and fuel innovation, all the while enabling compliance coverage and data protection. Microsoft Teams is core to our vision for the modern workplace as the digital hub that creates a single canvas for teamwork, conversations, meetings, and content. Microsoft Relationship Sales solution brings together LinkedIn Sales Navigator and Dynamics to transform business to business sales through social selling. Dynamics 365 for Talent with LinkedIn Recruiter and Learning gives human resource professionals a complete solution to compete for talent. Microsoft Power Platform empowers employees to build custom applications, automate workflow, and analyze data no matter their technical expertise.
These scenarios represent a move to unlock creativity and inspire teamwork, while simplifying security and management. Organizations of all sizes can now digitize business-critical functions, redefining what customers can expect from their business applications. This creates an opportunity for us to reach new customers and increase usage and engagement with existing customers.
Build the Intelligent Cloud and Intelligent Edge Platform
Companies are looking to use digital technology to fundamentally reimagine how they empower their employees, engage customers, optimize their operations, and change the very core of their products and services. Partnering with organizations on their digital transformation is one of our largest opportunities and we are uniquely positioned to become the strategic digital transformation platform and partner of choice.
Our strategy requires continued investment in datacenters and other hybrid and edge infrastructure to support our services. Microsoft Azure is a trusted cloud with comprehensive compliance coverage and AI-based security built in.
Our cloud business benefits from three economies of scale: datacenters that deploy computational resources at significantly lower cost per unit than smaller ones; datacenters that coordinate and aggregate diverse customer, geographic, and application demand patterns, improving the utilization of computing, storage, and network resources; and multi-tenancy locations that lower application maintenance labor costs.
As one of the two largest providers of cloud computing at scale, we believe we work from a position of strength. Being a global-scale cloud, Azure uniquely offers hybrid consistency, developer productivity, AI capabilities, and trusted security and compliance. We see more emerging use cases and needs for compute and security at the edge and are accelerating our innovation across the spectrum of intelligent edge devices, from IoT sensors to gateway devices and edge hardware to build, manage, and secure edge workloads. With Azure Stack, organizations can extend Azure into their own datacenters to create a consistent stack across the public cloud and the intelligent edge.
12
Our hybrid infrastructure consistency spans identity, data, compute, management, and security, helping to support the real-world needs and evolving regulatory requirements of commercial customers and enterprises. We are accelerating our development of mixed reality solutions, with new Azure services and devices such as HoloLens 2. The opportunity to merge the physical and digital worlds, when combined with the power of Azure cloud services, unlocks the potential for entirely new workloads which we believe will shape the next era of computing.
The ability to convert data into AI drives our competitive advantage. Azure SQL Database makes it possible for customers to take Microsoft SQL Server from their on-premises datacenter to a fully managed instance in the cloud to utilize built-in AI. We are accelerating adoption of AI innovations from research to products. Our innovation helps every developer be an AI developer, with approachable new tools from Azure Machine Learning Studio for creating simple machine learning models, to the powerful Azure Machine Learning Workbench for the most advanced AI modeling and data science.
On October 25, 2018, we completed our acquisition of GitHub, Inc. (“GitHub”), a service that millions of developers around the world rely on to write code together. The acquisition is expected to empower developers to achieve more at every stage of the development lifecycle, accelerate enterprise use of GitHub, and bring Microsoft’s developer tools and services to new audiences.
Create More Personal Computing
We strive to make computing more personal by putting users at the core of the experience, enabling them to interact with technology in more intuitive, engaging, and dynamic ways. In support of this, we are bringing Office, Windows, and devices together for an enhanced and more cohesive customer experience.
Windows 10 continues to gain traction in the enterprise as the most secure and productive operating system. It empowers people with AI-first interfaces ranging from voice-activated commands through Cortana, inking, immersive 3D content storytelling, and mixed reality experiences. Windows also plays a critical role in fueling our cloud business and Microsoft 365 strategy, and it powers the growing range of devices on the “intelligent edge.” Our ambition for Windows 10 monetization opportunities includes gaming, services, subscriptions, and search advertising.
We are committed to designing and marketing first-party devices to help drive innovation, create new device categories, and stimulate demand in the Windows ecosystem. We recently expanded our Surface family of devices with the Surface Hub 2S, which brings together Microsoft Teams, Windows, and Surface hardware to power teamwork for organizations.
We are mobilizing to pursue our expansive opportunity in the gaming industry, broadening our approach to how we think about gaming end-to-end, from the way games are created and distributed to how they are played and viewed. We have a strong position with our Xbox One console, our large and growing highly engaged community of gamers on Xbox Live, and with Windows 10, the most popular operating system for PC gamers. We will continue to connect our gaming assets across PC, console, and mobile, and work to grow and engage the Xbox Live member network more deeply and frequently with services like Mixer and Xbox Game Pass. Our approach is to enable gamers to play the games they want, with the people they want, on the devices they want.
Our Future Opportunity
Customers are looking to us to accelerate their own digital transformations and to unlock new opportunity in this era of intelligent cloud and intelligent edge. We continue to develop complete, intelligent solutions for our customers that empower users to be creative and work together while safeguarding businesses and simplifying IT management. Our goal is to lead the industry in several distinct areas of technology over the long-term, which we expect will translate to sustained growth. We are investing significant resources in:
• Transforming the workplace to deliver new modern, modular business applications to improve how people communicate, collaborate, learn, work, play, and interact with one another.
13
• Building and running cloud-based services in ways that unleash new experiences and opportunities for businesses and individuals.
• Applying AI to drive insights and act on our customer’s behalf by understanding and interpreting their needs using natural methods of communication.
• Using Windows to fuel our cloud business and Microsoft 365 strategy, and to develop new categories of devices – both our own and third-party – on the intelligent edge.
• Inventing new gaming experiences that bring people together around their shared love for games on any devices and pushing the boundaries of innovation with console and PC gaming by creating the next wave of entertainment.
Our future growth depends on our ability to transcend current product category definitions, business models, and sales motions. We have the opportunity to redefine what customers and partners can expect and are working to deliver new solutions that reflect the best of Microsoft.
OPERATING SEGMENTS
We operate our business and report our financial performance using three segments: Productivity and Business Processes, Intelligent Cloud, and More Personal Computing. Our segments provide management with a comprehensive financial view of our key businesses. The segments enable the alignment of strategies and objectives across the development, sales, marketing, and services organizations, and they provide a framework for timely and rational allocation of resources within businesses.
Additional information on our operating segments and geographic and product information is contained in Note 20 – Segment Information and Geographic Data of the Notes to Financial Statements.
Our reportable segments are described below.
Productivity and Business Processes
Our Productivity and Business Processes segment consists of products and services in our portfolio of productivity, communication, and information services, spanning a variety of devices and platforms. This segment primarily comprises:
• Office Commercial, including Office 365 subscriptions and Office licensed on-premises, comprising Office, Exchange, SharePoint, Microsoft Teams, Office 365 Security and Compliance, and Skype for Business, and related Client Access Licenses (“CALs”).
• Office Consumer, including Office 365 subscriptions and Office licensed on-premises, and Office Consumer Services, including Skype, Outlook.com, and OneDrive.
• LinkedIn, including Talent Solutions, Marketing Solutions, and Premium Subscriptions.
• Dynamics business solutions, including Dynamics 365, a set of cloud-based applications across ERP and CRM, Dynamics ERP on-premises, and Dynamics CRM on-premises.
Office Commercial
Office Commercial is designed to increase personal, team, and organizational productivity through a range of products and services. Growth depends on our ability to reach new users in new markets such as first-line workers, small and medium businesses, and growth markets, as well as add value to our core product and service offerings to span productivity categories such as communication, collaboration, analytics, security, and compliance. Office Commercial revenue is mainly affected by a combination of continued installed base growth and average revenue per user expansion, as well as the continued shift from Office licensed on-premises to Office 365. CALs provide certain Office Commercial products and services with access rights to our server products and CAL revenue is reported with the associated Office products and services.

14
Office Consumer
Office Consumer is designed to increase personal productivity through a range of products and services. Growth depends on our ability to reach new users, add value to our core product set, and continue to expand our product and service offerings into new markets. Office Consumer revenue is mainly affected by the percentage of customers that buy Office with their new devices and the continued shift from Office licensed on-premises to Office 365. Office Consumer Services revenue is mainly affected by the demand for communication and storage through Skype, Outlook.com, and OneDrive, which is largely driven by subscriptions, advertising, and the sale of minutes.
LinkedIn connects the world’s professionals to make them more productive and successful, and is the world’s largest professional network on the Internet. LinkedIn offers services that can be used by customers to transform the way they hire, market, sell, and learn. In addition to LinkedIn’s free services, LinkedIn offers three categories of monetized solutions: Talent Solutions, Marketing Solutions, and Premium Subscriptions, which includes Sales Solutions. Talent Solutions is comprised of two elements: Hiring, and Learning and Development. Hiring provides services to recruiters that enable them to attract, recruit, and hire talent. Learning and Development provides subscriptions to enterprises and individuals to access online learning content. Marketing Solutions enables companies to advertise to LinkedIn’s member base. Premium Subscriptions enables professionals to manage their professional identity, grow their network, and connect with talent through additional services like premium search. Premium Subscriptions also includes Sales Solutions, which helps sales professionals find, qualify, and create sales opportunities and accelerate social selling capabilities. Growth will depend on our ability to increase the number of LinkedIn members and our ability to continue offering services that provide value for our members and increase their engagement. LinkedIn revenue is mainly affected by demand from enterprises and professional organizations for subscriptions to Talent Solutions and Premium Subscriptions offerings, as well as member engagement and the quality of the sponsored content delivered to those members to drive Marketing Solutions.
On November 16, 2018, LinkedIn acquired Glint, an employee engagement platform, to expand its Talent Solutions offerings.
Dynamics
Dynamics provides cloud-based and on-premises business solutions for financial management, enterprise resource planning (“ERP”), customer relationship management (“CRM”), supply chain management, and analytics applications for small and medium businesses, large organizations, and divisions of global enterprises. Dynamics revenue is driven by the number of users licensed, expansion of average revenue per user, and the continued shift to Dynamics 365, a unified set of cloud-based intelligent business applications.
Competition
Competitors to Office include software and global application vendors, such as Apple, Cisco Systems, Facebook, Google, IBM, Okta, Proofpoint, Slack, Symantec, Zoom, and numerous web-based and mobile application competitors as well as local application developers. Apple distributes versions of its pre-installed application software, such as email and calendar products, through its PCs, tablets, and phones. Cisco Systems is using its position in enterprise communications equipment to grow its unified communications business. Google provides a hosted messaging and productivity suite. Slack provides teamwork and collaboration software. Zoom offers videoconferencing and cloud phone solutions. Skype for Business and Skype also compete with a variety of instant messaging, voice, and video communication providers, ranging from start-ups to established enterprises. Okta, Proofpoint, and Symantec provide security solutions across email security, information protection, identity, and governance. Web-based offerings competing with individual applications have also positioned themselves as alternatives to our products and services. We compete by providing powerful, flexible, secure, integrated industry-specific, and easy-to-use productivity and collaboration tools and services that create comprehensive solutions and work well with technologies our customers already have both on-premises or in the cloud.
15
LinkedIn faces competition from online recruiting companies, talent management companies, and larger companies that are focusing on talent management and human resource services; job boards; traditional recruiting firms; and companies that provide learning and development products and services. Marketing Solutions competes with online and offline outlets that generate revenue from advertisers and marketers.
Dynamics competes with vendors such as Infor, NetSuite, Oracle, Salesforce.com, SAP, and The Sage Group to provide cloud-based and on-premise business solutions for small, medium, and large organizations.
Intelligent Cloud
Our Intelligent Cloud segment consists of our public, private, and hybrid server products and cloud services that can power modern business. This segment primarily comprises:
• Server products and cloud services, including SQL Server, Windows Server, Visual Studio, System Center, and related CALs, GitHub, and Azure.
• Enterprise Services, including Premier Support Services and Microsoft Consulting Services.
Server Products and Cloud Services
Our server products are designed to make IT professionals, developers, and their systems more productive and efficient. Server software is integrated server infrastructure and middleware designed to support software applications built on the Windows Server operating system. This includes the server platform, database, business intelligence, storage, management and operations, virtualization, service-oriented architecture platform, security, and identity software. We also license standalone and software development lifecycle tools for software architects, developers, testers, and project managers. GitHub provides a collaboration platform and code hosting service for developers. Server products revenue is mainly affected by purchases through volume licensing programs, licenses sold to original equipment manufacturers (“OEM”), and retail packaged products. CALs provide access rights to certain server products, including SQL Server and Windows Server, and revenue is reported along with the associated server product.
Azure is a comprehensive set of cloud services that offer developers, IT professionals, and enterprises freedom to build, deploy, and manage applications on any platform or device. Customers can use Azure through our global network of datacenters for computing, networking, storage, mobile and web application services, AI, IoT, cognitive services, and machine learning. Azure enables customers to devote more resources to development and use of applications that benefit their organizations, rather than managing on-premises hardware and software. Azure revenue is mainly affected by infrastructure-as-a-service and platform-as-a-service consumption-based services, and per user-based services such as Enterprise Mobility + Security.
Enterprise Services
Enterprise Services, including Premier Support Services and Microsoft Consulting Services, assist customers in developing, deploying, and managing Microsoft server and desktop solutions and provide training and certification to developers and IT professionals on various Microsoft products.
Competition
Our server products face competition from a wide variety of server operating systems and applications offered by companies with a range of market approaches. Vertically integrated computer manufacturers such as Hewlett-Packard, IBM, and Oracle offer their own versions of the Unix operating system preinstalled on server hardware. Nearly all computer manufacturers offer server hardware for the Linux operating system and many contribute to Linux operating system development. The competitive position of Linux has also benefited from the large number of compatible applications now produced by many commercial and non-commercial software developers. A number of companies, such as Red Hat, supply versions of Linux.

16
We compete to provide enterprise-wide computing solutions and point solutions with numerous commercial software vendors that offer solutions and middleware technology platforms, software applications for connectivity (both Internet and intranet), security, hosting, database, and e-business servers. IBM and Oracle lead a group of companies focused on the Java Platform Enterprise Edition that competes with our enterprise-wide computing solutions. Commercial competitors for our server applications for PC-based distributed client-server environments include CA Technologies, IBM, and Oracle. Our web application platform software competes with open source software such as Apache, Linux, MySQL, and PHP. In middleware, we compete against Java vendors.
Our database, business intelligence, and data warehousing solutions offerings compete with products from IBM, Oracle, SAP, and other companies. Our system management solutions compete with server management and server virtualization platform providers, such as BMC, CA Technologies, Hewlett-Packard, IBM, and VMware. Our products for software developers compete against offerings from Adobe, IBM, Oracle, and other companies, and also against open-source projects, including Eclipse (sponsored by CA Technologies, IBM, Oracle, and SAP), PHP, and Ruby on Rails.
We believe our server products provide customers with advantages in performance, total costs of ownership, and productivity by delivering superior applications, development tools, compatibility with a broad base of hardware and software applications, security, and manageability.
Azure faces diverse competition from companies such as Amazon, Google, IBM, Oracle, Salesforce.com, VMware, and open source offerings. Our Enterprise Mobility + Security offerings also compete with products from a range of competitors including identity vendors, security solution vendors, and numerous other security point solution vendors. Azure’s competitive advantage includes enabling a hybrid cloud, allowing deployment of existing datacenters with our public cloud into a single, cohesive infrastructure, and the ability to run at a scale that meets the needs of businesses of all sizes and complexities. We believe our cloud’s global scale, coupled with our broad portfolio of identity and security solutions, allows us to effectively solve complex cybersecurity challenges for our customers and differentiates us from the competition.
Our Enterprise Services business competes with a wide range of companies that provide strategy and business planning, application development, and infrastructure services, including multinational consulting firms and small niche businesses focused on specific technologies.
More Personal Computing
Our More Personal Computing segment consists of products and services geared towards harmonizing the interests of end users, developers, and IT professionals across all devices. This segment primarily comprises:
• Windows, including Windows OEM licensing (“Windows OEM”) and other non-volume licensing of the Windows operating system; Windows Commercial, comprising volume licensing of the Windows operating system, Windows cloud services, and other Windows commercial offerings; patent licensing; Windows IoT; and MSN advertising.
• Devices, including Surface, PC accessories, and other intelligent devices.
• Gaming, including Xbox hardware and Xbox software and services, comprising Xbox Live transactions, subscriptions, cloud services, and advertising (“Xbox Live”), video games, and third-party video game royalties.
• Search.
Windows
The Windows operating system is designed to deliver a more personal computing experience for users by enabling consistency of experience, applications, and information across their devices. Windows OEM revenue is impacted
17
significantly by the number of Windows operating system licenses purchased by OEMs, which they pre-install on the devices they sell. In addition to computing device market volume, Windows OEM revenue is impacted by:
• The mix of computing devices based on form factor and screen size.
• Differences in device market demand between developed markets and growth markets.
• Attachment of Windows to devices shipped.
• Customer mix between consumer, small and medium businesses, and large enterprises.
• Changes in inventory levels in the OEM channel.
• Pricing changes and promotions, pricing variation that occurs when the mix of devices manufactured shifts from local and regional system builders to large multinational OEMs, and different pricing of Windows versions licensed.
• Constraints in the supply chain of device components.
• Piracy.
Windows Commercial revenue, which includes volume licensing of the Windows operating system and Windows cloud services such as Microsoft Defender Advanced Threat Protection, is affected mainly by the demand from commercial customers for volume licensing and Software Assurance (“SA”), as well as advanced security offerings. Windows Commercial revenue often reflects the number of information workers in a licensed enterprise and is relatively independent of the number of PCs sold in a given year.
Patent licensing includes our programs to license patents we own for use across a broad array of technology areas, including mobile devices and cloud offerings.
Windows IoT extends the power of Windows and the cloud to intelligent systems by delivering specialized operating systems, tools, and services for use in embedded devices.
MSN advertising includes both native and display ads.
Devices
We design, manufacture, and sell devices, including Surface, PC accessories, and other intelligent devices. Our devices are designed to enable people and organizations to connect to the people and content that matter most using Windows and integrated Microsoft products and services. Surface is designed to help organizations, students, and consumers be more productive.
Gaming
Our gaming platform is designed to provide a unique variety of entertainment using our devices, peripherals, applications, online services, and content. We released Xbox One S and Xbox One X in August 2016 and November 2017, respectively. With the launch of the Mixer service in May 2017, offering interactive live streaming, and Xbox Game Pass in June 2017, providing unlimited access to over 100 Xbox titles, we continue to open new opportunities for customers to engage both on- and off-console. With our acquisition of PlayFab in January 2018, we enable worldwide game developers to utilize game services, LiveOps, and analytics for player acquisition, engagement, and retention. We have also made these services available for developers outside of the gaming industry.
Xbox Live enables people to connect and share online gaming experiences and is accessible on Xbox consoles, Windows-enabled devices, and other devices. Xbox Live is designed to benefit users by providing access to a network of certified applications and services and to benefit our developer and partner ecosystems by providing access to a large customer base. Xbox Live revenue is mainly affected by subscriptions and sales of Xbox Live enabled content, as well as advertising. We also continue to design and sell gaming content to showcase our unique

18
platform capabilities for Xbox consoles, Windows-enabled devices, and other devices. Growth of our Gaming business is determined by the overall active user base through Xbox Live enabled content, availability of games, providing exclusive game content that gamers seek, the computational power and reliability of the devices used to access our content and services, and the ability to create new experiences via online services including game streaming, downloadable content, and peripherals.
Search
Our Search business, including Bing and Microsoft Advertising, is designed to deliver relevant online advertising to a global audience. We have several partnerships with other companies, including Verizon Media Group, through which we provide and monetize search queries. Growth depends on our ability to attract new users, understand intent, and match intent with relevant content and advertiser offerings.
Competition
Windows faces competition from various software products and from alternative platforms and devices, mainly from Apple and Google. We believe Windows competes effectively by giving customers choice, value, flexibility, security, an easy-to-use interface, and compatibility with a broad range of hardware and software applications, including those that enable productivity.
Devices face competition from various computer, tablet, and hardware manufacturers who offer a unique combination of high-quality industrial design and innovative technologies across various price points. These manufacturers, many of which are also current or potential partners and customers, include Apple and our Windows OEMs.
Our gaming platform competes with console platforms from Nintendo and Sony, both of which have a large, established base of customers. The lifecycle for gaming and entertainment consoles averages five to ten years. Nintendo released its latest generation console in March 2017 and Sony released its latest generation console in November 2013. We also compete with other providers of entertainment services through online marketplaces. We believe our gaming platform is effectively positioned against competitive products and services based on significant innovation in hardware architecture, user interface, developer tools, online gaming and entertainment services, and continued strong exclusive content from our own game franchises as well as other digital content offerings. Our video games competitors include Electronic Arts and Activision Blizzard. Xbox Live and our cloud gaming services face competition from various online marketplaces, including those operated by Amazon, Apple, and Google.
Our search business competes with Google and a wide array of websites, social platforms like Facebook, and portals that provide content and online offerings to end users.
OPERATIONS
We have operations centers that support operations in their regions, including customer contract and order processing, credit and collections, information processing, and vendor management and logistics. The regional center in Ireland supports the European, Middle Eastern, and African region; the center in Singapore supports the Japan, India, Greater China, and Asia-Pacific region; and the centers in Fargo, North Dakota, Fort Lauderdale, Florida, Puerto Rico, Redmond, Washington, and Reno, Nevada support Latin America and North America. In addition to the operations centers, we also operate datacenters throughout the Americas, Europe, Australia, and Asia, as well as in the Middle East and Africa.
To serve the needs of customers around the world and to improve the quality and usability of products in international markets, we localize many of our products to reflect local languages and conventions. Localizing a product may require modifying the user interface, altering dialog boxes, and translating text.
Our devices are primarily manufactured by third-party contract manufacturers. We generally have the ability to use other manufacturers if a current vendor becomes unavailable or unable to meet our requirements.

19
RESEARCH AND DEVELOPMENT
Product and Service Development, and Intellectual Property
We develop most of our products and services internally through the following engineering groups.
• Cloud and AI, focuses on making IT professionals, developers, and their systems more productive and efficient through development of cloud infrastructure, server, database, CRM, ERP, management and development tools, AI cognitive services, and other business process applications and services for enterprises.
• Experiences and Devices, focuses on instilling a unifying product ethos across our end-user experiences and devices, including Office, Windows, Enterprise Mobility and Management, and Surface.
• AI and Research, focuses on our AI innovations and other forward-looking research and development efforts spanning infrastructure, services, applications, and search.
• LinkedIn, focuses on our services that transform the way customers hire, market, sell, and learn.
• Gaming, focuses on connecting gaming assets across the range of devices to grow and engage the Xbox Live member network through game experiences, streaming content, and social interaction.
Internal development allows us to maintain competitive advantages that come from product differentiation and closer technical control over our products and services. It also gives us the freedom to decide which modifications and enhancements are most important and when they should be implemented. We strive to obtain information as early as possible about changing usage patterns and hardware advances that may affect software and hardware design. Before releasing new software platforms, and as we make significant modifications to existing platforms, we provide application vendors with a range of resources and guidelines for development, training, and testing. Generally, we also create product documentation internally.
We protect our intellectual property investments in a variety of ways. We work actively in the U.S. and internationally to ensure the enforcement of copyright, trademark, trade secret, and other protections that apply to our software and hardware products, services, business plans, and branding. We are a leader among technology companies in pursuing patents and currently have a portfolio of over 61,000 U.S. and international patents issued and over 26,000 pending. While we employ much of our internally-developed intellectual property exclusively in our products and services, we also engage in outbound licensing of specific patented technologies that are incorporated into licensees’ products. From time to time, we enter into broader cross-license agreements with other technology companies covering entire groups of patents. We also purchase or license technology that we incorporate into our products and services. At times, we make select intellectual property broadly available at no or low cost to achieve a strategic objective, such as promoting industry standards, advancing interoperability, or attracting and enabling our external development community. Our increasing engagement with open source software will also cause us to license our intellectual property rights broadly in certain situations.
While it may be necessary in the future to seek or renew licenses relating to various aspects of our products, services, and business methods, we believe, based upon past experience and industry practice, such licenses generally can be obtained on commercially reasonable terms. We believe our continuing research and product development are not materially dependent on any single license or other agreement with a third party relating to the development of our products.
Investing in the Future
Our success is based on our ability to create new and compelling products, services, and experiences for our users, to initiate and embrace disruptive technology trends, to enter new geographic and product markets, and to drive broad adoption of our products and services. We invest in a range of emerging technology trends and breakthroughs that we believe offer significant opportunities to deliver value to our customers and growth for the Company. Based on our assessment of key technology trends, we maintain our long-term commitment to research and development across a wide spectrum of technologies, tools, and platforms spanning digital work and life experiences, cloud computing, AI, devices, and operating systems.

20
While our main research and development facilities are located in Redmond, Washington, we also operate research and development facilities in other parts of the U.S. and around the world, including Canada, China, Czech Republic, India, Ireland, Israel, and the United Kingdom. This global approach helps us remain competitive in local markets and enables us to continue to attract top talent from across the world. We generally fund research at the corporate level to ensure that we are looking beyond immediate product considerations to opportunities further in the future. We also fund research and development activities at the operating segment level. Much of our segment level research and development is coordinated with other segments and leveraged across the Company.
In addition to our main research and development operations, we also operate Microsoft Research. Microsoft Research is one of the world’s largest corporate research organizations and works in close collaboration with top universities around the world to advance the state-of-the-art in computer science and a broad range of other disciplines, providing us a unique perspective on future trends and contributing to our innovation.
We plan to continue to make significant investments in a broad range of research and development efforts.
DISTRIBUTION, SALES, AND MARKETING
We market and distribute our products and services through the following channels: OEMs, direct, and distributors and resellers. Our sales force performs a variety of functions, including working directly with enterprises and public-sector organizations worldwide to identify and meet their technology requirements; managing OEM relationships; and supporting system integrators, independent software vendors, and other partners who engage directly with our customers to perform sales, consulting, and fulfillment functions for our products and services.
OEMs
We distribute our products and services through OEMs that pre-install our software on new devices and servers they sell. The largest component of the OEM business is the Windows operating system pre-installed on devices. OEMs also sell devices pre-installed with other Microsoft products and services, including applications such as Office and the capability to subscribe to Office 365.
There are two broad categories of OEMs. The largest category of OEMs are direct OEMs as our relationship with them is managed through a direct agreement between Microsoft and the OEM. We have distribution agreements covering one or more of our products with virtually all the multinational OEMs, including Acer, ASUS, Dell, Fujitsu, Hewlett-Packard, Lenovo, Samsung, Sharp, Toshiba, and with many regional and local OEMs. The second broad category of OEMs are system builders consisting of lower-volume PC manufacturers, which source Microsoft software for pre-installation and local redistribution primarily through the Microsoft distributor channel rather than through a direct agreement or relationship with Microsoft.
Direct
Many organizations that license our products and services transact directly with us through Enterprise Agreements and Enterprise Services contracts, with sales support from system integrators, independent software vendors, web agencies, and partners that advise organizations on licensing our products and services (“Enterprise Agreement Software Advisors” or “ESA”). Microsoft offers direct sales programs targeted to reach small, medium, and corporate customers, in addition to those offered through the reseller channel. A large network of partner advisors support many of these sales.
We also sell commercial and consumer products and services directly to customers, such as cloud services, search, and gaming, through our digital marketplaces, online stores, and retail stores.
Distributors and Resellers
Organizations also license our products and services indirectly, primarily through licensing solution partners (“LSP”), distributors, value-added resellers (“VAR”), and retailers. Although each type of reselling partner may reach
21
organizations of all sizes, LSPs are primarily engaged with large organizations, distributors resell primarily to VARs, and VARs typically reach small and medium organizations. ESAs are also typically authorized as LSPs and operate as resellers for our other volume licensing programs. Microsoft Cloud Solution Provider is our main partner program for reselling cloud services.
We distribute our retail packaged products primarily through independent non-exclusive distributors, authorized replicators, resellers, and retail outlets. Individual consumers obtain these products primarily through retail outlets. We distribute our devices through third-party retailers. We have a network of field sales representatives and field support personnel that solicit orders from distributors and resellers, and provide product training and sales support.
Our Dynamics business solutions are also licensed to enterprises through a global network of channel partners providing vertical solutions and specialized services.
LICENSING OPTIONS
We offer options for organizations that want to purchase our cloud services, on-premises software, and Software Assurance. We license software to organizations under volume licensing agreements to allow the customer to acquire multiple licenses of products and services instead of having to acquire separate licenses through retail channels. We use different programs designed to provide flexibility for organizations of various sizes. While these programs may differ in various parts of the world, generally they include those discussed below.
SA conveys rights to new software and upgrades for perpetual licenses released over the contract period. It also provides support, tools, and training to help customers deploy and use software efficiently. SA is included with certain volume licensing agreements and is an optional purchase with others.
Volume Licensing Programs
Enterprise Agreement
Enterprise Agreements offer large organizations a manageable volume licensing program that gives them the flexibility to buy cloud services and software licenses under one agreement. Enterprise Agreements are designed for medium or large organizations that want to license cloud services and on-premises software organization-wide over a three-year period. Organizations can elect to purchase perpetual licenses or subscribe to licenses. SA is included.
Microsoft Product and Services Agreement
Microsoft Product and Services Agreements are designed for medium and large organizations that want to license cloud services and on-premises software as needed, with no organization-wide commitment, under a single, non-expiring agreement. Organizations purchase perpetual licenses or subscribe to licenses. SA is optional for customers that purchase perpetual licenses.
Open
Open agreements are a simple, cost-effective way to acquire the latest Microsoft technology. Open agreements are designed for small and medium organizations that want to license cloud services and on-premises software over a one- to three-year period. Under the Open agreements, organizations purchase perpetual licenses and SA is optional. Under Open Value agreements, organizations can elect to purchase perpetual licenses or subscribe to licenses and SA is included.
Select Plus
Select Plus agreements are designed for government and academic organizations to acquire on-premises licenses at any affiliate or department level, while realizing advantages as one organization. Organizations purchase perpetual licenses and SA is optional.

22
Microsoft Online Subscription Agreement
Microsoft Online Subscription Agreements are designed for small and medium organizations that want to subscribe to, activate, provision, and maintain cloud services seamlessly and directly via the web. The agreement allows customers to acquire monthly or annual subscriptions for cloud-based services.
Partner Programs
The Microsoft Cloud Solution Provider program offers customers an easy way to license the cloud services they need in combination with the value-added services offered by their systems integrator, hosting partner, or cloud reseller partner. Partners in this program can easily package their own products and services to directly provision, manage, and support their customer subscriptions.
The Microsoft Services Provider License Agreement allows service providers and independent software vendors who want to license eligible Microsoft software products to provide software services and hosted applications to their end customers. Partners license software over a three-year period and are billed monthly based on consumption.
The Independent Software Vendor Royalty program enables partners to integrate Microsoft products into other applications and then license the unified business solution to their end users.
CUSTOMERS
Our customers include individual consumers, small and medium organizations, large global enterprises, public-sector institutions, Internet service providers, application developers, and OEMs. Our practice is to ship our products promptly upon receipt of purchase orders from customers; consequently, backlog is not significant.
EMPLOYEES
As of June 30, 2019, we employed approximately 144,000 people on a full-time basis, 85,000 in the U.S. and 59,000 internationally. Of the total employed people, 47,000 were in operations, including manufacturing, distribution, product support, and consulting services; 47,000 were in product research and development; 38,000 were in sales and marketing; and 12,000 were in general and administration. Certain of our employees are subject to collective bargaining agreements.
AVAILABLE INFORMATION
Our Internet address is www.microsoft.com. At our Investor Relations website, www.microsoft.com/investor, we make available free of charge a variety of information for investors. Our goal is to maintain the Investor Relations website as a portal through which investors can easily find or navigate to pertinent information about us, including:
• Our annual report on Form 10-K, quarterly reports on Form 10-Q, current reports on Form 8-K, and any amendments to those reports, as soon as reasonably practicable after we electronically file that material with or furnish it to the Securities and Exchange Commission (“SEC”) at www.sec.gov.
• Information on our business strategies, financial results, and metrics for investors.
• Announcements of investor conferences, speeches, and events at which our executives talk about our product, service, and competitive strategies. Archives of these events are also available.
• Press releases on quarterly earnings, product and service announcements, legal developments, and international news.
• Corporate governance information including our articles of incorporation, bylaws, governance guidelines, committee charters, codes of conduct and ethics, global corporate social responsibility initiatives, and other governance-related policies.

23
• Other news and announcements that we may post from time to time that investors might find useful or interesting.
• Opportunities to sign up for email alerts to have information pushed in real time.
The information found on our website is not part of this or any other report we file with, or furnish to, the SEC. In addition to these channels, we use social media to communicate to the public. It is possible that the information we post on social media could be deemed to be material to investors. We encourage investors, the media, and others interested in Microsoft to review the information we post on the social media channels listed on our Investor Relations website.
24
MANAGEMENT’S DISCUSSION AND ANALYSIS OF FINANCIAL CONDITION AND
RESULTS OF OPERATIONS
The following Management’s Discussion and Analysis of Financial Condition and Results of Operations (“MD&A”) is intended to help the reader understand the results of operations and financial condition of Microsoft Corporation. MD&A is provided as a supplement to, and should be read in conjunction with, our consolidated financial statements and the accompanying Notes to Financial Statements.
OVERVIEW
Microsoft is a technology company whose mission is to empower every person and every organization on the planet to achieve more. We strive to create local opportunity, growth, and impact in every country around the world. Our platforms and tools help drive small business productivity, large business competitiveness, and public-sector efficiency. They also support new startups, improve educational and health outcomes, and empower human ingenuity.
We generate revenue by offering a wide range of cloud-based and other services to people and businesses; licensing and supporting an array of software products; designing, manufacturing, and selling devices; and delivering relevant online advertising to a global audience. Our most significant expenses are related to compensating employees; designing, manufacturing, marketing, and selling our products and services; datacenter costs in support of our cloud-based services; and income taxes.
Highlights from fiscal year 2019 compared with fiscal year 2018 included:
• Commercial cloud revenue, which includes Microsoft Office 365 Commercial, Microsoft Azure, the commercial portion of LinkedIn, Microsoft Dynamics 365, and other commercial cloud properties, increased 43% to $38.1 billion.
• Office Commercial revenue increased 13%, driven by Office 365 Commercial growth of 33%.
• Office Consumer revenue increased 7%, and Office 365 Consumer subscribers increased to 34.8 million.
• LinkedIn revenue increased 28%, with record levels of engagement highlighted by LinkedIn sessions growth of 27%.
• Dynamics revenue increased 15%, driven by Dynamics 365 growth of 47%.
• Server products and cloud services revenue, including GitHub, increased 25%, driven by Azure growth of 72%.
• Enterprise Services revenue increased 5%.
• Windows original equipment manufacturer licensing (“Windows OEM”) revenue increased 4%.
• Windows Commercial revenue increased 14%.
• Microsoft Surface revenue increased 23%.
• Gaming revenue increased 10%, driven by Xbox software and services growth of 19%.
• Search advertising revenue, excluding traffic acquisition costs, increased 13%.
We have recast certain prior period commercial cloud metrics to include the commercial portion of LinkedIn to provide a comparable view of our commercial cloud business performance. The commercial portion of LinkedIn includes LinkedIn Recruiter, Sales Navigator, premium business subscriptions, and other services for organizations.
On October 25, 2018, we acquired GitHub, Inc. (“GitHub”) in a $7.5 billion stock transaction (inclusive of total cash payments of $1.3 billion in respect of vested GitHub equity awards and an indemnity escrow). The financial results of GitHub have been included in our consolidated financial statements since the date of the acquisition. GitHub is reported as part of our Intelligent Cloud segment. Refer to Note 8 – Business Combinations of the Notes to Financial Statements for further discussion.
25
On December 22, 2017, the Tax Cuts and Jobs Act (“TCJA”) was enacted into law, which significantly changed existing U.S. tax law and included numerous provisions that affect our business. We recorded a provisional net charge related to the enactment of the TCJA of $13.7 billion in fiscal year 2018, and adjusted our provisional net charge by recording additional tax expense of $157 million in the second quarter of fiscal year 2019. In the fourth quarter of fiscal year 2019, in response to the TCJA and recently issued regulations, we transferred certain intangible properties held by our foreign subsidiaries to the U.S. and Ireland, which resulted in a $2.6 billion net income tax benefit. Refer to Note 12 – Income Taxes of the Notes to Financial Statements for further discussion.
Industry Trends
Our industry is dynamic and highly competitive, with frequent changes in both technologies and business models. Each industry shift is an opportunity to conceive new products, new technologies, or new ideas that can further transform the industry and our business. At Microsoft, we push the boundaries of what is possible through a broad range of research and development activities that seek to identify and address the changing demands of customers and users, industry trends, and competitive forces.
Economic Conditions, Challenges, and Risks
The markets for software, devices, and cloud-based services are dynamic and highly competitive. Our competitors are developing new software and devices, while also deploying competing cloud-based services for consumers and businesses. The devices and form factors customers prefer evolve rapidly, and influence how users access services in the cloud, and in some cases, the user’s choice of which suite of cloud-based services to use. We must continue to evolve and adapt over an extended time in pace with this changing environment. The investments we are making in infrastructure and devices will continue to increase our operating costs and may decrease our operating margins.
Our success is highly dependent on our ability to attract and retain qualified employees. We hire a mix of university and industry talent worldwide. We compete for talented individuals globally by offering an exceptional working environment, broad customer reach, scale in resources, the ability to grow one’s career across many different products and businesses, and competitive compensation and benefits. Aggregate demand for our software, services, and devices is correlated to global macroeconomic and geopolitical factors, which remain dynamic.
Our international operations provide a significant portion of our total revenue and expenses. Many of these revenue and expenses are denominated in currencies other than the U.S. dollar. As a result, changes in foreign exchange rates may significantly affect revenue and expenses. Strengthening of foreign currencies relative to the U.S. dollar throughout fiscal year 2018 positively impacted reported revenue and increased reported expenses from our international operations. Strengthening of the U.S. dollar relative to certain foreign currencies did not significantly impact reported revenue or expenses from our international operations in the first and second quarters of fiscal year 2019, and reduced reported revenue and expenses from our international operations in the third and fourth quarters of fiscal year 2019.
Refer to Risk Factors in our fiscal year 2019 Form 10-K for a discussion of these factors and other risks.
Seasonality
Our revenue fluctuates quarterly and is generally higher in the second and fourth quarters of our fiscal year. Second quarter revenue is driven by corporate year-end spending trends in our major markets and holiday season spending by consumers, and fourth quarter revenue is driven by the volume of multi-year on-premises contracts executed during the period.
Reportable Segments
We report our financial performance based on the following segments: Productivity and Business Processes, Intelligent Cloud, and More Personal Computing. The segment amounts included in MD&A are presented on a basis
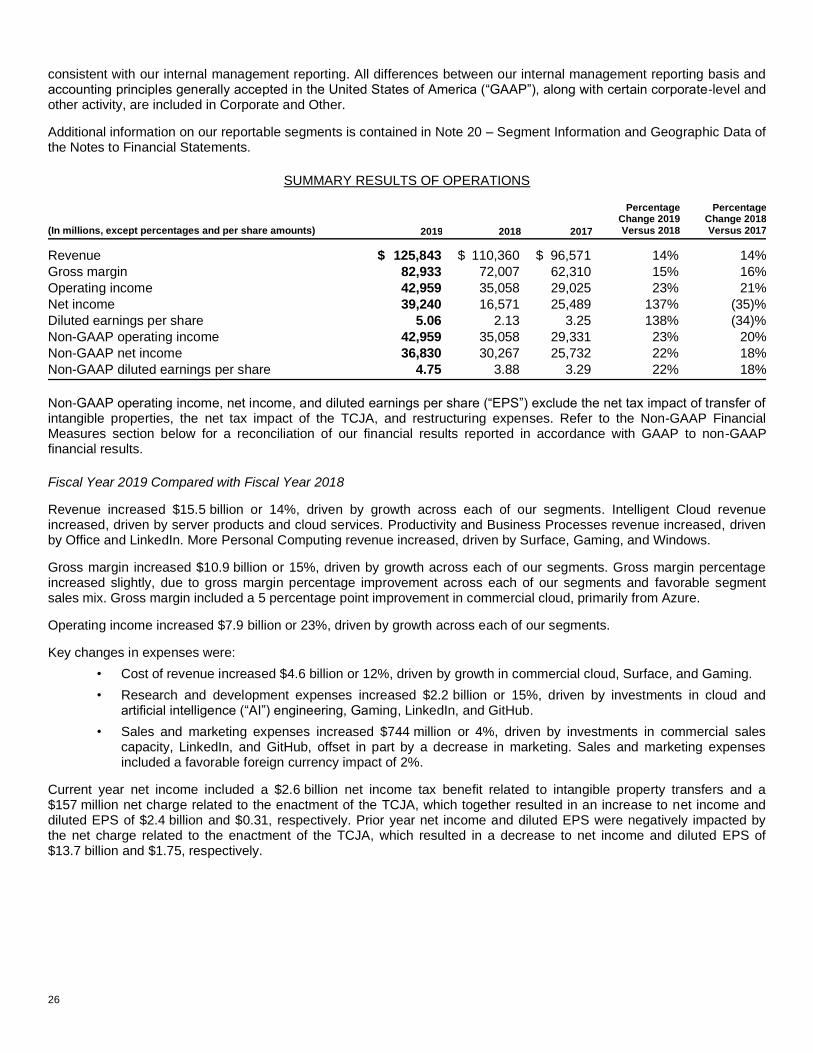
26
consistent with our internal management reporting. All differences between our internal management reporting basis and accounting principles generally accepted in the United States of America (“GAAP”), along with certain corporate-level and other activity, are included in Corporate and Other.
Additional information on our reportable segments is contained in Note 20 – Segment Information and Geographic Data of the Notes to Financial Statements.
SUMMARY RESULTS OF OPERATIONS
(In millions, except percentages and per share amounts) 2019 2018 2017
Percentage Change 2019 Versus 2018
Percentage Change 2018 Versus 2017
Revenue $ 125,843 $ 110,360 $ 96,571 14% 14% Gross margin 82,933 72,007 62,310 15% 16% Operating income 42,959 35,058 29,025 23% 21% Net income 39,240 16,571 25,489 137% (35)% Diluted earnings per share 5.06 2.13 3.25 138% (34)% Non-GAAP operating income 42,959 35,058 29,331 23% 20% Non-GAAP net income 36,830 30,267 25,732 22% 18% Non-GAAP diluted earnings per share 4.75 3.88 3.29 22% 18%
Non-GAAP operating income, net income, and diluted earnings per share (“EPS”) exclude the net tax impact of transfer of intangible properties, the net tax impact of the TCJA, and restructuring expenses. Refer to the Non-GAAP Financial Measures section below for a reconciliation of our financial results reported in accordance with GAAP to non-GAAP financial results.
Fiscal Year 2019 Compared with Fiscal Year 2018
Revenue increased $15.5 billion or 14%, driven by growth across each of our segments. Intelligent Cloud revenue increased, driven by server products and cloud services. Productivity and Business Processes revenue increased, driven by Office and LinkedIn. More Personal Computing revenue increased, driven by Surface, Gaming, and Windows.
Gross margin increased $10.9 billion or 15%, driven by growth across each of our segments. Gross margin percentage increased slightly, due to gross margin percentage improvement across each of our segments and favorable segment sales mix. Gross margin included a 5 percentage point improvement in commercial cloud, primarily from Azure.
Operating income increased $7.9 billion or 23%, driven by growth across each of our segments.
Key changes in expenses were:
• Cost of revenue increased $4.6 billion or 12%, driven by growth in commercial cloud, Surface, and Gaming.
• Research and development expenses increased $2.2 billion or 15%, driven by investments in cloud and artificial intelligence (“AI”) engineering, Gaming, LinkedIn, and GitHub.
• Sales and marketing expenses increased $744 million or 4%, driven by investments in commercial sales capacity, LinkedIn, and GitHub, offset in part by a decrease in marketing. Sales and marketing expenses included a favorable foreign currency impact of 2%.
Current year net income included a $2.6 billion net income tax benefit related to intangible property transfers and a $157 million net charge related to the enactment of the TCJA, which together resulted in an increase to net income and diluted EPS of $2.4 billion and $0.31, respectively. Prior year net income and diluted EPS were negatively impacted by the net charge related to the enactment of the TCJA, which resulted in a decrease to net income and diluted EPS of $13.7 billion and $1.75, respectively.
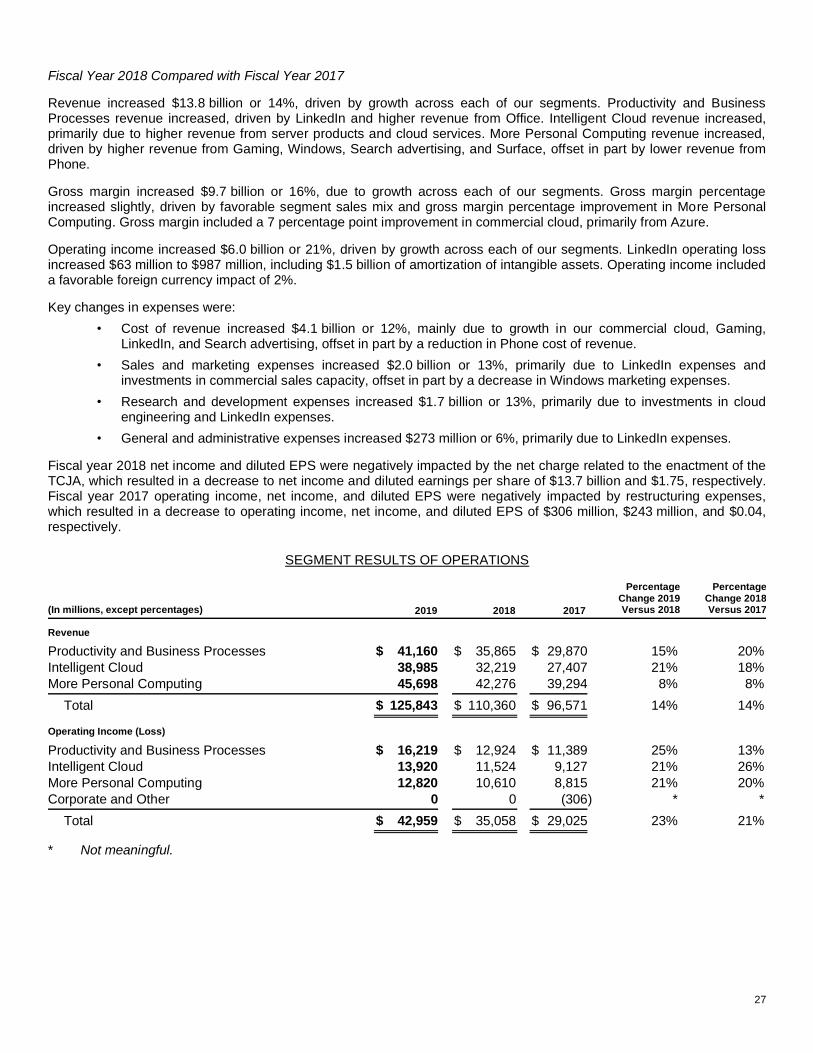
27
Fiscal Year 2018 Compared with Fiscal Year 2017
Revenue increased $13.8 billion or 14%, driven by growth across each of our segments. Productivity and Business Processes revenue increased, driven by LinkedIn and higher revenue from Office. Intelligent Cloud revenue increased, primarily due to higher revenue from server products and cloud services. More Personal Computing revenue increased, driven by higher revenue from Gaming, Windows, Search advertising, and Surface, offset in part by lower revenue from Phone.
Gross margin increased $9.7 billion or 16%, due to growth across each of our segments. Gross margin percentage increased slightly, driven by favorable segment sales mix and gross margin percentage improvement in More Personal Computing. Gross margin included a 7 percentage point improvement in commercial cloud, primarily from Azure.
Operating income increased $6.0 billion or 21%, driven by growth across each of our segments. LinkedIn operating loss increased $63 million to $987 million, including $1.5 billion of amortization of intangible assets. Operating income included a favorable foreign currency impact of 2%.
Key changes in expenses were:
• Cost of revenue increased $4.1 billion or 12%, mainly due to growth in our commercial cloud, Gaming, LinkedIn, and Search advertising, offset in part by a reduction in Phone cost of revenue.
• Sales and marketing expenses increased $2.0 billion or 13%, primarily due to LinkedIn expenses and investments in commercial sales capacity, offset in part by a decrease in Windows marketing expenses.
• Research and development expenses increased $1.7 billion or 13%, primarily due to investments in cloud engineering and LinkedIn expenses.
• General and administrative expenses increased $273 million or 6%, primarily due to LinkedIn expenses.
Fiscal year 2018 net income and diluted EPS were negatively impacted by the net charge related to the enactment of the TCJA, which resulted in a decrease to net income and diluted earnings per share of $13.7 billion and $1.75, respectively. Fiscal year 2017 operating income, net income, and diluted EPS were negatively impacted by restructuring expenses, which resulted in a decrease to operating income, net income, and diluted EPS of $306 million, $243 million, and $0.04, respectively.
SEGMENT RESULTS OF OPERATIONS
(In millions, except percentages) 2019 2018 2017
Percentage Change 2019 Versus 2018
Percentage Change 2018 Versus 2017
Revenue Productivity and Business Processes $ 41,160 $ 35,865 $ 29,870 15% 20% Intelligent Cloud 38,985 32,219 27,407 21% 18% More Personal Computing 45,698 42,276 39,294 8% 8%
Total $ 125,843 $ 110,360 $ 96,571 14% 14% Operating Income (Loss)
Productivity and Business Processes $ 16,219 $ 12,924 $ 11,389 25% 13% Intelligent Cloud 13,920 11,524 9,127 21% 26% More Personal Computing 12,820 10,610 8,815 21% 20% Corporate and Other 0 0 (306) * *
Total $ 42,959 $ 35,058 $ 29,025 23% 21%
* Not meaningful.
28
Reportable Segments
Fiscal Year 2019 Compared with Fiscal Year 2018
Productivity and Business Processes
Revenue increased $5.3 billion or 15%.
• Office Commercial revenue increased $3.2 billion or 13%, driven by Office 365 Commercial, offset in part by lower revenue from products licensed on-premises, reflecting a continued shift to cloud offerings. Office 365 Commercial grew 33%, due to growth in seats and higher average revenue per user.
• Office Consumer revenue increased $286 million or 7%, driven by Office 365 Consumer, due to recurring subscription revenue and transactional strength in Japan.
• LinkedIn revenue increased $1.5 billion or 28%, driven by growth across each line of business.
• Dynamics revenue increased 15%, driven by Dynamics 365 growth.
Operating income increased $3.3 billion or 25%, including an unfavorable foreign currency impact of 2%.
• Gross margin increased $4.1 billion or 15%, driven by growth in Office Commercial and LinkedIn. Gross margin percentage increased slightly, due to gross margin percentage improvement in LinkedIn and Office 365 Commercial, offset in part by an increased mix of cloud offerings.
• Operating expenses increased $806 million or 6%, driven by investments in LinkedIn and cloud engineering, offset in part by a decrease in marketing.
Intelligent Cloud
Revenue increased $6.8 billion or 21%.
• Server products and cloud services revenue, including GitHub, increased $6.5 billion or 25%, driven by Azure. Azure revenue growth was 72%, due to higher infrastructure-as-a-service and platform-as-a-service consumption-based and per user-based services. Server products revenue increased 6%, due to continued demand for premium versions and hybrid solutions, GitHub, and demand ahead of end-of-support for SQL Server 2008 and Windows Server 2008.
• Enterprise Services revenue increased $278 million or 5%, driven by growth in Premier Support Services and Microsoft Consulting Services.
Operating income increased $2.4 billion or 21%.
• Gross margin increased $4.8 billion or 22%, driven by growth in server products and cloud services revenue and cloud services scale and efficiencies. Gross margin percentage increased slightly, due to gross margin percentage improvement in Azure, offset in part by an increased mix of cloud offerings.
• Operating expenses increased $2.4 billion or 22%, driven by investments in cloud and AI engineering, GitHub, and commercial sales capacity.
More Personal Computing
Revenue increased $3.4 billion or 8%.
• Windows revenue increased $877 million or 4%, driven by growth in Windows Commercial and Windows OEM, offset in part by a decline in patent licensing. Windows Commercial revenue increased 14%, driven by an increased mix of multi-year agreements that carry higher in-quarter revenue recognition. Windows OEM revenue increased 4%. Windows OEM Pro revenue grew 10%, ahead of the commercial PC market, driven by healthy Windows 10 demand. Windows OEM non-Pro revenue declined 7%, below the consumer PC market, driven by continued pressure in the entry level category.

29
• Surface revenue increased $1.1 billion or 23%, with strong growth across commercial and consumer.
• Gaming revenue increased $1.0 billion or 10%, driven by Xbox software and services growth of 19%, primarily due to third-party title strength and subscriptions growth, offset in part by a decline in Xbox hardware of 13% primarily due to a decrease in volume of consoles sold.
• Search advertising revenue increased $616 million or 9%. Search advertising revenue, excluding traffic acquisition costs, increased 13%, driven by higher revenue per search.
Operating income increased $2.2 billion or 21%, including an unfavorable foreign currency impact of 2%.
• Gross margin increased $2.0 billion or 9%, driven by growth in Windows, Gaming, and Search. Gross margin percentage increased slightly, due to a sales mix shift to higher gross margin businesses in Windows and Gaming.
• Operating expenses decreased $172 million or 1%.
Fiscal Year 2018 Compared with Fiscal Year 2017
Productivity and Business Processes
Revenue increased $6.0 billion or 20%.
• LinkedIn revenue increased $3.0 billion to $5.3 billion. Fiscal year 2018 included a full period of results, whereas fiscal year 2017 only included results from the date of acquisition on December 8, 2016. LinkedIn revenue primarily consisted of revenue from Talent Solutions.
• Office Commercial revenue increased $2.4 billion or 11%, driven by Office 365 Commercial revenue growth, mainly due to growth in subscribers and average revenue per user, offset in part by lower revenue from products licensed on-premises, reflecting a continued shift to Office 365 Commercial.
• Office Consumer revenue increased $382 million or 11%, driven by Office 365 Consumer revenue growth, mainly due to growth in subscribers.
• Dynamics revenue increased 13%, driven by Dynamics 365 revenue growth.
Operating income increased $1.5 billion or 13%, including a favorable foreign currency impact of 2%.
• Gross margin increased $4.4 billion or 19%, driven by LinkedIn and growth in Office Commercial. Gross margin percentage decreased slightly, due to an increased mix of cloud offerings, offset in part by gross margin percentage improvement in Office 365 Commercial and LinkedIn. LinkedIn cost of revenue increased $818 million to $1.7 billion, including $888 million of amortization for acquired intangible assets.
• Operating expenses increased $2.9 billion or 25%, driven by LinkedIn expenses and investments in commercial sales capacity and cloud engineering. LinkedIn operating expenses increased $2.2 billion to $4.5 billion, including $617 million of amortization of acquired intangible assets.
Intelligent Cloud
Revenue increased $4.8 billion or 18%.
• Server products and cloud services revenue increased $4.5 billion or 21%, driven by Azure and server products licensed on-premises revenue growth. Azure revenue grew 91%, due to higher infrastructure-as-a-service and platform-as-a-service consumption-based and per user-based services. Server products licensed on-premises revenue increased 5%, mainly due to a higher mix of premium licenses for Windows Server and Microsoft SQL Server.
• Enterprise Services revenue increased $304 million or 5%, driven by higher revenue from Premier Support Services and Microsoft Consulting Services, offset in part by a decline in revenue from custom support agreements.

30
Operating income increased $2.4 billion or 26%.
• Gross margin increased $3.1 billion or 16%, driven by growth in server products and cloud services revenue and cloud services scale and efficiencies. Gross margin percentage decreased, due to an increased mix of cloud offerings, offset in part by gross margin percentage improvement in Azure.
• Operating expenses increased $683 million or 7%, driven by investments in commercial sales capacity and cloud engineering.
More Personal Computing
Revenue increased $3.0 billion or 8%.
• Windows revenue increased $925 million or 5%, driven by growth in Windows Commercial and Windows OEM, offset by a decline in patent licensing revenue. Windows Commercial revenue increased 12%, driven by multi-year agreement revenue growth. Windows OEM revenue increased 5%. Windows OEM Pro revenue grew 11%, ahead of a strengthening commercial PC market. Windows OEM non-Pro revenue declined 4%, below the consumer PC market, driven by continued pressure in the entry-level price category.
• Gaming revenue increased $1.3 billion or 14%, driven by Xbox software and services revenue growth of 20%, mainly from third-party title strength.
• Search advertising revenue increased $793 million or 13%. Search advertising revenue, excluding traffic acquisition costs, increased 16%, driven by growth in Bing, due to higher revenue per search and search volume.
• Surface revenue increased $625 million or 16%, driven by a higher mix of premium devices and an increase in volumes sold, due to the latest editions of Surface.
• Phone revenue decreased $525 million.
Operating income increased $1.8 billion or 20%, including a favorable foreign currency impact of 2%.
• Gross margin increased $2.2 billion or 11%, driven by growth in Windows, Surface, Search, and Gaming. Gross margin percentage increased, primarily due to gross margin percentage improvement in Surface.
• Operating expenses increased $391 million or 3%, driven by investments in Search, AI, and Gaming engineering and commercial sales capacity, offset in part by a decrease in Windows marketing expenses.
Corporate and Other
Corporate and Other includes corporate-level activity not specifically allocated to a segment, including restructuring expenses.
Fiscal Year 2019 Compared with Fiscal Year 2018
We did not incur Corporate and Other activity in fiscal years 2019 or 2018.
Fiscal Year 2018 Compared with Fiscal Year 2017
Corporate and Other operating loss decreased $306 million, due to a reduction in restructuring expenses, driven by employee severance expenses primarily related to our sales and marketing restructuring plan in fiscal year 2017.

31
OPERATING EXPENSES
Research and Development
(In millions, except percentages) 2019 2018 2017
Percentage Change 2019 Versus 2018
Percentage Change 2018 Versus 2017
Research and development $ 16,876 $ 14,726 $ 13,037 15% 13% As a percent of revenue 13% 13% 13% 0ppt 0ppt
Research and development expenses include payroll, employee benefits, stock-based compensation expense, and other headcount-related expenses associated with product development. Research and development expenses also include third-party development and programming costs, localization costs incurred to translate software for international markets, and the amortization of purchased software code and services content.
Fiscal Year 2019 Compared with Fiscal Year 2018
Research and development expenses increased $2.2 billion or 15%, driven by investments in cloud and AI engineering, Gaming, LinkedIn, and GitHub.
Fiscal Year 2018 Compared with Fiscal Year 2017
Research and development expenses increased $1.7 billion or 13%, primarily due to investments in cloud engineering and LinkedIn expenses. LinkedIn expenses increased $762 million to $1.5 billion.
Sales and Marketing
(In millions, except percentages) 2019 2018 2017
Percentage Change 2019 Versus 2018
Percentage Change 2018 Versus 2017
Sales and marketing $ 18,213 $ 17,469 $ 15,461 4% 13% As a percent of revenue 14% 16% 16% (2)ppt 0ppt
Sales and marketing expenses include payroll, employee benefits, stock-based compensation expense, and other headcount-related expenses associated with sales and marketing personnel, and the costs of advertising, promotions, trade shows, seminars, and other programs.
Fiscal Year 2019 Compared with Fiscal Year 2018
Sales and marketing expenses increased $744 million or 4%, driven by investments in commercial sales capacity, LinkedIn, and GitHub, offset in part by a decrease in marketing. Expenses included a favorable foreign currency impact of 2%.
Fiscal Year 2018 Compared with Fiscal Year 2017
Sales and marketing expenses increased $2.0 billion or 13%, primarily due to LinkedIn expenses and investments in commercial sales capacity, offset in part by a decrease in Windows marketing expenses. LinkedIn expenses increased $1.2 billion to $2.5 billion, including $617 million of amortization of acquired intangible assets.
General and Administrative
(In millions, except percentages) 2019 2018 2017
Percentage Change 2019 Versus 2018
Percentage Change 2018 Versus 2017
General and administrative $ 4,885 $ 4,754 $ 4,481 3% 6% As a percent of revenue 4% 4% 5% 0ppt (1)ppt
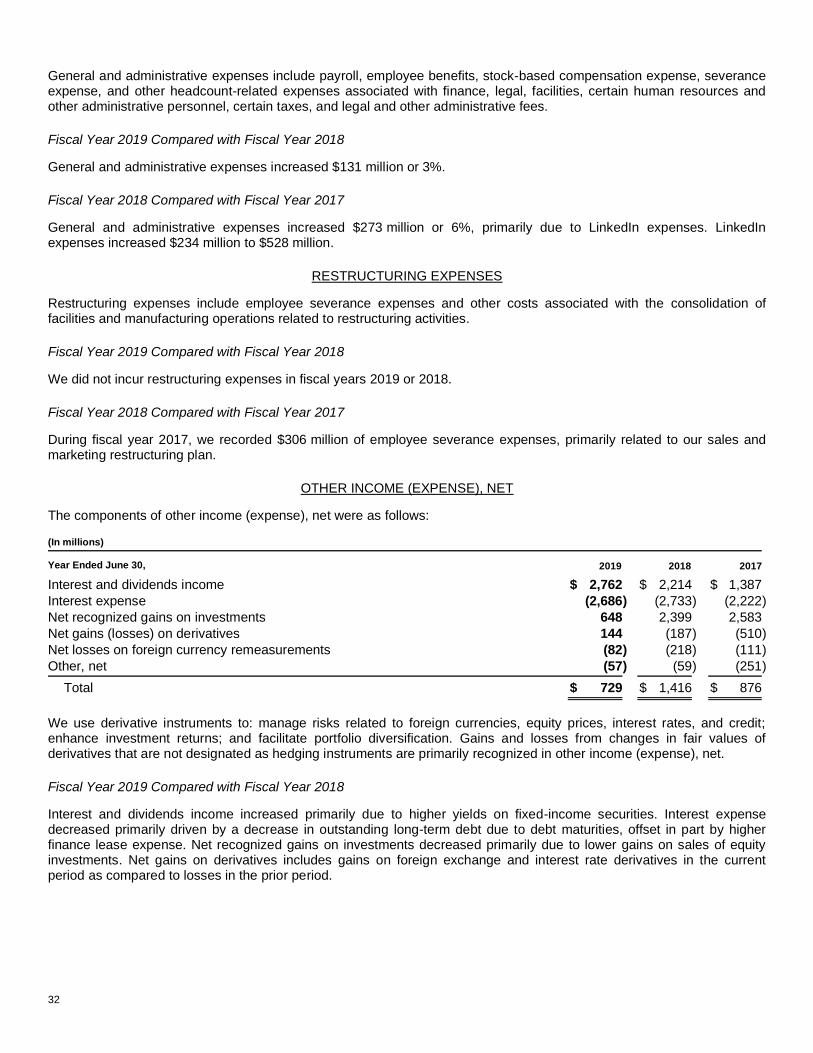
32
General and administrative expenses include payroll, employee benefits, stock-based compensation expense, severance expense, and other headcount-related expenses associated with finance, legal, facilities, certain human resources and other administrative personnel, certain taxes, and legal and other administrative fees.
Fiscal Year 2019 Compared with Fiscal Year 2018
General and administrative expenses increased $131 million or 3%.
Fiscal Year 2018 Compared with Fiscal Year 2017
General and administrative expenses increased $273 million or 6%, primarily due to LinkedIn expenses. LinkedIn expenses increased $234 million to $528 million.
RESTRUCTURING EXPENSES
Restructuring expenses include employee severance expenses and other costs associated with the consolidation of facilities and manufacturing operations related to restructuring activities.
Fiscal Year 2019 Compared with Fiscal Year 2018
We did not incur restructuring expenses in fiscal years 2019 or 2018.
Fiscal Year 2018 Compared with Fiscal Year 2017
During fiscal year 2017, we recorded $306 million of employee severance expenses, primarily related to our sales and marketing restructuring plan.
OTHER INCOME (EXPENSE), NET
The components of other income (expense), net were as follows: (In millions)
Year Ended June 30, 2019 2018 2017 Interest and dividends income $ 2,762 $ 2,214 $ 1,387 Interest expense (2,686) (2,733) (2,222) Net recognized gains on investments 648 2,399 2,583 Net gains (losses) on derivatives 144 (187) (510) Net losses on foreign currency remeasurements (82) (218) (111) Other, net (57) (59) (251)
Total $ 729 $ 1,416 $ 876
We use derivative instruments to: manage risks related to foreign currencies, equity prices, interest rates, and credit; enhance investment returns; and facilitate portfolio diversification. Gains and losses from changes in fair values of derivatives that are not designated as hedging instruments are primarily recognized in other income (expense), net.
Fiscal Year 2019 Compared with Fiscal Year 2018
Interest and dividends income increased primarily due to higher yields on fixed-income securities. Interest expense decreased primarily driven by a decrease in outstanding long-term debt due to debt maturities, offset in part by higher finance lease expense. Net recognized gains on investments decreased primarily due to lower gains on sales of equity investments. Net gains on derivatives includes gains on foreign exchange and interest rate derivatives in the current period as compared to losses in the prior period.

33
Fiscal Year 2018 Compared with Fiscal Year 2017
Dividends and interest income increased primarily due to higher average portfolio balances and yields on fixed-income securities. Interest expense increased primarily due to higher average outstanding long-term debt and higher finance lease expense. Net recognized gains on investments decreased primarily due to higher losses on sales of fixed-income securities, offset in part by higher gains on sales of equity securities. Net losses on derivatives decreased primarily due to lower losses on equity, foreign exchange, and commodity derivatives, offset in part by losses on interest rate derivatives in the current period as compared to gains in the prior period.
INCOME TAXES
Effective Tax Rate
Fiscal Year 2019 Compared with Fiscal Year 2018
Our effective tax rate for fiscal years 2019 and 2018 was 10% and 55%, respectively. The decrease in our effective tax rate for fiscal year 2019 compared to fiscal year 2018 was primarily due to the net charge related to the enactment of the TCJA in the second quarter of fiscal year 2018 and a $2.6 billion net income tax benefit in the fourth quarter of fiscal year 2019 related to intangible property transfers. Our effective tax rate was lower than the U.S. federal statutory rate, primarily due to the tax benefit related to intangible property transfers, and earnings taxed at lower rates in foreign jurisdictions resulting from producing and distributing our products and services through our foreign regional operations centers in Ireland, Singapore, and Puerto Rico.
The mix of income before income taxes between the U.S. and foreign countries impacted our effective tax rate as a result of the geographic distribution of, and customer demand for, our products and services. In fiscal year 2019, our U.S. income before income taxes was $15.8 billion and our foreign income before income taxes was $27.9 billion. In fiscal year 2018, our U.S. income before income taxes was $11.5 billion and our foreign income before income taxes was $24.9 billion.
Fiscal Year 2018 Compared with Fiscal Year 2017
Our effective tax rate for fiscal years 2018 and 2017 was 55% and 15%, respectively. The increase in our effective tax rate for fiscal year 2018 compared to fiscal year 2017 was primarily due to the net charge related to the enactment of the TCJA in fiscal year 2018 and the realization of tax benefits attributable to previous Phone business losses in fiscal year 2017. Our effective tax rate was higher than the U.S. federal statutory rate primarily due to the net charge related to the enactment of the TCJA, offset in part by earnings taxed at lower rates in foreign jurisdictions resulting from our foreign regional operations centers in Ireland, Singapore, and Puerto Rico.
The mix of income before income taxes between the U.S. and foreign countries impacted our effective tax rate as a result of the geographic distribution of, and customer demand for, our products and services. In fiscal year 2018, our U.S. income before income taxes was $11.5 billion and our foreign income before income taxes was $24.9 billion. In fiscal year 2017, our U.S. income before income taxes was $6.8 billion and our foreign income before income taxes was $23.1 billion.
Tax Cuts and Jobs Act
On December 22, 2017, the TCJA was enacted into law, which significantly changed existing U.S. tax law and included numerous provisions that affect our business, such as imposing a one-time transition tax on deemed repatriation of deferred foreign income, reducing the U.S. federal statutory tax rate, and adopting a territorial tax system. In fiscal year 2018, the TCJA required us to incur a transition tax on deferred foreign income not previously subject to U.S. income tax at a rate of 15.5% for foreign cash and certain other net current assets, and 8% on the remaining income. The TCJA reduced the U.S. federal statutory tax rate from 35% to 21% effective January 1, 2018. In addition, the TCJA subjected us to a tax on our global intangible low-taxed income (“GILTI”) effective July 1, 2018.

34
Under GAAP, we can make an accounting policy election to either treat taxes due on the GILTI inclusion as a current period expense or factor such amounts into our measurement of deferred taxes. We elected the deferred method, under which we recorded the corresponding deferred tax assets and liabilities on our consolidated balance sheets.
During fiscal year 2018, we recorded a net charge of $13.7 billion related to the enactment of the TCJA, due to the impact of the one-time transition tax on the deemed repatriation of deferred foreign income of $17.9 billion, offset in part by the impact of changes in the tax rate of $4.2 billion, primarily on deferred tax assets and liabilities. During the second quarter of fiscal year 2019, we recorded additional tax expense of $157 million, which related to completing our provisional accounting for GILTI deferred taxes pursuant to Securities and Exchange Commission Staff Accounting Bulletin No. 118.
In the fourth quarter of fiscal year 2019, in response to the TCJA and recently issued regulations, we transferred certain intangible properties held by our foreign subsidiaries to the U.S. and Ireland. The transfers of intangible properties resulted in a $2.6 billion net income tax benefit recorded in the fourth quarter of fiscal year 2019, as the value of future tax deductions exceeded the current tax liability from foreign jurisdictions and U.S. GILTI tax.
Refer to Note 12 – Income Taxes of the Notes to Financial Statements for further discussion.
Uncertain Tax Positions
We settled a portion of the Internal Revenue Service (“IRS”) audit for tax years 2004 to 2006 in fiscal year 2011. In February 2012, the IRS withdrew its 2011 Revenue Agents Report related to unresolved issues for tax years 2004 to 2006 and reopened the audit phase of the examination. We also settled a portion of the IRS audit for tax years 2007 to 2009 in fiscal year 2016, and a portion of the IRS audit for tax years 2010 to 2013 in fiscal year 2018. We remain under audit for tax years 2004 to 2013. We expect the IRS to begin an examination of tax years 2014 to 2017 within the next 12 months.
As of June 30, 2019, the primary unresolved issues for the IRS audits relate to transfer pricing, which could have a material impact on our consolidated financial statements when the matters are resolved. We believe our allowances for income tax contingencies are adequate. We have not received a proposed assessment for the unresolved issues and do not expect a final resolution of these issues in the next 12 months. Based on the information currently available, we do not anticipate a significant increase or decrease to our tax contingencies for these issues within the next 12 months.
We are subject to income tax in many jurisdictions outside the U.S. Our operations in certain jurisdictions remain subject to examination for tax years 1996 to 2018, some of which are currently under audit by local tax authorities. The resolution of each of these audits is not expected to be material to our consolidated financial statements.
NON-GAAP FINANCIAL MEASURES
Non-GAAP operating income, net income, and diluted EPS are non-GAAP financial measures which exclude the net tax impact of transfer of intangible properties, the net tax impact of the TCJA, and restructuring expenses. We believe these non-GAAP measures aid investors by providing additional insight into our operational performance and help clarify trends affecting our business. For comparability of reporting, management considers non-GAAP measures in conjunction with GAAP financial results in evaluating business performance. These non-GAAP financial measures presented should not be considered a substitute for, or superior to, the measures of financial performance prepared in accordance with GAAP.

35
The following table reconciles our financial results reported in accordance with GAAP to non-GAAP financial results:
(In millions, except percentages and per share amounts) 2019 2018 2017
Percentage Change 2019 Versus 2018
Percentage Change 2018 Versus 2017
Operating income $ 42,959 $ 35,058 $ 29,025 23% 21% Net tax impact of transfer of intangible
properties 0 0 0 * * Net tax impact of the TCJA 0 0 0 * * Restructuring expenses 0 0 306 * *
Non-GAAP operating income $ 42,959 $ 35,058 $ 29,331 23% 20%
Net income $ 39,240 $ 16,571 $ 25,489 137% (35)% Net tax impact of transfer of intangible
properties (2,567) 0 0 * * Net tax impact of the TCJA 157 13,696 0 * * Restructuring expenses 0 0 243 * *
Non-GAAP net income $ 36,830 $ 30,267 $ 25,732 22% 18%
Diluted earnings per share $ 5.06 $ 2.13 $ 3.25 138% (34)% Net tax impact of transfer of intangible
properties (0.33) 0 0 * * Net tax impact of the TCJA 0.02 1.75 0 * * Restructuring expenses 0 0 0.04 * *
Non-GAAP diluted earnings per share $ 4.75 $ 3.88 $ 3.29 22% 18%
* Not meaningful.
FINANCIAL CONDITION
Cash, Cash Equivalents, and Investments
Cash, cash equivalents, and short-term investments totaled $133.8 billion as of both June 30, 2019 and 2018. Equity investments were $2.6 billion and $1.9 billion as of June 30, 2019 and 2018, respectively. Our short-term investments are primarily intended to facilitate liquidity and capital preservation. They consist predominantly of highly liquid investment-grade fixed-income securities, diversified among industries and individual issuers. The investments are predominantly U.S. dollar-denominated securities, but also include foreign currency-denominated securities to diversify risk. Our fixed-income investments are exposed to interest rate risk and credit risk. The credit risk and average maturity of our fixed-income portfolio are managed to achieve economic returns that correlate to certain fixed-income indices. The settlement risk related to these investments is insignificant given that the short-term investments held are primarily highly liquid investment-grade fixed-income securities.
Valuation
In general, and where applicable, we use quoted prices in active markets for identical assets or liabilities to determine the fair value of our financial instruments. This pricing methodology applies to our Level 1 investments, such as U.S. government securities, common and preferred stock, and mutual funds. If quoted prices in active markets for identical assets or liabilities are not available to determine fair value, then we use quoted prices for similar assets and liabilities or inputs other than the quoted prices that are observable either directly or indirectly. This pricing methodology applies to our Level 2 investments, such as commercial paper, certificates of deposit, U.S. agency securities, foreign government bonds, mortgage- and asset-backed securities, corporate notes and bonds, and municipal securities. Level 3 investments are valued using internally-developed models with unobservable inputs. Assets and liabilities measured at fair value on a recurring basis using unobservable inputs are an immaterial portion of our portfolio.
A majority of our investments are priced by pricing vendors and are generally Level 1 or Level 2 investments as these vendors either provide a quoted market price in an active market or use observable inputs for their pricing without

36
applying significant adjustments. Broker pricing is used mainly when a quoted price is not available, the investment is not priced by our pricing vendors, or when a broker price is more reflective of fair values in the market in which the investment trades. Our broker-priced investments are generally classified as Level 2 investments because the broker prices these investments based on similar assets without applying significant adjustments. In addition, all our broker-priced investments have a sufficient level of trading volume to demonstrate that the fair values used are appropriate for these investments. Our fair value processes include controls that are designed to ensure appropriate fair values are recorded. These controls include model validation, review of key model inputs, analysis of period-over-period fluctuations, and independent recalculation of prices where appropriate.
Cash Flows
Fiscal Year 2019 Compared with Fiscal Year 2018
Cash from operations increased $8.3 billion to $52.2 billion for fiscal year 2019, mainly due to an increase in cash received from customers, offset in part by an increase in cash paid to suppliers and employees and an increase in cash paid for income taxes. Cash used in financing increased $3.3 billion to $36.9 billion for fiscal year 2019, mainly due to an $8.8 billion increase in common stock repurchases and a $1.1 billion increase in dividends paid, offset in part by a $6.2 billion decrease in repayments of debt, net of proceeds from issuance of debt. Cash used in investing increased $9.7 billion to $15.8 billion for fiscal year 2019, mainly due to a $6.0 billion decrease in cash from net investment purchases, sales, and maturities, a $2.3 billion increase in additions to property and equipment, and a $1.5 billion increase in cash used for acquisitions of companies, net of cash acquired, and purchases of intangible and other assets.
Fiscal Year 2018 Compared with Fiscal Year 2017
Cash from operations increased $4.4 billion to $43.9 billion for fiscal year 2018, mainly due to an increase in cash received from customers, offset in part by an increase in cash paid to employees, net cash paid for income taxes, cash paid for interest on debt, and cash paid to suppliers. Cash used in financing was $33.6 billion for fiscal year 2018, compared to cash from financing of $8.4 billion for fiscal year 2017. The change was mainly due to a $41.7 billion decrease in proceeds from issuance of debt, net of repayments of debt, offset in part by a $1.1 billion decrease in cash used for common stock repurchases. Cash used in investing decreased $40.7 billion to $6.1 billion for fiscal year 2018, mainly due to a $25.1 billion decrease in cash used for acquisitions of companies, net of cash acquired, and purchases of intangible and other assets, and a $19.1 billion increase in cash from net investment purchases, sales, and maturities.
Debt
We issue debt to take advantage of favorable pricing and liquidity in the debt markets, reflecting our credit rating and the low interest rate environment. The proceeds of these issuances were or will be used for general corporate purposes, which may include, among other things, funding for working capital, capital expenditures, repurchases of capital stock, acquisitions, and repayment of existing debt. Refer to Note 11 – Debt of the Notes to Financial Statements for further discussion.
Unearned Revenue
Unearned revenue comprises mainly unearned revenue related to volume licensing programs, which may include Software Assurance (“SA”) and cloud services. Unearned revenue is generally invoiced annually at the beginning of each contract period for multi-year agreements and recognized ratably over the coverage period. Unearned revenue also includes payments for other offerings for which we have been paid in advance and earn the revenue when we transfer control of the product or service. Refer to Note 1 – Accounting Policies of the Notes to Financial Statements for further discussion.

37
The following table outlines the expected future recognition of unearned revenue as of June 30, 2019: (In millions)
Three Months Ending, September 30, 2019 $ 12,353 December 31, 2019 9,807 March 31, 2020 6,887 June 30, 2020 3,629 Thereafter 4,530
Total $ 37,206
If our customers choose to license cloud-based versions of our products and services rather than licensing transaction-based products and services, the associated revenue will shift from being recognized at the time of the transaction to being recognized over the subscription period or upon consumption, as applicable.
Share Repurchases
For fiscal years 2019, 2018, and 2017, we repurchased 150 million shares, 99 million shares, and 170 million shares of our common stock for $16.8 billion, $8.6 billion, and $10.3 billion, respectively, through our share repurchase programs. All repurchases were made using cash resources. Refer to Note 17 – Stockholders’ Equity of the Notes to Financial Statements for further discussion.
Dividends
Refer to Note 17 – Stockholders’ Equity of the Notes to Financial Statements for further discussion.
Off-Balance Sheet Arrangements
We provide indemnifications of varying scope and size to certain customers against claims of intellectual property infringement made by third parties arising from the use of our products and certain other matters. Additionally, we have agreed to cover damages resulting from breaches of certain security and privacy commitments in our cloud business. In evaluating estimated losses on these obligations, we consider factors such as the degree of probability of an unfavorable outcome and our ability to make a reasonable estimate of the amount of loss. These obligations did not have a material impact on our consolidated financial statements during the periods presented.

38
Contractual Obligations
The following table summarizes the payments due by fiscal year for our outstanding contractual obligations as of June 30, 2019: (In millions) 2020 2021-2022 2023-2024 Thereafter Total
Long-term debt: (a)
Principal payments $ 5,518 $ 11,744 $ 8,000 $ 47,519 $ 72,781 Interest payments 2,299 4,309 3,818 29,383 39,809
Construction commitments (b) 3,443 515 0 0 3,958 Operating leases, including imputed interest (c) 1,790 3,144 2,413 3,645 10,992 Finance leases, including imputed interest (c) 797 2,008 2,165 9,872 14,842 Transition tax (d) 1,180 2,900 4,168 8,155 16,403 Purchase commitments (e) 17,478 1,185 159 339 19,161 Other long-term liabilities (f) 0 72 29 324 425
Total $ 32,505 $ 25,877 $ 20,752 $ 99,237 $ 178,371
(a) Refer to Note 11 – Debt of the Notes to Financial Statements. (b) Refer to Note 7 – Property and Equipment of the Notes to Financial Statements. (c) Refer to Note 15 – Leases of the Notes to Financial Statements. (d) Refer to Note 12 – Income Taxes of the Notes to Financial Statements. (e) Amounts represent purchase commitments, including open purchase orders and take-or-pay contracts that are not
presented as construction commitments above. (f) We have excluded long-term tax contingencies, other tax liabilities, and deferred income taxes of $14.2 billion from
the amounts presented as the timing of these obligations is uncertain. We have also excluded unearned revenue and non-cash items.
Other Planned Uses of Capital
We will continue to invest in sales, marketing, product support infrastructure, and existing and advanced areas of technology, as well as continue making acquisitions that align with our business strategy. Additions to property and equipment will continue, including new facilities, datacenters, and computer systems for research and development, sales and marketing, support, and administrative staff. We expect capital expenditures to increase in coming years to support growth in our cloud offerings. We have operating and finance leases for datacenters, corporate offices, research and development facilities, retail stores, and certain equipment. We have not engaged in any related party transactions or arrangements with unconsolidated entities or other persons that are reasonably likely to materially affect liquidity or the availability of capital resources.
Liquidity
As a result of the TCJA, we are required to pay a one-time transition tax on deferred foreign income not previously subject to U.S. income tax. Under the TCJA, the transition tax is payable interest free over eight years, with 8% due in each of the first five years, 15% in year six, 20% in year seven, and 25% in year eight. We have paid transition tax of approximately $2.0 billion, which included $1.5 billion for fiscal year 2019. The first installment of the transition tax was paid in fiscal year 2019, and the remaining transition tax of $16.4 billion is payable over the next seven years with a final payment in fiscal year 2026. During the first quarter of fiscal year 2020, we expect to pay $1.2 billion related to the second installment of the transition tax, and $3.5 billion related to the transfer of intangible properties in the fourth quarter of fiscal year 2019.
We expect existing cash, cash equivalents, short-term investments, cash flows from operations, and access to capital markets to continue to be sufficient to fund our operating activities and cash commitments for investing and financing activities, such as dividends, share repurchases, debt maturities, material capital expenditures, and the transition tax related to the TCJA, for at least the next 12 months and thereafter for the foreseeable future.
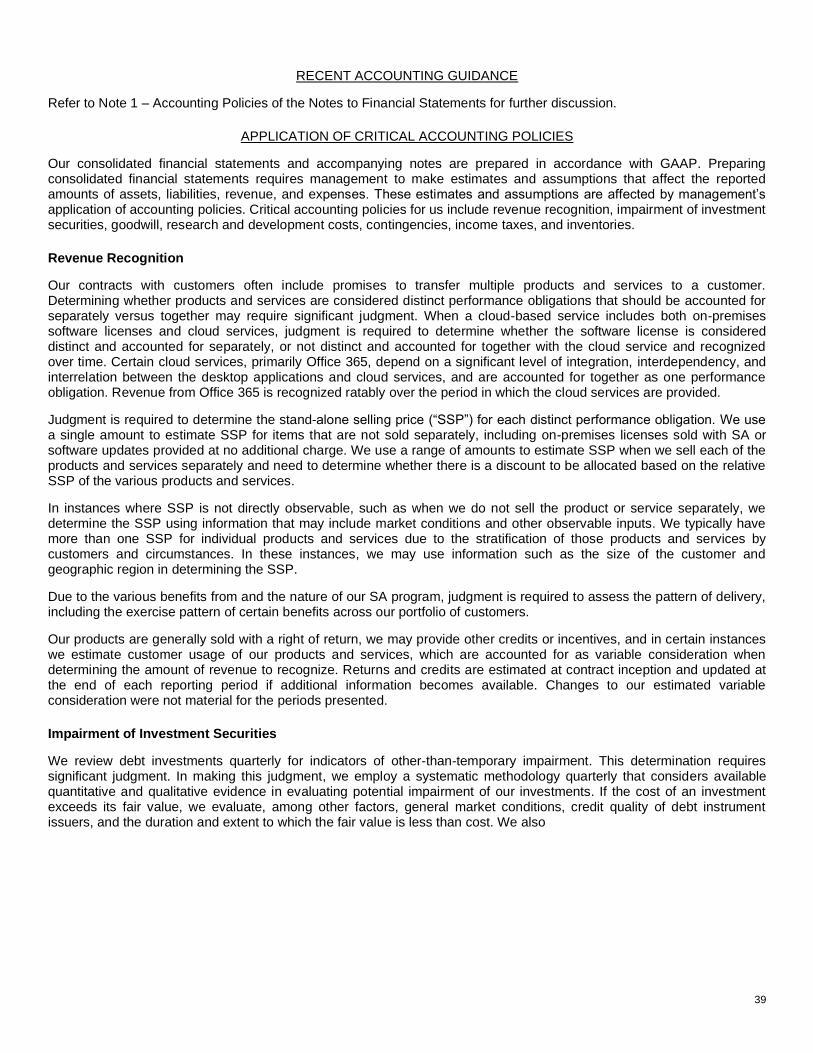
39
RECENT ACCOUNTING GUIDANCE
Refer to Note 1 – Accounting Policies of the Notes to Financial Statements for further discussion.
APPLICATION OF CRITICAL ACCOUNTING POLICIES
Our consolidated financial statements and accompanying notes are prepared in accordance with GAAP. Preparing consolidated financial statements requires management to make estimates and assumptions that affect the reported amounts of assets, liabilities, revenue, and expenses. These estimates and assumptions are affected by management’s application of accounting policies. Critical accounting policies for us include revenue recognition, impairment of investment securities, goodwill, research and development costs, contingencies, income taxes, and inventories.
Revenue Recognition
Our contracts with customers often include promises to transfer multiple products and services to a customer. Determining whether products and services are considered distinct performance obligations that should be accounted for separately versus together may require significant judgment. When a cloud-based service includes both on-premises software licenses and cloud services, judgment is required to determine whether the software license is considered distinct and accounted for separately, or not distinct and accounted for together with the cloud service and recognized over time. Certain cloud services, primarily Office 365, depend on a significant level of integration, interdependency, and interrelation between the desktop applications and cloud services, and are accounted for together as one performance obligation. Revenue from Office 365 is recognized ratably over the period in which the cloud services are provided.
Judgment is required to determine the stand-alone selling price (“SSP”) for each distinct performance obligation. We use a single amount to estimate SSP for items that are not sold separately, including on-premises licenses sold with SA or software updates provided at no additional charge. We use a range of amounts to estimate SSP when we sell each of the products and services separately and need to determine whether there is a discount to be allocated based on the relative SSP of the various products and services.
In instances where SSP is not directly observable, such as when we do not sell the product or service separately, we determine the SSP using information that may include market conditions and other observable inputs. We typically have more than one SSP for individual products and services due to the stratification of those products and services by customers and circumstances. In these instances, we may use information such as the size of the customer and geographic region in determining the SSP.
Due to the various benefits from and the nature of our SA program, judgment is required to assess the pattern of delivery, including the exercise pattern of certain benefits across our portfolio of customers.
Our products are generally sold with a right of return, we may provide other credits or incentives, and in certain instances we estimate customer usage of our products and services, which are accounted for as variable consideration when determining the amount of revenue to recognize. Returns and credits are estimated at contract inception and updated at the end of each reporting period if additional information becomes available. Changes to our estimated variable consideration were not material for the periods presented.
Impairment of Investment Securities
We review debt investments quarterly for indicators of other-than-temporary impairment. This determination requires significant judgment. In making this judgment, we employ a systematic methodology quarterly that considers available quantitative and qualitative evidence in evaluating potential impairment of our investments. If the cost of an investment exceeds its fair value, we evaluate, among other factors, general market conditions, credit quality of debt instrument issuers, and the duration and extent to which the fair value is less than cost. We also

40
evaluate whether we have plans to sell the security or it is more likely than not that we will be required to sell the security before recovery. In addition, we consider specific adverse conditions related to the financial health of and business outlook for the investee, including industry and sector performance, changes in technology, and operational and financing cash flow factors. Once a decline in fair value is determined to be other-than-temporary, an impairment charge is recorded in other income (expense), net and a new cost basis in the investment is established. If market, industry, and/or investee conditions deteriorate, we may incur future impairments.
Equity investments without readily determinable fair values are written down to fair value if a qualitative assessment indicates that the investment is impaired and the fair value of the investment is less than carrying value. We perform a qualitative assessment on a quarterly basis. We are required to estimate the fair value of the investment to determine the amount of the impairment loss. Once an investment is determined to be impaired, an impairment charge is recorded in other income (expense), net.
Goodwill
We allocate goodwill to reporting units based on the reporting unit expected to benefit from the business combination. We evaluate our reporting units on an annual basis and, if necessary, reassign goodwill using a relative fair value allocation approach. Goodwill is tested for impairment at the reporting unit level (operating segment or one level below an operating segment) on an annual basis (May 1 for us) and between annual tests if an event occurs or circumstances change that would more likely than not reduce the fair value of a reporting unit below its carrying value. These events or circumstances could include a significant change in the business climate, legal factors, operating performance indicators, competition, or sale or disposition of a significant portion of a reporting unit.
Application of the goodwill impairment test requires judgment, including the identification of reporting units, assignment of assets and liabilities to reporting units, assignment of goodwill to reporting units, and determination of the fair value of each reporting unit. The fair value of each reporting unit is estimated primarily through the use of a discounted cash flow methodology. This analysis requires significant judgments, including estimation of future cash flows, which is dependent on internal forecasts, estimation of the long-term rate of growth for our business, estimation of the useful life over which cash flows will occur, and determination of our weighted average cost of capital.
The estimates used to calculate the fair value of a reporting unit change from year to year based on operating results, market conditions, and other factors. Changes in these estimates and assumptions could materially affect the determination of fair value and goodwill impairment for each reporting unit.
Research and Development Costs
Costs incurred internally in researching and developing a computer software product are charged to expense until technological feasibility has been established for the product. Once technological feasibility is established, software costs are capitalized until the product is available for general release to customers. Judgment is required in determining when technological feasibility of a product is established. We have determined that technological feasibility for our software products is reached after all high-risk development issues have been resolved through coding and testing. Generally, this occurs shortly before the products are released to production. The amortization of these costs is included in cost of revenue over the estimated life of the products.
Legal and Other Contingencies
The outcomes of legal proceedings and claims brought against us are subject to significant uncertainty. An estimated loss from a loss contingency such as a legal proceeding or claim is accrued by a charge to income if it is probable that an asset has been impaired or a liability has been incurred and the amount of the loss can be reasonably estimated. In determining whether a loss should be accrued we evaluate, among other factors, the degree of probability of an unfavorable outcome and the ability to make a reasonable estimate of the amount of loss. Changes in these factors could materially impact our consolidated financial statements.
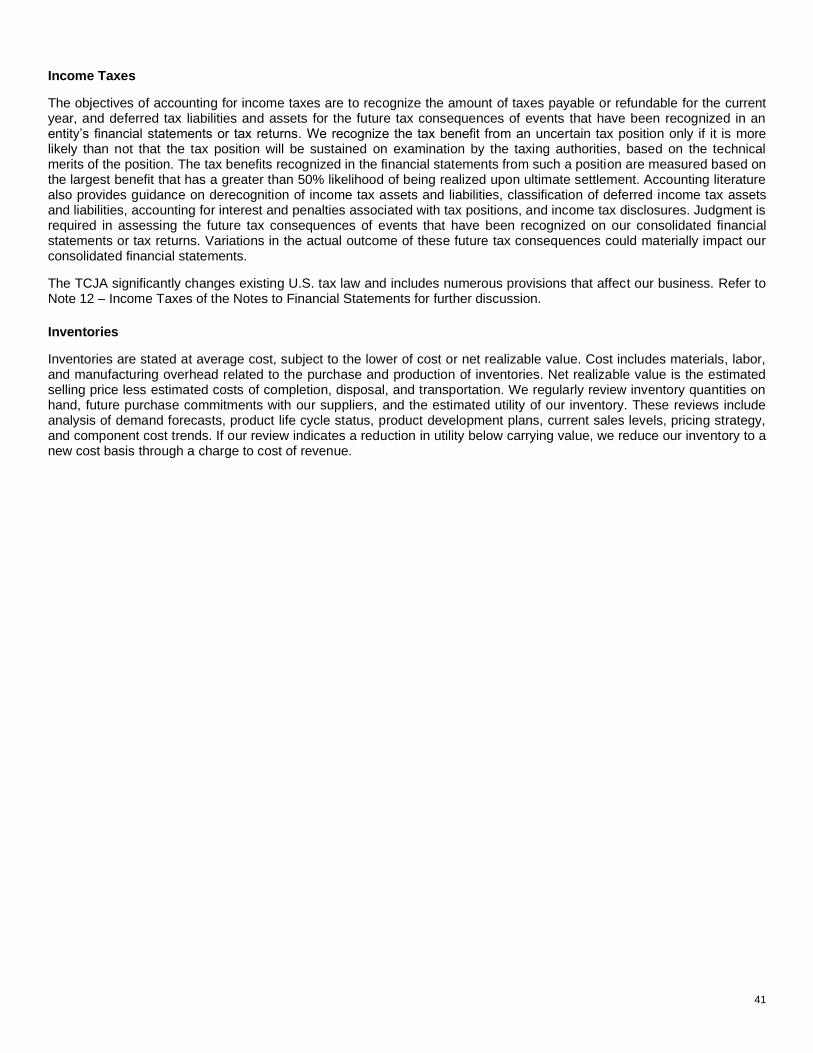
41
Income Taxes
The objectives of accounting for income taxes are to recognize the amount of taxes payable or refundable for the current year, and deferred tax liabilities and assets for the future tax consequences of events that have been recognized in an entity’s financial statements or tax returns. We recognize the tax benefit from an uncertain tax position only if it is more likely than not that the tax position will be sustained on examination by the taxing authorities, based on the technical merits of the position. The tax benefits recognized in the financial statements from such a position are measured based on the largest benefit that has a greater than 50% likelihood of being realized upon ultimate settlement. Accounting literature also provides guidance on derecognition of income tax assets and liabilities, classification of deferred income tax assets and liabilities, accounting for interest and penalties associated with tax positions, and income tax disclosures. Judgment is required in assessing the future tax consequences of events that have been recognized on our consolidated financial statements or tax returns. Variations in the actual outcome of these future tax consequences could materially impact our consolidated financial statements.
The TCJA significantly changes existing U.S. tax law and includes numerous provisions that affect our business. Refer to Note 12 – Income Taxes of the Notes to Financial Statements for further discussion.
Inventories
Inventories are stated at average cost, subject to the lower of cost or net realizable value. Cost includes materials, labor, and manufacturing overhead related to the purchase and production of inventories. Net realizable value is the estimated selling price less estimated costs of completion, disposal, and transportation. We regularly review inventory quantities on hand, future purchase commitments with our suppliers, and the estimated utility of our inventory. These reviews include analysis of demand forecasts, product life cycle status, product development plans, current sales levels, pricing strategy, and component cost trends. If our review indicates a reduction in utility below carrying value, we reduce our inventory to a new cost basis through a charge to cost of revenue.

42
STATEMENT OF MANAGEMENT’S RESPONSIBILITY FOR FINANCIAL STATEMENTS
Management is responsible for the preparation of the consolidated financial statements and related information that are presented in this report. The consolidated financial statements, which include amounts based on management’s estimates and judgments, have been prepared in conformity with accounting principles generally accepted in the United States of America.
The Company designs and maintains accounting and internal control systems to provide reasonable assurance at reasonable cost that assets are safeguarded against loss from unauthorized use or disposition, and that the financial records are reliable for preparing consolidated financial statements and maintaining accountability for assets. These systems are augmented by written policies, an organizational structure providing division of responsibilities, careful selection and training of qualified personnel, and a program of internal audits.
The Company engaged Deloitte & Touche LLP, an independent registered public accounting firm, to audit and render an opinion on the consolidated financial statements and internal control over financial reporting in accordance with the standards of the Public Company Accounting Oversight Board (United States).
The Board of Directors, through its Audit Committee, consisting solely of independent directors of the Company, meets periodically with management, internal auditors, and our independent registered public accounting firm to ensure that each is meeting its responsibilities and to discuss matters concerning internal controls and financial reporting. Deloitte & Touche LLP and the internal auditors each have full and free access to the Audit Committee.
Satya Nadella Chief Executive Officer
Amy E. Hood Executive Vice President and Chief Financial Officer
Frank H. Brod Corporate Vice President, Finance and Administration; Chief Accounting Officer
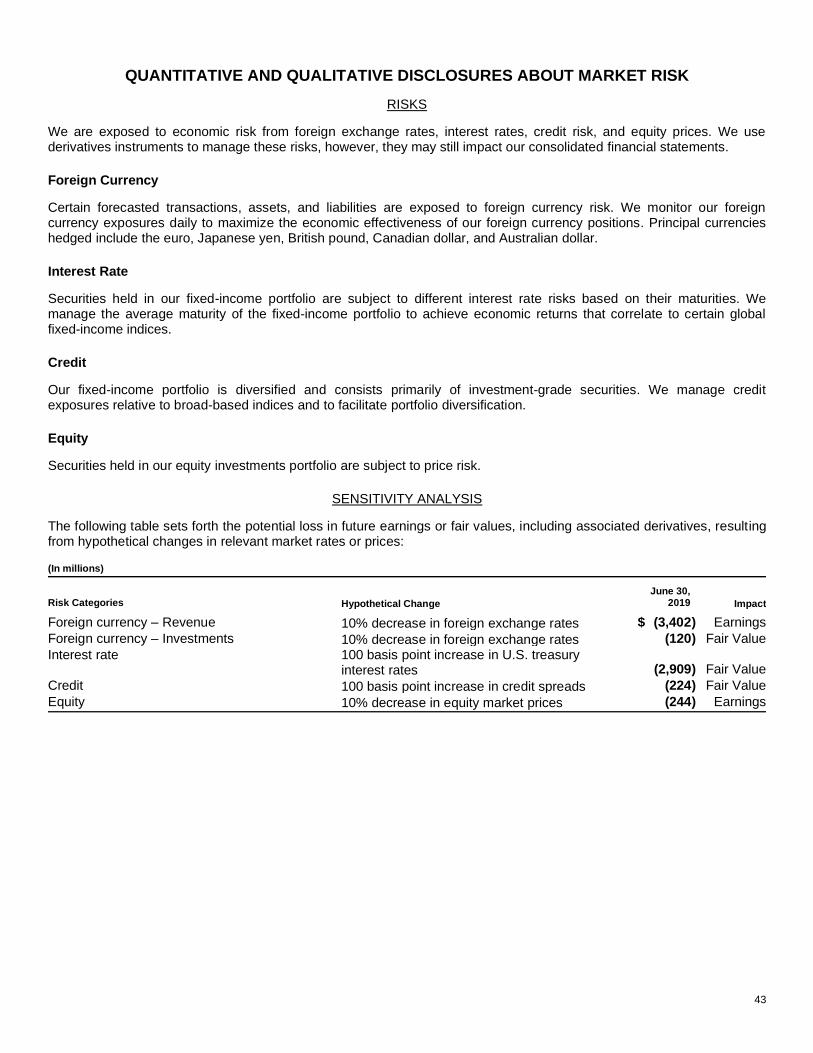
43
QUANTITATIVE AND QUALITATIVE DISCLOSURES ABOUT MARKET RISK
RISKS
We are exposed to economic risk from foreign exchange rates, interest rates, credit risk, and equity prices. We use derivatives instruments to manage these risks, however, they may still impact our consolidated financial statements.
Foreign Currency
Certain forecasted transactions, assets, and liabilities are exposed to foreign currency risk. We monitor our foreign currency exposures daily to maximize the economic effectiveness of our foreign currency positions. Principal currencies hedged include the euro, Japanese yen, British pound, Canadian dollar, and Australian dollar.
Interest Rate
Securities held in our fixed-income portfolio are subject to different interest rate risks based on their maturities. We manage the average maturity of the fixed-income portfolio to achieve economic returns that correlate to certain global fixed-income indices.
Credit
Our fixed-income portfolio is diversified and consists primarily of investment-grade securities. We manage credit exposures relative to broad-based indices and to facilitate portfolio diversification.
Equity
Securities held in our equity investments portfolio are subject to price risk.
SENSITIVITY ANALYSIS
The following table sets forth the potential loss in future earnings or fair values, including associated derivatives, resulting from hypothetical changes in relevant market rates or prices: (In millions)
Risk Categories Hypothetical Change June 30,
2019 Impact Foreign currency – Revenue 10% decrease in foreign exchange rates $ (3,402) Earnings Foreign currency – Investments 10% decrease in foreign exchange rates (120) Fair Value Interest rate 100 basis point increase in U.S. treasury
interest rates (2,909) Fair Value Credit 100 basis point increase in credit spreads (224) Fair Value Equity 10% decrease in equity market prices (244) Earnings
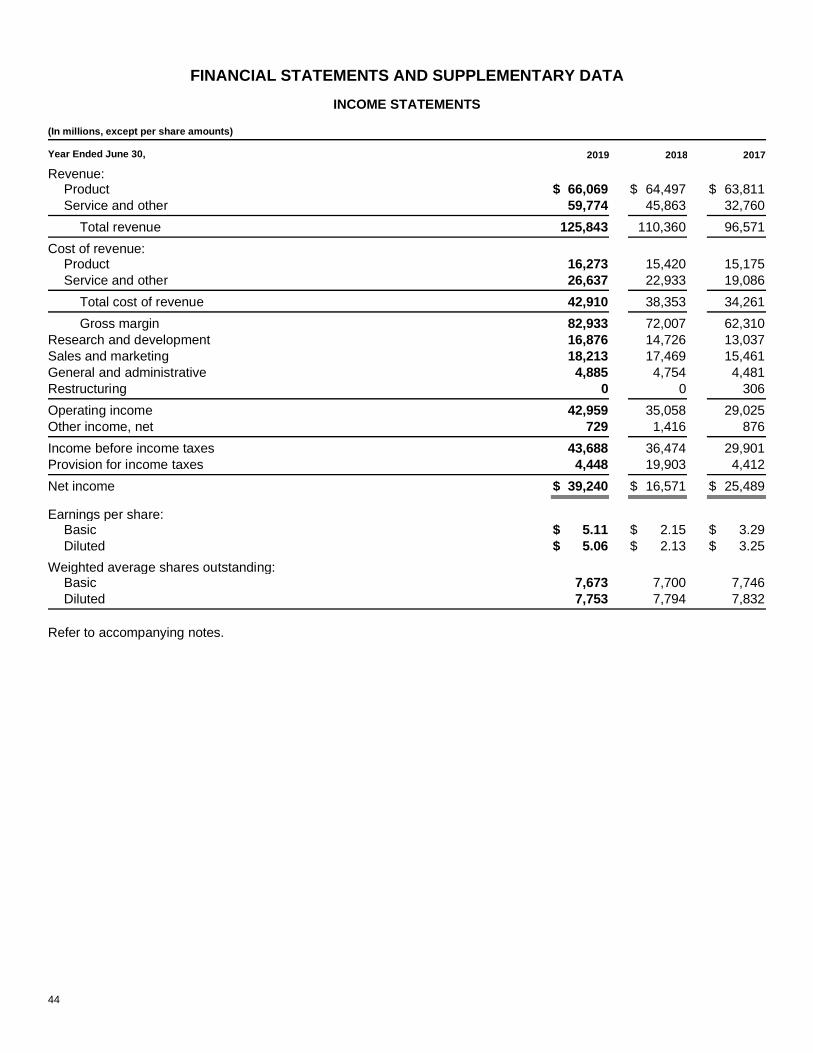
44
FINANCIAL STATEMENTS AND SUPPLEMENTARY DATA
INCOME STATEMENTS (In millions, except per share amounts)
Year Ended June 30, 2019 2018 2017
Revenue:
Product $ 66,069 $ 64,497 $ 63,811 Service and other 59,774 45,863 32,760
Total revenue 125,843 110,360 96,571
Cost of revenue:
Product 16,273 15,420 15,175 Service and other 26,637 22,933 19,086
Total cost of revenue 42,910 38,353 34,261
Gross margin 82,933 72,007 62,310 Research and development 16,876 14,726 13,037 Sales and marketing 18,213 17,469 15,461 General and administrative 4,885 4,754 4,481 Restructuring 0 0 306
Operating income 42,959 35,058 29,025 Other income, net 729 1,416 876
Income before income taxes 43,688 36,474 29,901 Provision for income taxes 4,448 19,903 4,412
Net income $ 39,240 $ 16,571 $ 25,489
Earnings per share:
Basic $ 5.11 $ 2.15 $ 3.29 Diluted $ 5.06 $ 2.13 $ 3.25
Weighted average shares outstanding:
Basic 7,673 7,700 7,746 Diluted 7,753 7,794 7,832
Refer to accompanying notes.

45
COMPREHENSIVE INCOME STATEMENTS (In millions)
Year Ended June 30, 2019 2018 2017
Net income $ 39,240 $ 16,571 $ 25,489
Other comprehensive income (loss), net of tax:
Net change related to derivatives (173) 39 (218) Net change related to investments 2,405 (2,717) (1,116) Translation adjustments and other (318) (178) 167
Other comprehensive income (loss) 1,914 (2,856) (1,167)
Comprehensive income $ 41,154 $ 13,715 $ 24,322
Refer to accompanying notes. Refer to Note 18 – Accumulated Other Comprehensive Income (Loss) for further information.

46
BALANCE SHEETS (In millions)
June 30, 2019 2018
Assets
Current assets:
Cash and cash equivalents $ 11,356 $ 11,946 Short-term investments 122,463 121,822
Total cash, cash equivalents, and short-term investments 133,819 133,768 Accounts receivable, net of allowance for doubtful accounts of $411 and $377 29,524 26,481 Inventories 2,063 2,662 Other 10,146 6,751
Total current assets 175,552 169,662 Property and equipment, net of accumulated depreciation of $35,330 and $29,223 36,477 29,460 Operating lease right-of-use assets 7,379 6,686 Equity investments 2,649 1,862 Goodwill 42,026 35,683 Intangible assets, net 7,750 8,053 Other long-term assets 14,723 7,442
Total assets $ 286,556 $ 258,848
Liabilities and stockholders’ equity
Current liabilities:
Accounts payable $ 9,382 $ 8,617 Current portion of long-term debt 5,516 3,998 Accrued compensation 6,830 6,103 Short-term income taxes 5,665 2,121 Short-term unearned revenue 32,676 28,905 Other 9,351 8,744
Total current liabilities 69,420 58,488 Long-term debt 66,662 72,242 Long-term income taxes 29,612 30,265 Long-term unearned revenue 4,530 3,815 Deferred income taxes 233 541 Operating lease liabilities 6,188 5,568 Other long-term liabilities 7,581 5,211
Total liabilities 184,226 176,130
Commitments and contingencies
Stockholders’ equity:
Common stock and paid-in capital – shares authorized 24,000; outstanding 7,643 and 7,677 78,520 71,223
Retained earnings 24,150 13,682 Accumulated other comprehensive loss (340) (2,187)
Total stockholders’ equity 102,330 82,718
Total liabilities and stockholders’ equity $ 286,556 $ 258,848
Refer to accompanying notes.
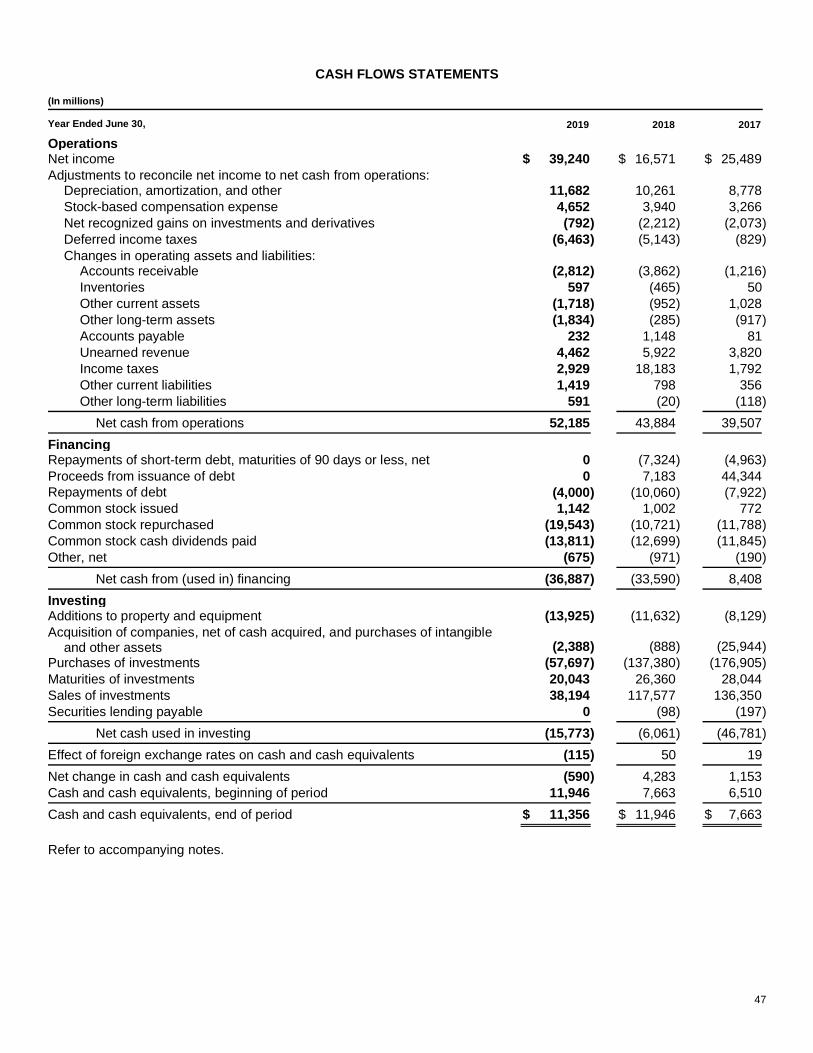
47
CASH FLOWS STATEMENTS (In millions)
Year Ended June 30, 2019 2018 2017
Operations
Net income $ 39,240 $ 16,571 $ 25,489 Adjustments to reconcile net income to net cash from operations:
Depreciation, amortization, and other 11,682 10,261 8,778 Stock-based compensation expense 4,652 3,940 3,266 Net recognized gains on investments and derivatives (792) (2,212) (2,073) Deferred income taxes (6,463) (5,143) (829) Changes in operating assets and liabilities:
Accounts receivable (2,812) (3,862) (1,216) Inventories 597 (465) 50 Other current assets (1,718) (952) 1,028 Other long-term assets (1,834) (285) (917) Accounts payable 232 1,148 81 Unearned revenue 4,462 5,922 3,820 Income taxes 2,929 18,183 1,792 Other current liabilities 1,419 798 356 Other long-term liabilities 591 (20) (118)
Net cash from operations 52,185 43,884 39,507
Financing
Repayments of short-term debt, maturities of 90 days or less, net 0 (7,324) (4,963) Proceeds from issuance of debt 0 7,183 44,344 Repayments of debt (4,000) (10,060) (7,922) Common stock issued 1,142 1,002 772 Common stock repurchased (19,543) (10,721) (11,788) Common stock cash dividends paid (13,811) (12,699) (11,845) Other, net (675) (971) (190)
Net cash from (used in) financing (36,887) (33,590) 8,408
Investing
Additions to property and equipment (13,925) (11,632) (8,129) Acquisition of companies, net of cash acquired, and purchases of intangible
and other assets (2,388) (888) (25,944) Purchases of investments (57,697) (137,380) (176,905) Maturities of investments 20,043 26,360 28,044 Sales of investments 38,194 117,577 136,350 Securities lending payable 0 (98) (197)
Net cash used in investing (15,773) (6,061) (46,781)
Effect of foreign exchange rates on cash and cash equivalents (115) 50 19
Net change in cash and cash equivalents (590) 4,283 1,153 Cash and cash equivalents, beginning of period 11,946 7,663 6,510
Cash and cash equivalents, end of period $ 11,356 $ 11,946 $ 7,663
Refer to accompanying notes.

48
STOCKHOLDERS’ EQUITY STATEMENTS (In millions)
Year Ended June 30, 2019 2018 2017
Common stock and paid-in capital
Balance, beginning of period $ 71,223 $ 69,315 $ 68,178 Common stock issued 6,829 1,002 772 Common stock repurchased (4,195) (3,033) (2,987) Stock-based compensation expense 4,652 3,940 3,266 Other, net 11 (1) 86
Balance, end of period 78,520 71,223 69,315
Retained earnings
Balance, beginning of period 13,682 17,769 13,118 Net income 39,240 16,571 25,489 Common stock cash dividends (14,103) (12,917) (12,040) Common stock repurchased (15,346) (7,699) (8,798) Cumulative effect of accounting changes 677 (42) 0
Balance, end of period 24,150 13,682 17,769
Accumulated other comprehensive income (loss)
Balance, beginning of period (2,187) 627 1,794 Other comprehensive income (loss) 1,914 (2,856) (1,167) Cumulative effect of accounting changes (67) 42 0
Balance, end of period (340) (2,187) 627
Total stockholders’ equity $ 102,330 $ 82,718 $ 87,711
Cash dividends declared per common share $ 1.84 $ 1.68 $ 1.56
Refer to accompanying notes.

49
NOTES TO FINANCIAL STATEMENTS
NOTE 1 — ACCOUNTING POLICIES
Accounting Principles
Our consolidated financial statements and accompanying notes are prepared in accordance with accounting principles generally accepted in the United States of America (“GAAP”).
We have recast certain prior period amounts related to investments, derivatives, and fair value measurements to conform to the current period presentation based on our adoption of the new accounting standard for financial instruments. We have recast prior period commercial cloud revenue to include the commercial portion of LinkedIn to provide a comparable view of our commercial cloud business performance. The commercial portion of LinkedIn includes LinkedIn Recruiter, Sales Navigator, premium business subscriptions, and other services for organizations. We have also recast components of the prior period deferred income tax assets and liabilities to conform to the current period presentation. The recast of these prior period amounts had no impact on our consolidated balance sheets, consolidated income statements, or net cash from or used in operating, financing, or investing on our consolidated cash flows statements.
Principles of Consolidation
The consolidated financial statements include the accounts of Microsoft Corporation and its subsidiaries. Intercompany transactions and balances have been eliminated.
Estimates and Assumptions
Preparing financial statements requires management to make estimates and assumptions that affect the reported amounts of assets, liabilities, revenue, and expenses. Examples of estimates and assumptions include: for revenue recognition, determining the nature and timing of satisfaction of performance obligations, and determining the standalone selling price (“SSP”) of performance obligations, variable consideration, and other obligations such as product returns and refunds; loss contingencies; product warranties; the fair value of and/or potential impairment of goodwill and intangible assets for our reporting units; product life cycles; useful lives of our tangible and intangible assets; allowances for doubtful accounts; the market value of, and demand for, our inventory; stock-based compensation forfeiture rates; when technological feasibility is achieved for our products; the potential outcome of uncertain tax positions that have been recognized on our consolidated financial statements or tax returns; and determining the timing and amount of impairments for investments. Actual results and outcomes may differ from management’s estimates and assumptions.
Foreign Currencies
Assets and liabilities recorded in foreign currencies are translated at the exchange rate on the balance sheet date. Revenue and expenses are translated at average rates of exchange prevailing during the year. Translation adjustments resulting from this process are recorded to other comprehensive income (“OCI”).
Revenue
Product Revenue and Service and Other Revenue
Product revenue includes sales from operating systems; cross-device productivity applications; server applications; business solution applications; desktop and server management tools; software development tools; video games; and hardware such as PCs, tablets, gaming and entertainment consoles, other intelligent devices, and related accessories.
50
Service and other revenue includes sales from cloud-based solutions that provide customers with software, services, platforms, and content such as Microsoft Office 365, Microsoft Azure, Microsoft Dynamics 365, and Xbox Live; solution support; and consulting services. Service and other revenue also includes sales from online advertising and LinkedIn.
Revenue Recognition
Revenue is recognized upon transfer of control of promised products or services to customers in an amount that reflects the consideration we expect to receive in exchange for those products or services. We enter into contracts that can include various combinations of products and services, which are generally capable of being distinct and accounted for as separate performance obligations. Revenue is recognized net of allowances for returns and any taxes collected from customers, which are subsequently remitted to governmental authorities.
Nature of Products and Services
Licenses for on-premises software provide the customer with a right to use the software as it exists when made available to the customer. Customers may purchase perpetual licenses or subscribe to licenses, which provide customers with the same functionality and differ mainly in the duration over which the customer benefits from the software. Revenue from distinct on-premises licenses is recognized upfront at the point in time when the software is made available to the customer. In cases where we allocate revenue to software updates, primarily because the updates are provided at no additional charge, revenue is recognized as the updates are provided, which is generally ratably over the estimated life of the related device or license.
Certain volume licensing programs, including Enterprise Agreements, include on-premises licenses combined with Software Assurance (“SA”). SA conveys rights to new software and upgrades released over the contract period and provides support, tools, and training to help customers deploy and use products more efficiently. On-premises licenses are considered distinct performance obligations when sold with SA. Revenue allocated to SA is generally recognized ratably over the contract period as customers simultaneously consume and receive benefits, given that SA comprises distinct performance obligations that are satisfied over time.
Cloud services, which allow customers to use hosted software over the contract period without taking possession of the software, are provided on either a subscription or consumption basis. Revenue related to cloud services provided on a subscription basis is recognized ratably over the contract period. Revenue related to cloud services provided on a consumption basis, such as the amount of storage used in a period, is recognized based on the customer utilization of such resources. When cloud services require a significant level of integration and interdependency with software and the individual components are not considered distinct, all revenue is recognized over the period in which the cloud services are provided.
Revenue from search advertising is recognized when the advertisement appears in the search results or when the action necessary to earn the revenue has been completed. Revenue from consulting services is recognized as services are provided.
Our hardware is generally highly dependent on, and interrelated with, the underlying operating system and cannot function without the operating system. In these cases, the hardware and software license are accounted for as a single performance obligation and revenue is recognized at the point in time when ownership is transferred to resellers or directly to end customers through retail stores and online marketplaces.
Refer to Note 20 – Segment Information and Geographic Data for further information, including revenue by significant product and service offering.
Significant Judgments
Our contracts with customers often include promises to transfer multiple products and services to a customer. Determining whether products and services are considered distinct performance obligations that should be

51
accounted for separately versus together may require significant judgment. When a cloud-based service includes both on-premises software licenses and cloud services, judgment is required to determine whether the software license is considered distinct and accounted for separately, or not distinct and accounted for together with the cloud service and recognized over time. Certain cloud services, primarily Office 365, depend on a significant level of integration, interdependency, and interrelation between the desktop applications and cloud services, and are accounted for together as one performance obligation. Revenue from Office 365 is recognized ratably over the period in which the cloud services are provided.
Judgment is required to determine the SSP for each distinct performance obligation. We use a single amount to estimate SSP for items that are not sold separately, including on-premises licenses sold with SA or software updates provided at no additional charge. We use a range of amounts to estimate SSP when we sell each of the products and services separately and need to determine whether there is a discount to be allocated based on the relative SSP of the various products and services.
In instances where SSP is not directly observable, such as when we do not sell the product or service separately, we determine the SSP using information that may include market conditions and other observable inputs. We typically have more than one SSP for individual products and services due to the stratification of those products and services by customers and circumstances. In these instances, we may use information such as the size of the customer and geographic region in determining the SSP.
Due to the various benefits from and the nature of our SA program, judgment is required to assess the pattern of delivery, including the exercise pattern of certain benefits across our portfolio of customers.
Our products are generally sold with a right of return, we may provide other credits or incentives, and in certain instances we estimate customer usage of our products and services, which are accounted for as variable consideration when determining the amount of revenue to recognize. Returns and credits are estimated at contract inception and updated at the end of each reporting period if additional information becomes available. Changes to our estimated variable consideration were not material for the periods presented.
Contract Balances
Timing of revenue recognition may differ from the timing of invoicing to customers. We record a receivable when revenue is recognized prior to invoicing, or unearned revenue when revenue is recognized subsequent to invoicing. For multi-year agreements, we generally invoice customers annually at the beginning of each annual coverage period. We record a receivable related to revenue recognized for multi-year on-premises licenses as we have an unconditional right to invoice and receive payment in the future related to those licenses.
As of June 30, 2019 and 2018, long-term accounts receivable, net of allowance for doubtful accounts, was $2.2 billion and $1.8 billion, respectively, and is included in other long-term assets in our consolidated balance sheets.
The allowance for doubtful accounts reflects our best estimate of probable losses inherent in the accounts receivable balance. We determine the allowance based on known troubled accounts, historical experience, and other currently available evidence.
Activity in the allowance for doubtful accounts was as follows: (In millions)
Year Ended June 30, 2019 2018 2017 Balance, beginning of period $ 397 $ 361 $ 409
Charged to costs and other 153 134 58 Write-offs (116) (98) (106)
Balance, end of period $ 434 $ 397 $ 361

52
Allowance for doubtful accounts included in our consolidated balance sheets: (In millions)
June 30, 2019 2018 2017 Accounts receivable, net of allowance for doubtful accounts $ 411 $ 377 $ 345 Other long-term assets 23 20 16
Total $ 434 $ 397 $ 361
Unearned revenue comprises mainly unearned revenue related to volume licensing programs, which may include SA and cloud services. Unearned revenue is generally invoiced annually at the beginning of each contract period for multi-year agreements and recognized ratably over the coverage period. Unearned revenue also includes payments for consulting services to be performed in the future; LinkedIn subscriptions; Office 365 subscriptions; Xbox Live subscriptions; Windows 10 post-delivery support; Dynamics business solutions; Skype prepaid credits and subscriptions; and other offerings for which we have been paid in advance and earn the revenue when we transfer control of the product or service.
Refer to Note 14 – Unearned Revenue for further information, including unearned revenue by segment and changes in unearned revenue during the period.
Payment terms and conditions vary by contract type, although terms generally include a requirement of payment within 30 to 60 days. In instances where the timing of revenue recognition differs from the timing of invoicing, we have determined our contracts generally do not include a significant financing component. The primary purpose of our invoicing terms is to provide customers with simplified and predictable ways of purchasing our products and services, not to receive financing from our customers or to provide customers with financing. Examples include invoicing at the beginning of a subscription term with revenue recognized ratably over the contract period, and multi-year on-premises licenses that are invoiced annually with revenue recognized upfront.
Assets Recognized from Costs to Obtain a Contract with a Customer
We recognize an asset for the incremental costs of obtaining a contract with a customer if we expect the benefit of those costs to be longer than one year. We have determined that certain sales incentive programs meet the requirements to be capitalized. Total capitalized costs to obtain a contract were immaterial during the periods presented and are included in other current and long-term assets in our consolidated balance sheets.
We apply a practical expedient to expense costs as incurred for costs to obtain a contract with a customer when the amortization period would have been one year or less. These costs include our internal sales force compensation program and certain partner sales incentive programs as we have determined annual compensation is commensurate with annual sales activities.
Cost of Revenue
Cost of revenue includes: manufacturing and distribution costs for products sold and programs licensed; operating costs related to product support service centers and product distribution centers; costs incurred to include software on PCs sold by original equipment manufacturers (“OEM”), to drive traffic to our websites, and to acquire online advertising space; costs incurred to support and maintain online products and services, including datacenter costs and royalties; warranty costs; inventory valuation adjustments; costs associated with the delivery of consulting services; and the amortization of capitalized software development costs. Capitalized software development costs are amortized over the estimated lives of the products.
Product Warranty
We provide for the estimated costs of fulfilling our obligations under hardware and software warranties at the time the related revenue is recognized. For hardware warranties, we estimate the costs based on historical and projected

53
product failure rates, historical and projected repair costs, and knowledge of specific product failures (if any). The specific hardware warranty terms and conditions vary depending upon the product sold and the country in which we do business, but generally include parts and labor over a period generally ranging from 90 days to three years. For software warranties, we estimate the costs to provide bug fixes, such as security patches, over the estimated life of the software. We regularly reevaluate our estimates to assess the adequacy of the recorded warranty liabilities and adjust the amounts as necessary.
Research and Development
Research and development expenses include payroll, employee benefits, stock-based compensation expense, and other headcount-related expenses associated with product development. Research and development expenses also include third-party development and programming costs, localization costs incurred to translate software for international markets, and the amortization of purchased software code and services content. Such costs related to software development are included in research and development expense until the point that technological feasibility is reached, which for our software products, is generally shortly before the products are released to production. Once technological feasibility is reached, such costs are capitalized and amortized to cost of revenue over the estimated lives of the products.
Sales and Marketing
Sales and marketing expenses include payroll, employee benefits, stock-based compensation expense, and other headcount-related expenses associated with sales and marketing personnel, and the costs of advertising, promotions, trade shows, seminars, and other programs. Advertising costs are expensed as incurred. Advertising expense was $1.6 billion, $1.6 billion, and $1.5 billion in fiscal years 2019, 2018, and 2017, respectively.
Stock-Based Compensation
Compensation cost for stock awards, which include restricted stock units (“RSUs”) and performance stock units (“PSUs”), is measured at the fair value on the grant date and recognized as expense, net of estimated forfeitures, over the related service or performance period. The fair value of stock awards is based on the quoted price of our common stock on the grant date less the present value of expected dividends not received during the vesting period. We measure the fair value of PSUs using a Monte Carlo valuation model. Compensation cost for RSUs is recognized using the straight-line method and for PSUs is recognized using the accelerated method.
Compensation expense for the employee stock purchase plan (“ESPP”) is measured as the discount the employee is entitled to upon purchase and is recognized in the period of purchase.
Income Taxes
Income tax expense includes U.S. and international income taxes, and interest and penalties on uncertain tax positions. Certain income and expenses are not reported in tax returns and financial statements in the same year. The tax effect of such temporary differences is reported as deferred income taxes. Deferred tax assets are reported net of a valuation allowance when it is more likely than not that a tax benefit will not be realized. All deferred income taxes are classified as long-term in our consolidated balance sheets.
Financial Instruments
Investments
We consider all highly liquid interest-earning investments with a maturity of three months or less at the date of purchase to be cash equivalents. The fair values of these investments approximate their carrying values. In general, investments with original maturities of greater than three months and remaining maturities of less than one year are
54
classified as short-term investments. Investments with maturities beyond one year may be classified as short-term based on their highly liquid nature and because such marketable securities represent the investment of cash that is available for current operations.
Debt investments are classified as available-for-sale and realized gains and losses are recorded using the specific identification method. Changes in fair value, excluding other-than-temporary impairments, are recorded in OCI. Debt investments are impaired when a decline in fair value is judged to be other-than-temporary. Fair value is calculated based on publicly available market information or other estimates determined by management. We employ a systematic methodology on a quarterly basis that considers available quantitative and qualitative evidence in evaluating potential impairment of our investments. If the cost of an investment exceeds its fair value, we evaluate, among other factors, general market conditions, credit quality of debt instrument issuers, and the duration and extent to which the fair value is less than cost. We also evaluate whether we have plans to sell the security or it is more likely than not that we will be required to sell the security before recovery. In addition, we consider specific adverse conditions related to the financial health of and business outlook for the investee, including industry and sector performance, changes in technology, and operational and financing cash flow factors. Once a decline in fair value is determined to be other-than-temporary, an impairment charge is recorded in other income (expense), net and a new cost basis in the investment is established.
Equity investments with readily determinable fair values are measured at fair value. Equity investments without readily determinable fair values are measured using the equity method, or measured at cost with adjustments for observable changes in price or impairments (referred to as the measurement alternative). We perform a qualitative assessment on a quarterly basis and recognize an impairment if there are sufficient indicators that the fair value of the investment is less than carrying value. Changes in value are recorded in other income (expense), net.
We lend certain fixed-income and equity securities to increase investment returns. These transactions are accounted for as secured borrowings and the loaned securities continue to be carried as investments on our consolidated balance sheets. Cash and/or security interests are received as collateral for the loaned securities with the amount determined based upon the underlying security lent and the creditworthiness of the borrower. Cash received is recorded as an asset with a corresponding liability.
Derivatives
Derivative instruments are recognized as either assets or liabilities and measured at fair value. The accounting for changes in the fair value of a derivative depends on the intended use of the derivative and the resulting designation.
For derivative instruments designated as fair value hedges, gains and losses are recognized in other income (expense), net with offsetting gains and losses on the hedged items.
For derivative instruments designated as cash flow hedges, the effective portion of the gains and losses are initially reported as a component of OCI and subsequently recognized in revenue when the hedged exposure is recognized in revenue. Gains and losses on derivatives representing either hedge components excluded from the assessment of effectiveness or hedge ineffectiveness are recognized in other income (expense), net.
For derivative instruments that are not designated as hedges, gains and losses from changes in fair values are primarily recognized in other income (expense), net.
Fair Value Measurements
We account for certain assets and liabilities at fair value. The hierarchy below lists three levels of fair value based on the extent to which inputs used in measuring fair value are observable in the market. We categorize each of our fair value measurements in one of these three levels based on the lowest level input that is significant to the fair value measurement in its entirety. These levels are:
• Level 1 – inputs are based upon unadjusted quoted prices for identical instruments in active markets. Our Level 1 investments include U.S. government securities, common and preferred stock, and mutual funds. Our Level 1 derivative assets and liabilities include those actively traded on exchanges.

55
• Level 2 – inputs are based upon quoted prices for similar instruments in active markets, quoted prices for identical or similar instruments in markets that are not active, and model-based valuation techniques (e.g. the Black-Scholes model) for which all significant inputs are observable in the market or can be corroborated by observable market data for substantially the full term of the assets or liabilities. Where applicable, these models project future cash flows and discount the future amounts to a present value using market-based observable inputs including interest rate curves, credit spreads, foreign exchange rates, and forward and spot prices for currencies. Our Level 2 investments include commercial paper, certificates of deposit, U.S. agency securities, foreign government bonds, mortgage- and asset-backed securities, corporate notes and bonds, and municipal securities. Our Level 2 derivative assets and liabilities primarily include certain over-the-counter option and swap contracts.
• Level 3 – inputs are generally unobservable and typically reflect management’s estimates of assumptions that market participants would use in pricing the asset or liability. The fair values are therefore determined using model-based techniques, including option pricing models and discounted cash flow models. Our Level 3 assets and liabilities include investments in corporate notes and bonds, and goodwill and intangible assets, when they are recorded at fair value due to an impairment charge. Unobservable inputs used in the models are significant to the fair values of the assets and liabilities.
We measure equity investments without readily determinable fair values on a nonrecurring basis. The fair values of these investments are determined based on valuation techniques using the best information available, and may include quoted market prices, market comparables, and discounted cash flow projections.
Our other current financial assets and current financial liabilities have fair values that approximate their carrying values.
Inventories
Inventories are stated at average cost, subject to the lower of cost or net realizable value. Cost includes materials, labor, and manufacturing overhead related to the purchase and production of inventories. Net realizable value is the estimated selling price less estimated costs of completion, disposal, and transportation. We regularly review inventory quantities on hand, future purchase commitments with our suppliers, and the estimated utility of our inventory. If our review indicates a reduction in utility below carrying value, we reduce our inventory to a new cost basis through a charge to cost of revenue.
Property and Equipment
Property and equipment is stated at cost less accumulated depreciation, and depreciated using the straight-line method over the shorter of the estimated useful life of the asset or the lease term. The estimated useful lives of our property and equipment are generally as follows: computer software developed or acquired for internal use, three to seven years; computer equipment, two to three years; buildings and improvements, five to 15 years; leasehold improvements, three to 20 years; and furniture and equipment, one to 10 years. Land is not depreciated.
Leases
We determine if an arrangement is a lease at inception. Operating leases are included in operating lease right-of-use (“ROU”) assets, other current liabilities, and operating lease liabilities in our consolidated balance sheets. Finance leases are included in property and equipment, other current liabilities, and other long-term liabilities in our consolidated balance sheets.
ROU assets represent our right to use an underlying asset for the lease term and lease liabilities represent our obligation to make lease payments arising from the lease. Operating lease ROU assets and liabilities are recognized at commencement date based on the present value of lease payments over the lease term. As most of our leases do not provide an implicit rate, we generally use our incremental borrowing rate based on the estimated rate of interest for collateralized borrowing over a similar term of the lease payments at commencement date. The operating lease ROU asset also includes any lease payments made and excludes lease incentives. Our lease terms may include options to extend or terminate the lease when it is reasonably certain that we will exercise that option. Lease expense for lease payments is recognized on a straight-line basis over the lease term.
56
We have lease agreements with lease and non-lease components, which are generally accounted for separately. For certain equipment leases, such as vehicles, we account for the lease and non-lease components as a single lease component. Additionally, for certain equipment leases, we apply a portfolio approach to effectively account for the operating lease ROU assets and liabilities.
Goodwill
Goodwill is tested for impairment at the reporting unit level (operating segment or one level below an operating segment) on an annual basis (May 1 for us) and between annual tests if an event occurs or circumstances change that would more likely than not reduce the fair value of a reporting unit below its carrying value.
Intangible Assets
Our intangible assets are subject to amortization and are amortized using the straight-line method over their estimated period of benefit, ranging from one to 20 years. We evaluate the recoverability of intangible assets periodically by taking into account events or circumstances that may warrant revised estimates of useful lives or that indicate the asset may be impaired.
Recent Accounting Guidance
Recently Adopted Accounting Guidance
Income Taxes – Intra-Entity Asset Transfers
In October 2016, the Financial Accounting Standards Board (“FASB”) issued new guidance requiring an entity to recognize the income tax consequences of an intra-entity transfer of an asset other than inventory when the transfer occurs, rather than when the asset has been sold to an outside party. We adopted the guidance effective July 1, 2018. Adoption of the guidance was applied using a modified retrospective approach through a cumulative-effect adjustment to retained earnings as of the effective date. We recorded a net cumulative-effect adjustment that resulted in an increase in retained earnings of $557 million, which reversed the previous deferral of income tax consequences and recorded new deferred tax assets from intra-entity transfers involving assets other than inventory, partially offset by a U.S. deferred tax liability related to global intangible low-taxed income (“GILTI”). Adoption of the standard resulted in an increase in long-term deferred tax assets of $2.8 billion, an increase in long-term deferred tax liabilities of $2.1 billion, and a reduction in other current assets of $152 million. Adoption of the standard had no impact on cash from or used in operating, financing, or investing on our consolidated cash flows statements.
Financial Instruments – Recognition, Measurement, Presentation, and Disclosure
In January 2016, the FASB issued a new standard related to certain aspects of recognition, measurement, presentation, and disclosure of financial instruments. Most prominent among the changes in the standard is the requirement for changes in the fair value of our equity investments, with certain exceptions, to be recognized through net income rather than OCI.
We adopted the standard effective July 1, 2018. Adoption of the standard was applied using a modified retrospective approach through a cumulative-effect adjustment from accumulated other comprehensive income (“AOCI”) to retained earnings as of the effective date, and we elected to measure equity investments without readily determinable fair values at cost with adjustments for observable changes in price or impairments. The cumulative-effect adjustment included any previously held unrealized gains and losses held in AOCI related to our equity investments carried at fair value as well as the impact of recording the fair value of certain equity investments carried at cost. The impact on our consolidated balance sheets upon adoption was not material. Adoption of the standard had no impact on cash from or used in operating, financing, or investing on our consolidated cash flows statements.
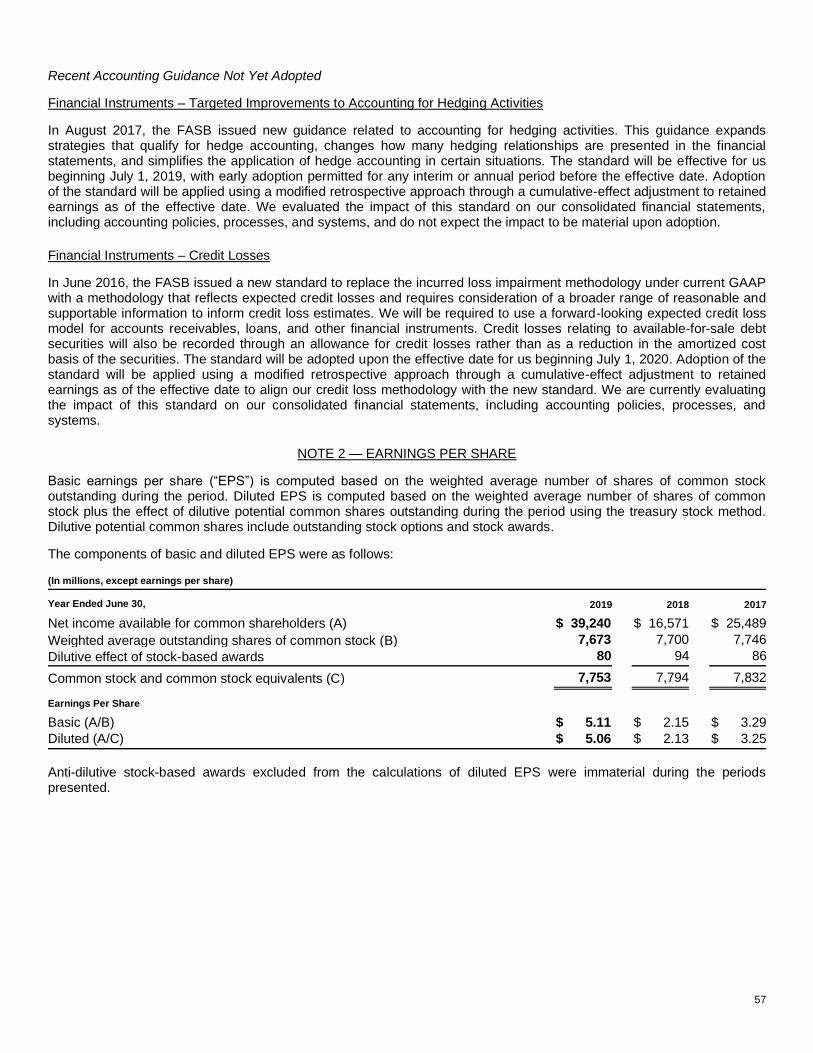
57
Recent Accounting Guidance Not Yet Adopted
Financial Instruments – Targeted Improvements to Accounting for Hedging Activities
In August 2017, the FASB issued new guidance related to accounting for hedging activities. This guidance expands strategies that qualify for hedge accounting, changes how many hedging relationships are presented in the financial statements, and simplifies the application of hedge accounting in certain situations. The standard will be effective for us beginning July 1, 2019, with early adoption permitted for any interim or annual period before the effective date. Adoption of the standard will be applied using a modified retrospective approach through a cumulative-effect adjustment to retained earnings as of the effective date. We evaluated the impact of this standard on our consolidated financial statements, including accounting policies, processes, and systems, and do not expect the impact to be material upon adoption.
Financial Instruments – Credit Losses
In June 2016, the FASB issued a new standard to replace the incurred loss impairment methodology under current GAAP with a methodology that reflects expected credit losses and requires consideration of a broader range of reasonable and supportable information to inform credit loss estimates. We will be required to use a forward-looking expected credit loss model for accounts receivables, loans, and other financial instruments. Credit losses relating to available-for-sale debt securities will also be recorded through an allowance for credit losses rather than as a reduction in the amortized cost basis of the securities. The standard will be adopted upon the effective date for us beginning July 1, 2020. Adoption of the standard will be applied using a modified retrospective approach through a cumulative-effect adjustment to retained earnings as of the effective date to align our credit loss methodology with the new standard. We are currently evaluating the impact of this standard on our consolidated financial statements, including accounting policies, processes, and systems.
NOTE 2 — EARNINGS PER SHARE
Basic earnings per share (“EPS”) is computed based on the weighted average number of shares of common stock outstanding during the period. Diluted EPS is computed based on the weighted average number of shares of common stock plus the effect of dilutive potential common shares outstanding during the period using the treasury stock method. Dilutive potential common shares include outstanding stock options and stock awards.
The components of basic and diluted EPS were as follows: (In millions, except earnings per share)
Year Ended June 30, 2019 2018 2017 Net income available for common shareholders (A) $ 39,240 $ 16,571 $ 25,489 Weighted average outstanding shares of common stock (B) 7,673 7,700 7,746 Dilutive effect of stock-based awards 80 94 86
Common stock and common stock equivalents (C) 7,753 7,794 7,832 Earnings Per Share
Basic (A/B) $ 5.11 $ 2.15 $ 3.29 Diluted (A/C) $ 5.06 $ 2.13 $ 3.25
Anti-dilutive stock-based awards excluded from the calculations of diluted EPS were immaterial during the periods presented.
58
NOTE 3 — OTHER INCOME (EXPENSE), NET
The components of other income (expense), net were as follows: (In millions)
Year Ended June 30, 2019 2018 2017 Interest and dividends income $ 2,762 $ 2,214 $ 1,387 Interest expense (2,686) (2,733) (2,222) Net recognized gains on investments 648 2,399 2,583 Net gains (losses) on derivatives 144 (187) (510) Net losses on foreign currency remeasurements (82) (218) (111) Other, net (57) (59) (251)
Total $ 729 $ 1,416 $ 876
Net Recognized Gains (Losses) on Investments
Net recognized gains (losses) on debt investments were as follows: (In millions)
Year Ended June 30, 2019 2018 2017
Realized gains from sales of available-for-sale securities $ 12 $ 27 $ 108 Realized losses from sales of available-for-sale securities (93) (987) (162) Other-than-temporary impairments of investments (16) (6) (14)
Total $ (97) $ (966) $ (68)
Net recognized gains (losses) on equity investments were as follows: (In millions)
Year Ended June 30, 2019 2018 2017
Net realized gains on investments sold $ 276 $ 3,406 $ 2,692 Net unrealized gains on investments still held 479 0 0 Impairments of investments (10) (41) (41)
Total $ 745 $ 3,365 $ 2,651

59
NOTE 4 — INVESTMENTS
Investment Components
The components of investments were as follows:
(In millions) Fair Value
Level Cost Basis Unrealized
Gains Unrealized
Losses Recorded
Basis
Cash and Cash
Equivalents Short-term
Investments Equity
Investments
June 30, 2019 Changes in Fair Value
Recorded in Other Comprehensive Income
Commercial paper Level 2 $ 2,211 $ 0 $ 0 $ 2,211 $ 1,773 $ 438 $ 0 Certificates of deposit Level 2 2,018 0 0 2,018 1,430 588 0 U.S. government
securities Level 1 104,925 1,854 (104) 106,675 769 105,906 0 U.S. agency securities Level 2 988 0 0 988 698 290 0 Foreign government
bonds Level 2 6,350 4 (8) 6,346 2,506 3,840 0 Mortgage- and asset-
backed securities Level 2 3,554 10 (3) 3,561 0 3,561 0 Corporate notes and
bonds Level 2 7,437 111 (7) 7,541 0 7,541 0 Corporate notes and
bonds Level 3 15 0 0 15 0 15 0 Municipal securities Level 2 242 48 0 290 0 290 0 Municipal securities Level 3 7 0 0 7 0 7 0
Total debt investments
$ 127,747 $ 2,027 $ (122) $ 129,652 $ 7,176 $ 122,476 $ 0 Changes in Fair Value
Recorded in Net Income
Equity investments Level 1
$ 973 $ 409 $ 0 $ 564 Equity investments Other
2,085 0 0 2,085
Total equity investments
$ 3,058 $ 409 $ 0 $ 2,649 Cash
$ 3,771 $ 3,771 $ 0 $ 0 Derivatives, net (a)
(13) 0 (13) 0
Total
$ 136,468 $ 11,356 $ 122,463 $ 2,649

60
(In millions) Fair Value
Level Cost Basis Unrealized
Gains Unrealized
Losses Recorded
Basis
Cash and Cash
Equivalents Short-term
Investments Equity
Investments
June 30, 2018
Changes in Fair Value Recorded in Other Comprehensive Income
Commercial paper Level 2 $ 2,513 $ 0 $ 0 $ 2,513 $ 2,215 $ 298 $ 0 Certificates of deposit Level 2 2,058 0 0 2,058 1,865 193 0 U.S. government
securities Level 1 108,120 62 (1,167) 107,015 2,280 104,735 0 U.S. agency securities Level 2 1,742 0 0 1,742 1,398 344 0 Foreign government
bonds Level 1 22 0 0 22 0 22 0 Foreign government
bonds Level 2 5,063 1 (10) 5,054 0 5,054 0 Mortgage- and asset-
backed securities Level 2 3,864 4 (13) 3,855 0 3,855 0 Corporate notes and
bonds Level 2 6,929 21 (56) 6,894 0 6,894 0 Corporate notes and
bonds Level 3 15 0 0 15 0 15 0 Municipal securities Level 2 271 37 (1) 307 0 307 0
Total debt investments
$ 130,597 $ 125 $ (1,247) $ 129,475 $ 7,758 $ 121,717 $ 0
Equity investments Level 1
$ 533 $ 246 $ 0 $ 287 Equity investments Level 3
18 0 0 18
Equity investments Other
1,558 0 1 1,557
Total equity investments
$ 2,109 $ 246 $ 1 $ 1,862
Cash
$ 3,942 $ 3,942 $ 0 $ 0 Derivatives, net (a)
104 0 104 0
Total
$ 135,630 $ 11,946 $ 121,822 $ 1,862
(a) Refer to Note 5 – Derivatives for further information on the fair value of our derivative instruments.
Equity investments presented as “Other” in the tables above include investments without readily determinable fair values measured using the equity method or measured at cost with adjustments for observable changes in price or impairments, and investments measured at fair value using net asset value as a practical expedient which are not categorized in the fair value hierarchy. As of June 30, 2019 and 2018, equity investments without readily determinable fair values measured at cost with adjustments for observable changes in price or impairments were $1.2 billion and $697 million, respectively.
As of June 30, 2019, we had no collateral received under agreements for loaned securities. As of June 30, 2018, collateral received under agreements for loaned securities was $1.8 billion and primarily comprised U.S. government and agency securities.
61
Unrealized Losses on Debt Investments
Debt investments with continuous unrealized losses for less than 12 months and 12 months or greater and their related fair values were as follows:
Less than 12 Months 12 Months or Greater Total Unrealized
Losses
(In millions) Fair Value Unrealized
Losses Fair Value Unrealized
Losses Total
Fair Value
June 30, 2019 U.S. government and agency securities $ 1,491 $ (1) $ 39,158 $ (103) $ 40,649 $ (104) Foreign government bonds 25 0 77 (8) 102 (8) Mortgage- and asset-backed securities 664 (1) 378 (2) 1,042 (3) Corporate notes and bonds 498 (3) 376 (4) 874 (7)
Total $ 2,678 $ (5) $ 39,989 $ (117) $ 42,667 $ (122)
Less than 12 Months 12 Months or Greater Total Unrealized
Losses
(In millions) Fair Value Unrealized
Losses Fair Value Unrealized
Losses Total
Fair Value
June 30, 2018
U.S. government and agency securities $ 82,352 $ (1,064) $ 4,459 $ (103) $ 86,811 $ (1,167) Foreign government bonds 3,457 (7) 13 (3) 3,470 (10) Mortgage- and asset-backed securities 2,072 (9) 96 (4) 2,168 (13) Corporate notes and bonds 3,111 (43) 301 (13) 3,412 (56) Municipal securities 45 (1) 0 0 45 (1)
Total $ 91,037 $ (1,124) $ 4,869 $ (123) $ 95,906 $ (1,247)
Unrealized losses from fixed-income securities are primarily attributable to changes in interest rates. Management does not believe any remaining unrealized losses represent other-than-temporary impairments based on our evaluation of available evidence.
Debt Investment Maturities
(In millions) Cost Basis Estimated Fair Value
June 30, 2019 Due in one year or less $ 53,200 $ 53,124 Due after one year through five years 47,016 47,783 Due after five years through 10 years 26,658 27,824 Due after 10 years 873 921
Total $ 127,747 $ 129,652
NOTE 5 — DERIVATIVES
We use derivative instruments to manage risks related to foreign currencies, equity prices, interest rates, and credit; to enhance investment returns; and to facilitate portfolio diversification. Our objectives for holding derivatives include reducing, eliminating, and efficiently managing the economic impact of these exposures as effectively as possible. Our derivative programs include strategies that both qualify and do not qualify for hedge accounting treatment.
62
Foreign Currency
Certain forecasted transactions, assets, and liabilities are exposed to foreign currency risk. We monitor our foreign currency exposures daily to maximize the economic effectiveness of our foreign currency hedge positions. Option and forward contracts are used to hedge a portion of forecasted international revenue and are designated as cash flow hedging instruments. Principal currencies hedged include the euro, Japanese yen, British pound, Canadian dollar, and Australian dollar.
Foreign currency risks related to certain non-U.S. dollar denominated securities are hedged using foreign exchange forward contracts that are designated as fair value hedging instruments.
Certain options and forwards not designated as hedging instruments are also used to manage the variability in foreign exchange rates on certain balance sheet amounts and to manage other foreign currency exposures.
Equity
Securities held in our equity investments portfolio are subject to market price risk. Market price risk is managed relative to broad-based global and domestic equity indices using certain convertible preferred investments, options, futures, and swap contracts not designated as hedging instruments. In the past, to hedge our price risk, we also used and designated equity derivatives as hedging instruments, including puts, calls, swaps, and forwards.
Other
Interest Rate
Securities held in our fixed-income portfolio are subject to different interest rate risks based on their maturities. We manage the average maturity of our fixed-income portfolio to achieve economic returns that correlate to certain broad-based fixed-income indices using exchange-traded option and futures contracts, and over-the-counter swap and option contracts, none of which are designated as hedging instruments.
In addition, we use “To Be Announced” forward purchase commitments of mortgage-backed assets to gain exposure to agency mortgage-backed securities. These meet the definition of a derivative instrument in cases where physical delivery of the assets is not taken at the earliest available delivery date.
Credit
Our fixed-income portfolio is diversified and consists primarily of investment-grade securities. We use credit default swap contracts, not designated as hedging instruments, to manage credit exposures relative to broad-based indices and to facilitate portfolio diversification. We use credit default swaps as they are a low-cost method of managing exposure to individual credit risks or groups of credit risks.
Credit-Risk-Related Contingent Features
Certain of our counterparty agreements for derivative instruments contain provisions that require our issued and outstanding long-term unsecured debt to maintain an investment grade credit rating and require us to maintain minimum liquidity of $1.0 billion. To the extent we fail to meet these requirements, we will be required to post collateral, similar to the standard convention related to over-the-counter derivatives. As of June 30, 2019, our long-term unsecured debt rating was AAA, and cash investments were in excess of $1.0 billion. As a result, no collateral was required to be posted.

63
The following table presents the notional amounts of our outstanding derivative instruments measured in U.S. dollar equivalents:
(In millions) June 30,
2019 June 30,
2018
Designated as Hedging Instruments
Foreign exchange contracts sold $ 6,034 $ 11,101 Not Designated as Hedging Instruments Foreign exchange contracts purchased 14,889 9,425 Foreign exchange contracts sold 15,614 13,374 Equity contracts purchased 680 49 Equity contracts sold 5 5 Other contracts purchased 1,327 878 Other contracts sold 451 472
Fair Values of Derivative Instruments
The following table presents our derivative instruments:
(In millions) Derivative
Assets Derivative Liabilities
Derivative Assets
Derivative Liabilities
June 30,
2019 June 30,
2018 Changes in Fair Value Recorded in Other Comprehensive Income
Designated as Hedging Instruments
Foreign exchange contracts $ 0 $ 0 $ 174 $ 0 Changes in Fair Value Recorded in Net Income
Designated as Hedging Instruments
Foreign exchange contracts 0 (93) 95 0 Not Designated as Hedging Instruments
Foreign exchange contracts 204 (172) 256 (197) Equity contracts 38 0 2 (7) Other contracts 8 (7) 11 (3)
Gross amounts of derivatives 250 (272) 538 (207) Gross amounts of derivatives offset in the balance sheet (113) 114 (152) 153 Cash collateral received 0 (78) 0 (235)
Net amounts of derivatives $ 137 $ (236) $ 386 $ (289) Reported as Short-term investments $ (13) $ 0 $ 104 $ 0 Other current assets 146 0 260 0 Other long-term assets 4 0 22 0 Other current liabilities 0 (221) 0 (288) Other long-term liabilities 0 (15) 0 (1)
Total $ 137 $ (236) $ 386 $ (289)
Gross derivative assets and liabilities subject to legally enforceable master netting agreements for which we have elected to offset were $247 million and $272 million, respectively, as of June 30, 2019, and $533 million and $207 million, respectively, as of June 30, 2018.

64
The following table presents the fair value of our derivatives instruments on a gross basis: (In millions) Level 1 Level 2 Level 3 Total
June 30, 2019 Derivative assets $ 0 $ 247 $ 3 $ 250 Derivative liabilities 0 (272) 0 (272) June 30, 2018
Derivative assets 1 535 2 538 Derivative liabilities (1) (206) 0 (207)
Fair Value Hedge Gains (Losses)
We recognized in other income (expense), net the following gains (losses) on contracts designated as fair value hedges and their related hedged items: (In millions)
Year Ended June 30, 2019 2018 2017 Foreign Exchange Contracts
Derivatives $ 38 $ 25 $ 441 Hedged items 130 78 (386)
Total amount of ineffectiveness $ 168 $ 103 $ 55 Equity Contracts Derivatives $ 0 $ (324) $ (74) Hedged items 0 324 74
Total amount of ineffectiveness $ 0 $ 0 $ 0
Amount of equity contracts excluded from effectiveness assessment $ 0 $ 80 $ (80)
Cash Flow Hedge Gains (Losses)
We recognized the following gains (losses) on foreign exchange contracts designated as cash flow hedges: (In millions)
Year Ended June 30, 2019 2018 2017 Effective Portion
Gains recognized in other comprehensive income (loss), net of tax of $1, $11, and $4 $ 159 $ 219 $ 328 Gains reclassified from accumulated other comprehensive income (loss) into revenue 341 185 555 Amount Excluded from Effectiveness Assessment and Ineffective Portion Losses recognized in other income (expense), net (64) (255) (389)
We do not have any net derivative gains included in AOCI as of June 30, 2019 that will be reclassified into earnings within the following 12 months. No significant amounts of gains (losses) were reclassified from AOCI into earnings as a result of forecasted transactions that failed to occur during fiscal year 2019.

65
Non-designated Derivative Gains (Losses)
We recognized in other income (expense), net the following gains (losses) on derivatives not designated as hedging instruments: (In millions)
Year Ended June 30, 2019 2018 2017 Foreign exchange contracts $ (97) $ (33) $ (117) Equity contracts 3 (87) (114) Other contracts 35 (17) (3)
Total $ (59) $ (137) $ (234)
NOTE 6 — INVENTORIES
The components of inventories were as follows: (In millions)
June 30, 2019 2018
Raw materials $ 399 $ 655 Work in process 53 54 Finished goods 1,611 1,953
Total $ 2,063 $ 2,662
NOTE 7 — PROPERTY AND EQUIPMENT
The components of property and equipment were as follows: (In millions)
June 30, 2019 2018
Land $ 1,540 $ 1,254 Buildings and improvements 26,288 20,604 Leasehold improvements 5,316 4,735 Computer equipment and software 33,823 27,633 Furniture and equipment 4,840 4,457
Total, at cost 71,807 58,683 Accumulated depreciation (35,330) (29,223)
Total, net $ 36,477 $ 29,460
During fiscal years 2019, 2018, and 2017, depreciation expense was $9.7 billion, $7.7 billion, and $6.1 billion, respectively. We have committed $4.0 billion for the construction of new buildings, building improvements, and leasehold improvements as of June 30, 2019.
NOTE 8 — BUSINESS COMBINATIONS
GitHub, Inc.
On October 25, 2018, we acquired GitHub, Inc. (“GitHub”), a software development platform, in a $7.5 billion stock transaction (inclusive of total cash payments of $1.3 billion in respect of vested GitHub equity awards and an indemnity escrow). The acquisition is expected to empower developers to achieve more at every stage of the

66
development lifecycle, accelerate enterprise use of GitHub, and bring Microsoft’s developer tools and services to new audiences. The financial results of GitHub have been included in our consolidated financial statements since the date of the acquisition. GitHub is reported as part of our Intelligent Cloud segment.
The allocation of the purchase price to goodwill was completed as of June 30, 2019. The major classes of assets and liabilities to which we allocated the purchase price were as follows: (In millions)
Cash, cash equivalents, and short-term investments $ 234 Goodwill 5,497 Intangible assets 1,267 Other assets 143 Other liabilities (217)
Total $ 6,924
The goodwill recognized in connection with the acquisition is primarily attributable to anticipated synergies from future growth and is not expected to be deductible for tax purposes. We assigned the goodwill to our Intelligent Cloud segment.
Following are the details of the purchase price allocated to the intangible assets acquired:
(In millions) Amount Weighted
Average Life
Customer-related $ 648 8 years Technology-based 447 5 years Marketing-related 170 10 years Contract-based 2 2 years
Total $ 1,267 7 years
Transactions recognized separately from the purchase price allocation were approximately $600 million, primarily related to equity awards recognized as expense over the related service period.
LinkedIn Corporation
On December 8, 2016, we completed our acquisition of all issued and outstanding shares of LinkedIn Corporation (“LinkedIn”), the world’s largest professional network on the Internet, for a total purchase price of $27.0 billion. The purchase price consisted primarily of cash of $26.9 billion. The acquisition is expected to accelerate the growth of LinkedIn, Office 365, and Dynamics 365. The financial results of LinkedIn have been included in our consolidated financial statements since the date of the acquisition.
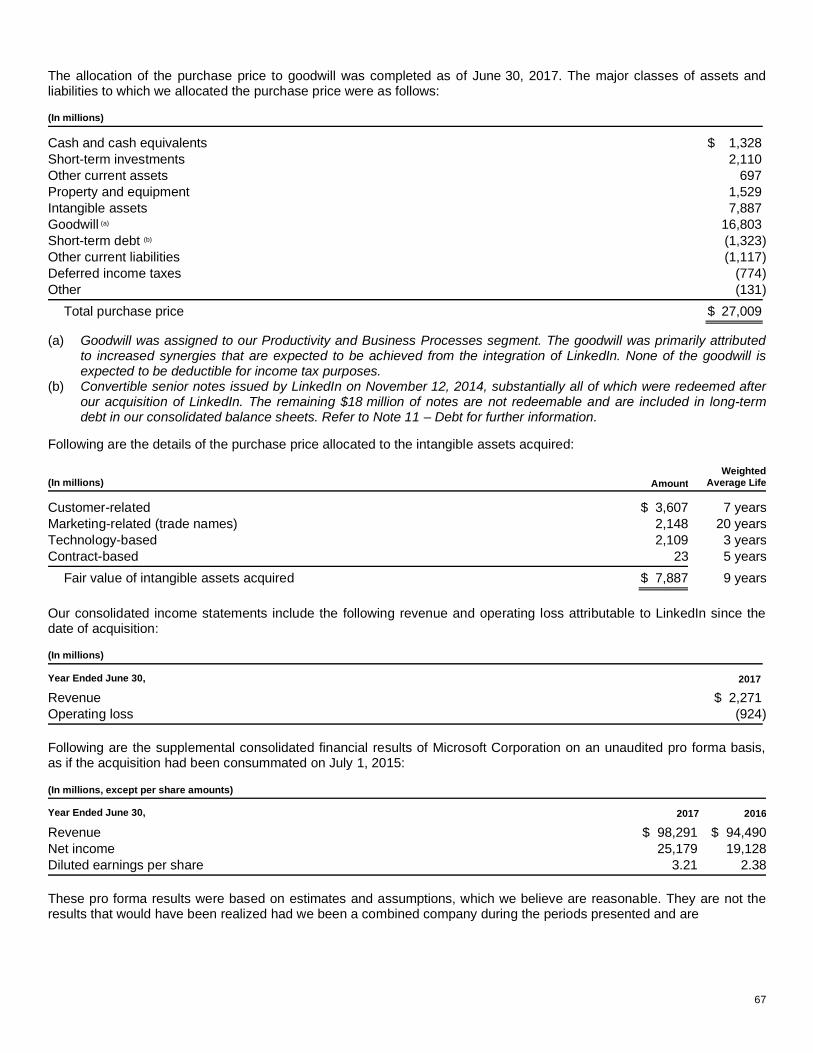
67
The allocation of the purchase price to goodwill was completed as of June 30, 2017. The major classes of assets and liabilities to which we allocated the purchase price were as follows: (In millions)
Cash and cash equivalents $ 1,328 Short-term investments 2,110 Other current assets 697 Property and equipment 1,529 Intangible assets 7,887 Goodwill (a) 16,803 Short-term debt (b) (1,323) Other current liabilities (1,117) Deferred income taxes (774) Other (131)
Total purchase price $ 27,009
(a) Goodwill was assigned to our Productivity and Business Processes segment. The goodwill was primarily attributed to increased synergies that are expected to be achieved from the integration of LinkedIn. None of the goodwill is expected to be deductible for income tax purposes.
(b) Convertible senior notes issued by LinkedIn on November 12, 2014, substantially all of which were redeemed after our acquisition of LinkedIn. The remaining $18 million of notes are not redeemable and are included in long-term debt in our consolidated balance sheets. Refer to Note 11 – Debt for further information.
Following are the details of the purchase price allocated to the intangible assets acquired:
(In millions) Amount Weighted
Average Life
Customer-related $ 3,607 7 years Marketing-related (trade names) 2,148 20 years Technology-based 2,109 3 years Contract-based 23 5 years
Fair value of intangible assets acquired $ 7,887 9 years
Our consolidated income statements include the following revenue and operating loss attributable to LinkedIn since the date of acquisition: (In millions)
Year Ended June 30, 2017 Revenue $ 2,271 Operating loss (924)
Following are the supplemental consolidated financial results of Microsoft Corporation on an unaudited pro forma basis, as if the acquisition had been consummated on July 1, 2015: (In millions, except per share amounts)
Year Ended June 30, 2017 2016
Revenue $ 98,291 $ 94,490 Net income 25,179 19,128 Diluted earnings per share 3.21 2.38
These pro forma results were based on estimates and assumptions, which we believe are reasonable. They are not the results that would have been realized had we been a combined company during the periods presented and are
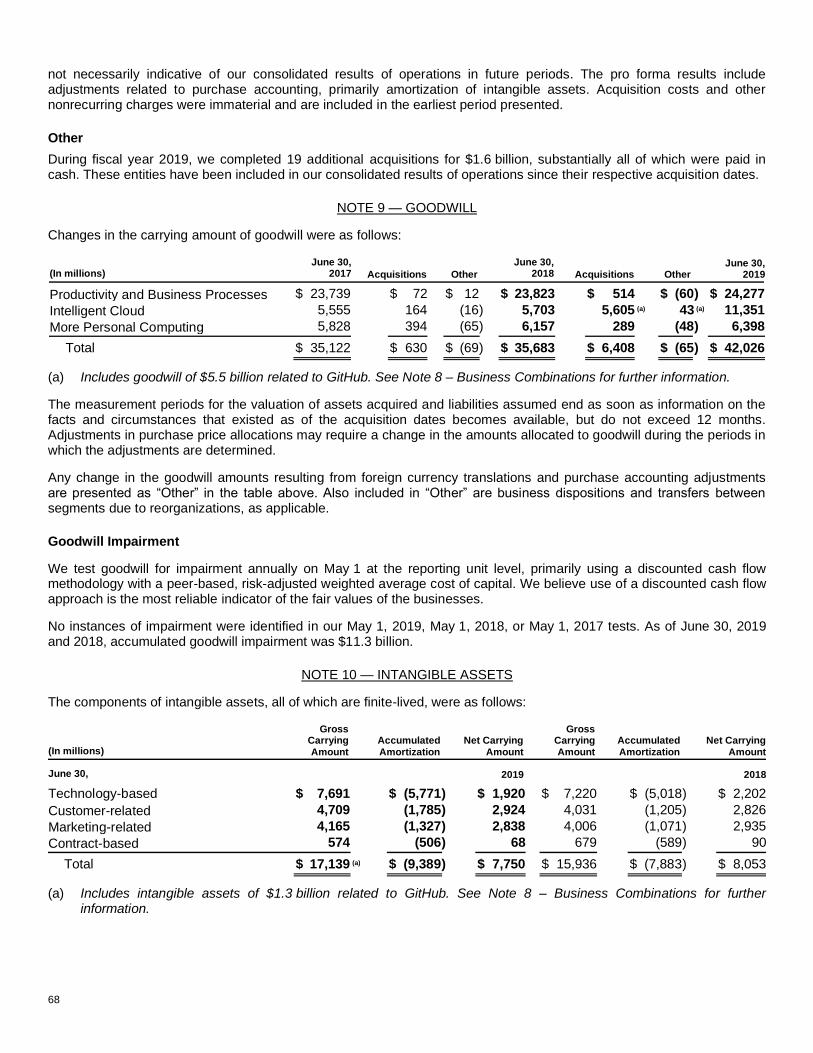
68
not necessarily indicative of our consolidated results of operations in future periods. The pro forma results include adjustments related to purchase accounting, primarily amortization of intangible assets. Acquisition costs and other nonrecurring charges were immaterial and are included in the earliest period presented.
Other
During fiscal year 2019, we completed 19 additional acquisitions for $1.6 billion, substantially all of which were paid in cash. These entities have been included in our consolidated results of operations since their respective acquisition dates.
NOTE 9 — GOODWILL
Changes in the carrying amount of goodwill were as follows:
(In millions) June 30,
2017 Acquisitions Other June 30,
2018 Acquisitions Other June 30,
2019
Productivity and Business Processes $ 23,739 $ 72 $ 12 $ 23,823 $ 514 $ (60) $ 24,277 Intelligent Cloud 5,555 164 (16) 5,703 5,605 (a) 43 (a) 11,351 More Personal Computing 5,828 394 (65) 6,157 289 (48) 6,398
Total $ 35,122 $ 630 $ (69) $ 35,683 $ 6,408 $ (65) $ 42,026
(a) Includes goodwill of $5.5 billion related to GitHub. See Note 8 – Business Combinations for further information.
The measurement periods for the valuation of assets acquired and liabilities assumed end as soon as information on the facts and circumstances that existed as of the acquisition dates becomes available, but do not exceed 12 months. Adjustments in purchase price allocations may require a change in the amounts allocated to goodwill during the periods in which the adjustments are determined.
Any change in the goodwill amounts resulting from foreign currency translations and purchase accounting adjustments are presented as “Other” in the table above. Also included in “Other” are business dispositions and transfers between segments due to reorganizations, as applicable.
Goodwill Impairment
We test goodwill for impairment annually on May 1 at the reporting unit level, primarily using a discounted cash flow methodology with a peer-based, risk-adjusted weighted average cost of capital. We believe use of a discounted cash flow approach is the most reliable indicator of the fair values of the businesses.
No instances of impairment were identified in our May 1, 2019, May 1, 2018, or May 1, 2017 tests. As of June 30, 2019 and 2018, accumulated goodwill impairment was $11.3 billion.
NOTE 10 — INTANGIBLE ASSETS
The components of intangible assets, all of which are finite-lived, were as follows:
(In millions)
Gross Carrying Amount
Accumulated Amortization
Net Carrying Amount
Gross Carrying Amount
Accumulated Amortization
Net Carrying Amount
June 30,
2019 2018
Technology-based $ 7,691 $ (5,771) $ 1,920 $ 7,220 $ (5,018) $ 2,202 Customer-related 4,709 (1,785) 2,924 4,031 (1,205) 2,826 Marketing-related 4,165 (1,327) 2,838 4,006 (1,071) 2,935 Contract-based 574 (506) 68 679 (589) 90
Total $ 17,139 (a) $ (9,389) $ 7,750 $ 15,936 $ (7,883) $ 8,053
(a) Includes intangible assets of $1.3 billion related to GitHub. See Note 8 – Business Combinations for further information.
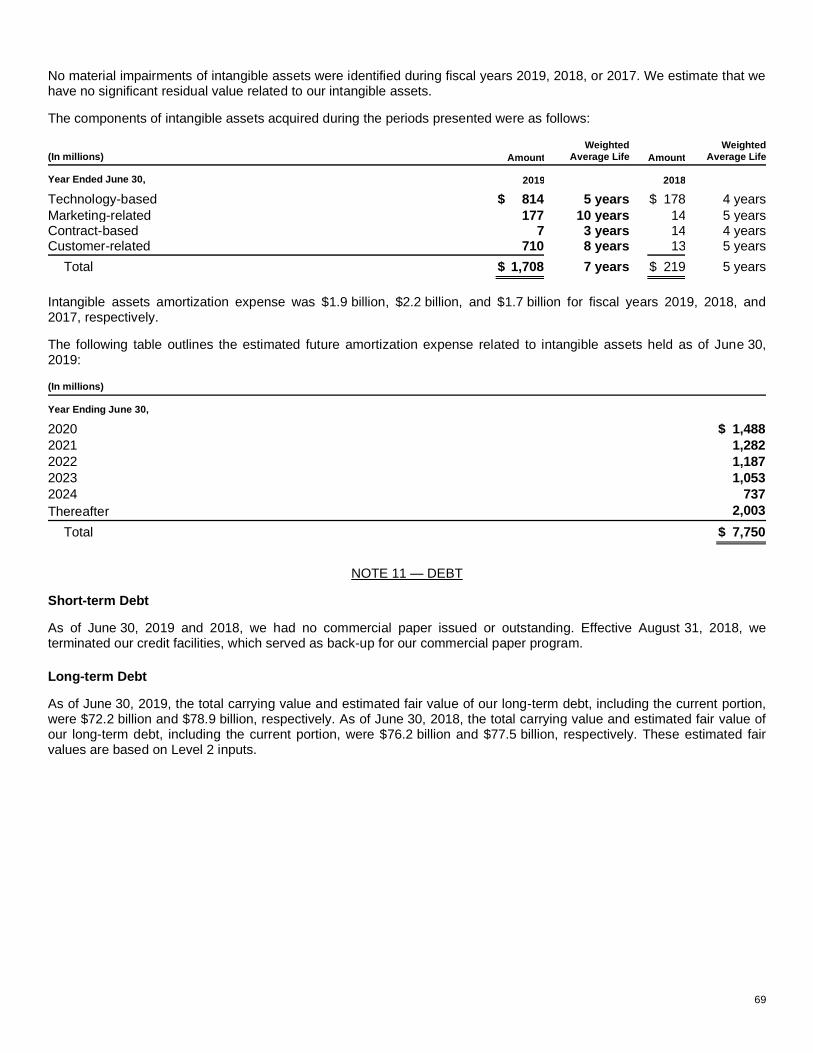
69
No material impairments of intangible assets were identified during fiscal years 2019, 2018, or 2017. We estimate that we have no significant residual value related to our intangible assets.
The components of intangible assets acquired during the periods presented were as follows:
(In millions) Amount Weighted
Average Life Amount Weighted
Average Life
Year Ended June 30, 2019 2018
Technology-based $ 814 5 years $ 178 4 years Marketing-related 177 10 years 14 5 years Contract-based 7 3 years 14 4 years Customer-related 710 8 years 13 5 years
Total $ 1,708 7 years $ 219 5 years
Intangible assets amortization expense was $1.9 billion, $2.2 billion, and $1.7 billion for fiscal years 2019, 2018, and 2017, respectively.
The following table outlines the estimated future amortization expense related to intangible assets held as of June 30, 2019: (In millions)
Year Ending June 30, 2020 $ 1,488 2021 1,282 2022 1,187 2023 1,053 2024 737 Thereafter 2,003
Total $ 7,750
NOTE 11 — DEBT
Short-term Debt
As of June 30, 2019 and 2018, we had no commercial paper issued or outstanding. Effective August 31, 2018, we terminated our credit facilities, which served as back-up for our commercial paper program.
Long-term Debt
As of June 30, 2019, the total carrying value and estimated fair value of our long-term debt, including the current portion, were $72.2 billion and $78.9 billion, respectively. As of June 30, 2018, the total carrying value and estimated fair value of our long-term debt, including the current portion, were $76.2 billion and $77.5 billion, respectively. These estimated fair values are based on Level 2 inputs.
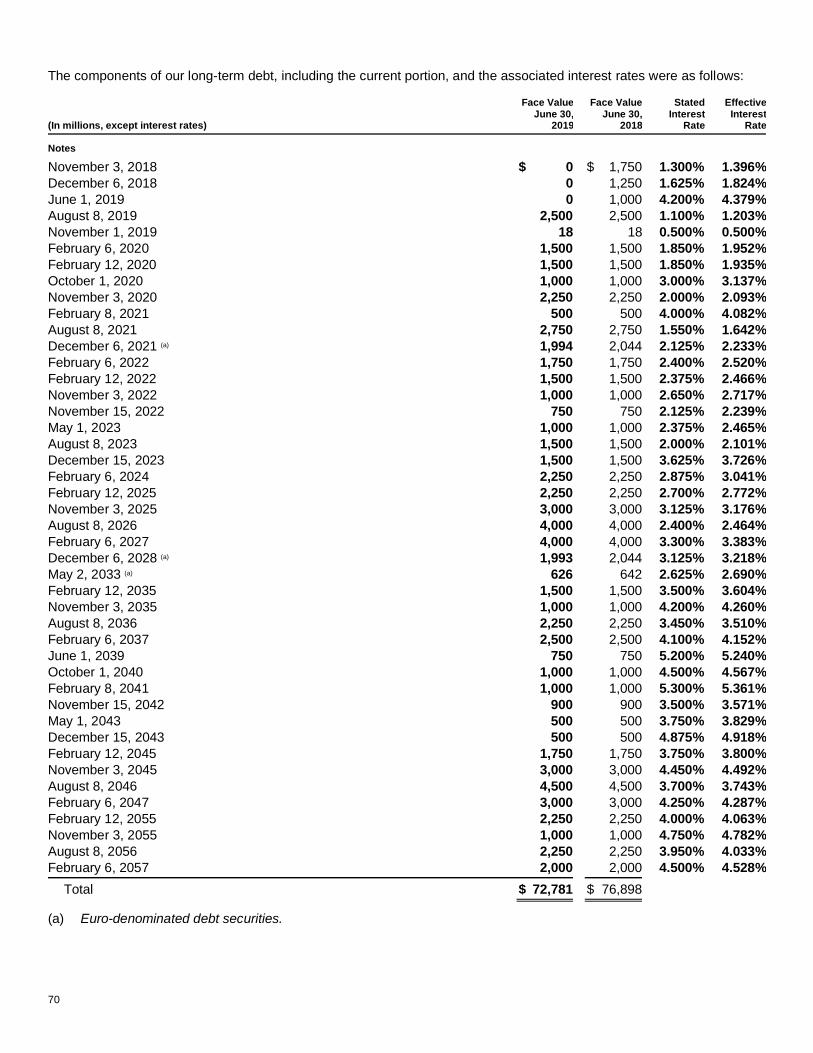
70
The components of our long-term debt, including the current portion, and the associated interest rates were as follows:
(In millions, except interest rates)
Face Value June 30,
2019
Face Value June 30,
2018
Stated Interest
Rate
Effective Interest
Rate
Notes November 3, 2018 $ 0 $ 1,750 1.300% 1.396% December 6, 2018 0 1,250 1.625% 1.824% June 1, 2019 0 1,000 4.200% 4.379% August 8, 2019 2,500 2,500 1.100% 1.203% November 1, 2019 18 18 0.500% 0.500% February 6, 2020 1,500 1,500 1.850% 1.952% February 12, 2020 1,500 1,500 1.850% 1.935% October 1, 2020 1,000 1,000 3.000% 3.137% November 3, 2020 2,250 2,250 2.000% 2.093% February 8, 2021 500 500 4.000% 4.082% August 8, 2021 2,750 2,750 1.550% 1.642% December 6, 2021 (a) 1,994 2,044 2.125% 2.233% February 6, 2022 1,750 1,750 2.400% 2.520% February 12, 2022 1,500 1,500 2.375% 2.466% November 3, 2022 1,000 1,000 2.650% 2.717% November 15, 2022 750 750 2.125% 2.239% May 1, 2023 1,000 1,000 2.375% 2.465% August 8, 2023 1,500 1,500 2.000% 2.101% December 15, 2023 1,500 1,500 3.625% 3.726% February 6, 2024 2,250 2,250 2.875% 3.041% February 12, 2025 2,250 2,250 2.700% 2.772% November 3, 2025 3,000 3,000 3.125% 3.176% August 8, 2026 4,000 4,000 2.400% 2.464% February 6, 2027 4,000 4,000 3.300% 3.383% December 6, 2028 (a) 1,993 2,044 3.125% 3.218% May 2, 2033 (a) 626 642 2.625% 2.690% February 12, 2035 1,500 1,500 3.500% 3.604% November 3, 2035 1,000 1,000 4.200% 4.260% August 8, 2036 2,250 2,250 3.450% 3.510% February 6, 2037 2,500 2,500 4.100% 4.152% June 1, 2039 750 750 5.200% 5.240% October 1, 2040 1,000 1,000 4.500% 4.567% February 8, 2041 1,000 1,000 5.300% 5.361% November 15, 2042 900 900 3.500% 3.571% May 1, 2043 500 500 3.750% 3.829% December 15, 2043 500 500 4.875% 4.918% February 12, 2045 1,750 1,750 3.750% 3.800% November 3, 2045 3,000 3,000 4.450% 4.492% August 8, 2046 4,500 4,500 3.700% 3.743% February 6, 2047 3,000 3,000 4.250% 4.287% February 12, 2055 2,250 2,250 4.000% 4.063% November 3, 2055 1,000 1,000 4.750% 4.782% August 8, 2056 2,250 2,250 3.950% 4.033% February 6, 2057 2,000 2,000 4.500% 4.528%
Total $ 72,781 $ 76,898
(a) Euro-denominated debt securities.
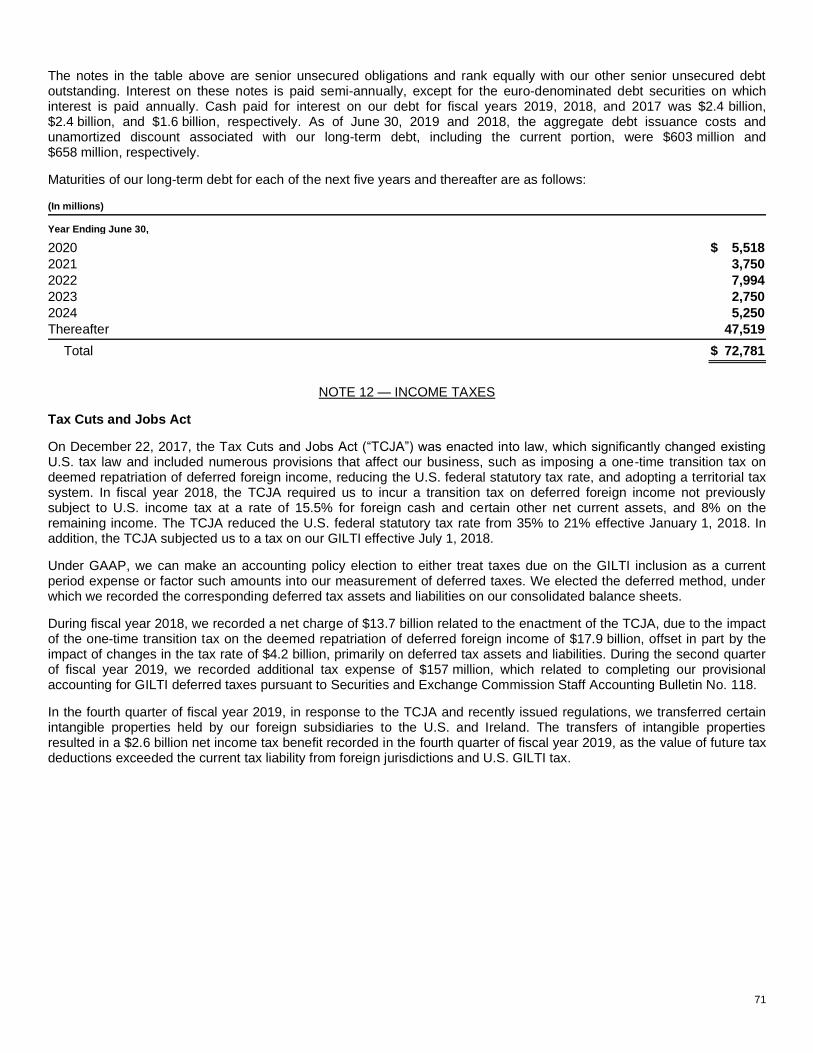
71
The notes in the table above are senior unsecured obligations and rank equally with our other senior unsecured debt outstanding. Interest on these notes is paid semi-annually, except for the euro-denominated debt securities on which interest is paid annually. Cash paid for interest on our debt for fiscal years 2019, 2018, and 2017 was $2.4 billion, $2.4 billion, and $1.6 billion, respectively. As of June 30, 2019 and 2018, the aggregate debt issuance costs and unamortized discount associated with our long-term debt, including the current portion, were $603 million and $658 million, respectively.
Maturities of our long-term debt for each of the next five years and thereafter are as follows: (In millions)
Year Ending June 30, 2020 $ 5,518 2021 3,750 2022 7,994 2023 2,750 2024 5,250 Thereafter 47,519
Total $ 72,781
NOTE 12 — INCOME TAXES
Tax Cuts and Jobs Act
On December 22, 2017, the Tax Cuts and Jobs Act (“TCJA”) was enacted into law, which significantly changed existing U.S. tax law and included numerous provisions that affect our business, such as imposing a one-time transition tax on deemed repatriation of deferred foreign income, reducing the U.S. federal statutory tax rate, and adopting a territorial tax system. In fiscal year 2018, the TCJA required us to incur a transition tax on deferred foreign income not previously subject to U.S. income tax at a rate of 15.5% for foreign cash and certain other net current assets, and 8% on the remaining income. The TCJA reduced the U.S. federal statutory tax rate from 35% to 21% effective January 1, 2018. In addition, the TCJA subjected us to a tax on our GILTI effective July 1, 2018.
Under GAAP, we can make an accounting policy election to either treat taxes due on the GILTI inclusion as a current period expense or factor such amounts into our measurement of deferred taxes. We elected the deferred method, under which we recorded the corresponding deferred tax assets and liabilities on our consolidated balance sheets.
During fiscal year 2018, we recorded a net charge of $13.7 billion related to the enactment of the TCJA, due to the impact of the one-time transition tax on the deemed repatriation of deferred foreign income of $17.9 billion, offset in part by the impact of changes in the tax rate of $4.2 billion, primarily on deferred tax assets and liabilities. During the second quarter of fiscal year 2019, we recorded additional tax expense of $157 million, which related to completing our provisional accounting for GILTI deferred taxes pursuant to Securities and Exchange Commission Staff Accounting Bulletin No. 118.
In the fourth quarter of fiscal year 2019, in response to the TCJA and recently issued regulations, we transferred certain intangible properties held by our foreign subsidiaries to the U.S. and Ireland. The transfers of intangible properties resulted in a $2.6 billion net income tax benefit recorded in the fourth quarter of fiscal year 2019, as the value of future tax deductions exceeded the current tax liability from foreign jurisdictions and U.S. GILTI tax.

72
Provision for Income Taxes
The components of the provision for income taxes were as follows: (In millions)
Year Ended June 30, 2019 2018 2017 Current Taxes
U.S. federal $ 4,718 $ 19,764 $ 2,739 U.S. state and local 662 934 30 Foreign 5,531 4,348 2,472
Current taxes $ 10,911 $ 25,046 $ 5,241 Deferred Taxes U.S. federal $ (5,647) $ (4,292) $ (554) U.S. state and local (1,010) (458) 269 Foreign 194 (393) (544)
Deferred taxes $ (6,463) $ (5,143) $ (829)
Provision for income taxes $ 4,448 $ 19,903 $ 4,412
U.S. and foreign components of income before income taxes were as follows: (In millions)
Year Ended June 30, 2019 2018 2017
U.S. $ 15,799 $ 11,527 $ 6,843 Foreign 27,889 24,947 23,058
Income before income taxes $ 43,688 $ 36,474 $ 29,901
Effective Tax Rate
The items accounting for the difference between income taxes computed at the U.S. federal statutory rate and our effective rate were as follows:
Year Ended June 30, 2019 2018 2017 Federal statutory rate 21.0% 28.1% 35.0% Effect of:
Foreign earnings taxed at lower rates (4.1)% (7.8)% (11.6)% Impact of the enactment of the TCJA 0.4% 37.7% 0% Phone business losses 0% 0% (5.7)% Impact of intangible property transfers (5.9)% 0% 0% Foreign-derived intangible income deduction (1.4)% 0% 0% Research and development credit (1.1)% (1.3)% (0.9)% Excess tax benefits relating to stock-based compensation (2.2)% (2.5)% (2.1)% Interest, net 1.0% 1.2% 1.4% Other reconciling items, net 2.5% (0.8)% (1.3)%
Effective rate 10.2% 54.6% 14.8%
The decrease from the federal statutory rate in fiscal year 2019 is primarily due to a $2.6 billion net income tax benefit related to intangible property transfers, and earnings taxed at lower rates in foreign jurisdictions resulting from producing and distributing our products and services through our foreign regional operations centers in Ireland, Singapore, and Puerto Rico. The increase from the federal statutory rate in fiscal year 2018 is primarily due to
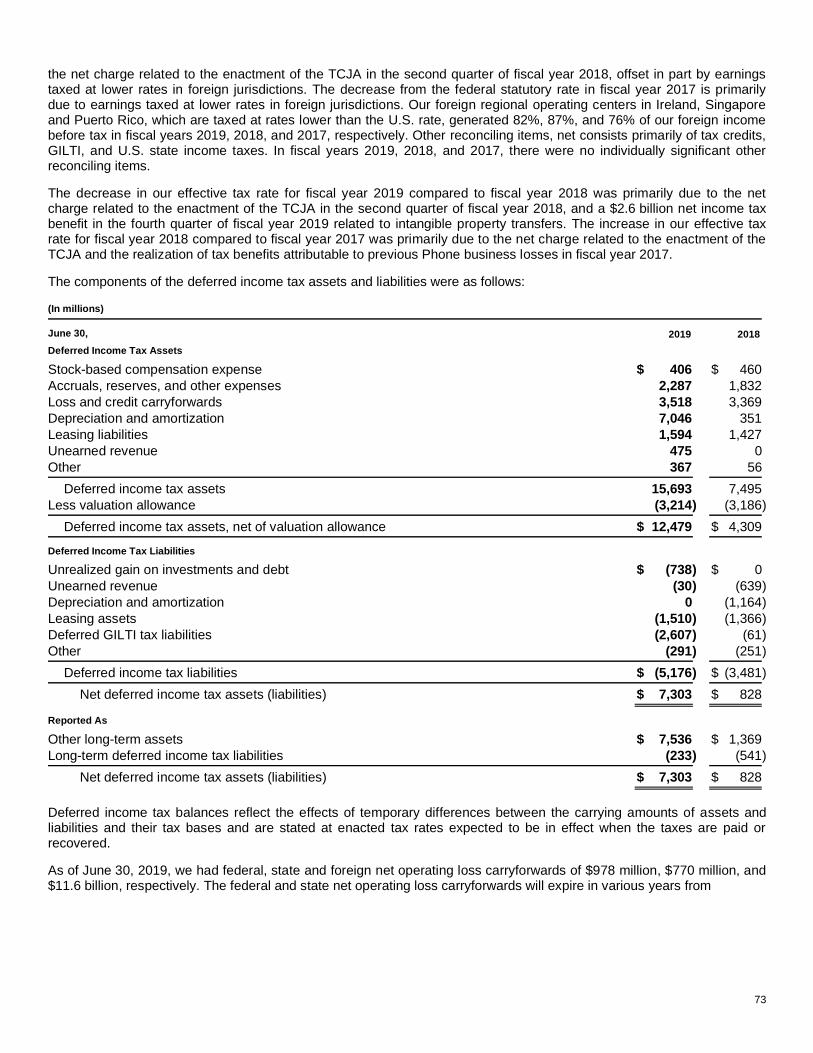
73
the net charge related to the enactment of the TCJA in the second quarter of fiscal year 2018, offset in part by earnings taxed at lower rates in foreign jurisdictions. The decrease from the federal statutory rate in fiscal year 2017 is primarily due to earnings taxed at lower rates in foreign jurisdictions. Our foreign regional operating centers in Ireland, Singapore and Puerto Rico, which are taxed at rates lower than the U.S. rate, generated 82%, 87%, and 76% of our foreign income before tax in fiscal years 2019, 2018, and 2017, respectively. Other reconciling items, net consists primarily of tax credits, GILTI, and U.S. state income taxes. In fiscal years 2019, 2018, and 2017, there were no individually significant other reconciling items.
The decrease in our effective tax rate for fiscal year 2019 compared to fiscal year 2018 was primarily due to the net charge related to the enactment of the TCJA in the second quarter of fiscal year 2018, and a $2.6 billion net income tax benefit in the fourth quarter of fiscal year 2019 related to intangible property transfers. The increase in our effective tax rate for fiscal year 2018 compared to fiscal year 2017 was primarily due to the net charge related to the enactment of the TCJA and the realization of tax benefits attributable to previous Phone business losses in fiscal year 2017.
The components of the deferred income tax assets and liabilities were as follows: (In millions)
June 30, 2019 2018 Deferred Income Tax Assets
Stock-based compensation expense $ 406 $ 460 Accruals, reserves, and other expenses 2,287 1,832 Loss and credit carryforwards 3,518 3,369 Depreciation and amortization 7,046 351 Leasing liabilities 1,594 1,427 Unearned revenue 475 0 Other 367 56
Deferred income tax assets 15,693 7,495 Less valuation allowance (3,214) (3,186)
Deferred income tax assets, net of valuation allowance $ 12,479 $ 4,309
Deferred Income Tax Liabilities Unrealized gain on investments and debt $ (738) $ 0 Unearned revenue (30) (639) Depreciation and amortization 0 (1,164) Leasing assets (1,510) (1,366) Deferred GILTI tax liabilities (2,607) (61) Other (291) (251)
Deferred income tax liabilities $ (5,176) $ (3,481)
Net deferred income tax assets (liabilities) $ 7,303 $ 828 Reported As
Other long-term assets $ 7,536 $ 1,369 Long-term deferred income tax liabilities (233) (541)
Net deferred income tax assets (liabilities) $ 7,303 $ 828
Deferred income tax balances reflect the effects of temporary differences between the carrying amounts of assets and liabilities and their tax bases and are stated at enacted tax rates expected to be in effect when the taxes are paid or recovered.
As of June 30, 2019, we had federal, state and foreign net operating loss carryforwards of $978 million, $770 million, and $11.6 billion, respectively. The federal and state net operating loss carryforwards will expire in various years from

74
fiscal 2020 through 2039, if not utilized. The majority of our foreign net operating loss carryforwards do not expire. Certain acquired net operating loss carryforwards are subject to an annual limitation, but are expected to be realized with the exception of those which have a valuation allowance.
The valuation allowance disclosed in the table above relates to the foreign net operating loss carryforwards and other net deferred tax assets that may not be realized.
Income taxes paid, net of refunds, were $8.4 billion, $5.5 billion, and $2.4 billion in fiscal years 2019, 2018, and 2017, respectively.
Uncertain Tax Positions
Gross unrecognized tax benefits related to uncertain tax positions as of June 30, 2019, 2018, and 2017, were $13.1 billion, $12.0 billion, and $11.7 billion, respectively, which were primarily included in long-term income taxes in our consolidated balance sheets. If recognized, the resulting tax benefit would affect our effective tax rates for fiscal years 2019, 2018, and 2017 by $12.0 billion, $11.3 billion, and $10.2 billion, respectively.
As of June 30, 2019, 2018, and 2017, we had accrued interest expense related to uncertain tax positions of $3.4 billion, $3.0 billion, and $2.3 billion, respectively, net of income tax benefits. The provision for (benefit from) income taxes for fiscal years 2019, 2018, and 2017 included interest expense related to uncertain tax positions of $515 million, $688 million, and $399 million, respectively, net of income tax benefits.
The aggregate changes in the gross unrecognized tax benefits related to uncertain tax positions were as follows: (In millions)
Year Ended June 30, 2019 2018 2017
Beginning unrecognized tax benefits $ 11,961 $ 11,737 $ 10,164 Decreases related to settlements (316) (193) (4) Increases for tax positions related to the current year 2,106 1,445 1,277 Increases for tax positions related to prior years 508 151 397 Decreases for tax positions related to prior years (1,113) (1,176) (49) Decreases due to lapsed statutes of limitations 0 (3) (48)
Ending unrecognized tax benefits $ 13,146 $ 11,961 $ 11,737
We settled a portion of the Internal Revenue Service (“IRS”) audit for tax years 2004 to 2006 in fiscal year 2011. In February 2012, the IRS withdrew its 2011 Revenue Agents Report related to unresolved issues for tax years 2004 to 2006 and reopened the audit phase of the examination. We also settled a portion of the IRS audit for tax years 2007 to 2009 in fiscal year 2016, and a portion of the IRS audit for tax years 2010 to 2013 in fiscal year 2018. We remain under audit for tax years 2004 to 2013. We expect the IRS to begin an examination of tax years 2014 to 2017 within the next 12 months.
As of June 30, 2019, the primary unresolved issues for the IRS audits relate to transfer pricing, which could have a material impact on our consolidated financial statements when the matters are resolved. We believe our allowances for income tax contingencies are adequate. We have not received a proposed assessment for the unresolved issues and do not expect a final resolution of these issues in the next 12 months. Based on the information currently available, we do not anticipate a significant increase or decrease to our tax contingencies for these issues within the next 12 months.
We are subject to income tax in many jurisdictions outside the U.S. Our operations in certain jurisdictions remain subject to examination for tax years 1996 to 2018, some of which are currently under audit by local tax authorities. The resolution of each of these audits is not expected to be material to our consolidated financial statements.

75
NOTE 13 — RESTRUCTURING CHARGES
In June 2017, management approved a sales and marketing restructuring plan. In fiscal year 2017, we recorded employee severance expenses of $306 million primarily related to this sales and marketing restructuring plan. The actions associated with this restructuring plan were completed as of June 30, 2018.
NOTE 14 — UNEARNED REVENUE
Unearned revenue by segment was as follows: (In millions)
June 30, 2019 2018 Productivity and Business Processes $ 16,831 $ 14,864 Intelligent Cloud 16,988 14,706 More Personal Computing 3,387 3,150
Total $ 37,206 $ 32,720
Changes in unearned revenue were as follows: (In millions)
Year Ended June 30, 2019
Balance, beginning of period $ 32,720 Deferral of revenue 69,493 Recognition of unearned revenue (65,007)
Balance, end of period $ 37,206
Revenue allocated to remaining performance obligations represents contracted revenue that has not yet been recognized (“contracted not recognized revenue”), which includes unearned revenue and amounts that will be invoiced and recognized as revenue in future periods. Contracted not recognized revenue was $91 billion as of June 30, 2019, of which we expect to recognize approximately 50% of the revenue over the next 12 months and the remainder thereafter. Many customers are committing to our products and services for longer contract terms, which is increasing the percentage of contracted revenue that will be recognized beyond the next 12 months.
NOTE 15 — LEASES
We have operating and finance leases for datacenters, corporate offices, research and development facilities, retail stores, and certain equipment. Our leases have remaining lease terms of 1 year to 20 years, some of which include options to extend the leases for up to 5 years, and some of which include options to terminate the leases within 1 year.
The components of lease expense were as follows: (In millions)
Year Ended June 30, 2019 2018 2017
Operating lease cost $ 1,707 $ 1,585 $ 1,412
Finance lease cost:
Amortization of right-of-use assets $ 370 $ 243 $ 104 Interest on lease liabilities 247 175 68
Total finance lease cost $ 617 $ 418 $ 172

76
Supplemental cash flow information related to leases was as follows: (In millions)
Year Ended June 30, 2019 2018 2017 Cash paid for amounts included in the measurement of lease liabilities:
Operating cash flows from operating leases $ 1,670 $ 1,522 $ 1,157 Operating cash flows from finance leases 247 175 68 Financing cash flows from finance leases 221 144 46
Right-of-use assets obtained in exchange for lease obligations:
Operating leases 2,303 1,571 1,270 Finance leases 2,532 1,933 1,773
Supplemental balance sheet information related to leases was as follows: (In millions, except lease term and discount rate)
June 30, 2019 2018 Operating Leases Operating lease right-of-use assets $ 7,379 $ 6,686
Other current liabilities $ 1,515 $ 1,399 Operating lease liabilities 6,188 5,568
Total operating lease liabilities $ 7,703 $ 6,967 Finance Leases
Property and equipment, at cost $ 7,041 $ 4,543 Accumulated depreciation (774) (404)
Property and equipment, net $ 6,267 $ 4,139
Other current liabilities $ 317 $ 176 Other long-term liabilities 6,257 4,125
Total finance lease liabilities $ 6,574 $ 4,301 Weighted Average Remaining Lease Term
Operating leases 7 years 7 years Finance leases 13 years 13 years
Weighted Average Discount Rate Operating leases 3.0% 2.7% Finance leases 4.6% 5.2%
Maturities of lease liabilities were as follows: (In millions)
Year Ending June 30, Operating
Leases Finance Leases
2020 $ 1,678 $ 591 2021 1,438 616 2022 1,235 626 2023 1,036 631 2024 839 641 Thereafter 2,438 5,671
Total lease payments 8,664 8,776 Less imputed interest (961) (2,202)
Total $ 7,703 $ 6,574

77
As of June 30, 2019, we have additional operating and finance leases, primarily for datacenters, that have not yet commenced of $2.3 billion and $6.1 billion, respectively. These operating and finance leases will commence between fiscal year 2020 and fiscal year 2022 with lease terms of 1 year to 15 years.
NOTE 16 — CONTINGENCIES
Patent and Intellectual Property Claims
There were 44 patent infringement cases pending against Microsoft as of June 30, 2019, none of which are material individually or in aggregate.
Antitrust, Unfair Competition, and Overcharge Class Actions
Antitrust and unfair competition class action lawsuits were filed against us in British Columbia, Ontario, and Quebec, Canada. All three have been certified on behalf of Canadian indirect purchasers who acquired licenses for Microsoft operating system software and/or productivity application software between 1998 and 2010.
The trial of the British Columbia action commenced in May 2016. Following a mediation, the parties agreed to a global settlement of all three Canadian actions, and submitted the proposed settlement agreement to the courts in all three jurisdictions for approval. The final settlement has been approved by the courts in British Columbia, Ontario, and Quebec, and the claims administration process will commence.
Other Antitrust Litigation and Claims
China State Administration for Industry and Commerce Investigation
In 2014, Microsoft was informed that China’s State Agency for Market Regulation (“SAMR”) (formerly State Administration for Industry and Commerce) had begun a formal investigation relating to China’s Anti-Monopoly Law, and the SAMR conducted onsite inspections of Microsoft offices in Beijing, Shanghai, Guangzhou, and Chengdu. The SAMR has presented its preliminary views as to certain possible violations of China’s Anti-Monopoly Law, and discussions are expected to continue.
Product-Related Litigation
U.S. Cell Phone Litigation
Microsoft Mobile Oy, a subsidiary of Microsoft, along with other handset manufacturers and network operators, is a defendant in 40 lawsuits filed in the Superior Court for the District of Columbia by individual plaintiffs who allege that radio emissions from cellular handsets caused their brain tumors and other adverse health effects. We assumed responsibility for these claims in our agreement to acquire Nokia’s Devices and Services business and have been substituted for the Nokia defendants. Nine of these cases were filed in 2002 and are consolidated for certain pre-trial proceedings; the remaining cases are stayed. In a separate 2009 decision, the Court of Appeals for the District of Columbia held that adverse health effect claims arising from the use of cellular handsets that operate within the U.S. Federal Communications Commission radio frequency emission guidelines (“FCC Guidelines”) are pre-empted by federal law. The plaintiffs allege that their handsets either operated outside the FCC Guidelines or were manufactured before the FCC Guidelines went into effect. The lawsuits also allege an industry-wide conspiracy to manipulate the science and testing around emission guidelines.
In 2013, the defendants in the consolidated cases moved to exclude the plaintiffs’ expert evidence of general causation on the basis of flawed scientific methodologies. In 2014, the trial court granted in part and denied in part the defendants’ motion to exclude the plaintiffs’ general causation experts. The defendants filed an interlocutory appeal to the District of Columbia Court of Appeals challenging the standard for evaluating expert scientific evidence. In October 2016, the Court of Appeals issued its decision adopting the standard advocated by the defendants and remanding the cases to the trial court for further proceedings under that standard. The plaintiffs have filed supplemental expert evidence, portions of which the defendants have moved to strike. In August 2018, the trial court issued an order striking portions of the plaintiffs’ expert reports. A hearing is expected to be scheduled in the second half of calendar year 2019.
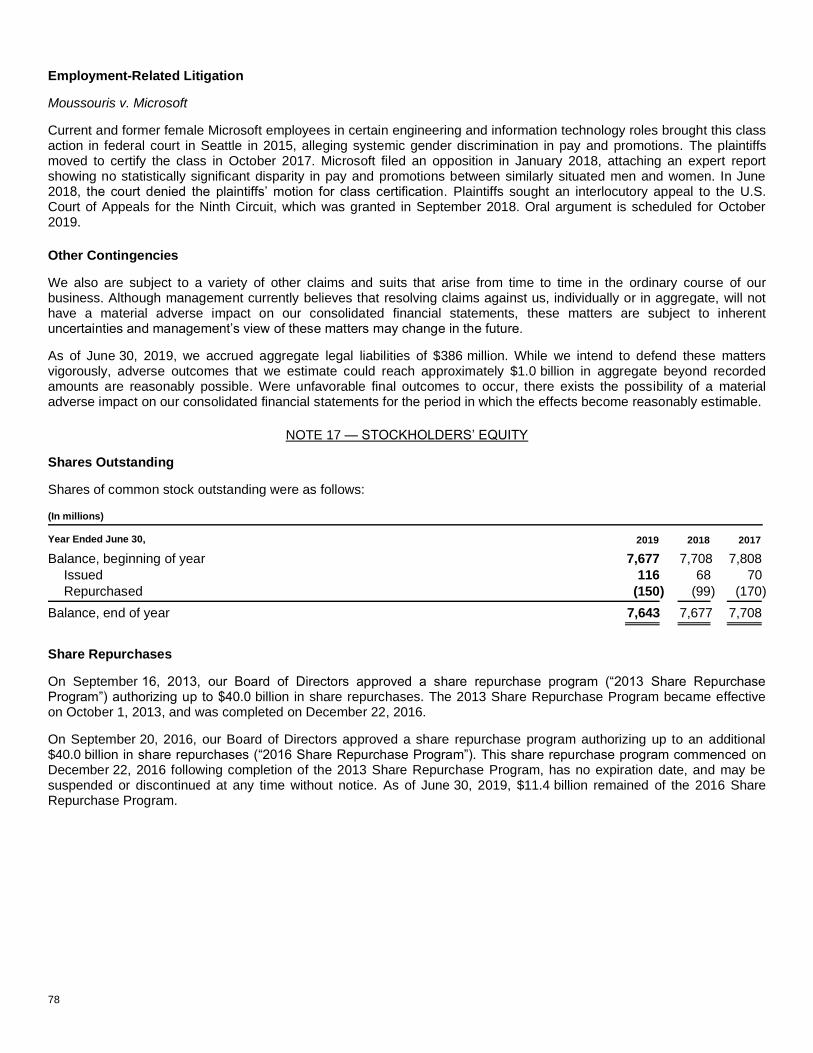
78
Employment-Related Litigation
Moussouris v. Microsoft
Current and former female Microsoft employees in certain engineering and information technology roles brought this class action in federal court in Seattle in 2015, alleging systemic gender discrimination in pay and promotions. The plaintiffs moved to certify the class in October 2017. Microsoft filed an opposition in January 2018, attaching an expert report showing no statistically significant disparity in pay and promotions between similarly situated men and women. In June 2018, the court denied the plaintiffs’ motion for class certification. Plaintiffs sought an interlocutory appeal to the U.S. Court of Appeals for the Ninth Circuit, which was granted in September 2018. Oral argument is scheduled for October 2019.
Other Contingencies
We also are subject to a variety of other claims and suits that arise from time to time in the ordinary course of our business. Although management currently believes that resolving claims against us, individually or in aggregate, will not have a material adverse impact on our consolidated financial statements, these matters are subject to inherent uncertainties and management’s view of these matters may change in the future.
As of June 30, 2019, we accrued aggregate legal liabilities of $386 million. While we intend to defend these matters vigorously, adverse outcomes that we estimate could reach approximately $1.0 billion in aggregate beyond recorded amounts are reasonably possible. Were unfavorable final outcomes to occur, there exists the possibility of a material adverse impact on our consolidated financial statements for the period in which the effects become reasonably estimable.
NOTE 17 — STOCKHOLDERS’ EQUITY
Shares Outstanding
Shares of common stock outstanding were as follows: (In millions)
Year Ended June 30, 2019 2018 2017 Balance, beginning of year 7,677 7,708 7,808
Issued 116 68 70 Repurchased (150) (99) (170)
Balance, end of year 7,643 7,677 7,708
Share Repurchases
On September 16, 2013, our Board of Directors approved a share repurchase program (“2013 Share Repurchase Program”) authorizing up to $40.0 billion in share repurchases. The 2013 Share Repurchase Program became effective on October 1, 2013, and was completed on December 22, 2016.
On September 20, 2016, our Board of Directors approved a share repurchase program authorizing up to an additional $40.0 billion in share repurchases (“2016 Share Repurchase Program”). This share repurchase program commenced on December 22, 2016 following completion of the 2013 Share Repurchase Program, has no expiration date, and may be suspended or discontinued at any time without notice. As of June 30, 2019, $11.4 billion remained of the 2016 Share Repurchase Program.

79
We repurchased the following shares of common stock under the share repurchase programs: (In millions) Shares Amount Shares Amount Shares Amount
Year Ended June 30, 2019 2018 2017
First Quarter 24 $ 2,600 22 $ 1,600 63 $ 3,550 Second Quarter 57 6,100 22 1,800 59 3,533 Third Quarter 36 3,899 34 3,100 25 1,600 Fourth Quarter 33 4,200 21 2,100 23 1,600
Total 150 $ 16,799 99 $ 8,600 170 $ 10,283
Shares repurchased in the first and second quarter of fiscal year 2017 were under the 2013 Share Repurchase Program. All other shares repurchased were under the 2016 Share Repurchase Program. The above table excludes shares repurchased to settle employee tax withholding related to the vesting of stock awards of $2.7 billion, $2.1 billion, and $1.5 billion for fiscal years 2019, 2018, and 2017, respectively. All share repurchases were made using cash resources.
Dividends
Our Board of Directors declared the following dividends:
Declaration Date Record Date Payment Date
Dividend Per Share Amount
Fiscal Year 2019 (In millions)
September 18, 2018 November 15, 2018 December 13, 2018 $ 0.46 $ 3,544
November 28, 2018 February 21, 2019 March 14, 2019 0.46 3,526
March 11, 2019 May 16, 2019 June 13, 2019 0.46 3,521
June 12, 2019 August 15, 2019 September 12, 2019 0.46 3,516
Total $ 1.84 $ 14,107
Fiscal Year 2018
September 19, 2017
November 16, 2017 December 14, 2017 $ 0.42 $ 3,238 November 29, 2017
February 15, 2018 March 8, 2018 0.42 3,232 March 12, 2018
May 17, 2018 June 14, 2018 0.42 3,226 June 13, 2018
August 16, 2018 September 13, 2018 0.42 3,220
Total
$ 1.68 $ 12,916
The dividend declared on June 12, 2019 was included in other current liabilities as of June 30, 2019.

80
NOTE 18 — ACCUMULATED OTHER COMPREHENSIVE INCOME (LOSS)
The following table summarizes the changes in accumulated other comprehensive income (loss) by component: (In millions)
Year Ended June 30, 2019 2018 2017 Derivatives
Balance, beginning of period $ 173 $ 134 $ 352 Unrealized gains, net of tax of $2, $11, and $4 160 218 328 Reclassification adjustments for gains included in revenue (341) (185) (555) Tax expense included in provision for income taxes 8 6 9
Amounts reclassified from accumulated other comprehensive income (loss) (333) (179) (546)
Net change related to derivatives, net of tax of $(6), $5, and $(5) (173) 39 (218)
Balance, end of period $ 0 $ 173 $ 134
Investments Balance, beginning of period $ (850) $ 1,825 $ 2,941 Unrealized gains (losses), net of tax of $616, $(427), and $267 2,331 (1,146) 517 Reclassification adjustments for (gains) losses included in other income (expense),
net 93 (2,309) (2,513) Tax expense (benefit) included in provision for income taxes (19) 738 880
Amounts reclassified from accumulated other comprehensive income (loss) 74 (1,571) (1,633)
Net change related to investments, net of tax of $635, $(1,165), and $(613) 2,405 (2,717) (1,116) Cumulative effect of accounting changes (67) 42 0
Balance, end of period $ 1,488 $ (850) $ 1,825
Translation Adjustments and Other
Balance, beginning of period $ (1,510) $ (1,332) $ (1,499) Translation adjustments and other, net of tax effects of $(1), $0, and $9 (318) (178) 167
Balance, end of period $ (1,828) $ (1,510) $ (1,332)
Accumulated other comprehensive income (loss), end of period $ (340) $ (2,187) $ 627
NOTE 19 — EMPLOYEE STOCK AND SAVINGS PLANS
We grant stock-based compensation to employees and directors. As of June 30, 2019, an aggregate of 327 million shares were authorized for future grant under our stock plans. Awards that expire or are canceled without delivery of shares generally become available for issuance under the plans. We issue new shares of Microsoft common stock to satisfy vesting of awards granted under our stock plans. We also have an ESPP for all eligible employees.
Stock-based compensation expense and related income tax benefits were as follows: (In millions)
Year Ended June 30, 2019 2018 2017
Stock-based compensation expense $ 4,652 $ 3,940 $ 3,266 Income tax benefits related to stock-based compensation 816 823 1,066
Stock Plans
Stock awards entitle the holder to receive shares of Microsoft common stock as the award vests. Stock awards generally vest over a four or five-year service period.

81
Executive Incentive Plan
Under the Executive Incentive Plan, the Compensation Committee approves stock awards to executive officers and certain senior executives. RSUs generally vest ratably over a four-year service period. PSUs generally vest over a three-year performance period. The number of shares the PSU holder receives is based on the extent to which the corresponding performance goals have been achieved.
Activity for All Stock Plans
The fair value of stock awards was estimated on the date of grant using the following assumptions:
Year Ended June 30, 2019 2018 2017
Dividends per share (quarterly amounts) $ 0.42 - $ 0.46 $ 0.39 - $ 0.42 $ 0.36 - $ 0.39 Interest rates 1.8% - 3.1% 1.7% - 2.9% 1.2% - 2.2%
During fiscal year 2019, the following activity occurred under our stock plans:
Shares
Weighted Average
Grant-Date Fair Value
(In millions)
Stock Awards Nonvested balance, beginning of year 174 $ 57.85
Granted (a) 63 107.02 Vested (77) 57.08 Forfeited (13) 69.35
Nonvested balance, end of year 147 $ 78.49
(a) Includes 2 million, 3 million, and 2 million of PSUs granted at target and performance adjustments above target levels for fiscal years 2019, 2018, and 2017, respectively.
As of June 30, 2019, there was approximately $8.6 billion of total unrecognized compensation costs related to stock awards. These costs are expected to be recognized over a weighted average period of 3 years. The weighted average grant-date fair value of stock awards granted was $107.02, $75.88, and $55.64 for fiscal years 2019, 2018, and 2017, respectively. The fair value of stock awards vested was $8.7 billion, $6.6 billion, and $4.8 billion, for fiscal years 2019, 2018, and 2017, respectively.
Employee Stock Purchase Plan
We have an ESPP for all eligible employees. Shares of our common stock may be purchased by employees at three-month intervals at 90% of the fair market value on the last trading day of each three-month period. Employees may purchase shares having a value not exceeding 15% of their gross compensation during an offering period. Employees purchased the following shares during the periods presented: (Shares in millions)
Year Ended June 30, 2019 2018 2017 Shares purchased 11 13 13 Average price per share $ 104.85 $ 76.40 $ 56.36
As of June 30, 2019, 105 million shares of our common stock were reserved for future issuance through the ESPP.

82
Savings Plan
We have savings plans in the U.S. that qualify under Section 401(k) of the Internal Revenue Code, and a number of savings plans in international locations. Eligible U.S. employees may contribute a portion of their salary into the savings plans, subject to certain limitations. We contribute fifty cents for each dollar a participant contributes into the plans, with a maximum employer contribution of 50% of the IRS contribution limit for the calendar year. Employer-funded retirement benefits for all plans were $877 million, $807 million, and $734 million in fiscal years 2019, 2018, and 2017, respectively, and were expensed as contributed.
NOTE 20 — SEGMENT INFORMATION AND GEOGRAPHIC DATA
In its operation of the business, management, including our chief operating decision maker, who is also our Chief Executive Officer, reviews certain financial information, including segmented internal profit and loss statements prepared on a basis not consistent with GAAP. During the periods presented, we reported our financial performance based on the following segments: Productivity and Business Processes, Intelligent Cloud, and More Personal Computing.
Our reportable segments are described below.
Productivity and Business Processes
Our Productivity and Business Processes segment consists of products and services in our portfolio of productivity, communication, and information services, spanning a variety of devices and platforms. This segment primarily comprises:
• Office Commercial, including Office 365 subscriptions and Office licensed on-premises, comprising Office, Exchange, SharePoint, Microsoft Teams, Office 365 Security and Compliance, and Skype for Business, and related Client Access Licenses (“CALs”).
• Office Consumer, including Office 365 subscriptions and Office licensed on-premises, and Office Consumer Services, including Skype, Outlook.com, and OneDrive.
• LinkedIn, including Talent Solutions, Marketing Solutions, and Premium Subscriptions.
• Dynamics business solutions, including Dynamics 365, a set of cloud-based applications across ERP and CRM, Dynamics ERP on-premises, and Dynamics CRM on-premises.
Intelligent Cloud
Our Intelligent Cloud segment consists of our public, private, and hybrid server products and cloud services that can power modern business. This segment primarily comprises:
• Server products and cloud services, including Microsoft SQL Server, Windows Server, Visual Studio, System Center, and related CALs, GitHub, and Azure.
• Enterprise Services, including Premier Support Services and Microsoft Consulting Services.
More Personal Computing
Our More Personal Computing segment consists of products and services geared towards harmonizing the interests of end users, developers, and IT professionals across all devices. This segment primarily comprises:
• Windows, including Windows OEM licensing and other non-volume licensing of the Windows operating system; Windows Commercial, comprising volume licensing of the Windows operating system, Windows cloud services, and other Windows commercial offerings; patent licensing; Windows Internet of Things (“IoT”); and MSN advertising.
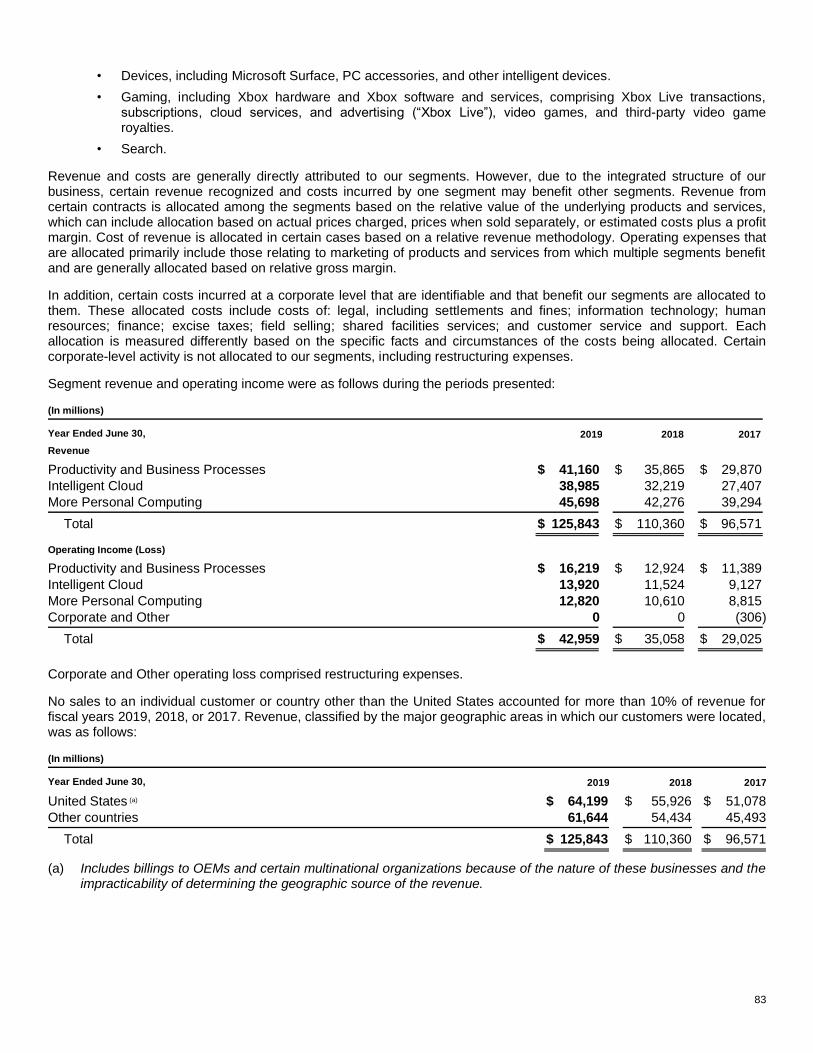
83
• Devices, including Microsoft Surface, PC accessories, and other intelligent devices.
• Gaming, including Xbox hardware and Xbox software and services, comprising Xbox Live transactions, subscriptions, cloud services, and advertising (“Xbox Live”), video games, and third-party video game royalties.
• Search.
Revenue and costs are generally directly attributed to our segments. However, due to the integrated structure of our business, certain revenue recognized and costs incurred by one segment may benefit other segments. Revenue from certain contracts is allocated among the segments based on the relative value of the underlying products and services, which can include allocation based on actual prices charged, prices when sold separately, or estimated costs plus a profit margin. Cost of revenue is allocated in certain cases based on a relative revenue methodology. Operating expenses that are allocated primarily include those relating to marketing of products and services from which multiple segments benefit and are generally allocated based on relative gross margin.
In addition, certain costs incurred at a corporate level that are identifiable and that benefit our segments are allocated to them. These allocated costs include costs of: legal, including settlements and fines; information technology; human resources; finance; excise taxes; field selling; shared facilities services; and customer service and support. Each allocation is measured differently based on the specific facts and circumstances of the costs being allocated. Certain corporate-level activity is not allocated to our segments, including restructuring expenses.
Segment revenue and operating income were as follows during the periods presented: (In millions)
Year Ended June 30, 2019 2018 2017 Revenue
Productivity and Business Processes $ 41,160 $ 35,865 $ 29,870 Intelligent Cloud 38,985 32,219 27,407 More Personal Computing 45,698 42,276 39,294
Total $ 125,843 $ 110,360 $ 96,571 Operating Income (Loss) Productivity and Business Processes $ 16,219 $ 12,924 $ 11,389 Intelligent Cloud 13,920 11,524 9,127 More Personal Computing 12,820 10,610 8,815 Corporate and Other 0 0 (306)
Total $ 42,959 $ 35,058 $ 29,025
Corporate and Other operating loss comprised restructuring expenses.
No sales to an individual customer or country other than the United States accounted for more than 10% of revenue for fiscal years 2019, 2018, or 2017. Revenue, classified by the major geographic areas in which our customers were located, was as follows: (In millions)
Year Ended June 30, 2019 2018 2017 United States (a) $ 64,199 $ 55,926 $ 51,078 Other countries 61,644 54,434 45,493
Total $ 125,843 $ 110,360 $ 96,571
(a) Includes billings to OEMs and certain multinational organizations because of the nature of these businesses and the impracticability of determining the geographic source of the revenue.

84
Revenue from external customers, classified by significant product and service offerings, was as follows: (In millions)
Year Ended June 30, 2019 2018 2017 Server products and cloud services $ 32,622 $ 26,129 $ 21,649 Office products and cloud services 31,769 28,316 25,573 Windows 20,395 19,518 18,593 Gaming 11,386 10,353 9,051 Search advertising 7,628 7,012 6,219 LinkedIn 6,754 5,259 2,271 Enterprise Services 6,124 5,846 5,542 Devices 6,095 5,134 5,062 Other 3,070 2,793 2,611
Total $ 125,843 $ 110,360 $ 96,571
Our commercial cloud revenue, which includes Office 365 Commercial, Azure, the commercial portion of LinkedIn, Dynamics 365, and other commercial cloud properties, was $38.1 billion, $26.6 billion and $16.2 billion in fiscal years 2019, 2018, and 2017, respectively. These amounts are primarily included in Office products and cloud services, Server products and cloud services, and LinkedIn in the table above.
Assets are not allocated to segments for internal reporting presentations. A portion of amortization and depreciation is included with various other costs in an overhead allocation to each segment; it is impracticable for us to separately identify the amount of amortization and depreciation by segment that is included in the measure of segment profit or loss.
Long-lived assets, excluding financial instruments and tax assets, classified by the location of the controlling statutory company and with countries over 10% of the total shown separately, were as follows: (In millions)
June 30, 2019 2018 2017 United States $ 55,252 $ 44,501 $ 42,730 Ireland 12,958 12,843 12,889 Other countries 25,422 22,538 19,898
Total $ 93,632 $ 79,882 $ 75,517
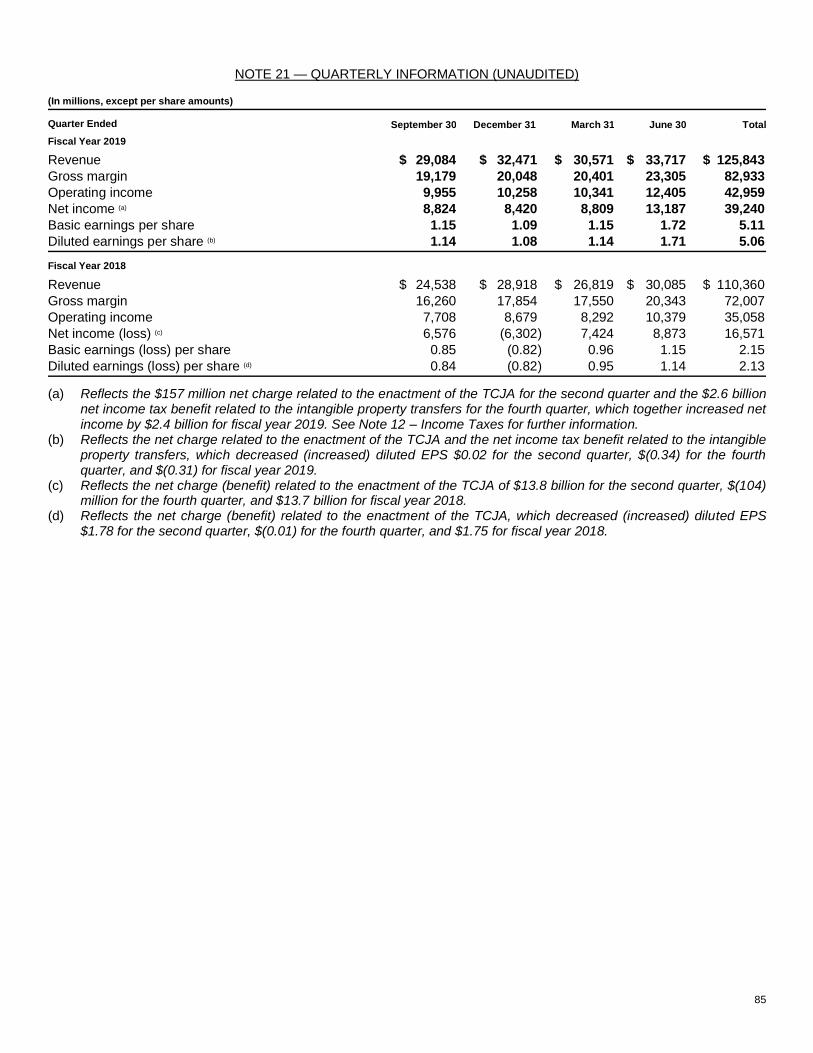
85
NOTE 21 — QUARTERLY INFORMATION (UNAUDITED) (In millions, except per share amounts)
Quarter Ended September 30 December 31 March 31 June 30 Total Fiscal Year 2019 Revenue $ 29,084 $ 32,471 $ 30,571 $ 33,717 $ 125,843 Gross margin 19,179 20,048 20,401 23,305 82,933 Operating income 9,955 10,258 10,341 12,405 42,959 Net income (a) 8,824 8,420 8,809 13,187 39,240 Basic earnings per share 1.15 1.09 1.15 1.72 5.11 Diluted earnings per share (b) 1.14 1.08 1.14 1.71 5.06
Fiscal Year 2018
Revenue $ 24,538 $ 28,918 $ 26,819 $ 30,085 $ 110,360 Gross margin 16,260 17,854 17,550 20,343 72,007 Operating income 7,708 8,679 8,292 10,379 35,058 Net income (loss) (c) 6,576 (6,302) 7,424 8,873 16,571 Basic earnings (loss) per share 0.85 (0.82) 0.96 1.15 2.15 Diluted earnings (loss) per share (d) 0.84 (0.82) 0.95 1.14 2.13
(a) Reflects the $157 million net charge related to the enactment of the TCJA for the second quarter and the $2.6 billion net income tax benefit related to the intangible property transfers for the fourth quarter, which together increased net income by $2.4 billion for fiscal year 2019. See Note 12 – Income Taxes for further information.
(b) Reflects the net charge related to the enactment of the TCJA and the net income tax benefit related to the intangible property transfers, which decreased (increased) diluted EPS $0.02 for the second quarter, $(0.34) for the fourth quarter, and $(0.31) for fiscal year 2019.
(c) Reflects the net charge (benefit) related to the enactment of the TCJA of $13.8 billion for the second quarter, $(104) million for the fourth quarter, and $13.7 billion for fiscal year 2018.
(d) Reflects the net charge (benefit) related to the enactment of the TCJA, which decreased (increased) diluted EPS $1.78 for the second quarter, $(0.01) for the fourth quarter, and $1.75 for fiscal year 2018.
86
REPORT OF INDEPENDENT REGISTERED PUBLIC ACCOUNTING FIRM
To the Stockholders and the Board of Directors of Microsoft Corporation
Opinion on the Financial Statements
We have audited the accompanying consolidated balance sheets of Microsoft Corporation and subsidiaries (the “Company”) as of June 30, 2019 and 2018, the related consolidated statements of income, comprehensive income, stockholders’ equity, and cash flows, for each of the three years in the period ended June 30, 2019, and the related notes (collectively referred to as the “financial statements”). In our opinion, the financial statements present fairly, in all material respects, the financial position of the Company as of June 30, 2019 and 2018, and the results of its operations and its cash flows for each of the three years in the period ended June 30, 2019, in conformity with accounting principles generally accepted in the United States of America.
We have also audited, in accordance with the standards of the Public Company Accounting Oversight Board (United States) (“PCAOB”), the Company’s internal control over financial reporting as of June 30, 2019, based on criteria established in Internal Control – Integrated Framework (2013) issued by the Committee of Sponsoring Organizations of the Treadway Commission and our report dated August 1, 2019, expressed an unqualified opinion on the Company’s internal control over financial reporting.
Basis for Opinion
These financial statements are the responsibility of the Company’s management. Our responsibility is to express an opinion on the Company’s financial statements based on our audits. We are a public accounting firm registered with the PCAOB and are required to be independent with respect to the Company in accordance with the U.S. federal securities laws and the applicable rules and regulations of the Securities and Exchange Commission and the PCAOB.
We conducted our audits in accordance with the standards of the PCAOB. Those standards require that we plan and perform the audit to obtain reasonable assurance about whether the financial statements are free of material misstatement, whether due to error or fraud. Our audits included performing procedures to assess the risks of material misstatement of the financial statements, whether due to error or fraud, and performing procedures that respond to those risks. Such procedures included examining, on a test basis, evidence regarding the amounts and disclosures in the financial statements. Our audits also included evaluating the accounting principles used and significant estimates made by management, as well as evaluating the overall presentation of the financial statements. We believe that our audits provide a reasonable basis for our opinion.
Critical Audit Matters
The critical audit matters communicated below are matters arising from the current-period audit of the financial statements that were communicated or required to be communicated to the Company’s Audit Committee and that: (1) relate to accounts or disclosures that are material to the financial statements and (2) involved our especially challenging, subjective, or complex judgments. The communication of critical audit matters does not alter in any way our opinion on the financial statements, taken as a whole, and we are not, by communicating the critical audit matters below, providing separate opinions on the critical audit matters or on the accounts or disclosures to which they relate.
87
Revenue Recognition — Refer to Note 1 to the Financial Statements
Critical Audit Matter Description
The Company recognizes revenue upon transfer of control of promised products or services to customers in an amount that reflects the consideration the Company expects to receive in exchange for those products or services. The Company offers customers the ability to acquire multiple licenses of software products and services, including cloud-based services, in its customer agreements through its volume licensing programs.
Significant judgment is exercised by the Company in determining revenue recognition for these customer agreements, and includes the following:
• Determination of whether products and services are considered distinct performance obligations that should be accounted for separately versus together, such as software licenses and related services that are sold with cloud-based services.
• Determination of stand-alone selling prices for each distinct performance obligation and for products and services that are not sold separately.
• The pattern of delivery (i.e., timing of when revenue is recognized) for each distinct performance obligation.
• Estimation of variable consideration when determining the amount of revenue to recognize (e.g., customer credits, incentives, and in certain instances, estimation of customer usage of products and services).
Given these factors, the related audit effort in evaluating management’s judgments in determining revenue recognition for these customer agreements was extensive and required a high degree of auditor judgment.
How the Critical Audit Matter Was Addressed in the Audit
Our principal audit procedures related to the Company’s revenue recognition for these customer agreements included the following:
• We tested the effectiveness of internal controls related to the identification of distinct performance obligations, the determination of the timing of revenue recognition, and the estimation of variable consideration.
• We evaluated management’s significant accounting policies related to these customer agreements for reasonableness.
• We selected a sample of customer agreements and performed the following procedures:
• Obtained and read contract source documents for each selection, including master agreements, and other documents that were part of the agreement.
• Tested management’s identification of significant terms for completeness, including the identification of distinct performance obligations and variable consideration.
• Assessed the terms in the customer agreement and evaluated the appropriateness of management’s application of their accounting policies, along with their use of estimates, in the determination of revenue recognition conclusions.
• We evaluated the reasonableness of management’s estimate of stand-alone selling prices for products and services that are not sold separately.
• We tested the mathematical accuracy of management’s calculations of revenue and the associated timing of revenue recognized in the financial statements.

88
Income Taxes — Uncertain Tax Positions — Refer to Note 12 to the Financial Statements
Critical Audit Matter Description
The Company’s long-term income taxes liability includes uncertain tax positions related to transfer pricing issues that remain unresolved with the Internal Revenue Service (“IRS”). The Company remains under IRS audit, or subject to IRS audit, for tax years subsequent to 2003. While the Company has settled a portion of the IRS audits, resolution of the remaining matters could have a material impact on the Company’s financial statements.
Conclusions on recognizing and measuring uncertain tax positions involve significant estimates and management judgment and include complex considerations of the Internal Revenue Code, related regulations, tax case laws, and prior-year audit settlements. Given the complexity and the subjective nature of the transfer pricing issues that remain unresolved with the IRS, evaluating management’s estimates relating to their determination of uncertain tax positions required extensive audit effort and a high degree of auditor judgment, including involvement of our tax specialists.
How the Critical Audit Matter Was Addressed in the Audit
Our principal audit procedures to evaluate management’s estimates of uncertain tax positions related to unresolved transfer pricing issues included the following:
• We evaluated the appropriateness and consistency of management’s methods and assumptions used in the identification, recognition, measurement, and disclosure of uncertain tax positions, which included testing the effectiveness of the related internal controls.
• We read and evaluated management’s documentation, including relevant accounting policies and information obtained by management from outside tax specialists, that detailed the basis of the uncertain tax positions.
• We tested the reasonableness of management’s judgments regarding the future resolution of the uncertain tax positions, including an evaluation of the technical merits of the uncertain tax positions.
• For those uncertain tax positions that had not been effectively settled, we evaluated whether management had appropriately considered new information that could significantly change the recognition, measurement or disclosure of the uncertain tax positions.
• We evaluated the reasonableness of management’s estimates by considering how tax law, including statutes, regulations and case law, impacted management’s judgments.
/s/ DELOITTE & TOUCHE LLP
Seattle, Washington August 1, 2019
We have served as the Company’s auditor since 1983.

89
CHANGES IN AND DISAGREEMENTS WITH ACCOUNTANTS ON ACCOUNTING AND FINANCIAL DISCLOSURE
Not applicable.
CONTROLS AND PROCEDURES
Under the supervision and with the participation of our management, including the Chief Executive Officer and Chief Financial Officer, we have evaluated the effectiveness of our disclosure controls and procedures as required by Exchange Act Rule 13a-15(b) as of the end of the period covered by this report. Based on that evaluation, the Chief Executive Officer and Chief Financial Officer have concluded that these disclosure controls and procedures are effective.
REPORT OF MANAGEMENT ON INTERNAL CONTROL OVER FINANCIAL REPORTING
Our management is responsible for establishing and maintaining adequate internal control over financial reporting for the Company. Internal control over financial reporting is a process to provide reasonable assurance regarding the reliability of our financial reporting for external purposes in accordance with accounting principles generally accepted in the United States of America. Internal control over financial reporting includes maintaining records that in reasonable detail accurately and fairly reflect our transactions; providing reasonable assurance that transactions are recorded as necessary for preparation of our consolidated financial statements; providing reasonable assurance that receipts and expenditures of company assets are made in accordance with management authorization; and providing reasonable assurance that unauthorized acquisition, use, or disposition of company assets that could have a material effect on our consolidated financial statements would be prevented or detected on a timely basis. Because of its inherent limitations, internal control over financial reporting is not intended to provide absolute assurance that a misstatement of our consolidated financial statements would be prevented or detected.
Management conducted an evaluation of the effectiveness of our internal control over financial reporting based on the framework in Internal Control – Integrated Framework (2013) issued by the Committee of Sponsoring Organizations of the Treadway Commission. Based on this evaluation, management concluded that the Company’s internal control over financial reporting was effective as of June 30, 2019. There were no changes in our internal control over financial reporting during the quarter ended June 30, 2019 that have materially affected, or are reasonably likely to materially affect, our internal control over financial reporting. Deloitte & Touche LLP has audited our internal control over financial reporting as of June 30, 2019; their report follows.
90
REPORT OF INDEPENDENT REGISTERED PUBLIC ACCOUNTING FIRM
To the Stockholders and the Board of Directors of Microsoft Corporation
Opinion on Internal Control over Financial Reporting
We have audited the internal control over financial reporting of Microsoft Corporation and subsidiaries (the “Company”) as of June 30, 2019, based on criteria established in Internal Control – Integrated Framework (2013) issued by the Committee of Sponsoring Organizations of the Treadway Commission (“COSO”). In our opinion, the Company maintained, in all material respects, effective internal control over financial reporting as of June 30, 2019, based on the criteria established in Internal Control – Integrated Framework (2013) issued by COSO.
We have also audited, in accordance with the standards of the Public Company Accounting Oversight Board (United States) (“PCAOB”), the consolidated financial statements and the related notes (collectively referred to as the “financial statements”) as of and for the year ended June 30, 2019, of the Company and our report dated August 1, 2019, expressed an unqualified opinion on those financial statements.
Basis for Opinion
The Company’s management is responsible for maintaining effective internal control over financial reporting and for its assessment of the effectiveness of internal control over financial reporting, included in the accompanying Report of Management on Internal Control over Financial Reporting. Our responsibility is to express an opinion on the Company’s internal control over financial reporting based on our audit. We are a public accounting firm registered with the PCAOB and are required to be independent with respect to the Company in accordance with the U.S. federal securities laws and the applicable rules and regulations of the Securities and Exchange Commission and the PCAOB.
We conducted our audit in accordance with the standards of the PCAOB. Those standards require that we plan and perform the audit to obtain reasonable assurance about whether effective internal control over financial reporting was maintained in all material respects. Our audit included obtaining an understanding of internal control over financial reporting, assessing the risk that a material weakness exists, testing and evaluating the design and operating effectiveness of internal control based on the assessed risk, and performing such other procedures as we considered necessary in the circumstances. We believe that our audit provides a reasonable basis for our opinion.
Definition and Limitations of Internal Control over Financial Reporting
A company’s internal control over financial reporting is a process designed to provide reasonable assurance regarding the reliability of financial reporting and the preparation of financial statements for external purposes in accordance with generally accepted accounting principles. A company’s internal control over financial reporting includes those policies and procedures that (1) pertain to the maintenance of records that, in reasonable detail, accurately and fairly reflect the transactions and dispositions of the assets of the company; (2) provide reasonable assurance that transactions are recorded as necessary to permit preparation of financial statements in accordance with generally accepted accounting principles, and that receipts and expenditures of the company are being made only in accordance with authorizations of management and directors of the company; and (3) provide reasonable assurance regarding prevention or timely detection of unauthorized acquisition, use, or disposition of the company’s assets that could have a material effect on the financial statements.
Because of its inherent limitations, internal control over financial reporting may not prevent or detect misstatements. Also, projections of any evaluation of effectiveness to future periods are subject to the risk that controls may become inadequate because of changes in conditions, or that the degree of compliance with the policies or procedures may deteriorate.
/s/ DELOITTE & TOUCHE LLP
Seattle, Washington August 1, 2019

91
DIRECTORS AND EXECUTIVE OFFICERS OF MICROSOFT CORPORATION
DIRECTORS
John W. Thompson 3,4 Independent Board Chair, Microsoft Corporation
Satya Nadella Chief Executive Officer, Microsoft Corporation
Charles W. Scharf 2,3 Former Chairman and Chief Executive Officer, The Bank of New York Mellon Corporation*
William H. Gates III Co-Chair and Trustee, Bill & Melinda Gates Foundation
Charles H. Noski 1,3 Former Vice Chairman, Bank of America Corporation
Arne M. Sorenson 1 President and Chief Executive Officer, Marriott International, Inc.
Reid G. Hoffman Partner, Greylock Partners
Helmut G. W. Panke 1,4 Former Chairman of the Board of Management, BMW AG
John W. Stanton 2,4 Chairman, Trilogy Partnerships
Hugh F. Johnston 1 Vice Chairman and Chief Financial Officer, PepsiCo
Sandra E. Peterson 2,4 Operating Partner, Clayton, Dubilier & Rice
Padmasree Warrior 2 Founder, President and Chief Executive Officer, Fable Group, Inc.
Teri L. List-Stoll 1, 3 Executive Vice President and Chief Financial Officer, Gap, Inc.
Penny S. Pritzker 4 Founder and Chairman, PSP Partners
* Wells Fargo & Company has announced that effective October 21, 2019, Mr. Scharf will become its Chief Executive Officer and President, and a member of the Board of Directors.
Board Committees 1. Audit Committee 2. Compensation Committee 3. Governance and Nominating Committee 4. Regulatory and Public Policy Committee
EXECUTIVE OFFICERS
Satya Nadella Chief Executive Officer
Amy E. Hood Executive Vice President, Chief Financial Officer
Christopher C. Capossela Executive Vice President, Marketing and Consumer Business, and Chief Marketing Officer
Margaret L. Johnson Executive Vice President, Business Development
Jean-Philippe Courtois Executive Vice President and President, Microsoft Global Sales, Marketing and Operations
Bradford L. Smith President and Chief Legal Officer
Kathleen T. Hogan Executive Vice President, Human Resources

92
INVESTOR RELATIONS
Investor Relations
You can contact Microsoft Investor Relations at any time to order financial documents such as annual reports and Form 10-Ks free of charge.
Call us toll-free at (800) 285-7772 or outside the United States, call (425) 706-4400. We can be contacted between the hours of 9:00 a.m. to 5:00 p.m. Pacific Time to answer investment oriented questions about Microsoft.
For access to additional financial information, visit the Investor Relations website online at: www.microsoft.com/investor
Our e-mail is [email protected]
Our mailing address is: Investor Relations Microsoft Corporation One Microsoft Way Redmond, Washington 98052-6399
Attending the Annual Meeting
The 2019 Annual Shareholders Meeting will be held as a virtual-only meeting. Any shareholder can join the Annual Meeting, while shareholders of record as of October 8, 2019 will be able to vote and submit questions during the meeting.
Date: Wednesday, December 4, 2018 Time: 8:00 a.m. Pacific Time Virtual Shareholder Meeting: www.virtualshareholdermeeting.com/MSFT19
Submit Your Question
We invite you to submit any questions via the proxy voting site at www.proxyvote.com. We will include as many of your questions as possible during the Q&A session of the meeting and will provide answers to questions on the Microsoft Investor Relations website under the Annual Meeting page.
Registered Shareholder Services
Computershare, our transfer agent, can help you with a variety of shareholder related services including:
• Change of address • Lost stock certificates • Transfer of stock to another person • Additional administrative services
Computershare also administers a direct stock purchase plan and a dividend reinvestment program for the company.
Contact Computershare directly to find out more about these services and programs at 800-285-7772, option 1, or visit online at: https://www.computershare.com/Microsoft
You can e-mail the transfer agent at: [email protected]
You can also send mail to the transfer agent at: Computershare P.O. Box 505000 Louisville, KY 40233-5000
Shareholders can sign up for electronic alerts to access the annual report and proxy statement online. The service gets you the information you need faster and also gives you the power and convenience of online proxy voting. To sign up for this free service, visit the Annual Report site on the Investor Relations website at: http://www.microsoft.com/investor/AnnualReports/default.aspx
Corporate Social Responsibility
We appreciate the inquiries we receive from many investors about our commitment to corporate social responsibility. Our CSR commitments contribute long-term value to our business, our shareholders, and communities around the world. Microsoft cannot fulfill our mission to empower every person and every organization on the planet to achieve more just by providing products and services that let our users do great things. Achieving that mission requires us to be thoughtful about the impact of our own business practices and policies and our investments in communities. And it’s not a mission we can achieve alone. It requires partnerships to apply our technologies to address some of the world’s toughest challenges. In short, we see corporate responsibility as both a responsibility and an opportunity to work together to advance societal needs and technology at the same time.
For more about Microsoft’s CSR commitments and performance, please visit: www.microsoft.com/transparency.