CP 01 04 Orange Juice - afcerc.tamu.eduafcerc.tamu.edu/publications/Publication-PDFs/CP 01 04 Orange...
83
FLORIDA ORANGE GROWER RETURNS FROM ORANGE JUICE ADVERTISING Gary W. Williams Oral Capps, Jr. David A. Bessler* TAMRC Consumer and Product Research Report No. CP-01-04 February 2004 * Williams is Professor of Agricultural Economics and Director, Texas Agricultural Market Research Center, Capps is Southwest Dairy Marketing Endowed Chair and Professor of Agricultural Economics, and Bessler is Professor of Agricultural Economics, Department of Agricultural Economics, Texas A&M University, College Station, Texas 77843-2124.
Transcript of CP 01 04 Orange Juice - afcerc.tamu.eduafcerc.tamu.edu/publications/Publication-PDFs/CP 01 04 Orange...
FLORIDA ORANGE GROWER RETURNS FROM ORANGE JUICE ADVERTISING
Gary W. Williams Oral Capps, Jr.
David A. Bessler*
TAMRC Consumer and Product Research Report No. CP-01-04
February 2004 * Williams is Professor of Agricultural Economics and Director, Texas Agricultural Market
Research Center, Capps is Southwest Dairy Marketing Endowed Chair and Professor of Agricultural Economics, and Bessler is Professor of Agricultural Economics, Department of Agricultural Economics, Texas A&M University, College Station, Texas 77843-2124.
FLORIDA ORANGE GROWER RETURNS FROM ORANGE JUICE ADVERTISING
Texas Agribusiness Market Research Center (TAMRC) Consumer and Product Research Report No. CP-01-04, February 2004 by Dr. Gary W. Williams, Dr. Oral Capps, Jr. and Dr. David A. Bessler. ABSTRACT This report analyzes the returns to Florida orange growers from the box tax they are assessed in support of the orange juice advertising program of the Florida Department of Citrus. The analysis focuses on 3 key questions: (1) What have been the effects of the FDOC advertising expenditures on U.S. orange and orange juice markets? (2) Have Florida orange growers benefited? (3) Would they have been better off if the box tax had been invested in other financial opportunities? The general conclusion is that the program has effectively augmented the profitability of Florida orange production. ACKNOWLEDGEMENTS The research reported here was funded by the Florida Department of Citrus through a competitive contract. The findings and conclusions do not necessarily reflect those of the Florida Department of Citrus or any private firm or government agency. The authors are indebted to a team of industry and academic peer group reviewers, including Bob Barber, Bob Behr, Bernie Lester, Olan Forker, and Ron Ward, for their insightful comments and suggestions. Any errors remain those of the authors alone, however. The Texas Agribusiness Market Research Center (TAMRC) has been providing timely, unique, and professional research on a wide range of issues relating to agricultural and agribusiness markets and products of importance to Texas and the nation for thirty-five years. TAMRC is a market research service of the Texas Agricultural Experiment Station and the Texas Agricultural Extension Service. The main TAMRC objective is to conduct research leading to expanded and more efficient markets for Texas and U.S. agricultural and food products. Major TAMRC research divisions include International Market Research, Consumer and Product Market Research, Commodity Market Research, and Contemporary Market Issues Research.
FLORIDA ORANGE GROWER RETURNS FROM ORANGE JUICE ADVERTISING
EXECUTIVE SUMMARY The main objective of this report is the calculation of the return to Florida orange growers from the box tax assessment they have paid over the years in support of the orange juice advertising expenditures of the Florida Department of Citrus (FDOC). Specifically, the research presented in this report was designed to address three key questions: (1) What have been the effects of the FDOC advertising expenditures on U.S. orange and orange juice markets? (2) Have Florida orange growers benefited from the FDOC advertising program? (3) Would Florida orange growers have been better off if the taxes they have paid over the years in support of the FDOC advertising programs instead had been invested in other financial opportunities? The answers to these questions are analyzed utilizing a 40-equation, annual econometric, non-spatial, price equilibrium simulation model of U.S. orange and orange juice markets as they interact with world markets (OJMOD) which was developed specifically for the research presented in this report. The most comprehensive model of orange and orange juice markets published to date, OJMOD allows for the simultaneous determination of the U.S. supplies, demands, prices, and trade of both oranges and orange juice and contains behavioral relationships specifying the manner in which orange supply and demand and the supply and demand for orange juice behave in response to changes in variables like the prices of fresh and processing oranges, orange juice, and competing commodities, technology, income, marketing costs, inflation, exchange rates, world economic growth, import tariffs, FDOC and brand advertising, and other market forces as appropriate. Statistical tests indicate that OJMOD replicates the historical functioning of orange and orange juice markets well and is reliable for the historical analysis of the FDOC advertising program. The analysis proceeds by using OJMOD to simulate the levels of the endogenous variables in the model (e.g., orange and orange juice production, demand, prices, etc.) over the 1967/68 to 1999/2000 period with and without FDOC advertising expenditures and comparing the results. Differences in the solution values of the endogenous variables in the “without” scenario from their baseline simulation solution (the “with” scenario) values are direct measures of the effects of the advertising expenditures over time. Because no other exogenous variable in the model is allowed to change (e.g., marketing or production costs, levels of inflation, exchange rates, income levels, import tariff levels, weather, etc.), this process effectively isolates the effects of the advertising expenditures on the endogenous variables in the model. The general conclusion of the analysis is that the orange juice advertising expenditures by the Florida Department of Citrus since at least since the late 1960s have been effective in

iii
augmenting the profitability of Florida orange production. With respect to the three key questions, the study concludes the following: 1. Effects of FDOC advertising expenditures on U.S. orange and orange juice markets:
FDOC advertising has effectively increased U.S. orange juice demand, boosted the prices of both orange juice and oranges, and expanded Florida orange production. Between 1967/68 and 1999/2000, FDOC advertising:
- increased the average annual demand for orange juice by 388 million gallons (SSE);
- boosted the average annual price of orange juice by $0.23 per 16 oz; - raised the Florida average annual all sales on-tree price of oranges by $0.66/box,
and - expanded average annual orange production in Florida by 916.7 million pounds
(10.2 million boxes).
FDOC advertising has substantially increased the level of U.S. orange juice imports. U.S. net imports of orange juice accounted for most of the increase in orange juice demand induced by FDOC advertising in the early years of the program but a lower share in later years as domestic production slowly responded to the advertising-induced price increase.
FDOC advertising has increased orange production in other states. Because FDOC
advertising has raised orange juice and orange prices, the production of oranges in other states has benefited as well. On average each year between 1967/68 and 1999/200 as a result of FDOC advertising:
- orange production in Arizona, California, and Texas was 1% to 2% higher; - total U.S. orange production from FDOC advertising was 964 million pounds
(10.8 million boxes) higher; - Florida accounted for about 95% of the increase in U.S. production.
In contrast, brand advertising of orange juice has had no measurable effect on the total
volume of orange juice sales over the years. No conclusion can be drawn from the research presented in this report, however, regarding the effect of brand advertising on the market shares accounted for by individual orange juice manufacturers.
2. Florida orange grower benefits from the FDOC advertising program
FDOC advertising programs generated 6 times more in profits for Florida orange growers than the cost of the programs on average each year between 1967/68 and 1999/2000.
- The average annual ratio of increased Florida grower profits to FDOC orange juice advertising expenditures (the Benefit-Cost Ratio or BCR) has been reasonably high at 6.1 to 1. Thus, every dollar spent by the FDOC on orange
iv
juice advertising in each year between 1967/68 and 1999/200 has contributed an average of $6.1 in profits to Florida orange growers.
- Discounting the estimated profits added by FDOC advertising for lost alternative investment earning opportunities reduces the Florida grower BCR to 2.9 to 1 (the discounted BCR).
- The grower BCR estimates fall in the range of BCRs reported for other commodities with similar producer-financed promotional programs ($2 to $12).
- The estimated Florida grower BCR represents a lower bound on the average return to Florida growers. In other words, while potentially higher than estimated in this study, the true BCR is not likely to be lower.
Between 1967/68 and 1999/2000, FDOC advertising increased Florida orange grower profits by at least $3.5 billion over and above the box tax paid by growers. That is, of the profits actually earned by Florida orange growers between 1967/68 and 1999/2000, at least $3.5 billion was contributed directly by FDOC orange juice advertising expenditures. In other terms, the contribution of FDOC advertising to Florida orange grower profits over that 33 year period can be expressed as an average of:
- $0.64 per box of oranges produced; - $2.02 per bearing tree; and - $489,000 per orange grove.
3. The FDOC advertising program as an alternative investment opportunity for Florida
orange growers
The FDOC advertising program has been an attractive investment alternative for the funds (box tax) collected from Florida growers. The internal rate of return to Florida growers from FDOC advertising expenditures over the 1967/68 through 1999/2000 period of analysis was estimated to be 14.4%.
Few investment alternatives were likely available to Florida growers over the entire 33 year period of 1967/68 to 1999/200 that could have provided a higher return for the funds they paid in support of FDOC programs.
The conclusions of this study suggest a number of implications for management of the FDOC advertising program:
The grower profit BCR of $6.1 per advertising dollar implies that increases in FDOC advertising from current levels would generate additional profits to Florida growers. As the level of expenditure increases, however, the grower benefit-cost ratio would begin to drop at some point. Determining how much of an increase in FDOC expenditures in what type of advertising and promotional activities would maximize grower profits (that is, the optimal expenditure level and, by extension, the optimal box tax rate) would be a useful next step in the analysis of FDOC activities for program management purposes.
v
Capricious, on-again-off-again funding of advertising can seriously erode the effectiveness of the expenditures in boosting orange juice sales and raising producer profits not only in the particular year in which a change may occur but over a long period of time. Indeed, a precipitous 26% drop in FDOC expenditures in the mid-1980s which arrested the momentum in the program during that period resulted in a drop in the returns to growers not only in the years in which the expenditures declined but also for a number of years thereafter.
Advertising that shifts out the demand for orange juice must necessarily lead to increased
imports of orange juice. The impact on imports is most important at the beginning of the program or following a large, sustained change in the level of expenditures because it takes time for domestic orange and orange juice production to change sufficiently in response to the consequent change in demand. In the mean time, the increased demand is met by increased imports. Over time, in response to a sustained program of advertising, the imports are increasingly replaced by domestic production. The key to minimizing imports in response to advertising is to maintain a sustained, growing program of advertising.
The benefits of FDOC advertising programs are not limited to Florida orange growers
alone. Brazil benefits from the higher orange juice price and experiences some increase in orange juice exports. Orange producers in other states (Arizona, California, and Texas) benefit from FDOC success in raising orange juice and orange prices. Orange juice processors benefit because the processing margin as well as the volume of oranges processed tend to increase. Retailers also benefit from increased sales of orange juice at higher prices. Even though the sharing of the benefits of such programs is inevitable to some degree, the analysis clearly shows that the benefits of FDOC advertising to Florida orange growers who pay for the advertising far exceeds what they pay for those benefits.
vi
TABLE OF CONTENTS
Abstract ............................................................................................................................................ i
Acknowledgements.......................................................................................................................... i
Executive Summary ........................................................................................................................ ii
Introduction..................................................................................................................................... 1
Methodology and Data.................................................................................................................... 2 The Orange and Orange Juice Model (OJMOD)......................................................................... 3 Description of the Structure of OJMOD ..................................................................................... 3 Theoretical Representation of the OJMOD Structure ................................................................. 8 Data............................................................................................................................................ 14
Model Parameter Estimation and Validation................................................................................ 15
Analyzing the Returns to Florida Growers from Advertising ...................................................... 20 Effects of FDOC Advertising on U.S. Orange and Orange Juice Markets ............................... 22 Florida Grower Benefit-Cost Analysis of FDOC Advertising .................................................. 26 FDOC Advertising and Alternative Financial Opportunities .................................................... 29
Comparison of Estimated Returns to Commodity Advertising and Promotion Programs ........... 30
Conclusions and Implications for Program Management............................................................. 32 Implications for Management of FDOC Advertising Programs ............................................... 36 Some Further Considerations .................................................................................................... 38
References..................................................................................................................................... 41
Appendix A................................................................................................................................... 47
Appendix B ................................................................................................................................... 66
vii
LIST OF FIGURES
Figure 1: Schematic Representation of OJMOD ........................................................................... 5 Figure 2: Effect of Advertising on Orange and Orange Juice Markets ......................................... 7 Figure 3: FDOC Advertising Expenditures, 1967/68-1999/2000................................................ 16 Figure 4: Branded Advertising Expenditures, 1967/68-1999/2000............................................. 16 Figure 5: FDOC Advertising Intensity, 1967/68-1999/2000....................................................... 19 Figure 6: Impact of FDOC Advertising on U.S. OJ Disappearance, 1967/68-1999/2000 .......... 23 Figure 7: Impact of FDOC Advertising on Average U.S. OJ Price, 1967/68-1999/2000 ........... 23 Figure 8: Impact of FDOC Advertising on Brazilian OJ Exports, 1967/68-1999/2000.............. 24
LIST OF TABLES
Table 1: OJMOD Structural Specification..................................................................................... 9 Table 2: OJMOD Variable Definitions........................................................................................ 11 Table 3: Key Estimated Partial Elasticities for Selected Variables in OJMOD .......................... 17 Table 4: Dynamic FDOC Advertising Elasticities of Selected OJMOD Variables..................... 21 Table 5: FDOC Advertising Investments: Effects on U.S. Orange Supply, Demand, and Prices,
1967/68-1999/2000 ................................................................................................................ 25 Table 6: FDOC Advertising Investments: Florida Orange Grower Benefit-Cost Analysis,
1967/68-1999/2000 ................................................................................................................ 29 Table 7: Studies of Generic Advertising Effects on Commodity Sales/Consumption ................ 33 Table 8: Returns to Generic Commodity Promotion in the U.S., Selected Studies..................... 34

FLORIDA ORANGE GROWER RETURNS FROM ORANGE JUICE ADVERTISING
The Florida Department of Citrus (FDOC) is funded through a per-box tax levied on citrus growers in accordance with the State of Florida Citrus Code, Chapter 601, F.S. Proceeds from the taxes total nearly $65 million annually and are used to fund the general operations of the FDOC, including both domestic and foreign advertising of citrus juices and fresh citrus. The primary objective of the FDOC orange juice advertising program over time has been to shift out the demand for orange juice, raise the price of orange juice and, thus, increase the profitability of growing oranges by Florida producers. The first relevant question, then, is whether FDOC advertising indeed has shifted out the demand for orange juice over the years. If the answer to this question is yes, then the next question is whether or not the rightward shift in orange juice demand that has been accomplished has benefited the Florida growers who pay for the program as intended. Obviously, if the answer to the first question is “no,” then the answer to the second question is “no” as well. However, if the answer to the first question is “yes,” the answer to the second is not necessarily “yes” because any consequent increase in revenues to growers may or may not be sufficient to cover their costs associated with the advertising program.
This report analyzes the answers to three main questions: (1) What were the specific effects of the FDOC advertising expenditures on U.S. orange and orange juice markets over the entire 33 year period of 1967/68 to 1999/2000? (2) Did Florida orange growers benefit from the FDOC advertising program over that period? (3) Would Florida orange growers have been better off if the box taxes they paid over the years in support of the FDOC advertising programs had been invested in other financial opportunities? In analyzing the first question, the initial focus is on whether FDOC advertising has effectively and consistently shifted out the U.S. demand for orange juice over the 33 year period of 1967/68 to 1999/2000, a period for which adequate historical data were available. The analysis also considers the effects of brand advertising by orange juice manufacturers on the overall demand for orange juice. Then the analysis considers whether any advertising-induced shift in orange juice demand effectively has boosted the profitability of Florida orange production. This analysis requires an in-depth understanding of the complex relationships within and between the orange juice and orange markets. For this purpose, a comprehensive economic model of U.S. orange and orange juice markets as they interact with world markets (OJMOD) was developed to account specifically for the complex interactions of U.S. supplies, demands, prices, and trade of both oranges and orange juice as they are affected by myriad forces such as the prices of fresh and processing oranges, orange juice, and competing commodities, technology, income, marketing costs, inflation, exchange rates, world economic growth, import tariffs, FDOC and brand advertising, and other market forces as appropriate.
OJMOD is then used to simulate the levels of the relevant variables such as Florida orange production and prices and other related variables over the 1967/68 to 1999/2000 period with and without FDOC advertising expenditures to obtain a direct measure of the effects of the
2
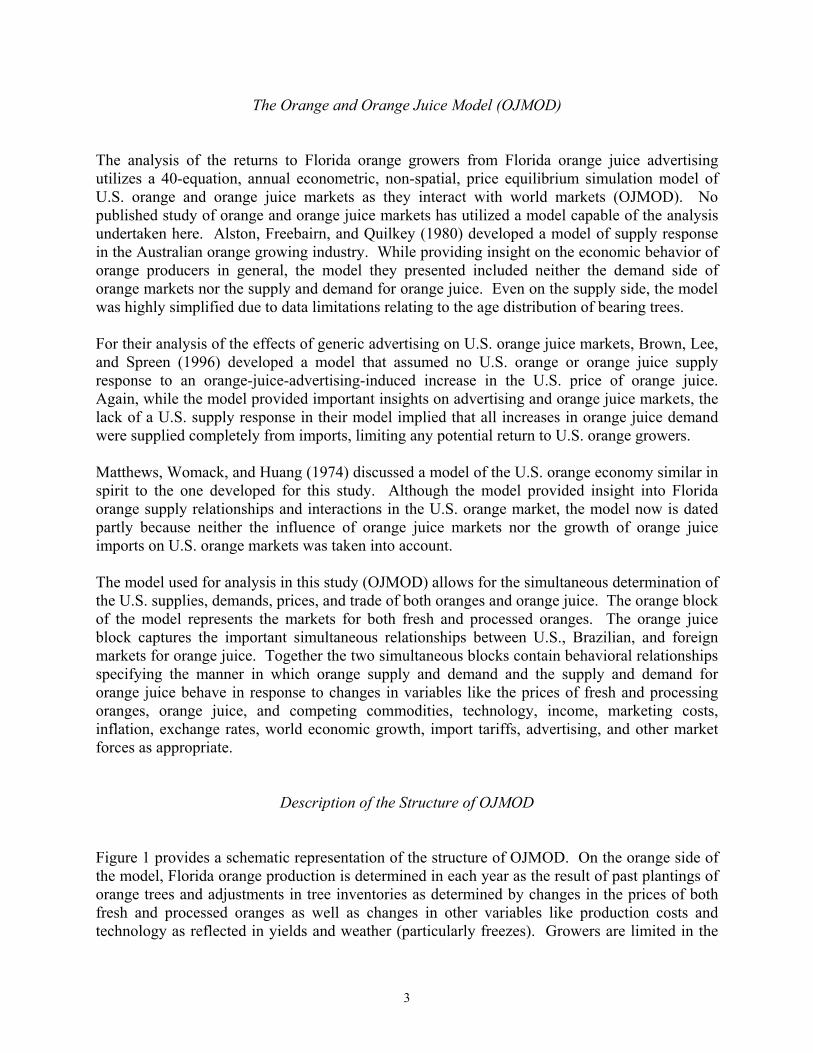
advertising expenditures over time. OJMOD accounts for the total demand for orange juice over a long period of time with linkages to the rest of the U.S. and foreign orange juice and orange markets. Annual data are used for the analysis because data for various structural linkages and related variables such as orange production are available only on an annual basis.
The analysis of the second question (whether Florida growers have benefited from FDOC advertising) utilizes the model simulation results generated to answer the first question to calculate the Benefit-Cost Ratio (BCR) to Florida orange growers from the FDOC advertising program over the period of 1967/68 to 1999/2000. Various BCR measures are considered.
Of course, even if the BCR to Florida growers was positive, growers still might have been better off if they had retained the box taxes they paid and invested that amount in other financial opportunities. Thus, to answer the third question and determine whether the FDOC advertising program has been an attractive investment alternative for Florida orange growers, the simulation results are used to calculate the internal rate of return to FDOC advertising and compared to the rates of return that might have been earned with those funds in alternative investments.
This report is organized into five sections. First, the analytical methodology and related data are discussed. The principal aim of this section is to lay out the structural model of the U.S. orange industry used in the analysis. This section also discusses the annual data used to estimate the relationships embedded in the structural model. The second section of this part of the report presents the results associated with the estimation of the structural model, validation of the model, and explanation of the simulation process used to measure and compare the benefits and costs to growers. The third section presents the simulation results indicating the historical impacts of FDOC advertising on the orange and orange juice markets along with the benefit-cost and rate-of-return measures associated with FDOC orange juice advertising efforts. The fourth section compares the results presented in Section three of this part of the report to those reported by other studies of commodity promotion programs. The last section highlights the key conclusions flowing from the analysis and discusses the main implications of those conclusions for management of the FDOC advertising program.
Methodology and Data
To measure the returns to Florida orange growers from Florida orange juice advertising expenditures over time, the first step was to isolate the effects of those investments in domestic and foreign orange and orange juice markets from those of other events that may have affected those markets over the years. For this purpose, both FDOC and brand advertising expenditures were incorporated as exogenous variables into an econometric representation of U.S. orange juice demand which, in turn, is one equation of the orange and orange juice econometric model (OJMOD) constructed specifically for the research results reported here. The model was then simulated over the 1967/68 to 1999/2000 period under alternative assumptions regarding the levels of orange juice advertising expenditures. The results then were used to calculate the various benefit-cost ratios for the FDOC advertising program.
3
The Orange and Orange Juice Model (OJMOD)
The analysis of the returns to Florida orange growers from Florida orange juice advertising utilizes a 40-equation, annual econometric, non-spatial, price equilibrium simulation model of U.S. orange and orange juice markets as they interact with world markets (OJMOD). No published study of orange and orange juice markets has utilized a model capable of the analysis undertaken here. Alston, Freebairn, and Quilkey (1980) developed a model of supply response in the Australian orange growing industry. While providing insight on the economic behavior of orange producers in general, the model they presented included neither the demand side of orange markets nor the supply and demand for orange juice. Even on the supply side, the model was highly simplified due to data limitations relating to the age distribution of bearing trees. For their analysis of the effects of generic advertising on U.S. orange juice markets, Brown, Lee, and Spreen (1996) developed a model that assumed no U.S. orange or orange juice supply response to an orange-juice-advertising-induced increase in the U.S. price of orange juice. Again, while the model provided important insights on advertising and orange juice markets, the lack of a U.S. supply response in their model implied that all increases in orange juice demand were supplied completely from imports, limiting any potential return to U.S. orange growers.
Matthews, Womack, and Huang (1974) discussed a model of the U.S. orange economy similar in spirit to the one developed for this study. Although the model provided insight into Florida orange supply relationships and interactions in the U.S. orange market, the model now is dated partly because neither the influence of orange juice markets nor the growth of orange juice imports on U.S. orange markets was taken into account.
The model used for analysis in this study (OJMOD) allows for the simultaneous determination of the U.S. supplies, demands, prices, and trade of both oranges and orange juice. The orange block of the model represents the markets for both fresh and processed oranges. The orange juice block captures the important simultaneous relationships between U.S., Brazilian, and foreign markets for orange juice. Together the two simultaneous blocks contain behavioral relationships specifying the manner in which orange supply and demand and the supply and demand for orange juice behave in response to changes in variables like the prices of fresh and processing oranges, orange juice, and competing commodities, technology, income, marketing costs, inflation, exchange rates, world economic growth, import tariffs, advertising, and other market forces as appropriate.
Description of the Structure of OJMOD
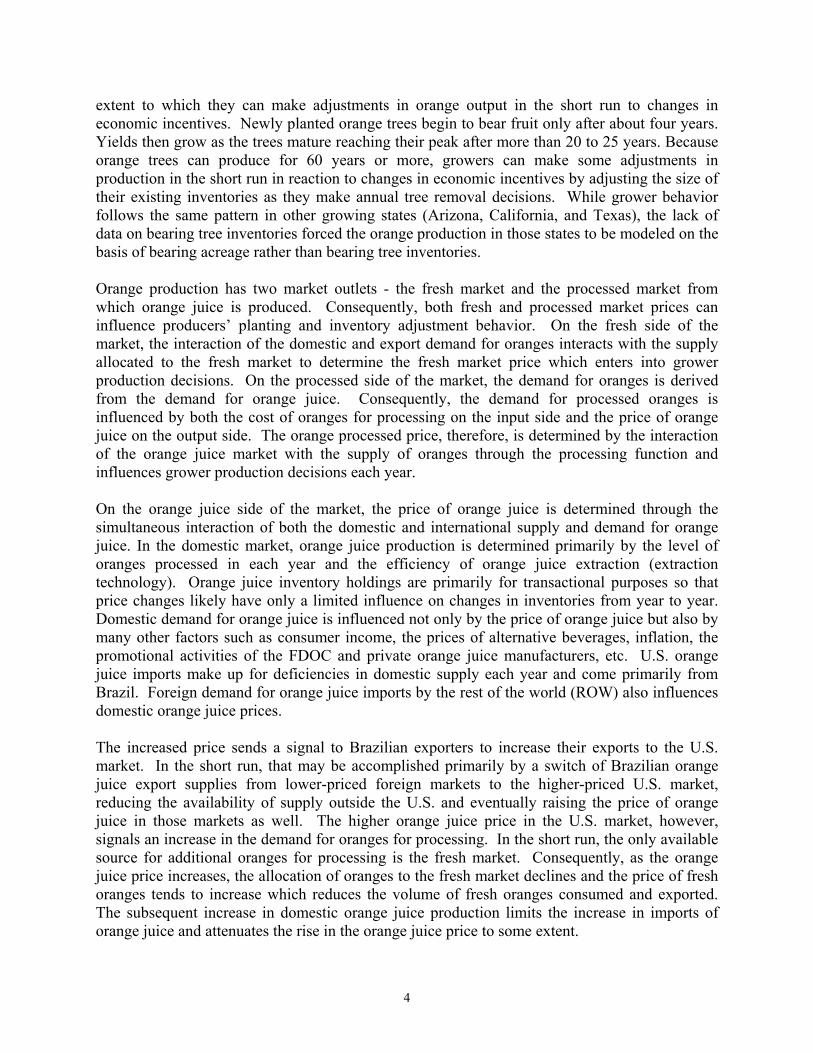
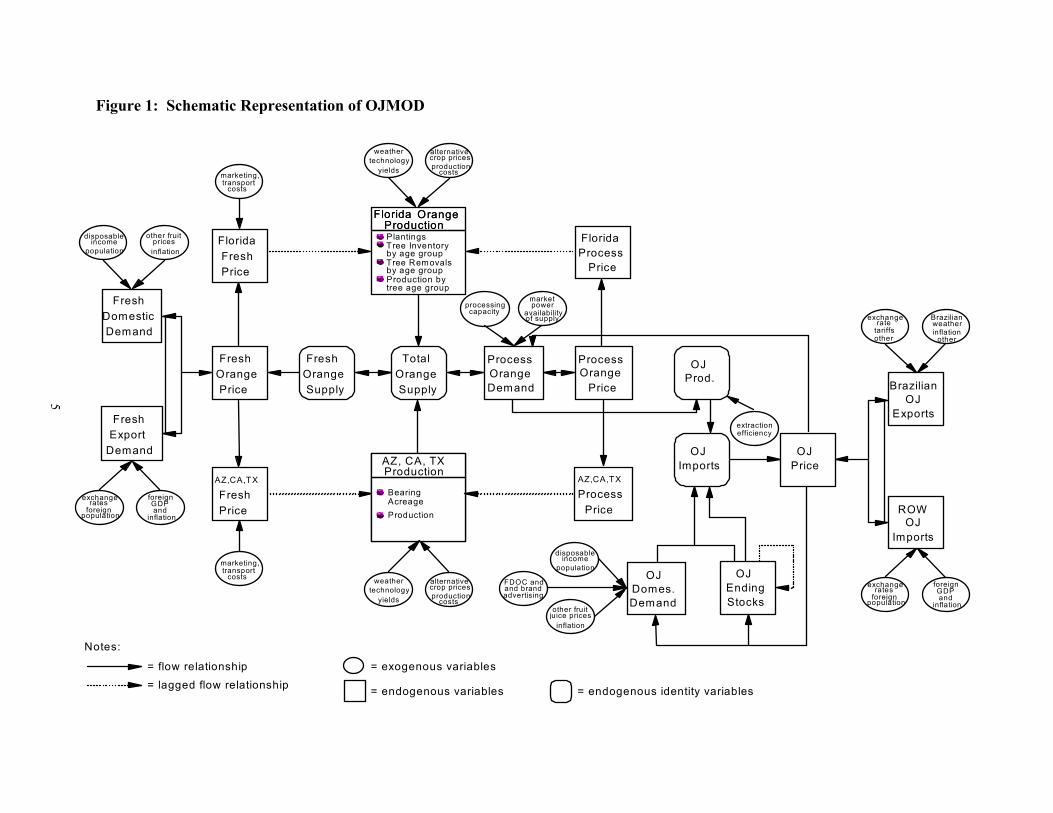
Figure 1 provides a schematic representation of the structure of OJMOD. On the orange side of the model, Florida orange production is determined in each year as the result of past plantings of orange trees and adjustments in tree inventories as determined by changes in the prices of both fresh and processed oranges as well as changes in other variables like production costs and technology as reflected in yields and weather (particularly freezes). Growers are limited in the
4
extent to which they can make adjustments in orange output in the short run to changes in economic incentives. Newly planted orange trees begin to bear fruit only after about four years. Yields then grow as the trees mature reaching their peak after more than 20 to 25 years. Because orange trees can produce for 60 years or more, growers can make some adjustments in production in the short run in reaction to changes in economic incentives by adjusting the size of their existing inventories as they make annual tree removal decisions. While grower behavior follows the same pattern in other growing states (Arizona, California, and Texas), the lack of data on bearing tree inventories forced the orange production in those states to be modeled on the basis of bearing acreage rather than bearing tree inventories.
Orange production has two market outlets - the fresh market and the processed market from which orange juice is produced. Consequently, both fresh and processed market prices can influence producers’ planting and inventory adjustment behavior. On the fresh side of the market, the interaction of the domestic and export demand for oranges interacts with the supply allocated to the fresh market to determine the fresh market price which enters into grower production decisions. On the processed side of the market, the demand for oranges is derived from the demand for orange juice. Consequently, the demand for processed oranges is influenced by both the cost of oranges for processing on the input side and the price of orange juice on the output side. The orange processed price, therefore, is determined by the interaction of the orange juice market with the supply of oranges through the processing function and influences grower production decisions each year.
On the orange juice side of the market, the price of orange juice is determined through the simultaneous interaction of both the domestic and international supply and demand for orange juice. In the domestic market, orange juice production is determined primarily by the level of oranges processed in each year and the efficiency of orange juice extraction (extraction technology). Orange juice inventory holdings are primarily for transactional purposes so that price changes likely have only a limited influence on changes in inventories from year to year. Domestic demand for orange juice is influenced not only by the price of orange juice but also by many other factors such as consumer income, the prices of alternative beverages, inflation, the promotional activities of the FDOC and private orange juice manufacturers, etc. U.S. orange juice imports make up for deficiencies in domestic supply each year and come primarily from Brazil. Foreign demand for orange juice imports by the rest of the world (ROW) also influences domestic orange juice prices. The increased price sends a signal to Brazilian exporters to increase their exports to the U.S. market. In the short run, that may be accomplished primarily by a switch of Brazilian orange juice export supplies from lower-priced foreign markets to the higher-priced U.S. market, reducing the availability of supply outside the U.S. and eventually raising the price of orange juice in those markets as well. The higher orange juice price in the U.S. market, however, signals an increase in the demand for oranges for processing. In the short run, the only available source for additional oranges for processing is the fresh market. Consequently, as the orange juice price increases, the allocation of oranges to the fresh market declines and the price of fresh oranges tends to increase which reduces the volume of fresh oranges consumed and exported. The subsequent increase in domestic orange juice production limits the increase in imports of orange juice and attenuates the rise in the orange juice price to some extent.
5
Figure 1: Schematic Representation of OJMOD
capacity
ProductionAZ, CA, TX
BearingAcreageProduction
Florida
Plantings
Tree Removalsby age group
Tree Inventoryby age group
Production by tree age group
OrangeProduction
Florida OrangeProduction
TotalOrange Supply
FreshOrange Supply
Fresh Orange Price
Florida Fresh Price
AZ,CA,TX Fresh Price
Fresh Domestic Demand
Fresh Export Demand
Demand
ProcessOrange
Price
Process Orange
Price Process Florida
AZ,CA,TX Process Price
OJProd.
OJ
StocksEnding
OJ
DemandDomes.
OJImports
OJPrice
BrazilianOJ
Exports
weather
yieldstechnology
alternativecrop prices
costsproduction
weather
yieldstechnology
alternativecrop prices
costsproduction
disposable population
other fruit prices inflation
income
exchange foreign
foreign inflation
rates population
GDP and
processingmarket
of supplyavailability
power
efficiencyextraction
disposable
population
other fruitjuice prices
inflation
income
exchange
foreign
foreign
inflation
rates
populationGDPand
Notes: = flow relationship = lagged flow relationship
= exogenous variables
= endogenous variables = endogenous identity variables
FDOC andand brandadvertising
marketing, costs transport
marketing, costs transport
ROWOJ
Imports
exchange
tariffsrate
Brazilian
inflationweather
other other
6
Over the longer run, however, the increased upward pressure on processing demand to fill domestic supply deficiencies and the resulting upward pressure on the prices of both fresh and processing oranges leads to increased domestic production of oranges. Although growers respond to the price increases by planting more trees, the increased production does not result in any additional orange juice supplies for a number of years until the new trees have sufficiently matured. In the mean time, growers respond by removing fewer trees from current inventories in attempt to benefit from the higher prices. In the short run, then, orange juice supply deficiencies are filled primarily by imports as Brazil switches destinations of its exports and attempts to increase its own export supply. Over time, as U.S. production comes on line, more of the increased demand is filled from domestic production and less from imports.
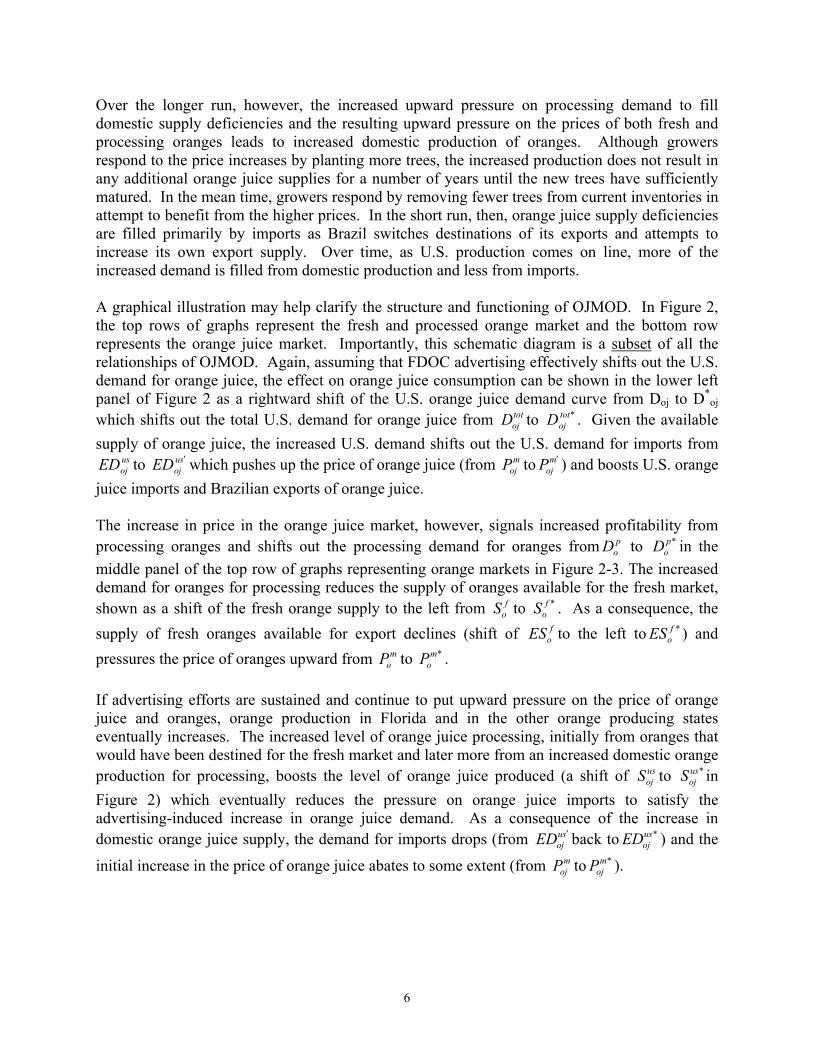
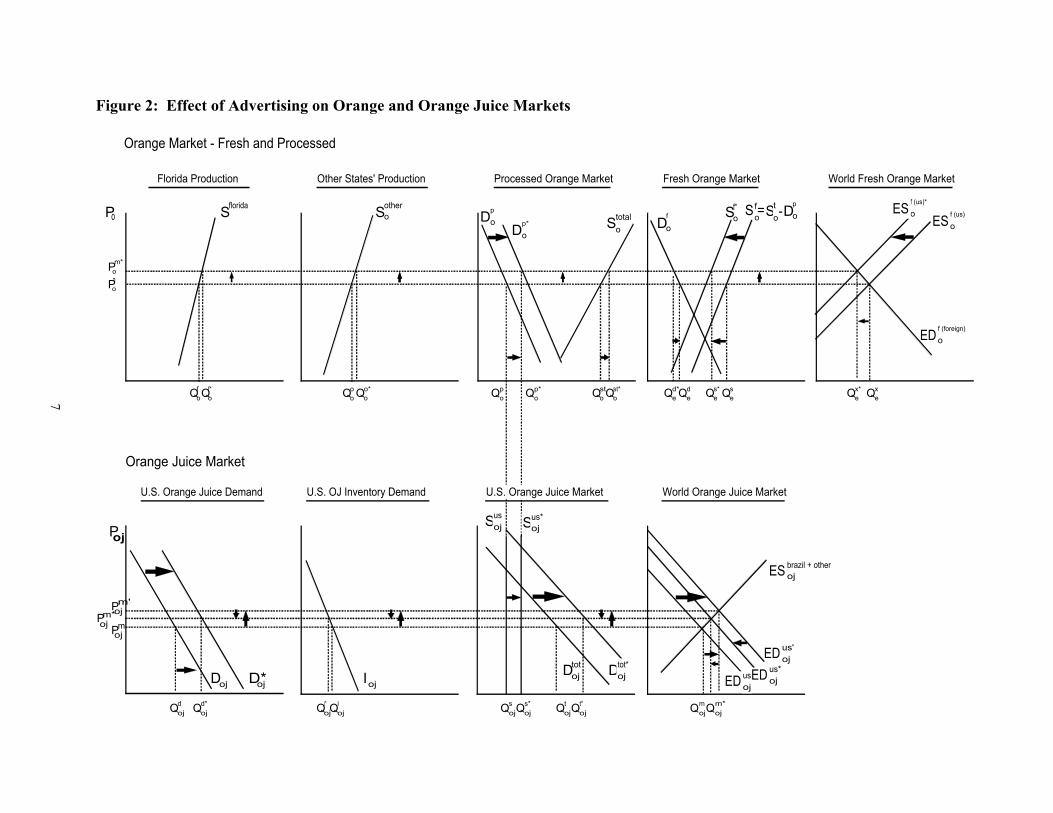
A graphical illustration may help clarify the structure and functioning of OJMOD. In Figure 2, the top rows of graphs represent the fresh and processed orange market and the bottom row represents the orange juice market. Importantly, this schematic diagram is a subset of all the relationships of OJMOD. Again, assuming that FDOC advertising effectively shifts out the U.S. demand for orange juice, the effect on orange juice consumption can be shown in the lower left panel of Figure 2 as a rightward shift of the U.S. orange juice demand curve from Doj to D*
oj which shifts out the total U.S. demand for orange juice from tot
ojD to *totojD . Given the available
supply of orange juice, the increased U.S. demand shifts out the U.S. demand for imports from usojED to su
ojED ′ which pushes up the price of orange juice (from mojP to m
ojP ′ ) and boosts U.S. orange juice imports and Brazilian exports of orange juice. The increase in price in the orange juice market, however, signals increased profitability from processing oranges and shifts out the processing demand for oranges from p
oD to *poD in the
middle panel of the top row of graphs representing orange markets in Figure 2-3. The increased demand for oranges for processing reduces the supply of oranges available for the fresh market, shown as a shift of the fresh orange supply to the left from f
oS to *foS . As a consequence, the
supply of fresh oranges available for export declines (shift of foES to the left to *f
oES ) and pressures the price of oranges upward from m
oP to *moP .
If advertising efforts are sustained and continue to put upward pressure on the price of orange juice and oranges, orange production in Florida and in the other orange producing states eventually increases. The increased level of orange juice processing, initially from oranges that would have been destined for the fresh market and later more from an increased domestic orange production for processing, boosts the level of orange juice produced (a shift of us
ojS to *usojS in
Figure 2) which eventually reduces the pressure on orange juice imports to satisfy the advertising-induced increase in orange juice demand. As a consequence of the increase in domestic orange juice supply, the demand for imports drops (from su
ojED ′ back to *usojED ) and the
initial increase in the price of orange juice abates to some extent (from mojP to *m
ojP ).
7
Figure 2: Effect of Advertising on Orange and Orange Juice Markets
f (foreign)
o
Sflorida SotheroP o
P mo
Stotalo
Dp
oSf*
oDf
o ES f (us)
o
ED
Doj
Poj
IojDtot
oj
Susoj
ED usoj
ES brazil + otheroj
Orange Market - Fresh and Processed
Orange Juice Market
Qfo Qo
o QstoQp
o Qde Qx
e
Qdoj Qi
oj Qsoj Qm
oj
D*ojDtot*
oj ED us*oj
Dp*
o
S -to D
p
oS = fo
Qx*eQf*
o Qo*o
Sus*oj
Qm*ojQs*
oj QtojQ
t*ojQd*
oj Qi*oj
f (us)*
oES
Qst*o Qd*
e QseQs*
e
P m*o
Qp*o
Florida Production Processed Orange Market Fresh Orange MarketOther States' Production
U.S. Orange Juice Demand
World Fresh Orange Market
U.S. OJ Inventory Demand U.S. Orange Juice Market World Orange Juice Market
ED us'oj
Pm*oj Pm
oj
Pm'oj

8
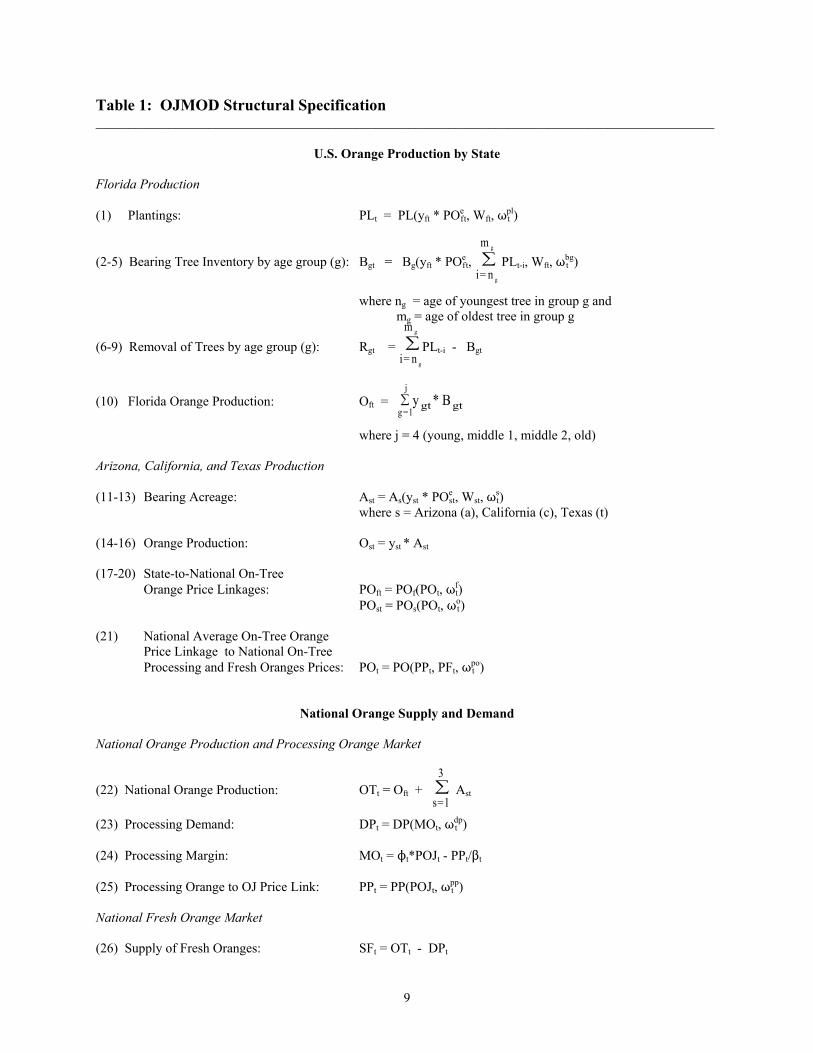
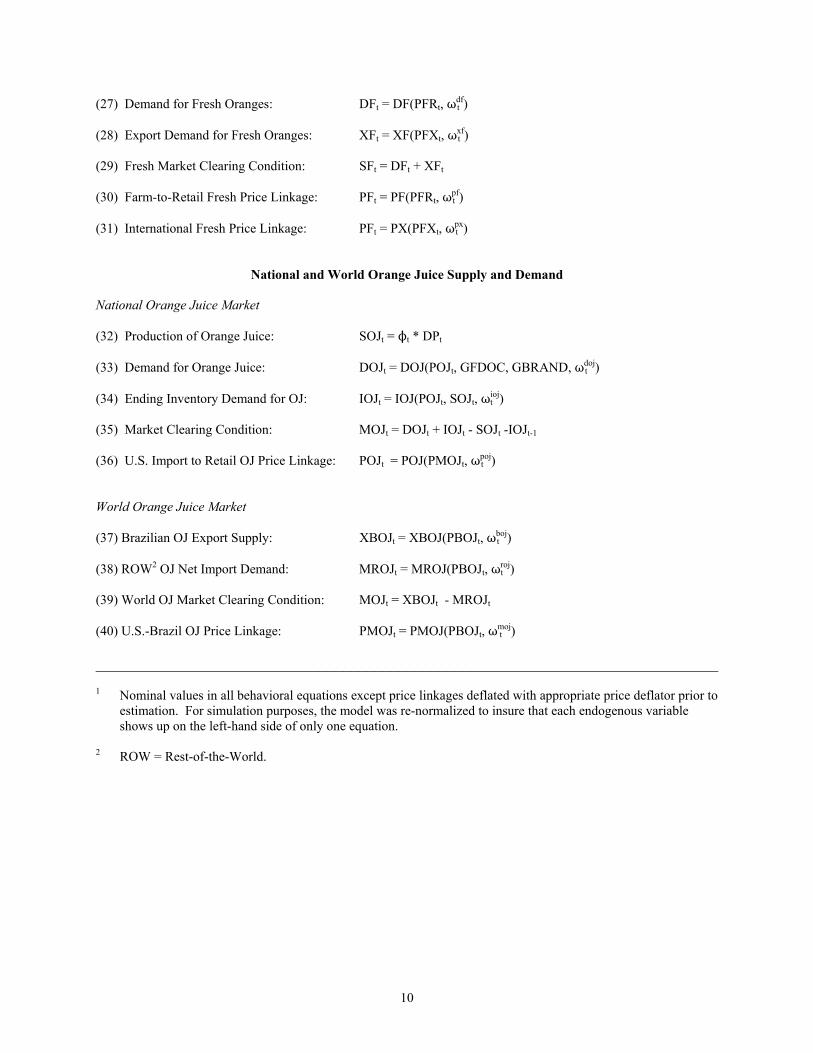
Theoretical Representation of the OJMOD Structure Table 1 provides a more formalized mathematical representation of the model used for this analysis. Table 2 provides a definition of the variables in the model. Equations (1) - (10) represent Florida orange production. Equations (1) - (5) capture the two critical components of grower behavior in response to economic incentives: (1) changes in annual plantings of new orange tress (equation (1) in Table 1) and (2) changes in existing bearing tree inventories of various age groups (equations (2 - 5)). In equation (1), the level of new plantings in each year is specified as a function of expected gross grower revenues per unit of oranges produced, modeled as yield times the expected on-tree price of oranges, weather, and other exogenous factors. An adaptive price expectation with stock adjustment specification was used given the lengthy lag between planting and production.
The level of bearing tree inventories in any age group at any point in time (equations (2 - 5) in Table 1) is determined primarily by the number of trees planted the appropriate number of years before as affected by freezes and other weather problems that impact the number of bearing trees. Although growers can adjust bearing tree inventories in the short run in response to economic incentives by adjusting the number of productive trees removed from production in a given year, growers are usually reticent to make disinvestments in productive bearing tree inventories. Most trees removed each year are, therefore, likely diseased, dead or otherwise unproductive. As a consequence, bearing inventories are not likely to be highly responsive to changes in price in the short run. The number of trees in the various age groups removed in each year (equations (6 – 9) in Table 1), then, is simply the difference between the number of trees planted the corresponding number of years in the past and the current inventory of bearing trees in the same age group. Total Florida orange production is the sum of oranges produced by each age group of bearing trees (yield for the particular age group times bearing inventories in the corresponding age group) as given in equation (10) in Table 1. In the other orange producing states (Arizona, California, and Texas), the specification of the production of oranges in similar to that of Florida but much less rich in structure because the lack of data on bearing tree inventories in those states forced the specification to be based on bearing acreage instead. The bearing acreage of oranges in those states, therefore, is specified as a function of expected grower revenue per unit in each state (specified as defined for Florida) along with weather and other exogenous factors impacting bearing acreage (equations (11-13) in Table 1). Production of oranges in these states is then just the product of yields and bearing acreage in the respective states (equations (14-16) in Table 1). Even though these three states produce oranges primarily for the fresh market, their production behavior was modeled and incorporated into OJMOD because fresh production can play an important role in helping ameliorate the effects of orange juice supply deficiencies on the price and imports of orange juice. At times of orange juice supply shortfalls (for example, if effective orange juice advertising increases the demand for orange juice), the fresh market responds by allocating more oranges for processing and fewer for fresh consumption.
9
i= n
m
g
g
∑
i= n
m
g
g
∑
y Bgt gtg =1
j*∑
s=1
3∑
Table 1: OJMOD Structural Specification _____________________________________________________________________________________________ U.S. Orange Production by State Florida Production (1) Plantings: PLt = PL(yft * POe
ft, Wft, Tptl)
(2-5) Bearing Tree Inventory by age group (g): Bgt = Bg(yft * POe
ft, PLt-i, Wft, Tbtg)
where ng = age of youngest tree in group g and mg = age of oldest tree in group g (6-9) Removal of Trees by age group (g): Rgt = PLt-i - Bgt
(10) Florida Orange Production: Oft =
where j = 4 (young, middle 1, middle 2, old) Arizona, California, and Texas Production (11-13) Bearing Acreage: Ast = As(yst * POe
st, Wst, Tst)
where s = Arizona (a), California (c), Texas (t) (14-16) Orange Production: Ost = yst * Ast (17-20) State-to-National On-Tree Orange Price Linkages: POft = POf(POt, Tf
t) POst = POs(POt, To
t) (21) National Average On-Tree Orange Price Linkage to National On-Tree Processing and Fresh Oranges Prices: POt = PO(PPt, PFt, Tp
to)
National Orange Supply and Demand National Orange Production and Processing Orange Market (22) National Orange Production: OTt = Oft + Ast
(23) Processing Demand: DPt = DP(MOt, Tdtp)
(24) Processing Margin: MOt = Nt*POJt - PPt/$t (25) Processing Orange to OJ Price Link: PPt = PP(POJt, Tp
tp)
National Fresh Orange Market (26) Supply of Fresh Oranges: SFt = OTt - DPt
10
(27) Demand for Fresh Oranges: DFt = DF(PFRt, Tdtf)
(28) Export Demand for Fresh Oranges: XFt = XF(PFXt, Tx
tf)
(29) Fresh Market Clearing Condition: SFt = DFt + XFt (30) Farm-to-Retail Fresh Price Linkage: PFt = PF(PFRt, Tp
tf)
(31) International Fresh Price Linkage: PFt = PX(PFXt, Tp
tx)
National and World Orange Juice Supply and Demand National Orange Juice Market (32) Production of Orange Juice: SOJt = Nt * DPt (33) Demand for Orange Juice: DOJt = DOJ(POJt, GFDOC, GBRAND, Td
toj)
(34) Ending Inventory Demand for OJ: IOJt = IOJ(POJt, SOJt, Ti
toj)
(35) Market Clearing Condition: MOJt = DOJt + IOJt - SOJt -IOJt-1 (36) U.S. Import to Retail OJ Price Linkage: POJt = POJ(PMOJt, Tp
toj)
World Orange Juice Market (37) Brazilian OJ Export Supply: XBOJt = XBOJ(PBOJt, Tb
toj)
(38) ROW2 OJ Net Import Demand: MROJt = MROJ(PBOJt, Tr
toj)
(39) World OJ Market Clearing Condition: MOJt = XBOJt - MROJt (40) U.S.-Brazil OJ Price Linkage: PMOJt = PMOJ(PBOJt, Tm
toj)
______________________________________________________________________________ 1 Nominal values in all behavioral equations except price linkages deflated with appropriate price deflator prior to
estimation. For simulation purposes, the model was re-normalized to insure that each endogenous variable shows up on the left-hand side of only one equation.
2 ROW = Rest-of-the-World.
11
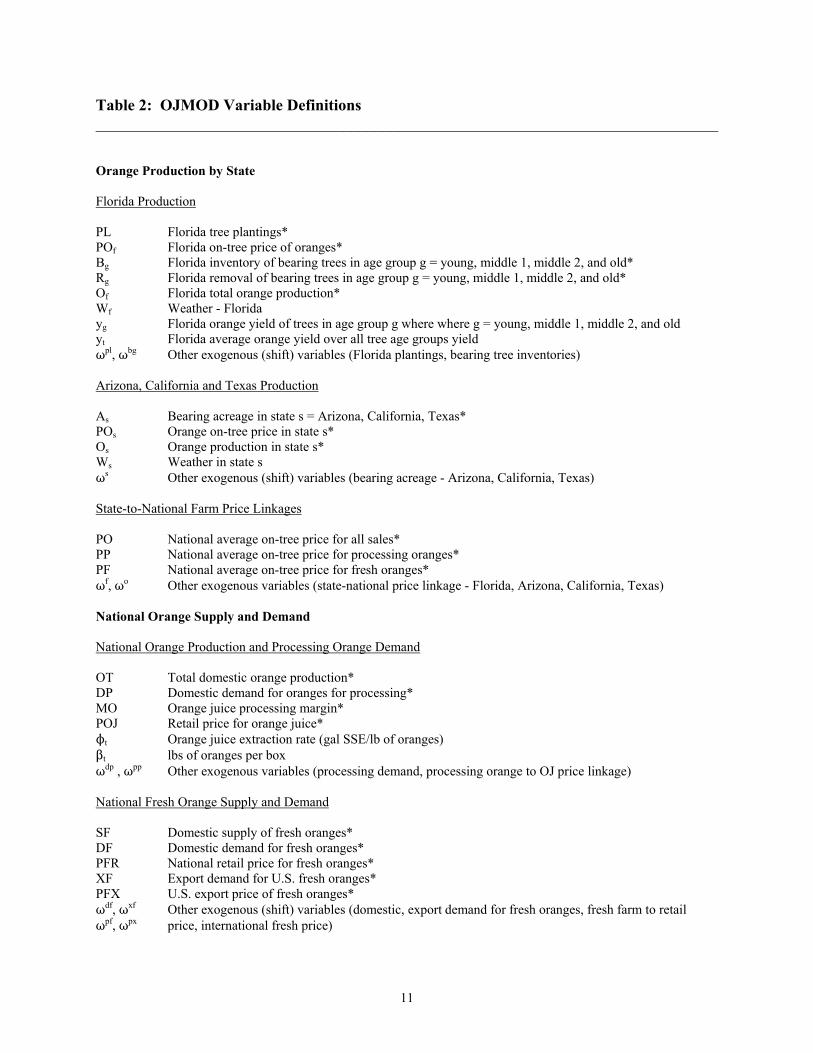
Table 2: OJMOD Variable Definitions ______________________________________________________________________________ Orange Production by State Florida Production PL Florida tree plantings* POf Florida on-tree price of oranges* Bg Florida inventory of bearing trees in age group g = young, middle 1, middle 2, and old* Rg Florida removal of bearing trees in age group g = young, middle 1, middle 2, and old* Of Florida total orange production* Wf Weather - Florida yg Florida orange yield of trees in age group g where where g = young, middle 1, middle 2, and old yt Florida average orange yield over all tree age groups yield Tpl, Tbg Other exogenous (shift) variables (Florida plantings, bearing tree inventories) Arizona, California and Texas Production As Bearing acreage in state s = Arizona, California, Texas* POs Orange on-tree price in state s* Os Orange production in state s* Ws Weather in state s Ts Other exogenous (shift) variables (bearing acreage - Arizona, California, Texas) State-to-National Farm Price Linkages PO National average on-tree price for all sales* PP National average on-tree price for processing oranges* PF National average on-tree price for fresh oranges* Tf, To Other exogenous variables (state-national price linkage - Florida, Arizona, California, Texas) National Orange Supply and Demand National Orange Production and Processing Orange Demand OT Total domestic orange production* DP Domestic demand for oranges for processing* MO Orange juice processing margin* POJ Retail price for orange juice* Nt Orange juice extraction rate (gal SSE/lb of oranges) $t lbs of oranges per box Tdp , Tpp Other exogenous variables (processing demand, processing orange to OJ price linkage) National Fresh Orange Supply and Demand SF Domestic supply of fresh oranges* DF Domestic demand for fresh oranges* PFR National retail price for fresh oranges* XF Export demand for U.S. fresh oranges* PFX U.S. export price of fresh oranges* Tdf, Txf Other exogenous (shift) variables (domestic, export demand for fresh oranges, fresh farm to retail Tpf, Tpx price, international fresh price)

12
National Orange Juice Supply and Demand SOJ National production of orange juice* DOJ Domestic demand for orange juice* IOJ U.S. ending inventory (stocks) of orange juice* MOJ U.S. imports of orange juice* GFDOC Goodwill variable for Flordia Dept. of Citrus advertising expenditures for Florida orange juice GBRAND Goodwill variable for branded advertising expenditures for Florida orange juice Tdoj,Tioj,Tpoj Other exogenous (shift) variables (domestic demand for U.S. orange juice, ending inventory of orange
juice, and import to retail price linkage) World Orange Juice Market XBOJ Brazilian orange juice exports* PBOJ Brazilian export price of orange juice* PMOJ U.S. import price of orange juice* MROJ Rest-of-the-World net orange juice import demand* Txboj, Tmroj Other exogenous (shift) variables (Brazilian OJ exports and ROW OJ imports) Tboj, Troj, Tmoj Other exogenous (shift) variables (Brazilian and World OJ price) ______________________________________________________________________________ 1 Endogenous variables marked with an asterisk (*). To maintain the linkage between the national market for oranges the markets in each of the four producing states, OJMOD includes four state-to-national on-tree orange price linkages (equations (17 –20) in Table 1). Equation (21) simply recognizes that the national average on-tree orange price for all sales is derived from the national prices of oranges for processing and for fresh sales.
The national production of oranges in OJMOD is calculated as the sum of the production of oranges in the four producing states (equation (22) in Table 1). On the processing side, the demand for oranges is derived from the demand for orange juice and, therefore, is a function of the price of orange juice on the output side and the price of oranges for processing on the input side as given by the processing margin (MO in equation (23) in Table 1). Equation (24) defines the processing margin as the difference in the price of orange juice and the price of processing oranges adjusted to the same units. Equation (25) in Table 1 is a marketing link between the price of orange juice and the price of processing oranges in the market.
On the fresh side of the orange market, the supply of fresh oranges is the difference between total supply and the number of oranges processed (equation (26) in Table 1). The supply of fresh oranges interfaces with both domestic and export demand (equations (27) and (28)). The fresh orange market component of the model closes with a market clearing condition (equation (29) in Table 1) that insures equality of total supply and total demand in each year. Equation (30) is the farm-to-retail price marketing linkage while equation (31) links the domestic fresh price to the export price of oranges. The orange juice component of OJMOD includes a representation of both the domestic and world markets for orange juice. On the domestic side, orange juice production is determined by
13
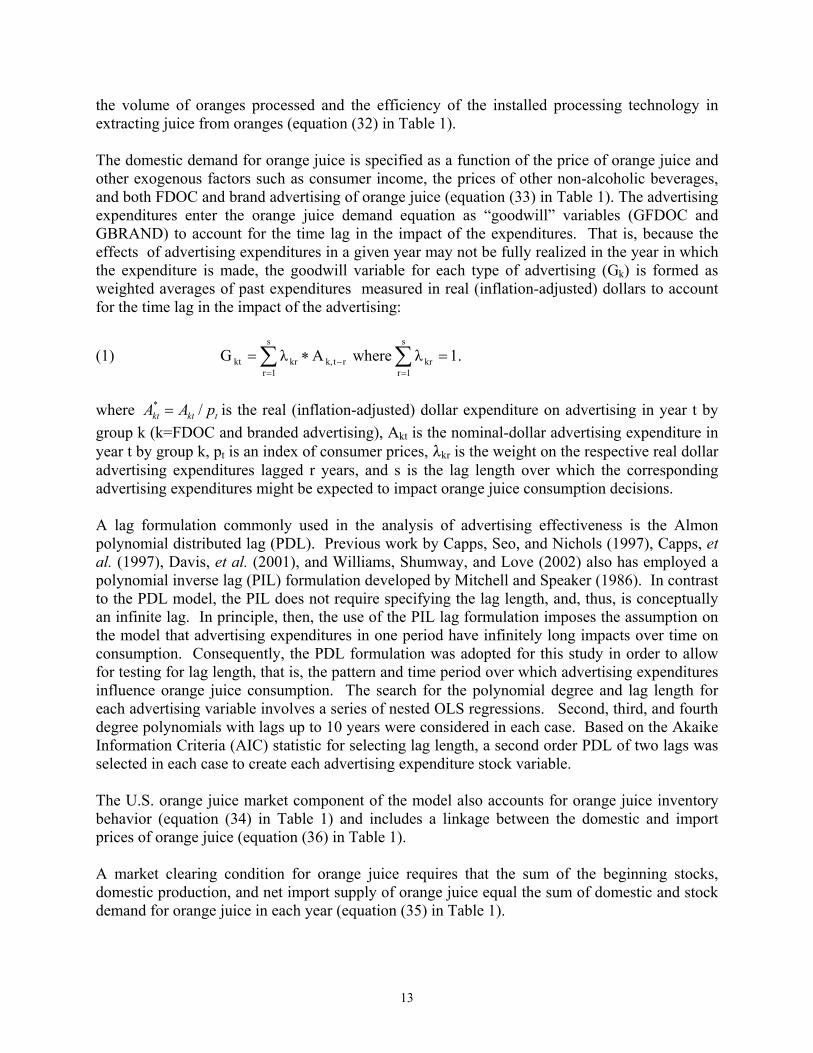
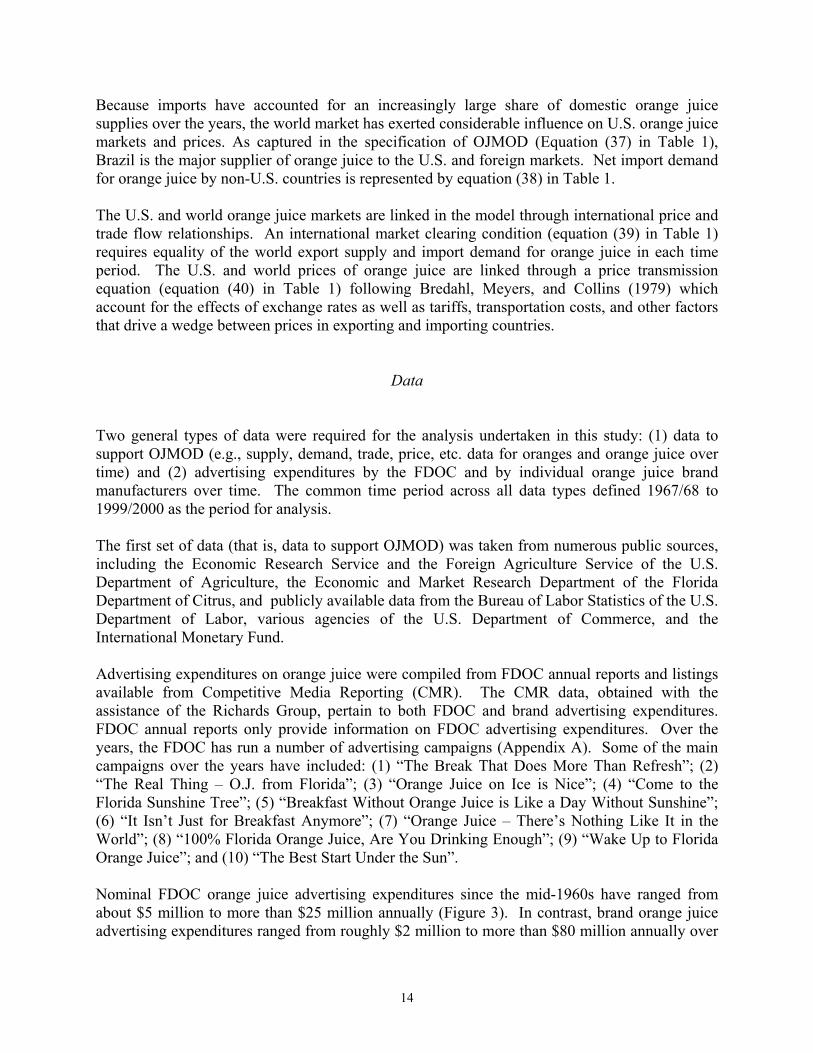
the volume of oranges processed and the efficiency of the installed processing technology in extracting juice from oranges (equation (32) in Table 1). The domestic demand for orange juice is specified as a function of the price of orange juice and other exogenous factors such as consumer income, the prices of other non-alcoholic beverages, and both FDOC and brand advertising of orange juice (equation (33) in Table 1). The advertising expenditures enter the orange juice demand equation as “goodwill” variables (GFDOC and GBRAND) to account for the time lag in the impact of the expenditures. That is, because the effects of advertising expenditures in a given year may not be fully realized in the year in which the expenditure is made, the goodwill variable for each type of advertising (Gk) is formed as weighted averages of past expenditures measured in real (inflation-adjusted) dollars to account for the time lag in the impact of the advertising:
(1) 1.λwhereAλGs
1rkrrtk,
s
1rkrkt =∗= ∑∑
=−
=
where tktkt pAA /* = is the real (inflation-adjusted) dollar expenditure on advertising in year t by group k (k=FDOC and branded advertising), Akt is the nominal-dollar advertising expenditure in year t by group k, pt is an index of consumer prices, 8kr is the weight on the respective real dollar advertising expenditures lagged r years, and s is the lag length over which the corresponding advertising expenditures might be expected to impact orange juice consumption decisions. A lag formulation commonly used in the analysis of advertising effectiveness is the Almon polynomial distributed lag (PDL). Previous work by Capps, Seo, and Nichols (1997), Capps, et al. (1997), Davis, et al. (2001), and Williams, Shumway, and Love (2002) also has employed a polynomial inverse lag (PIL) formulation developed by Mitchell and Speaker (1986). In contrast to the PDL model, the PIL does not require specifying the lag length, and, thus, is conceptually an infinite lag. In principle, then, the use of the PIL lag formulation imposes the assumption on the model that advertising expenditures in one period have infinitely long impacts over time on consumption. Consequently, the PDL formulation was adopted for this study in order to allow for testing for lag length, that is, the pattern and time period over which advertising expenditures influence orange juice consumption. The search for the polynomial degree and lag length for each advertising variable involves a series of nested OLS regressions. Second, third, and fourth degree polynomials with lags up to 10 years were considered in each case. Based on the Akaike Information Criteria (AIC) statistic for selecting lag length, a second order PDL of two lags was selected in each case to create each advertising expenditure stock variable.
The U.S. orange juice market component of the model also accounts for orange juice inventory behavior (equation (34) in Table 1) and includes a linkage between the domestic and import prices of orange juice (equation (36) in Table 1). A market clearing condition for orange juice requires that the sum of the beginning stocks, domestic production, and net import supply of orange juice equal the sum of domestic and stock demand for orange juice in each year (equation (35) in Table 1).
14
Because imports have accounted for an increasingly large share of domestic orange juice supplies over the years, the world market has exerted considerable influence on U.S. orange juice markets and prices. As captured in the specification of OJMOD (Equation (37) in Table 1), Brazil is the major supplier of orange juice to the U.S. and foreign markets. Net import demand for orange juice by non-U.S. countries is represented by equation (38) in Table 1. The U.S. and world orange juice markets are linked in the model through international price and trade flow relationships. An international market clearing condition (equation (39) in Table 1) requires equality of the world export supply and import demand for orange juice in each time period. The U.S. and world prices of orange juice are linked through a price transmission equation (equation (40) in Table 1) following Bredahl, Meyers, and Collins (1979) which account for the effects of exchange rates as well as tariffs, transportation costs, and other factors that drive a wedge between prices in exporting and importing countries.
Data Two general types of data were required for the analysis undertaken in this study: (1) data to support OJMOD (e.g., supply, demand, trade, price, etc. data for oranges and orange juice over time) and (2) advertising expenditures by the FDOC and by individual orange juice brand manufacturers over time. The common time period across all data types defined 1967/68 to 1999/2000 as the period for analysis.
The first set of data (that is, data to support OJMOD) was taken from numerous public sources, including the Economic Research Service and the Foreign Agriculture Service of the U.S. Department of Agriculture, the Economic and Market Research Department of the Florida Department of Citrus, and publicly available data from the Bureau of Labor Statistics of the U.S. Department of Labor, various agencies of the U.S. Department of Commerce, and the International Monetary Fund.
Advertising expenditures on orange juice were compiled from FDOC annual reports and listings available from Competitive Media Reporting (CMR). The CMR data, obtained with the assistance of the Richards Group, pertain to both FDOC and brand advertising expenditures. FDOC annual reports only provide information on FDOC advertising expenditures. Over the years, the FDOC has run a number of advertising campaigns (Appendix A). Some of the main campaigns over the years have included: (1) “The Break That Does More Than Refresh”; (2) “The Real Thing – O.J. from Florida”; (3) “Orange Juice on Ice is Nice”; (4) “Come to the Florida Sunshine Tree”; (5) “Breakfast Without Orange Juice is Like a Day Without Sunshine”; (6) “It Isn’t Just for Breakfast Anymore”; (7) “Orange Juice – There’s Nothing Like It in the World”; (8) “100% Florida Orange Juice, Are You Drinking Enough”; (9) “Wake Up to Florida Orange Juice”; and (10) “The Best Start Under the Sun”.
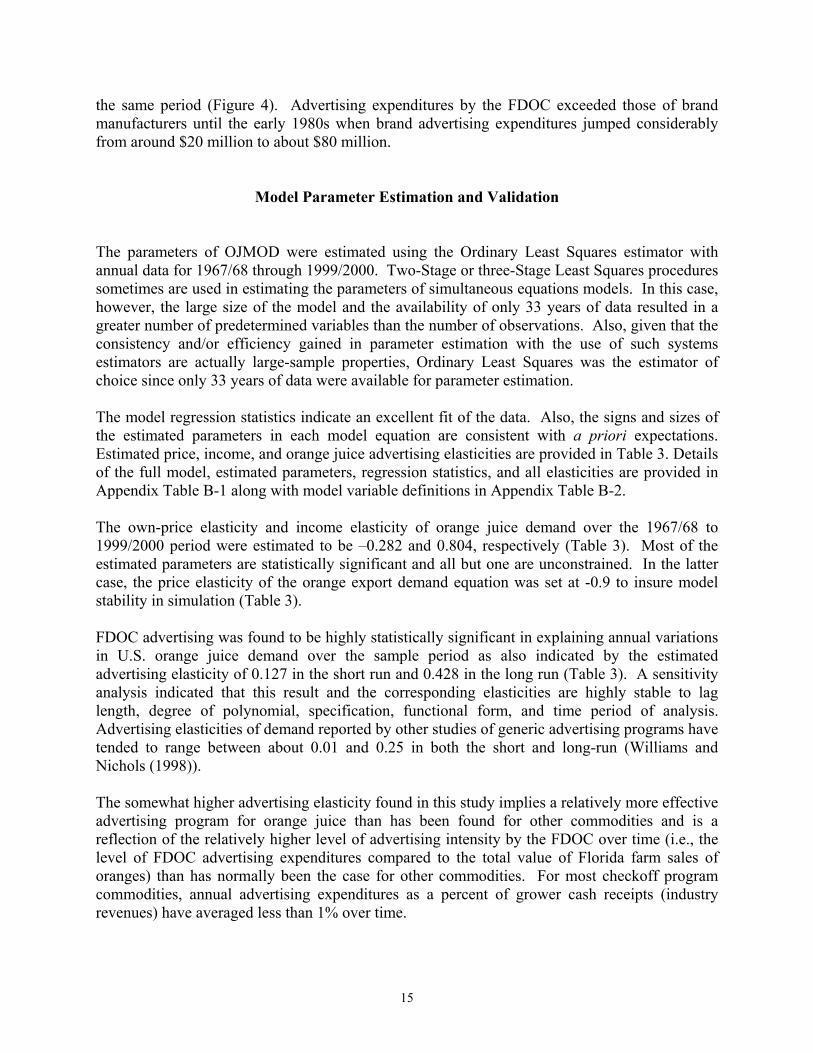
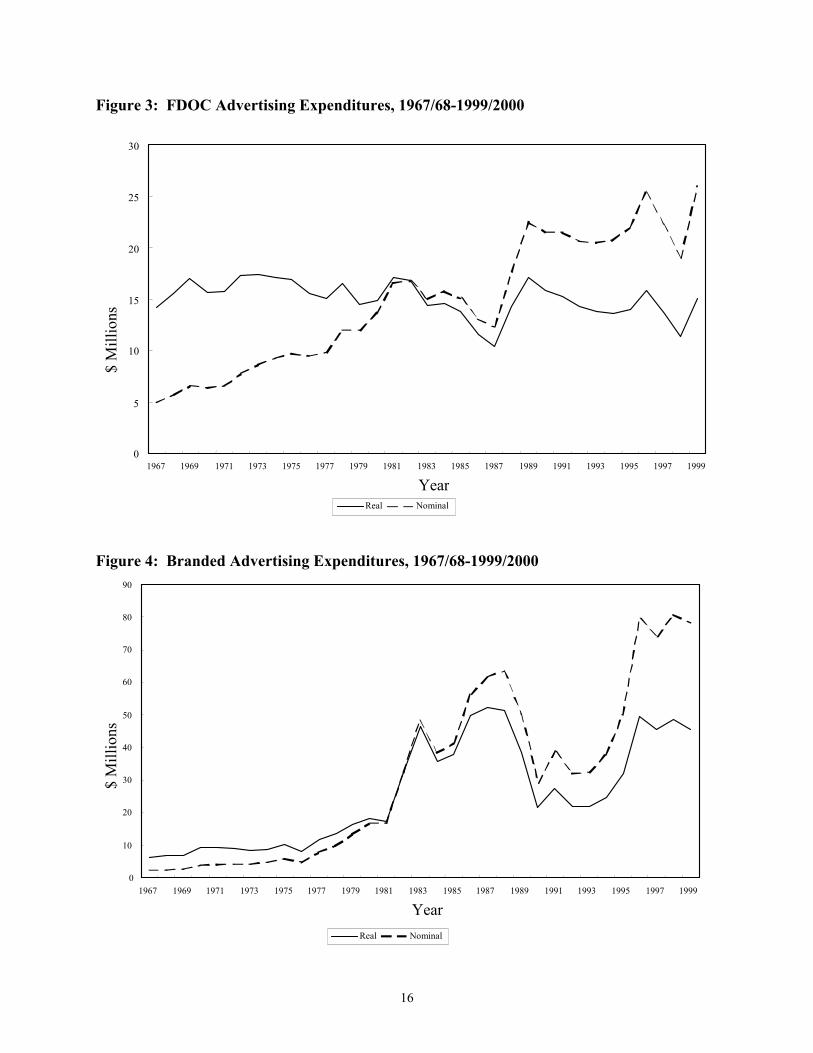
Nominal FDOC orange juice advertising expenditures since the mid-1960s have ranged from about $5 million to more than $25 million annually (Figure 3). In contrast, brand orange juice advertising expenditures ranged from roughly $2 million to more than $80 million annually over
15
the same period (Figure 4). Advertising expenditures by the FDOC exceeded those of brand manufacturers until the early 1980s when brand advertising expenditures jumped considerably from around $20 million to about $80 million.
Model Parameter Estimation and Validation The parameters of OJMOD were estimated using the Ordinary Least Squares estimator with annual data for 1967/68 through 1999/2000. Two-Stage or three-Stage Least Squares procedures sometimes are used in estimating the parameters of simultaneous equations models. In this case, however, the large size of the model and the availability of only 33 years of data resulted in a greater number of predetermined variables than the number of observations. Also, given that the consistency and/or efficiency gained in parameter estimation with the use of such systems estimators are actually large-sample properties, Ordinary Least Squares was the estimator of choice since only 33 years of data were available for parameter estimation.
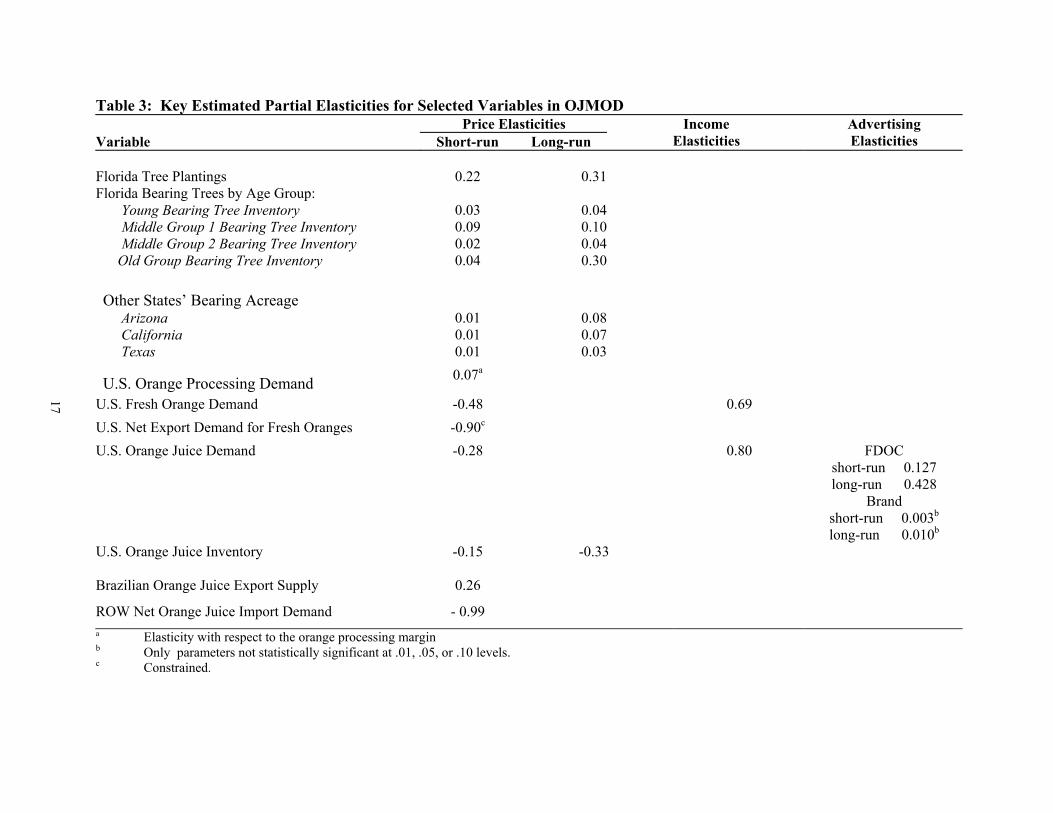
The model regression statistics indicate an excellent fit of the data. Also, the signs and sizes of the estimated parameters in each model equation are consistent with a priori expectations. Estimated price, income, and orange juice advertising elasticities are provided in Table 3. Details of the full model, estimated parameters, regression statistics, and all elasticities are provided in Appendix Table B-1 along with model variable definitions in Appendix Table B-2. The own-price elasticity and income elasticity of orange juice demand over the 1967/68 to 1999/2000 period were estimated to be –0.282 and 0.804, respectively (Table 3). Most of the estimated parameters are statistically significant and all but one are unconstrained. In the latter case, the price elasticity of the orange export demand equation was set at -0.9 to insure model stability in simulation (Table 3). FDOC advertising was found to be highly statistically significant in explaining annual variations in U.S. orange juice demand over the sample period as also indicated by the estimated advertising elasticity of 0.127 in the short run and 0.428 in the long run (Table 3). A sensitivity analysis indicated that this result and the corresponding elasticities are highly stable to lag length, degree of polynomial, specification, functional form, and time period of analysis. Advertising elasticities of demand reported by other studies of generic advertising programs have tended to range between about 0.01 and 0.25 in both the short and long-run (Williams and Nichols (1998)). The somewhat higher advertising elasticity found in this study implies a relatively more effective advertising program for orange juice than has been found for other commodities and is a reflection of the relatively higher level of advertising intensity by the FDOC over time (i.e., the level of FDOC advertising expenditures compared to the total value of Florida farm sales of oranges) than has normally been the case for other commodities. For most checkoff program commodities, annual advertising expenditures as a percent of grower cash receipts (industry revenues) have averaged less than 1% over time.
16
Figure 3: FDOC Advertising Expenditures, 1967/68-1999/2000
Figure 4: Branded Advertising Expenditures, 1967/68-1999/2000
0
5
10
15
20
25
30
1967 1969 1971 1973 1975 1977 1979 1981 1983 1985 1987 1989 1991 1993 1995 1997 1999
Year
$ M
illio
ns
Real Nominal
0
10
20
30
40
50
60
70
80
90
1967 1969 1971 1973 1975 1977 1979 1981 1983 1985 1987 1989 1991 1993 1995 1997 1999
Year
$ M
illio
ns
Real Nominal
17
Table 3: Key Estimated Partial Elasticities for Selected Variables in OJMOD Price Elasticities
Variable Short-run Long-run Income
Elasticities Advertising Elasticities
Florida Tree Plantings
0.22
0.31
Florida Bearing Trees by Age Group: Young Bearing Tree Inventory
0.03
0.04
Middle Group 1 Bearing Tree Inventory 0.09 0.10 Middle Group 2 Bearing Tree Inventory 0.02 0.04 Old Group Bearing Tree Inventory 0.04 0.30
Other States’ Bearing Acreage
Arizona 0.01 0.08 California 0.01 0.07 Texas 0.01 0.03
U.S. Orange Processing Demand 0.07a
U.S. Fresh Orange Demand -0.48 0.69 U.S. Net Export Demand for Fresh Oranges -0.90c U.S. Orange Juice Demand -0.28 0.80 FDOC
short-run 0.127 long-run 0.428
Brand short-run 0.003b
long-run 0.010b U.S. Orange Juice Inventory -0.15
-0.33
Brazilian Orange Juice Export Supply 0.26
ROW Net Orange Juice Import Demand - 0.99 a Elasticity with respect to the orange processing margin
b Only parameters not statistically significant at .01, .05, or .10 levels. c Constrained.
18
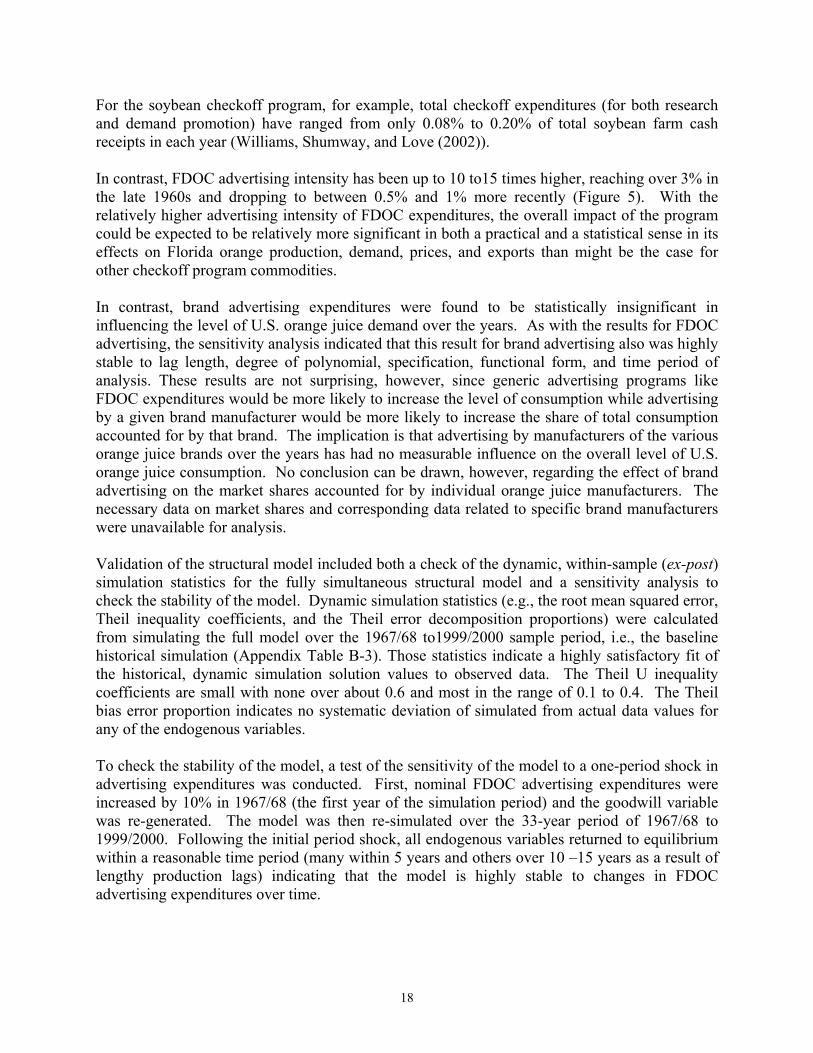
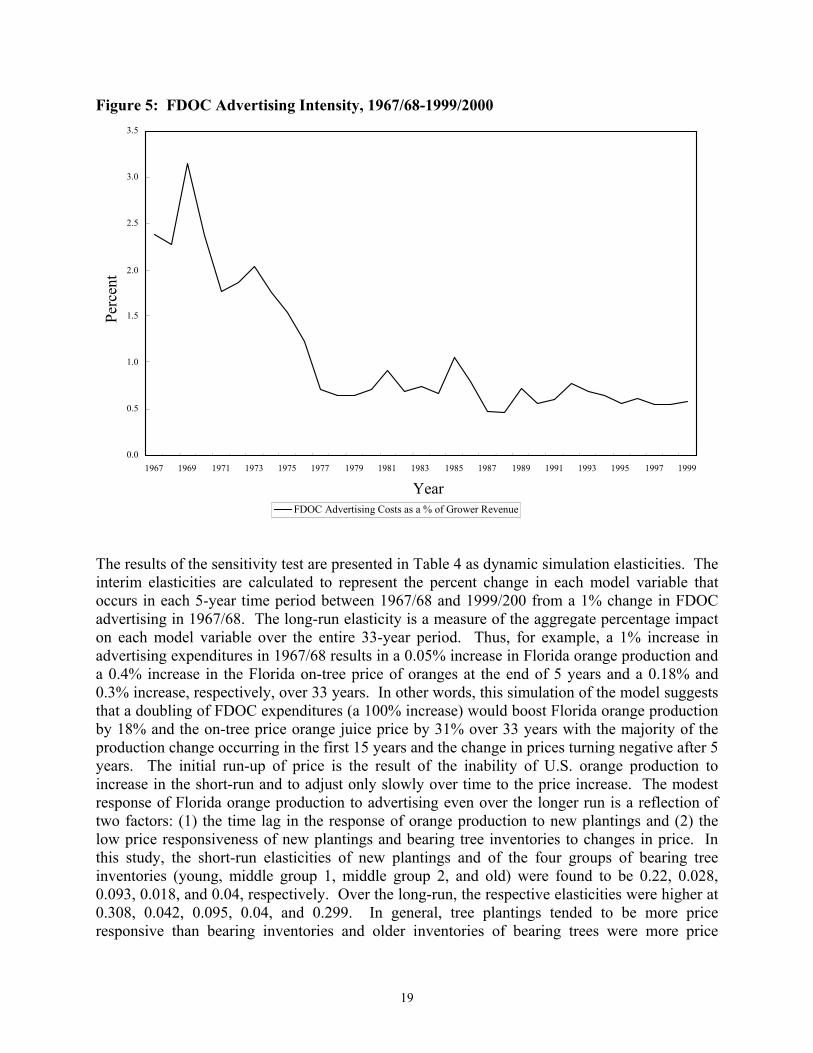
For the soybean checkoff program, for example, total checkoff expenditures (for both research and demand promotion) have ranged from only 0.08% to 0.20% of total soybean farm cash receipts in each year (Williams, Shumway, and Love (2002)). In contrast, FDOC advertising intensity has been up to 10 to15 times higher, reaching over 3% in the late 1960s and dropping to between 0.5% and 1% more recently (Figure 5). With the relatively higher advertising intensity of FDOC expenditures, the overall impact of the program could be expected to be relatively more significant in both a practical and a statistical sense in its effects on Florida orange production, demand, prices, and exports than might be the case for other checkoff program commodities. In contrast, brand advertising expenditures were found to be statistically insignificant in influencing the level of U.S. orange juice demand over the years. As with the results for FDOC advertising, the sensitivity analysis indicated that this result for brand advertising also was highly stable to lag length, degree of polynomial, specification, functional form, and time period of analysis. These results are not surprising, however, since generic advertising programs like FDOC expenditures would be more likely to increase the level of consumption while advertising by a given brand manufacturer would be more likely to increase the share of total consumption accounted for by that brand. The implication is that advertising by manufacturers of the various orange juice brands over the years has had no measurable influence on the overall level of U.S. orange juice consumption. No conclusion can be drawn, however, regarding the effect of brand advertising on the market shares accounted for by individual orange juice manufacturers. The necessary data on market shares and corresponding data related to specific brand manufacturers were unavailable for analysis. Validation of the structural model included both a check of the dynamic, within-sample (ex-post) simulation statistics for the fully simultaneous structural model and a sensitivity analysis to check the stability of the model. Dynamic simulation statistics (e.g., the root mean squared error, Theil inequality coefficients, and the Theil error decomposition proportions) were calculated from simulating the full model over the 1967/68 to1999/2000 sample period, i.e., the baseline historical simulation (Appendix Table B-3). Those statistics indicate a highly satisfactory fit of the historical, dynamic simulation solution values to observed data. The Theil U inequality coefficients are small with none over about 0.6 and most in the range of 0.1 to 0.4. The Theil bias error proportion indicates no systematic deviation of simulated from actual data values for any of the endogenous variables. To check the stability of the model, a test of the sensitivity of the model to a one-period shock in advertising expenditures was conducted. First, nominal FDOC advertising expenditures were increased by 10% in 1967/68 (the first year of the simulation period) and the goodwill variable was re-generated. The model was then re-simulated over the 33-year period of 1967/68 to 1999/2000. Following the initial period shock, all endogenous variables returned to equilibrium within a reasonable time period (many within 5 years and others over 10 –15 years as a result of lengthy production lags) indicating that the model is highly stable to changes in FDOC advertising expenditures over time.
19
0.0
0.5
1.0
1.5
2.0
2.5
3.0
3.5
1967 1969 1971 1973 1975 1977 1979 1981 1983 1985 1987 1989 1991 1993 1995 1997 1999
Year
Perc
ent
FDOC Advertising Costs as a % of Grower Revenue
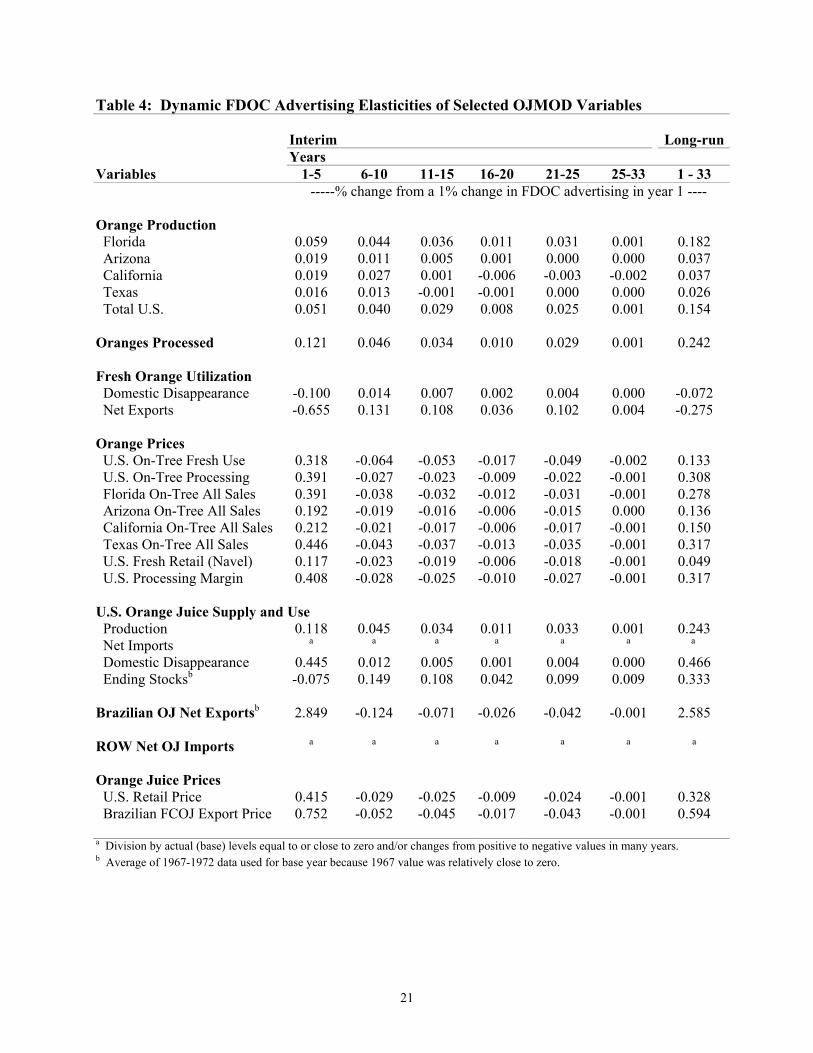
Figure 5: FDOC Advertising Intensity, 1967/68-1999/2000 The results of the sensitivity test are presented in Table 4 as dynamic simulation elasticities. The interim elasticities are calculated to represent the percent change in each model variable that occurs in each 5-year time period between 1967/68 and 1999/200 from a 1% change in FDOC advertising in 1967/68. The long-run elasticity is a measure of the aggregate percentage impact on each model variable over the entire 33-year period. Thus, for example, a 1% increase in advertising expenditures in 1967/68 results in a 0.05% increase in Florida orange production and a 0.4% increase in the Florida on-tree price of oranges at the end of 5 years and a 0.18% and 0.3% increase, respectively, over 33 years. In other words, this simulation of the model suggests that a doubling of FDOC expenditures (a 100% increase) would boost Florida orange production by 18% and the on-tree price orange juice price by 31% over 33 years with the majority of the production change occurring in the first 15 years and the change in prices turning negative after 5 years. The initial run-up of price is the result of the inability of U.S. orange production to increase in the short-run and to adjust only slowly over time to the price increase. The modest response of Florida orange production to advertising even over the longer run is a reflection of two factors: (1) the time lag in the response of orange production to new plantings and (2) the low price responsiveness of new plantings and bearing tree inventories to changes in price. In this study, the short-run elasticities of new plantings and of the four groups of bearing tree inventories (young, middle group 1, middle group 2, and old) were found to be 0.22, 0.028, 0.093, 0.018, and 0.04, respectively. Over the long-run, the respective elasticities were higher at 0.308, 0.042, 0.095, 0.04, and 0.299. In general, tree plantings tended to be more price responsive than bearing inventories and older inventories of bearing trees were more price
20
responsive than younger inventories. These results are consistent both with observed behavior and the few studies that have been published relating to orange supply price response. Alston, Freebairn, and Quilkey (1980), for example, find similar results for Australia and concluded that “Orange growers adjust resource allocation and production relatively little and slowly to changes in prices and profits.” As the dynamic elasticities in Table 4 suggest, a doubling of FDOC advertising in a given year would boost U.S. orange juice consumption by nearly 47% over 33 years with most of the change occurring in the first 5 years. Much of the initial increase in U.S. orange juice consumption comes from imports and increased domestic processing of oranges from oranges diverted primarily from export channels rather than domestic fresh markets. Most of the increased orange juice consumption in later years comes from the slowly growing production of U.S. oranges following the initial increase in new plantings and a reduction in tree removals in response to the price run-up. As orange production grows, prices decline so that the response of prices to an increase in FDOC advertising is less in the long run than in the short run.
Analyzing the Returns to Florida Growers from Advertising
As the discussion of the model and the dynamic elasticities has emphasized, even though advertising may effectively enhance the demand for orange juice, whether or not returns to growers are positive depends on myriad forces in U.S. and world orange juice markets as well as in fresh and processed orange markets which interact to determine the response of grower prices and orange production to the advertising campaigns. Isolating and measuring the specific effects of advertising on the profitability of Florida orange production involved a historical simulation analysis of the effects of the advertising expenditures. The analysis proceeds by using OJMOD to simulate the levels of the endogenous variables in the model (e.g., orange and orange juice production, demand, prices, etc.) over the 1967/68 to 1999/2000 period with and without the advertising expenditures and comparing the results. The model is first used to generate a baseline historical simulation of the endogenous variables in the model (e.g., orange and orange juice production, demand, prices, trade, etc.) over the 1967/68 to 1999/2000 period that closely replicate the actual, historical values of those variables. The baseline historical simulation for this study was generated in the process of validating OJMOD and represents the with-advertising-expenditures scenario. For the without-advertising-expenditures scenario, the historic values of the advertising expenditures were set at zero and the model again was simulated over the period of analysis. These simulation results provide a measure of what the levels of production, prices, consumption, trade, etc. would have been in the absence of the advertising program. Differences in the solution values of the endogenous variables in the without scenario from their baseline simulation solution values (the with-advertising scenario) are direct measures of the effects of the advertising expenditures over time.
21
Table 4: Dynamic FDOC Advertising Elasticities of Selected OJMOD Variables Interim Long-run Years Variables 1-5 6-10 11-15 16-20 21-25 25-33 1 - 33 -----% change from a 1% change in FDOC advertising in year 1 ----
Orange Production Florida 0.059 0.044 0.036 0.011 0.031 0.001 0.182 Arizona 0.019 0.011 0.005 0.001 0.000 0.000 0.037 California 0.019 0.027 0.001 -0.006 -0.003 -0.002 0.037 Texas 0.016 0.013 -0.001 -0.001 0.000 0.000 0.026 Total U.S. 0.051 0.040 0.029 0.008 0.025 0.001 0.154 Oranges Processed 0.121 0.046 0.034 0.010 0.029 0.001 0.242 Fresh Orange Utilization Domestic Disappearance -0.100 0.014 0.007 0.002 0.004 0.000 -0.072 Net Exports -0.655 0.131 0.108 0.036 0.102 0.004 -0.275 Orange Prices U.S. On-Tree Fresh Use 0.318 -0.064 -0.053 -0.017 -0.049 -0.002 0.133 U.S. On-Tree Processing 0.391 -0.027 -0.023 -0.009 -0.022 -0.001 0.308 Florida On-Tree All Sales 0.391 -0.038 -0.032 -0.012 -0.031 -0.001 0.278 Arizona On-Tree All Sales 0.192 -0.019 -0.016 -0.006 -0.015 0.000 0.136 California On-Tree All Sales 0.212 -0.021 -0.017 -0.006 -0.017 -0.001 0.150 Texas On-Tree All Sales 0.446 -0.043 -0.037 -0.013 -0.035 -0.001 0.317 U.S. Fresh Retail (Navel) 0.117 -0.023 -0.019 -0.006 -0.018 -0.001 0.049 U.S. Processing Margin 0.408 -0.028 -0.025 -0.010 -0.027 -0.001 0.317 U.S. Orange Juice Supply and Use Production 0.118 0.045 0.034 0.011 0.033 0.001 0.243 Net Imports a a a a a a a
Domestic Disappearance 0.445 0.012 0.005 0.001 0.004 0.000 0.466 Ending Stocksb -0.075 0.149 0.108 0.042 0.099 0.009 0.333 Brazilian OJ Net Exportsb 2.849 -0.124 -0.071 -0.026 -0.042 -0.001 2.585 ROW Net OJ Imports a a a a a a a
Orange Juice Prices U.S. Retail Price 0.415 -0.029 -0.025 -0.009 -0.024 -0.001 0.328 Brazilian FCOJ Export Price 0.752 -0.052 -0.045 -0.017 -0.043 -0.001 0.594 a Division by actual (base) levels equal to or close to zero and/or changes from positive to negative values in many years. b Average of 1967-1972 data used for base year because 1967 value was relatively close to zero.
22
Because no other exogenous variable in the model is allowed to change (e.g., marketing or production costs, levels of inflation, exchange rates, income levels, import tariff levels, weather, etc.), this process effectively isolates the effects of the advertising expenditures on the endogenous variables in the model.
Following this process, three without-advertising-expenditures scenarios were originally intended to be simulated and compared to the baseline simulation: (1) without FDOC advertising expenditures, (2) without brand advertising expenditures, and (3) without either FDOC or brand advertising expenditures. Given that the econometric analysis determined that brand advertising had no statistically significant effect on the level of U.S. orange juice consumption over the 33year period of analysis, only the first of the three scenarios could be meaningfully analyzed.
The simulation analysis of the effectiveness of the orange juice advertising expenditures by the Florida Department of Citrus was designed to address at three key questions: (1) What have been the effects of the FDOC advertising expenditures on U.S. orange and orange juice markets? (2) Have orange growers benefited from the FDOC advertising program? (3) Would Florida orange growers have been better off if the taxes they have paid over the years in support of the FDOC advertising programs instead had been invested in other financial opportunities?
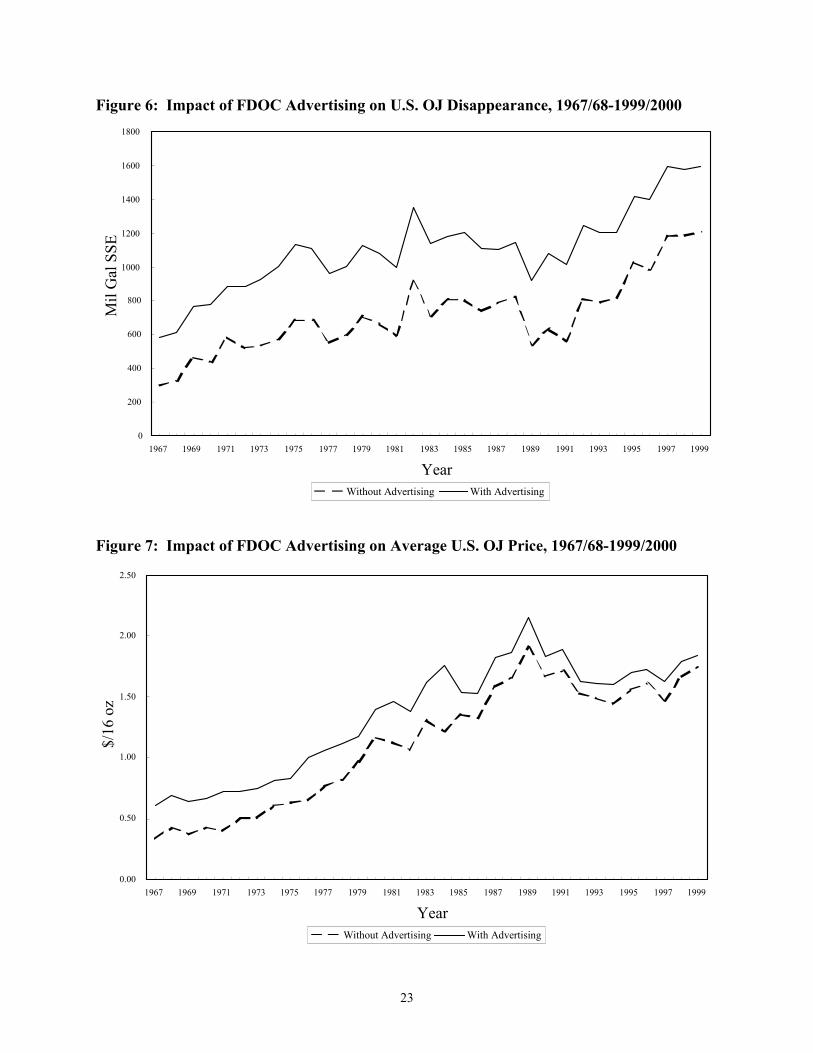
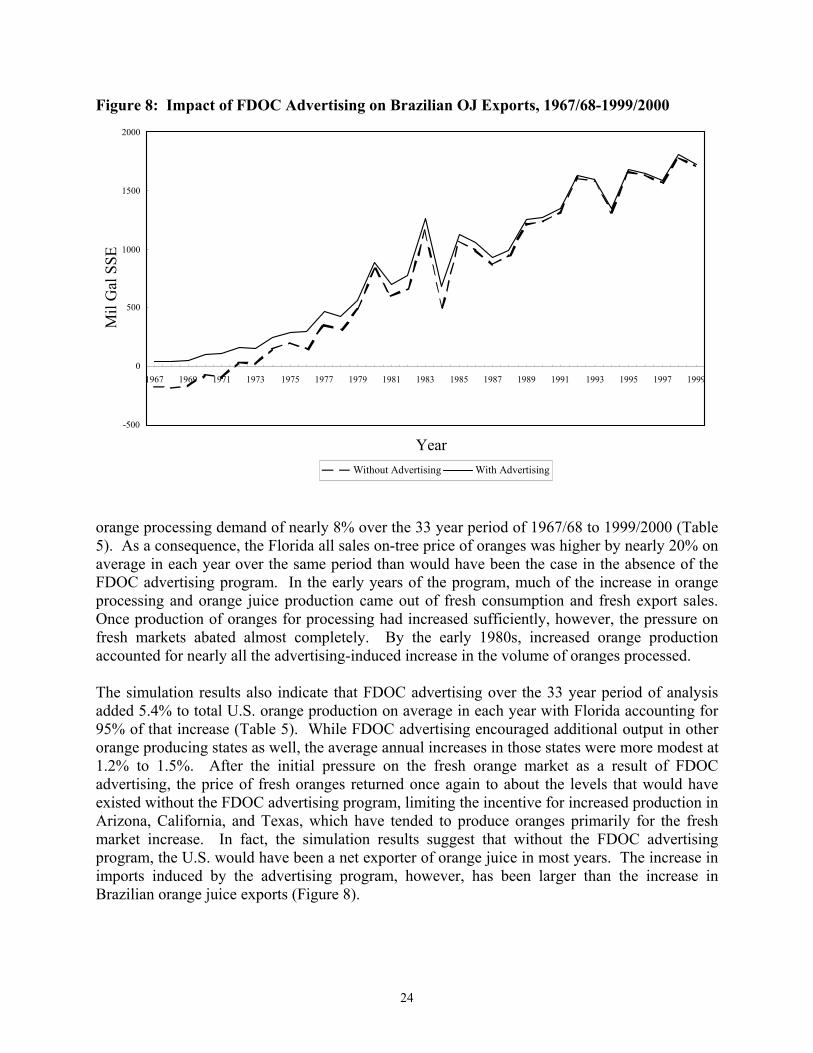
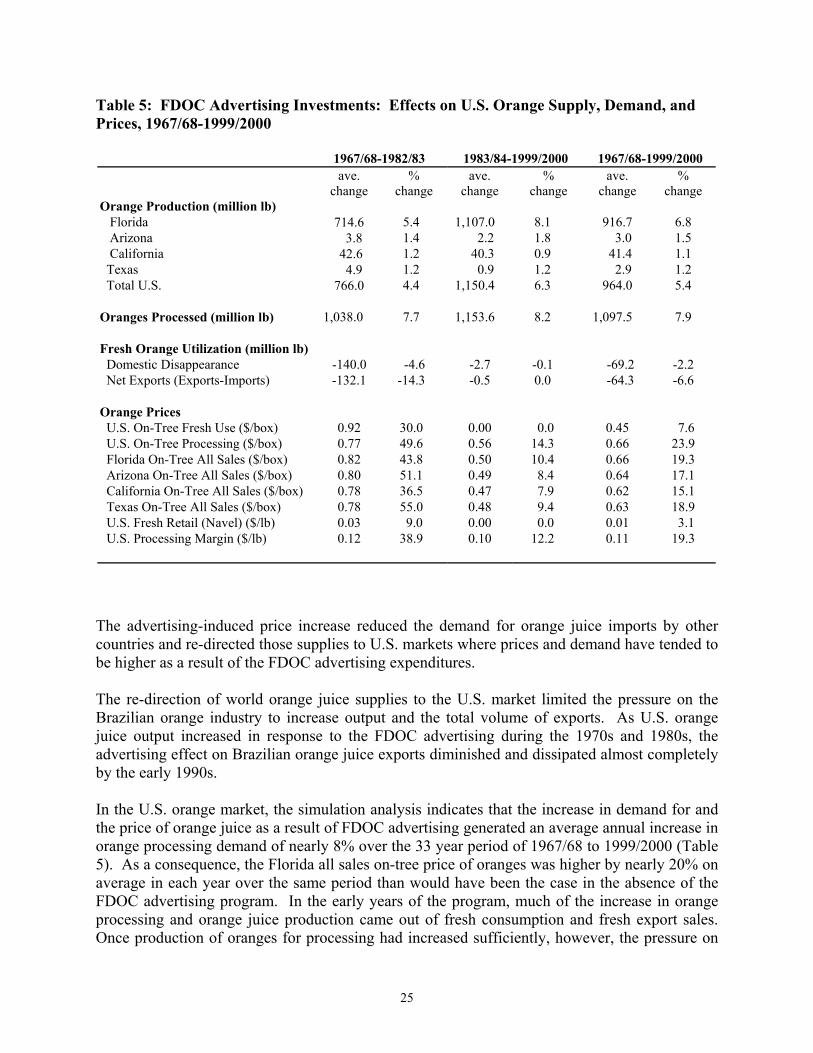
Effects of FDOC Advertising on U.S. Orange and Orange Juice Markets The simulation results demonstrate clearly that the FDOC advertising program has effectively increased U.S. orange juice demand and the retail price of orange juice (Figures 6 and 7). Over the 1967/68 to 1999/2000 period of analysis, FDOC expenditures on orange juice advertising increased the demand for orange juice in each year by an average of 388 million gallons (SSE) and boosted the annual average price of orange juice by $0.23/16 oz. The average annual orange juice price increase in the first half of the period ($0.27/16 oz) was nearly double that in the second half of the period ($0.15/16oz) due to the slow rate of domestic supply response to the demand-induced increase in price. As a consequence, U.S. net imports of orange juice accounted for most of the demand increase in the first half of the period but a lower share in the second half as domestic production began slowly coming on-line in response to the price increase. In fact, the simulation results suggest that without the FDOC advertising program, the U.S. would have been a net exporter of orange juice in most years. The increase in imports induced by the advertising program, however, has been larger than the increase in Brazilian orange juice exports (Figure 8). The advertising-induced price increase reduced the demand for orange juice imports by other countries and re-directed those supplies to U.S. markets where prices and demand have tended to be higher as a result of the FDOC advertising expenditures. The re-direction of world orange juice supplies to the U.S. market limited the pressure on the Brazilian orange industry to increase output and the total volume of exports. As U.S. orange juice output increased in response to the FDOC advertising during the 1970s and 1980s, the advertising effect on Brazilian orange juice exports diminished and dissipated almost completely by the early 1990s. In the U.S. orange market, the simulation analysis indicates that the increase in demand for and the price of orange juice as a result of FDOC advertising generated an average annual increase in
23
Figure 6: Impact of FDOC Advertising on U.S. OJ Disappearance, 1967/68-1999/2000
Figure 7: Impact of FDOC Advertising on Average U.S. OJ Price, 1967/68-1999/2000
0
200
400
600
800
1000
1200
1400
1600
1800
1967 1969 1971 1973 1975 1977 1979 1981 1983 1985 1987 1989 1991 1993 1995 1997 1999
Year
Mil
Gal
SSE
Without Advertising With Advertising
0.00
0.50
1.00
1.50
2.00
2.50
1967 1969 1971 1973 1975 1977 1979 1981 1983 1985 1987 1989 1991 1993 1995 1997 1999
Year
$/16
oz
Without Advertising With Advertising
24
Figure 8: Impact of FDOC Advertising on Brazilian OJ Exports, 1967/68-1999/2000
orange processing demand of nearly 8% over the 33 year period of 1967/68 to 1999/2000 (Table 5). As a consequence, the Florida all sales on-tree price of oranges was higher by nearly 20% on average in each year over the same period than would have been the case in the absence of the FDOC advertising program. In the early years of the program, much of the increase in orange processing and orange juice production came out of fresh consumption and fresh export sales. Once production of oranges for processing had increased sufficiently, however, the pressure on fresh markets abated almost completely. By the early 1980s, increased orange production accounted for nearly all the advertising-induced increase in the volume of oranges processed.
The simulation results also indicate that FDOC advertising over the 33 year period of analysis added 5.4% to total U.S. orange production on average in each year with Florida accounting for 95% of that increase (Table 5). While FDOC advertising encouraged additional output in other orange producing states as well, the average annual increases in those states were more modest at 1.2% to 1.5%. After the initial pressure on the fresh orange market as a result of FDOC advertising, the price of fresh oranges returned once again to about the levels that would have existed without the FDOC advertising program, limiting the incentive for increased production in Arizona, California, and Texas, which have tended to produce oranges primarily for the fresh market increase. In fact, the simulation results suggest that without the FDOC advertising program, the U.S. would have been a net exporter of orange juice in most years. The increase in imports induced by the advertising program, however, has been larger than the increase in Brazilian orange juice exports (Figure 8).
-500
0
500
1000
1500
2000
1967 1969 1971 1973 1975 1977 1979 1981 1983 1985 1987 1989 1991 1993 1995 1997 1999
Year
Mil
Gal
SSE
Without Advertising With Advertising
25
Table 5: FDOC Advertising Investments: Effects on U.S. Orange Supply, Demand, and Prices, 1967/68-1999/2000 1967/68-1982/83 1983/84-1999/2000 1967/68-1999/2000 ave.
change %
change ave.
change %
change ave.
change %
change Orange Production (million lb) Florida 714.6 5.4 1,107.0 8.1 916.7 6.8 Arizona 3.8 1.4 2.2 1.8 3.0 1.5 California 42.6 1.2 40.3 0.9 41.4 1.1 Texas 4.9 1.2 0.9 1.2 2.9 1.2 Total U.S. 766.0 4.4 1,150.4 6.3 964.0 5.4 Oranges Processed (million lb) 1,038.0 7.7 1,153.6 8.2 1,097.5 7.9 Fresh Orange Utilization (million lb) Domestic Disappearance -140.0 -4.6 -2.7 -0.1 -69.2 -2.2 Net Exports (Exports-Imports) -132.1 -14.3 -0.5 0.0 -64.3 -6.6 Orange Prices U.S. On-Tree Fresh Use ($/box) 0.92 30.0 0.00 0.0 0.45 7.6 U.S. On-Tree Processing ($/box) 0.77 49.6 0.56 14.3 0.66 23.9 Florida On-Tree All Sales ($/box) 0.82 43.8 0.50 10.4 0.66 19.3 Arizona On-Tree All Sales ($/box) 0.80 51.1 0.49 8.4 0.64 17.1 California On-Tree All Sales ($/box) 0.78 36.5 0.47 7.9 0.62 15.1 Texas On-Tree All Sales ($/box) 0.78 55.0 0.48 9.4 0.63 18.9 U.S. Fresh Retail (Navel) ($/lb) 0.03 9.0 0.00 0.0 0.01 3.1 U.S. Processing Margin ($/lb) 0.12 38.9 0.10 12.2 0.11 19.3 The advertising-induced price increase reduced the demand for orange juice imports by other countries and re-directed those supplies to U.S. markets where prices and demand have tended to be higher as a result of the FDOC advertising expenditures. The re-direction of world orange juice supplies to the U.S. market limited the pressure on the Brazilian orange industry to increase output and the total volume of exports. As U.S. orange juice output increased in response to the FDOC advertising during the 1970s and 1980s, the advertising effect on Brazilian orange juice exports diminished and dissipated almost completely by the early 1990s.
In the U.S. orange market, the simulation analysis indicates that the increase in demand for and the price of orange juice as a result of FDOC advertising generated an average annual increase in orange processing demand of nearly 8% over the 33 year period of 1967/68 to 1999/2000 (Table 5). As a consequence, the Florida all sales on-tree price of oranges was higher by nearly 20% on average in each year over the same period than would have been the case in the absence of the FDOC advertising program. In the early years of the program, much of the increase in orange processing and orange juice production came out of fresh consumption and fresh export sales. Once production of oranges for processing had increased sufficiently, however, the pressure on
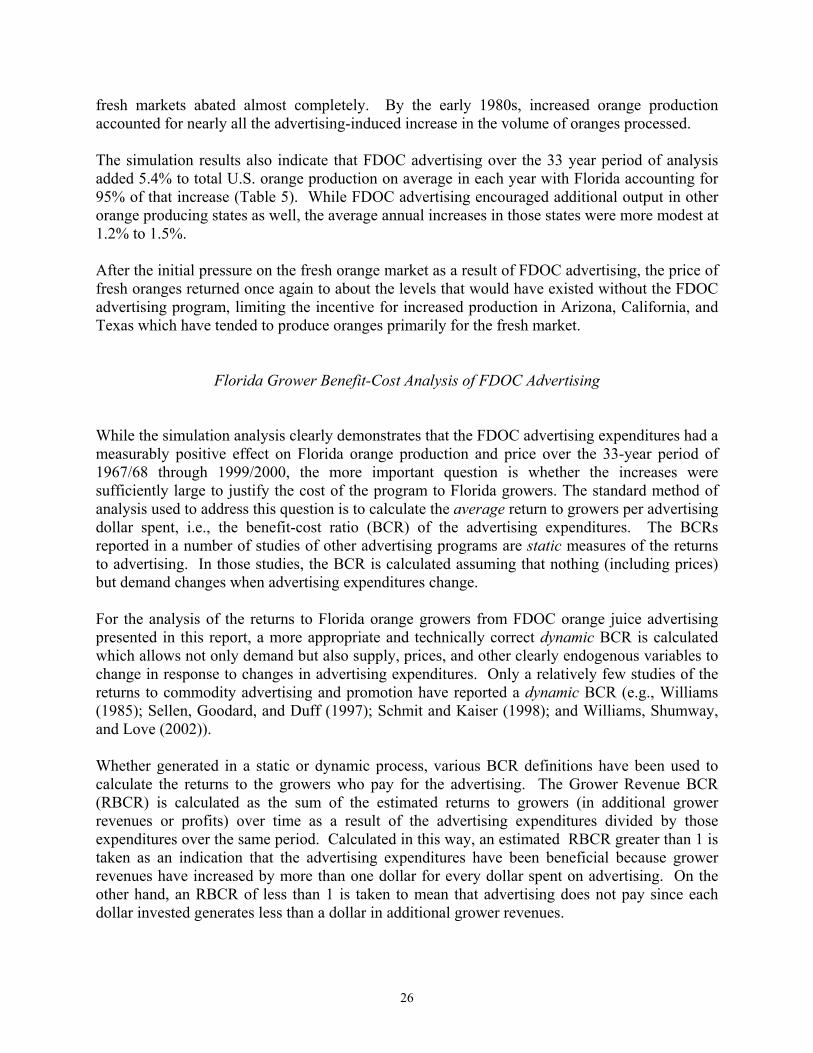
26
fresh markets abated almost completely. By the early 1980s, increased orange production accounted for nearly all the advertising-induced increase in the volume of oranges processed. The simulation results also indicate that FDOC advertising over the 33 year period of analysis added 5.4% to total U.S. orange production on average in each year with Florida accounting for 95% of that increase (Table 5). While FDOC advertising encouraged additional output in other orange producing states as well, the average annual increases in those states were more modest at 1.2% to 1.5%. After the initial pressure on the fresh orange market as a result of FDOC advertising, the price of fresh oranges returned once again to about the levels that would have existed without the FDOC advertising program, limiting the incentive for increased production in Arizona, California, and Texas which have tended to produce oranges primarily for the fresh market.
Florida Grower Benefit-Cost Analysis of FDOC Advertising While the simulation analysis clearly demonstrates that the FDOC advertising expenditures had a measurably positive effect on Florida orange production and price over the 33-year period of 1967/68 through 1999/2000, the more important question is whether the increases were sufficiently large to justify the cost of the program to Florida growers. The standard method of analysis used to address this question is to calculate the average return to growers per advertising dollar spent, i.e., the benefit-cost ratio (BCR) of the advertising expenditures. The BCRs reported in a number of studies of other advertising programs are static measures of the returns to advertising. In those studies, the BCR is calculated assuming that nothing (including prices) but demand changes when advertising expenditures change.
For the analysis of the returns to Florida orange growers from FDOC orange juice advertising presented in this report, a more appropriate and technically correct dynamic BCR is calculated which allows not only demand but also supply, prices, and other clearly endogenous variables to change in response to changes in advertising expenditures. Only a relatively few studies of the returns to commodity advertising and promotion have reported a dynamic BCR (e.g., Williams (1985); Sellen, Goodard, and Duff (1997); Schmit and Kaiser (1998); and Williams, Shumway, and Love (2002)). Whether generated in a static or dynamic process, various BCR definitions have been used to calculate the returns to the growers who pay for the advertising. The Grower Revenue BCR (RBCR) is calculated as the sum of the estimated returns to growers (in additional grower revenues or profits) over time as a result of the advertising expenditures divided by those expenditures over the same period. Calculated in this way, an estimated RBCR greater than 1 is taken as an indication that the advertising expenditures have been beneficial because grower revenues have increased by more than one dollar for every dollar spent on advertising. On the other hand, an RBCR of less than 1 is taken to mean that advertising does not pay since each dollar invested generates less than a dollar in additional grower revenues.
27
More meaningful is the Grower Profit Benefit-Cost Ratio (PBCR). As usually calculated, the PBCR is the total grower revenue added as a consequence of the advertising expenditures over time divided by the level of advertising expenditures made to generate those additional revenues after deducting the additional production costs required to produce the additional output generated. In this study, a dynamic PBCR is calculated by first calculating the additional grower profits (in million $) generated by FDOC advertising in each year (t) as:
(2) s s s s b b b bR = (p q - c B ) - (p q - c B )t t t t t t t t t
where p is the on-tree price of oranges ($/box); c is production cost ($/tree); B is the inventory of bearing trees (1,000); q is production of oranges (1,000 boxes); and s and b indicate scenario and baseline simulation value, respectively. Then, the Grower Profit BCR is calculated as:
(3)
TRtt=1PBCR = TAtt=1
∑
∑
where A is the advertising expenditures ($ million). If the cost of the advertising in each year (At) is first netted out of the additional profit generated (Rt) in those years (i.e., Rt - At), then the Grower Net Profit BCR (NBCR) is calculated as:
(4) NBCR = PBCR – 1.
As is done by Sellen, Goodard, and Duff (1997), Davis, et al. (2001), Williams, Love, and Shumway (2002), and others, the time value of money can be accounted for in calculating the Grower Profit BCR by first discounting the grower profits over time to present value before dividing by total advertising expenditures. Consequently, the Discounted Grower Profit BCR (DBCR) can be calculated as:
(5)
T t(R -A )/(1+i)t tt=1DBCR= TA tt=1
∑
∑
where i is the interest rate chosen to discount the additional profit flows to present value. Obviously, the level of the DBCR depends on the rate used to discount the benefits over time. In this study, the DBCR was calculated using the 30-day Treasury bill interest rates (IMF) for 1967/68 through 1999//2000. Sellen, Goodard, and Duff (1997) and Davis, et al. (2001) made an arbitrary choice of an annual 5% fixed rate as the discount rate. Because the Treasury bill interest rate averaged 7.1% between 1978 and 1994, using a fixed 5% rate would generate a higher DBCR. The Treasury bill rate was selected simply because it represents a realistic alternative investment rate for the 1967/68 to 1999/2000 period.
28
Using the simulation analysis results for the FDOC advertising program, the Florida Grower RBCR was calculated to be $9.2 per dollar spent by the FDOC on advertising over the 1967/68 to 1999/2000 period (Table 6). Subtracting the cost of the additional production from the increase in revenues earned by Florida producers as a result of FDOC advertising yields a Florida Grower PBCR of $7.1 per FDOC advertising dollar spent over the same period. Then, subtracting the cost of the box tax paid by growers from the additional profits earned generates a Florida Grower NBCR of $6.1 per dollar spent on advertising by the FDOC over the 1967/68 to 1999/2000 period of analysis. These results fall in the middle of the range of the BCRs calculated for other commodities with similar producer-financed promotional programs of about $2 to $12 (Williams and Nichols, 1998).
When the additional grower profits generated by the FDOC advertising program are discounted to present value to account for the time value of money, the discounted ratio of benefits to costs (DBCR) is just under $3 per FDOC advertising dollar spent (Table 6). The DBCR calculation is increasingly recognized as the most appropriate measure of the returns to the producers that pay for commodity advertising and checkoff programs. So even though the simulation results suggest that Florida growers earned a profit of $6 per dollar spent by the FDOC net of the assessment they paid on average over the period of 1967/68 through 1999/2000, the actual return they earned is less after taking into consideration the opportunity cost of those assessments (that is, the fact that the funds could have been invested in other financial instruments and earned a return if they had not been used to support FDOC advertising programs). The DBCR of $2.9 per dollar spent by the FDOC on average over the period suggests that FDOC advertising has been a successful investment for Florida growers over the 1967/68 to 1999/2000 period of analysis. Note that however calculated, the BCRs to the FDOC advertising program were all lower in the second half of the 33 year period of analysis than in the first half. This result happens for at least two reasons. First, in the initial years of the program, the inability of domestic orange production to meet the growing processing orange demand led to a substantial price run-up and windfall particularly to Florida growers who specialize in producing oranges for orange juice production. As sufficient additional production came on line after 10 to 15 years, the subsequent moderation of the price increase also enervated the increase in industry profits. Second, after demonstrating strong growth from about $5 million in the late 1960s to nearly $17 million in the early 1980s, FDOC expenditures experienced a precipitous 26% drop in the mid-1980s which arrested the momentum in the program and released the upward pressure on prices. After about a 5-year hiatus, expenditures again returned to the levels of the 1970s and more but much of the steam in the program had been lost and needed to be re-generated as production levels again began responding slowly to the increasing upward price pressure once again Consequently, returns to growers dropped not only in the years of the expenditure declines but also for a number of years thereafter as production slowly responded to the renewed spending.
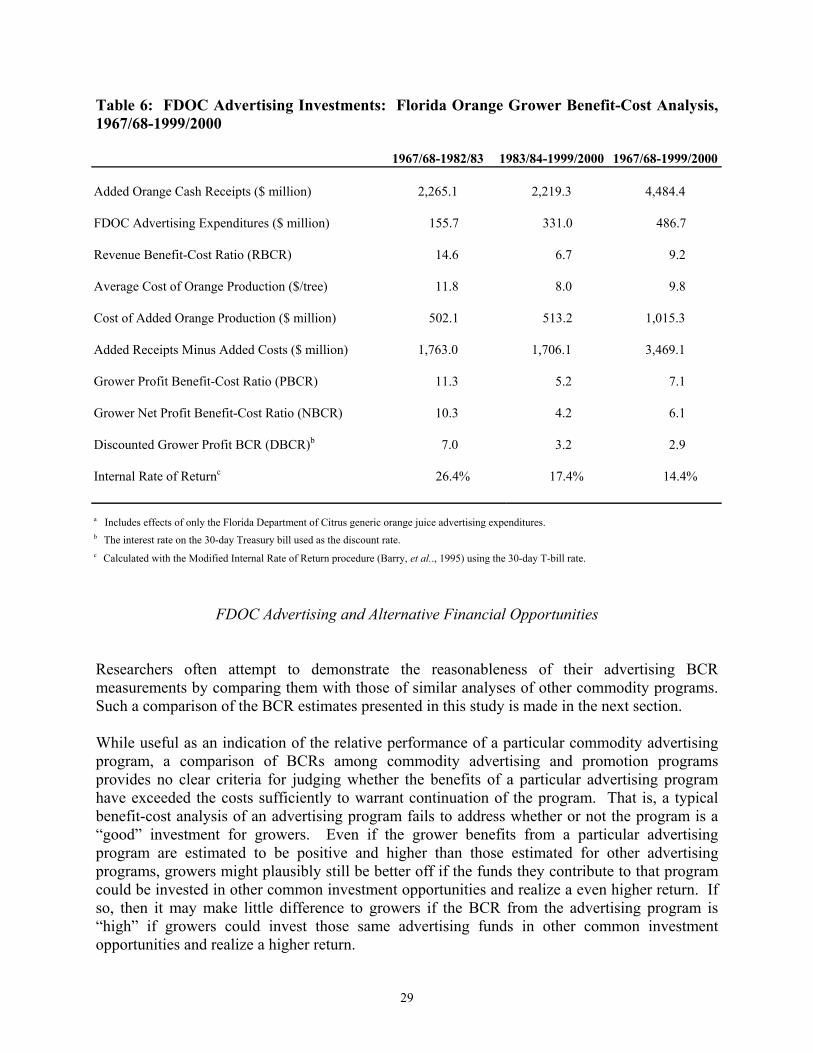
29
Table 6: FDOC Advertising Investments: Florida Orange Grower Benefit-Cost Analysis, 1967/68-1999/2000 1967/68-1982/83 1983/84-1999/2000 1967/68-1999/2000 Added Orange Cash Receipts ($ million) 2,265.1 2,219.3 4,484.4 FDOC Advertising Expenditures ($ million) 155.7 331.0 486.7 Revenue Benefit-Cost Ratio (RBCR) 14.6 6.7 9.2 Average Cost of Orange Production ($/tree) 11.8 8.0 9.8 Cost of Added Orange Production ($ million) 502.1 513.2 1,015.3 Added Receipts Minus Added Costs ($ million) 1,763.0 1,706.1 3,469.1 Grower Profit Benefit-Cost Ratio (PBCR) 11.3 5.2 7.1 Grower Net Profit Benefit-Cost Ratio (NBCR) 10.3 4.2 6.1 Discounted Grower Profit BCR (DBCR)b 7.0 3.2 2.9 Internal Rate of Returnc 26.4% 17.4% 14.4% a Includes effects of only the Florida Department of Citrus generic orange juice advertising expenditures. b The interest rate on the 30-day Treasury bill used as the discount rate. c Calculated with the Modified Internal Rate of Return procedure (Barry, et al.., 1995) using the 30-day T-bill rate.
FDOC Advertising and Alternative Financial Opportunities
Researchers often attempt to demonstrate the reasonableness of their advertising BCR measurements by comparing them with those of similar analyses of other commodity programs. Such a comparison of the BCR estimates presented in this study is made in the next section.
While useful as an indication of the relative performance of a particular commodity advertising program, a comparison of BCRs among commodity advertising and promotion programs provides no clear criteria for judging whether the benefits of a particular advertising program have exceeded the costs sufficiently to warrant continuation of the program. That is, a typical benefit-cost analysis of an advertising program fails to address whether or not the program is a “good” investment for growers. Even if the grower benefits from a particular advertising program are estimated to be positive and higher than those estimated for other advertising programs, growers might plausibly still be better off if the funds they contribute to that program could be invested in other common investment opportunities and realize a even higher return. If so, then it may make little difference to growers if the BCR from the advertising program is “high” if growers could invest those same advertising funds in other common investment opportunities and realize a higher return.
30
A standard method for determining the highest yielding investment opportunity is the modified internal rate of return (MIRR) procedure as defined in Barry, et al. (1995). In analyzing alternative business investments, the MIRR is often referred to as the discounted rate of return, the marginal efficiency of capital, and the yield of an investment (Barry, et al., 1995) and is calculated as:
(2-6) 1
FV TMIRR = -1PV
where FV is the future value of the estimated grower industry profits generated by investments in advertising as simulated with the use of OJMOD evaluated at the end of the period of analysis, PV is the present value of the advertising expenditures evaluated at the beginning of the period of analysis, and T is the number of years of analysis.
Thus, the MIRR is a measure of the change in the future value of the estimated returns to advertising over time resulting from a change in advertising expenditures expressed in percentage terms. Consequently, while a BCR represents the estimated average return to advertising expenditures over time (i.e., the returns per dollar invested), an MIRR expresses the estimated marginal return to such expenditures (i.e., the percent change in returns from a one percent change in advertising).
As with the discounted BCR, the choice of the discount rate to calculate the PV and FV in the MIRR formula is crucial. Rather than choosing some arbitrary rate, however, alternative rates are chosen representing relevant investment alternatives facing the investor. For analysis of the FDOC orange juice advertising program, the 30-day Treasury bill rate was used because Treasury bills represent a realistic, conservative investment alternative for growers. At 14.4%, the estimated MIRR to Florida orange growers suggests that the FDOC advertising program over the 1967/68 to 1999/2000 period of analysis was an attractive investment alternative for the funds collected from Florida growers (Table 6). Few investment alternatives, if any, probably were available to Florida growers that could have returned more than 14.4% on average annually over the entire 33-year period of 1967/68 to 1999/2000.
Comparison of Estimated Returns to Commodity Advertising and Promotion Programs
To place the results generated from the foregoing analysis of the returns to Florida orange growers from FDOC advertising expenditures in context, this section compares the results of other studies of the producer returns to commodity advertising and promotion programs. Given the proliferation of producer-sponsored commodity promotion programs in recent years, predominantly in the United States, Canada, and Australia, there has been a growing body of research focused on estimating the impacts of those programs on market demand. Much of this research has focused on the benefits to producers from funded generic promotion activities (Williams and Nichols (1998)).
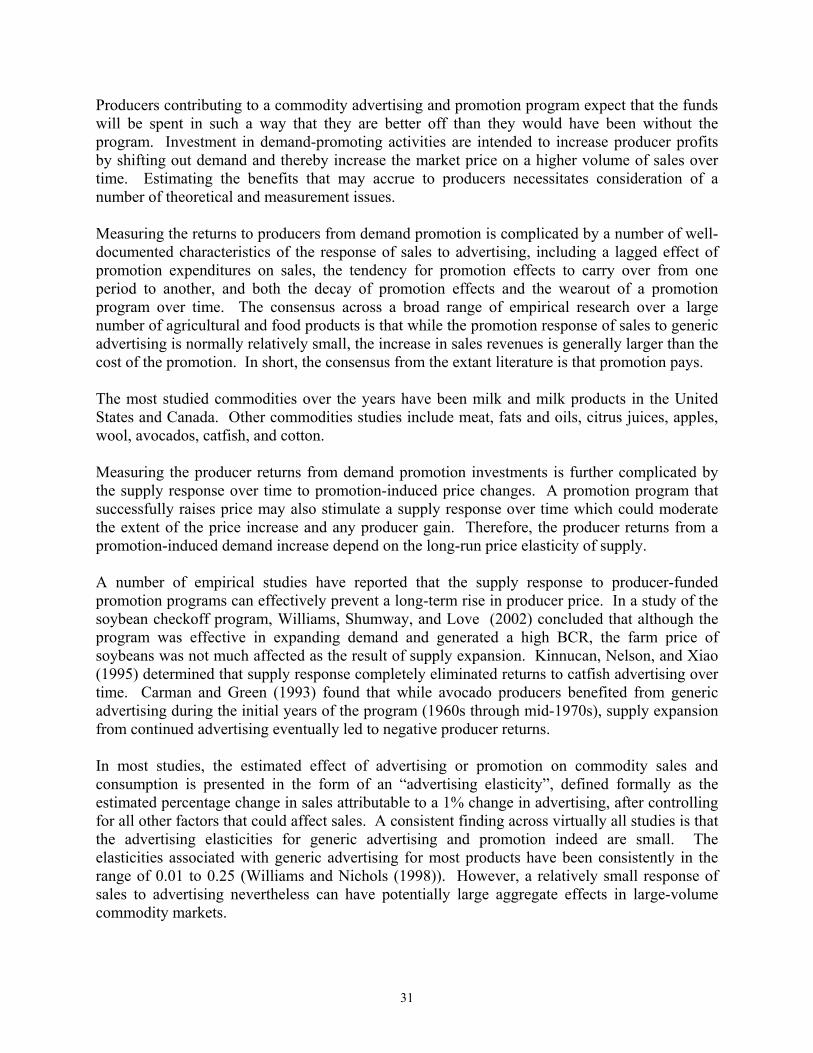
31
Producers contributing to a commodity advertising and promotion program expect that the funds will be spent in such a way that they are better off than they would have been without the program. Investment in demand-promoting activities are intended to increase producer profits by shifting out demand and thereby increase the market price on a higher volume of sales over time. Estimating the benefits that may accrue to producers necessitates consideration of a number of theoretical and measurement issues.
Measuring the returns to producers from demand promotion is complicated by a number of well-documented characteristics of the response of sales to advertising, including a lagged effect of promotion expenditures on sales, the tendency for promotion effects to carry over from one period to another, and both the decay of promotion effects and the wearout of a promotion program over time. The consensus across a broad range of empirical research over a large number of agricultural and food products is that while the promotion response of sales to generic advertising is normally relatively small, the increase in sales revenues is generally larger than the cost of the promotion. In short, the consensus from the extant literature is that promotion pays.
The most studied commodities over the years have been milk and milk products in the United States and Canada. Other commodities studies include meat, fats and oils, citrus juices, apples, wool, avocados, catfish, and cotton.
Measuring the producer returns from demand promotion investments is further complicated by the supply response over time to promotion-induced price changes. A promotion program that successfully raises price may also stimulate a supply response over time which could moderate the extent of the price increase and any producer gain. Therefore, the producer returns from a promotion-induced demand increase depend on the long-run price elasticity of supply. A number of empirical studies have reported that the supply response to producer-funded promotion programs can effectively prevent a long-term rise in producer price. In a study of the soybean checkoff program, Williams, Shumway, and Love (2002) concluded that although the program was effective in expanding demand and generated a high BCR, the farm price of soybeans was not much affected as the result of supply expansion. Kinnucan, Nelson, and Xiao (1995) determined that supply response completely eliminated returns to catfish advertising over time. Carman and Green (1993) found that while avocado producers benefited from generic advertising during the initial years of the program (1960s through mid-1970s), supply expansion from continued advertising eventually led to negative producer returns.
In most studies, the estimated effect of advertising or promotion on commodity sales and consumption is presented in the form of an “advertising elasticity”, defined formally as the estimated percentage change in sales attributable to a 1% change in advertising, after controlling for all other factors that could affect sales. A consistent finding across virtually all studies is that the advertising elasticities for generic advertising and promotion indeed are small. The elasticities associated with generic advertising for most products have been consistently in the range of 0.01 to 0.25 (Williams and Nichols (1998)). However, a relatively small response of sales to advertising nevertheless can have potentially large aggregate effects in large-volume commodity markets.
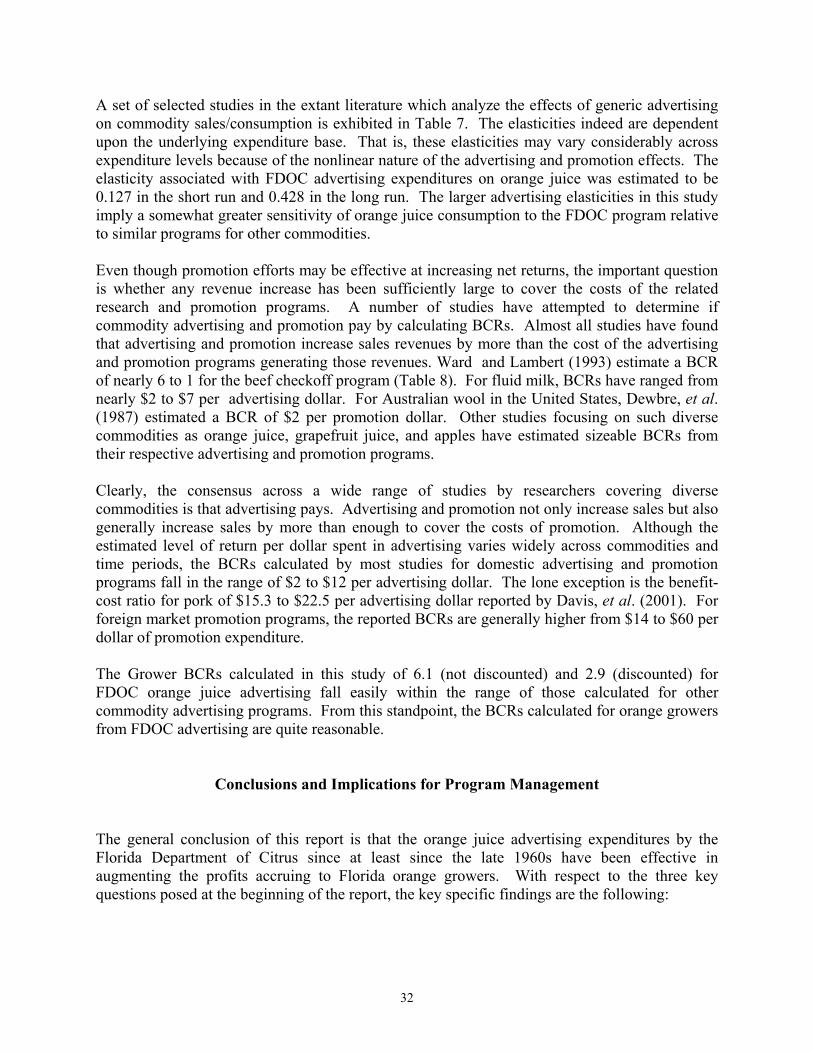
32
A set of selected studies in the extant literature which analyze the effects of generic advertising on commodity sales/consumption is exhibited in Table 7. The elasticities indeed are dependent upon the underlying expenditure base. That is, these elasticities may vary considerably across expenditure levels because of the nonlinear nature of the advertising and promotion effects. The elasticity associated with FDOC advertising expenditures on orange juice was estimated to be 0.127 in the short run and 0.428 in the long run. The larger advertising elasticities in this study imply a somewhat greater sensitivity of orange juice consumption to the FDOC program relative to similar programs for other commodities.
Even though promotion efforts may be effective at increasing net returns, the important question is whether any revenue increase has been sufficiently large to cover the costs of the related research and promotion programs. A number of studies have attempted to determine if commodity advertising and promotion pay by calculating BCRs. Almost all studies have found that advertising and promotion increase sales revenues by more than the cost of the advertising and promotion programs generating those revenues. Ward and Lambert (1993) estimate a BCR of nearly 6 to 1 for the beef checkoff program (Table 8). For fluid milk, BCRs have ranged from nearly $2 to $7 per advertising dollar. For Australian wool in the United States, Dewbre, et al. (1987) estimated a BCR of $2 per promotion dollar. Other studies focusing on such diverse commodities as orange juice, grapefruit juice, and apples have estimated sizeable BCRs from their respective advertising and promotion programs. Clearly, the consensus across a wide range of studies by researchers covering diverse commodities is that advertising pays. Advertising and promotion not only increase sales but also generally increase sales by more than enough to cover the costs of promotion. Although the estimated level of return per dollar spent in advertising varies widely across commodities and time periods, the BCRs calculated by most studies for domestic advertising and promotion programs fall in the range of $2 to $12 per advertising dollar. The lone exception is the benefit-cost ratio for pork of $15.3 to $22.5 per advertising dollar reported by Davis, et al. (2001). For foreign market promotion programs, the reported BCRs are generally higher from $14 to $60 per dollar of promotion expenditure.
The Grower BCRs calculated in this study of 6.1 (not discounted) and 2.9 (discounted) for FDOC orange juice advertising fall easily within the range of those calculated for other commodity advertising programs. From this standpoint, the BCRs calculated for orange growers from FDOC advertising are quite reasonable.
Conclusions and Implications for Program Management The general conclusion of this report is that the orange juice advertising expenditures by the Florida Department of Citrus since at least since the late 1960s have been effective in augmenting the profits accruing to Florida orange growers. With respect to the three key questions posed at the beginning of the report, the key specific findings are the following:
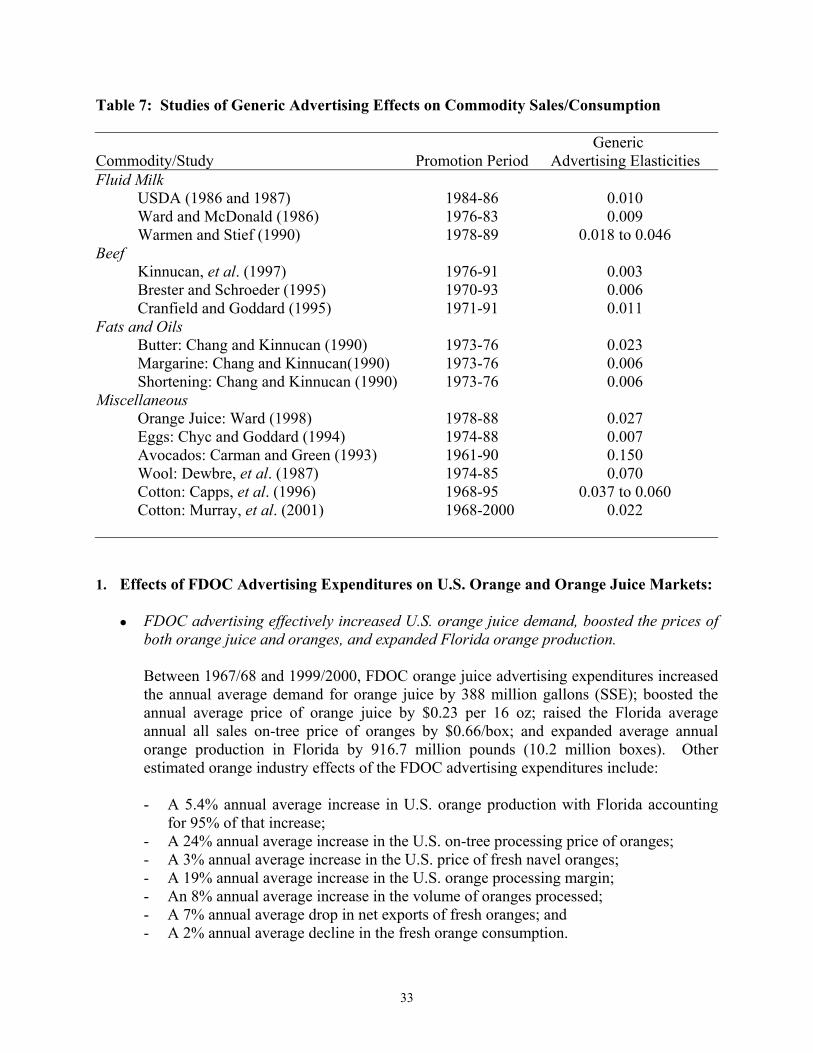
33
Table 7: Studies of Generic Advertising Effects on Commodity Sales/Consumption
Commodity/Study
Promotion Period Generic
Advertising Elasticities Fluid Milk USDA (1986 and 1987) Ward and McDonald (1986) Warmen and Stief (1990)
1984-86 1976-83 1978-89
0.010 0.009
0.018 to 0.046 Beef Kinnucan, et al. (1997) Brester and Schroeder (1995) Cranfield and Goddard (1995)
1976-91 1970-93 1971-91
0.003 0.006 0.011
Fats and Oils Butter: Chang and Kinnucan (1990) Margarine: Chang and Kinnucan(1990) Shortening: Chang and Kinnucan (1990)
1973-76 1973-76 1973-76
0.023 0.006 0.006
Miscellaneous Orange Juice: Ward (1998) Eggs: Chyc and Goddard (1994) Avocados: Carman and Green (1993) Wool: Dewbre, et al. (1987) Cotton: Capps, et al. (1996) Cotton: Murray, et al. (2001)
1978-88 1974-88 1961-90 1974-85 1968-95
1968-2000
0.027 0.007 0.150 0.070
0.037 to 0.060 0.022
1. Effects of FDOC Advertising Expenditures on U.S. Orange and Orange Juice Markets:
FDOC advertising effectively increased U.S. orange juice demand, boosted the prices of both orange juice and oranges, and expanded Florida orange production.
Between 1967/68 and 1999/2000, FDOC orange juice advertising expenditures increased the annual average demand for orange juice by 388 million gallons (SSE); boosted the annual average price of orange juice by $0.23 per 16 oz; raised the Florida average annual all sales on-tree price of oranges by $0.66/box; and expanded average annual orange production in Florida by 916.7 million pounds (10.2 million boxes). Other estimated orange industry effects of the FDOC advertising expenditures include:
- A 5.4% annual average increase in U.S. orange production with Florida accounting
for 95% of that increase; - A 24% annual average increase in the U.S. on-tree processing price of oranges; - A 3% annual average increase in the U.S. price of fresh navel oranges; - A 19% annual average increase in the U.S. orange processing margin; - An 8% annual average increase in the volume of oranges processed; - A 7% annual average drop in net exports of fresh oranges; and - A 2% annual average decline in the fresh orange consumption.
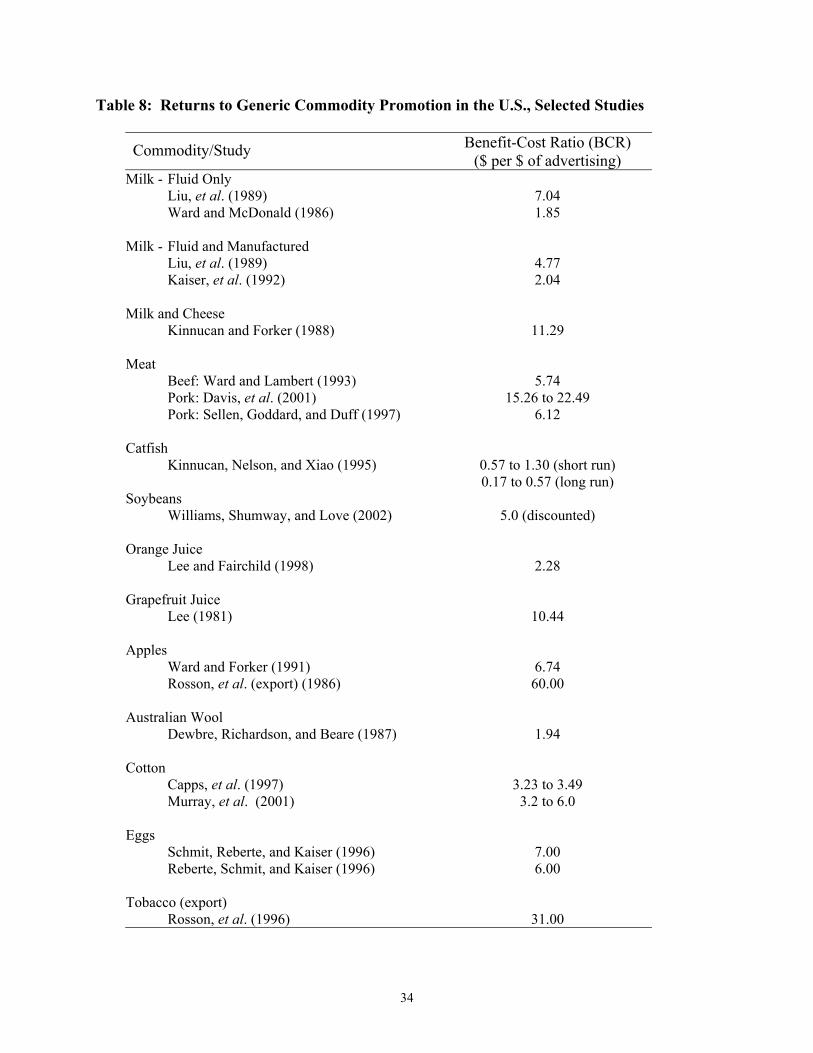
34
Table 8: Returns to Generic Commodity Promotion in the U.S., Selected Studies
Commodity/Study Benefit-Cost Ratio (BCR) ($ per $ of advertising)
Milk - Fluid Only Liu, et al. (1989) Ward and McDonald (1986) Milk - Fluid and Manufactured Liu, et al. (1989) Kaiser, et al. (1992) Milk and Cheese Kinnucan and Forker (1988) Meat Beef: Ward and Lambert (1993) Pork: Davis, et al. (2001) Pork: Sellen, Goddard, and Duff (1997) Catfish Kinnucan, Nelson, and Xiao (1995) Soybeans Williams, Shumway, and Love (2002) Orange Juice Lee and Fairchild (1998) Grapefruit Juice Lee (1981) Apples Ward and Forker (1991) Rosson, et al. (export) (1986) Australian Wool Dewbre, Richardson, and Beare (1987) Cotton Capps, et al. (1997) Murray, et al. (2001) Eggs Schmit, Reberte, and Kaiser (1996) Reberte, Schmit, and Kaiser (1996) Tobacco (export) Rosson, et al. (1996)
7.04 1.85
4.77 2.04
11.29
5.74 15.26 to 22.49
6.12
0.57 to 1.30 (short run) 0.17 to 0.57 (long run)
5.0 (discounted)
2.28
10.44
6.74 60.00
1.94
3.23 to 3.49 3.2 to 6.0
7.00 6.00
31.00
35
FDOC orange juice advertising increased the level of U.S. orange juice imports.
U.S. net imports of orange juice accounted for most of the increase in orange juice demand induced by FDOC advertising in the early years of the program but a lower share in later years as domestic production slowly responded to the advertising-induced price increase. The increase in imports induced by the advertising program, however, was larger than the increase in Brazilian orange juice exports because the price increase also reduced the demand for orange juice imports in other countries and re-directed those supplies to U.S. markets where prices and demand were correspondingly higher. The response of primarily Florida orange production to the advertising-induced price increases generated a sufficient additional domestic supply of oranges and orange juice over time to minimize the advertising effect on the total level of Brazilian orange juice exports. Thus, the FDOC advertising primarily induced a switch in destination of Brazilian orange juice exports rather than an increase in the total volume of Brazilian exports. So while FDOC advertising no longer has much impact on the total volume of Brazilian orange juice exports, U.S. imports of Brazilian orange juice have increased because more of what Brazil exports is now destined for U.S. markets. Consequently, FDOC advertising has effectively increased the U.S. share of Brazilian orange juice exports by increasing the U.S. demand for orange juice and attracting Brazilian orange juice away from other world markets to the higher price U.S. market.
FDOC advertising increased orange production in other states. Because FDOC advertising has raised orange juice and orange prices over the years, the production of oranges in other states has benefited as well. On average each year between 1967/68 and 1999/2000 as a result of FDOC advertising, orange production in Arizona, California, and Texas was 1% to 2% higher and total U.S. orange production from FDOC advertising was 964 million pounds (10.8 million boxes) higher. Florida accounted for about 95% of the increase in U.S. production.
Brand advertising of orange juice had no measurable effect on the total volume of orange
juice sales over the years.
In contrast to the FDOC advertising expenditures, brand advertising was found to be not statistically significant in explaining annual variations in U.S. orange juice demand over the sample period. In repeated parameter sensitivity tests, the lack of a statistical relationship between brand advertising and orange juice consumption was highly stable to lag length, degree of polynomial, specification, functional form, and time period of analysis. This result is consistent with the findings of the research reported earlier relating to Objective 1 in Part I. This result is not too surprising, however, since generic advertising programs like those funded by FDOC expenditures might be more expected to increase the level of consumption while advertising by a given brand manufacturer might be more targeted to increasing the share of total consumption accounted for by that brand. No conclusion can be drawn from the research presented in this report, however, regarding the effect of brand advertising on the market shares accounted for by individual orange juice manufacturers.
36
2. Florida orange grower benefits from the FDOC advertising program
FDOC advertising programs generated 6 times more in profits for Florida orange growers than the cost of the programs on average each year between 1967/68 and 1999/2000.
In this study, the grower Benefit-Cost ratio or BCR (that is, the estimated average annual ratio of increased Florida grower profits to FDOC orange juice advertising expenditures) between 1967/68 and 1999/2000 was reasonably high at 6.1 to 1. Thus, every dollar spent by the FDOC on orange juice advertising in each year between 1967/68 and 1999/2000 has contributed an average of $6.1 in profits to Florida orange growers. Discounting the estimated profits added by FDOC advertising for lost alternative investment earning opportunities reduces the Florida grower BCR to just under $3 per FDOC advertising dollar spent (the discounted BCR), still a noteworthy return. The grower BCR estimates reported for other commodities with similar producer-financed promotional programs fall in the range of $2 to $12.
Between 1967/68 and 1999/2000, FDOC advertising increased Florida orange grower
profits by at least $3.5 billion over and above the box tax paid by growers.
Of the profits actually earned by Florida orange growers between 1967/68 and 1999/2000, this study estimates that at least $3.5 billion was contributed directly by FDOC orange juice advertising programs. In other terms, the contribution of FDOC advertising to Florida orange grower profits over that 33 year period can be expressed as an average of $0.64 per box of oranges produced; $2.02 per bearing tree; or $489,000 per orange grove.
3. The FDOC advertising program as an alternative investment opportunity for Florida
orange growers
The FDOC advertising program has been an attractive investment alternative for the funds (box tax) collected from Florida growers.
The internal rate of return to FDOC advertising expenditures over the 1967/68 to 1999/2000 period of analysis was estimated to be 14.4%. Few investment alternatives were likely available to Florida growers over the entire 33-year period of 1967/68 to 1999/200 that could have provided a higher return for the funds they paid in support of FDOC programs.
Implications for Management of FDOC Advertising Programs The conclusions of this study suggest a number of implications for management of the FDOC advertising program. First, the BCR estimated for FDOC orange juice advertising programs indicates that additional benefits in terms of net grower profits might be realized from an
37
increase in those expenditures above historical levels. In that case, the grower BCR would be expected to drop to some extent as expenditures increase. Although beyond the scope of this study, determining how much of an increase in FDOC expenditures and determining what type of advertising and promotional activities would maximize grower profits (that is, calculating the optimal expenditure level and, by extension, calculating the optimal box tax rate) would be a useful next step in the analysis of FDOC activities for program management purposes. The seminal studies of the derivation of conditions for optimal advertising intensity are those of Dorfman and Steiner (1954) and Nerlove and Waugh (1961). Several other studies have built upon these foundational works to generate conditions for optimal commodity advertising under a variety of market conditions. Goddard and McCutcheon (1993) and Kinnucan (1999) analyzed optimal commodity advertising in a supply-managed industry. Alston, Carman, and Chalfant (2000) derived the conditions for optimal commodity advertising when the funds were raised by a per-unit tax. Zhang and Sexton (2002) considered the optimal collection and expenditure of funds for agricultural commodity promotion in markets where the processing and distribution sectors may exhibit oligopoly and/or oligopsony power. The conditions that characterize optimal advertising intensity under perfect competition for funds generated from per-unit taxes do not, in general, hold when marketing is imperfectly competitive. Zhang and Sexton (2002) showed that oligopoly or oligopsony power in the marketing sector reduces optimal advertising expenditure relative to the perfectly competitive optimum. A second implication for management of the FDOC advertising program clearly evident in the simulation analysis is that a failure to maintain and enhance the growth in advertising expenditures can have serious negative impacts on grower profitability over a number of years. Advertising expenditures create a stream of new revenues over a long period time due to the slow response of production to price changes. Thus, the full effects of advertising expenditures made in any given year are not realized immediately but rather over a number of years. Capricious, on-again-off-again funding of advertising, therefore, can seriously erode the effectiveness of the expenditures in boosting orange juice sales and raising producer profits not only in a particular year in which a change may occur but over a long period of time. Indeed, a precipitous 26% drop in FDOC expenditures in the mid-1980s which arrested the momentum in the program resulted in a drop in the returns to growers not only in the years of the expenditure declines but also for a number of years thereafter. Third, advertising that shifts the demand for orange juice necessarily leads to increased imports of orange juice. As the analysis in this report demonstrates, however, the import impact is most important at the beginning of the program or following a large, sustained change in the level of expenditures because it takes time for domestic orange and orange juice production to change sufficiently in response to the increase in demand. In the mean time, the increased demand is met by increased imports. Over time, in response to a sustained program of advertising, the imports are increasingly replaced by domestic production. Thus, the key to minimizing imports in response to advertising is to maintain a sustained, growing program of advertising. Fourth, the benefits of FDOC advertising programs are not limited to Florida orange growers alone. Brazil benefits from the higher orange juice price and experiences some increase in orange juice exports. Orange producers in other states (Arizona, California, and Texas) benefit
38
from FDOC success in raising orange juice and orange prices. Orange juice processors benefit because the processing margin as well as the volume of oranges processed tend to increase. Retailers also benefit from increased sales of orange juice at higher prices. Even though the sharing of the benefits of such programs is inevitable to some degree, the analysis clearly shows that the benefits of FDOC advertising to Florida orange growers who pay for the advertising far exceeds what they pay for those benefits.
Some Further Considerations In interpreting and utilizing the findings of this study, a number of additional issues should be carefully considered, including the underestimation/overestimation of BCRs, concentration in the orange processing sector, and the distributional impacts of commodity advertising programs. Underestimation/Overestimation of Benefit-Cost Ratios In each time period, advertising expenditures provide a stream of current and future producer revenues/profits given the dynamic nature of the orange industry as explained in detail earlier in the report. The calculation of the grower BCR associated with the FDOC advertising program considers grower revenues/profit generated and advertising expenses incurred between 1967/68 and 1999/2000. Initializing the calculation in 1967/68 implicitly assumes that FDOC programs began in 1965/66 (to allow for the time lag of impact). Obviously, FDOC operated advertising campaigns prior to that date. However, the lack of data prior to that date for many variables in the structural model such as tree plantings, adverting expenditure data, prices, and others, precluded the estimation of the parameters of OJMOD and the simulation of the model over an earlier time period. Consequently, any grower revenues that may have accrued during the 1967/68 to 1999/2000 period of analysis as a result of FDOC activities prior to 1965/66 are not taken into account. At the same time, the analysis ends in 1999/2000 so that any revenues that may have accrued to producers after that date as a result of expenditures in 1999/2000 or prior years are likewise not included in the calculation of the grower BCRs. Consequently, the grower BCRs calculated in this study represent lower bounds on the average returns to Florida growers. Thus, while potentially higher than estimated in this study, the true BCR is not likely to be lower. In other words, the BCRs presented in this study are conservative estimates of the effectiveness of the FDOC advertising program in boosting the profitability of Florida orange production. Concentration in the Orange Processing Sector Over the 1967/68 to 1999/2000 time period of analysis, the orange processing industry became increasingly concentrated, consistent with the trend toward greater concentration in the food industry as a whole. Unfortunately, data on the extent of concentration in orange processing are not available. The relevance of the growing concentration in processing is that estimates of the change in producer revenues as a result of commodity advertising programs may be overstated under conditions of imperfect competition, particularly in the processing sector (see Zhang and
39
Sexton, 2000). For the beef industry, Zhang and Sexton (2000) found that the benefits accruing to producers were reduced by about 30% under imperfect competition in the processing sector (compared to the assumption of perfect competition in the processing sector). For the dairy industry, they estimated that producer benefits were reduced by only 7% due to imperfect competition. The effects of imperfectly competitive markets on the returns to producers from advertising depend on at least six factors: (1) the degree of competition among processors in procuring the farm product; (2) the departure from competition in the sale of the finished product; (3) the own-price elasticity of demand at the retail level of the marketing channel; (4) the elasticity of demand with respect to advertising expenditures; (5) the own-price elasticity of supply at the producer level; and (6) the farm share of the retail expenditure. Although not as concentrated as the beef processing sector, the orange processing sector likely is more concentrated than the dairy processing sector. As a consequence, and in the light of the findings of Zhang and Sexton (2000), the estimates of the increase in grower profit due to the FDOC program could be overstated to some degree. Even if that is the case, however, the resulting overstatement of the estimated returns would be offset to some extent by the understatement of grower profits in the calculation of the grower BCR for the period of 1967/68 to 1999/2000. That would mean, therefore, that the estimates of the Florida grower BCRs calculated for the FDOC advertising program and presented in this report are unlikely to be either highly overstated or understated to any extent. Distributional Impacts Whether overstated or understated, the grower BCRs calculated in this study provide measures of the average returns to Florida orange growers from FDOC advertising, not the return realized by individual growers. In other words, not all growers have earned $6.1 or even $2.9 (discounted) for every dollar they have paid. Because the BCR is an average, some growers have realized higher returns and some lower (Chung and Kaiser, 2000a and 2000b). To suggest that all producers benefit equally from the FDOC advertising program is to commit the inferential error termed “the fallacy of composition”. Recent research has focused on the distribution of benefits and costs of commodity advertising, including Alston, Chalfant, and Piggott (2000); Kinnucan and Miao (2000); and Alston, Freebairn, and James (2001).
In any case, generic advertising is generally intended to benefit all growers by inducing a rightward shift in demand. However, during the 1997 Supreme Court case of Olickman vs. Wileman Brothers & Elliott, Inc., attorneys for the growers/handlers argued that although total demand increased with generic advertising, some growers were affected differently than others. They argued that since their clients’ products were differentiated, generic advertising was detrimental to them by fostering the concept that the products of all producers are the same, thus lowering product differentiation in consumers’ minds. This product differentiation argument also was made in a case concerning generic advertising for mushrooms. Crespi and Marette (2002) showed that if the benefits from demand-enhancing generic advertising are outweighed by the costs of lower product differentiation, then “high-quality” producers may not benefit from generic promotion.
40
Although interesting, the Chung and Kaiser distribution of the gains hypothesis and the Crespi and Marette product differentiation hypothesis would be extremely difficult to test for the FDOC advertising program. In any case, the objective of this study was to measure the average returns to Florida orange growers as a whole rather than the how the benefits are distributed across growers. The results of the analysis presented in this report suggest that the FDOC advertising program effectively stimulates demand for orange juice and increases the profit accruing to Florida orange growers by more than the cost of the advertising. Of course, a further distributional concern relates to the sharing of the benefits of FDOC advertising by groups other than among Florida growers. Brazil benefits from the higher orange juice price and experiences some increase in orange juice exports. Orange producers in other states (Arizona, California, and Texas) benefit from FDOC success in raising orange juice and orange prices. Orange juice processors benefit because the processing margin as well as the volume of oranges processed tend to increase. Retailers also benefit from increased sales of orange juice at higher prices. Even though the sharing of the benefits of such programs is inevitable to some degree, the analysis in this study clearly shows that the benefits of FDOC advertising to Florida orange growers who pay for the advertising far exceeds what they pay for those benefits.
41
REFERENCES Alston, J.M., H.F. Carman, and J.A. Chalfant, “Evaluating Primary Product Promotion: The
Returns to Generic Advertising by a Producer Cooperative in a Small, Open Economy,” Promotion in the Marketing Mix: What Works, Where and Why, G.W. Goddard and D.S. Taylor, eds. University of Guelph: Toronto, 2000.
Alston, J.M., J.A. Chalfant, and N.E. Piggott, “The Incidence of the Costs and Benefits of
Generic Advertising,” American Journal of Agricultural Economics 82(3):665-71, 2000. Alston, J.M., J.W. Freebairn, and J.S. James, “Beggar-thy-Neighbor Advertising: Theory and
Application to Generic Commodity Promotion Programs,” American Journal of Agricultural Economics 83(4):888-902, 2001.
Alston, J.M., J.W. Freebairn, and J.J. Quilkey, “A Model of Supply Response in the Australian
Orange Growing Industry, “ Australian Journal of Agricultural Economics 24(3):248-267, 1980.
Barry, P.J., P.N. Ellinger, J.A. Hopkin, and C.B. Baker. Financial Management in Agriculture,
5th ed. Danville, IL: Interstate Publishers, Inc., 1995. Brester, G.W. and Schroeder, T.C., “The Impacts of Brand and Generic Advertising on Meat
Demand,” American Journal of Agricultural Economics 77(4):969-979, November 1995. Brown, M..G., J-Y Lee, and T.H. Spreen, “The Impact of Generic Advertising and the Free Rider
Problem: A Look at the US Orange Juice Market and Imports,” Agribusiness: An International Journal 12(4):309-316, 1996.
Capps, O., Jr., D.A. Bessler, G.C. Davis, J.P. Nichols, C. Anderson, and E. Smith, “Economic
Evaluation of the Cotton Checkoff Program,” Technical Report 97-2, Department of Agricultural Economics, Texas A&M University, August 1997.
Capps, O., Jr., S-C Seo, and J.P. Nichols, “On the Estimation of Advertising Effects for Branded
Products: An Application to Spaghetti Sauces,” Journal of Agricultural and Applied Economics 29:291-302, 1997.
Carman, H.F. and R.D. Green, “Commodity Supply Response to a Producer-Financed
Advertising Program: The California Avocado Industry,” Agribusiness: An International Journal 9(6):605-621, 1993.
Chang, H.S. and H. Kinnucan, “Advertising and Structural Changes in the Demand for Butter in
Canada,” Canadian Journal of Agricultural Economics 38:295-308, 1990. Chung, C., and H.M. Kaiser, “Do Farmers Get an Equal Bang for Their Buck from Generic
Advertising Programs?” Journal of Agricultural and Resource Economics 25:147-158, 2000a.

42
Chung, C., and H.M. Kaiser, “Distribution of Generic Advertising Benefits Across Participating Firms,” American Journal of Agricultural Economics 82(3):659-64, 2000b.
Chyc, K.M. and E.W. Goddard, “Optimal Investment in Generic Advertising and Research: The
Case of the Canadian Supply-Managed Egg Market,” Agribusiness: An International Journal 10(2):145-166, 1994.
Cranfield, J. and E. Goddard, “Advertising and Oligopoly Power in the North American Beef
Processing Sector,” Chapter 6 in H.W. Kinnucan, J.E. Lenz, and C.R. Clary, eds., Economic Analysis of Meat Promotion, Proceedings from the NEC-63 Conference, Denver, Colorado, June 1995.
Crespi, J.M., and S. Marette, “Generic Advertising and Product Differentiation,” American
Journal of Agricultural Economics 84(3):691-701, 2002. Davis, G.C., O. Capps, Jr., D.A. Bessler, J. Leigh, J.P. Nichols, and E. Goddard, “Economic
Evaluation of the Pork Checkoff Program,” Technical Report 01-1, Department of Agricultural Economics, Texas A&M University, January 2001.
Dewbre, J., B. Richardson, and S. Beare, “Returns from Wool Promotion in the United States,”
Occasional Paper #100, Australian Government Publishing Service, Canberra, Australia, 1987.
Dorfman, R. and P.O. Steiner, “Optimal Advertising and Optimal Policy,” American Economic
Review 44:826-36, 1954. Forker, O.D., and R.W. Ward, Commodity Advertising: The Economic and Measurement of
Generic Programs, Lexington Books: New York, 1998. Gardner, B. The Governing of Agriculture. University Press of Kansas: Lawrence, Kansas, 1981. Goddard, E.W., and M.L. McCutcheon, “Optimal Producer Investment in Generic Advertising:
The Case of Fluid Milk in Ontario and Quebec,” Canadian Journal of Agricultural Economics 41:329-47, 1993.
Kaiser, H.M., D.J. Liu, T.D. Mount, and O.D. Forker, “Impacts of Dairy Promotion from
Consumer Demand to Farm Supply,” Chapter 3 in H.W. Kinnucan, S.R. Thompson, and H. Chant, eds., Commodity Advertising and Promotion, Ames, IA: Iowa State University Press, 1992.
Kinnucan, H.W., “Optimal Generic Advertising Decisions in Supply-Managed Industries:
Clarification and Some Further Results,” Canadian Journal of Agricultural Economics 47:57-66, 1999.
43
Kinnucan, H.W. and O.D. Forker, “Allocation of Generic Advertising Funds Among Products: A Sales Maximization Approach,” Northeastern Journal of Agricultural and Resource Economics 17(1):64-71, 1988.
Kinnucan, H.W., and Y. Miao, “Distributional Impacts of Generic Advertising on Related
Commodity Markets,” American Journal of Agricultural Economics 82:672-78, 2000. Kinnucan, H.W., R.G. Nelson, and H. Xiao, “Cooperative Advertising Rent Dissipation,”
Marine Resource Economics 10:373-384, 1995. Kinnucan, J.W., and M. Venkatesworen, “Economic Effectiveness of Advertising Aquacultural
Products: The Case of Catfish,” Journal of Applied Aquaculture 1(1):3-31, 1991. Kinnucan, H.W., H. Xiao, and C.-J. Hsia, and J.D. Jackson “Effects of Health Information and
Generic Advertising on U.S. Meat Demand,” American Journal of Agricultural Economics 79(1):13-23, 1997.
Lee, J-Y., “Generic Advertising, FOB Price Promotion, and FOB Revenue: A Case Study of the
Florida Grapefruit Juice Industry,” Southern Journal of Agricultural Economics 13:69-78, 1981.
Lee, J.Y. and G.F. Fairchild, “Commodity Advertising, Imports, and the Free Rider Problem,”
Journal of Food Distribution Research 19(2):36-42, 1988. Liu, D.J., H.M. Kaiser, O.D. Forker, and T.D. Mount, “The Economic Implications of the U.S.
Generic Advertising Program: An Industry Model Approach,” Northeastern Journal of Agriculture and Resource Economics 19(1):37-48, 1989.
Matthews, J.L., A.W. Womack, and B.W. Huang, “The U.S. Orange Economy: Demand and
Supply Prospects 1973/74 to 1984/85,” Fruit and Tree Nut Situation Report, TFS-190, Economic Research Service, U.S. Department of Agriculture, Washington, D.C. February 1974.
Mitchell, D.W. and P.J. Speaker, “A Simple, Flexible Distributed Lag Technique: The
Polynomial Inverse Lag,” Journal of Econometrics 31:329-340, 1986. Murray, B.C., R.H. Beach, W.J. White, and C. Viator, “An Economic Analysis of the Cotton
Research and Promotion Program,” Research Triangle Institute, September 2001. Nerlove, M. and F.V. Waugh, "Advertising Without Supply Control: Some Implications of a
Study of the Advertising of Oranges," Journal of Farm Economics 43:813-37, 1961. Reberte, C., H.M. Kaiser, J.E. Lenz, and O. Forker, “Generic Advertising Wearout: The Case of
the New York City Fluid Milk Campaign,” NICPRE 96-01, R.B. 96-01, National Institute for Commodity Promotion Research and Evaluation, Cornell University, Ithaca, New York, January 1996.
44
Rosson, C.P. III, M.D. Hammig, and J.W. Jones, “Foreign Market Promotion Programs: An Analysis of Promotion Response for Apples, Poultry, and Tobacco,” Agribusiness: An International Journal 2(1):33-42, 1986.
Schmit, T.M. and H.M. Kaiser, “Egg Advertising, Dietary Cholesterol Concerns, and U.S.
Consumer Demand.” Agricultural and Resource Economics Review 27:43-52, 1998. Schmit, T.M., J.C. Reberte, and H.M. Kaiser, “An Economic Analysis of Generic Egg
Advertising in California,” NICPRE Research Bulletin 96-14, National Institute for Commodity Promotion Research and Evaluation, Department of Agricultural, Resource, and Managerial Economics, Cornell University, Ithaca, NY, October 1996.
Sellen, D. E. Goddard, and S. Duff, “Returns from Research and Advertising in the North
American Hog and Pork Industry,” in Economic Analysis of Research and Promotion, J. Ferrero and C. Clary, eds, Proceedings, joint NC-208 and NEC-63 conference, New Orleans, LA, 1997.
U.S. Department of Agriculture (USDA), “Report to Congress on the Dairy Promotion
Program,” Dairy Division, Agricultural Marketing Service, Washington, D.C., 1986 and 1987.
Ward, R.W., “Evaluation of the Economics Gains from the Generic and Brand Advertising of
Orange Juice, and Advertising Implications from the Generic and Brand Advertising Model for Orange Juice,” Comments Presented to the Advertising Committee, Florida Department of Citrus, Lakeland, FL, 1988.
Ward, R.W. and O.D. Forker, “Washington Apple Advertising: An Economic Model of Its
Impact,” Washington Apple Commission, WAC 91:1, University of Florida, Gainesville, 1991.
Ward, R.W. and C. Lambert, “Generic Promotion of Beef: Measuring the Impact of the U.S.
Beef Checkoff,” Journal of Agricultural Economics 44:456-465, September 1993. Ward, R.W. and W.F. McDonald, “Effectiveness of Generic Milk Advertising: A Ten-Region
Study,” Agribusiness Industry Journal 2(1):77-89, 1986. Warman, M. and M. Stief, “Evaluation of Fluid Milk Advertising” Market Research Branch,
CSSD, AMS, USDA, Washington, DC, 25 pp, 1990. Williams, G.W., “Returns to US Soybean Export Market Development,” Agribusiness 1(3):243-
263, 1985. Williams, G.W. and J.P. Nichols, “Effectiveness of Commodity Promotion,” Texas Agricultural
Market Research Center Consumer and Product Research Report No. CP1-98, Texas A&M University, College Station, Texas, May 1998.

45
Williams, G.W., C.R. Shumway, and H.A. Love, “Returns to Soybean Producers from Investments in Promotion and Research,” Agricultural and Resource Economics Review 31(1):97-111, April 2002.
Zhang, M., and R.J. Sexton, “Optimal Commodity Promotion When Downstream Markets Are
Imperfectly Competitive,” American Journal of Agricultural Economics 84(2):352-365, 2002.

46
APPENDICES

47
APPENDIX A
Highlights of the Domestic Orange Juice Marketing Programs of the Florida Department of Citrus
from 1960/61 through 2002/03

48
Florida Department of Citrus Highlights of the Domestic Orange Juice Marketing Programs1
1960-61 (Homer Hooks: General Manager) Major hurricane (“Donna”) drastically reduced harvest Merchandising • 850 product demonstrations • 855 in-store promotions • 224 incentive programs Advertising • Orange juice campaign: "The Break That Does More Than Refresh" (National consumer
magazine) • Newspaper advertisements • Television: Vitamin C • Benton & Bowles advertising firm Public Relations, newspaper, magazine, radio & television • "Recipes" contest • Newspaper, magazine, radio
1961-62 Advertising • Print -magazine & newspaper • Television- network and local • Quick energy and Vitamin C Merchandising • 66 field representatives • 1624 In-store demonstrations • 387 trade incentive promotions Public Relations (Dudley, Anderson, Yutzy) • Recipes in newspapers, magazines, cookbooks .magazine editors • "Orange Dessert" contest 1962-63 -Major Freeze Year Advertising • Florida Citrus Processor's spend $3.5 million on coupon redemption; FDOC places print ads
in magazines and newspapers (coupon); National magazine purchase. • Three month (November/December/January) television advertisements; Medical advertising
in professional journals • Campbell Ewald: new advertising firm _______________________________________ 1 Source: FDOC Annual Reports, Market Research Report and Program Plans Fiscal Years as Indicated
49
Publicity • Newspaper editors conference • radio-freeze stories • sell Florida first -In-state marketing programs Merchandising • 76 field representatives • 34,000 merchandising display retail store .300 retail incentive promotions 1963-64 Advertising • "O.J." symbol adopted "The Real Thing- O.J. from Florida" - first time FDOC used
identifying symbols • Print media • Breakfast and Vitamin C - large glass • Television - daytime & nighttime programming • 8 week radio schedule • 4th year for medical advertising Merchandising • 212 merchandising incentive promotions • 15,500 in-store displays Public Relations • Sell Florida First • Orange Dessert Contest • Food Publicity Editor's Conference
1964-65 Advertising • Sunday newspaper -Squeater promotion • Magazine Advertisement (Saturday Evening Post) • Television -"O.J. - The Real Thing From Florida" • Consumer promotions expanded to Canada Merchandising • 62 merchandising field force .15,000 in-store displays • 248 sales incentive promotions • Attended 19 national conventions Publicity • Magazine features • Sunday newspaper inserts • Food editor conference 1965-66 (Freeze Year and New Executive Director: Edward Taylor) • Taste test (FCOJ) at the New York World's Fair
50
Advertising • Radio, spot television, newspapers • Lennen & Newell new advertising agency • First FDOC coupon promotion (216 million) • Orange juice break license tags • "Famous Florida Chefs Favorite Citrus Recipe" booklet • "OJ on the Rocks" campaign Merchandising • 65 field representatives • 25,361 displays • 340 trade incentive promotions Medical Advertising • magazine, "Nutrition Today" Publicity • Magazine editors • Best food day newspaper placements • Teenage (nutrition) film Foodservice • 4 man field force • Educational material for schools 1966-67 Merchandising • 549 sales incentive promotions • Newspaper tie-ins • 62 field representatives Advertising • "Orange on a Straw" theme • FDOC • Coupons • Spot television • Radio: "Orange Juice on Ice is Nice" • Convenience factor: Drink canned OJ Publicity • Recipe contest • Florida citrus golf tournament • Mike Douglas show at Cypress Gardens • Five-minute radio interviews Foodservice / School Marketing • National convention • School lunch program • Sales (incentive) promotion Brand Advertising Rebate Program
51
1967-68 (Introduction - partial year - of Anita Bryant) Advertising • Anita Bryant sings "Come to the Florida Sunshine Tree" • "Breakfast Without Orange Juice Is Like A Day Without Sunshine” • Vitamin C, taste, energy, convenience, value • Television, radio, magazines Publicity • Florida Citrus golf tournament • Permanent exhibit at Walt Disney World • Trade seminars and luncheon Institutional & School Marketing • 265 incentive promotions • Trade advertising magazine • School lunch program • Attendance annual convention Merchandising • 62 man field force • In-store displays • 476 trade incentive promotions Brand Advertising Rebate Program 1968-69 Merchandising • In-store promotional campaigns • Test non-food (automobile and appliance dealers) promotions • 24,300,000 display pieces were utilized in lending supermarkets Publicity • Major sponsor of Republican National Convention at Miami Beach • Educational tours -newspaper -food editors Advertising • First full year of Anita Bryant • Television, radio, print advertisements and point-of-sale materials • "Breakfast Without Orange Juice is Like a Day Without Sunshine" Foodservice • Nutritional seminars • "The Citrus Family Tree" film for elementary/junior high schools • First year (special referendum) of school lunch program 1969-70 Merchandising • 1000 trade incentive promotions
52
• In-store display contest • National sales meeting "Better Communications" Advertising • Continuation of generic advertising • Anita Bryant "Breakfast Without Orange Juice Is Like A Day Without Sunshine" • Television (targeted audience women) • Radio "Orange Juice on Ice" • 65 million coupons • Orange juice license tags Foodservice & Schools • President Nixon "Citrus Fitness" Day • Test college, commercial, teenage markets • 364 foodservice incentive promotions 1970-71 Advertising • Anita Bryant featured in radio, television, print advertising and point-of-sale material • "Breakfast Without Orange Juice is Like a Day Without Sunshine" scored record high 81%
recall • incremental funding from processed orange advertising fund Coupons • 150 million store coupons Foodservice • public service announcements • test breakfast/orange juice in leading drive-in restaurants • Florida citrus food seminars Merchandising • participate in food conventions • merchandising representatives • 16.8 million promotional materials & 14,000 displays Publicity • Orange Bird and Walt Disney World promotions 1971-72 Advertising • Dancer Fitzgerald Sample: new advertising agency • network television, Anita Bryant • "A Day (Breakfast) Without Orange Juice Is Like A Day Without Sunshine" • Orange Bird Institutional/Schools • 459 incentive promotions for foodservice • School lunch / breakfast promotions • Participate in national physical fitness program
53
• Education material • Court ordered school marketing (special revenue fund) on hold Merchandising • Expanded in-store shelf space • 1075 trade incentive promotions Publicity • Walt Disney World Orange Bird • Orange Bowl parade • Professional Golfers sponsorship 1972-73 Advertising • Anita Bryant and children • " A Day Without Orange Juice is Like a Day Without Sunshine" • Orange Bird tie-in • Television, point-of-sale materials Coupons • 165 million direct mail and consumer magazines Merchandising • 65 (men) field force • 16.5 million in-store display pieces • 1200 trade incentive program Foodservice • School lunch seminars • Convention activities • Film strips for schools PUBLICITY • Orange Bowl parade • Orange Bird • Sunshine Pavilion at Walt Disney World • Industry "State of Citrus" newsletter
1973-74 Advertising • Anita Bryant • " A Day Without Orange Juice is Like a Day Without Sunshine" television, newspaper ads • Tie-in promotion with Kelloggs Coupons • 87 million Merchandising • 1,200 trade incentive programs • 16 million point-of-purchase pieces Rebate Program • advertising rebate program for FCOJ
54
Foodservice • fast food ( drive-in) promotions • public service announcements • 500 trade incentive promotions 1974- 75 (Large Florida Crops; Mechanical Harvesting) Advertising • Anita Bryant from Chicago, New York, San Francisco, Rocky Mountains • National television • Orange Bird sweepstakes • Coupon promotion tie-in with Wheaties • Newspaper coupon Rebate Program • Advertising rebate program for FCOJ Merchandising • 65 field representatives • Trade incentive promotions Foodservice / School Marketing • Foodservice recipe contest • Nutritional workshops • 820 trade incentive promotions Sell Florida First • In-state promotional campaign • Print "Take A Florida Orange Juice Break" Publicity • Placements in national magazines, newspapers • Walt Disney World, golf tournament, King Orange parade
1975-76 Merchandising • Reorganize field force • Combine merchandising, foodservice and school • Continued trade incentive promotions Advertising • Network television "88% recall of Anita Bryant campaign" • Back-up commercials to replace Anita Bryant put "on the shelf” • Coupon redemption • Tie-in promotion with General Mills • Reader's Digest and Women's magazines • OJ "The Cold Fighter" magazine campaign featuring Anita Bryant Institutional/School Marketing • Radio for away-from-home markets • 590 trade incentive promotions • Nutritional workshops
55
• National poster contest (schools) • Introduce Teddy Roosevelt program Publicity • Industry film, Walt Disney World, Sell Florida First 1976- 77 (Freeze Year) Advertising • In January, Anita Bryant publicly opposed an anti-discrimination ordinance for homosexuals.
Intense pressure to terminate her contract. Market research suggest her involvement did not negatively affect consumer buying habits.
• Anita Bryant continues as spokesperson • Network television -all parts • "It Isn't Just For Breakfast Anymore" Foodservice • 415 incentive promotions • nutritional education workshops • "Teddy Roosevelt" campaign in schools Merchandising • 90 field personnel for retail/foodservice trade promotions Publicity • Consumer affairs seminars • Walt Disney World Promotions • Press releases on freeze damage 1977-78 Advertising • Network television (100 GRP) per week • Coupon test in four markets • Anita Bryant and other "celebrities" (Arthur Fiedler, Peggy Fleming, Mark Fidrych) • "It Isn't Just For Breakfast Anymore" Merchandising • 1,100 trade incentive promotions Publicity • National food editor brunch • Sponsorship "Dinah Shore" television show School Marketing • "Teddy Roosevelt" campaign • Emphasized OJ for breakfast in schools 1978-79 (New Executive Director: Dr. W. Bernard Lester) Advertising • National television, daytime, news and prime time slots

56
• Anita Bryant and celebrities: Nancy Lopez, Arnold Palmer, Peter Marshall • "Orange Juice from Florida -It Isn't Just for Breakfast Anymore" • Small coupon promotion Foodservice • OJ on the Rocks • Recipe contest • Trade incentive program Merchandising • Field force expanded to include nutritional/school marketing representatives • Trade incentive promotion • New guidelines for T.I.P. Public Industry Relations • Tangerine Bowl • Bay Rill Citrus Classic (golf sponsorship) • Dinah Shore sponsor • Romper Room at Walt Disney World with Orange Bird • "Take A Florida Orange Juice Break"
1979-80 Public/Industry /Relations • Florida Tangerine (Citrus) Bowl • Miami's King Orange Bowl • Juice at welcome stations Advertising • "Celebrity Campaign" replaced by " Anticipation" • 39 weeks network television • 39 million coupons Merchandising • Major reorganizing (downsizing) Foodservice • "OJ on the Rocks" • Florida Sunshine Recipe contest • Trade incentive promotions • Food editor conferences 1980-81 - Freeze Year Public/Industry/Relations • Continued sponsorship of Walt Disney World • Sports (UP) sponsorships • Tangerine (Citrus) Bowl • Florida Lady Citrus golf tournament Advertising • " Anticipation" campaign (taste as a major consumer benefit)
57
• 38 weeks of national television • Tie-in with Sara Lee coffee cakes Merchandising • Reassignment of responsibilities and reduction in personnel • Trade incentive promotions Food Publicity & School Marketing • food editor's tour • conventions • public service announcements
1981-82- Major Freeze Year Public/Industry Relations • Juice at the Florida welcome stations • Miami King Orange Bowl parade • Tangerine (Citrus) Bowl • Walt Disney World Tiki Bird sponsorship • "Florida Day" in Washington, DC Advertising • Network television, 41 weeks • Target audience "women with families" • "Anticipation" campaign: "It Isn't Just for Breakfast Anymore" • Major coupon drop in women's magazine Merchandising • trade promotion incentive Food Publicity & School Marketing • spot radio • public service announcements • media hits • nutrition seminars 1982-83 Public/Industry Relations • Tangerine (Citrus) Bowl • Miss Teen USA Pageant • Miami King Orange Bowl parade • Florida State Fair • Florida welcome centers • Walt Disney World Advertising • New campaign "Orange You Smart" • Network television, 38 weeks • Three national consumer promotions Merchandising
58
• Field staff (67) • Trade incentive program • Fast food "McDonald's" national promotion • Increased funding Food Publicity & School Marketing • 12 minute physical fitness film • Nutritional seminars 1983-84 (Major Freeze) Public/Industry Relations • Miss Teen USA • Florida Citrus Bow (NBC network) • Walt Disney World • UF football sponsorship Rebate Program • Reimbursement to processors who advertise & promote Florida orange juice; first year with
funding in excess of $2.5 million for brand advertising Advertising • Network television, 37 week schedule • "Orange You Smart" campaign • Consumer sweepstakes Foodservice • Recognized "Away From Home" market • Consumer instant winner game • Tie-in promotions with restaurants Merchandising • Activities and staff reduced due to similar objectives/programs of brand rebate program 1984-85 (Major Freeze; 50 year Anniversary for FDOC)
Public/Industry Relations • Press releases regarding canker • Florida Citrus Bowl • Walt Disney World • Welcome centers • Turnpike: "Take a Florida Orange Juice Break"
Advertising • introduce Florida Seal of Approval • network television -32 week • print campaign • "Orange You Smart" Advertising Campaign • One consumer (national) promotion Rebate Program • double the expenditure, totaled $6.0 million brand advertising
59
Merchandising • 61 staff reduced to 38 • Trade incentive promotion
School Marketing • Nutritional seminars • Consumer education at school • 300 school trade incentive promotions
1985-86 Public/1ndustry Relations • Florida citrus cookbook • Florida Citrus Bowl • Florida Citrus Bowl parade WALT DISNEY WORLD TIKI BIRD SPONSORSHIP ADVERTISING • Consumer advertising over $21 million (largest ever) • Network television • "Look for Florida's Seal of Approval" Foodservice Advertising • trade incentive programs • promote "large sizes" Merchandising • 1,200 trade incentive promotions • 35 field staff School Marketing • N TV contest • conventions, seminars • nutrition education kits 1986-87 (New Executive Director: Dr. Dan Gunter) PUBLIC/INDUSTRY RELATIONS • Florida Citrus Bowl (NBC) • Welcome centers • Government Day Luncheon Advertising • Network television -Seal of Approval • Magazine campaign -Sunshine Tree • New advertising: "Orange Juice: There's Nothing Like It In The World" Rebate Program • $10 million brand advertising program Merchandising • Trade incentives up 30% as compared to prior year Foodservice • A national "Suggest a Sales of OJ" contest
60
Publicity • No major consumer public relations
1987-88 Advertising • Network television • "Orange Juice -There's Nothing Like It In The World" • Florida Seal of Approval Merchandising • 1273 trade incentive programs • Best Food Day tie-in Foodservice • Suggest A Sale • The Color of Money is Orange Public Industry Relations • tourist campaign • Florida Citrus Bowl Rebate Program • $10.1 million brand advertising 1988-89 Advertising • "Orange Juice, It Makes You Feel So Good" • Network television -35 weeks -140 GRP per week • Four national consumer promotions Merchandising • 1800 trade incentive promotions • Florida's Seal of Approval and Sunshine Tree School Marketing • Fourth year nutrition music video contest Public Industry Relations • Cup of juice -young children • Juice truth brochure • Strive for five promotion • Rolling orange Rebate Program • $9.7 million brand advertising 1989-90 - Major Freeze Advertising • National campaign -35 weeks, network, cable, syndication • Advertising message: "Just A Sip" • Magazine to supplement television: targeted women 18-34
61
• three national promotions Merchandising • 19 field staff • 1,200 trade incentive promotions Foodservice • "Profitability " promotions • "Cash-in-a-G1ass of OJ" School Marketing • 6 field staff • Orangeman nutrition adventure • NMV contest Public Relations • National public relation campaign(s) • "Florida 01 in the AM" • "Strive for Five" • Nutritional media releases • Instate promotions: Florida welcome centers, Florida Citrus Bowl Rebate Program • Reduced from prior years, $4.4 million brand advertising program 1990-91 Advertising • Network, cable, syndicated television • Advertising message, "Little Brother" • Spots reached 95% U.S. household 50 times • Magazine campaign -women 18-34 • Radio • In-store electronic billboards Foodservice • Sweepstake promotions Rebate Program • Symbol incentive program, $1.8 million brand advertising Merchandising • Local advertising, displays, increase shelf space and tie-in activities
1991-92 Advertising • Network, cable, syndicated television • Advertising message with Burt Reynolds: "Get on Your Feet" • Pots reached 95% U.S. household 50 times • Magazine campaign -women 18-34 • Radio • In-store electronic billboards
62
Foodservice • Suggestive selling promotions Merchandising • Trade incentive promotions for Florida identified product • Product monitoring, sample pickup School Marketing • Nutrition music video contest Rebate • None 1992-93 (New Interim Executive Director: Michael W. Sparks) Advertising • Network and cable television • Burt Reynolds campaign replaced by Cafe • Magazine: Vitamin C • 3 national consumer promotions; radio, coupon, in-store electronic advertising Merchandising • 19 retail field staff • Trade incentive promotions Foodservice • Trade advertising • Trade incentive promotions School Marketing • Promotional kits • Nutrition music video contest Public/Industry Relations • National and local news • Hill and Knowlton (PR firm)
1993-94 (New Executive Director: Daniel Santangelo) Advertising • Network and cable television • Advertising campaign, "Rollerblader" • Magazine -health and nutritional benefits • Network radio -health message • Radio, with tags Merchandising • Trade incentive promotions • Category management/shelf space Foodservice • Suggestive selling videos trade incentive promotions
63
1994-95 Processed Business Unit • wellness strategy • Network, cable, syndicated television, 26 weeks at 135 GRP • Advertising campaign, "Little Girl" and "Super Fly" • Network and local radio • National promotion -"The Great Cooking Challenge" infomercial • In-store advertising Public Relations • Magazine editorials • Featured newspaper articles • Television -video news releases • Conferences Merchandising • Merger school/foodservice and retail field staff • Trade incentive promotions • Florida section in dairy and frozen departments 1995-96 Processed Business Unit • Drink larger glasses: 100% Florida Orange Juice " Are You Drinking Enough?" • Wellness strategy, national radio with NFL sponsorship • National network television, prime and syndication, also cable, 26 weeks at 130 GRP • Print advertisements • "Big Glass" and "Super Fly" • Florida Cuisine • Infomercial 30 minute "The Great Cooking Challenge" Merchandising • Trade incentive focused on top 40 retailers • Fit, Fresh & Fast recipe books sold at grocery stores • Shelf space, secondary location, local radio campaign Agencies • Golin-Harris -new PR firm • New advertising firm: Ammirati Purtis Foodservice • Trade incentives -radio test, 60 seconds, 4 cities 1996-97 (New Advertising Firm: The Richards Group) PROCESSED BUSINESS UNIT • Triple crown: national partnership with American Cancer Society, March of Dimes, and
American Heart Association • Lauren Bacall commercial • Introduce "Baby in Back Seat" national commercial

64
• "Heavy-up" advertising levels, greater than prior year -television, 28 weeks @ 140 GRP • Public relations, television V .N .R. magazine, editorials • Fly commercial directed at kids continued • Category management introduced to address retail out-of-store • National retail promotions with ACS and MOD via trade incentive promotions • Florida cuisine 1997-98 Processed Business Unit • Health & wellness strategy continuation • Two tier merchandising/trade incentive program recognizing tree and seal • Wellness commercials -network prime time and cable television • "Baby in Back Seat" and "Mom's Kitchen" • Steve Spurrier/Bobby Bowden commercials -in-state commercials only • Taste, health and nutrition benefits of Florida orange juice Foodservice • Trade incentives "Wake-up to Breakfast Profit" campaign Public Relations • Partners: American Cancer Society, March of Dimes and American Academy of Pediatrics • Florida cuisine • Medical research news • Consumer affairs directors at retail 1998-99 Advertising • "Talking Sandwich" commercial • Introduce new Florida sunshine Tree symbol • Health / wellness theme • Building the Florida franchise Merchandising & Public Relations (incorporated into the Processed Orange Business Unit) • Focus on proven benefits related to cancer, heart disease and colds/flu • National television, local radio, print • Retail (national), shelf space / triple crown promotions • PR includes "Wake Up To Florida Orange Juice" and "America's Sickest Cities" • "Fight Cancer, Fight Harder" • Supermarket trade magazines • In-store meals 1999-2000 Processed Orange Business Unit • Prevention Magazine • Talking Sandwich
65
• Value-added merchandising incentive program • Advertising messages on orange juice containers • Health/wellness -continue prior year theme • Television, print, local radio • Retail promotions • Public relations include pediatric outreach, America's sickest cities, consumer affairs director
education, video news release • Merchandising: value-added incentive promotion 2000-01 (New Executive Director: Bob Crawford) • Strategic Plan approved • Talking sandwich campaign • Juice confusion consumer education • Public service announcement "Cheryl Tiegs" • Discover the taste of Florida recipe campaign • Merchandising foodservice representative programs wind-down in May 2001 2001-02 (Major Reorganization of FDOC Marketing) • No merchandising activities • No retail incentives • No schoo1/foodservice incentives • No television advertising until January 2002; black for 6 months (July to December, 2001) • Jan-June TV: "The Best Start Under the Sun" targeted audience (mothers with children 5-13) • Public relations January to June: Mobil Marketing Tour • Emphasis on public relations and advertising (annual funding spent in last six months -
January to June 2002) 2002-03 • Continue "The Best Start Under the Sun" campaign • Target audience: Moms with children • Advertising, public relations, in-state promotion
- network television (target women 25-44) - traffic radio - magazine - mobile marketing tour - juice confusion: consumer recognition of fruit drinks (Sunny D) vs. 100% orange juice
• No retail (trade incentive) programs Foodservice/schools • Suggest a sale promotion • Importance of breakfast • Brand ID (symbol) program with advertising and public relations, no rebate 68 programs
66
APPENDIX B
Appendix Table B-1: OJMOD Structure and Econometric Results
Appendix Table B-2: A Listing of Endogenous and Exogenous OJMOD Variables
Appendix Table B-3: OJMOD Ex Post Simulation Validation Statistics, Theil Relative Change Forecast Error Statistics, 1967/68 to 1999/2000

67
APPENDIX TABLE B-1: OJMOD STRUCTURE AND ECONOMETRIC RESULTS1
Orange Production by State Florida
Tree Plantings FORATPC = 1465.6 + 48.882*(FORASYC*FORAPAC/UPPI90) t-1 + 0.287 * FORATPC t-1 (262.65) (15.12) (0.039) [0.22] [0.31] - 903.43*WTHRFP - 1116.9*S6778 + 3265.4*S8692 + 1352.9*D87 (128.88) (170.3) (223.7) (397.9) R-Square = 0.9823 Adj. R-Square = 0.9782 DW = 2.448 Durbin-h = -1.17 Bearing Trees by Age Group Young Bearing Tree Inventory FORATYC = -718.06 + 20.449*(FORASYC*FORAPAC/UPPI90) t-1 + 0.639*LFORAPY + 0.517*FORATYC t-1 (264.97) (14.16) (0.027) (0.056) [0.03] [0.04] - 0.1835*FORATYC t-2 - 1855.6*WTHRFY1 - 960.51*WTHRFY2 (0.034) (148.45) (230.89) where LFORAPY = (FORATPCt-3+FORATPC t-4+FORATPC t-5+FORATPC t-6+FORATPC t-7 + FORATPC t-
8)*Z8901+ (FORATPC t-4+FORATPC t-5+FORATPC t-6+FORATPC t-7+FORATPC t-8)*Z8588+ (FORATPC t-4+FORATPC t-5+FORATPC t-6+FORATPC t-7+ FORATPC t-8+FORATPC t-9) *Z6784
R-Square = 0.9993 Adj. R-Square = 0.9991 DW = 2.247 Durbin-h = -0.749 Middle Group 1 Bearing Tree Inventory FORAT1C = -1383.03 + 68.317*(FORASYC*FORAPAC/UPPI90) t-1 + 0.753*LFORAP1 + 0.346*FORAT1C t-1 (293.01) (15.887) (0.041) (0.086) [0.09] [0.10] - 0.333*FORAT1C t-2 + 1505.4*WTHRF1 - 1306.5*S8893 (0.052) (184.3) (230.8) where LFORAP1 = (FORATPC t-9+FORATPC t-10+FORATPC t-11+FORATPC t-12+FORATPC t-13)*Z8501+
(FORATPC t-10+FORATPC t-11+FORATPC t-12+FORATPC t-13+FORATPC t-14)*Z6784 R-Square = 0.9976 Adj. R-Square = 0.9970 DW = 1.693 Durbin-h = 0.0925 Middle Group 2 Bearing Tree Removals FORAT2C = 765.5 + 12.873*(FORASYC*FORAPAC/UPPI90) t-1 + 0.208*LFORAP2 + 1.474*FORAT2C t-1 (285.63) (20.21) (0.048) (0.103) [0.02] [0.04] - 0.931*FORAT2C t-2 - 1142.7*WTHRF2 + 1566.8*D7598 (0.075) (223.6) (334.1) _____________________________________________ 1 Numbers in parentheses below the estimated coefficients are the standard errors. Numbers in brackets below the standard errors are elasticities. For equations with lagged dependent variables, numbers in brackets below the coefficients are short-run elasticities and those to the right of the short-run elasticities are long-run elasticities. All variables are assumed to be subscripted with “t” for current time period unless otherwise indicated.
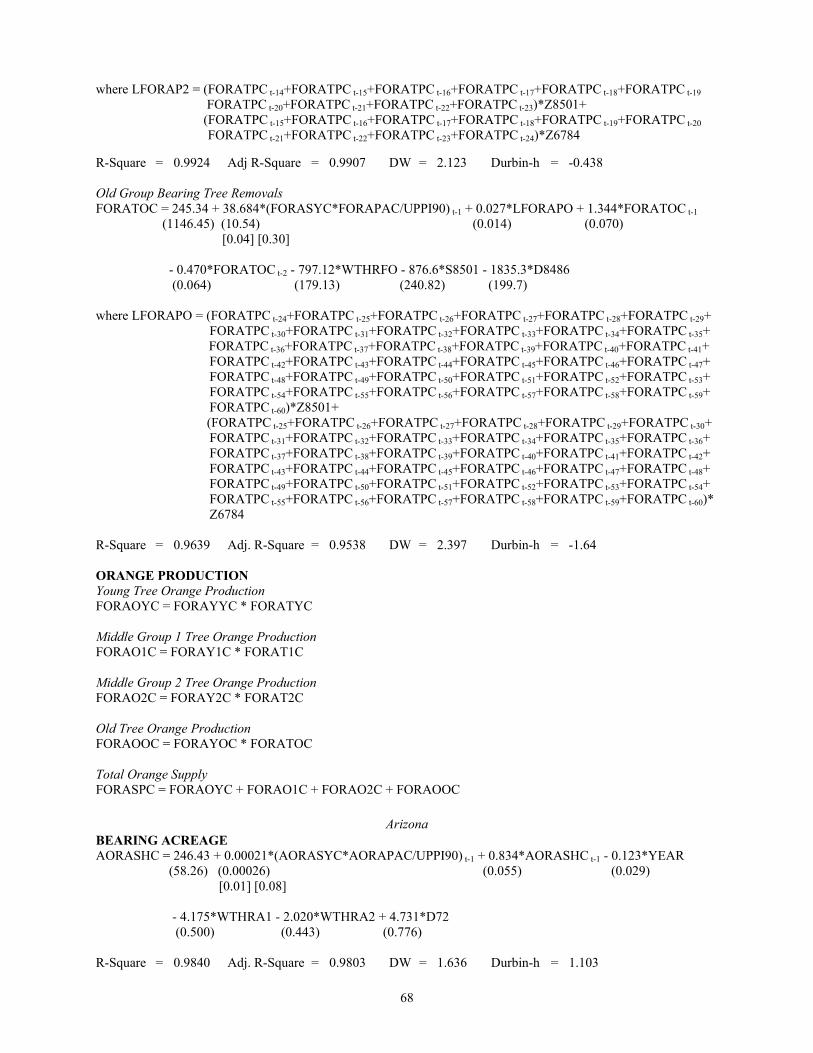
68
where LFORAP2 = (FORATPC t-14+FORATPC t-15+FORATPC t-16+FORATPC t-17+FORATPC t-18+FORATPC t-19
FORATPC t-20+FORATPC t-21+FORATPC t-22+FORATPC t-23)*Z8501+ (FORATPC t-15+FORATPC t-16+FORATPC t-17+FORATPC t-18+FORATPC t-19+FORATPC t-20
FORATPC t-21+FORATPC t-22+FORATPC t-23+FORATPC t-24)*Z6784 R-Square = 0.9924 Adj R-Square = 0.9907 DW = 2.123 Durbin-h = -0.438 Old Group Bearing Tree Removals FORATOC = 245.34 + 38.684*(FORASYC*FORAPAC/UPPI90) t-1 + 0.027*LFORAPO + 1.344*FORATOC t-1 (1146.45) (10.54) (0.014) (0.070) [0.04] [0.30] - 0.470*FORATOC t-2 - 797.12*WTHRFO - 876.6*S8501 - 1835.3*D8486 (0.064) (179.13) (240.82) (199.7) where LFORAPO = (FORATPC t-24+FORATPC t-25+FORATPC t-26+FORATPC t-27+FORATPC t-28+FORATPC t-29+
FORATPC t-30+FORATPC t-31+FORATPC t-32+FORATPC t-33+FORATPC t-34+FORATPC t-35+ FORATPC t-36+FORATPC t-37+FORATPC t-38+FORATPC t-39+FORATPC t-40+FORATPC t-41+
FORATPC t-42+FORATPC t-43+FORATPC t-44+FORATPC t-45+FORATPC t-46+FORATPC t-47+ FORATPC t-48+FORATPC t-49+FORATPC t-50+FORATPC t-51+FORATPC t-52+FORATPC t-53+ FORATPC t-54+FORATPC t-55+FORATPC t-56+FORATPC t-57+FORATPC t-58+FORATPC t-59+ FORATPC t-60)*Z8501+
(FORATPC t-25+FORATPC t-26+FORATPC t-27+FORATPC t-28+FORATPC t-29+FORATPC t-30+ FORATPC t-31+FORATPC t-32+FORATPC t-33+FORATPC t-34+FORATPC t-35+FORATPC t-36+ FORATPC t-37+FORATPC t-38+FORATPC t-39+FORATPC t-40+FORATPC t-41+FORATPC t-42+ FORATPC t-43+FORATPC t-44+FORATPC t-45+FORATPC t-46+FORATPC t-47+FORATPC t-48+ FORATPC t-49+FORATPC t-50+FORATPC t-51+FORATPC t-52+FORATPC t-53+FORATPC t-54+ FORATPC t-55+FORATPC t-56+FORATPC t-57+FORATPC t-58+FORATPC t-59+FORATPC t-60)* Z6784
R-Square = 0.9639 Adj. R-Square = 0.9538 DW = 2.397 Durbin-h = -1.64 ORANGE PRODUCTION Young Tree Orange Production FORAOYC = FORAYYC * FORATYC Middle Group 1 Tree Orange Production FORAO1C = FORAY1C * FORAT1C Middle Group 2 Tree Orange Production FORAO2C = FORAY2C * FORAT2C Old Tree Orange Production FORAOOC = FORAYOC * FORATOC Total Orange Supply FORASPC = FORAOYC + FORAO1C + FORAO2C + FORAOOC
Arizona BEARING ACREAGE AORASHC = 246.43 + 0.00021*(AORASYC*AORAPAC/UPPI90) t-1 + 0.834*AORASHC t-1 - 0.123*YEAR (58.26) (0.00026) (0.055) (0.029) [0.01] [0.08] - 4.175*WTHRA1 - 2.020*WTHRA2 + 4.731*D72 (0.500) (0.443) (0.776) R-Square = 0.9840 Adj. R-Square = 0.9803 DW = 1.636 Durbin-h = 1.103
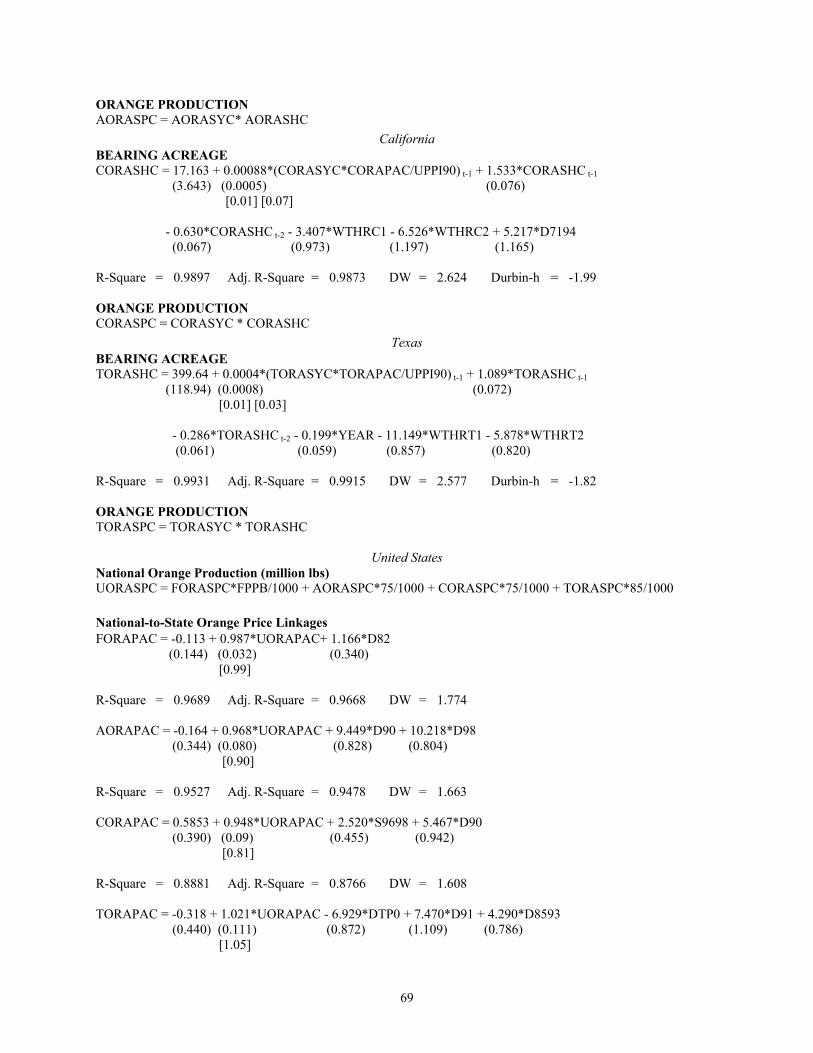
69
ORANGE PRODUCTION AORASPC = AORASYC* AORASHC
California BEARING ACREAGE CORASHC = 17.163 + 0.00088*(CORASYC*CORAPAC/UPPI90) t-1 + 1.533*CORASHC t-1 (3.643) (0.0005) (0.076) [0.01] [0.07] - 0.630*CORASHC t-2 - 3.407*WTHRC1 - 6.526*WTHRC2 + 5.217*D7194 (0.067) (0.973) (1.197) (1.165) R-Square = 0.9897 Adj. R-Square = 0.9873 DW = 2.624 Durbin-h = -1.99 ORANGE PRODUCTION CORASPC = CORASYC * CORASHC
Texas BEARING ACREAGE TORASHC = 399.64 + 0.0004*(TORASYC*TORAPAC/UPPI90) t-1 + 1.089*TORASHC t-1 (118.94) (0.0008) (0.072) [0.01] [0.03] - 0.286*TORASHC t-2 - 0.199*YEAR - 11.149*WTHRT1 - 5.878*WTHRT2 (0.061) (0.059) (0.857) (0.820) R-Square = 0.9931 Adj. R-Square = 0.9915 DW = 2.577 Durbin-h = -1.82 ORANGE PRODUCTION TORASPC = TORASYC * TORASHC
United States National Orange Production (million lbs) UORASPC = FORASPC*FPPB/1000 + AORASPC*75/1000 + CORASPC*75/1000 + TORASPC*85/1000 National-to-State Orange Price Linkages FORAPAC = -0.113 + 0.987*UORAPAC+ 1.166*D82 (0.144) (0.032) (0.340) [0.99] R-Square = 0.9689 Adj. R-Square = 0.9668 DW = 1.774 AORAPAC = -0.164 + 0.968*UORAPAC + 9.449*D90 + 10.218*D98 (0.344) (0.080) (0.828) (0.804) [0.90] R-Square = 0.9527 Adj. R-Square = 0.9478 DW = 1.663 CORAPAC = 0.5853 + 0.948*UORAPAC + 2.520*S9698 + 5.467*D90 (0.390) (0.09) (0.455) (0.942) [0.81] R-Square = 0.8881 Adj. R-Square = 0.8766 DW = 1.608 TORAPAC = -0.318 + 1.021*UORAPAC - 6.929*DTP0 + 7.470*D91 + 4.290*D8593 (0.440) (0.111) (0.872) (1.109) (0.786) [1.05]
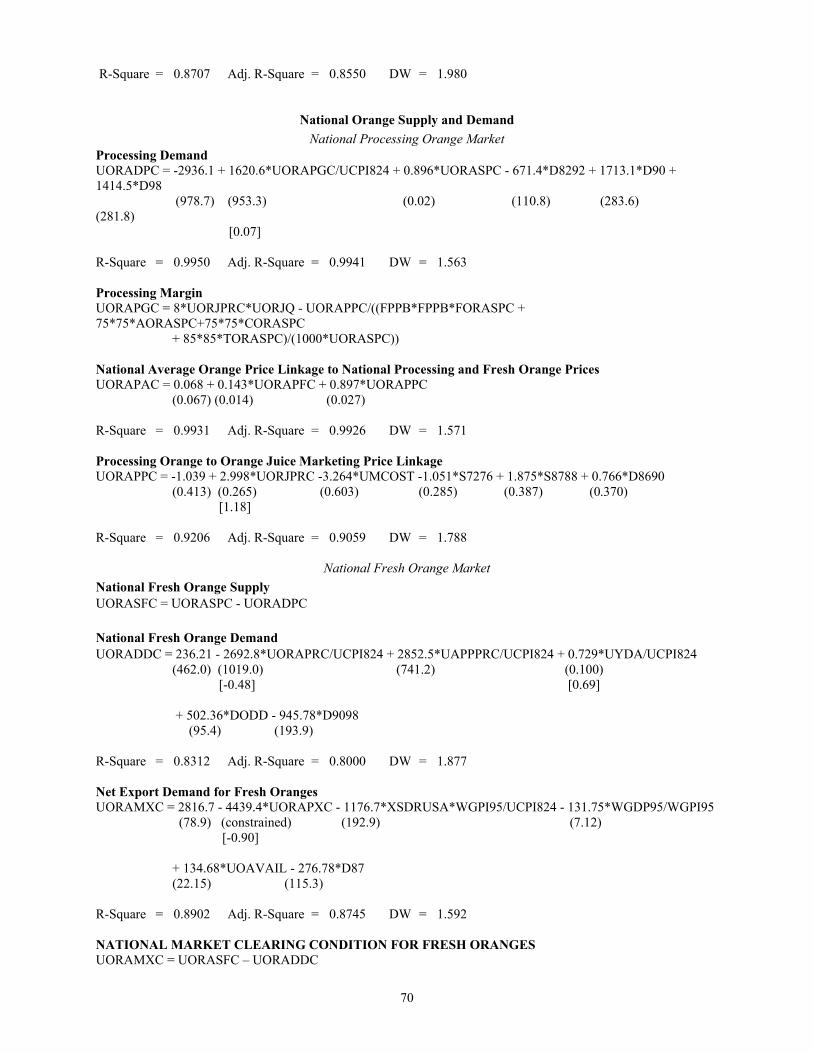
70
R-Square = 0.8707 Adj. R-Square = 0.8550 DW = 1.980
National Orange Supply and Demand National Processing Orange Market
Processing Demand UORADPC = -2936.1 + 1620.6*UORAPGC/UCPI824 + 0.896*UORASPC - 671.4*D8292 + 1713.1*D90 + 1414.5*D98 (978.7) (953.3) (0.02) (110.8) (283.6) (281.8) [0.07] R-Square = 0.9950 Adj. R-Square = 0.9941 DW = 1.563 Processing Margin UORAPGC = 8*UORJPRC*UORJQ - UORAPPC/((FPPB*FPPB*FORASPC + 75*75*AORASPC+75*75*CORASPC + 85*85*TORASPC)/(1000*UORASPC)) National Average Orange Price Linkage to National Processing and Fresh Orange Prices UORAPAC = 0.068 + 0.143*UORAPFC + 0.897*UORAPPC (0.067) (0.014) (0.027) R-Square = 0.9931 Adj. R-Square = 0.9926 DW = 1.571 Processing Orange to Orange Juice Marketing Price Linkage UORAPPC = -1.039 + 2.998*UORJPRC -3.264*UMCOST -1.051*S7276 + 1.875*S8788 + 0.766*D8690 (0.413) (0.265) (0.603) (0.285) (0.387) (0.370) [1.18] R-Square = 0.9206 Adj. R-Square = 0.9059 DW = 1.788
National Fresh Orange Market National Fresh Orange Supply UORASFC = UORASPC - UORADPC National Fresh Orange Demand UORADDC = 236.21 - 2692.8*UORAPRC/UCPI824 + 2852.5*UAPPPRC/UCPI824 + 0.729*UYDA/UCPI824 (462.0) (1019.0) (741.2) (0.100) [-0.48] [0.69] + 502.36*DODD - 945.78*D9098 (95.4) (193.9) R-Square = 0.8312 Adj. R-Square = 0.8000 DW = 1.877 Net Export Demand for Fresh Oranges UORAMXC = 2816.7 - 4439.4*UORAPXC - 1176.7*XSDRUSA*WGPI95/UCPI824 - 131.75*WGDP95/WGPI95 (78.9) (constrained) (192.9) (7.12) [-0.90] + 134.68*UOAVAIL - 276.78*D87 (22.15) (115.3) R-Square = 0.8902 Adj. R-Square = 0.8745 DW = 1.592 NATIONAL MARKET CLEARING CONDITION FOR FRESH ORANGES UORAMXC = UORASFC – UORADDC
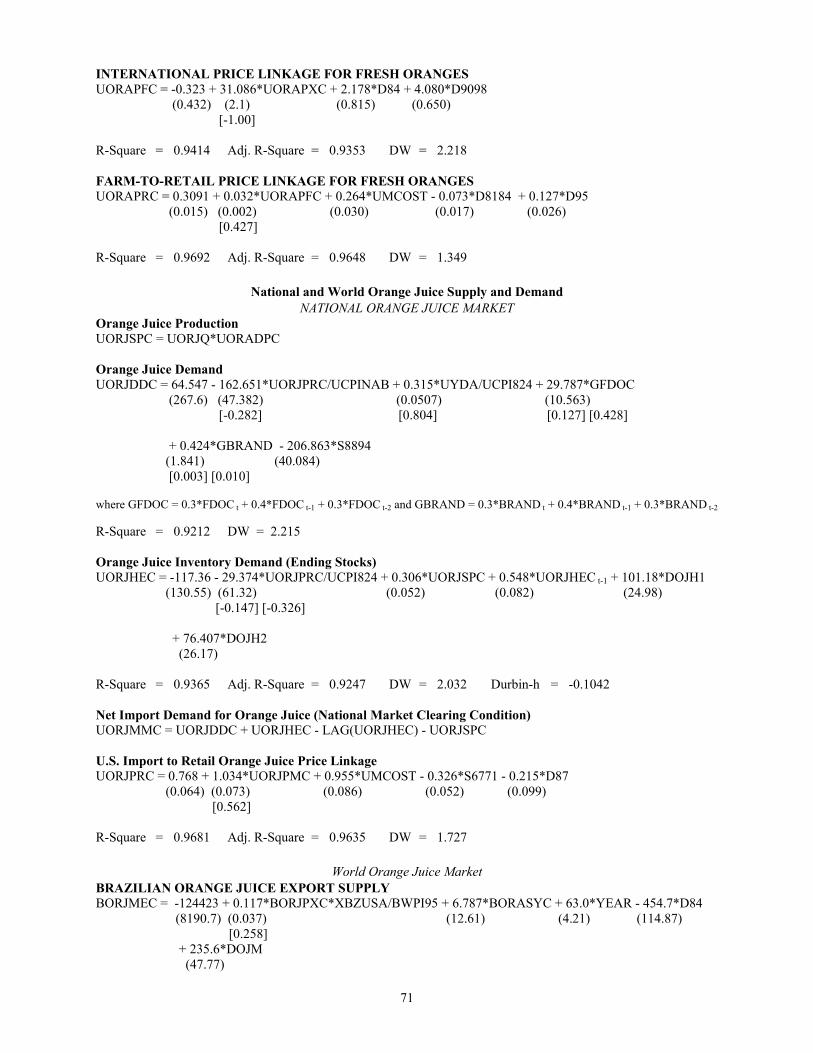
71
INTERNATIONAL PRICE LINKAGE FOR FRESH ORANGES UORAPFC = -0.323 + 31.086*UORAPXC + 2.178*D84 + 4.080*D9098 (0.432) (2.1) (0.815) (0.650) [-1.00] R-Square = 0.9414 Adj. R-Square = 0.9353 DW = 2.218 FARM-TO-RETAIL PRICE LINKAGE FOR FRESH ORANGES UORAPRC = 0.3091 + 0.032*UORAPFC + 0.264*UMCOST - 0.073*D8184 + 0.127*D95 (0.015) (0.002) (0.030) (0.017) (0.026) [0.427] R-Square = 0.9692 Adj. R-Square = 0.9648 DW = 1.349
National and World Orange Juice Supply and Demand NATIONAL ORANGE JUICE MARKET
Orange Juice Production UORJSPC = UORJQ*UORADPC Orange Juice Demand UORJDDC = 64.547 - 162.651*UORJPRC/UCPINAB + 0.315*UYDA/UCPI824 + 29.787*GFDOC (267.6) (47.382) (0.0507) (10.563) [-0.282] [0.804] [0.127] [0.428] + 0.424*GBRAND - 206.863*S8894 (1.841) (40.084) [0.003] [0.010] where GFDOC = 0.3*FDOC t + 0.4*FDOC t-1 + 0.3*FDOC t-2 and GBRAND = 0.3*BRAND t + 0.4*BRAND t-1 + 0.3*BRAND t-2 R-Square = 0.9212 DW = 2.215 Orange Juice Inventory Demand (Ending Stocks) UORJHEC = -117.36 - 29.374*UORJPRC/UCPI824 + 0.306*UORJSPC + 0.548*UORJHEC t-1 + 101.18*DOJH1 (130.55) (61.32) (0.052) (0.082) (24.98) [-0.147] [-0.326] + 76.407*DOJH2 (26.17) R-Square = 0.9365 Adj. R-Square = 0.9247 DW = 2.032 Durbin-h = -0.1042 Net Import Demand for Orange Juice (National Market Clearing Condition) UORJMMC = UORJDDC + UORJHEC - LAG(UORJHEC) - UORJSPC U.S. Import to Retail Orange Juice Price Linkage UORJPRC = 0.768 + 1.034*UORJPMC + 0.955*UMCOST - 0.326*S6771 - 0.215*D87 (0.064) (0.073) (0.086) (0.052) (0.099) [0.562] R-Square = 0.9681 Adj. R-Square = 0.9635 DW = 1.727
World Orange Juice Market BRAZILIAN ORANGE JUICE EXPORT SUPPLY BORJMEC = -124423 + 0.117*BORJPXC*XBZUSA/BWPI95 + 6.787*BORASYC + 63.0*YEAR - 454.7*D84 (8190.7) (0.037) (12.61) (4.21) (114.87) [0.258] + 235.6*DOJM (47.77)
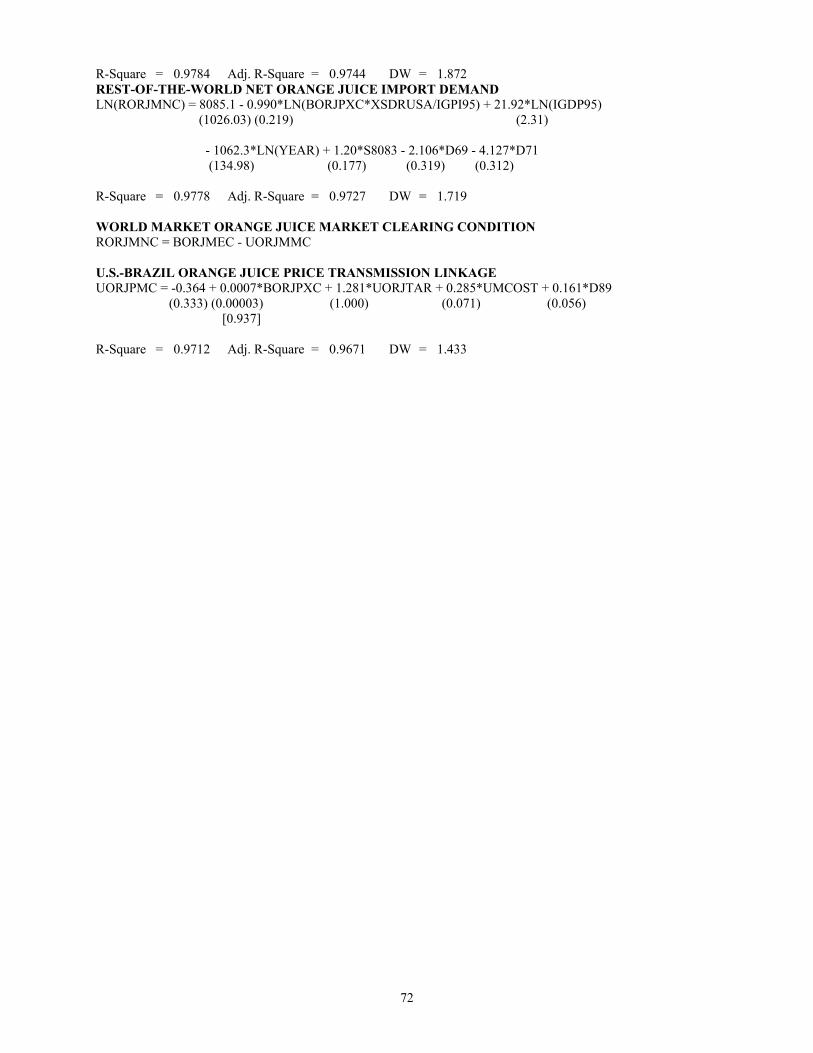
72
R-Square = 0.9784 Adj. R-Square = 0.9744 DW = 1.872 REST-OF-THE-WORLD NET ORANGE JUICE IMPORT DEMAND LN(RORJMNC) = 8085.1 - 0.990*LN(BORJPXC*XSDRUSA/IGPI95) + 21.92*LN(IGDP95) (1026.03) (0.219) (2.31) - 1062.3*LN(YEAR) + 1.20*S8083 - 2.106*D69 - 4.127*D71 (134.98) (0.177) (0.319) (0.312) R-Square = 0.9778 Adj. R-Square = 0.9727 DW = 1.719 WORLD MARKET ORANGE JUICE MARKET CLEARING CONDITION RORJMNC = BORJMEC - UORJMMC
U.S.-BRAZIL ORANGE JUICE PRICE TRANSMISSION LINKAGE UORJPMC = -0.364 + 0.0007*BORJPXC + 1.281*UORJTAR + 0.285*UMCOST + 0.161*D89 (0.333) (0.00003) (1.000) (0.071) (0.056) [0.937] R-Square = 0.9712 Adj. R-Square = 0.9671 DW = 1.433
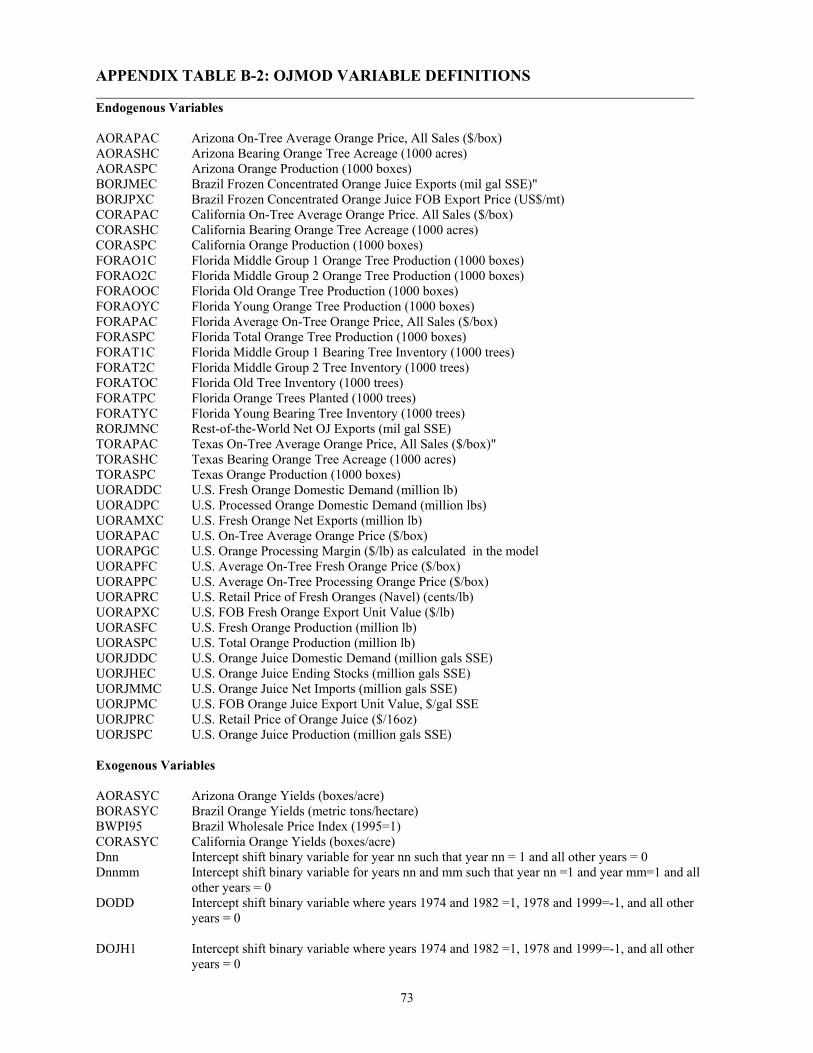
73
APPENDIX TABLE B-2: OJMOD VARIABLE DEFINITIONS Endogenous Variables AORAPAC Arizona On-Tree Average Orange Price, All Sales ($/box) AORASHC Arizona Bearing Orange Tree Acreage (1000 acres) AORASPC Arizona Orange Production (1000 boxes) BORJMEC Brazil Frozen Concentrated Orange Juice Exports (mil gal SSE)" BORJPXC Brazil Frozen Concentrated Orange Juice FOB Export Price (US$/mt) CORAPAC California On-Tree Average Orange Price. All Sales ($/box) CORASHC California Bearing Orange Tree Acreage (1000 acres) CORASPC California Orange Production (1000 boxes) FORAO1C Florida Middle Group 1 Orange Tree Production (1000 boxes) FORAO2C Florida Middle Group 2 Orange Tree Production (1000 boxes) FORAOOC Florida Old Orange Tree Production (1000 boxes) FORAOYC Florida Young Orange Tree Production (1000 boxes) FORAPAC Florida Average On-Tree Orange Price, All Sales ($/box) FORASPC Florida Total Orange Tree Production (1000 boxes) FORAT1C Florida Middle Group 1 Bearing Tree Inventory (1000 trees) FORAT2C Florida Middle Group 2 Tree Inventory (1000 trees) FORATOC Florida Old Tree Inventory (1000 trees) FORATPC Florida Orange Trees Planted (1000 trees) FORATYC Florida Young Bearing Tree Inventory (1000 trees) RORJMNC Rest-of-the-World Net OJ Exports (mil gal SSE) TORAPAC Texas On-Tree Average Orange Price, All Sales ($/box)" TORASHC Texas Bearing Orange Tree Acreage (1000 acres) TORASPC Texas Orange Production (1000 boxes) UORADDC U.S. Fresh Orange Domestic Demand (million lb) UORADPC U.S. Processed Orange Domestic Demand (million lbs) UORAMXC U.S. Fresh Orange Net Exports (million lb) UORAPAC U.S. On-Tree Average Orange Price ($/box) UORAPGC U.S. Orange Processing Margin ($/lb) as calculated in the model UORAPFC U.S. Average On-Tree Fresh Orange Price ($/box) UORAPPC U.S. Average On-Tree Processing Orange Price ($/box) UORAPRC U.S. Retail Price of Fresh Oranges (Navel) (cents/lb) UORAPXC U.S. FOB Fresh Orange Export Unit Value ($/lb) UORASFC U.S. Fresh Orange Production (million lb) UORASPC U.S. Total Orange Production (million lb) UORJDDC U.S. Orange Juice Domestic Demand (million gals SSE) UORJHEC U.S. Orange Juice Ending Stocks (million gals SSE) UORJMMC U.S. Orange Juice Net Imports (million gals SSE) UORJPMC U.S. FOB Orange Juice Export Unit Value, $/gal SSE UORJPRC U.S. Retail Price of Orange Juice ($/16oz) UORJSPC U.S. Orange Juice Production (million gals SSE) Exogenous Variables AORASYC Arizona Orange Yields (boxes/acre) BORASYC Brazil Orange Yields (metric tons/hectare) BWPI95 Brazil Wholesale Price Index (1995=1) CORASYC California Orange Yields (boxes/acre) Dnn Intercept shift binary variable for year nn such that year nn = 1 and all other years = 0 Dnnmm Intercept shift binary variable for years nn and mm such that year nn =1 and year mm=1 and all
other years = 0 DODD Intercept shift binary variable where years 1974 and 1982 =1, 1978 and 1999=-1, and all other
years = 0 DOJH1 Intercept shift binary variable where years 1974 and 1982 =1, 1978 and 1999=-1, and all other
years = 0
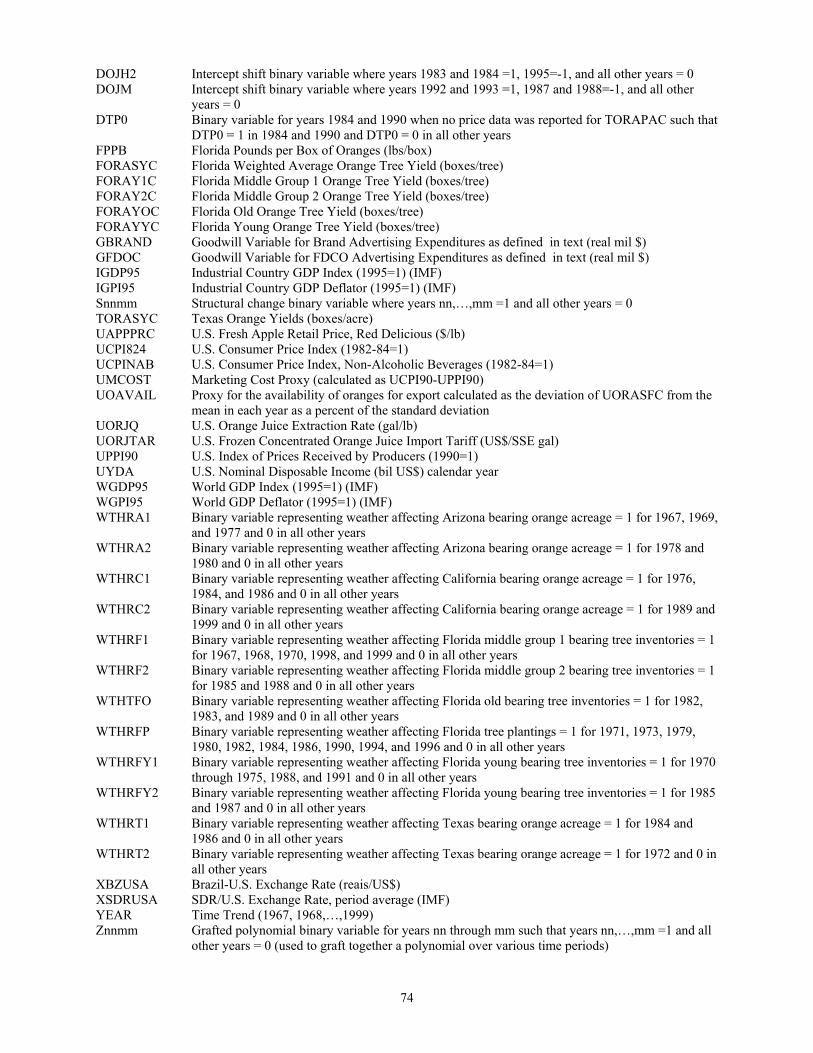
74
DOJH2 Intercept shift binary variable where years 1983 and 1984 =1, 1995=-1, and all other years = 0 DOJM Intercept shift binary variable where years 1992 and 1993 =1, 1987 and 1988=-1, and all other
years = 0 DTP0 Binary variable for years 1984 and 1990 when no price data was reported for TORAPAC such that
DTP0 = 1 in 1984 and 1990 and DTP0 = 0 in all other years FPPB Florida Pounds per Box of Oranges (lbs/box) FORASYC Florida Weighted Average Orange Tree Yield (boxes/tree) FORAY1C Florida Middle Group 1 Orange Tree Yield (boxes/tree) FORAY2C Florida Middle Group 2 Orange Tree Yield (boxes/tree) FORAYOC Florida Old Orange Tree Yield (boxes/tree) FORAYYC Florida Young Orange Tree Yield (boxes/tree) GBRAND Goodwill Variable for Brand Advertising Expenditures as defined in text (real mil $) GFDOC Goodwill Variable for FDCO Advertising Expenditures as defined in text (real mil $) IGDP95 Industrial Country GDP Index (1995=1) (IMF) IGPI95 Industrial Country GDP Deflator (1995=1) (IMF) Snnmm Structural change binary variable where years nn,…,mm =1 and all other years = 0 TORASYC Texas Orange Yields (boxes/acre) UAPPPRC U.S. Fresh Apple Retail Price, Red Delicious ($/lb) UCPI824 U.S. Consumer Price Index (1982-84=1) UCPINAB U.S. Consumer Price Index, Non-Alcoholic Beverages (1982-84=1) UMCOST Marketing Cost Proxy (calculated as UCPI90-UPPI90) UOAVAIL Proxy for the availability of oranges for export calculated as the deviation of UORASFC from the
mean in each year as a percent of the standard deviation UORJQ U.S. Orange Juice Extraction Rate (gal/lb) UORJTAR U.S. Frozen Concentrated Orange Juice Import Tariff (US$/SSE gal) UPPI90 U.S. Index of Prices Received by Producers (1990=1) UYDA U.S. Nominal Disposable Income (bil US$) calendar year WGDP95 World GDP Index (1995=1) (IMF) WGPI95 World GDP Deflator (1995=1) (IMF) WTHRA1 Binary variable representing weather affecting Arizona bearing orange acreage = 1 for 1967, 1969,
and 1977 and 0 in all other years WTHRA2 Binary variable representing weather affecting Arizona bearing orange acreage = 1 for 1978 and
1980 and 0 in all other years WTHRC1 Binary variable representing weather affecting California bearing orange acreage = 1 for 1976,
1984, and 1986 and 0 in all other years WTHRC2 Binary variable representing weather affecting California bearing orange acreage = 1 for 1989 and
1999 and 0 in all other years WTHRF1 Binary variable representing weather affecting Florida middle group 1 bearing tree inventories = 1
for 1967, 1968, 1970, 1998, and 1999 and 0 in all other years WTHRF2 Binary variable representing weather affecting Florida middle group 2 bearing tree inventories = 1
for 1985 and 1988 and 0 in all other years WTHTFO Binary variable representing weather affecting Florida old bearing tree inventories = 1 for 1982,
1983, and 1989 and 0 in all other years WTHRFP Binary variable representing weather affecting Florida tree plantings = 1 for 1971, 1973, 1979,
1980, 1982, 1984, 1986, 1990, 1994, and 1996 and 0 in all other years WTHRFY1 Binary variable representing weather affecting Florida young bearing tree inventories = 1 for 1970
through 1975, 1988, and 1991 and 0 in all other years WTHRFY2 Binary variable representing weather affecting Florida young bearing tree inventories = 1 for 1985
and 1987 and 0 in all other years WTHRT1 Binary variable representing weather affecting Texas bearing orange acreage = 1 for 1984 and
1986 and 0 in all other years WTHRT2 Binary variable representing weather affecting Texas bearing orange acreage = 1 for 1972 and 0 in
all other years XBZUSA Brazil-U.S. Exchange Rate (reais/US$) XSDRUSA SDR/U.S. Exchange Rate, period average (IMF) YEAR Time Trend (1967, 1968,…,1999) Znnmm Grafted polynomial binary variable for years nn through mm such that years nn,…,mm =1 and all
other years = 0 (used to graft together a polynomial over various time periods)
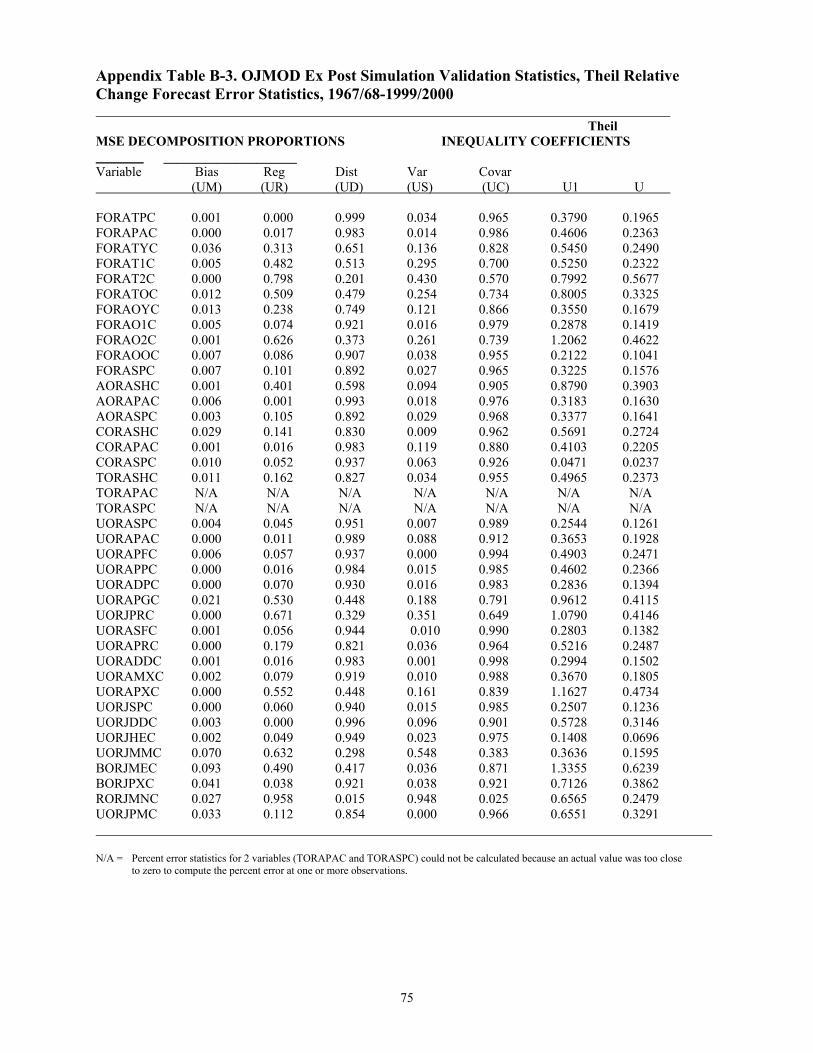
75
Appendix Table B-3. OJMOD Ex Post Simulation Validation Statistics, Theil Relative Change Forecast Error Statistics, 1967/68-1999/2000 Theil MSE DECOMPOSITION PROPORTIONS INEQUALITY COEFFICIENTS ____________________ Variable Bias Reg Dist Var Covar (UM) (UR) (UD) (US) (UC) U1 U FORATPC 0.001 0.000 0.999 0.034 0.965 0.3790 0.1965 FORAPAC 0.000 0.017 0.983 0.014 0.986 0.4606 0.2363 FORATYC 0.036 0.313 0.651 0.136 0.828 0.5450 0.2490 FORAT1C 0.005 0.482 0.513 0.295 0.700 0.5250 0.2322 FORAT2C 0.000 0.798 0.201 0.430 0.570 0.7992 0.5677 FORATOC 0.012 0.509 0.479 0.254 0.734 0.8005 0.3325 FORAOYC 0.013 0.238 0.749 0.121 0.866 0.3550 0.1679 FORAO1C 0.005 0.074 0.921 0.016 0.979 0.2878 0.1419 FORAO2C 0.001 0.626 0.373 0.261 0.739 1.2062 0.4622 FORAOOC 0.007 0.086 0.907 0.038 0.955 0.2122 0.1041 FORASPC 0.007 0.101 0.892 0.027 0.965 0.3225 0.1576 AORASHC 0.001 0.401 0.598 0.094 0.905 0.8790 0.3903 AORAPAC 0.006 0.001 0.993 0.018 0.976 0.3183 0.1630 AORASPC 0.003 0.105 0.892 0.029 0.968 0.3377 0.1641 CORASHC 0.029 0.141 0.830 0.009 0.962 0.5691 0.2724 CORAPAC 0.001 0.016 0.983 0.119 0.880 0.4103 0.2205 CORASPC 0.010 0.052 0.937 0.063 0.926 0.0471 0.0237 TORASHC 0.011 0.162 0.827 0.034 0.955 0.4965 0.2373 TORAPAC N/A N/A N/A N/A N/A N/A N/A TORASPC N/A N/A N/A N/A N/A N/A N/A UORASPC 0.004 0.045 0.951 0.007 0.989 0.2544 0.1261 UORAPAC 0.000 0.011 0.989 0.088 0.912 0.3653 0.1928 UORAPFC 0.006 0.057 0.937 0.000 0.994 0.4903 0.2471 UORAPPC 0.000 0.016 0.984 0.015 0.985 0.4602 0.2366 UORADPC 0.000 0.070 0.930 0.016 0.983 0.2836 0.1394 UORAPGC 0.021 0.530 0.448 0.188 0.791 0.9612 0.4115 UORJPRC 0.000 0.671 0.329 0.351 0.649 1.0790 0.4146 UORASFC 0.001 0.056 0.944 0.010 0.990 0.2803 0.1382 UORAPRC 0.000 0.179 0.821 0.036 0.964 0.5216 0.2487 UORADDC 0.001 0.016 0.983 0.001 0.998 0.2994 0.1502 UORAMXC 0.002 0.079 0.919 0.010 0.988 0.3670 0.1805 UORAPXC 0.000 0.552 0.448 0.161 0.839 1.1627 0.4734 UORJSPC 0.000 0.060 0.940 0.015 0.985 0.2507 0.1236 UORJDDC 0.003 0.000 0.996 0.096 0.901 0.5728 0.3146 UORJHEC 0.002 0.049 0.949 0.023 0.975 0.1408 0.0696 UORJMMC 0.070 0.632 0.298 0.548 0.383 0.3636 0.1595 BORJMEC 0.093 0.490 0.417 0.036 0.871 1.3355 0.6239 BORJPXC 0.041 0.038 0.921 0.038 0.921 0.7126 0.3862 RORJMNC 0.027 0.958 0.015 0.948 0.025 0.6565 0.2479 UORJPMC 0.033 0.112 0.854 0.000 0.966 0.6551 0.3291 N/A = Percent error statistics for 2 variables (TORAPAC and TORASPC) could not be calculated because an actual value was too close
to zero to compute the percent error at one or more observations.