Cover Pg - INFO - Home
50
U.S. Department of Energy FreedomCAR and Vehicle Technologies, EE-2G 1000 Independence Avenue, S.W. Washington, D.C. 20585-0121 FY 2005 REPORT ON TOYOTA PRIUS MOTOR THERMAL MANAGEMENT Prepared by: Oak Ridge National Laboratory Laura D. Marlino, Program Manager Submitted to: Energy Efficiency and Renewable Energy FreedomCAR and Vehicle Technologies Vehicle Systems Team Susan A. Rogers, Technology Development Manager February 2005
Transcript of Cover Pg - INFO - Home

U.S. Department of Energy FreedomCAR and Vehicle Technologies, EE-2G
1000 Independence Avenue, S.W. Washington, D.C. 20585-0121
FY 2005 REPORT ON TOYOTA PRIUS MOTOR THERMAL MANAGEMENT Prepared by: Oak Ridge National Laboratory Laura D. Marlino, Program Manager Submitted to: Energy Efficiency and Renewable Energy FreedomCAR and Vehicle Technologies Vehicle Systems Team Susan A. Rogers, Technology Development Manager February 2005

ORNL/TM-2005/33 Engineering Science & Technology Division
REPORT ON TOYOTA PRIUS MOTOR
THERMAL MANAGEMENT
J. S. Hsu S. C. Nelson P. A. Jallouk C. W. Ayers R. H. Wiles
S. L. Campbell C. L. Coomer
K. T. Lowe T. A. Burress
Publication Date: February 2005
Prepared by the OAK RIDGE NATIONAL LABORATORY
Oak Ridge, Tennessee 37831 managed by
UT-BATTELLE, LLC for the
U.S. DEPARTMENT OF ENERGY Under contract DE-AC05-00OR22725

This report was prepared as an account of work sponsored by an agency of the United States Government. Neither the United States Government nor any agency thereof, nor any of their employees, makes any warranty, express or implied, or assumes any legal liability or responsibility for the accuracy, completeness, or usefulness of any information, apparatus, product, or process disclosed, or represents that its use would not infringe privately owned rights. Reference herein to any specific commercial product, process, or service by trade name, trademark, manufacturer, or otherwise, does not necessarily constitute or imply its endorsement, recommendation, or favoring by the United States Government or any agency thereof. The views and opinions of authors expressed herein do not necessarily state or reflect those of the United States Government or any agency thereof.

ii
TABLE CONTENTS
Page
LIST OF FIGURES ............................................................................................................................ iii LIST OF TABLES .............................................................................................................................. v INTRODUCTION............................................................................................................................... 1 1. REASON FOR CONDUCTING TEMPERATURE TESTS .................................................... 3
2. PERMISSIBLE TEMPERATURE LIMITS OF WINDING AND COOLING OIL............. 4
3. THERMOCOUPLE LOCATIONS ............................................................................................ 5
4. TEST SETUP ................................................................................................................................ 6
5. POWER SUPPLY FOR CONDUCTING MOTOR TORQUE CAPABILITY TEST AT 900 RPM ...................................................................................................................... 9
6. TESTING OF PRIUS AT 900 RPM ........................................................................................... 11
6.1 MECHANICAL LOSS TESTING .................................................................................... 11 7. THERMAL MODELING RESULTS......................................................................................... 24 7.1 INTRODUCTION .............................................................................................................. 24 7.2 MODEL DESCRIPTION .................................................................................................. 24 7.2.1 Overall Model of Motor ........................................................................................ 24 7.2.2 Thermal Model of Motor ...................................................................................... 25 7.2.3 Model Components................................................................................................ 25 7.2.4 Physical Properties ................................................................................................ 29 7.3 METHODOLOGY ............................................................................................................. 30 7.4 RESULTS ............................................................................................................................ 31 8. SUMMARY AND RECOMMENDATIONS ............................................................................. 37 APPENDIX A: CUT VIEW OF PRIUS HYBRID THSII SYSTEM ............................................. 38 APPENDIX B: LOAD-ANGLE ESTIMATION USING SPEED SENSOR/RESOLVER FOR PRIUS THSII ...................................................................................................................... 39 B.1 LOAD ANGLE DETECTION CIRCUIT ........................................................................ 40

iii
TABLE OF FIGURES
Figure Page
1 Output power and torque vs. speed of THSII motors ........................................................... 3 2 Thermocouple locations viewed from the end of the Toyota Prius motor ........................... 5 3 Test schematic diagram ........................................................................................................ 6 4 Shaft coupling of test setup................................................................................................... 7 5 Side view of shaft coupling .................................................................................................. 8 6 Adjustable temperature and adjustable flow rate water-ethylene-glycol supply .................. 8 7 The 60-Hz power supply for conducting the motor temperature rise test ............................ 9 8 Control room set up .............................................................................................................. 10 9 Current vs. voltage at 900 rpm at no-load conditions........................................................... 13 10 Input power vs. voltage at 900 rpm at no-load conditions.................................................... 13 11 The THSII with all gears at 900 rpm with 168.7 Nm and 35°C coolant .............................. 17 12 The THSII with all gears at 900 rpm with 168.7 Nm and 35°C coolant .............................. 17 13 The THSII with all gears at 900 rpm with 159.6 Nm and 50°C coolant .............................. 18 14 The THSII with all gears at 900 rpm with 159.6 Nm and 50°C coolant .............................. 18 15 The THSII with all gears at 900 rpm with 145.7 Nm and 75°C coolant .............................. 19 16 The THSII with all gears at 900 rpm with 145.7 Nm and 75°C coolant .............................. 19 17 The THSII with all gears at 900 rpm with 117.8 Nm and 105°C coolant ............................ 20 18 The THSII with all gears at 900 rpm with 117.8 Nm and 105°C coolant ............................ 20 19 Peak power tests at 900 rpm at 205 VLL ............................................................................... 22 20 Obtaining rate of change of winding temperature for 400 Nm............................................. 23 21 Schematic of Prius motor stator and rotor ............................................................................ 25 22 Schematic of Prius motor stator iron in HEATING 7.3 model ............................................ 26 23 Schematic of slot insulation and wedge insulation in stator iron core slots in HEATING 7.3 model ........................................................................................................... 27 24 Schematic of copper bundles in stator iron core slots in HEATING 7.3 model................... 27 25 Schematic of rotor iron core and hub as modeled in HEATING 7.3 model......................... 28 26 Schematic of slinger superimposed on rotor iron core and hub in HEATING 7.3 model.... 28 27 Schematic of bracket and cooling frame in HEATING 7.3 model....................................... 29 28 Temperature profiles in Prius motor stator iron for the 50°C cooling case in the vicinity of winding thermocouple W1 as predicted by HEATING 7.3 model ..................... 33
29 Temperature profiles in Prius motor slot and wedge insulation for the 50°C cooling case in the vicinity of winding thermocouple W1 as predicted by HEATING 7.3 model ........... 33
30 Temperature profiles in Prius motor stator copper windings for the 50°C cooling case in the vicinity of winding thermocouple W1 as predicted by HEATING 7.3 model ........... 34
30 Close-up of emperature profiles in Prius motor stator copper windings for the 50°C cooling case in the vicinity of winding thermocouple W1 as predicted by HEATING 7.3 model ........................................................................................................... 34 32 Temperature profiles in Prius motor rotor iron core and hub for the 50°C cooling case in the vicinity of winding thermocouple W1 as predicted by HEATING 7.3 model ... 36 33 Temperature profiles in Prius motor PMs for the 50°C cooling case in the vicinity of winding thermocouple W1 as predicted by HEATING 7.3 model....................................... 36 A.1 Motor, generator, and engine of the Prius hybrid THSII system.......................................... 38 B.1 Sensor/resolver of Prius THSII motor .................................................................................. 39 B.2 Waveforms that correspond to a fixed rotor position ........................................................... 39 B.3 Waveforms in the detection coils ......................................................................................... 40 B.4 When one position signal reaches a maximum, the other crosses zero ................................ 40

iv
TABLE OF FIGURES (cont’d)
Figure Page
B.5 Circuit with two comparators and two position signals........................................................ 41 B.6 Hardware assembly of circuit shown in Fig. B.5…………………………………………… 41 B.7 Load angle position at 20-Nm load ...................................................................................... 42 B.8 Load angle position at 120-Nm load .................................................................................... 42

v
TABLE OF TABLES
Table Page
1 Power and torque of the PM synchronous motor of Prius hybrid THSII system ................. 3 2 Mechanical loss data............................................................................................................. 11 3 No-load test data ................................................................................................................... 12 4 Voltage vs. torque with coolant inlet temperature of 35°C .................................................. 14 5 Voltage vs. torque with coolant inlet temperature of 50°C .................................................. 146 Voltage vs. torque with coolant inlet temperature of 75°C .................................................. 15 7 Power capability at 900 rpm with stable parameters ............................................................ 15 8 Continuous power ratings ..................................................................................................... 16 9 Power capability at 900 rpm including thermal data ............................................................ 16
10 Loss data summary ............................................................................................................... 16 11 Dissipated motor power to motor heat exchanger ................................................................ 21 12 Motor heat exchanger effective ratio .................................................................................... 21 13 Peak power tests ................................................................................................................... 21 14 Efficiencies and power factors near peak-torque region ...................................................... 23 15 Thermal conductivity values used for various components.................................................. 30 16 Values input to the model for the various winding thermocouples and coolant temperatures............................................................................................................. 31
17 Comparison of measured and predicted winding temperatures for four coolant temperatures............................................................................................................. 32 18 Comparison of measured and predicted winding temperatures for four coolant temperatures – entire winding temperature range presented ................................................ 35
1
INTRODUCTION In the current hybrid vehicle market, the Toyota Prius drive system is considered the leader in
electrical, mechanical, and manufacturing innovations. It is a significant accomplishment that Toyota is able to manufacture and sell the vehicle for a profit.
The Toyota Prius traction motor design approach for reducing manufacturing costs and the motor’s
torque capability have been studied and tested. The findings were presented in two previous Oak Ridge National Laboratory (ORNL) reports. The conclusions from this report reveal, through temperature rise tests, that the 2004 Toyota Prius (THSII) motor is applicable only for use in a hybrid automobile. It would be significantly undersized if used in a fuel cell vehicle application.
The power rating of the Prius motor is limited by the permissible temperature rise of the motor
winding (170°C) and the motor cooling oil (158°C). The continuous ratings at base speed (1200 rpm) with different coolant temperatures are projected from test data at 900 rpm. They are approximately 15 kW with 105°C coolant and 21 kW with 35°C coolant. These continuous ratings are much lower than the 30 kW specified as a technical motor target of the U.S. Department of Energy FreedomCAR Program. All tests were conducted at about 24°C ambient temperature. The load angle of each torque adjustment was monitored to prevent a sudden stop of the motor if the peak torque were exceeded, as indicated by the load angle in the region greater than 90 electrical degrees. For peak power with 400 Nm torque at 1200 rpm, the permissible running time depends upon the initial winding temperature condition. The projected rate of winding temperature rise is approximately 2.1°C/sec. The cooling-oil temperature does not change much during short peak power operation.
For light and medium load situations, the efficiency varies from 80% to above 90%, and the power
factor varies from 70% to above 90%, depending on the load and speed. When the motor is loaded heavily near the peak-torque (400-Nm) region, the efficiency goes down to the 40–50% range, and the power factor is nearly 100%. The efficiency is not a major concern at the high-torque region.
The water-ethylene-glycol heat exchanger attached to the motor is small. During continuous
operation, it dissipates about 76% of the total motor heat loss with 35°C coolant. The heat exchanger is less effective when the coolant temperature increases. With 75°C coolant, the heat exchanger dissipates about 38% of the motor heat. When the coolant temperature is 105°C, the heat exchanger not only stops cooling the motor but also adds heat to the large motor housing that acts as an air-cooled heat sink.
From start to the base speed, 400 Nms of torque can be produced by the Prius motor with a
reasonably low stator current. However, the permissible running time of the motor depends on the load drawn from the motor and the coolant temperature. In the Toyota Prius hybrid configuration, if the motor gets too hot and cannot keep running, the load can be shifted back to the engine. The motor acts to improve the system efficiency without being overly designed.
A detailed thermal model was developed to help predict the temperature levels in key motor
components. The model was calibrated and compared with the experimentally measured temperatures. Very good agreement was obtained between model and experiment. This model can now be used to predict the temperature of key motor components at a variety of operating conditions and to evaluate the thermal characteristics of new motor designs.
It should be pointed out that a fuel-cell motor does not have an engine to fall back on to provide the
needed wheel power. Therefore, the design philosophy of a fuel-cell motor is very different from that of a hybrid Prius motor.

2
Further thermal management studies in the high-speed region of the Prius motor, fed by its inverter, are planned.

3
1. REASON FOR CONDUCTING TEMPERATURE TESTS
Figure 1 shows the published output power and torque versus speed curves of the THSII model of
Prius motors. Its output power and torque values up to the base speed are tabulated in Table 1.
Table 1. Power and torque of the permanent magnet (PM) synchronous motor of Prius hybrid THSII system
Model (2004)
Power: 50 kW at base speed of 1200 rpm
Torque: 400 Nm up to base speed of 1200 rpm
The authors did not find the permissible running time versus rating of the Toyota Prius motor in
Toyota’s publications. Therefore, it was necessary to conduct a temperature-rise test to determine the continuous rating and the permissible time for the peak rating of the Prius motor.
Fig. 1. Output power and torque vs. speed of THSII motors.
Source: M. Okamura, E. Sato, S. Sasaki, “Development of Hybrid Electric Dive system Using a Boost Converter,” Toyota Motor Corporation, 1, Toyota-cho, Toyota, Aichi, 471-8572.

4
2. PERMISSIBLE TEMPERATURE LIMITS OF WINDING AND COOLING OIL The permissible temperature rise of the motor winding, 170°C, and of the motor cooling oil (or transaxle fluid), 158°C, of the Toyota Prius motor during tests was determined from the trip conditions of the motor, 174°C, and the transaxle fluid, 162°C, given on P. 426 of the Toyota Repair Manual, Vol. 1, 2004, No. RM1075U1. The 4° difference between the permissible temperature and the trip temperature was arbitrarily selected for safe operation during the tests without causing a trip.

5
3. THERMOCOUPLE LOCATIONS
Figure 2 shows thermocouple locations for the test. The thermocouples at the motor end turns are marked by W1, W2, and W3. The outer frame thermocouple locations are indicated by Case 1 Ext, Case 2 Ext, Case 3 Ext, Case 6 Ext, Case 9 Ext, Case 10 Ext, and Case 11 Ext. The numbers in the location labels roughly indicate the locations as viewed from the end of motor, similar to the hour locations on a clock. The thermocouples for the oil, and the water-ethylene glycol inlet and outlet, are also installed.
Fig. 2. Thermocouple locations viewed from the end of the Toyota Prius motor.

6
4. TEST SETUP
The setup of the test is designed to use 60-Hz utility power to energize the motor without using an inverter. This will give a good sinusoidal waveform for the motor power supply without taking the inverter influence into account for the motor performance. The temperature rise result obtained from a sinusoidal waveform would be on the favorable side. Because the supply frequency of the utility power is fixed at 60 Hz, the 8-pole Prius motor runs at 900 rpm. The rating of the Prius motor at its base speed of 1200 rpm can be prorated without causing much error through the test at 900 rpm. Figure 3 shows the test schematic diagram. The Toyota Prius motor being tested is at the top left side of the diagram. Its shaft is coupled to the dynamometer via a torque gauge. The other end of the dynamometer shaft is coupled to a variable-speed motor that can bring the non-energized Toyota Prius motor to 900 rpm before connecting the motor to the 60-Hz utility power.
Fig. 3. Test schematic diagram.

7
The bottom of the diagram shows that the three-phase power supply would go through a three-phase variac to energize the 480-V side of the three-phase 480-V/120-V transformer. A three-phase synchronizing switch and three light bulbs are used to connect the Prius motor to the utility power. The synchronizing switch is turned on when all three light bulbs are dark. The cooling loop of the motor is connected to the adjustable temperature and adjustable flow rate supply system circulating a water-ethylene-glycol solution.
Figure 4 shows the shaft coupling of the test that involves an adjustable-speed motor, a dynamometer, a torque gauge, and the Prius motor that is being tested.
Fig. 4. Shaft coupling of test setup.
The side view of the shaft coupling is shown in Fig. 5.
Adjustable-speed motor
Dynamometer
Torque gauge
Toyota Prius motor

8
Fig. 5. Side view of shaft coupling.
Figure 6 shows the adjustable temperature and adjustable flow rate water-ethylene glycol supply used
for the temperature rise tests. Thermocouples are inserted into the inlet and outlet liquid of the heat exchanger attached to the motor.
Fig. 6. Adjustable temperature and adjustable flow rate water-ethylene-glycol supply.
Adjustable temperature and adjustable flow rate water-ethylene-glycol supply
Hoses
Dynamometer Torque gauge Heat exchanger Prius motor
Water/glycol Water/glycol inlet outlet

9
5. POWER SUPPLY FOR CONDUCTING MOTOR TORQUE CAPABILITY TEST AT 900 RPM
In order to study the motor temperature rise and related motor thermal management issues, a 60-Hz power supply is used that provides a sinusoidal waveform to separate the inverter influence to the motor. Figure 7 shows a three-phase variac, a tjree-phase 480-V/120-V transformer, a set of synchronizing lamps, and a synchronizing switch used to connect the Prius motor to the 60-Hz power system.
Fig. 7. The 60-Hz power supply for conducting the motor temperature rise test.
Figure 8 shows the control room setup. A safety window separates the test room and the control room. The data monitor is connected to the data acquisition system for reading current, voltage, temperature, pressure, flow rate, torque, and time. The wattmeter for the motor input power measurement, the torque controller for adjusting the load torque of the motor, the load angle monitor that indicates the electrical angle between terminal voltage and back-emf, and the voltage control of the variac are all located in the control room.
Three-phase variac
Three-phase 480V/120V transformer
Three-phase synchronizing lamps
Three-phase synchronizing switch

10
Fig. 8. Control room set up.
Wattmeter
Load angle monitor
Data monitor
Test room safety window
Torque controller

11
6. TESTING OF PRIUS AT 900 RPM 6.1 MECHANICAL LOSS TESTING
The THSII motor was driven by an auxiliary motor at 900 rpm at no-load conditions (i.e., spin test) and mechanical loss data were recorded. The mechanical loss data were measured at four coolant inlet temperatures, 35, 50, 75, and 105ºC. Table 2 summarizes the mechanical loss data.
Table 2. Mechanical loss data
Inlet coolant temperature
(°C)
Motor speed (rpm)
Motor speed
(rad/sec)
Torque (Nm)
Mechanical loss (W)
35 900 94.25 1.7 160.2 50 900 94.25 1.7 160.2 75 900 94.25 1.7 160.2 105 900 94.25 1.6 150.8
The Prius was tested at 900 rpm at no-load conditions with inlet coolant temperature of 35ºC with the
input voltage (VLL) set from 80 to 210 V. Machine variables were allowed to stabilize during the test. The no-load test data are summarized in Table 3. Figures 9 and 10 illustrate the current vs. voltage and input power vs. voltage, respectively, at no-load conditions.
The no-load mechanical and electrical losses are used to set the loss locations for the validation of the analytical motor temperature prediction.
Tests were performed to determine the optimum voltage to supply to the test motor at a given torque (i.e., load) starting at no-load conditions. The torque was increased in steps of 10 Nm and the input voltage was varied in steps of 5 V. The optimal voltage was determined based on highest efficiency. Testing was performed at each of the four inlet coolant conditions. A winding temperature limit of 170ºC and lubrication oil temperature limit of 158ºC were observed during the tests. Tables 4, 5, and 6 summarize the machine performance at 35, 50, and 75ºC.

12
Table 3. No-load test data
Supply Mechanical Electrical Winding Oil voltage Torque Speed Speed power power Current temp. temp. (VLL) (Nm) (rpm) (rad/s) (W) (W) (A) (°C) (°C)
80 0 900 94.2 0 210 1.9 33.7 33.1 85 0 900 94.2 0 220 3.8 33.7 33.2 90 0 900 94.2 0 230 7.7 33.7 33.2 95 0 900 94.2 0 240 11 33.8 33.3 100 0 900 94.2 0 270 14.6 34 33.4 105 0 900 94.2 0 280 18.3 34.4 33.5 110 0 900 94.2 0 320 21.7 34.9 33.7 115 0 900 94.2 0 360 24.9 35.4 33.9 120 0 900 94.2 0 400 27.5 36.1 34.1 125 0 900 94.2 0 440 30.1 37 34.5 130 0 900 94.2 0 480 31.4 37.9 34.9 135 0 900 94.2 0 500 34.3 39.1 35.2 140 0 900 94.2 0 530 37 40.5 35.7 145 0 900 94.2 0 580 39 41.7 36.1 150 0 900 94.2 0 640 41.6 43.2 36.7 155 0 900 94.2 0 700 44.8 44.7 37.2 160 0 900 94.2 0 780 48.7 46.3 37.8 165 0 900 94.2 0 870 52.5 48.3 38.5 170 0 900 94.2 0 930 54.5 50.5 39.5 175 0 900 94.2 0 1,170 63.3 54.5 40.7 180 0 900 94.2 0 1,310 67.3 59.1 42.3 185 0 900 94.2 0 1,670 77.5 65.1 44.6 190 0 900 94.2 0 1,900 82.4 79.5 50 195 0 900 94.2 0 2,250 89.8 85.7 53.1 200 0 900 94.2 0 2,960 103.8 100.7 59.4 205 0 900 94.2 0 4,040 119.6 119.5 65.8 210 0 900 94.2 0 5,370 135.2 142.8 72.1

13
0
20
40
60
80
100
120
140
160
0 50 100 150 200 250
Voltage (VLL)
Cur
rent
(A)
900 rpm with 35C coolant at no loadconditons
Fig. 9. Current vs. voltage at 900 rpm at no-load conditions.
0
1,000
2,000
3,000
4,000
5,000
6,000
0 50 100 150 200 250
Voltage (VLL)
Inpu
t pow
er (w
atts
) 900 rpm with 35C coolant at no loadconditions
Fig. 10. Input power vs. voltage at 900 rpm at no-load conditions.

14
Table 4. Voltage vs. torque with coolant inlet temperature of 35ºC
Supply Mech. Elect. Winding Oil voltage Torque Speed Speed power power Effic. Current Power temp. temp. (VLL) (Nm) (rpm) (rad/s) (W) (W) (A) factor (°C) (°C)
85 0 900 94.25 0 130 3.5 29.6 27.8 85 10 900 94.25 942 1,030 0.92 7.3 0.96 35.3 34.1 90 20 900 94.25 1,885 2,030 0.93 13.3 0.98 37 35.1 100 30 900 94.25 2,827 3,000 0.94 18.8 0.92 39.5 36.9 105 40 900 94.25 3,770 4,020 0.94 23.9 0.93 41.7 38 115 50 900 94.25 4,712 5,030 0.94 28.5 0.89 45.9 41.6 120 60 900 94.25 5,655 6,070 0.93 33 0.89 48.7 43.1 130 70 900 94.25 6,597 7,070 0.93 37.3 0.84 56.2 49.7 130 80 900 94.25 7,540 8,090 0.93 41.6 0.86 61.2 52.5 135 90 900 94.25 8,482 9,130 0.93 45.7 0.86 68.0 58 140 100 900 94.25 9,425 10,190 0.92 50.1 0.84 73.9 60.8 150 110 900 94.25 10,367 11,260 0.92 54.5 0.80 83.2 68.2 150 120 900 94.25 11,310 12,310 0.92 58.7 0.81 92.7 75.1 150 130 900 94.25 12,252 13,440 0.91 63.2 0.82 101.8 80.4 155 140 900 94.25 13,195 14,560 0.91 67.6 0.80 109.7 84.4 160 150 900 94.25 14,137 15,710 0.90 72.3 0.79 120.8 91.2 165 160 900 94.25 15,080 16,910 0.89 77.1 0.77 136.8 101.2 165 170 900 94.25 16,022 18,180 0.88 82.4 0.77 159.2 115.5
Table 5. Voltage vs. torque with coolant inlet temperature of 50ºC
Supply Mech. Elect. Winding Oil voltage Torque Speed Speed power power Effic. Current Power temp. temp. (VLL) (Nm) (rpm) (rad/s) (W) (W) (A) factor (°C) (°C)
80 0 900 94.25 0 140 1.5 51 50.5 85 10 900 94.25 942 1,090 0.86 7.8 0.95 51.8 51.2 90 20 900 94.25 1,885 2,060 0.92 13.9 0.95 54.2 53 100 30 900 94.25 2,827 3,070 0.92 19.4 0.91 57.2 55.3 105 40 900 94.25 3,770 4,070 0.93 24.3 0.92 60.7 57.7 115 50 900 94.25 4,712 5,070 0.93 29.0 0.88 64.8 60.3 120 60 900 94.25 5,655 6,090 0.93 33.4 0.88 68.6 62.5 130 70 900 94.25 6,597 7,110 0.93 37.5 0.84 71.1 63 130 80 900 94.25 7,540 8,140 0.93 42.3 0.86 79.4 69.8 135 90 900 94.25 8,482 9,190 0.92 46.4 0.85 85.5 73.7 140 100 900 94.25 9,425 10,220 0.92 50.6 0.83 90.2 75.4 140 100 900 94.25 9,425 10,220 0.92 50.6 0.83 90.2 75.4 150 110 900 94.25 10,367 11,310 0.92 55.1 0.79 104 86.3 150 120 900 94.25 11,310 12,400 0.91 59.3 0.81 111.7 90.4 150 130 900 94.25 12,252 13,500 0.91 63.8 0.82 119.9 94.5 155 140 900 94.25 13,195 14,720 0.90 68.1 0.81 135 103.6 160 150 900 94.25 14,137 15,800 0.89 72.9 0.78 144.1 107.7 165 160 900 94.25 15,080 17,040 0.88 78.0 0.77 160.7 120.3

15
Table 6. Voltage vs. torque with coolant inlet temperature of 75ºC
Supply Mech. Elect. Winding Oil voltage Torque Speed Speed power power Effic. Current Power temp. temp. (VLL) (Nm) (rpm) (rad/s) (W) (W) (A) factor (°C) (°C)
85 0 900 94.25 0 130 1.2 59.8 57.3 85 10 900 94.25 942 1,060 0.89 7.9 0.91 66 63.2 90 20 900 94.25 1,885 2,050 0.92 14 0.94 68.5 65.3 100 30 900 94.25 2,827 3,040 0.93 19.4 0.91 71.8 67.7 105 40 900 94.25 3,770 4,040 0.93 24.5 0.91 76 70.8 115 50 900 94.25 4,712 5,050 0.93 29 0.88 79.9 73.3 120 60 900 94.25 5,655 6,060 0.93 33.6 0.87 84.7 76.4 130 70 900 94.25 6,597 7,090 0.93 37.9 0.83 89.6 79.3 130 80 900 94.25 7,540 8,130 0.93 42.5 0.85 96.3 84.1 135 90 900 94.25 8,482 9,180 0.92 46.5 0.85 103.60 89 140 100 900 94.25 9,425 10,230 0.92 50.8 0.83 110.6 93.4 150 110 900 94.25 10,367 11,330 0.92 55.5 0.79 118.8 97.8 150 120 900 94.25 11,310 12,430 0.91 60 0.80 131.9 106.6 150 130 900 94.25 12,252 13,560 0.90 64.5 0.81 140.7 111.6 155 140 900 94.25 13,195 14,770 0.89 69.1 0.80 145.9 114.1
Tests were performed to determine the continuous capability of the motor at the four coolant inlet
temperatures with the thermal parameters of the machine allowed to stabilize at below than the winding and lubrication oil temperature limits. Tables 7 and 8 summarize the machine parameters. The coolant inlet is on the generator side of the unit, and the outlet is on the traction motor side of the unit. A hose (interim) connects the coolant flow from the generator to the traction motor. Calculations were performed for mechanical, I2R, and core losses for the four coolant temperatures (see Table 9).
Table 7. Power capability at 900 rpm with stable parameters
Supply Mech. Elect. Winding Oil Inlet Test voltage Torque Speed Speed power power Effic. Current Power temp. temp. cool. duration (VLL) (Nm) (rpm) (rad/s) (W) (W) (Arms) factor (°C) (°C) (°C) (min)
160 167.3 900 94.2 15,768 17970 0.88 81.6 0.80 166 114.3 34.6 99.1 165 159.6 900 94.2 15,042 17090 0.88 78 0.77 167.2 118.5 49.5 48.2 160 145.7 900 94.2 13,732 15510 0.89 72 0.78 168.5 118.5 73.9 66.8 150 117.8 900 94.2 11,102 12380 0.90 60.5 0.79 166.3 130.3 103.4 80.3

16
Table 8. Continuous power ratings
Power Power Coolant Load rating rating
temperature torque at 900 rpm at 1200 rpm (°C) (Nm) (kW) (kW) 35 167.3 16 21 50 159.6 15 20 74 145.7 14 18 103 117.8 11 15
Table 9. Power capability at 900 rpm including thermal data
Coolant Supply Test Temp voltage Torque Inlet Interim. Outlet Flow Initial Final Initial Final Duration (°C) (VLL) (Nm) (°C) (°C) (°C) (gpm) (°C) (°C) (°C) (°C) (min) 35 160 167.3 34.6 36.0 37.6 2.4 90.1 166 67.8 114.3 88.6 50 165 159.6 49.5 50.3 51.8 2.4 163.1 167.2 114.2 118.5 48.2 75 160 145.7 73.9 74.1 75.1 2.4 159.1 168.4 118.3 125.3 66.8 105 150 117.8 103.5 102.6 102.9 2.4 149 166.3 117.3 130.3 80.3
The continuous power ratings of the Prius motor at 900 rpm with different coolant temperatures can
be calculated from the torque and speed data shown in Table 7. The result is shown below in Table 8. The corresponding power ratings at 1200 rpm are projected from the 900 rpm ratings with a speed ratio multiplier (i.e., 1200/900 = 1.333). Table 10 shows the power capability at 900 rpm including thermal data at different coolant temperatures. Table 10 presents the loss data summary with different cooling temperatures.
Table 10. Loss data summary
Coolant Supply Mech. Elect. Total Mech. I2R Core Current Power temp volt Torque power power loss loss loss loss Effic. load factor (°C) (VLL) (Nm) (W) (W) (W) (W) (W) (W) (Arms) 35 160 167.3 15,768 17,970 2,202 160 1,019 1,023 0.88 81.6 0.80 50 165 159.6 15,042 17,090 2,048 160 935 952 0.88 78 0.77 75 160 145.7 13,732 15,510 1,778 160 801 817 0.89 72 0.78 105 150 117.8 11,102 12,380 1,278 151 560 567 0.90 60.5 0.79
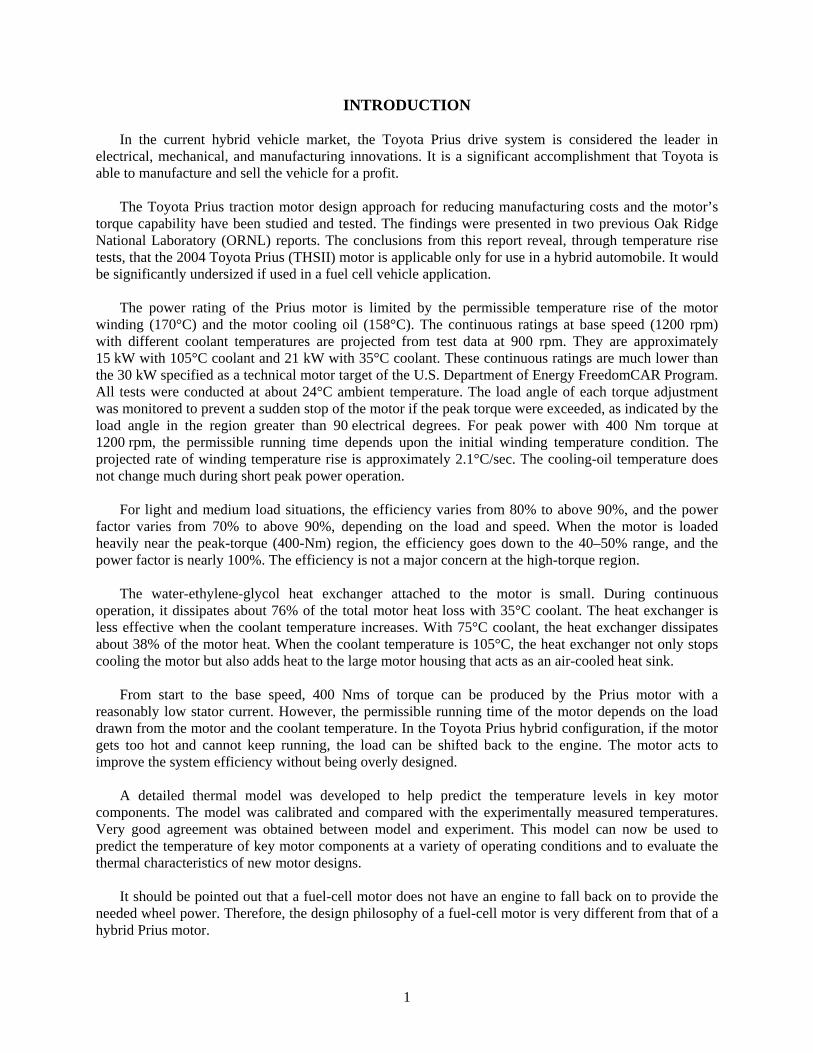
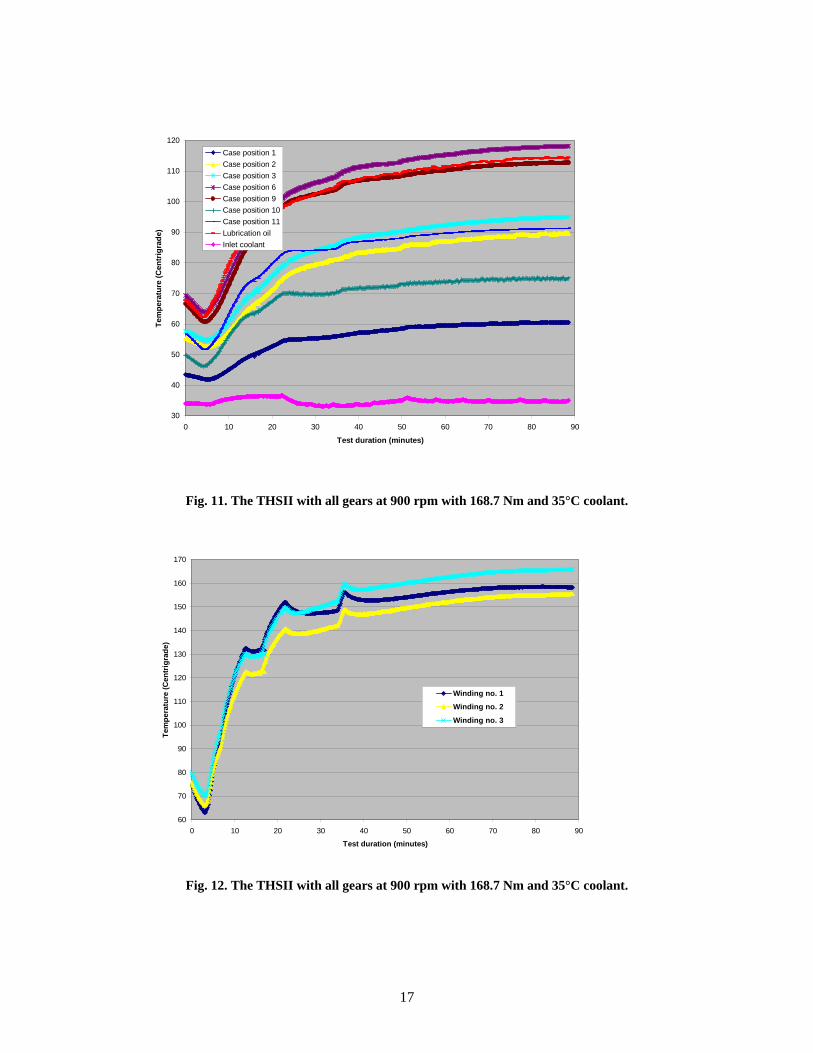
Figures 11 through 18 show the motor winding temperature versus time curves with 35, 50, 75, and 105°C coolant, respectively. To determine the continuous rating of the motor, the winding temperature must be closely leveled off to the winding temperature limit (170°C), and the cooling oil temperature must remain below 158°C.
17
30
40
50
60
70
80
90
100
110
120
0 10 20 30 40 50 60 70 80 90
Test duration (minutes)
Tem
pera
ture
(Cen
trig
rade
)Case position 1Case position 2Case position 3Case position 6Case position 9Case position 10Case position 11Lubrication oilInlet coolant
Fig. 11. The THSII with all gears at 900 rpm with 168.7 Nm and 35°C coolant.
60
70
80
90
100
110
120
130
140
150
160
170
0 10 20 30 40 50 60 70 80 90
Test duration (minutes)
Tem
pera
ture
(Cen
trig
rade
)
Winding no. 1
Winding no. 2
Winding no. 3
Fig. 12. The THSII with all gears at 900 rpm with 168.7 Nm and 35°C coolant.

18
40
50
60
70
80
90
100
110
120
130
0 5 10 15 20 25 30 35 40 45 50
Test duration (minutes)
Tem
pera
ture
(Cen
tigra
de)
Case position 1Case position 2Case position 3Case position 6Case position 9Case position 10Case position 11Lubrication oilinlet coolantOutlet coolant
Fig. 13. The THSII with all gears at 900 rpm with 159.6 Nm and 50°C coolant.
150
155
160
165
170
0 5 10 15 20 25 30 35 40 45 50
Test duration (minutes)
Tem
pera
ture
(Cen
tigra
de)
Winding no. 1Winding no. 2Winding no. 3
Fig. 14. The THSII with all gears at 900 rpm with 159.6 Nm and 50°C coolant.
19
50
60
70
80
90
100
110
120
130
0 10 20 30 40 50 60 70
Test duration (minutes)
Tem
pera
ture
(Cen
tigra
de)
Case position 1Case position 2Case position 3Case position 6Case position 9case position 10Case position 11Lubrication oilInlet coolantOutlet coolant
Fig. 15. The THSII with all gears at 900 rpm with 145.7 Nm and 75°C coolant.
156
157
158
159
160
161
162
163
164
165
166
167
168
169
170
0 10 20 30 40 50 60 70
Test duration (minutes)
Tem
pera
ture
(Cen
trig
rade
)
Winding no. 1Winding no. 2Winding no. 3
Fig. 16. The THSII with all gears at 900 rpm with 145.7 Nm and 75°C coolant.

20
90
95
100
105
110
115
120
125
130
135
0 10 20 30 40 50 60 70 80 90
Test duration (minutes)
Tem
pera
ture
(Cen
tigra
de)
Case position 1Case position 2Case position 3Case position 6Case position 9Case position 10Case position 11Lubrication oilInlet coolantOutlet coolant
Fig. 17. The THSII with all gears at 900 rpm with 117.8 Nm and 105°C coolant.
140
145
150
155
160
165
170
0 10 20 30 40 50 60 70 80
Test duration (minutes)
Tem
pera
ture
(Cen
tigra
de)
Winding no. 1Winding no. 2winding no. 3
Fig. 18. The THSII with all gears at 900 rpm with 117.8 Nm and 105°C coolant. The dissipated motor power to the motor heat exchanger is shown in Table 11 with various coolant temperatures.

21
Table 11. Dissipated motor power to motor heat exchanger
Coolant Outlet Inlet Delta GPM GPS Liter Spec Spec kW lb/kg Exchanger
(°C) (°F) (°F) (°F) /s heat gravity /BTU (kW) 35 99.68 94.28 5.4 2.4 0.04 0.1514 0.832 1.064 1.054 2.2 1.678 50 125.24 121.1 4.14 2.4 0.04 0.1514 0.832 1.064 1.054 2.2 1.287 75 167.18 165.02 2.16 2.4 0.04 0.1514 0.85 1.05 1.054 2.2 0.677 105 217.22 218.3 -1.08 2.4 0.04 0.1514 0.85 1.05 1.054 2.2 -0.338
Table 12 shows the motor heat exchanger effective ratio that is defined by the ratio of dissipated motor power to heat exchanger and the total motor loss. When the coolant temperature is low, at 35°C, the ratio is 0.763. This ratio decreases when the coolant temperature increases. At 105°C, the heat exchanger not only stops cooling the motor but also it transfers heat to the motor housing that acts as a heat sink.
Table 12. Motor heat exchanger effective ratio
Total Exchanger
Coolant motor loss Exchanger effective (°C) (kW) (kW) ratio 35 2.200 1.678 0.763 50 2.050 1.287 0.628 75 1.780 0.677 0.380
105 1.280 -0.338 -0.264 Table 13 shows the peak power rating test data. The corresponding winding temperatures versus time for different torques and mechanical powers are plotted in Fig. 19.
Table 13. Peak power tests
Mechanical Test
Current Voltage Torque power duration (Arms) (VLL) (Nm) (W) (S)
136 205 265 24,976 91 149 205 300 28,275 40 161 205 320 30,160 62 176 205 335 31,574 30 187 205 344 32,422 30 176 210 338 31,857 40

22
0
10
20
30
40
50
60
70
80
90
100
110
120
130
140
150
160
170
180
0 10 20 30 40 50 60 70 80 90 100
Test duration (Seconds)
Win
ding
tem
pera
ture
(Cen
tigra
de)
265 Nm at 136 A
300 Nm at 149 A
320 Nm at 161 A
335 Nm at 176 A
344 Nm at 187 A
Fig. 19. Peak power tests at 900 rpm at 205 VLL.
Figure 20 plots the motor load torque versus the rate of temperature rise of the motor winding in a log scale. The projected rate at 400 Nm is 2.1°C/s. If the motor is cool, at 40°C, it takes 62 s ((170−40)/2.1) to reach the winding temperature limit. If the motor winding is hot, at 160°C, it allows only 4.8 s (170−160)/2.1 for the peak torque operation.
The efficiencies and power factors near the peak torque region are shown in Table 14. The efficiency can be in the 40–50% when the load torque increases. The power factor is nearly equivalent to a resistive load because of high losses.

23
Torque vs. rate of change of winding temp (deg C/ sec)
0
0.5
1
1.5
2
2.5
1 10 100 1000
Torque (Nm)
Deg
rees
C p
er s
econ
d
Test dataLinear (Test data)
Fig. 20. Obtaining rate of change of winding temperature for 400 Nm.
Table 14. Efficiencies and power factors near peak-torque region
W1 winding Torque Current Mech Elect
temp. (Nm) (A) Voltage power power Effic. PF (°C) 127.8 265.0 136.0 205.0 24976 48232 0.518 0.999 132.4 300.0 149.0 205.0 28275 52843 0.535 0.999 92.9 320.0 161.0 205.0 30160 57099 0.528 0.999 82.9 335.0 176.0 205.0 31574 62418 0.506 0.999 70.8 344.0 187.0 205.0 32422 66320 0.489 0.999

24
7. THERMAL MODELING RESULTS 7.1 INTRODUCTION
The ability to predict the temperature profile in various motor components is a valuable analytical tool. It enables design engineers to predict temperatures in locations that would be difficult if not impossible to instrument. In addition, various operating scenarios can be investigated and the thermal response determined analytically for a fraction of the cost of running an experiment. Finally, once confidence has been established in a certain thermal model, it can be extended to model new motor designs, help establish thermally efficient configurations, and determine operating points before any hardware is built. In other words, the thermal model can act as a guide to help the design or development engineer choose efficient designs and reasonable operating points that maximize overall efficiency and motor performance without exceeding safe operating temperatures in key motor components. 7.2 MODEL DESCRIPTION 7.2.1 Overall Model of Motor
To aid the design or development engineer, a detailed three-dimensional model of the Prius electric motor has been developed. This model includes all key portions of the motor that affect its heat transfer performance. The goal of this model is to develop a tool to which the appropriate boundary conditions can be applied and which will then predict the temperature levels in all the hardware components–especially, the copper winding temperature in the stator.
A schematic of the Prius motor stator and rotor is shown in Fig. 21. Because of azimuthal symmetry, only 1/8 of the motor was modeled as shown in the figure. In addition, axial symmetry was assumed; therefore, only half of the axial length of the motor was included in the model. Thus, because of symmetry considerations, only 1/16 of the motor was required for an accurate model. This simplification resulted in a smaller, more robust model that could quickly predict component temperatures.

25
0.300"
0.349"
ø0.360"
0.080"
0.230"
ø4.356" 4.15
2"
ø6.314"
0.060" 0.056"
ø10.600"
0.474"
0.09
4"
R0.109"
2004 Prius Stator Lamination
6.375"
R0.234"
30.000°
30.000°
1.32
0"
0.076"
ø0.222"
0.124"0.040"
Fig. 21. Schematic of Prius motor stator and rotor. 7.2.2 Thermal Model of Motor
The thermal model used was HEATING 7.3, a general-purpose, finite-difference conduction heat transfer model developed at ORNL. This code has its own mesh generating capability and is capable of modeling a wide variety of complex geometries and boundary conditions. The output from the code can be viewed in two ways–either as a node-by-node temperature printout or as a plot of the temperature profiles of the various components. This latter option utilizes the commercially available tool TECPLOT. This powerful plotting capability enables the user to view the temperature profiles of the surface of each component or to ‘slice’ the part at any plane to view the temperature of internal nodes. A wide variety of temperature, heat flux, convective, or radiative boundary conditions can be applied to the HEATING 7.3 thermal model to simulate the scenarios of interest. In addition, output information can be obtained for the heat generation values of any volume in the model and the heat flow rate at any boundary. This code is also capable of performing transient analyses, although this capability was not utilized in the present study. 7.2.3 Model Components
In order for the model to accurately represent the Prius motor, all key components must be accurately modeled with respect to geometry and material properties. To that end, the following components of the motor were included in the model:
• Stator iron core, including laminations • Slot and wedge insulation in each stator slot • Stator copper windings, including insulation on wires
Portion of motor that is

26
• Rotor iron core • Hub • PMs in rotor • Slinger • Bracket and cooling frame • Contact resistance between slinger and motor • Contact resistance between stator and cooling frame
Illustrations of some of these components are presented. Figure 22 illustrates the 1/16 model of the
motor stator as well as the laminations (1/8 part of the azimuthal and 1/2 of the axial length). Here, 6 of the 48 stator slots can be seen. In Fig. 23, the slot insulation and wedge insulation that electrically separate the copper bundle from the stator core are shown. The copper windings in the stator core are shown in Fig. 24. Each of the nine bundles in each stator slot is modeled separately. For simplification, the bundle is modeled as a rectangular part rather than a round part. The spaces between each of the bundles are modeled as low-conductivity regions to account for the insulation coating on the wires and the oil/air mixture.
The rotor iron core, including laminations and hub, is shown in Fig. 25. Note that the shape and orientation of the slot for the PMs are slightly different from those in the actual motor as, shown in Fig. 21. This resulted in a significant simplification of the model and is believed to have had minimal effect on the thermal results. The effect of the slinger on the thermal results is also included in this model. As shown in Fig. 26, the slinger is modeled simply as a thin cylindrical piece of aluminum with a thermal contact resistance between it and the rotor. The effect of the oil that is splashed on the copper windings is modeled as a boundary condition and will be discussed later.
X
Y
Z
Frame 001 ⏐ 21 Jan 2005 ⏐ PriusM20A - Prius Motor - 12/20/04Frame 001 ⏐ 21 Jan 2005 ⏐ PriusM20A - Prius Motor - 12/20/04
Fig. 22. Schematic of Prius motor stator iron in HEATING 7.3 model.

27
X
Y
Z
Frame 001 ⏐ 21 Jan 2005 ⏐ PriusM20A - Prius Motor - 12/20/04Frame 001 ⏐ 21 Jan 2005 ⏐ PriusM20A - Prius Motor - 12/20/04
Fig. 23. Schematic of slot insulation and wedge insulation in stator iron core slots in HEATING 7.3 model.
X
Y
Z
Nine Bundles of Copper Wire
Frame 001 ⏐ 21 Jan 2005 ⏐ PriusM20A - Prius Motor - 12/20/04Frame 001 ⏐ 21 Jan 2005 ⏐ PriusM20A - Prius Motor - 12/20/04
Fig. 24. Schematic of copper bundles in stator iron core slots in HEATING 7.3 model.

28
X
Y
Z
HubSlot for Permanent Magnets
Frame 001 ⏐ 21 Jan 2005 ⏐ PriusM20A - Prius Motor - 12/20/04Frame 001 ⏐ 21 Jan 2005 ⏐ PriusM20A - Prius Motor - 12/20/04
Fig. 25. Schematic of rotor iron core and hub as modeled in HEATING 7.3 model.
X
Y
Z
Hub
Rotor
Slinger
Frame 001 ⏐ 21 Jan 2005 ⏐ PriusM20A - Prius Motor - 12/20/04Frame 001 ⏐ 21 Jan 2005 ⏐ PriusM20A - Prius Motor - 12/20/04
Fig. 26. Schematic of slinger (in red) superimposed on rotor iron core and hub (in blue) in HEATING 7.3 model.
The final key component of this thermal model is the bracket and cooling frame, shown in Fig. 27.
The bracket and cooling frame are modeled as separate pieces, since different boundary conditions are applied to each part.

29
X
Y
Z
Cooling Frame
Bracket
Frame 001 ⏐03 Feb 2005 ⏐PriusM20A- PriusMotor - 12/20/04Frame 001 ⏐03 Feb 2005 ⏐PriusM20A- PriusMotor - 12/20/04
Fig. 27. Schematic of bracket and cooling frame in HEATING 7.3 model. 7.2.4 Physical Properties
For steady-state heat transfer calculations, only the thermal conductivity values for the various materials are used. The values used here for the various materials were determined from reference materials or, in the case of contact resistances, based on reasonable estimates. For example, since both the rotor and stator are made of laminations, the thermal conductivity of iron was used for the radial direction. In the axial direction, the laminations result in contact resistances that significantly decrease the effective axial conduction. In this case, based on the thermal conductivity of the cooling oil used and an estimate of the contact fraction between adjacent laminations, a value of 1/10 of the iron conductivity was assumed for the axial direction. In addition, this motor configuration resulted in an oil film forming in the stator-rotor gap. This film approximates Couette flow and would result in good heat transfer between the rotor and stator surfaces across the gap. In this model, this gap was approximated by a high-conductivity solid. The thermal conductivity values used are given in Table 15. The present model consisted of 59,994 nodes.

30
Table 15. Thermal conductivity values used for various components
Component Thermal conductivity (W/m−°C) Stator and rotor iron core – radial 51.9 Stator and rotor iron core - axial 5.21 Stator slot insulation and wedge 0.125 Copper windings 400.0 PM motor 47.3 Oil/air/insulation mixture in stator 0.408 – 2.71 Oil/air convective mixture in stator/rotor gap 10.0
Contact resistance – rotor to slinger 0.10 Contact resistance – stator to housing 0.075
7.3 METHODOLOGY
A series of tests was run on the Prius motor to determine the temperature rise of the motor winding at four different inlet temperatures, as described in Section 2. Figure 28 illustrated the thermocouple locations, and the experimental results obtained were presented in Figs. 11–18 for the four coolant temperatures of 35, 50, 75 and 105ºC. The loss data summary was presented in Table 10. To use these results in the thermal modeling studies, the following approach was used: since the main goal of this thermal model was to see how well it helped predict the motor winding temperatures, for each of the tests conducted, the model and corresponding boundary conditions were used to see how well the model predicted the temperatures measured for windings 1–3. Since the motor is physically roughly similar in the azimuthal direction, the casing temperatures closest to each winding thermocouple were used as boundary conditions. In addition, the heat losses generated in the stator and rotor for that specific run were entered in the thermal model.
The main cooling mechanism in the motor is to the casing. Cooling occurs in two ways: via
conduction through the stator to a cooled casing or via convection to the cooling oil and then to the casing. The latter mechanism results when the slinger splashes oil on the portion of the stator cooling wires that protrude from the stator iron core. The temperature of the oil was experimentally measured. What was unknown was the heat transfer coefficient between the oil and the stator cooling wires. Because of the complexity of the geometry and the hydrodynamics of the splashing oil, a detailed analytical calculation of this heat transfer coefficient would be complex, time-consuming, and subject to a high degree of uncertainty. Thus, this heat transfer model was used to experimentally determine this heat transfer coefficient, h. While it may be possible to always get agreement between model and experiment by varying this heat transfer coefficient for each individual test, the proof of the efficacy of this heat transfer model is if the same value of h is found to be applicable for each winding temperature test, for each coolant temperature level, and each motor heat loss value. Since the heat transfer coefficient is strictly a function of the hydrodynamics of the flow and the fluid properties, it should not vary with any other operating parameter. In addition, it should be in rough agreement with values available in the literature from experimental and analytical studies performed for flow over bundles with simpler geometric configurations. Calculations based on a search of the literature indicated that a value of h of between 15 and 40 W/m2−ºC would be reasonable. The reason for this large range in expected values is the high uncertainty associated with the value of the velocity at which the oil impinges on the copper bundles.

31
With this methodology established, the boundary conditions and heat loads from the thermal experimental results were input into the model. For these modeling studies, only the steady state values for temperature were used. No transient behavior was analyzed. The stator copper winding heating was represented by the I2R loss column in Table 10; the stator iron core losses were the values in the core loss column in Table 10. The PM motor losses were small, and a constant value of 40 W was used for all cases. Finally, the rotor iron core losses were estimated to be 1.5 % of the mechanical power and were confined to the outer 1/8 inch of the rotor. The resulting values used for input as boundary conditions to the thermal model are presented in Table 16.
Table 16. Values input to the model for the various winding thermocouples and coolant temperatures
Coolant temp. (ºc)
Stator iron core
losses (w)
Copper windings losses (w)
Rotor iron core losses
(w)
PM motor losses (w)
Casing temp. Bc
(ºc)
Oil temp. (ºc)
Winding thermo-couple
Experimen-tally
measured winding
temp. (ºc) 91 W1 159
75.5 W2 156 35 1023 1019 236.5 40 107
114 W3 166
99.5 W1 162 81.5 W2 158 50 952 935 225.6 40 111
118.5 W3 167
113 W1 168.5 93.5 W2 163 75 817 801 206.0 40 118.3
126 W3 168
126 W1 161.8 106.8 W2 147.7 105 567 560 166.5 40 122.5
130.5 W3 156.1
Thus, the heat loads (losses in Table 16) and the casing and oil temperatures are input into the model.
The heat transfer coefficient, h, is then varied to see at which value the model best predicts the winding temperatures that are presented in the last column of Table 16. 7.4 RESULTS
The model was found to best predict the experimentally measured winding temperature for a heat transfer coefficient, h, of 25 W/m2−ºC. A comparison of the measured and predicted winding temperatures is shown in Table 17. Note that a single value of the heat transfer coefficient, h, was found to give good agreement between model and experiment over a wide range of cooling temperatures and heat load values. This value lies within the range predicted by analytical and experimental results published in the literature.

32
Table 17. Comparison of measured and predicted winding temperatures for four coolant temperatures
Coolant temp. (ºC)
Winding thermocouple
Measured winding temp. (ºC)
Minimum predicted winding temp. (ºC)
W1 159 157.8 W2 156 146.5
35
W3 166 169.5 W1 162 160.8 W2 158 147.6
50
W3 167 169.1 W1 168.5 165.0 W2 163 150.8
75
W3 168 168.8 W1 166.5 161.8 W2 157.5 147.7
105
W3 159.5 156.1 A review of the results in Table 17 indicates that while excellent agreement was obtained between
model and experiment for thermocouples W1 and W3, the experimentally measured temperatures for W2 were consistently higher than the analytically predicted values by about 10 ºC. The reason for this bias is not certain. Quite possibly, the specific locations of the thermocouples, as illustrated in Fig. 28, may have had an effect. W2 seemed to lie on the radially inner part of the stator copper bundle. This region may have been subjected to a different oil flow distribution than the other two locations on the copper winding bundle. In addition, the minimum bundle temperature was given in Table 17, and these thermocouples may have been located at regions that were not at or close to the minimum bundle temperature. This possibility will be discussed in greater detail later. Considering the thermal complexity of the motor components, the assumption of a constant heat transfer coefficient, h, for the entire range of azimuthal, axial, and radial locations probably represents something of an over-simplification. However, the relatively good agreement between experimentally determined temperatures and calculated values indicates that this model may be a valuable tool for determining maximum operating points and evaluating new designs from a thermal point of view.
Let us now take a closer look at the analytical results for one of the cases analyzed. We shall look at
the results for winding thermocouple W1 for the 50ºC case. The temperature profiles for the various key components will be presented. Figure 28 shows the temperature profile for the Prius motor stator for this case. The stator iron core varies in temperature from 157ºC at the innermost part to 133.7ºC at the outer part. This outermost part is closest to the cooled casing and is thus expected to have the lowest temperature. The slot and wedge insulation temperatures are shown in Fig. 29. While the temperature level of this component is usually not of great interest, it does indicate the type of detailed information that

33
0 0
X
Y
Z
T001157155.338153.676152.014150.351148.689147.027145.365143.703142.041140.379138.716137.054135.392133.73
Frame 001 ⏐ 23 Jan 2005 ⏐ PriusM22B - Prius Motor - 12/20/04Frame 001 ⏐ 23 Jan 2005 ⏐ PriusM22B - Prius Motor - 12/20/04
Fig. 28. Temperature profiles in Prius motor stator iron for the 50ºC cooling case in the vicinity of winding thermocouple W1 as predicted by HEATING 7.3 model.
0 0
X
Y
Z
T001163.26161.803160.346158.889157.431155.974154.517153.06151.603150.146148.689147.231145.774144.317142.86
Frame 001 ⏐ 23 Jan 2005 ⏐ PriusM22B - Prius Motor - 12/20/04Frame 001 ⏐ 23 Jan 2005 ⏐ PriusM22B - Prius Motor - 12/20/04
Fig. 29. Temperature profiles in Prius motor slot and wedge insulation for the 50ºC cooling case in the vicinity of winding thermocouples W1 as predicted by HEATING 7.3 model.
The temperature profile range of this component is between 142.9 and 163.3ºC. In addition, the inside
surface of the slot insulation is hotter than the outside surface. This is to be expected, since the insulation has both low electrical and thermal conductivity. The hottest part of the slot insulation is on the surface adjacent to the windings at the innermost radial location.
The component of most interest in these thermal studies is the copper windings in the stator. As
mentioned earlier, it is necessary to restrict the temperature rise of the motor winding to 170ºC. Figure 30 shows that the temperature range that the copper windings experience is 160.8 to 167.6ºC. The windings seem to exhibit both radial and axial variations in temperature. In addition, this temperature varies

34
depending on the specific bundle of interest. To better visualize the temperature profile in the copper windings, let us look in detail at the temperature profile of the windings in one slot. Figure 31 shows a close-up of the copper bundles in one slot.
0 0
X
Y
Z
T001167.59167.106166.621166.137165.653165.169164.684164.2163.716163.231162.747162.263161.779161.294160.81
Axial Center of Motor Region
Axial Center of Motor Region
Frame 001 ⏐ 23 Jan 2005 ⏐ PriusM22B - Prius Motor - 12/20/04Frame 001 ⏐ 23 Jan 2005 ⏐ PriusM22B - Prius Motor - 12/20/04
Fig. 30. Temperature profiles in Prius motor stator copper windings for the 50ºC cooling case in the vicinity of winding thermocouple W1 as predicted by HEATING 7.3 model.
X
Y
Z
T001167.59167.106166.621166.137165.653165.169164.684164.2163.716163.231162.747162.263161.779161.294160.81
Axial Center of Motor Region
Centermost (Hottest) Bundle
Frame 001 ⏐ 23 Jan 2005 ⏐ PriusM22B - Prius Motor - 12/20/04Frame 001 ⏐ 23 Jan 2005 ⏐ PriusM22B - Prius Motor - 12/20/04
Fig. 31. Close-up of temperature profiles in Prius motor stator copper windings for the 50ºC cooling case in the vicinity of winding thermocouple W1 as predicted by HEATING 7.3 model.
Note the complex temperature gradient in the axial direction. The windings are coolest (blue to light
green) in the outermost portion of the winding closest to the center. This may seem surprising, but it should be noted that this is the part of the winding that is closest to the 99.5º C casing and farthest away from the 118.5º C oil. The temperature of greatest interest is the hottest part of the windings. This is represented by the centermost bundle of each nine-bundle group in every slot. This bundle appears almost

35
all red in Fig. 31. It is sufficiently isolated from the cooled casing that its axial temperature profile is different. It is hottest in the axial center of the motor and coolest at the end that is exposed to the cooling oil deposited on the copper windings by the slinger. In all cases, the axial gradients shown here are small, as is to be expected, since copper has a high thermal conductivity. It should be noted that the comparison presented in Table 17 was between the coolest predicted winding temperature and the measured value. As the figures have illustrated, the winding temperature is, in reality, a range. Thus any consideration of an upper temperature limit should address the maximum temperature of the winding bundle. Thus Table 18 expands on the results in Table 17 by presenting the winding temperature range for each of the cases compared. The ranges, in all instances, are small and compare well with the locally measured values. The locations of the thermocouples were such that they represented positions where the winding temperature was greater than the minimum but, in all cases, well below the maximum. This is another indication of how a model such as this can be used to predict component temperatures that would otherwise be experimentally inaccessible.
Table 18. Comparison of measured and predicted winding temperatures for four coolant temperatures – entire winding temperature range presented
Coolant temp.
(ºC) Winding
thermocouple Measured winding temp.
(ºC) Predicted winding temp.
range (ºC) W1 159 157.8 – 165.3 W2 156 146.5 – 154.8
35
W3 166 169.5 – 176.2 W1 162 160.8 – 167.6 W2 158 147.6 – 155.3
50
W3 167 169.1 – 175.4 W1 168.5 165.0 – 170.7 W2 163 150.8 – 157.5
75
W3 168 168.8 – 174.2 W1 166.5 161.8 – 165.7 W2 157.5 147.7 – 152.5
105
W3 159.5 156.1 – 160.3
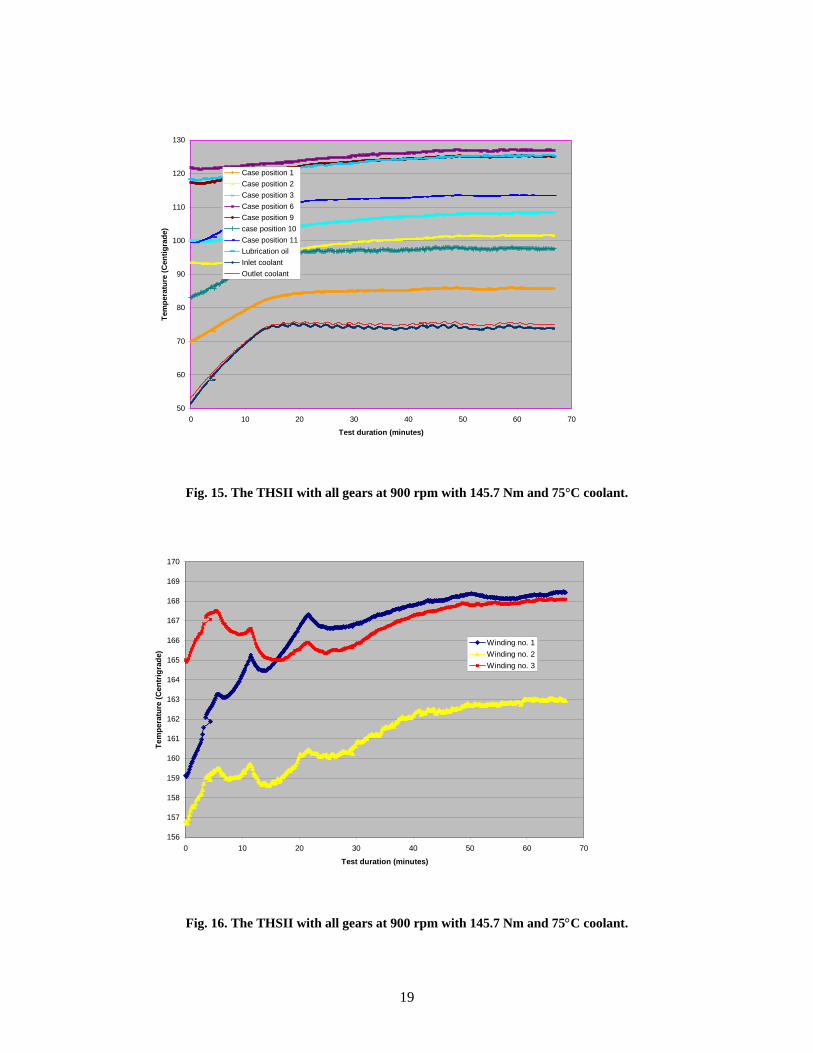
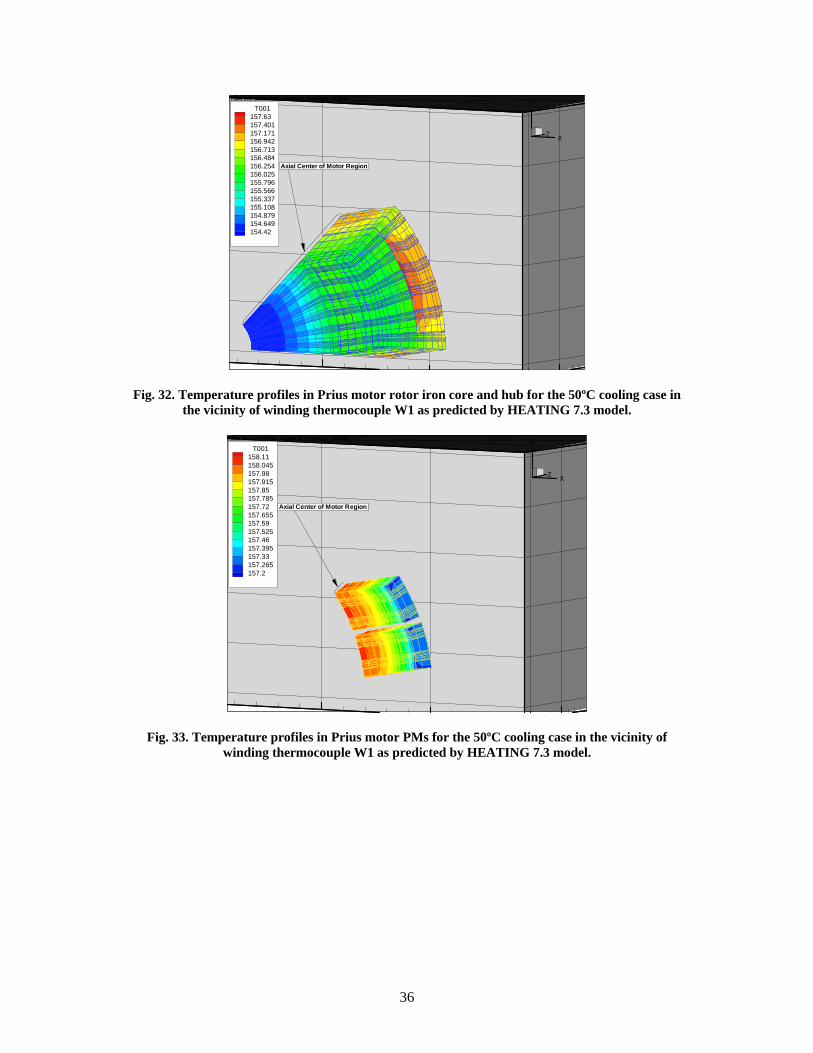
The temperature profile in the rotor iron core and hub is shown in Fig. 32. The overall rotor temperature levels are a bit cooler than the corresponding stator values. A discernable axial gradient exists in the rotor, with the region near the center of the motor being hottest. The hub region is the coolest because it is farthest away from the heat-generating components of the motor (note that the effect of the bearings is not included in this model). The PMs are shown in Fig. 33. They are slightly hotter than the adjacent rotor iron core and exhibit a discernable albeit small axial gradient, with the magnets being hottest near the center of the motor.
36
X
Y
Z
T001157.63157.401157.171156.942156.713156.484156.254156.025155.796155.566155.337155.108154.879154.649154.42
Axial Center of Motor Region
Frame 001 ⏐ 23 Jan 2005 ⏐ PriusM22B - Prius Motor - 12/20/04Frame 001 ⏐ 23 Jan 2005 ⏐ PriusM22B - Prius Motor - 12/20/04
Fig. 32. Temperature profiles in Prius motor rotor iron core and hub for the 50ºC cooling case in the vicinity of winding thermocouple W1 as predicted by HEATING 7.3 model.
X
Y
Z
T001158.11158.045157.98157.915157.85157.785157.72157.655157.59157.525157.46157.395157.33157.265157.2
Axial Center of Motor Region
Frame 001 ⏐ 23 Jan 2005 ⏐ PriusM22B - Prius Motor - 12/20/04Frame 001 ⏐ 23 Jan 2005 ⏐ PriusM22B - Prius Motor - 12/20/04
Fig. 33. Temperature profiles in Prius motor PMs for the 50ºC cooling case in the vicinity of winding thermocouple W1 as predicted by HEATING 7.3 model.

37
8. SUMMARY AND RECOMMENDATIONS A finite difference model of the Prius motor was developed. It included detailed modeling of all key
components. Information on material properties, boundary conditions, and heat generation terms was also included. Good agreement between experiment and model for all operating points was obtained with a convective coefficient, h, between the cooling oil and motor components of 25 W/m2−ºC.
These experimental results, along with the modeling studies presented here, indicate that the
performance of the motor can be improved by more effectively cooling the oil. The experimental results in Table 16 indicate a weak coupling between oil temperature and coolant temperature. More effective cooling of the oil would enable the motor to operate at higher load levels without overheating the windings.
The comparison of experimental temperatures with analytical results has yielded an experimentally
determined value for the convective coefficient, h, between the oil that is splashed on the motor components and the components themselves. Once determined, this value can be used to perform parametric studies and even analyze different motor components, so long as the basic slinger design and the interaction of the oil with the motor components are not radically altered. Thus one end result of this study is that a powerful, calibrated model now exists to perform a wide variety of design studies to improve motor thermal performance and overall operating efficiency.

38
APPENDIX A:
CUT VIEW OF PRIUS HYBRID THSII SYSTEM
Figure A.1 shows the assembly of the Prius hybrid THSII drive train system. The motor shaft is coupled to a set of gears and then to the wheel shafts without a direct motor-torque shaft coming out from the frame.
Fig. A.1. Motor, generator, and engine of the Prius hybrid THSII system. Source: Development of Electric Motors for the TOYOTA Hybrid Vehicle “PRIUS,” Kazuaki Shingo, Kaoru Kubo, Toshiaki Katsu, and Yuji Hata, Toyor Motor Corporation.
Ring Gear Oil Pump
Planetary Gear
Chain
Engine
Final Gear
Sun Gear
Carrier
Damper
Torque Limiter
Counter Gear
To wheel To wheel
Motor Generator

39
APPENDIX B:
LOAD-ANGLE ESTIMATION USING SPEED SENSOR/RESOLVER FOR PRIUS THSII
This sensor precisely detects the position of the rotor and therefore magnetic pole position, which is
essential for efficiently controlling PM synchronous motors. Using the magnetic pole position as feedback, an inverter controller can supply the appropriate voltage needed to drive the motor as desired.
The sensor/resolver system, shown in Fig. B.1, contains one excitation coil, A, and two detection
coils, B and C. The excitation coil induces a 7-kHz sine wave to an oval piece that is fixed to the rotor. Detection coils, B and C, have induced currents at 7 kHz because of the excited oval piece. Figure B.2 shows the waveforms that correspond to a fixed rotor position. Notice that the amplitude of the waveform labeled as CH3 is greater than the amplitude of the other waveform labeled as CH2. This is because part of the oval is closer to the detection coil, which corresponds to the waveform labeled as CH3.
Fig. B.1. Sensor/resolver of Prius THSII motor.
Fig. B.2. Waveforms that correspond to a fixed rotor position. As the rotor turns, the distance of the gap between the detection coils and the oval piece varies. This
produces a modulated 7 kHz waveform in the detection coils, as shown in Fig. B.3. Since the zero crossings occur when part of the oval is furthest away from the detection coil, the modulation of the 7-kHz waveform directly reflects the rotor position and speed. The distance, A, in Fig. B.3 decreases as the rotor speed increases. The instantaneous value of both detector waveforms provides the information needed to determine the rotor position, even at a standstill.

40
Fig. B.3. Waveforms in the detection coils.
B.1 LOAD ANGLE DETECTION CIRCUIT The resolver provides information needed to determine the load angle, since one of the sinusoidal
signals from the resolver has a direct relation to the back-emf voltage of one phase. Therefore, when voltage is applied to the motor, information about the back-emf voltage is known even though it cannot be directly measured.
By using a simple circuit to produce a pulse that corresponds with the zero crossings of the back-emf
voltage, the motor can be loaded until the maximum torque angle is achieved. As shown in Fig. B.4, when one of the position signals is at a maximum, the other position signal crosses zero. Therefore, a more precise pulse aligned with the maximum of the position signal can be generated. The circuit shown in Fig. B.5 uses two comparators with the two position signals, Channels 1 and 2, from the resolver. One comparator produces a 5-V output only if Channel 1 exceeds an upper threshold level that is determined by a potentiometer setting. The other comparator produces a 5-V output only if Channel 2 is below a low threshold level. The thresholds are shown in Fig. B.4.
Fig. B.4. When one position signal reaches a maximum, the other crosses zero.

41
Fig. B.5. Circuit with two comparators and two position signals.
The hardware assembly circuit shown in Fig. B.5 is presented in Fig. B.6.
Fig. B.6. Hardware assembly of circuit shown in Fig. B.5.

42
An oscilloscope is used to monitor the toque angle during experimentation. The pulse and the voltage applied to the motor are monitored on the oscilloscope. Because at no load the motor back-emf is very close to the motor voltage, the position of the pulse with no load was observed to be near the zero crossing of the no-load motor voltage, as indicated by the zero load angle position shown in Fig. B.7. As the load is increased, the pulse will shift with respect to the applied voltage. Hence, the load on the motor can be increased until the pulse nears the maximum torque angle as shown in Fig. B.8. Since the output of the resolver is a modulated 7-kHz sine wave, many pulses may be generated because the two signals meet the threshold requirements. To further illustrate this behavior, Figs. B.7 and B.8 have two different threshold settings. Another look at Fig. B.4 may also provide a better understanding.
Fig. B.7. Load angle position at 20-Nm load.
Fig. B.8. Load angle position at 120-Nm load.

43
DISTRIBUTION
Internal
1. D. J. Adams 2. C. W. Ayers 3. T.A. Burress 4. S. L. Campbell 5. C. L. Coomer 6. E. C. Fox 7. J. S. Hsu
8. P. A. Jallouk 9. K. T. Lowe 10. S. C. Nelson 11. L. D. Marlino 12. R. H. Wiles 13–14. Laboratory Records
External
15. S. A. Rogers, U.S. Department of Energy, EE-2G/Forrestal Building, 1000 Independence Avenue, S.W., Washington, D.C. 20585.
16. E. J. Wall, U.S. Department of Energy, EE-2G/Forrestal Building, 1000 Independence Avenue, S.W., Washington, D.C. 20585.