Covenant of Mayors: Monitoring...
56
Albana Kona, Paolo Bertoldi, Giulia Melica, Silvia Rivas Calvete, Paolo Zancanella, Tiago Serrenho, Andreea Iancu, Greet Janssens-Manhout Covenant of Mayors: Monitoring Indicators 2016 EUR 27723 EN
Transcript of Covenant of Mayors: Monitoring...
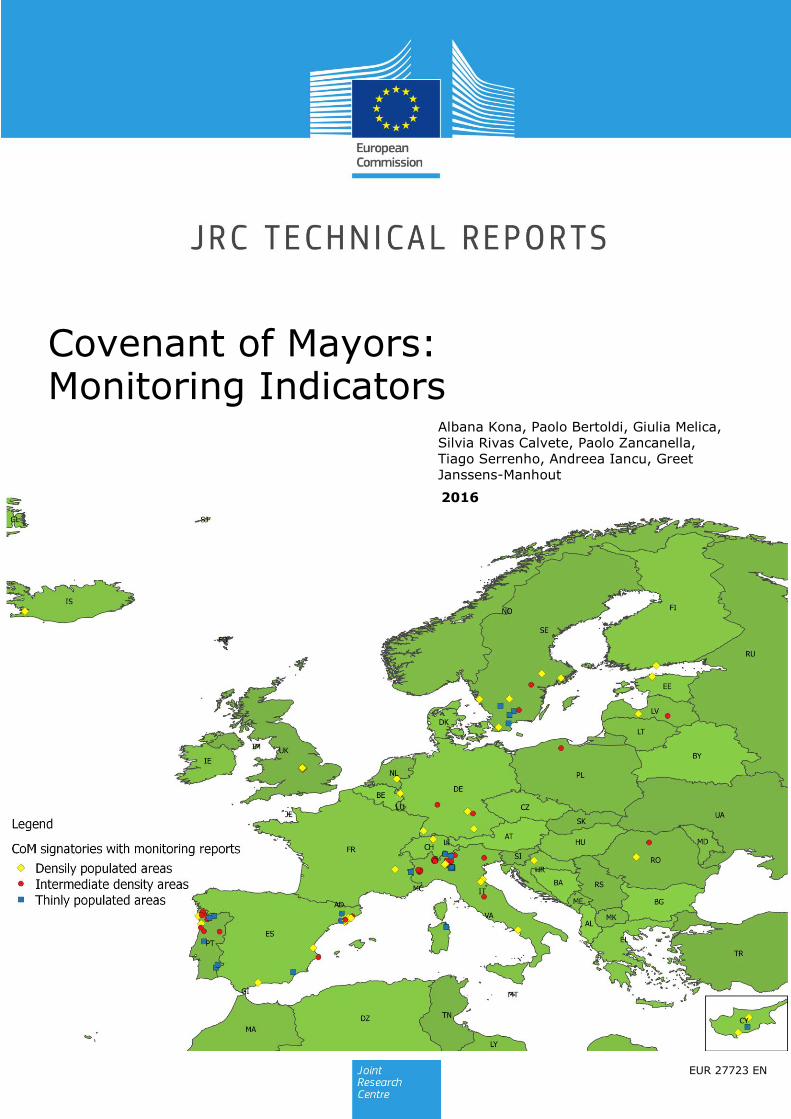
Albana Kona, Paolo Bertoldi, Giulia Melica, Silvia Rivas Calvete, Paolo Zancanella, Tiago Serrenho, Andreea Iancu, Greet Janssens-Manhout
Covenant of Mayors: Monitoring Indicators
2016
EUR 27723 EN

Covenant of Mayors: Monitoring Indicators
Progress report of
monitoring phase as of
September 2015

1
This publication is a Technical report by the Joint Research Centre, the European Commission’s in-house science
service. It aims to provide evidence-based scientific support to the European policy-making process. The scientific
output expressed does not imply a policy position of the European Commission. Neither the European
Commission nor any person acting on behalf of the Commission is responsible for the use which might be made
of this publication.
JRC Science Hub
https://ec.europa.eu/jrc
JRC97924
EUR 27723 EN
ISBN 978-92-79-54716-4 (PDF)
ISBN 978-92-79-54717-1 (print)
ISSN 1831-9424 (online)
ISSN 1018-5593 (print)
doi:10.2790/192450 (online)
doi:10.2790/006719 (print)
© European Union, 2016
Reproduction is authorised provided the source is acknowledged.
Printed in Italy
All images © European Union 2016,
How to cite: Kona A, Bertoldi P, Melica G, Rivas Calvete S, Zancanella P, Serrenho T., Iancu A, Janssens-
Maenhout G. Covenant of Mayors: Monitoring Indicators. EUR 27723 EN. Luxembourg (Luxembourg): Publications
Office of the European Union; 2016. JRC97924
2
Table of contents
Abstract ............................................................................................................... 3
1. Introduction ................................................................................................. 4
2. General Statistics on Covenant of Mayors Monitoring phase ............................... 5
3. Progress towards GHG emission targets ......................................................... 13
4. Progress on Energy Efficiency ....................................................................... 15
4.1. Electricity ......................................................................................... 17
Electricity consumption ............................................................................. 17
Electricity production ................................................................................ 17
4.2. Heating and cooling .......................................................................... 19
Heating and cooling consumption ............................................................... 19
Heating and cooling production .................................................................. 21
4.3. Transport ......................................................................................... 23
5. Progress on renewable energy ...................................................................... 25
Conclusion.......................................................................................................... 28
References ......................................................................................................... 30
List of abbreviations and definitions ....................................................................... 32
List of figures ...................................................................................................... 33
List of tables ....................................................................................................... 34
Annex ................................................................................................................ 35
3
Abstract
Launched in 2008 by the European Commission, the Covenant of Mayors (CoM) is the
mainstream European movement involving cities and towns in the development and
implementation of local sustainable energy and climate policies.
Covenant of Mayors' signatories can benefit from support at different levels: from
European institutions to national and regional governments and to fellow signatories
sharing best practises through the CoM platform.
Featured by multilevel governance models and bottom up actions, the CoM platform
paves the way for local and regional governments to contribute to EU's climate and
energy objectives.
By signing up to the Covenant of Mayors, local authorities commit to submit:
I. action plan: based on the inventory of energy consumptions/production and
greenhouse gas emissions in the local authority's territory, identifies actions to be
implemented for reaching the CO2 reduction target.
II. monitoring reports: including status of the implementation of actions and - at
least every fourth year - a monitoring inventory which allows to measure
progress toward the targets set in the action plan1.
As of September 2015, almost six thousand local authorities have signed the CoM,
for a total of ca. 208 million inhabitants in the whole initiative. More than 4500 local
authorities have submitted an action plan (Sustainable Energy Action Plan) for a total of
ca. 166 million. Out of these, 122 signatories, representing 3% of the signatories with an
action plan, have submitted a monitoring report including inventories for a total ca. 11
million inhabitants. Only 45 out of 418 signatories (11%) required submitting a
monitoring report as of September 2015 have reported the full progress report.
Monitoring inventories enable to track the evolution of GHG emissions in local
authorities territories as well as changes in energy consumptions patterns, and to
compare estimated impacts of the actions against actual results.
This report illustrates main statistical indicators based on data provided by
signatories in the monitoring reports submitted as of September 2015.
1 The full description of the CoM commitments can be found in the CoM website: http://www.covenantofmayors.eu/index_en.html

4
1. Introduction
The "Covenant of Mayors: Monitoring Indicators" report provides an assessment of
progress made by local authorities, signatories of Covenant of Mayors initiative as of
September 2015 towards their climate mitigation target.
By joining the CoM initiative, signatories commit themselves to submitting to the
European Commission the following reports (Bertoldi et al. 2010):
Action plan: called Sustainable Energy Action Plan (SEAP), has to be submitted
within one year after the adhesion to the initiative and includes:
the inventory: it is based on the data collection of energy consumptions
/production and greenhouse gas emissions in the local territory. The starting point
against which the target is set is called Baseline Emission Inventory (BEI).
the action plan for 2020: it is based on the inventory results, identifying the actions to be implemented for reaching the CO2 reduction target.
Monitoring: the monitoring process is an important part of the Covenant of Mayors
commitments, which allows to measure progress toward the targets set in the action
plan. It can be of two types:
a qualitative monitoring report, at least every second year after submission of the
action plan.
a full quantitative implementation report, at least every fourth year after
submission of the action plan, for evaluation, monitoring and verification purposes.
Both action and monitoring reports are submitted via on-line templates available on
the CoM web-site signatory's restricted area. All the indicators presented in this
document are elaborated based on data reported by the signatories as of September
2015. The Joint Research Centre (JRC), in charge of the scientific support of the CoM
initiative has started to publish a series of yearly assessment reports on the initiative,
which may be downloaded from the website: http://iet.jrc.ec.europa.eu.
Based on the analysis of data submitted by local authorities as of September 2015, in
the following chapters are reported their progress towards '20-20-20' climate and energy
targets.
Chapter 2 analyses the main statistics of CoM signatories with a submitted
progress report in terms of population coverage/region, main drivers of the
trends. In addition, taking into account the harmonized definition of degree of
urbanization of Local Administrative Units for Europe based on (Dijkstra L. &
Poelman, 2012), by OECD – European Commission 2012, CoM signatories in
the data set were classified into categories according to those definitions.
Chapter 3 provides detailed information on current progress towards GHG
emission targets. All the GHG emission occurred in the local territory, with the
exception of the industry, are recommended to be included in the baseline
emission inventory. The industry sector comprises only small industry, not
included in the European Emissions Trading scheme.
Chapter 4 analyses progress towards reducing energy consumption and
contribution of local authorities in achieving the national energy efficiency
objectives for 2020. Furthermore, in this chapter are provided detailed
information on local electricity and heat/cold production.
Chapter 5 analyses progress made towards increasing the renewable energy
sources usage in local authorities.
The annex provides detailed information on the monitoring signatories with the
harmonised related information on Local Administrative Units 2 code, name,
geographical coordinates, area and degree of urbanization with Eurostat
5
2. General Statistics on Covenant of Mayors Monitoring
phase
As of September 2015, 5 951 local authorities signed the Covenant of Mayors (CoM),
for a total of ca. 172 million inhabitants in the EU-28, and ca. 208 million inhabitants in
the whole initiative.
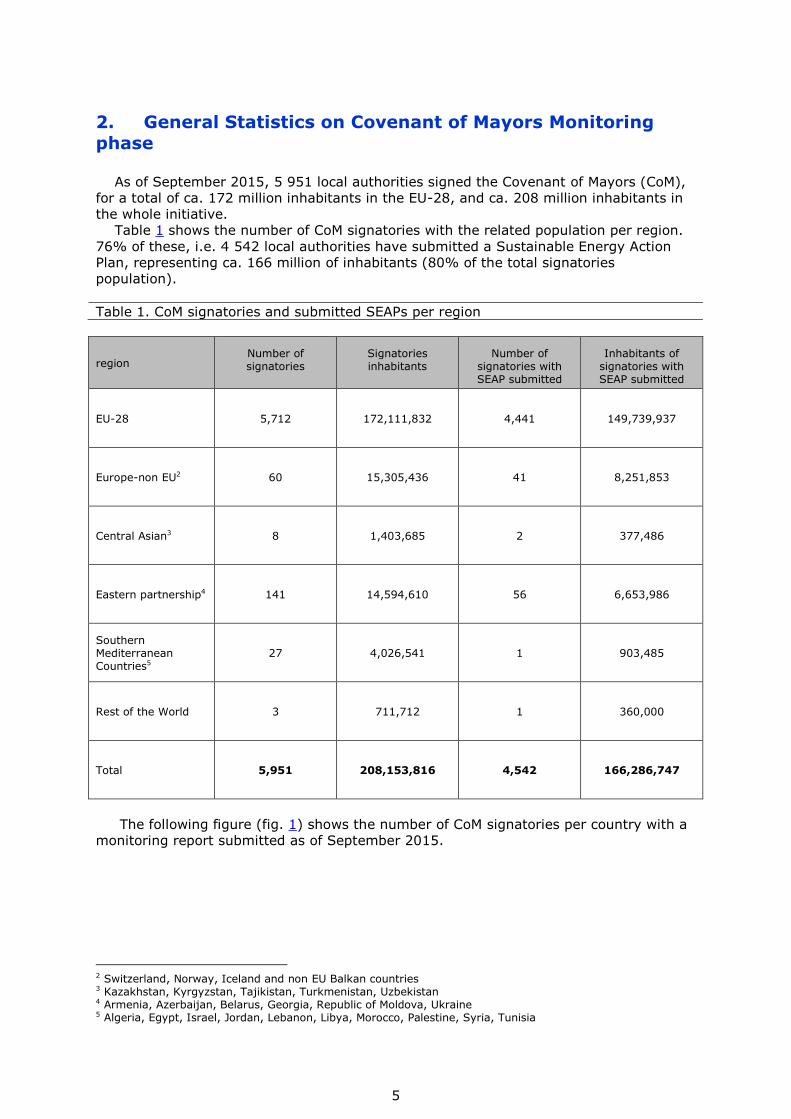
Table 1 shows the number of CoM signatories with the related population per region.
76% of these, i.e. 4 542 local authorities have submitted a Sustainable Energy Action
Plan, representing ca. 166 million of inhabitants (80% of the total signatories
population).
Table 1. CoM signatories and submitted SEAPs per region
region Number of signatories
Signatories inhabitants
Number of signatories with SEAP submitted
Inhabitants of signatories with SEAP submitted
EU-28 5,712 172,111,832 4,441 149,739,937
Europe-non EU2 60 15,305,436 41 8,251,853
Central Asian3 8 1,403,685 2 377,486
Eastern partnership4 141 14,594,610 56 6,653,986
Southern Mediterranean Countries5
27 4,026,541 1 903,485
Rest of the World 3 711,712 1 360,000
Total 5,951 208,153,816 4,542 166,286,747
The following figure (fig. 1) shows the number of CoM signatories per country with a
monitoring report submitted as of September 2015.
2 Switzerland, Norway, Iceland and non EU Balkan countries 3 Kazakhstan, Kyrgyzstan, Tajikistan, Turkmenistan, Uzbekistan 4 Armenia, Azerbaijan, Belarus, Georgia, Republic of Moldova, Ukraine 5 Algeria, Egypt, Israel, Jordan, Lebanon, Libya, Morocco, Palestine, Syria, Tunisia
6
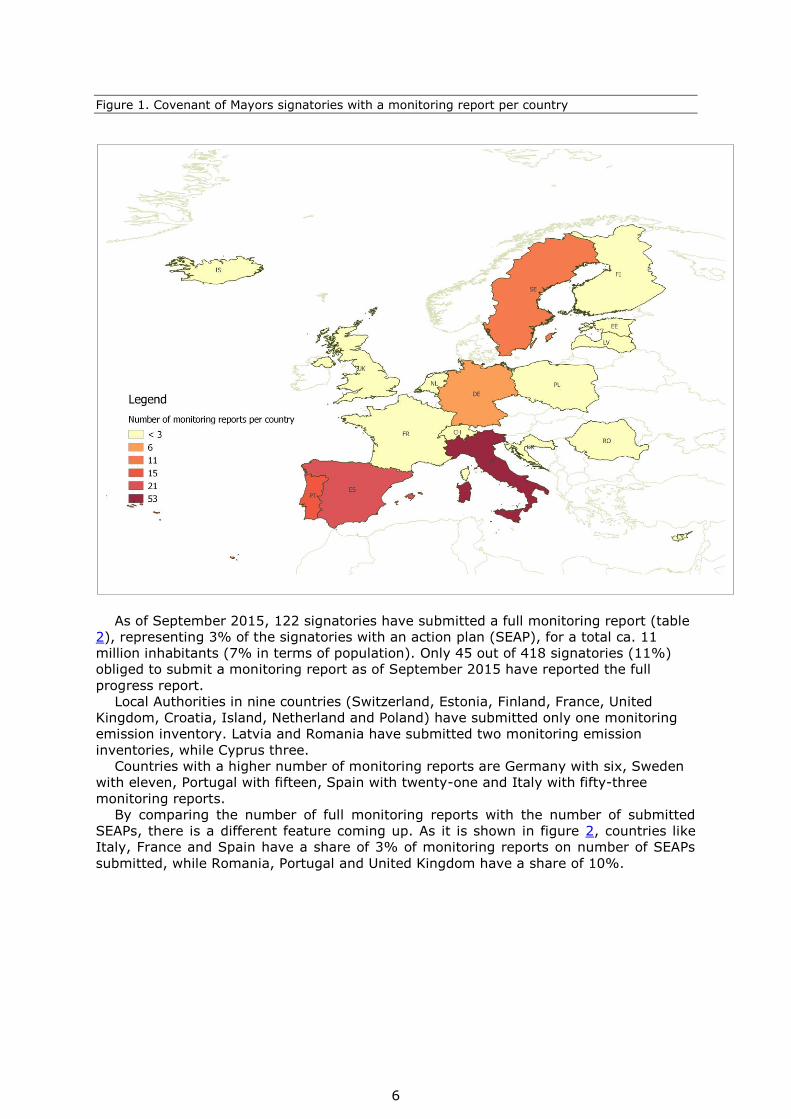
Figure 1. Covenant of Mayors signatories with a monitoring report per country
As of September 2015, 122 signatories have submitted a full monitoring report (table
2), representing 3% of the signatories with an action plan (SEAP), for a total ca. 11
million inhabitants (7% in terms of population). Only 45 out of 418 signatories (11%)
obliged to submit a monitoring report as of September 2015 have reported the full
progress report.
Local Authorities in nine countries (Switzerland, Estonia, Finland, France, United
Kingdom, Croatia, Island, Netherland and Poland) have submitted only one monitoring
emission inventory. Latvia and Romania have submitted two monitoring emission
inventories, while Cyprus three.
Countries with a higher number of monitoring reports are Germany with six, Sweden
with eleven, Portugal with fifteen, Spain with twenty-one and Italy with fifty-three
monitoring reports.
By comparing the number of full monitoring reports with the number of submitted
SEAPs, there is a different feature coming up. As it is shown in figure 2, countries like
Italy, France and Spain have a share of 3% of monitoring reports on number of SEAPs
submitted, while Romania, Portugal and United Kingdom have a share of 10%.

7
Table 2. CoM signatories with a submitted baseline and monitoring emission inventory
region Country
code
Number of signatories with a submitted Baseline Emission Inventory
Population of signatories with a submitted Baseline Emission Inventory
Number of signatories with a
submitted Monitoring Emission
Inventory
Population of Signatories with a
submitted Monitoring Emission
Inventory
EU-28
DE 57 17,419,470 6 2,539,079
EE 2 429,842 1 400,000
ES 1,144 24,510,410 21 2,276,673
FR 75 14,774,435 1 34,566
HR 57 1,907,944 1 788,850
IT 2,469 30,673,018 53 826,336
CY 21 462,376 3 82,900
LV 19 1,097,101 2 96,087
NL 15 3,339,002 1 161,286
PL 31 3,474,133 1 22,916
PT 89 4,511,253 15 742,266
RO 45 3,020,830 2 150,417
FI 8 1,818,313 1 490,872
SE 50 4,159,732 11 1,657,796
UK 31 16,649,223 1 281,500
EU other
357 24,838,111 - -
Europe
non EU
CH 8 795,181 1 366,809
IS 1 118,427 1 116,642
Other 92 15,633,202 - -
Total 4,542 166,286,747 122 11,034,995
There are 11 monitoring reports submitted by Swedish signatories, out of 44
SEAPs, representing 25%.
There are two signatories from Estonia with a SEAP submitted, and one
monitoring report, therefore the share of monitoring is 50%. The only signatory from
Iceland (Reykjavik) has submitted both the SEAP and the corresponding monitoring
report.
8
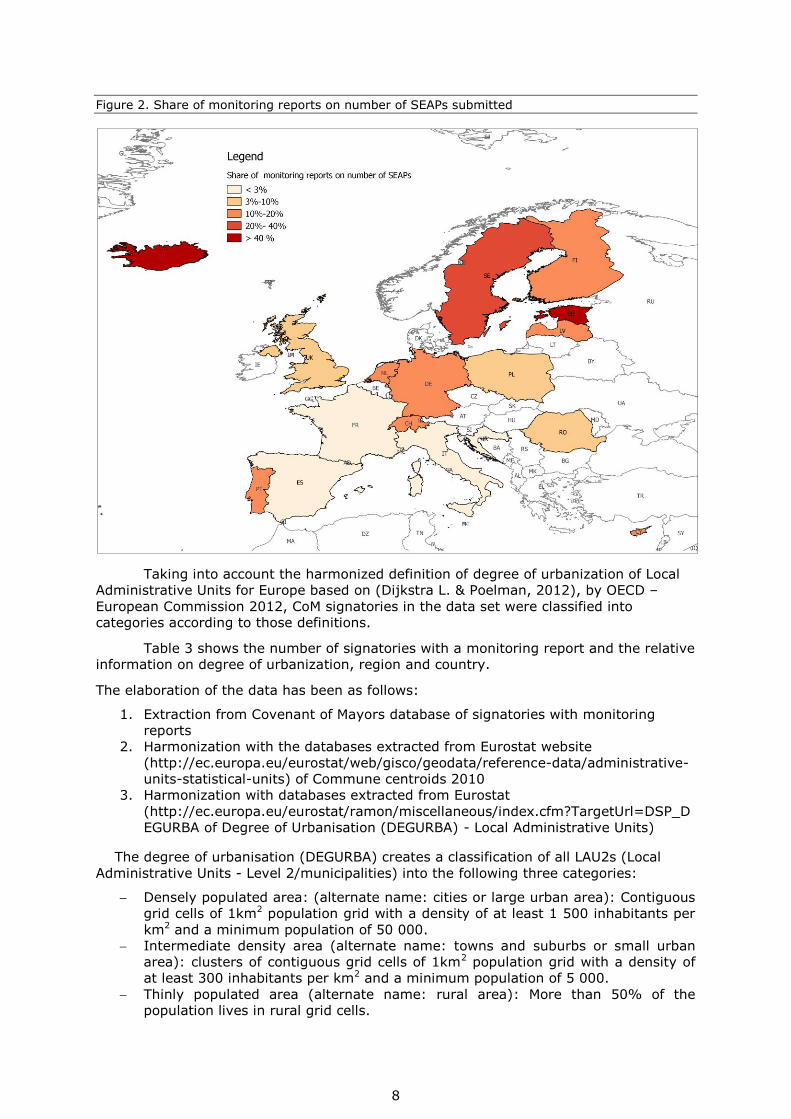
Figure 2. Share of monitoring reports on number of SEAPs submitted
Taking into account the harmonized definition of degree of urbanization of Local
Administrative Units for Europe based on (Dijkstra L. & Poelman, 2012), by OECD –
European Commission 2012, CoM signatories in the data set were classified into
categories according to those definitions.
Table 3 shows the number of signatories with a monitoring report and the relative
information on degree of urbanization, region and country.
The elaboration of the data has been as follows:
1. Extraction from Covenant of Mayors database of signatories with monitoring
reports
2. Harmonization with the databases extracted from Eurostat website
(http://ec.europa.eu/eurostat/web/gisco/geodata/reference-data/administrative-
units-statistical-units) of Commune centroids 2010
3. Harmonization with databases extracted from Eurostat
(http://ec.europa.eu/eurostat/ramon/miscellaneous/index.cfm?TargetUrl=DSP_D
EGURBA of Degree of Urbanisation (DEGURBA) - Local Administrative Units)
The degree of urbanisation (DEGURBA) creates a classification of all LAU2s (Local
Administrative Units - Level 2/municipalities) into the following three categories:
Densely populated area: (alternate name: cities or large urban area): Contiguous
grid cells of 1km2 population grid with a density of at least 1 500 inhabitants per
km2 and a minimum population of 50 000.
Intermediate density area (alternate name: towns and suburbs or small urban
area): clusters of contiguous grid cells of 1km2 population grid with a density of
at least 300 inhabitants per km2 and a minimum population of 5 000.
Thinly populated area (alternate name: rural area): More than 50% of the
population lives in rural grid cells.
http://ec.europa.eu/eurostat/web/gisco/geodata/reference-data/administrative-units-statistical-units

9
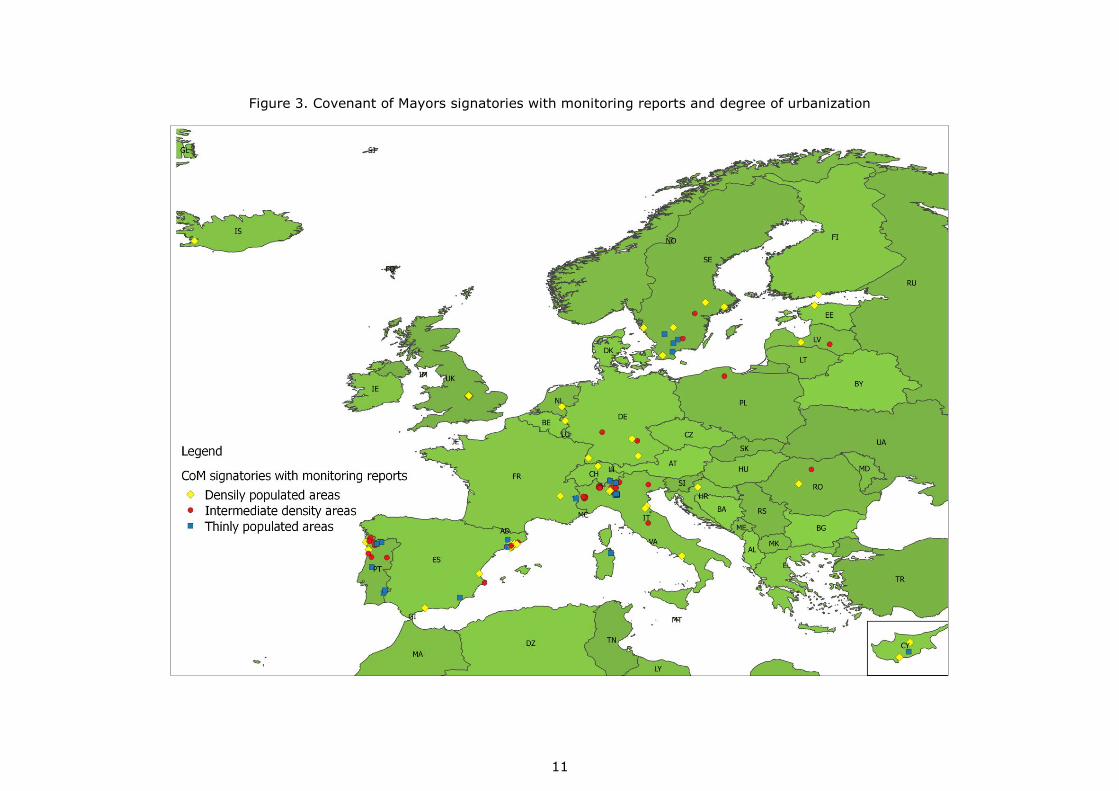
34% of the CoM signatories with a submitted monitoring report as of September
2015 are densely populated areas i.e. cities or large urban areas, representing 85% of
the CoM signatories population. Spanish large urban areas are the most active cities in
the monitoring process, with a share of 27 % of large urban areas.
The majority, 44%, in terms of numbers of the CoM signatories with a submitted
monitoring report as of September 2015 are intermediate populated areas i.e. small
urban areas, representing 11% of the CoM monitoring signatories' population. Italian
signatories are the most active small urban areas in the monitoring process, with a share
of 59% of signatories categorized as small urban areas. On the other hand, CoM
signatories classified as thinly populated areas i.e rural areas represent a small share
either in terms of numbers (22% of the total monitoring signatories), or 4% in terms of
population. Italian signatories are the most active rural areas in the monitoring process,
with a share of 52% of monitoring signatories.
Table 3. Degree of urbanization of CoM signatories with a monitoring report submitted
region Country
code
Densely populated area /
cities or large urban area
Intermediate density area/ towns
and suburbs or small urban area
Thinly populated area/ rural area
Total of monitoring reports
EU-28
DE 4 2 - 6
EE 1 - - 1
ES 11 7 3 21
FR 1 - - 1
HR 1 - - 1
IT 7 32 14 53
CY 2 - 1 3
LV 1 1 - 2
NL 1 - - 1
PL - 1 - 1
PT 2 8 5 15
RO 1 1 - 2
FI 1 - - 1
SE 5 2 4 11
UK 1 - - 1
Europe non EU
CH 1 - - 1
IS 1 - - 1
Total 41 54 27 122
10
The Annex lists all the monitoring signatories with the harmonised related
information on Commune ID code or Local Administrative Unit 2 code, name,
geographical coordinates, area and degree of urbanization with Eurostat. The following
figure (fig 3) shows the number of signatories with a monitoring report submitted as of
September 2015 and the related information on the degree of urbanization.
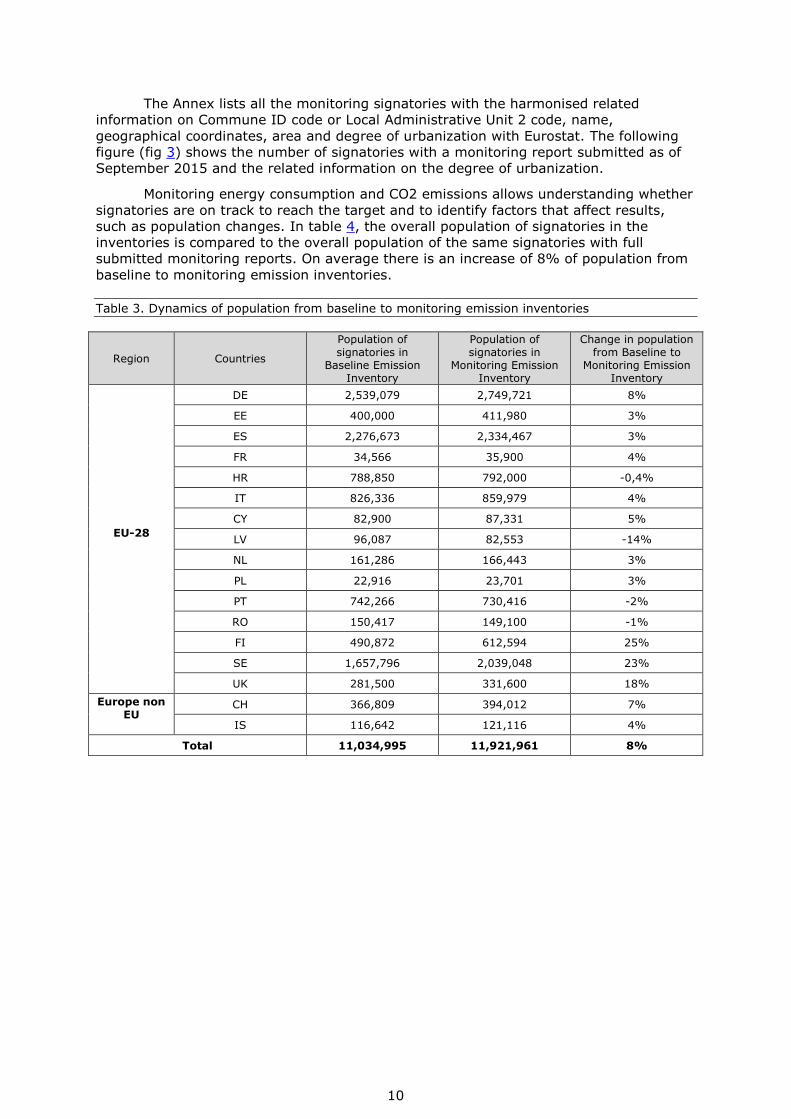
Monitoring energy consumption and CO2 emissions allows understanding whether
signatories are on track to reach the target and to identify factors that affect results,
such as population changes. In table 4, the overall population of signatories in the
inventories is compared to the overall population of the same signatories with full
submitted monitoring reports. On average there is an increase of 8% of population from
baseline to monitoring emission inventories.
Table 3. Dynamics of population from baseline to monitoring emission inventories
Region Countries
Population of signatories in
Baseline Emission Inventory
Population of signatories in
Monitoring Emission Inventory
Change in population from Baseline to
Monitoring Emission Inventory
EU-28
DE 2,539,079 2,749,721 8%
EE 400,000 411,980 3%
ES 2,276,673 2,334,467 3%
FR 34,566 35,900 4%
HR 788,850 792,000 -0,4%
IT 826,336 859,979 4%
CY 82,900 87,331 5%
LV 96,087 82,553 -14%
NL 161,286 166,443 3%
PL 22,916 23,701 3%
PT 742,266 730,416 -2%
RO 150,417 149,100 -1%
FI 490,872 612,594 25%
SE 1,657,796 2,039,048 23%
UK 281,500 331,600 18%
Europe non EU
CH 366,809 394,012 7%
IS 116,642 121,116 4%
Total 11,034,995 11,921,961 8%
11
Figure 3. Covenant of Mayors signatories with monitoring reports and degree of urbanization

12
0
5
10
15
20
25
30
35
40
45
50
55
60
65
20
06
20
07
20
08
20
09
20
10
20
11
20
12
20
13
20
14
20
15
20
16
Number of CoM signatories with Monitoring Emission Inventories
In the guidebook "How to develop a Sustainable Energy Action Plan", (Bertoldi P.,
2010) a general recommendation was made to use 1990 as the year for the BEI
reference; nevertheless signatories are able to choose the closest subsequent year for
which reliable data could be gathered. As a result, different years have been chosen as
baseline years for inventories. The majority of population (46%) in CoM signatories have
chosen as BEI inventory year 1990 (19/122), while 45% (34/122) of population MEI
inventory years 2012 as shown in figure 4.
Figure 4. Reference years in baseline and monitoring emission inventories
0
5
10
15
20
25
30
35
40
45
50
55
60
65
19
88
19
90
19
92
19
94
19
96
19
98
20
00
20
02
20
04
20
06
20
08
20
10
Number of CoM signatories with Baseline Emission Inventories

13
3. Progress towards GHG emission targets
Based on the report 'Trends and Projections in Europe 2015: Tracking progress
towards Europe's climate and energy target' (EEA, 2015) the EU is on course to meet
the 2020 targets for GHG emissions. In 2014, the estimates reported by Member states
indicate that GHG emissions reductions reached 23% compared to 1990 levels. Most of
the savings in GHG emissions are expected to take place in the EU ETS, which currently
represent 45% of the total emissions.
Local Authorities in Covenant of Mayors initiative are putting in place with a bottom-
up approach the 2020 targets for GHG emissions. The focus of the Covenant of Mayors
inventories are the main non ETS sectors under the direct influence of the local authority
(such as households, transport, services). In addition to the non-ETS sectors, the CoM
inventories also account for indirect emissions associated with consumption of electricity
and heat/cold (as final product delivered to the final consumer). As a consequence, a
certain share of emissions arising from power generation by plants included in the EU
ETS scheme are computed in the inventories and addressed via the SEAPs.
Although the minimum commitment was to reduce the current emissions by 20% by
2020, CoM signatories who have already submitted the progress report, i.e. a monitoring
inventory reached an overall reduction of 23% (table 5) compared to the baseline inventory.
Table 4. Per capita reduction of GHG emissions from baseline to monitoring emission inventories
Baseline Emission Inventory
Monitoring Emission Inventory
GHG emissions inventories [tCO2-eq/y]
63,331,717 48,980,985
Absolute reduction of GHG emissions from baseline to monitoring emission
inventories 23%
Per capita GHG emissions [tCO2-eq/p y]
5.74 4.11
Per capita reduction of GHG emissions from baseline to monitoring emission
inventories 28%
The CoM average monitoring results on GHG emissions reductions seem particularly
consistent with the EEA's report 'Trends and Projections in Europe 2015: Tracking
progress towards Europe's climate and energy target' (EEA, 2015), despite the
differences on CoM sectors coverage and different inventory years.
These results underline the interconnected nature of Climate and Energy mitigation
actions adopted at local level. The CoM signatories adopted a range of policies and
measures in improving energy efficiency though building regulations, increasing of
renewable energy share, and a gradual transformation to more efficient transportation.
The 23% decrease in GHG emissions between baseline and monitoring years was
driven by (figure 5):
GHG emission due to electricity consumption decreased by 10% from
baseline to monitoring years.
GHG emission in buildings for heating and cooling decrease by 46% from
baseline to monitoring years.
GHG emission in the transport sector decrease by 9% from baseline to
monitoring years.

14
Figure 5. Evolution of GHG emission per sector from baseline to monitoring emission inventories
Note: the percentages in Figure 5, refers to the shares of GHG emissions of the sector on total GHG
emissions.
The drop of GHG emissions between baseline and monitoring emission inventories
resulted from the combination of several factors as energy efficiency improvement,
increase of renewables, demographic growth, variation on weathers conditions ,
economic growth etc. The relative effects of energy efficiency improvement and the
progress on renewables are treated separately in the chapters 4 and 5, while the
demographic growth is taken into account in the calculation of the per capita indicators.
33%
38%
39%
29%
28%
33%
-
5,000
10,000
15,000
20,000
25,000
30,000
Baseline Emission Inventory Monitoring Emission Inventory
[kt CO2-eq/Year] Electricity Heat cold Transport

15
4. Progress on Energy Efficiency
Local Authorities in Covenant of Mayors initiative are putting in place with a bottom-
up approach the targets of Energy Efficiency Directive. The Energy Efficiency Directive
(Energy Efficiency Directive 2012/27/EU , 2012) specifically acknowledges the Covenant
of Mayors initiative and the role of local governments in achieving significant energy
savings, and calls for Member States to encourage municipalities and other public bodies
to adopt integrated and sustainable energy efficiency plans (SEAPs) (preamble 18).
The Covenant of Mayors signatories have been reducing their final energy
consumptions since 1990. Compared to the baseline inventories, final energy
consumptions have dropped by 14% on absolute value (table 5). Taking into account
that signatories' population has changed from baseline to monitoring inventory year, the
per capita final energy consumptions have dropped by 20%.
Table 5. Evolution of final energy consumptions from baseline to monitoring emission inventories
Baseline Emission Inventory
Monitoring Emission Inventory
Final energy consumptions in Inventories [MWh/y]
233,974,612 201,897,758
Absolute reduction of final energy consumption from baseline to monitoring inventories
14%
Per capita final energy consumption [MWh/p year]
21.20 16.93
Reduction of per capita final energy consumption from baseline to monitoring inventories
20%
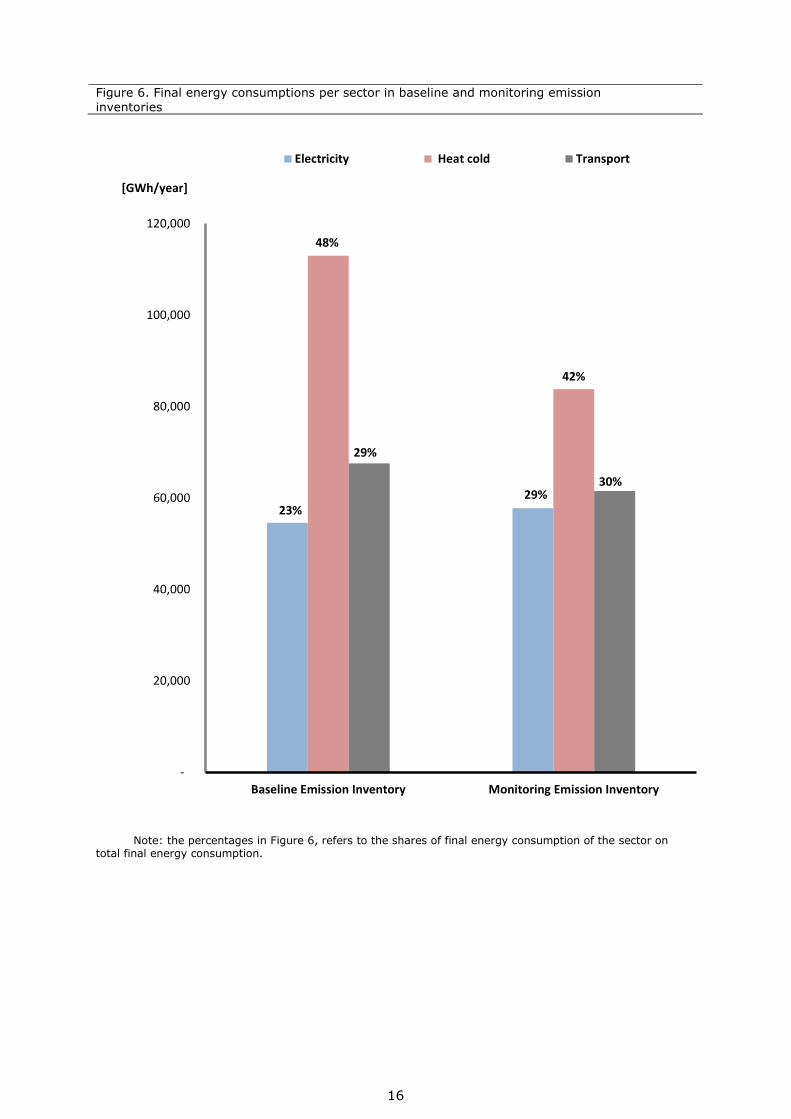
The 14% decrease in final energy consumptions between baseline and monitoring
years was driven by (Figure 6):
Electricity consumption increase by 6% from baseline to monitoring years.
Final energy consumption in buildings for heating and cooling decrease by
26% from baseline to monitoring years.
Energy consumption in the transport sector decrease by 9% from baseline to
monitoring years.
16
Figure 6. Final energy consumptions per sector in baseline and monitoring emission inventories
Note: the percentages in Figure 6, refers to the shares of final energy consumption of the sector on
total final energy consumption.
23% 29%
48%
42%
29%
30%
-
20,000
40,000
60,000
80,000
100,000
120,000
Baseline Emission Inventory Monitoring Emission Inventory
[GWh/year]
Electricity Heat cold Transport
17
4.1. Electricity
Electricity consumption
In CoM signatories electricity consumption increased by 6%, from a share of 23% on
final energy consumption in baseline inventories to 29% in monitoring inventories (table
6). This trend can be explained by higher living standards and a growing demand for
electrical appliances.
Table 6. Evolution of electricity consumption from baseline to monitoring emission inventories
Baseline Emission
Inventory Monitoring Emission
Inventory
Electricity consumption [MWh/year] 54,586,797 57,761,130
Increase of electricity consumption 6%
Final energy consumptions [MWh/y] 233,974,612 201,897,758
Increase of electricity consumption on final energy consumption
23% 29%
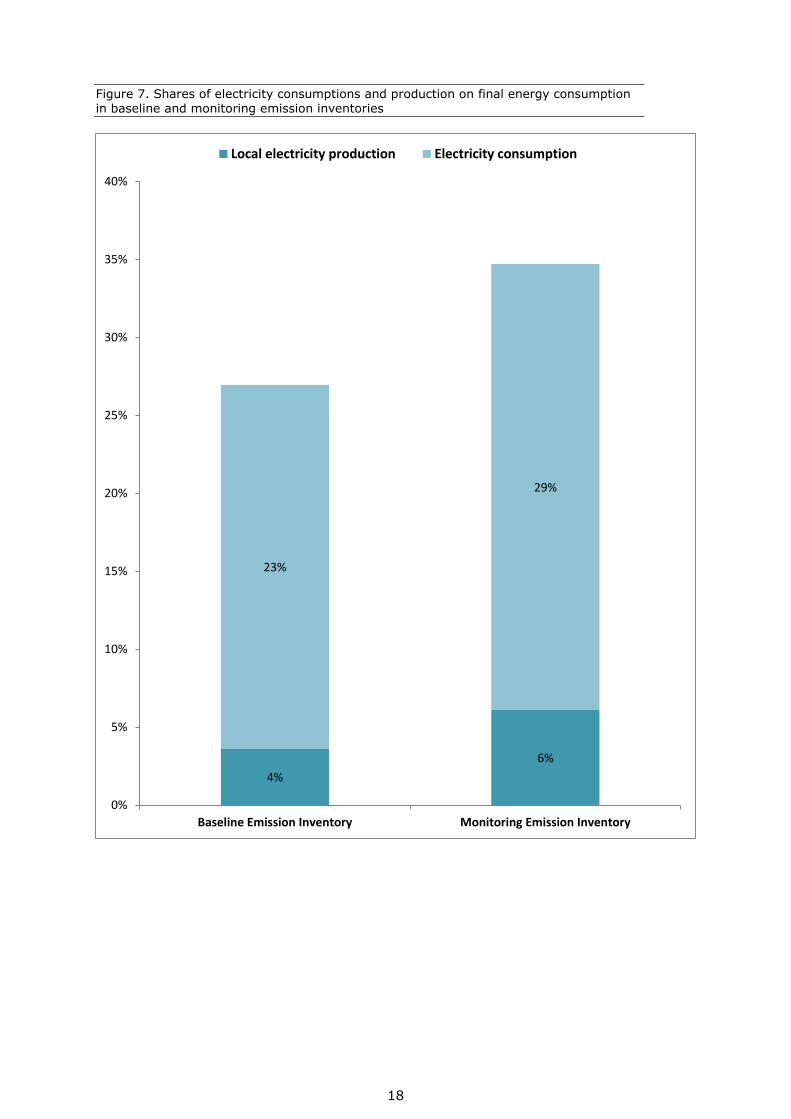
Electricity production
In comparison to baseline emission inventories the local electricity production
increased of 45% (table 7), from a share of 16% on electricity consumption in baseline
inventories to 21% in monitoring inventories.
Table 7. Evolution of local electricity production from baseline to monitoring emission inventories
Baseline Emission
Inventory Monitoring Emission
Inventory
Local electricity production [MWh/y] 8,496,069 12,321,761
Increase of local electricity production 45%
Electricity consumption [MWh/year] 233,974,612 201,897,758
Shares of local electricity production on on final energy consumption
4% 6%
The Energy Efficiency Directive asks Member States to take adequate measures for
efficient district heating and cooling infrastructure to be developed and/or to
accommodate the development of high-efficiency cogeneration ... (article 14).
CoM signatories, in close collaboration with local utilities for sustainable energy
systems in their territories, have been able to implement measures related to
development of high-efficiency cogeneration power plans.
The 6% increase of electricity consumption between baseline and monitoring years
was mainly produced by the increase of local production of electricity from CHP power
plants (Figure 7):
18
Figure 7. Shares of electricity consumptions and production on final energy consumption in baseline and monitoring emission inventories
4%
6%
23%
29%
0%
5%
10%
15%
20%
25%
30%
35%
40%
Baseline Emission Inventory Monitoring Emission Inventory
Local electricity production Electricity consumption

19
4.2. Heating and cooling
Heating and cooling consumption
Heating and cooling consumption has dropped in Covenant of Mayors signatories
Compared to the baseline inventories, heating and cooling consumptions has dropped by
26% on absolute value (table 8), from a share of 48% on final energy consumption in
baseline inventories to 42% in monitoring inventories.
Table 8. Evolution of final energy consumptions for heating and cooling from baseline to monitoring emission inventories
Baseline Emission
Inventory Monitoring Emission
Inventory
Final energy consumption for heating and cooling [MWh/y]
112,979,666 83,807,310
Reduction of heating and cooling consumptions
26%
Final energy consumptions [MWh/y] 233,974,612 201,897,758
Shares of heating and cooling consumptions on final energy consumption
48% 42%
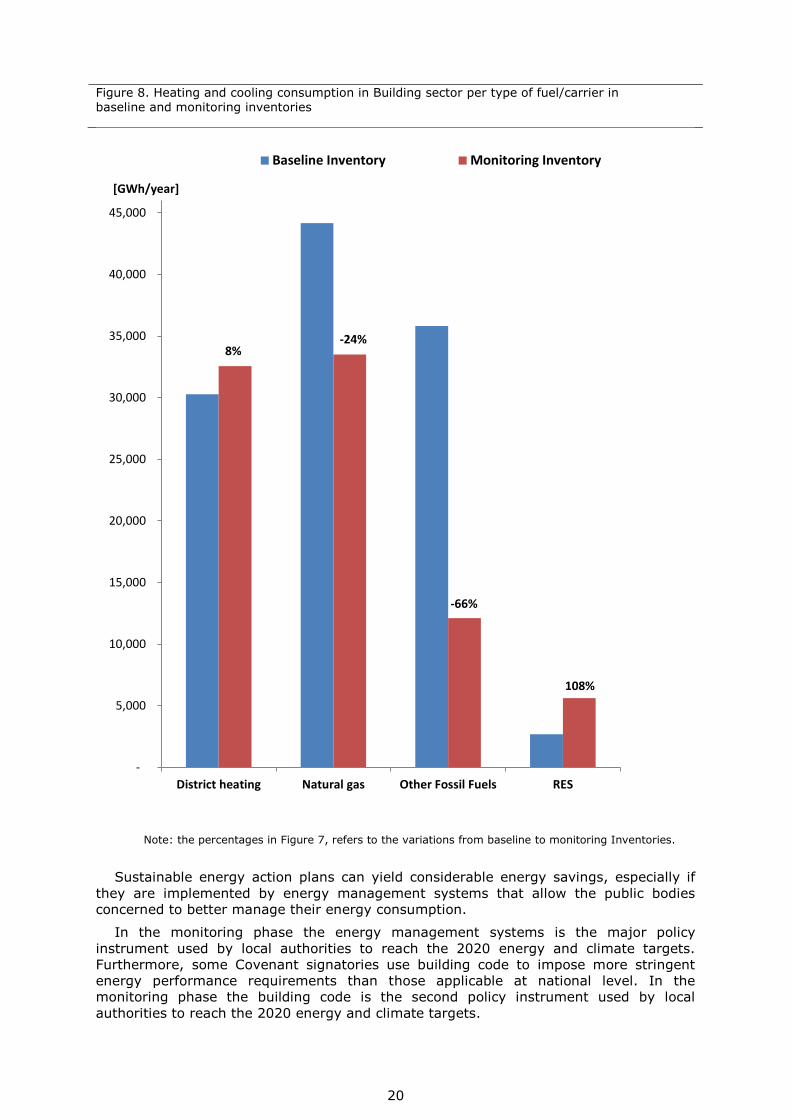
The 26% decrease in heating and cooling consumption between baseline and
monitoring years was mainly driven by energy efficiency measures in the building sector
(Figure 8):
Heating and cooling consumption using natural gas in buildings decreased by
24% from baseline to monitoring years;
Heating and cooling consumption using other fossil fuels (different from
natural gas) in buildings decreased by 66% from baseline to monitoring
years.
While, there is an increase of
Heating consumption from district heating networks by 8% from baseline to
monitoring years;
Heating consumption using renewable sources by 108% from baseline to
monitoring years.
20
Figure 8. Heating and cooling consumption in Building sector per type of fuel/carrier in baseline and monitoring inventories
Note: the percentages in Figure 7, refers to the variations from baseline to monitoring Inventories.
Sustainable energy action plans can yield considerable energy savings, especially if
they are implemented by energy management systems that allow the public bodies
concerned to better manage their energy consumption.
In the monitoring phase the energy management systems is the major policy
instrument used by local authorities to reach the 2020 energy and climate targets.
Furthermore, some Covenant signatories use building code to impose more stringent
energy performance requirements than those applicable at national level. In the
monitoring phase the building code is the second policy instrument used by local
authorities to reach the 2020 energy and climate targets.
8% -24%
-66%
108%
-80%
-60%
-40%
-20%
0%
20%
40%
60%
80%
100%
120%
-
5,000
10,000
15,000
20,000
25,000
30,000
35,000
40,000
45,000
District heating Natural gas Other Fossil Fuels RES
[GWh/year]
Baseline Inventory Monitoring Inventory
21
The city of Växjö in Sweden is a representative case of implementation of these
policies (City Växjö).
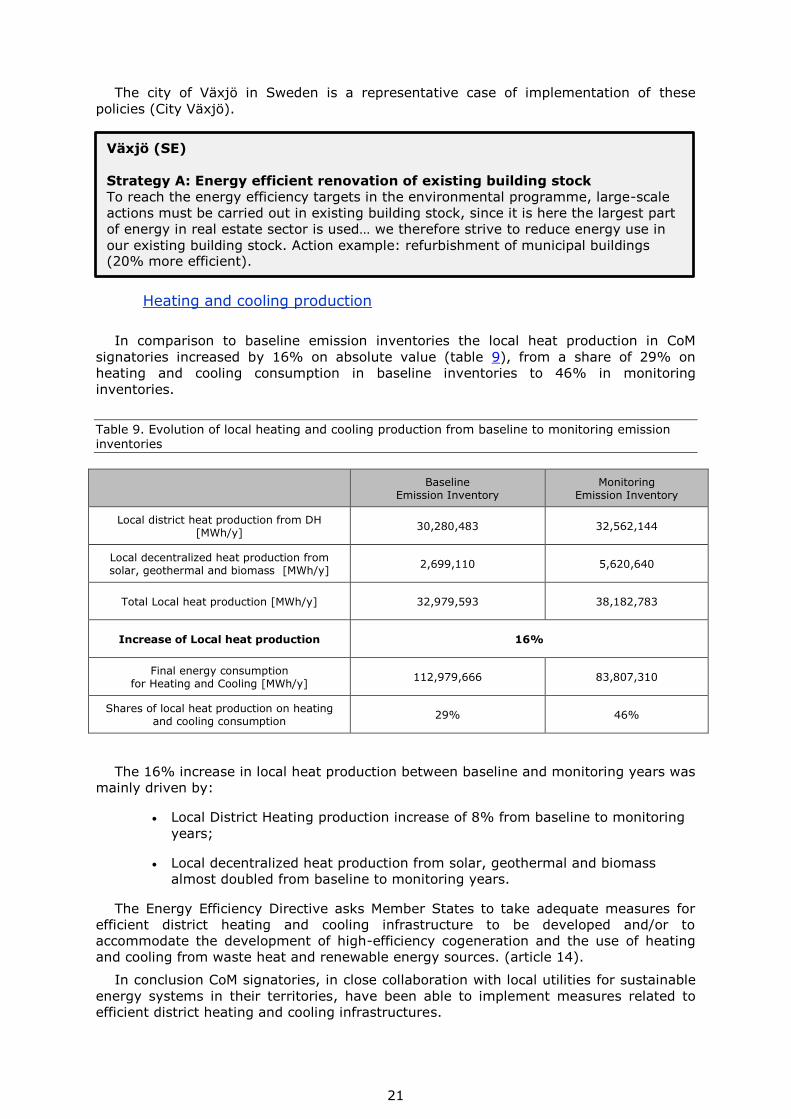
Heating and cooling production
In comparison to baseline emission inventories the local heat production in CoM
signatories increased by 16% on absolute value (table 9), from a share of 29% on
heating and cooling consumption in baseline inventories to 46% in monitoring
inventories.
Table 9. Evolution of local heating and cooling production from baseline to monitoring emission inventories
Baseline
Emission Inventory Monitoring
Emission Inventory
Local district heat production from DH [MWh/y]
30,280,483 32,562,144
Local decentralized heat production from solar, geothermal and biomass [MWh/y]
2,699,110 5,620,640
Total Local heat production [MWh/y] 32,979,593 38,182,783
Increase of Local heat production 16%
Final energy consumption for Heating and Cooling [MWh/y]
112,979,666 83,807,310
Shares of local heat production on heating and cooling consumption
29% 46%
The 16% increase in local heat production between baseline and monitoring years was
mainly driven by:
Local District Heating production increase of 8% from baseline to monitoring
years;
Local decentralized heat production from solar, geothermal and biomass
almost doubled from baseline to monitoring years.
The Energy Efficiency Directive asks Member States to take adequate measures for
efficient district heating and cooling infrastructure to be developed and/or to
accommodate the development of high-efficiency cogeneration and the use of heating
and cooling from waste heat and renewable energy sources. (article 14).
In conclusion CoM signatories, in close collaboration with local utilities for sustainable
energy systems in their territories, have been able to implement measures related to
efficient district heating and cooling infrastructures.
Växjö (SE)
Strategy A: Energy efficient renovation of existing building stock
To reach the energy efficiency targets in the environmental programme, large-scale
actions must be carried out in existing building stock, since it is here the largest part
of energy in real estate sector is used… we therefore strive to reduce energy use in
our existing building stock. Action example: refurbishment of municipal buildings (20% more efficient).
22
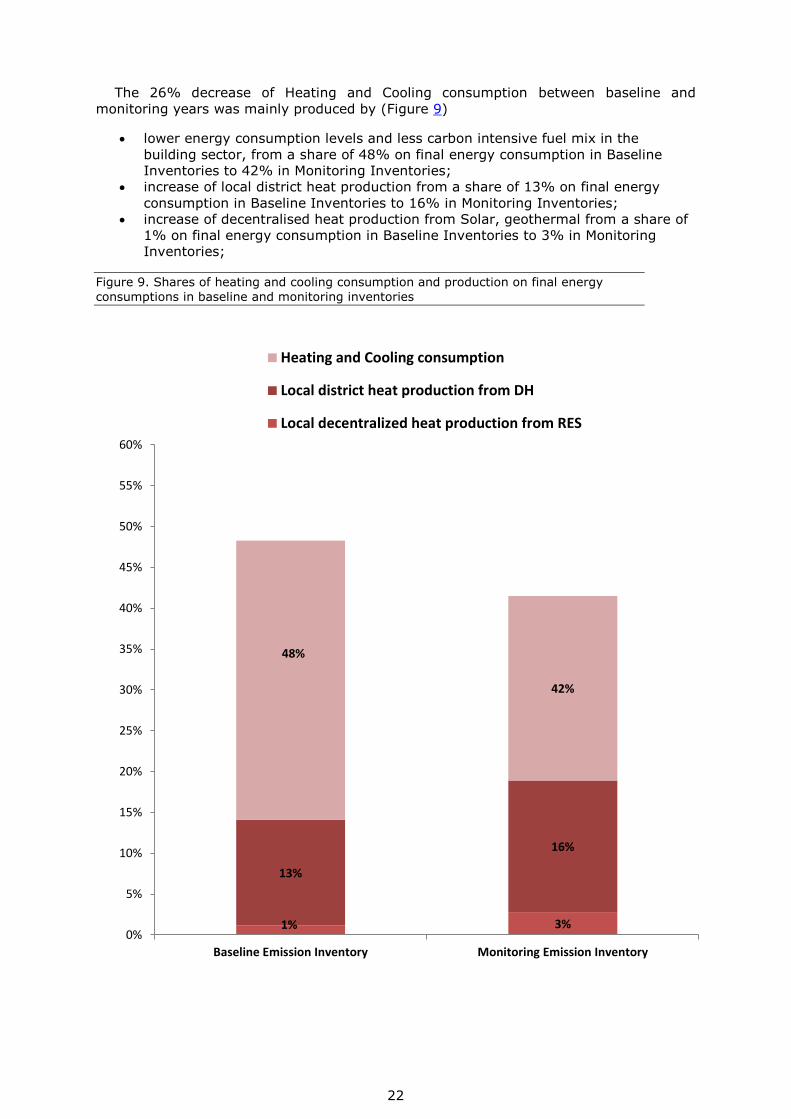
The 26% decrease of Heating and Cooling consumption between baseline and
monitoring years was mainly produced by (Figure 9)
lower energy consumption levels and less carbon intensive fuel mix in the
building sector, from a share of 48% on final energy consumption in Baseline
Inventories to 42% in Monitoring Inventories;
increase of local district heat production from a share of 13% on final energy
consumption in Baseline Inventories to 16% in Monitoring Inventories;
increase of decentralised heat production from Solar, geothermal from a share of
1% on final energy consumption in Baseline Inventories to 3% in Monitoring
Inventories;
Figure 9. Shares of heating and cooling consumption and production on final energy
consumptions in baseline and monitoring inventories
1% 3%
13%
16%
48%
42%
0%
5%
10%
15%
20%
25%
30%
35%
40%
45%
50%
55%
60%
Baseline Emission Inventory Monitoring Emission Inventory
Heating and Cooling consumption
Local district heat production from DH
Local decentralized heat production from RES

23
4.3. Transport
The transport sector to be fully effective, a gradual transformation of the entire
system is required towards greater integration between modes, innovation and
deployment of alternative fuels, and improved management of traffic flows through
intelligent transport systems.
In the transport sector the gradual transition towards more efficient vehicles is one of
the major areas of intervention in CoM local authorities (27% of the total share of
actions in the transportation): this is probably not a direct area of intervention for local
authorities, but could be indirectly influenced through local mobility planning practices
such as limited traffic zones, low emissions zones, designated parking spaces for low
emission vehicles, etc..This is followed by modal shift to walking and cycling (17% of the
total share) and by modal shift to public transport (13% of the total share).
The trend of energy consumption in the transport sector has dropped in Covenant of
Mayors signatories. Compared to the baseline inventories, final energy consumption for
transportation has dropped by 9% on absolute value (Table 10).
Table 10. Energy consumption in transport sector in baseline and monitoring emission inventories
Baseline
Emission Inventory Monitoring
Emission Inventory
Electricity consumption in transport [MWh/y]
1,359,178 2,029,821
Fossil Fuels consumption in transport [MWh/y]
66,110,386 58,380,413
RES consumption in transport [MWh/y]
79,336 1,099,716
Total energy consumption in transport [MWh/y]
67,548,900 61,509,950
Decrease of energy consumption in transport
9%
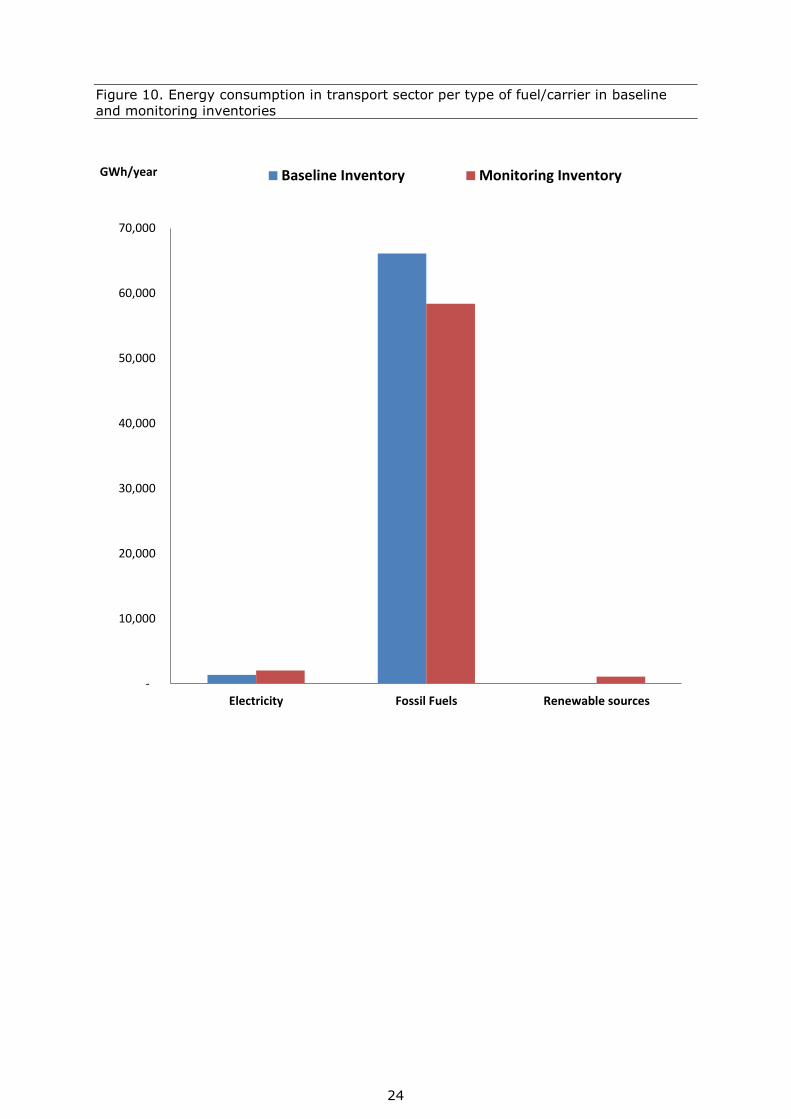
The 9% decrease in energy consumption in Transport between baseline and
monitoring years was mainly driven by (Figure 10):
Lower energy consumption from non-renewable sources (12% of reduction
on absolute value)
Increase of Electricity consumption (49% in comparison to baseline
consumptions)
Increase of renewable sources (around 13 times in comparison to baseline
inventories)
24
Figure 10. Energy consumption in transport sector per type of fuel/carrier in baseline
and monitoring inventories
-
10,000
20,000
30,000
40,000
50,000
60,000
70,000
Electricity Fossil Fuels Renewable sources
GWh/year Baseline Inventory Monitoring Inventory
25
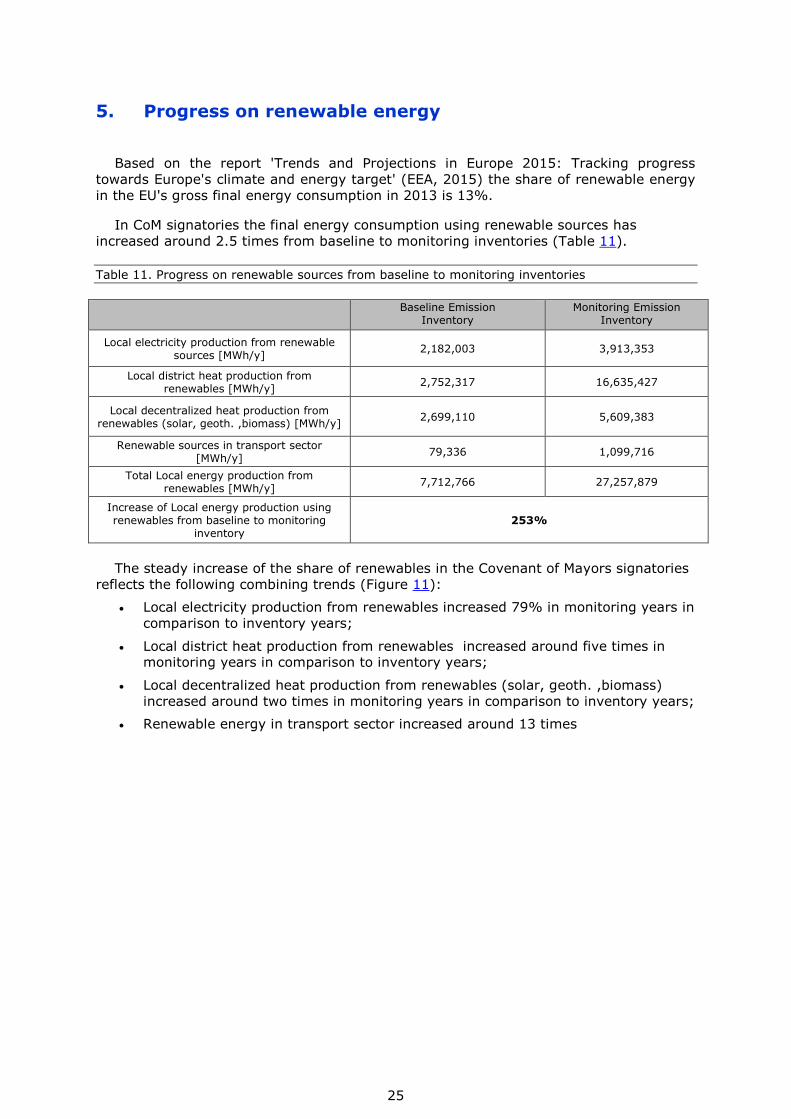
5. Progress on renewable energy
Based on the report 'Trends and Projections in Europe 2015: Tracking progress
towards Europe's climate and energy target' (EEA, 2015) the share of renewable energy
in the EU's gross final energy consumption in 2013 is 13%.
In CoM signatories the final energy consumption using renewable sources has
increased around 2.5 times from baseline to monitoring inventories (Table 11).
Table 11. Progress on renewable sources from baseline to monitoring inventories
Baseline Emission
Inventory Monitoring Emission
Inventory
Local electricity production from renewable sources [MWh/y]
2,182,003 3,913,353
Local district heat production from renewables [MWh/y]
2,752,317 16,635,427
Local decentralized heat production from renewables (solar, geoth. ,biomass) [MWh/y]
2,699,110 5,609,383
Renewable sources in transport sector [MWh/y]
79,336 1,099,716
Total Local energy production from renewables [MWh/y]
7,712,766 27,257,879
Increase of Local energy production using renewables from baseline to monitoring
inventory 253%
The steady increase of the share of renewables in the Covenant of Mayors signatories
reflects the following combining trends (Figure 11):
Local electricity production from renewables increased 79% in monitoring years in
comparison to inventory years;
Local district heat production from renewables increased around five times in monitoring years in comparison to inventory years;
Local decentralized heat production from renewables (solar, geoth. ,biomass)
increased around two times in monitoring years in comparison to inventory years;
Renewable energy in transport sector increased around 13 times
26
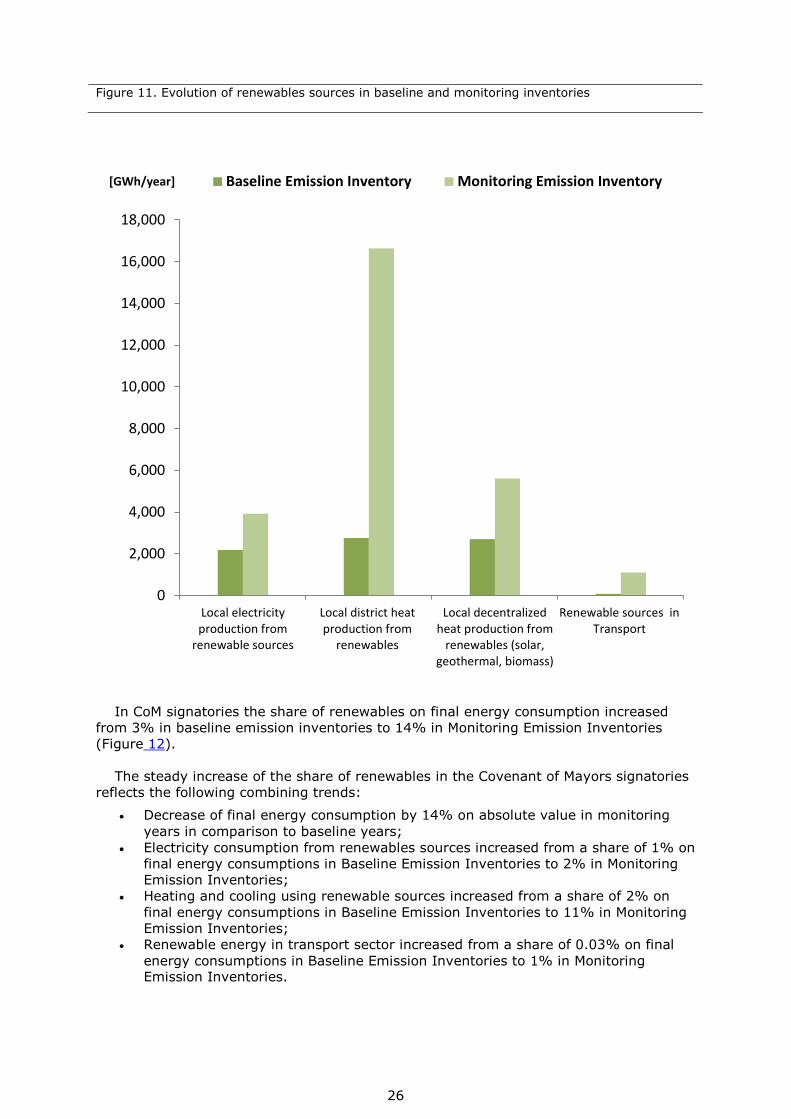
Figure 11. Evolution of renewables sources in baseline and monitoring inventories
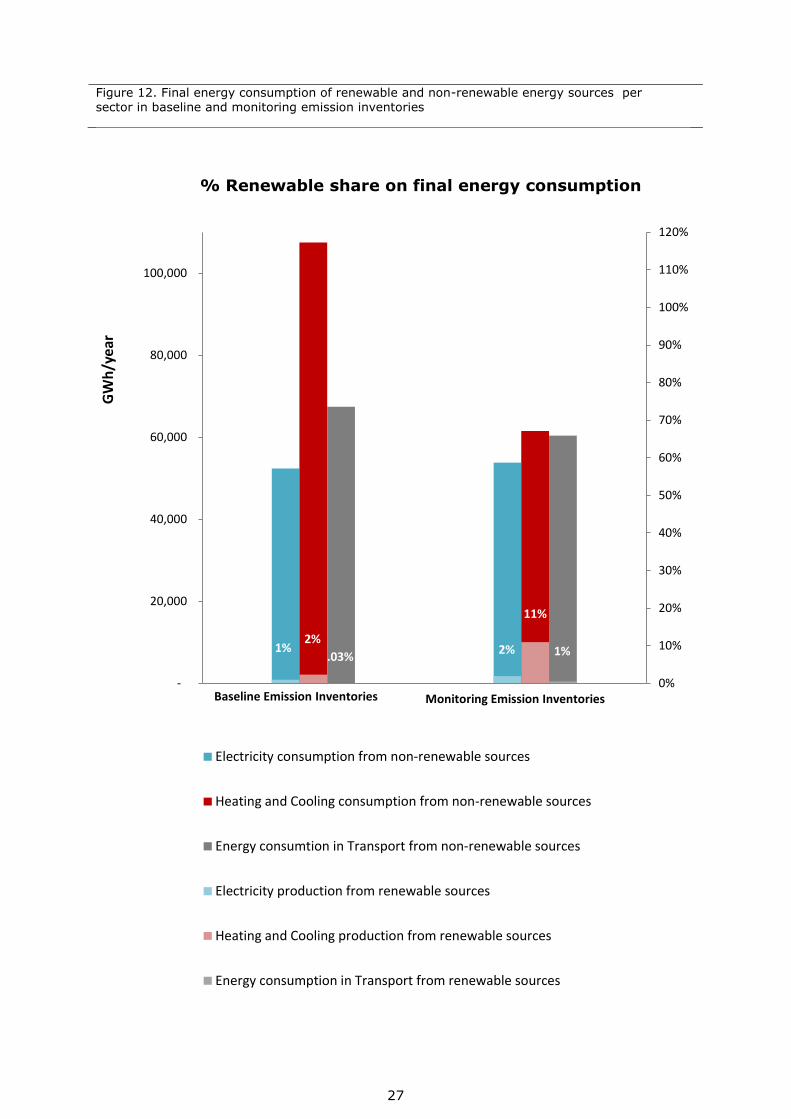
In CoM signatories the share of renewables on final energy consumption increased
from 3% in baseline emission inventories to 14% in Monitoring Emission Inventories
(Figure 12).
The steady increase of the share of renewables in the Covenant of Mayors signatories
reflects the following combining trends:
Decrease of final energy consumption by 14% on absolute value in monitoring
years in comparison to baseline years;
Electricity consumption from renewables sources increased from a share of 1% on
final energy consumptions in Baseline Emission Inventories to 2% in Monitoring
Emission Inventories;
Heating and cooling using renewable sources increased from a share of 2% on
final energy consumptions in Baseline Emission Inventories to 11% in Monitoring
Emission Inventories;
Renewable energy in transport sector increased from a share of 0.03% on final
energy consumptions in Baseline Emission Inventories to 1% in Monitoring Emission Inventories.
0
2,000
4,000
6,000
8,000
10,000
12,000
14,000
16,000
18,000
Local electricityproduction from
renewable sources
Local district heatproduction from
renewables
Local decentralizedheat production from
renewables (solar,geothermal, biomass)
Renewable sources inTransport
[GWh/year] Baseline Emission Inventory Monitoring Emission Inventory
27
Figure 12. Final energy consumption of renewable and non-renewable energy sources per sector in baseline and monitoring emission inventories
1% 2% 2%
11%
.03% 1%
0%
10%
20%
30%
40%
50%
60%
70%
80%
90%
100%
110%
120%
-
20,000
40,000
60,000
80,000
100,000
GW
h/y
ear
Electricity consumption from non-renewable sources
Heating and Cooling consumption from non-renewable sources
Energy consumtion in Transport from non-renewable sources
Electricity production from renewable sources
Heating and Cooling production from renewable sources
Energy consumption in Transport from renewable sources
% Renewable share on final energy consumption
Baseline Emission Inventories Monitoring Emission Inventories
28
Conclusion
The "Covenant of Mayors: Monitoring Indicators" report provides an assessment of
progress made by local authorities, signatories of Covenant of Mayors initiative as of
September 2015 towards their climate mitigation and energy targets.
As of September 2015, almost six thousand local authorities have signed the CoM, for
a total of ca. 208 million inhabitants in the whole initiative. More than 4 500 local
authorities have submitted an action plan (Sustainable Energy Action Plan) for a total of
ca. 166 million. Out of these, 122 signatories, representing 3% of the signatories with an
action plan, have submitted a monitoring report including a monitoring emission
inventory for a total ca. 11 million inhabitants. Only 45 out of 418 signatories (11%)
required submitting a monitoring report as of September 2015 have reported the full
progress report.
Taking into account the harmonized definition of degree of urbanization of Local
Administrative Units for Europe by OECD and European Commission (2012), CoM
signatories in the data set were classified into categories according to those definitions.
This harmonised dataset allows enhancing the understanding of key factors that affect
urban energy and environmental systems such as climate, population density, economic factors etc.
More than a third of the CoM signatories with a submitted monitoring report as of
September 2015 (34%) are densely populated areas i.e. cities or large urban areas,
representing 85% of the sample in terms of population. While the majority, 44%, in
terms of numbers of the CoM signatories with a submitted monitoring report as of
September 2015 are intermediate populated areas i.e. small urban areas, representing 11% of the sample in terms of population.
Monitoring inventories enable to track the evolution of GHG emissions in local
authorities' territories as well as changes in energy consumption patterns, and to
compare estimated impacts of the actions against actual results. Main statistical
indicators based on data provided by Covenant of Mayors signatories in the monitoring reports submitted as of September 2015 are reported in the following:
GHG emissions: although the minimum commitment was to reduce the current
emissions by 20% by 2020, CoM signatories who have already submitted the progress
report, i.e. a monitoring inventory reached an overall reduction of 23% between
baseline and monitoring emission inventories. Progress towards the GHG target is substantial and more pronounced than for the renewable energy and energy efficiency.
o lower energy consumption levels and less carbon intensive fuel mix in the
building sector (46% absolute reduction for heating and cooling encouraged
in part by energy efficiency improvement and increase of renewable shares);
o more efficient and less carbon intensive fuel mix of national electrical grids
(although the electricity consumption increased by 6% in absolute value, the
related emissions drop by 10%);
o more efficient and less carbon intensive transportation (emission in the
transport sector decrease by 9% from baseline to monitoring years).
Energy efficiency: The Covenant of Mayors signatories have been reducing their
final energy consumptions. Compared to the baseline inventories, final energy
consumptions have dropped by 14% on absolute value. The decrease in final energy
consumptions between baseline and monitoring years was driven by:
o energy efficiency improvement in buildings for heating and cooling (26% of
decrease). In the monitoring phase the energy management systems is the
major policy instrument used by local authorities to reach the 2020 energy
and climate targets. Furthermore, some Covenant signatories use building
29
code to impose more stringent energy performance requirements than those
applicable at national level. In addition, thanks to a close collaboration
between utilities and local governments for the development sustainable
energy systems, CoM signatories have been able to implement measures
related to energy efficiency in district heating networks;
o more efficient transportation, i.e. energy consumption in transport sector
decrease by 9% from baseline to monitoring years. In the transport sector
the gradual transformation to more efficient vehicles is one of the major area
of intervention in CoM local authorities, followed by modal shift to walking
and cycling and by modal shift to public transport.
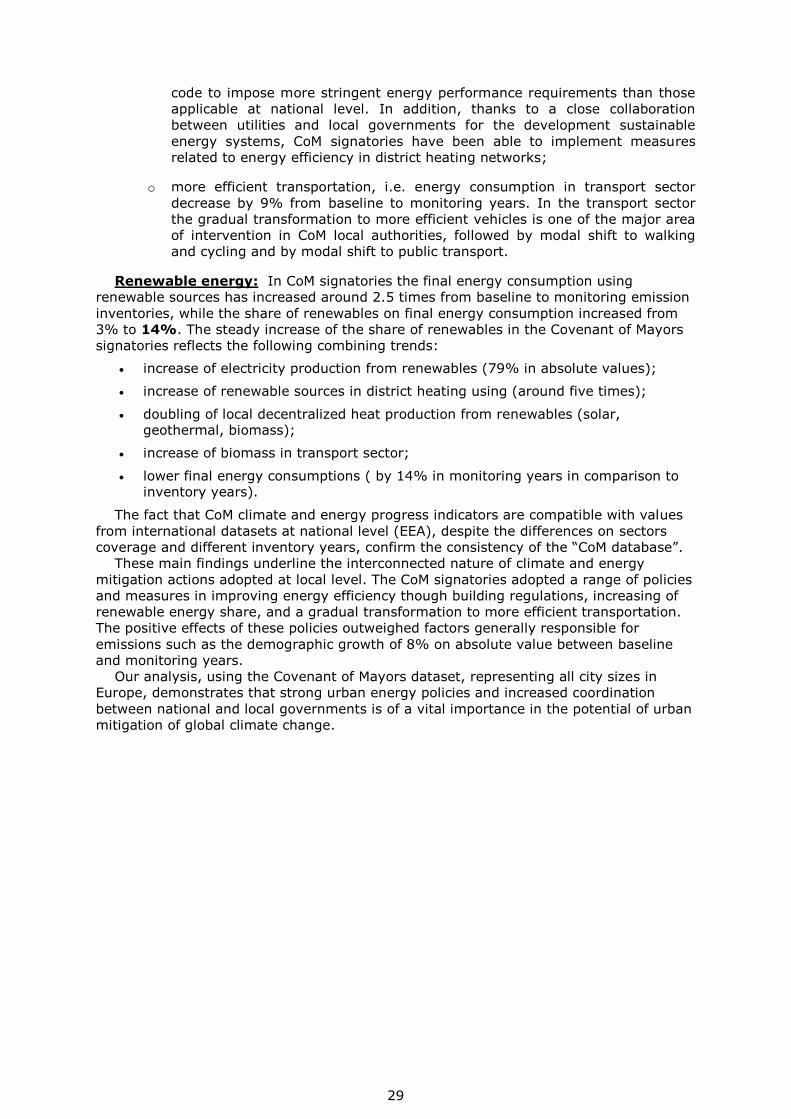
Renewable energy: In CoM signatories the final energy consumption using
renewable sources has increased around 2.5 times from baseline to monitoring emission
inventories, while the share of renewables on final energy consumption increased from
3% to 14%. The steady increase of the share of renewables in the Covenant of Mayors
signatories reflects the following combining trends:
increase of electricity production from renewables (79% in absolute values);
increase of renewable sources in district heating using (around five times);
doubling of local decentralized heat production from renewables (solar, geothermal, biomass);
increase of biomass in transport sector;
lower final energy consumptions ( by 14% in monitoring years in comparison to inventory years).
The fact that CoM climate and energy progress indicators are compatible with values
from international datasets at national level (EEA), despite the differences on sectors
coverage and different inventory years, confirm the consistency of the “CoM database”.
These main findings underline the interconnected nature of climate and energy
mitigation actions adopted at local level. The CoM signatories adopted a range of policies
and measures in improving energy efficiency though building regulations, increasing of
renewable energy share, and a gradual transformation to more efficient transportation.
The positive effects of these policies outweighed factors generally responsible for
emissions such as the demographic growth of 8% on absolute value between baseline
and monitoring years.
Our analysis, using the Covenant of Mayors dataset, representing all city sizes in
Europe, demonstrates that strong urban energy policies and increased coordination
between national and local governments is of a vital importance in the potential of urban
mitigation of global climate change.

30
References
Bertoldi P., Bornás Cayuela D., Monni S., Raveschoot Piers R. de,. JRC Science and Policy
Report . Guidebook: How to develop a sustainable energy action plan (SEAP).
http://iet.jrc.ec.europa.eu/energyefficiency/publication/guidebook-how-develop-
sustainable-energy-action-plan, 2010.
Cerutti A.K., Iancu A., Janssens-Maenhout G., Melica G., Paina F., Bertoldi P. Covenant
of Mayors in figures 5 – Years Assessment. EUR 25992. JRC Reference Report, EC,
Publication Office of the European Union , 2013, 52pp.
Christoforidis G.C, Chatzisavvas K. C., Lazarou S., and Parisses C. “Covenant of Mayors
initiative – Public perception issues and barriers in Greece.” (Energy Policy) 2013.
City Växjö. Energy plan for the City of Växjö.
http://www.covenantofmayors.eu/index_en.html
Dall’O’ G., Norese M.F., Galante A., Novello C. “A Multi-Criteria Methodology to Support
Pubblic Administration Decision Making Concerning Sustainable Energy Action Plans.”
(Energies) 6:4308-4330 (2013).
Doukas H., Papadopoulou A., Savvakis N., Tsoutsos T., Psarras J. “Assessing energy
sustainability of rural communities using Principal Component Analysis.” (Renewable and
Sustainable Energy Reviews) 16, no. 4 (2012): 1949–1957.
Dijkstra L. and Poelman H.. Cities in Europe. The new OECD-EC Definition.
http://ec.europa.eu/regional_policy/sources/docgener/focus/2012_01_city.pdf, 2012.
Energy Efficiency Directive 2012/27/EU , 2012
EEA 2015: Trends and Projections in Europe 2015: Tracking progress towards Europe's
climate and energy target
Green City Freiburg : http://www.covenantofmayors.eu/index_en.html
Hoornweg D., Sugar L., Gomez C. L. T. “Cities and greenhouse gas emissions: moving
forward.” (Environ. Urban.) 23 (1), 207–227. (2011).
Iancu A., Cerutti A., Janssens Maenhout G., Gabrielaitiene I., Paina F., Melica G.,
Zancanella P., Bertoldi P.,. How to develop a sustainable energy action plan (SEAP) in
the eastern partnership and central asian cities - Guidebook: PART II - Baseline emission
inventories. Scientific and Technical Reports, EUR 25804 EN, Publications Office of the
European Union, 2013.
Janssens-Maenhout G., Dentener F., Van Aardenne J., Monni S., Pagliari V., Orlandini L.,
Klimont Z., Kurokawa J., Akimoto H., Ohara T., Wankmueller R., Battye B., Grano D.,
Zuber A., Keating T. EDGAR-HTAP: a Harmonized Gridded Air Pollution Emission Dataset
Based on National Inventories.EUR 25229 EN. JRC Scientific and Technical Report , Ispra
(Italy): European Commission Publications Office, 2012.
Jelgava: SEAP of Jelgava. http://www.covenantofmayors.eu/index_en.html
Kona A., G. Melica, I. Gabrielaitiene, S. Rivas Calvete, P. Zancanella, A. Iancu,
G.Janssens-Manhout, P. Bertoldi. Covenant of Mayors: Fuel Switch and Sustainable
Demand in signatories from "stress test" countries. EUR 26951 EN. JRC Science and
Policy Report, Publications Office of the European Union, 2014.
Kona A., Melica G., Rivas Calvete S., Zancanella P., Iancu A., Gabrielaitiene I., Saheb Y., Janssens-Manhout G., Bertoldi P. Covenant of Mayors in Figures and Performance Indicators – 6-year Assessment. JRC Science and Policy Report. EUR 27110 EN, Publications Office of the European Union, 2014.
Kona A., Iancu A., Cerutti AK., Ganisheva K., Janssens-Maenhout G., Melica G., Rivas
Calvete S., Gabrielaitiene I., Zancanella P., Bertoldi P. “Reducing Greenhouse Gases
Emissions through Sustainable Energy Action Plans at Local Level: The Common Platform
Proposed by the Covenant of Mayors Initiative and its Potential Impact in the South East
European Region.” 1st South East Europe Conference on Sustainable Development of

31
Energy, Water and Environment Systems, SEE SDEWES2014: Books of Abstracts.
SDEWES, 2014.
Kona A, Melica G, Bertoldi P, Zancanella P, Rivas Calvete S, Iancu A, Janssens-Maenhout
G. The covenant of mayors initiative: transition to an energy efficient low carbon future.
eceee 2015 Summer Study - First fuel now; ECEEE (Organiser). ECEEE; 2015.
JRC95863
Kona A, Bertoldi P, Kilkis S, Pagani R. Proceeding of the Workshop "Benchmarking
Energy Sustainability in Cities" . Publications Office of the European Union; EUR 27267.
2015. JRC94838
Melica G., Bertoldi P., Kona A., Rivas Calvete S., Zancanella P.,Janssens-Maenhout G.,
Cerutti AK., Iancu A., Ganisheva K. “The Covenant of Mayor Initiative: An Assessment
and Evaluation.” ACEEE Summer Study on Energy Efficiency in Buildings. ACEEE, 2014.
Melica G., Zancanella P., Kona A., Rivas Calvete S., Gabrielaitiene I., Iancu A., Bertoldi
P. “The role of regions and provinces to support the participation of small local
authorities in the Covenant of Mayors.” 13th IAEE European Conference. Rome, Italy,
2014.
Raveschoot R. Piers de, Bornás Cayuela D., Bertoldi P., Monni S. “Review of
Methodologies for the Development of Sustainable Energy Action Plans in the Frame of
the Covenant of Mayors.” ACEEE Summer study oon Energy Efficiency of Buildings.
ACEEE, 2010.
Rivas S., Melica G., Kona A., Zancanella P., Serrenho S., Iancu A., Koffi B.,
Gabrielaitiene I., Janssens-Maenhout G., Bertoldi P.. The Covenant of Mayors: In-depth
Analysis of Sustainable Energy Action Plans . EUR 27526. Luxembourg (Luxembourg):
Publications Office of the European Union; 2015. JRC95656

32
List of abbreviations and definitions
BEI Baseline Emission Inventory
CH4 Methane
CHP Combined Heat and Power
CO2–eq CO2 – equivalents
CoM Covenant of Mayors
EU European Union
GHG Greenhouse gases
IEA International Energy Agency
IPCC Intergovernmental Panel on Climate Change
LCA Life Cycle Assessment
MS Member States
PV photovoltaic
RES Renewable Energy Source
SEAP Sustainable Energy Action Plan
UNFCCC United Nations Framework Convention on Climate Change
UNDP United Nations Development Programme
33
List of figures
Figure 1. Covenant of Mayors signatories with a monitoring report per country ............. 6 Figure 2. Share of monitoring reports on number of SEAPs submitted .......................... 8 Figure 3. Covenant of Mayors signatories with monitoring reports and degree of
urbanization ....................................................................................................... 11 Figure 4. Reference years in baseline and monitoring emission inventories ................. 12 Figure 5. Evolution of GHG emission per sector from baseline to monitoring emission
inventories ......................................................................................................... 14 Figure 6. Final energy consumptions per sector in baseline and monitoring emission
inventories ......................................................................................................... 16 Figure 7. Shares of electricity consumptions and production on final energy consumption
in baseline and monitoring emission inventories ...................................................... 18 Figure 8. Heating and cooling consumption in Building sector per type of fuel/carrier in
baseline and monitoring inventories ...................................................................... 20 Figure 9. Shares of heating and cooling consumption and production on final energy
consumptions in baseline and monitoring inventories ............................................... 22 Figure 10. Energy consumption in transport sector per type of fuel/carrier in baseline
and monitoring inventories ................................................................................... 24 Figure 11. Evolution of renewables sources in baseline and monitoring inventories ...... 26 Figure 12. Final energy consumption of renewable and non-renewable energy sources
per sector in baseline and monitoring emission inventories ....................................... 27

34
List of tables
Table 1. CoM signatories and submitted SEAPs per region .......................................... 5 Table 2. CoM signatories with a submitted baseline and monitoring emission inventory .. 7 Table 3. Dynamics of population from baseline to monitoring emission inventories ...... 10 Table 4. Per capita reduction of GHG emissions from baseline to monitoring emission
inventories ......................................................................................................... 13 Table 5. Evolution of final energy consumptions from baseline to monitoring emission
inventories ......................................................................................................... 15 Table 6. Evolution of electricity consumption from baseline to monitoring emission
inventories ......................................................................................................... 17 Table 7. Evolution of local electricity production from baseline to monitoring emission
inventories ......................................................................................................... 17 Table 8. Evolution of final energy consumptions for heating and cooling from baseline to
monitoring emission inventories ............................................................................ 19 Table 9. Evolution of local heating and cooling production from baseline to monitoring
emission inventories ............................................................................................ 21 Table 10. Energy consumption in transport sector in baseline and monitoring emission
inventories ......................................................................................................... 23 Table 11. Progress on renewable sources from baseline to monitoring inventories ....... 25 Table 12. Harmonised dataset of CoM signatories with monitoring reports submitted as
of September 2015.............................................................................................. 35
35
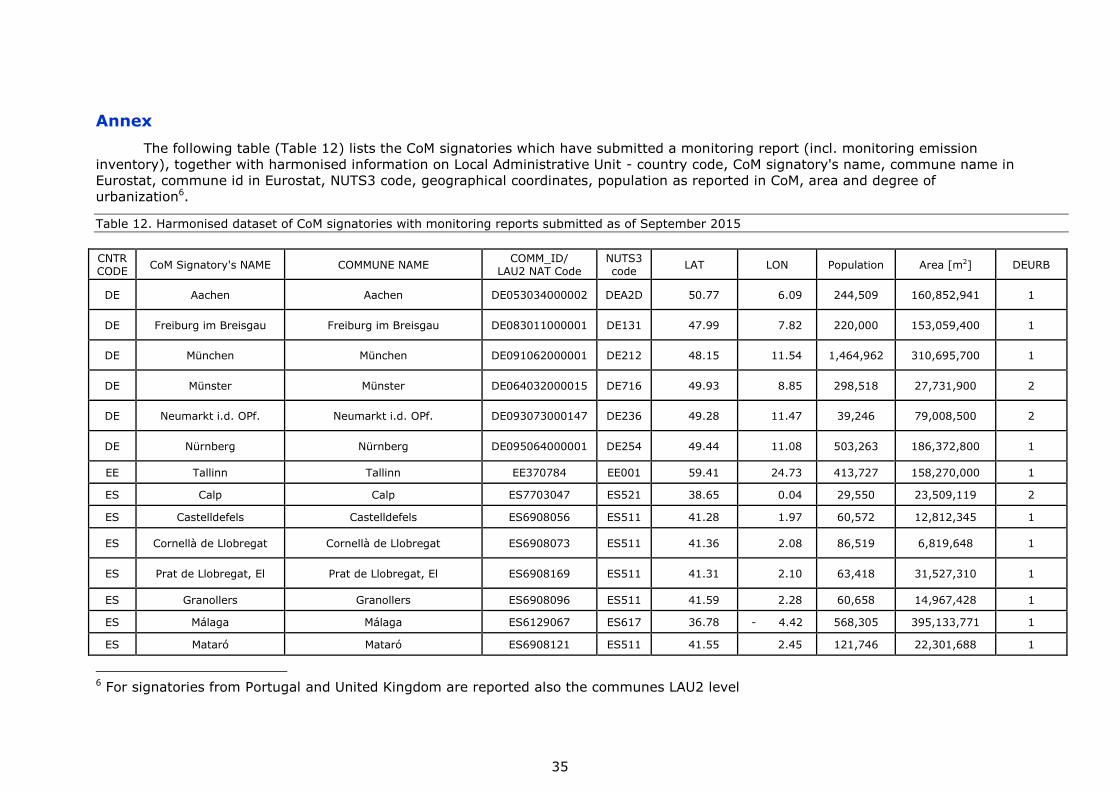
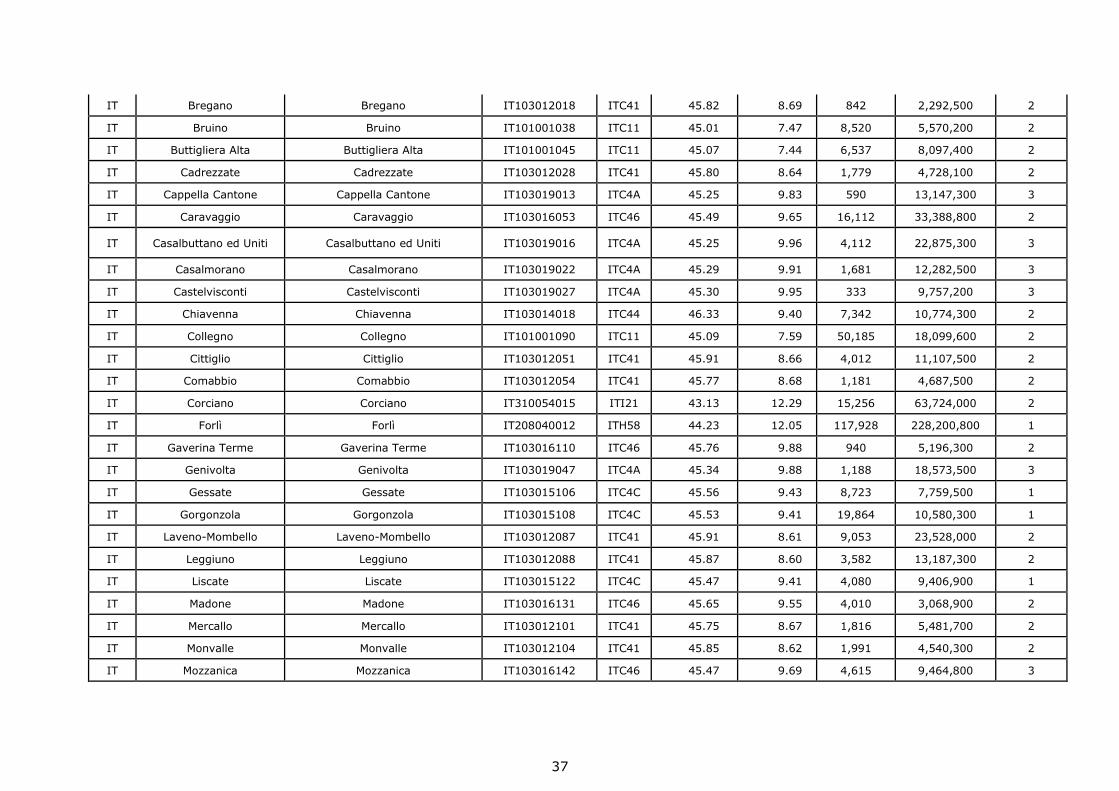
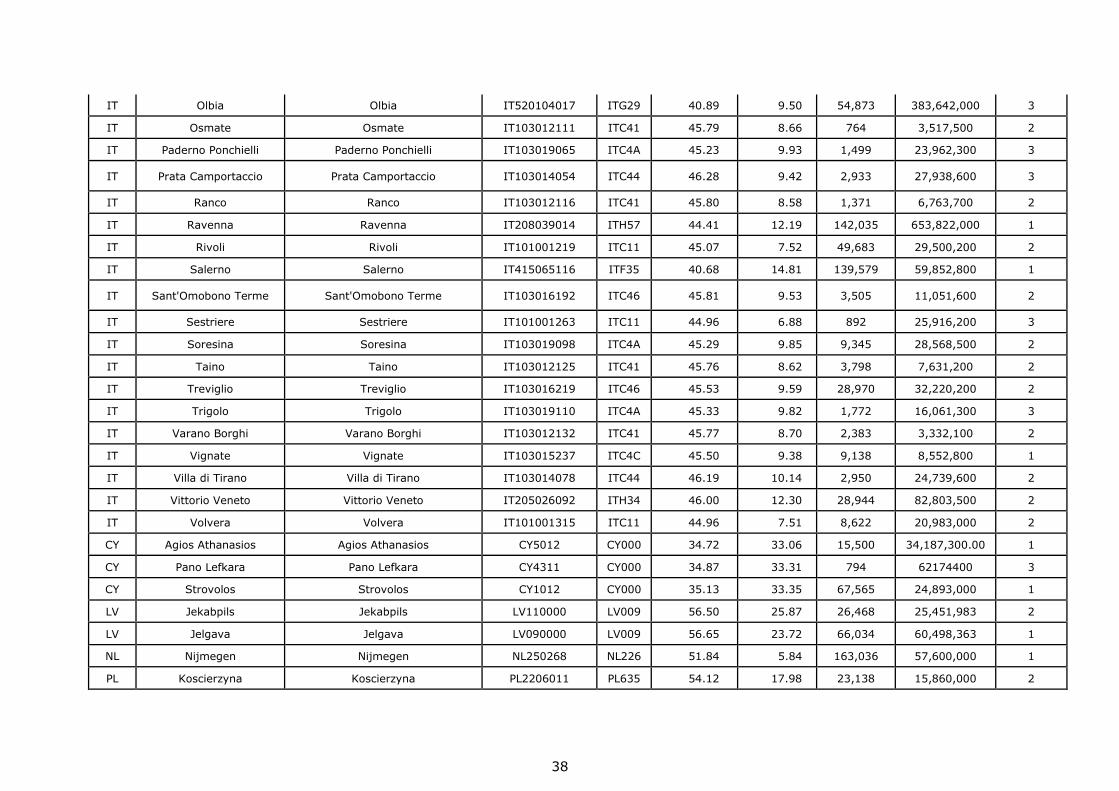
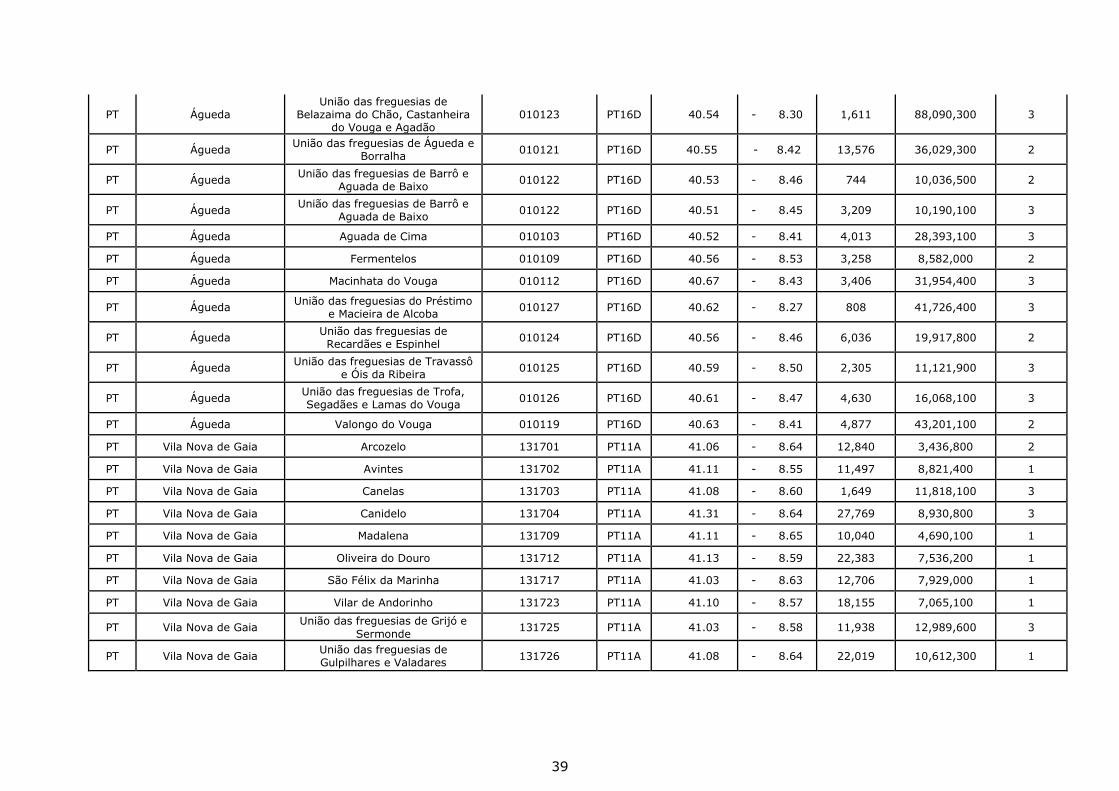
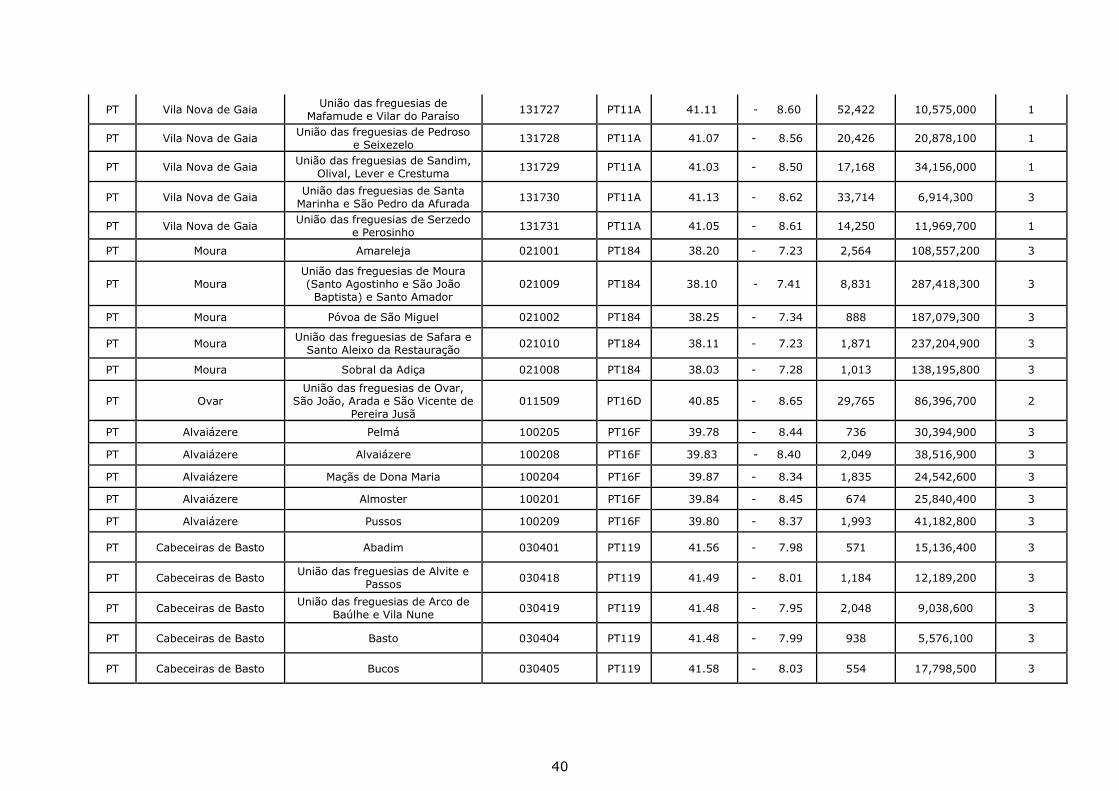
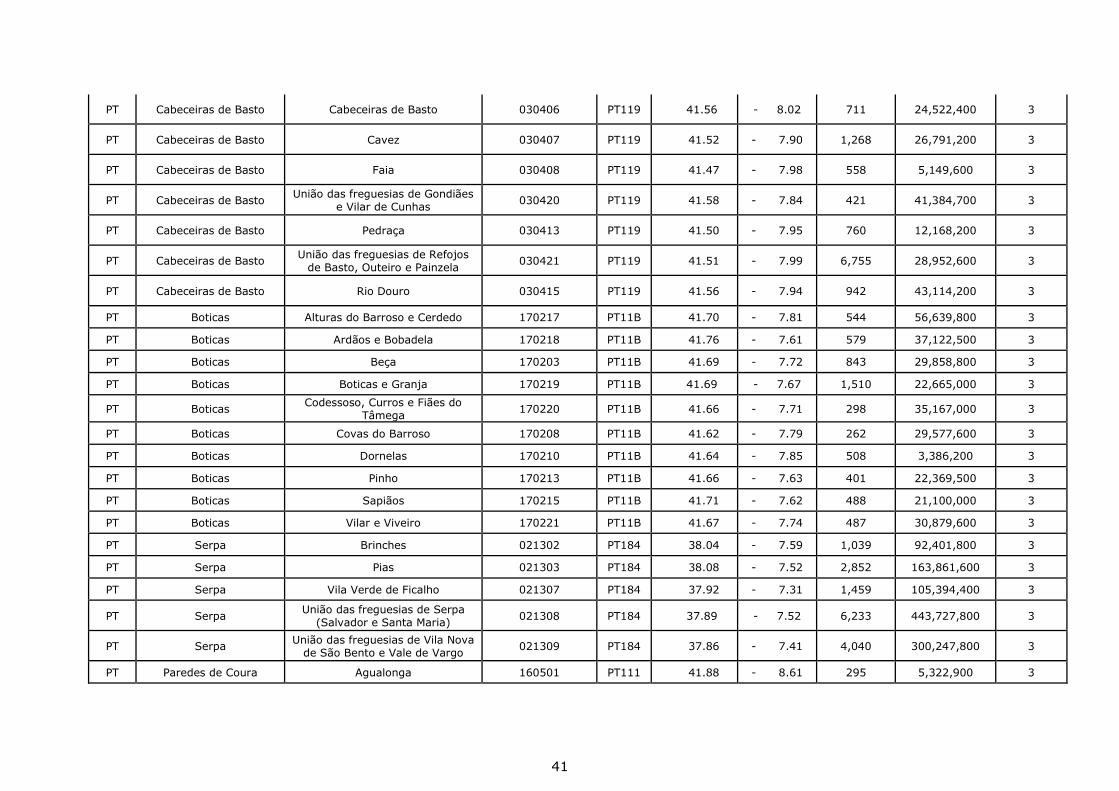
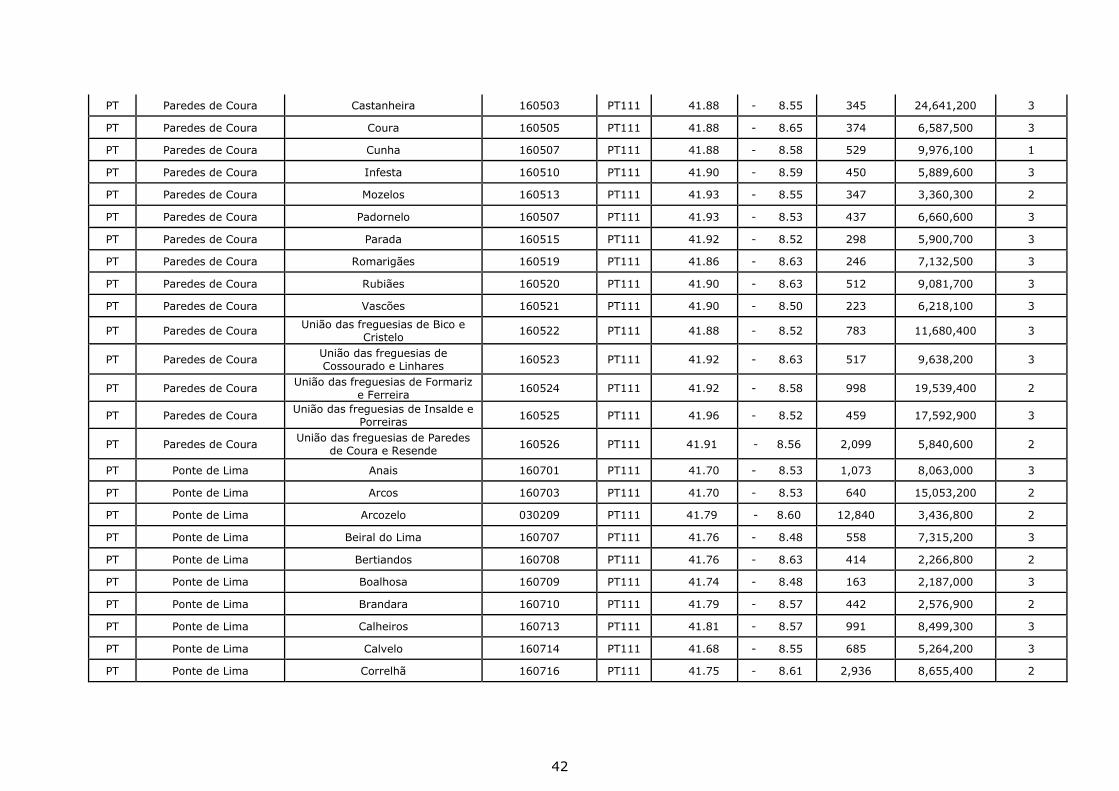
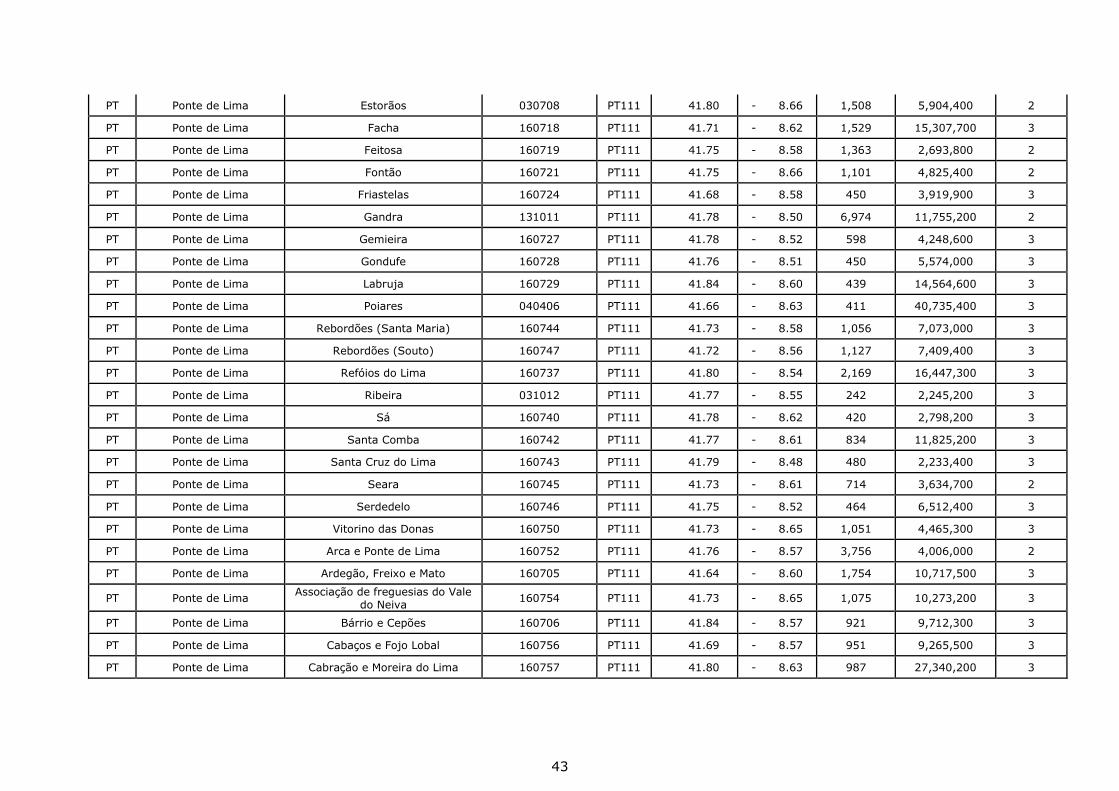
Annex
The following table (Table 12) lists the CoM signatories which have submitted a monitoring report (incl. monitoring emission
inventory), together with harmonised information on Local Administrative Unit - country code, CoM signatory's name, commune name in
Eurostat, commune id in Eurostat, NUTS3 code, geographical coordinates, population as reported in CoM, area and degree of
urbanization6.
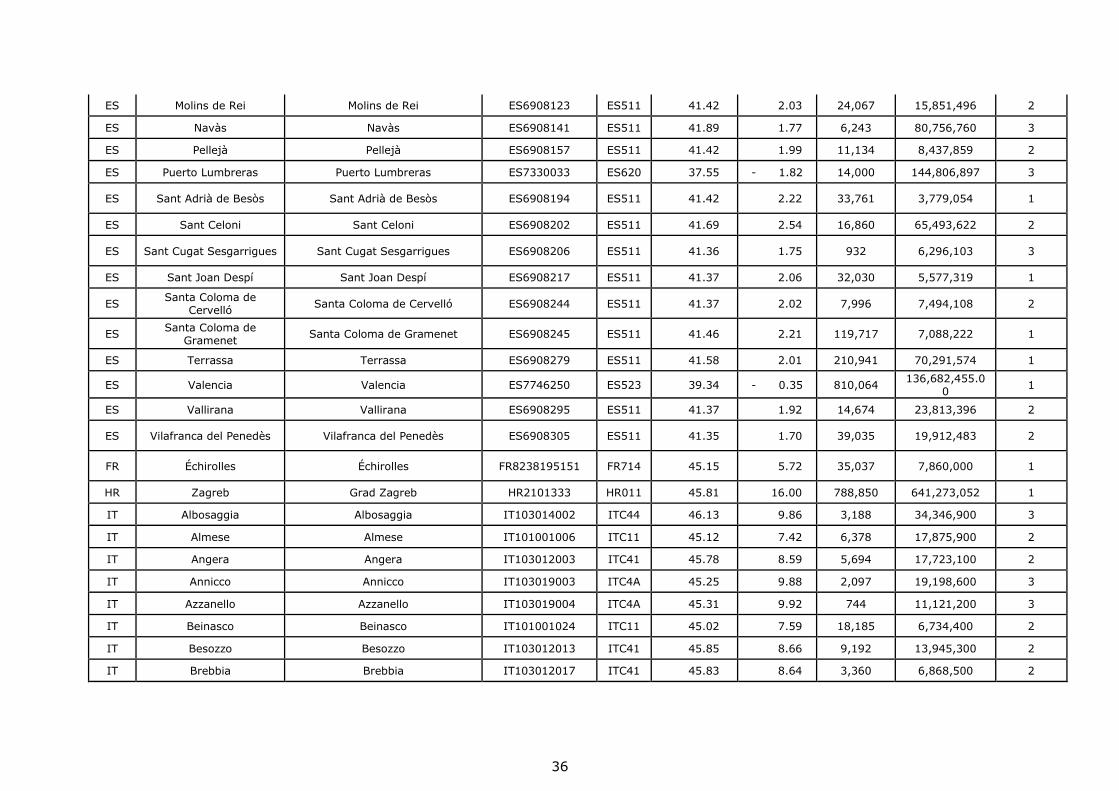
Table 12. Harmonised dataset of CoM signatories with monitoring reports submitted as of September 2015
CNTR CODE
CoM Signatory's NAME COMMUNE NAME COMM_ID/
LAU2 NAT Code NUTS3 code
LAT LON Population Area [m2] DEURB
DE Aachen Aachen DE053034000002 DEA2D 50.77 6.09 244,509 160,852,941 1
DE Freiburg im Breisgau Freiburg im Breisgau DE083011000001 DE131 47.99 7.82 220,000 153,059,400 1
DE München München DE091062000001 DE212 48.15 11.54 1,464,962 310,695,700 1
DE Münster Münster DE064032000015 DE716 49.93 8.85 298,518 27,731,900 2
DE Neumarkt i.d. OPf. Neumarkt i.d. OPf. DE093073000147 DE236 49.28 11.47 39,246 79,008,500 2
DE Nürnberg Nürnberg DE095064000001 DE254 49.44 11.08 503,263 186,372,800 1
EE Tallinn Tallinn EE370784 EE001 59.41 24.73 413,727 158,270,000 1
ES Calp Calp ES7703047 ES521 38.65 0.04 29,550 23,509,119 2
ES Castelldefels Castelldefels ES6908056 ES511 41.28 1.97 60,572 12,812,345 1
ES Cornellà de Llobregat Cornellà de Llobregat ES6908073 ES511 41.36 2.08 86,519 6,819,648 1
ES Prat de Llobregat, El Prat de Llobregat, El ES6908169 ES511 41.31 2.10 63,418 31,527,310 1
ES Granollers Granollers ES6908096 ES511 41.59 2.28 60,658 14,967,428 1
ES Málaga Málaga ES6129067 ES617 36.78 - 4.42 568,305 395,133,771 1
ES Mataró Mataró ES6908121 ES511 41.55 2.45 121,746 22,301,688 1
6 For signatories from Portugal and United Kingdom are reported also the communes LAU2 level
36
ES Molins de Rei Molins de Rei ES6908123 ES511 41.42 2.03 24,067 15,851,496 2
ES Navàs Navàs ES6908141 ES511 41.89 1.77 6,243 80,756,760 3
ES Pellejà Pellejà ES6908157 ES511 41.42 1.99 11,134 8,437,859 2
ES Puerto Lumbreras Puerto Lumbreras ES7330033 ES620 37.55 - 1.82 14,000 144,806,897 3
ES Sant Adrià de Besòs Sant Adrià de Besòs ES6908194 ES511 41.42 2.22 33,761 3,779,054 1
ES Sant Celoni Sant Celoni ES6908202 ES511 41.69 2.54 16,860 65,493,622 2
ES Sant Cugat Sesgarrigues Sant Cugat Sesgarrigues ES6908206 ES511 41.36 1.75 932 6,296,103 3
ES Sant Joan Despí Sant Joan Despí ES6908217 ES511 41.37 2.06 32,030 5,577,319 1
ES Santa Coloma de
Cervelló Santa Coloma de Cervelló ES6908244 ES511 41.37 2.02 7,996 7,494,108 2
ES Santa Coloma de
Gramenet Santa Coloma de Gramenet ES6908245 ES511 41.46 2.21 119,717 7,088,222 1
ES Terrassa Terrassa ES6908279 ES511 41.58 2.01 210,941 70,291,574 1
ES Valencia Valencia ES7746250 ES523 39.34 - 0.35 810,064 136,682,455.0
0 1
ES Vallirana Vallirana ES6908295 ES511 41.37 1.92 14,674 23,813,396 2
ES Vilafranca del Penedès Vilafranca del Penedès ES6908305 ES511 41.35 1.70 39,035 19,912,483 2
FR Échirolles Échirolles FR8238195151 FR714 45.15 5.72 35,037 7,860,000 1
HR Zagreb Grad Zagreb HR2101333 HR011 45.81 16.00 788,850 641,273,052 1
IT Albosaggia Albosaggia IT103014002 ITC44 46.13 9.86 3,188 34,346,900 3
IT Almese Almese IT101001006 ITC11 45.12 7.42 6,378 17,875,900 2
IT Angera Angera IT103012003 ITC41 45.78 8.59 5,694 17,723,100 2
IT Annicco Annicco IT103019003 ITC4A 45.25 9.88 2,097 19,198,600 3
IT Azzanello Azzanello IT103019004 ITC4A 45.31 9.92 744 11,121,200 3
IT Beinasco Beinasco IT101001024 ITC11 45.02 7.59 18,185 6,734,400 2
IT Besozzo Besozzo IT103012013 ITC41 45.85 8.66 9,192 13,945,300 2
IT Brebbia Brebbia IT103012017 ITC41 45.83 8.64 3,360 6,868,500 2
37
IT Bregano Bregano IT103012018 ITC41 45.82 8.69 842 2,292,500 2
IT Bruino Bruino IT101001038 ITC11 45.01 7.47 8,520 5,570,200 2
IT Buttigliera Alta Buttigliera Alta IT101001045 ITC11 45.07 7.44 6,537 8,097,400 2
IT Cadrezzate Cadrezzate IT103012028 ITC41 45.80 8.64 1,779 4,728,100 2
IT Cappella Cantone Cappella Cantone IT103019013 ITC4A 45.25 9.83 590 13,147,300 3
IT Caravaggio Caravaggio IT103016053 ITC46 45.49 9.65 16,112 33,388,800 2
IT Casalbuttano ed Uniti Casalbuttano ed Uniti IT103019016 ITC4A 45.25 9.96 4,112 22,875,300 3
IT Casalmorano Casalmorano IT103019022 ITC4A 45.29 9.91 1,681 12,282,500 3
IT Castelvisconti Castelvisconti IT103019027 ITC4A 45.30 9.95 333 9,757,200 3
IT Chiavenna Chiavenna IT103014018 ITC44 46.33 9.40 7,342 10,774,300 2
IT Collegno Collegno IT101001090 ITC11 45.09 7.59 50,185 18,099,600 2
IT Cittiglio Cittiglio IT103012051 ITC41 45.91 8.66 4,012 11,107,500 2
IT Comabbio Comabbio IT103012054 ITC41 45.77 8.68 1,181 4,687,500 2
IT Corciano Corciano IT310054015 ITI21 43.13 12.29 15,256 63,724,000 2
IT Forlì Forlì IT208040012 ITH58 44.23 12.05 117,928 228,200,800 1
IT Gaverina Terme Gaverina Terme IT103016110 ITC46 45.76 9.88 940 5,196,300 2
IT Genivolta Genivolta IT103019047 ITC4A 45.34 9.88 1,188 18,573,500 3
IT Gessate Gessate IT103015106 ITC4C 45.56 9.43 8,723 7,759,500 1
IT Gorgonzola Gorgonzola IT103015108 ITC4C 45.53 9.41 19,864 10,580,300 1
IT Laveno-Mombello Laveno-Mombello IT103012087 ITC41 45.91 8.61 9,053 23,528,000 2
IT Leggiuno Leggiuno IT103012088 ITC41 45.87 8.60 3,582 13,187,300 2
IT Liscate Liscate IT103015122 ITC4C 45.47 9.41 4,080 9,406,900 1
IT Madone Madone IT103016131 ITC46 45.65 9.55 4,010 3,068,900 2
IT Mercallo Mercallo IT103012101 ITC41 45.75 8.67 1,816 5,481,700 2
IT Monvalle Monvalle IT103012104 ITC41 45.85 8.62 1,991 4,540,300 2
IT Mozzanica Mozzanica IT103016142 ITC46 45.47 9.69 4,615 9,464,800 3
38
IT Olbia Olbia IT520104017 ITG29 40.89 9.50 54,873 383,642,000 3
IT Osmate Osmate IT103012111 ITC41 45.79 8.66 764 3,517,500 2
IT Paderno Ponchielli Paderno Ponchielli IT103019065 ITC4A 45.23 9.93 1,499 23,962,300 3
IT Prata Camportaccio Prata Camportaccio IT103014054 ITC44 46.28 9.42 2,933 27,938,600 3
IT Ranco Ranco IT103012116 ITC41 45.80 8.58 1,371 6,763,700 2
IT Ravenna Ravenna IT208039014 ITH57 44.41 12.19 142,035 653,822,000 1
IT Rivoli Rivoli IT101001219 ITC11 45.07 7.52 49,683 29,500,200 2
IT Salerno Salerno IT415065116 ITF35 40.68 14.81 139,579 59,852,800 1
IT Sant'Omobono Terme Sant'Omobono Terme IT103016192 ITC46 45.81 9.53 3,505 11,051,600 2
IT Sestriere Sestriere IT101001263 ITC11 44.96 6.88 892 25,916,200 3
IT Soresina Soresina IT103019098 ITC4A 45.29 9.85 9,345 28,568,500 2
IT Taino Taino IT103012125 ITC41 45.76 8.62 3,798 7,631,200 2
IT Treviglio Treviglio IT103016219 ITC46 45.53 9.59 28,970 32,220,200 2
IT Trigolo Trigolo IT103019110 ITC4A 45.33 9.82 1,772 16,061,300 3
IT Varano Borghi Varano Borghi IT103012132 ITC41 45.77 8.70 2,383 3,332,100 2
IT Vignate Vignate IT103015237 ITC4C 45.50 9.38 9,138 8,552,800 1
IT Villa di Tirano Villa di Tirano IT103014078 ITC44 46.19 10.14 2,950 24,739,600 2
IT Vittorio Veneto Vittorio Veneto IT205026092 ITH34 46.00 12.30 28,944 82,803,500 2
IT Volvera Volvera IT101001315 ITC11 44.96 7.51 8,622 20,983,000 2
CY Agios Athanasios Agios Athanasios CY5012 CY000 34.72 33.06 15,500 34,187,300.00 1
CY Pano Lefkara Pano Lefkara CY4311 CY000 34.87 33.31 794 62174400 3
CY Strovolos Strovolos CY1012 CY000 35.13 33.35 67,565 24,893,000 1
LV Jekabpils Jekabpils LV110000 LV009 56.50 25.87 26,468 25,451,983 2
LV Jelgava Jelgava LV090000 LV009 56.65 23.72 66,034 60,498,363 1
NL Nijmegen Nijmegen NL250268 NL226 51.84 5.84 163,036 57,600,000 1
PL Koscierzyna Koscierzyna PL2206011 PL635 54.12 17.98 23,138 15,860,000 2
39
PT Águeda União das freguesias de
Belazaima do Chão, Castanheira do Vouga e Agadão
010123 PT16D 40.54 - 8.30 1,611 88,090,300 3
PT Águeda União das freguesias de Águeda e
Borralha 010121 PT16D 40.55 - 8.42 13,576 36,029,300 2
PT Águeda União das freguesias de Barrô e
Aguada de Baixo 010122 PT16D 40.53 - 8.46 744 10,036,500 2
PT Águeda União das freguesias de Barrô e
Aguada de Baixo 010122 PT16D 40.51 - 8.45 3,209 10,190,100 3
PT Águeda Aguada de Cima 010103 PT16D 40.52 - 8.41 4,013 28,393,100 3
PT Águeda Fermentelos 010109 PT16D 40.56 - 8.53 3,258 8,582,000 2
PT Águeda Macinhata do Vouga 010112 PT16D 40.67 - 8.43 3,406 31,954,400 3
PT Águeda União das freguesias do Préstimo
e Macieira de Alcoba 010127 PT16D 40.62 - 8.27 808 41,726,400 3
PT Águeda União das freguesias de Recardães e Espinhel
010124 PT16D 40.56 - 8.46 6,036 19,917,800 2
PT Águeda União das freguesias de Travassô
e Óis da Ribeira 010125 PT16D 40.59 - 8.50 2,305 11,121,900 3
PT Águeda União das freguesias de Trofa, Segadães e Lamas do Vouga
010126 PT16D 40.61 - 8.47 4,630 16,068,100 3
PT Águeda Valongo do Vouga 010119 PT16D 40.63 - 8.41 4,877 43,201,100 2
PT Vila Nova de Gaia Arcozelo 131701 PT11A 41.06 - 8.64 12,840 3,436,800 2
PT Vila Nova de Gaia Avintes 131702 PT11A 41.11 - 8.55 11,497 8,821,400 1
PT Vila Nova de Gaia Canelas 131703 PT11A 41.08 - 8.60 1,649 11,818,100 3
PT Vila Nova de Gaia Canidelo 131704 PT11A 41.31 - 8.64 27,769 8,930,800 3
PT Vila Nova de Gaia Madalena 131709 PT11A 41.11 - 8.65 10,040 4,690,100 1
PT Vila Nova de Gaia Oliveira do Douro 131712 PT11A 41.13 - 8.59 22,383 7,536,200 1
PT Vila Nova de Gaia São Félix da Marinha 131717 PT11A 41.03 - 8.63 12,706 7,929,000 1
PT Vila Nova de Gaia Vilar de Andorinho 131723 PT11A 41.10 - 8.57 18,155 7,065,100 1
PT Vila Nova de Gaia União das freguesias de Grijó e
Sermonde 131725 PT11A 41.03 - 8.58 11,938 12,989,600 3
PT Vila Nova de Gaia União das freguesias de Gulpilhares e Valadares
131726 PT11A 41.08 - 8.64 22,019 10,612,300 1
40
PT Vila Nova de Gaia União das freguesias de
Mafamude e Vilar do Paraíso 131727 PT11A 41.11 - 8.60 52,422 10,575,000 1
PT Vila Nova de Gaia União das freguesias de Pedroso
e Seixezelo 131728 PT11A 41.07 - 8.56 20,426 20,878,100 1
PT Vila Nova de Gaia União das freguesias de Sandim,
Olival, Lever e Crestuma 131729 PT11A 41.03 - 8.50 17,168 34,156,000 1
PT Vila Nova de Gaia União das freguesias de Santa
Marinha e São Pedro da Afurada 131730 PT11A 41.13 - 8.62 33,714 6,914,300 3
PT Vila Nova de Gaia União das freguesias de Serzedo
e Perosinho 131731 PT11A 41.05 - 8.61 14,250 11,969,700 1
PT Moura Amareleja 021001 PT184 38.20 - 7.23 2,564 108,557,200 3
PT Moura União das freguesias de Moura (Santo Agostinho e São João
Baptista) e Santo Amador 021009 PT184 38.10 - 7.41 8,831 287,418,300 3
PT Moura Póvoa de São Miguel 021002 PT184 38.25 - 7.34 888 187,079,300 3
PT Moura União das freguesias de Safara e
Santo Aleixo da Restauração 021010 PT184 38.11 - 7.23 1,871 237,204,900 3
PT Moura Sobral da Adiça 021008 PT184 38.03 - 7.28 1,013 138,195,800 3
PT Ovar União das freguesias de Ovar,
São João, Arada e São Vicente de Pereira Jusã
011509 PT16D 40.85 - 8.65 29,765 86,396,700 2
PT Alvaiázere Pelmá 100205 PT16F 39.78 - 8.44 736 30,394,900 3
PT Alvaiázere Alvaiázere 100208 PT16F 39.83 - 8.40 2,049 38,516,900 3
PT Alvaiázere Maçãs de Dona Maria 100204 PT16F 39.87 - 8.34 1,835 24,542,600 3
PT Alvaiázere Almoster 100201 PT16F 39.84 - 8.45 674 25,840,400 3
PT Alvaiázere Pussos 100209 PT16F 39.80 - 8.37 1,993 41,182,800 3
PT Cabeceiras de Basto Abadim 030401 PT119 41.56 - 7.98 571 15,136,400 3
PT Cabeceiras de Basto União das freguesias de Alvite e
Passos 030418 PT119 41.49 - 8.01 1,184 12,189,200 3
PT Cabeceiras de Basto União das freguesias de Arco de
Baúlhe e Vila Nune 030419 PT119 41.48 - 7.95 2,048 9,038,600 3
PT Cabeceiras de Basto Basto 030404 PT119 41.48 - 7.99 938 5,576,100 3
PT Cabeceiras de Basto Bucos 030405 PT119 41.58 - 8.03 554 17,798,500 3
41
PT Cabeceiras de Basto Cabeceiras de Basto 030406 PT119 41.56 - 8.02 711 24,522,400 3
PT Cabeceiras de Basto Cavez 030407 PT119 41.52 - 7.90 1,268 26,791,200 3
PT Cabeceiras de Basto Faia 030408 PT119 41.47 - 7.98 558 5,149,600 3
PT Cabeceiras de Basto União das freguesias de Gondiães
e Vilar de Cunhas 030420 PT119 41.58 - 7.84 421 41,384,700 3
PT Cabeceiras de Basto Pedraça 030413 PT119 41.50 - 7.95 760 12,168,200 3
PT Cabeceiras de Basto União das freguesias de Refojos
de Basto, Outeiro e Painzela 030421 PT119 41.51 - 7.99 6,755 28,952,600 3
PT Cabeceiras de Basto Rio Douro 030415 PT119 41.56 - 7.94 942 43,114,200 3
PT Boticas Alturas do Barroso e Cerdedo 170217 PT11B 41.70 - 7.81 544 56,639,800 3
PT Boticas Ardãos e Bobadela 170218 PT11B 41.76 - 7.61 579 37,122,500 3
PT Boticas Beça 170203 PT11B 41.69 - 7.72 843 29,858,800 3
PT Boticas Boticas e Granja 170219 PT11B 41.69 - 7.67 1,510 22,665,000 3
PT Boticas Codessoso, Curros e Fiães do
Tâmega 170220 PT11B 41.66 - 7.71 298 35,167,000 3
PT Boticas Covas do Barroso 170208 PT11B 41.62 - 7.79 262 29,577,600 3
PT Boticas Dornelas 170210 PT11B 41.64 - 7.85 508 3,386,200 3
PT Boticas Pinho 170213 PT11B 41.66 - 7.63 401 22,369,500 3
PT Boticas Sapiãos 170215 PT11B 41.71 - 7.62 488 21,100,000 3
PT Boticas Vilar e Viveiro 170221 PT11B 41.67 - 7.74 487 30,879,600 3
PT Serpa Brinches 021302 PT184 38.04 - 7.59 1,039 92,401,800 3
PT Serpa Pias 021303 PT184 38.08 - 7.52 2,852 163,861,600 3
PT Serpa Vila Verde de Ficalho 021307 PT184 37.92 - 7.31 1,459 105,394,400 3
PT Serpa União das freguesias de Serpa
(Salvador e Santa Maria) 021308 PT184 37.89 - 7.52 6,233 443,727,800 3
PT Serpa União das freguesias de Vila Nova
de São Bento e Vale de Vargo 021309 PT184 37.86 - 7.41 4,040 300,247,800 3
PT Paredes de Coura Agualonga 160501 PT111 41.88 - 8.61 295 5,322,900 3
42
PT Paredes de Coura Castanheira 160503 PT111 41.88 - 8.55 345 24,641,200 3
PT Paredes de Coura Coura 160505 PT111 41.88 - 8.65 374 6,587,500 3
PT Paredes de Coura Cunha 160507 PT111 41.88 - 8.58 529 9,976,100 1
PT Paredes de Coura Infesta 160510 PT111 41.90 - 8.59 450 5,889,600 3
PT Paredes de Coura Mozelos 160513 PT111 41.93 - 8.55 347 3,360,300 2
PT Paredes de Coura Padornelo 160507 PT111 41.93 - 8.53 437 6,660,600 3
PT Paredes de Coura Parada 160515 PT111 41.92 - 8.52 298 5,900,700 3
PT Paredes de Coura Romarigães 160519 PT111 41.86 - 8.63 246 7,132,500 3
PT Paredes de Coura Rubiães 160520 PT111 41.90 - 8.63 512 9,081,700 3
PT Paredes de Coura Vascões 160521 PT111 41.90 - 8.50 223 6,218,100 3
PT Paredes de Coura União das freguesias de Bico e
Cristelo 160522 PT111 41.88 - 8.52 783 11,680,400 3
PT Paredes de Coura União das freguesias de Cossourado e Linhares
160523 PT111 41.92 - 8.63 517 9,638,200 3
PT Paredes de Coura União das freguesias de Formariz
e Ferreira 160524 PT111 41.92 - 8.58 998 19,539,400 2
PT Paredes de Coura União das freguesias de Insalde e
Porreiras 160525 PT111 41.96 - 8.52 459 17,592,900 3
PT Paredes de Coura União das freguesias de Paredes
de Coura e Resende 160526 PT111 41.91 - 8.56 2,099 5,840,600 2
PT Ponte de Lima Anais 160701 PT111 41.70 - 8.53 1,073 8,063,000 3
PT Ponte de Lima Arcos 160703 PT111 41.70 - 8.53 640 15,053,200 2
PT Ponte de Lima Arcozelo 030209 PT111 41.79 - 8.60 12,840 3,436,800 2
PT Ponte de Lima Beiral do Lima 160707 PT111 41.76 - 8.48 558 7,315,200 3
PT Ponte de Lima Bertiandos 160708 PT111 41.76 - 8.63 414 2,266,800 2
PT Ponte de Lima Boalhosa 160709 PT111 41.74 - 8.48 163 2,187,000 3
PT Ponte de Lima Brandara 160710 PT111 41.79 - 8.57 442 2,576,900 2
PT Ponte de Lima Calheiros 160713 PT111 41.81 - 8.57 991 8,499,300 3
PT Ponte de Lima Calvelo 160714 PT111 41.68 - 8.55 685 5,264,200 3
PT Ponte de Lima Correlhã 160716 PT111 41.75 - 8.61 2,936 8,655,400 2
43
PT Ponte de Lima Estorãos 030708 PT111 41.80 - 8.66 1,508 5,904,400 2
PT Ponte de Lima Facha 160718 PT111 41.71 - 8.62 1,529 15,307,700 3
PT Ponte de Lima Feitosa 160719 PT111 41.75 - 8.58 1,363 2,693,800 2
PT Ponte de Lima Fontão 160721 PT111 41.75 - 8.66 1,101 4,825,400 2
PT Ponte de Lima Friastelas 160724 PT111 41.68 - 8.58 450 3,919,900 3
PT Ponte de Lima Gandra 131011 PT111 41.78 - 8.50 6,974 11,755,200 2
PT Ponte de Lima Gemieira 160727 PT111 41.78 - 8.52 598 4,248,600 3
PT Ponte de Lima Gondufe 160728 PT111 41.76 - 8.51 450 5,574,000 3
PT Ponte de Lima Labruja 160729 PT111 41.84 - 8.60 439 14,564,600 3
PT Ponte de Lima Poiares 040406 PT111 41.66 - 8.63 411 40,735,400 3
PT Ponte de Lima Rebordões (Santa Maria) 160744 PT111 41.73 - 8.58 1,056 7,073,000 3
PT Ponte de Lima Rebordões (Souto) 160747 PT111 41.72 - 8.56 1,127 7,409,400 3
PT Ponte de Lima Refóios do Lima 160737 PT111 41.80 - 8.54 2,169 16,447,300 3
PT Ponte de Lima Ribeira 031012 PT111 41.77 - 8.55 242 2,245,200 3
PT Ponte de Lima Sá 160740 PT111 41.78 - 8.62 420 2,798,200 3
PT Ponte de Lima Santa Comba 160742 PT111 41.77 - 8.61 834 11,825,200 3
PT Ponte de Lima Santa Cruz do Lima 160743 PT111 41.79 - 8.48 480 2,233,400 3
PT Ponte de Lima Seara 160745 PT111 41.73 - 8.61 714 3,634,700 2
PT Ponte de Lima Serdedelo 160746 PT111 41.75 - 8.52 464 6,512,400 3
PT Ponte de Lima Vitorino das Donas 160750 PT111 41.73 - 8.65 1,051 4,465,300 3
PT Ponte de Lima Arca e Ponte de Lima 160752 PT111 41.76 - 8.57 3,756 4,006,000 2
PT Ponte de Lima Ardegão, Freixo e Mato 160705 PT111 41.64 - 8.60 1,754 10,717,500 3
PT Ponte de Lima Associação de freguesias do Vale
do Neiva 160754 PT111 41.73 - 8.65 1,075 10,273,200 3
PT Ponte de Lima Bárrio e Cepões 160706 PT111 41.84 - 8.57 921 9,712,300 3
PT Ponte de Lima Cabaços e Fojo Lobal 160756 PT111 41.69 - 8.57 951 9,265,500 3
PT Ponte de Lima Cabração e Moreira do Lima 160757 PT111 41.80 - 8.63 987 27,340,200 3
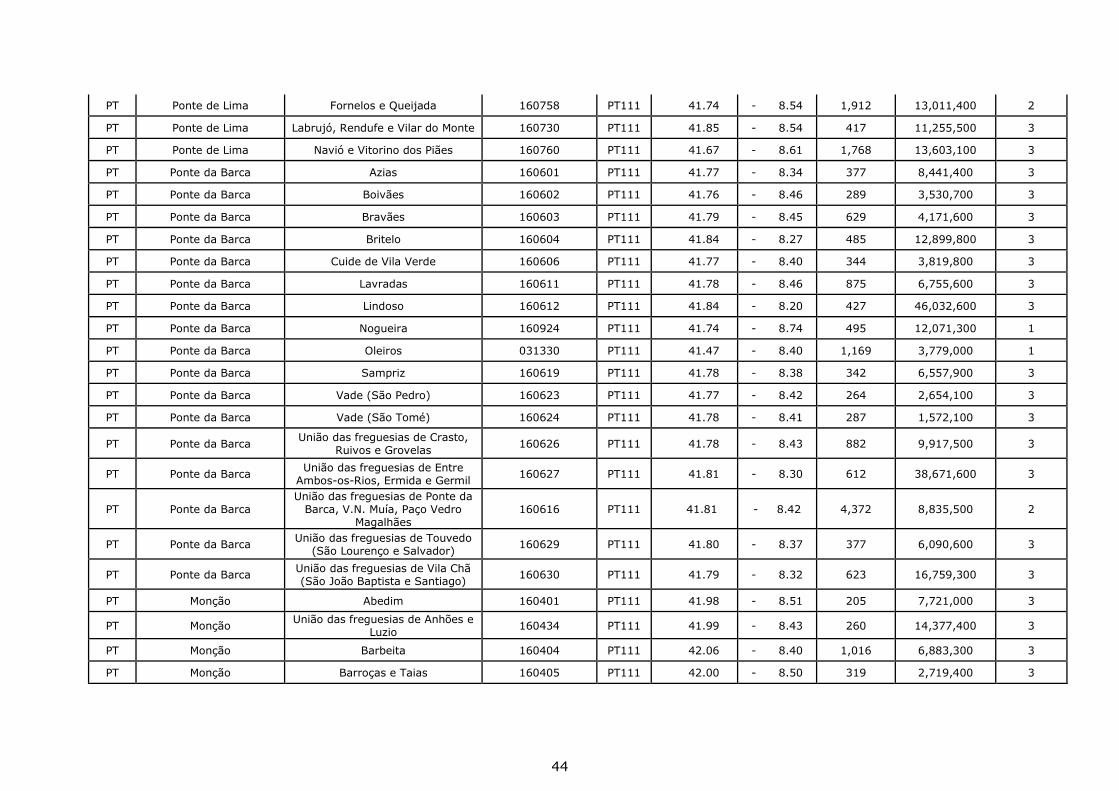
44
PT Ponte de Lima Fornelos e Queijada 160758 PT111 41.74 - 8.54 1,912 13,011,400 2
PT Ponte de Lima Labrujó, Rendufe e Vilar do Monte 160730 PT111 41.85 - 8.54 417 11,255,500 3
PT Ponte de Lima Navió e Vitorino dos Piães 160760 PT111 41.67 - 8.61 1,768 13,603,100 3
PT Ponte da Barca Azias 160601 PT111 41.77 - 8.34 377 8,441,400 3
PT Ponte da Barca Boivães 160602 PT111 41.76 - 8.46 289 3,530,700 3
PT Ponte da Barca Bravães 160603 PT111 41.79 - 8.45 629 4,171,600 3
PT Ponte da Barca Britelo 160604 PT111 41.84 - 8.27 485 12,899,800 3
PT Ponte da Barca Cuide de Vila Verde 160606 PT111 41.77 - 8.40 344 3,819,800 3
PT Ponte da Barca Lavradas 160611 PT111 41.78 - 8.46 875 6,755,600 3
PT Ponte da Barca Lindoso 160612 PT111 41.84 - 8.20 427 46,032,600 3
PT Ponte da Barca Nogueira 160924 PT111 41.74 - 8.74 495 12,071,300 1
PT Ponte da Barca Oleiros 031330 PT111 41.47 - 8.40 1,169 3,779,000 1
PT Ponte da Barca Sampriz 160619 PT111 41.78 - 8.38 342 6,557,900 3
PT Ponte da Barca Vade (São Pedro) 160623 PT111 41.77 - 8.42 264 2,654,100 3
PT Ponte da Barca Vade (São Tomé) 160624 PT111 41.78 - 8.41 287 1,572,100 3
PT Ponte da Barca União das freguesias de Crasto,
Ruivos e Grovelas 160626 PT111 41.78 - 8.43 882 9,917,500 3
PT Ponte da Barca União das freguesias de Entre
Ambos-os-Rios, Ermida e Germil 160627 PT111 41.81 - 8.30 612 38,671,600 3
PT Ponte da Barca União das freguesias de Ponte da
Barca, V.N. Muía, Paço Vedro Magalhães
160616 PT111 41.81 - 8.42 4,372 8,835,500 2
PT Ponte da Barca União das freguesias de Touvedo
(São Lourenço e Salvador) 160629 PT111 41.80 - 8.37 377 6,090,600 3
PT Ponte da Barca União das freguesias de Vila Chã (São João Baptista e Santiago)
160630 PT111 41.79 - 8.32 623 16,759,300 3
PT Monção Abedim 160401 PT111 41.98 - 8.51 205 7,721,000 3
PT Monção União das freguesias de Anhões e
Luzio 160434 PT111 41.99 - 8.43 260 14,377,400 3
PT Monção Barbeita 160404 PT111 42.06 - 8.40 1,016 6,883,300 3
PT Monção Barroças e Taias 160405 PT111 42.00 - 8.50 319 2,719,400 3
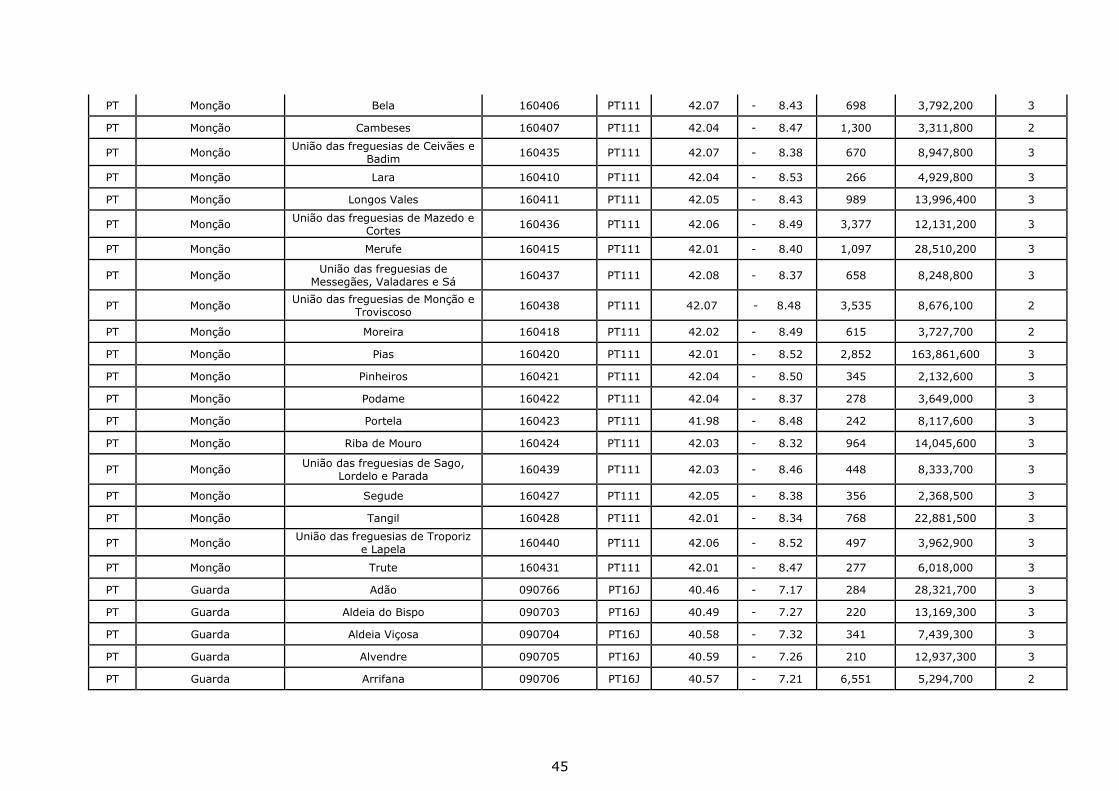
45
PT Monção Bela 160406 PT111 42.07 - 8.43 698 3,792,200 3
PT Monção Cambeses 160407 PT111 42.04 - 8.47 1,300 3,311,800 2
PT Monção União das freguesias de Ceivães e
Badim 160435 PT111 42.07 - 8.38 670 8,947,800 3
PT Monção Lara 160410 PT111 42.04 - 8.53 266 4,929,800 3
PT Monção Longos Vales 160411 PT111 42.05 - 8.43 989 13,996,400 3
PT Monção União das freguesias de Mazedo e
Cortes 160436 PT111 42.06 - 8.49 3,377 12,131,200 3
PT Monção Merufe 160415 PT111 42.01 - 8.40 1,097 28,510,200 3
PT Monção União das freguesias de
Messegães, Valadares e Sá 160437 PT111 42.08 - 8.37 658 8,248,800 3
PT Monção União das freguesias de Monção e
Troviscoso 160438 PT111 42.07 - 8.48 3,535 8,676,100 2
PT Monção Moreira 160418 PT111 42.02 - 8.49 615 3,727,700 2
PT Monção Pias 160420 PT111 42.01 - 8.52 2,852 163,861,600 3
PT Monção Pinheiros 160421 PT111 42.04 - 8.50 345 2,132,600 3
PT Monção Podame 160422 PT111 42.04 - 8.37 278 3,649,000 3
PT Monção Portela 160423 PT111 41.98 - 8.48 242 8,117,600 3
PT Monção Riba de Mouro 160424 PT111 42.03 - 8.32 964 14,045,600 3
PT Monção União das freguesias de Sago,
Lordelo e Parada 160439 PT111 42.03 - 8.46 448 8,333,700 3
PT Monção Segude 160427 PT111 42.05 - 8.38 356 2,368,500 3
PT Monção Tangil 160428 PT111 42.01 - 8.34 768 22,881,500 3
PT Monção União das freguesias de Troporiz
e Lapela 160440 PT111 42.06 - 8.52 497 3,962,900 3
PT Monção Trute 160431 PT111 42.01 - 8.47 277 6,018,000 3
PT Guarda Adão 090766 PT16J 40.46 - 7.17 284 28,321,700 3
PT Guarda Aldeia do Bispo 090703 PT16J 40.49 - 7.27 220 13,169,300 3
PT Guarda Aldeia Viçosa 090704 PT16J 40.58 - 7.32 341 7,439,300 3
PT Guarda Alvendre 090705 PT16J 40.59 - 7.26 210 12,937,300 3
PT Guarda Arrifana 090706 PT16J 40.57 - 7.21 6,551 5,294,700 2
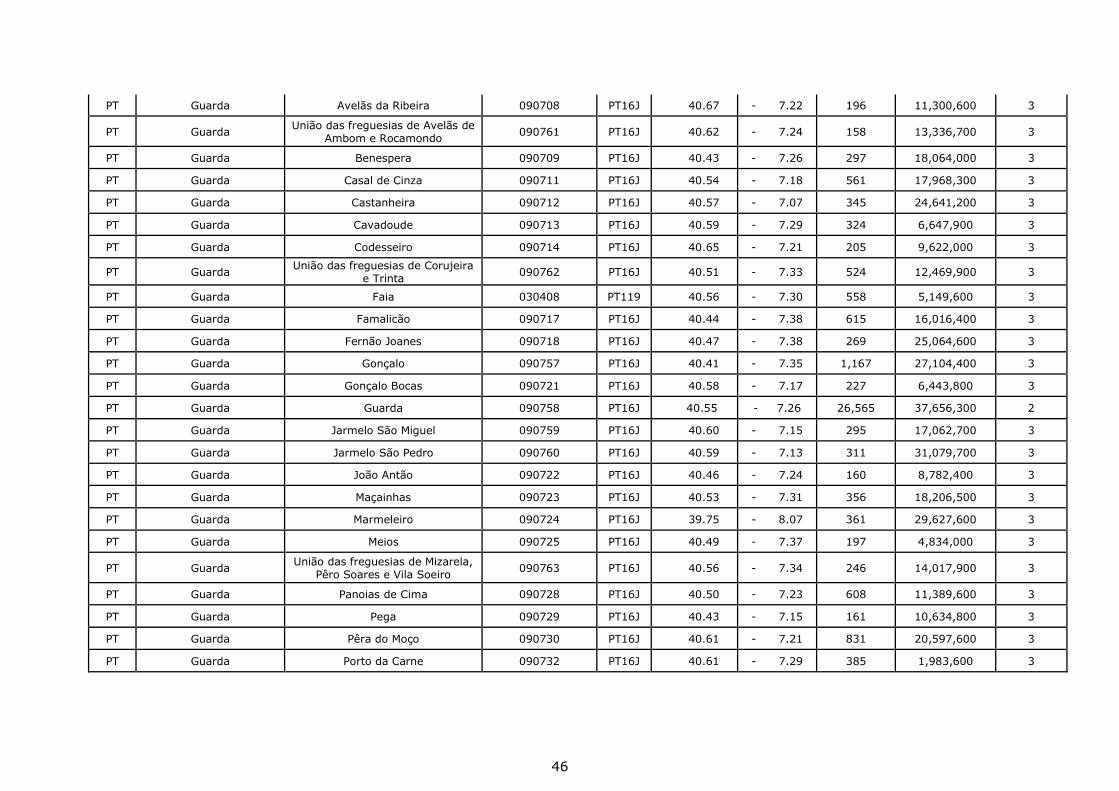
46
PT Guarda Avelãs da Ribeira 090708 PT16J 40.67 - 7.22 196 11,300,600 3
PT Guarda União das freguesias de Avelãs de
Ambom e Rocamondo 090761 PT16J 40.62 - 7.24 158 13,336,700 3
PT Guarda Benespera 090709 PT16J 40.43 - 7.26 297 18,064,000 3
PT Guarda Casal de Cinza 090711 PT16J 40.54 - 7.18 561 17,968,300 3
PT Guarda Castanheira 090712 PT16J 40.57 - 7.07 345 24,641,200 3
PT Guarda Cavadoude 090713 PT16J 40.59 - 7.29 324 6,647,900 3
PT Guarda Codesseiro 090714 PT16J 40.65 - 7.21 205 9,622,000 3
PT Guarda União das freguesias de Corujeira
e Trinta 090762 PT16J 40.51 - 7.33 524 12,469,900 3
PT Guarda Faia 030408 PT119 40.56 - 7.30 558 5,149,600 3
PT Guarda Famalicão 090717 PT16J 40.44 - 7.38 615 16,016,400 3
PT Guarda Fernão Joanes 090718 PT16J 40.47 - 7.38 269 25,064,600 3
PT Guarda Gonçalo 090757 PT16J 40.41 - 7.35 1,167 27,104,400 3
PT Guarda Gonçalo Bocas 090721 PT16J 40.58 - 7.17 227 6,443,800 3
PT Guarda Guarda 090758 PT16J 40.55 - 7.26 26,565 37,656,300 2
PT Guarda Jarmelo São Miguel 090759 PT16J 40.60 - 7.15 295 17,062,700 3
PT Guarda Jarmelo São Pedro 090760 PT16J 40.59 - 7.13 311 31,079,700 3
PT Guarda João Antão 090722 PT16J 40.46 - 7.24 160 8,782,400 3
PT Guarda Maçainhas 090723 PT16J 40.53 - 7.31 356 18,206,500 3
PT Guarda Marmeleiro 090724 PT16J 39.75 - 8.07 361 29,627,600 3
PT Guarda Meios 090725 PT16J 40.49 - 7.37 197 4,834,000 3
PT Guarda União das freguesias de Mizarela,
Pêro Soares e Vila Soeiro 090763 PT16J 40.56 - 7.34 246 14,017,900 3
PT Guarda Panoias de Cima 090728 PT16J 40.50 - 7.23 608 11,389,600 3
PT Guarda Pega 090729 PT16J 40.43 - 7.15 161 10,634,800 3
PT Guarda Pêra do Moço 090730 PT16J 40.61 - 7.21 831 20,597,600 3
PT Guarda Porto da Carne 090732 PT16J 40.61 - 7.29 385 1,983,600 3
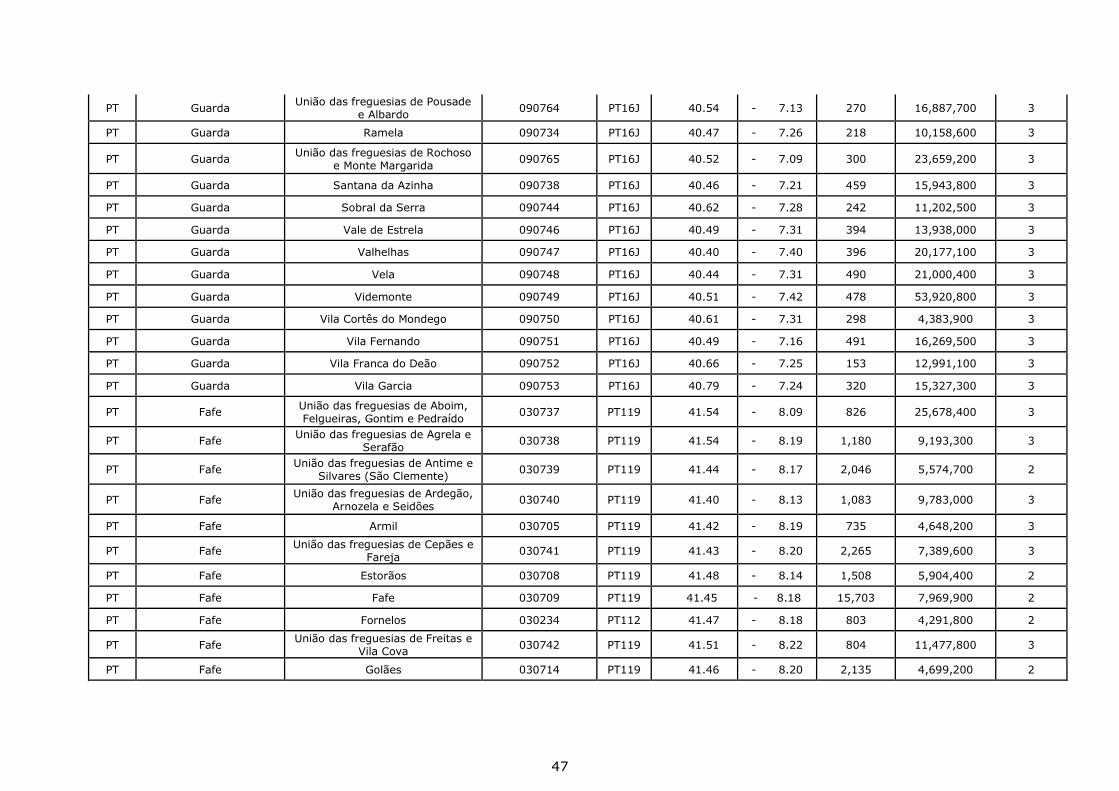
47
PT Guarda União das freguesias de Pousade
e Albardo 090764 PT16J 40.54 - 7.13 270 16,887,700 3
PT Guarda Ramela 090734 PT16J 40.47 - 7.26 218 10,158,600 3
PT Guarda União das freguesias de Rochoso
e Monte Margarida 090765 PT16J 40.52 - 7.09 300 23,659,200 3
PT Guarda Santana da Azinha 090738 PT16J 40.46 - 7.21 459 15,943,800 3
PT Guarda Sobral da Serra 090744 PT16J 40.62 - 7.28 242 11,202,500 3
PT Guarda Vale de Estrela 090746 PT16J 40.49 - 7.31 394 13,938,000 3
PT Guarda Valhelhas 090747 PT16J 40.40 - 7.40 396 20,177,100 3
PT Guarda Vela 090748 PT16J 40.44 - 7.31 490 21,000,400 3
PT Guarda Videmonte 090749 PT16J 40.51 - 7.42 478 53,920,800 3
PT Guarda Vila Cortês do Mondego 090750 PT16J 40.61 - 7.31 298 4,383,900 3
PT Guarda Vila Fernando 090751 PT16J 40.49 - 7.16 491 16,269,500 3
PT Guarda Vila Franca do Deão 090752 PT16J 40.66 - 7.25 153 12,991,100 3
PT Guarda Vila Garcia 090753 PT16J 40.79 - 7.24 320 15,327,300 3
PT Fafe União das freguesias de Aboim, Felgueiras, Gontim e Pedraído
030737 PT119 41.54 - 8.09 826 25,678,400 3
PT Fafe União das freguesias de Agrela e
Serafão 030738 PT119 41.54 - 8.19 1,180 9,193,300 3
PT Fafe União das freguesias de Antime e
Silvares (São Clemente) 030739 PT119 41.44 - 8.17 2,046 5,574,700 2
PT Fafe União das freguesias de Ardegão,
Arnozela e Seidões 030740 PT119 41.40 - 8.13 1,083 9,783,000 3
PT Fafe Armil 030705 PT119 41.42 - 8.19 735 4,648,200 3
PT Fafe União das freguesias de Cepães e
Fareja 030741 PT119 41.43 - 8.20 2,265 7,389,600 3
PT Fafe Estorãos 030708 PT119 41.48 - 8.14 1,508 5,904,400 2
PT Fafe Fafe 030709 PT119 41.45 - 8.18 15,703 7,969,900 2
PT Fafe Fornelos 030234 PT112 41.47 - 8.18 803 4,291,800 2
PT Fafe União das freguesias de Freitas e
Vila Cova 030742 PT119 41.51 - 8.22 804 11,477,800 3
PT Fafe Golães 030714 PT119 41.46 - 8.20 2,135 4,699,200 2
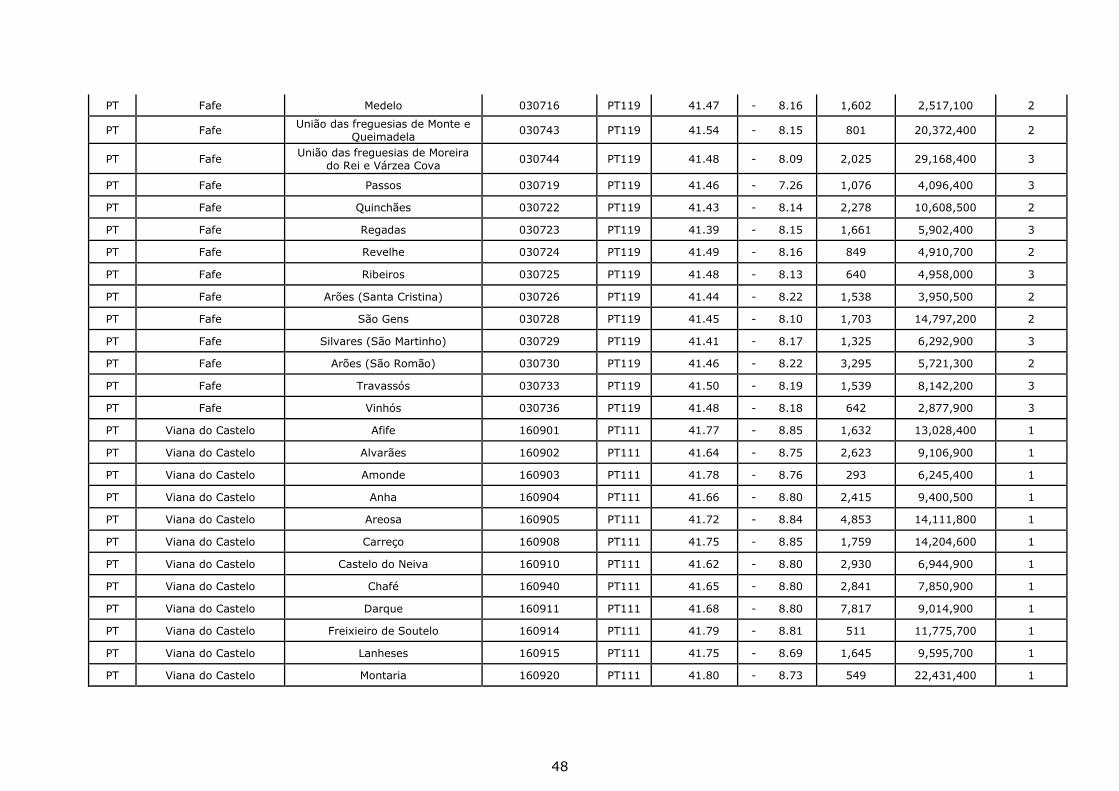
48
PT Fafe Medelo 030716 PT119 41.47 - 8.16 1,602 2,517,100 2
PT Fafe União das freguesias de Monte e
Queimadela 030743 PT119 41.54 - 8.15 801 20,372,400 2
PT Fafe União das freguesias de Moreira
do Rei e Várzea Cova 030744 PT119 41.48 - 8.09 2,025 29,168,400 3
PT Fafe Passos 030719 PT119 41.46 - 7.26 1,076 4,096,400 3
PT Fafe Quinchães 030722 PT119 41.43 - 8.14 2,278 10,608,500 2
PT Fafe Regadas 030723 PT119 41.39 - 8.15 1,661 5,902,400 3
PT Fafe Revelhe 030724 PT119 41.49 - 8.16 849 4,910,700 2
PT Fafe Ribeiros 030725 PT119 41.48 - 8.13 640 4,958,000 3
PT Fafe Arões (Santa Cristina) 030726 PT119 41.44 - 8.22 1,538 3,950,500 2
PT Fafe São Gens 030728 PT119 41.45 - 8.10 1,703 14,797,200 2
PT Fafe Silvares (São Martinho) 030729 PT119 41.41 - 8.17 1,325 6,292,900 3
PT Fafe Arões (São Romão) 030730 PT119 41.46 - 8.22 3,295 5,721,300 2
PT Fafe Travassós 030733 PT119 41.50 - 8.19 1,539 8,142,200 3
PT Fafe Vinhós 030736 PT119 41.48 - 8.18 642 2,877,900 3
PT Viana do Castelo Afife 160901 PT111 41.77 - 8.85 1,632 13,028,400 1
PT Viana do Castelo Alvarães 160902 PT111 41.64 - 8.75 2,623 9,106,900 1
PT Viana do Castelo Amonde 160903 PT111 41.78 - 8.76 293 6,245,400 1
PT Viana do Castelo Anha 160904 PT111 41.66 - 8.80 2,415 9,400,500 1
PT Viana do Castelo Areosa 160905 PT111 41.72 - 8.84 4,853 14,111,800 1
PT Viana do Castelo Carreço 160908 PT111 41.75 - 8.85 1,759 14,204,600 1
PT Viana do Castelo Castelo do Neiva 160910 PT111 41.62 - 8.80 2,930 6,944,900 1
PT Viana do Castelo Chafé 160940 PT111 41.65 - 8.80 2,841 7,850,900 1
PT Viana do Castelo Darque 160911 PT111 41.68 - 8.80 7,817 9,014,900 1
PT Viana do Castelo Freixieiro de Soutelo 160914 PT111 41.79 - 8.81 511 11,775,700 1
PT Viana do Castelo Lanheses 160915 PT111 41.75 - 8.69 1,645 9,595,700 1
PT Viana do Castelo Montaria 160920 PT111 41.80 - 8.73 549 22,431,400 1

49
PT Viana do Castelo Mujães 160922 PT111 41.66 - 8.71 1,550 4,898,600 1
PT Viana do Castelo São Romão de Neiva 160923 PT111 41.63 - 8.77 1,225 7,023,300 1
PT Viana do Castelo Outeiro 160925 PT111 41.76 - 8.79 301 40,932,100 3
PT Viana do Castelo Perre 160926 PT111 41.73 - 8.79 2,956 13,088,200 1
PT Viana do Castelo Santa Marta de Portuzelo 160928 PT111 41.71 - 8.77 3,805 7,412,200 1
PT Viana do Castelo Vila Franca 160935 PT111 41.68 - 8.74 1,757 7,146,000 1
PT Viana do Castelo Vila de Punhe 160938 PT111 41.66 - 8.73 2,273 6,026,700 1
PT Viana do Castelo União das freguesias de Barroselas e Carvoeiro
160941 PT111 41.65 - 8.70 5,031 18,675,400 1
PT Viana do Castelo União das freguesias de Cardielos
e Serreleis 160942 PT111 41.71 - 8.74 2,312 7,681,000 1
PT Viana do Castelo União das freguesias de Geraz do
Lima (Santa Maria, Santa Leocádia e Moreira) e Deão
160943 PT111 41.70 - 8.68 3,339 19,060,600 1
PT Viana do Castelo União das freguesias de
Mazarefes e Vila Fria 160944 PT111 41.68 - 8.77 2,670 10,281,000 1
PT Viana do Castelo União das freguesias de
Nogueira, Meixedo e Vilar de Murteda
160945 PT111 41.74 - 8.74 1,597 27,409,400 1
PT Viana do Castelo União das freguesias de
Subportela, Deocriste e Portela Susã
160946 PT111 41.69 - 8.72 2,552 17,101,500 1
PT Viana do Castelo União das freguesias de Torre e
Vila Mou 160947 PT111 41.72 - 8.72 1,181 6,354,500 3
PT Viana do Castelo União das freguesias de Viana do
Castelo (Santa Maria Maior e Monserrate) e Meadela
160948 PT111 41.70 - 8.83 25,375 14,324,900 1
RO Alba Iulia Alba Iulia RO11001017 RO121 46.06 23.56 66,369 103,650,000 1
RO Bistrita Bistrita RO16032394 RO112 47.14 24.50 84,850 145,470,000 2
FI Helsinki Helsinki#Helsingfors FI101091 FI1B1 60.22 25.02 622,240 715,480,000 1
SE Älmhult Älmhult SE0765 SE212 56.57 14.18 15,570 890,780,000 3
SE Alvesta Alvesta SE0764 SE212 56.85 14.50 18,757 974,190,000 3
SE Finspång Finspång SE0562 SE123 58.80 15.78 20,733 1,055,280,000 2
SE Göteborg Göteborg SE1480 SE232 57.74 11.95 506,100 447,760,000 1

50
SE Gislaved Gislaved SE0662 SE211 57.25 13.51 29,212 1,137,080,000 3
SE Jönköping Jönköping SE0680 SE211 57.76 14.17 126,331 1,480,360,000 1
SE Kristianstad Kristianstad SE1290 SE224 55.95 14.11 78,000 1,246,250,000 3
SE Lund Lund SE1281 SE224 55.67 13.37 116,000 427,230,000 1
SE Stockholm Stockholm SE0180 SE110 59.31 17.98 829,417 187,170,000 1
SE Västerås Västerås SE1980 SE125 59.63 16.57 140,000 957,890,000 1
SE Växjö Växjö SE0780 SE212 56.93 14.87 86,000 1,665,510,000 2
UK Leicester Braunstone Park and Rowley
Fields UK12FN00NK UKF21 52.62 - 1.17 18,173 4,387,326 1
UK Leicester Spinney Hills UK12FN00NZ UKF21 52.63 - 1.11 25,571 2,224,782 1
UK Leicester Rushey Mead UK12FN00NY UKF21 52.66 - 1.10 15,962 5,452,285 1
UK Leicester Latimer UK12FN00NW UKF21 52.65 - 1.12 12,457 1,523,779 1
UK Leicester Westcotes UK12FN00PC UKF21 52.63 - 1.15 11,644 1,440,587 1
UK Leicester Freemen UK12FN00NS UKF21 52.61 - 1.13 10,949 2,693,479 1
UK Leicester Thurncourt UK12FN00PB UKF21 52.64 - 1.06 10,596 2,027,836 1
UK Leicester Belgrave UK12FN00NJ UKF21 52.66 - 1.11 11,558 1,333,799 1
UK Leicester Eyres Monsell UK12FN00NQ UKF21 52.59 - 1.15 11,520 2,321,207 1
UK Leicester Castle UK12FN00NL UKF21 52.63 - 1.13 10,069 22,161,939 1
UK Leicester Western Park UK12FN00PD UKF21 52.63 - 1.17 10,609 2,331,201 1
UK Leicester Knighton UK12FN00NU UKF21 52.61 - 1.11 16,805 4,151,040 1
UK Leicester Fosse UK12FN00NR UKF21 52.64 - 1.15 13,072 1,776,704 1
UK Leicester Aylestone UK12FN00NG UKF21 52.60 - 1.15 11,151 3,808,609 1
UK Leicester New Parks UK12FN00NX UKF21 52.64 - 1.19 17,128 4,782,107 1
UK Leicester Evington UK12FN00NP UKF21 52.63 - 1.07 11,133 4,290,174 1
UK Leicester Coleman UK12FN00NN UKF21 52.64 - 1.09 14,669 1,856,485 1
UK Leicester Humberstone and Hamilton UK12FN00NT UKF21 52.65 - 1.07 18,854 5,236,788 1
UK Leicester Beaumont Leys UK12FN00NH UKF21 52.67 - 1.16 16,480 8,896,922 1
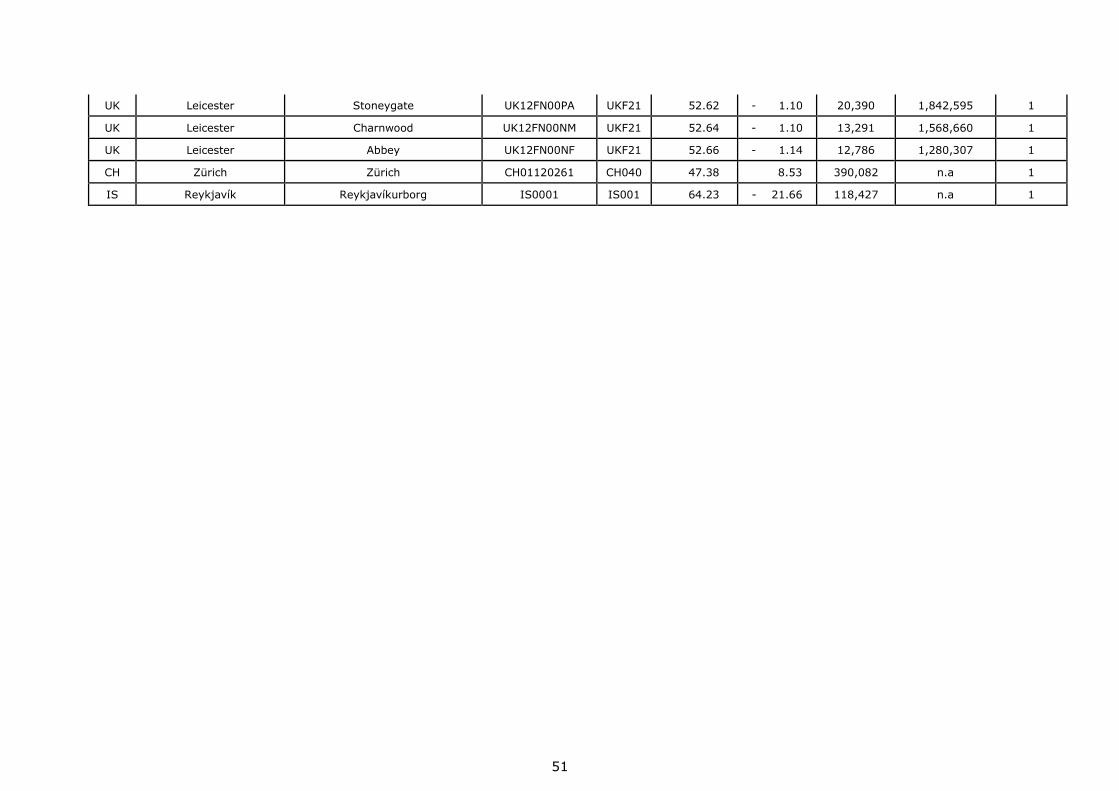
51
UK Leicester Stoneygate UK12FN00PA UKF21 52.62 - 1.10 20,390 1,842,595 1
UK Leicester Charnwood UK12FN00NM UKF21 52.64 - 1.10 13,291 1,568,660 1
UK Leicester Abbey UK12FN00NF UKF21 52.66 - 1.14 12,786 1,280,307 1
CH Zürich Zürich CH01120261 CH040 47.38 8.53 390,082 n.a 1
IS Reykjavík Reykjavíkurborg IS0001 IS001 64.23 - 21.66 118,427 n.a 1

How to obtain EU publications
Our publications are available from EU Bookshop (http://bookshop.europa.eu),
where you can place an order with the sales agent of your choice.
The Publications Office has a worldwide network of sales agents.
You can obtain their contact details by sending a fax to (352) 29 29-42758.
Europe Direct is a service to help you find answers to your questions about the European Union
Free phone number (*): 00 800 6 7 8 9 10 11
(*) Certain mobile telephone operators do not allow access to 00 800 numbers or these calls may be billed.
A great deal of additional information on the European Union is available on the Internet.
It can be accessed through the Europa server http://europa.eu
2
doi: 10.2790/192450
ISBN 978-92-79-54716-4
LD
-NA-2
7723-E
N-N
JRC Mission
As the Commission’s
in-house science service,
the Joint Research Centre’s
mission is to provide EU
policies with independent,
evidence-based scientific
and technical support
throughout the whole
policy cycle.
Working in close
cooperation with policy
Directorates-General,
the JRC addresses key
societal challenges while
stimulating innovation
through developing
new methods, tools
and standards, and sharing
its know-how with
the Member States,
the scientific community
and international partners.
Serving society Stimulating innovation Supporting legislation


![Masterthesis E. Bekker-Janssens [4254694]](https://static.fdocuments.net/doc/165x107/58edeb421a28ab2d5c8b458d/masterthesis-e-bekker-janssens-4254694.jpg)