cov13-2578-1 204752 mdb
948
L IBERTY L IFE A SSURANCE C OMPANY OF B OSTON L IBERTY L IFE ’ S S PECTRUM S ELECT ® AND S PECTRUM S ELECT P LUS ® V ARIABLE L IFE I NSURANCE THIS REPORT MAY BE USED WITH THE PUBLIC ONLY WHEN PRECEDED OR ACCOMPANIED BY A CURRENT PROSPECTUS FOR LIBERTY LIFE'S SPECTRUM SELECT OR SPECTRUM SELECT PLUS.THE PROSPECTUSES CONTAIN COMPLETE INFORMATION CONCERNING CHARGES AND EXPENSES AND SHOULD BE READ CAREFULLY BEFORE YOU INVEST OR SEND MONEY . A spectrum of choices...a lifetime of protection ® Liberty Life Assurance Company of Boston Annual Report December 31, 2012
Transcript of cov13-2578-1 204752 mdb

LI B E RT Y LI F E AS S U R A N C E CO M PA N Y O F B O S T O N
LI B E RT Y LI F E’S
SP E C T R U M SE L E C T ® A N D SP E C T R U M SE L E C T PLU S ®
VA R I A B L E LI F E IN S U R A N C E
THIS REPORT MAY BE USED WITH THE PUBLIC ONLY WHEN PRECEDED OR ACCOMPANIED BY A CURRENT
PROSPECTUS FOR LIBERTY LIFE'S SPECTRUM SELECT OR SPECTRUM SELECT PLUS. THE
PROSPECTUSES CONTAIN COMPLETE INFORMATION CONCERNING CHARGES AND EXPENSES AND
SHOULD BE READ CAREFULLY BEFORE YOU INVEST OR SEND MONEY.
A spectrum of choices...a lifetime of protection®
Liberty Life Assurance Company of Boston
Annual ReportDecember 31, 2012
Liberty Life Assurance Company of Boston100 Liberty WayDover, NH 03820
PRSRT BPMU.S. POSTAGE
PAIDMERRILL
CORPORATION
VUL 200230 REV 2-13
ZIP CODE 10014


Dear Policyholder, This nnual Report represents the investment performance of the portfolios invested in by the sub-accounts available with Liberty Life’s Spectrum Select® and Spectrum Select Plus® variable life insurance contracts. All of us at Liberty Life thank you for your business. Sincerely,
Elaine Dansereau Liberty Life Assurance Company of Boston Director – Policyholder Services 100 Liberty Way Dover, NH 03820


The Fund provides a complete list of its holdings four times in each fiscal year, at the quarter-ends. For the second and fourth quarters, the lists appear in the Fund’s semiannual and annual reports to shareholders. For the first and third quarters, the Fund files the lists with the Securities and Exchange Commission (SEC) on Form N-Q. The Fund’s Form N-Q filings are available on the SEC website, sec.gov. Copies of the Fund’s Forms N-Q may be reviewed and copied at the SEC Public Reference Room in Washington, D.C. You can obtain information on the operation of the Public Reference Room, including information about duplicating fee charges, by calling 202 551 8090 or 800 732 0330, or by electronic request at the following email address: [email protected]. The SEC file numbers for the Fund are 811-07452 and 033-57340. The Fund’s most recent portfolio holdings, as filed on Form N-Q, have also been made available to insurance companies issuing variable annuity contracts and variable life insurance policies (“variable products”) that invest in the Fund.
A description of the policies and procedures that the Fund uses to determine how to vote proxies relating to portfolio securities is available without charge, upon request, from our Client Services department at 800 959 4246 or at invesco.com/proxyguidelines. The information is also available on the SEC website, sec.gov.
Information regarding how the Fund voted proxies related to its portfolio securities during the 12 months ended June 30, 2012, is available at invesco.com/proxysearch. The information is also available on the SEC website, sec.gov.
Invesco Advisers, Inc. is an investment adviser; it provides investment advisory services to individual and institutional clients and does not sell securities. Invesco Distributors, Inc. is the US distributor for Invesco Ltd.’s retail mutual funds, exchange-traded funds and institutional money market funds. Both are wholly owned, indirect subsidiaries of Invesco Ltd.
This report must be accompanied or preceded by a currently effective Fund prospectus and variable product prospectus, which contain more complete information, including sales charges and expenses. Investors should read each carefully before investing.Invesco Distributors, Inc.VK-VIAMFR-AR-1
Invesco Van Kampen V.I. American Franchise FundAnnual Report to Shareholders December 31, 2012

Invesco Van Kampen V.I. American Franchise Fund
How we investWe believe a growth investment strategy is an essential component of a diversified portfolio.
Our investment process emphasizes rigorous bottom-up analysis of individual companies. We seek to invest in compa-nies with strong or improving fundamen-tals, attractive valuation relative to growth prospects and earnings expecta-tions that appear fair to conservative.
To narrow our investment universe, we utilize a holistic approach that empha-sizes fundamental research and, to a lesser extent, includes quantitative anal-ysis. At the end of this distillation pro-cess, we have a set of stocks to analyze in greater depth.
Our fundamental analysis focuses on identifying companies with strong drivers of growth. To accomplish this goal, we conduct comprehensive bottom-up analy-sis in order to develop higher conviction in each company’s prospects for growth. Through our analysis, we develop a mosaic of each company through detailed discussions with company man-agement teams, competitors, distribu-
tors, suppliers, Wall Street analysts and customers. We also utilize a variety of valuation techniques based on the com-pany in question, the industry in which the company operates, the stage of the business cycle and other factors that best reflect a company’s value.
Risk management plays an important role in portfolio construction, as our tar-get portfolio attempts to maximize the relationship between risk and return. We seek to accomplish this goal by investing in companies with attractive fundamental prospects for growth, and we divide the portfolio between stable growth stocks and catalyst-driven stocks.
We consider selling a stock for any of the following reasons:
been reached.
fundamentals.
longer present or are reflected in the stock price.
opportunity.
Market conditions and your FundThe year 2012 began with improving economic data in the US and a rally in equities that continued almost uninter-rupted into the spring. However, the ongoing eurozone sovereign debt crisis intensified in April and May, dominating headlines and creating significant volatil-ity in global equity markets.
This negative news from overseas pre-cipitated a slowdown in the US, where economic data began to decelerate as manufacturing, employment, consumer spending and consumer confidence weakened over the summer. While corpo-rate earnings remained solid until late in the year, financial markets were influ-enced negatively by these weakening economic data. Fears about the fate of the eurozone began to subside after the European Central Bank announced new measures to support member economies through potentially unlimited purchases of sovereign debt, among other mea-sures. At the same time, continued risk aversion among investors and corpora-tions, along with tepid employment growth, prompted the US Federal Reserve to initiate a third round of quanti-tative easing and to promise to remain accommodative until the labor market outlook improved materially. Near year end, market psychology turned negative — first, due to uncertainty about the out-come of the presidential election, and then due to the apparent inability of the White House and Congress to reach an agreement on legislation averting the “fiscal cliff” — a variety of tax increases and spending cuts scheduled to take effect in January 2013.
Despite volatility for much of the year, major equity market indexes delivered double-digit gains, and all 10 sectors of the S&P 500 Index had positive returns.1
The Fund’s holdings are subject to change, and there is no assurance that the Fund will continue to hold any particular security.*Excluding money market fund holdings.
Portfolio CompositionBy sector
Information Technology 31.4%Consumer Discretionary 21.1Industrials 13.0Health Care 12.1Financials 8.5Energy 6.0Telecommunication Services 2.2Materials 2.1Consumer Staples 1.7Money Market Funds Plus Other Assets Less Liabilities 1.9
Top 10 Equity Holdings*
1. Apple Inc. 7.2% 2. Google Inc.-Class A 3.7 3. QUALCOMM, Inc. 3.6 4. DISH Network Corp.-Class A 3.0 5. General Electric Co. 2.5 6. Goldman Sachs Group, Inc. (The) 2.5 7. DIRECTV 2.3 8. Sprint Nextel Corp. 2.2 9. Pfizer Inc. 2.2 10. Weatherford International Ltd. 2.2
Top Five Industries*
1. Computer Hardware 7.2% 2. Internet Software and Services 7.1 3. Cable and Satellite 6.4 4. Pharmaceuticals 5.8 5. Oil and Gas Equipment and Services 4.7
Performance summaryFor the year ended December 31, 2012, Invesco Van Kampen V.I. American Franchise Fund had positive returns but underperformed the Fund’s style-specific benchmark, the Russell 1000 Growth Index.
Your Fund’s long-term performance appears later in this report.
Fund vs. IndexesTotal returns, 12/31/11 to 12/31/12, excluding variable product issuer charges. If variable product issuer charges were included, returns would be lower.
Series I Shares 13.73%Series II Shares 13.40S&P 500 Index▼ (Broad Market Index) 16.00Russell 1000 Growth Index■ (Style-Specific Index) 15.26Lipper VUF Large-Cap Growth Funds Index◆ (Peer Group Index) 16.39
Source(s): ▼Invesco, S&P-Dow Jones via FactSet Research Systems Inc.; ■Invesco, Russell via FactSet Research Systems Inc.; ◆Lipper Inc.
Management’s Discussion of Fund Performance
Total Net Assets $720.7 million
Total Number of Holdings* 73

Invesco Van Kampen V.I. American Franchise Fund
In this environment, the Fund posted solid positive returns but underperformed the Russell 1000 Growth Index, its style-specific benchmark, during the reporting period. The Fund underperformed by the widest margin in the energy sector driven by stock selection. The largest detractor was Weatherford International, an oil-field services firm with a strong position in artificial lift, which enables hydraulic fracturing (fracking) wells to produce more oil after their initial output falls off. The stock was pressured during the year due to issues with filing audited financial reports and the uncertain macroeconomic environment. National Oilwell Varco and Occidental Petroleum were also detrac-tors in the sector.
The Fund also underperformed the style-specific index in the health care sec-tor. The largest detractor was Allscripts, which provides clinical, financial, connec-tivity and information solutions to hospi-tals and physicians. Allscripts announced dramatically lower business fundamentals and earnings during the reporting period, and a power struggle in the boardroom led to the departure of a number of board members. Amid these events, the stock price was hit dramatically. We sold our position during the reporting period.
Given the strong performance from equity markets and the style-specific index during the reporting period, the Fund’s modest cash position detracted from relative performance. Certain stocks in the materials and information technol-ogy sectors led the Fund to underperform the index in those sectors as well.
In contrast, the Fund outperformed the Russell 1000 Growth Index in a number of sectors, including consumer discre-tionary, telecommunication services, industrials and financials. Strong stock selection in the consumer discretionary sector included Amazon, Gap and Italian fashion company Prada. The portfolio also benefited from several satellite and cable providers, who were rewarded by investors for their consistent recurring revenues during a very uncertain eco-nomic period. Comcast, DIRECTV and DISH Network were all solid contributors in the consumer discretionary sector.
Likewise, the Fund outperformed its style-specific benchmark in the telecom-munication services sector due to strong stock selection. The largest contributor in this sector was Sprint Nextel, which was up strongly during the year as manage-ment deftly executed several innovative business strategies. The struggles of sev-eral lower-end competitors also recently contributed to success for Sprint. The Fund also benefited from positive stock selection in the industrials and financials sectors and from an underweight alloca-tion to the relatively poor performing consumer staples sector.
As we’ve discussed, the stock market experienced heavy volatility during the last 12 months. We would like to caution investors against making investment decisions based on short-term perfor-mance. We thank you for your commit-ment to Invesco Van Kampen V.I. American Franchise Fund.
1 Source: Lipper Inc.
The views and opinions expressed in management’s discussion of Fund performance are those of Invesco Advisers, Inc. These views and opinions are subject to change at any time based on factors such as mar-ket and economic conditions. These views and opin-ions may not be relied upon as investment advice or recommendations, or as an offer for a particular security. The information is not a complete analysis of every aspect of any market, country, industry, security or the Fund. Statements of fact are from sources considered reliable, but Invesco Advisers, Inc. makes no representation or warranty as to their completeness or accuracy. Although historical per-formance is no guarantee of future results, these insights may help you understand our investment management philosophy.
See important Fund and, if applicable, index disclosures later in this report.
Erik VossChartered Financial Analyst, portfolio manager, is lead manager of Invesco Van Kampen V.I. American Franchise Fund. He joined
Invesco in 2010. Mr. Voss earned a BS in mathematics and an MS in finance from the University of Wisconsin.
Ido CohenPortfolio manager, is manager of Invesco Van Kampen V.I. American Franchise Fund. He joined Invesco in 2010. Mr.
Cohen earned a BS in economics from the Wharton School of the University of Pennsylvania.

Invesco Van Kampen V.I. American Franchise Fund
Effective June 1, 2010, Class I and Class II shares of the predecessor fund, Van Kampen Life Investment Trust Capital Growth Portfolio, advised by Van Kampen Asset Management were reorganized into Series I and Series II shares, respectively, of Invesco Van Kampen V.I. Capital Growth Fund. Returns shown above for Series I and Series II shares are blended returns of the predecessor fund and Invesco Van Kampen V.I. Capital Growth Fund (renamed Invesco Van Kampen V.I. American Franchise Fund on April 30, 2012). Share class returns will differ from the predecessor fund because of different expenses.
The performance data quoted repre-sent past performance and cannot guarantee comparable future results; current performance may be lower or higher. Please contact your variable product issuer or financial adviser for the most recent month-end variable product performance. Performance figures reflect Fund expenses, rein-vested distributions and changes in net asset value. Investment return and principal value will fluctuate so that you may have a gain or loss when you sell shares.
The net annual Fund operating expense ratio set forth in the most recent Fund prospectus as of the date of this report for Series I and Series II shares was 0.90% and 1.15%, respec-tively.1 The total annual Fund operat-ing expense ratio set forth in the most recent Fund prospectus as of the date of this report for Series I and Series II shares was 0.95% and 1.20%, respec-tively. The expense ratios presented above may vary from the expense ratios presented in other sections of this report that are based on expenses incurred during the period covered by this report.
Invesco Van Kampen V.I. American Franchise Fund, a series portfolio of AIM Variable Insurance Funds (Invesco Variable Insurance Funds), is currently offered through insurance companies issuing variable products. You cannot purchase shares of the Fund directly. Performance figures given represent the Fund and are not intended to reflect actual variable product values. They do not reflect sales charges, expenses and fees assessed in connection with a variable product. Sales charges, expenses and fees, which are deter-mined by the variable product issuers, will vary and will lower the total return.
The most recent month-end perfor-mance data at the Fund level, exclud-ing variable product charges, is available at 800 451 4246. As men-tioned above, for the most recent month-end performance including vari-able product charges, please contact your variable product issuer or finan-cial adviser.
1 Total annual Fund operating expenses after any contractual fee waivers and/or expense reim-bursements by the adviser in effect through at least June 30, 2014. See current prospectus for more information.
Your Fund’s Long-Term Performance
Past performance cannot guarantee comparable future results.
Results of a $10,000 Investment — Oldest Share Class(es)Fund and index data from 12/31/02
1 Source(s): Invesco, Russell via FactSet Research Systems Inc.2 Source(s): Invesco, S&P-Dow Jones via FactSet Research Systems Inc.3 Source: Lipper Inc.
$20,651 Russell 1000 Growth Index1
$19,850 S&P 500 Index2
$19,764 Lipper VUF Large-Cap Growth Funds Index3
$19,174 Invesco Van Kampen V.I. American Franchise Fund Series I Shares
5,000
10,000
15,000
20,000
$25,000
12/1212/1112/1012/0912/0812/0712/0612/0512/0412/0312/31/02
Average Annual Total ReturnsAs of 12/31/12
Series I SharesInception (7/3/95) 7.74% 10 Years 6.73 5 Years 1.61 1 Year 13.73
Series II SharesInception (9/18/00) –3.24% 10 Years 6.46 5 Years 1.36 1 Year 13.40

Invesco Van Kampen V.I. American Franchise Fund
Invesco Van Kampen V.I. American Franchise Fund’s investment objective is to seek capital growth.
Principal risks of investing in the FundActive trading risk. The Fund engages in frequent trading of portfolio securities. Active trading results in added expenses and may result in a lower return and increased tax liability. Market risk. Market risk is the possi-bility that the market values of securities owned by the Fund will decline. Market risk may affect a single issuer, industry, sector of the economy or the market as a whole. Investments in common stocks and other equity securities generally are affected by changes in the stock markets, which fluctuate substantially over time, sometimes suddenly and sharply. Different types of stocks tend to shift in and out of favor depending on market and economic conditions. Thus, the value of the Fund’s investments will vary and at times may be lower or higher than that of other types of investments. Growth investing risk. The Fund empha-sizes a growth style of investing. Invest-ments in growth-oriented equity securities may have above-average volatility of price movement. The returns on growth securi-ties may or may not move in tandem with the returns on other styles of investing or the overall stock markets. Foreign risks. The risks of investing in securities of foreign issuers, including emerging market issuers, can include fluctuations in foreign currencies, foreign currency exchange controls, political and economic instability, differences in secu-rities regulation and trading, and foreign taxation issues. Real estate investment trusts (REITs) risk. Investing in REITs makes the Fund more susceptible to risks associated with the ownership of real estate and with the real estate industry in general and may involve duplication of manage-ment fees and certain other expenses. In addition, REITs depend upon special-ized management skills, may be less diversified, may have lower trading volume, and may be subject to more abrupt or erratic price movements than the overall securities markets. REITs must comply with certain requirements of the federal income tax law to maintain their federal income tax status.
About indexes used in this report The S&P 500® Index is an unmanaged index considered representative of the US stock market.
The Russell 1000® Growth Index is an unmanaged index considered representa-tive of large-cap growth stocks. The Russell 1000 Growth Index is a trade-mark/service mark of the Frank Russell Co. Russell® is a trademark of the Frank Russell Co.
The Lipper VUF Large-Cap Growth Funds Index is an unmanaged index considered representative of large-cap growth variable insurance underlying funds tracked by Lipper.
The Fund is not managed to track the performance of any particular index, including the index(es) defined here, and consequently, the performance of the Fund may deviate significantly from the performance of the index(es).
A direct investment cannot be made in an index. Unless otherwise indicated, index results include reinvested divi-dends, and they do not reflect sales charges. Performance of the peer group, if applicable, reflects fund expenses; performance of a market index does not.
Other informationThe returns shown in management’s discussion of Fund performance are based on net asset values calculated for shareholder transactions. Generally accepted accounting principles require adjustments to be made to the net assets of the Fund at period end for financial reporting purposes, and as such, the net asset values for shareholder transactions and the returns based on those net asset values may differ from the net asset values and returns reported in the Finan-cial Highlights. Additionally, the returns and net asset values shown throughout this report are at the Fund level only and do not include variable product issuer charges. If such charges were included, the total returns would be lower.
Industry classifications used in this report are generally according to the Global Industry Classification Standard, which was developed by and is the exclu-sive property and a service mark of MSCI Inc. and Standard & Poor’s.

Schedule of Investments(a)
December 31, 2012
Shares Value
Common Stocks & Other Equity Interests–98.11%Aerospace & Defense–2.68%
Boeing Co. (The) 154,375 $ 11,633,700
United Technologies Corp. 93,499 7,667,853
19,301,553
Air Freight & Logistics–1.12%
Expeditors International of Washington, Inc. 203,569 8,051,154
Apparel Retail–0.98%
Gap, Inc. (The) 226,982 7,045,521
Apparel, Accessories & Luxury Goods–2.15%
Coach, Inc. 125,301 6,955,458
Prada S.p.A. (Italy) 881,000 8,517,669
15,473,127
Application Software–3.88%
Autodesk, Inc.(b) 97,705 3,453,872
Citrix Systems, Inc.(b) 172,668 11,352,921
Salesforce.com, Inc.(b) 78,316 13,164,919
27,971,712
Automobile Manufacturers–1.60%
General Motors Co.(b) 400,282 11,540,130
Biotechnology–4.25%
Amgen Inc. 91,917 7,934,275
Biogen Idec Inc.(b) 34,494 5,059,235
Celgene Corp.(b) 96,658 7,607,951
Gilead Sciences, Inc.(b) 136,173 10,001,907
30,603,368
Broadcasting–1.02%
CBS Corp.–Class B 192,590 7,328,050
Cable & Satellite–6.42%
Comcast Corp.–Class A 219,558 8,207,078
DIRECTV(b) 323,416 16,222,547
DISH Network Corp.–Class A 599,403 21,818,269
46,247,894
Casinos & Gaming–0.84%
Las Vegas Sands Corp. 131,724 6,080,380
Communications Equipment–3.86%
F5 Networks, Inc.(b) 20,899 2,030,338
QUALCOMM, Inc. 415,647 25,778,427
27,808,765
Computer Hardware–7.18%
Apple Inc. 97,052 51,726,775
Computer Storage & Peripherals–2.01%
EMC Corp.(b) 571,542 14,460,013
Shares Value
Construction & Engineering–0.82%
Foster Wheeler AG (Switzerland)(b) 242,988 $ 5,909,468
Construction & Farm Machinery & Heavy Trucks–1.89%
Cummins Inc. 125,969 13,648,741
Consumer Finance–1.79%
Capital One Financial Corp. 222,381 12,882,531
Data Processing & Outsourced Services–1.84%
Visa Inc.–Class A 87,436 13,253,549
Department Stores–0.45%
Macy’s, Inc. 84,173 3,284,430
Diversified Banks–1.36%
Wells Fargo & Co. 286,180 9,781,632
Fertilizers & Agricultural Chemicals–2.05%
Monsanto Co. 109,140 10,330,101
Mosaic Co. (The) 78,232 4,430,278
14,760,379
General Merchandise Stores–0.82%
Dollar General Corp.(b) 134,048 5,910,176
Health Care Equipment–0.27%
Intuitive Surgical, Inc.(b) 3,939 1,931,567
Health Care Services–1.34%
Express Scripts Holding Co.(b) 179,336 9,684,144
Health Care Technology–0.37%
Cerner Corp.(b) 34,226 2,657,307
Home Improvement Retail–1.58%
Home Depot, Inc. (The) 94,775 5,861,834
Lowe’s Cos., Inc. 156,585 5,561,899
11,423,733
Hypermarkets & Super Centers–1.35%
Wal-Mart Stores, Inc. 142,354 9,712,813
Industrial Conglomerates–3.62%
Danaher Corp. 144,600 8,083,140
General Electric Co. 856,504 17,978,019
26,061,159
Industrial Machinery–0.94%
Ingersoll–Rand PLC 141,636 6,792,863
Integrated Oil & Gas–0.18%
Occidental Petroleum Corp. 16,582 1,270,347
Internet Retail–3.17%
Amazon.com, Inc.(b) 36,920 9,276,889
Priceline.com Inc.(b) 21,848 13,570,448
22,847,337
See accompanying Notes to Financial Statements which are an integral part of the financial statements.
Invesco Van Kampen V.I. American Franchise Fund

Shares Value
Internet Software & Services–7.14%
Baidu, Inc.–ADR (China)(b) 46,520 $ 4,665,491
eBay Inc.(b) 211,644 10,798,077
Facebook Inc.–Class A(b) 347,918 9,265,056
Google Inc.–Class A(b) 37,673 26,727,110
51,455,734
Investment Banking & Brokerage–2.48%
Goldman Sachs Group, Inc. (The) 140,292 17,895,648
IT Consulting & Other Services–1.76%
Cognizant Technology Solutions Corp.–Class A(b) 171,654 12,710,979
Movies & Entertainment–0.77%
Walt Disney Co. (The) 111,765 5,564,779
Oil & Gas Equipment & Services–4.71%
Cameron International Corp.(b) 93,825 5,297,359
National Oilwell Varco Inc. 53,208 3,636,767
Schlumberger Ltd. 135,481 9,387,478
Weatherford International Ltd.(b) 1,398,408 15,648,186
33,969,790
Oil & Gas Exploration & Production–0.84%
Anadarko Petroleum Corp. 81,074 6,024,609
Oil & Gas Refining & Marketing–0.31%
Marathon Petroleum Corp. 35,990 2,267,370
Packaged Foods & Meats–0.35%
Mondelez International Inc.–Class A 98,756 2,515,315
Pharmaceuticals–5.81%
Abbott Laboratories 139,924 9,165,022
Allergan, Inc. 73,923 6,780,957
Johnson & Johnson 144,358 10,119,496
Pfizer Inc. 631,642 15,841,581
41,907,056
Property & Casualty Insurance–0.91%
ACE Ltd. 81,932 6,538,174
Shares Value
Railroads–0.98%
Union Pacific Corp. 56,416 $ 7,092,620
Restaurants–1.27%
Chipotle Mexican Grill, Inc.(b) 10,964 3,261,352
Starbucks Corp. 110,286 5,913,535
9,174,887
Semiconductors–1.95%
Broadcom Corp.–Class A 217,576 7,225,699
Maxim Integrated Products, Inc. 233,419 6,862,519
14,088,218
Specialized REIT’s–2.00%
American Tower Corp. 186,831 14,436,431
Systems Software–1.79%
Check Point Software Technologies Ltd. (Israel)(b) 89,033 4,241,532
Oracle Corp. 259,627 8,650,772
12,892,304
Trucking–0.98%
J.B. Hunt Transport Services, Inc. 118,155 7,055,035
Wireless Telecommunication Services–2.23%
Sprint Nextel Corp.(b) 2,830,906 16,051,237
Total Common Stocks & Other Equity Interests(Cost $560,082,990) 707,090,804
Money Market Funds–1.87%Liquid Assets Portfolio–Institutional Class(c) 6,730,221 6,730,221
Premier Portfolio–Institutional Class(c) 6,730,221 6,730,221
Total Money Market Funds(Cost $13,460,442) 13,460,442
TOTAL INVESTMENTS–99.98%(Cost $573,543,432) 720,551,246
OTHER ASSETS LESS LIABILITIES–0.02% 123,620
NET ASSETS–100.00% $720,674,866
Investment Abbreviations:
ADR – American Depositary ReceiptREIT – Real Estate Investment Trust
Notes to Schedule of Investments:(a) Industry and/or sector classifications used in this report are generally according to the Global Industry Classification Standard, which was developed by and is the
exclusive property and a service mark of MSCI Inc. and Standard & Poor’s.(b) Non-income producing security.(c) The money market fund and the Fund are affiliated by having the same investment adviser.
See accompanying Notes to Financial Statements which are an integral part of the financial statements.
Invesco Van Kampen V.I. American Franchise Fund

Statement of Assets and LiabilitiesDecember 31, 2012
Statement of OperationsFor the year ended December 31, 2012
Assets:
Investments, at value (Cost $560,082,990) $ 707,090,804
Investments in affiliated money market funds, at value andcost 13,460,442
Total investments, at value (Cost $573,543,432) 720,551,246
Foreign currencies, at value (Cost $927) 851
Receivable for:Investments sold 1,061,845
Fund shares sold 309,732
Dividends 371,418
Fund expenses absorbed 15,800
Investment for trustee deferred compensation andretirement plans 213,782
Other assets 387
Total assets 722,525,061
Liabilities:
Payable for:Fund shares reacquired 795,764
Accrued fees to affiliates 598,667
Accrued other operating expenses 49,174
Trustee deferred compensation and retirement plans 406,590
Total liabilities 1,850,195
Net assets applicable to shares outstanding $ 720,674,866
Net assets consist of:
Shares of beneficial interest $ 798,888,685
Undistributed net investment income 2,413,124
Undistributed net realized gain (loss) (227,636,140)
Unrealized appreciation 147,009,197
$ 720,674,866
Net Assets:
Series I $ 496,340,818
Series II $ 224,334,048
Shares outstanding, $0.01 par value per share,with an unlimited number of shares authorized:
Series I 13,681,672
Series II 6,310,576
Series I:Net asset value per share $ 36.28
Series II:Net asset value per share $ 35.55
Investment income:
Dividends (net of foreign withholding taxes of $12,557) $ 8,038,365
Dividends from affiliated money market funds (includessecurities lending income of $624) 10,863
Total investment income 8,049,228
Expenses:
Advisory fees 3,887,163
Administrative services fees 1,460,129
Custodian fees 33,069
Distribution fees — Series II 464,701
Transfer agent fees 72,851
Trustees’ and officers’ fees and benefits 42,401
Other 124,438
Total expenses 6,084,752
Less: Fees waived (583,776)
Net expenses 5,500,976
Net investment income 2,548,252
Realized and unrealized gain (loss) from:
Net realized gain from:Investment securities (includes net gains (losses) from
securities sold to affiliates of $(479,714)) 15,713,066
Foreign currencies 1,424
15,714,490
Change in net unrealized appreciation (depreciation) of:Investment securities (8,897,809)
Foreign currencies (522)
(8,898,331)
Net realized and unrealized gain 6,816,159
Net increase in net assets resulting from operations $ 9,364,411
See accompanying Notes to Financial Statements which are an integral part of the financial statements.
Invesco Van Kampen V.I. American Franchise Fund

Statement of Changes in Net AssetsFor the years ended December 31, 2012 and 2011
2012 2011
Operations:
Net investment income (loss) $ 2,548,252 $ (583,465)
Net realized gain 15,714,490 13,210,743
Change in net unrealized appreciation (depreciation) (8,898,331) (34,132,830)
Net increase (decrease) in net assets resulting from operations 9,364,411 (21,505,552)
Share transactions-net:
Series l 370,787,226 64,098,694
Series ll 131,813,205 (18,673,081)
Net increase in net assets resulting from share transactions 502,600,431 45,425,613
Net increase in net assets 511,964,842 23,920,061
Net assets:
Beginning of year 208,710,024 184,789,963
End of year (includes undistributed net investment income (loss) of $2,413,124 and $(55,300), respectively) $720,674,866 $208,710,024
Notes to Financial StatementsDecember 31, 2012
NOTE 1—Significant Accounting Policies
Invesco Van Kampen V.I. American Franchise Fund, formerly Invesco Van Kampen V.I. Capital Growth Fund, (the “Fund”) is a series portfolio ofAIM Variable Insurance Funds (Invesco Variable Insurance Funds) (the “Trust”). The Trust is a Delaware statutory trust registered under the InvestmentCompany Act of 1940, as amended (the “1940 Act”), as an open-end series management investment company consisting of twenty-five separateportfolios, (each constituting a “Fund”). The assets, liabilities and operations of each portfolio are accounted for separately. Information presented inthese financial statements pertains only to the Fund. Matters affecting each Fund or class will be voted on exclusively by the shareholders of suchFund or class. Current Securities and Exchange Commission (“SEC”) guidance, however, requires participating insurance companies offering separateaccounts to vote shares proportionally in accordance with the instructions of the contract owners whose investments are funded by shares of eachFund or class.
The Fund’s investment objective is to seek capital growth.The Fund currently offers two classes of shares, Series I and Series II, both of which are offered to insurance company separate accounts funding
variable annuity contracts and variable life insurance policies (“variable products”).The following is a summary of the significant accounting policies followed by the Fund in the preparation of its financial statements.
A. Security Valuations — Securities, including restricted securities, are valued according to the following policy.A security listed or traded on an exchange (except convertible bonds) is valued at its last sales price or official closing price as of the close of
the customary trading session on the exchange where the security is principally traded, or lacking any sales or official closing price on a particularday, the security may be valued at the closing bid price on that day. Securities traded in the over-the-counter market are valued based on pricesfurnished by independent pricing services or market makers. When such securities are valued by an independent pricing service they may beconsidered fair valued. Futures contracts are valued at the final settlement price set by an exchange on which they are principally traded. Listedoptions are valued at the mean between the last bid and ask prices from the exchange on which they are principally traded. Options not listed onan exchange are valued by an independent source at the mean between the last bid and ask prices. For purposes of determining net asset valueper share, futures and option contracts generally are valued 15 minutes after the close of the customary trading session of the New York StockExchange (“NYSE”).
Investments in open-end and closed-end registered investment companies that do not trade on an exchange are valued at the end of day netasset value per share. Investments in open-end and closed-end registered investment companies that trade on an exchange are valued at the lastsales price or official closing price as of the close of the customary trading session on the exchange where the security is principally traded.
Debt obligations (including convertible bonds) and unlisted equities are fair valued using an evaluated quote provided by an independentpricing service. Evaluated quotes provided by the pricing service may be determined without exclusive reliance on quoted prices, and may reflectappropriate factors such as institution-size trading in similar groups of securities, developments related to specific securities, dividend rate (forunlisted equities), yield (for debt obligations), quality, type of issue, coupon rate (for debt obligations), maturity (for debt obligations), individualtrading characteristics and other market data. Debt obligations are subject to interest rate and credit risks. In addition, all debt obligationsinvolve some risk of default with respect to interest and/or principal payments.
Foreign securities’ (including foreign exchange contracts) prices are converted into U.S. dollar amounts using the applicable exchange rates asof the close of the NYSE. If market quotations are available and reliable for foreign exchange-traded equity securities, the securities will be valuedat the market quotations. Because trading hours for certain foreign securities end before the close of the NYSE, closing market quotations maybecome unreliable. If between the time trading ends on a particular security and the close of the customary trading session on the NYSE, eventsoccur that the Adviser determines are significant and make the closing price unreliable, the Fund may fair value the security. If the event is likelyto have affected the closing price of the security, the security will be valued at fair value in good faith using procedures approved by the Board of
Invesco Van Kampen V.I. American Franchise Fund

Trustees. Adjustments to closing prices to reflect fair value may also be based on a screening process of an independent pricing service toindicate the degree of certainty, based on historical data, that the closing price in the principal market where a foreign security trade is not thecurrent value as of the close of the NYSE. Foreign securities’ prices meeting the approved degree of certainty that the price is not reflective ofcurrent value will be priced at the indication of fair value from the independent pricing service. Multiple factors may be considered by theindependent pricing service in determining adjustments to reflect fair value and may include information relating to sector indices, AmericanDepositary Receipts and domestic and foreign index futures. Foreign securities may have additional risks including exchange rate changes,potential for sharply devalued currencies and high inflation, political and economic upheaval, the relative lack of issuer information, relatively lowmarket liquidity and the potential lack of strict financial and accounting controls and standards.
Securities for which market prices are not provided by any of the above methods may be valued based upon quotes furnished by independentsources. The last bid price may be used to value equity securities. The mean between the last bid and asked prices is used to value debtobligations, including corporate loans.
Securities for which market quotations are not readily available or became unreliable are valued at fair value as determined in good faith by orunder the supervision of the Trust’s officers following procedures approved by the Board of Trustees. Issuer specific events, market trends, bid/ask quotes of brokers and information providers and other market data may be reviewed in the course of making a good faith determination of asecurity’s fair value.
Valuations change in response to many factors including the historical and prospective earnings of the issuer, the value of the issuer’s assets,general economic conditions, interest rates, investor perceptions and market liquidity. Because of the inherent uncertainties of valuation, thevalues reflected in the financial statements may materially differ from the value received upon actual sale of those investments.
B. Securities Transactions and Investment Income — Securities transactions are accounted for on a trade date basis. Realized gains orlosses on sales are computed on the basis of specific identification of the securities sold. Interest income is recorded on the accrual basis fromsettlement date. Dividend income (net of withholding tax, if any) is recorded on the ex-dividend date.
The Fund may periodically participate in litigation related to Fund investments. As such, the Fund may receive proceeds from litigationsettlements. Any proceeds received are included in the Statement of Operations as realized gain (loss) for investments no longer held and asunrealized gain (loss) for investments still held.
Brokerage commissions and mark ups are considered transaction costs and are recorded as an increase to the cost basis of securitiespurchased and/or a reduction of proceeds on a sale of securities. Such transaction costs are included in the determination of net realized andunrealized gain (loss) from investment securities reported in the Statement of Operations and the Statement of Changes in Net Assets and the netrealized and unrealized gains (losses) on securities per share in the Financial Highlights. Transaction costs are included in the calculation of theFund’s net asset value and, accordingly, they reduce the Fund’s total returns. These transaction costs are not considered operating expenses andare not reflected in net investment income reported in the Statement of Operations and Statement of Changes in Net Assets, or the net investmentincome per share and ratios of expenses and net investment income reported in the Financial Highlights, nor are they limited by any expenselimitation arrangements between the Fund and the investment adviser.
The Fund allocates income and realized and unrealized capital gains and losses to a class based on the relative net assets of each class.C. Country Determination — For the purposes of making investment selection decisions and presentation in the Schedule of Investments, the
investment adviser may determine the country in which an issuer is located and/or credit risk exposure based on various factors. These factorsinclude the laws of the country under which the issuer is organized, where the issuer maintains a principal office, the country in which the issuerderives 50% or more of its total revenues and the country that has the primary market for the issuer’s securities, as well as other criteria. Amongthe other criteria that may be evaluated for making this determination are the country in which the issuer maintains 50% or more of its assets,the type of security, financial guarantees and enhancements, the nature of the collateral and the sponsor organization. Country of issuer and/orcredit risk exposure has been determined to be the United States of America, unless otherwise noted.
D. Distributions — Distributions from income and net realized capital gain, if any, are generally declared and paid to separate accounts ofparticipating insurance companies annually and recorded on the ex-dividend date.
E. Federal Income Taxes — The Fund intends to comply with the requirements of Subchapter M of the Internal Revenue Code necessary toqualify as a regulated investment company and to distribute substantially all of the Fund’s taxable earnings to shareholders. As such, the Fund willnot be subject to federal income taxes on otherwise taxable income (including net realized capital gain) that is distributed to shareholders.Therefore, no provision for federal income taxes is recorded in the financial statements.
The Fund files tax returns in the U.S. Federal jurisdiction and certain other jurisdictions. Generally, the Fund is subject to examinations by suchtaxing authorities for up to three years after the filing of the return for the tax period.
F. Expenses — Fees provided for under the Rule 12b-1 plan of a particular class of the Fund and which are directly attributable to that class arecharged to the operations of such class. All other expenses are allocated among the classes based on relative net assets.
G. Accounting Estimates — The preparation of financial statements in conformity with accounting principles generally accepted in the UnitedStates of America (“GAAP”) requires management to make estimates and assumptions that affect the reported amounts of assets and liabilities atthe date of the financial statements and the reported amounts of revenues and expenses during the reporting period including estimates andassumptions related to taxation. Actual results could differ from those estimates by a significant amount. In addition, the Fund monitors formaterial events or transactions that may occur or become known after the period-end date and before the date the financial statements arereleased to print.
H. Indemnifications — Under the Trust’s organizational documents, each Trustee, officer, employee or other agent of the Trust is indemnifiedagainst certain liabilities that may arise out of the performance of their duties to the Fund. Additionally, in the normal course of business, theFund enters into contracts, including the Fund’s servicing agreements, that contain a variety of indemnification clauses. The Fund’s maximumexposure under these arrangements is unknown as this would involve future claims that may be made against the Fund that have not yetoccurred. The risk of material loss as a result of such indemnification claims is considered remote.
I. Securities Lending — The Fund may lend portfolio securities having a market value up to one-third of the Fund’s total assets. Such loans aresecured by collateral equal to no less than the market value of the loaned securities determined daily by the securities lending provider. Suchcollateral will be cash or debt securities issued or guaranteed by the U.S. Government or any of its sponsored agencies. Cash collateral received in
Invesco Van Kampen V.I. American Franchise Fund
connection with these loans is invested in short-term money market instruments or affiliated money market funds and is shown as such on theSchedule of Investments. It is the Fund’s policy to obtain additional collateral from or return excess collateral to the borrower by the end of thenext business day, following the valuation date of the securities loaned. Therefore, the value of the collateral held may be temporarily less thanthe value of the securities on loan. Lending securities entails a risk of loss to the Fund if and to the extent that the market value of the securitiesloaned were to increase and the borrower did not increase the collateral accordingly, and the borrower fails to return the securities. Upon thefailure of the borrower to return the securities, collateral may be liquidated and the securities may be purchased on the open market to replacethe loaned securities. The Fund could experience delays and costs in gaining access to the collateral. The Fund bears the risk of any deficiency inthe amount of the collateral available for return to the borrower due to any loss on the collateral invested. Dividends received on cash collateralinvestments for securities lending transactions, which are net of compensation to counterparties, is included in Dividends from affiliated moneymarket funds on the Statement of Operations. The aggregate value of securities out on loan is shown as a footnote on the Statement of Assets andLiabilities, if any.
J. Foreign Currency Translations — Foreign currency is valued at the close of the NYSE based on quotations posted by banks and majorcurrency dealers. Portfolio securities and other assets and liabilities denominated in foreign currencies are translated into U.S. dollar amounts atdate of valuation. Purchases and sales of portfolio securities (net of foreign taxes withheld on disposition) and income items denominated inforeign currencies are translated into U.S. dollar amounts on the respective dates of such transactions. The Fund does not separately account forthe portion of the results of operations resulting from changes in foreign exchange rates on investments and the fluctuations arising fromchanges in market prices of securities held. The combined results of changes in foreign exchange rates and the fluctuation of market prices oninvestments (net of estimated foreign tax withholding) are included with the net realized and unrealized gain or loss from investments in theStatement of Operations. Reported net realized foreign currency gains or losses arise from (1) sales of foreign currencies, (2) currency gains orlosses realized between the trade and settlement dates on securities transactions, and (3) the difference between the amounts of dividends,interest, and foreign withholding taxes recorded on the Fund’s books and the U.S. dollar equivalent of the amounts actually received or paid. Netunrealized foreign currency gains and losses arise from changes in the fair values of assets and liabilities, other than investments in securities atfiscal period end, resulting from changes in exchange rates.
The Fund may invest in foreign securities which may be subject to foreign taxes on income, gains on investments or currency repatriation, aportion of which may be recoverable.
K. Foreign Currency Contracts — The Fund may enter into foreign currency contracts to manage or minimize currency or exchange rate risk.The Fund may also enter into foreign currency contracts for the purchase or sale of a security denominated in a foreign currency in order to “lockin” the U.S. dollar price of that security. A foreign currency contract is an obligation to purchase or sell a specific currency for an agreed-uponprice at a future date. The use of foreign currency contracts does not eliminate fluctuations in the price of the underlying securities the Fundowns or intends to acquire but establishes a rate of exchange in advance. Fluctuations in the value of these contracts are measured by thedifference in the contract date and reporting date exchange rates and are recorded as unrealized appreciation (depreciation) until the contractsare closed. When the contracts are closed, realized gains (losses) are recorded. Realized and unrealized gains (losses) on the contracts areincluded in the Statement of Operations. The primary risks associated with foreign currency contracts include failure of the counterparty to meetthe terms of the contract and the value of the foreign currency changing unfavorably. These risks may be in excess of the amounts reflected inthe Statement of Assets and Liabilities.
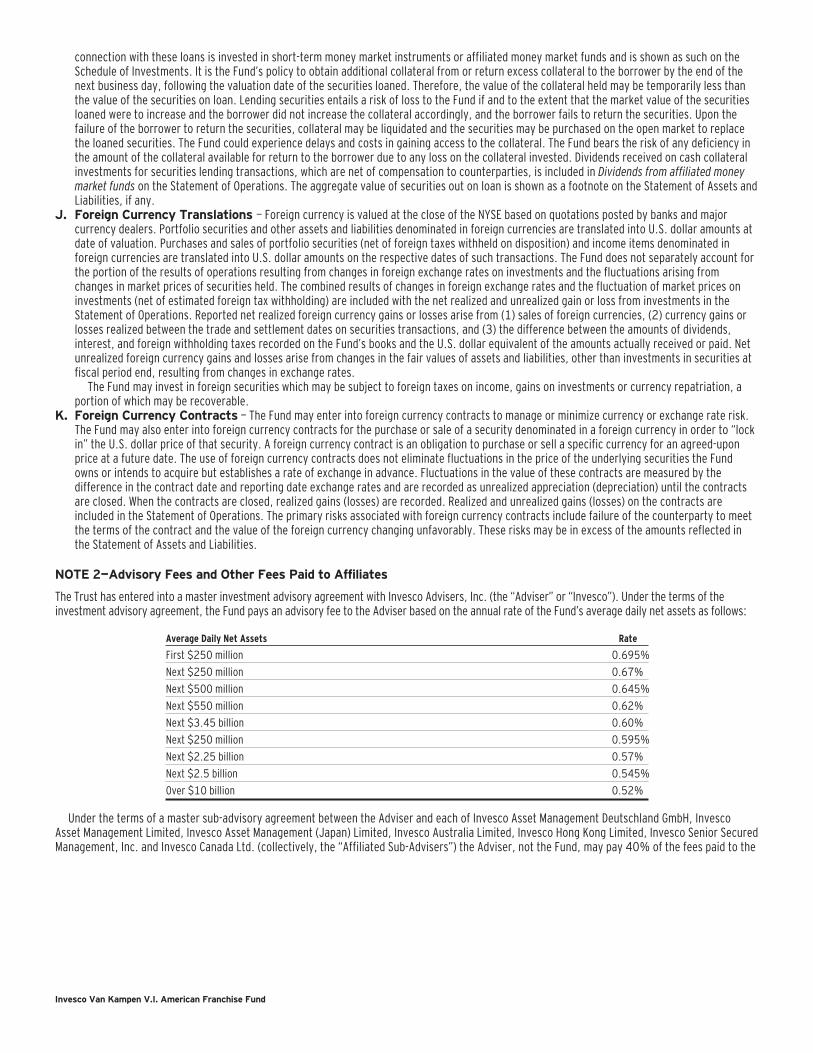
NOTE 2—Advisory Fees and Other Fees Paid to Affiliates
The Trust has entered into a master investment advisory agreement with Invesco Advisers, Inc. (the “Adviser” or “Invesco”). Under the terms of theinvestment advisory agreement, the Fund pays an advisory fee to the Adviser based on the annual rate of the Fund’s average daily net assets as follows:
Average Daily Net Assets Rate
First $250 million 0.695%
Next $250 million 0.67%
Next $500 million 0.645%
Next $550 million 0.62%
Next $3.45 billion 0.60%
Next $250 million 0.595%
Next $2.25 billion 0.57%
Next $2.5 billion 0.545%
Over $10 billion 0.52%
Under the terms of a master sub-advisory agreement between the Adviser and each of Invesco Asset Management Deutschland GmbH, InvescoAsset Management Limited, Invesco Asset Management (Japan) Limited, Invesco Australia Limited, Invesco Hong Kong Limited, Invesco Senior SecuredManagement, Inc. and Invesco Canada Ltd. (collectively, the “Affiliated Sub-Advisers”) the Adviser, not the Fund, may pay 40% of the fees paid to the
Invesco Van Kampen V.I. American Franchise Fund
Adviser to any such Affiliated Sub-Adviser(s) that provide(s) discretionary investment management services to the Fund based on the percentage ofassets allocated to such Sub-Adviser(s).
Effective July 1, 2012, the Adviser has contractually agreed, through at least June 30, 2014, to waive advisory fees and/or reimburse expenses tothe extent necessary to limit total annual fund operating expenses after fee waivers and/or expense reimbursements (excluding certain items discussedbelow) of Series I shares to 0.90% and Series II shares to 1.15% of average daily net assets. Prior to July 1, 2012, the Adviser had contractually agreedto waive advisory fees and/or reimburse expenses to the extent necessary to limit total annual fund operating expenses after fee waivers and/or expensereimbursements (excluding certain items discussed below) of Series I shares to 0.84% and Series II shares to 1.09% of average daily net assets. Indetermining the Adviser’s obligation to waive advisory fees and/or reimburse expenses, the following expenses are not taken into account, and couldcause the total annual fund operating expenses after fee waiver and/or expense reimbursement to exceed the numbers reflected above: (1) interest;(2) taxes; (3) dividend expense on short sales; (4) extraordinary or non-routine items, including litigation expenses; and (5) expenses that the Fund hasincurred but did not actually pay because of an expense offset arrangement. Unless the Board of Trustees and Invesco mutually agree to amend orcontinue the fee waiver agreement, it will terminate on June 30, 2014.
Further, the Adviser has contractually agreed, through at least June 30, 2013, to waive the advisory fee payable by the Fund in an amount equalto 100% of the net advisory fees the Adviser receives from the affiliated money market funds on investments by the Fund of uninvested cash in suchaffiliated money market funds.
For the year ended December 31, 2012, the Adviser waived advisory fees of $583,776.The Trust has entered into a master administrative services agreement with Invesco pursuant to which the Fund has agreed to pay Invesco a fee for
costs incurred in providing accounting services and fund administrative services to the Fund and to reimburse Invesco for administrative services feespaid to insurance companies that have agreed to provide services to the participants of separate accounts. These administrative services provided bythe insurance companies may include, among other things: the printing of prospectuses, financial reports and proxy statements and the delivery ofthe same to existing participants; the maintenance of master accounts; the facilitation of purchases and redemptions requested by the participants;and the servicing of participants’ accounts. Pursuant to such agreement, for the year ended December 31, 2012, Invesco was paid $139,412 foraccounting and fund administrative services and reimbursed $1,320,717 for services provided by insurance companies.
The Trust has entered into a transfer agency and service agreement with Invesco Investment Services, Inc. (“IIS”) pursuant to which the Fund hasagreed to pay IIS a fee for providing transfer agency and shareholder services to the Fund and reimburse IIS for certain expenses incurred by IIS in thecourse of providing such services. For the year ended December 31, 2012, expenses incurred under the agreement are shown in the Statement ofOperations as Transfer agent fees.
The Trust has entered into a master distribution agreement with Invesco Distributors, Inc. (“IDI”) to serve as the distributor for the Fund. The Trusthas adopted a plan pursuant to Rule 12b-1 under the 1940 Act with respect to the Fund’s Series II shares (the “Plan”). The Fund, pursuant to thePlan, pays IDI compensation at the annual rate of 0.25% of the Fund’s average daily net assets of Series II shares. Of the Plan payments, up to0.25% of the average daily net assets of the Series II shares may be paid to insurance companies who furnish continuing personal shareholderservices to customers who purchase and own Series II shares of the Fund. For the year ended December 31, 2012, expenses incurred under the Planare detailed in the Statement of Operations as Distribution fees.
For the year ended December 31, 2012, the Fund incurred $7,767 in brokerage commissions with Invesco Capital Markets, Inc., an affiliate of theAdviser and IDI, for portfolio transactions executed on behalf of the Fund.
Certain officers and trustees of the Trust are officers and directors of the Adviser, IIS and/or IDI.
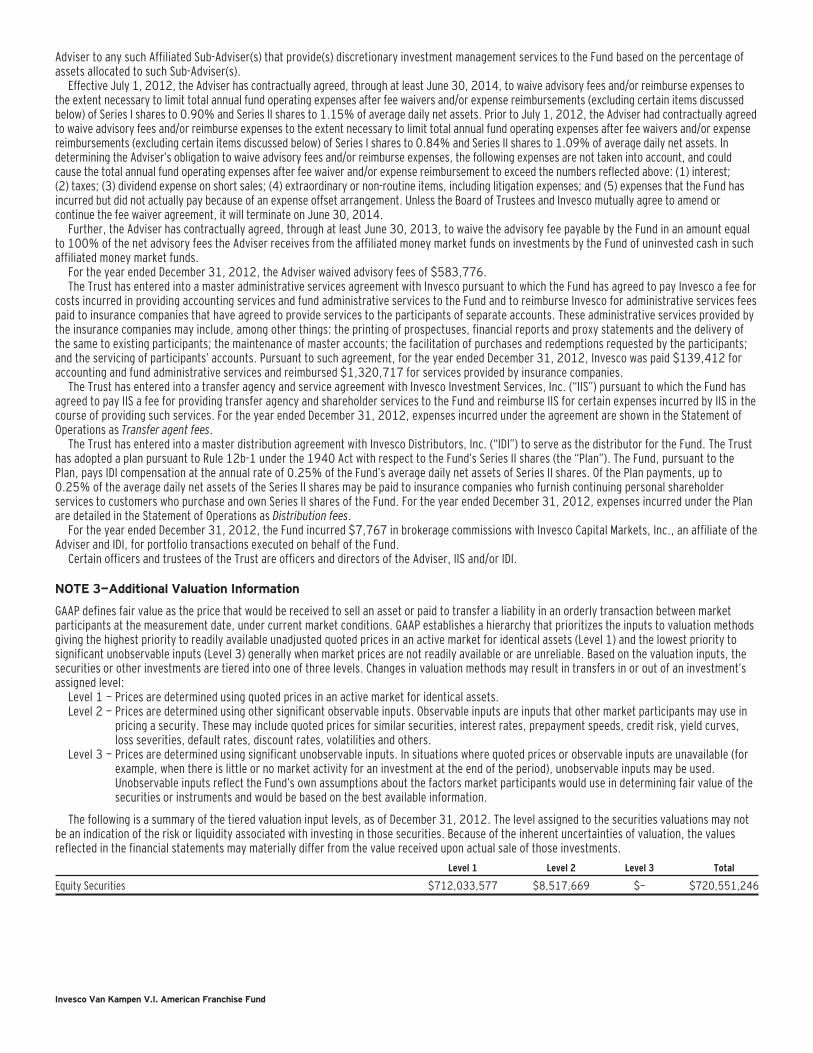
NOTE 3—Additional Valuation Information
GAAP defines fair value as the price that would be received to sell an asset or paid to transfer a liability in an orderly transaction between marketparticipants at the measurement date, under current market conditions. GAAP establishes a hierarchy that prioritizes the inputs to valuation methodsgiving the highest priority to readily available unadjusted quoted prices in an active market for identical assets (Level 1) and the lowest priority tosignificant unobservable inputs (Level 3) generally when market prices are not readily available or are unreliable. Based on the valuation inputs, thesecurities or other investments are tiered into one of three levels. Changes in valuation methods may result in transfers in or out of an investment’sassigned level:
Level 1 — Prices are determined using quoted prices in an active market for identical assets.Level 2 — Prices are determined using other significant observable inputs. Observable inputs are inputs that other market participants may use in
pricing a security. These may include quoted prices for similar securities, interest rates, prepayment speeds, credit risk, yield curves,loss severities, default rates, discount rates, volatilities and others.
Level 3 — Prices are determined using significant unobservable inputs. In situations where quoted prices or observable inputs are unavailable (forexample, when there is little or no market activity for an investment at the end of the period), unobservable inputs may be used.Unobservable inputs reflect the Fund’s own assumptions about the factors market participants would use in determining fair value of thesecurities or instruments and would be based on the best available information.
The following is a summary of the tiered valuation input levels, as of December 31, 2012. The level assigned to the securities valuations may notbe an indication of the risk or liquidity associated with investing in those securities. Because of the inherent uncertainties of valuation, the valuesreflected in the financial statements may materially differ from the value received upon actual sale of those investments.
Level 1 Level 2 Level 3 Total
Equity Securities $712,033,577 $8,517,669 $— $720,551,246
Invesco Van Kampen V.I. American Franchise Fund

NOTE 4—Security Transactions with Affiliated Funds
The Fund is permitted to purchase or sell securities from or to certain other Invesco Funds under specified conditions outlined in procedures adoptedby the Board of Trustees of the Trust. The procedures have been designed to ensure that any purchase or sale of securities by the Fund from or toanother fund or portfolio that is or could be considered an affiliate by virtue of having a common investment adviser (or affiliated investmentadvisers), common Trustees and/or common officers complies with Rule 17a-7 of the 1940 Act. Further, as defined under the procedures, eachtransaction is effected at the current market price. Pursuant to these procedures, for the year ended December 31, 2012, the Fund engaged insecurities purchases of $2,233,441 and securities sales of $1,346,851, which resulted in net realized gains (losses) of $(479,714).
NOTE 5—Trustees’ and Officers’ Fees and Benefits
“Trustees’ and Officers’ Fees and Benefits” include amounts accrued by the Fund to pay remuneration to certain Trustees and Officers of the Fund.Trustees have the option to defer compensation payable by the Fund, and “Trustees’ and Officers’ Fees and Benefits” also include amounts accrued bythe Fund to fund such deferred compensation amounts. Those Trustees who defer compensation have the option to select various Invesco Funds inwhich their deferral accounts shall be deemed to be invested. Finally, certain current Trustees are eligible to participate in a retirement plan thatprovides for benefits to be paid upon retirement to Trustees over a period of time based on the number of years of service. The Fund may have certainformer Trustees who also participate in a retirement plan and receive benefits under such plan. “Trustees’ and Officers’ Fees and Benefits” includeamounts accrued by the Fund to fund such retirement benefits. Obligations under the deferred compensation and retirement plans representunsecured claims against the general assets of the Fund.
NOTE 6—Cash Balances
The Fund is permitted to temporarily carry a negative or overdrawn balance in its account with State Street Bank and Trust Company, the custodianbank. Such balances, if any at period end, are shown in the Statement of Assets and Liabilities under the payable caption Amount due custodian. Tocompensate the custodian bank for such overdrafts, the overdrawn Fund may either (1) leave funds as a compensating balance in the account so thecustodian bank can be compensated by earning the additional interest; or (2) compensate by paying the custodian bank at a rate agreed upon by thecustodian bank and Invesco, not to exceed the contractually agreed upon rate.
NOTE 7—Distributions to Shareholders and Tax Components of Net Assets
There were no ordinary income or long-term capital gain distributions paid during the years ended December 31, 2012 and 2011.
Tax Components of Net Assets at Period-End:
2012
Undistributed ordinary income $ 2,829,665
Net unrealized appreciation — investments 144,105,590
Net unrealized appreciation — other investments 1,383
Temporary book/tax differences (381,118)
Capital loss carryforward (224,769,339)
Shares of beneficial interest 798,888,685
Total net assets $ 720,674,866
The difference between book-basis and tax-basis unrealized appreciation (depreciation) is due to differences in the timing of recognition of gainsand losses on investments for tax and book purposes. The Fund’s net unrealized appreciation difference is attributable primarily to wash sales,straddle loss deferral and partnership adjustments.
The temporary book/tax differences are a result of timing differences between book and tax recognition of income and/or expenses. The Fund’stemporary book/tax differences are the result of the trustee deferral of compensation and retirement plan benefits.
Capital loss carryforward is calculated and reported as of a specific date. Results of transactions and other activity after that date may affect theamount of capital loss carryforward actually available for the Fund to utilize. The Regulated Investment Company Modernization Act of 2010(the “Act”) eliminated the eight-year carryover period for capital losses that arise in taxable years beginning after its enactment date ofDecember 22, 2010. Consequently, these capital losses can be carried forward for an unlimited period. However, capital losses with an expirationperiod may not be used to offset capital gains until all net capital losses without an expiration date have been utilized. Additionally, post-enactmentcapital loss carryovers will retain their character as either short-term or long-term capital losses instead of as short-term capital losses as under priorlaw. The ability to utilize capital loss carryforward in the future may be limited under the Internal Revenue Code and related regulations based on theresults of future transactions.
Invesco Van Kampen V.I. American Franchise Fund
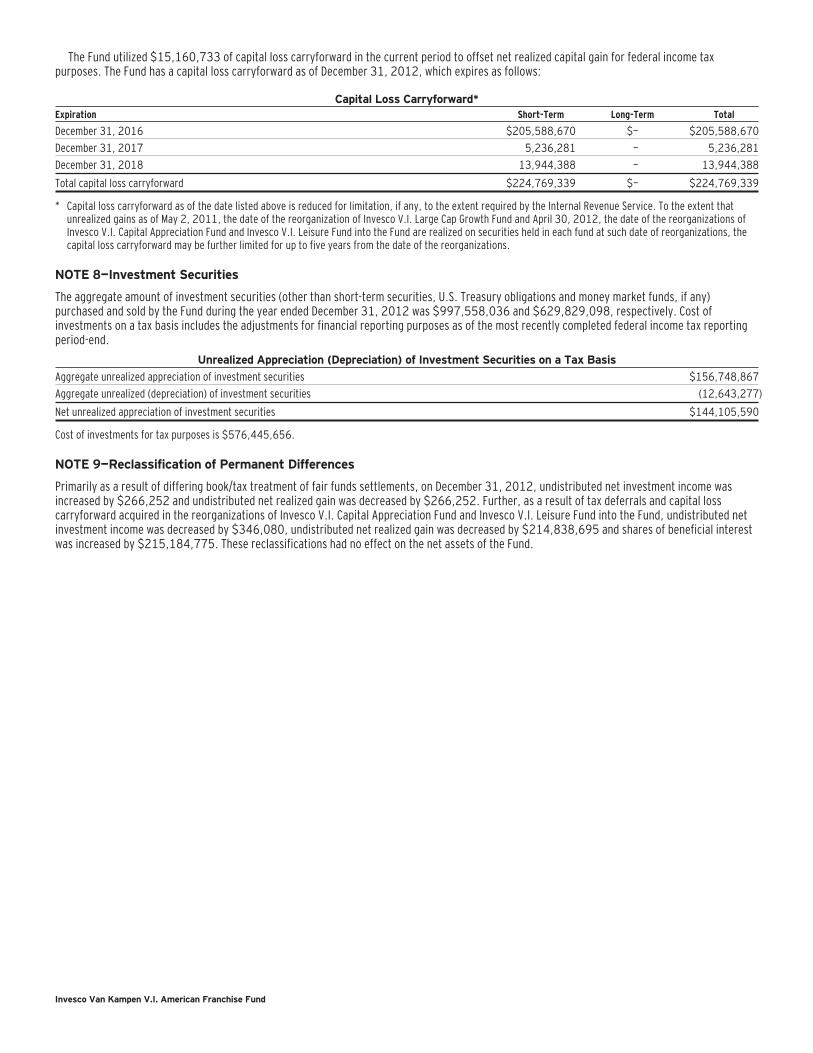
The Fund utilized $15,160,733 of capital loss carryforward in the current period to offset net realized capital gain for federal income taxpurposes. The Fund has a capital loss carryforward as of December 31, 2012, which expires as follows:
Capital Loss Carryforward*Expiration Short-Term Long-Term Total
December 31, 2016 $205,588,670 $— $205,588,670
December 31, 2017 5,236,281 — 5,236,281
December 31, 2018 13,944,388 — 13,944,388
Total capital loss carryforward $224,769,339 $— $224,769,339
* Capital loss carryforward as of the date listed above is reduced for limitation, if any, to the extent required by the Internal Revenue Service. To the extent thatunrealized gains as of May 2, 2011, the date of the reorganization of Invesco V.I. Large Cap Growth Fund and April 30, 2012, the date of the reorganizations ofInvesco V.I. Capital Appreciation Fund and Invesco V.I. Leisure Fund into the Fund are realized on securities held in each fund at such date of reorganizations, thecapital loss carryforward may be further limited for up to five years from the date of the reorganizations.
NOTE 8—Investment Securities
The aggregate amount of investment securities (other than short-term securities, U.S. Treasury obligations and money market funds, if any)purchased and sold by the Fund during the year ended December 31, 2012 was $997,558,036 and $629,829,098, respectively. Cost ofinvestments on a tax basis includes the adjustments for financial reporting purposes as of the most recently completed federal income tax reportingperiod-end.
Unrealized Appreciation (Depreciation) of Investment Securities on a Tax Basis
Aggregate unrealized appreciation of investment securities $156,748,867
Aggregate unrealized (depreciation) of investment securities (12,643,277)
Net unrealized appreciation of investment securities $144,105,590
Cost of investments for tax purposes is $576,445,656.
NOTE 9—Reclassification of Permanent Differences
Primarily as a result of differing book/tax treatment of fair funds settlements, on December 31, 2012, undistributed net investment income wasincreased by $266,252 and undistributed net realized gain was decreased by $266,252. Further, as a result of tax deferrals and capital losscarryforward acquired in the reorganizations of Invesco V.I. Capital Appreciation Fund and Invesco V.I. Leisure Fund into the Fund, undistributed netinvestment income was decreased by $346,080, undistributed net realized gain was decreased by $214,838,695 and shares of beneficial interestwas increased by $215,184,775. These reclassifications had no effect on the net assets of the Fund.
Invesco Van Kampen V.I. American Franchise Fund

NOTE 10—Share Information
Summary of Share ActivityYears ended December 31,
2012(a) 2011
Shares Amount Shares Amount
Sold:
Series I 789,397 $ 28,721,163 148,444 $ 4,995,733
Series II 320,230 11,081,001 311,666 10,470,974
Issued in connection with acquisitions:(b)(c)
Series I 11,970,981 445,461,917 2,764,202 102,182,035
Series II 4,415,803 161,335,668 17,638 641,933
Reacquired:
Series I (2,934,105) (103,395,854) (1,259,447) (43,079,074)
Series II (1,160,262) (40,603,464) (876,910) (29,785,988)
Net increase in share activity 13,402,044 $ 502,600,431 1,105,593 $ 45,425,613
(a) There are entities that are record owners of more than 5% of the outstanding shares of the Fund and in the aggregate own 20% of the outstanding shares of theFund. The Fund and the Fund’s principal underwriter or adviser, are parties to participation agreements with these entities whereby these entities sell units ofinterest in separate accounts funding variable products that are invested in the Fund. The Fund, Invesco and/or Invesco affiliates may make payments to theseentities, which are considered to be related to the Fund, for providing services to the Fund, Invesco and/or Invesco affiliates including but not limited to servicessuch as, securities brokerage, third party record keeping and account servicing and administrative services. The Fund has no knowledge as to whether all or anyportion of the shares owned of record by these entities are also owned beneficially.
(b) As of the open of business on April 30, 2012, the Fund acquired all the net assets of Invesco V.I. Capital Appreciation Fund and Invesco V.I. Leisure Fund (the“Target Funds”) pursuant to a plan of reorganization approved by the Trustees of the Fund on November 30, 2011 and by the shareholders of the Target Fundson April 2, 2012. The acquisition was accomplished by a tax-free exchange of 16,386,784 shares of the Fund for 23,847,677 shares outstanding of InvescoV.I. Capital Appreciation Fund and 2,145,577 shares outstanding of Invesco V.I. Leisure Fund as of the close of business on April 27, 2012. Each class of theTarget Funds were exchanged for the like class of shares of the Fund, based on the relative net asset value of the Target Funds to the net asset value of the Fundon the close of business, April 27, 2012. Invesco V.I. Capital Appreciation Fund’s net assets as of the close of business on April 27, 2012 of $586,894,436,including $120,477,190 of unrealized appreciation and Invesco V.I. Leisure Fund’s net assets as of the close of business on April 27, 2012 of $19,903,149,including $5,495,250 of unrealized appreciation, were combined with those of the Fund. The net assets of the Fund immediately before the acquisition were$226,713,532. The net assets immediately after the acquisition were $833,511,117.
The pro forma results of operations for the year ended December 31, 2012 assuming the reorganization had been completed on January 1, 2012, thebeginning of the annual reporting period are as follows:
Net investment income $ 2,254,431
Net realized/unrealized gains 92,187,134
Change in net assets resulting from operations $94,441,565
The combined investment portfolios have been managed as a single integrated portfolio since the acquisition was completed, it is not practicable to separatethe amounts of revenue and earnings of the Target Funds that have been included in the Fund’s Statement of Operations since April 30, 2012.
(c) As of the open of business on May 2, 2011, the Fund acquired all the net assets of Invesco V.I. Large Cap Growth Fund (the “Target Fund”) pursuant to a plan ofreorganization approved by the Trustees of the Fund on November 10, 2010 and by the shareholders of the Target Fund on April 1, 2011. The acquisition wasaccomplished by a tax-free exchange of 2,781,840 shares of the Fund for 6,596,443 shares outstanding of the Target Fund as of the close of business on April29, 2011. Each class of the Target Fund was exchanged for the like class of shares of the Fund based on the relative net asset value of the Target Fund to the netasset value of the Fund on the close of business, April 29, 2011. The Target Fund’s net assets at that date of $102,823,968, including $19,535,310 ofunrealized appreciation, were combined with those of the Fund. The net assets of the Fund immediately before the acquisition were $188,601,217. The netassets of the Fund immediately after the acquisition were $291,425,185.
The pro forma results of operations for the year ended December 31, 2011 assuming the reorganization had been completed on January 1, 2011, thebeginning of the annual reporting period are as follows:
Net investment income (loss) $ (731,640)
Net realized/unrealized gains (loss) (13,447,533)
Change in net assets resulting from operations $(14,179,173)
The combined investment portfolios have been managed as a single integrated portfolio since the acquisition was completed, it is not practicable to separatethe amounts of revenue and earnings of the Target Fund that have been included in the Fund’s Statement of Operations since May 2, 2011.
Invesco Van Kampen V.I. American Franchise Fund

NOTE 11—Financial Highlights
The following schedule presents financial highlights for a share of the Fund outstanding throughout the periods indicated.
Net assetvalue,
beginningof period
Netinvestment
income(loss)(a)
Net gains(losses)
on securities(both
realized andunrealized)
Total frominvestmentoperations
Dividendsfrom net
investmentincome
Return ofcapital
distributionsTotal
distributions
Net assetvalue, endof period
Totalreturn
Net assets,end of period
(000’s omitted)
Ratio ofexpenses
to averagenet assets
with fee waiversand/or expenses
absorbed
Ratio ofexpenses
to average netassets without
fee waiversand/or expenses
absorbed
Ratio of netinvestment
income(loss) toaverage
net assetsPortfolio
turnover(b)
Series I(c)
Year ended 12/31/12 $31.90 $ 0.19 $ 4.19 $ 4.38 $ — $ — $ — $36.28 13.73%(d) $496,341 0.88%(e) 0.98%(e) 0.52%(e) 190%Year ended 12/31/11 34.00 (0.05) (2.05) (2.10) — — — 31.90 (6.18)(d) 122,986 0.84 0.99 (0.15) 126Year ended 12/31/10 28.37 0.03 5.60 5.63 — — — 34.00 19.84(d) 74,870 0.79 0.90 0.12 158Year ended 12/31/09 17.10 0.04 11.26 11.30 (0.03) (0.00)(f) (0.03) 28.37 66.07 74,214 0.84 0.84 0.17 13Year ended 12/31/08 33.68 (0.01) (16.43) (16.44) (0.14) – (0.14) 17.10 (48.99) 48,599 0.85 0.87 (0.04) 42
Series II(c)
Year ended 12/31/12 31.35 0.10 4.10 4.20 — — — 35.55 13.40(d) 224,334 1.13(e) 1.23(e) 0.27(e) 190Year ended 12/31/11 33.49 (0.14) (2.00) (2.14) — — — 31.35 (6.39)(d) 85,724 1.09 1.24 (0.40) 126Year ended 12/31/10 28.01 (0.05) 5.53 5.48 — — — 33.49 19.56(d) 109,920 1.04 1.15 (0.18) 158Year ended 12/31/09 16.91 (0.02) 11.12 11.10 — — — 28.01 65.64(g) 112,533 1.09 1.09 (0.07) 13Year ended 12/31/08 33.29 (0.08) (16.25) (16.33) (0.05) — (0.05) 16.91 (49.11)(g) 69,198 1.10 1.12 (0.29) 42
(a) Calculated using average shares outstanding.(b) Portfolio turnover is calculated at the fund level and is not annualized for periods less than one year, if applicable. For the year ended December 31, 2012, the portfolio turnover
calculation excludes the value of securities purchased of $14,357,093 and sold of $15,173,740 in the effort to realign the Fund’s portfolio holdings after the reorganization ofInvesco V.I. Capital Appreciation Fund and Invesco V.I. Leisure Fund into the Fund. For the year ended December 31, 2011, the portfolio turnover calculation excludes the value ofsecurities purchased of $81,993,574 and sold of $49,870,241 in the effort to realign the Fund’s portfolio holdings after the reorganization of Invesco V.I. Large Cap Growth Fundinto the Fund.
(c) On June 1, 2010, the predecessor Fund’s former Class I and Class II shares were reorganized into Series I and Series II shares.(d) Includes adjustments in accordance with accounting principles generally accepted in the United States of America and as such, the net asset value for financial reporting purposes and
the returns based upon those net asset values may differ from the net asset value and returns for shareholder transactions. Total returns are not annualized for periods less than oneyear if applicable and do not reflect charges assessed in connection with a variable product, which if included would reduce total returns.
(e) Ratios are based on average daily net assets (000’s) of $387,711 and $185,880 for Series I and Series II, respectively.(f) Amount is less than $0.01 per share.(g) These returns include combined Rule 12b-1 fees and service fees of up to 0.25%.
NOTE 12—Subsequent Event
Effective May 1, 2013, the Fund will change its name to Invesco V.I. American Franchise Fund.
Invesco Van Kampen V.I. American Franchise Fund

Report of Independent Registered Public Accounting Firm
To the Board of Trustees of AIM Variable Insurance Funds (Invesco Variable Insurance Funds)and Shareholders of Invesco Van Kampen V.I. American Franchise Fund:
In our opinion, the accompanying statement of assets and liabilities, including the schedule of investments, and the related statementsof operations and of changes in net assets and the financial highlights present fairly, in all material respects, the financial position ofInvesco Van Kampen V.I. American Franchise Fund, (formerly known as Invesco Van Kampen V.I. Capital Growth Fund; one of the fundsconstituting AIM Variable Insurance Funds (Invesco Variable Insurance Funds), hereafter referred to as the “Fund”) at December 31,2012, the results of its operations for the year then ended, the changes in its net assets for each of the two years in the period thenended and the financial highlights for each of the three years in the period then ended, in conformity with accounting principlesgenerally accepted in the United States of America. These financial statements and financial highlights (hereafter referred to as“financial statements”) are the responsibility of the Fund’s management; our responsibility is to express an opinion on these financialstatements based on our audits. We conducted our audits of these financial statements in accordance with the standards of the PublicCompany Accounting Oversight Board (United States). Those standards require that we plan and perform the audit to obtain reasonableassurance about whether the financial statements are free of material misstatement. An audit includes examining, on a test basis,evidence supporting the amounts and disclosures in the financial statements, assessing the accounting principles used and significantestimates made by management, and evaluating the overall financial statement presentation. We believe that our audits, which includedconfirmation of securities at December 31, 2012 by correspondence with the custodian, provide a reasonable basis for our opinion. Thefinancial highlights of the Fund for the periods ended December 31, 2009 and prior were audited by another independent registeredpublic accounting firm whose report dated February 19, 2010 expressed an unqualified opinion on those statements.
PRICEWATERHOUSECOOPERS LLP
February 15, 2013Houston, Texas
Invesco Van Kampen V.I. American Franchise Fund

Calculating your ongoing Fund expenses
Example
As a shareholder of the Fund, you incur ongoing costs, including management fees; distribution and/or service fees (12b-1); and other Fundexpenses. This example is intended to help you understand your ongoing costs (in dollars) of investing in the Fund and to compare these costs withongoing costs of investing in other mutual funds. The example is based on an investment of $1,000 invested at the beginning of the period and heldfor the entire period July 1, 2012 through December 31, 2012.
The actual and hypothetical expenses in the examples below do not represent the effect of any fees or other expenses assessed in connection witha variable product; if they did, the expenses shown would be higher while the ending account values shown would be lower.
Actual expenses
The table below provides information about actual account values and actual expenses. You may use the information in this table, together with theamount you invested, to estimate the expenses that you paid over the period. Simply divide your account value by $1,000 (for example, an $8,600account value divided by $1,000 = 8.6), then multiply the result by the number in the table under the heading entitled “Actual Expenses Paid DuringPeriod” to estimate the expenses you paid on your account during this period.
Hypothetical example for comparison purposes
The table below also provides information about hypothetical account values and hypothetical expenses based on the Fund’s actual expense ratio andan assumed rate of return of 5% per year before expenses, which is not the Fund’s actual return.
The hypothetical account values and expenses may not be used to estimate the actual ending account balance or expenses you paid for the period. Youmay use this information to compare the ongoing costs of investing in the Fund and other funds. To do so, compare this 5% hypothetical example withthe 5% hypothetical examples that appear in the shareholder reports of the other funds.
Please note that the expenses shown in the table are meant to highlight your ongoing costs. Therefore, the hypothetical information is useful incomparing ongoing costs, and will not help you determine the relative total costs of owning different funds.
Class
BeginningAccount Value(07/01/12)
ACTUAL
HYPOTHETICAL(5% annual return before
expenses)
AnnualizedExpense
Ratio
EndingAccount Value(12/31/12)1
ExpensesPaid During
Period2
EndingAccount Value(12/31/12)
ExpensesPaid During
Period2
Series I $1,000.00 $1,047.70 $4.63 $1,020.61 $4.57 0.90%
Series II 1,000.00 1,046.20 5.91 1,019.36 5.84 1.151 The actual ending account value is based on the actual total return of the Fund for the period July 1, 2012 through December 31, 2012, after actual expenses and will differ from the
hypothetical ending account value which is based on the Fund’s expense ratio and a hypothetical annual return of 5% before expenses.2 Expenses are equal to the Fund’s annualized expense ratio as indicated above multiplied by the average account value over the period, multiplied by 184/366 to reflect the most recent
fiscal half year.
Invesco Van Kampen V.I. American Franchise Fund

Tax Information
Form 1099-DIV, Form 1042-S and other year–end tax information provide shareholders with actual calendar year amounts that should be included intheir tax returns. Shareholders should consult their tax advisors.
The following distribution information is being provided as required by the Internal Revenue Code or to meet a specific state’s requirement.The Fund designates the following amounts or, if subsequently determined to be different, the maximum amount allowable for its fiscal year ended
December 31, 2012:
Federal and State Income TaxCorporate Dividends Received Deduction* 0%
* The above percentage is based on ordinary income dividends paid to shareholders during the Fund’s fiscal year.
Invesco Van Kampen V.I. American Franchise Fund

Trustees and OfficersThe address of each trustee and officer is AIM Variable Insurance Funds (Invesco Variable Insurance Funds) (the “Trust”), 11 Greenway Plaza, Suite1000, Houston, Texas 77046-1173. The trustees serve for the life of the Trust, subject to their earlier death, incapacitation, resignation,retirement or removal as more specifically provided in the Trust’s organizational documents. Each officer serves for a one year term or until theirsuccessors are elected and qualified. Column two below includes length of time served with predecessor entities, if any.
Name, Year of Birth andPosition(s) Held with the Trust
Trustee and/or Officer Since
Principal Occupation(s)During Past 5 Years
Number ofFunds in FundComplexOverseen byTrustee
Other Directorship(s)Held by Trustee DuringPast 5 Years
Interested Persons
Martin L. Flanagan1 — 1960Trustee
2007 Executive Director, Chief Executive Officer and President, Invesco Ltd. (ultimateparent of Invesco and a global investment management firm); Advisor to theBoard, Invesco Advisers, Inc. (formerly known as Invesco Institutional (N.A.),Inc.); Trustee, The Invesco Funds; Vice Chair, Investment Company Institute;and Member of Executive Board, SMU Cox School of BusinessFormerly: Chairman and Chief Executive Officer, Invesco Advisers, Inc. (registeredinvestment adviser); Director, Chairman, Chief Executive Officer and President, IVZInc. (holding company), INVESCO Group Services, Inc. (service provider) andInvesco North American Holdings, Inc. (holding company); Director, ChiefExecutive Officer and President, Invesco Holding Company Limited (parent ofInvesco and a global investment management firm); Director, Invesco Ltd.;Chairman, Investment Company Institute and President, Co-Chief ExecutiveOfficer, Co-President, Chief Operating Officer and Chief Financial Officer, FranklinResources, Inc. (global investment management organization)
124 None
Philip A. Taylor2 — 1954Trustee, President and PrincipalExecutive Officer
2006 Head of North American Retail and Senior Managing Director, Invesco Ltd.;Director, Co-Chairman, Co-President and Co-Chief Executive Officer, InvescoAdvisers, Inc. (formerly known as Invesco Institutional (N.A.), Inc.) (registeredinvestment adviser); Director, Chairman, Chief Executive Officer andPresident, Invesco Management Group, Inc. (formerly known as Invesco AimManagement Group, Inc.) (financial services holding company); Director andPresident, INVESCO Funds Group, Inc. (registered investment adviser andregistered transfer agent); Director and Chairman, Invesco InvestmentServices, Inc. (formerly known as Invesco Aim Investment Services, Inc.)(registered transfer agent) and IVZ Distributors, Inc. (formerly known asINVESCO Distributors, Inc.) (registered broker dealer); Director, President andChairman, Invesco Inc. (holding company) and Invesco Canada Holdings Inc.(holding company); Chief Executive Officer, Invesco Corporate Class Inc.(corporate mutual fund company) and Invesco Canada Fund Inc. (corporatemutual fund company); Director, Chairman and Chief Executive Officer,Invesco Canada Ltd. (formerly known as Invesco Trimark Ltd./Invesco TrimarkLtèe) (registered investment adviser and registered transfer agent); Trustee,President and Principal Executive Officer, The Invesco Funds (other than AIMTreasurer’s Series Trust (Invesco Treasurer’s Series Trust) and Short-TermInvestments Trust); Trustee and Executive Vice President, The Invesco Funds(AIM Treasurer’s Series Trust (Invesco Treasurer’s Series Trust) and Short-Term Investments Trust only); Director, Invesco Investment Advisers LLC(formerly known as Van Kampen Asset Management); Director, Chief ExecutiveOfficer and President, Van Kampen Exchange Corp.Formerly: Director and Chairman, Van Kampen Investor Services Inc.: Director,Chief Executive Officer and President, 1371 Preferred Inc. (holding company); andVan Kampen Investments Inc.; Director and President, AIM GP Canada Inc. (generalpartner for limited partnerships); and Van Kampen Advisors, Inc.; Director andChief Executive Officer, Invesco Trimark Dealer Inc. (registered broker dealer);Director, Invesco Distributors, Inc. (formerly known as Invesco Aim Distributors,Inc.) (registered broker dealer); Manager, Invesco PowerShares CapitalManagement LLC; Director, Chief Executive Officer and President, InvescoAdvisers, Inc.; Director, Chairman, Chief Executive Officer and President, InvescoAim Capital Management, Inc.; President, Invesco Trimark Dealer Inc. and InvescoTrimark Ltd./Invesco Trimark Ltèe; Director and President, AIM Trimark CorporateClass Inc. and AIM Trimark Canada Fund Inc.; Senior Managing Director, InvescoHolding Company Limited; Trustee and Executive Vice President, Tax-FreeInvestments Trust; Director and Chairman, Fund Management Company (formerregistered broker dealer); President and Principal Executive Officer, The InvescoFunds (AIM Treasurer’s Series Trust (Invesco Treasurer’s Series Trust), Short-TermInvestments Trust and Tax-Free Investments Trust only); President, AIM TrimarkGlobal Fund Inc. and AIM Trimark Canada Fund Inc.
124 None
Wayne W. Whalen3 — 1939Trustee
2010 Of Counsel, and prior to 2010, partner in the law firm of Skadden, Arps,Slate, Meagher & Flom LLP, legal counsel to certain funds in the Fund Complex
137 Director of the Mutual FundDirectors Forum, a nonprofitmembership organization forinvestment directors;Chairman and Director of theAbraham Lincoln PresidentialLibrary Foundation; andDirector of the StevensonCenter for Democracy
1 Mr. Flanagan is considered an interested person of the Trust because he is an officer of the adviser to the Trust, and an officer and a director of Invesco Ltd., ultimate parent of theadviser to the Trust.
2 Mr. Taylor is considered an interested person of the Trust because he is an officer and a director of the adviser to, and a director of the principal underwriter of, the Trust.3 Mr. Whalen is considered an “interested person” (within the meaning of Section 2(a)(19) of the 1940 Act) of certain Funds in the Invesco Fund Complex by reason of he and his firm
currently providing legal services as legal counsel to such Funds in the Invesco Fund Complex.
Invesco Van Kampen V.I. American Franchise Fund

Trustees and Officers—(continued)
Name, Year of Birth andPosition(s) Held with the Trust
Trustee and/or Officer Since
Principal Occupation(s)During Past 5 Years
Number ofFunds in FundComplexOverseen byTrustee
Other Directorship(s)Held by Trustee DuringPast 5 Years
Independent Trustees
Bruce L. Crockett — 1944Trustee and Chair
1993 Chairman, Crockett Technologies Associates (technology consulting company)Formerly: Director, Captaris (unified messaging provider); Director, Presidentand Chief Executive Officer COMSAT Corporation; and Chairman, Board ofGovernors of INTELSAT (international communications company)
124 ACE Limited (insurancecompany); and InvestmentCompany Institute
David C. Arch — 1945Trustee
2010 Chairman and Chief Executive Officer of Blistex Inc., (consumer health careproducts manufacturer)Formerly: Member of the Heartland Alliance Advisory Board, a nonprofitorganization serving human needs based in Chicago
137 Board member of theIllinois Manufacturers’Association; Member of theBoard of Visitors, Institutefor the Humanities,University of Michigan
Frank S. Bayley — 1939Trustee
2001 RetiredFormerly: Director, Badgley Funds, Inc. (registered investment company)(2 portfolios) and General Partner and Of Counsel, law firm of Baker &McKenzie, LLP
124 Director and Chairman, C.D.Stimson Company (a realestate investmentcompany); Trustee andOverseer, The Curtisinstitute of Music
James T. Bunch — 1942Trustee
2004 Managing Member, Grumman Hill Group LLC (family office private equitymanagement)Formerly: Founder, Green, Manning & Bunch Ltd. (investment banking firm)(1988-2010); Executive Committee, United States Golf Association; andDirector, Policy Studies, Inc. and Van Gilder Insurance Corporation
124 Chairman, Board ofGovernors, Western GolfAssociation; Chairman-elect, Evans ScholarsFoundation; and Director,Denver Film Society
Rodney F. Dammeyer — 1940Trustee
2010 Chairman of CAC, LLC, (private company offering capital investment andmanagement advisory services)Formerly: Prior to 2001, Managing Partner at Equity Group CorporateInvestments; Prior to 1995, Vice Chairman of Anixter International; Prior to1985, experience includes Senior Vice President and Chief Financial Officer ofHousehold International, Inc., Executive Vice President and Chief FinancialOfficer of Northwest Industries, Inc. and Partner of Arthur Andersen & Co.;From 1987 to 2010, Director/Trustee of investment companies in the VanKampen Funds complex
126 Director of QuidelCorporation and Stericycle,Inc.; Prior to May 2008,Trustee of The ScrippsResearch Institute; Prior toFebruary 2008, Director ofVentana Medical Systems,Inc.; Prior to April 2007,Director of GATXCorporation; Prior to April2004, Director ofTheraSense, Inc.
Albert R. Dowden — 1941Trustee
2000 Director of a number of public and private business corporations, includingthe Boss Group, Ltd. (private investment and management); Reich & TangFunds (5 portfolios) (registered investment company); and Homeowners ofAmerica Holding Corporation/ Homeowners of America Insurance Company(property casualty company)Formerly: Director, Continental Energy Services, LLC (oil and gas pipelineservice); Director, CompuDyne Corporation (provider of product and servicesto the public security market) and Director, Annuity and Life Re (Holdings),Ltd. (reinsurance company); Director, President and Chief Executive Officer,Volvo Group North America, Inc.; Senior Vice President, AB Volvo; Director ofvarious public and private corporations; Chairman, DHJ Media, Inc.; DirectorMagellan Insurance Company; and Director, The Hertz Corporation, GenmarCorporation (boat manufacturer), National Media Corporation; Advisory Boardof Rotary Power International (designer, manufacturer, and seller of rotarypower engines); and Chairman, Cortland Trust, Inc. (registered investmentcompany)
124 Director of Nature’sSunshine Products, Inc.
Jack M. Fields — 1952Trustee
1997 Chief Executive Officer, Twenty First Century Group, Inc. (government affairscompany); Owner and Chief Executive Officer, Dos Angeles Ranch, L.P. (cattle,hunting, corporate entertainment); and Discovery Global Education Fund (non-profit)Formerly: Chief Executive Officer, Texana Timber LP (sustainable forestrycompany); Director of Cross Timbers Quail Research Ranch (non-profit); andmember of the U.S. House of Representatives
124 Insperity, Inc. (formerlyknown as Administaff)
Prema Mathai-Davis — 1950Trustee
1998 RetiredFormerly: Chief Executive Officer, YWCA of the U.S.A.
124 None
Larry Soll — 1942Trustee
2004 RetiredFormerly: Chairman, Chief Executive Officer and President, Synergen Corp.(a biotechnology company)
124 None
Hugo F. Sonnenschein — 1940Trustee
2010 Distinguished Service Professor and President Emeritus of the University ofChicago and the Adam Smith Distinguished Service Professor in theDepartment of Economics at the University of ChicagoFormerly: President of the University of Chicago
137 Trustee of the University ofRochester and a member ofits investment committee.Member of the NationalAcademy of Sciences, theAmerican PhilosophicalSociety and a fellow of theAmerican Academy of Artsand Sciences
Invesco Van Kampen V.I. American Franchise Fund

Trustees and Officers—(continued)
Name, Year of Birth andPosition(s) Held with the Trust
Trustee and/or Officer Since
Principal Occupation(s)During Past 5 Years
Number ofFunds in FundComplexOverseen byTrustee
Other Directorship(s)Held by Trustee DuringPast 5 Years
Independent Trustees—(continued)
Raymond Stickel, Jr. — 1944Trustee
2005 RetiredFormerly: Director, Mainstay VP Series Funds, Inc. (25 portfolios) and Partner,Deloitte & Touche
124 None
Other Officers
Russell C. Burk — 1958Senior Vice President and SeniorOfficer
2005 Senior Vice President and Senior Officer, The Invesco Funds N/A N/A
John M. Zerr — 1962Senior Vice President, ChiefLegal Officer and Secretary
2006 Director, Senior Vice President, Secretary and General Counsel, InvescoManagement Group, Inc. (formerly known as Invesco Aim Management Group,Inc.) and Van Kampen Exchange Corp.; Senior Vice President, InvescoAdvisers, Inc. (formerly known as Invesco Institutional (N.A.), Inc.) (registeredinvestment adviser); Senior Vice President and Secretary, InvescoDistributors, Inc. (formerly known as Invesco Aim Distributors, Inc.); Director,Vice President and Secretary, Invesco Investment Services, Inc. (formerlyknown as Invesco Aim Investment Services, Inc.) and IVZ Distributors, Inc.(formerly known as INVESCO Distributors, Inc.); Director and Vice President,INVESCO Funds Group, Inc.; Senior Vice President, Chief Legal Officer andSecretary, The Invesco Funds; Manager, Invesco PowerShares CapitalManagement LLC; Director, Secretary and General Counsel, InvescoInvestment Advisers LLC (formerly known as Van Kampen Asset Management);Secretary and General Counsel, Van Kampen Funds Inc. and Chief LegalOfficer, PowerShares Exchange-Traded Fund Trust, PowerShares Exchange-Traded Fund Trust II, PowerShares India Exchange-Traded Fund Trust andPowerShares Actively Managed Exchange-Traded Fund TrustFormerly: Director and Vice President, Van Kampen Advisors Inc.; Director,Vice President, Secretary and General Counsel Van Kampen Investor ServicesInc.; Director, Invesco Distributors, Inc. (formerly known as Invesco AimDistributors, Inc.); Director, Senior Vice President, General Counsel andSecretary, Invesco Advisers, Inc. and Van Kampen Investments Inc.; Director,Vice President and Secretary, Fund Management Company; Director, SeniorVice President, Secretary, General Counsel and Vice President, Invesco AimCapital Management, Inc.; Chief Operating Officer and General Counsel, LibertyRidge Capital, Inc. (an investment adviser); Vice President and Secretary,PBHG Funds (an investment company) and PBHG Insurance Series Fund (aninvestment company); Chief Operating Officer, General Counsel and Secretary,Old Mutual Investment Partners (a broker-dealer); General Counsel andSecretary, Old Mutual Fund Services (an administrator) and Old MutualShareholder Services (a shareholder servicing center); Executive VicePresident, General Counsel and Secretary, Old Mutual Capital, Inc. (aninvestment adviser); and Vice President and Secretary, Old Mutual AdvisorsFunds (an investment company)
N/A N/A
Karen Dunn Kelley — 1960Vice President
1993 Head of Invesco’s World Wide Fixed Income and Cash Management Group;Senior Vice President, Invesco Management Group, Inc. (formerly known asInvesco Aim Management Group, Inc.) and Invesco Advisers, Inc. (formerlyknown as Invesco Institutional (N.A.), Inc.) (registered investment adviser);Executive Vice President, Invesco Distributors, Inc. (formerly known asInvesco Aim Distributors, Inc.); Director, Invesco Mortgage Capital Inc.,INVESCO Global Asset Management Limited, Invesco Management CompanyLimited and INVESCO Management S.A.; Vice President, The Invesco Funds(other than AIM Treasurer’s Series Trust (Invesco Treasurer’s Series Trust) andShort-Term Investments Trust); and President and Principal Executive Officer,The Invesco Funds (AIM Treasurer’s Series Trust (Invesco Treasurer’s SeriesTrust) and Short-Term Investments Trust only)Formerly: Senior Vice President, Van Kampen Investments Inc.; VicePresident, Invesco Advisers, Inc. (formerly known as Invesco Institutional(N.A.), Inc.); Director of Cash Management and Senior Vice President, InvescoAdvisers, Inc. and Invesco Aim Capital Management, Inc.; President andPrincipal Executive Officer, Tax-Free Investments Trust; Director andPresident, Fund Management Company; Chief Cash Management Officer,Director of Cash Management, Senior Vice President, and Managing Director,Invesco Aim Capital Management, Inc.; Director of Cash Management, SeniorVice President, and Vice President, Invesco Advisers, Inc. and The InvescoFunds (AIM Treasurer’s Series Trust (Invesco Treasurer’s Series Trust), Short-Term Investments Trust and Tax-Free Investments Trust only)
N/A N/A
Invesco Van Kampen V.I. American Franchise Fund

Trustees and Officers—(continued)
Name, Year of Birth andPosition(s) Held with the Trust
Trustee and/or Officer Since
Principal Occupation(s)During Past 5 Years
Number ofFunds in FundComplexOverseen byTrustee
Other Directorship(s)Held by Trustee DuringPast 5 Years
Other Officers—(continued)
Sheri Morris — 1964Vice President, Treasurer andPrincipal Financial Officer
1999 Vice President, Treasurer and Principal Financial Officer, The Invesco Funds;Vice President, Invesco Advisers, Inc. (formerly known as Invesco Institutional(N.A.), Inc.) (registered investment adviser); and Vice President, PowerSharesExchange-Traded Fund Trust, PowerShares Exchange-Traded Fund Trust II,PowerShares India Exchange-Traded Fund Trust and PowerShares ActivelyManaged Exchange-Traded Fund TrustFormerly: Vice President, Invesco Aim Advisers, Inc., Invesco Aim CapitalManagement, Inc. and Invesco Aim Private Asset Management, Inc.; AssistantVice President and Assistant Treasurer, The Invesco Funds and Assistant VicePresident, Invesco Advisers, Inc., Invesco Aim Capital Management, Inc. andInvesco Aim Private Asset Management, Inc.; and Treasurer, PowerSharesExchange-Traded Fund Trust, PowerShares Exchange-Traded Fund Trust II,PowerShares India Exchange-Traded Fund Trust and PowerShares ActivelyManaged Exchange-Traded Fund Trust
N/A N/A
Yinka Akinsola — 1977Anti-Money LaunderingCompliance Officer
2011 Anti-Money Laundering Compliance Officer, Invesco Advisers, Inc. (formerlyknown as Invesco Institutional (N.A.), Inc.) (registered investment adviser);Invesco Distributors, Inc. (formerly known as Invesco Aim Distributors, Inc.),Invesco Investment Services, Inc. (formerly known as Invesco Aim InvestmentServices, Inc.), Invesco Management Group, Inc., The Invesco Funds, InvescoVan Kampen Closed-End Funds, Van Kampen Exchange Corp., Van KampenFunds Inc., PowerShares Exchange-Traded Fund Trust, PowerShares Exchange-Traded Fund Trust II, PowerShares India Exchange-Traded Fund Trust, andPowerShares Actively Managed Exchange-Traded Fund TrustFormerly: Regulatory Analyst III, Financial Industry Regulatory Authority(FINRA)
N/A N/A
Todd L. Spillane — 1958Chief Compliance Officer
2006 Senior Vice President, Invesco Management Group, Inc. (formerly known asInvesco Aim Management Group, Inc.) and Van Kampen Exchange Corp.;Senior Vice President and Chief Compliance Officer, Invesco Advisers, Inc.(registered investment adviser) (formerly known as Invesco Institutional(N.A.), Inc.); Chief Compliance Officer, The Invesco Funds; Vice President,Invesco Distributors, Inc. (formerly known as Invesco Aim Distributors, Inc.)and Invesco Investment Services, Inc. (formerly known as Invesco AimInvestment Services, Inc.)Formerly: Chief Compliance Officer, Invesco Van Kampen Closed-End Funds;Senior Vice President, Van Kampen Investments Inc.; Senior Vice Presidentand Chief Compliance Officer, Invesco Aim Advisers, Inc. and Invesco AimCapital Management, Inc.; Chief Compliance Officer, INVESCO Private CapitalInvestments, Inc. (holding company), Invesco Private Capital, Inc. (registeredinvestment adviser), Invesco Global Asset Management (N.A.), Inc., InvescoSenior Secured Management, Inc. (registered investment adviser), VanKampen Investor Services Inc., PowerShares Exchange-Traded Fund Trust,PowerShares Exchange-Traded Fund Trust II, PowerShares India Exchange-Traded Fund Trust and PowerShares Actively Managed Exchange-Traded FundTrust; and Vice President, Invesco Aim Capital Management, Inc. and FundManagement Company
N/A N/A
The Statement of Additional Information of the Trust includes additional information about the Fund’s Trustees and is available upon request, without charge, by calling 1.800.959.4246.Please refer to the Fund’s prospectus for information on the Fund’s sub-advisers.Office of the Fund11 Greenway Plaza, Suite 1000Houston, TX 77046-1173
Investment AdviserInvesco Advisers, Inc.1555 Peachtree Street, N.E.Atlanta, GA 30309
DistributorInvesco Distributors, Inc.11 Greenway Plaza, Suite 1000Houston, TX 77046-1173
AuditorsPricewaterhouseCoopers LLP1201 Louisiana Street, Suite 2900Houston, TX 77002-5678
Counsel to the FundStradley Ronon Stevens & Young, LLP2005 Market Street, Suite 2600Philadelphia, PA 19103-7018
Counsel to the Independent TrusteesGoodwin Procter LLP901 New York Avenue, N.W.Washington, D.C. 20001
Transfer AgentInvesco Investment Services, Inc.11 Greenway Plaza, Suite 1000Houston, TX 77046-1173
CustodianState Street Bank and Trust Company225 Franklin StreetBoston, MA 02110-2801
Invesco Van Kampen V.I. American Franchise Fund


The Fund provides a complete list of its holdings four times in each fiscal year, at the quarter-ends. For the second and fourth quarters, the lists appear in the Fund’s semiannual and annual reports to shareholders. For the first and third quarters, the Fund files the lists with the Securities and Exchange Commission (SEC) on Form N-Q. The Fund’s Form N-Q filings are available on the SEC website, sec.gov. Copies of the Fund’s Forms N-Q may be reviewed and copied at the SEC Public Reference Room in Washington, D.C. You can obtain information on the operation of the Public Reference Room, including information about duplicating fee charges, by calling 202 551 8090 or 800 732 0330, or by electronic request at the following email address: [email protected]. The SEC file numbers for the Fund are 811-07452 and 033-57340. The Fund’s most recent portfolio holdings, as filed on Form N-Q, have also been made available to insurance companies issuing variable annuity contracts and variable life insurance policies (“variable products”) that invest in the Fund.
A description of the policies and procedures that the Fund uses to determine how to vote proxies relating to portfolio securities is available without charge, upon request, from our Client Services department at 800 959 4246 or at invesco.com/proxyguidelines. The information is also available on the SEC website, sec.gov.
Information regarding how the Fund voted proxies related to its portfolio securities during the 12 months ended June 30, 2012, is available at invesco.com/proxysearch. The information is also available on the SEC website, sec.gov.
Invesco Advisers, Inc. is an investment adviser; it provides investment advisory services to individual and institutional clients and does not sell securities. Invesco Distributors, Inc. is the US distributor for Invesco Ltd.’s retail mutual funds, exchange-traded funds and institutional money market funds. Both are wholly owned, indirect subsidiaries of Invesco Ltd.
This report must be accompanied or preceded by a currently effective Fund prospectus and variable product prospectus, which contain more complete information, including sales charges and expenses. Investors should read each carefully before investing.Invesco Distributors, Inc.VIGOV-AR-1
Invesco V.I. Government Securities FundAnnual Report to Shareholders December 31, 2012

Invesco V.I. Government Securities Fund
How we investWe invest primarily in corporate bonds, US government securities, including US government agency mortgage-backed securities, and securities issued by for-eign governments, their agencies or instrumentalities. Up to 50% of the Fund’s total assets may be invested in for-eign securities, including up to 15% in securities of issuers located in developing markets, and up to 35% in lower quality, high yield debt securities. The Fund can also invest in derivative instruments, spe-cifically credit default swaps, credit default swap indices, interest rate futures and forward foreign currency contracts.
Our security selection is supported by a team of independent specialists. Team members conduct top-down macroeco-nomic as well as bottom-up analysis on individual securities. Recommendations are communicated to portfolio managers through proprietary technology that allows all investment professionals to communicate in a timely manner.
Portfolio construction begins with a well-defined Fund design that establishes the target investment vehicles for gener-ating the desired “alpha” (the extra
return above a specific benchmark) as well as the risk parameters for the Fund. Investment vehicles are evaluated for liquidity and relative value.
Sell decisions are based on:
macro risk exposure (such as duration, yield curve positioning, sector exposure).
a particular sector or issuer.
opportunity.
Market conditions and your FundDuring 2012, most major segments of the US bond market produced positive performances, buoyed by generally slow economic growth, sustained low interest rates and investor demand for yield. The US showed positive, if lethargic, eco-nomic and employment progress while signs of recession across Europe and Japan, and slowing growth in China, weighed on global demand for US goods and services. With inflation expectations
held in check by modest economic and employment growth prospects, the US Federal Reserve (the Fed), along with other major central banks around the world, continued their accommodative monetary policies and bond buying pro-grams aimed at spurring economic activ-ity by keeping interest rates low.
Throughout the year, US Treasuries experienced mild rallies and sell-offs as uncertainties with the slowing global economies, the US Presidential election, the pending ”fiscal cliff” and geopolitical risks were reflected in market prices. Treasury yields ultimately remained very low and little changed across the matu-rity spectrum from start to finish.
The low yields provided by Treasuries, and increased investor confidence that rates would remain low for an extended period, increased demand for the seg-ments of the bond market that provided relative value and higher yields than com-parable-maturity Treasuries in return for the additional risks they carry. In lieu of significant rate declines, US bond market returns for 2012 were supported by demand for riskier assets such as corpo-rate bonds and mortgage-backed securi-ties (MBS).
Sector allocation decisions that incor-porated a significant underweight posi-tion to US Treasuries and overweight exposure to higher-coupon agency debentures were advantageous for the Fund as non-Treasury sectors of the gov-ernment bond market outperformed other bond sectors during the year. Like-wise, allocations to off-benchmark Trea-sury Inflation-Protected Securities as well as short-average-life agency collateral-ized mortgage obligations and agency MBS benefited total return versus the style-specific index and contributed to a higher-than-index average portfolio yield-to-maturity for the reporting period. Our security selection decisions across the
The Fund’s holdings are subject to change, and there is no assurance that the Fund will continue to hold any particular security.*Excluding money market fund holdings.
Portfolio CompositionBy security type
US Government Sponsored Mortgage-Backed Securities 72.1%US Government Sponsored Agency Securities 19.8US Treasury Securities 12.3Foreign Bonds 2.7Corporate Bonds and Notes 1.1Money Market Funds Plus Other Assets Less Liabilities –8.0
Top 10 Fixed Income Issuers*
1. Federal National Mortgage Association 22.2%
2. Federal Home Loan Mortgage Corp. 16.6 3. Fannie Mae REMICs 13.1 4. Freddie Mac REMICs 11.4 5. Federal Home Loan Bank 8.9 6. US Treasury Notes 8.2 7. Ginnie Mae REMICs 7.1 8. Government National Mortgage
Association 4.0 9. Federal Agricultural Mortgage Corp. 3.2 10. Federal Farm Credit Bank 2.8
Performance summaryFor the year ended December 31, 2012, Invesco V.I. Government Securities Fund outperformed the Fund’s style-specific index, the Barclays U.S. Government Bond Index. Sector allocation decisions were the main contributor to outperformance versus the style-specific benchmark for the year.
Your Fund’s long-term performance appears later in this report.
Fund vs. IndexesTotal returns, 12/31/11 to 12/31/12, excluding variable product issuer charges. If variable product issuer charges were included, returns would be lower.
Series I Shares 2.47%Series II Shares 2.22Barclays U.S. Aggregate Index▼ (Broad Market Index) 4.21Barclays U.S. Government Bond Index■ (Style-Specific Index) 2.02Lipper VUF General U.S. Government Funds Index■ (Peer Group Index) 3.42
Source(s): ▼Invesco, Barclays via FactSet Research Systems Inc.; ■Lipper Inc.
Management’s Discussion of Fund Performance
Total Net Assets $1.1 billion
Total Number of Holdings* 892

Invesco V.I. Government Securities Fund
maturity, coupon, vintage and issuer strata of the residential MBS market were also helpful for the Fund’s relative returns. Among agency MBS, an empha-sis on 30-year, fixed-rate lower-coupon securities contributed to Fund returns as these securities benefited from favorable prepayment trends as well as a very posi-tive market environment where demand exceeded available supply, especially fol-lowing the Fed’s September announce-ment of “QE3”, an open-ended, bond purchasing program for lower coupon agency MBS.
The Fund also benefited from incre-mental income earned by engaging in mortgage dollar roll activity in the to-be-announced market, which involves the selling of an MBS to a financial institution with an agreement to repurchase a sub-stantially similar security at an agreed upon price and date. Excess portfolio cash resulting from the use of this strat-egy was subsequently invested in short-term instruments to generate additional return for the Fund.
The Fund uses active duration and yield curve positioning for risk management and for generating alpha versus its style-specific benchmark. Duration measures a portfolio’s price sensitivity to interest rate changes, with a shorter duration portfolio tending to be less sensitive to these changes. The Fund’s duration and yield curve positioning were maintained close to the style-specific benchmark on aver-age, but the timing of changes and degree of variance from the benchmark were negligible detractors to relative returns as rates fluctuated throughout the reporting period. Buying and selling US Treasury futures contracts were important tools we used for the manage-ment of interest rate risk and to maintain our targeted portfolio duration.
We thank you for your investment in Invesco V.I. Government Securities Fund.
The views and opinions expressed in management’s discussion of Fund performance are those of Invesco Advisers, Inc. These views and opinions are subject to change at any time based on factors such as mar-ket and economic conditions. These views and opin-ions may not be relied upon as investment advice or recommendations, or as an offer for a particular security. The information is not a complete analysis of every aspect of any market, country, industry, security or the Fund. Statements of fact are from sources considered reliable, but Invesco Advisers, Inc. makes no representation or warranty as to their completeness or accuracy. Although historical per-formance is no guarantee of future results, these insights may help you understand our investment management philosophy.
See important Fund and, if applicable, index disclosures later in this report.
Clint DudleyChartered Financial Ana-lyst, portfolio manager, is manager of Invesco V.I. Government Securities Fund. He joined Invesco in
1998. Mr. Dudley earned a BBA and an MBA from Baylor University.
Brian SchneiderChartered Financial Ana-lyst, portfolio manager, is manager of Invesco V.I. Government Securities Fund. He joined Invesco in
1987. Mr. Schneider earned a BA in eco-nomics and an MBA from Bellarmine University.

Invesco V.I. Government Securities Fund
Your Fund’s Long-Term Performance
Past performance cannot guarantee comparable future results.
Average Annual Total ReturnsAs of 12/31/12
Series I SharesInception (5/5/93) 5.07% 10 Years 4.27 5 Years 5.53 1 Year 2.47
Series II SharesInception (9/19/01) 4.38% 10 Years 4.01 5 Years 5.25 1 Year 2.22
The performance of the Fund’s Series I and Series II share classes will differ primarily due to different class expenses.
The performance data quoted repre-sent past performance and cannot guarantee comparable future results; current performance may be lower or higher. Please contact your variable product issuer or financial adviser for the most recent month-end variable product performance. Performance fig-ures reflect Fund expenses, reinvested distributions and changes in net asset value. Investment return and principal value will fluctuate so that you may have a gain or loss when you sell shares.
The net annual Fund operating expense ratio set forth in the most recent Fund prospectus as of the date of this report for Series I and Series II shares was 0.70% and 0.95%,
re spect ively.1 The total annual Fund operating expense ratio set forth in the most recent Fund prospectus as of the date of this report for Series I and Series II shares was 0.75% and 1.00%, respectively. The expense ratios pre-sented above may vary from the expense ratios presented in other sec-tions of this report that are based on expenses incurred during the period covered by this report.
Invesco V.I. Government Securities Fund, a series portfolio of AIM Variable Insurance Funds (Invesco Variable Insurance Funds), is currently offered through insurance companies issuing variable products. You cannot pur-chase shares of the Fund directly. Per-formance figures given represent the Fund and are not intended to reflect actual variable product values. They do not reflect sales charges, expenses and fees assessed in connection with a variable product. Sales charges, expenses and fees, which are deter-mined by the variable product issuers, will vary and will lower the total return.
The most recent month-end perfor-mance data at the Fund level, exclud-ing variable product charges, is available at 800 451 4246. As men-tioned above, for the most recent month-end performance including vari-able product charges, please contact your variable product issuer or finan-cial adviser.
1 Total annual Fund operating expenses after any contractual fee waivers and/or expense reim-bursements by the adviser in effect through at least April 30, 2013. See current prospectus for more information.
Results of a $10,000 Investment — Oldest Share Class(es)Fund and index data from 12/31/02
1 Source(s): Invesco, Barclays via FactSet Research Systems Inc.2 Source: Lipper Inc.
$16,575 Barclays U.S. Aggregate Index1
$15,770 Barclays U.S. Government Bond Index2
$15,640 Lipper VUF General U.S. Government Funds Index2
$15,188 Invesco V.I. Government Securities Fund—Series I Shares
5,000
10,000
15,000
$20,000
12/1212/1112/1012/0912/0812/0712/0612/0512/0412/0312/31/02

Invesco V.I. Government Securities Fund
Invesco V.I. Government Securities Fund’s investment objective is total return, comprised of current income and capital appreciation.
Principal risks of investing in the FundActive trading risk. The Fund engages in frequent trading of portfolio securities. Active trading results in added expenses and may result in a lower return and increased tax liability.
Derivatives risk. The performance of derivative instruments is tied to the per-formance of an underlying currency, security, index or other instrument. In addition to risks relating to their underly-ing instruments, the use of derivatives may include other, possibly greater, risks. Derivatives involve costs, may be volatile, and may involve a small initial investment relative to the risk assumed. Risks associated with the use of deriva-tives include counterparty, leverage, cor-relation, liquidity, tax, market, interest rate and management risks. Derivatives may also be more difficult to purchase, sell or value than other investments. The Fund may lose more than the cash amount invested on investments in derivatives.
Investors should bear in mind that, while the Fund intends to use derivative strategies, it is not obligated to actively engage in these transactions, generally or in any particular kind of derivative, if the investment manager elects not to do so due to availability, cost, market condi-tions or other factors.
Dollar roll transactions risk. Dollar roll transactions involve the risk that the market value and yield of the securities retained by the Fund may decline below the price of the mortgage-related securi-ties sold by the Fund that it is obligated to repurchase.
Interest rate risk. Interest rate risk refers to the risk that bond prices gener-ally fall as interest rates rise; conversely, bond prices generally rise as interest rates fall. Specific bonds differ in their sensitivity to changes in interest rates depending on their individual characteris-tics, including duration.
Management risk. The investment techniques and risk analysis used by the Fund’s portfolio managers may not pro-duce the desired results.
Market risk. The prices of and the income generated by the Fund’s securi-ties may decline in response to, among other things, investor sentiment, general economic and market conditions,
regional or global instability, and cur-rency and interest rate fluctuations.
Mortgage- and asset-backed securities risk. The Fund may invest in mortgage- and asset-backed securities that are sub-ject to prepayment or call risk, which is the risk that the borrower’s payments may be received earlier or later than expected due to changes in prepayment rates on underlying loans. Faster prepay-ments often happen when interest rates are falling. As a result, the Fund may rein-vest these early payments at lower inter-est rates, thereby reducing the Fund’s income. Conversely, when interest rates rise, prepayments may happen more slowly, causing the security to lengthen in duration. Longer duration securities tend to be more volatile. Securities may be prepaid at a price less than the original purchase value. An unexpectedly high rate of defaults on the mortgages held by a mortgage pool may adversely affect the value of mortgage-backed securities and could result in losses to the Fund. The risk of such defaults is generally higher in the case of mortgage pools that include subprime mortgages. Subprime mort-gages refer to loans made to borrowers with weakened credit histories or with lower capacity to make timely payments on their mortgages.
Reinvestment risk. Reinvestment risk is the risk that a bond’s cash flows (coupon income and principal repayment) will be reinvested at an interest rate below that on the original bond.
Reverse purchase agreement risk. Reverse repurchase agreements involve the risk that the market value of securi-ties to be repurchased may decline below the repurchase price or that the other party may default on its obligation, resulting in delays, additional costs or the restriction of proceeds from the sale.
Synthetic securities risk. Fluctuations in the values of synthetic securities may not correlate perfectly with the instruments they are designed to replicate. Synthetic securities may be subject to interest rate changes, market price fluctuations, counterparty risk and liquidity risk.
US government obligations risk. The Fund may invest in obligations issued by US government agencies and instrumen-talities that may receive varying levels of support from the government, which could affect the Fund’s ability to recover should they default.
About indexes used in this report The Barclays U.S. Aggregate Index is an unmanaged index considered representa-tive of the US investment-grade, fixed-rate bond market.
The Barclays U.S. Government Bond Index is an unmanaged index considered representative of fixed income obliga-tions issued by the US Treasury, govern-ment agencies and quasi-federal corporations.
The Lipper VUF General U.S. Govern-ment Funds Index is an unmanaged index considered representative of general US government variable insur-ance underlying funds tracked by Lipper.
The Fund is not managed to track the performance of any particular index, including the index(es) defined here, and consequently, the performance of the Fund may deviate significantly from the performance of the index(es).
A direct investment cannot be made in an index. Unless otherwise indicated, index results include reinvested divi-dends, and they do not reflect sales charges. Performance of the peer group, if applicable, reflects fund expenses; performance of a market index does not.
Other informationThe returns shown in management’s discussion of Fund performance are based on net asset values calculated for shareholder transactions. Generally accepted accounting principles require adjustments to be made to the net assets of the Fund at period end for financial reporting purposes, and as such, the net asset values for shareholder transactions and the returns based on those net asset values may differ from the net asset values and returns reported in the Finan-cial Highlights. Additionally, the returns and net asset values shown throughout this report are at the Fund level only and do not include variable product issuer charges. If such charges were included, the total returns would be lower.

Schedule of InvestmentsDecember 31, 2012
PrincipalAmount Value
U.S. Government Sponsored Mortgage-BackedSecurities–72.05%
Collateralized Mortgage Obligations–33.90%
Fannie Mae REMICs,4.00%, 07/25/18 to 07/25/40 $13,996,515 $ 14,907,158
4.50%, 07/25/19 to 07/25/27 6,043,126 6,206,751
5.00%, 08/25/19 to 09/25/37 17,488,644 18,229,038
4.25%, 12/25/19 to 02/25/37 10,366,605 11,018,739
3.00%, 07/25/22 to 09/25/36 14,724,706 15,171,041
2.50%, 03/25/26 4,320,481 4,503,399
7.00%, 09/18/27 812,867 954,033
6.50%, 01/25/30 to 03/25/32 2,557,579 2,938,915
3.50%, 12/25/31 1,400,778 1,422,853
4.75%, 07/25/33 2,741,026 2,788,279
5.75%, 10/25/35 943,882 1,065,260
0.51%, 05/25/36(a) 10,619,707 10,667,941
0.71%, 03/25/37 to 05/25/41(a) 15,448,849 15,543,510
0.98%, 06/25/37(a) 8,148,163 8,257,943
0.61%, 06/25/38(a) 11,680,536 11,737,157
6.58%, 06/25/39(a) 8,725,488 10,421,744
0.76%, 02/25/41(a) 9,153,596 9,222,710
0.73%, 11/25/41(a) 3,365,246 3,396,745
Fannie Mae Whole Loan,5.50%, 07/25/34 203,195 203,529
Federal Home Loan Bank,5.07%, 10/20/15 1,410,849 1,514,075
5.46%, 11/27/15 19,793,148 21,355,758
5.77%, 03/23/18 3,206,715 3,535,185
Freddie Mac REMICs,0.85%, 03/15/13 945,664 945,854
4.16%, 07/15/17 2,053 2,053
3.77%, 09/15/17 151,079 151,732
3.84%, 09/15/17 325,120 327,414
4.00%, 12/15/17 to 03/15/38 11,688,118 12,052,292
5.00%, 02/15/18 to 09/15/32 8,710,893 9,169,305
4.50%, 07/15/18 to 10/15/36 5,730,409 5,848,519
3.00%, 10/15/18 to 04/15/26 11,563,947 12,031,865
3.75%, 10/15/18 3,816,317 3,930,519
4.25%, 01/15/19 768,320 785,668
3.50%, 05/15/22 to 12/15/27 1,279,722 1,308,143
0.61%, 04/15/28 to 06/15/37(a) 15,565,867 15,669,037
5.25%, 08/15/32 3,049,220 3,084,364
5.50%, 02/15/33 2,787 2,786
0.71%, 12/15/35 to 03/15/40(a) 11,452,209 11,580,162
0.51%, 03/15/36(a) 9,885,883 9,946,043
5.75%, 05/15/36 606,242 627,331
0.56%, 11/15/36(a) 11,177,050 11,222,216
1.07%, 11/15/39(a) 3,879,424 3,923,685
0.66%, 03/15/40to 02/15/42(a) 26,374,950 26,628,052
PrincipalAmount Value
Collateralized Mortgage Obligations–(continued)
Ginnie Mae REMICs,6.00%, 01/16/25 $ 2,144,133 $ 2,417,530
4.50%, 01/16/31 to 11/20/34 35,981,520 37,078,506
4.75%, 09/20/32 1,294,247 1,342,743
4.00%, 04/16/33 to 02/20/38 15,753,440 16,419,401
5.76%, 08/20/34(a) 3,117,880 3,562,663
5.00%, 08/16/35 573,960 593,212
5.85%, 01/20/39(a) 9,550,035 11,117,334
1.01%, 09/16/39(a) 4,378,779 4,482,853
4.51%, 07/20/41(a) 2,807,255 3,185,732
384,498,777
Federal Home Loan Mortgage Corp. (FHLMC)–14.20%
Pass Through Ctfs.,6.00%, 09/01/13 to 07/01/38 4,374,009 4,796,481
7.00%, 07/01/14 to 12/01/37 9,844,254 11,565,589
6.50%, 04/01/15 to 12/01/35 9,339,299 10,650,403
8.00%, 07/01/15 to 09/01/36 9,919,104 12,217,941
5.00%, 07/01/18 to 01/01/40 5,191,520 5,674,059
10.50%, 08/01/19 2,148 2,372
4.50%, 09/01/20 to 08/01/41 23,840,208 26,234,012
8.50%, 09/01/20 to 08/01/31 831,427 994,947
10.00%, 03/01/21 46,145 54,271
9.00%, 06/01/21 to 06/01/22 319,721 366,304
7.50%, 09/01/22 to 08/01/36 3,515,230 4,216,086
5.50%, 12/01/22 to 11/01/39 2,700,731 2,944,295
3.50%, 08/01/26 2,437,515 2,612,001
3.00%, 05/01/27 3,046,868 3,268,845
7.05%, 05/20/27 238,485 274,243
6.03%, 10/20/30 1,705,511 1,949,155
Pass Through Ctfs., ARM2.93%, 09/01/35 to 07/01/36(a) 23,966,406 25,505,655
2.66%, 10/01/36(a) 5,443,583 5,815,097
2.94%, 10/01/36(a) 478,526 513,793
3.01%, 11/01/37(a) 3,656,852 3,945,865
5.32%, 01/01/38(a) 207,203 219,258
Pass Through Ctfs., TBA3.00%, 01/01/43(b) 12,200,000 12,758,532
3.50%, 01/01/43(b)(c) 23,000,000 24,464,454
161,043,658
Federal National Mortgage Association (FNMA)–19.95%
Pass Through Ctfs.,6.50%, 05/01/13 to 11/01/37 11,142,169 12,408,986
10.00%, 09/01/13 1,966 1,977
7.50%, 12/01/13 to 08/01/37 12,179,065 14,723,717
6.00%, 01/01/14 to 10/01/38 9,526,057 10,519,150
7.00%, 01/15/14 to 06/01/36 13,811,261 15,635,470
8.00%, 02/01/14 to 11/01/37 9,306,643 11,202,844
8.50%, 09/01/15 to 08/01/37 3,980,964 4,808,141
5.00%, 11/01/17 to 03/01/40 3,300,051 3,652,849
4.50%, 04/01/19 to 08/01/41 21,865,840 24,186,316
See accompanying Notes to Financial Statements which are an integral part of the financial statements.
Invesco V.I. Government Securities Fund
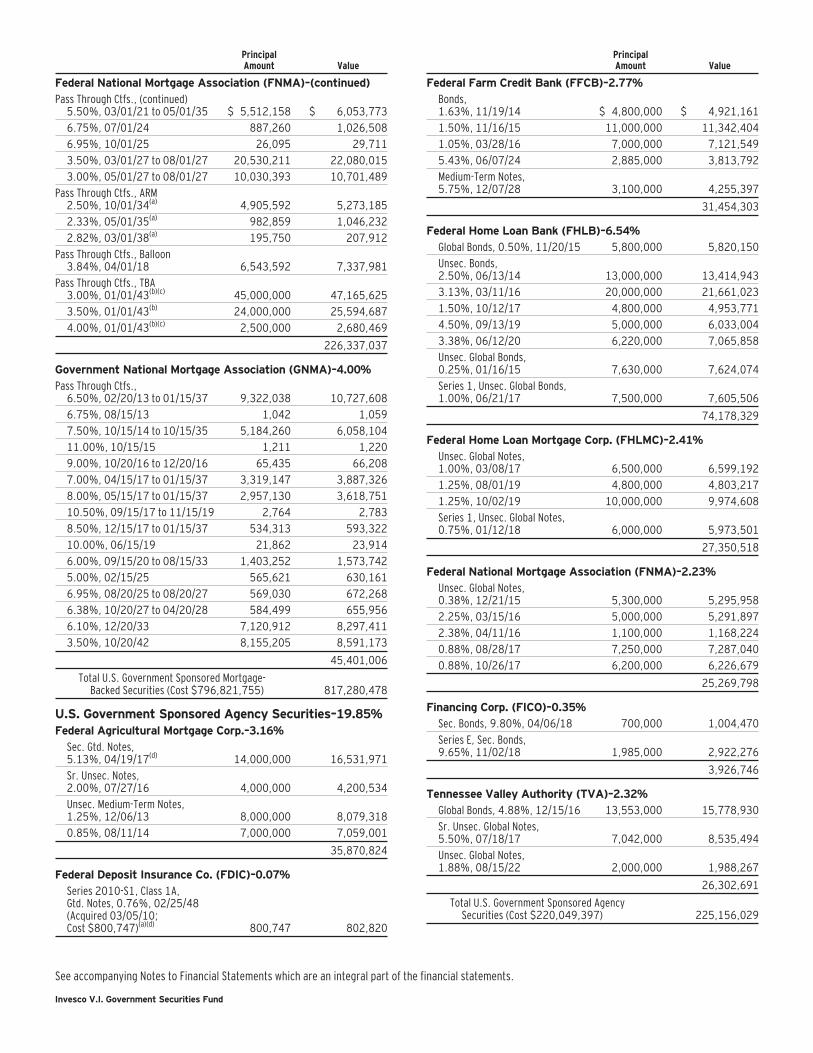
PrincipalAmount Value
Federal National Mortgage Association (FNMA)–(continued)
Pass Through Ctfs., (continued)5.50%, 03/01/21 to 05/01/35 $ 5,512,158 $ 6,053,773
6.75%, 07/01/24 887,260 1,026,508
6.95%, 10/01/25 26,095 29,711
3.50%, 03/01/27 to 08/01/27 20,530,211 22,080,015
3.00%, 05/01/27 to 08/01/27 10,030,393 10,701,489
Pass Through Ctfs., ARM2.50%, 10/01/34(a) 4,905,592 5,273,185
2.33%, 05/01/35(a) 982,859 1,046,232
2.82%, 03/01/38(a) 195,750 207,912
Pass Through Ctfs., Balloon3.84%, 04/01/18 6,543,592 7,337,981
Pass Through Ctfs., TBA3.00%, 01/01/43(b)(c) 45,000,000 47,165,625
3.50%, 01/01/43(b) 24,000,000 25,594,687
4.00%, 01/01/43(b)(c) 2,500,000 2,680,469
226,337,037
Government National Mortgage Association (GNMA)–4.00%
Pass Through Ctfs.,6.50%, 02/20/13 to 01/15/37 9,322,038 10,727,608
6.75%, 08/15/13 1,042 1,059
7.50%, 10/15/14 to 10/15/35 5,184,260 6,058,104
11.00%, 10/15/15 1,211 1,220
9.00%, 10/20/16 to 12/20/16 65,435 66,208
7.00%, 04/15/17 to 01/15/37 3,319,147 3,887,326
8.00%, 05/15/17 to 01/15/37 2,957,130 3,618,751
10.50%, 09/15/17 to 11/15/19 2,764 2,783
8.50%, 12/15/17 to 01/15/37 534,313 593,322
10.00%, 06/15/19 21,862 23,914
6.00%, 09/15/20 to 08/15/33 1,403,252 1,573,742
5.00%, 02/15/25 565,621 630,161
6.95%, 08/20/25 to 08/20/27 569,030 672,268
6.38%, 10/20/27 to 04/20/28 584,499 655,956
6.10%, 12/20/33 7,120,912 8,297,411
3.50%, 10/20/42 8,155,205 8,591,173
45,401,006
Total U.S. Government Sponsored Mortgage-Backed Securities (Cost $796,821,755) 817,280,478
U.S. Government Sponsored Agency Securities–19.85%Federal Agricultural Mortgage Corp.–3.16%
Sec. Gtd. Notes,5.13%, 04/19/17(d) 14,000,000 16,531,971
Sr. Unsec. Notes,2.00%, 07/27/16 4,000,000 4,200,534
Unsec. Medium-Term Notes,1.25%, 12/06/13 8,000,000 8,079,318
0.85%, 08/11/14 7,000,000 7,059,001
35,870,824
Federal Deposit Insurance Co. (FDIC)–0.07%
Series 2010-S1, Class 1A,Gtd. Notes, 0.76%, 02/25/48(Acquired 03/05/10;Cost $800,747)(a)(d) 800,747 802,820
PrincipalAmount Value
Federal Farm Credit Bank (FFCB)–2.77%
Bonds,1.63%, 11/19/14 $ 4,800,000 $ 4,921,161
1.50%, 11/16/15 11,000,000 11,342,404
1.05%, 03/28/16 7,000,000 7,121,549
5.43%, 06/07/24 2,885,000 3,813,792
Medium-Term Notes,5.75%, 12/07/28 3,100,000 4,255,397
31,454,303
Federal Home Loan Bank (FHLB)–6.54%
Global Bonds, 0.50%, 11/20/15 5,800,000 5,820,150
Unsec. Bonds,2.50%, 06/13/14 13,000,000 13,414,943
3.13%, 03/11/16 20,000,000 21,661,023
1.50%, 10/12/17 4,800,000 4,953,771
4.50%, 09/13/19 5,000,000 6,033,004
3.38%, 06/12/20 6,220,000 7,065,858
Unsec. Global Bonds,0.25%, 01/16/15 7,630,000 7,624,074
Series 1, Unsec. Global Bonds,1.00%, 06/21/17 7,500,000 7,605,506
74,178,329
Federal Home Loan Mortgage Corp. (FHLMC)–2.41%
Unsec. Global Notes,1.00%, 03/08/17 6,500,000 6,599,192
1.25%, 08/01/19 4,800,000 4,803,217
1.25%, 10/02/19 10,000,000 9,974,608
Series 1, Unsec. Global Notes,0.75%, 01/12/18 6,000,000 5,973,501
27,350,518
Federal National Mortgage Association (FNMA)–2.23%
Unsec. Global Notes,0.38%, 12/21/15 5,300,000 5,295,958
2.25%, 03/15/16 5,000,000 5,291,897
2.38%, 04/11/16 1,100,000 1,168,224
0.88%, 08/28/17 7,250,000 7,287,040
0.88%, 10/26/17 6,200,000 6,226,679
25,269,798
Financing Corp. (FICO)–0.35%
Sec. Bonds, 9.80%, 04/06/18 700,000 1,004,470
Series E, Sec. Bonds,9.65%, 11/02/18 1,985,000 2,922,276
3,926,746
Tennessee Valley Authority (TVA)–2.32%
Global Bonds, 4.88%, 12/15/16 13,553,000 15,778,930
Sr. Unsec. Global Notes,5.50%, 07/18/17 7,042,000 8,535,494
Unsec. Global Notes,1.88%, 08/15/22 2,000,000 1,988,267
26,302,691
Total U.S. Government Sponsored AgencySecurities (Cost $220,049,397) 225,156,029
See accompanying Notes to Financial Statements which are an integral part of the financial statements.
Invesco V.I. Government Securities Fund

PrincipalAmount Value
U.S. Treasury Securities–12.33%U.S. Treasury Bonds–2.26%
8.75%, 05/15/20 $ 3,500,000 $ 5,374,938
7.88%, 02/15/21 1,100,000 1,655,598
7.50%, 11/15/24 4,370,000 6,958,032
7.63%, 02/15/25 550,000 886,730
5.38%, 02/15/31 3,800,000 5,420,021
4.25%, 05/15/39(e) 3,685,000 4,695,349
4.38%, 11/15/39 500,000 649,593
25,640,261
U.S. Treasury Notes–8.20%
2.00%, 01/31/16 1,200,000 1,259,392
1.00%, 03/31/17 7,000,000 7,126,521
0.63%, 05/31/17 8,000,000 8,013,370
2.75%, 05/31/17(e) 10,000,000 10,935,519
2.38%, 07/31/17(e) 10,000,000 10,783,989
0.75%, 12/31/17 7,000,000 7,012,889
1.38%, 12/31/18 3,000,000 3,078,255
1.00%, 11/30/19 10,000,000 9,901,647
3.63%, 02/15/20 2,000,000 2,336,310
2.13%, 08/15/21 2,700,000 2,838,935
2.00%, 11/15/21 8,300,000 8,614,296
2.00%, 02/15/22 7,000,000 7,238,851
1.75%, 05/15/22 13,750,000 13,869,002
93,008,976
U.S. Treasury Inflation-Indexed Notes and Bonds–1.87%
Bonds, 0.75%, 02/15/42 7,370,784(f) 8,069,057
Notes,0.13%, 04/15/17 5,092,200(f) 5,452,423
0.13%, 07/15/22 7,041,300(f) 7,640,529
21,162,009
Total U.S. Treasury Securities(Cost $132,897,931) 139,811,246
PrincipalAmount Value
Foreign Bonds–2.72%Collateralized Mortgage Obligations–2.30%
La Hipotecaria S.A. de C.V. (Panama),Series 2010-1GA, Class A, FloatingRate Pass Through Ctfs.,3.00%, 09/08/39(Acquired 11/05/10;Cost $25,818,450)(a)(d) $24,990,636 $ 26,052,738
Sovereign Debt–0.42%
Israel Government Agency forInternational Development (AID)Bond, Gtd. Bonds,5.13%, 11/01/24 3,800,000 4,834,219
Total Foreign Bonds(Cost $29,606,100) 30,886,957
Corporate Bonds and Notes–1.08%Private Export Funding Corp., Sec. Gtd.
Notes,1.38%, 02/15/17 5,000,000 5,132,874
2.13%, 07/15/16 5,000,000 5,272,824
4.30%, 12/15/21 1,540,000 1,846,128
Total Corporate Bonds and Notes(Cost $11,525,474) 12,251,826
Shares
Money Market Funds–2.30%Government & Agency Portfolio–
Institutional Class(Cost $26,041,432)(g) 26,041,432 26,041,432
TOTAL INVESTMENTS–110.33%(Cost $1,216,942,089) 1,251,427,968
OTHER ASSETS LESS LIABILITIES–(10.33)% (117,133,519)
NET ASSETS–100.00% $1,134,294,449
Investment Abbreviations:
ARM – Adjustable Rate MortgageCtfs. – CertificatesGtd. – GuaranteedREMIC – Real Estate Mortgage Investment ConduitSec. – SecuredSr. – SeniorTBA – To Be AnnouncedUnsec. – Unsecured
Notes to Schedule of Investments:(a) Interest or dividend rate is redetermined periodically. Rate shown is the rate in effect on December 31, 2012.(b) Security purchased on a forward commitment basis.(c) Security is subject to dollar roll transactions. See Note 1I.(d) Security purchased or received in a transaction exempt from registration under the Securities Act of 1933, as amended. The security may be resold pursuant to
an exemption from registration under the 1933 Act, typically to qualified institutional buyers. The aggregate value of these securities at December 31, 2012was $43,387,529, which represented 3.83% of the Fund’s Net Assets.
(e) All or a portion of the value was pledged as collateral to cover margin requirements for open futures contracts. See Note 1J and Note 4.(f) Principal amount of security and interest payments are adjusted for inflation.(g) The money market fund and the Fund are affiliated by having the same investment adviser.
See accompanying Notes to Financial Statements which are an integral part of the financial statements.
Invesco V.I. Government Securities Fund

Statement of Assets and LiabilitiesDecember 31, 2012
Statement of OperationsFor the year ended December 31, 2012
Assets:
Investments, at value (Cost $1,190,900,657) $1,225,386,536
Investments in affiliated money market funds, at valueand cost 26,041,432
Total investments, at value (Cost $1,216,942,089) 1,251,427,968
Receivable for:Investments sold 1,246
Fund shares sold 295,679
Dividends and interest 4,032,894
Principal paydowns 446,200
Investment for trustee deferred compensation andretirement plans 77,866
Other assets 17,189
Total assets 1,256,299,042
Liabilities:
Payable for:Investments purchased 119,605,206
Fund shares reacquired 716,173
Variation margin 440,761
Accrued fees to affiliates 879,661
Accrued other operating expenses 133,382
Trustee deferred compensation and retirement plans 229,410
Total liabilities 122,004,593
Net assets applicable to shares outstanding $1,134,294,449
Net assets consist of:
Shares of beneficial interest $1,074,437,523
Undistributed net investment income 29,658,894
Undistributed net realized gain (loss) (3,221,060)
Unrealized appreciation 33,419,092
$1,134,294,449
Net Assets:
Series I $ 873,211,611
Series II $ 261,082,838
Shares outstanding, $0.001 par value per share,with an unlimited number of shares authorized:
Series I 70,427,420
Series II 21,247,460
Series I:Net asset value per share $ 12.40
Series II:Net asset value per share $ 12.29
Investment income:
Interest $25,745,884
Dividends from affiliated money market funds 4,459
Total investment income 25,750,343
Expenses:
Advisory fees 5,544,463
Administrative services fees 3,203,848
Custodian fees 58,852
Distribution fees — Series II 687,286
Transfer agent fees 36,921
Trustees’ and officers’ fees and benefits 67,964
Other 215,915
Total expenses 9,815,249
Less: Fees waived (1,316,203)
Net expenses 8,499,046
Net investment income 17,251,297
Realized and unrealized gain (loss) from:
Net realized gain from:Investment securities 13,436,023
Futures contracts 6,125,828
19,561,851
Change in net unrealized appreciation (depreciation) of:Investment securities (5,848,654)
Futures contracts (2,407,945)
(8,256,599)
Net realized and unrealized gain 11,305,252
Net increase in net assets resulting from operations $28,556,549
See accompanying Notes to Financial Statements which are an integral part of the financial statements.
Invesco V.I. Government Securities Fund
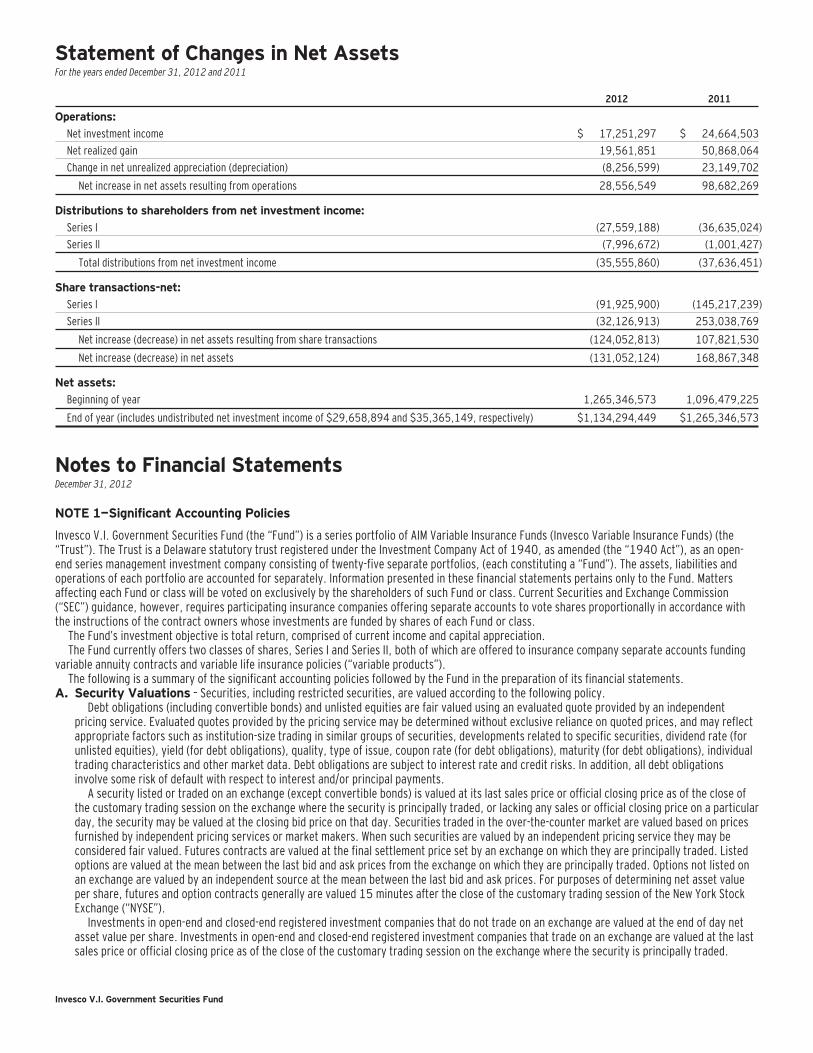
Statement of Changes in Net AssetsFor the years ended December 31, 2012 and 2011
2012 2011
Operations:
Net investment income $ 17,251,297 $ 24,664,503
Net realized gain 19,561,851 50,868,064
Change in net unrealized appreciation (depreciation) (8,256,599) 23,149,702
Net increase in net assets resulting from operations 28,556,549 98,682,269
Distributions to shareholders from net investment income:
Series I (27,559,188) (36,635,024)
Series ll (7,996,672) (1,001,427)
Total distributions from net investment income (35,555,860) (37,636,451)
Share transactions-net:
Series l (91,925,900) (145,217,239)
Series ll (32,126,913) 253,038,769
Net increase (decrease) in net assets resulting from share transactions (124,052,813) 107,821,530
Net increase (decrease) in net assets (131,052,124) 168,867,348
Net assets:
Beginning of year 1,265,346,573 1,096,479,225
End of year (includes undistributed net investment income of $29,658,894 and $35,365,149, respectively) $1,134,294,449 $1,265,346,573
Notes to Financial StatementsDecember 31, 2012
NOTE 1—Significant Accounting Policies
Invesco V.I. Government Securities Fund (the “Fund”) is a series portfolio of AIM Variable Insurance Funds (Invesco Variable Insurance Funds) (the“Trust”). The Trust is a Delaware statutory trust registered under the Investment Company Act of 1940, as amended (the “1940 Act”), as an open-end series management investment company consisting of twenty-five separate portfolios, (each constituting a “Fund”). The assets, liabilities andoperations of each portfolio are accounted for separately. Information presented in these financial statements pertains only to the Fund. Mattersaffecting each Fund or class will be voted on exclusively by the shareholders of such Fund or class. Current Securities and Exchange Commission(“SEC”) guidance, however, requires participating insurance companies offering separate accounts to vote shares proportionally in accordance withthe instructions of the contract owners whose investments are funded by shares of each Fund or class.
The Fund’s investment objective is total return, comprised of current income and capital appreciation.The Fund currently offers two classes of shares, Series I and Series II, both of which are offered to insurance company separate accounts funding
variable annuity contracts and variable life insurance policies (“variable products”).The following is a summary of the significant accounting policies followed by the Fund in the preparation of its financial statements.
A. Security Valuations – Securities, including restricted securities, are valued according to the following policy.Debt obligations (including convertible bonds) and unlisted equities are fair valued using an evaluated quote provided by an independent
pricing service. Evaluated quotes provided by the pricing service may be determined without exclusive reliance on quoted prices, and may reflectappropriate factors such as institution-size trading in similar groups of securities, developments related to specific securities, dividend rate (forunlisted equities), yield (for debt obligations), quality, type of issue, coupon rate (for debt obligations), maturity (for debt obligations), individualtrading characteristics and other market data. Debt obligations are subject to interest rate and credit risks. In addition, all debt obligationsinvolve some risk of default with respect to interest and/or principal payments.
A security listed or traded on an exchange (except convertible bonds) is valued at its last sales price or official closing price as of the close ofthe customary trading session on the exchange where the security is principally traded, or lacking any sales or official closing price on a particularday, the security may be valued at the closing bid price on that day. Securities traded in the over-the-counter market are valued based on pricesfurnished by independent pricing services or market makers. When such securities are valued by an independent pricing service they may beconsidered fair valued. Futures contracts are valued at the final settlement price set by an exchange on which they are principally traded. Listedoptions are valued at the mean between the last bid and ask prices from the exchange on which they are principally traded. Options not listed onan exchange are valued by an independent source at the mean between the last bid and ask prices. For purposes of determining net asset valueper share, futures and option contracts generally are valued 15 minutes after the close of the customary trading session of the New York StockExchange (“NYSE”).
Investments in open-end and closed-end registered investment companies that do not trade on an exchange are valued at the end of day netasset value per share. Investments in open-end and closed-end registered investment companies that trade on an exchange are valued at the lastsales price or official closing price as of the close of the customary trading session on the exchange where the security is principally traded.
Invesco V.I. Government Securities Fund

Foreign securities’ (including foreign exchange contracts) prices are converted into U.S. dollar amounts using the applicable exchange rates asof the close of the NYSE. If market quotations are available and reliable for foreign exchange-traded equity securities, the securities will be valuedat the market quotations. Because trading hours for certain foreign securities end before the close of the NYSE, closing market quotations maybecome unreliable. If between the time trading ends on a particular security and the close of the customary trading session on the NYSE, eventsoccur that the Adviser determines are significant and make the closing price unreliable, the Fund may fair value the security. If the event is likelyto have affected the closing price of the security, the security will be valued at fair value in good faith using procedures approved by the Board ofTrustees. Adjustments to closing prices to reflect fair value may also be based on a screening process of an independent pricing service toindicate the degree of certainty, based on historical data, that the closing price in the principal market where a foreign security trade is not thecurrent value as of the close of the NYSE. Foreign securities’ prices meeting the approved degree of certainty that the price is not reflective ofcurrent value will be priced at the indication of fair value from the independent pricing service. Multiple factors may be considered by theindependent pricing service in determining adjustments to reflect fair value and may include information relating to sector indices, AmericanDepositary Receipts and domestic and foreign index futures. Foreign securities may have additional risks including exchange rate changes,potential for sharply devalued currencies and high inflation, political and economic upheaval, the relative lack of issuer information, relatively lowmarket liquidity and the potential lack of strict financial and accounting controls and standards.
Securities for which market prices are not provided by any of the above methods may be valued based upon quotes furnished by independentsources. The last bid price may be used to value equity securities. The mean between the last bid and asked prices is used to value debtobligations, including corporate loans.
Securities for which market quotations are not readily available or became unreliable are valued at fair value as determined in good faith by orunder the supervision of the Trust’s officers following procedures approved by the Board of Trustees. Issuer specific events, market trends, bid/ask quotes of brokers and information providers and other market data may be reviewed in the course of making a good faith determination of asecurity’s fair value.
Valuations change in response to many factors including the historical and prospective earnings of the issuer, the value of the issuer’s assets,general economic conditions, interest rates, investor perceptions and market liquidity. Because of the inherent uncertainties of valuation, thevalues reflected in the financial statements may materially differ from the value received upon actual sale of those investments.
B. Securities Transactions and Investment Income – Securities transactions are accounted for on a trade date basis. Realized gains orlosses on sales are computed on the basis of specific identification of the securities sold. Interest income is recorded on the accrual basis fromsettlement date. Paydown gains and losses on mortgage and asset-backed securities are recorded as adjustments to interest income. Dividendincome (net of withholding tax, if any) is recorded on the ex-dividend date. Bond premiums and discounts are amortized and/or accreted forfinancial reporting purposes.
The Fund may periodically participate in litigation related to Fund investments. As such, the Fund may receive proceeds from litigationsettlements. Any proceeds received are included in the Statement of Operations as realized gain (loss) for investments no longer held and asunrealized gain (loss) for investments still held.
Brokerage commissions and mark ups are considered transaction costs and are recorded as an increase to the cost basis of securitiespurchased and/or a reduction of proceeds on a sale of securities. Such transaction costs are included in the determination of net realized andunrealized gain (loss) from investment securities reported in the Statement of Operations and the Statement of Changes in Net Assets and the netrealized and unrealized gains (losses) on securities per share in the Financial Highlights. Transaction costs are included in the calculation of theFund’s net asset value and, accordingly, they reduce the Fund’s total returns. These transaction costs are not considered operating expenses andare not reflected in net investment income reported in the Statement of Operations and Statement of Changes in Net Assets, or the net investmentincome per share and ratios of expenses and net investment income reported in the Financial Highlights, nor are they limited by any expenselimitation arrangements between the Fund and the investment adviser.
The Fund allocates income and realized and unrealized capital gains and losses to a class based on the relative net assets of each class.C. Country Determination – For the purposes of making investment selection decisions and presentation in the Schedule of Investments, the
investment adviser may determine the country in which an issuer is located and/or credit risk exposure based on various factors. These factorsinclude the laws of the country under which the issuer is organized, where the issuer maintains a principal office, the country in which the issuerderives 50% or more of its total revenues and the country that has the primary market for the issuer’s securities, as well as other criteria. Amongthe other criteria that may be evaluated for making this determination are the country in which the issuer maintains 50% or more of its assets,the type of security, financial guarantees and enhancements, the nature of the collateral and the sponsor organization. Country of issuer and/orcredit risk exposure has been determined to be the United States of America, unless otherwise noted.
D. Distributions – Distributions from income and net realized capital gain, if any, are generally declared and paid to separate accounts ofparticipating insurance companies annually and recorded on the ex-dividend date.
E. Federal Income Taxes – The Fund intends to comply with the requirements of Subchapter M of the Internal Revenue Code necessary toqualify as a regulated investment company and to distribute substantially all of the Fund’s taxable earnings to shareholders. As such, the Fund willnot be subject to federal income taxes on otherwise taxable income (including net realized capital gain) that is distributed to shareholders.Therefore, no provision for federal income taxes is recorded in the financial statements.
The Fund files tax returns in the U.S. Federal jurisdiction and certain other jurisdictions. Generally, the Fund is subject to examinations by suchtaxing authorities for up to three years after the filing of the return for the tax period.
F. Expenses – Fees provided for under the Rule 12b-1 plan of a particular class of the Fund and which are directly attributable to that class arecharged to the operations of such class. All other expenses are allocated among the classes based on relative net assets.
G. Accounting Estimates – The preparation of financial statements in conformity with accounting principles generally accepted in theUnited States of America (“GAAP”) requires management to make estimates and assumptions that affect the reported amounts of assets andliabilities at the date of the financial statements and the reported amounts of revenues and expenses during the reporting period includingestimates and assumptions related to taxation. Actual results could differ from those estimates by a significant amount. In addition, the Fundmonitors for material events or transactions that may occur or become known after the period-end date and before the date the financialstatements are released to print.
Invesco V.I. Government Securities Fund

H. Indemnifications – Under the Trust’s organizational documents, each Trustee, officer, employee or other agent of the Trust is indemnifiedagainst certain liabilities that may arise out of the performance of their duties to the Fund. Additionally, in the normal course of business, theFund enters into contracts, including the Fund’s servicing agreements, that contain a variety of indemnification clauses. The Fund’s maximumexposure under these arrangements is unknown as this would involve future claims that may be made against the Fund that have not yetoccurred. The risk of material loss as a result of such indemnification claims is considered remote.
I. Dollar Rolls and Forward Commitment Transactions — The Fund may enter into dollar roll transactions to enhance the Fund’sperformance. The Fund executes its dollar roll transactions in the to be announced (“TBA”) market whereby the Fund makes a forwardcommitment to purchase a security and, instead of accepting delivery, the position is offset by the sale of the security with a simultaneousagreement to repurchase at a future date.
The Fund accounts for dollar roll transactions as purchases and sales and realizes gains and losses on these transactions. These transactionsincrease the Fund’s portfolio turnover rate. The Fund will segregate liquid assets in an amount equal to its dollar roll commitments. Dollar rolltransactions are considered borrowings under the 1940 Act.
Dollar roll transactions involve the risk that a counter-party to the transaction may fail to complete the transaction. If this occurs, the Fundmay lose the opportunity to purchase or sell the security at the agreed upon price. Dollar rolls transactions also involve the risk that the value ofthe securities retained by the Fund may decline below the price of the securities that the Fund has sold but is obligated to purchase under theagreement.
J. Futures Contracts – The Fund may enter into futures contracts to manage exposure to interest rate, equity and market price movements and/or currency risks. A futures contract is an agreement between two parties to purchase or sell a specified underlying security, currency orcommodity (or delivery of a cash settlement price, in the case of an index future) for a fixed price at a future date. The Fund currently invests onlyin exchange-traded futures and they are standardized as to maturity date and underlying financial instrument. Initial margin deposits requiredupon entering into futures contracts are satisfied by the segregation of specific securities or cash as collateral at the futures commissionmerchant (broker). During the period the futures contracts are open, changes in the value of the contracts are recognized as unrealized gains orlosses by recalculating the value of the contracts on a daily basis. Subsequent or variation margin payments are received or made dependingupon whether unrealized gains or losses are incurred. These amounts are reflected as receivables or payables on the Statement of Assets andLiabilities. When the contracts are closed or expire, the Fund recognizes a realized gain or loss equal to the difference between the proceedsfrom, or cost of, the closing transaction and the Fund’s basis in the contract. The net realized gain (loss) and the change in unrealized gain (loss)on futures contracts held during the period is included on the Statement of Operations. The primary risks associated with futures contracts aremarket risk and the absence of a liquid secondary market. If the Fund were unable to liquidate a futures contract and/or enter into an offsettingclosing transaction, the Fund would continue to be subject to market risk with respect to the value of the contracts and continue to be required tomaintain the margin deposits on the futures contracts. Futures contracts have minimal counterparty risk since the exchange’s clearinghouse, ascounterparty to all exchange-traded futures, guarantees the futures against default. Risks may exceed amounts recognized in the Statement ofAssets and Liabilities.
K. Other Risks – The Funds may invest in obligations issued by agencies and instrumentalities of the U.S. Government that may vary in the level ofsupport they receive from the government. The government may choose not to provide financial support to government sponsored agencies orinstrumentalities if it is not legally obligated to do so. In this case, if the issuer defaulted, the underlying fund holding securities of such issuermight not be able to recover its investment from the U.S. Government. Many securities purchased by the Fund are not guaranteed by theU.S. Government.
L. Collateral – To the extent the Fund has designated or segregated a security as collateral and that security is subsequently sold, it is the Fund’spractice to replace such collateral no later than the next business day.
NOTE 2—Advisory Fees and Other Fees Paid to Affiliates
The Trust has entered into a master investment advisory agreement with Invesco Advisers, Inc. (the “Adviser” or “Invesco”). Under the terms of theinvestment advisory agreement, the Fund pays an advisory fee to the Adviser based on the annual rate of the Fund’s average daily net assets asfollows:
Average Daily Net Assets Rate
First $250 million 0.50%
Over $250 million 0.45%
Under the terms of a master sub-advisory agreement between the Adviser and each of Invesco Asset Management Deutschland GmbH, InvescoAsset Management Limited, Invesco Asset Management (Japan) Limited, Invesco Australia Limited, Invesco Hong Kong Limited, Invesco Senior SecuredManagement, Inc. and Invesco Canada Ltd. (collectively, the “Affiliated Sub-Advisers”) the Adviser, not the Fund, may pay 40% of the fees paid to theAdviser to any such Affiliated Sub-Adviser(s) that provide discretionary investment management services to the Fund based on the percentage ofassets allocated to such Sub-Adviser(s).
Effective July 1, 2012, the Adviser has contractually agreed, through April 30, 2013, to waive advisory fees and/or reimburse expenses of allshares to the extent necessary to limit total annual fund operating expenses after fee waivers and/or expense reimbursements (excluding certainitems discussed below) of Series I shares to 0.70% and Series II shares to 0.95% of average daily net assets. Prior to July 1, 2012, the Adviser hadcontractually agreed to waive advisory fees and/or reimburse expenses of all shares to the extent necessary to limit total annual fund operatingexpenses after fee waivers and/or expense reimbursements (excluding certain items discussed below) of Series I shares to 0.60% and Series II sharesto 0.85% of average daily net assets. In determining the Adviser’s obligation to waive advisory fees and/or reimburse expenses, the followingexpenses are not taken into account, and could cause the total annual fund operating expenses after fee waivers and/or expense reimbursements toexceed the numbers reflected above: (1) interest; (2) taxes; (3) dividend expense on short sales; (4) extraordinary or non-routine items, includinglitigation expenses; and (5) expenses that the Fund has incurred but did not actually pay because of an expense offset arrangement.
Invesco V.I. Government Securities Fund

Further, the Adviser has contractually agreed, through at least June 30, 2013, to waive the advisory fee payable by the Fund in an amount equalto 100% of the net advisory fees the Adviser receives from the affiliated money market funds on investments by the Fund of uninvested cash in suchaffiliated money market funds.
For the year ended December 31, 2012, the Adviser waived advisory fees of $1,316,203.The Trust has entered into a master administrative services agreement with Invesco pursuant to which the Fund has agreed to pay Invesco a fee for
costs incurred in providing accounting services and fund administrative services to the Fund and to reimburse Invesco for administrative services feespaid to insurance companies that have agreed to provide services to the participants of separate accounts. These administrative services provided bythe insurance companies may include, among other things: the printing of prospectuses, financial reports and proxy statements and the delivery ofthe same to existing participants; the maintenance of master accounts; the facilitation of purchases and redemptions requested by the participants;and the servicing of participants’ accounts. Pursuant to such agreement, for the year ended December 31, 2012, Invesco was paid $284,481 foraccounting and fund administrative services and reimbursed $2,919,367 for services provided by insurance companies.
The Trust has entered into a transfer agency and service agreement with Invesco Investment Services, Inc. (“IIS”) pursuant to which the Fund hasagreed to pay IIS a fee for providing transfer agency and shareholder services to the Fund and reimburse IIS for certain expenses incurred by IIS in thecourse of providing such services. For the year ended December 31, 2012, expenses incurred under the agreement are shown in the Statement ofOperations as Transfer agent fees.
The Trust has entered into a master distribution agreement with Invesco Distributors, Inc. (“IDI”) to serve as the distributor for the Fund. The Trusthas adopted a plan pursuant to Rule 12b-1 under the 1940 Act with respect to the Fund’s Series II shares (the “Plan”). The Fund, pursuant to thePlan, pays IDI compensation at the annual rate of 0.25% of the Fund’s average daily net assets of Series II shares. Of the Plan payments, up to0.25% of the average daily net assets of the Series II shares may be paid to insurance companies who furnish continuing personal shareholderservices to customers who purchase and own Series II shares of the Fund. For the year ended December 31, 2012, expenses incurred under the Planare detailed in the Statement of Operations as Distribution fees.
Certain officers and trustees of the Trust are officers and directors of the Adviser, IIS and/or IDI.
NOTE 3—Additional Valuation Information
GAAP defines fair value as the price that would be received to sell an asset or paid to transfer a liability in an orderly transaction between marketparticipants at the measurement date, under current market conditions. GAAP establishes a hierarchy that prioritizes the inputs to valuation methodsgiving the highest priority to readily available unadjusted quoted prices in an active market for identical assets (Level 1) and the lowest priority tosignificant unobservable inputs (Level 3) generally when market prices are not readily available or are unreliable. Based on the valuation inputs, thesecurities or other investments are tiered into one of three levels. Changes in valuation methods may result in transfers in or out of an investment’sassigned level:
Level 1 – Prices are determined using quoted prices in an active market for identical assets.Level 2 – Prices are determined using other significant observable inputs. Observable inputs are inputs that other market participants may use in
pricing a security. These may include quoted prices for similar securities, interest rates, prepayment speeds, credit risk, yield curves,loss severities, default rates, discount rates, volatilities and others.
Level 3 – Prices are determined using significant unobservable inputs. In situations where quoted prices or observable inputs are unavailable (forexample, when there is little or no market activity for an investment at the end of the period), unobservable inputs may be used.Unobservable inputs reflect the Fund’s own assumptions about the factors market participants would use in determining fair value of thesecurities or instruments and would be based on the best available information.
The following is a summary of the tiered valuation input levels, as of December 31, 2012. The level assigned to the securities valuations may notbe an indication of the risk or liquidity associated with investing in those securities. Because of the inherent uncertainties of valuation, the valuesreflected in the financial statements may materially differ from the value received upon actual sale of those investments.
Level 1 Level 2 Level 3 Total
Equity Securities $26,041,432 $ — $— $ 26,041,432
U.S. Treasury Securities — 139,811,246 — 139,811,246
U.S. Government Sponsored Securities — 1,042,436,507 — 1,042,436,507
Corporate Debt Securities — 12,251,826 — 12,251,826
Foreign Debt Securities — 26,052,738 — 26,052,738
Foreign Sovereign Debt Securities — 4,834,219 — 4,834,219
26,041,432 1,225,386,536 — 1,251,427,968
Futures Contracts* (1,066,787) — — (1,066,787)
Total Investments $24,974,645 $1,225,386,536 $— $1,250,361,181
* Unrealized appreciation (depreciation).
Invesco V.I. Government Securities Fund

NOTE 4—Derivative Investments
Value of Derivative Instruments at Period-End
The table below summarizes the value of the Fund’s derivative instruments, detailed by primary risk exposure, held as of December 31, 2012:
Value
Risk Exposure/Derivative Type Assets Liabilities
Interest rate riskFutures contracts(a) $1,445,461 $(2,512,248)
(a) Includes cumulative appreciation (depreciation) of futures contracts. Only current day’s variation margin receivable (payable) is reported within the Statement ofAssets and Liabilities.
Effect of Derivative Instruments for the year ended December 31, 2012
The table below summarizes the gains (losses) on derivative instruments, detailed by primary risk exposure, recognized in earnings during the period:
Location of Gain (Loss) onStatement of Operations
Futures Contracts*
Realized GainInterest rate risk $ 6,125,828
Change in Unrealized Appreciation (Depreciation)Interest rate risk $(2,407,945)
Total $ 3,717,883
* The average notional value of futures contracts outstanding during the period was $554,413,699.
Open Futures Contracts
Long ContractsNumber ofContracts
ExpirationMonth
NotionalValue
UnrealizedAppreciation
(Depreciation)
U.S. Treasury 2 Year Notes 539 March–2013 $118,832,656 $ 36,290
U.S. Treasury 10 Year Notes 660 March–2013 87,635,625 (202,480)
U.S. Ultra Bonds 667 March–2013 108,450,031 (2,309,768)
Subtotal $(2,475,958)
Short ContractsU.S. Treasury 5 Year Notes 256 March–2013 $ 31,850,000 $ 44,109
U.S. Treasury 30 Year Bonds 618 March–2013 91,155,000 1,365,062
Subtotal $ 1,409,171
Total $(1,066,787)
NOTE 5—Trustees’ and Officers’ Fees and Benefits
“Trustees’ and Officers’ Fees and Benefits” include amounts accrued by the Fund to pay remuneration to certain Trustees and Officers of the Fund.Trustees have the option to defer compensation payable by the Fund, and “Trustees’ and Officers’ Fees and Benefits” also include amounts accrued bythe Fund to fund such deferred compensation amounts. Those Trustees who defer compensation have the option to select various Invesco Funds inwhich their deferral accounts shall be deemed to be invested. Finally, certain current Trustees are eligible to participate in a retirement plan thatprovides for benefits to be paid upon retirement to Trustees over a period of time based on the number of years of service. The Fund may have certainformer Trustees who also participate in a retirement plan and receive benefits under such plan. “Trustees’ and Officers’ Fees and Benefits” includeamounts accrued by the Fund to fund such retirement benefits. Obligations under the deferred compensation and retirement plans representunsecured claims against the general assets of the Fund.
NOTE 6—Cash Balances
The Fund may borrow for leveraging in an amount up to 5% of the Fund’s total assets (excluding the amount borrowed) at the time the borrowing ismade. In doing so, the Fund is permitted to temporarily carry a negative or overdrawn balance in its account with State Street Bank and TrustCompany, the custodian bank. Such balances, if any at period end, are shown in the Statement of Assets and Liabilities under the payable captionAmount due custodian. To compensate the custodian bank for such overdrafts, the overdrawn Fund may either (1) leave funds as a compensatingbalance in the account so the custodian bank can be compensated by earning the additional interest; or (2) compensate by paying the custodian bankat a rate agreed upon by the custodian bank and Invesco, not to exceed the contractually agreed upon rate. A Fund may not purchase additionalsecurities when any borrowings from banks exceed 5% of the Fund’s total assets.
Invesco V.I. Government Securities Fund

NOTE 7—Distributions to Shareholders and Tax Components of Net Assets
Tax Character of Distributions to Shareholders Paid During the Years Ended December 31, 2012 and 2011:
2012 2011
Ordinary income $35,555,860 $37,636,451
Tax Components of Net Assets at Period-End:
2012
Undistributed ordinary income $ 29,879,025
Net unrealized appreciation – investments 34,043,871
Temporary book/tax differences (220,131)
Capital loss carryforward (3,845,839)
Shares of beneficial interest 1,074,437,523
Total net assets $1,134,294,449
The difference between book-basis and tax-basis unrealized appreciation (depreciation) is due to differences in the timing of recognition of gainsand losses on investments for tax and book purposes. The Fund’s net unrealized appreciation difference is attributable primarily to straddles and washsales.
The temporary book/tax differences are a result of timing differences between book and tax recognition of income and/or expenses. The Fund’stemporary book/tax differences are the result of the trustee deferral of compensation and retirement plan benefits.
Capital loss carryforward is calculated and reported as of a specific date. Results of transactions and other activity after that date may affect theamount of capital loss carryforward actually available for the Fund to utilize. The Regulated Investment Company Modernization Act of 2010 (the“Act”) eliminated the eight-year carryover period for capital losses that arise in taxable years beginning after its enactment date ofDecember 22, 2010. Consequently, these capital losses can be carried forward for an unlimited period. However, capital losses with an expirationperiod may not be used to offset capital gains until all net capital losses without an expiration date have been utilized. Additionally, post-enactmentcapital loss carryovers will retain their character as either short-term or long-term capital losses instead of as short-term capital losses as under priorlaw. The ability to utilize capital loss carryforward in the future may be limited under the Internal Revenue Code and related regulations based on theresults of future transactions.
The Fund utilized $4,339,076 of capital loss carryforward in the current period to offset net realized capital gain for federal income tax purposes.The Fund has a capital loss carryforward as of December 31, 2012, which expires as follows:
Capital Loss Carryforward*Expiration Short-Term Long-Term Total
December 31, 2017 $3,845,839 $— $3,845,839
* Capital loss carryforward as of the date listed above is reduced for limitations, if any, to the extent required by the Internal Revenue Code. To the extent thatunrealized gains as of May 2, 2011, the date of reorganization of Invesco V.I. Government Fund into the Fund, are realized on securities held in each fund at suchdate of reorganization, the capital loss carryforward may be further limited for up to five years from the date of the reorganization.
NOTE 8—Investment Securities
The aggregate amount of investment securities (other than short-term securities, U.S. Treasury obligations and money market funds, if any)purchased and sold by the Fund during the year ended December 31, 2012 was $1,421,434,502 and $1,467,040,674, respectively. During thesame period, purchases and sales of U.S. Treasury obligations were $78,999,016 and $109,486,209, respectively. Cost of investments on a taxbasis includes the adjustments for financial reporting purposes as of the most recently completed federal income tax reporting period end.
Unrealized Appreciation (Depreciation) of Investment Securities on a Tax Basis
Aggregate unrealized appreciation of investment securities $36,858,593
Aggregate unrealized (depreciation) of investment securities (2,814,722)
Net unrealized appreciation of investment securities $34,043,871
Cost of investments for tax purposes is $1,217,384,097.
NOTE 9—Reclassification of Permanent Differences
Primarily as a result of differing book/tax treatment of paydown gains (losses) and dollar rolls, on December 31, 2012, undistributed net investmentincome was increased by $12,598,308 and undistributed net realized gain (loss) was decreased by $12,598,308. This reclassification had noeffect on the net assets of the Fund.
Invesco V.I. Government Securities Fund

NOTE 10—Share Information
Summary of Share ActivityYears ended December 31,
2012(a) 2011
Shares Amount Shares Amount
Sold:
Series I 9,955,734 $ 124,521,467 10,663,153 $ 128,843,040
Series II 4,230,588 52,978,846 5,300,488 64,070,452
Issued as reinvestment of dividends:
Series I 2,220,724 27,559,188 3,158,192 36,635,024
Series II 649,608 7,996,671 86,854 1,001,427
Issued in connection with acquisitions:(b)
Series I — — 2,587,718 30,250,210
Series II — — 22,298,634 259,005,451
Reacquired:
Series I (19,390,637) (244,006,555) (28,160,963) (340,945,513)
Series II (7,462,478) (93,102,430) (5,875,436) (71,038,561)
Net increase (decrease) in share activity (9,796,461) $(124,052,813) 10,058,640 $ 107,821,530
(a) There are entities that are record owners of more than 5% of the outstanding shares of the Fund and in the aggregate own 81% of the outstanding shares of theFund. The Fund and the Fund’s principal underwriter or adviser, are parties to participation agreements with these entities whereby these entities sell units ofinterest in separate accounts funding variable products that are invested in the Fund. The Fund, Invesco and/or Invesco affiliates may make payments to theseentities, which are considered to be related to the Fund, for providing services to the Fund, Invesco and/or Invesco affiliates including but not limited to servicessuch as, securities brokerage, third party record keeping and account servicing and administrative services. The Fund has no knowledge as to whether all or anyportion of the shares owned of record by these entities are also owned beneficially.
(b) As of the opening of business on May 2, 2011 the Fund acquired all the net assets of Invesco Van Kampen V.I. Government Fund (the “Target Fund”) pursuant to aplan of reorganization approved by the Trustees of the Fund on November 10, 2010 and by the shareholders of the Target Fund on April 1, 2011. The acquisitionwas accomplished by a tax-free exchange of 24,886,352 shares of the Fund for 32,516,244 shares outstanding of the Target Fund as of the close of businesson April 29, 2011. Each class of the Target Fund was exchanged for the like class of shares of the Fund based on the relative net asset value of the Target Fund tothe net asset value of the Fund as of the close of business on April 29, 2011. The Target Fund’s net assets at that date of $289,255,661, including$4,992,514 of unrealized appreciation, were combined with those of the Fund. The net assets of the Fund immediately before the acquisition were$1,059,348,706. The net assets of the Fund subsequent to the acquisition were $1,348,604,367. The pro forma results of operations for the year endedDecember 31, 2011 assuming the reorganization had been completed on January 1, 2011, the beginning of the annual reporting period, are as follows:
Net investment income $ 28,166,317
Net realized/unrealized gains 72,785,041
Change in net assets resulting from operations $100,951,358
The combined investment portfolios have been managed as a single integrated portfolio since the acquisition was completed, and it is not practicable toseparate the amounts of revenue and earnings of the Target Fund that have been included in the Fund’s Statement of Operations since May 2, 2011.
Invesco V.I. Government Securities Fund
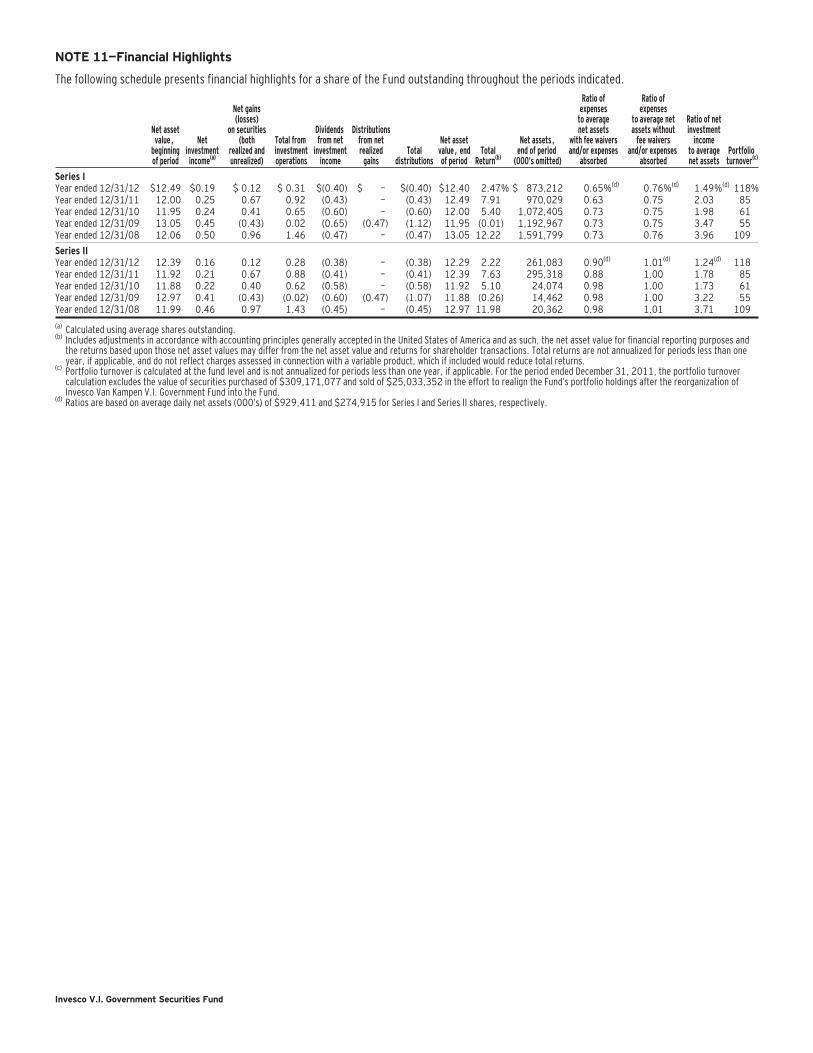
NOTE 11—Financial Highlights
The following schedule presents financial highlights for a share of the Fund outstanding throughout the periods indicated.
Net assetvalue,
beginningof period
Netinvestmentincome(a)
Net gains(losses)
on securities(both
realized andunrealized)
Total frominvestmentoperations
Dividendsfrom net
investmentincome
Distributionsfrom netrealized
gainsTotal
distributions
Net assetvalue, endof period
TotalReturn(b)
Net assets,end of period
(000’s omitted)
Ratio ofexpenses
to averagenet assets
with fee waiversand/or expenses
absorbed
Ratio ofexpenses
to average netassets without
fee waiversand/or expenses
absorbed
Ratio of netinvestment
incometo averagenet assets
Portfolioturnover(c)
Series IYear ended 12/31/12 $12.49 $0.19 $ 0.12 $ 0.31 $(0.40) $ — $(0.40) $12.40 2.47% $ 873,212 0.65%(d) 0.76%(d) 1.49%(d) 118%Year ended 12/31/11 12.00 0.25 0.67 0.92 (0.43) — (0.43) 12.49 7.91 970,029 0.63 0.75 2.03 85Year ended 12/31/10 11.95 0.24 0.41 0.65 (0.60) — (0.60) 12.00 5.40 1,072,405 0.73 0.75 1.98 61Year ended 12/31/09 13.05 0.45 (0.43) 0.02 (0.65) (0.47) (1.12) 11.95 (0.01) 1,192,967 0.73 0.75 3.47 55Year ended 12/31/08 12.06 0.50 0.96 1.46 (0.47) — (0.47) 13.05 12.22 1,591,799 0.73 0.76 3.96 109
Series IIYear ended 12/31/12 12.39 0.16 0.12 0.28 (0.38) — (0.38) 12.29 2.22 261,083 0.90(d) 1.01(d) 1.24(d) 118Year ended 12/31/11 11.92 0.21 0.67 0.88 (0.41) — (0.41) 12.39 7.63 295,318 0.88 1.00 1.78 85Year ended 12/31/10 11.88 0.22 0.40 0.62 (0.58) — (0.58) 11.92 5.10 24,074 0.98 1.00 1.73 61Year ended 12/31/09 12.97 0.41 (0.43) (0.02) (0.60) (0.47) (1.07) 11.88 (0.26) 14,462 0.98 1.00 3.22 55Year ended 12/31/08 11.99 0.46 0.97 1.43 (0.45) — (0.45) 12.97 11.98 20,362 0.98 1.01 3.71 109
(a) Calculated using average shares outstanding.(b) Includes adjustments in accordance with accounting principles generally accepted in the United States of America and as such, the net asset value for financial reporting purposes and
the returns based upon those net asset values may differ from the net asset value and returns for shareholder transactions. Total returns are not annualized for periods less than oneyear, if applicable, and do not reflect charges assessed in connection with a variable product, which if included would reduce total returns.
(c) Portfolio turnover is calculated at the fund level and is not annualized for periods less than one year, if applicable. For the period ended December 31, 2011, the portfolio turnovercalculation excludes the value of securities purchased of $309,171,077 and sold of $25,033,352 in the effort to realign the Fund’s portfolio holdings after the reorganization ofInvesco Van Kampen V.I. Government Fund into the Fund.
(d) Ratios are based on average daily net assets (000’s) of $929,411 and $274,915 for Series I and Series II shares, respectively.
Invesco V.I. Government Securities Fund
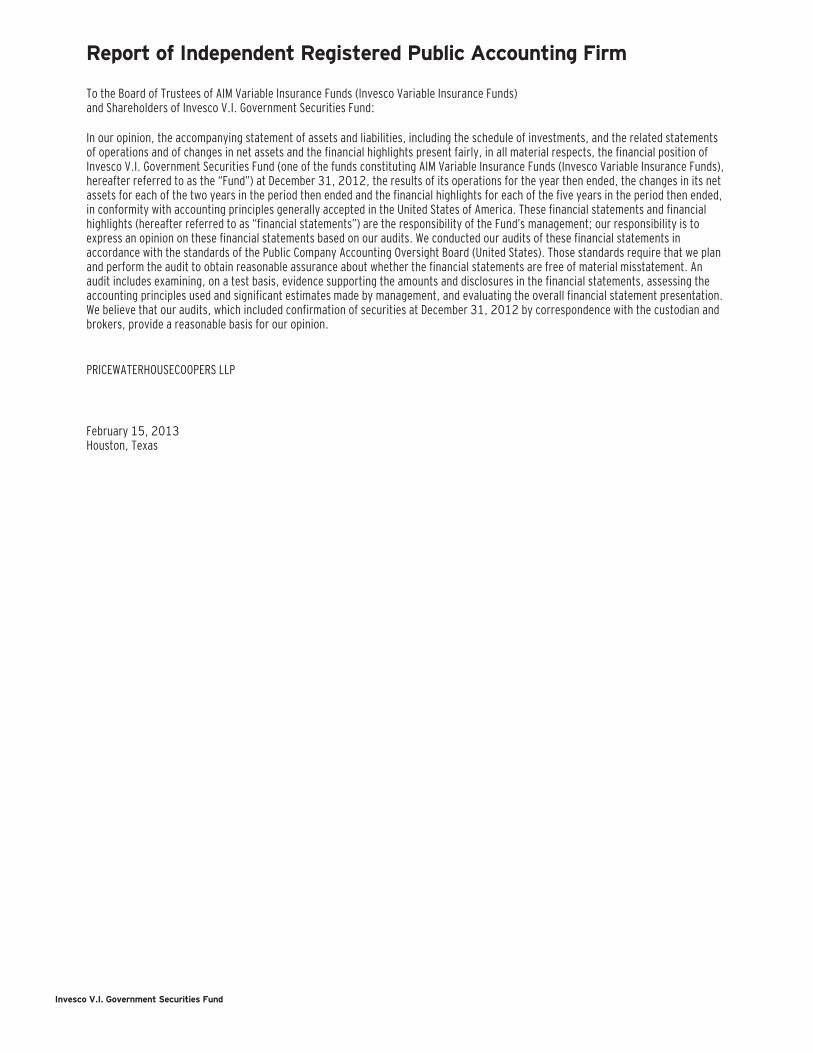
Report of Independent Registered Public Accounting Firm
To the Board of Trustees of AIM Variable Insurance Funds (Invesco Variable Insurance Funds)and Shareholders of Invesco V.I. Government Securities Fund:
In our opinion, the accompanying statement of assets and liabilities, including the schedule of investments, and the related statementsof operations and of changes in net assets and the financial highlights present fairly, in all material respects, the financial position ofInvesco V.I. Government Securities Fund (one of the funds constituting AIM Variable Insurance Funds (Invesco Variable Insurance Funds),hereafter referred to as the “Fund”) at December 31, 2012, the results of its operations for the year then ended, the changes in its netassets for each of the two years in the period then ended and the financial highlights for each of the five years in the period then ended,in conformity with accounting principles generally accepted in the United States of America. These financial statements and financialhighlights (hereafter referred to as “financial statements”) are the responsibility of the Fund’s management; our responsibility is toexpress an opinion on these financial statements based on our audits. We conducted our audits of these financial statements inaccordance with the standards of the Public Company Accounting Oversight Board (United States). Those standards require that we planand perform the audit to obtain reasonable assurance about whether the financial statements are free of material misstatement. Anaudit includes examining, on a test basis, evidence supporting the amounts and disclosures in the financial statements, assessing theaccounting principles used and significant estimates made by management, and evaluating the overall financial statement presentation.We believe that our audits, which included confirmation of securities at December 31, 2012 by correspondence with the custodian andbrokers, provide a reasonable basis for our opinion.
PRICEWATERHOUSECOOPERS LLP
February 15, 2013Houston, Texas
Invesco V.I. Government Securities Fund

Calculating your ongoing Fund expenses
Example
As a shareholder of the Fund, you incur ongoing costs, including management fees; distribution and/or service fees (12b-1); and other Fundexpenses. This example is intended to help you understand your ongoing costs (in dollars) of investing in the Fund and to compare these costs withongoing costs of investing in other mutual funds. The example is based on an investment of $1,000 invested at the beginning of the period and heldfor the entire period July 1, 2012 through December 31, 2012.
The actual and hypothetical expenses in the examples below do not represent the effect of any fees or other expenses assessed in connection witha variable product; if they did, the expenses shown would be higher while the ending account values shown would be lower.
Actual expenses
The table below provides information about actual account values and actual expenses. You may use the information in this table, together with theamount you invested, to estimate the expenses that you paid over the period. Simply divide your account value by $1,000 (for example, an $8,600account value divided by $1,000 = 8.6), then multiply the result by the number in the table under the heading entitled “Actual Expenses Paid DuringPeriod” to estimate the expenses you paid on your account during this period.
Hypothetical example for comparison purposes
The table below also provides information about hypothetical account values and hypothetical expenses based on the Fund’s actual expense ratio andan assumed rate of return of 5% per year before expenses, which is not the Fund’s actual return.
The hypothetical account values and expenses may not be used to estimate the actual ending account balance or expenses you paid for the period. Youmay use this information to compare the ongoing costs of investing in the Fund and other funds. To do so, compare this 5% hypothetical example withthe 5% hypothetical examples that appear in the shareholder reports of the other funds.
Please note that the expenses shown in the table are meant to highlight your ongoing costs. Therefore, the hypothetical information is useful incomparing ongoing costs, and will not help you determine the relative total costs of owning different funds.
ACTUAL
HYPOTHETICAL(5% annual return before
expenses)
Class
BeginningAccount Value(07/01/12)
EndingAccount Value(12/31/12)1
ExpensesPaid During
Period2
EndingAccount Value(12/31/12)
ExpensesPaid During
Period2
AnnualizedExpense
Ratio
Series I $1,000.00 $1,006.20 $3.53 $1,021.62 $3.56 0.70%
Series II 1,000.00 1,005.10 4.79 1,020.36 4.82 0.951 The actual ending account value is based on the actual total return of the Fund for the period July 1, 2012 through December 31, 2012, after actual expenses and will differ from the
hypothetical ending account value which is based on the Fund’s expense ratio and a hypothetical annual return of 5% before expenses.2 Expenses are equal to the Fund’s annualized expense ratio as indicated above multiplied by the average account value over the period, multiplied by 184/366 to reflect the most recent
fiscal half year.
Invesco V.I. Government Securities Fund

Tax Information
Form 1099-DIV, Form 1042-S and other year–end tax information provide shareholders with actual calendar year amounts that should be included intheir tax returns. Shareholders should consult their tax advisors.
The following distribution information is being provided as required by the Internal Revenue Code or to meet a specific state’s requirement.The Fund designates the following amounts or, if subsequently determined to be different, the maximum amount allowable for its fiscal year ended
December 31, 2012:
Federal and State Income TaxCorporate Dividends Received Deduction* 0.00%U.S. Treasury Obligations* 8.09%
* The above percentages are based on ordinary income dividends paid to shareholders during the Fund’s fiscal year.
Invesco V.I. Government Securities Fund
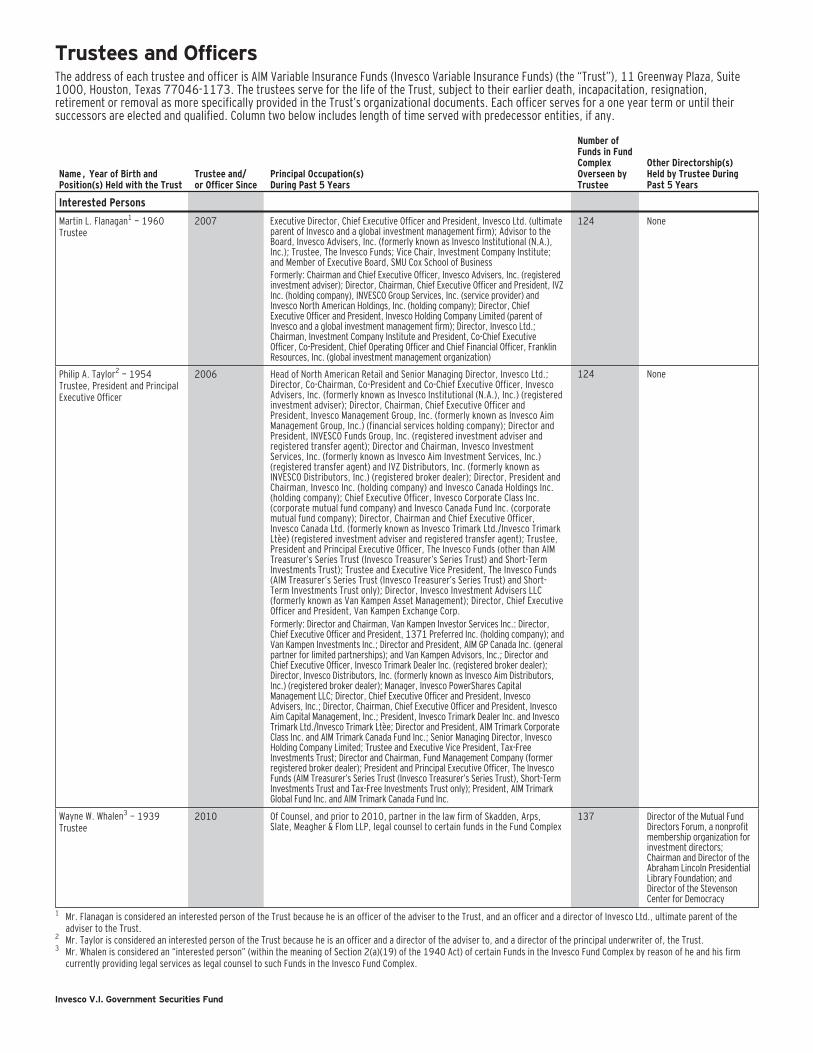
Trustees and OfficersThe address of each trustee and officer is AIM Variable Insurance Funds (Invesco Variable Insurance Funds) (the “Trust”), 11 Greenway Plaza, Suite1000, Houston, Texas 77046-1173. The trustees serve for the life of the Trust, subject to their earlier death, incapacitation, resignation,retirement or removal as more specifically provided in the Trust’s organizational documents. Each officer serves for a one year term or until theirsuccessors are elected and qualified. Column two below includes length of time served with predecessor entities, if any.
Name, Year of Birth andPosition(s) Held with the Trust
Trustee and/or Officer Since
Principal Occupation(s)During Past 5 Years
Number ofFunds in FundComplexOverseen byTrustee
Other Directorship(s)Held by Trustee DuringPast 5 Years
Interested Persons
Martin L. Flanagan1 — 1960Trustee
2007 Executive Director, Chief Executive Officer and President, Invesco Ltd. (ultimateparent of Invesco and a global investment management firm); Advisor to theBoard, Invesco Advisers, Inc. (formerly known as Invesco Institutional (N.A.),Inc.); Trustee, The Invesco Funds; Vice Chair, Investment Company Institute;and Member of Executive Board, SMU Cox School of BusinessFormerly: Chairman and Chief Executive Officer, Invesco Advisers, Inc. (registeredinvestment adviser); Director, Chairman, Chief Executive Officer and President, IVZInc. (holding company), INVESCO Group Services, Inc. (service provider) andInvesco North American Holdings, Inc. (holding company); Director, ChiefExecutive Officer and President, Invesco Holding Company Limited (parent ofInvesco and a global investment management firm); Director, Invesco Ltd.;Chairman, Investment Company Institute and President, Co-Chief ExecutiveOfficer, Co-President, Chief Operating Officer and Chief Financial Officer, FranklinResources, Inc. (global investment management organization)
124 None
Philip A. Taylor2 — 1954Trustee, President and PrincipalExecutive Officer
2006 Head of North American Retail and Senior Managing Director, Invesco Ltd.;Director, Co-Chairman, Co-President and Co-Chief Executive Officer, InvescoAdvisers, Inc. (formerly known as Invesco Institutional (N.A.), Inc.) (registeredinvestment adviser); Director, Chairman, Chief Executive Officer andPresident, Invesco Management Group, Inc. (formerly known as Invesco AimManagement Group, Inc.) (financial services holding company); Director andPresident, INVESCO Funds Group, Inc. (registered investment adviser andregistered transfer agent); Director and Chairman, Invesco InvestmentServices, Inc. (formerly known as Invesco Aim Investment Services, Inc.)(registered transfer agent) and IVZ Distributors, Inc. (formerly known asINVESCO Distributors, Inc.) (registered broker dealer); Director, President andChairman, Invesco Inc. (holding company) and Invesco Canada Holdings Inc.(holding company); Chief Executive Officer, Invesco Corporate Class Inc.(corporate mutual fund company) and Invesco Canada Fund Inc. (corporatemutual fund company); Director, Chairman and Chief Executive Officer,Invesco Canada Ltd. (formerly known as Invesco Trimark Ltd./Invesco TrimarkLtèe) (registered investment adviser and registered transfer agent); Trustee,President and Principal Executive Officer, The Invesco Funds (other than AIMTreasurer’s Series Trust (Invesco Treasurer’s Series Trust) and Short-TermInvestments Trust); Trustee and Executive Vice President, The Invesco Funds(AIM Treasurer’s Series Trust (Invesco Treasurer’s Series Trust) and Short-Term Investments Trust only); Director, Invesco Investment Advisers LLC(formerly known as Van Kampen Asset Management); Director, Chief ExecutiveOfficer and President, Van Kampen Exchange Corp.Formerly: Director and Chairman, Van Kampen Investor Services Inc.: Director,Chief Executive Officer and President, 1371 Preferred Inc. (holding company); andVan Kampen Investments Inc.; Director and President, AIM GP Canada Inc. (generalpartner for limited partnerships); and Van Kampen Advisors, Inc.; Director andChief Executive Officer, Invesco Trimark Dealer Inc. (registered broker dealer);Director, Invesco Distributors, Inc. (formerly known as Invesco Aim Distributors,Inc.) (registered broker dealer); Manager, Invesco PowerShares CapitalManagement LLC; Director, Chief Executive Officer and President, InvescoAdvisers, Inc.; Director, Chairman, Chief Executive Officer and President, InvescoAim Capital Management, Inc.; President, Invesco Trimark Dealer Inc. and InvescoTrimark Ltd./Invesco Trimark Ltèe; Director and President, AIM Trimark CorporateClass Inc. and AIM Trimark Canada Fund Inc.; Senior Managing Director, InvescoHolding Company Limited; Trustee and Executive Vice President, Tax-FreeInvestments Trust; Director and Chairman, Fund Management Company (formerregistered broker dealer); President and Principal Executive Officer, The InvescoFunds (AIM Treasurer’s Series Trust (Invesco Treasurer’s Series Trust), Short-TermInvestments Trust and Tax-Free Investments Trust only); President, AIM TrimarkGlobal Fund Inc. and AIM Trimark Canada Fund Inc.
124 None
Wayne W. Whalen3 — 1939Trustee
2010 Of Counsel, and prior to 2010, partner in the law firm of Skadden, Arps,Slate, Meagher & Flom LLP, legal counsel to certain funds in the Fund Complex
137 Director of the Mutual FundDirectors Forum, a nonprofitmembership organization forinvestment directors;Chairman and Director of theAbraham Lincoln PresidentialLibrary Foundation; andDirector of the StevensonCenter for Democracy
1 Mr. Flanagan is considered an interested person of the Trust because he is an officer of the adviser to the Trust, and an officer and a director of Invesco Ltd., ultimate parent of theadviser to the Trust.
2 Mr. Taylor is considered an interested person of the Trust because he is an officer and a director of the adviser to, and a director of the principal underwriter of, the Trust.3 Mr. Whalen is considered an “interested person” (within the meaning of Section 2(a)(19) of the 1940 Act) of certain Funds in the Invesco Fund Complex by reason of he and his firm
currently providing legal services as legal counsel to such Funds in the Invesco Fund Complex.
Invesco V.I. Government Securities Fund

Trustees and Officers—(continued)
Name, Year of Birth andPosition(s) Held with the Trust
Trustee and/or Officer Since
Principal Occupation(s)During Past 5 Years
Number ofFunds in FundComplexOverseen byTrustee
Other Directorship(s)Held by Trustee DuringPast 5 Years
Independent Trustees
Bruce L. Crockett — 1944Trustee and Chair
1993 Chairman, Crockett Technologies Associates (technology consulting company)Formerly: Director, Captaris (unified messaging provider); Director, Presidentand Chief Executive Officer COMSAT Corporation; and Chairman, Board ofGovernors of INTELSAT (international communications company)
124 ACE Limited (insurancecompany); and InvestmentCompany Institute
David C. Arch — 1945Trustee
2010 Chairman and Chief Executive Officer of Blistex Inc., (consumer health careproducts manufacturer)Formerly: Member of the Heartland Alliance Advisory Board, a nonprofitorganization serving human needs based in Chicago
137 Board member of theIllinois Manufacturers’Association; Member of theBoard of Visitors, Institutefor the Humanities,University of Michigan
Frank S. Bayley — 1939Trustee
2001 RetiredFormerly: Director, Badgley Funds, Inc. (registered investment company)(2 portfolios) and General Partner and Of Counsel, law firm of Baker &McKenzie, LLP
124 Director and Chairman, C.D.Stimson Company (a realestate investmentcompany); Trustee andOverseer, The Curtisinstitute of Music
James T. Bunch — 1942Trustee
2004 Managing Member, Grumman Hill Group LLC (family office private equitymanagement)Formerly: Founder, Green, Manning & Bunch Ltd. (investment bankingfirm)(1988-2010); Executive Committee, United States Golf Association; andDirector, Policy Studies, Inc. and Van Gilder Insurance Corporation
124 Chairman, Board ofGovernors, Western GolfAssociation; Chairman-elect, Evans ScholarsFoundation; and Director,Denver Film Society
Rodney F. Dammeyer — 1940Trustee
2010 Chairman of CAC, LLC, (private company offering capital investment andmanagement advisory services)Formerly: Prior to 2001, Managing Partner at Equity Group CorporateInvestments; Prior to 1995, Vice Chairman of Anixter International; Prior to1985, experience includes Senior Vice President and Chief Financial Officer ofHousehold International, Inc., Executive Vice President and Chief FinancialOfficer of Northwest Industries, Inc. and Partner of Arthur Andersen & Co.;From 1987 to 2010, Director/Trustee of investment companies in the VanKampen Funds complex
126 Director of QuidelCorporation and Stericycle,Inc.; Prior to May 2008,Trustee of The ScrippsResearch Institute; Prior toFebruary 2008, Director ofVentana Medical Systems,Inc.; Prior to April 2007,Director of GATXCorporation; Prior to April2004, Director ofTheraSense, Inc.
Albert R. Dowden — 1941Trustee
2000 Director of a number of public and private business corporations, includingthe Boss Group, Ltd. (private investment and management); Reich & TangFunds (5 portfolios) (registered investment company); and Homeowners ofAmerica Holding Corporation/ Homeowners of America Insurance Company(property casualty company)Formerly: Director, Continental Energy Services, LLC (oil and gas pipelineservice); Director, CompuDyne Corporation (provider of product and servicesto the public security market) and Director, Annuity and Life Re (Holdings),Ltd. (reinsurance company); Director, President and Chief Executive Officer,Volvo Group North America, Inc.; Senior Vice President, AB Volvo; Director ofvarious public and private corporations; Chairman, DHJ Media, Inc.; DirectorMagellan Insurance Company; and Director, The Hertz Corporation, GenmarCorporation (boat manufacturer), National Media Corporation; Advisory Boardof Rotary Power International (designer, manufacturer, and seller of rotarypower engines); and Chairman, Cortland Trust, Inc. (registered investmentcompany)
124 Director of Nature’sSunshine Products, Inc.
Jack M. Fields — 1952Trustee
1997 Chief Executive Officer, Twenty First Century Group, Inc. (government affairscompany); Owner and Chief Executive Officer, Dos Angeles Ranch, L.P. (cattle,hunting, corporate entertainment); and Discovery Global Education Fund (non-profit)Formerly: Chief Executive Officer, Texana Timber LP (sustainable forestrycompany); Director of Cross Timbers Quail Research Ranch (non-profit); andmember of the U.S. House of Representatives
124 Insperity, Inc. (formerlyknown as Administaff)
Prema Mathai-Davis — 1950Trustee
1998 RetiredFormerly: Chief Executive Officer, YWCA of the U.S.A.
124 None
Larry Soll — 1942Trustee
2004 RetiredFormerly: Chairman, Chief Executive Officer and President, Synergen Corp.(a biotechnology company)
124 None
Hugo F. Sonnenschein — 1940Trustee
2010 Distinguished Service Professor and President Emeritus of the University ofChicago and the Adam Smith Distinguished Service Professor in theDepartment of Economics at the University of ChicagoFormerly: President of the University of Chicago
137 Trustee of the University ofRochester and a member ofits investment committee.Member of the NationalAcademy of Sciences, theAmerican PhilosophicalSociety and a fellow of theAmerican Academy of Artsand Sciences
Invesco V.I. Government Securities Fund
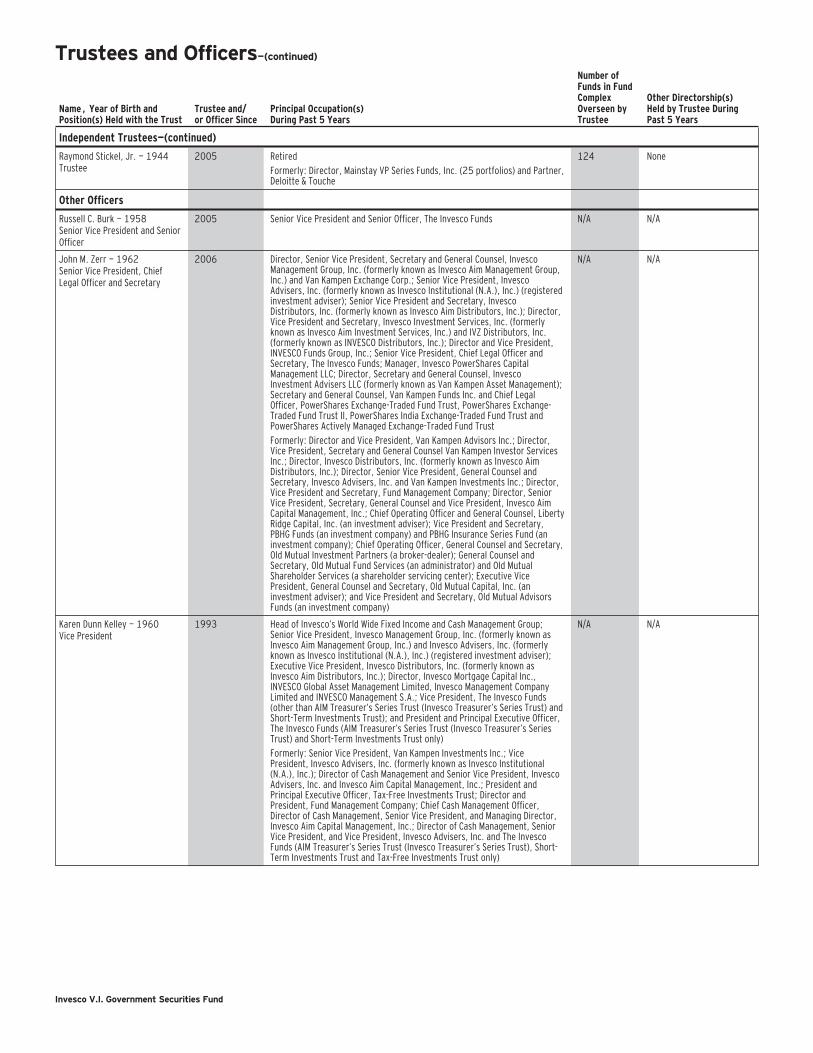
Trustees and Officers—(continued)
Name, Year of Birth andPosition(s) Held with the Trust
Trustee and/or Officer Since
Principal Occupation(s)During Past 5 Years
Number ofFunds in FundComplexOverseen byTrustee
Other Directorship(s)Held by Trustee DuringPast 5 Years
Independent Trustees—(continued)
Raymond Stickel, Jr. — 1944Trustee
2005 RetiredFormerly: Director, Mainstay VP Series Funds, Inc. (25 portfolios) and Partner,Deloitte & Touche
124 None
Other Officers
Russell C. Burk — 1958Senior Vice President and SeniorOfficer
2005 Senior Vice President and Senior Officer, The Invesco Funds N/A N/A
John M. Zerr — 1962Senior Vice President, ChiefLegal Officer and Secretary
2006 Director, Senior Vice President, Secretary and General Counsel, InvescoManagement Group, Inc. (formerly known as Invesco Aim Management Group,Inc.) and Van Kampen Exchange Corp.; Senior Vice President, InvescoAdvisers, Inc. (formerly known as Invesco Institutional (N.A.), Inc.) (registeredinvestment adviser); Senior Vice President and Secretary, InvescoDistributors, Inc. (formerly known as Invesco Aim Distributors, Inc.); Director,Vice President and Secretary, Invesco Investment Services, Inc. (formerlyknown as Invesco Aim Investment Services, Inc.) and IVZ Distributors, Inc.(formerly known as INVESCO Distributors, Inc.); Director and Vice President,INVESCO Funds Group, Inc.; Senior Vice President, Chief Legal Officer andSecretary, The Invesco Funds; Manager, Invesco PowerShares CapitalManagement LLC; Director, Secretary and General Counsel, InvescoInvestment Advisers LLC (formerly known as Van Kampen Asset Management);Secretary and General Counsel, Van Kampen Funds Inc. and Chief LegalOfficer, PowerShares Exchange-Traded Fund Trust, PowerShares Exchange-Traded Fund Trust II, PowerShares India Exchange-Traded Fund Trust andPowerShares Actively Managed Exchange-Traded Fund TrustFormerly: Director and Vice President, Van Kampen Advisors Inc.; Director,Vice President, Secretary and General Counsel Van Kampen Investor ServicesInc.; Director, Invesco Distributors, Inc. (formerly known as Invesco AimDistributors, Inc.); Director, Senior Vice President, General Counsel andSecretary, Invesco Advisers, Inc. and Van Kampen Investments Inc.; Director,Vice President and Secretary, Fund Management Company; Director, SeniorVice President, Secretary, General Counsel and Vice President, Invesco AimCapital Management, Inc.; Chief Operating Officer and General Counsel, LibertyRidge Capital, Inc. (an investment adviser); Vice President and Secretary,PBHG Funds (an investment company) and PBHG Insurance Series Fund (aninvestment company); Chief Operating Officer, General Counsel and Secretary,Old Mutual Investment Partners (a broker-dealer); General Counsel andSecretary, Old Mutual Fund Services (an administrator) and Old MutualShareholder Services (a shareholder servicing center); Executive VicePresident, General Counsel and Secretary, Old Mutual Capital, Inc. (aninvestment adviser); and Vice President and Secretary, Old Mutual AdvisorsFunds (an investment company)
N/A N/A
Karen Dunn Kelley — 1960Vice President
1993 Head of Invesco’s World Wide Fixed Income and Cash Management Group;Senior Vice President, Invesco Management Group, Inc. (formerly known asInvesco Aim Management Group, Inc.) and Invesco Advisers, Inc. (formerlyknown as Invesco Institutional (N.A.), Inc.) (registered investment adviser);Executive Vice President, Invesco Distributors, Inc. (formerly known asInvesco Aim Distributors, Inc.); Director, Invesco Mortgage Capital Inc.,INVESCO Global Asset Management Limited, Invesco Management CompanyLimited and INVESCO Management S.A.; Vice President, The Invesco Funds(other than AIM Treasurer’s Series Trust (Invesco Treasurer’s Series Trust) andShort-Term Investments Trust); and President and Principal Executive Officer,The Invesco Funds (AIM Treasurer’s Series Trust (Invesco Treasurer’s SeriesTrust) and Short-Term Investments Trust only)Formerly: Senior Vice President, Van Kampen Investments Inc.; VicePresident, Invesco Advisers, Inc. (formerly known as Invesco Institutional(N.A.), Inc.); Director of Cash Management and Senior Vice President, InvescoAdvisers, Inc. and Invesco Aim Capital Management, Inc.; President andPrincipal Executive Officer, Tax-Free Investments Trust; Director andPresident, Fund Management Company; Chief Cash Management Officer,Director of Cash Management, Senior Vice President, and Managing Director,Invesco Aim Capital Management, Inc.; Director of Cash Management, SeniorVice President, and Vice President, Invesco Advisers, Inc. and The InvescoFunds (AIM Treasurer’s Series Trust (Invesco Treasurer’s Series Trust), Short-Term Investments Trust and Tax-Free Investments Trust only)
N/A N/A
Invesco V.I. Government Securities Fund

Trustees and Officers—(continued)
Name, Year of Birth andPosition(s) Held with the Trust
Trustee and/or Officer Since
Principal Occupation(s)During Past 5 Years
Number ofFunds in FundComplexOverseen byTrustee
Other Directorship(s)Held by Trustee DuringPast 5 Years
Other Officers—(continued)
Sheri Morris — 1964Vice President, Treasurer andPrincipal Financial Officer
1999 Vice President, Treasurer and Principal Financial Officer, The Invesco Funds;Vice President, Invesco Advisers, Inc. (formerly known as Invesco Institutional(N.A.), Inc.) (registered investment adviser); and Vice President, PowerSharesExchange-Traded Fund Trust, PowerShares Exchange-Traded Fund Trust II,PowerShares India Exchange-Traded Fund Trust and PowerShares ActivelyManaged Exchange-Traded Fund TrustFormerly: Vice President, Invesco Aim Advisers, Inc., Invesco Aim CapitalManagement, Inc. and Invesco Aim Private Asset Management, Inc.; AssistantVice President and Assistant Treasurer, The Invesco Funds and Assistant VicePresident, Invesco Advisers, Inc., Invesco Aim Capital Management, Inc. andInvesco Aim Private Asset Management, Inc.; and Treasurer, PowerSharesExchange-Traded Fund Trust, PowerShares Exchange-Traded Fund Trust II,PowerShares India Exchange-Traded Fund Trust and PowerShares ActivelyManaged Exchange-Traded Fund Trust
N/A N/A
Yinka Akinsola — 1977Anti-Money LaunderingCompliance Officer
2011 Anti-Money Laundering Compliance Officer, Invesco Advisers, Inc. (formerlyknown as Invesco Institutional (N.A.), Inc.) (registered investment adviser);Invesco Distributors, Inc. (formerly known as Invesco Aim Distributors, Inc.),Invesco Investment Services, Inc. (formerly known as Invesco Aim InvestmentServices, Inc.), Invesco Management Group, Inc., The Invesco Funds, InvescoVan Kampen Closed-End Funds, Van Kampen Exchange Corp., Van KampenFunds Inc., PowerShares Exchange-Traded Fund Trust, PowerShares Exchange-Traded Fund Trust II, PowerShares India Exchange-Traded Fund Trust, andPowerShares Actively Managed Exchange-Traded Fund TrustFormerly: Regulatory Analyst III, Financial Industry Regulatory Authority(FINRA)
N/A N/A
Todd L. Spillane — 1958Chief Compliance Officer
2006 Senior Vice President, Invesco Management Group, Inc. (formerly known asInvesco Aim Management Group, Inc.) and Van Kampen Exchange Corp.;Senior Vice President and Chief Compliance Officer, Invesco Advisers, Inc.(registered investment adviser) (formerly known as Invesco Institutional(N.A.), Inc.); Chief Compliance Officer, The Invesco Funds; Vice President,Invesco Distributors, Inc. (formerly known as Invesco Aim Distributors, Inc.)and Invesco Investment Services, Inc. (formerly known as Invesco AimInvestment Services, Inc.)Formerly: Chief Compliance Officer, Invesco Van Kampen Closed-End Funds;Senior Vice President, Van Kampen Investments Inc.; Senior Vice Presidentand Chief Compliance Officer, Invesco Aim Advisers, Inc. and Invesco AimCapital Management, Inc.; Chief Compliance Officer, INVESCO Private CapitalInvestments, Inc. (holding company), Invesco Private Capital, Inc. (registeredinvestment adviser), Invesco Global Asset Management (N.A.), Inc., InvescoSenior Secured Management, Inc. (registered investment adviser), VanKampen Investor Services Inc., PowerShares Exchange-Traded Fund Trust,PowerShares Exchange-Traded Fund Trust II, PowerShares India Exchange-Traded Fund Trust and PowerShares Actively Managed Exchange-Traded FundTrust; and Vice President, Invesco Aim Capital Management, Inc. and FundManagement Company
N/A N/A
The Statement of Additional Information of the Trust includes additional information about the Fund’s Trustees and is available upon request, without charge, by calling 1.800.959.4246.Please refer to the Fund’s prospectus for information on the Fund’s sub-advisers.Office of the Fund11 Greenway Plaza, Suite 1000Houston, TX 77046-1173
Investment AdviserInvesco Advisers, Inc.1555 Peachtree Street, N.E.Atlanta, GA 30309
DistributorInvesco Distributors, Inc.11 Greenway Plaza, Suite 1000Houston, TX 77046-1173
AuditorsPricewaterhouseCoopers LLP1201 Louisiana Street, Suite 2900Houston, TX 77002-5678
Counsel to the FundStradley Ronon Stevens & Young, LLP2005 Market Street, Suite 2600Philadelphia, PA 19103-7018
Counsel to the Independent TrusteesGoodwin Procter LLP901 New York Avenue, N.W.Washington, D.C. 20001
Transfer AgentInvesco Investment Services, Inc.11 Greenway Plaza, Suite 1000Houston, TX 77046-1173
CustodianState Street Bank and Trust Company225 Franklin StreetBoston, MA 02110-2801
Invesco V.I. Government Securities Fund

The Fund provides a complete list of its holdings four times in each fiscal year, at the quarter-ends. For the second and fourth quarters, the lists appear in the Fund’s semiannual and annual reports to shareholders. For the first and third quarters, the Fund files the lists with the Securities and Exchange Commission (SEC) on Form N-Q. The Fund’s Form N-Q filings are available on the SEC website, sec.gov. Copies of the Fund’s Forms N-Q may be reviewed and copied at the SEC Public Reference Room in Washington, D.C. You can obtain information on the operation of the Public Reference Room, including information about duplicating fee charges, by calling 202 551 8090 or 800 732 0330, or by electronic request at the following email address: [email protected]. The SEC file numbers for the Fund are 811-07452 and 033-57340. The Fund’s most recent portfolio holdings, as filed on Form N-Q, have also been made available to insurance companies issuing variable annuity contracts and variable life insurance policies (“variable products”) that invest in the Fund.
A description of the policies and procedures that the Fund uses to determine how to vote proxies relating to portfolio securities is available without charge, upon request, from our Client Services department at 800 959 4246 or at invesco.com/proxyguidelines. The information is also available on the SEC website, sec.gov.
Information regarding how the Fund voted proxies related to its portfolio securities during the 12 months ended June 30, 2012, is available at invesco.com/proxysearch. The information is also available on the SEC website, sec.gov.
Invesco Advisers, Inc. is an investment adviser; it provides investment advisory services to individual and institutional clients and does not sell securities. Invesco Distributors, Inc. is the US distributor for Invesco Ltd.’s retail mutual funds, exchange-traded funds and institutional money market funds. Both are wholly owned, indirect subsidiaries of Invesco Ltd.
This report must be accompanied or preceded by a currently effective Fund prospectus and variable product prospectus, which contain more complete information, including sales charges and expenses. Investors should read each carefully before investing.Invesco Distributors, Inc.VIIGR-AR-1
Invesco V.I. International Growth FundAnnual Report to Shareholders December 31, 2012

Invesco V.I. International Growth Fund
How we investWhen selecting stocks for your Fund, we use a disciplined investment strategy that emphasizes fundamental research, sup-ported by both quantitative analysis and portfolio construction techniques. Our EQV (earnings, quality, valuation) strat-egy focuses primarily on identifying qual-ity companies that have experienced, or exhibit the potential for, accelerated or above-average earnings growth, but whose stock prices do not fully reflect these attributes.
While research responsibilities within the portfolio management team are focused by geographic region, we select investments for the Fund using a bottom-up investment approach, which means we construct the Fund primarily on a stock-by-stock basis. We focus on the strengths of individual companies rather than sec-tors, countries or market-cap trends.
We believe disciplined sell decisions are key to successful investing. We consider selling a stock for one of the following reasons:
or it posts disappointing earnings.
-nity becomes available.
Market conditions and your FundGlobal equity markets rebounded in the beginning of 2012 following a difficult and volatile year in 2011. Improvements in global economic indicators and contin-ued accommodative policy measures from central banks provided support for the rally in stocks, with some of the worst performing areas of the market in recent years leading the way in the beginning of 2012. During the year, macroeconomic concerns stemming largely from Greece and Spain eased somewhat as the pro-euro party won the Greek elections and Spanish banks were provided a bailout of up to 100 billion euros. Eurozone leaders also took steps to allow for the direct recapitalization of banks through the European Stability Mechanism (the bail-out fund) and to move closer to a regional banking union during their most
recent summit. In addition, the European Central Bank (ECB) announced new mea-sures to support eurozone economies through potentially unlimited purchases of sovereign debt, with ECB President Mario Draghi pledging to “do whatever it takes” to save the euro (although key details of the plan remain unresolved). The US Federal Reserve announced a third round of quantitative easing with a promise to continue until the labor mar-ket outlook improved materially, and the Bank of Japan took steps to increase its asset purchase program. These easing measures were well received by investors and helped to drive equity markets higher during the year.
In this environment, we continued to construct the Fund’s portfolio with a bot-tom-up approach, selecting stocks on an individual basis. The Fund fared better than its style-specific benchmark in six of 10 sectors, significantly outperforming in the materials and information technology (IT) sectors. In each sector, strong stock selection was a key driver of relative results.
In the materials sector, strong stock selection led the Fund to meaningfully outperform the style-specific index. The Fund’s underweight exposure to this weak sector versus its style-specific index also supported relative results.
As a group, the Fund’s holdings in the consumer discretionary sector delivered double-digit gains, outperforming the style-specific index’s holdings for the reporting period. The Fund’s holdings in the media, multiline retail and hotels, res-taurants and leisure industries were par-ticularly strong. Top contributors in this sector included UK-based retailer Next, German automobile maker Volkswagen and UK-based professional information solutions publisher Reed Elsevier.
The Fund’s holdings are subject to change, and there is no assurance that the Fund will continue to hold any particular security.*Excluding money market fund holdings.
Portfolio CompositionBy sector
Consumer Discretionary 22.2%Information Technology 12.5Financials 10.6Consumer Staples 10.2Industrials 9.8Health Care 9.3Energy 8.7Materials 4.8Telecommunication Services 2.4Utilities 0.9Money Market Funds Plus Other Assets Less Liabilities 8.6
Top 10 Equity Holdings*
1. SAP AG 2.5% 2. Reed Elsevier PLC 2.5 3. Compass Group PLC 2.4 4. Anheuser-Busch InBev N.V. 2.3 5. Suncor Energy, Inc. 2.0 6. Imperial Tobacco Group PLC 2.0 7. Brambles Ltd. 1.8 8. Volkswagen AG-Preference Shares 1.8 9. Roche Holding AG 1.8 10. Teva Pharmaceutical
Industries Ltd.-ADR 1.7
Performance summaryFor the year ended December 31, 2012, Invesco V.I. International Growth Fund deliv-ered double-digit gains but underperformed its style-specific and peer group bench-marks. The Fund’s high single-digit cash position throughout the fiscal year detracted from performance as markets rebounded at the end of the reporting period.
Your Fund’s long-term performance appears later in this report.
Fund vs. IndexesTotal returns, 12/31/11 to 12/31/12, excluding variable product issuer charges. If variable product issuer charges were included, returns would be lower.
Series I Shares 15.53%Series II Shares 15.26MSCI EAFE Index▼ (Broad Market Index) 17.32MSCI EAFE Growth Index▼ (Style-Specific Index) 16.86Lipper VUF International Growth Funds Index■ (Peer Group Index) 19.17
Source(s): ▼Invesco, MSCI via FactSet Research Systems Inc.; ■Lipper Inc.
Management’s Discussion of Fund Performance
Total Net Assets $1.4 billion
Total Number of Holdings* 77

Invesco V.I. International Growth Fund
In contrast, stock selection combined with an underweight exposure to the strong-performing consumer staples sec-tor detracted from relative returns.
The Fund’s high single-digit cash posi-tion throughout the fiscal year detracted from performance as markets rebounded at the end of the reporting period. It is important to note that we do not use cash for “top-down” tactical asset allocation purposes. Historically when the portfolio’s cash position has been higher than aver-age, it has reflected a lack of good EQV investment opportunities in the market-place rather than an overall negative opin-ion on markets. However, concerns about further downside risk led us to be cautious investors throughout the reporting period.
In broad geographic terms, the Fund benefited most significantly from strong stock performance in the UK, the largest country allocation in the portfolio. Within the UK, one of the largest contributors to Fund performance included Compass Group, a global leader in foodservice management and support services.
In the Asia Pacific region, out perform-ance of the style-specific index was led by the Fund’s continued underweight expo-sure to Japan. The Japanese economy continued to face significant headwinds, including a weak export market, the result of the yen remaining near record highs. This put significant pressure on export-oriented companies. Much of the growth in the Japanese stock market this year reflected a temporary benefit result-ing from the resumption of production after the devastating 2011 earthquake and tsunami. In our opinion, this boost is unlikely to last much beyond 2012.
As mentioned above, stock selection in the portfolio is driven by the underlying fundamentals of each individual com-pany, not by any top-down macroeco-nomic views. This focus on bottom-up stock selection is the key driver of the portfolio’s overall profile. The Fund ended the reporting period with overweight exposure (relative to our style-specific benchmark) to the consumer discretion-ary, IT, energy and telecommunication services sectors. The Fund had under-weight exposure to the consumer staples, materials, industrials, financials, health care and utilities sectors.
With market volatility likely to continue for some time, our focus remains on ensuring that our portfolio is comprised of high-quality, reasonably valued com-panies capable of sustained earnings growth. We believe that this balanced EQV-focused approach may help deliver attractive returns over the long term.
We thank you for your continued investment in Invesco V.I. International Growth Fund.
The views and opinions expressed in management’s discussion of Fund performance are those of Invesco Advisers, Inc. These views and opinions are subject to change at any time based on factors such as mar-ket and economic conditions. These views and opin-ions may not be relied upon as investment advice or recommendations, or as an offer for a particular security. The information is not a complete analysis of every aspect of any market, country, industry, security or the Fund. Statements of fact are from sources considered reliable, but Invesco Advisers, Inc. makes no representation or warranty as to their completeness or accuracy. Although historical per-formance is no guarantee of future results, these insights may help you understand our investment management philosophy.
See important Fund and, if applicable, index disclosures later in this report.
Clas OlssonPortfolio manager and chief investment officer of Invesco’s international growth investments team, is lead manager of Invesco
V.I. International Growth Fund. He joined Invesco in 1994. Mr. Olsson became a commissioned officer at the Royal Swedish Naval Academy in 1988. He also earned a BBA from The University of Texas at Austin.
Steve CaoChartered Financial Analyst, portfolio manager, is manager of Invesco V.I. International Growth Fund. He joined
Invesco in 1997. Mr. Cao earned a BA in English from the Tianjin Foreign Language Institute and an MBA from Texas A&M University. He is also a Certified Public Accountant.
Matthew DennisChartered Financial Analyst, portfolio manager, is manager of Invesco V.I. International Growth Fund. He joined
Invesco in 2000. Mr. Dennis earned a BA in economics from The University of Texas at Austin and an MS in finance from Texas A&M University.
Jason HolzerChartered Financial Analyst, portfolio manager, is manager of Invesco V.I. International Growth Fund. He joined
Invesco in 1996. Mr. Holzer earned a BA in quantitative economics and an MS in engineering economic systems from Stanford University.
Mark JasonChartered Financial Analyst, portfolio manager, is manager of Invesco V.I. International Growth Fund. He joined
Invesco in 2001. Mr. Jason earned a BS in finance and a BS in real estate from California State University, Northridge.

Invesco V.I. International Growth Fund
Your Fund’s Long-Term Performance
Past performance cannot guarantee comparable future results.
Results of a $10,000 Investment — Oldest Share Class(es)Fund and index data from 12/31/02
1 Source: Lipper Inc.2 Source(s): Invesco, MSCI via FactSet Research Systems Inc.
$27,224 Invesco V.I. International Growth Fund—Series I Shares
$22,414 Lipper VUF International Growth Funds Index1
$22,021 MSCI EAFE Index2
$21,136 MSCI EAFE Growth Index2
5,000
10,000
15,000
20,000
25,000
30,000
$35,000
12/1212/1112/1012/0912/0812/0712/0612/0512/0412/0312/31/02
Average Annual Total ReturnsAs of 12/31/12
Series I SharesInception (5/5/93) 7.41% 10 Years 10.53 5 Years –0.39 1 Year 15.53
Series II SharesInception (9/19/01) 7.99% 10 Years 10.25 5 Years –0.64 1 Year 15.26
The performance of the Fund’s Series I and Series II share classes will differ primarily due to different class expenses.
The performance data quoted repre-sent past performance and cannot guarantee comparable future results; current performance may be lower or higher. Please contact your variable
product issuer or financial adviser for the most recent month-end variable product performance. Performance fig-ures reflect Fund expenses, reinvested distributions and changes in net asset value. Investment return and principal value will fluctuate so that you may have a gain or loss when you sell shares.
The total annual Fund operating expense ratio set forth in the most recent Fund prospectus as of the date of this report for Series I and Series II shares was 1.03% and 1.28%, respec-tively. The expense ratios presented above may vary from the expense ratios presented in other sections of this report that are based on expenses incurred during the period covered by this report.
Invesco V.I. International Growth Fund, a series portfolio of AIM Variable Insurance Funds (Invesco Variable
Insurance Funds), is currently offered through insurance companies issuing variable products. You cannot pur-chase shares of the Fund directly. Performance figures given represent the Fund and are not intended to reflect actual variable product values. They do not reflect sales charges, expenses and fees assessed in connection with a variable product. Sales charges, expenses and fees, which are deter-mined by the variable product issuers, will vary and will lower the total return.
The most recent month-end perfor-mance data at the Fund level, excluding variable product charges, is available at 800 451 4246. As mentioned above, for the most recent month-end performance including variable product charges, please contact your variable product issuer or financial adviser.

Invesco V.I. International Growth Fund
Invesco V.I. International Growth Fund’s investment objective is long-term growth of capital.
Principal risks of investing in the FundDerivatives risk. The performance of derivative instruments is tied to the performance of an underlying currency, security, index or other instrument. In addition to risks relating to their under-lying instruments, the use of derivatives may include other, possibly greater, risks. Derivatives involve costs, may be volatile, and may involve a small initial investment relative to the risk assumed. Risks associ-ated with the use of derivatives include counterparty, leverage, correlation, liquidity, tax, market, interest rate and management risks. Derivatives may also be more difficult to purchase, sell or value than other investments. The Fund may lose more than the cash amount invested on investments in derivatives. Investors should bear in mind that, while the Fund intends to use derivative strategies, it is not obligated to actively engage in these transactions, generally or in any particular kind of derivative, if the investment manager elects not to do so due to availability, cost, market condi-tions or other factors.
Developing/emerging markets securi-ties risk. Securities issued by foreign companies and governments located in developing/emerging countries may be affected more negatively by inflation, devaluation of their currencies, higher transaction costs, delays in settlement, adverse political developments, the intro-duction of capital controls, withholding taxes, nationalization of private assets, expropriation, social unrest, war or lack of timely information than those in devel-oped countries.
Foreign securities risk. The Fund’s foreign investments may be affected by changes in a foreign country’s exchange rates, political and social instability, changes in economic or taxation policies, difficulties when enforcing obligations, decreased liquidity, and increased vola-tility. Foreign companies may be subject to less regulation resulting in less publicly available information about the companies.
Geographic focus risk. From time to time the Fund may invest a substantial amount of its assets in securities of issuers located in a single country or a
limited number of countries. If the Fund focuses its investments in this manner, it assumes the risk that economic, political and social conditions in those countries will have a significant impact on its invest-ment performance. The Fund’s invest-ment performance may also be more volatile if it focuses its investments in certain countries, especially emerging market countries.
Growth investing risk. Growth stocks tend to be more expensive relative to their earnings or assets compared with other types of stock. As a result they tend to be more sensitive to changes in their earnings and can be more volatile.
Investing in the European Union risk. Many countries in the European Union are susceptible to high economic risks associated with high levels of debt, notably due to investments in sovereign debts of European countries such as Greece, Italy and Spain. One or more member states might exit the European Union, placing its currency and banking system in jeopardy. The European Union faces major issues involving its member-ship, structure, procedures and policies, including the adoption, abandonment or adjustment of the new constitutional treaty, the European Union’s enlarge-ment to the south and east, and resolu-tion of the European Union’s problematic fiscal and democratic accountability. Efforts of the member states to further unify their economic and monetary poli-cies may increase the potential for the downward movement of one member state’s market to cause a similar effect on other member states’ markets. European countries that are part of the European Economic and Monetary Union may be significantly affected by the tight fiscal and monetary controls that the union seeks to impose on its members.
Management risk. The investment techniques and risk analysis used by the Fund’s portfolio managers may not produce the desired results.
Market risk. The prices of and the income generated by the Fund’s securi-ties may decline in response to, among other things, investor sentiment, general economic and market conditions, regional or global instability, and currency and interest rate fluctuations.
About indexes used in this report The MSCI EAFE® Index is an unmanaged index considered representative of stocks of Europe, Australasia and the Far East.
The MSCI EAFE® Growth Index is an unmanaged index considered representa-tive of growth stocks of Europe, Austral-asia and the Far East.
The Lipper VUF International Growth Funds Index is an unmanaged index considered representative of interna-tional growth variable insurance under-lying funds tracked by Lipper.
The Fund is not managed to track the performance of any particular index, including the index(es) defined here, and consequently, the performance of the Fund may deviate significantly from the performance of the index(es).
A direct investment cannot be made in an index. Unless otherwise indicated, index results include reinvested divi-dends, and they do not reflect sales charges. Performance of the peer group, if applicable, reflects fund expenses; performance of a market index does not.
Other informationCPA® and Certified Public Accountant® are trademarks owned by the American Institute of Certified Public Accountants.
The returns shown in management’s discussion of Fund performance are based on net asset values calculated for shareholder transactions. Generally accepted accounting principles require adjustments to be made to the net assets of the Fund at period end for financial reporting purposes, and as such, the net asset values for shareholder transactions and the returns based on those net asset values may differ from the net asset values and returns reported in the Finan-cial Highlights. Additionally, the returns and net asset values shown throughout this report are at the Fund level only and do not include variable product issuer charges. If such charges were included, the total returns would be lower.
Industry classifications used in this report are generally according to the Global Industry Classification Standard, which was developed by and is the exclu-sive property and a service mark of MSCI Inc. and Standard & Poor’s.

Schedule of InvestmentsDecember 31, 2012
Shares Value
Common Stocks & Other Equity Interests–91.38%Australia–5.14%
BHP Billiton Ltd. 387,469 $ 15,148,628
Brambles Ltd. 3,267,078 26,028,641
CSL Ltd. 273,542 15,470,076
WorleyParsons Ltd. 657,369 16,234,741
72,882,086
Belgium–2.28%
Anheuser-Busch InBev N.V. 369,776 32,300,729
Brazil–1.73%
Banco Bradesco S.A.–ADR 1,416,552 24,605,508
Canada–8.39%
Agrium Inc. 134,833 13,465,643
Canadian National Railway Co. 132,030 12,013,972
Canadian Natural Resources Ltd. 340,209 9,815,237
Cenovus Energy Inc. 394,929 13,243,867
CGI Group Inc.–Class A(a) 508,229 11,744,508
Fairfax Financial Holdings Ltd. 39,373 14,221,002
Potash Corp. of Saskatchewan Inc. 400,673 16,338,514
Suncor Energy, Inc. 858,148 28,276,439
119,119,182
China–4.90%
Baidu, Inc. –ADR(a) 236,688 23,737,439
China Mobile Ltd. 1,480,500 17,343,589
CNOOC Ltd. 5,214,000 11,449,488
Industrial & Commercial Bank of ChinaLtd.–Class H 23,652,000 17,058,281
69,588,797
Denmark–0.98%
Novo Nordisk A.S.–Class B 85,235 13,915,642
France–4.53%
Cap Gemini S.A. 220,478 9,604,393
Eutelsat Communications S.A. 279,237 9,267,847
L’Oreal S.A. 71,381 9,967,063
Publicis Groupe S.A. 305,046 18,269,429
Schneider Electric S.A. 230,673 17,197,228
64,305,960
Germany–7.67%
Adidas AG 257,459 22,934,708
Deutsche Boerse AG 187,535 11,441,605
Fresenius Medical Care AG & Co. KGaA 204,991 14,157,368
SAP AG 439,795 35,216,315
Volkswagen AG–Preference Shares 110,415 25,109,575
108,859,571
Shares Value
Hong Kong–2.26%
Galaxy Entertainment Group Ltd.(a) 4,009,000 $ 15,992,445
Hutchison Whampoa Ltd. 1,510,000 16,019,674
32,012,119
Ireland–1.71%
Shire PLC 260,953 8,016,868
WPP PLC 1,119,631 16,280,888
24,297,756
Israel–1.74%
Teva Pharmaceutical Industries Ltd.–ADR 660,798 24,674,197
Japan–5.28%
Canon Inc. 150,100 5,879,443
Denso Corp. 287,600 9,993,755
Fanuc Corp. 73,700 13,687,365
Keyence Corp. 73,500 20,258,450
Komatsu Ltd. 297,837 7,611,387
Toyota Motor Corp. 375,200 17,489,832
74,920,232
Mexico–3.65%
America Movil S.A.B. de C.V.–ADR 698,812 16,170,510
Fomento Economico Mexicano, S.A.B.de C.V.–ADR 120,151 12,099,206
Grupo Televisa S.A.B.–ADR 884,282 23,504,215
51,773,931
Netherlands–1.23%
Unilever N.V. 463,092 17,466,912
Singapore–2.33%
Keppel Corp. Ltd. 2,125,661 19,317,156
United Overseas Bank Ltd. 837,000 13,710,429
33,027,585
South Korea–2.52%
Hyundai Mobis 73,457 20,039,083
NHN Corp. 73,018 15,659,797
35,698,880
Spain–1.13%
Amadeus IT Holding S.A.–Class A 641,922 16,101,842
Sweden–4.40%
Investment AB Kinnevik–Class B 433,738 9,064,947
Investor AB–Class B 636,032 16,685,473
Swedbank AB–Class A 727,648 14,321,917
Telefonaktiebolaget LM Ericsson–Class B 1,036,186 10,424,396
Volvo AB–Class B 864,575 11,924,701
62,421,434
See accompanying Notes to Financial Statements which are an integral part of the financial statements.
Invesco V.I. International Growth Fund

Shares Value
Switzerland–8.02%
ABB Ltd. 753,828 $ 15,637,881
Julius Baer Group Ltd. 401,686 14,438,699
Nestle S.A. 323,111 21,034,861
Novartis AG 239,018 15,118,542
Roche Holding AG 122,208 24,873,698
Syngenta AG 56,333 22,702,679
113,806,360
Taiwan–1.08%
Taiwan Semiconductor ManufacturingCo. Ltd.–ADR 890,024 15,272,812
Turkey–1.07%
Akbank T.A.S. 3,053,947 15,117,871
United Kingdom–18.40%
BG Group PLC 1,215,588 20,388,951
British American Tobacco PLC 474,212 24,034,994
British Sky Broadcasting Group PLC 1,192,941 14,906,230
Centrica PLC 2,347,627 12,756,766
Compass Group PLC 2,820,635 33,368,221
Gazprom OAO–ADR 760,500 7,292,338
Imperial Tobacco Group PLC 725,580 28,025,923
Informa PLC 1,688,165 12,492,433
Kingfisher PLC 3,498,804 16,151,672
Next PLC 234,536 14,479,743
Pearson PLC 532,595 10,414,768
Reed Elsevier PLC 3,325,189 34,923,812
Royal Dutch Shell PLC–Class B 471,279 16,684,290
Smith & Nephew PLC 1,371,839 15,185,836
261,105,977
United States–0.94%
Avago Technologies Ltd. 420,309 13,306,983
Total Common Stocks & Other Equity Interests(Cost $934,547,606) 1,296,582,366
Shares Value
Money Market Funds–8.50%Liquid Assets Portfolio–Institutional
Class(b) 60,276,542 $ 60,276,542
Premier Portfolio–Institutional Class(b) 60,276,541 60,276,541
Total Money Market Funds(Cost $120,553,083) 120,553,083
TOTAL INVESTMENTS–99.88%(Cost $1,055,100,689) 1,417,135,449
OTHER ASSETS LESS LIABILITIES–0.12% 1,715,913
NET ASSETS–100.00% $1,418,851,362
Investment Abbreviations:
ADR – American Depositary Receipt
Notes to Schedule of Investments:(a) Non-income producing security.(b) The money market fund and the Fund are affiliated by having the same
investment adviser.
See accompanying Notes to Financial Statements which are an integral part of the financial statements.
Invesco V.I. International Growth Fund

Statement of Assets and LiabilitiesDecember 31, 2012
Statement of OperationsFor the year ended December 31, 2012
Assets:
Investments, at value (Cost $934,547,606) $1,296,582,366
Investments in affiliated money market funds, at valueand cost 120,553,083
Total investments, at value (Cost $1,055,100,689) 1,417,135,449
Foreign currencies, at value (Cost $514,174) 517,416
Receivable for:Investments sold 1,295,738
Fund shares sold 957,495
Dividends 2,009,696
Investment for trustee deferred compensation andretirement plans 77,819
Other assets 190
Total assets 1,421,993,803
Liabilities:
Payable for:Fund shares reacquired 1,484,710
Accrued fees to affiliates 1,340,432
Accrued other operating expenses 95,647
Trustee deferred compensation and retirement plans 221,652
Total liabilities 3,142,441
Net assets applicable to shares outstanding $1,418,851,362
Net assets consist of:
Shares of beneficial interest $1,284,343,013
Undistributed net investment income 13,999,707
Undistributed net realized gain (loss) (241,544,197)
Unrealized appreciation 362,052,839
$1,418,851,362
Net Assets:
Series I $ 591,490,817
Series II $ 827,360,545
Shares outstanding, $0.001 par value per share,with an unlimited number of shares authorized:
Series I 19,695,815
Series II 27,873,359
Series I:Net asset value per share $ 30.03
Series II:Net asset value per share $ 29.68
Investment income:
Dividends (net of foreign withholding taxes of $2,612,167) $ 29,217,575
Dividends from affiliated money market funds 173,207
Total investment income 29,390,782
Expenses:
Advisory fees 9,327,362
Administrative services fees 3,480,071
Custodian fees 338,600
Distribution fees — Series II 1,828,836
Transfer agent fees 65,691
Trustees’ and officers’ fees and benefits 69,138
Other 55,474
Total expenses 15,165,172
Less: Fees waived (175,809)
Net expenses 14,989,363
Net investment income 14,401,419
Realized and unrealized gain (loss) from:
Net realized gain (loss) from:Investment securities (includes net gains from securities
sold to affiliates of $37,339) 16,963,841
Foreign currencies (216,406)
16,747,435
Change in net unrealized appreciation (depreciation) of:Investment securities (net of foreign taxes of $52,335) 154,116,074
Foreign currencies (242,300)
153,873,774
Net realized and unrealized gain 170,621,209
Net increase in net assets resulting from operations $185,022,628
See accompanying Notes to Financial Statements which are an integral part of the financial statements.
Invesco V.I. International Growth Fund

Statement of Changes in Net AssetsFor the years ended December 31, 2012 and 2011
2012 2011
Operations:
Net investment income $ 14,401,419 $ 19,119,924
Net realized gain 16,747,435 53,816,330
Change in net unrealized appreciation (depreciation) 153,873,774 (159,536,857)
Net increase (decrease) in net assets resulting from operations 185,022,628 (86,600,603)
Distributions to shareholders from net investment income:
Series I (8,556,390) (8,703,100)
Series ll (9,968,702) (6,565,728)
Total distributions from net investment income (18,525,092) (15,268,828)
Share transactions-net:
Series l (26,680,260) 6,595,238
Series ll 127,622,176 90,856,363
Net increase in net assets resulting from share transactions 100,941,916 97,451,601
Net increase (decrease) in net assets 267,439,452 (4,417,830)
Net assets:
Beginning of year 1,151,411,910 1,155,829,740
End of year (includes undistributed net investment income of $13,999,707 and $18,339,786, respectively) $1,418,851,362 $1,151,411,910
Notes to Financial StatementsDecember 31, 2012
NOTE 1—Significant Accounting Policies
Invesco V.I. International Growth Fund (the “Fund”) is a series portfolio of AIM Variable Insurance Funds (Invesco Variable Insurance Funds) (the“Trust”). The Trust is a Delaware statutory trust registered under the Investment Company Act of 1940, as amended (the “1940 Act”), as an open-end series management investment company consisting of twenty-five separate portfolios, (each constituting a “Fund”). The assets, liabilities andoperations of each portfolio are accounted for separately. Information presented in these financial statements pertains only to the Fund. Mattersaffecting each Fund or class will be voted on exclusively by the shareholders of such Fund or class. Current Securities and Exchange Commission(“SEC”) guidance, however, requires participating insurance companies offering separate accounts to vote shares proportionally in accordance withthe instructions of the contract owners whose investments are funded by shares of each Fund or class.
The Fund’s investment objective is long-term growth of capital.The Fund currently offers two classes of shares, Series I and Series II, both of which are offered to insurance company separate accounts funding
variable annuity contracts and variable life insurance policies (“variable products”).The following is a summary of the significant accounting policies followed by the Fund in the preparation of its financial statements.
A. Security Valuations — Securities, including restricted securities, are valued according to the following policy.A security listed or traded on an exchange (except convertible bonds) is valued at its last sales price or official closing price as of the close of
the customary trading session on the exchange where the security is principally traded, or lacking any sales or official closing price on a particularday, the security may be valued at the closing bid price on that day. Securities traded in the over-the-counter market are valued based on pricesfurnished by independent pricing services or market makers. When such securities are valued by an independent pricing service they may beconsidered fair valued. Futures contracts are valued at the final settlement price set by an exchange on which they are principally traded. Listedoptions are valued at the mean between the last bid and ask prices from the exchange on which they are principally traded. Options not listed onan exchange are valued by an independent source at the mean between the last bid and ask prices. For purposes of determining net asset valueper share, futures and option contracts generally are valued 15 minutes after the close of the customary trading session of the New York StockExchange (“NYSE”).
Investments in open-end and closed-end registered investment companies that do not trade on an exchange are valued at the end of day netasset value per share. Investments in open-end and closed-end registered investment companies that trade on an exchange are valued at the lastsales price or official closing price as of the close of the customary trading session on the exchange where the security is principally traded.
Debt obligations (including convertible bonds) and unlisted equities are fair valued using an evaluated quote provided by an independentpricing service. Evaluated quotes provided by the pricing service may be determined without exclusive reliance on quoted prices, and may reflectappropriate factors such as institution-size trading in similar groups of securities, developments related to specific securities, dividend rate (forunlisted equities), yield (for debt obligations), quality, type of issue, coupon rate (for debt obligations), maturity (for debt obligations), individualtrading characteristics and other market data. Debt obligations are subject to interest rate and credit risks. In addition, all debt obligationsinvolve some risk of default with respect to interest and/or principal payments.
Invesco V.I. International Growth Fund

Foreign securities’ (including foreign exchange contracts) prices are converted into U.S. dollar amounts using the applicable exchange rates asof the close of the NYSE. If market quotations are available and reliable for foreign exchange-traded equity securities, the securities will be valuedat the market quotations. Because trading hours for certain foreign securities end before the close of the NYSE, closing market quotations maybecome unreliable. If between the time trading ends on a particular security and the close of the customary trading session on the NYSE, eventsoccur that the Adviser determines are significant and make the closing price unreliable, the Fund may fair value the security. If the event is likelyto have affected the closing price of the security, the security will be valued at fair value in good faith using procedures approved by the Board ofTrustees. Adjustments to closing prices to reflect fair value may also be based on a screening process of an independent pricing service toindicate the degree of certainty, based on historical data, that the closing price in the principal market where a foreign security trade is not thecurrent value as of the close of the NYSE. Foreign securities’ prices meeting the approved degree of certainty that the price is not reflective ofcurrent value will be priced at the indication of fair value from the independent pricing service. Multiple factors may be considered by theindependent pricing service in determining adjustments to reflect fair value and may include information relating to sector indices, AmericanDepositary Receipts and domestic and foreign index futures. Foreign securities may have additional risks including exchange rate changes,potential for sharply devalued currencies and high inflation, political and economic upheaval, the relative lack of issuer information, relatively lowmarket liquidity and the potential lack of strict financial and accounting controls and standards.
Securities for which market prices are not provided by any of the above methods may be valued based upon quotes furnished by independentsources. The last bid price may be used to value equity securities. The mean between the last bid and asked prices is used to value debtobligations, including corporate loans.
Securities for which market quotations are not readily available or became unreliable are valued at fair value as determined in good faith by orunder the supervision of the Trust’s officers following procedures approved by the Board of Trustees. Issuer specific events, market trends, bid/ask quotes of brokers and information providers and other market data may be reviewed in the course of making a good faith determination of asecurity’s fair value.
Valuations change in response to many factors including the historical and prospective earnings of the issuer, the value of the issuer’s assets,general economic conditions, interest rates, investor perceptions and market liquidity. Because of the inherent uncertainties of valuation, thevalues reflected in the financial statements may materially differ from the value received upon actual sale of those investments.
B. Securities Transactions and Investment Income — Securities transactions are accounted for on a trade date basis. Realized gains orlosses on sales are computed on the basis of specific identification of the securities sold. Interest income is recorded on the accrual basis fromsettlement date. Dividend income (net of withholding tax, if any) is recorded on the ex-dividend date.
The Fund may periodically participate in litigation related to Fund investments. As such, the Fund may receive proceeds from litigationsettlements. Any proceeds received are included in the Statement of Operations as realized gain (loss) for investments no longer held and asunrealized gain (loss) for investments still held.
Brokerage commissions and mark ups are considered transaction costs and are recorded as an increase to the cost basis of securitiespurchased and/or a reduction of proceeds on a sale of securities. Such transaction costs are included in the determination of net realized andunrealized gain (loss) from investment securities reported in the Statement of Operations and the Statement of Changes in Net Assets and the netrealized and unrealized gains (losses) on securities per share in the Financial Highlights. Transaction costs are included in the calculation of theFund’s net asset value and, accordingly, they reduce the Fund’s total returns. These transaction costs are not considered operating expenses andare not reflected in net investment income reported in the Statement of Operations and Statement of Changes in Net Assets, or the net investmentincome per share and ratios of expenses and net investment income reported in the Financial Highlights, nor are they limited by any expenselimitation arrangements between the Fund and the investment adviser.
The Fund allocates income and realized and unrealized capital gains and losses to a class based on the relative net assets of each class.C. Country Determination — For the purposes of making investment selection decisions and presentation in the Schedule of Investments, the
investment adviser may determine the country in which an issuer is located and/or credit risk exposure based on various factors. These factorsinclude the laws of the country under which the issuer is organized, where the issuer maintains a principal office, the country in which the issuerderives 50% or more of its total revenues and the country that has the primary market for the issuer’s securities, as well as other criteria. Amongthe other criteria that may be evaluated for making this determination are the country in which the issuer maintains 50% or more of its assets,the type of security, financial guarantees and enhancements, the nature of the collateral and the sponsor organization. Country of issuer and/orcredit risk exposure has been determined to be the United States of America, unless otherwise noted.
D. Distributions — Distributions from income and net realized capital gain, if any, are generally declared and paid to separate accounts ofparticipating insurance companies annually and recorded on the ex-dividend date.
E. Federal Income Taxes — The Fund intends to comply with the requirements of Subchapter M of the Internal Revenue Code necessary toqualify as a regulated investment company and to distribute substantially all of the Fund’s taxable earnings to shareholders. As such, the Fund willnot be subject to federal income taxes on otherwise taxable income (including net realized capital gain) that is distributed to shareholders.Therefore, no provision for federal income taxes is recorded in the financial statements.
The Fund files tax returns in the U.S. Federal jurisdiction and certain other jurisdictions. Generally, the Fund is subject to examinations by suchtaxing authorities for up to three years after the filing of the return for the tax period.
F. Expenses — Fees provided for under the Rule 12b-1 plan of a particular class of the Fund and which are directly attributable to that class arecharged to the operations of such class. All other expenses are allocated among the classes based on relative net assets.
G. Accounting Estimates — The preparation of financial statements in conformity with accounting principles generally accepted in the UnitedStates of America (“GAAP”) requires management to make estimates and assumptions that affect the reported amounts of assets and liabilities atthe date of the financial statements and the reported amounts of revenues and expenses during the reporting period including estimates andassumptions related to taxation. Actual results could differ from those estimates by a significant amount. In addition, the Fund monitors formaterial events or transactions that may occur or become known after the period-end date and before the date the financial statements arereleased to print.
H. Indemnifications — Under the Trust’s organizational documents, each Trustee, officer, employee or other agent of the Trust is indemnifiedagainst certain liabilities that may arise out of the performance of their duties to the Fund. Additionally, in the normal course of business, the
Invesco V.I. International Growth Fund

Fund enters into contracts, including the Fund’s servicing agreements, that contain a variety of indemnification clauses. The Fund’s maximumexposure under these arrangements is unknown as this would involve future claims that may be made against the Fund that have not yetoccurred. The risk of material loss as a result of such indemnification claims is considered remote.
I. Foreign Currency Translations — Foreign currency is valued at the close of the NYSE based on quotations posted by banks and majorcurrency dealers. Portfolio securities and other assets and liabilities denominated in foreign currencies are translated into U.S. dollar amounts atdate of valuation. Purchases and sales of portfolio securities (net of foreign taxes withheld on disposition) and income items denominated inforeign currencies are translated into U.S. dollar amounts on the respective dates of such transactions. The Fund does not separately account forthe portion of the results of operations resulting from changes in foreign exchange rates on investments and the fluctuations arising fromchanges in market prices of securities held. The combined results of changes in foreign exchange rates and the fluctuation of market prices oninvestments (net of estimated foreign tax withholding) are included with the net realized and unrealized gain or loss from investments in theStatement of Operations. Reported net realized foreign currency gains or losses arise from (1) sales of foreign currencies, (2) currency gains orlosses realized between the trade and settlement dates on securities transactions, and (3) the difference between the amounts of dividends,interest, and foreign withholding taxes recorded on the Fund’s books and the U.S. dollar equivalent of the amounts actually received or paid. Netunrealized foreign currency gains and losses arise from changes in the fair values of assets and liabilities, other than investments in securities atfiscal period end, resulting from changes in exchange rates.
The Fund may invest in foreign securities which may be subject to foreign taxes on income, gains on investments or currency repatriation, aportion of which may be recoverable.
J. Foreign Currency Contracts — The Fund may enter into foreign currency contracts to manage or minimize currency or exchange rate risk.The Fund may also enter into foreign currency contracts for the purchase or sale of a security denominated in a foreign currency in order to “lockin” the U.S. dollar price of that security. A foreign currency contract is an obligation to purchase or sell a specific currency for an agreed-uponprice at a future date. The use of foreign currency contracts does not eliminate fluctuations in the price of the underlying securities the Fundowns or intends to acquire but establishes a rate of exchange in advance. Fluctuations in the value of these contracts are measured by thedifference in the contract date and reporting date exchange rates and are recorded as unrealized appreciation (depreciation) until the contractsare closed. When the contracts are closed, realized gains (losses) are recorded. Realized and unrealized gains (losses) on the contracts areincluded in the Statement of Operations. The primary risks associated with foreign currency contracts include failure of the counterparty to meetthe terms of the contract and the value of the foreign currency changing unfavorably. These risks may be in excess of the amounts reflected inthe Statement of Assets and Liabilities.
NOTE 2—Advisory Fees and Other Fees Paid to Affiliates
The Trust has entered into a master investment advisory agreement with Invesco Advisers, Inc. (the “Adviser” or “Invesco”). Under the terms of theinvestment advisory agreement, the Fund pays an advisory fee to the Adviser based on the annual rate of the Fund’s average daily net assets asfollows:
Average Net Assets Rate
First $250 million 0.75%
Over $250 million 0.70%
Under the terms of a master sub-advisory agreement between the Adviser and each of Invesco Asset Management Deutschland GmbH, InvescoAsset Management Limited, Invesco Asset Management (Japan) Limited, Invesco Australia Limited, Invesco Hong Kong Limited, Invesco Senior SecuredManagement, Inc. and Invesco Canada Ltd. (collectively, the “Affiliated Sub-Advisers”) the Adviser, not the Fund, may pay 40% of the fees paid to theAdviser to any such Affiliated Sub-Adviser(s) that provide discretionary investment management services to the Fund based on the percentage ofassets allocated to such Sub-Adviser(s).
Effective July 1, 2012, the Adviser has contractually agreed, through at least June 30, 2013, to waive advisory fees and/or reimburse expensesof all shares to the extent necessary to limit total annual fund operating expenses after fee waiver and/or expense reimbursement (excluding certainitems discussed below) of Series I shares to 2.25% and Series II shares to 2.50% of average daily net assets. Prior to July 1, 2012, the Adviser hadcontractually agreed to waive advisory fees and/or reimburse expenses of all shares to the extent necessary to limit total annual fund operatingexpenses after fee waiver and/or expense reimbursement (excluding certain items discussed below) of Series I shares to 1.11% and Series II sharesto 1.36% of average daily net assets. In determining the Adviser’s obligation to waive advisory fees and/or reimburse expenses, the followingexpenses are not taken into account, and could cause the total annual fund operating expenses after fee waiver and/or expense reimbursement toexceed the numbers reflected above: (1) interest; (2) taxes; (3) dividend expense on short sales; (4) extraordinary or non-routine items, includinglitigation expenses; and (5) expenses that the Fund has incurred but did not actually pay because of an expense offset arrangement. Unless the Boardof Trustees and Invesco mutually agree to amend or continue the fee waiver agreement, it will terminate on June 30, 2013. The Adviser did notwaive fees and/or reimburse expenses during the period under this expense limitation.
Further, the Adviser has contractually agreed, through at least June 30, 2013, to waive the advisory fee payable by the Fund in an amount equalto 100% of the net advisory fees the Adviser receives from the affiliated money market funds on investments by the Fund of uninvested cash in suchaffiliated money market funds.
For the year ended December 31, 2012, the Adviser waived advisory fees of $175,809.The Trust has entered into a master administrative services agreement with Invesco pursuant to which the Fund has agreed to pay Invesco a fee for
costs incurred in providing accounting services and fund administrative services to the Fund and to reimburse Invesco for administrative services feespaid to insurance companies that have agreed to provide services to the participants of separate accounts. These administrative services provided bythe insurance companies may include, among other things: the printing of prospectuses, financial reports and proxy statements and the delivery ofthe same to existing participants; the maintenance of master accounts; the facilitation of purchases and redemptions requested by the participants;and the servicing of participants’ accounts. Pursuant to such agreement, for the year ended December 31, 2012, Invesco was paid $309,850 foraccounting and fund administrative services and reimbursed $3,170,221 for services provided by insurance companies.
Invesco V.I. International Growth Fund

The Trust has entered into a transfer agency and service agreement with Invesco Investment Services, Inc. (“IIS”) pursuant to which the Fund hasagreed to pay IIS a fee for providing transfer agency and shareholder services to the Fund and reimburse IIS for certain expenses incurred by IIS in thecourse of providing such services. For the year ended December 31, 2012, expenses incurred under the agreement are shown in the Statement ofOperations as Transfer agent fees.
The Trust has entered into a master distribution agreement with Invesco Distributors, Inc. (“IDI”) to serve as the distributor for the Fund. The Trusthas adopted a plan pursuant to Rule 12b-1 under the 1940 Act with respect to the Fund’s Series II shares (the “Plan”). The Fund, pursuant to thePlan, pays IDI compensation at the annual rate of 0.25% of the Fund’s average daily net assets of Series II shares. Of the Plan payments, up to0.25% of the average daily net assets of the Series II shares may be paid to insurance companies who furnish continuing personal shareholderservices to customers who purchase and own Series II shares of the Fund. For the year ended December 31, 2012, expenses incurred under the Planare detailed in the Statement of Operations as Distribution fees.
Certain officers and trustees of the Trust are officers and directors of the Adviser, IIS and/or IDI.
NOTE 3—Additional Valuation Information
GAAP defines fair value as the price that would be received to sell an asset or paid to transfer a liability in an orderly transaction between marketparticipants at the measurement date, under current market conditions. GAAP establishes a hierarchy that prioritizes the inputs to valuation methodsgiving the highest priority to readily available unadjusted quoted prices in an active market for identical assets (Level 1) and the lowest priority tosignificant unobservable inputs (Level 3) generally when market prices are not readily available or are unreliable. Based on the valuation inputs, thesecurities or other investments are tiered into one of three levels. Changes in valuation methods may result in transfers in or out of an investment’sassigned level:
Level 1 – Prices are determined using quoted prices in an active market for identical assets.Level 2 – Prices are determined using other significant observable inputs. Observable inputs are inputs that other market participants may use in
pricing a security. These may include quoted prices for similar securities, interest rates, prepayment speeds, credit risk, yield curves,loss severities, default rates, discount rates, volatilities and others.
Level 3 – Prices are determined using significant unobservable inputs. In situations where quoted prices or observable inputs are unavailable (forexample, when there is little or no market activity for an investment at the end of the period), unobservable inputs may be used.Unobservable inputs reflect the Fund’s own assumptions about the factors market participants would use in determining fair value of thesecurities or instruments and would be based on the best available information.
The following is a summary of the tiered valuation input levels, as of December 31, 2012. The level assigned to the securities valuations may notbe an indication of the risk or liquidity associated with investing in those securities. Because of the inherent uncertainties of valuation, the valuesreflected in the financial statements may materially differ from the value received upon actual sale of those investments.
During the year ended December 31, 2012, there were transfers from Level 1 to Level 2 of $370,338,789 and from Level 2 to Level 1 of$21,034,861, due to foreign fair value adjustments.
Level 1 Level 2 Level 3 Total
Australia $ — $ 72,882,086 $— $ 72,882,086
Belgium — 32,300,729 — 32,300,729
Brazil 24,605,508 — — 24,605,508
Canada 119,119,182 — — 119,119,182
China 23,737,439 45,851,358 — 69,588,797
Denmark — 13,915,642 — 13,915,642
France — 64,305,960 — 64,305,960
Germany 35,216,315 73,643,256 — 108,859,571
Hong Kong — 32,012,119 — 32,012,119
Ireland — 24,297,756 — 24,297,756
Israel 24,674,197 — — 24,674,197
Japan — 74,920,232 — 74,920,232
Mexico 51,773,931 — — 51,773,931
Netherlands — 17,466,912 — 17,466,912
Singapore — 33,027,585 — 33,027,585
South Korea — 35,698,880 — 35,698,880
Spain — 16,101,842 — 16,101,842
Sweden — 62,421,434 — 62,421,434
Switzerland 21,034,861 92,771,499 — 113,806,360
Taiwan 15,272,812 — — 15,272,812
Turkey — 15,117,871 — 15,117,871
United Kingdom 16,151,672 244,954,305 — 261,105,977
United States 133,860,066 — — 133,860,066
$465,445,983 $951,689,466 $— $1,417,135,449
Invesco V.I. International Growth Fund

NOTE 4—Security Transactions with Affiliated Funds
The Fund is permitted to purchase or sell securities from or to certain other Invesco Funds under specified conditions outlined in procedures adoptedby the Board of Trustees of the Trust. The procedures have been designed to ensure that any purchase or sale of securities by the Fund from or toanother fund or portfolio that is or could be considered an affiliate by virtue of having a common investment adviser (or affiliated investmentadvisers), common Trustees and/or common officers complies with Rule 17a-7 of the 1940 Act. Further, as defined under the procedures, eachtransaction is effected at the current market price. Pursuant to these procedures, for the year ended December 31, 2012, the Fund engaged insecurities sales of $135,819, which resulted in net realized gains of $37,339.
NOTE 5—Trustees’ and Officers’ Fees and Benefits
“Trustees’ and Officers’ Fees and Benefits” include amounts accrued by the Fund to pay remuneration to certain Trustees and Officers of the Fund.Trustees have the option to defer compensation payable by the Fund, and “Trustees’ and Officers’ Fees and Benefits” also include amounts accrued bythe Fund to fund such deferred compensation amounts. Those Trustees who defer compensation have the option to select various Invesco Funds inwhich their deferral accounts shall be deemed to be invested. Finally, certain current Trustees are eligible to participate in a retirement plan thatprovides for benefits to be paid upon retirement to Trustees over a period of time based on the number of years of service. The Fund may have certainformer Trustees who also participate in a retirement plan and receive benefits under such plan. “Trustees’ and Officers’ Fees and Benefits” includeamounts accrued by the Fund to fund such retirement benefits. Obligations under the deferred compensation and retirement plans representunsecured claims against the general assets of the Fund.
NOTE 6—Cash Balances
The Fund is permitted to temporarily carry a negative or overdrawn balance in its account with State Street Bank and Trust Company, the custodianbank. Such balances, if any at period end, are shown in the Statement of Assets and Liabilities under the payable caption Amount due custodian. Tocompensate the custodian bank for such overdrafts, the overdrawn Fund may either (1) leave funds as a compensating balance in the account so thecustodian bank can be compensated by earning the additional interest; or (2) compensate by paying the custodian bank at a rate agreed upon by thecustodian bank and Invesco, not to exceed the contractually agreed upon rate.
NOTE 7—Distributions to Shareholders and Tax Components of Net Assets
Tax Character of Distributions to Shareholders Paid During the Years Ended December 31, 2012 and 2011:
2012 2011
Ordinary income $18,525,092 $15,268,828
Tax Components of Net Assets at Period-End:
2012
Undistributed ordinary income $ 17,912,503
Net unrealized appreciation—investments 340,322,039
Net unrealized appreciation —other investments 18,079
Temporary book/tax differences (212,381)
Capital loss carryforward (223,531,891)
Shares of beneficial interest 1,284,343,013
Total net assets $1,418,851,362
The difference between book-basis and tax-basis unrealized appreciation (depreciation) is due to differences in the timing of recognition of gainsand losses on investments for tax and book purposes. The Fund’s net unrealized appreciation difference is attributable primarily to wash sales andpassive foreign investment companies.
The temporary book/tax differences are a result of timing differences between book and tax recognition of income and/or expenses. The Fund’stemporary book/tax differences are the result of the trustee deferral of compensation and retirement plan benefits.
Capital loss carryforward is calculated and reported as of a specific date. Results of transactions and other activity after that date may affect theamount of capital loss carryforward actually available for the Fund to utilize. The Regulated Investment Company Modernization Act of 2010 (the“Act”) eliminated the eight-year carryover period for capital losses that arise in taxable years beginning after its enactment date of December 22,2010. Consequently, these capital losses can be carried forward for an unlimited period. However, capital losses with an expiration period may not beused to offset capital gains until all net capital losses without an expiration date have been utilized. Additionally, post-enactment capital losscarryovers will retain their character as either short-term or long-term capital losses instead of as short-term capital losses as under prior law. Theability to utilize capital loss carryforward in the future may be limited under the Internal Revenue Code and related regulations based on the results offuture transactions.
Invesco V.I. International Growth Fund

The Fund utilized $12,836,124 of capital loss carryforward in the current period to offset net realized capital gain for federal income taxpurposes. The Fund has a capital loss carryforward as of December 31, 2012, which expires as follows:
Capital Loss Carryforward*Expiration Short-Term Long-Term Total
December 31, 2016 $ 42,539,639 $— $ 42,539,639
December 31, 2017 143,189,697 — 143,189,697
December 31, 2018 37,802,555 — 37,802,555
$223,531,891 $— $223,531,891
* Capital loss carryforward as of the date listed above is reduced for limitations, if any, to the extent required by the Internal Revenue Code. To the extent thatunrealized gains as of May 02, 2011, the date of the reorganizations of Invesco Van Kampen V.I. International Growth Equity Fund into the Fund are realized onsecurities held in each fund at such date of reorganization, the capital loss carryforward may be further limited for up to five years from the date of thereorganization.
NOTE 8—Investment Securities
The aggregate amount of investment securities (other than short-term securities, U.S. Treasury obligations and money market funds, if any)purchased and sold by the Fund during the year ended December 31, 2012 was $356,811,603 and $289,652,148, respectively. Cost ofinvestments on a tax basis includes the adjustments for financial reporting purposes as of the most recently completed federal income tax reportingperiod-end.
Unrealized Appreciation (Depreciation) of Investment Securities on a Tax Basis
Aggregate unrealized appreciation of investment securities $349,103,402
Aggregate unrealized (depreciation) of investment securities (8,781,363)
Net unrealized appreciation of investment securities $340,322,039
Cost of investments for tax purposes is $1,076,813,410.
NOTE 9—Reclassification of Permanent Differences
Primarily as a result of differing book/tax treatment of foreign currency transactions, on December 31, 2012, undistributed net investment incomewas decreased by $216,406 and undistributed net realized gain (loss) was increased by $216,406. This reclassification had no effect on the netassets of the Fund.
NOTE 10—Share Information
Summary of Share ActivityYear ended December 31,
2012(a) 2011
Shares Amount Shares Amount
Sold:
Series I 3,825,772 $ 108,462,127 4,674,557 $ 132,444,153
Series II 7,868,132 219,142,823 5,695,478 157,043,118
Issued as reinvestment of dividends:
Series I 293,127 8,556,390 292,246 8,703,100
Series II 345,296 9,968,702 222,492 6,565,728
Issued in connection with acquisitions:(b)
Series I — — 426 13,190
Series II — — 1,107,888 34,002,342
Reacquired:
Series I (5,060,588) (143,698,777) (4,761,021) (134,565,205)
Series II (3,624,167) (101,489,349) (3,833,060) (106,754,825)
Net increase in share activity 3,647,572 $ 100,941,916 3,399,006 $ 97,451,601
(a) There are entities that are record owners of more than 5% of the outstanding shares of the Fund and in the aggregate own 32% of the outstanding shares of theFund. The Fund and the Fund’s principal underwriter or adviser, are parties to participation agreements with these entities whereby these entities sell units ofinterest in separate accounts funding variable products that are invested in the Fund. The Fund, Invesco and/or Invesco affiliates may make payments to theseentities, which are considered to be related to the Fund, for providing services to the Fund, Invesco and/or Invesco affiliates including but not limited to servicessuch as, securities brokerage, third party record keeping and account servicing and administrative services. The Fund has no knowledge as to whether all or anyportion of the shares owned of record by these entities are also owned beneficially.
Invesco V.I. International Growth Fund

(b) As of the open of business on May 2, 2011, the Fund acquired all the net assets of Invesco Van Kampen V.I. International Growth Equity Fund (the “Target Fund”)pursuant to a plan of reorganization approved by the Trustees of the Fund on November 10, 2010 and by the shareholders of the Target Fund on April 1, 2011.The acquisition was accomplished by a tax-free exchange of 1,108,314 shares of the Fund for 3,524,810 shares outstanding of the Target Fund as of the closeof business on April 29, 2011. Each class of the Target Fund was exchanged for the like class of shares of the Fund based on the relative net asset value of theTarget Fund to the net asset value of the Fund on the close of business, April 29, 2011. The Target Fund’s net assets at that date of $34,015,532, including$7,388,865 of unrealized appreciation, was combined with those of the Fund. The net assets of the Fund immediately before the acquisition were$1,248,419,884. The net assets of the Fund immediately following the acquisition were $1,282,435,416.
The pro forma results of operations for the year ended December 31, 2011, assuming the reorganization had been completed on January 1, 2011, thebeginning of the annual reporting period are as follows:
Net investment income $ 19,406,572
Net realized/unrealized gains (losses) (102,914,763)
Change in net assets resulting from operations $ (83,508,191)
The combined investment portfolios have been managed as a single integrated portfolio since the acquisition was completed, it is not practicable to separatethe amounts of revenue and earnings of the Target Fund that have been included in the Fund’s Statement of Operations since May 2, 2011.
NOTE 11—Financial Highlights
The following schedule presents financial highlights for a share of the Fund outstanding throughout the periods indicated.
Net assetvalue,
beginningof period
Netinvestmentincome(a)
Net gains(losses) onsecurities
(bothrealized andunrealized)
Total frominvestmentoperations
Dividendsfrom net
investmentincome
Distributionsfrom netrealized
gainsTotal
distributions
Net assetvalue, endof period
Totalreturn(b)
Net assets,end of period
(000’s omitted)
Ratio ofexpenses
to averagenet assets
with fee waiversand/or expenses
absorbed
Ratio ofexpenses
to average netassets without
fee waiversand/or expenses
absorbed
Ratioof net
investmentincome toaverage
net assetsPortfolio
turnover(c)
Series IYear ended 12/31/12 $26.37 $0.35 $ 3.73 $ 4.08 $(0.42) $ — $(0.42) $30.03 15.53% $ 591,491 1.00%(d) 1.01%(d) 1.24%(d) 24%Year ended 12/31/11 28.69 0.50 (2.38) (1.88) (0.44) — (0.44) 26.37 (6.74) 544,143 1.02 1.03 1.75 26Year ended 12/31/10 26.01 0.38 2.92 3.30 (0.62) — (0.62) 28.69 12.86 586,219 1.03 1.04 1.46 38Year ended 12/31/09 19.49 0.32 6.55 6.87 (0.35) — (0.35) 26.01 35.24 556,883 1.02 1.04 1.47 27Year ended 12/31/08 33.63 0.54 (14.16) (13.62) (0.15) (0.37) (0.52) 19.49 (40.38) 446,437 1.05 1.06 1.96 44
Series IIYear ended 12/31/12 26.08 0.28 3.69 3.97 (0.37) — (0.37) 29.68 15.26 827,361 1.25(d) 1.26(d) 0.99(d) 24Year ended 12/31/11 28.35 0.42 (2.36) (1.94) (0.33) — (0.33) 26.08 (6.99) 607,269 1.27 1.28 1.50 26Year ended 12/31/10 25.63 0.31 2.89 3.20 (0.48) — (0.48) 28.35 12.61 569,610 1.28 1.29 1.21 38Year ended 12/31/09 19.23 0.27 6.44 6.71 (0.31) — (0.31) 25.63 34.91 1,500,514 1.27 1.29 1.22 27Year ended 12/31/08 33.24 0.45 (13.96) (13.51) (0.13) (0.37) (0.50) 19.23 (40.55) 793,365 1.30 1.31 1.71 44
(a) Calculated using average shares outstanding.(b) Includes adjustments in accordance with accounting principles generally accepted in the United States of America and as such, the net asset value for financial reporting purposes and
the returns based upon those net asset values may differ from the net asset value and returns for shareholder transactions. Total returns are not annualized for periods less than oneyear, if applicable and do not reflect charges assessed in connection with a variable product, which if included would reduce total returns.
(c) Portfolio turnover is calculated at the fund level and is not annualized for periods less than one year, if applicable. For the year ended December 31, 2011, the portfolio turnovercalculation excludes the value of securities purchased of $23,376,285 and sold of $8,831,296 in the effort to realign the Fund’s portfolio holdings after the reorganization of InvescoVan Kampen V.I. International Growth Equity Fund into the Fund.
(d) Ratios are based on average daily net assets (000’s omitted) of $583,089 and $731,534 for Series I and Series II, respectively.
Invesco V.I. International Growth Fund

Report of Independent Registered Public Accounting Firm
To the Board of Trustees of AIM Variable Insurance Funds (Invesco Variable Insurance Funds)and Shareholders of Invesco V.I. International Growth Fund:
In our opinion, the accompanying statement of assets and liabilities, including the schedule of investments, and the related statementsof operations and of changes in net assets and the financial highlights present fairly, in all material respects, the financial position ofInvesco V.I. International Growth Fund (one of the funds constituting AIM Variable Insurance Funds (Invesco Variable Insurance Funds),hereafter referred to as the “Fund”) at December 31, 2012, the results of its operations for the year then ended, the changes in its netassets for each of the two years in the period then ended and the financial highlights for each of the five years in the period then ended,in conformity with accounting principles generally accepted in the United States of America. These financial statements and financialhighlights (hereafter referred to as “financial statements”) are the responsibility of the Fund’s management; our responsibility is toexpress an opinion on these financial statements based on our audits. We conducted our audits of these financial statements inaccordance with the standards of the Public Company Accounting Oversight Board (United States). Those standards require that we planand perform the audit to obtain reasonable assurance about whether the financial statements are free of material misstatement. Anaudit includes examining, on a test basis, evidence supporting the amounts and disclosures in the financial statements, assessing theaccounting principles used and significant estimates made by management, and evaluating the overall financial statement presentation.We believe that our audits, which included confirmation of securities at December 31, 2012 by correspondence with the custodian,provide a reasonable basis for our opinion.
PricewaterhouseCoopers LLP
February 15, 2013Houston, Texas
Invesco V.I. International Growth Fund

Calculating your ongoing Fund expenses
Example
As a shareholder of the Fund, you incur ongoing costs, including management fees; distribution and/or service fees (12b-1); and other Fundexpenses. This example is intended to help you understand your ongoing costs (in dollars) of investing in the Fund and to compare these costs withongoing costs of investing in other mutual funds. The example is based on an investment of $1,000 invested at the beginning of the period and heldfor the entire period July 1, 2012 through December 31, 2012.
The actual and hypothetical expenses in the examples below do not represent the effect of any fees or other expenses assessed in connection witha variable product; if they did, the expenses shown would be higher while the ending account values shown would be lower.
Actual expenses
The table below provides information about actual account values and actual expenses. You may use the information in this table, together with theamount you invested, to estimate the expenses that you paid over the period. Simply divide your account value by $1,000 (for example, an $8,600account value divided by $1,000 = 8.6), then multiply the result by the number in the table under the heading entitled “Actual Expenses Paid DuringPeriod” to estimate the expenses you paid on your account during this period.
Hypothetical example for comparison purposes
The table below also provides information about hypothetical account values and hypothetical expenses based on the Fund’s actual expense ratio andan assumed rate of return of 5% per year before expenses, which is not the Fund’s actual return.
The hypothetical account values and expenses may not be used to estimate the actual ending account balance or expenses you paid for the period. Youmay use this information to compare the ongoing costs of investing in the Fund and other funds. To do so, compare this 5% hypothetical example withthe 5% hypothetical examples that appear in the shareholder reports of the other funds.
Please note that the expenses shown in the table are meant to highlight your ongoing costs. Therefore, the hypothetical information is useful incomparing ongoing costs, and will not help you determine the relative total costs of owning different funds.
Class
BeginningAccount Value(07/01/12)
ActualHYPOTHETICAL
(5% annual return before expenses)
AnnualizedExpense
Ratio
EndingAccount Value(12/31/12)1
ExpensesPaid During
Period 2
EndingAccount Value(12/31/12)
ExpensesPaid During
Period 2
Series I $1,000.00 $1,106.20 $5.35 $1,020.06 $5.13 1.01%
Series II 1,000.00 1,104.70 6.67 1,018.80 6.39 1.261 The actual ending account value is based on the actual total return of the Fund for the period July 1, 2012 through December 31, 2012, after actual expenses and will differ from the
hypothetical ending account value which is based on the Fund’s expense ratio and a hypothetical annual return of 5% before expenses.2 Expenses are equal to the Fund’s annualized expense ratio as indicated above multiplied by the average account value over the period, multiplied by 184/366 to reflect the most recent
fiscal half year.
Invesco V.I. International Growth Fund

Tax Information
Form 1099-DIV, Form 1042-S and other year–end tax information provide shareholders with actual calendar year amounts that should be included intheir tax returns. Shareholders should consult their tax advisors.
The following distribution information is being provided as required by the Internal Revenue Code or to meet a specific state’s requirement.The Fund designates the following amounts or, if subsequently determined to be different, the maximum amount allowable for its fiscal year ended
December 31, 2012:
Federal and State Income TaxCorporate Dividends Received Deduction * 0%Foreign Taxes $0.0506 per shareForeign Source Income $0.6547 per share
* The above percentage is based on ordinary income dividends paid to shareholders during the Fund’s fiscal year.
Invesco V.I. International Growth Fund

Trustees and OfficersThe address of each trustee and officer is AIM Variable Insurance Funds (Invesco Variable Insurance Funds) (the “Trust”), 11 Greenway Plaza, Suite1000, Houston, Texas 77046-1173. The trustees serve for the life of the Trust, subject to their earlier death, incapacitation, resignation,retirement or removal as more specifically provided in the Trust’s organizational documents. Each officer serves for a one year term or until theirsuccessors are elected and qualified. Column two below includes length of time served with predecessor entities, if any.
Name, Year of Birth andPosition(s) Held with the Trust
Trustee and/or Officer Since
Principal Occupation(s)During Past 5 Years
Number ofFunds in FundComplexOverseen byTrustee
Other Directorship(s)Held by Trustee DuringPast 5 Years
Interested Persons
Martin L. Flanagan1 — 1960Trustee
2007 Executive Director, Chief Executive Officer and President, Invesco Ltd. (ultimateparent of Invesco and a global investment management firm); Advisor to theBoard, Invesco Advisers, Inc. (formerly known as Invesco Institutional (N.A.),Inc.); Trustee, The Invesco Funds; Vice Chair, Investment Company Institute;and Member of Executive Board, SMU Cox School of BusinessFormerly: Chairman and Chief Executive Officer, Invesco Advisers, Inc. (registeredinvestment adviser); Director, Chairman, Chief Executive Officer and President, IVZInc. (holding company), INVESCO Group Services, Inc. (service provider) andInvesco North American Holdings, Inc. (holding company); Director, ChiefExecutive Officer and President, Invesco Holding Company Limited (parent ofInvesco and a global investment management firm); Director, Invesco Ltd.;Chairman, Investment Company Institute and President, Co-Chief ExecutiveOfficer, Co-President, Chief Operating Officer and Chief Financial Officer, FranklinResources, Inc. (global investment management organization)
124 None
Philip A. Taylor2 — 1954Trustee, President and PrincipalExecutive Officer
2006 Head of North American Retail and Senior Managing Director, Invesco Ltd.;Director, Co-Chairman, Co-President and Co-Chief Executive Officer, InvescoAdvisers, Inc. (formerly known as Invesco Institutional (N.A.), Inc.) (registeredinvestment adviser); Director, Chairman, Chief Executive Officer andPresident, Invesco Management Group, Inc. (formerly known as Invesco AimManagement Group, Inc.) (financial services holding company); Director andPresident, INVESCO Funds Group, Inc. (registered investment adviser andregistered transfer agent); Director and Chairman, Invesco InvestmentServices, Inc. (formerly known as Invesco Aim Investment Services, Inc.)(registered transfer agent) and IVZ Distributors, Inc. (formerly known asINVESCO Distributors, Inc.) (registered broker dealer); Director, President andChairman, Invesco Inc. (holding company) and Invesco Canada Holdings Inc.(holding company); Chief Executive Officer, Invesco Corporate Class Inc.(corporate mutual fund company) and Invesco Canada Fund Inc. (corporatemutual fund company); Director, Chairman and Chief Executive Officer,Invesco Canada Ltd. (formerly known as Invesco Trimark Ltd./Invesco TrimarkLtèe) (registered investment adviser and registered transfer agent); Trustee,President and Principal Executive Officer, The Invesco Funds (other than AIMTreasurer’s Series Trust (Invesco Treasurer’s Series Trust) and Short-TermInvestments Trust); Trustee and Executive Vice President, The Invesco Funds(AIM Treasurer’s Series Trust (Invesco Treasurer’s Series Trust) and Short-Term Investments Trust only); Director, Invesco Investment Advisers LLC(formerly known as Van Kampen Asset Management); Director, Chief ExecutiveOfficer and President, Van Kampen Exchange Corp.Formerly: Director and Chairman, Van Kampen Investor Services Inc.: Director,Chief Executive Officer and President, 1371 Preferred Inc. (holding company); andVan Kampen Investments Inc.; Director and President, AIM GP Canada Inc. (generalpartner for limited partnerships); and Van Kampen Advisors, Inc.; Director andChief Executive Officer, Invesco Trimark Dealer Inc. (registered broker dealer);Director, Invesco Distributors, Inc. (formerly known as Invesco Aim Distributors,Inc.) (registered broker dealer); Manager, Invesco PowerShares CapitalManagement LLC; Director, Chief Executive Officer and President, InvescoAdvisers, Inc.; Director, Chairman, Chief Executive Officer and President, InvescoAim Capital Management, Inc.; President, Invesco Trimark Dealer Inc. and InvescoTrimark Ltd./Invesco Trimark Ltèe; Director and President, AIM Trimark CorporateClass Inc. and AIM Trimark Canada Fund Inc.; Senior Managing Director, InvescoHolding Company Limited; Trustee and Executive Vice President, Tax-FreeInvestments Trust; Director and Chairman, Fund Management Company (formerregistered broker dealer); President and Principal Executive Officer, The InvescoFunds (AIM Treasurer’s Series Trust (Invesco Treasurer’s Series Trust), Short-TermInvestments Trust and Tax-Free Investments Trust only); President, AIM TrimarkGlobal Fund Inc. and AIM Trimark Canada Fund Inc.
124 None
Wayne W. Whalen3 — 1939Trustee
2010 Of Counsel, and prior to 2010, partner in the law firm of Skadden, Arps,Slate, Meagher & Flom LLP, legal counsel to certain funds in the Fund Complex
137 Director of the Mutual FundDirectors Forum, a nonprofitmembership organization forinvestment directors;Chairman and Director of theAbraham Lincoln PresidentialLibrary Foundation; andDirector of the StevensonCenter for Democracy
1 Mr. Flanagan is considered an interested person of the Trust because he is an officer of the adviser to the Trust, and an officer and a director of Invesco Ltd., ultimate parent of theadviser to the Trust.
2 Mr. Taylor is considered an interested person of the Trust because he is an officer and a director of the adviser to, and a director of the principal underwriter of, the Trust.3 Mr. Whalen is considered an “interested person” (within the meaning of Section 2(a)(19) of the 1940 Act) of certain Funds in the Invesco Fund Complex by reason of he and his firm
currently providing legal services as legal counsel to such Funds in the Invesco Fund Complex.
Invesco V.I. International Growth Fund

Trustees and Officers—(continued)
Name, Year of Birth andPosition(s) Held with the Trust
Trustee and/or Officer Since
Principal Occupation(s)During Past 5 Years
Number ofFunds in FundComplexOverseen byTrustee
Other Directorship(s)Held by Trustee DuringPast 5 Years
Independent Trustees
Bruce L. Crockett — 1944Trustee and Chair
1993 Chairman, Crockett Technologies Associates (technology consulting company)Formerly: Director, Captaris (unified messaging provider); Director, Presidentand Chief Executive Officer COMSAT Corporation; and Chairman, Board ofGovernors of INTELSAT (international communications company)
124 ACE Limited (insurancecompany); and InvestmentCompany Institute
David C. Arch — 1945Trustee
2010 Chairman and Chief Executive Officer of Blistex Inc., (consumer health careproducts manufacturer)Formerly: Member of the Heartland Alliance Advisory Board, a nonprofitorganization serving human needs based in Chicago
137 Board member of theIllinois Manufacturers’Association; Member of theBoard of Visitors, Institutefor the Humanities,University of Michigan
Frank S. Bayley — 1939Trustee
2001 RetiredFormerly: Director, Badgley Funds, Inc. (registered investment company)(2 portfolios) and General Partner and Of Counsel, law firm of Baker &McKenzie, LLP
124 Director and Chairman, C.D.Stimson Company (a realestate investmentcompany); Trustee andOverseer, The Curtisinstitute of Music
James T. Bunch — 1942Trustee
2004 Managing Member, Grumman Hill Group LLC (family office private equitymanagement)Formerly: Founder, Green, Manning & Bunch Ltd. (investment bankingfirm)(1988-2010); Executive Committee, United States Golf Association; andDirector, Policy Studies, Inc. and Van Gilder Insurance Corporation
124 Chairman, Board ofGovernors, Western GolfAssociation; Chairman-elect, Evans ScholarsFoundation; and Director,Denver Film Society
Rodney F. Dammeyer — 1940Trustee
2010 Chairman of CAC, LLC, (private company offering capital investment andmanagement advisory services)Formerly: Prior to 2001, Managing Partner at Equity Group CorporateInvestments; Prior to 1995, Vice Chairman of Anixter International; Prior to1985, experience includes Senior Vice President and Chief Financial Officer ofHousehold International, Inc., Executive Vice President and Chief FinancialOfficer of Northwest Industries, Inc. and Partner of Arthur Andersen & Co.;From 1987 to 2010, Director/Trustee of investment companies in the VanKampen Funds complex
126 Director of QuidelCorporation and Stericycle,Inc.; Prior to May 2008,Trustee of The ScrippsResearch Institute; Prior toFebruary 2008, Director ofVentana Medical Systems,Inc.; Prior to April 2007,Director of GATXCorporation; Prior to April2004, Director ofTheraSense, Inc.
Albert R. Dowden — 1941Trustee
2000 Director of a number of public and private business corporations, includingthe Boss Group, Ltd. (private investment and management); Reich & TangFunds (5 portfolios) (registered investment company); and Homeowners ofAmerica Holding Corporation/ Homeowners of America Insurance Company(property casualty company)Formerly: Director, Continental Energy Services, LLC (oil and gas pipelineservice); Director, CompuDyne Corporation (provider of product and servicesto the public security market) and Director, Annuity and Life Re (Holdings),Ltd. (reinsurance company); Director, President and Chief Executive Officer,Volvo Group North America, Inc.; Senior Vice President, AB Volvo; Director ofvarious public and private corporations; Chairman, DHJ Media, Inc.; DirectorMagellan Insurance Company; and Director, The Hertz Corporation, GenmarCorporation (boat manufacturer), National Media Corporation; Advisory Boardof Rotary Power International (designer, manufacturer, and seller of rotarypower engines); and Chairman, Cortland Trust, Inc. (registered investmentcompany)
124 Director of Nature’sSunshine Products, Inc.
Jack M. Fields — 1952Trustee
1997 Chief Executive Officer, Twenty First Century Group, Inc. (government affairscompany); Owner and Chief Executive Officer, Dos Angeles Ranch, L.P. (cattle,hunting, corporate entertainment); and Discovery Global Education Fund (non-profit)Formerly: Chief Executive Officer, Texana Timber LP (sustainable forestrycompany); Director of Cross Timbers Quail Research Ranch (non-profit); andmember of the U.S. House of Representatives
124 Insperity, Inc. (formerlyknown as Administaff)
Prema Mathai-Davis — 1950Trustee
1998 RetiredFormerly: Chief Executive Officer, YWCA of the U.S.A.
124 None
Larry Soll — 1942Trustee
2004 RetiredFormerly: Chairman, Chief Executive Officer and President, Synergen Corp.(a biotechnology company)
124 None
Hugo F. Sonnenschein — 1940Trustee
2010 Distinguished Service Professor and President Emeritus of the University ofChicago and the Adam Smith Distinguished Service Professor in theDepartment of Economics at the University of ChicagoFormerly: President of the University of Chicago
137 Trustee of the University ofRochester and a member ofits investment committee.Member of the NationalAcademy of Sciences, theAmerican PhilosophicalSociety and a fellow of theAmerican Academy of Artsand Sciences
Invesco V.I. International Growth Fund

Trustees and Officers—(continued)
Name, Year of Birth andPosition(s) Held with the Trust
Trustee and/or Officer Since
Principal Occupation(s)During Past 5 Years
Number ofFunds in FundComplexOverseen byTrustee
Other Directorship(s)Held by Trustee DuringPast 5 Years
Independent Trustees—(continued)
Raymond Stickel, Jr. — 1944Trustee
2005 RetiredFormerly: Director, Mainstay VP Series Funds, Inc. (25 portfolios) and Partner,Deloitte & Touche
124 None
Other Officers
Russell C. Burk — 1958Senior Vice President and SeniorOfficer
2005 Senior Vice President and Senior Officer, The Invesco Funds N/A N/A
John M. Zerr — 1962Senior Vice President, ChiefLegal Officer and Secretary
2006 Director, Senior Vice President, Secretary and General Counsel, InvescoManagement Group, Inc. (formerly known as Invesco Aim Management Group,Inc.) and Van Kampen Exchange Corp.; Senior Vice President, InvescoAdvisers, Inc. (formerly known as Invesco Institutional (N.A.), Inc.) (registeredinvestment adviser); Senior Vice President and Secretary, InvescoDistributors, Inc. (formerly known as Invesco Aim Distributors, Inc.); Director,Vice President and Secretary, Invesco Investment Services, Inc. (formerlyknown as Invesco Aim Investment Services, Inc.) and IVZ Distributors, Inc.(formerly known as INVESCO Distributors, Inc.); Director and Vice President,INVESCO Funds Group, Inc.; Senior Vice President, Chief Legal Officer andSecretary, The Invesco Funds; Manager, Invesco PowerShares CapitalManagement LLC; Director, Secretary and General Counsel, InvescoInvestment Advisers LLC (formerly known as Van Kampen Asset Management);Secretary and General Counsel, Van Kampen Funds Inc. and Chief LegalOfficer, PowerShares Exchange-Traded Fund Trust, PowerShares Exchange-Traded Fund Trust II, PowerShares India Exchange-Traded Fund Trust andPowerShares Actively Managed Exchange-Traded Fund TrustFormerly: Director and Vice President, Van Kampen Advisors Inc.; Director,Vice President, Secretary and General Counsel Van Kampen Investor ServicesInc.; Director, Invesco Distributors, Inc. (formerly known as Invesco AimDistributors, Inc.); Director, Senior Vice President, General Counsel andSecretary, Invesco Advisers, Inc. and Van Kampen Investments Inc.; Director,Vice President and Secretary, Fund Management Company; Director, SeniorVice President, Secretary, General Counsel and Vice President, Invesco AimCapital Management, Inc.; Chief Operating Officer and General Counsel, LibertyRidge Capital, Inc. (an investment adviser); Vice President and Secretary,PBHG Funds (an investment company) and PBHG Insurance Series Fund (aninvestment company); Chief Operating Officer, General Counsel and Secretary,Old Mutual Investment Partners (a broker-dealer); General Counsel andSecretary, Old Mutual Fund Services (an administrator) and Old MutualShareholder Services (a shareholder servicing center); Executive VicePresident, General Counsel and Secretary, Old Mutual Capital, Inc. (aninvestment adviser); and Vice President and Secretary, Old Mutual AdvisorsFunds (an investment company)
N/A N/A
Karen Dunn Kelley — 1960Vice President
1993 Head of Invesco’s World Wide Fixed Income and Cash Management Group;Senior Vice President, Invesco Management Group, Inc. (formerly known asInvesco Aim Management Group, Inc.) and Invesco Advisers, Inc. (formerlyknown as Invesco Institutional (N.A.), Inc.) (registered investment adviser);Executive Vice President, Invesco Distributors, Inc. (formerly known asInvesco Aim Distributors, Inc.); Director, Invesco Mortgage Capital Inc.,INVESCO Global Asset Management Limited, Invesco Management CompanyLimited and INVESCO Management S.A.; Vice President, The Invesco Funds(other than AIM Treasurer’s Series Trust (Invesco Treasurer’s Series Trust) andShort-Term Investments Trust); and President and Principal Executive Officer,The Invesco Funds (AIM Treasurer’s Series Trust (Invesco Treasurer’s SeriesTrust) and Short-Term Investments Trust only)Formerly: Senior Vice President, Van Kampen Investments Inc.; VicePresident, Invesco Advisers, Inc. (formerly known as Invesco Institutional(N.A.), Inc.); Director of Cash Management and Senior Vice President, InvescoAdvisers, Inc. and Invesco Aim Capital Management, Inc.; President andPrincipal Executive Officer, Tax-Free Investments Trust; Director andPresident, Fund Management Company; Chief Cash Management Officer,Director of Cash Management, Senior Vice President, and Managing Director,Invesco Aim Capital Management, Inc.; Director of Cash Management, SeniorVice President, and Vice President, Invesco Advisers, Inc. and The InvescoFunds (AIM Treasurer’s Series Trust (Invesco Treasurer’s Series Trust), Short-Term Investments Trust and Tax-Free Investments Trust only)
N/A N/A
Invesco V.I. International Growth Fund

Trustees and Officers—(continued)
Name, Year of Birth andPosition(s) Held with the Trust
Trustee and/or Officer Since
Principal Occupation(s)During Past 5 Years
Number ofFunds in FundComplexOverseen byTrustee
Other Directorship(s)Held by Trustee DuringPast 5 Years
Other Officers—(continued)
Sheri Morris — 1964Vice President, Treasurer andPrincipal Financial Officer
1999 Vice President, Treasurer and Principal Financial Officer, The Invesco Funds;Vice President, Invesco Advisers, Inc. (formerly known as Invesco Institutional(N.A.), Inc.) (registered investment adviser); and Vice President, PowerSharesExchange-Traded Fund Trust, PowerShares Exchange-Traded Fund Trust II,PowerShares India Exchange-Traded Fund Trust and PowerShares ActivelyManaged Exchange-Traded Fund TrustFormerly: Vice President, Invesco Aim Advisers, Inc., Invesco Aim CapitalManagement, Inc. and Invesco Aim Private Asset Management, Inc.; AssistantVice President and Assistant Treasurer, The Invesco Funds and Assistant VicePresident, Invesco Advisers, Inc., Invesco Aim Capital Management, Inc. andInvesco Aim Private Asset Management, Inc.; and Treasurer, PowerSharesExchange-Traded Fund Trust, PowerShares Exchange-Traded Fund Trust II,PowerShares India Exchange-Traded Fund Trust and PowerShares ActivelyManaged Exchange-Traded Fund Trust
N/A N/A
Yinka Akinsola — 1977Anti-Money LaunderingCompliance Officer
2011 Anti-Money Laundering Compliance Officer, Invesco Advisers, Inc. (formerlyknown as Invesco Institutional (N.A.), Inc.) (registered investment adviser);Invesco Distributors, Inc. (formerly known as Invesco Aim Distributors, Inc.),Invesco Investment Services, Inc. (formerly known as Invesco Aim InvestmentServices, Inc.), Invesco Management Group, Inc., The Invesco Funds, InvescoVan Kampen Closed-End Funds, Van Kampen Exchange Corp., Van KampenFunds Inc., PowerShares Exchange-Traded Fund Trust, PowerShares Exchange-Traded Fund Trust II, PowerShares India Exchange-Traded Fund Trust, andPowerShares Actively Managed Exchange-Traded Fund TrustFormerly: Regulatory Analyst III, Financial Industry Regulatory Authority(FINRA)
N/A N/A
Todd L. Spillane — 1958Chief Compliance Officer
2006 Senior Vice President, Invesco Management Group, Inc. (formerly known asInvesco Aim Management Group, Inc.) and Van Kampen Exchange Corp.;Senior Vice President and Chief Compliance Officer, Invesco Advisers, Inc.(registered investment adviser) (formerly known as Invesco Institutional(N.A.), Inc.); Chief Compliance Officer, The Invesco Funds; Vice President,Invesco Distributors, Inc. (formerly known as Invesco Aim Distributors, Inc.)and Invesco Investment Services, Inc. (formerly known as Invesco AimInvestment Services, Inc.)Formerly: Chief Compliance Officer, Invesco Van Kampen Closed-End Funds;Senior Vice President, Van Kampen Investments Inc.; Senior Vice Presidentand Chief Compliance Officer, Invesco Aim Advisers, Inc. and Invesco AimCapital Management, Inc.; Chief Compliance Officer, INVESCO Private CapitalInvestments, Inc. (holding company), Invesco Private Capital, Inc. (registeredinvestment adviser), Invesco Global Asset Management (N.A.), Inc., InvescoSenior Secured Management, Inc. (registered investment adviser), VanKampen Investor Services Inc., PowerShares Exchange-Traded Fund Trust,PowerShares Exchange-Traded Fund Trust II, PowerShares India Exchange-Traded Fund Trust and PowerShares Actively Managed Exchange-Traded FundTrust; and Vice President, Invesco Aim Capital Management, Inc. and FundManagement Company
N/A N/A
The Statement of Additional Information of the Trust includes additional information about the Fund’s Trustees and is available upon request, without charge, by calling 1.800.959.4246.Please refer to the Fund’s prospectus for information on the Fund’s sub-advisers.Office of the Fund11 Greenway Plaza, Suite 1000Houston, TX 77046-1173
Investment AdviserInvesco Advisers, Inc.1555 Peachtree Street, N.E.Atlanta, GA 30309
DistributorInvesco Distributors, Inc.11 Greenway Plaza, Suite 1000Houston, TX 77046-1173
AuditorsPricewaterhouseCoopers LLP1201 Louisiana Street, Suite 2900Houston, TX 77002-5678
Counsel to the FundStradley Ronon Stevens & Young, LLP2005 Market Street, Suite 2600Philadelphia, PA 19103-7018
Counsel to the Independent TrusteesGoodwin Procter LLP901 New York Avenue, N.W.Washington, D.C. 20001
Transfer AgentInvesco Investment Services, Inc.11 Greenway Plaza, Suite 1000Houston, TX 77046-1173
CustodianState Street Bank and Trust Company225 Franklin StreetBoston, MA 02110-2801
Invesco V.I. International Growth Fund

The Fund provides a complete list of its holdings four times in each fiscal year, at the quarter-ends. For the second and fourth quarters, the lists appear in the Fund’s semiannual and annual reports to shareholders. For the first and third quarters, the Fund files the lists with the Securities and Exchange Commission (SEC) on Form N-Q. The Fund’s Form N-Q filings are available on the SEC website, sec.gov. Copies of the Fund’s Forms N-Q may be reviewed and copied at the SEC Public Reference Room in Washington, D.C. You can obtain information on the operation of the Public Reference Room, including information about duplicating fee charges, by calling 202 551 8090 or 800 732 0330, or by electronic request at the following email address: [email protected]. The SEC file numbers for the Fund are 811-07452 and 033-57340. The Fund’s most recent portfolio holdings, as filed on Form N-Q, have also been made available to insurance companies issuing variable annuity contracts and variable life insurance policies (“variable products”) that invest in the Fund.
A description of the policies and procedures that the Fund uses to determine how to vote proxies relating to portfolio securities is available without charge, upon request, from our Client Services department at 800 959 4246 or at invesco.com/proxyguidelines. The information is also available on the SEC website, sec.gov.
Information regarding how the Fund voted proxies related to its portfolio securities during the 12 months ended June 30, 2012, is available at invesco.com/proxysearch. The information is also available on the SEC website, sec.gov.
Invesco Advisers, Inc. is an investment adviser; it provides investment advisory services to individual and institutional clients and does not sell securities. Invesco Distributors, Inc. is the US distributor for Invesco Ltd.’s retail mutual funds, exchange-traded funds and institutional money market funds. Both are wholly owned, indirect subsidiaries of Invesco Ltd.
This report must be accompanied or preceded by a currently effective Fund prospectus and variable product prospectus, which contain more complete information, including sales charges and expenses. Investors should read each carefully before investing.Invesco Distributors, Inc.I-VITEC-AR-1
Invesco V.I. Technology FundAnnual Report to Shareholders December 31, 2012

Invesco V.I. Technology Fund
How we investWe seek to grow capital by investing in companies we believe are capable of gen-erating sustainable, superior earnings and cash flow growth that is not fully reflected in investor expectations or equity valuations. The Fund emphasizes companies we believe have a strategic advantage over their competition and that operate in industries we believe to be beneficiaries of secular trends.
The Fund invests in industries such as hardware, software, telecommunications equipment and services, semiconductors and service-related companies in the IT sector. We use a research-oriented, bot-tom-up investment approach focusing on company fundamentals and growth pros-pects. We place great emphasis on com-panies exhibiting high returns on invested capital and generating free cash flow — metrics we believe are good indicators of financial health and growth potential. We seek companies with management teams that maintain high-quality balance sheets and manageable debt levels. Valuation also plays a critical role in stock selection.
Risk management is an integral part of our portfolio construction process as we attempt to limit volatility and downside risk. Only stocks that exhibit a proper bal-ance of risk and reward are chosen for the portfolio. We seek to accomplish this goal by thoroughly understanding the key business drivers of companies in which we invest. The portfolio is constructed with the goal of holding a diversified port-folio of stocks we believe are best suited to capitalize on secular trends in the IT sector.
We may reduce or eliminate a holding when:
target.
deteriorate.
criteria.
Market conditions and your FundThe year 2012 began with improving economic data in the US and a rally in equities that continued almost uninter-rupted into the spring. However, the
ongoing eurozone sovereign debt crisis intensified in April and May, dominating headlines and creating significant volatil-ity in global equity markets. This negative news from overseas precipitated a slow-down in the US, where economic data began to decelerate over the summer. While corporate earnings remained solid until late in the year, financial markets were negatively influenced by headline economic data. Asian economies, which are mainly export-driven, were similarly affected with sharp corrections mid-year.
Fears about the fate of the eurozone began to subside after the European Cen-tral Bank announced new measures to support member economies through potentially unlimited purchases of sover-eign debt, among other measures. At the same time, continued risk aversion among investors and corporations, along with tepid employment growth, prompted the US Federal Reserve to initiate a third round of quantitative easing and to prom-ise to remain accommodative until the labor market outlook improved materi-ally. Asian governments continued to try to balance key aims of supporting growth while preventing asset bubbles. China announced a surprise interest rate cut in July and the Bank of Japan announced an expansion and extension of its asset purchase plan in September, following the US and European central banks’ mon-etary easing announcements.
Near year end, market psychology turned negative — first, due to uncer-tainty about the outcome of the US presi-dential election, and then due to the apparent inability of the White House and Congress to reach an agreement on legis-lation averting the “fiscal cliff” — a variety of tax increases and spending cuts sched-uled to take effect in January 2013.
Despite volatility for much of the year, major equity market indexes delivered double-digit gains, and all 10 sectors of
The Fund’s holdings are subject to change, and there is no assurance that the Fund will continue to hold any particular security.*Excluding money market fund holdings.
Portfolio CompositionBy sector
Information Technology 92.9%Consumer Discretionary 2.5Health Care 1.3Industrials 0.6Financials 0.4Money Market Funds Plus Other Assets Less Liabilities 2.3
Top 10 Equity Holdings*
1. Apple Inc. 10.1% 2. QUALCOMM, Inc. 4.7 3. Google Inc.-Class A 4.3 4. Cognizant Technology Solutions Corp.-
Class A 3.4 5. Oracle Corp. 3.0 6. Salesforce.com, Inc. 3.0 7. Visa Inc.-Class A 2.7 8. EMC Corp. 2.5 9. Microsemi Corp. 2.3 10. Broadcom Corp.-Class A 2.3
Top Five Industries*
1. Semiconductors 17.1% 2. Internet Software & Services 12.4 3. Application Software 11.3 4. Communications Equipment 10.9 5. Computer Hardware 10.1
Performance summaryAmid significant volatility and uncertainty, information technology (IT) stocks delivered significant gains, yet lagged the broad market during the year ended December 31, 2012. Invesco V.I. Technology Fund outperformed its style-specific benchmark, the BofA Merrill Lynch 100 Technology Index, primarily as a result of the Fund’s security selection in the computers and peripherals industry and the IT services industry.
Your Fund’s long-term performance appears later in this report.
Fund vs. IndexesTotal returns, 12/31/11 to 12/31/12, excluding variable product issuer charges. If variable product issuer charges were included, returns would be lower.
Series I Shares 11.28%Series II Shares 11.04S&P 500 Index▼ (Broad Market Index) 16.00BofA Merrill Lynch 100 Technology Index (price only)■ (Style-Specific Index) 9.77Lipper VUF Science & Technology Funds Classification Average■ (Peer Group) 13.35
Source(s): ▼Invesco, S&P-Dow Jones via FactSet Research Systems Inc.; ■Lipper Inc.
Management’s Discussion of Fund Performance
Total Net Assets $97.5 million
Total Number of Holdings* 69

Invesco V.I. Technology Fund
the S&P 500 Index had positive returns.1 Financials, consumer discretionary, tele-communication services and health care were the leading market sectors, while utilities, energy, consumer staples and IT were lagging sectors.
Security selection in the computers and peripherals industry and IT services industry benefited Fund performance on both an absolute and benchmark-relative basis during the year. The professional services industry was the only detractor from absolute Fund performance. Rela-tive to the BofA Merrill Lynch Technology 100 Index, security selection and under-weight exposure to semiconductors and Internet software and services stocks detracted from Fund performance.
Top individual contributors to the Fund’s absolute performance during the year included Apple and Visa. Apple introduced and received record sales on the iPhone 5 during the year. The iPhone 5 boasts a thinner aluminum body, a dis-play with more pixels, greater battery life, a redesigned camera and over 200 new operating features versus the iPhone 4S. Visa’s stock rose because the company increased its dividend and announced a share repurchase plan during the year.
Top individual detractors from Fund performance included Marvell and MicroStrategy. While semiconductor company Marvell initiated a quarterly dividend in 2012, it also lowered revenue guidance throughout the year, often below analyst estimates. We sold Marvell during the year. MicroStrategy, a fairly new holding, is a global provider of enter-prise software platforms aimed at helping businesses manage, analyze and increase accessibility of data. The stock experi-enced weakness toward the end of the year, despite securing several large con-tracts. At the close of the reporting peri-od, we continued to hold MicroStrategy.
At the close of the reporting period, the Fund had overweight exposure (rela-tive to its style-specific index) to the com-puters and peripherals, Internet and catalog retail, communications equip-ment and life sciences tools and services industries. Conversely, we were under-weight the electronic equipment and instruments, IT services, semiconductors and Internet software and services indus-tries. Additionally, the Fund did not have exposure to office electronics, an indus-try in which the style-specific index had minor exposure.
We remain confident about the medium-term outlook for IT stocks, pri-marily because of the potential for increased enterprise spending. Busi-nesses have been reluctant to hire addi-tional employees due to ancillary costs and, therefore, are using IT to boost pro-ductivity. Additionally, we believe emerg-ing markets will continue to have increased technology needs. Going for-ward, we see possible improvements in credit markets, stabilization of demand patterns and other conditions conducive to continued secular growth.
Longer term, we anticipate positive trends in the IT sector because we believe three key secular themes, which are inde-pendent of short-term catalysts, continue to offer support: 1) globalization — desire for productivity gains support increased technology use in international markets; 2) consumerization — technology demand is consumer-driven; and 3) proliferation — technology continues to penetrate products ranging from auto mobiles and industrial controls to sporting gear and alternative energy.
As always, we thank you for your continued investment in Invesco V.I. Technology Fund.
1 Source: Lipper Inc.
The views and opinions expressed in management’s discussion of Fund performance are those of Invesco Advisers, Inc. These views and opinions are subject to change at any time based on factors such as mar-ket and economic conditions. These views and opin-ions may not be relied upon as investment advice or recommendations, or as an offer for a particular security. The information is not a complete analysis of every aspect of any market, country, industry, security or the Fund. Statements of fact are from sources considered reliable, but Invesco Advisers, Inc. makes no representation or warranty as to their completeness or accuracy. Although historical per-formance is no guarantee of future results, these insights may help you understand our investment management philosophy.
See important Fund and, if applicable, index disclosures later in this report.
Warren TennantChartered Financial Analyst, portfolio manager, is lead manager of Invesco V.I. Technology Fund. He joined Invesco in
2000. Mr. Tennant earned a BBA in finance and an MBA from The University of Texas at Austin.
Brian NelsonChartered Financial Analyst, portfolio manager, is manager of Invesco V.I. Technology Fund. He joined Invesco in
2004. Mr. Nelson earned a BA from the University of California, Santa Barbara.

Invesco V.I. Technology Fund
Your Fund’s Long-Term Performance
Past performance cannot guarantee comparable future results.
Results of a $10,000 Investment — Oldest Share Class(es)Fund and index data from 12/31/02
1 Source: Lipper Inc.2 Source(s): Invesco, S&P-Dow Jones via FactSet Research Systems Inc.
$23,160 BofA Merrill Lynch 100 Technology Index (price-only)1
$23,122 Lipper VUF Science & Technology Funds Classification Average1
$20,691 Invesco V.I. Technology Fund—Series I Shares
$19,850 S&P 500 Index2
5,000
10,000
15,000
20,000
25,000
$30,000
12/1212/1112/1012/0912/0812/0712/0612/0512/0412/0312/31/02
Average Annual Total ReturnsAs of 12/31/12
Series I SharesInception (5/20/97) 3.48% 10 Years 7.54 5 Years 2.28 1 Year 11.28
Series II Shares 10 Years 7.26% 5 Years 2.01 1 Year 11.04
Series II shares incepted on April 30, 2004. Performance shown prior to that date is that of Series I shares, restated to reflect the higher 12b-1 fees appli-cable to Series II. Series I performance reflects any applicable fee waivers or expense reimbursements. The perfor-mance of the Fund’s Series I and Series II share classes will differ primarily due to different class expenses.
The performance data quoted repre-sent past performance and cannot guarantee comparable future results;
current performance may be lower or higher. Please contact your variable product issuer or financial adviser for the most recent month-end variable product performance. Performance fig-ures reflect Fund expenses, reinvested distributions and changes in net asset value. Investment return and principal value will fluctuate so that you may have a gain or loss when you sell shares.
The total annual Fund operating expense ratio set forth in the most recent Fund prospectus as of the date of this report for Series I and Series II shares was 1.12% and 1.37%, respec-tively. The expense ratios presented above may vary from the expense ratios presented in other sections of this report that are based on expenses incurred during the period covered by this report.
Invesco V.I. Technology Fund, a series portfolio of AIM Variable Insur-ance Funds (Invesco Variable Insurance Funds), is currently offered through
insurance companies issuing variable products. You cannot purchase shares of the Fund directly. Performance fig-ures given represent the Fund and are not intended to reflect actual variable product values. They do not reflect sales charges, expenses and fees assessed in connection with a variable product. Sales charges, expenses and fees, which are determined by the vari-able product issuers, will vary and will lower the total return.
The most recent month-end perfor-mance data at the Fund level, excluding variable product charges, is available at 800 451 4246. As mentioned above, for the most recent month-end performance including variable product charges, please contact your variable product issuer or financial adviser.

Invesco V.I. Technology Fund
Invesco V.I. Technology Fund’s investment objective is long-term growth of capital.
Principal risks of investing in the FundDerivatives risk. The performance of derivative instruments is tied to the performance of an underlying currency, security, index or other instrument. In addition to risks relating to their under-lying instruments, the use of derivatives may include other, possibly greater, risks. Derivatives involve costs, may be volatile, and may involve a small initial investment relative to the risk assumed. Risks associated with the use of deriva-tives include counterparty, leverage, correlation, liquidity, tax, market, interest rate and management risks. Derivatives may also be more difficult to purchase, sell or value than other investments. The Fund may lose more than the cash amount invested on investments in derivatives. Investors should bear in mind that, while the Fund intends to use derivative strategies, it is not obligated to actively engage in these transactions, generally or in any particular kind of derivative, if the investment manager elects not to do so due to availability, cost, market condi-tions or other factors.
Foreign securities risk. The Fund’s foreign investments may be affected by changes in a foreign country’s exchange rates, political and social instability, changes in economic or taxation policies, difficulties when enforcing obligations, decreased liquidity, and increased vola-tility. Foreign companies may be subject to less regulation resulting in less publicly available information about the companies.
Management risk. The investment techniques and risk analysis used by the Fund’s portfolio managers may not produce the desired results.
Market risk. The prices of and the income generated by the Fund’s securi-ties may decline in response to, among other things, investor sentiment, general economic and market conditions, regional or global instability, and currency and interest rate fluctuations.
Sector fund risk. The Fund’s invest-ments are concentrated in a compara-tively narrow segment of the economy, which may make the Fund more volatile than non-concentrated funds.
Small- and mid-capitalization risks. Stocks of small- and mid-sized companies tend to be more vulnerable to adverse developments in the above factors and may have little or no operating history or track record of success, and limited product lines, markets, management and financial resources. The securities of small and mid-sized companies may be more volatile due to less market interest and less publicly available information about the issuer. They also may be illiquid or restricted as to resale, or may trade less frequently and in smaller volumes, all of which may cause difficulty when establishing or closing a position at a desirable price.
Synthetic securities risk. Fluctuations in the values of synthetic securities may not correlate perfectly with the instruments they are designed to replicate. Synthetic securities may be subject to interest rate changes, market price fluctuations, counterparty risk and liquidity risk.
Technology sector risk. Many products and services offered in technology-related industries are subject to rapid obsolescence, which may lower the value of the issuers in this sector.
About indexes used in this report The S&P 500® Index is an unmanaged index considered representative of the US stock market.
The BofA Merrill Lynch 100 Technology Index (price only) is an unmanaged, price-only, equal-dollar-weighted index of 100 stocks designed to measure the performance of a cross section of large, actively traded tech-nology stocks and American Depositary Receipts.
The Lipper VUF Science & Tech-nology Funds Classification Average represents an average of all variable insurance underlying funds in the Lipper Science & Technology Funds classification.
The Fund is not managed to track the performance of any particular index, including the index(es) defined here, and consequently, the performance of the Fund may deviate significantly from the performance of the index(es).
A direct investment cannot be made in an index. Unless otherwise indicated, index results include reinvested divi-dends, and they do not reflect sales charges. Performance of the peer group, if applicable, reflects fund expenses; performance of a market index does not.
Other informationThe returns shown in management’s discussion of Fund performance are based on net asset values calculated for shareholder transactions. Generally accepted accounting principles require adjustments to be made to the net assets of the Fund at period end for financial reporting purposes, and as such, the net asset values for shareholder transactions and the returns based on those net asset values may differ from the net asset values and returns reported in the Finan-cial Highlights. Additionally, the returns and net asset values shown throughout this report are at the Fund level only and do not include variable product issuer charges. If such charges were included, the total returns would be lower.
Industry classifications used in this report are generally according to the Global Industry Classification Standard, which was developed by and is the exclu-sive property and a service mark of MSCI Inc. and Standard & Poor’s.

Schedule of Investments(a)
December 31, 2012
Shares Value
Common Stocks & Other Equity Interests–97.70%Application Software–11.26%
Aspen Technology, Inc.(b) 39,484 $ 1,091,338
Autodesk, Inc.(b) 18,194 643,158
Cadence Design Systems, Inc.(b) 101,140 1,366,401
Citrix Systems, Inc.(b) 29,458 1,936,863
Informatica Corp.(b) 10,354 313,933
MicroStrategy Inc.–Class A(b) 8,882 829,401
Nuance Communications, Inc.(b) 27,802 620,541
Salesforce.com, Inc.(b) 17,231 2,896,531
SS&C Techonologies Holdings, Inc.(b) 37,166 859,278
TIBCO Software Inc.(b) 19,063 419,577
10,977,021
Communications Equipment–10.94%
Brocade Communications Systems, Inc.(b) 119,592 637,425
Ciena Corp.(b) 30,901 485,146
Cisco Systems, Inc. 83,498 1,640,736
F5 Networks, Inc.(b) 12,688 1,232,639
Finisar Corp.(b) 34,062 555,211
JDS Uniphase Corp.(b) 111,811 1,513,921
QUALCOMM, Inc. 74,179 4,600,581
10,665,659
Computer Hardware–10.14%
Apple Inc. 18,556 9,889,977
Computer Storage & Peripherals–2.49%
EMC Corp.(b) 95,997 2,428,724
Data Processing & Outsourced Services–7.97%
Alliance Data Systems Corp.(b) 12,462 1,803,999
Genpact Ltd. 68,965 1,068,958
MasterCard, Inc.–Class A 4,531 2,225,990
Visa Inc.–Class A 17,642 2,674,174
7,773,121
Electronic Manufacturing Services–3.49%
Jabil Circuit, Inc. 60,532 1,167,662
Molex Inc. 35,020 957,097
Sanmina Corp.(b) 114,990 1,272,939
3,397,698
Internet Retail–2.46%
Amazon.com, Inc.(b) 5,247 1,318,414
Priceline.com Inc.(b) 1,743 1,082,629
2,401,043
Internet Software & Services–12.35%
Akamai Technologies, Inc.(b) 17,863 730,775
Baidu, Inc.–ADR (China)(b) 3,656 366,660
eBay Inc.(b) 21,731 1,108,716
Facebook Inc.–Class A(b) 43,146 1,148,978
Shares Value
Internet Software & Services–(continued)
Google Inc.–Class A(b) 5,877 $ 4,169,438
LogMeIn, Inc.(b) 39,757 890,954
ValueClick, Inc.(b) 63,201 1,226,732
VeriSign, Inc.(b) 32,965 1,279,701
Web.com Group Inc.(b) 75,509 1,117,533
12,039,487
IT Consulting & Other Services–7.36%
Accenture PLC–Class A 29,448 1,958,292
Cognizant Technology Solutions Corp.–Class A(b) 44,567 3,300,187
International Business Machines Corp. 9,984 1,912,435
7,170,914
Life Sciences Tools & Services–1.33%
Agilent Technologies, Inc. 31,574 1,292,640
Other Diversified Financial Services–0.35%
BlueStream Ventures L.P.(Acquired 08/03/00–06/13/08;Acquisition Cost $3,149,655)(b)(c)(d) — 341,773
Research & Consulting Services–0.64%
Acacia Research(b) 24,482 627,963
Semiconductor Equipment–1.07%
Teradyne, Inc.(b) 61,982 1,046,876
Semiconductors–17.13%
ARM Holdings PLC–ADR (United Kingdom) 8,918 337,368
Avago Technologies Ltd. 33,610 1,064,093
Broadcom Corp.–Class A 67,028 2,226,000
Cirrus Logic, Inc.(b) 20,788 602,228
Cypress Semiconductor Corp. 74,900 811,916
Diodes Inc.(b) 50,846 882,178
Fairchild Semiconductor International, Inc.(b) 65,501 943,214
Intermolecular Inc.(b) 67,306 599,023
Lattice Semiconductor Corp.(b) 246,253 982,549
MA-COM Technology Solutions Holdings Inc.(b) 28,412 425,328
Maxim Integrated Products, Inc. 27,465 807,471
Microsemi Corp.(b) 106,963 2,250,502
ON Semiconductor Corp.(b) 116,453 820,994
Semtech Corp.(b) 54,789 1,586,142
Skyworks Solutions, Inc.(b) 45,135 916,240
Texas Instruments Inc. 25,070 775,666
Xilinx, Inc. 18,595 667,560
16,698,472
Systems Software–8.72%
Check Point Software Technologies Ltd. (Israel)(b) 23,472 1,118,206
CommVault Systems, Inc.(b) 11,879 828,085
Fortinet Inc.(b) 60,273 1,269,952
Infoblox, Inc.(b) 13,588 244,177
Oracle Corp. 88,151 2,937,191
See accompanying Notes to Financial Statements which are an integral part of the financial statements.
Invesco V.I. Technology Fund
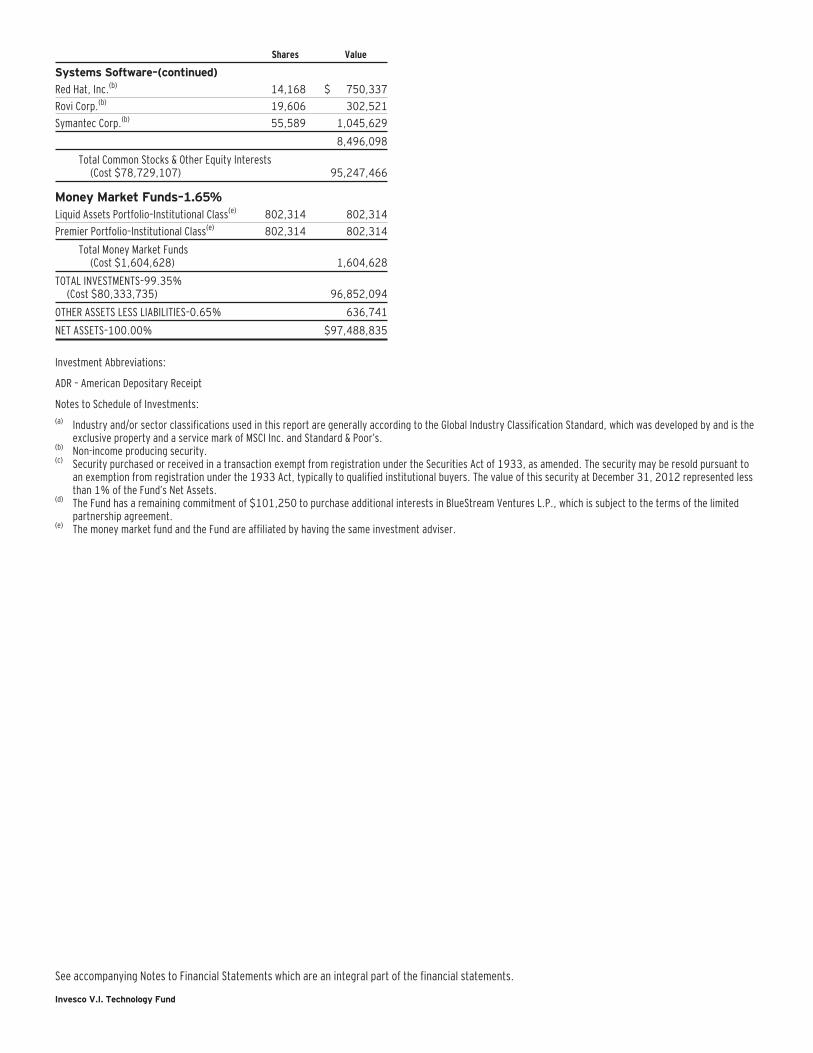
Shares Value
Systems Software–(continued)
Red Hat, Inc.(b) 14,168 $ 750,337
Rovi Corp.(b) 19,606 302,521
Symantec Corp.(b) 55,589 1,045,629
8,496,098
Total Common Stocks & Other Equity Interests(Cost $78,729,107) 95,247,466
Money Market Funds–1.65%Liquid Assets Portfolio–Institutional Class(e) 802,314 802,314
Premier Portfolio–Institutional Class(e) 802,314 802,314
Total Money Market Funds(Cost $1,604,628) 1,604,628
TOTAL INVESTMENTS–99.35%(Cost $80,333,735) 96,852,094
OTHER ASSETS LESS LIABILITIES–0.65% 636,741
NET ASSETS–100.00% $97,488,835
Investment Abbreviations:
ADR – American Depositary Receipt
Notes to Schedule of Investments:(a) Industry and/or sector classifications used in this report are generally according to the Global Industry Classification Standard, which was developed by and is the
exclusive property and a service mark of MSCI Inc. and Standard & Poor’s.(b) Non-income producing security.(c) Security purchased or received in a transaction exempt from registration under the Securities Act of 1933, as amended. The security may be resold pursuant to
an exemption from registration under the 1933 Act, typically to qualified institutional buyers. The value of this security at December 31, 2012 represented lessthan 1% of the Fund’s Net Assets.
(d) The Fund has a remaining commitment of $101,250 to purchase additional interests in BlueStream Ventures L.P., which is subject to the terms of the limitedpartnership agreement.
(e) The money market fund and the Fund are affiliated by having the same investment adviser.
See accompanying Notes to Financial Statements which are an integral part of the financial statements.
Invesco V.I. Technology Fund

Statement of Assets and LiabilitiesDecember 31, 2012
Statement of OperationsFor the year ended December 31, 2012
Assets:
Investments, at value (Cost $78,729,107) $95,247,466
Investments in affiliated money market funds, at value andcost 1,604,628
Total investments, at value (Cost $80,333,735) 96,852,094
Cash 795,135
Receivable for:Fund shares sold 56,334
Dividends 11,579
Investment for trustee deferred compensation and retirementplans 38,292
Total assets 97,753,434
Liabilities:
Payable for:Fund shares reacquired 102,431
Accrued fees to affiliates 64,740
Accrued other operating expenses 37,765
Trustee deferred compensation and retirement plans 59,663
Total liabilities 264,599
Net assets applicable to shares outstanding $97,488,835
Net assets consist of:
Shares of beneficial interest $70,920,323
Undistributed net investment income 2,076,625
Undistributed net realized gain 7,973,528
Unrealized appreciation 16,518,359
$97,488,835
Net Assets:
Series I $95,370,902
Series II $ 2,117,933
Shares outstanding, $0.001 par value per share,with an unlimited number of shares authorized:
Series I 5,651,714
Series II 128,343
Series I:Net asset value per share $ 16.87
Series II:Net asset value per share $ 16.50
Investment income:
Dividends $ 776,628
Dividends from affiliated money market funds 3,958
Total investment income 780,586
Expenses:
Advisory fees 794,695
Administrative services fees 308,497
Custodian fees 10,794
Distribution fees — Series II 5,030
Transfer agent fees 30,506
Trustees’ and officers’ fees and benefits 25,160
Other 60,617
Total expenses 1,235,299
Less: Fees waived (4,218)
Net expenses 1,231,081
Net investment income (loss) (450,495)
Realized and unrealized gain from:
Net realized gain from:Investment securities 9,554,276
Change in net unrealized appreciation of:Investment securities 2,176,313
Net realized and unrealized gain 11,730,589
Net increase in net assets resulting from operations $11,280,094
See accompanying Notes to Financial Statements which are an integral part of the financial statements.
Invesco V.I. Technology Fund

Statement of Changes in Net AssetsFor the years ended December 31, 2012 and 2011
2012 2011
Operations:
Net investment income (loss) $ (450,495) $ (756,527)
Net realized gain 9,554,276 11,675,866
Change in net unrealized appreciation (depreciation) 2,176,313 (16,912,981)
Net increase (decrease) in net assets resulting from operations 11,280,094 (5,993,642)
Distributions to shareholders from net investment income:
Series I — (209,892)
Series ll — (1,326)
Total distributions from net investment income — (211,218)
Share transactions–net:
Series l (16,315,465) (21,625,874)
Series ll 331,851 520,728
Net increase (decrease) in net assets resulting from share transactions (15,983,614) (21,105,146)
Net increase (decrease) in net assets (4,703,520) (27,310,006)
Net assets:
Beginning of year 102,192,355 129,502,361
End of year (includes undistributed net investment income of $2,076,625 and $1,881,365, respectively) $ 97,488,835 $102,192,355
Notes to Financial StatementsDecember 31, 2012
NOTE 1—Significant Accounting Policies
Invesco V.I. Technology Fund (the “Fund”) is a series portfolio of AIM Variable Insurance Funds (Invesco Variable Insurance Funds) (the “Trust”). TheTrust is a Delaware statutory trust registered under the Investment Company Act of 1940, as amended (the “1940 Act”), as an open-end seriesmanagement investment company consisting of twenty-five separate portfolios, (each constituting a “Fund”). The assets, liabilities and operations ofeach portfolio are accounted for separately. Information presented in these financial statements pertains only to the Fund. Matters affecting eachFund or class will be voted on exclusively by the shareholders of such Fund or class. Current Securities and Exchange Commission (“SEC”) guidance,however, requires participating insurance companies offering separate accounts to vote shares proportionally in accordance with the instructions ofthe contract owners whose investments are funded by shares of each Fund or class.
The Fund’s investment objective is long-term growth of capital.The Fund currently offers two classes of shares, Series I and Series II, both of which are offered to insurance company separate accounts funding
variable annuity contracts and variable life insurance policies (“variable products”).The following is a summary of the significant accounting policies followed by the Fund in the preparation of its financial statements.
A. Security Valuations — Securities, including restricted securities, are valued according to the following policy.A security listed or traded on an exchange (except convertible bonds) is valued at its last sales price or official closing price as of the close of
the customary trading session on the exchange where the security is principally traded, or lacking any sales or official closing price on a particularday, the security may be valued at the closing bid price on that day. Securities traded in the over-the-counter market are valued based on pricesfurnished by independent pricing services or market makers. When such securities are valued by an independent pricing service they may beconsidered fair valued. Futures contracts are valued at the final settlement price set by an exchange on which they are principally traded. Listedoptions are valued at the mean between the last bid and ask prices from the exchange on which they are principally traded. Options not listed onan exchange are valued by an independent source at the mean between the last bid and ask prices. For purposes of determining net asset valueper share, futures and option contracts generally are valued 15 minutes after the close of the customary trading session of the New York StockExchange (“NYSE”).
Investments in open-end and closed-end registered investment companies that do not trade on an exchange are valued at the end of day netasset value per share. Investments in open-end and closed-end registered investment companies that trade on an exchange are valued at the lastsales price or official closing price as of the close of the customary trading session on the exchange where the security is principally traded.
Debt obligations (including convertible bonds) and unlisted equities are fair valued using an evaluated quote provided by an independentpricing service. Evaluated quotes provided by the pricing service may be determined without exclusive reliance on quoted prices, and may reflectappropriate factors such as institution-size trading in similar groups of securities, developments related to specific securities, dividend rate(for unlisted equities), yield (for debt obligations), quality, type of issue, coupon rate (for debt obligations), maturity (for debt obligations),individual trading characteristics and other market data. Debt obligations are subject to interest rate and credit risks. In addition, all debtobligations involve some risk of default with respect to interest and/or principal payments.
Invesco V.I. Technology Fund

Foreign securities’ (including foreign exchange contracts) prices are converted into U.S. dollar amounts using the applicable exchange rates asof the close of the NYSE. If market quotations are available and reliable for foreign exchange-traded equity securities, the securities will be valuedat the market quotations. Because trading hours for certain foreign securities end before the close of the NYSE, closing market quotations maybecome unreliable. If between the time trading ends on a particular security and the close of the customary trading session on the NYSE, eventsoccur that the Adviser determines are significant and make the closing price unreliable, the Fund may fair value the security. If the event is likelyto have affected the closing price of the security, the security will be valued at fair value in good faith using procedures approved by the Board ofTrustees. Adjustments to closing prices to reflect fair value may also be based on a screening process of an independent pricing service toindicate the degree of certainty, based on historical data, that the closing price in the principal market where a foreign security trade is not thecurrent value as of the close of the NYSE. Foreign securities’ prices meeting the approved degree of certainty that the price is not reflective ofcurrent value will be priced at the indication of fair value from the independent pricing service. Multiple factors may be considered by theindependent pricing service in determining adjustments to reflect fair value and may include information relating to sector indices, AmericanDepositary Receipts and domestic and foreign index futures. Foreign securities may have additional risks including exchange rate changes,potential for sharply devalued currencies and high inflation, political and economic upheaval, the relative lack of issuer information, relatively lowmarket liquidity and the potential lack of strict financial and accounting controls and standards.
Securities for which market prices are not provided by any of the above methods may be valued based upon quotes furnished by independentsources. The last bid price may be used to value equity securities. The mean between the last bid and asked prices is used to value debtobligations, including corporate loans.
Securities for which market quotations are not readily available or became unreliable are valued at fair value as determined in good faith by orunder the supervision of the Trust’s officers following procedures approved by the Board of Trustees. Issuer specific events, market trends, bid/ask quotes of brokers and information providers and other market data may be reviewed in the course of making a good faith determination of asecurity’s fair value.
Valuations change in response to many factors including the historical and prospective earnings of the issuer, the value of the issuer’s assets,general economic conditions, interest rates, investor perceptions and market liquidity. Because of the inherent uncertainties of valuation, thevalues reflected in the financial statements may materially differ from the value received upon actual sale of those investments.
B. Securities Transactions and Investment Income — Securities transactions are accounted for on a trade date basis. Realized gains orlosses on sales are computed on the basis of specific identification of the securities sold. Interest income is recorded on the accrual basis fromsettlement date. Dividend income (net of withholding tax, if any) is recorded on the ex-dividend date.
The Fund may periodically participate in litigation related to Fund investments. As such, the Fund may receive proceeds from litigationsettlements. Any proceeds received are included in the Statement of Operations as realized gain (loss) for investments no longer held and asunrealized gain (loss) for investments still held.
Brokerage commissions and mark ups are considered transaction costs and are recorded as an increase to the cost basis of securitiespurchased and/or a reduction of proceeds on a sale of securities. Such transaction costs are included in the determination of net realized andunrealized gain (loss) from investment securities reported in the Statement of Operations and the Statement of Changes in Net Assets and the netrealized and unrealized gains (losses) on securities per share in the Financial Highlights. Transaction costs are included in the calculation of theFund’s net asset value and, accordingly, they reduce the Fund’s total returns. These transaction costs are not considered operating expenses andare not reflected in net investment income reported in the Statement of Operations and Statement of Changes in Net Assets, or the net investmentincome per share and ratios of expenses and net investment income reported in the Financial Highlights, nor are they limited by any expenselimitation arrangements between the Fund and the investment adviser.
The Fund allocates income and realized and unrealized capital gains and losses to a class based on the relative net assets of each class.C. Country Determination — For the purposes of making investment selection decisions and presentation in the Schedule of Investments, the
investment adviser may determine the country in which an issuer is located and/or credit risk exposure based on various factors. These factorsinclude the laws of the country under which the issuer is organized, where the issuer maintains a principal office, the country in which the issuerderives 50% or more of its total revenues and the country that has the primary market for the issuer’s securities, as well as other criteria. Amongthe other criteria that may be evaluated for making this determination are the country in which the issuer maintains 50% or more of its assets,the type of security, financial guarantees and enhancements, the nature of the collateral and the sponsor organization. Country of issuer and/orcredit risk exposure has been determined to be the United States of America, unless otherwise noted.
D. Distributions — Distributions from income and net realized capital gain, if any, are generally declared and paid to separate accounts ofparticipating insurance companies annually and recorded on the ex-dividend date.
E. Federal Income Taxes — The Fund intends to comply with the requirements of Subchapter M of the Internal Revenue Code necessary toqualify as a regulated investment company and to distribute substantially all of the Fund’s taxable earnings to shareholders. As such, the Fund willnot be subject to federal income taxes on otherwise taxable income (including net realized capital gain) that is distributed to shareholders.Therefore, no provision for federal income taxes is recorded in the financial statements.
The Fund files tax returns in the U.S. Federal jurisdiction and certain other jurisdictions. Generally, the Fund is subject to examinations by suchtaxing authorities for up to three years after the filing of the return for the tax period.
F. Expenses — Fees provided for under the Rule 12b-1 plan of a particular class of the Fund and which are directly attributable to that class arecharged to the operations of such class. All other expenses are allocated among the classes based on relative net assets.
G. Accounting Estimates — The preparation of financial statements in conformity with accounting principles generally accepted in the UnitedStates of America (“GAAP”) requires management to make estimates and assumptions that affect the reported amounts of assets and liabilities atthe date of the financial statements and the reported amounts of revenues and expenses during the reporting period including estimates andassumptions related to taxation. Actual results could differ from those estimates by a significant amount. In addition, the Fund monitors formaterial events or transactions that may occur or become known after the period-end date and before the date the financial statements arereleased to print.
H. Indemnifications — Under the Trust’s organizational documents, each Trustee, officer, employee or other agent of the Trust is indemnifiedagainst certain liabilities that may arise out of the performance of their duties to the Fund. Additionally, in the normal course of business, the
Invesco V.I. Technology Fund

Fund enters into contracts, including the Fund’s servicing agreements, that contain a variety of indemnification clauses. The Fund’s maximumexposure under these arrangements is unknown as this would involve future claims that may be made against the Fund that have not yetoccurred. The risk of material loss as a result of such indemnification claims is considered remote.
I. Other Risks — The Fund’s investments are concentrated in a comparatively narrow segment of the economy, which may make the Fund morevolatile.
Many products and services offered in technology-related industries are subject to rapid obsolescence, which may lower the value of theissuers in this sector.
NOTE 2—Advisory Fees and Other Fees Paid to Affiliates
The Trust has entered into a master investment advisory agreement with Invesco Advisers, Inc. (the “Adviser” or “Invesco”). Under the terms of theinvestment advisory agreement, the Fund pays an advisory fee to the Adviser based on the annual rate of the Fund’s average daily net assets asfollows:
Average Daily Net Assets Rate
First $250 million 0.75%
Next $250 million 0.74%
Next $500 million 0.73%
Next $1.5 billion 0.72%
Next $2.5 billion 0.71%
Next $2.5 billion 0.70%
Next $2.5 billion 0.69%
Over $10 billion 0.68%
Under the terms of a master sub-advisory agreement between the Adviser and each of Invesco Asset Management Deutschland GmbH, InvescoAsset Management Limited, Invesco Asset Management (Japan) Limited, Invesco Australia Limited, Invesco Hong Kong Limited, Invesco Senior SecuredManagement, Inc. and Invesco Canada Ltd. (collectively, the “Affiliated Sub-Advisers”) the Adviser, not the Fund, may pay 40% of the fees paid to theAdviser to any such Affiliated Sub-Adviser(s) that provide discretionary investment management services to the Fund based on the percentage ofassets allocated to such Sub-Adviser(s).
The Adviser has contractually agreed, through April 30, 2013, to waive advisory fees and/or reimburse expenses to the extent necessary to limittotal annual fund operating expenses after fee waiver and/or expense reimbursement (excluding certain items discussed below) of Series I shares to1.30% and Series II shares to 1.45% of average daily net assets. In determining the Adviser’s obligation to waive advisory fees and/or reimburseexpenses, the following expenses are not taken into account, and could cause the total annual fund operating expenses after fee waiver and/orexpense reimbursement to exceed the numbers reflected above: (1) interest; (2) taxes; (3) dividend expense on short sales; (4) extraordinary or non-routine items, including litigation expenses; and (5) expenses that the Fund has incurred but did not actually pay because of an expense offsetarrangement. The Adviser did not waive fees and/or reimburse expenses during the period under this expense limitation.
The Adviser has contractually agreed, through at least June 30, 2013, to waive the advisory fee payable by the Fund in an amount equal to 100%of the net advisory fees the Adviser receives from the affiliated money market funds on investments by the Fund of uninvested cash in such affiliatedmoney market funds.
For the year ended December 31, 2012, the Adviser waived advisory fees of $4,218.The Trust has entered into a master administrative services agreement with Invesco pursuant to which the Fund has agreed to pay Invesco a fee for
costs incurred in providing accounting services and fund administrative services to the Fund and to reimburse Invesco for administrative services feespaid to insurance companies that have agreed to provide services to the participants of separate accounts. These administrative services provided bythe insurance companies may include, among other things: the printing of prospectuses, financial reports and proxy statements and the delivery ofthe same to existing participants; the maintenance of master accounts; the facilitation of purchases and redemptions requested by the participants;and the servicing of participants’ accounts. Pursuant to such agreement, for the year ended December 31, 2012, Invesco was paid $50,000 foraccounting and fund administrative services and reimbursed $258,497 for services provided by insurance companies.
The Trust has entered into a transfer agency and service agreement with Invesco Investment Services, Inc. (“IIS”) pursuant to which the Fund hasagreed to pay IIS a fee for providing transfer agency and shareholder services to the Fund and reimburse IIS for certain expenses incurred by IIS in thecourse of providing such services. For the year ended December 31, 2012, expenses incurred under the agreement are shown in the Statement ofOperations as Transfer agent fees.
The Trust has entered into a master distribution agreement with Invesco Distributors, Inc. (“IDI”) to serve as the distributor for the Fund. The Trusthas adopted a plan pursuant to Rule 12b-1 under the 1940 Act with respect to the Fund’s Series II shares (the “Plan”). The Fund, pursuant to thePlan, pays IDI compensation at the annual rate of 0.25% of the Fund’s average daily net assets of Series II shares. Of the Plan payments, up to0.25% of the average daily net assets of the Series II shares may be paid to insurance companies who furnish continuing personal shareholderservices to customers who purchase and own Series II shares of the Fund. For the year ended December 31, 2012, expenses incurred under the Planare detailed in the Statement of Operations as Distribution fees.
For the year ended December 31, 2012, the Fund incurred $968 in brokerage commissions with Invesco Capital Markets, Inc., an affiliate of theAdviser and IDI, for portfolio transactions executed on behalf of the Fund.
Certain officers and trustees of the Trust are officers and directors of the Adviser, IIS and/or IDI.
Invesco V.I. Technology Fund

NOTE 3—Additional Valuation Information
GAAP defines fair value as the price that would be received to sell an asset or paid to transfer a liability in an orderly transaction between marketparticipants at the measurement date, under current market conditions. GAAP establishes a hierarchy that prioritizes the inputs to valuation methodsgiving the highest priority to readily available unadjusted quoted prices in an active market for identical assets (Level 1) and the lowest priority tosignificant unobservable inputs (Level 3) generally when market prices are not readily available or are unreliable. Based on the valuation inputs, thesecurities or other investments are tiered into one of three levels. Changes in valuation methods may result in transfers in or out of an investment’sassigned level:
Level 1 — Prices are determined using quoted prices in an active market for identical assets.Level 2 — Prices are determined using other significant observable inputs. Observable inputs are inputs that other market participants may use in
pricing a security. These may include quoted prices for similar securities, interest rates, prepayment speeds, credit risk, yield curves,loss severities, default rates, discount rates, volatilities and others.
Level 3 — Prices are determined using significant unobservable inputs. In situations where quoted prices or observable inputs are unavailable (forexample, when there is little or no market activity for an investment at the end of the period), unobservable inputs may be used.Unobservable inputs reflect the Fund’s own assumptions about the factors market participants would use in determining fair value of thesecurities or instruments and would be based on the best available information.
The following is a summary of the tiered valuation input levels, as of December 31, 2012. The level assigned to the securities valuations may notbe an indication of the risk or liquidity associated with investing in those securities. Because of the inherent uncertainties of valuation, the valuesreflected in the financial statements may materially differ from the value received upon actual sale of those investments.
Level 1 Level 2 Level 3 Total
Equity Securities $96,510,321 $— $341,773 $96,852,094
NOTE 4—Trustees’ and Officers’ Fees and Benefits
“Trustees’ and Officers’ Fees and Benefits” include amounts accrued by the Fund to pay remuneration to certain Trustees and Officers of the Fund.Trustees have the option to defer compensation payable by the Fund, and “Trustees’ and Officers’ Fees and Benefits” also include amounts accrued bythe Fund to fund such deferred compensation amounts. Those Trustees who defer compensation have the option to select various Invesco Funds inwhich their deferral accounts shall be deemed to be invested. Finally, certain current Trustees are eligible to participate in a retirement plan thatprovides for benefits to be paid upon retirement to Trustees over a period of time based on the number of years of service. The Fund may have certainformer Trustees who also participate in a retirement plan and receive benefits under such plan. “Trustees’ and Officers’ Fees and Benefits” includeamounts accrued by the Fund to fund such retirement benefits. Obligations under the deferred compensation and retirement plans representunsecured claims against the general assets of the Fund.
NOTE 5—Cash Balances
The Fund is permitted to temporarily carry a negative or overdrawn balance in its account with State Street Bank and Trust Company, the custodianbank. Such balances, if any at period end, are shown in the Statement of Assets and Liabilities under the payable caption Amount due custodian. Tocompensate the custodian bank for such overdrafts, the overdrawn Fund may either (1) leave funds as a compensating balance in the account so thecustodian bank can be compensated by earning the additional interest; or (2) compensate by paying the custodian bank at a rate agreed upon by thecustodian bank and Invesco, not to exceed the contractually agreed upon rate.
NOTE 6—Distributions to Shareholders and Tax Components of Net Assets
Tax Character of Distributions to Shareholders Paid During the Years Ended December 31, 2012 and 2011:
2012 2011
Ordinary income $— $211,218
Tax Components of Net Assets at Period-End:
2012
Undistributed long-term gain $ 8,068,484
Net unrealized appreciation — investments 18,555,078
Temporary book/tax differences (55,050)
Shares of beneficial interest 70,920,323
Total net assets $97,488,835
The difference between book-basis and tax-basis unrealized appreciation (depreciation) is due to differences in the timing of recognition of gainsand losses on investments for tax and book purposes. The Fund’s net unrealized appreciation difference is attributable primarily to wash sales andpartnership interests.
The temporary book/tax differences are a result of timing differences between book and tax recognition of income and/or expenses. The Fund’stemporary book/tax differences are the result of the trustee deferral of compensation and retirement plan benefits.
Invesco V.I. Technology Fund

Capital loss carryforward is calculated and reported as of a specific date. Results of transactions and other activity after that date may affect theamount of capital loss carryforward actually available for the Fund to utilize. The Regulated Investment Company Modernization Act of 2010(the “Act”) eliminated the eight-year carryover period for capital losses that arise in taxable years beginning after its enactment date ofDecember 22, 2010. Consequently, these capital losses can be carried forward for an unlimited period. However, capital losses with an expirationperiod may not be used to offset capital gains until all net capital losses without an expiration date have been utilized. Additionally, post-enactmentcapital loss carryovers will retain their character as either short-term or long-term capital losses instead of as short-term capital losses as under priorlaw. The ability to utilize capital loss carryforward in the future may be limited under the Internal Revenue Code and related regulations based on theresults of future transactions.
The Fund utilized $1,524,170 of capital loss carryforward in the current period to offset net realized capital gain for federal income tax purposes.The Fund does not have a capital loss carryforward as of December 31, 2012.
NOTE 7—Investment Securities
The aggregate amount of investment securities (other than short-term securities, U.S. Treasury obligations and money market funds, if any)purchased and sold by the Fund during the year ended December 31, 2012 was $43,193,946 and $58,776,017, respectively. Cost of investmentson a tax basis includes the adjustments for financial reporting purposes as of the most recently completed federal income tax reporting period-end.
Unrealized Appreciation (Depreciation) of Investment Securities on a Tax Basis
Aggregate unrealized appreciation of investment securities $25,475,540
Aggregate unrealized (depreciation) of investment securities (6,920,462)
Net unrealized appreciation of investment securities $18,555,078
Cost of investments for tax purposes is $78,297,016.
NOTE 8—Reclassification of Permanent Differences
Primarily as a result of differing book/tax treatment of partnership and net operating losses, on December 31, 2012, undistributed net investmentincome was increased by $645,755 , undistributed net realized gain was increased by $18,893 and shares of beneficial interest was decreased by$664,648. This reclassification had no effect on the net assets of the Fund.
NOTE 9—Share Information
Summary of Share ActivityYears ended December 31,
2012(a) 2011
Shares Amount Shares Amount
Sold:
Series I 678,900 $ 11,607,559 1,327,553 $ 22,172,590
Series II 65,426 1,097,512 56,016 891,686
Issued as reinvestment of dividends:
Series I — — 14,376 209,892
Series II — — 93 1,326
Reacquired:
Series I (1,662,300) (27,923,024) (2,725,269) (44,008,356)
Series II (45,637) (765,661) (23,813) (372,284)
Net increase (decrease) in share activity (963,611) $(15,983,614) (1,351,044) $(21,105,146)
(a) There are entities that are record owners of more than 5% of the outstanding shares of the Fund and in the aggregate own 64% of the outstanding shares of theFund. The Fund and the Fund’s principal underwriter or adviser, are parties to participation agreements with these entities whereby these entities sell units ofinterest in separate accounts funding variable products that are invested in the Fund. The Fund, Invesco and/or Invesco affiliates may make payments to theseentities, which are considered to be related to the Fund, for providing services to the Fund, Invesco and/or Invesco affiliates including but not limited to servicessuch as, securities brokerage, third party record keeping and account servicing and administrative services. The Fund has no knowledge as to whether all or anyportion of the shares owned of record by these entities are also owned beneficially.
Invesco V.I. Technology Fund

NOTE 10—Financial Highlights
The following schedule presents financial highlights for a share of the Fund outstanding throughout the periods indicated.
Net assetvalue,
beginningof period
Netinvestment
income(loss)(a)
Net gains(losses)
on securities(both
realized andunrealized)
Total frominvestmentoperations
Dividendsfrom net
investmentincome
Net assetvalue, endof period
Totalreturn(b)
Net assets,end of period
(000’s omitted)
Ratio ofexpenses
to averagenet assets
with fee waiversand/or expenses
absorbed
Ratio ofexpenses
to average netassets without
fee waiversand/or expenses
absorbed
Ratio of netinvestment
income(loss) toaverage
net assetsPortfolio
turnover(c)
Series IYear ended 12/31/12 $15.16 $(0.07) $ 1.78 $ 1.71 $ — $16.87 11.28% $ 95,371 1.16%(d) 1.16%(d) (0.42)%(d) 42%Year ended 12/31/11 16.00 (0.10) (0.71) (0.81) (0.03) 15.16 (5.05) 100,579 1.12 1.12 (0.62) 41Year ended 12/31/10 13.19 0.02 2.79 2.81 — 16.00 21.30 128,304 1.14 1.14 0.18 43Year ended 12/31/09 8.38 (0.03) 4.84 4.81 — 13.19 57.40 119,369 1.18 1.19 (0.27) 42Year ended 12/31/08 15.10 0.01 (6.73) (6.72) — 8.38 (44.50) 71,546 1.15 1.16 0.05 81
Series IIYear ended 12/31/12 14.86 (0.11) 1.75 1.64 — 16.50 11.04 2,118 1.41(d) 1.41(d) (0.67)(d) 42Year ended 12/31/11 15.71 (0.14) (0.70) (0.84) (0.01) 14.86 (5.32) 1,613 1.37 1.37 (0.87) 41Year ended 12/31/10 12.98 (0.01) 2.74 2.73 — 15.71 21.03 1,198 1.39 1.39 (0.07) 43Year ended 12/31/09 8.26 (0.06) 4.78 4.72 — 12.98 57.14 417 1.43 1.44 (0.52) 42Year ended 12/31/08 14.95 (0.02) (6.67) (6.69) — 8.26 (44.75) 115 1.40 1.41 (0.20) 81
(a) Calculated using average shares outstanding.(b) Includes adjustments in accordance with accounting principles generally accepted in the United States of America and as such, the net asset value for financial reporting purposes and
the returns based upon those net asset values may differ from the net asset value and returns for shareholder transactions. Total returns are not annualized for periods less than oneyear, if applicable and do not reflect charges assessed in connection with a variable product, which if included would reduce total returns.
(c) Portfolio turnover is calculated at the fund level and is not annualized for periods less than one year, if applicable.(d) Ratios are based on average daily net assets (000’s) of $103,947 and $2,012 for Series I and Series II, respectively.
Invesco V.I. Technology Fund

Report of Independent Registered Public Accounting Firm
To the Board of Trustees of AIM Variable Insurance Funds (Invesco Variable Insurance Funds)and Shareholders of Invesco V.I. Technology Fund:
In our opinion, the accompanying statement of assets and liabilities, including the schedule of investments, and the related statementsof operations and of changes in net assets and the financial highlights present fairly, in all material respects, the financial position ofInvesco V.I. Technology Fund (one of the funds constituting AIM Variable Insurance Funds (Invesco Variable Insurance Funds), hereafterreferred to as the “Fund”) at December 31, 2012, the results of its operations for the year then ended, the changes in its net assets foreach of the two years in the period then ended and the financial highlights for each of the five years in the period then ended, inconformity with accounting principles generally accepted in the United States of America. These financial statements and financialhighlights (hereafter referred to as “financial statements”) are the responsibility of the Fund’s management; our responsibility is toexpress an opinion on these financial statements based on our audits. We conducted our audits of these financial statements inaccordance with the standards of the Public Company Accounting Oversight Board (United States). Those standards require that we planand perform the audit to obtain reasonable assurance about whether the financial statements are free of material misstatement. Anaudit includes examining, on a test basis, evidence supporting the amounts and disclosures in the financial statements, assessing theaccounting principles used and significant estimates made by management, and evaluating the overall financial statement presentation.We believe that our audits, which included confirmation of securities at December 31, 2012 by correspondence with the custodian,provide a reasonable basis for our opinion.
PRICEWATERHOUSECOOPERS LLP
February 15, 2013Houston, Texas
Invesco V.I. Technology Fund

Calculating your ongoing Fund expenses
Example
As a shareholder of the Fund, you incur ongoing costs, including management fees; distribution and/or service fees (12b-1); and other Fundexpenses. This example is intended to help you understand your ongoing costs (in dollars) of investing in the Fund and to compare these costs withongoing costs of investing in other mutual funds. The example is based on an investment of $1,000 invested at the beginning of the period and heldfor the entire period July 1, 2012 through December 31, 2012.
The actual and hypothetical expenses in the examples below do not represent the effect of any fees or other expenses assessed in connection witha variable product; if they did, the expenses shown would be higher while the ending account values shown would be lower.
Actual expenses
The table below provides information about actual account values and actual expenses. You may use the information in this table, together with theamount you invested, to estimate the expenses that you paid over the period. Simply divide your account value by $1,000 (for example, an $8,600account value divided by $1,000 = 8.6), then multiply the result by the number in the table under the heading entitled “Actual Expenses Paid DuringPeriod” to estimate the expenses you paid on your account during this period.
Hypothetical example for comparison purposes
The table below also provides information about hypothetical account values and hypothetical expenses based on the Fund’s actual expense ratio andan assumed rate of return of 5% per year before expenses, which is not the Fund’s actual return.
The hypothetical account values and expenses may not be used to estimate the actual ending account balance or expenses you paid for the period. Youmay use this information to compare the ongoing costs of investing in the Fund and other funds. To do so, compare this 5% hypothetical example withthe 5% hypothetical examples that appear in the shareholder reports of the other funds.
Please note that the expenses shown in the table are meant to highlight your ongoing costs. Therefore, the hypothetical information is useful incomparing ongoing costs, and will not help you determine the relative total costs of owning different funds.
Class
BeginningAccount Value(07/01/12)
ACTUAL
HYPOTHETICAL(5% annual return before
expenses)
AnnualizedExpense
Ratio
EndingAccount Value(12/31/12)1
ExpensesPaid During
Period2
EndingAccount Value(12/31/12)
ExpensesPaid During
Period2
Series I $1,000.00 $1,020.60 $5.99 $1,019.20 $5.99 1.18%
Series II 1,000.00 1,019.20 7.26 1,017.95 7.25 1.431 The actual ending account value is based on the actual total return of the Fund for the period July 1, 2012 through December 31, 2012, after actual expenses and will differ from the
hypothetical ending account value which is based on the Fund’s expense ratio and a hypothetical annual return of 5% before expenses.2 Expenses are equal to the Fund’s annualized expense ratio as indicated above multiplied by the average account value over the period, multiplied by 184/366 to reflect the most recent
fiscal half year.
Invesco V.I. Technology Fund

Trustees and OfficersThe address of each trustee and officer is AIM Variable Insurance Funds (Invesco Variable Insurance Funds) (the “Trust”), 11 Greenway Plaza, Suite1000, Houston, Texas 77046-1173. The trustees serve for the life of the Trust, subject to their earlier death, incapacitation, resignation,retirement or removal as more specifically provided in the Trust’s organizational documents. Each officer serves for a one year term or until theirsuccessors are elected and qualified. Column two below includes length of time served with predecessor entities, if any.
Name, Year of Birth andPosition(s) Held with the Trust
Trustee and/or Officer Since
Principal Occupation(s)During Past 5 Years
Number ofFunds in FundComplexOverseen byTrustee
Other Directorship(s)Held by Trustee DuringPast 5 Years
Interested Persons
Martin L. Flanagan1 — 1960Trustee
2007 Executive Director, Chief Executive Officer and President, Invesco Ltd. (ultimateparent of Invesco and a global investment management firm); Advisor to theBoard, Invesco Advisers, Inc. (formerly known as Invesco Institutional (N.A.),Inc.); Trustee, The Invesco Funds; Vice Chair, Investment Company Institute;and Member of Executive Board, SMU Cox School of BusinessFormerly: Chairman and Chief Executive Officer, Invesco Advisers, Inc. (registeredinvestment adviser); Director, Chairman, Chief Executive Officer and President, IVZInc. (holding company), INVESCO Group Services, Inc. (service provider) andInvesco North American Holdings, Inc. (holding company); Director, ChiefExecutive Officer and President, Invesco Holding Company Limited (parent ofInvesco and a global investment management firm); Director, Invesco Ltd.;Chairman, Investment Company Institute and President, Co-Chief ExecutiveOfficer, Co-President, Chief Operating Officer and Chief Financial Officer, FranklinResources, Inc. (global investment management organization)
124 None
Philip A. Taylor2 — 1954Trustee, President and PrincipalExecutive Officer
2006 Head of North American Retail and Senior Managing Director, Invesco Ltd.;Director, Co-Chairman, Co-President and Co-Chief Executive Officer, InvescoAdvisers, Inc. (formerly known as Invesco Institutional (N.A.), Inc.) (registeredinvestment adviser); Director, Chairman, Chief Executive Officer andPresident, Invesco Management Group, Inc. (formerly known as Invesco AimManagement Group, Inc.) (financial services holding company); Director andPresident, INVESCO Funds Group, Inc. (registered investment adviser andregistered transfer agent); Director and Chairman, Invesco InvestmentServices, Inc. (formerly known as Invesco Aim Investment Services, Inc.)(registered transfer agent) and IVZ Distributors, Inc. (formerly known asINVESCO Distributors, Inc.) (registered broker dealer); Director, President andChairman, Invesco Inc. (holding company) and Invesco Canada Holdings Inc.(holding company); Chief Executive Officer, Invesco Corporate Class Inc.(corporate mutual fund company) and Invesco Canada Fund Inc. (corporatemutual fund company); Director, Chairman and Chief Executive Officer,Invesco Canada Ltd. (formerly known as Invesco Trimark Ltd./Invesco TrimarkLtèe) (registered investment adviser and registered transfer agent); Trustee,President and Principal Executive Officer, The Invesco Funds (other than AIMTreasurer’s Series Trust (Invesco Treasurer’s Series Trust) and Short-TermInvestments Trust); Trustee and Executive Vice President, The Invesco Funds(AIM Treasurer’s Series Trust (Invesco Treasurer’s Series Trust) and Short-Term Investments Trust only); Director, Invesco Investment Advisers LLC(formerly known as Van Kampen Asset Management); Director, Chief ExecutiveOfficer and President, Van Kampen Exchange Corp.Formerly: Director and Chairman, Van Kampen Investor Services Inc.: Director,Chief Executive Officer and President, 1371 Preferred Inc. (holding company); andVan Kampen Investments Inc.; Director and President, AIM GP Canada Inc. (generalpartner for limited partnerships); and Van Kampen Advisors, Inc.; Director andChief Executive Officer, Invesco Trimark Dealer Inc. (registered broker dealer);Director, Invesco Distributors, Inc. (formerly known as Invesco Aim Distributors,Inc.) (registered broker dealer); Manager, Invesco PowerShares CapitalManagement LLC; Director, Chief Executive Officer and President, InvescoAdvisers, Inc.; Director, Chairman, Chief Executive Officer and President, InvescoAim Capital Management, Inc.; President, Invesco Trimark Dealer Inc. and InvescoTrimark Ltd./Invesco Trimark Ltèe; Director and President, AIM Trimark CorporateClass Inc. and AIM Trimark Canada Fund Inc.; Senior Managing Director, InvescoHolding Company Limited; Trustee and Executive Vice President, Tax-FreeInvestments Trust; Director and Chairman, Fund Management Company (formerregistered broker dealer); President and Principal Executive Officer, The InvescoFunds (AIM Treasurer’s Series Trust (Invesco Treasurer’s Series Trust), Short-TermInvestments Trust and Tax-Free Investments Trust only); President, AIM TrimarkGlobal Fund Inc. and AIM Trimark Canada Fund Inc.
124 None
Wayne W. Whalen3 — 1939Trustee
2010 Of Counsel, and prior to 2010, partner in the law firm of Skadden, Arps,Slate, Meagher & Flom LLP, legal counsel to certain funds in the Fund Complex
137 Director of the Mutual FundDirectors Forum, a nonprofitmembership organization forinvestment directors;Chairman and Director of theAbraham Lincoln PresidentialLibrary Foundation; andDirector of the StevensonCenter for Democracy
1 Mr. Flanagan is considered an interested person of the Trust because he is an officer of the adviser to the Trust, and an officer and a director of Invesco Ltd., ultimate parent of theadviser to the Trust.
2 Mr. Taylor is considered an interested person of the Trust because he is an officer and a director of the adviser to, and a director of the principal underwriter of, the Trust.3 Mr. Whalen is considered an “interested person” (within the meaning of Section 2(a)(19) of the 1940 Act) of certain Funds in the Invesco Fund Complex by reason of he and his firm
currently providing legal services as legal counsel to such Funds in the Invesco Fund Complex.
Invesco V.I. Technology Fund

Trustees and Officers—(continued)
Name, Year of Birth andPosition(s) Held with the Trust
Trustee and/or Officer Since
Principal Occupation(s)During Past 5 Years
Number ofFunds in FundComplexOverseen byTrustee
Other Directorship(s)Held by Trustee DuringPast 5 Years
Independent Trustees
Bruce L. Crockett — 1944Trustee and Chair
1993 Chairman, Crockett Technologies Associates (technology consulting company)Formerly: Director, Captaris (unified messaging provider); Director, Presidentand Chief Executive Officer COMSAT Corporation; and Chairman, Board ofGovernors of INTELSAT (international communications company)
124 ACE Limited (insurancecompany); and InvestmentCompany Institute
David C. Arch — 1945Trustee
2010 Chairman and Chief Executive Officer of Blistex Inc., (consumer health careproducts manufacturer)Formerly: Member of the Heartland Alliance Advisory Board, a nonprofitorganization serving human needs based in Chicago
137 Board member of theIllinois Manufacturers’Association; Member of theBoard of Visitors, Institutefor the Humanities,University of Michigan
Frank S. Bayley — 1939Trustee
2001 RetiredFormerly: Director, Badgley Funds, Inc. (registered investment company)(2 portfolios) and General Partner and Of Counsel, law firm of Baker &McKenzie, LLP
124 Director and Chairman, C.D.Stimson Company (a realestate investmentcompany); Trustee andOverseer, The Curtisinstitute of Music
James T. Bunch — 1942Trustee
2004 Managing Member, Grumman Hill Group LLC (family office private equitymanagement)Formerly: Founder, Green, Manning & Bunch Ltd. (investment bankingfirm)(1988-2010); Executive Committee, United States Golf Association; andDirector, Policy Studies, Inc. and Van Gilder Insurance Corporation
124 Chairman, Board ofGovernors, Western GolfAssociation; Chairman-elect, Evans ScholarsFoundation; and Director,Denver Film Society
Rodney F. Dammeyer — 1940Trustee
2010 Chairman of CAC, LLC, (private company offering capital investment andmanagement advisory services)Formerly: Prior to 2001, Managing Partner at Equity Group CorporateInvestments; Prior to 1995, Vice Chairman of Anixter International; Prior to1985, experience includes Senior Vice President and Chief Financial Officer ofHousehold International, Inc., Executive Vice President and Chief FinancialOfficer of Northwest Industries, Inc. and Partner of Arthur Andersen & Co.;From 1987 to 2010, Director/Trustee of investment companies in the VanKampen Funds complex
126 Director of QuidelCorporation and Stericycle,Inc.; Prior to May 2008,Trustee of The ScrippsResearch Institute; Prior toFebruary 2008, Director ofVentana Medical Systems,Inc.; Prior to April 2007,Director of GATXCorporation; Prior to April2004, Director ofTheraSense, Inc.
Albert R. Dowden — 1941Trustee
2000 Director of a number of public and private business corporations, includingthe Boss Group, Ltd. (private investment and management); Reich & TangFunds (5 portfolios) (registered investment company); and Homeowners ofAmerica Holding Corporation/ Homeowners of America Insurance Company(property casualty company)Formerly: Director, Continental Energy Services, LLC (oil and gas pipelineservice); Director, CompuDyne Corporation (provider of product and servicesto the public security market) and Director, Annuity and Life Re (Holdings),Ltd. (reinsurance company); Director, President and Chief Executive Officer,Volvo Group North America, Inc.; Senior Vice President, AB Volvo; Director ofvarious public and private corporations; Chairman, DHJ Media, Inc.; DirectorMagellan Insurance Company; and Director, The Hertz Corporation, GenmarCorporation (boat manufacturer), National Media Corporation; Advisory Boardof Rotary Power International (designer, manufacturer, and seller of rotarypower engines); and Chairman, Cortland Trust, Inc. (registered investmentcompany)
124 Director of Nature’sSunshine Products, Inc.
Jack M. Fields — 1952Trustee
1997 Chief Executive Officer, Twenty First Century Group, Inc. (government affairscompany); Owner and Chief Executive Officer, Dos Angeles Ranch, L.P. (cattle,hunting, corporate entertainment); and Discovery Global Education Fund (non-profit)Formerly: Chief Executive Officer, Texana Timber LP (sustainable forestrycompany); Director of Cross Timbers Quail Research Ranch (non-profit); andmember of the U.S. House of Representatives
124 Insperity, Inc. (formerlyknown as Administaff)
Prema Mathai-Davis — 1950Trustee
1998 RetiredFormerly: Chief Executive Officer, YWCA of the U.S.A.
124 None
Larry Soll — 1942Trustee
2004 RetiredFormerly: Chairman, Chief Executive Officer and President, Synergen Corp.(a biotechnology company)
124 None
Hugo F. Sonnenschein — 1940Trustee
2010 Distinguished Service Professor and President Emeritus of the University ofChicago and the Adam Smith Distinguished Service Professor in theDepartment of Economics at the University of ChicagoFormerly: President of the University of Chicago
137 Trustee of the University ofRochester and a member ofits investment committee.Member of the NationalAcademy of Sciences, theAmerican PhilosophicalSociety and a fellow of theAmerican Academy of Artsand Sciences
Invesco V.I. Technology Fund

Trustees and Officers—(continued)
Name, Year of Birth andPosition(s) Held with the Trust
Trustee and/or Officer Since
Principal Occupation(s)During Past 5 Years
Number ofFunds in FundComplexOverseen byTrustee
Other Directorship(s)Held by Trustee DuringPast 5 Years
Independent Trustees—(continued)
Raymond Stickel, Jr. — 1944Trustee
2005 RetiredFormerly: Director, Mainstay VP Series Funds, Inc. (25 portfolios) and Partner,Deloitte & Touche
124 None
Other Officers
Russell C. Burk — 1958Senior Vice President and SeniorOfficer
2005 Senior Vice President and Senior Officer, The Invesco Funds N/A N/A
John M. Zerr — 1962Senior Vice President, ChiefLegal Officer and Secretary
2006 Director, Senior Vice President, Secretary and General Counsel, InvescoManagement Group, Inc. (formerly known as Invesco Aim Management Group,Inc.) and Van Kampen Exchange Corp.; Senior Vice President, InvescoAdvisers, Inc. (formerly known as Invesco Institutional (N.A.), Inc.) (registeredinvestment adviser); Senior Vice President and Secretary, InvescoDistributors, Inc. (formerly known as Invesco Aim Distributors, Inc.); Director,Vice President and Secretary, Invesco Investment Services, Inc. (formerlyknown as Invesco Aim Investment Services, Inc.) and IVZ Distributors, Inc.(formerly known as INVESCO Distributors, Inc.); Director and Vice President,INVESCO Funds Group, Inc.; Senior Vice President, Chief Legal Officer andSecretary, The Invesco Funds; Manager, Invesco PowerShares CapitalManagement LLC; Director, Secretary and General Counsel, InvescoInvestment Advisers LLC (formerly known as Van Kampen Asset Management);Secretary and General Counsel, Van Kampen Funds Inc. and Chief LegalOfficer, PowerShares Exchange-Traded Fund Trust, PowerShares Exchange-Traded Fund Trust II, PowerShares India Exchange-Traded Fund Trust andPowerShares Actively Managed Exchange-Traded Fund TrustFormerly: Director and Vice President, Van Kampen Advisors Inc.; Director,Vice President, Secretary and General Counsel Van Kampen Investor ServicesInc.; Director, Invesco Distributors, Inc. (formerly known as Invesco AimDistributors, Inc.); Director, Senior Vice President, General Counsel andSecretary, Invesco Advisers, Inc. and Van Kampen Investments Inc.; Director,Vice President and Secretary, Fund Management Company; Director, SeniorVice President, Secretary, General Counsel and Vice President, Invesco AimCapital Management, Inc.; Chief Operating Officer and General Counsel, LibertyRidge Capital, Inc. (an investment adviser); Vice President and Secretary,PBHG Funds (an investment company) and PBHG Insurance Series Fund (aninvestment company); Chief Operating Officer, General Counsel and Secretary,Old Mutual Investment Partners (a broker-dealer); General Counsel andSecretary, Old Mutual Fund Services (an administrator) and Old MutualShareholder Services (a shareholder servicing center); Executive VicePresident, General Counsel and Secretary, Old Mutual Capital, Inc. (aninvestment adviser); and Vice President and Secretary, Old Mutual AdvisorsFunds (an investment company)
N/A N/A
Karen Dunn Kelley — 1960Vice President
1993 Head of Invesco’s World Wide Fixed Income and Cash Management Group;Senior Vice President, Invesco Management Group, Inc. (formerly known asInvesco Aim Management Group, Inc.) and Invesco Advisers, Inc. (formerlyknown as Invesco Institutional (N.A.), Inc.) (registered investment adviser);Executive Vice President, Invesco Distributors, Inc. (formerly known asInvesco Aim Distributors, Inc.); Director, Invesco Mortgage Capital Inc.,INVESCO Global Asset Management Limited, Invesco Management CompanyLimited and INVESCO Management S.A.; Vice President, The Invesco Funds(other than AIM Treasurer’s Series Trust (Invesco Treasurer’s Series Trust) andShort-Term Investments Trust); and President and Principal Executive Officer,The Invesco Funds (AIM Treasurer’s Series Trust (Invesco Treasurer’s SeriesTrust) and Short-Term Investments Trust only)Formerly: Senior Vice President, Van Kampen Investments Inc.; VicePresident, Invesco Advisers, Inc. (formerly known as Invesco Institutional(N.A.), Inc.); Director of Cash Management and Senior Vice President, InvescoAdvisers, Inc. and Invesco Aim Capital Management, Inc.; President andPrincipal Executive Officer, Tax-Free Investments Trust; Director andPresident, Fund Management Company; Chief Cash Management Officer,Director of Cash Management, Senior Vice President, and Managing Director,Invesco Aim Capital Management, Inc.; Director of Cash Management, SeniorVice President, and Vice President, Invesco Advisers, Inc. and The InvescoFunds (AIM Treasurer’s Series Trust (Invesco Treasurer’s Series Trust), Short-Term Investments Trust and Tax-Free Investments Trust only)
N/A N/A
Invesco V.I. Technology Fund

Trustees and Officers—(continued)
Name, Year of Birth andPosition(s) Held with the Trust
Trustee and/or Officer Since
Principal Occupation(s)During Past 5 Years
Number ofFunds in FundComplexOverseen byTrustee
Other Directorship(s)Held by Trustee DuringPast 5 Years
Other Officers—(continued)
Sheri Morris — 1964Vice President, Treasurer andPrincipal Financial Officer
1999 Vice President, Treasurer and Principal Financial Officer, The Invesco Funds;Vice President, Invesco Advisers, Inc. (formerly known as Invesco Institutional(N.A.), Inc.) (registered investment adviser); and Vice President, PowerSharesExchange-Traded Fund Trust, PowerShares Exchange-Traded Fund Trust II,PowerShares India Exchange-Traded Fund Trust and PowerShares ActivelyManaged Exchange-Traded Fund TrustFormerly: Vice President, Invesco Aim Advisers, Inc., Invesco Aim CapitalManagement, Inc. and Invesco Aim Private Asset Management, Inc.; AssistantVice President and Assistant Treasurer, The Invesco Funds and Assistant VicePresident, Invesco Advisers, Inc., Invesco Aim Capital Management, Inc. andInvesco Aim Private Asset Management, Inc.; and Treasurer, PowerSharesExchange-Traded Fund Trust, PowerShares Exchange-Traded Fund Trust II,PowerShares India Exchange-Traded Fund Trust and PowerShares ActivelyManaged Exchange-Traded Fund Trust
N/A N/A
Yinka Akinsola — 1977Anti-Money LaunderingCompliance Officer
2011 Anti-Money Laundering Compliance Officer, Invesco Advisers, Inc. (formerlyknown as Invesco Institutional (N.A.), Inc.) (registered investment adviser);Invesco Distributors, Inc. (formerly known as Invesco Aim Distributors, Inc.),Invesco Investment Services, Inc. (formerly known as Invesco Aim InvestmentServices, Inc.), Invesco Management Group, Inc., The Invesco Funds, InvescoVan Kampen Closed-End Funds, Van Kampen Exchange Corp., Van KampenFunds Inc., PowerShares Exchange-Traded Fund Trust, PowerShares Exchange-Traded Fund Trust II, PowerShares India Exchange-Traded Fund Trust, andPowerShares Actively Managed Exchange-Traded Fund TrustFormerly: Regulatory Analyst III, Financial Industry Regulatory Authority(FINRA)
N/A N/A
Todd L. Spillane — 1958Chief Compliance Officer
2006 Senior Vice President, Invesco Management Group, Inc. (formerly known asInvesco Aim Management Group, Inc.) and Van Kampen Exchange Corp.;Senior Vice President and Chief Compliance Officer, Invesco Advisers, Inc.(registered investment adviser) (formerly known as Invesco Institutional(N.A.), Inc.); Chief Compliance Officer, The Invesco Funds; Vice President,Invesco Distributors, Inc. (formerly known as Invesco Aim Distributors, Inc.)and Invesco Investment Services, Inc. (formerly known as Invesco AimInvestment Services, Inc.)Formerly: Chief Compliance Officer, Invesco Van Kampen Closed-End Funds;Senior Vice President, Van Kampen Investments Inc.; Senior Vice Presidentand Chief Compliance Officer, Invesco Aim Advisers, Inc. and Invesco AimCapital Management, Inc.; Chief Compliance Officer, INVESCO Private CapitalInvestments, Inc. (holding company), Invesco Private Capital, Inc. (registeredinvestment adviser), Invesco Global Asset Management (N.A.), Inc., InvescoSenior Secured Management, Inc. (registered investment adviser), VanKampen Investor Services Inc., PowerShares Exchange-Traded Fund Trust,PowerShares Exchange-Traded Fund Trust II, PowerShares India Exchange-Traded Fund Trust and PowerShares Actively Managed Exchange-Traded FundTrust; and Vice President, Invesco Aim Capital Management, Inc. and FundManagement Company
N/A N/A
The Statement of Additional Information of the Trust includes additional information about the Fund’s Trustees and is available upon request, without charge, by calling 1.800.959.4246.Please refer to the Fund’s prospectus for information on the Fund’s sub-advisers.Office of the Fund11 Greenway Plaza, Suite 1000Houston, TX 77046-1173
Investment AdviserInvesco Advisers, Inc.1555 Peachtree Street, N.E.Atlanta, GA 30309
DistributorInvesco Distributors, Inc.11 Greenway Plaza, Suite 1000Houston, TX 77046-1173
AuditorsPricewaterhouseCoopers LLP1201 Louisiana Street, Suite 2900Houston, TX 77002-5678
Counsel to the FundStradley Ronon Stevens & Young, LLP2005 Market Street, Suite 2600Philadelphia, PA 19103-7018
Counsel to the Independent TrusteesGoodwin Procter LLP901 New York Avenue, N.W.Washington, D.C. 20001
Transfer AgentInvesco Investment Services, Inc.11 Greenway Plaza, Suite 1000Houston, TX 77046-1173
CustodianState Street Bank and Trust Company225 Franklin StreetBoston, MA 02110-2801
Invesco V.I. Technology Fund

Annual Report
December 31, 2012
Columbia Variable Portfolio — Small Cap Value Fund
Not FDIC insured • No bank guarantee • May lose value
Please remember that you may not buy (nor will you own) shares of the Fund directly. You invest by buying a variable annuitycontract or life insurance policy and allocating your purchase payments to the variable subaccount or variable account (thesubaccounts) that invests in the Fund. Please contact your financial advisor or insurance representative for more information.


Table of Contents
Performance Overview.............................................................2
Manager Discussion of Fund Performance ................................4
Understanding Your Fund’s Expenses .......................................6
Portfolio of Investments ..........................................................7
Statement of Assets and Liabilities........................................14
Statement of Operations .......................................................16
Statement of Changes in Net Assets......................................17
Financial Highlights...............................................................19
Notes to Financial Statements...............................................21
Report of Independent RegisteredPublic Accounting Firm ..........................................................27
Federal Income Tax Information..............................................28
Trustees and Officers ............................................................29
Important Information About This Report ................................33
Annual Report 2012
Columbia Variable Portfolio — Small Cap Value Fund
The views expressed in this report reflect
the current views of the respective parties.
These views are not guarantees of future
performance and involve certain risks,
uncertainties and assumptions that are
difficult to predict, so actual outcomes and
results may differ significantly from the
views expressed. These views are subject to
change at any time based upon economic,
market or other conditions and the
respective parties disclaim any
responsibility to update such views. These
views may not be relied on as investment
advice and, because investment decisions
for a Columbia Fund are based on numerous
factors, may not be relied on as an
indication of trading intent on behalf of any
particular Columbia Fund. References to
specific securities should not be construed
as a recommendation or investment advice.

2 Annual Report 2012
Performance Overview
Performance Summary
> Columbia Variable Portfolio — Small Cap Value Fund (the Fund) Class 1 shares returned 11.40% for the 12-monthperiod that ended December 31, 2012.
> The Fund underperformed its benchmark, the Russell 2000 Value Index, which returned 18.05% for the same time period.
> The Fund’s relative performance was affected by its positioning in high quality stocks with strong balance sheets andcash flow growth. During the year, lower quality stocks drove performance in the small capitalization range.
Average Annual Total Returns (%) (for period ended December 31, 2012)
Inception 1 Year 5 Years 10 Years
Class 1 05/19/98 11.40 3.65 9.69
Class 2 06/01/00 11.25 3.47 9.52
Russell 2000 Value Index 18.05 3.55 9.50
Performance data quoted represents past performance and current performance may be lower or higher. Past performance is no guarantee
of future results. The investment return and principal value will fluctuate so that shares, when redeemed, may be worth more or less than
the original cost. For current month-end performance information, please contact your insurance company.
Performance results reflect the effect of any fee waivers or reimbursements of fund expenses by Columbia Management Investment
Advisers, LLC and/or any of its affiliates. Absent these fee waivers or expense reimbursement arrangements, performance results would
have been lower.
Investment earnings, if any, are tax-deferred until distributed to shareholders, at which time taxes may become due. Total return
performance includes changes in share price and assumes reinvestment of dividends and capital gains, if any. Performance results reflect
the effect of all fund expenses, but do not include any fees and expenses imposed under your variable annuity contract and/or variable life
insurance policy or qualified pension or retirement plan. If performance results included the effect of these additional charges, they would
be lower.
The Russell 2000 Value Index, an unmanaged index, tracks the performance of those Russell 2000 Index companies with lower price-to-bookratios and lower forecasted growth values.
Indices are not available for investment, are not professionally managed and do not reflect sales charges, fees, brokerage commissions, taxesor other expenses of investing. Securities in the Fund may not match those in an index.
Columbia Variable Portfolio — Small Cap Value Fund

3Annual Report 2012
Performance Overview (continued)
Performance of a Hypothetical $10,000 Investment (January 1, 2003 – December 31, 2012)
The chart above shows the change in value of a hypothetical $10,000 investment in Class 1 shares of Columbia Variable Portfolio — SmallCap Value Fund during the stated time period, and does not reflect the deduction of taxes, if any, that a shareholder may pay on Funddistributions or on the redemption of Fund shares. The returns also do not reflect fees and expenses imposed under your variable annuitycontract and/or variable life insurance policy or qualified pension or retirement plan, if any.
5,000
10,000
15,000
20,000
25,000
$30,000
$24,787$25,220
Columbia Variable Portfolio — Small Cap Value Fund Class 1 ($25,220)
Russell 2000 Value Index ($24,787)
12/1212/1112/1012/0912/0812/0712/0612/0512/0412/0301/01/03
Columbia Variable Portfolio — Small Cap Value Fund

4 Annual Report 2012
Manager Discussion of Fund Performance
For the 12-month period that ended December 31, 2012, the Fund’s Class 1shares returned 11.40%. The Fund underperformed its benchmark, theRussell 2000 Value Index, which returned 18.05% for the same time period. TheFund’s relative performance was affected by its positioning in high quality stockswith strong balance sheets and cash flow growth. During the year, lower qualitystocks drove performance in the small capitalization range. In particular, stockselection in the financials, consumer discretionary and industrials sectors of themarket hurt the Fund’s relative returns. This underperformance was partiallyoffset by strong results in the technology and health care sectors. An underweightto underperforming utility stocks also helped.
Positioning Hurt Relative Returns
In a market environment that favored riskier stocks, an emphasis on higher qualitynames restrained Fund performance. Stock selection in three sectors — financials,consumer discretionary, and industrials — detracted the most from overallperformance. An underweight allocation to real estate investment trusts (REITs)hurt, as REIT stocks benefited from declining interest rates. Holdings in the thrift,mortgage finance and capital markets subsectors disappointed, despite positivebusiness results. Capital markets operator INTL FC Stone declined in valuefollowing a competitor’s bankruptcy.
In the consumer discretionary area, an underweight position in homebuildershurt. We continue to believe the market has overestimated the pace of recovery inhomebuilding, and these stocks remain unattractive based on balance sheetfundamentals. Specialty retailers HH Gregg Appliances and Radio Shack alsohurt. We exited these stocks due to continued competitive industry pressures. Weretained a position in two underperforming consumer stocks: Rent-a-Center,which saw a pause in its stock price despite positive results, and Finish Line,which was hurt by a misperception that the running trend in athletic shoepurchases is over.
Within industrials, the Fund was hurt by not owning a benchmark name incommercial services and supplies, which saw strong performance upon itsconversion to a REIT. Other detractors included business printer ConsolidatedGraphics and Acco Brands, a supplier of branded office products. Slowing printtrends and the underperformance of a major competitor hurt the former, whilethe latter was affected by a slower than anticipated back-to-school season.
Technology and Health Care Names Aided Results
Among positive contributors was semiconductor chip maker Cymer, which wasacquired by a European conglomerate at an attractive premium. Significant cashflow generation helped new holding First Solar. Top health care performersincluded two firms that were acquired by European concerns: Kensey Nash andLincare. We sold medical sterilization company Cantel Medical when it reachedour price target. Disposable medical connection maker ICU Medical benefitedfrom increased use of IVs. An underweight in utilities also helped when thatsector underperformed the benchmark.
Positioned to Benefit from Slow Economic Growth
The U.S. economy has been growing at a slow pace, and we currently do notenvision that will change in 2013. We remain focused on finding high qualitynames that we believe will be rewarded by the market over longer periods. Going
Portfolio Management
Jeremy Javidi, CFA
John Barrett, CFA
Top Ten Holdings (%)
(at December 31, 2012)
Rent-A-Center, Inc. 1.0
OM Group, Inc. 1.0
Greif, Inc., Class A 0.9
Colonial Properties Trust 0.9
Helix Energy Solutions Group, Inc. 0.8
Hancock Holding Co. 0.8
Fresh Del Monte Produce, Inc. 0.8
IDACORP, Inc. 0.8
Minerals Technologies, Inc. 0.8
Argo Group International Holdings Ltd. 0.8
Percentages indicated are based upon totalinvestments (excluding Money MarketFunds).
For further detail about these holdings,please refer to the section entitled“Portfolio of Investments.”
Fund holdings are as of the date given, aresubject to change at any time, and are notrecommendations to buy or sell any security.
Columbia Variable Portfolio — Small Cap Value Fund

5Annual Report 2012
Manager Discussion of Fund Performance (continued)
forward, we are focused on finding quality stocks at attractive prices with growingcash flow and strong balance sheets that can benefit from a slow growthenvironment. In particular, we are seeking stocks that meet our criteria in thehealth care, industrial and energy sectors. The energy sector offers attractivevaluations due to its recent underperformance, and we believe the sector canbenefit from a stabilization of energy prices. We currently continue to emphasizehealth care names which are benefiting from the aging Baby Boom generation,increasing use of medical care and more advanced care techniques. We have alsoidentified several opportunities among undervalued industrials. We continue tolimit the portfolio’s exposure to REIT and specialty finance stocks because ofhigh valuations in those areas. We also presently maintain an underweight positionin consumer discretionary stocks and utilities, although we have slightly increasedour exposure to the latter.
Portfolio Breakdown (%)
(at December 31, 2012)
Common Stocks 98.9
Consumer Discretionary 11.0
Consumer Staples 3.2
Energy 8.4
Financials 30.4
Health Care 7.0
Industrials 15.4
Information Technology 11.7
Materials 6.0
Telecommunication Services 1.4
Utilities 4.4
Exchange-Traded Funds 0.4
Money Market Funds 0.7
Total 100.0
Percentages indicated are based upon totalinvestments. The Fund’s portfoliocomposition is subject to change.
Columbia Variable Portfolio — Small Cap Value Fund

6 Annual Report 2012
Columbia Massachusetts Intermediate Municipal Bond Fund
Understanding Your Fund’s Expenses(Unaudited)
As an investor, you incur ongoing costs, which generally include management fees, distribution and/or service (Rule 12b-1)fees, and other fund expenses. The following information is intended to help you understand your ongoing costs (in dollars)of investing in the Fund and to help you compare these costs with the ongoing costs of investing in other mutual funds.
The information below does not reflect fees and expenses imposed under your variable annuity contract and/or variable lifeinsurance policy (collectively, Contracts) or qualified pension and retirement plan (Qualified Plan), if any. The total fees andexpenses you bear may therefore be higher than those shown below.
Analyzing Your Fund’s Expenses
To illustrate these ongoing costs, we have provided examples and calculated the expenses paid by investors in each shareclass of the Fund during the period. The actual and hypothetical information in the table is based on an initial investment of$1,000 at the beginning of the period indicated and held for the entire period. Expense information is calculated two waysand each method provides you with different information. The amount listed in the “Actual” column is calculated using theFund’s actual operating expenses and total return for the period. You may use the Actual information, together with theamount invested, to estimate the expenses that you paid over the period. Simply divide your account value by $1,000 (forexample, an $8,600 account value divided by $1,000 = 8.6), then multiply the results by the expenses paid during the periodunder the Actual column. The amount listed in the “Hypothetical” column assumes a 5% annual rate of return beforeexpenses (which is not the Fund’s actual return) and then applies the Fund’s actual expense ratio for the period to thehypothetical return. You should not use the hypothetical account values and expenses to estimate either your actual accountbalance at the end of the period or the expenses you paid during the period. See “Compare With Other Funds” below fordetails on how to use the hypothetical data.
Compare With Other Funds
Since all mutual funds are required to include the same hypothetical calculations about expenses in shareholder reports, youcan use this information to compare the ongoing cost of investing in the Fund with other funds. To do so, compare thehypothetical example with the 5% hypothetical examples that appear in the shareholder reports of other funds. As youcompare hypothetical examples of other funds, it is important to note that hypothetical examples are meant to highlight theongoing costs of investing in a fund only and do not reflect any transaction costs, such as redemption or exchange fees, orexpenses that apply to the subaccount or the contract. Therefore, the hypothetical calculations are useful in comparingongoing costs only, and will not help you determine the relative total costs of owning different funds. If the fees andexpenses imposed under your Contract or Qualified Plan, if any, were included, your costs would be higher.
July 1, 2012 – December 31, 2012
Account Value at the Beginning Account Value at the End of the Expenses Paid During the Fund’s Annualized
of the Period ($) Period ($) Period ($) Expense Ratio (%)
Actual Hypothetical Actual Hypothetical Actual Hypothetical Actual
Class 1 1,000.00 1,000.00 1,080.70 1,020.83 4.63 4.49 0.88
Class 2 1,000.00 1,000.00 1,079.10 1,020.07 5.41 5.26 1.03
Expenses paid during the period are equal to the annualized expense ratio for each class as indicated above, multiplied by the averageaccount value over the period and then multiplied by the number of days in the Fund’s most recent fiscal half year and divided by 366.
Expenses do not include fees and expenses incurred indirectly by the Fund from the underlying funds in which the Fund may invest (also referredto as “acquired funds”), including affiliated and non-affiliated pooled investment vehicles (including mutual funds and exchange-traded funds).
Had Columbia Management Investment Advisers, LLC and/or certain of its affiliates not waived/reimbursed certain fees and expenses,account value at the end of the period would have been reduced.
Columbia Variable Portfolio — Small Cap Value Fund

7Annual Report 2012
Portfolio of InvestmentsDecember 31, 2012(Percentages represent value of investments compared to net assets)
Consumer Discretionary 11.1%
Auto Components 1.6%
Cooper Tire & Rubber Co. 83,660 2,121,617
Dana Holding Corp. 135,936 2,121,961
Gentherm, Inc.(a) 70,669 939,898
Total 5,183,476
Diversified Consumer Services 0.5%
Lincoln Educational Services Corp. 132,195 738,970
Universal Technical Institute, Inc. 67,641 679,116
Total 1,418,086
Hotels, Restaurants & Leisure 1.3%
Life Time Fitness, Inc.(a) 30,800 1,515,668
Red Robin Gourmet Burgers, Inc.(a) 35,024 1,235,997
WMS Industries, Inc.(a) 85,270 1,492,225
Total 4,243,890
Household Durables 0.3%
Cavco Industries, Inc.(a) 20,467 1,022,941
Specialty Retail 5.4%
Aaron’s, Inc. 59,090 1,671,065
Casual Male Retail Group, Inc.(a) 178,920 751,464
Finish Line, Inc., Class A (The) 97,370 1,843,214
GameStop Corp., Class A 69,626 1,746,916
Haverty Furniture Companies, Inc. 34,480 562,369
HOT Topic, Inc. 80,510 776,921
Men’s Wearhouse, Inc. (The) 70,741 2,204,290
Pier 1 Imports, Inc. 88,530 1,770,600
Rent-A-Center, Inc. 93,846 3,224,549
Shoe Carnival, Inc. 57,795 1,184,220
Stage Stores, Inc. 55,253 1,369,169
Total 17,104,777
Textiles, Apparel & Luxury Goods 2.0%
Crocs, Inc.(a) 106,150 1,527,498
Deckers Outdoor Corp.(a) 38,110 1,534,690
G-III Apparel Group Ltd.(a) 39,690 1,358,589
Steven Madden Ltd.(a) 45,480 1,922,439
Total 6,343,216
Total Consumer Discretionary 35,316,386
Columbia Variable Portfolio — Small Cap Value Fund
The accompanying Notes to Financial Statements are an integral part of this statement.
Common Stocks 99.1%
Issuer Shares Value ($)
Common Stocks (continued)
Issuer Shares Value ($)
Consumer Staples 3.2%
Food & Staples Retailing 1.3%
Andersons, Inc. (The) 28,850 1,237,665
Harris Teeter Supermarkets, Inc. 46,220 1,782,243
Spartan Stores, Inc. 67,217 1,032,453
Total 4,052,361
Food Products 1.6%
Chiquita Brands International, Inc.(a) 108,500 895,125
Darling International, Inc.(a) 108,310 1,737,293
Fresh Del Monte Produce, Inc. 99,529 2,622,589
Total 5,255,007
Personal Products 0.3%
Inter Parfums, Inc. 53,052 1,032,392
Total Consumer Staples 10,339,760
Energy 8.4%
Energy Equipment & Services 4.6%
Dawson Geophysical Co.(a) 38,105 1,005,210
Gulf Island Fabrication, Inc. 33,942 815,626
Helix Energy Solutions Group, Inc.(a) 127,910 2,640,062
Matrix Service Co.(a) 81,241 934,272
Newpark Resources, Inc.(a) 144,711 1,135,981
Patterson-UTI Energy, Inc. 106,830 1,990,243
RPC, Inc. 102,494 1,254,527
Tesco Corp.(a) 78,520 894,343
Tetra Technologies, Inc.(a) 129,196 980,598
TGC Industries, Inc. 120,091 983,545
Tidewater, Inc. 41,793 1,867,311
Total 14,501,718
Oil, Gas & Consumable Fuels 3.8%
Bill Barrett Corp.(a) 77,180 1,373,032
Cloud Peak Energy, Inc.(a) 98,220 1,898,592
Energy XXI Bermuda Ltd. 63,420 2,041,490
Gulfport Energy Corp.(a) 49,549 1,893,763
Rex Energy Corp.(a) 73,510 957,100
Stone Energy Corp.(a) 84,102 1,725,773
VAALCO Energy, Inc.(a) 165,260 1,429,499
Western Refining, Inc. 33,330 939,573
Total 12,258,822
Total Energy 26,760,540
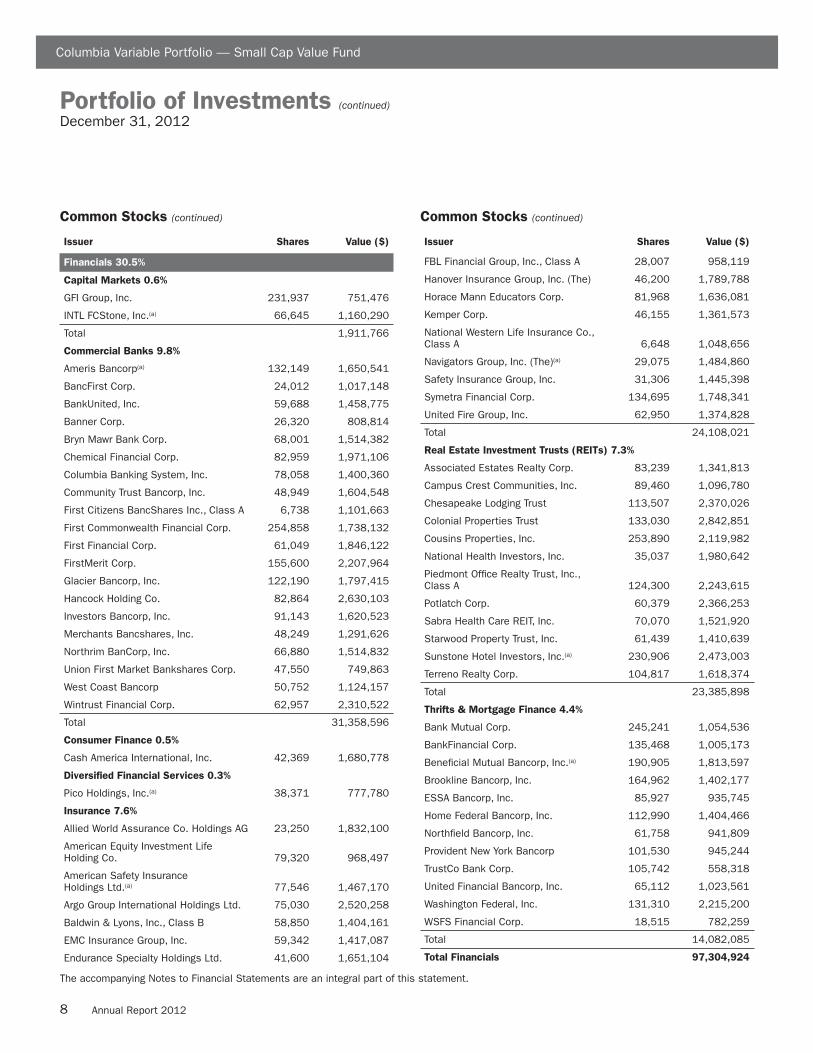
8 Annual Report 2012
Portfolio of Investments (continued)December 31, 2012
Financials 30.5%
Capital Markets 0.6%
GFI Group, Inc. 231,937 751,476
INTL FCStone, Inc.(a) 66,645 1,160,290
Total 1,911,766
Commercial Banks 9.8%
Ameris Bancorp(a) 132,149 1,650,541
BancFirst Corp. 24,012 1,017,148
BankUnited, Inc. 59,688 1,458,775
Banner Corp. 26,320 808,814
Bryn Mawr Bank Corp. 68,001 1,514,382
Chemical Financial Corp. 82,959 1,971,106
Columbia Banking System, Inc. 78,058 1,400,360
Community Trust Bancorp, Inc. 48,949 1,604,548
First Citizens BancShares Inc., Class A 6,738 1,101,663
First Commonwealth Financial Corp. 254,858 1,738,132
First Financial Corp. 61,049 1,846,122
FirstMerit Corp. 155,600 2,207,964
Glacier Bancorp, Inc. 122,190 1,797,415
Hancock Holding Co. 82,864 2,630,103
Investors Bancorp, Inc. 91,143 1,620,523
Merchants Bancshares, Inc. 48,249 1,291,626
Northrim BanCorp, Inc. 66,880 1,514,832
Union First Market Bankshares Corp. 47,550 749,863
West Coast Bancorp 50,752 1,124,157
Wintrust Financial Corp. 62,957 2,310,522
Total 31,358,596
Consumer Finance 0.5%
Cash America International, Inc. 42,369 1,680,778
Diversified Financial Services 0.3%
Pico Holdings, Inc.(a) 38,371 777,780
Insurance 7.6%
Allied World Assurance Co. Holdings AG 23,250 1,832,100
American Equity Investment Life Holding Co. 79,320 968,497
American Safety Insurance Holdings Ltd.(a) 77,546 1,467,170
Argo Group International Holdings Ltd. 75,030 2,520,258
Baldwin & Lyons, Inc., Class B 58,850 1,404,161
EMC Insurance Group, Inc. 59,342 1,417,087
Endurance Specialty Holdings Ltd. 41,600 1,651,104
Columbia Variable Portfolio — Small Cap Value Fund
The accompanying Notes to Financial Statements are an integral part of this statement.
Common Stocks (continued)
Issuer Shares Value ($)
Common Stocks (continued)
Issuer Shares Value ($)
FBL Financial Group, Inc., Class A 28,007 958,119
Hanover Insurance Group, Inc. (The) 46,200 1,789,788
Horace Mann Educators Corp. 81,968 1,636,081
Kemper Corp. 46,155 1,361,573
National Western Life Insurance Co., Class A 6,648 1,048,656
Navigators Group, Inc. (The)(a) 29,075 1,484,860
Safety Insurance Group, Inc. 31,306 1,445,398
Symetra Financial Corp. 134,695 1,748,341
United Fire Group, Inc. 62,950 1,374,828
Total 24,108,021
Real Estate Investment Trusts (REITs) 7.3%
Associated Estates Realty Corp. 83,239 1,341,813
Campus Crest Communities, Inc. 89,460 1,096,780
Chesapeake Lodging Trust 113,507 2,370,026
Colonial Properties Trust 133,030 2,842,851
Cousins Properties, Inc. 253,890 2,119,982
National Health Investors, Inc. 35,037 1,980,642
Piedmont Office Realty Trust, Inc., Class A 124,300 2,243,615
Potlatch Corp. 60,379 2,366,253
Sabra Health Care REIT, Inc. 70,070 1,521,920
Starwood Property Trust, Inc. 61,439 1,410,639
Sunstone Hotel Investors, Inc.(a) 230,906 2,473,003
Terreno Realty Corp. 104,817 1,618,374
Total 23,385,898
Thrifts & Mortgage Finance 4.4%
Bank Mutual Corp. 245,241 1,054,536
BankFinancial Corp. 135,468 1,005,173
Beneficial Mutual Bancorp, Inc.(a) 190,905 1,813,597
Brookline Bancorp, Inc. 164,962 1,402,177
ESSA Bancorp, Inc. 85,927 935,745
Home Federal Bancorp, Inc. 112,990 1,404,466
Northfield Bancorp, Inc. 61,758 941,809
Provident New York Bancorp 101,530 945,244
TrustCo Bank Corp. 105,742 558,318
United Financial Bancorp, Inc. 65,112 1,023,561
Washington Federal, Inc. 131,310 2,215,200
WSFS Financial Corp. 18,515 782,259
Total 14,082,085
Total Financials 97,304,924

9Annual Report 2012
Portfolio of Investments (continued)December 31, 2012
Health Care 7.0%
Biotechnology 0.2%
Dynavax Technologies Corp.(a) 205,245 587,001
Health Care Equipment & Supplies 2.2%
Angiodynamics, Inc.(a) 92,055 1,011,684
CONMED Corp. 62,530 1,747,713
ICU Medical, Inc.(a) 30,830 1,878,472
Orthofix International NV(a) 28,897 1,136,519
Quidel Corp.(a) 66,253 1,236,944
Total 7,011,332
Health Care Providers & Services 2.3%
Amsurg Corp.(a) 43,751 1,312,967
Centene Corp.(a) 39,640 1,625,240
Magellan Health Services, Inc.(a) 38,320 1,877,680
Molina Healthcare, Inc.(a) 52,710 1,426,333
Triple-S Management Corp., Class B(a) 50,074 924,867
Total 7,167,087
Pharmaceuticals 2.3%
Impax Laboratories, Inc.(a) 78,010 1,598,425
Jazz Pharmaceuticals PLC(a) 40,100 2,133,320
Questcor Pharmaceuticals, Inc. 46,770 1,249,694
Supernus Pharmaceuticals, Inc.(a) 64,817 464,738
Viropharma, Inc.(a) 89,390 2,034,517
Total 7,480,694
Total Health Care 22,246,114
Industrials 15.4%
Aerospace & Defense 0.9%
AAR Corp. 54,275 1,013,857
Curtiss-Wright Corp. 55,040 1,806,963
Total 2,820,820
Building Products 0.4%
Universal Forest Products, Inc. 38,020 1,446,281
Commercial Services & Supplies 2.1%
ABM Industries, Inc. 63,850 1,273,807
ACCO Brands Corp.(a) 190,011 1,394,681
Consolidated Graphics, Inc.(a) 29,226 1,020,572
Ennis, Inc. 50,692 784,205
Unifirst Corp. 30,760 2,255,323
Total 6,728,588
Columbia Variable Portfolio — Small Cap Value Fund
The accompanying Notes to Financial Statements are an integral part of this statement.
Common Stocks (continued)
Issuer Shares Value ($)
Common Stocks (continued)
Issuer Shares Value ($)
Construction & Engineering 1.1%
Comfort Systems U.S.A., Inc. 83,013 1,009,438
KHD Humboldt Wedag International AG 69,805 432,225
Layne Christensen Co.(a) 36,292 880,807
Pike Electric Corp.(a) 37,373 356,912
Sterling Construction Co., Inc.(a) 69,076 686,615
Total 3,365,997
Electrical Equipment 2.9%
Belden, Inc. 48,638 2,188,224
Brady Corp., Class A 66,900 2,234,460
EnerSys, Inc.(a) 52,432 1,973,016
GrafTech International Ltd.(a) 171,479 1,610,188
Powell Industries, Inc.(a) 27,885 1,158,064
Total 9,163,952
Machinery 6.3%
Albany International Corp., Class A 61,031 1,384,183
Altra Holdings, Inc. 49,187 1,084,573
Astec Industries, Inc.(a) 41,279 1,375,829
Briggs & Stratton Corp. 80,281 1,692,324
CIRCOR International, Inc. 36,280 1,436,325
Dynamic Materials Corp. 41,087 571,109
EnPro Industries, Inc.(a) 33,696 1,378,166
FreightCar America, Inc. 37,761 846,602
Gorman-Rupp Co. 19,780 590,037
Harsco Corp. 55,044 1,293,534
ITT Corp. 76,810 1,801,963
Kadant, Inc.(a) 40,776 1,080,972
LB Foster Co., Class A 35,069 1,523,397
Mueller Industries, Inc. 37,584 1,880,328
Titan International, Inc. 65,310 1,418,533
Twin Disc, Inc. 49,268 858,741
Total 20,216,616
Professional Services 0.4%
Korn/Ferry International(a) 76,224 1,208,913
Road & Rail 1.0%
Heartland Express, Inc. 105,533 1,379,316
Werner Enterprises, Inc. 88,908 1,926,637
Total 3,305,953
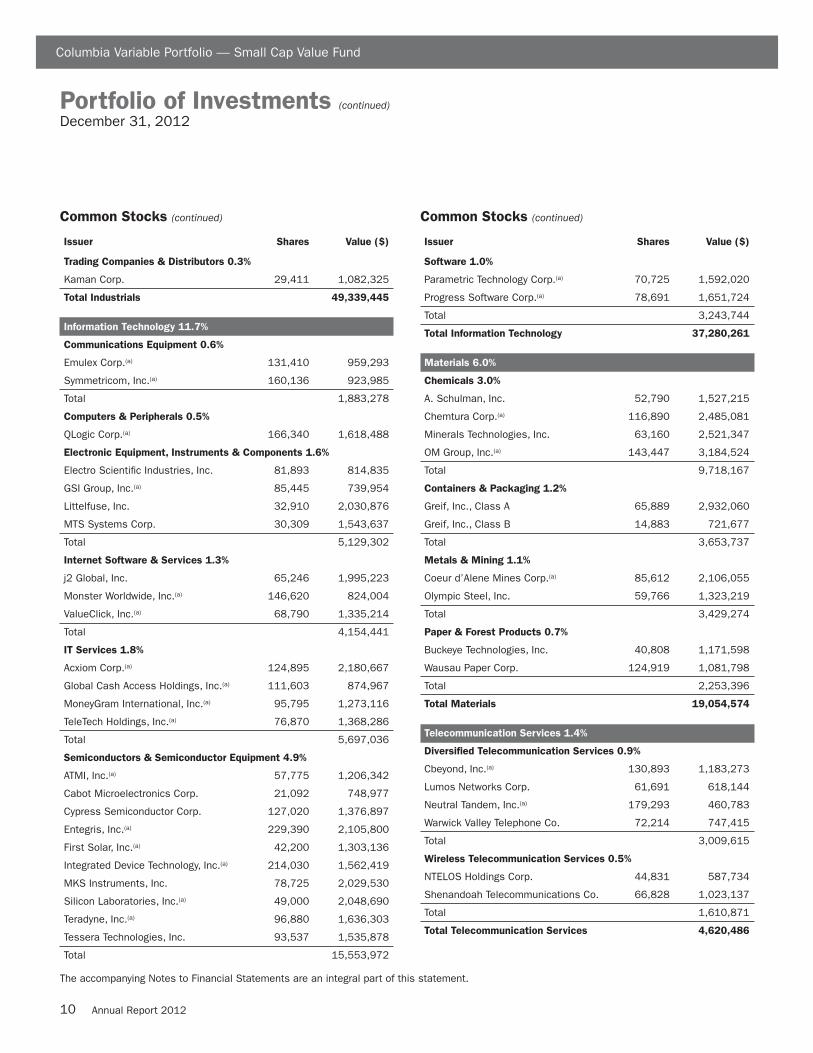
10 Annual Report 2012
Portfolio of Investments (continued)December 31, 2012
Trading Companies & Distributors 0.3%
Kaman Corp. 29,411 1,082,325
Total Industrials 49,339,445
Information Technology 11.7%
Communications Equipment 0.6%
Emulex Corp.(a) 131,410 959,293
Symmetricom, Inc.(a) 160,136 923,985
Total 1,883,278
Computers & Peripherals 0.5%
QLogic Corp.(a) 166,340 1,618,488
Electronic Equipment, Instruments & Components 1.6%
Electro Scientific Industries, Inc. 81,893 814,835
GSI Group, Inc.(a) 85,445 739,954
Littelfuse, Inc. 32,910 2,030,876
MTS Systems Corp. 30,309 1,543,637
Total 5,129,302
Internet Software & Services 1.3%
j2 Global, Inc. 65,246 1,995,223
Monster Worldwide, Inc.(a) 146,620 824,004
ValueClick, Inc.(a) 68,790 1,335,214
Total 4,154,441
IT Services 1.8%
Acxiom Corp.(a) 124,895 2,180,667
Global Cash Access Holdings, Inc.(a) 111,603 874,967
MoneyGram International, Inc.(a) 95,795 1,273,116
TeleTech Holdings, Inc.(a) 76,870 1,368,286
Total 5,697,036
Semiconductors & Semiconductor Equipment 4.9%
ATMI, Inc.(a) 57,775 1,206,342
Cabot Microelectronics Corp. 21,092 748,977
Cypress Semiconductor Corp. 127,020 1,376,897
Entegris, Inc.(a) 229,390 2,105,800
First Solar, Inc.(a) 42,200 1,303,136
Integrated Device Technology, Inc.(a) 214,030 1,562,419
MKS Instruments, Inc. 78,725 2,029,530
Silicon Laboratories, Inc.(a) 49,000 2,048,690
Teradyne, Inc.(a) 96,880 1,636,303
Tessera Technologies, Inc. 93,537 1,535,878
Total 15,553,972
Columbia Variable Portfolio — Small Cap Value Fund
The accompanying Notes to Financial Statements are an integral part of this statement.
Common Stocks (continued)
Issuer Shares Value ($)
Common Stocks (continued)
Issuer Shares Value ($)
Software 1.0%
Parametric Technology Corp.(a) 70,725 1,592,020
Progress Software Corp.(a) 78,691 1,651,724
Total 3,243,744
Total Information Technology 37,280,261
Materials 6.0%
Chemicals 3.0%
A. Schulman, Inc. 52,790 1,527,215
Chemtura Corp.(a) 116,890 2,485,081
Minerals Technologies, Inc. 63,160 2,521,347
OM Group, Inc.(a) 143,447 3,184,524
Total 9,718,167
Containers & Packaging 1.2%
Greif, Inc., Class A 65,889 2,932,060
Greif, Inc., Class B 14,883 721,677
Total 3,653,737
Metals & Mining 1.1%
Coeur d’Alene Mines Corp.(a) 85,612 2,106,055
Olympic Steel, Inc. 59,766 1,323,219
Total 3,429,274
Paper & Forest Products 0.7%
Buckeye Technologies, Inc. 40,808 1,171,598
Wausau Paper Corp. 124,919 1,081,798
Total 2,253,396
Total Materials 19,054,574
Telecommunication Services 1.4%
Diversified Telecommunication Services 0.9%
Cbeyond, Inc.(a) 130,893 1,183,273
Lumos Networks Corp. 61,691 618,144
Neutral Tandem, Inc.(a) 179,293 460,783
Warwick Valley Telephone Co. 72,214 747,415
Total 3,009,615
Wireless Telecommunication Services 0.5%
NTELOS Holdings Corp. 44,831 587,734
Shenandoah Telecommunications Co. 66,828 1,023,137
Total 1,610,871
Total Telecommunication Services 4,620,486

11Annual Report 2012
Portfolio of Investments (continued)December 31, 2012
Utilities 4.4%
Electric Utilities 3.0%
Allete, Inc. 59,419 2,434,990
IDACORP, Inc. 59,680 2,587,128
MGE Energy, Inc. 40,697 2,073,512
Portland General Electric Co. 91,005 2,489,897
Total 9,585,527
Gas Utilities 1.4%
Laclede Group, Inc. (The) 53,091 2,049,844
Southwest Gas Corp. 57,671 2,445,827
Total 4,495,671
Total Utilities 14,081,198
Total Common Stocks
(Cost: $306,994,325) 316,343,688
Columbia Variable Portfolio — Small Cap Value Fund
The accompanying Notes to Financial Statements are an integral part of this statement.
Common Stocks (continued)
Issuer Shares Value ($)
Exchange-Traded Funds 0.3%
Shares Value ($)
iShares Russell 2000 Value Index Fund 14,940 1,128,120
Total Exchange-Traded Funds
(Cost: $1,085,700) 1,128,120
Money Market Funds 0.7%
Columbia Short-Term Cash Fund, 0.142%(b)(c) 2,182,116 2,182,116
Total Money Market Funds
(Cost: $2,182,116) 2,182,116
Total Investments
(Cost: $310,262,141) 319,653,924
Other Assets & Liabilities, Net (458,812)
Net Assets 319,195,112
Notes to Portfolio of Investments
(a) Non-income producing.
(b) The rate shown is the seven-day current annualized yield at December 31, 2012.
(c) As defined in the Investment Company Act of 1940, an affiliated company is one in which the Fund owns 5% or more of its outstandingvoting securities, or a company which is under common ownership or control with the Fund. Holdings and transactions in these affiliatedcompanies during the year ended December 31, 2012, are as follows:
Dividends
Beginning Purchase Proceeds Realized Ending or Interest
Issuer Cost ($) Cost ($) From Sales ($) Gain/Loss ($) Cost ($) Income ($) Value ($)
Columbia Short-Term Cash Fund — 52,419,067 (50,236,951) — 2,182,116 2,404 2,182,116
Fair Value Measurements
Generally accepted accounting principles (GAAP) require disclosure regarding the inputs and valuation techniques used to measure fair valueand any changes in valuation inputs or techniques. In addition, investments shall be disclosed by major category.
The Fund categorizes its fair value measurements according to a three-level hierarchy that maximizes the use of observable inputs andminimizes the use of unobservable inputs by prioritizing that the most observable input be used when available. Observable inputs are thosethat market participants would use in pricing an investment based on market data obtained from sources independent of the reporting entity.Unobservable inputs are those that reflect the Fund’s assumptions about the information market participants would use in pricing aninvestment. An investment’s level within the fair value hierarchy is based on the lowest level of any input that is deemed significant to theasset or liability’s fair value measurement. The input levels are not necessarily an indication of the risk or liquidity associated withinvestments at that level. For example, certain U.S. government securities are generally high quality and liquid, however, they are reflected asLevel 2 because the inputs used to determine fair value may not always be quoted prices in an active market.
Fair value inputs are summarized in the three broad levels listed below:
> Level 1 — Valuations based on quoted prices for investments in active markets that the Fund has the ability to access at themeasurement date (including NAV for open-end mutual funds). Valuation adjustments are not applied to Level 1 investments.
> Level 2 — Valuations based on other significant observable inputs (including quoted prices for similar securities, interest rates,prepayment speeds, credit risks, etc.).

12 Annual Report 2012
Portfolio of Investments (continued)December 31, 2012
Fair Value Measurements (continued)
> Level 3 — Valuations based on significant unobservable inputs (including the Fund’s own assumptions and judgment in determining thefair value of investments).
Inputs that are used in determining fair value of an investment may include price information, credit data, volatility statistics, and otherfactors. These inputs can be either observable or unobservable. The availability of observable inputs can vary between investments, and isaffected by various factors such as the type of investment, and the volume and level of activity for that investment or similar investments inthe marketplace. The inputs will be considered by the Investment Manager, along with any other relevant factors in the calculation of aninvestment’s fair value. The Fund uses prices and inputs that are current as of the measurement date, which may include periods of marketdislocations. During these periods, the availability of prices and inputs may be reduced for many investments. This condition could cause aninvestment to be reclassified between the various levels within the hierarchy.
Foreign equity securities actively traded in markets where there is a significant delay in the local close relative to the New York StockExchange (NYSE) are classified as Level 2. The values of these securities may include an adjustment to reflect the impact of significantmarket movements following the close of local trading, as described in Note 2 to the financial statements — Security Valuation.
Investments falling into the Level 3 category are primarily supported by quoted prices from brokers and dealers participating in the market forthose investments. However, these may be classified as Level 3 investments due to lack of market transparency and corroboration to supportthese quoted prices. Additionally, valuation models may be used as the pricing source for any remaining investments classified as Level 3.These models rely on one or more significant unobservable inputs and/or significant assumptions by the Investment Manager. Inputs used invaluations may include, but are not limited to, financial statement analysis, capital account balances, discount rates and estimated cashflows, and comparable company data.
Under the direction of the Fund’s Board of Trustees (the Board), the Investment Manager’s Valuation Committee (the Committee) isresponsible for carrying out the valuation procedures approved by the Board. The Committee consists of voting and non-voting members fromvarious groups within the Investment Manager’s organization, including operations and accounting, trading and investments, compliance, riskmanagement and legal.
The Committee meets at least monthly to review and approve valuation matters, which may include a description of specific valuationdeterminations, data regarding pricing information received from approved pricing vendors and brokers and the results of Board-approvedvaluation control policies and procedures (the Policies). The Policies address, among other things, instances when market quotations arereadily available, including recommendations of third party pricing vendors and a determination of appropriate pricing methodologies; eventsthat require specific valuation determinations and assessment of fair value techniques; securities with a potential for stale pricing, includingthose that are illiquid, restricted, or in default; and the effectiveness of third-party pricing vendors, including periodic reviews of vendors. TheCommittee meets more frequently, as needed, to discuss additional valuation matters, which may include the need to review back-testingresults, review time-sensitive information or approve related valuation actions. The Committee reports to the Board, with members of theCommittee meeting with the Board at each of its regularly scheduled meetings to discuss valuation matters and actions during the period,similar to those described earlier.
For investments categorized as Level 3, the Committee monitors information similar to that described above, which may include: (i) dataspecific to the issuer or comparable issuers, (ii) general market or specific sector news and (iii) quoted prices and specific or similar securitytransactions. The Committee considers this data and any changes from prior periods in order to assess the reasonableness of observableand unobservable inputs, any assumptions or internal models used to value those securities and changes in fair value. This data is also usedto corroborate, when available, information received from approved pricing vendors and brokers. Various factors impact the frequency ofmonitoring this information (which may occur as often as daily). However, the Committee may determine that changes to inputs, assumptionsand models are not required as a result of the monitoring procedures performed.
Columbia Variable Portfolio — Small Cap Value Fund
The accompanying Notes to Financial Statements are an integral part of this statement.

13Annual Report 2012
Portfolio of Investments (continued)December 31, 2012
Fair Value Measurements (continued)
The following table is a summary of the inputs used to value the Fund’s investments at December 31, 2012:
Level 1
Quoted Prices in Active Level 2 Level 3
Markets for Identical Other Significant Significant
Description Assets ($) Observable Inputs ($) Unobservable Inputs ($) Total ($)
Equity Securities
Common Stocks
Consumer Discretionary 35,316,386 — — 35,316,386
Consumer Staples 10,339,760 — — 10,339,760
Energy 26,760,540 — — 26,760,540
Financials 97,304,924 — — 97,304,924
Health Care 22,246,114 — — 22,246,114
Industrials 48,907,220 432,225 — 49,339,445
Information Technology 37,280,261 — — 37,280,261
Materials 19,054,574 — — 19,054,574
Telecommunication Services 4,620,486 — — 4,620,486
Utilities 14,081,198 — — 14,081,198
Exchange-Traded Funds 1,128,120 — — 1,128,120
Total Equity Securities 317,039,583 432,225 — 317,471,808
Other
Money Market Funds 2,182,116 — — 2,182,116
Total Other 2,182,116 — — 2,182,116
Total 319,221,699 432,225 — 319,653,924
See the Portfolio of Investments for all investment classifications not indicated in the table.
The Fund’s assets assigned to the Level 2 input category are generally valued using the market approach, in which a security’s value isdetermined through reference to prices and information from market transactions for similar or identical assets. These assets include certainforeign securities for which a third party statistical pricing service may be employed for purposes of fair market valuation. The models utilizedby the third party statistical pricing service take into account a security’s correlation to available market data including, but not limited to,intraday index, ADR, and ETF movements.
There were no transfers of financial assets between Levels 1 and 2 during the period.
Columbia Variable Portfolio — Small Cap Value Fund
The accompanying Notes to Financial Statements are an integral part of this statement.

14 Annual Report 2012
Statement of Assets and LiabilitiesDecember 31, 2012
Columbia Variable Portfolio — Small Cap Value Fund
The accompanying Notes to Financial Statements are an integral part of this statement.
Assets
Investments, at value
Unaffiliated issuers (identified cost $308,080,025) $317,471,808
Affiliated issuers (identified cost $2,182,116) 2,182,116
Total investments (identified cost $310,262,141) 319,653,924
Receivable for:
Investments sold 974,221
Capital shares sold 330,368
Dividends 281,231
Reclaims 112
Expense reimbursement due from Investment Manager 77,241
Prepaid expenses 2,735
Trustees’ deferred compensation plan 39,809
Total assets 321,359,641
Liabilities
Payable for:
Investments purchased 1,663,236
Capital shares purchased 80,109
Investment management fees 209,297
Distribution and/or service fees 61,958
Transfer agent fees 15,896
Administration fees 21,195
Compensation of board members 239
Chief compliance officer expenses 66
Other expenses 72,724
Trustees’ deferred compensation plan 39,809
Total liabilities 2,164,529
Net assets applicable to outstanding capital stock $319,195,112
Represented by
Paid-in capital $309,081,975
Undistributed net investment income 3,372,093
Accumulated net realized loss (2,650,741)
Unrealized appreciation (depreciation) on:
Investments 9,391,783
Foreign currency translations 2
Total — representing net assets applicable to outstanding capital stock $319,195,112

15Annual Report 2012
Statement of Assets and Liabilities (continued)December 31, 2012
Columbia Variable Portfolio — Small Cap Value Fund
The accompanying Notes to Financial Statements are an integral part of this statement.
Class 1
Net assets $20,532,087
Shares outstanding 1,332,522
Net asset value per share $15.41
Class 2
Net assets $298,663,025
Shares outstanding 19,442,320
Net asset value per share $15.36

16 Annual Report 2012
Statement of OperationsYear Ended December 31, 2012
Columbia Variable Portfolio — Small Cap Value Fund
The accompanying Notes to Financial Statements are an integral part of this statement.
Net investment income
Income:Dividends — unaffiliated issuers $5,890,241Dividends — affiliated issuers 2,404Interest 1,435Income from securities lending — net 93,254Foreign taxes withheld (179)
Total income 5,987,155
Expenses:Investment management fees 2,411,918Distribution and/or service fees
Class 2 707,310Transfer agent fees
Class 1 13,429Class 2 169,750
Administration fees 244,246Compensation of board members 28,541Custodian fees 29,701Printing and postage fees 113,980Professional fees 27,660Chief compliance officer expenses 218Other 8,417
Total expenses 3,755,170Fees waived or expenses reimbursed by Investment Manager and its affiliates (644,017)Total net expenses 3,111,153Net investment income 2,876,002
Realized and unrealized gain (loss) — net
Net realized gain (loss) on:Investments (2,463,510)Foreign currency translations (76)
Net realized loss (2,463,586)Net change in unrealized appreciation (depreciation) on:
Investments 32,482,484Foreign currency translations 2
Net change in unrealized appreciation (depreciation) 32,482,486Net realized and unrealized gain 30,018,900
Net increase in net assets resulting from operations $32,894,902

17Annual Report 2012
Statement of Changes in Net Assets
Columbia Variable Portfolio — Small Cap Value Fund
The accompanying Notes to Financial Statements are an integral part of this statement.
Year Ended Year Ended
December 31, December 31,
2012 2011
Operations
Net investment income $2,876,002 $1,910,727
Net realized gain (loss) (2,463,586) 18,218,029
Net change in unrealized appreciation (depreciation) 32,482,486 (38,777,364)
Net increase (decrease) in net assets resulting from operations 32,894,902 (18,648,608)
Distributions to shareholders
Net investment income
Class 1 (92,472) (273,258)
Class 2 (812,331) (2,467,512)
Net realized gains
Class 1 (957,894) (2,997,112)
Class 2 (13,057,096) (30,090,661)
Total distributions to shareholders (14,919,793) (35,828,543)
Increase (decrease) in net assets from capital stock activity 9,989,516 22,578,988
Total increase (decrease) in net assets 27,964,625 (31,898,163)
Net assets at beginning of year 291,230,487 323,128,650
Net assets at end of year $319,195,112 $291,230,487
Undistributed net investment income $3,372,093 $1,454,759

18 Annual Report 2012
Statement of Changes in Net Assets (continued)
Columbia Variable Portfolio — Small Cap Value Fund
The accompanying Notes to Financial Statements are an integral part of this statement.
Year Ended December 31, 2012 Year Ended December 31, 2011
Shares Dollars ($) Shares Dollars ($)
Capital stock activity
Class 1 shares
Subscriptions 122,293 1,852,356 189,593 2,913,927
Distributions reinvested 74,126 1,050,365 210,043 3,270,370
Redemptions (581,889) (9,007,152) (366,352) (5,753,027)
Net increase (decrease) (385,470) (6,104,431) 33,284 431,270
Class 2 shares
Subscriptions 2,413,047 36,162,495 2,086,024 32,820,780
Distributions reinvested 980,865 13,869,426 2,096,470 32,558,173
Redemptions (2,257,004) (33,937,974) (2,665,419) (43,231,235)
Net increase 1,136,908 16,093,947 1,517,075 22,147,718
Total net increase 751,438 9,989,516 1,550,359 22,578,988

19Annual Report 2012
Financial Highlights
Columbia Variable Portfolio — Small Cap Value Fund
The accompanying Notes to Financial Statements are an integral part of this statement.
The following tables are intended to help you understand the Fund’s financial performance. Certain information reflectsfinancial results for a single share of a class held for the periods shown. Per share net investment income (loss) amounts arecalculated based on average shares outstanding during the period. Total return assumes reinvestment of all dividends anddistributions. Total return does not reflect payment of the expenses that apply to the variable accounts or contract charges, ifany, and are not annualized for periods of less than one year.
Year Ended December 31,
Class 1 2012 2011 2010 2009 2008
Per share data
Net asset value, beginning of period $14.59 $17.53 $14.01 $11.35 $18.08
Income from investment operations:
Net investment income 0.16 0.12 0.13 0.12 0.17
Net realized and unrealized gain (loss) 1.44 (1.04) 3.58 2.70 (4.79)
Total from investment operations 1.60 (0.92) 3.71 2.82 (4.62)
Less distributions to shareholders:
Net investment income (0.07) (0.17) (0.19) (0.14) (0.12)
Net realized gains (0.71) (1.85) — (0.02) (1.99)
Total distributions to shareholders (0.78) (2.02) (0.19) (0.16) (2.11)
Net asset value, end of period $15.41 $14.59 $17.53 $14.01 $11.35
Total return 11.40% (5.96%) 26.75% 25.16% (28.02%)
Ratios to average net assets(a)(b)
Total gross expenses 1.00% 0.98%(c) 0.93%(c) 0.92% 0.89%(c)
Total net expenses(d) 0.88% 0.90%(c) 0.93%(c)(e)(f) 0.92%(f) 0.89%(c)(f)
Net investment income 1.06% 0.76% 0.85% 0.99% 1.16%
Supplemental data
Net assets, end of period (in thousands) $20,532 $25,058 $29,529 $23,538 $19,357
Portfolio turnover 49% 32% 39% 43% 48%
Notes to Financial Highlights
(a) In addition to the fees and expenses which the Fund bears directly, the Fund indirectly bears a pro rata share of the fees and expenses ofthe acquired funds in which it invests. Such indirect expenses are not included in the reported expense ratios.
(b) Certain line items from prior years have been reclassified to conform to the current presentation.
(c) Includes interest expense which rounds to less than 0.01%.
(d) Total net expenses include the impact of certain waivers/reimbursements made by the Investment Manager and certain of its affiliates, ifapplicable.
(e) The Investment Manager reimbursed interest expense which had an impact of less than 0.01%.
(f) The benefits derived from expense reductions had an impact of less than 0.01%.

20 Annual Report 2012
Financial Highlights (continued)
Columbia Variable Portfolio — Small Cap Value Fund
The accompanying Notes to Financial Statements are an integral part of this statement.
Year Ended December 31,
Class 2 2012 2011 2010 2009 2008
Per share data
Net asset value, beginning of period $14.54 $17.49 $13.98 $11.31 $18.01
Income from investment operations:
Net investment income 0.14 0.10 0.09 0.10 0.13
Net realized and unrealized gain (loss) 1.43 (1.04) 3.58 2.70 (4.77)
Total from investment operations 1.57 (0.94) 3.67 2.80 (4.64)
Less distributions to shareholders:
Net investment income (0.04) (0.16) (0.16) (0.11) (0.07)
Net realized gains (0.71) (1.85) — (0.02) (1.99)
Total distributions to shareholders (0.75) (2.01) (0.16) (0.13) (2.06)
Net asset value, end of period $15.36 $14.54 $17.49 $13.98 $11.31
Total return 11.25% (6.13%) 26.46% 25.00% (28.15%)
Ratios to average net assets(a)(b)
Total gross expenses 1.25% 1.23%(c) 1.18%(c) 1.17% 1.14%(c)
Total net expenses(d) 1.03% 1.05%(c) 1.10%(c)(e)(f) 1.10%(f) 1.10%(c)(f)
Net investment income 0.93% 0.61% 0.61% 0.81% 0.83%
Supplemental data
Net assets, end of period (in thousands) $298,663 $266,172 $293,600 $436,346 $314,060
Portfolio turnover 49% 32% 39% 43% 48%
Notes to Financial Highlights
(a) In addition to the fees and expenses which the Fund bears directly, the Fund indirectly bears a pro rata share of the fees and expenses ofthe acquired funds in which it invests. Such indirect expenses are not included in the reported expense ratios.
(b) Certain line items from prior years have been reclassified to conform to the current presentation.
(c) Includes interest expense which rounds to less than 0.01%.
(d) Total net expenses include the impact of certain waivers/reimbursements made by the Investment Manager and certain of its affiliates, ifapplicable.
(e) The Investment Manager reimbursed interest expense which had an impact of less than 0.01%.
(f) The benefits derived from expense reductions had an impact of less than 0.01%.

21Annual Report 2012
Notes to Financial StatementsDecember 31, 2012
Note 1. Organization
Columbia Variable Portfolio — Small Cap Value Fund (theFund), a series of Columbia Funds Variable Insurance Trust(the Trust), is a diversified fund. The Trust is registered underthe Investment Company Act of 1940, as amended (the1940 Act), as an open-end management investment companyorganized as a Massachusetts business trust.
Fund Shares
The Trust may issue an unlimited number of shares (withoutpar value). The Fund offers Class 1 and Class 2 shares toseparate accounts funding variable annuity contracts andvariable life insurance policies (collectively, Contracts) issuedby affiliated and unaffiliated life insurance companies as wellas qualified pension and retirement plans (Qualified Plans)and other qualified institutional investors authorized byColumbia Management Investment Distributors, Inc. (theDistributor). You may not buy (nor will you own) shares of theFund directly. You invest by participating in a Qualified Planor buying a Contract and making allocations to the Fund. Allshare classes have identical voting, dividend and liquidationrights. Each share class has its own expense structure.
Note 2. Summary of Significant
Accounting Policies
Use of Estimates
The preparation of financial statements in accordance withU.S. generally accepted accounting principles (GAAP)requires management to make certain estimates andassumptions that affect the reported amounts of assets andliabilities, the disclosure of contingent assets and liabilities atthe date of the financial statements and the reported amountsof revenue and expenses during the reporting period. Actualresults could differ from those estimates.
The following is a summary of significant accounting policiesconsistently followed by the Fund in the preparation of itsfinancial statements.
Security Valuation
All equity securities are valued at the close of business of theNew York Stock Exchange (NYSE). Equity securities arevalued at the last quoted sales price on the principal exchangeor market on which they trade, except for securities traded onthe NASDAQ Stock Market, which are valued at theNASDAQ official close price. Unlisted securities or listedsecurities for which there were no sales during the day arevalued at the mean of the latest quoted bid and ask prices onsuch exchanges or markets.
Foreign securities are valued based on quotations from theprincipal market in which such securities are normally traded.
If any foreign share prices are not readily available as a resultof limited share activity the securities are valued at the meanof the latest quoted bid and ask prices on such exchanges ormarkets. Foreign currency exchange rates are generallydetermined at 4:00 p.m. Eastern (U.S.) time. However, manysecurities markets and exchanges outside the U.S. close priorto the close of the NYSE; therefore, the closing prices forsecurities in such markets or on such exchanges may not fullyreflect events that occur after such close but before the closeof the NYSE. In those situations, foreign securities will be fairvalued pursuant to the policy adopted by the Board of Trustees(the Board), including utilizing a third party pricing service todetermine these fair values. The third party pricing servicetakes into account multiple factors, including, but not limitedto, movements in the U.S. securities markets, certaindepositary receipts, futures contracts and foreign exchangerates that have occurred subsequent to the close of the foreignexchange or market, to determine a good faith estimate thatreasonably reflects the current market conditions as of theclose of the NYSE. The fair value of a security is likely to bedifferent from the quoted or published price, if available.
Investments in other open-end investment companies,including money market funds, are valued at net asset value.
Investments for which market quotations are not readilyavailable, or that have quotations which management believesare not reliable, are valued at fair value as determined in goodfaith under consistently applied procedures established by andunder the general supervision of the Board. If a security orclass of securities (such as foreign securities) is valued at fairvalue, such value is likely to be different from the last quotedmarket price for the security.
The determination of fair value often requires significantjudgment. To determine fair value, management may useassumptions including but not limited to future cash flows andestimated risk premiums. Multiple inputs from various sourcesmay be used to determine fair value.
Foreign Currency Transactions and Translations
The values of all assets and liabilities denominated in foreigncurrencies are translated into U.S. dollars at that day’sexchange rates. Net realized and unrealized gains (losses) onforeign currency transactions and translations include gains(losses) arising from the fluctuation in exchange rates betweentrade and settlement dates on securities transactions, gains(losses) arising from the disposition of foreign currency andcurrency gains (losses) between the accrual and payment dateson dividends, interest income and foreign withholding taxes.
For financial statement purposes, the Fund does notdistinguish that portion of gains (losses) on investments whichis due to changes in foreign exchange rates from that which is
Columbia Variable Portfolio — Small Cap Value Fund

22 Annual Report 2012
Notes to Financial Statements (continued)December 31, 2012
due to changes in market prices of the investments. Suchfluctuations are included with the net realized and unrealizedgains (losses) on investments in the Statement of Operations.
Repurchase Agreements
The Fund may engage in repurchase agreement transactionswith institutions that management has determined arecreditworthy. The Fund, through the custodian, receivesdelivery of the underlying securities collateralizing arepurchase agreement. Management is responsible fordetermining that the collateral is at least equal, at all times, tothe value of the repurchase obligation including interest. Arepurchase agreement transaction involves certain risks in theevent of default or insolvency of the counterparty. These risksinclude possible delays in or restrictions on the Fund’s abilityto dispose of the underlying securities and a possible declinein the value of the underlying securities during the periodwhile the Fund seeks to assert its rights.
Security Transactions
Security transactions are accounted for on the trade date. Costis determined and gains (losses) are based upon the specificidentification method for both financial statement and federalincome tax purposes.
Income Recognition
Corporate actions and dividend income are recorded net ofany non-reclaimable tax withholdings, on the ex-dividend dateor upon receipt of ex-dividend notification in the case ofcertain foreign securities.
Interest income is recorded on an accrual basis.
The Fund may receive distributions from holdings in businessdevelopment companies (BDCs), exchange traded funds(ETFs) and real estate investment trusts (REITs), which reportinformation on the character of their distributions annually.These distributions are allocated to dividend income, capitalgain and return of capital based on estimates made by theFund’s management if actual information has not yet beenreported. Return of capital is recorded as a reduction of thecost basis of securities held. If the Fund no longer owns theapplicable securities, return of capital is recorded as realizedgain. Management’s estimates are subsequently adjusted whenthe actual character of the distributions is disclosed by theBDCs, ETFs and REITs, which could result in a proportionatechange in return of capital to shareholders.
Awards from class action litigation are recorded as a reductionof cost basis if the Fund still owns the applicable securities onthe payment date. If the Fund no longer owns the applicablesecurities, the proceeds are recorded as realized gains.
Expenses
General expenses of the Trust are allocated to the Fund andother funds of the Trust based upon relative net assets or otherexpense allocation methodologies determined by the nature ofthe expense. Expenses directly attributable to the Fund arecharged to the Fund. Expenses directly attributable to aspecific class of shares are charged to that share class.
Determination of Class Net Asset Value
All income, expenses (other than class-specific expenses,which are charged to that share class, as shown in theStatement of Operations) and realized and unrealized gains(losses) are allocated to each class of the Fund on a dailybasis, based on the relative net assets of each class, forpurposes of determining the net asset value of each class.
Federal Income Tax Status
The Fund intends to qualify each year as a regulatedinvestment company under Subchapter M of the InternalRevenue Code, as amended, and will distribute substantiallyall of its taxable income, if any, for its tax year, and as suchwill not be subject to federal income taxes. In addition,because the Fund’s sole shareholders are Qualified Investors,the Fund expects not to be subject to federal excise tax.Therefore, no federal income or excise tax provision isrecorded.
Distributions to Subaccounts
Distributions from net investment income, if any, are declaredand paid annually. Net realized capital gains, if any, aredistributed along with the income distribution. Incomedistributions and capital gain distributions are determined inaccordance with federal income tax regulations, which maydiffer from GAAP. All dividends and distributions arereinvested in additional shares of the applicable class of theFund at net asset value as of the ex-dividend date of thedistribution.
Guarantees and Indemnifications
Under the Trust’s organizational documents and, in somecases, by contract, its officers and trustees are indemnifiedagainst certain liabilities arising out of the performance oftheir duties to the Trust or its funds. In addition, certain of theFund’s contracts with its service providers contain generalindemnification clauses. The Fund’s maximum exposureunder these arrangements is unknown since the amount of anyfuture claims that may be made against the Fund cannot bedetermined, and the Fund has no historical basis for predictingthe likelihood of any such claims.
Columbia Variable Portfolio — Small Cap Value Fund
23Annual Report 2012
Notes to Financial Statements (continued)December 31, 2012
Recent Accounting Pronouncement
Disclosures about Offsetting Assets and LiabilitiesIn December 2011, the Financial Accounting Standards Board(FASB) issued Accounting Standards Update (ASU)No. 2011-11, Disclosures about Offsetting Assets andLiabilities. The objective of the FASB is to enhance currentdisclosure requirements on offsetting of certain assets andliabilities and to enable financial statement users to comparefinancial statements prepared under GAAP and InternationalFinancial Reporting Standards.
Specifically, ASU No. 2011-11 requires an entity to discloseboth gross and net information for derivatives and otherfinancial instruments that are subject to a master nettingarrangement or similar agreement. The standard requiresdisclosure of collateral received in connection with the masternetting agreements or similar agreements. The effective dateof ASU No. 2011-11 is for interim and annual periodsbeginning on or after January 1, 2013. At this time,management is evaluating the implications of this guidanceand the impact it will have on the financial statement amountsand footnote disclosures, if any.
Note 3. Fees and Compensation Paid to
Affiliates
Investment Management Fees
Under an Investment Management Services Agreement,Columbia Management Investment Advisers, LLC (theInvestment Manager), a wholly-owned subsidiary ofAmeriprise Financial, Inc. (Ameriprise Financial), determineswhich securities will be purchased, held or sold. Theinvestment management fee is an annual fee that is equal to apercentage of the Fund’s average daily net assets that declinesfrom 0.79% to 0.70% as the Fund’s net assets increase. Theeffective investment management fee rate for the year endedDecember 31, 2012 was 0.79% of the Fund’s average daily netassets.
Administration Fees
Under an Administrative Services Agreement, the InvestmentManager also serves as the Fund Administrator. The Fund paysthe Fund Administrator an annual fee for administration andaccounting services equal to a percentage of the Fund’saverage daily net assets that declines from 0.08% to 0.05% asthe Fund’s net assets increase. The effective administration feerate for the year ended December 31, 2012 was 0.08% of theFund’s average daily net assets.
Compensation of Board Members
Board members are compensated for their services to the Fundas disclosed in the Statement of Operations. The Trust’seligible Trustees may participate in a Deferred CompensationPlan (the Plan) which may be terminated at any time.Obligations of the Plan will be paid solely out of the Fund’sassets.
Compensation of Chief Compliance Officer
The Board has appointed a Chief Compliance Officer to theFund in accordance with federal securities regulations. TheFund pays its pro-rata share of the expenses associated withthe Chief Compliance Officer. The Fund’s expenses for theChief Compliance Officer will not exceed $15,000 per year.
Transfer Agent Fees
The Fund has a Transfer Agency and Dividend DisbursingAgent Agreement with Columbia Management InvestmentServices Corp. (the Transfer Agent), an affiliate of theInvestment Manager and a wholly-owned subsidiary ofAmeriprise Financial. The annual fee rate under thisagreement is 0.06% of the Fund’s average daily net assets. TheTransfer Agent also receives compensation from fees forvarious shareholder services and reimbursements for certainout-of-pocket fees.
Distribution Fees
The Fund has an agreement with the Distributor, an affiliate ofthe Investment Manager and a wholly-owned subsidiary ofAmeriprise Financial, for distribution services. Pursuant toRule 12b-1 under the 1940 Act, the Board has approved, andthe Fund has adopted, a distribution plan (the Plan) which setsthe distribution fees for the Fund. These fees are calculateddaily and are intended to compensate the Distributor forselling shares of the Fund. The Plan requires the payment of amonthly distribution fee to the Distributor at the maximumannual rate of 0.25% of the average daily net assetsattributable to Class 2 shares of the Fund.
Expenses Waived/Reimbursed by the Investment
Manager and its Affiliates
The Investment Manager and certain of its affiliates havecontractually agreed to waive fees and/or reimburse expenses(excluding certain fees and expenses described below),through April 30, 2013, unless sooner terminated at the solediscretion of the Board, so that the Fund’s net operatingexpenses, after giving effect to fees waived/expensesreimbursed and any balance credits and/or overdraft charges
Columbia Variable Portfolio — Small Cap Value Fund

24 Annual Report 2012
Notes to Financial Statements (continued)December 31, 2012
from the Fund’s custodian, do not exceed the following annualrates as a percentage of the class’ average daily net assets:
Class 1 0.88%
Class 2 1.03
Under the agreement governing these fee waivers and/orexpense reimbursement arrangements, the following fees andexpenses are excluded from the waiver/reimbursementcommitment, and therefore will be paid by the Fund, ifapplicable: taxes (including foreign transaction taxes),expenses associated with investments in affiliated and non-affiliated pooled investment vehicles (including mutual fundsand exchange traded funds), transaction costs and brokeragecommissions, costs related to any securities lending program,dividend expenses associated with securities sold short,inverse floater program fees and expenses, transaction chargesand interest on borrowed money, interest, extraordinaryexpenses and any other expenses the exclusion of which isspecifically approved by the Board. This agreement may bemodified or amended only with approval from all parties.
In addition, the Distributor has voluntarily agreed to reimbursethe Class 2 distribution fee in excess of 0.15% if the totalannual Fund operating expenses applicable to Class 2 shares,including distribution fees, exceed the annual rate of 1.03% ofthe average daily net assets attributable to Class 2 shares. Thisarrangement may be modified or terminated by the Distributorat any time.
Note 4. Federal Tax Information
The timing and character of income and capital gaindistributions are determined in accordance with income taxregulations, which may differ from GAAP because oftemporary or permanent book to tax differences.
At December 31, 2012, these differences are primarily due todiffering treatment for capital loss carryforwards,deferral/reversal of wash sale losses, Trustees’ deferredcompensation, distribution reclassifications, foreign currencytransactions, and passive foreign investment company (PFIC)holdings. To the extent these differences are permanent,reclassifications are made among the components of theFund’s net assets in the Statement of Assets and Liabilities.Temporary differences do not require reclassifications. In theStatement of Assets and Liabilities the followingreclassifications were made:
Undistributed net investment income $(53,865)
Accumulated net realized loss $53,865
Net investment income and net realized gains (losses), asdisclosed in the Statement of Operations, and net assets werenot affected by this reclassification.
The tax character of distributions paid during the yearsindicated was as follows:
Year Ended December 31, 2012 2011
Ordinary income $2,634,395 $3,731,475
Long-term capital gains 12,285,398 32,097,068
Total $14,919,793 $35,828,543
Short-term capital gain distributions, if any, are consideredordinary income distributions for tax purposes.
At December 31, 2012, the components of distributableearnings on a tax basis were as follows:
Undistributed ordinary income $3,443,809
Accumulated realized loss (2,481,019)
Unrealized appreciation 9,188,778
At December 31, 2012, the cost of investments for federalincome tax purposes was $310,465,146 and the aggregategross unrealized appreciation and depreciation based on thatcost was:
Unrealized appreciation $37,256,239
Unrealized depreciation (28,067,461)
Net unrealized appreciation $9,188,778
The following capital loss carryforward, determined atDecember 31, 2012, may be available to reduce taxableincome arising from future net realized gains on investments,if any, to the extent permitted by the Internal Revenue Code:
Year of Expiration Amount
Unlimited long-term $2,481,019
Total $2,481,019
Unlimited capital loss carryforwards are required to beutilized prior to any capital losses which carry an expirationdate. As a result of this ordering rule, capital losscarryforwards which carry an expiration date may be morelikely to expire unused.
Management of the Fund has concluded that there are nosignificant uncertain tax positions that would requirerecognition in the financial statements. However,management’s conclusion may be subject to review andadjustment at a later date based on factors including, but notlimited to, new tax laws, regulations, and administrativeinterpretations (including relevant court decisions). Generally,the Fund’s federal tax returns for the prior three fiscal yearsremain subject to examination by the Internal RevenueService.
Columbia Variable Portfolio — Small Cap Value Fund

25Annual Report 2012
Notes to Financial Statements (continued)December 31, 2012
Note 5. Portfolio Information
The cost of purchases and proceeds from sales of securities,excluding short-term obligations, aggregated to $147,747,632and $151,393,839, respectively, for the year endedDecember 31, 2012.
Note 6. Lending of Portfolio Securities
Effective December 31, 2012, the Fund no longer participatesin securities lending activity. Prior to that date, the Fund hadentered into a Master Securities Lending Agreement (theAgreement) with JPMorgan Chase Bank, N.A. (JPMorgan).The Agreement authorized JPMorgan as lending agent to lendsecurities to authorized borrowers in order to generateadditional income on behalf of the Fund. Pursuant to theAgreement, the securities loaned were secured by cash orsecurities that either were issued or guaranteed as to principaland interest by the U.S. government, its agencies, authoritiesor instrumentalities with value equal to at least 100% of themarket value of the loaned securities. Any additional collateralrequired to maintain those levels due to market fluctuations ofthe loaned securities was requested to be delivered thefollowing business day. Cash collateral received was investedby the lending agent on behalf of the Fund into authorizedinvestments pursuant to the Agreement.
Pursuant to the Agreement, the Fund received income forlending its securities either in the form of fees or by earninginterest on invested cash collateral, net of negotiated rebatespaid to borrowers and fees paid to the lending agent forservices provided and any other securities lending expenses.Net income earned from securities lending for the year endedDecember 31, 2012 is disclosed in the Statement ofOperations. The Fund continued to earn and accrue interestand dividends on the securities loaned. At December 31, 2012,the Fund did not have any securities on loan.
Note 7. Affiliated Money Market Fund
The Fund invests its daily cash balances in Columbia Short-Term Cash Fund, an affiliated money market fund establishedfor the exclusive use by the Fund and other affiliated funds.The income earned by the Fund from such investments isincluded as “Dividends — affiliated issuers” in the Statementof Operations. As an investing fund, the Fund indirectly bearsits proportionate share of the expenses of Columbia Short-Term Cash Fund.
Note 8. Shareholder Concentration
At December 31, 2012, three unaffiliated shareholderaccounts owned an aggregate of 86.8% of the outstandingshares of the Fund. The Fund has no knowledge about whetherany portion of those shares was owned beneficially by such
accounts. Subscription and redemption activity byconcentrated accounts may have a significant effect on theoperations of the Fund.
Note 9. Line of Credit
The Fund has entered into a revolving credit facility with asyndicate of banks led by JPMorgan whereby the Fund mayborrow for the temporary funding of shareholder redemptionsor for other temporary or emergency purposes. The creditfacility agreement, as amended, which is a collectiveagreement between the Fund and certain other funds managedby the Investment Manager, severally and not jointly, permitscollective borrowings up to $500 million. Interest is charged toeach participating fund based on its borrowings at a rate equalto the higher of (i) the overnight federal funds rate plus 1.00%or (ii) the one-month LIBOR rate plus 1.00%. Each borrowingunder the credit facility matures no later than 60 days after thedate of borrowing. The Fund also pays a commitment feeequal to its pro rata share of the amount of the credit facility ata rate of 0.08% per annum.
The Fund had no borrowings during the year endedDecember 31, 2012.
Note 10. Significant Risks
Financial Sector Risk
The Fund’s portfolio managers may invest significantly inissuers operating in the financial sector. The Fund may bemore susceptible to the particular risks of this sector than ifthe Fund were invested in a wider variety of issuers operatingin unrelated sectors.
Note 11. Subsequent Events
Management has evaluated the events and transactions thathave occurred through the date the financial statements wereissued and noted no items requiring adjustment of thefinancial statements or additional disclosure.
Note 12. Information Regarding Pending
and Settled Legal Proceedings
In December 2005, without admitting or denying theallegations, American Express Financial Corporation (AEFC,which is now known as Ameriprise Financial, Inc. (AmeripriseFinancial)) entered into settlement agreements with theSecurities and Exchange Commission (SEC) and MinnesotaDepartment of Commerce (MDOC) related to market timingactivities. As a result, AEFC was censured and ordered to ceaseand desist from committing or causing any violations of certainprovisions of the Investment Advisers Act of 1940, theInvestment Company Act of 1940, and various Minnesota laws.AEFC agreed to pay disgorgement of $10 million and civil
Columbia Variable Portfolio — Small Cap Value Fund

26 Annual Report 2012
Notes to Financial Statements (continued)December 31, 2012
money penalties of $7 million. AEFC also agreed to retain anindependent distribution consultant to assist in developing aplan for distribution of all disgorgement and civil penaltiesordered by the SEC in accordance with various undertakingsdetailed at www.sec.gov/litigation/admin/ia-2451.pdf.Ameriprise Financial and its affiliates have cooperated with theSEC and the MDOC in these legal proceedings, and have maderegular reports to the funds’ Boards of Trustees.
Ameriprise Financial and certain of its affiliates havehistorically been involved in a number of legal, arbitration andregulatory proceedings, including routine litigation, classactions, and governmental actions, concerning matters arisingin connection with the conduct of their business activities.Ameriprise Financial believes that the Funds are not currentlythe subject of, and that neither Ameriprise Financial nor any ofits affiliates are the subject of, any pending legal, arbitration orregulatory proceedings that are likely to have a materialadverse effect on the Funds or the ability of AmeripriseFinancial or its affiliates to perform under their contracts withthe Funds. Ameriprise Financial is required to make 10-Q,10-K and, as necessary, 8-K filings with the Securities andExchange Commission on legal and regulatory matters thatrelate to Ameriprise Financial and its affiliates. Copies ofthese filings may be obtained by accessing the SEC website atwww.sec.gov.
There can be no assurance that these matters, or the adversepublicity associated with them, will not result in increasedfund redemptions, reduced sale of fund shares or other adverseconsequences to the Funds. Further, although we believeproceedings are not likely to have a material adverse effect onthe Funds or the ability of Ameriprise Financial or its affiliatesto perform under their contracts with the Funds, theseproceedings are subject to uncertainties and, as such, we areunable to estimate the possible loss or range of loss that mayresult. An adverse outcome in one or more of theseproceedings could result in adverse judgments, settlements,fines, penalties or other relief that could have a materialadverse effect on the consolidated financial condition orresults of operations of Ameriprise Financial.
Columbia Variable Portfolio — Small Cap Value Fund

Annual Report 2012 27
To the Trustees of Columbia Funds Variable Insurance Trust and the Shareholders of
Columbia Variable Portfolio — Small Cap Value Fund
In our opinion, the accompanying statement of assets and liabilities, including the portfolio of investments, and the relatedstatements of operations and of changes in net assets and the financial highlights present fairly, in all material respects, thefinancial position of Columbia Variable Portfolio — Small Cap Value Fund (the “Fund”) (a series of Columbia FundsVariable Insurance Trust) at December 31, 2012, the results of its operations, the changes in its net assets, and the financialhighlights for each of the periods indicated, in conformity with accounting principles generally accepted in the United Statesof America. These financial statements and financial highlights (hereafter referred to as “financial statements”) are theresponsibility of the Fund’s management. Our responsibility is to express an opinion on these financial statements based onour audit. We conducted our audit of these financial statements in accordance with the standards of the Public CompanyAccounting Oversight Board (United States). Those standards require that we plan and perform the audit to obtainreasonable assurance about whether the financial statements are free of material misstatement. An audit includes examining,on a test basis, evidence supporting the amounts and disclosures in the financial statements, assessing the accountingprinciples used and significant estimates made by management, and evaluating the overall financial statement presentation.We believe that our audits, which included confirmation of securities at December 31, 2012 by correspondence with thecustodian, transfer agent and brokers, provides a reasonable basis for our opinion.
PricewaterhouseCoopers LLPMinneapolis, MinnesotaFebruary 19, 2013
Columbia Variable Portfolio — Small Cap Value Fund
Report of Independent Registered Public Accounting Firm

28 Annual Report 2012
The Fund hereby designates the following tax attributes for the fiscal year ended December 31, 2012.
Tax Designations:
Dividends Received Deduction . . . . . . . . . . . . . . . . . . . . . . . . . . . . . . . . 82.14%
Dividend Received Deduction. The percentage of ordinary income dividends paid during the fiscal year that qualifies forthe corporate dividend received deduction.
Federal Income Tax Information(Unaudited)
Columbia Variable Portfolio — Small Cap Value Fund

Trustees and Officers
Columbia Variable Portfolio — Small Cap Value Fund
29Annual Report 2012
The Trustees serve terms of indefinite duration. The names, addresses and birth years of the Trustees and Officers of theFunds in Columbia Funds Variable Insurance Trust, the year each was first elected or appointed to office, their principalbusiness occupations during at least the last five years, the number of Funds overseen by each Trustee and otherdirectorships they hold are shown below. Each officer listed below serves as an officer of each Fund in Columbia FundsVariable Insurance Trust.
Independent Trustees
Name, Address and Year of Birth, Principal Occupation(s) During Past Five Years, Number of Funds in Columbia
Position with Funds, Year First Funds Complex Overseen by Trustee, Other Directorships Held
Elected or Appointed to Office
Independent consultant since 2010; Co-Founder of Baringo Capital LLC (private equity) from 1997 to2008; CEO of Crystal River Capital, Inc. (real estate investment trust) from 2003 to 2010; Oversees52; Jackson Hewitt Tax Service Inc. (tax preparation services from 2004 to 2011); CelgeneCorporation (global biotechnology company); Student Loan Corporation (student loan provider from2005 to 2010); Celgene Corporation (global biotechnology company); The Helios Funds andBrookfield Funds (closed-end funds); Crystal River Capital, Inc. from 2005 to 2010; ParsonsBrinckerhoff from 1995 to 2008; and Apex Silver Mines Ltd. from 2007 to 2009
Rodman L. Drake (Born 1943)c/o Columbia ManagementInvestment Advisers, LLC 225 Franklin Street Boston, MA 02110 Trustee (since 1994) and Chairman of the Board (since 2009)
Independent business executive since May 2006; Executive Vice President — Strategy of UnitedAirlines from December 2002 to May 2006; President of UAL Loyalty Services (airline marketingcompany) from September 2001 to December 2002; Executive Vice President and Chief FinancialOfficer of United Airlines from July 1999 to September 2001. Oversees 52; Nash Finch Company (fooddistributor); Aircastle Limited (aircraft leasing); and SeaCube Container Leasing Ltd. (container leasing)
Douglas A. Hacker (Born 1955)c/o Columbia ManagementInvestment Advisers, LLC 225 Franklin Street Boston, MA 02110 Trustee (since 1996)
Senior Vice President, General Counsel and Corporate Secretary, ConocoPhillips (integrated energycompany) since September 2007; Deputy General Counsel — Corporate Legal Services,ConocoPhillips from August 2006 to August 2007; Partner, Zelle, Hofmann, Voelbel, Mason & GetteLLP (law firm) from March 2005 to July 2006; Adjunct Professor of Law, Northwestern University fromSeptember 2004 to June 2006; Director, UAL Corporation (airline) from February 2006 to July 2006;Chief Administrative Officer and Senior Vice President, Kmart Holding Corporation (consumer goods)from September 2003 to March 2004. Oversees 52; None
Janet Langford Kelly (Born 1957)c/o Columbia ManagementInvestment Advisers, LLC 225 Franklin Street Boston, MA 02110 Trustee (since 1996)
Senior Vice President, Partner and Director of Marketing, Wellington Management Company, LLP(investment adviser) from 1997 to 2010; Chair, Wellington Management Investment Portfolios(commingled non-U.S. investment pools) from 2007 to 2010; Director, Wellington Trust Company, NAand other Wellington affiliates from 1997 to 2010. Oversees 52; None
Nancy T. Lukitsh (Born 1956)c/o Columbia ManagementInvestment Advisers, LLC 225 Franklin Street Boston, MA 02110 Trustee (since 2011)
Partner, Park Avenue Equity Partners (private equity) since February 1999; Dean and Professor,College of Business and Management, University of Maryland from 1992 to 1996. Oversees 52;DynaVox Inc. (speech creation); Lee Enterprises (print media); WR Hambrecht + Co. (financial serviceprovider) from 2000 to 2012; BlackRock Kelso Capital Corporation (investment company)
William E. Mayer (Born 1940)c/o Columbia ManagementInvestment Advisers, LLC 225 Franklin Street Boston, MA 02110 Trustee (since 1994)
Retired. Chief Executive Officer, Federal Home Loan Mortgage Corporation, from 2008 to 2009;Senior Adviser, Global Financial Services Group, Carlyle Group, Inc., from 2007 to 2008; ViceChairman and Chief Financial Officer, U.S. Bancorp, from 1993 to 2007. Oversees 52; CIT Group Inc.(commercial and consumer finance); eBay Inc. (online trading community); MBIA Inc. (financial serviceprovider); E.W. Scripps Co. (print and television media), Building Materials Holding Corp. (buildingmaterials and construction services); and University of Oklahoma Foundation.
David M. Moffett (Born 1952)c/o Columbia ManagementInvestment Advisers, LLC 225 Franklin Street Boston, MA 02110 Trustee (since 2011)
Retired Professor Emeritus, University of Washington, since 2011; Professor of Economics, Universityof Washington from January 1976 to 2011; Ford and Louisa Van Voorhis Professor of PoliticalEconomy, University of Washington from 1993 to 2011; Adjunct Professor of Statistics, University ofWashington from 1980 to 2011; Associate Editor, Journal of Money Credit and Banking from 1993 to2008; consultant on econometric and statistical matters. Oversees 52; None
Charles R. Nelson (Born 1942)c/o Columbia ManagementInvestment Advisers, LLC 225 Franklin Street Boston, MA 02110 Trustee (since 1981)
President, Saint Michael’s College, since August 2007; Director or Trustee of several non-profitorganizations, including Fletcher Allen Health Care, Inc.; University Professor, Boston College fromNovember 2005 to August 2007; Academic Vice President and Dean of Faculties, Boston Collegefrom August 1999 to October 2005. Oversees 52; Liberty All-Star Equity Fund and Liberty All-StarGrowth Fund (closed-end funds)
John J. Neuhauser (Born 1943)c/o Columbia ManagementInvestment Advisers, LLC 225 Franklin Street Boston, MA 02110 Trustee (since 1984)
Columbia Variable Portfolio — Small Cap Value Fund
Trustees and Officers (continued)
30 Annual Report 2012
Independent Trustees (continued)
Name, Address and Year of Birth, Principal Occupation(s) During Past Five Years, Number of Funds in Columbia
Position with Funds, Year First Funds Complex Overseen by Trustee, Other Directorships Held
Elected or Appointed to Office
Interested Trustee
Name, Address and Year of Birth, Principal Occupation(s) During Past Five Years, Number of Funds in Columbia
Position with Funds, Year First Funds Complex Overseen by Trustee, Other Directorships Held
Elected or Appointed to Office
The Statement of Additional Information includes additional information about the Trustees of the Funds and is available,without charge, upon request by calling 1-800-345-6611.
The Board has appointed officers who are responsible for day-to-day business decisions based on policies it has established.The officers serve at the pleasure of the Board. In addition to Mr. Truscott, who is Senior Vice President, the Funds’ otherofficers are:
Officers
Name, Year of Birth and Address Principal Occupation(s) During the Past Five Years
Partner, Perkins Coie LLP (law firm). Oversees 52; NonePatrick J. Simpson (Born 1944)c/o Columbia ManagementInvestment Advisers, LLC 225 Franklin Street Boston, MA 02110 Trustee (since 2000)
Retired. General Manager — Global Education Industry from 1994 to 1997, President — ApplicationSystems Division from 1991 to 1994, Chief Financial Officer — US Marketing & Services from 1988to 1991, and Chief Information Officer from 1987 to 1988, IBM Corporation (computer andtechnology). Oversees 52; Enesco Group, Inc. (producer of giftware and home and garden decorproducts) from 2001 to 2006
Anne-Lee Verville (Born 1945)c/o Columbia ManagementInvestment Advisers, LLC 225 Franklin Street Boston, MA 02110 Trustee (since 1998)
President, Columbia Management Investment Advisers, LLC since February 2012, (previouslyPresident, Chairman of the Board and Chief Investment Officer, 2001-April 2010); Chief ExecutiveOfficer, Global Asset Management, Ameriprise Financial, Inc. since September 2012 (previously ChiefExecutive Officer, U.S. Asset Management & President, Annuities, May 2010-September 2012 andPresident — U.S. Asset Management and Chief Investment Officer, 2005-April 2010); President andChief Executive Officer, Ameriprise Certificate Company 2006-August 2012; Chief Executive Officer,Columbia Management Investment Distributors, Inc. since February 2012, (previously Chairman of theBoard and Chief Executive Officer, 2006-April 2010); Chairman of the Board and Chief Executive Officer,RiverSource Distributors, Inc. since 2006. Oversees 208; Columbia Funds Board.
William F. Truscott (born 1960)53600 Ameriprise Financial CenterMinneapolis, MN 55474Senior Vice President (since 2012)
Senior Vice President and General Manager — Mutual Fund Products, Columbia ManagementInvestment Advisers, LLC since May 2010; President, Columbia Funds, since 2009, and RiverSourceFunds, since May 2010 (previously Senior Vice President and Chief Financial Officer, Columbia Funds,from June 2008 to January 2009, Treasurer, Columbia Funds, from October 2003 to May 2008, andsenior officer of various other affiliated funds since 2000); Managing Director, Columbia ManagementAdvisors, LLC from December 2004 to April 2010.
J. Kevin Connaughton (Born 1964)225 Franklin Street Boston, MA 02110 President (since 2009)
Vice President, Columbia Management Investment Advisers, LLC since May 2010; Managing Directorof Fund Administration, Columbia Management Advisors, LLC, from September 2004 to April 2010;senior officer of Columbia Funds and affiliated funds since 2002.
Michael G. Clarke (Born 1969)225 Franklin Street Boston, MA 02110 Treasurer (since 2011) and ChiefFinancial Officer (since 2009)
Senior Vice President, Chief Legal Officer and Assistant Secretary, Columbia Management InvestmentAdvisers, LLC since June 2005; Vice President and Lead Chief Counsel — Asset Management,Ameriprise Financial, Inc. since May 2010 (previously Vice President and Chief Counsel — AssetManagement, from 2005 to April 2010); Vice President, Chief Counsel and Assistant Secretary,Columbia Management Investment Distributors, Inc. since 2008; Vice President, General Counsel andSecretary, Ameriprise Certificate Company since 2005; Chief Counsel, RiverSource Distributors, Inc.since 2006; Vice President, General Counsel and Secretary, RiverSource Funds sinceDecember 2006; Senior Vice President, Secretary and Chief Legal Officer, Columbia Funds, sinceMay 2010.
Scott R. Plummer (Born 1959)5228 Ameriprise Financial Center Minneapolis, MN 55474 Senior Vice President, AssistantSecretary and Chief Legal Officer(since 2010)

Columbia Variable Portfolio — Small Cap Value Fund
Trustees and Officers (continued)
Officers (continued)
Name, Year of Birth and Address Principal Occupation(s) During the Past Five Years
Thomas P. McGuire (Born 1972)225 Franklin Street Boston, MA 02110 Chief Compliance Officer(since 2012)
Vice President — Asset Management Compliance, Columbia Management Investment Advisers, LLCsince 2010; Chief Compliance Officer, Ameriprise Certificate Company, since September 2010;Compliance Executive, Bank of America, 2005-2010.
Colin Moore (Born 1958)225 Franklin Street Boston, MA 02110 Senior Vice President (since 2010)
Director and Chief Investment Officer, Columbia Management Investment Advisers, LLC sinceMay 2010; Manager, Managing Director and Chief Investment Officer of Columbia ManagementAdvisors, LLC from 2007 to April 2010; Head of Equities, Columbia Management Advisors, LLC from2002 to 2007.
Amy Johnson (Born 1965)5228 Ameriprise Financial Center Minneapolis, MN 55474 Vice President (since 2010)
Senior Vice President and Chief Operating Officer, Columbia Management Investment Advisers, LLCsince May 2010 (previously Chief Administrative Officer, from 2009 until April 2010, Vice President —Asset Management and Trust Company Services, from 2006 to 2009, and Vice President —Operations and Compliance from 2004 to 2006).
Joseph F. DiMaria (Born 1968)225 Franklin Street Boston, MA 02110 Vice President (since 2011) andChief Accounting Officer (since 2008)
Vice President, Mutual Fund Administration, Columbia Management Investment Advisers, LLC, sinceMay 2010; Director of Fund Administration, Columbia Management Advisors, LLC from January 2006to April 2010; Head of Tax/Compliance and Assistant Treasurer, Columbia Management Advisors,LLC, from November 2004 to December 2005.
Stephen T. Welsh (born 1957)225 Franklin Street Boston, MA 02110 Vice President (since 2006)
President and Director, Columbia Management Investment Services Corp. since May 2010; Presidentand Director, Columbia Management Services, Inc. from July 2004 to April 2010; Managing Director,Columbia Management Distributors, Inc. from August 2007 to April 2010.
Paul D. Pearson (born 1956)10468 Ameriprise Financial Center Minneapolis, MN 55474 Vice President and AssistantTreasurer (since 2011)
Vice President, Investment Accounting, Columbia Management Investment Advisers, LLC, sinceMay 2010; Vice President, Managed Assets, Investment Accounting, Ameriprise FinancialCorporation.
Paul B. Goucher (born 1968)5228 Ameriprise Financial Center Minneapolis, MN 55474 Vice President and AssistantSecretary (since 2010)
Vice President and Lead Chief Counsel, Ameriprise Financial, Inc. since November 2008 andJanuary 2013, respectively (formerly, Chief Counsel from January 2010-January 2013 and GroupCounsel from November 2008-January 2010); Director, Managing Director and General Counsel, J. &W. Seligman & Co. Incorporated, July 2008-November 2008 (previously, Managing Director andAssociate General Counsel, January 2005-July 2008).
Christopher O. Petersen (born 1970)5228 Ameriprise Financial Center Minneapolis, MN 55474 Vice President (since 2010) andSecretary (since 2011)
Vice President and Chief Counsel, Ameriprise Financial since January 2010 (formerly Vice Presidentand Group Counsel or Counsel from April 2004 to January 2010); Assistant Secretary of RiverSourceFunds since January 2007; officer of Columbia Funds and affiliated funds since 2007.
Michael E. DeFao (born 1968)225 Franklin StreetBoston, MA 02110Vice President and AssistantSecretary (since 2011)
Vice President and Chief Counsel, Ameriprise Financial since May 2010; Associate General Counsel,Bank of America from June 2005 to April 2010.
Annual Report 2012 31

32 Annual Report 2012
This page intentionally left blank.

33Annual Report 2012
The policy of the Board is to vote the proxies of the companies in which each fund holds investments consistent with theprocedures as stated in the Statement of Additional Information (SAI). You may obtain a copy of the SAI without charge bycalling 800.345.6611; contacting your financial intermediary; or searching the website of the Securities and ExchangeCommission (SEC) at sec.gov. Information regarding how each fund voted proxies relating to portfolio securities is filedwith the SEC by August 31 for the most recent 12-month period ending June 30 of that year, and is available without chargeby visiting columbiamanagement.com; or searching the website of the SEC at sec.gov.
Each fund files a complete schedule of portfolio holdings with the SEC for the first and third quarters of each fiscal year onForm N-Q. Each fund’s Form N-Q is available on the SEC’s website at sec.gov and may be reviewed and copied at theSEC’s Public Reference Room in Washington, D.C. Information on the operation of the Public Reference Room may beobtained by calling 800.SEC.0330. Each fund’s complete schedule of portfolio holdings, as filed on Form N-Q, can also beobtained without charge, upon request, by calling 800.345.6611.
Important Information About This Report
Columbia Variable Portfolio — Small Cap Value Fund

This information is for use with concurrent or prior delivery of a fund prospectus. Please carefully consider theinvestment objectives, risks, charges and expenses of any variable fund and its related variable contract beforeinvesting. For variable fund and variable contract prospectuses, which contain this and other importantinformation, contact your financial advisor or insurance representative. Please read the prospectus carefullybefore you invest. The Fund is distributed by Columbia Management Investment Distributors, Inc., member FINRA,and managed by Columbia Management Investment Advisers, LLC. © 2013 Columbia Management Investment Advisers, LLC. All rights reserved.
C-1501 C (3/13)
Columbia Variable Portfolio — Small Cap Value FundP.O. Box 8081Boston, MA 02266-8081
Annual Report
December 31, 2012
Columbia Variable Portfolio — Strategic Income Fund
Not FDIC insured • No bank guarantee • May lose value
Please remember that you may not buy (nor will you own) shares of the Fund directly. You invest by buying a variable annuitycontract or life insurance policy and allocating your purchase payments to the variable subaccount or variable account (thesubaccounts) that invests in the Fund. Please contact your financial advisor or insurance representative for more information.


Table of Contents
Performance Overview.............................................................2
Manager Discussion of Fund Performance ................................4
Understanding Your Fund’s Expenses .......................................7
Portfolio of Investments ..........................................................8
Statement of Assets and Liabilities........................................40
Statement of Operations .......................................................42
Statement of Changes in Net Assets......................................43
Financial Highlights...............................................................44
Notes to Financial Statements...............................................46
Report of Independent RegisteredPublic Accounting Firm ..........................................................57
Federal Income Tax Information..............................................58
Trustees and Officers ............................................................59
Important Information About This Report ................................65
Annual Report 2012
Columbia Variable Portfolio — Strategic Income Fund
The views expressed in this report reflect
the current views of the respective parties.
These views are not guarantees of future
performance and involve certain risks,
uncertainties and assumptions that are
difficult to predict, so actual outcomes and
results may differ significantly from the
views expressed. These views are subject to
change at any time based upon economic,
market or other conditions and the
respective parties disclaim any
responsibility to update such views. These
views may not be relied on as investment
advice and, because investment decisions
for a Columbia Fund are based on numerous
factors, may not be relied on as an
indication of trading intent on behalf of any
particular Columbia Fund. References to
specific securities should not be construed
as a recommendation or investment advice.

2 Annual Report 2012
Performance Overview
Performance Summary
> Columbia Variable Portfolio — Strategic Income Fund (the Fund) Class 1 shares returned 12.25% for the 12-monthperiod ended December 31, 2012.
> During the 12-month period, the Fund outperformed its primary benchmark, the Barclays U.S. Government/Credit BondIndex, which returned 4.82%, as well as its New Blended Benchmark, which returned 9.73%.
> Favorable sector allocation decisions drove the Fund’s strong performance for the year.
Average Annual Total Returns (%) (for period ended December 31, 2012)
Inception 1 Year 5 Years 10 Years
Class 1 07/05/94 12.25 8.00 8.27
Class 2 06/01/00 11.96 7.78 8.05
Barclays U.S. Government/Credit Bond Index 4.82 6.06 5.25
New Blended Benchmark 9.73 8.17 8.21
Former Blended Benchmark 9.84 8.26 8.29
Performance data quoted represents past performance and current performance may be lower or higher. Past performance is no guarantee
of future results. The investment return and principal value will fluctuate so that shares, when redeemed, may be worth more or less than
the original cost. For current month-end performance information, please contact your insurance company.
Performance results reflect the effect of any fee waivers or reimbursements of fund expenses by Columbia Management Investment
Advisers, LLC and/or any of its affiliates. Absent these fee waivers or expense reimbursement arrangements, performance results would
have been lower.
Investment earnings, if any, are tax-deferred until distributed to shareholders, at which time taxes may become due. Total return performance
includes changes in share price and assumes reinvestment of dividends and capital gains, if any. Performance results reflect the effect of all
fund expenses, but do not include any fees and expenses imposed under your variable annuity contract and/or variable life insurance policy
or qualified pension or retirement plan. If performance results included the effect of these additional charges, they would be lower.
The Barclays U.S. Government/Credit Bond Index tracks the performance of U.S. government and corporate bonds rated investment grade orbetter, with maturities of at least one year.
The New Blended Benchmark, a weighted custom composite, established by the Investment Manager, consisting of a 35% weighting of theBarclays U.S. Aggregate Bond Index, a 35% weighting of the Bank of America Merrill Lynch (BofAML) U.S. High Yield Cash Pay Constrained Index, a15% weighting of the Citigroup Non-U.S. World Government Bond Index — Unhedged (Citigroup Non U.S. WGBI — Unhedged) and a 15% weightingof the JPMorgan Emerging Markets Bond Index (EMBI) — Global. The Barclays U.S. Aggregate Bond Index is a market value-weighted index thattracks the daily price, coupon, pay-downs and total return performance of fixed-rate, publicly placed, dollar-denominated and non-convertibleinvestment grade debt issues with at least $250 million par amount outstanding and with at least one year to final maturity. The BofAML U.S. HighYield Cash Pay Constrained Index tracks the performance of U.S. dollar-denominated below investment grade corporate debt, currently in a couponpaying period, that is publicly issued in the U.S. domestic market. The Citigroup Non-U.S. WGBI — Unhedged is calculated on a market-weightedbasis and includes all fixed-rate bonds with a remaining maturity of one year or longer and with amounts outstanding of at least the equivalentof U.S. $25 million, while excluding floating or variable rate bonds, securities aimed principally at non-institutional investors and privateplacement-type securities. The JPMorgan EMBI — Global is based on U.S. dollar-denominated debt instruments issued by emerging marketsovereign and quasi-sovereign entities, such as Brady bonds, Eurobonds and loans, and reflects reinvestment of all distributions and changes inmarket prices.
The Former Blended Benchmark is a weighted custom composite, established by the Investment Manager, consisting of a 35% weightingof the Barclays U.S. Aggregate Bond Index, a 35% weighting of the JPMorgan Global High Yield Index, a 15% weighting of the CitigroupNon-U.S. WGBI — Unhedged and a 15% weighting of the JPMorgan EMBI Global Diversified Index. The JPMorgan Global High Yield Index isdesigned to mirror the investable universe of the U.S. dollar global high yield corporate debt market, including domestic and internationalissues. The JPMorgan EMBI Global Diversified Index tracks total returns for traded external debt instruments in the emerging marketsincluding U.S. dollar-denominated Brady bonds, loans and Eurobonds with an outstanding face value of at least $500 million.
Effective on February 29, 2012, the Fund changed its blended benchmark because the Investment Manager believes it is more consistentwith the Fund’s investment strategy.
Indices are not available for investment, are not professionally managed and do not reflect sales charges, fees, brokerage commissions, taxesor other expenses of investing. Securities in the Fund may not match those in an index.
Columbia Variable Portfolio — Strategic Income Fund

3Annual Report 2012
Performance Overview (continued)
Performance of a Hypothetical $10,000 Investment (January 1, 2003 – December 31, 2012)
The chart above shows the change in value of a hypothetical $10,000 investment in Class 1 shares of Columbia Variable Portfolio — StrategicIncome Fund during the stated time period, and does not reflect the deduction of taxes, if any, that a shareholder may pay on Fund distributionsor on the redemption of Fund shares. The returns also do not reflect fees and expenses imposed under your variable annuity contract and/orvariable life insurance policy or qualified pension or retirement plan, if any.
0
5,000
10,000
15,000
$25,000
20,000$22,138$22,175
$22,007
$16,675
12/1212/1112/1012/0912/0812/0712/0612/0512/0412/0301/01/03
Columbia Variable Portfolio — Strategic Income Fund Class 1 ($22,138) Barclays U.S. Government/Credit Bond Index ($16,675)New Blended Benchmark ($22,007)Former Blended Benchmark ($22,175)
Columbia Variable Portfolio — Strategic Income Fund

4 Annual Report 2012
Manager Discussion of Fund Performance
For the 12-month period that ended December 31, 2012, the Fund’s Class 1shares returned 12.25%. During the 12-month period, the Fund outperformed itsprimary benchmark, the Barclays U.S. Government/Credit Bond Index, whichreturned 4.82%, as well as its New Blended Benchmark, which returned 9.73%.The New Blended Benchmark consists of 35% Barclays U.S. Aggregate BondIndex, 35% BofA Merrill Lynch U.S. High Yield Cash Pay Constrained Index,15% Citigroup Non-U.S. World Government Bond Index — Unhedged and 15%JPMorgan Emerging Markets Bond Index-Global. Favorable sector allocationdecisions drove the Fund’s strong performance for the year.
Falling Volatility, Rising Asset Prices
Following a volatile year in 2011, 2012 was marked by falling volatility andrising asset prices across most global financial markets. Political uncertainty inthe eurozone faded as the European Central Bank (ECB) pledged to do“whatever it takes” to protect the currency union. In the U.S., economic growthcontinued to muddle through as the housing market showed renewed signs oflife. The U.S. labor market remained firm, adding just over 1.8 million jobsthroughout the course of the year. This was sufficient to push the unemploymentrate down to 7.8%, from 8.5% to start the year. Following the presidentialelection in November, the focus shifted squarely to the looming U.S. “fiscal cliff”of spending cuts and tax increases. In the end, policy makers came to a deal justbefore markets opened for the New Year, pushing some of the toughest budgetdecisions further into 2013.
Meanwhile, the Federal Reserve (the Fed) maintained its accommodative stancetoward monetary policy. During 2012, the Fed used a number of tools to helpkeep interest rates low, including extending the maturity extension program(known as “operation twist”), starting a new mortgage-backed security (MBS)purchase program (known as “QE3”), and finally announcing an additionalU.S. Treasury purchase program in December. In addition, the Fed removed itsdate-based guidance for short-term interest rates. In its place, the Fed stated thatit expects rates will remain “exceptionally low” until the unemployment ratereaches 6.5%. While interest rates are still expected to remain low for a longtime, this so-called “Evan’s Rule” adds some flexibility for the Fed to movesooner should the labor market improve faster than forecast.
Against this backdrop of slow growth, declining volatility and accommodativemonetary policy, financial markets performed quite well in 2012. U.S. equitymarkets posted strong performance, with the S&P 500 Index returning 16.00%.High quality fixed-income results were modest by comparison, returning 4.21%,as measured by the Barclays U.S. Aggregate Bond Index. For the 12 monthsended December 31, 2012, the yield on the 10-year U.S. Treasury declined12 basis points (a basis point is 1/100th of a percentage point) to end the year at1.76%. Credit-sensitive, non-Treasury sectors of the bond market outperformedTreasury sectors, as spreads, or risk premiums, tightened. High yield bondsreturned 15.40%, as measured by the BofA Merrill Lynch U.S. High Yield CashPay Constrained Index, and emerging market bonds returned 18.54%, asmeasured by the JPMorgan Emerging Markets Bond Index — Global. Foreigndeveloped market bonds lagged these sectors, gaining only 1.51%, as measured bythe Citigroup Non-U.S. World Government Bond Index — Unhedged. Three-month Treasury bills, a proxy for cash, returned 0.08%, as measured by the
Portfolio Management
Colin Lundgren, CFA
Brian Lavin, CFA
Gene Tannuzzo, CFA
Portfolio Breakdown (%)
(at December 31, 2012)
Asset-Backed Securities —
Non-Agency 0.2
Commercial Mortgage-Backed
Securities — Non-Agency 1.5
Common Stocks 0.0(a)
Financials 0.0(a)
Corporate Bonds & Notes 45.4
Consumer Discretionary 5.3
Consumer Staples 1.9
Energy 6.4
Financials 4.6
Health Care 3.7
Industrials 3.1
Materials 4.5
Telecommunication 9.6
Utilities 6.3
Foreign Government
Obligations 20.8
Inflation-Indexed Bonds 1.0
Money Market Funds 5.7
Municipal Bonds 0.0(a)
Options Purchased Calls 0.0(a)
Options Purchased Puts 0.1
Residential Mortgage-Backed
Securities — Agency 11.5
Residential Mortgage-Backed
Securities — Non-Agency 4.5
Senior Loans 5.7
Consumer Discretionary 1.5
Consumer Staples 0.3
Energy 0.1
Financials 0.3
Health Care 0.6
Industrials 0.8
Materials 0.8
Telecommunication 1.1
Utilities 0.2
U.S. Treasury Obligations 3.6
Warrants 0.0(a)
Total 100.0
Percentages indicated are based upon totalinvestments. The Fund’s portfoliocomposition is subject to change.
(a) Rounds to less than 0.1%.
Columbia Variable Portfolio — Strategic Income Fund

5Annual Report 2012
Manager Discussion of Fund Performance (continued)
Citigroup 3-Month Treasury Bill Index, as the Fed maintained short-term interestrates near zero throughout the year.
Contributors and Detractors
Sector allocation was the largest contributor to performance relative tobenchmark for the year. Specifically, the Fund’s underweight in U.S. Treasuryand foreign developed market debt added more than one percentage point torelative performance as government bonds lagged higher-yielding sectors in2012. In addition, the Fund’s overweight in high-yield bonds aided relativeperformance as high-yield spreads tightened. Security selection was also apositive contributor to performance. Specifically, security selection in foreigndeveloped markets and MBS was very strong during the year. Sector allocationto MBS was a modest drag on performance, as MBS lagged riskier sectors of thefixed-income market. However, this drag was more than offset by strong securityselection within the sector. Security selection within the commercialmortgage-backed securities sector also modestly detracted from relativeperformance.
We reduced the Fund’s exposure to high-yield bonds during the first threequarters of the year and added to MBS, which we expected to perform well givensupport from the Fed. Following the introduction of QE3 in September, wesubsequently reduced MBS exposure in favor of bank loans and investmentgrade credit.
Derivatives Helped Manage Interest Rate Risk
We utilized Treasury futures and options to help manage interest rate risk.Overall, interest rate decisions (i.e. those that affected the Fund’s duration, ameasure of interest rate sensitivity, and points of emphasis along the yield curve,a graph that charts yields across the range of maturities, from short to long) werea positive contributor to performance, adding 37 basis points of return for theyear. In addition, we utilized mortgage TBA’s to manage exposure within theMBS sector. “TBA” stands for “to be announced.” Buyers purchase mortgagesecurities that are not specified until a later point. The amount is agreed upon atthe time of contract. However, the actual identity of the securities to be deliveredat settlement is not specified. Instead, the parties to the trade agree on generalparameters of the securities to be delivered.
Looking Ahead
We believe we are moving into a phase of the recovery in which fiscal andmonetary policy may be less of a direct support to market prices. Whilecontinued economic growth in the 2.0% range still seems like the most likelyoutcome, valuations provide much less margin for error. As money has floodedinto bonds over the past few years, the relative yield offered by different sectorsand industries of the market has compressed. Therefore, it is more important thanever for investors to determine whether they are being paid for the risk they aretaking. We believe investors should re-focus on sectors that offer fundamentalstrength and are less reliant on policy support. In our view, government bondsremain overvalued compared to both the level of inflation as well as their ownvolatility. Corporate bonds look better, but investors who have benefited fromcredit risk in years past may be well served to live a little less dangerously in2013. Looking internationally, emerging-market yields currently still look more
Quality Breakdown (%)
(at December 31, 2012)
AAA rating 24.0
AA rating 2.0
A rating 4.2
BBB rating 19.9
BB rating 14.5
B rating 25.3
CCC rating 5.7
CC rating 0.1
Not rated 4.3
Total 100.0
Percentages indicated are based upon totalfixed income securities (excluding MoneyMarket Funds).
Bond ratings apply to the underlyingholdings of the Fund and not the Fund itselfand are divided into categories ranging fromAAA (highest) to D (lowest), and are subjectto change. The ratings shown aredetermined by using the lower of the ratingsfor S&P or Moody’s. When a rating fromonly one agency is available, that rating isused. When a bond is not rated by either ofthese agencies, it is designated as Notrated. Credit ratings are subjective opinionsand not statements of fact.
Columbia Variable Portfolio — Strategic Income Fund

6 Annual Report 2012
Manager Discussion of Fund Performance (continued)
attractive than developed markets even when adjusted for volatility. For investorslooking for a relative safe haven, we believe the mortgage-backed securitiesmarket is likely to provide a smoother ride than other high quality sectors, butMBS investors should be diligent to avoid prepayment risk.
In this environment, we plan to maintain duration, or interest rate risk, below thatof the Fund’s primary benchmark, as we believe that further improvements in thelabor market will cause investors to reassess expectations for monetary policyand push yields higher. We currently prefer corporate bonds and loans, which webelieve still offer attractive spreads when compared to strong corporatefundamental metrics. In addition, we currently expect certain areas of the MBSmarket to perform well given the support from the Fed and a benign prepaymentenvironment. In today’s market, our goal is to maintain an attractive yield profilewith a focus on high quality assets that offer attractive spread.
Columbia Variable Portfolio — Strategic Income Fund

7Annual Report 2012
Columbia Variable Portfolio — Strategic Income Fund
Understanding Your Fund’s Expenses(Unaudited)
As an investor, you incur ongoing costs, which generally include management fees, distribution and/or service (Rule 12b-1)fees, and other fund expenses. The following information is intended to help you understand your ongoing costs (in dollars)of investing in the Fund and to help you compare these costs with the ongoing costs of investing in other mutual funds.
The information below does not reflect fees and expenses imposed under your variable annuity contract and/or variable lifeinsurance policy (collectively, Contracts) or qualified pension and retirement plan (Qualified Plan), if any. The total fees andexpenses you bear may therefore be higher than those shown below.
Analyzing Your Fund’s Expenses
To illustrate these ongoing costs, we have provided examples and calculated the expenses paid by investors in each shareclass of the Fund during the period. The actual and hypothetical information in the table is based on an initial investment of$1,000 at the beginning of the period indicated and held for the entire period. Expense information is calculated two waysand each method provides you with different information. The amount listed in the “Actual” column is calculated using theFund’s actual operating expenses and total return for the period. You may use the Actual information, together with theamount invested, to estimate the expenses that you paid over the period. Simply divide your account value by $1,000 (forexample, an $8,600 account value divided by $1,000 = 8.6), then multiply the results by the expenses paid during the periodunder the Actual column. The amount listed in the “Hypothetical” column assumes a 5% annual rate of return beforeexpenses (which is not the Fund’s actual return) and then applies the Fund’s actual expense ratio for the period to thehypothetical return. You should not use the hypothetical account values and expenses to estimate either your actual accountbalance at the end of the period or the expenses you paid during the period. See “Compare With Other Funds” below fordetails on how to use the hypothetical data.
Compare With Other Funds
Since all mutual funds are required to include the same hypothetical calculations about expenses in shareholder reports, youcan use this information to compare the ongoing cost of investing in the Fund with other funds. To do so, compare thehypothetical example with the 5% hypothetical examples that appear in the shareholder reports of other funds. As youcompare hypothetical examples of other funds, it is important to note that hypothetical examples are meant to highlight theongoing costs of investing in a fund only and do not reflect any transaction costs, such as redemption or exchange fees, orexpenses that apply to the subaccount or the contract. Therefore, the hypothetical calculations are useful in comparingongoing costs only, and will not help you determine the relative total costs of owning different funds. If the fees andexpenses imposed under your Contract or Qualified Plan, if any, were included, your costs would be higher.
July 1, 2012 – December 31, 2012
Account Value at the Beginning Account Value at the End of the Expenses Paid During the Fund’s Annualized
of the Period ($) Period ($) Period ($) Expense Ratio (%)
Actual Hypothetical Actual Hypothetical Actual Hypothetical Actual
Class 1 1,000.00 1,000.00 1,066.30 1,021.84 3.55 3.47 0.68
Class 2 1,000.00 1,000.00 1,065.60 1,020.57 4.86 4.75 0.93
Expenses paid during the period are equal to the annualized expense ratio for each class as indicated above, multiplied by the averageaccount value over the period and then multiplied by the number of days in the Fund’s most recent fiscal half year and divided by 366.
Expenses do not include fees and expenses incurred indirectly by the Fund from the underlying funds in which the Fund may invest (also referredto as “acquired funds”), including affiliated and non-affiliated pooled investment vehicles (including mutual funds and exchange-traded funds).
Had Columbia Management Investment Advisers, LLC and/or certain of its affiliates not waived/reimbursed certain fees and expenses,account value at the end of the period would have been reduced.

Goldman Sachs Group, Inc. (The)Senior Unsecured06/15/20 6.000% 875,000 1,039,68501/24/22 5.750% 815,000 963,503
Morgan StanleySenior Unsecured07/28/21 5.500% 2,865,000 3,252,847
Synovus Financial Corp.Senior Unsecured02/15/19 7.875% 1,328,000 1,467,440
Total 8,914,737
Brokerage 0.3%
E*TRADE Financial Corp.Senior Unsecured11/15/19 6.375% 1,021,000 1,046,525
Neuberger Berman Group LLC/Finance Corp.Senior Unsecured(b)
03/15/22 5.875% 760,000 805,600
Nuveen Investments, Inc.Senior Unsecured(b)
10/15/20 9.500% 796,000 792,020
Total 2,644,145
Building Materials 0.6%
Building Materials Corp. of AmericaSenior Notes(b)
05/01/21 6.750% 1,355,000 1,497,275
Gibraltar Industries, Inc.(c)
12/01/15 8.000% 1,515,000 1,533,938
HD Supply, Inc.(b)
07/15/20 11.500% 500,000 563,125
Interface, Inc.12/01/18 7.625% 595,000 638,881
Norcraft Companies LP/Finance Corp.Secured12/15/15 10.500% 1,349,000 1,369,235
Nortek, Inc.12/01/18 10.000% 190,000 211,37504/15/21 8.500% 786,000 872,460
Total 6,686,289
Chemicals 1.8%
Ashland, Inc.(b)
08/15/22 4.750% 556,000 578,240
Celanese U.S. Holdings LLC10/15/18 6.625% 8,000 8,80006/15/21 5.875% 354,000 396,48011/15/22 4.625% 727,000 761,532
Corporate Bonds & Notes(a) (continued)
Coupon Principal
Issuer Rate Amount ($) Value ($)
Corporate Bonds & Notes(a) 46.9%
Coupon Principal
Issuer Rate Amount ($) Value ($)
Aerospace & Defense 1.2%
ADS Tactical, Inc.Senior Secured(b)
04/01/18 11.000% 2,660,000 2,713,200
Huntington Ingalls Industries, Inc.03/15/18 6.875% 1,334,000 1,450,725
Kratos Defense & Security Solutions, Inc.Senior Secured06/01/17 10.000% 3,374,000 3,702,965
Oshkosh Corp.03/01/17 8.250% 651,000 714,47203/01/20 8.500% 2,086,000 2,310,245
Silver II Borrower/US Holdings LLC(b)
12/15/20 7.750% 857,000 886,995
TransDigm, Inc.(b)
10/15/20 5.500% 660,000 686,400
Total 12,465,002
Automotive 0.5%
Chrysler Group LLC/Co-Issuer, Inc.Secured06/15/19 8.000% 467,000 509,03006/15/21 8.250% 960,000 1,056,000
Dana Holding Corp.Senior Unsecured02/15/21 6.750% 199,000 213,427
Lear Corp.03/15/18 7.875% 612,000 667,08003/15/20 8.125% 218,000 246,340
Schaeffler Finance BVSenior Secured(b)
02/15/19 8.500% 735,000 826,875
Tenneco, Inc.08/15/18 7.750% 16,000 17,360
Visteon Corp.04/15/19 6.750% 2,057,000 2,190,705
Total 5,726,817
Banking 0.8%
BanColombia SASenior Unsecured06/03/21 5.950% 700,000 808,500
Banco BMG SASenior Notes(b)
04/15/18 8.000% 1,000,000 880,113
Citigroup, Inc.Senior Unsecured01/15/15 6.010% 460,000 502,649
The accompanying Notes to Financial Statements are an integral part of this statement.
Columbia Variable Portfolio — Strategic Income Fund
Portfolio of InvestmentsDecember 31, 2012(Percentages represent value of investments compared to net assets)
Annual Report 20128

Consumer Cyclical Services 0.6%
Goodman Networks, Inc.Senior Secured(b)
07/01/18 12.375% 1,035,000 1,133,325
Monitronics International, Inc.04/01/20 9.125% 535,000 549,713
Vivint, Inc.(b)
Senior Secured12/01/19 6.375% 3,345,000 3,315,731Senior Unsecured12/01/20 8.750% 929,000 912,742
Total 5,911,511
Consumer Products 0.4%
Clorox Co. (The)Senior Unsecured09/15/22 3.050% 1,120,000 1,154,766
Libbey Glass, Inc.Senior Secured05/15/20 6.875% 433,000 465,475
Serta Simmons Holdings LLCSenior Unsecured(b)
10/01/20 8.125% 1,163,000 1,163,000
Spectrum Brands Escrow Corp.(b)
Senior Unsecured11/15/20 6.375% 829,000 870,45011/15/22 6.625% 423,000 453,667
Spectrum Brands, Inc.(b)
03/15/20 6.750% 309,000 330,630
Tempur-Pedic International, Inc.(b)
12/15/20 6.875% 134,000 137,853
Total 4,575,841
Diversified Manufacturing 0.2%
Actuant Corp.06/15/22 5.625% 610,000 631,350
Amsted Industries, Inc.Senior Notes(b)
03/15/18 8.125% 1,070,000 1,144,900
Tomkins LLC/Inc.Secured10/01/18 9.000% 636,000 712,320
Total 2,488,570
Electric 3.2%
AES Corp.Senior Unsecured07/01/21 7.375% 959,000 1,064,490
Corporate Bonds & Notes(a) (continued)
Coupon Principal
Issuer Rate Amount ($) Value ($)
Corporate Bonds & Notes(a) (continued)
Coupon Principal
Issuer Rate Amount ($) Value ($)
Dow Chemical Co. (The)Senior Unsecured11/15/22 3.000% 2,505,000 2,499,424
Huntsman International LLC(b)
11/15/20 4.875% 415,000 419,669
JM Huber Corp.Senior Notes(b)
11/01/19 9.875% 1,175,000 1,304,250
LyondellBasell Industries NVSenior Unsecured11/15/21 6.000% 2,844,000 3,334,59004/15/24 5.750% 2,271,000 2,668,425
MacDermid, Inc.(b)
04/15/17 9.500% 820,000 852,800
Momentive Performance Materials, Inc.Senior Secured(b)
10/15/20 8.875% 914,000 923,140
Nufarm Australia Ltd.(b)
10/15/19 6.375% 264,000 275,880
PQ Corp.Secured (b)
05/01/18 8.750% 2,868,000 2,982,720
Polypore International, Inc.11/15/17 7.500% 1,025,000 1,117,250
Rockwood Specialties Group, Inc.10/15/20 4.625% 894,000 925,290
Total 19,048,490
Construction Machinery 0.8%
Ashtead Capital, Inc.Secured(b)
07/15/22 6.500% 277,000 299,160
CNH Capital LLC11/01/16 6.250% 1,635,000 1,802,587
Case New Holland, Inc.12/01/17 7.875% 2,977,000 3,520,302
Columbus McKinnon Corp.02/01/19 7.875% 381,000 408,623
H&E Equipment Services, Inc.(b)
09/01/22 7.000% 384,000 408,960
Neff Rental LLC/Finance Corp.Secured(b)
05/15/16 9.625% 1,534,000 1,587,690
United Rentals North America, Inc.Secured(b)
07/15/18 5.750% 777,000 837,218
Total 8,864,540
The accompanying Notes to Financial Statements are an integral part of this statement.
Columbia Variable Portfolio — Strategic Income Fund
Portfolio of Investments (continued)December 31, 2012
Annual Report 2012 9

TransAlta Corp.Senior Unsecured05/15/18 6.650% 2,670,000 3,068,823
Xcel Energy, Inc.Senior Unsecured05/15/20 4.700% 525,000 613,952
Total 33,072,691
Entertainment 0.2%
AMC Entertainment, Inc.06/01/19 8.750% 820,000 908,15012/01/20 9.750% 752,000 868,560
Cinemark USA, Inc.(b)
12/15/22 5.125% 398,000 402,975
Six Flags, Inc.(b)(d)(e)(f)
06/01/14 9.625% 95,000 —
Speedway Motorsports, Inc.02/01/19 6.750% 32,000 33,920
Vail Resorts, Inc.05/01/19 6.500% 287,000 308,884
Total 2,522,489
Environmental 0.2%
Clean Harbors, Inc.08/01/20 5.250% 950,000 990,375
Clean Harbors, Inc.(b)
06/01/21 5.125% 691,000 716,912
Total 1,707,287
Food and Beverage 1.5%
ConAgra Foods, Inc.Senior Unsecured09/15/22 3.250% 2,025,000 2,033,99310/01/28 7.000% 440,000 553,127
Cott Beverages, Inc.09/01/18 8.125% 1,150,000 1,270,750
Kraft Foods Group, Inc.Senior Unsecured(b)
08/23/18 6.125% 4,205,000 5,162,801
MHP SA(b)
04/29/15 10.250% 1,160,000 1,215,100
Mondelez International, Inc.Senior Unsecured02/01/18 6.125% 1,480,000 1,800,821
SABMiller Holdings, Inc.(b)
01/15/17 2.450% 2,235,000 2,329,75301/15/22 3.750% 1,045,000 1,128,423
Total 15,494,768
Corporate Bonds & Notes(a) (continued)
Coupon Principal
Issuer Rate Amount ($) Value ($)
Corporate Bonds & Notes(a) (continued)
Coupon Principal
Issuer Rate Amount ($) Value ($)
Appalachian Power Co.Senior Unsecured03/30/21 4.600% 2,460,000 2,833,428
Calpine Corp.Senior Secured(b)
02/15/21 7.500% 1,283,000 1,417,715
Carolina Power & Light Co.1st Mortgage05/15/42 4.100% 670,000 685,702
Consolidated Edison Co. of New York, Inc.Senior Unsecured04/01/38 6.750% 255,000 364,539
Dominion Resources, Inc.Senior Unsecured11/30/17 6.000% 540,000 651,26808/15/19 5.200% 1,795,000 2,133,86209/15/42 4.050% 540,000 533,165
Duke Energy Corp.Senior Unsecured08/15/22 3.050% 175,000 178,130
Duke Energy Ohio, Inc.1st Mortgage04/01/19 5.450% 1,696,000 2,043,789
GenOn Energy, Inc.Senior Unsecured10/15/18 9.500% 903,000 1,065,540
Ipalco Enterprises, Inc.Senior Secured(b)
04/01/16 7.250% 75,000 83,250
Nevada Power Co.01/15/15 5.875% 920,000 1,012,97405/15/18 6.500% 4,820,000 6,011,29204/01/36 6.650% 30,000 40,706
Oncor Electric Delivery Co. LLCSenior Secured06/01/42 5.300% 1,460,000 1,669,212
Pacific Gas & Electric Co.Senior Unsecured10/01/20 3.500% 630,000 690,55104/15/42 4.450% 260,000 277,542
Progress Energy, Inc.Senior Unsecured12/01/19 4.875% 1,430,000 1,639,80804/01/22 3.150% 1,625,000 1,645,030
Sierra Pacific Power Co.05/15/16 6.000% 1,395,000 1,614,466
Toledo Edison Co. (The)Senior Secured05/15/37 6.150% 1,390,000 1,733,457
The accompanying Notes to Financial Statements are an integral part of this statement.
Columbia Variable Portfolio — Strategic Income Fund
Portfolio of Investments (continued)December 31, 2012
Annual Report 201210

Plains All American Pipeline LP/Finance Corp.Senior Unsecured05/01/19 8.750% 965,000 1,312,798
Regency Energy Partners LP/Finance Corp.12/01/18 6.875% 1,359,000 1,484,70807/15/21 6.500% 1,813,000 1,985,235
Southern Natural Gas Co. LLCSenior Unsecured(b)
04/01/17 5.900% 4,160,000 4,888,100
Southern Star Central Corp.Senior Unsecured03/01/16 6.750% 1,785,000 1,816,237
Tesoro Logistics LP/Finance Corp.Senior Unsecured(b)
10/01/20 5.875% 608,000 630,800
TransCanada PipeLines Ltd.Senior Unsecured01/15/39 7.625% 320,000 481,394
Transcontinental Gas Pipe Line Co. LLCSenior Unsecured08/01/42 4.450% 1,190,000 1,224,930
Total 35,187,813
Health Care 3.2%
American Renal Associates Holdings, Inc.Senior Unsecured PIK03/01/16 9.750% 320,357 337,977
American Renal Holdings, Inc.Senior Secured05/15/18 8.375% 1,251,000 1,316,677
Amsurg Corp.(b)
11/30/20 5.625% 419,000 435,760
Biomet, Inc.(b)
08/01/20 6.500% 1,074,000 1,141,125
CHS/Community Health Systems, Inc.11/15/19 8.000% 1,241,000 1,343,38207/15/20 7.125% 822,000 877,485Senior Secured08/15/18 5.125% 1,291,000 1,345,867
ConvaTec Healthcare E SASenior Unsecured(b)
12/15/18 10.500% 2,150,000 2,370,375
DaVita HealthCare Partners, Inc.08/15/22 5.750% 470,000 495,263
Emdeon, Inc.12/31/19 11.000% 1,275,000 1,466,250
Fresenius Medical Care U.S. Finance II, Inc.(b)
07/31/19 5.625% 386,000 414,46801/31/22 5.875% 500,000 542,500
Corporate Bonds & Notes(a) (continued)
Coupon Principal
Issuer Rate Amount ($) Value ($)
Corporate Bonds & Notes(a) (continued)
Coupon Principal
Issuer Rate Amount ($) Value ($)
Gaming 1.1%
Caesars Entertainment Operating Co., Inc.Senior Secured02/15/20 8.500% 1,107,000 1,098,698
MGM Resorts International03/01/18 11.375% 901,000 1,090,21012/15/21 6.625% 1,194,000 1,194,000
MGM Resorts International(b)
10/01/20 6.750% 176,000 179,740
ROC Finance LLC/Corp.Secured(b)
09/01/18 12.125% 1,705,000 1,969,275
Seminole Indian Tribe of Florida(b)
Secured10/01/17 7.750% 1,663,000 1,798,119Senior Secured10/01/20 6.535% 65,000 70,676Senior Unsecured10/01/20 7.804% 145,000 147,275
Seneca Gaming Corp.(b)
12/01/18 8.250% 1,340,000 1,413,700
Studio City Finance Ltd.(b)
12/01/20 8.500% 1,905,000 1,995,487
Tunica-Biloxi Gaming AuthoritySenior Unsecured(b)
11/15/15 9.000% 923,000 830,700
Total 11,787,880
Gas Pipelines 3.4%
Access Midstream Partners LP/Finance Corp.05/15/23 4.875% 1,388,000 1,408,820
El Paso LLC06/15/14 6.875% 70,000 74,95509/15/20 6.500% 3,024,000 3,417,12001/15/32 7.750% 3,244,000 3,811,677
Enterprise Products Operating LLC02/15/42 5.700% 1,055,000 1,235,574
Hiland Partners LP/Finance Corp.(b)
10/01/20 7.250% 2,229,000 2,385,030
Kinder Morgan Energy Partners LPSenior Unsecured02/15/20 6.850% 710,000 894,55509/15/20 5.300% 650,000 757,616
MarkWest Energy Partners LP/Finance Corp.06/15/22 6.250% 1,698,000 1,865,67702/15/23 5.500% 1,174,000 1,273,790
NiSource Finance Corp.09/15/17 5.250% 3,675,000 4,238,797
The accompanying Notes to Financial Statements are an integral part of this statement.
Columbia Variable Portfolio — Strategic Income Fund
Portfolio of Investments (continued)December 31, 2012
Annual Report 2012 11

Universal Hospital Services, Inc.Secured(b)
08/15/20 7.625% 343,000 361,436
VWR Funding, Inc.(b)
09/15/17 7.250% 72,000 75,420
Vanguard Health Holding Co. II LLC/Inc.02/01/18 8.000% 1,595,000 1,650,82502/01/19 7.750% 682,000 705,870
Vanguard Health Holding Co. II LLC/Inc.(b)
02/01/19 7.750% 309,000 318,270
Total 33,588,357
Healthcare Insurance 0.2%
AMERIGROUP Corp.Senior Unsecured11/15/19 7.500% 655,000 786,000
Aetna, Inc.Senior Unsecured11/15/22 2.750% 930,000 922,343
WellPoint, Inc.Senior Unsecured02/15/19 7.000% 505,000 628,401
Total 2,336,744
Home Construction 0.4%
Beazer Homes USA, Inc.05/15/19 9.125% 362,000 378,742
KB Home03/15/20 8.000% 498,000 565,23009/15/22 7.500% 344,000 376,250
Meritage Homes Corp.04/01/22 7.000% 462,000 502,425
Shea Homes LP/Funding Corp.Senior Secured05/15/19 8.625% 706,000 780,130
Taylor Morrison Communities, Inc./Monarch, Inc.(b)
04/15/20 7.750% 250,000 265,00004/15/20 7.750% 983,000 1,041,980
Total 3,909,757
Independent Energy 5.5%
Anadarko Petroleum Corp.Senior Unsecured09/15/16 5.950% 3,990,000 4,593,013
Antero Resources Finance Corp.12/01/17 9.375% 73,000 80,11808/01/19 7.250% 258,000 281,220
Canadian Oil Sands Ltd.Senior Unsecured(b)
04/01/42 6.000% 885,000 1,039,372
Corporate Bonds & Notes(a) (continued)
Coupon Principal
Issuer Rate Amount ($) Value ($)
Corporate Bonds & Notes(a) (continued)
Coupon Principal
Issuer Rate Amount ($) Value ($)
Fresenius Medical Care U.S. Finance, Inc.(b)
09/15/18 6.500% 305,000 340,838
HCA Holdings, Inc.Senior Unsecured02/15/21 6.250% 1,456,000 1,492,400
HCA, Inc.02/15/22 7.500% 1,000,000 1,145,00005/01/23 5.875% 671,000 694,485Senior Secured02/15/20 6.500% 2,019,000 2,271,37505/01/23 4.750% 446,000 453,805
Health Management Associates, Inc.01/15/20 7.375% 720,000 777,600
Hologic, Inc.(b)
08/01/20 6.250% 208,000 224,120
IASIS Healthcare LLC/Capital Corp.05/15/19 8.375% 1,331,000 1,257,795
IMS Health, Inc.Senior Unsecured(b)
11/01/20 6.000% 586,000 613,835
Kinetic Concepts, Inc./KCI U.S.A., Inc.Secured(b)
11/01/18 10.500% 505,000 529,619
LifePoint Hospitals, Inc.10/01/20 6.625% 425,000 459,000
Multiplan, Inc.(b)
09/01/18 9.875% 2,093,000 2,328,462
Physio-Control International, Inc.Senior Secured(b)
01/15/19 9.875% 1,001,000 1,098,597
Radnet Management, Inc.04/01/18 10.375% 465,000 473,138
Rural/Metro Corp.Senior Unsecured(b)
07/15/19 10.125% 816,000 789,480
STHI Holding Corp.Secured(b)
03/15/18 8.000% 403,000 436,248
Tenet Healthcare Corp.(b)
Senior Secured06/01/20 4.750% 914,000 927,710Senior Unsecured02/01/20 6.750% 716,000 737,480
Truven Health Analytics, Inc.Senior Unsecured(b)
06/01/20 10.625% 548,000 583,620
United Surgical Partners International, Inc.04/01/20 9.000% 680,000 754,800
The accompanying Notes to Financial Statements are an integral part of this statement.
Columbia Variable Portfolio — Strategic Income Fund
Portfolio of Investments (continued)December 31, 2012
Annual Report 201212

Plains Exploration & Production Co.11/15/20 6.500% 2,329,000 2,579,36702/15/23 6.875% 1,758,000 2,008,515
QEP Resources, Inc.Senior Unsecured03/01/21 6.875% 1,145,000 1,319,61210/01/22 5.375% 1,697,000 1,824,27505/01/23 5.250% 1,491,000 1,595,370
Range Resources Corp.06/01/21 5.750% 1,450,000 1,551,500
SM Energy Co.Senior Unsecured11/15/21 6.500% 621,000 664,47001/01/23 6.500% 405,000 433,350
Sandridge Energy, Inc.10/15/22 8.125% 76,000 83,220
Whiting Petroleum Corp.10/01/18 6.500% 74,000 79,550
Total 57,629,794
Integrated Energy 0.1%
Lukoil International Finance BV(b)
11/09/20 6.125% 1,200,000 1,387,575
Life Insurance 0.2%
Prudential Financial, Inc.Senior Unsecured05/12/41 5.625% 1,395,000 1,590,186
Lodging —%
Choice Hotels International, Inc.07/01/22 5.750% 431,000 477,332
Media Cable 1.6%
CCO Holdings LLC/Capital Corp.04/30/20 8.125% 1,867,000 2,105,04301/31/22 6.625% 180,000 196,65009/30/22 5.250% 1,252,000 1,267,650
CSC Holdings LLCSenior Unsecured(b)
11/15/21 6.750% 1,953,000 2,165,389
Cablevision Systems Corp.Senior Unsecured04/15/20 8.000% 535,000 602,54409/15/22 5.875% 928,000 929,160
Cequel Communications Holdings I LLC/Capital Corp.Senior Unsecured(b)
09/15/20 6.375% 849,000 884,021
Comcast Corp.08/15/37 6.950% 530,000 718,715
Corporate Bonds & Notes(a) (continued)
Coupon Principal
Issuer Rate Amount ($) Value ($)
Corporate Bonds & Notes(a) (continued)
Coupon Principal
Issuer Rate Amount ($) Value ($)
Carrizo Oil & Gas, Inc.10/15/18 8.625% 1,083,000 1,169,640
Chaparral Energy, Inc.09/01/21 8.250% 747,000 810,49511/15/22 7.625% 297,000 312,593
Chesapeake Energy Corp.08/15/20 6.625% 1,355,000 1,458,31902/15/21 6.125% 2,851,000 2,957,912
Cimarex Energy Co.05/01/22 5.875% 1,480,000 1,620,600
Comstock Resources, Inc.06/15/20 9.500% 1,702,000 1,829,650
Concho Resources, Inc.01/15/21 7.000% 875,000 975,62501/15/22 6.500% 1,430,000 1,573,00004/01/23 5.500% 648,000 678,780
Continental Resources, Inc.10/01/19 8.250% 104,000 116,48010/01/20 7.375% 6,000 6,78004/01/21 7.125% 1,598,000 1,801,74509/15/22 5.000% 3,282,000 3,536,355
EP Energy Holdings LLC/Bond Co., Inc. PIKSenior Unsecured(b)
12/15/17 8.125% 551,000 546,179
EP Energy LLC/Everest Acquisition Finance, Inc.09/01/22 7.750% 172,000 182,320Senior Secured05/01/19 6.875% 1,175,000 1,280,750
EP Energy LLC/Finance, Inc.Senior Unsecured05/01/20 9.375% 1,767,000 1,992,292
Halcon Resources Corp.(b)
05/15/21 8.875% 670,000 710,200
Kodiak Oil & Gas Corp.12/01/19 8.125% 3,556,000 3,920,490
Laredo Petroleum, Inc.02/15/19 9.500% 2,975,000 3,324,56205/01/22 7.375% 356,000 386,260
MEG Energy Corp.(b)
03/15/21 6.500% 1,185,000 1,247,21301/30/23 6.375% 749,000 780,833
Novatek Finance Ltd.Senior Unsecured(b)
02/03/21 6.604% 2,000,000 2,331,026
Oasis Petroleum, Inc.02/01/19 7.250% 1,990,000 2,139,25011/01/21 6.500% 1,254,000 1,332,37501/15/23 6.875% 443,000 475,118
The accompanying Notes to Financial Statements are an integral part of this statement.
Columbia Variable Portfolio — Strategic Income Fund
Portfolio of Investments (continued)December 31, 2012
Annual Report 2012 13

Lamar Media Corp.(b)
05/01/23 5.000% 1,420,000 1,459,050
NBCUniversal Media LLCSenior Unsecured01/15/43 4.450% 670,000 678,467
National CineMedia LLCSenior Secured04/15/22 6.000% 1,075,000 1,139,500
News America, Inc.12/15/35 6.400% 55,000 68,274
News America, Inc.(b)
09/15/22 3.000% 5,490,000 5,514,710
Nielsen Finance LLC/Co.(b)
10/01/20 4.500% 2,004,000 1,993,980
Reed Elsevier Capital, Inc.(b)
10/15/22 3.125% 980,000 964,157
Salem Communications Corp.Secured12/15/16 9.625% 1,946,000 2,155,195
Starz LLC/Finance Corp.Senior Unsecured(b)
09/15/19 5.000% 406,000 416,150
TCM Sub LLC(b)
01/15/15 3.550% 2,650,000 2,780,991
Univision Communications, Inc.(b)
05/15/21 8.500% 1,270,000 1,317,625Senior Secured05/15/19 6.875% 1,585,000 1,648,40011/01/20 7.875% 1,930,000 2,084,40009/15/22 6.750% 228,000 235,410
Total 41,573,289
Metals 1.6%
Alpha Natural Resources, Inc.04/15/18 9.750% 1,365,000 1,474,20006/01/19 6.000% 1,063,000 985,933
ArcelorMittalSenior Unsecured(c)
03/01/41 7.250% 1,122,000 1,040,655
Arch Coal, Inc.06/15/19 7.000% 289,000 268,77006/15/21 7.250% 126,000 116,235
Arch Coal, Inc.(b)
06/15/19 9.875% 1,145,000 1,190,800
CONSOL Energy, Inc.04/01/20 8.250% 481,000 520,683
Calcipar SASenior Secured(b)
05/01/18 6.875% 1,709,000 1,743,180
Corporate Bonds & Notes(a) (continued)
Coupon Principal
Issuer Rate Amount ($) Value ($)
Corporate Bonds & Notes(a) (continued)
Coupon Principal
Issuer Rate Amount ($) Value ($)
DISH DBS Corp.09/01/19 7.875% 2,212,000 2,621,22006/01/21 6.750% 1,618,000 1,844,52007/15/22 5.875% 173,000 185,975
DirecTV Holdings LLC/Financing Co., Inc.03/15/42 5.150% 975,000 986,147
Quebecor Media, Inc.Senior Unsecured(b)
01/15/23 5.750% 1,035,000 1,090,631
Time Warner Cable, Inc.07/01/18 6.750% 5,000 6,24602/01/20 5.000% 19,000 22,130
Unitymedia Hessen GmbH & Co. KG NRWSenior Secured(b)
01/15/23 5.500% 990,000 1,022,175
Videotron Ltd.07/15/22 5.000% 7,000 7,341
WaveDivision Escrow LLC/Corp.Senior Unsecured(b)
09/01/20 8.125% 27,000 27,945
Total 16,683,502
Media Non-Cable 4.0%
AMC Networks, Inc.07/15/21 7.750% 2,826,000 3,228,70512/15/22 4.750% 233,000 234,165
British Sky Broadcasting Group PLC(b)
11/26/22 3.125% 2,735,000 2,725,482
Clear Channel Communications, Inc.08/01/16 10.750% 728,000 549,640
Clear Channel Worldwide Holdings, Inc.03/15/20 7.625% 2,299,000 2,316,242
Clear Channel Worldwide Holdings, Inc.(b)
11/15/22 6.500% 709,000 728,49811/15/22 6.500% 1,917,000 1,988,888
Getty Images, Inc.Senior Notes(b)
10/15/20 7.000% 1,274,000 1,302,665
Hughes Satellite Systems Corp.06/15/21 7.625% 605,000 688,188Senior Secured06/15/19 6.500% 2,203,000 2,428,807
Intelsat Jackson Holdings SASenior Unsecured04/01/21 7.500% 680,000 749,700
Intelsat Luxembourg SAPIK02/04/17 11.500% 2,048,000 2,176,000
The accompanying Notes to Financial Statements are an integral part of this statement.
Columbia Variable Portfolio — Strategic Income Fund
Portfolio of Investments (continued)December 31, 2012
Annual Report 201214

Oil Field Services 0.9%
Atwood Oceanics, Inc.Senior Unsecured02/01/20 6.500% 2,843,000 3,056,225
Green Field Energy Services, Inc.(b)
Senior Secured11/15/16 13.250% 1,854,000 1,854,00011/15/16 13.250% 44,000 44,000
Offshore Group Investments Ltd.Senior Secured08/01/15 11.500% 1,821,000 1,984,890
Oil States International, Inc.06/01/19 6.500% 1,286,000 1,369,590
Oil States International, Inc.(b)
01/15/23 5.125% 824,000 835,330
Weatherford International Ltd.03/15/13 5.150% 4,000 4,032
Total 9,148,067
Other Financial Institutions 0.1%
FTI Consulting, Inc.(b)
11/15/22 6.000% 544,000 563,040
Other Industry 0.2%
Interline Brands, Inc.11/15/18 7.500% 1,397,000 1,508,760
SPL Logistics Escrow LLC/Finance Corp.Senior Secured(b)
08/01/20 8.875% 669,000 714,157
Total 2,222,917
Packaging 0.5%
Berry Plastics Corp.Secured01/15/21 9.750% 810,000 933,525
Reynolds Group Issuer, Inc./LLC08/15/19 9.875% 2,358,000 2,523,060Senior Secured08/15/19 7.875% 836,000 930,050
Reynolds Group Issuer, Inc./LLC(b)
Senior Secured10/15/20 5.750% 365,000 376,862
Sealed Air Corp.(b)
09/15/21 8.375% 384,000 438,720
Total 5,202,217
Corporate Bonds & Notes(a) (continued)
Coupon Principal
Issuer Rate Amount ($) Value ($)
Corporate Bonds & Notes(a) (continued)
Coupon Principal
Issuer Rate Amount ($) Value ($)
FMG Resources August 2006 Proprietary Ltd.(b)
11/01/19 8.250% 2,315,000 2,471,262
Inmet Mining Corp.(b)
06/01/20 8.750% 2,245,000 2,452,66206/01/21 7.500% 546,000 566,475
JMC Steel Group, Inc.Senior Notes(b)
03/15/18 8.250% 824,000 861,080
Metalloinvest Finance Ltd.(b)
07/21/16 6.500% 1,000,000 1,033,537
Peabody Energy Corp.11/15/18 6.000% 1,204,000 1,279,250
Rain CII Carbon LLC/Corp.Senior Secured(b)
12/01/18 8.000% 1,217,000 1,238,298
Total 17,243,020
Non-Captive Consumer 0.3%
SLM Corp.Senior Unsecured03/25/20 8.000% 936,000 1,069,380
Springleaf Finance Corp.Senior Unsecured12/15/17 6.900% 1,903,000 1,703,185
Total 2,772,565
Non-Captive Diversified 2.4%
Ally Financial, Inc.03/15/20 8.000% 5,794,000 7,097,65009/15/20 7.500% 791,000 955,132
CIT Group, Inc.Senior Unsecured05/15/20 5.375% 900,000 983,250
CIT Group, Inc.(b)
Senior Secured04/01/18 6.625% 1,415,000 1,598,950Senior Unsecured02/15/19 5.500% 3,246,000 3,521,910
General Electric Capital Corp.Senior Unsecured10/17/21 4.650% 5,110,000 5,830,694
International Lease Finance Corp.Senior Unsecured09/01/17 8.875% 875,000 1,028,12504/01/19 5.875% 359,000 378,38605/15/19 6.250% 533,000 567,64512/15/20 8.250% 1,436,000 1,712,43001/15/22 8.625% 1,094,000 1,351,090
Total 25,025,262
The accompanying Notes to Financial Statements are an integral part of this statement.
Columbia Variable Portfolio — Strategic Income Fund
Portfolio of Investments (continued)December 31, 2012
Annual Report 2012 15

Restaurants 0.3%
Shearer’s Foods, Inc. LLCSenior Secured(b)
11/01/19 9.000% 664,000 697,200
Yum! Brands, Inc.Senior Unsecured09/15/19 5.300% 1,726,000 2,017,031
Total 2,714,231
Retailers 0.7%
99 Cent Only Stores12/15/19 11.000% 627,000 717,131
AutoNation, Inc.02/01/20 5.500% 88,000 94,380
Burlington Coat Factory Warehouse Corp.02/15/19 10.000% 1,005,000 1,085,400
Jo-Ann Stores, Inc.Senior Unsecured(b)
03/15/19 8.125% 732,000 744,810
Limited Brands, Inc.02/15/22 5.625% 811,000 881,963
Penske Automotive Group, Inc.(b)
10/01/22 5.750% 660,000 679,800
Rite Aid Corp.03/15/20 9.250% 329,000 350,385Senior Secured08/15/20 8.000% 1,280,000 1,462,400Senior Unsecured02/15/27 7.700% 934,000 798,570
Sally Holdings LLC/Capital, Inc.11/15/19 6.875% 585,000 646,425
Total 7,461,264
Supranational 0.4%
Asian Development BankSenior Unsecured06/21/27 2.350% JPY 120,000,000 1,567,228
European Investment BankSenior Unsecured06/20/17 1.400% JPY 189,000,000 2,282,743
International Finance Corp.02/28/13 7.500% AUD 120,000 125,428
Total 3,975,399
Technology 2.1%
Alliance Data Systems Corp.(b)
12/01/17 5.250% 828,000 840,42004/01/20 6.375% 557,000 584,850
Corporate Bonds & Notes(a) (continued)
Coupon Principal
Issuer Rate Amount ($) Value ($)
Corporate Bonds & Notes(a) (continued)
Coupon Principal
Issuer Rate Amount ($) Value ($)
Pharmaceuticals 0.4%
Catalent Pharma Solutions, Inc.(b)
10/15/18 7.875% 890,000 896,675
Jaguar Holding Co. ISenior Unsecured PIK(b)
10/15/17 9.375% 557,000 584,850
Jaguar Holding Co. II/Merger Sub, Inc.Senior Unsecured(b)
12/01/19 9.500% 435,000 493,725
VPI Escrow Corp.(b)
10/15/20 6.375% 1,381,000 1,481,122
Valeant Pharmaceuticals InternationalSenior Notes(b)
10/15/20 6.375% 276,000 296,010
Warner Chilcott Co. LLC/Finance09/15/18 7.750% 705,000 750,825
Total 4,503,207
Property & Casualty 0.4%
Alliant Holdings, Inc.Senior Unsecured(b)
12/15/20 7.875% 703,000 699,485
Hub International Ltd.(b)
10/15/18 8.125% 1,110,000 1,137,750
Liberty Mutual Group, Inc.(b)
05/01/22 4.950% 2,240,000 2,441,347
Total 4,278,582
Railroads 0.2%
CSX Corp.Senior Unsecured04/15/41 5.500% 1,195,000 1,431,83103/15/44 4.100% 440,000 434,342
Union Pacific Corp.Senior Unsecured08/15/18 5.700% 385,000 467,247
Total 2,333,420
Refining 0.1%
Marathon Petroleum Corp.Senior Unsecured03/01/41 6.500% 600,000 760,234
Phillips 66(b)
05/01/17 2.950% 275,000 291,455
Total 1,051,689
The accompanying Notes to Financial Statements are an integral part of this statement.
Columbia Variable Portfolio — Strategic Income Fund
Portfolio of Investments (continued)December 31, 2012
Annual Report 201216

ERAC U.S.A. Finance LLC(b)
07/01/13 2.750% 330,000 333,00210/01/20 5.250% 305,000 350,954
Hertz Corp. (The)01/15/21 7.375% 872,000 959,200
Hertz Corp. (The)(b)
10/15/20 5.875% 365,000 381,42510/15/22 6.250% 39,000 41,535
Total 3,389,296
Wireless 1.6%
Cricket Communications, Inc.10/15/20 7.750% 1,096,000 1,117,920
Crown Castle International Corp.Senior Unsecured(b)
01/15/23 5.250% 1,430,000 1,530,100
SBA Telecommunications, Inc.(b)
07/15/20 5.750% 1,828,000 1,942,250
Sprint Capital Corp.11/15/28 6.875% 1,695,000 1,762,800
Sprint Nextel Corp.(b)
11/15/18 9.000% 4,182,000 5,164,77003/01/20 7.000% 585,000 680,063
United States Cellular Corp.Senior Unsecured12/15/33 6.700% 780,000 818,408
VimpelCom Holdings BV(b)
03/01/22 7.504% 1,500,000 1,719,375
Wind Acquisition Finance SA(b)
Secured07/15/17 11.750% 885,000 927,037Senior Secured02/15/18 7.250% 1,607,000 1,629,498
Total 17,292,221
Wirelines 2.3%
AT&T, Inc.Senior Unsecured02/15/39 6.550% 1,645,000 2,161,71609/01/40 5.350% 1,055,000 1,228,598
AT&T, Inc.(b)
Senior Unsecured06/15/45 4.350% 660,000 661,896
CyrusOne LLP./Finance Corp.(b)
11/15/22 6.375% 824,000 859,020
Embarq Corp.Senior Unsecured06/01/36 7.995% 5,210,000 5,754,554
Corporate Bonds & Notes(a) (continued)
Coupon Principal
Issuer Rate Amount ($) Value ($)
Corporate Bonds & Notes(a) (continued)
Coupon Principal
Issuer Rate Amount ($) Value ($)
Amkor Technology, Inc.Senior Unsecured06/01/21 6.625% 1,893,000 1,888,267
Amkor Technology, Inc.(b)
Senior Unsecured10/01/22 6.375% 646,000 636,310
Anixter, Inc.05/01/19 5.625% 302,000 317,855
Brocade Communications Systems, Inc.Senior Secured01/15/20 6.875% 864,000 930,960
CDW LLC/Finance Corp.04/01/19 8.500% 2,440,000 2,641,300Senior Secured12/15/18 8.000% 1,153,000 1,275,506
Cardtronics, Inc.09/01/18 8.250% 1,143,000 1,268,730
Equinix, Inc.Senior Unsecured07/15/21 7.000% 510,000 566,100
First Data Corp.01/15/21 12.625% 1,427,000 1,501,918
First Data Corp.(b)
Secured01/15/21 8.250% 725,000 725,000Senior Secured06/15/19 7.375% 1,488,000 1,543,80008/15/20 8.875% 1,305,000 1,422,45011/01/20 6.750% 764,000 773,550
Freescale Semiconductor, Inc.Senior Secured(b)
04/15/18 9.250% 1,195,000 1,305,538
Interactive Data Corp.08/01/18 10.250% 1,525,000 1,715,625
NXP BV/Funding LLCSenior Secured(b)
08/01/18 9.750% 185,000 215,525
Nuance Communications, Inc.(b)
08/15/20 5.375% 1,778,000 1,858,010
Total 22,011,714
Textile 0.1%
PVH Corp.Senior Unsecured12/15/22 4.500% 666,000 672,660
Transportation Services 0.3%
Avis Budget Car Rental LLC/Finance, Inc.01/15/19 8.250% 471,000 520,45503/15/20 9.750% 695,000 802,725
The accompanying Notes to Financial Statements are an integral part of this statement.
Columbia Variable Portfolio — Strategic Income Fund
Portfolio of Investments (continued)December 31, 2012
Annual Report 2012 17

CMO IO Series 2957 Class SW04/15/35 5.791% 4,852,183 876,489CMO IO Series 3122 Class IS03/15/36 6.491% 4,428,380 637,410CMO IO Series 3550 Class EI07/15/39 6.191% 5,622,990 1,007,840CMO IO Series 3761 Class KS06/15/40 5.791% 5,622,764 825,432CMO IO Series 3960 Class SL11/15/41 6.291% 13,988,419 3,630,623CMO IO Series 4073 Class AS08/15/38 5.841% 8,844,165 1,664,914CMO IO Series 4093 Class SD01/15/38 6.491% 3,935,997 1,069,560
Federal Home Loan Mortgage Corp.(h)
10/01/26 8.000% 47,837 52,399
Federal National Mortgage Association(c)(h)(i)
CMO IO Series 2006-5 Class N108/25/34 2.275% 11,674,646 587,179CMO IO Series 2006-5 Class N202/25/35 2.248% 17,675,386 1,159,224CMO IO Series 2007-39 Class AI05/25/37 5.910% 3,623,359 736,637CMO IO Series 2010-135 Class MS12/25/40 5.740% 3,731,525 731,039CMO IO Series 2012-74 Class AS03/25/39 5.840% 6,846,901 1,271,412CMO IO Series 2012-80 Class AS02/25/39 5.840% 6,887,024 1,706,892CMO IO Series 2012-87 SQ08/25/42 6.090% 4,578,261 1,202,252
Federal National Mortgage Association(h)
06/01/27 3.000% 11,050,377 11,837,28404/01/42 - 06/01/42 3.500% 21,905,648 23,804,47510/01/39 - 06/01/42 4.000% 7,739,738 8,301,79503/01/39 - 07/01/39 4.500% 11,640,329 12,781,31406/01/34 - 05/01/40 5.000% 1,441,281 1,565,80702/01/37 - 08/01/38 6.000% 326,214 356,90911/01/36 6.500% 446,662 497,659
Federal National Mortgage Association(h)(j)
01/01/28 2.500% 15,750,000 16,468,59401/01/28 3.000% 15,000,000 15,832,032
Federal National Mortgage Association(h)(k)
04/01/38 5.000% 932,828 1,033,047
Government National Mortgage Association(c)(h)(i)
CMO IO Series 2010-108 Class PI02/20/38 5.889% 7,029,037 891,083
Residential Mortgage-Backed Securities —
Agency(g) (continued)
Coupon Principal
Issuer Rate Amount ($) Value ($)
Corporate Bonds & Notes(a) (continued)
Coupon Principal
Issuer Rate Amount ($) Value ($)
Frontier Communications Corp.Senior Unsecured10/01/18 8.125% 795,000 914,25004/15/20 8.500% 1,004,000 1,154,60007/01/21 9.250% 329,000 385,75304/15/22 8.750% 449,000 520,840
Integra Telecom Holdings, Inc.Senior Secured(b)
04/15/16 10.750% 63,000 66,071
Level 3 Communications, Inc.Senior Unsecured02/01/19 11.875% 1,341,000 1,545,502
Level 3 Communications, Inc.(b)
Senior Unsecured06/01/19 8.875% 269,000 286,485
Level 3 Financing, Inc.02/01/18 10.000% 986,000 1,099,39004/01/19 9.375% 623,000 696,20307/01/19 8.125% 1,008,000 1,098,720
Level 3 Financing, Inc.(b)
06/01/20 7.000% 80,000 83,600
PAETEC Holding Corp.12/01/18 9.875% 1,845,000 2,112,525
Qtel International Finance Ltd.(b)
10/19/25 5.000% 800,000 900,865
Verizon Communications, Inc.Senior Unsecured11/01/42 3.850% 335,000 331,235
Verizon New York, Inc.04/01/32 7.375% 262,000 347,139
Windstream Corp.09/01/18 8.125% 50,000 54,625
Zayo Group LLC/Capital, Inc.07/01/20 10.125% 788,000 896,350
tw telecom holdings, Inc.(b)
10/01/22 5.375% 416,000 435,760
Total 23,595,697
Total Corporate Bonds & Notes
(Cost: $457,510,636) 491,731,874
Residential Mortgage-Backed Securities —
Agency(g) 11.8%
Federal Home Loan Mortgage Corp.(c)(h)(i)
CMO IO STRIPS Series 281 Class S110/15/42 5.791% 6,954,838 1,889,150
The accompanying Notes to Financial Statements are an integral part of this statement.
Columbia Variable Portfolio — Strategic Income Fund
Portfolio of Investments (continued)December 31, 2012
Annual Report 201218

Citigroup Mortgage Loan Trust, Inc.(b)(h)
CMO Series 2012-A Class A06/25/51 2.500% 2,681,085 2,654,274
Credit Suisse Mortgage Capital Certificates(b)(c)(h)
CMO Series 2011-4R Class 4A708/27/37 4.000% 3,880,000 3,840,426CMO Series 2011-7R Class A108/28/47 1.460% 1,969,455 1,951,408Series 2012-11 Class 3A206/28/47 1.212% 3,058,154 2,759,984
Credit Suisse Mortgage Capital Certificates(b)(h)
Series 2012-11R Class 1A111/29/37 2.000% 4,000,000 3,997,500
Deutsche Mortgage Securities, Inc.CMO Series 2003-1 Class 1A7(h)
04/25/33 5.500% 1,300,468 1,345,859
JPMorgan Resecuritization TrustCMO Series 2010-5 Class 1A6(b)(c)(h)
04/26/37 4.500% 615,000 626,899
PennyMac Loan Trust(b)(c)(h)
Series 2011-NPL1 Class A09/25/51 5.250% 270,911 270,652Series 2012-NPL1 Class A05/28/52 3.422% 3,854,962 3,854,962
RBSSP Resecuritization TrustCMO Series 2010-12 Class 3A4(b)(c)(h)
06/27/32 4.000% 721,469 725,388
Residential Mortgage Asset TrustSeries 2012-1A Class A1(b)(c)(h)
08/26/52 2.734% 3,680,573 3,740,957
Wells Fargo Mortgage-Backed Securities TrustCMO Series 2005-18 Class 2A6(h)
01/25/36 5.500% 489,222 492,234
Total Residential Mortgage-Backed
Securities — Non-Agency
(Cost: $48,762,198) 48,451,472
Commercial Mortgage-Backed Securities —
Non-Agency 1.6%
Commercial Mortgage Pass-Through CertificatesSeries 2011-THL Class A(b)(h)
06/09/28 3.376% 964,788 978,118
DBUBS Mortgage TrustSeries 2011-LC2A Class A1(b)(h)
07/10/44 3.527% 1,751,761 1,918,341
JPMorgan Chase Commercial Mortgage Securities Corp.Series 2012-C6 Class A3(h)
05/15/45 3.507% 1,000,000 1,090,592
Residential Mortgage-Backed Securities —
Non-Agency (continued)
Coupon Principal
Issuer Rate Amount ($) Value ($)
Residential Mortgage-Backed Securities —
Agency(g) (continued)
Coupon Principal
Issuer Rate Amount ($) Value ($)
CMO IO Series 2012-41 Class SA03/20/42 6.389% 10,064,830 2,720,306CMO IO Series 2012-48 Class SA04/16/42 6.441% 2,082,406 438,651
Government National Mortgage Association(h)
04/15/40 4.500% 2,101,988 2,320,159
Government National Mortgage Association(h)(i)
CMO IO Series 2010-167 Class GI02/20/38 4.000% 3,604,709 405,854CMO IO Series 2012-94 Class BI05/20/37 4.000% 11,431,137 1,761,995
Government National Mortgage Association(h)(j)
01/01/43 3.000% 4,000,000 4,251,875
Total Residential Mortgage-Backed
Securities — Agency
(Cost: $122,279,395) 124,317,291
Residential Mortgage-Backed Securities —
Non-Agency 4.6%
BCAP LLC Trust(b)(c)(h)
CMO Series 2010-RR7 Class 17A703/26/36 5.019% 780,000 647,157
BCAP LLC Trust(b)(h)
CMO Series 2010-RR7 Class 8A605/26/35 5.500% 1,145,000 1,133,637
Banc of America Funding Corp.CMO Series 2012-R5 Class A(b)(c)(h)
10/03/39 0.474% 3,397,757 3,288,769
Bayview Opportunity Master Fund Trust IIB LP(b)(c)(h)
Series 2012-4NPL Class A07/28/32 3.475% 2,649,998 2,684,675Series 2012-5NPL Class A10/28/32 2.981% 4,761,454 4,761,454
Castle Peak Loan Trust(b)(h)
CMO Series 2011-1 Class 22A105/25/52 6.250% 377,998 377,998CMO Series 2012-1A Class A105/25/52 5.000% 4,234,484 4,234,484
Citigroup Mortgage Loan Trust, Inc.(b)(c)(h)
CMO Series 2009-3 Class 4A310/25/33 2.508% 2,635,000 1,682,783CMO Series 2009-4 Class 9A203/25/36 2.644% 1,365,000 1,088,237CMO Series 2010-6 Class 2A209/25/35 2.654% 515,000 334,737CMO Series 2010-6 Class 3A207/25/36 2.614% 2,215,000 1,956,998
The accompanying Notes to Financial Statements are an integral part of this statement.
Columbia Variable Portfolio — Strategic Income Fund
Portfolio of Investments (continued)December 31, 2012
Annual Report 2012 19
02/15/22 2.000% 1,215,000 1,256,48108/15/22 1.625% 1,490,000 1,480,22311/15/41 3.125% 10,080,000 10,550,92702/15/42 3.125% 40,000 41,82505/15/42 3.000% 165,000 168,09408/15/42 2.750% 10,705,000 10,337,016
Total U.S. Treasury Obligations(Cost: $37,470,214) 39,503,446
Foreign Government Obligations(a) 21.5%
Argentina 0.3%
Argentina Boden BondsSenior Unsecured10/03/15 7.000% 1,595,000 1,451,450
Argentina Bonar BondsSenior Unsecured04/17/17 7.000% 836,000 706,420
Provincia de Buenos AiresSenior Unsecured(b)
01/26/21 10.875% 1,110,000 821,400
Provincia de CordobaSenior Unsecured(b)
08/17/17 12.375% 880,000 726,000
Total 3,705,270
Australia 0.7%
Treasury Corp. of VictoriaLocal Government Guaranteed11/15/16 5.750% AUD 3,850,000 4,362,49906/15/20 6.000% AUD 2,550,000 3,037,556
Total 7,400,055
Brazil 1.0%
Brazilian Government International BondSenior Unsecured01/05/24 8.500% BRL 3,250,000 1,932,54001/20/34 8.250% 2,285,000 3,844,512
Morgan StanleySenior Unsecured10/22/20 11.500% BRL 3,415,000 1,938,889
Petrobras International Finance Co.03/15/19 7.875% 1,535,000 1,917,33201/27/21 5.375% 600,000 674,160
Total 10,307,433
U.S. Treasury Obligations (continued)
Coupon Principal
Issuer Rate Amount ($) Value ($)
Commercial Mortgage-Backed Securities —
Non-Agency (continued)
Coupon Principal
Issuer Rate Amount ($) Value ($)
Morgan Stanley Capital I, Inc.(c)(h)
Series 2005-IQ10 Class A4A09/15/42 5.230% 500,000 550,294
Morgan Stanley Capital I, Inc.(h)
Series 2005-HQ5 Class A401/14/42 5.168% 2,635,000 2,825,392Series 2005-HQ6 Class A4A08/13/42 4.989% 175,000 191,191
Morgan Stanley Reremic TrustSeries 2010-GG10 Class A4A(b)(c)(h)
08/15/45 5.789% 7,050,000 8,225,446
S2 Hospitality LLCSeries 2012-LV1 Class A(b)(h)
04/15/25 4.500% 1,088,024 1,089,643
Total Commercial Mortgage-Backed Securities — Non-Agency(Cost: $15,826,807) 16,869,017
Asset-Backed Securities — Non-Agency 0.2%
American Credit Acceptance Receivables TrustSeries 2012-3 Class A(b)
11/15/16 1.640% 1,700,000 1,700,205
GMAC Mortgage Corp Loan TrustSeries 2004-HE5 Class A5 (FGIC)(c)
09/25/34 5.865% 236,888 179,980
Total Asset-Backed Securities — Non-Agency(Cost: $1,936,826) 1,880,185
Inflation-Indexed Bonds(a) 1.1%
Uruguay 1.1%
Uruguay Government International Bond04/05/27 4.250% UYU 110,986,462 6,737,924Senior Unsecured12/15/28 4.375% UYU 73,106,500 4,544,262
Total 11,282,186
Total Inflation-Indexed Bonds(Cost: $9,921,594) 11,282,186
U.S. Treasury Obligations 3.8%
U.S. Treasury12/31/13 0.125% 3,103,400 3,101,46005/31/17 0.625% 800,000 801,24902/15/20 3.625% 10,070,000 11,766,171
The accompanying Notes to Financial Statements are an integral part of this statement.
Columbia Variable Portfolio — Strategic Income Fund
Portfolio of Investments (continued)December 31, 2012
Annual Report 201220

Georgia —%
Georgian Railway JSCSenior Unsecured(b)
07/11/22 7.750% 442,000 504,380
Germany 1.5%
Bundesrepublik Deutschland06/20/16 6.000% EUR 245,000 388,91807/04/17 4.250% EUR 4,260,000 6,632,77201/04/19 3.750% EUR 5,555,000 8,712,300
Total 15,733,990
Hungary 0.1%
Hungary Government International BondSenior Unsecured02/03/15 4.750% 80,000 82,400
Magyar Export-Import Bank RT(b)
02/12/18 5.500% 500,000 504,990
Total 587,390
Indonesia 1.5%
Indonesia Government International Bond(b)
Senior Unsecured04/20/15 7.250% 1,655,000 1,863,94403/13/20 5.875% 5,630,000 6,784,150
Indonesia Treasury BondSenior Unsecured06/15/15 9.500% IDR 6,476,000,000 747,15807/15/17 10.000% IDR 4,979,000,000 624,70509/15/19 11.500% IDR 8,500,000,000 1,202,69807/15/22 10.250% IDR 10,680,000,000 1,505,96509/15/24 10.000% IDR 4,500,000,000 637,402
Majapahit Holding BV(b)
08/07/19 8.000% 1,000,000 1,265,00006/29/37 7.875% 540,000 741,150
Total 15,372,172
Japan 0.3%
Japan Government 10-Year BondSenior Unsecured12/20/18 1.400% JPY 15,000,000 184,821
Japan Government 20-Year BondSenior Unsecured09/20/26 2.200% JPY 270,000,000 3,508,242
Total 3,693,063
Kazakhstan 0.3%
KazMunaiGaz Finance Sub BV(b)
07/02/18 9.125% 1,875,000 2,479,687
Foreign Government Obligations(a) (continued)
Coupon Principal
Issuer Rate Amount ($) Value ($)
Foreign Government Obligations(a) (continued)
Coupon Principal
Issuer Rate Amount ($) Value ($)
Canada 0.8%
Canadian Government Bond06/01/18 4.250% CAD 500,000 576,04806/01/19 3.750% CAD 6,600,000 7,522,15606/01/23 8.000% CAD 85,000 134,877
Total 8,233,081
Colombia 1.0%
Colombia Government International BondSenior Unsecured05/21/24 8.125% 285,000 428,92501/18/41 6.125% 2,070,000 2,823,609
Ecopetrol SASenior Unsecured07/23/19 7.625% 1,200,000 1,551,000
Empresa de Energia de Bogota SASenior Unsecured(b)
11/10/21 6.125% 1,050,000 1,177,096
Empresas Publicas de Medellin ESPSenior Unsecured(b)
02/01/21 8.375% COP 5,280,000,000 3,451,572
Transportadora de Gas Internacional SA ESPSenior Unsecured(b)
03/20/22 5.700% 1,000,000 1,103,876
Total 10,536,078
Dominican Republic 0.3%
Dominican Republic International Bond(b)
Senior Unsecured05/06/21 7.500% 1,675,000 1,942,55104/20/27 8.625% 1,300,000 1,565,200
Total 3,507,751
El Salvador 0.1%
El Salvador Government International BondSenior Unsecured(b)
02/01/41 7.625% 600,000 681,000
Finland 0.2%
Finland Government BondSenior Unsecured07/04/15 4.250% EUR 1,160,000 1,692,363
France 1.0%
France Government Bond OAT04/25/17 3.750% EUR 450,000 674,75910/25/18 4.250% EUR 1,000,000 1,563,24104/25/19 4.250% EUR 4,080,000 6,412,98704/25/29 5.500% EUR 1,160,000 2,121,858
Total 10,772,845
The accompanying Notes to Financial Statements are an integral part of this statement.
Columbia Variable Portfolio — Strategic Income Fund
Portfolio of Investments (continued)December 31, 2012
Annual Report 2012 21

Netherlands 0.4%
Netherlands Government Bond(b)
07/15/16 4.000% EUR 2,565,000 3,834,628
New Zealand 0.2%
New Zealand Government BondSenior Unsecured05/15/21 6.000% NZD 2,725,000 2,676,890
Norway 0.8%
Norway Government Bond05/19/17 4.250% NOK 40,900,000 8,197,507
Peru 0.5%
Corporacion Financiera de Desarrollo SASenior Unsecured(b)
02/08/22 4.750% 1,000,000 1,097,152
Peruvian Government International BondSenior Unsecured05/03/16 8.375% 510,000 627,55507/21/25 7.350% 1,210,000 1,753,29011/21/33 8.750% 205,000 356,18711/18/50 5.625% 700,000 907,550
Peruvian Government International Bond(b)
Senior Unsecured08/12/20 7.840% PEN 1,500,000 740,627
Total 5,482,361
Philippines 0.3%
Philippine Government International BondSenior Unsecured01/15/21 4.950% PHP 14,000,000 371,39901/14/36 6.250% PHP 46,000,000 1,333,933
Power Sector Assets & Liabilities Management Corp.(b)
Government Guaranteed05/27/19 7.250% 720,000 924,30012/02/24 7.390% 610,000 850,275
Total 3,479,907
Poland 1.0%
Poland Government Bond10/24/15 6.250% PLN 13,600,000 4,759,68210/25/19 5.500% PLN 9,280,000 3,391,158
Poland Government International BondSenior Unsecured03/23/22 5.000% 2,250,000 2,657,250
Total 10,808,090
Foreign Government Obligations(a) (continued)
Coupon Principal
Issuer Rate Amount ($) Value ($)
Foreign Government Obligations(a) (continued)
Coupon Principal
Issuer Rate Amount ($) Value ($)
Senior Unsecured04/09/21 6.375% 600,000 734,280
Total 3,213,967
Latvia 0.1%
Republic of LatviaSenior Unsecured(b)
06/16/21 5.250% 650,000 755,630
Lithuania 0.2%
Lithuania Government International Bond(b)
Senior Unsecured03/09/21 6.125% 600,000 737,59002/01/22 6.625% 1,250,000 1,596,241
Total 2,333,831
Malaysia —%
Petronas Capital Ltd.08/12/19 5.250% 75,000 89,016
Mexico 1.8%
Comision Federal De ElectricidadSenior Unsecured(b)
02/14/42 5.750% 300,000 339,750
Mexican Bonos06/16/16 6.250% MXN 2,000,000 1,609,26512/15/16 7.250% MXN 500,000 417,47712/13/18 8.500% MXN 3,663,500 3,316,28306/09/22 6.500% MXN 3,500,000 2,932,07906/03/27 7.500% MXN 2,515,000 2,263,553
Mexico Government International BondSenior Unsecured01/11/40 6.050% 1,430,000 1,917,630
Pemex Finance Ltd.Senior Unsecured11/15/18 9.150% 310,000 383,719Senior Unsecured (NPFGC)08/15/17 10.610% 215,000 259,786
Pemex Project Funding Master Trust03/01/18 5.750% 2,420,000 2,825,35001/21/21 5.500% 1,000,000 1,168,500
Petroleos Mexicanos06/02/41 6.500% 1,000,000 1,255,000
Total 18,688,392
Mongolia 0.1%
Mongolia Government International BondSenior Unsecured(b)
12/05/22 5.125% 700,000 684,668
The accompanying Notes to Financial Statements are an integral part of this statement.
Columbia Variable Portfolio — Strategic Income Fund
Portfolio of Investments (continued)December 31, 2012
Annual Report 201222

South Africa 0.1%
South Africa Government International BondSenior Unsecured03/09/20 5.500% 430,000 509,550
Transnet SOC Ltd.Senior Unsecured(b)
07/26/22 4.000% 700,000 703,432
Total 1,212,982
South Korea 0.2%
Export-Import Bank of KoreaSenior Unsecured04/11/22 5.000% 1,800,000 2,082,175
Sweden 0.8%
Sweden Government Bond08/12/17 3.750% SEK 43,765,000 7,561,46612/01/20 5.000% SEK 3,100,000 603,944
Total 8,165,410
Trinidad And Tobago 0.2%
Petroleum Co. of Trinidad & Tobago Ltd.Senior Unsecured(b)
08/14/19 9.750% 1,290,000 1,711,761
Turkey 1.0%
Turkey Government International Bond01/14/41 6.000% 1,700,000 2,120,750Senior Unsecured03/30/21 5.625% 3,050,000 3,621,87509/26/22 6.250% 250,000 311,62502/05/25 7.375% 3,540,000 4,796,700
Total 10,850,950
Ukraine 0.1%
City of Kyiv Via Kyiv Finance PLCSenior Unsecured(b)
07/11/16 9.375% 600,000 554,268
National JSC Naftogaz of UkraineGovernment Guaranteed09/30/14 9.500% 335,000 345,085
Total 899,353
United Arab Emirates 0.2%
Abu Dhabi National Energy Co.Senior Unsecured(b)
12/13/21 5.875% 700,000 835,426
Dolphin Energy Ltd.Senior Secured(b)
12/15/21 5.500% 1,000,000 1,145,076
Total 1,980,502
Foreign Government Obligations(a) (continued)
Coupon Principal
Issuer Rate Amount ($) Value ($)
Foreign Government Obligations(a) (continued)
Coupon Principal
Issuer Rate Amount ($) Value ($)
Qatar 0.1%
Nakilat, Inc.Senior Secured(b)
12/31/33 6.067% 180,000 217,800
Qatar Government International BondSenior Unsecured(b)
01/20/22 4.500% 600,000 688,500
Total 906,300
Republic of Namibia 0.1%
Namibia International BondsSenior Unsecured(b)
11/03/21 5.500% 800,000 896,000
Republic of the Congo 0.1%
Republic of CongoSenior Unsecured(c)
06/30/29 3.000% 617,500 534,138
Romania 0.1%
Romanian Government International BondSenior Unsecured(b)
02/07/22 6.750% 800,000 970,836
Russian Federation 1.6%
Gazprom OAO Via Gaz Capital SA(b)
Senior Unsecured04/11/18 8.146% 3,115,000 3,842,35303/07/22 6.510% 1,460,000 1,741,050
Russian Foreign Bond — EurobondSenior Unsecured03/31/30 7.500% 142,600 183,155
Russian Foreign Bond — Eurobond(b)
Senior Unsecured03/10/18 7.850% RUB 20,000,000 713,53803/31/30 7.500% 3,561,125 4,573,909
Russian Railways via RZD Capital Ltd.Senior Unsecured04/02/19 8.300% RUB 16,000,000 543,273
Sberbank of Russia Via SB Capital SASenior Unsecured(b)
02/07/22 6.125% 1,700,000 1,939,204
VTB Bank OJSC Via VTB Capital SASenior Unsecured(b)
04/12/17 6.000% 600,000 648,600
Vnesheconombank Via VEB Finance PLCSenior Unsecured(b)
11/22/25 6.800% 2,190,000 2,682,750
Total 16,867,832
The accompanying Notes to Financial Statements are an integral part of this statement.
Columbia Variable Portfolio — Strategic Income Fund
Portfolio of Investments (continued)December 31, 2012
Annual Report 2012 23

Silver II Borrower SCATerm Loan(c)(j)(n)
11/20/19 5.000% 800,000 807,000
TransDigm, Inc.Tranche B2 Term Loan(c)(n)
02/14/17 4.000% 299,246 301,116
Total 1,199,366
Airlines 0.1%
Delta Air Lines, Inc.(c)(n)
Tranche B1 Term Loan10/18/18 5.250% 150,000 151,088Tranche B2 Term Loan04/18/16 4.250% 350,000 350,983
U.S. Airways Group, Inc.Term Loan(c)(n)
03/21/14 2.712% 486,111 478,941
United Air Lines, Inc.Tranche B Term Loan(c)(n)
02/01/14 2.250% 266,997 266,108
Total 1,247,120
Automotive 0.2%
Allison Transmission, Inc.Tranche B1 Term Loan(c)(n)
08/07/14 2.710% 123,801 124,239
Chrysler Group LLCTranche B Term Loan(c)(n)
05/24/17 6.000% 395,489 403,288
Federal-Mogul Corp.(c)(n)
Tranche B Term Loan12/29/14 2.148% 196,793 180,804Tranche C Term Loan12/28/15 2.148% 100,405 92,247
Goodyear Tire & Rubber Co. (The)2nd Lien Term Loan(c)(n)
04/30/19 4.750% 300,000 301,641
Navistar, Inc.Tranche B Term Loan(c)(n)
08/17/17 7.000% 200,000 200,500
Schaeffler AGTranche B2 Term Loan(c)(n)
01/27/17 6.000% 250,000 252,657
Total 1,555,376
Brokerage 0.1%
Nuveen Investments, Inc.(c)(n)
1st Lien Term Loan05/13/17 5.811% 325,000 326,13805/13/17 7.250% 125,000 125,430
Senior Loans (continued)
Weighted
Average Principal
Borrower Coupon Amount ($) Value ($)
Foreign Government Obligations(a) (continued)
Coupon Principal
Issuer Rate Amount ($) Value ($)
United Kingdom 0.8%
United Kingdom Gilt03/07/18 5.000% GBP 1,400,000 2,743,24509/07/19 3.750% GBP 200,000 377,87609/07/21 3.750% GBP 500,000 953,95803/07/25 5.000% GBP 2,050,000 4,395,728
Total 8,470,807
Uruguay 0.1%
Uruguay Government International BondSenior Unsecured PIK01/15/33 7.875% 935,000 1,445,978
Venezuela 1.5%
Petroleos de Venezuela SA04/12/17 5.250% 4,660,000 4,065,85011/02/17 8.500% 5,835,000 5,762,06302/17/22 12.750% 180,300 202,657
Venezuela Government International BondSenior Unsecured05/07/23 9.000% 5,636,000 5,466,920
Total 15,497,490
Total Foreign Government Obligations
(Cost: $195,175,962) 225,464,272
Municipal Bonds —%
Issue Coupon Principal
Description Rate Amount ($) Value ($)
Cabazon Band Mission IndiansRevenue BondsSeries 2004(b)(e)(l)(m)
10/01/11 13.000% 350,000 210,000
Total Municipal Bonds
(Cost: $350,000) 210,000
Senior Loans 5.9%
Weighted
Average Principal
Borrower Coupon Amount ($) Value ($)
Aerospace & Defense 0.1%
Huntington Ingalls Industries, Inc.Term Loan(c)(n)
03/30/16 2.750% 91,250 91,250
The accompanying Notes to Financial Statements are an integral part of this statement.
Columbia Variable Portfolio — Strategic Income Fund
Portfolio of Investments (continued)December 31, 2012
Annual Report 201224
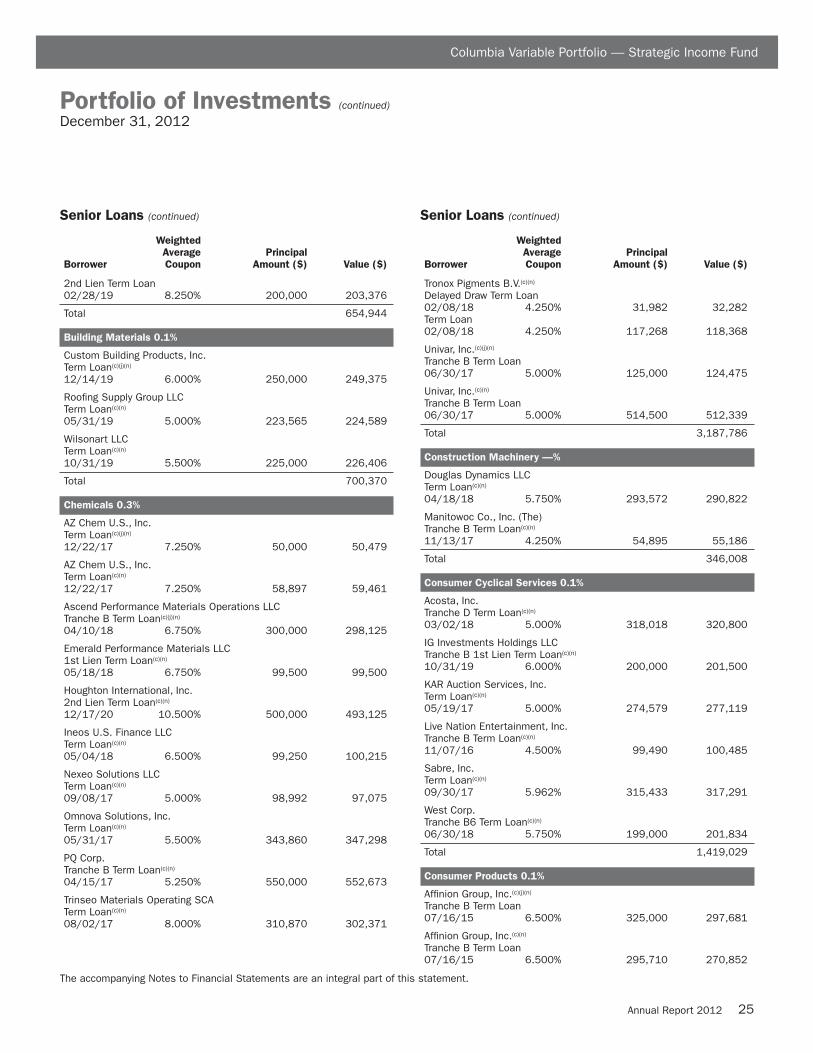
25Annual Report 2012
Portfolio of Investments (continued)December 31, 2012
Columbia Variable Portfolio — Strategic Income Fund
The accompanying Notes to Financial Statements are an integral part of this statement.
2nd Lien Term Loan02/28/19 8.250% 200,000 203,376
Total 654,944
Building Materials 0.1%
Custom Building Products, Inc.Term Loan(c)(j)(n)
12/14/19 6.000% 250,000 249,375
Roofing Supply Group LLCTerm Loan(c)(n)
05/31/19 5.000% 223,565 224,589
Wilsonart LLCTerm Loan(c)(n)
10/31/19 5.500% 225,000 226,406
Total 700,370
Chemicals 0.3%
AZ Chem U.S., Inc.Term Loan(c)(j)(n)
12/22/17 7.250% 50,000 50,479
AZ Chem U.S., Inc.Term Loan(c)(n)
12/22/17 7.250% 58,897 59,461
Ascend Performance Materials Operations LLCTranche B Term Loan(c)(j)(n)
04/10/18 6.750% 300,000 298,125
Emerald Performance Materials LLC1st Lien Term Loan(c)(n)
05/18/18 6.750% 99,500 99,500
Houghton International, Inc.2nd Lien Term Loan(c)(n)
12/17/20 10.500% 500,000 493,125
Ineos U.S. Finance LLCTerm Loan(c)(n)
05/04/18 6.500% 99,250 100,215
Nexeo Solutions LLCTerm Loan(c)(n)
09/08/17 5.000% 98,992 97,075
Omnova Solutions, Inc.Term Loan(c)(n)
05/31/17 5.500% 343,860 347,298
PQ Corp.Tranche B Term Loan(c)(n)
04/15/17 5.250% 550,000 552,673
Trinseo Materials Operating SCATerm Loan(c)(n)
08/02/17 8.000% 310,870 302,371
Senior Loans (continued)
Weighted
Average Principal
Borrower Coupon Amount ($) Value ($)
Senior Loans (continued)
Weighted
Average Principal
Borrower Coupon Amount ($) Value ($)
Tronox Pigments B.V.(c)(n)
Delayed Draw Term Loan02/08/18 4.250% 31,982 32,282Term Loan02/08/18 4.250% 117,268 118,368
Univar, Inc.(c)(j)(n)
Tranche B Term Loan06/30/17 5.000% 125,000 124,475
Univar, Inc.(c)(n)
Tranche B Term Loan06/30/17 5.000% 514,500 512,339
Total 3,187,786
Construction Machinery —%
Douglas Dynamics LLCTerm Loan(c)(n)
04/18/18 5.750% 293,572 290,822
Manitowoc Co., Inc. (The)Tranche B Term Loan(c)(n)
11/13/17 4.250% 54,895 55,186
Total 346,008
Consumer Cyclical Services 0.1%
Acosta, Inc.Tranche D Term Loan(c)(n)
03/02/18 5.000% 318,018 320,800
IG Investments Holdings LLCTranche B 1st Lien Term Loan(c)(n)
10/31/19 6.000% 200,000 201,500
KAR Auction Services, Inc.Term Loan(c)(n)
05/19/17 5.000% 274,579 277,119
Live Nation Entertainment, Inc.Tranche B Term Loan(c)(n)
11/07/16 4.500% 99,490 100,485
Sabre, Inc.Term Loan(c)(n)
09/30/17 5.962% 315,433 317,291
West Corp.Tranche B6 Term Loan(c)(n)
06/30/18 5.750% 199,000 201,834
Total 1,419,029
Consumer Products 0.1%
Affinion Group, Inc.(c)(j)(n)
Tranche B Term Loan07/16/15 6.500% 325,000 297,681
Affinion Group, Inc.(c)(n)
Tranche B Term Loan07/16/15 6.500% 295,710 270,852

26 Annual Report 2012
Portfolio of Investments (continued)December 31, 2012
Columbia Variable Portfolio — Strategic Income Fund
The accompanying Notes to Financial Statements are an integral part of this statement.
Fender Musical Instruments Corp.(c)(n)
Delayed Draw Term Loan06/09/14 2.470% 71,662 71,160Term Loan06/09/14 2.470% 141,817 140,824
Jarden Corp.Tranche B Term Loan(c)(n)
03/31/18 3.212% 147,560 148,207
Serta Simmons Holdings LLCTerm Loan(c)(n)
10/01/19 5.000% 150,000 150,125
Total 1,078,849
Diversified Manufacturing 0.3%
Colfax Corp.(c)(j)(n)
Tranche B Term Loan01/11/19 4.500% 525,000 528,197
Colfax Corp.(c)(n)
Tranche B Term Loan01/11/19 4.500% 123,750 124,504
Generac Power System, Inc.Term Loan(c)(n)
05/30/18 6.250% 399,000 407,311
IMG Worldwide, Inc.Tranche B Term Loan(c)(n)
06/16/16 5.500% 369,375 370,298
MRC GlobalTranche B Term Loan(c)(n)
11/08/19 6.250% 124,688 124,999
QS0001 Corp.(c)(j)(n)
1st Lien Term Loan11/09/18 4.250% 525,000 529,268
QS0001 Corp.(c)(n)
2nd Lien Term Loan05/11/20 9.250% 325,000 331,500
Rexnord LLC/RBS Global, Inc.Tranche B Term Loan(c)(n)
04/01/18 4.500% 274,312 276,255
Tomkins LLC/Inc.Tranche B1 Term Loan(c)(n)
09/29/16 4.250% 427,118 429,164
Total 3,121,496
Electric 0.2%
Calpine Corp.(c)(n)
Term Loan04/01/18 4.500% 147,750 149,01804/01/18 4.500% 270,680 273,002
Equipower Resources Holdings LLCTranche B 1st Lien Term Loan(c)(n)
12/21/18 5.500% 124,437 125,785
Senior Loans (continued)
Weighted
Average Principal
Borrower Coupon Amount ($) Value ($)
Senior Loans (continued)
Weighted
Average Principal
Borrower Coupon Amount ($) Value ($)
Essential Power LLCTerm Loan(c)(n)
08/08/19 5.500% 192,421 195,066
FREIF North American Power I LLC(c)(n)
Tranche B Term Loan03/29/19 6.000% 85,979 86,624Tranche C Term Loan03/29/19 6.000% 13,580 13,682
LSP Madison Funding LLCTerm Loan(c)(n)
06/28/19 5.500% 95,100 96,468
NRG Energy, Inc.Term Loan(c)(n)
07/01/18 4.000% 295,500 298,387
TPF Generation Holdings LLC1st Lien Synthetic Letter of Credit(c)(n)
12/15/13 2.311% 45,620 45,506
Texas Competitive Electric Holdings Co. LLCTerm Loan(c)(n)
10/10/14 3.746% 624,903 470,046
Windsor Financing LLCTranche B Term Loan(c)(e)(j)(n)
12/07/17 6.250% 125,000 125,156
Total 1,878,740
Entertainment 0.2%
24 Hour Fitness Worldwide, Inc.Tranche B Term Loan(c)(n)
04/22/16 7.500% 1,226,412 1,234,727
Alpha Topco Ltd.Tranche B2 Term Loan(c)(n)
04/30/19 6.000% 446,631 452,589
Cinemark USA, Inc.Term Loan(c)(n)
12/18/19 3.210% 325,000 324,662
Six Flags Theme Parks, Inc.Tranche B Term Loan(c)(n)
12/20/18 4.000% 84,620 84,922
Zuffa LLCTerm Loan(c)(n)
06/19/15 7.500% 297,714 299,111
Total 2,396,011
Environmental 0.1%
ADS Waste Holdings, Inc.Term Loan(c)(n)
10/09/19 5.250% 100,000 101,125
EnviroSolutions Real Property Holdings, Inc.2nd Lien Term Loan(c)(n)
07/29/14 8.000% 628,235 623,002

27Annual Report 2012
Portfolio of Investments (continued)December 31, 2012
Columbia Variable Portfolio — Strategic Income Fund
The accompanying Notes to Financial Statements are an integral part of this statement.
WCA Waste Corp.Term Loan(c)(n)
03/23/18 5.500% 99,250 99,746
Total 823,873
Food and Beverage 0.3%
AdvancePierre Foods, Inc.1st Lien Term Loan(c)(n)
07/10/17 5.750% 750,000 757,500
Aramark Corp.Tranche C Term Loan(c)(j)(n)
07/26/16 3.515% 475,000 475,252
Del Monte Foods Co.Term Loan(c)(n)
03/08/18 4.500% 608,504 608,887
JBS U.S.A. LLCTerm Loan(c)(n)
05/25/18 4.250% 98,500 98,131
Pinnacle Foods Finance LLCTranche F Term Loan(c)(n)
10/17/18 4.750% 99,500 100,308
U.S. Foods, Inc.Term Loan(c)(n)
03/31/17 5.750% 220,624 220,417
Windsor Quality Food Co., Ltd.Tranche B Term Loan(c)(n)
02/16/17 5.000% 363,200 359,869
Total 2,620,364
Gaming 0.3%
Affinity Gaming LLCTerm Loan(c)(n)
11/09/17 5.500% 99,250 100,118
Caesars Entertainment Operating Co., Inc.Tranche B2 Term Loan(c)(n)
01/28/15 3.210% 400,000 393,232
Caesars Octavius LLCTranche B Term Loan(c)(n)
04/25/17 9.250% 325,000 329,875
Cannery Casino Resorts LLC(c)(n)
1st Lien Term Loan10/02/18 6.000% 99,750 99,8332nd Lien Term Loan10/02/19 10.000% 100,000 94,917
Las Vegas Sands LLC(c)(n)
Tranche B Term Loan11/23/16 2.760% 130,907 131,088Tranche I Delayed Draw Term Loan11/23/16 2.760% 16,454 16,477
Senior Loans (continued)
Weighted
Average Principal
Borrower Coupon Amount ($) Value ($)
Senior Loans (continued)
Weighted
Average Principal
Borrower Coupon Amount ($) Value ($)
MGM Resorts InternationalTranche B Term Loan(c)(n)
12/20/19 4.250% 500,000 504,875
Peppermill Casinos, Inc.(c)(j)(n)
Tranche B Term Loan11/09/18 7.250% 150,000 146,063
Peppermill Casinos, Inc.(c)(n)
Tranche B Term Loan11/09/18 7.250% 250,000 243,437
Pinnacle Entertainment, Inc.Tranche A Term Loan(c)(n)
03/19/19 4.000% 272,938 274,302
ROC Finance LLC(c)(j)(n)(o)
Tranche B Delayed Draw Term Loan08/19/17 2.250% 8,333 8,58308/19/17 2.250% 5,000 5,150
ROC Finance LLC(c)(n)
Tranche B Term Loan08/19/17 8.500% 111,667 115,017
Stockbridge/SBE HoldingsTranche B Term Loan(c)(n)
05/02/17 13.000% 125,000 124,375
Twin River Worldwide Holdings, Inc.Term Loan(c)(n)
11/05/15 8.500% 418,889 420,983
Total 3,008,325
Gas Pipelines —%
Energy Transfer Equity LP(c)(j)(n)
Term Loan03/24/17 3.750% 300,000 301,950
Energy Transfer Equity LP(c)(n)
Term Loan03/24/17 3.750% 100,000 100,650
Total 402,600
Health Care 0.5%
Alere, Inc.Tranche B Term Loan(c)(n)
06/30/17 4.750% 491,459 493,036
Bausch & Lomb, Inc.Term Loan(c)(n)
05/17/19 5.250% 199,000 200,421
Community Health Systems, Inc.Term Loan(c)(j)(n)
01/25/17 4.057% 825,000 829,430
ConvaTec, Inc.Term Loan(c)(n)
12/22/16 5.000% 314,601 318,008

28 Annual Report 2012
Portfolio of Investments (continued)December 31, 2012
Columbia Variable Portfolio — Strategic Income Fund
The accompanying Notes to Financial Statements are an integral part of this statement.
DaVita, Inc.Tranche B Term Loan(c)(n)
11/01/19 4.000% 225,000 226,195
HCA, Inc.Tranche B3 Term Loan(c)(j)(n)
05/01/18 3.459% 800,000 801,664
Health Management Associates, Inc.Tranche B Term Loan(c)(n)
11/16/18 4.500% 123,750 124,619
IASIS Healthcare LLCTranche B Term Loan(c)(n)
05/03/18 5.000% 639,739 640,737
MedAssets, Inc.Tranche B Term Loan(c)(j)(n)
12/11/19 4.000% 250,000 249,875
Onex Carestream Finance LPTerm Loan(c)(n)
02/25/17 5.000% 368,236 366,509
Quintiles Transnational Corp.Tranche B2 Term Loan(c)(n)
06/08/18 4.500% 467,875 470,214
Select Medical Corp.Tranche B Term Loan(c)(n)
06/01/18 5.500% 123,125 123,494
inVentiv Health, Inc.Term Loan(c)(n)
08/04/16 7.500% 106,379 103,188
Total 4,947,390
Independent Energy —%
Plains Exploration & Production Co.Term Loan(c)(j)(n)
12/01/19 4.000% 325,000 326,017
Integrated Energy —%
Gibson Energy ULCTranche B Term Loan(c)(n)
06/15/18 4.750% 120,414 122,069
Life Insurance —%
Alliant Holdings I, Inc.Term Loan(c)(j)(n)
11/26/19 5.000% 100,000 100,100
Media Cable 0.1%
Cequel Communications LLCTerm Loan(c)(n)
02/14/19 4.000% 198,500 199,288
Senior Loans (continued)
Weighted
Average Principal
Borrower Coupon Amount ($) Value ($)
Senior Loans (continued)
Weighted
Average Principal
Borrower Coupon Amount ($) Value ($)
MCC Iowa LLC(c)(n)
Tranche F Term Loan10/23/17 4.500% 318,467 318,866Tranche G Term Loan01/20/20 4.000% 199,500 199,416
Mediacom Illinois LLCTranche E Term Loan(c)(n)
10/23/17 4.500% 489,950 487,706
Total 1,205,276
Media Non-Cable 0.5%
Clear Channel Communications, Inc.Tranche B Term Loan(c)(n)
01/29/16 3.862% 558,510 460,335
Cumulus Media Holdings, Inc.(c)(n)
1st Lien Term Loan09/17/18 4.500% 563,581 564,8152nd Lien Term Loan09/16/19 7.500% 350,000 360,063
Encompass Digital Media, Inc.Tranche B Term Loan(c)(n)
08/10/17 8.000% 447,750 451,108
Getty Images, Inc.(c)(j)(n)
Term Loan10/18/19 4.750% 550,000 550,000
Getty Images, Inc.(c)(n)
Term Loan10/18/19 4.750% 200,000 200,000
Granite BroadcastingTranche B 1st Lien Term Loan(c)(n)
05/23/18 8.500% 199,000 198,503
Gray Television, Inc.Term Loan(c)(n)
10/12/19 4.750% 168,694 169,677
Hubbard Radio LLC1st Lien Term Loan(c)(n)
04/28/17 5.250% 120,971 121,878
Intelsat Jackson Holdings SATranche B Term Loan(c)(n)
04/02/18 4.500% 297,739 300,034
National CineMedia LLCTerm Loan(c)(n)
11/26/19 3.470% 200,000 199,750
Radio One, Inc.Term Loan(c)(n)
03/31/16 7.500% 390,943 395,505
Tribune Co.Tranche B Term Loan(c)(j)(n)
12/31/19 4.000% 225,000 224,438

29Annual Report 2012
Portfolio of Investments (continued)December 31, 2012
Columbia Variable Portfolio — Strategic Income Fund
The accompanying Notes to Financial Statements are an integral part of this statement.
Univision Communications, Inc.1st Lien Term Loan(c)(n)
03/31/17 4.462% 475,456 467,212
Van Wagner Communications LLCTerm Loan(c)(n)
08/03/18 8.250% 150,000 151,376
Total 4,814,694
Metals 0.3%
Essar Steel Algoma, Inc.Term Loan(c)(n)
09/19/14 8.750% 124,688 122,817
FMG Resources August 2006 Proprietary Ltd.(c)(j)(n)
Term Loan10/18/17 5.250% 531,667 535,655
FMG Resources August 2006 Proprietary Ltd.(c)(n)
Term Loan10/18/17 5.250% 2,300,235 2,317,487
Metals USA, Inc.Tranche B Term Loan(c)(n)
12/14/19 6.250% 250,000 247,812
Novelis, Inc.Tranche B2 Term Loan(c)(n)
03/10/17 4.000% 222,187 223,994
Total 3,447,765
Non-Captive Consumer —%
Springleaf Financial Funding Co.Term Loan(c)(n)
05/10/17 5.500% 400,000 397,356
Non-Captive Diversified —%
Istar Financial, Inc.Term Loan(c)(n)
10/15/17 5.750% 240,998 242,606
Oil Field Services —%
FTS International, Inc.Term Loan(c)(n)
05/06/16 8.500% 330,307 273,494
Other Financial Institutions 0.1%
Alix Partners LLP(c)(j)(n)
Tranche B2 1st Lien Term Loan06/28/19 6.500% 300,000 303,375
Alix Partners LLP(c)(n)
Tranche B2 1st Lien Term Loan06/28/19 6.500% 149,250 150,929
Total 454,304
Senior Loans (continued)
Weighted
Average Principal
Borrower Coupon Amount ($) Value ($)
Senior Loans (continued)
Weighted
Average Principal
Borrower Coupon Amount ($) Value ($)
Other Industry 0.1%
Advantage Sales & Marketing, Inc.1st Lien Term Loan(c)(n)
12/18/17 5.250% 73,500 73,941
Harland Clarke Holdings Corp.Tranche B1 Term Loan(c)(n)
06/30/14 2.712% 293,782 282,974
On Assignment, Inc.Tranche B Term Loan(c)(n)
05/15/19 5.000% 114,414 115,701
Sensus U.S.A., Inc.2nd Lien Term Loan(c)(n)
05/09/18 8.500% 350,000 350,000
WireCo WorldGroup, Inc.Term Loan(c)(n)
02/15/17 6.000% 249,375 253,739
Total 1,076,355
Packaging 0.2%
BWAY Holding Co.Term Loan(c)(n)
08/06/17 4.500% 143,000 144,001
Berry Plastics Holding Corp.Tranche C Term Loan(c)(n)
04/03/15 2.212% 796,373 791,316
Consolidated Container Co. LLCTerm Loan(c)(n)
07/03/19 5.000% 399,000 399,331
Reynolds Group Holdings, Inc.(c)(j)(n)
Term Loan09/28/18 4.750% 350,000 353,808
Reynolds Group Holdings, Inc.(c)(n)
Term Loan09/28/18 4.750% 270,284 273,224
Total 1,961,680
Pharmaceuticals 0.2%
Endo Pharmaceuticals Holdings, Inc.(c)(n)
Tranche A Term Loan06/17/16 2.000% 115,625 115,576Tranche B Term Loan06/17/18 4.000% 28,670 28,892
Grifols, Inc.Tranche B Term Loan(c)(n)
06/01/17 4.500% 267,246 269,547
Par PharmaTranche B Term Loan(c)(j)(n)
08/02/19 5.000% 500,000 499,065

30 Annual Report 2012
Portfolio of Investments (continued)December 31, 2012
Columbia Variable Portfolio — Strategic Income Fund
The accompanying Notes to Financial Statements are an integral part of this statement.
Patheon, Inc.Term Loan(c)(j)(n)
12/06/18 7.250% 225,000 223,875
Pharmaceutical Product Development, Inc.Term Loan(c)(n)
12/05/18 6.250% 99,000 100,467
RPI Finance TrustTerm Loan(c)(n)
05/09/18 3.500% 396,246 399,218
Valeant Pharmaceuticals International, Inc.Tranche B Term Loan(c)(n)
02/13/19 4.250% 149,375 150,201
Total 1,786,841
Property & Casualty 0.1%
Asurion LLC2nd Lien Term Loan(c)(n)
05/24/19 9.000% 222,930 229,154
HUB International Ltd.Term Loan(c)(j)(n)
06/13/17 4.709% 600,000 603,168
USI Holdings Corp.Tranche B Term Loan(c)(j)(n)
12/17/19 5.250% 300,000 299,001
Total 1,131,323
REITs —%
CB Richard Ellis Services, Inc.Tranche C Term Loan(c)(n)
03/04/18 3.462% 98,500 98,451
Restaurants —%
OSI Restaurant Partners LLCTerm Loan(c)(n)
10/28/19 4.800% 150,000 151,374
Retailers 0.6%
Academy Ltd.(c)(j)(n)
Term Loan08/03/18 4.750% 275,000 276,425
Academy Ltd.(c)(n)
Term Loan08/03/18 4.750% 621,003 624,220
BJ Wholesale Club, Inc.Term Loan(c)(n)
09/26/19 5.750% 475,000 480,610
Bass Pro Group LLCTerm Loan(c)(n)
11/20/19 4.000% 225,000 225,139
Senior Loans (continued)
Weighted
Average Principal
Borrower Coupon Amount ($) Value ($)
Senior Loans (continued)
Weighted
Average Principal
Borrower Coupon Amount ($) Value ($)
Blue Buffalo Co., Ltd.Term Loan(c)(n)
08/08/19 6.500% 274,312 275,799
David’s Bridal, Inc.(c)(j)(n)
Term Loan10/11/19 5.000% 200,000 200,334
David’s Bridal, Inc.(c)(n)
Term Loan10/11/19 5.000% 300,000 300,501
General Nutrition Centers, Inc.Tranche B Term Loan(c)(n)
03/02/18 3.750% 424,614 425,136
J. Crew Group, Inc.Term Loan(c)(n)
03/07/18 4.500% 592,500 593,910
Jo-Ann Stores, Inc.Term Loan(c)(n)
03/16/18 4.750% 409,871 410,981
Neiman Marcus Group, Inc. (The)Term Loan(c)(n)
05/16/18 4.750% 475,000 475,119
Orchard Supply Hardware LLCTranche B1 Term Loan(c)(n)
12/21/13 5.000% 458,216 387,958
Pantry, Inc. (The)Term Loan(c)(n)
08/03/19 5.750% 124,688 126,246
Party City Holdings, Inc.Term Loan(c)(n)
07/27/19 5.750% 548,625 554,194
Pep BoysTerm Loan(c)(n)
10/11/18 5.000% 175,000 175,985
Pilot Travel Centers LLCTranche B Term Loan(c)(j)(n)
08/07/19 4.250% 406,054 407,914
Toys ‘R’ Us — Delaware, Inc.Term Loan(c)(n)
09/01/16 6.000% 338,932 326,927
Total 6,267,398
Technology 0.5%
Aeroflex, Inc.Tranche B Term Loan(c)(n)
05/09/18 5.750% 668,833 672,318
Ancestry.comTerm Loan(c)(j)(n)
11/30/18 7.000% 300,000 288,939
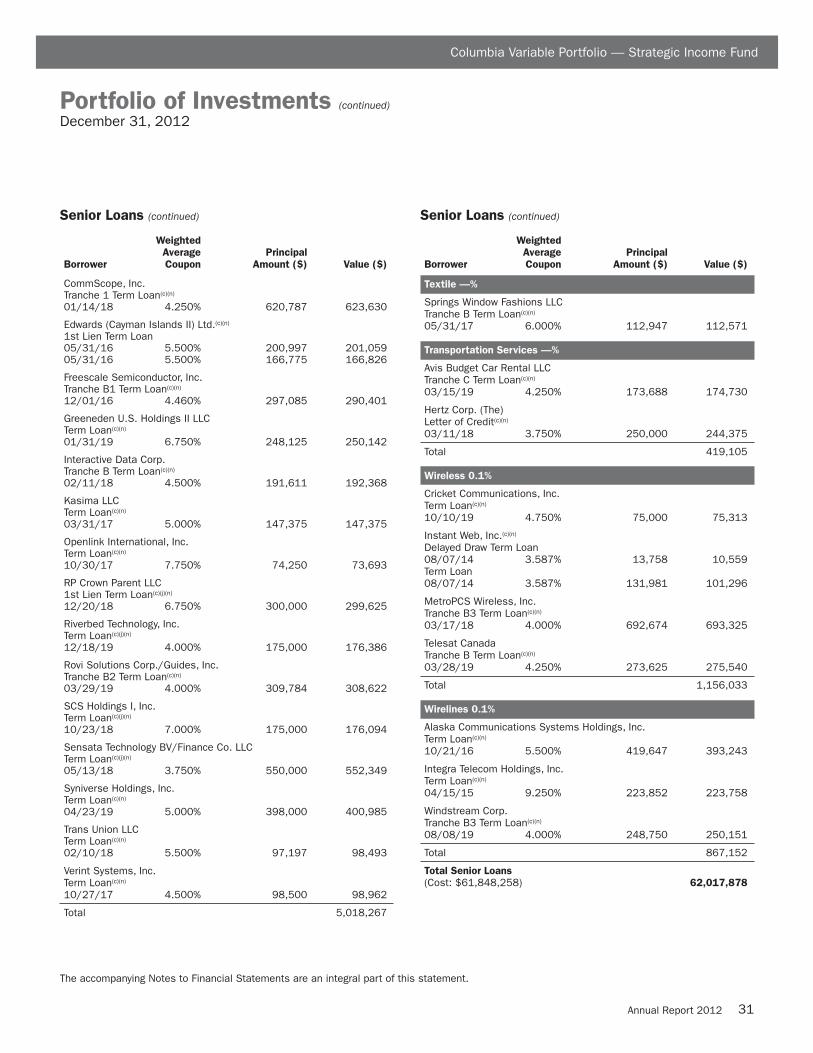
31Annual Report 2012
Portfolio of Investments (continued)December 31, 2012
Columbia Variable Portfolio — Strategic Income Fund
The accompanying Notes to Financial Statements are an integral part of this statement.
CommScope, Inc.Tranche 1 Term Loan(c)(n)
01/14/18 4.250% 620,787 623,630
Edwards (Cayman Islands II) Ltd.(c)(n)
1st Lien Term Loan05/31/16 5.500% 200,997 201,05905/31/16 5.500% 166,775 166,826
Freescale Semiconductor, Inc.Tranche B1 Term Loan(c)(n)
12/01/16 4.460% 297,085 290,401
Greeneden U.S. Holdings II LLCTerm Loan(c)(n)
01/31/19 6.750% 248,125 250,142
Interactive Data Corp.Tranche B Term Loan(c)(n)
02/11/18 4.500% 191,611 192,368
Kasima LLCTerm Loan(c)(n)
03/31/17 5.000% 147,375 147,375
Openlink International, Inc.Term Loan(c)(n)
10/30/17 7.750% 74,250 73,693
RP Crown Parent LLC1st Lien Term Loan(c)(j)(n)
12/20/18 6.750% 300,000 299,625
Riverbed Technology, Inc.Term Loan(c)(j)(n)
12/18/19 4.000% 175,000 176,386
Rovi Solutions Corp./Guides, Inc.Tranche B2 Term Loan(c)(n)
03/29/19 4.000% 309,784 308,622
SCS Holdings I, Inc.Term Loan(c)(j)(n)
10/23/18 7.000% 175,000 176,094
Sensata Technology BV/Finance Co. LLCTerm Loan(c)(j)(n)
05/13/18 3.750% 550,000 552,349
Syniverse Holdings, Inc.Term Loan(c)(n)
04/23/19 5.000% 398,000 400,985
Trans Union LLCTerm Loan(c)(n)
02/10/18 5.500% 97,197 98,493
Verint Systems, Inc.Term Loan(c)(n)
10/27/17 4.500% 98,500 98,962
Total 5,018,267
Senior Loans (continued)
Weighted
Average Principal
Borrower Coupon Amount ($) Value ($)
Senior Loans (continued)
Weighted
Average Principal
Borrower Coupon Amount ($) Value ($)
Textile —%
Springs Window Fashions LLCTranche B Term Loan(c)(n)
05/31/17 6.000% 112,947 112,571
Transportation Services —%
Avis Budget Car Rental LLCTranche C Term Loan(c)(n)
03/15/19 4.250% 173,688 174,730
Hertz Corp. (The)Letter of Credit(c)(n)
03/11/18 3.750% 250,000 244,375
Total 419,105
Wireless 0.1%
Cricket Communications, Inc.Term Loan(c)(n)
10/10/19 4.750% 75,000 75,313
Instant Web, Inc.(c)(n)
Delayed Draw Term Loan08/07/14 3.587% 13,758 10,559Term Loan08/07/14 3.587% 131,981 101,296
MetroPCS Wireless, Inc.Tranche B3 Term Loan(c)(n)
03/17/18 4.000% 692,674 693,325
Telesat CanadaTranche B Term Loan(c)(n)
03/28/19 4.250% 273,625 275,540
Total 1,156,033
Wirelines 0.1%
Alaska Communications Systems Holdings, Inc.Term Loan(c)(n)
10/21/16 5.500% 419,647 393,243
Integra Telecom Holdings, Inc.Term Loan(c)(n)
04/15/15 9.250% 223,852 223,758
Windstream Corp.Tranche B3 Term Loan(c)(n)
08/08/19 4.000% 248,750 250,151
Total 867,152
Total Senior Loans
(Cost: $61,848,258) 62,017,878

32 Annual Report 2012
Portfolio of Investments (continued)December 31, 2012
Columbia Variable Portfolio — Strategic Income Fund
The accompanying Notes to Financial Statements are an integral part of this statement.
Financials —%
Real Estate Investment Trusts (REITs) —%
Fairlane Management Corp.(d)(f)(p) 2,000 —
Total Financials —
Total Common Stocks
(Cost: $—) —
Warrants —%
Energy —%
Energy Equipment & Services —%
Green Field Energy Services, Inc.(p) 1,854 57,474
Total Energy 57,474
Total Warrants
(Cost: $75,032) 57,474
Options Purchased Calls —%
Exercise Expiration
Issuer Contracts Price Date Value ($)
U.S. Treasury Long Bond, 20-year 150 151.00 01/25/13 42,188
Total Options Purchased Calls
(Cost: $363,634) 42,188
Common Stocks —%
Issuer Shares Value ($)
Options Purchased Puts 0.1%
Exercise Expiration
Issuer Contracts Price Date Value ($)
U.S. TreasuryLong Bond,20-year 150 151.00 01/25/13 567,187
Total Options Purchased Puts
(Cost: $389,415) 567,187
Money Market Funds 5.9%
Shares Value ($)
Columbia Short-Term Cash Fund, 0.142%(q)(r) 61,678,259 61,678,259
Total Money Market Funds
(Cost: $61,678,259) 61,678,259
Total Investments
(Cost: $1,013,588,230) 1,084,072,729
Other Assets & Liabilities, Net (35,501,644)
Net Assets 1,048,571,085
Investments in Derivatives
Futures Contracts Outstanding at December 31, 2012
Number of Notional
Contracts Trading Market Expiration Unrealized Unrealized
Contract Description Long (Short) Currency Value ($) Date Appreciation ($) Depreciation ($)
U.S. Treasury Long Bond, 20-year 196 USD 28,910,000 March 2013 — (403,013)
U.S. Treasury Note, 2-year 90 USD 19,842,188 March 2013 5,489 —
U.S. Treasury Note, 5-year (837) USD (104,134,568) March 2013 290,447 —
U.S. Treasury Note, 10-year (531) USD (70,506,844) March 2013 260,423 —
U.S. Treasury Ultra Bond, 30-year 104 USD 16,909,750 March 2013 — (408,144)
Total 556,359 (811,157)

33Annual Report 2012
Portfolio of Investments (continued)December 31, 2012
Credit Default Swap Contracts Outstanding at December 31, 2012
Buy Protection
Periodic Payments Unrealized Unrealized
Reference Pay Fixed Notional Market Receivable Appreciation Depreciation Counterparty Entity Expiration Date Rate (%) Amount ($) Value ($) (Payable) ($) ($) ($)
Barclays Capital Federative Republic of Brazil September 20, 2014 1.470 400,000 (6,824) (1,682) — (8,506)
Total — (8,506)
Forward Foreign Currency Exchange Contracts Open at December 31, 2012
Currency to Currency to Unrealized Unrealized Counterparty Exchange Date be Delivered be Received Appreciation ($) Depreciation ($)
Citigroup Global Markets Inc. January 10, 2013 649,726 20,294,000 13,656 —(USD) (RUB)
UBS Securities January 14, 2013 2,729,000 2,236,497 — (17,087)(NZD) (USD)
Deutsche Bank January 16, 2013 4,779,000 5,210,707 — (15,676)(CHF) (USD)
Goldman, Sachs & Co. January 16, 2013 9,896,000 12,888,788 — (174,981)(EUR) (USD)
Credit Suisse January 16, 2013 4,843,000 7,783,408 — (83,509)(GBP) (USD)
Morgan Stanley January 16, 2013 13,025,167 12,441,000 — (119,070)(USD) (AUD)
Morgan Stanley January 16, 2013 156,632 151,000 12 —(USD) (AUD)
State Street Bank & Trust Company January 16, 2013 7,825,408 676,065,000 — (21,807)(USD) (JPY)
J.P. Morgan Securities, Inc. January 16, 2013 5,165,978 6,204,000 — (43,455)(USD) (NZD)
J.P. Morgan Securities, Inc. January 16, 2013 121,662 148,000 539 —(USD) (NZD)
State Street Bank & Trust Company January 24, 2013 3,300,000 4,286,601 — (70,066)(EUR) (USD)
J.P. Morgan Securities, Inc. January 25, 2013 9,000,000 2,827,610 — (73,038)(PLN) (USD)
J.P. Morgan Securities, Inc. February 7, 2013 4,167,585 350,000,000 — (126,465)(USD) (JPY)
Total 14,207 (745,154)
Notes to Portfolio of Investments
(a) Principal amounts are denominated in United States Dollars unless otherwise noted.
(b) Security exempt from registration pursuant to Rule 144A under the Securities Act of 1933. This security may be resold in transactionsexempt from registration, normally to qualified institutional buyers. At December 31, 2012, the value of these securities amounted to$294,673,190 or 28.10% of net assets.
(c) Variable rate security.
(d) Negligible market value.
Columbia Variable Portfolio — Strategic Income Fund
The accompanying Notes to Financial Statements are an integral part of this statement.
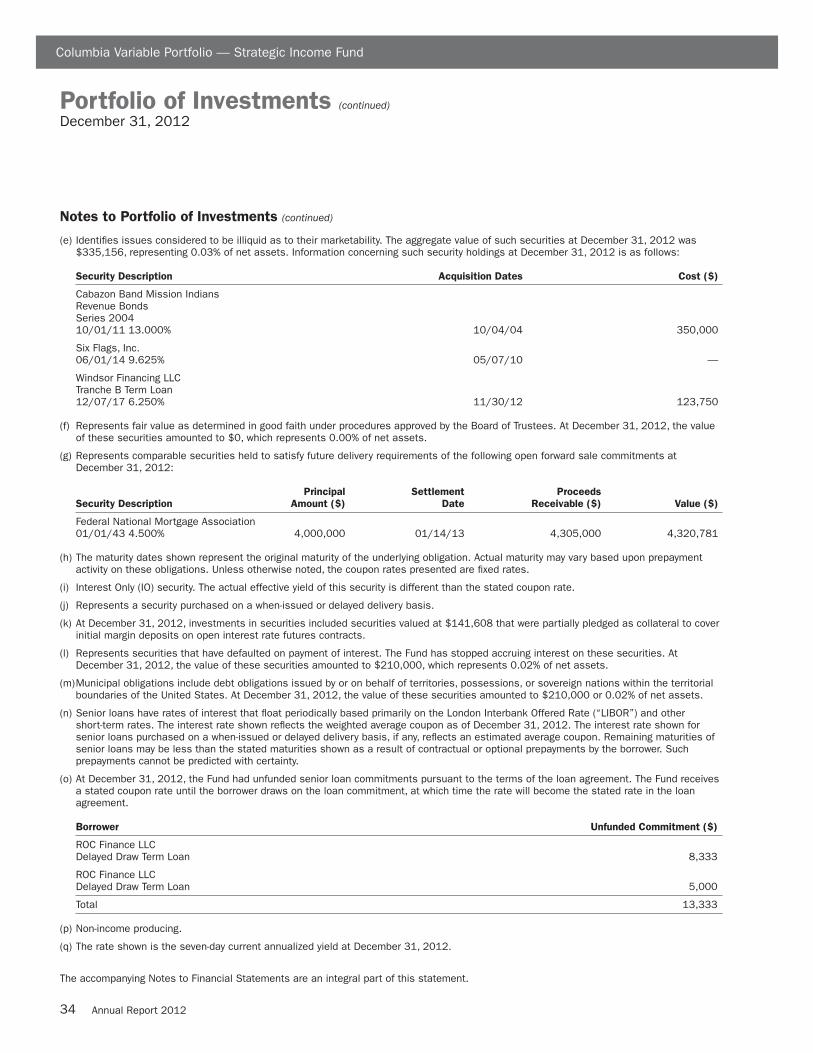
34 Annual Report 2012
Portfolio of Investments (continued)December 31, 2012
(e) Identifies issues considered to be illiquid as to their marketability. The aggregate value of such securities at December 31, 2012 was$335,156, representing 0.03% of net assets. Information concerning such security holdings at December 31, 2012 is as follows:
Security Description Acquisition Dates Cost ($)
Cabazon Band Mission IndiansRevenue BondsSeries 200410/01/11 13.000% 10/04/04 350,000
Six Flags, Inc.06/01/14 9.625% 05/07/10 —
Windsor Financing LLCTranche B Term Loan12/07/17 6.250% 11/30/12 123,750
(f) Represents fair value as determined in good faith under procedures approved by the Board of Trustees. At December 31, 2012, the valueof these securities amounted to $0, which represents 0.00% of net assets.
(g) Represents comparable securities held to satisfy future delivery requirements of the following open forward sale commitments atDecember 31, 2012:
Principal Settlement Proceeds
Security Description Amount ($) Date Receivable ($) Value ($)
Federal National Mortgage Association01/01/43 4.500% 4,000,000 01/14/13 4,305,000 4,320,781
(h) The maturity dates shown represent the original maturity of the underlying obligation. Actual maturity may vary based upon prepaymentactivity on these obligations. Unless otherwise noted, the coupon rates presented are fixed rates.
(i) Interest Only (IO) security. The actual effective yield of this security is different than the stated coupon rate.
(j) Represents a security purchased on a when-issued or delayed delivery basis.
(k) At December 31, 2012, investments in securities included securities valued at $141,608 that were partially pledged as collateral to coverinitial margin deposits on open interest rate futures contracts.
(l) Represents securities that have defaulted on payment of interest. The Fund has stopped accruing interest on these securities. AtDecember 31, 2012, the value of these securities amounted to $210,000, which represents 0.02% of net assets.
(m)Municipal obligations include debt obligations issued by or on behalf of territories, possessions, or sovereign nations within the territorialboundaries of the United States. At December 31, 2012, the value of these securities amounted to $210,000 or 0.02% of net assets.
(n) Senior loans have rates of interest that float periodically based primarily on the London Interbank Offered Rate (“LIBOR”) and othershort-term rates. The interest rate shown reflects the weighted average coupon as of December 31, 2012. The interest rate shown forsenior loans purchased on a when-issued or delayed delivery basis, if any, reflects an estimated average coupon. Remaining maturities ofsenior loans may be less than the stated maturities shown as a result of contractual or optional prepayments by the borrower. Suchprepayments cannot be predicted with certainty.
(o) At December 31, 2012, the Fund had unfunded senior loan commitments pursuant to the terms of the loan agreement. The Fund receivesa stated coupon rate until the borrower draws on the loan commitment, at which time the rate will become the stated rate in the loanagreement.
Borrower Unfunded Commitment ($)
ROC Finance LLCDelayed Draw Term Loan 8,333
ROC Finance LLCDelayed Draw Term Loan 5,000
Total 13,333
(p) Non-income producing.
(q) The rate shown is the seven-day current annualized yield at December 31, 2012.
Columbia Variable Portfolio — Strategic Income Fund
The accompanying Notes to Financial Statements are an integral part of this statement.
Notes to Portfolio of Investments (continued)

35Annual Report 2012
Portfolio of Investments (continued)December 31, 2012
(r) As defined in the Investment Company Act of 1940, an affiliated company is one in which the Fund owns 5% or more of its outstandingvoting securities, or a company which is under common ownership or control with the Fund. Holdings and transactions in these affiliatedcompanies during the year ended December 31, 2012, are as follows:
Sales Cost/ Dividends
Beginning Purchase Proceeds Realized Ending or Interest
Issuer Cost ($) Cost ($) From Sales ($) Gain/Loss ($) Cost ($) Income ($) Value ($)
Columbia Short–Term Cash Fund 37,296,441 374,586,042 (350,204,224) — 61,678,259 93,734 61,678,259
Abbreviation Legend
CMO Collateralized Mortgage Obligation
FGIC Financial Guaranty Insurance Company
NPFGC National Public Finance Guarantee Corporation
PIK Payment-in-Kind
STRIPS Separate Trading of Registered Interest and Principal Securities
Currency Legend
AUD Australian Dollar
BRL Brazilian Real
CAD Canadian Dollar
CHF Swiss Franc
COP Colombian Peso
EUR Euro
GBP British Pound
IDR Indonesian Rupiah
JPY Japanese Yen
MXN Mexican Peso
NOK Norwegian Krone
NZD New Zealand Dollar
PEN Peru Nuevos Soles
PHP Philippine Peso
PLN Polish Zloty
RUB Russian Rouble
SEK Swedish Krona
USD US Dollar
UYU Uruguay Pesos
Columbia Variable Portfolio — Strategic Income Fund
The accompanying Notes to Financial Statements are an integral part of this statement.
Notes to Portfolio of Investments (continued)

36 Annual Report 2012
Portfolio of Investments (continued)December 31, 2012
Fair Value Measurements
Generally accepted accounting principles (GAAP) require disclosure regarding the inputs and valuation techniques used to measure fair valueand any changes in valuation inputs or techniques. In addition, investments shall be disclosed by major category.
The Fund categorizes its fair value measurements according to a three-level hierarchy that maximizes the use of observable inputs andminimizes the use of unobservable inputs by prioritizing that the most observable input be used when available. Observable inputs are thosethat market participants would use in pricing an investment based on market data obtained from sources independent of the reporting entity.Unobservable inputs are those that reflect the Fund’s assumptions about the information market participants would use in pricing aninvestment. An investment’s level within the fair value hierarchy is based on the lowest level of any input that is deemed significant to theasset or liability’s fair value measurement. The input levels are not necessarily an indication of the risk or liquidity associated withinvestments at that level. For example, certain U.S. government securities are generally high quality and liquid, however, they are reflected asLevel 2 because the inputs used to determine fair value may not always be quoted prices in an active market.
Fair value inputs are summarized in the three broad levels listed below:
> Level 1 — Valuations based on quoted prices for investments in active markets that the Fund has the ability to access at themeasurement date (including NAV for open-end mutual funds). Valuation adjustments are not applied to Level 1 investments.
> Level 2 — Valuations based on other significant observable inputs (including quoted prices for similar securities, interest rates,prepayment speeds, credit risks, etc.).
> Level 3 — Valuations based on significant unobservable inputs (including the Fund’s own assumptions and judgment in determining thefair value of investments).
Inputs that are used in determining fair value of an investment may include price information, credit data, volatility statistics, and otherfactors. These inputs can be either observable or unobservable. The availability of observable inputs can vary between investments, and isaffected by various factors such as the type of investment, and the volume and level of activity for that investment or similar investments inthe marketplace. The inputs will be considered by the Investment Manager, along with any other relevant factors in the calculation of aninvestment’s fair value. The Fund uses prices and inputs that are current as of the measurement date, which may include periods of marketdislocations. During these periods, the availability of prices and inputs may be reduced for many investments. This condition could cause aninvestment to be reclassified between the various levels within the hierarchy.
Investments falling into the Level 3 category are primarily supported by quoted prices from brokers and dealers participating in the market forthose investments. However, these may be classified as Level 3 investments due to lack of market transparency and corroboration to supportthese quoted prices. Additionally, valuation models may be used as the pricing source for any remaining investments classified as Level 3.These models rely on one or more significant unobservable inputs and/or significant assumptions by the Investment Manager. Inputs used invaluations may include, but are not limited to, financial statement analysis, capital account balances, discount rates and estimated cashflows, and comparable company data.
Under the direction of the Fund’s Board of Trustees (the Board), the Investment Manager’s Valuation Committee (the Committee) isresponsible for carrying out the valuation procedures approved by the Board. The Committee consists of voting and non-voting members fromvarious groups within the Investment Manager’s organization, including operations and accounting, trading and investments, compliance, riskmanagement and legal.
The Committee meets at least monthly to review and approve valuation matters, which may include a description of specific valuationdeterminations, data regarding pricing information received from approved pricing vendors and brokers and the results of Board-approvedvaluation control policies and procedures (the Policies). The Policies address, among other things, instances when market quotations arereadily available, including recommendations of third party pricing vendors and a determination of appropriate pricing methodologies; eventsthat require specific valuation determinations and assessment of fair value techniques; securities with a potential for stale pricing, includingthose that are illiquid, restricted, or in default; and the effectiveness of third-party pricing vendors, including periodic reviews of vendors. TheCommittee meets more frequently, as needed, to discuss additional valuation matters, which may include the need to review back-testingresults, review time-sensitive information or approve related valuation actions. The Committee reports to the Board, with members of theCommittee meeting with the Board at each of its regularly scheduled meetings to discuss valuation matters and actions during the period,similar to those described earlier.
For investments categorized as Level 3, the Committee monitors information similar to that described above, which may include: (i) dataspecific to the issuer or comparable issuers, (ii) general market or specific sector news and (iii) quoted prices and specific or similar securitytransactions. The Committee considers this data and any changes from prior periods in order to assess the reasonableness of observableand unobservable inputs, any assumptions or internal models used to value those securities and changes in fair value. This data is also usedto corroborate, when available, information received from approved pricing vendors and brokers. Various factors impact the frequency ofmonitoring this information (which may occur as often as daily). However, the Committee may determine that changes to inputs, assumptionsand models are not required as a result of the monitoring procedures performed.
Columbia Variable Portfolio — Strategic Income Fund
The accompanying Notes to Financial Statements are an integral part of this statement.

37Annual Report 2012
Portfolio of Investments (continued)December 31, 2012
Fair Value Measurements (continued)
The following table is a summary of the inputs used to value the Fund’s investments at December 31, 2012:
Level 1
Quoted Prices in Active Level 2 Level 3
Markets for Identical Other Significant Significant
Description Assets ($) Observable Inputs ($) Unobservable Inputs ($) Total ($)
Bonds
Corporate Bonds & Notes — 491,731,874 — 491,731,874
Residential Mortgage-Backed Securities — Agency — 124,317,291 — 124,317,291
Residential Mortgage-Backed Securities — Non-Agency — 19,385,184 29,066,288 48,451,472
Commercial Mortgage-Backed Securities — Non-Agency — 16,869,017 — 16,869,017
Asset-Backed Securities — Non-Agency — 1,880,185 — 1,880,185
Inflation-Indexed Bonds — 11,282,186 — 11,282,186
U.S. Treasury Obligations 39,503,446 — — 39,503,446
Foreign Government Obligations — 225,464,272 — 225,464,272
Municipal Bonds — 210,000 — 210,000
Total Bonds 39,503,446 891,140,009 29,066,288 959,709,743
Senior Loans
Aerospace & Defense — 1,108,116 91,250 1,199,366
Chemicals — 3,088,286 99,500 3,187,786
Consumer Cyclical Services — 1,318,544 100,485 1,419,029
Diversified Manufacturing — 2,751,198 370,298 3,121,496
Electric — 1,732,928 145,812 1,878,740
Gaming — 2,480,898 527,427 3,008,325
Health Care — 4,844,202 103,188 4,947,390
Media Non-Cable — 4,363,586 451,108 4,814,694
Other Industry — 356,915 719,440 1,076,355
Retailers — 6,141,152 126,246 6,267,398
Technology — 4,870,892 147,375 5,018,267
All other industries — 26,079,032 — 26,079,032
Total Senior Loans — 59,135,749 2,882,129 62,017,878
Equity Securities
Common Stocks
Financials — — — —
Warrants
Energy — 57,474 — 57,474
Total Equity Securities — 57,474 — 57,474
Columbia Variable Portfolio — Strategic Income Fund
The accompanying Notes to Financial Statements are an integral part of this statement.

38 Annual Report 2012
Portfolio of Investments (continued)December 31, 2012
Fair Value Measurements (continued)
Level 1
Quoted Prices in Active Level 2 Level 3
Markets for Identical Other Significant Significant
Description Assets ($) Observable Inputs ($) Unobservable Inputs ($) Total ($)
Other
Options Purchased Calls 42,188 — — 42,188
Options Purchased Puts 567,187 — — 567,187
Money Market Funds 61,678,259 — — 61,678,259
Total Other 62,287,634 — — 62,287,634
Investments in Securities 101,791,080 950,333,232 31,948,417 1,084,072,729
Forward Sale Commitments Liability — (4,320,781) — (4,320,781)
Derivatives
Assets
Futures Contracts 556,359 — — 556,359
Forward Foreign Currency Exchange Contracts — 14,207 — 14,207
Liabilities
Futures Contracts (811,157) — — (811,157)
Forward Foreign Currency Exchange Contracts — (745,154) — (745,154)
Swap Contracts — (8,506) — (8,506)
Total 101,536,282 945,272,998 31,948,417 1,078,757,697
See the Portfolio of Investments for all investment classifications not indicated in the table.
The Fund’s assets assigned to the Level 2 input category are generally valued using the market approach, in which a security’s value isdetermined through reference to prices and information from market transactions for similar or identical assets.
The Fund’s assets assigned to the Level 3 category are valued utilizing the valuation technique deemed the most appropriate in thecircumstances. Certain residential mortgage backed securities and senior loans classified as Level 3 securities are valued using the marketapproach and utilize single market quotations from broker dealers which may have included, but not limited to, the distressed nature of thesecurity and observable transactions for similar assets in the market. Significant increases (decreases) to any of these inputs would result ina significantly lower (higher) fair value measurement.
There were no transfers of financial assets between Levels 1 and 2 during the period.
Futures contracts, forward foreign currency contracts and swap contracts are valued at unrealized appreciation (depreciation).
Columbia Variable Portfolio — Strategic Income Fund
The accompanying Notes to Financial Statements are an integral part of this statement.

39Annual Report 2012
Portfolio of Investments (continued)December 31, 2012
Columbia Variable Portfolio — Strategic Income Fund
The accompanying Notes to Financial Statements are an integral part of this statement.
Fair Value Measurements (continued)
The following table is a reconciliation of Level 3 assets for which significant observable and/or unobservable inputs were used to determinefair value.
Residential
Mortgage-
Corporate Backed
Bonds & Securities — Senior
Notes ($) Non-Agency ($) Loans ($) Warrants ($) Total ($)
Balance as of December 31, 2011 352,024 6,145,020 3,260,269 33 9,757,346
Accrued discounts/premiums 898 18 12,103 — 13,019
Realized gain (loss) (426) 5,768 33,681 — 39,023
Change in unrealized appreciation (depreciation)(a) (14,218) 106,219 96,531 — 188,532
Sales (515,328) (4,566,603) (3,238,355) (33) (8,320,319)
Purchases 177,050 31,219,046 2,362,183 — 33,758,279
Transfers into Level 3 — — 1,083,783 — 1,083,783
Transfers out of Level 3 — (3,843,180) (728,066) — (4,571,246)
Balance as of December 31, 2012 — 29,066,288 2,882,129 — 31,948,417
(a) Change in unrealized appreciation (depreciation) relating to securities held at was $178,333, which is comprised of ResidentialMortgage-Backed Securities — Non-Agency of $107,204 and Senior Loans of $71,129.
The Fund does not hold any significant investments with unobservable inputs which are categorized as Level 3.
Financial assets were transferred from Level 3 to Level 2 as observable market inputs were utilized and management’s determination thatthere was sufficient, reliable and observable market data to value these assets as of period end, December 31, 2012.
Financial Assets were transferred from Level 2 to Level 3 due to utilizing a single market quotation from a broker dealer. As a result, as ofperiod end, management determined to value the security(s) under consistently applied procedures established by and under the generalsupervision of the Board of Trustees.
Transfers in and/or out of Level 3 are determined based on the fair value at the beginning of the period for security positions held throughoutthe period.

40 Annual Report 2012
Statement of Assets and LiabilitiesDecember 31, 2012
Columbia Variable Portfolio — Strategic Income Fund
The accompanying Notes to Financial Statements are an integral part of this statement.
Assets
Investments, at value
Unaffiliated issuers (identified cost $951,909,971) $1,022,394,470
Affiliated issuers (identified cost $61,678,259) 61,678,259
Total investments (identified cost $1,013,588,230) 1,084,072,729
Foreign currency (identified cost $4,652,774) 4,726,646
Unrealized appreciation on forward foreign currency exchange contracts 14,207
Receivable for:
Investments sold 5,539,422
Capital shares sold 126,899
Investments sold on a delayed delivery basis 74,248
Dividends 7,122
Interest 12,370,575
Reclaims 162,625
Trustees’ deferred compensation plan 33,153
Total assets 1,107,127,626
Liabilities
Forward sale commitments, at value (proceeds receivable $4,305,000) 4,320,781
Disbursements in excess of cash 2,394,029
Unrealized depreciation on forward foreign currency exchange contracts 745,154
Unrealized depreciation on swap contracts 8,506
Payable for:
Investments purchased 74,807
Investments purchased on a delayed delivery basis 48,742,815
Capital shares purchased 1,314,821
Variation margin on futures contracts 211,430
Investment management fees 467,883
Distribution and/or service fees 7,912
Foreign capital gains taxes deferred 51,074
Transfer agent fees 53,276
Administration fees 59,631
Compensation of board members 3,378
Chief compliance officer expenses 258
Other expenses 67,633
Trustees’ deferred compensation plan 33,153
Total liabilities 58,556,541
Net assets applicable to outstanding capital stock $1,048,571,085

41Annual Report 2012
Statement of Assets and Liabilities (continued)December 31, 2012
Columbia Variable Portfolio — Strategic Income Fund
The accompanying Notes to Financial Statements are an integral part of this statement.
Represented by
Paid-in capital $913,780,088
Undistributed net investment income 42,741,255
Accumulated net realized gain 22,508,989
Unrealized appreciation (depreciation) on:
Investments 70,484,499
Foreign currency translations 117,360
Forward sale commitments (15,781)
Forward foreign currency exchange contracts (730,947)
Futures contracts (254,798)
Swap contracts (8,506)
Foreign capital gains tax (51,074)
Total — representing net assets applicable to outstanding capital stock $1,048,571,085
Class 1
Net assets $1,011,054,895
Shares outstanding 107,858,506
Net asset value per share $9.37
Class 2
Net assets $37,516,190
Shares outstanding 4,022,162
Net asset value per share $9.33

42 Annual Report 2012
Statement of OperationsYear Ended December 31, 2012
Columbia Variable Portfolio — Strategic Income Fund
The accompanying Notes to Financial Statements are an integral part of this statement.
Net investment income
Income:Dividends — affiliated issuers $93,734Interest 56,622,829Income from securities lending — net 151,457Foreign taxes withheld (73,858)
Total income 56,794,162
Expenses:Investment management fees 5,669,097Distribution and/or service fees
Class 2 85,528Transfer agent fees
Class 1 572,206Class 2 20,526
Administration fees 721,091Compensation of board members 44,628Custodian fees 71,865Printing and postage fees 47,617Professional fees 74,397Chief compliance officer expenses 854Other 39,473
Total expenses 7,347,282Fees waived or expenses reimbursed by Investment Manager and its affiliates (314,452)Total net expenses 7,032,830Net investment income 49,761,332
Realized and unrealized gain (loss) — net
Net realized gain (loss) on:Investments 35,950,320Foreign currency translations (286,454)Forward foreign currency exchange contracts 1,768,675Futures contracts (4,194,749)Options contracts written 126,591Swap contracts (5,978)
Net realized gain 33,358,405Net change in unrealized appreciation (depreciation) on:
Investments 39,779,945Foreign currency translations 271,145Forward sale commitments (15,781)Forward foreign currency exchange contracts (832,736)Futures contracts 103,165Swap contracts (3,782)Foreign capital gains tax 44,368
Net change in unrealized appreciation (depreciation) 39,346,324Net realized and unrealized gain 72,704,729
Net increase in net assets resulting from operations $122,466,061

43Annual Report 2012
Statement of Changes in Net Assets
Columbia Variable Portfolio — Strategic Income Fund
The accompanying Notes to Financial Statements are an integral part of this statement.
Year Ended Year Ended
December 31, December 31,
2012 2011
Operations
Net investment income $49,761,332 $38,364,548
Net realized gain 33,358,405 4,516,482
Net change in unrealized appreciation (depreciation) 39,346,324 (16,434,361)
Net increase in net assets resulting from operations 122,466,061 26,446,669
Distributions to shareholders
Net investment income
Class 1 (44,227,829) (2,779,236)
Class 2 (1,426,041) (1,940,793)
Total distributions to shareholders (45,653,870) (4,720,029)
Increase (decrease) in net assets from capital stock activity (103,685,110) 988,368,575
Total increase (decrease) in net assets (26,872,919) 1,010,095,215
Net assets at beginning of year 1,075,444,004 65,348,789
Net assets at end of year $1,048,571,085 $1,075,444,004
Undistributed net investment income $42,741,255 $37,082,882
Year Ended December 31, 2012 Year Ended December 31, 2011
Shares Dollars ($) Shares Dollars ($)
Capital stock activity
Class 1 shares
Subscriptions 6,574,480 60,260,840 5,867,775 50,493,729
Fund merger — — 116,606,245 995,714,495
Distributions reinvested 4,880,221 44,227,829 326,585 2,779,236
Redemptions (23,199,281) (212,421,581) (7,455,447) (63,894,044)
Net increase (decrease) (11,744,580) (107,932,912) 115,345,158 985,093,416
Class 2 shares
Subscriptions 1,239,710 11,286,103 611,156 5,234,018
Fund merger — — 369,809 3,147,028
Distributions reinvested 157,804 1,426,041 228,867 1,940,793
Redemptions (928,934) (8,464,342) (814,148) (7,046,680)
Net increase 468,580 4,247,802 395,684 3,275,159
Total net increase (decrease) (11,276,000) (103,685,110) 115,740,842 988,368,575

44 Annual Report 2012
Financial Highlights
Columbia Variable Portfolio — Strategic Income Fund
The accompanying Notes to Financial Statements are an integral part of this statement.
The following tables are intended to help you understand the Fund’s financial performance. Certain information reflectsfinancial results for a single share of a class held for the periods shown. Per share net investment income (loss) amounts arecalculated based on average shares outstanding during the period. Total return assumes reinvestment of all dividends anddistributions. Total return does not reflect payment of the expenses that apply to the variable accounts or contract charges, ifany, and are not annualized for periods of less than one year.
Year Ended December 31,
Class 1 2012 2011 2010 2009 2008
Per share data
Net asset value, beginning of period $8.73 $8.83 $8.60 $8.01 $9.47
Income from investment operations:
Net investment income 0.42 0.45 0.47 0.51 0.53
Net realized and unrealized gain (loss) 0.63 0.13(a) 0.40 1.04 (1.21)
Total from investment operations 1.05 0.58 0.87 1.55 (0.68)
Less distributions to shareholders:
Net investment income (0.41) (0.68) (0.64) (0.96) (0.78)
Total distributions to shareholders (0.41) (0.68) (0.64) (0.96) (0.78)
Net asset value, end of period $9.37 $8.73 $8.83 $8.60 $8.01
Total return 12.25% 6.80% 10.43% 20.40% (7.81%)
Ratios to average net assets(b)
Total gross expenses 0.67% 0.68% 0.98% 0.90% 0.84%
Total net expenses(c) 0.65% 0.58%(d) 0.65%(d) 0.65%(d) 0.84%(d)
Net investment income 4.63% 5.22% 5.34% 6.11% 5.89%
Supplemental data
Net assets, end of period (in thousands) $1,011,055 $1,044,575 $37,602 $39,774 $37,407
Portfolio turnover 112%(e) 95%(e) 78% 50%(f) 28%(f)
Notes to Financial Highlights
(a) Calculation of the net gain (loss) per share (both realized and unrealized) does not correlate to the aggregate realized and unrealized gain(loss) presented in the Statement of Operations due to the timing of sales and repurchases of Fund shares in relation to fluctuations inthe market value of the portfolio.
(b) In addition to the fees and expenses which the Fund bears directly, the Fund indirectly bears a pro rata share of the fees and expenses ofthe acquired funds in which it invests. Such indirect expenses are not included in the reported expense ratios.
(c) Total net expenses include the impact of certain waivers/reimbursements made by the Investment Manager and certain of its affiliates, ifapplicable.
(d) The benefits derived from expense reductions had an impact of less than 0.01%.
(e) Includes mortgage dollar rolls. If mortgage dollar roll transactions were excluded, the portfolio turnover would have been 74% and 82% forthe years ended December 31, 2012 and December 31, 2011, respectively.
(f) Excludes mortgage dollar rolls.

45Annual Report 2012
Financial Highlights (continued)
Columbia Variable Portfolio — Strategic Income Fund
The accompanying Notes to Financial Statements are an integral part of this statement.
Year Ended December 31,
Class 2 2012 2011 2010 2009 2008
Per share data
Net asset value, beginning of period $8.69 $8.79 $8.56 $7.98 $9.43
Income from investment operations:
Net investment income 0.40 0.43 0.44 0.49 0.51
Net realized and unrealized gain (loss) 0.62 0.13(a) 0.41 1.03 (1.19)
Total from investment operations 1.02 0.56 0.85 1.52 (0.68)
Less distributions to shareholders:
Net investment income (0.38) (0.66) (0.62) (0.94) (0.77)
Total distributions to shareholders (0.38) (0.66) (0.62) (0.94) (0.77)
Net asset value, end of period $9.33 $8.69 $8.79 $8.56 $7.98
Total return 11.96% 6.56% 10.21% 20.14% (7.92%)
Ratios to average net assets(b)
Total gross expenses 0.93% 1.08% 1.23% 1.15% 1.09%
Total net expenses(c) 0.90% 0.91%(d) 0.90%(d) 0.90%(d) 1.00%(d)
Net investment income 4.36% 5.01% 5.09% 5.87% 5.73%
Supplemental data
Net assets, end of period (in thousands) $37,516 $30,869 $27,747 $30,755 $33,737
Portfolio turnover 112%(e) 95%(e) 78% 50%(f) 28%(f)
Notes to Financial Highlights
(a) Calculation of the net gain (loss) per share (both realized and unrealized) does not correlate to the aggregate realized and unrealized gain(loss) presented in the Statement of Operations due to the timing of sales and repurchases of Fund shares in relation to fluctuations inthe market value of the portfolio.
(b) In addition to the fees and expenses which the Fund bears directly, the Fund indirectly bears a pro rata share of the fees and expenses ofthe acquired funds in which it invests. Such indirect expenses are not included in the reported expense ratios.
(c) Total net expenses include the impact of certain waivers/reimbursements made by the Investment Manager and certain of its affiliates, ifapplicable.
(d) The benefits derived from expense reductions had an impact of less than 0.01%.
(e) Includes mortgage dollar rolls. If mortgage dollar roll transactions were excluded, the portfolio turnover would have been 74% and 82% forthe years ended December 31, 2012 and December 31, 2011, respectively.
(f) Excludes mortgage dollar rolls.

46 Annual Report 2012
Notes to Financial StatementsDecember 31, 2012
Note 1. Organization
Columbia Variable Portfolio — Strategic Income Fund (theFund), a series of Columbia Funds Variable Insurance Trust(the Trust), is a diversified fund. The Trust is registered underthe Investment Company Act of 1940, as amended (the1940 Act), as an open-end management investment companyorganized as a Massachusetts business trust.
Fund Shares
The Trust may issue an unlimited number of shares (withoutpar value). The Fund offers Class 1 and Class 2 shares toseparate accounts funding variable annuity contracts andvariable life insurance policies issued by affiliated andunaffiliated life insurance companies as well as qualifiedpension and retirement plans and other qualified institutionalinvestors authorized by Columbia Management InvestmentDistributors, Inc. (the Distributor). You may not buy (nor willyou own) shares of the Fund directly. You invest byparticipating in a qualified plan or buying a contract andmaking allocations to the Fund. All share classes haveidentical voting, dividend and liquidation rights. Each shareclass has its own expense structure.
Note 2. Summary of Significant
Accounting Policies
Use of Estimates
The preparation of financial statements in accordance withU.S. generally accepted accounting principles (GAAP)requires management to make certain estimates andassumptions that affect the reported amounts of assets andliabilities, the disclosure of contingent assets and liabilities atthe date of the financial statements and the reported amountsof revenue and expenses during the reporting period. Actualresults could differ from those estimates.
The following is a summary of significant accounting policiesconsistently followed by the Fund in the preparation of itsfinancial statements.
Security Valuation
All equity securities are valued at the close of business of theNew York Stock Exchange (NYSE). Equity securities arevalued at the last quoted sales price on the principal exchangeor market on which they trade, except for securities traded onthe NASDAQ Stock Market, which are valued at theNASDAQ official close price. Unlisted securities or listedsecurities for which there were no sales during the day arevalued at the mean of the latest quoted bid and ask prices onsuch exchanges or markets.
Debt securities generally are valued by pricing servicesapproved by the Board of Trustees (the Board) based upon
market transactions for normal, institutional-size trading unitsof similar securities. The services may use various pricingtechniques which take into account appropriate factors such asyield, quality, coupon rate, maturity, type of issue, tradingcharacteristics and other data, as well as broker quotes. Debtsecurities for which quotations are readily available may alsobe valued based upon an over-the-counter or exchange bidquotation.
Asset and mortgage-backed securities are generally valued bypricing services, which utilize pricing models that incorporatethe securities’ cash flow and loan performance data. Thesemodels also take into account available market data, includingtrades, market quotations, and benchmark yield curves foridentical or similar securities. Factors used to identify similarsecurities may include, but are not limited to, issuer, collateraltype, vintage, prepayment speeds, collateral performance,credit ratings, credit enhancement and expected life. Asset-backed securities for which quotations are readily availablemay also be valued based upon an over-the-counter orexchange bid quotation.
Foreign securities are valued based on quotations from theprincipal market in which such securities are normally traded.If any foreign share prices are not readily available as a resultof limited share activity the securities are valued at the meanof the latest quoted bid and ask prices on such exchanges ormarkets. Foreign currency exchange rates are generallydetermined at 4:00 p.m. Eastern (U.S.) time. However, manysecurities markets and exchanges outside the U.S. close priorto the close of the NYSE; therefore, the closing prices forsecurities in such markets or on such exchanges may not fullyreflect events that occur after such close but before the closeof the NYSE. In those situations, foreign securities will be fairvalued pursuant to the policy adopted by the Board, includingutilizing a third party pricing service to determine these fairvalues. The third party pricing service takes into accountmultiple factors, including, but not limited to, movements inthe U.S. securities markets, certain depositary receipts, futurescontracts and foreign exchange rates that have occurredsubsequent to the close of the foreign exchange or market, todetermine a good faith estimate that reasonably reflects thecurrent market conditions as of the close of the NYSE. Thefair value of a security is likely to be different from the quotedor published price, if available.
Investments in other open-end investment companies,including money market funds, are valued at net asset value.
Short-term securities purchased within 60 days to maturity arevalued at amortized cost, which approximates market value.The value of short-term securities originally purchased withmaturities greater than 60 days is determined based on anamortized value to par upon reaching 60 days to maturity.Short-term securities maturing in more than 60 days from the
Columbia Variable Portfolio — Strategic Income Fund
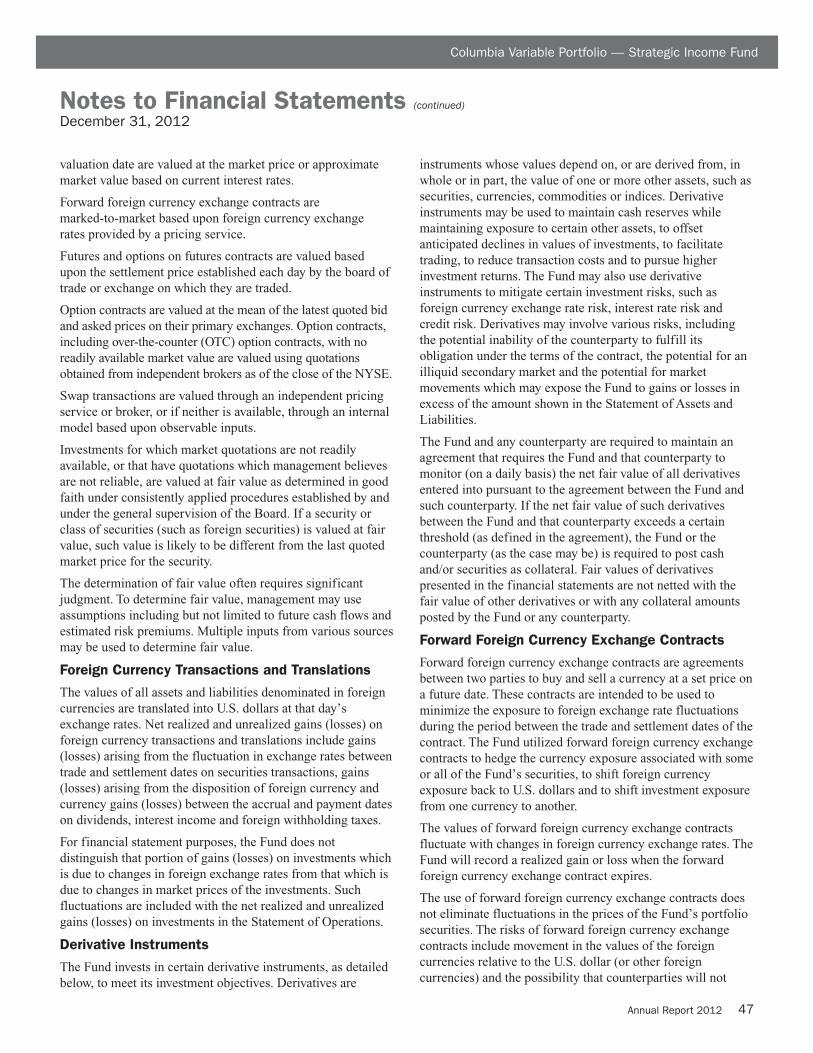
47Annual Report 2012
Notes to Financial Statements (continued)December 31, 2012
valuation date are valued at the market price or approximatemarket value based on current interest rates.
Forward foreign currency exchange contracts aremarked-to-market based upon foreign currency exchangerates provided by a pricing service.
Futures and options on futures contracts are valued basedupon the settlement price established each day by the board oftrade or exchange on which they are traded.
Option contracts are valued at the mean of the latest quoted bidand asked prices on their primary exchanges. Option contracts,including over-the-counter (OTC) option contracts, with noreadily available market value are valued using quotationsobtained from independent brokers as of the close of the NYSE.
Swap transactions are valued through an independent pricingservice or broker, or if neither is available, through an internalmodel based upon observable inputs.
Investments for which market quotations are not readilyavailable, or that have quotations which management believesare not reliable, are valued at fair value as determined in goodfaith under consistently applied procedures established by andunder the general supervision of the Board. If a security orclass of securities (such as foreign securities) is valued at fairvalue, such value is likely to be different from the last quotedmarket price for the security.
The determination of fair value often requires significantjudgment. To determine fair value, management may useassumptions including but not limited to future cash flows andestimated risk premiums. Multiple inputs from various sourcesmay be used to determine fair value.
Foreign Currency Transactions and Translations
The values of all assets and liabilities denominated in foreigncurrencies are translated into U.S. dollars at that day’sexchange rates. Net realized and unrealized gains (losses) onforeign currency transactions and translations include gains(losses) arising from the fluctuation in exchange rates betweentrade and settlement dates on securities transactions, gains(losses) arising from the disposition of foreign currency andcurrency gains (losses) between the accrual and payment dateson dividends, interest income and foreign withholding taxes.
For financial statement purposes, the Fund does notdistinguish that portion of gains (losses) on investments whichis due to changes in foreign exchange rates from that which isdue to changes in market prices of the investments. Suchfluctuations are included with the net realized and unrealizedgains (losses) on investments in the Statement of Operations.
Derivative Instruments
The Fund invests in certain derivative instruments, as detailedbelow, to meet its investment objectives. Derivatives are
instruments whose values depend on, or are derived from, inwhole or in part, the value of one or more other assets, such assecurities, currencies, commodities or indices. Derivativeinstruments may be used to maintain cash reserves whilemaintaining exposure to certain other assets, to offsetanticipated declines in values of investments, to facilitatetrading, to reduce transaction costs and to pursue higherinvestment returns. The Fund may also use derivativeinstruments to mitigate certain investment risks, such asforeign currency exchange rate risk, interest rate risk andcredit risk. Derivatives may involve various risks, includingthe potential inability of the counterparty to fulfill itsobligation under the terms of the contract, the potential for anilliquid secondary market and the potential for marketmovements which may expose the Fund to gains or losses inexcess of the amount shown in the Statement of Assets andLiabilities.
The Fund and any counterparty are required to maintain anagreement that requires the Fund and that counterparty tomonitor (on a daily basis) the net fair value of all derivativesentered into pursuant to the agreement between the Fund andsuch counterparty. If the net fair value of such derivativesbetween the Fund and that counterparty exceeds a certainthreshold (as defined in the agreement), the Fund or thecounterparty (as the case may be) is required to post cashand/or securities as collateral. Fair values of derivativespresented in the financial statements are not netted with thefair value of other derivatives or with any collateral amountsposted by the Fund or any counterparty.
Forward Foreign Currency Exchange Contracts
Forward foreign currency exchange contracts are agreementsbetween two parties to buy and sell a currency at a set price ona future date. These contracts are intended to be used tominimize the exposure to foreign exchange rate fluctuationsduring the period between the trade and settlement dates of thecontract. The Fund utilized forward foreign currency exchangecontracts to hedge the currency exposure associated with someor all of the Fund’s securities, to shift foreign currencyexposure back to U.S. dollars and to shift investment exposurefrom one currency to another.
The values of forward foreign currency exchange contractsfluctuate with changes in foreign currency exchange rates. TheFund will record a realized gain or loss when the forwardforeign currency exchange contract expires.
The use of forward foreign currency exchange contracts doesnot eliminate fluctuations in the prices of the Fund’s portfoliosecurities. The risks of forward foreign currency exchangecontracts include movement in the values of the foreigncurrencies relative to the U.S. dollar (or other foreigncurrencies) and the possibility that counterparties will not
Columbia Variable Portfolio — Strategic Income Fund

48 Annual Report 2012
Notes to Financial Statements (continued)December 31, 2012
complete their contractual obligations, which may be in excessof the amount reflected, if any, in the Statement of Assets andLiabilities.
Futures Contracts
Futures contracts represent commitments for the futurepurchase or sale of an asset at a specified price on a specifieddate. The Fund bought and sold futures contracts to managethe duration and yield curve exposure of the Fund versus thebenchmark. Upon entering into futures contracts, the Fundbears risks which may include interest rates, exchange rates orsecurities prices moving unexpectedly, in which case, the Fundmay not achieve the anticipated benefits of the futurescontracts and may realize a loss. Additional risks includecounterparty credit risk, the possibility of an illiquid market,and that a change in the value of the contract or option maynot correlate with changes in the value of the underlying asset.
Upon entering into a futures contract, the Fund pledges cashor securities with the broker in an amount sufficient to meetthe initial margin requirement. Subsequent payments(variation margin) are made or received by the Fund each day.The variation margin payments are equal to the daily changein the contract value and are recorded as variation marginreceivable or payable and are offset in unrealized gains orlosses. The Fund recognizes a realized gain or loss when thecontract is closed or expires. Futures contracts involve, tovarying degrees, risk of loss in excess of the variation margindisclosed in the Statement of Assets and Liabilities.
Options Contracts
Options are contracts which entitle the holder to purchase orsell securities or other identified assets at a specified price, orin the case of index option contracts, to receive or pay thedifference between the index value and the strike price of theindex option contract. The Fund purchased and wrote optioncontracts to manage exposure to movements in interest rates.Completion of transactions for option contracts traded in theOTC market depends upon the performance of the other party.Cash collateral may be collected or posted by the Fund tosecure certain OTC option contract trades. Cash collateral heldor posted by the Fund for such option contract trades must bereturned to the counterparty or the Fund upon closure,exercise or expiration of the contract.
Option contracts purchased are recorded as investments andoptions contracts written are recorded as liabilities of theFund. The Fund will realize a gain or loss when the optioncontract expires. When option contracts are exercised, theproceeds on sales for a written call or purchased put optioncontract, or the purchase cost for a written put or purchasedcall option contract, is adjusted by the amount of premiumreceived or paid.
The risk in buying an option contract is that the Fund pays apremium whether or not the option contract is exercised. TheFund also has the additional risk of being unable to enter intoa closing transaction if a liquid secondary market does notexist. The risk in writing a call option contract is that the Fundgives up the opportunity for profit if the market price of thesecurity increases. The risk in writing a put option contract isthat the Fund may incur a loss if the market price of thesecurity decreases and the option contract is exercised. TheFund’s maximum payout in the case of written put optioncontracts represents the maximum potential amount of futurepayments (undiscounted) that the Fund could be required tomake under the contract. For OTC options contracts, thetransaction is also subject to counterparty credit risk. Themaximum payout amount may be offset by the subsequentsale, if any, of assets obtained upon the exercise of the putoption contracts by holders of the option contracts or proceedsreceived upon entering into the contracts.
Contracts and premiums associated with options contractswritten for the year ended December 31, 2012 are as follows:
Calls
Contracts Premiums
Balance at December 31, 2011 — $ —
Opened 380 240,299
Closed (380) (240,299)
Balance at December 31, 2012 — $ —
Credit Default Swap Contracts
Credit default swap contracts are agreements in which one partypays fixed periodic payments to a counterparty in considerationfor a guarantee from the counterparty to make a specificpayment should a specified negative credit event(s) take place.The Fund entered into credit default swap contracts to increaseor decrease its credit exposure to a single issuer of debtsecurities.
As the purchaser of a credit default swap contract, the Fundpurchases protection by paying a periodic interest rate on thenotional amount to the counterparty. The interest amount isaccrued daily as a component of unrealized appreciation(depreciation) and is recorded as a realized loss upon payment.If a credit event as specified in the contract occurs, the Fundmay have the option either to deliver the reference obligationto the seller in exchange for a cash payment of its par amount,or to receive a net cash settlement equal to the par amount lessan agreed-upon value of the reference obligation as of the dateof the credit event. The difference between the value of theobligation or cash delivered and the notional amount receivedwill be recorded as a realized gain (loss).
Columbia Variable Portfolio — Strategic Income Fund

49Annual Report 2012
Notes to Financial Statements (continued)December 31, 2012
As the seller of a credit default swap contract, the Fund sellsprotection to a buyer and will generally receive a periodicinterest rate on the notional amount. The interest amount isaccrued daily as a component of unrealized appreciation(depreciation) and is recorded as a realized gain upon receipt ofthe payment. If a credit event as specified in the contractoccurs, the Fund may either be required to accept the referenceobligation from the buyer in exchange for a cash payment of itsnotional amount, or to pay the buyer a net cash settlementequal to the notional amount less an agreed-upon value of thereference obligation as of the date of the credit event. Thedifference between the value of the obligation or cash receivedand the notional amount paid will be recorded as a realizedgain (loss). The maximum potential amount of undiscountedfuture payments the Fund could be required to make as theseller of protection under a credit default swap contract is equalto the notional amount of the reference obligation. Notionalamounts of all credit default swap contracts outstanding forwhich the Fund is the seller of protection, if any, are disclosedin the Credit Default Swap Contracts Outstanding schedulefollowing the Portfolio of Investments. These potential amountsmay be partially offset by any recovery values of the respectivereference obligations or premiums received upon entering intothe agreement.
As a protection seller, the Fund bears the risk of loss from thecredit events specified in the contract. Although specified eventsare contract specific, credit events are generally defined asbankruptcy, failure to pay, restructuring, obligation acceleration,obligation default, or repudiation/moratorium. For credit defaultswap contracts on credit indices, quoted market prices andresulting market values serve as an indicator of the current statusof the payment/performance risk. Increasing market values, inabsolute terms when compared to the notional amount of theswap, represent a deterioration of the reference entity’s creditsoundness and a greater likelihood or risk of default or othercredit event occurring as defined under the terms of the contract.Market values for credit default swap contracts in which theFund is the seller of protection, if any, are disclosed in the CreditDefault Swap Contracts Outstanding schedule following thePortfolio of Investments.
The notional amounts and market values of credit default swapcontracts are not recorded in the financial statements. Anypremium paid or received by the Fund upon entering into acredit default swap contract is recorded as an asset or liability,respectively, and amortized daily as a component of realizedgain (loss) in the Statement of Operations. Credit default swapcontracts are valued daily, and the change in value is recordedas unrealized appreciation (depreciation) until the terminationof the swap, at which time a realized gain (loss) is recorded.
Credit default swap contracts can involve greater risks than ifa fund had invested in the reference obligation directly since,in addition to general market risks, credit default swaps aresubject to counterparty credit risk, leverage risk, hedging risk,correlation risk and liquidity risk. The Fund will enter intocredit default swap transactions only with counterparties thatmeet certain standards of creditworthiness.
Effects of Derivative Transactions in the Financial
Statements
The following tables are intended to provide additionalinformation about the effect of derivatives on the financialstatements of the Fund, including: the fair value of derivativesby risk category and the location of those fair values in theStatement of Assets and Liabilities; the impact of derivativetransactions on the Fund’s operations over the periodincluding realized gains or losses and unrealized gains orlosses. The derivative schedules following the Portfolio ofInvestments present additional information regardingderivative instruments outstanding at the end of the period, ifany.
The following table is a summary of the fair value ofderivative instruments at December 31, 2012:
Asset Derivatives
Risk Exposure Statement of Assets and
Category Liabilities Location Fair Value ($)
Foreign exchange Unrealized appreciation on 14,207contracts forward foreign currency
exchange contracts
Interest rate Net assets — unrealized 556,359*contracts appreciation on futures
contracts
Total 570,566
Liability Derivatives
Risk Exposure Statement of Assets and
Category Liabilities Location Fair Value ($)
Credit contracts Unrealized depreciation on 8,506swap contracts
Foreign exchange Unrealized depreciation on 745,154contracts forward foreign currency
exchange contracts
Interest rate Net assets — unrealized 811,157*contracts depreciation on futures
contracts
Total 1,564,817
*Includes cumulative appreciation (depreciation) of futures contracts asreported in the Futures Contracts Outstanding table following the Portfolioof Investments. Only the current day’s variation margin is reported inreceivables or payables in the Statement of Assets and Liabilities.
Columbia Variable Portfolio — Strategic Income Fund

50 Annual Report 2012
Notes to Financial Statements (continued)December 31, 2012
The effect of derivative instruments in the Statement of Operations for the year ended December 31, 2012:Amount of Realized Gain (Loss) on Derivatives Recognized in Income
Forward Foreign Options Contracts
Currency Exchange Written and
Risk Exposure Category Contracts ($) Futures Contracts ($) Purchased ($) Swap Contracts ($) Total ($)
Credit contracts — — — (5,978) (5,978)
Foreign exchange contracts 1,768,675 — — — 1,768,675
Interest rate contracts — (4,194,749) (294,153) — (4,488,902)
Total 1,768,675 (4,194,749) (294,153) (5,978) (2,726,205)
Change in Unrealized Appreciation (Depreciation) on Derivatives Recognized in Income
Forward Foreign Options Contracts
Currency Exchange Written and
Risk Exposure Category Contracts ($) Futures Contracts ($) Purchased ($) Swap Contracts ($) Total ($)
Credit contracts — — — (3,782) (3,782)
Foreign exchange contracts (832,736) — — — (832,736)
Interest rate contracts — 103,165 (143,674) — (40,509)
Total (832,736) 103,165 (143,674) (3,782) (877,027)
Columbia Variable Portfolio — Strategic Income Fund
The following table is a summary of the volume of derivativeinstruments for the year ended December 31, 2012:
Derivative Instrument Contracts Opened
Forward foreign currency exchange contracts 257
Futures contracts 8,610
Options contracts 2,935
Swap contracts —
Aggregate Notional
Derivative Instrument Opened ($)
Credit default swap contracts — buy protection —
Repurchase Agreements
The Fund may engage in repurchase agreement transactionswith institutions that management has determined arecreditworthy. The Fund, through the custodian, receivesdelivery of the underlying securities collateralizing arepurchase agreement. Management is responsible fordetermining that the collateral is at least equal, at all times, tothe value of the repurchase obligation including interest. Arepurchase agreement transaction involves certain risks in theevent of default or insolvency of the counterparty. These risksinclude possible delays in or restrictions on the Fund’s abilityto dispose of the underlying securities and a possible decline inthe value of the underlying securities during the period whilethe Fund seeks to assert its rights.
Delayed Delivery Securities and Forward Sale
Commitments
The Fund may trade securities on other than normal settlementterms, including securities purchased or sold on a“when-issued” basis. This may increase the risk if the otherparty to the transaction fails to deliver and causes the Fund tosubsequently invest at less advantageous prices. The Fund
designates cash or liquid securities in an amount equal to thedelayed delivery commitment.
The Fund may enter into forward sale commitments to hedgeits portfolio positions or to sell mortgage-backed securities itowns under delayed delivery arrangements. Proceeds offorward sale commitments are not received until thecontractual settlement date. While a forward sale commitmentis outstanding, equivalent deliverable securities or anoffsetting forward purchase commitment deliverable on orbefore the sale commitment date, are used to satisfy thecommitment.
Unsettled forward sale commitments are valued at the currentmarket value of the underlying securities, generally accordingto the procedures described under “Security Valuation” above.The forward sale commitment is “marked-to-market” dailyand the change in market value is recorded by the Fund as anunrealized gain or loss. If the forward sale commitment isclosed through the acquisition of an offsetting purchasecommitment, the Fund realizes a gain or loss. If the Funddelivers securities under the commitment, the Fund realizes again or a loss from the sale of the securities based upon themarket price established at the date the commitment wasentered into.
Mortgage Dollar Roll Transactions
The Fund may enter into mortgage “dollar rolls” in which theFund sells securities for delivery in the current month andsimultaneously contracts with the same counterparty torepurchase similar (same type, coupon and maturity) but notidentical securities on a specified future date not exceeding120 days. During the roll period, the Fund loses the right toreceive principal and interest paid on the securities sold.However, the Fund will benefit because it receives negotiated

51Annual Report 2012
Notes to Financial Statements (continued)December 31, 2012
amounts in the form of reductions of the purchase price for thefuture purchase plus the interest earned on the cash proceedsof the securities sold until the settlement date of the forwardpurchase. The Fund records the incremental differencebetween the forward purchase and sale of each forward roll asa realized gain or loss. Unless any realized gains exceed theincome, capital appreciation, and gain or loss due to mortgageprepayments that would have been realized on the securitiessold as part of the mortgage dollar roll, the use of thistechnique will diminish the investment performance of theFund compared to what the performance would have beenwithout the use of mortgage dollar rolls. All cash proceedswill be invested in instruments that are permissibleinvestments for the Fund. The Fund identifies within itsPortfolio of Investments cash or liquid securities in an amountequal to the forward purchase price.
For financial reporting and tax purposes, the Fund treats “tobe announced” mortgage dollar rolls as two separatetransactions, one involving the purchase of a security and aseparate transaction involving a sale. These transactions mayincrease the Fund’s portfolio turnover rate. The Fund does notcurrently enter into mortgage dollar rolls that are accountedfor as financing transactions.
Mortgage dollar rolls involve certain risks. If the broker-dealerto whom the Fund sells the securities becomes insolvent, theFund’s right to purchase or repurchase the mortgage-relatedsecurities may be restricted and the instruments which theFund is required to repurchase may be worth less thaninstruments which the Fund originally held. Successful use ofmortgage dollar rolls may depend upon the InvestmentManager’s ability to predict interest rates and mortgageprepayments. For these reasons, there is no assurance thatmortgage dollar rolls can be successfully employed.
Treasury Inflation Protected Securities
The Fund may invest in treasury inflation protected securities(TIPS). The principal amount of TIPS is adjusted periodicallyand is increased for inflation or decreased for deflation basedon a monthly published index. Interest payments are based onthe adjusted principal at the time the interest is paid. Theseadjustments are recorded as interest income in the Statementof Operations.
Loan Participations and Commitments
The Fund may invest in loan participations. When the Fundpurchases a loan participation, the Fund typically enters into acontractual relationship with the lender or third party sellingsuch participation (Selling Participant), but not the borrower.However, the Fund assumes the credit risk of the borrower,Selling Participant and any other persons interpositionedbetween the Fund and the borrower. The Fund may not directly
benefit from the collateral supporting the senior loan which ithas purchased from the Selling Participant.
Stripped Securities
The Fund may invest in Interest Only (IO) and Principal Only(PO) stripped mortgage-backed securities. These securities arederivative multi-class mortgage securities structured so thatone class receives most, if not all, of the principal from theunderlying mortgage assets, while the other class receivesmost, if not all, of the interest and the remainder of theprincipal. If the underlying mortgage assets experience greaterthan anticipated prepayments of principal, the Fund may fail tofully recoup its initial investment in an IO security, thereforethe daily interest accrual factor is adjusted each month toreflect the paydown of principal. The market value of thesesecurities can be extremely volatile in response to changes ininterest rates. Credit risk reflects the risk that the Fund maynot receive all or part of its principal because the issuer orcredit enhancer has defaulted on its obligation.
Security Transactions
Security transactions are accounted for on the trade date. Costis determined and gains (losses) are based upon the specificidentification method for both financial statement and federalincome tax purposes.
Income Recognition
Interest income is recorded on an accrual basis. Marketpremiums and discounts, including original issue discounts,are amortized and accreted, respectively, over the expected lifeof the security on all debt securities, unless otherwise noted.
Corporate actions and dividend income are recorded net ofany non-reclaimable tax withholdings, on the ex-dividend dateor upon receipt of ex-dividend notification in the case ofcertain foreign securities.
The value of additional securities received as an incomepayment is recorded as income and increases the cost basis ofsuch securities.
Expenses
General expenses of the Trust are allocated to the Fund andother funds of the Trust based upon relative net assets or otherexpense allocation methodologies determined by the nature ofthe expense. Expenses directly attributable to the Fund arecharged to the Fund. Expenses directly attributable to aspecific class of shares are charged to that share class.
Determination of Class Net Asset Value
All income, expenses (other than class-specific expenses,which are charged to that share class, as shown in theStatement of Operations) and realized and unrealized gains
Columbia Variable Portfolio — Strategic Income Fund
52 Annual Report 2012
Notes to Financial Statements (continued)December 31, 2012
(losses) are allocated to each class of the Fund on a dailybasis, based on the relative net assets of each class, forpurposes of determining the net asset value of each class.
Federal Income Tax Status
The Fund intends to qualify each year as a regulatedinvestment company under Subchapter M of the InternalRevenue Code, as amended, and will distribute substantiallyall of its taxable income, if any, for its tax year, and as suchwill not be subject to federal income taxes. In addition,because the Fund’s sole shareholders are Qualified Investors,the Fund expects not to be subject to federal excise tax.Therefore, no federal income or excise tax provision isrecorded.
Foreign Taxes
The Fund may be subject to foreign taxes on income, gains oninvestments or currency repatriation, a portion of which maybe recoverable. The Fund will accrue such taxes andrecoveries, as applicable, based upon its current interpretationof tax rules and regulations that exist in the markets in whichit invests.
Realized gains in certain countries may be subject to foreigntaxes at the Fund level, based on statutory rates. The Fundaccrues for such foreign taxes on net realized and unrealizedgains at the appropriate rate for each jurisdiction, asapplicable. The amount, if any, is disclosed as a liability on theStatement of Assets and Liabilities.
Distributions to Subaccounts
Distributions from net investment income, if any, are declaredand paid annually. Net realized capital gains, if any, aredistributed along with the income distribution. Incomedistributions and capital gain distributions are determined inaccordance with federal income tax regulations, which maydiffer from GAAP. All dividends and distributions arereinvested in additional shares of the applicable class of theFund at net asset value as of the ex-dividend date of thedistribution.
Guarantees and Indemnifications
Under the Trust’s organizational documents and, in somecases, by contract, its officers and trustees are indemnifiedagainst certain liabilities arising out of the performance oftheir duties to the Trust or its funds. In addition, certain of theFund’s contracts with its service providers contain generalindemnification clauses. The Fund’s maximum exposureunder these arrangements is unknown since the amount of anyfuture claims that may be made against the Fund cannot bedetermined, and the Fund has no historical basis for predictingthe likelihood of any such claims.
Recent Accounting Pronouncement
Disclosures about Offsetting Assets and LiabilitiesIn December 2011, the Financial Accounting Standards Board(FASB) issued Accounting Standards Update (ASU)No. 2011-11, Disclosures about Offsetting Assets andLiabilities. The objective of the FASB is to enhance currentdisclosure requirements on offsetting of certain assets andliabilities and to enable financial statement users to comparefinancial statements prepared under GAAP and InternationalFinancial Reporting Standards.
Specifically, ASU No. 2011-11 requires an entity to discloseboth gross and net information for derivatives and otherfinancial instruments that are subject to a master nettingarrangement or similar agreement. The standard requiresdisclosure of collateral received in connection with the masternetting agreements or similar agreements. The effective dateof ASU No. 2011-11 is for interim and annual periodsbeginning on or after January 1, 2013. At this time,management is evaluating the implications of this guidanceand the impact it will have on the financial statement amountsand footnote disclosures, if any.
Note 3. Fees and Compensation Paid to
Affiliates
Investment Management Fees
Under an Investment Management Services Agreement,Columbia Management Investment Advisers, LLC (theInvestment Manager), a wholly-owned subsidiary ofAmeriprise Financial, Inc. (Ameriprise Financial), determineswhich securities will be purchased, held or sold. Theinvestment management fee is an annual fee that is equal to apercentage of the Fund’s average daily net assets that declinesfrom 0.530% to 0.353% as the Fund’s net assets increase. Theeffective investment management fee rate for the year endedDecember 31, 2012 was 0.53% of the Fund’s average daily netassets.
Administration Fees
Under an Administrative Services Agreement, the InvestmentManager also serves as the Fund Administrator. The Fund paysthe Fund Administrator an annual fee for administration andaccounting services equal to a percentage of the Fund’saverage daily net assets that declines from 0.07% to 0.04% asthe Fund’s net assets increase. The effective administration feerate for the year ended December 31, 2012 was 0.07% of theFund’s average daily net assets.
Compensation of Board Members
Board members are compensated for their services to the Fundas disclosed in the Statement of Operations. The Trust’s eligibleTrustees may participate in a Deferred Compensation Plan (the
Columbia Variable Portfolio — Strategic Income Fund

53Annual Report 2012
Notes to Financial Statements (continued)December 31, 2012
Plan) which may be terminated at any time. Obligations of thePlan will be paid solely out of the Fund’s assets.
Compensation of Chief Compliance Officer
The Board has appointed a Chief Compliance Officer to theFund in accordance with federal securities regulations. TheFund pays its pro-rata share of the expenses associated withthe Chief Compliance Officer. The Fund’s expenses for theChief Compliance Officer will not exceed $15,000 per year.
Transfer Agent Fees
The Fund has a Transfer Agency and Dividend Disbursing AgentAgreement with Columbia Management Investment ServicesCorp. (the Transfer Agent), an affiliate of the InvestmentManager and a wholly-owned subsidiary of AmeripriseFinancial. The annual fee rate under this agreement is 0.06% ofthe Fund’s average daily net assets. The Transfer Agent alsoreceives compensation from fees for various shareholder servicesand reimbursements for certain out-of-pocket fees.
Distribution Fees
The Fund has an agreement with the Distributor, an affiliate ofthe Investment Manager and a wholly-owned subsidiary ofAmeriprise Financial, for distribution services. Pursuant toRule 12b-1 under the 1940 Act, the Board has approved, andthe Fund has adopted, a distribution plan (the Plan) which setsthe distribution fees for the Fund. These fees are calculateddaily and are intended to compensate the Distributor forselling shares of the Fund. The Plan requires the payment of amonthly distribution fee to the Distributor at the maximumannual rate of 0.25% of the average daily net assetsattributable to Class 2 shares of the Fund.
Expenses Waived/Reimbursed by the Investment
Manager and its Affiliates
Effective May 1, 2012, the Investment Manager and certain ofits affiliates have contractually agreed to waive fees and/orreimburse expenses (excluding certain fees and expensesdescribed below), through April 30, 2013, unless soonerterminated at the sole discretion of the Board, so that theFund’s net operating expenses, after giving effect to feeswaived/expenses reimbursed and any balance credits and/oroverdraft charges from the Fund’s custodian, do not exceedthe following annual rates as a percentage of the class’ averagedaily net assets:
Class 1 0.71%
Class 2 0.96
Prior to May 1, 2012, the Investment Manager and certain ofits affiliates contractually agreed to waive fees and/orreimburse expenses (excluding certain fees and expensesdescribed below), so that the Fund’s net operating expenses,
after giving effect to fees waived/expenses reimbursed and anybalance credits and/or overdraft charges from the Fund’scustodian, did not exceed the following annual rates as apercentage of the class’ average daily net assets:
Class 1 0.58%
Class 2 0.83
Under the agreement governing these fee waivers and/orexpense reimbursement arrangements, the following fees andexpenses are excluded from the waiver/reimbursementcommitment, and therefore will be paid by the Fund, ifapplicable: taxes (including foreign transaction taxes),expenses associated with investments in affiliated and non-affiliated pooled investment vehicles (including mutual fundsand exchange traded funds), transaction costs and brokeragecommissions, costs related to any securities lending program,dividend expenses associated with securities sold short,inverse floater program fees and expenses, transaction chargesand interest on borrowed money, interest, extraordinaryexpenses and any other expenses the exclusion of which isspecifically approved by the Board. This agreement may bemodified or amended only with approval from all parties.
Note 4. Federal Tax Information
The timing and character of income and capital gaindistributions are determined in accordance with income taxregulations, which may differ from GAAP because oftemporary or permanent book to tax differences.
At December 31, 2012, these differences are primarily due todiffering treatment for capital loss carryforwards, principaland/or interest of fixed income securities, deferral/reversal ofwash sales losses, Trustees’ deferred compensation, foreigncapital gains tax, foreign currency transactions and derivativeinvestments. To the extent these differences are permanent,reclassifications are made among the components of theFund’s net assets in the Statement of Assets and Liabilities.Temporary differences do not require reclassifications. In theStatement of Assets and Liabilities the followingreclassifications were made:
Undistributed net investment income $1,550,911
Accumulated net realized gain (1,550,911)
Paid-in capital —
Net investment income and net realized gains (losses), asdisclosed in the Statement of Operations, and net assets werenot affected by this reclassification.
The tax character of distributions paid during the yearsindicated was as follows:
Year Ended December 31, 2012 2011
Ordinary income $45,653,870 $4,720,029
Columbia Variable Portfolio — Strategic Income Fund

54 Annual Report 2012
Notes to Financial Statements (continued)December 31, 2012
Short-term capital gain distributions, if any, are consideredordinary income distributions for tax purposes.
At December 31, 2012, the components of distributableearnings on a tax basis were as follows:
Undistributed ordinary income $53,439,534
Undistributed accumulated long-term gain 22,667,276
Accumulated realized loss (3,902,482)
Unrealized appreciation 63,656,946
At December 31, 2012, the cost of investments for federalincome tax purposes was $1,020,415,783 and the aggregategross unrealized appreciation and depreciation based on thatcost was:
Unrealized appreciation $68,213,887
Unrealized depreciation (4,556,941)
Net unrealized appreciation $63,656,946
The following capital loss carryforward, determined atDecember 31, 2012, may be available to reduce taxableincome arising from future net realized gains on investments,if any, to the extent permitted by the Internal Revenue Code:
Year of Expiration Amount ($)
2017 3,902,482
For the year ended December 31, 2012, $4,685,790 of capitalloss carryforward was utilized.
Management of the Fund has concluded that there are nosignificant uncertain tax positions that would requirerecognition in the financial statements. However,management’s conclusion may be subject to review andadjustment at a later date based on factors including, but notlimited to, new tax laws, regulations, and administrativeinterpretations (including relevant court decisions). Generally,the Fund’s federal tax returns for the prior three fiscal yearsremain subject to examination by the Internal RevenueService.
Note 5. Portfolio Information
The cost of purchases and proceeds from sales of securities,excluding short-term obligations, aggregated to$1,169,089,663 and $1,249,380,152, respectively, for the yearended December 31, 2012, of which $947,660,259 and$930,341,727, respectively, were U.S. government securities.
Note 6. Lending of Portfolio Securities
Effective December 31, 2012, the Fund no longer participatesin securities lending activity. Prior to that date, the Fund hadentered into a Master Securities Lending Agreement (the
Agreement) with JPMorgan Chase Bank, N.A. (JPMorgan).The Agreement authorized JPMorgan as lending agent to lendsecurities to authorized borrowers in order to generateadditional income on behalf of the Fund. Pursuant to theAgreement, the securities loaned were secured by cash orsecurities that either were issued or guaranteed as to principaland interest by the U.S. government, its agencies, authoritiesor instrumentalities with value equal to at least 100% of themarket value of the loaned securities. Any additional collateralrequired to maintain those levels due to market fluctuations ofthe loaned securities was requested to be delivered thefollowing business day. Cash collateral received was investedby the lending agent on behalf of the Fund into authorizedinvestments pursuant to the Agreement.
Pursuant to the Agreement, the Fund received income forlending its securities either in the form of fees or by earninginterest on invested cash collateral, net of negotiated rebatespaid to borrowers and fees paid to the lending agent forservices provided and any other securities lending expenses.Net income earned from securities lending for the year endedDecember 31, 2012 is disclosed in the Statement ofOperations. The Fund continued to earn and accrue interestand dividends on the securities loaned. At December 31, 2012,the Fund did not have any securities on loan.
Note 7. Affiliated Money Market Fund
The Fund invests its daily cash balances in Columbia Short-Term Cash Fund, an affiliated money market fund establishedfor the exclusive use by the Fund and other affiliated funds.The income earned by the Fund from such investments isincluded as “Dividends — affiliated issuers” in the Statementof Operations. As an investing fund, the Fund indirectly bearsits proportionate share of the expenses of Columbia Short-Term Cash Fund.
Note 8. Shareholder Concentration
At December 31, 2012, affiliated shareholder accounts owned93.5% of the outstanding shares of the Fund. Subscription andredemption activity by concentrated accounts may have asignificant effect on the operations of the Fund.
Note 9. Line of Credit
The Fund has entered into a revolving credit facility with asyndicate of banks led by JPMorgan whereby the Fund mayborrow for the temporary funding of shareholder redemptionsor for other temporary or emergency purposes. The creditfacility agreement, as amended, which is a collectiveagreement between the Fund and certain other funds managedby the Investment Manager, severally and not jointly, permits
Columbia Variable Portfolio — Strategic Income Fund
55Annual Report 2012
Notes to Financial Statements (continued)December 31, 2012
collective borrowings up to $500 million. Interest is charged toeach participating fund based on its borrowings at a rate equalto the higher of (i) the overnight federal funds rate plus 1.00%or (ii) the one-month LIBOR rate plus 1.00%. Each borrowingunder the credit facility matures no later than 60 days after thedate of borrowing. The Fund also pays a commitment feeequal to its pro rata share of the amount of the credit facility ata rate of 0.08% per annum.
The Fund had no borrowings during the year endedDecember 31, 2012.
Note 10. Fund Merger
At the close of business on April 29, 2011, the Fund acquiredthe assets and assumed the identified liabilities of RiverSourceVariable Portfolio — Strategic Income Fund, a series ofColumbia Funds Variable Series Trust II. The reorganizationwas completed after shareholders approved the plan onFebruary 15, 2011. The purpose of the transaction was tocombine two funds managed by the Investment Manager withcomparable investment objectives and strategies.
The aggregate net assets of the Fund immediately before theacquisition were $64,473,972 and the combined net assetsimmediately after the acquisition were $1,063,335,495.
The merger was accomplished by a tax-free exchange of96,054,561 shares of RiverSource Variable Portfolio —Strategic Income Fund valued at $998,861,523 (including$42,951,869 of unrealized appreciation).
In exchange for RiverSource Variable Portfolio — StrategicIncome Fund shares, the Fund issued the following number ofshares:
Shares
Class 1 116,606,245
Class 2 369,809
For financial reporting purposes, net assets received andshares issued by Columbia Variable Portfolio — StrategicIncome Fund were recorded at fair value; however,RiverSource Variable Portfolio — Strategic Income Fund’scost of investments was carried forward.
The financial statements reflect the operations of the Fund forthe period prior to the merger and the combined fund for theperiod subsequent to the merger. Because the combinedinvestment portfolios have been managed as a singleintegrated portfolio since the merger was completed, it is notpracticable to separate the amounts of revenue and earnings ofRiverSource Variable Portfolio — Strategic Income Fund thathave been included in the combined Fund’s Statement ofOperations since the merger was completed.
Assuming the merger had been completed on January 1, 2011,the Fund’s pro-forma net investment income, net gain oninvestments, net change in unrealized appreciation and netincrease in net assets from operations for the year endedDecember 31, 2011 would have been approximately$54.4 million, $12.3 million, $(1.3) million and $65.4 million,respectively.
Note 11. Significant Risks
High Yield Securities Risk
Investing in high-yield fixed income securities may involvegreater credit risk and considerations not typically associatedwith investing in U.S. Government bonds and other higherquality fixed income securities. These securities are non-investment grade securities, often referred to as “junk” bonds.Economic downturns may disrupt the high yield market andimpair the ability of issuers to repay principal and interest.Also, an increase in interest rates would likely have an adverseimpact on the value of such obligations. Moreover, high-yieldsecurities may be less liquid to the extent that there is noestablished secondary market.
Foreign Securities Risk
Investing in foreign securities may include certain risks andconsiderations not typically associated with investing in U.S.securities, such as fluctuating currency values and changinglocal and regional economic, political and social conditions,which may result in greater market volatility. In addition, certainforeign securities may not be as liquid as U.S. securities.Investing in emerging markets may accentuate these risks.
Investments in emerging market countries are subject toadditional risk. The risk of foreign investments is typicallyincreased in less developed countries. These countries are alsomore likely to experience high levels of inflation, deflation orcurrency devaluation which could hurt their economies andsecurities markets.
Asset-Backed Securities Risk
The value of asset-backed securities may be affected by, amongother factors, changes in interest rates, the market’s assessmentof the quality of underlying assets, the creditworthiness of theservicer for the underlying assets, factors concerning theinterests in and structure of the issuer or the originator of theunderlying assets, or the creditworthiness or rating of theentities that provide any supporting letters of credit, suretybonds, derivative instruments, or other credit enhancement. Thevalue of asset-backed securities also will be affected by theexhaustion, termination or expiration of any creditenhancement. Most asset-backed securities are subject toprepayment risk, which is the possibility that the underlyingdebt may be refinanced or prepaid prior to maturity during
Columbia Variable Portfolio — Strategic Income Fund

56 Annual Report 2012
Notes to Financial Statements (continued)December 31, 2012
periods of declining or low interest rates, causing the Fund tohave to reinvest the money received in securities that havelower yields. In addition, the impact of prepayments on thevalue of asset-backed securities may be difficult to predict andmay result in greater volatility.
Mortgage-Backed Securities Risk
The value of mortgage-backed securities may be affected by,among other things, changes in interest rates, factorsconcerning the interests in and structure of the issuer or theoriginator of the mortgages, the creditworthiness of theentities that provide any supporting letters of credit, suretybonds or other credit enhancements or the quality ofunderlying assets or the market’s assessment thereof.Mortgage-backed securities are subject to prepayment risk,which is the possibility that the underlying mortgage may berefinanced or prepaid prior to maturity during periods ofdeclining or low interest rates, causing the Fund to have toreinvest the money received in securities that have loweryields. In addition, the impact of prepayments on the value ofmortgage-backed securities may be difficult to predict andmay result in greater volatility.
Note 12. Subsequent Events
Management has evaluated the events and transactions thathave occurred through the date the financial statements wereissued and noted no items requiring adjustment of thefinancial statements or additional disclosure.
Note 13. Information Regarding Pending
and Settled Legal Proceedings
In December 2005, without admitting or denying theallegations, American Express Financial Corporation (AEFC,which is now known as Ameriprise Financial, Inc. (AmeripriseFinancial)) entered into settlement agreements with theSecurities and Exchange Commission (SEC) and MinnesotaDepartment of Commerce (MDOC) related to market timingactivities. As a result, AEFC was censured and ordered to ceaseand desist from committing or causing any violations of certainprovisions of the Investment Advisers Act of 1940, theInvestment Company Act of 1940, and various Minnesota laws.AEFC agreed to pay disgorgement of $10 million and civilmoney penalties of $7 million. AEFC also agreed to retain anindependent distribution consultant to assist in developing aplan for distribution of all disgorgement and civil penaltiesordered by the SEC in accordance with various undertakingsdetailed at www.sec.gov/litigation/admin/ia-2451.pdf.Ameriprise Financial and its affiliates have cooperated with theSEC and the MDOC in these legal proceedings, and have maderegular reports to the funds’ Boards of Trustees.
Ameriprise Financial and certain of its affiliates havehistorically been involved in a number of legal, arbitration andregulatory proceedings, including routine litigation, classactions, and governmental actions, concerning matters arisingin connection with the conduct of their business activities.Ameriprise Financial believes that the Funds are not currentlythe subject of, and that neither Ameriprise Financial nor any ofits affiliates are the subject of, any pending legal, arbitration orregulatory proceedings that are likely to have a materialadverse effect on the Funds or the ability of AmeripriseFinancial or its affiliates to perform under their contracts withthe Funds. Ameriprise Financial is required to make 10-Q,10-K and, as necessary, 8-K filings with the Securities andExchange Commission on legal and regulatory matters thatrelate to Ameriprise Financial and its affiliates. Copies ofthese filings may be obtained by accessing the SEC websiteat www.sec.gov.
There can be no assurance that these matters, or the adversepublicity associated with them, will not result in increasedfund redemptions, reduced sale of fund shares or other adverseconsequences to the Funds. Further, although we believeproceedings are not likely to have a material adverse effect onthe Funds or the ability of Ameriprise Financial or its affiliatesto perform under their contracts with the Funds, theseproceedings are subject to uncertainties and, as such, we areunable to estimate the possible loss or range of loss that mayresult. An adverse outcome in one or more of theseproceedings could result in adverse judgments, settlements,fines, penalties or other relief that could have a materialadverse effect on the consolidated financial condition orresults of operations of Ameriprise Financial.
Columbia Variable Portfolio — Strategic Income Fund

Annual Report 2012 57
To the Trustees of Columbia Funds Variable Insurance Trust and
the Shareholders of Columbia Variable Portfolio — Strategic Income Fund
In our opinion, the accompanying statement of assets and liabilities, including the portfolio of investments, and the relatedstatements of operations and of changes in net assets and the financial highlights present fairly, in all material respects, thefinancial position of Columbia Variable Portfolio — Strategic Income Fund (the “Fund”) (a series of Columbia FundsVariable Insurance Trust) at December 31, 2012, the results of its operations, the changes in its net assets, and the financialhighlights for each of the periods indicated, in conformity with accounting principles generally accepted in the United Statesof America. These financial statements and financial highlights (hereafter referred to as “financial statements”) are theresponsibility of the Fund’s management. Our responsibility is to express an opinion on these financial statements based onour audit. We conducted our audit of these financial statements in accordance with the standards of the Public CompanyAccounting Oversight Board (United States). Those standards require that we plan and perform the audit to obtainreasonable assurance about whether the financial statements are free of material misstatement. An audit includes examining,on a test basis, evidence supporting the amounts and disclosures in the financial statements, assessing the accountingprinciples used and significant estimates made by management, and evaluating the overall financial statement presentation.We believe that our audits, which included confirmation of securities at December 31, 2012 by correspondence with thecustodian, transfer agent, agent banks and brokers, provides a reasonable basis for our opinion.
PricewaterhouseCoopers LLPMinneapolis, MinnesotaFebruary 19, 2013
Columbia Variable Portfolio — Strategic Income Fund
Report of Independent Registered Public Accounting Firm
58 Annual Report 2012
The Fund hereby designates the following tax attributes for the fiscal year ended December 31, 2012.
Tax Designations:
Capital Gain Dividend . . . . . . . . . . . . . . . . . . . . . . . . . . . . . . . . . . . . . . . $23,800,640
Capital Gain Dividend. The Fund designates as a capital gain dividend the amount reflected above, or if subsequentlydetermined to be different, the net capital gain of such fiscal period. The Fund also designates as capital gain dividends, tothe extent necessary to fully distribute such capital gains, earnings and profits distributed to shareholders on the redemptionof shares.
Federal Income Tax Information(Unaudited)
Columbia Variable Portfolio — Strategic Income Fund

Trustees and Officers
Columbia Variable Portfolio — Strategic Income Fund
59Annual Report 2012
The Trustees serve terms of indefinite duration. The names, addresses and birth years of the Trustees and Officers of theFunds in Columbia Funds Variable Insurance Trust, the year each was first elected or appointed to office, their principalbusiness occupations during at least the last five years, the number of Funds overseen by each Trustee and otherdirectorships they hold are shown below. Each officer listed below serves as an officer of each Fund in Columbia FundsVariable Insurance Trust.
Independent Trustees
Name, Address and Year of Birth, Principal Occupation(s) During Past Five Years, Number of Funds in Columbia
Position with Funds, Year First Funds Complex Overseen by Trustee, Other Directorships Held
Elected or Appointed to Office
Independent consultant since 2010; Co-Founder of Baringo Capital LLC (private equity) from 1997 to2008; CEO of Crystal River Capital, Inc. (real estate investment trust) from 2003 to 2010; Oversees52; Jackson Hewitt Tax Service Inc. (tax preparation services from 2004 to 2011); CelgeneCorporation (global biotechnology company); Student Loan Corporation (student loan provider from2005 to 2010); Celgene Corporation (global biotechnology company); The Helios Funds andBrookfield Funds (closed-end funds); Crystal River Capital, Inc. from 2005 to 2010; ParsonsBrinckerhoff from 1995 to 2008; and Apex Silver Mines Ltd. from 2007 to 2009
Rodman L. Drake (Born 1943)c/o Columbia ManagementInvestment Advisers, LLC 225 Franklin Street Boston, MA 02110 Trustee (since 1994) and Chairman of the Board (since 2009)
Independent business executive since May 2006; Executive Vice President — Strategy of UnitedAirlines from December 2002 to May 2006; President of UAL Loyalty Services (airline marketingcompany) from September 2001 to December 2002; Executive Vice President and Chief FinancialOfficer of United Airlines from July 1999 to September 2001. Oversees 52; Nash Finch Company (fooddistributor); Aircastle Limited (aircraft leasing); and SeaCube Container Leasing Ltd. (container leasing)
Douglas A. Hacker (Born 1955)c/o Columbia ManagementInvestment Advisers, LLC 225 Franklin Street Boston, MA 02110 Trustee (since 1996)
Senior Vice President, General Counsel and Corporate Secretary, ConocoPhillips (integrated energycompany) since September 2007; Deputy General Counsel — Corporate Legal Services,ConocoPhillips from August 2006 to August 2007; Partner, Zelle, Hofmann, Voelbel, Mason & GetteLLP (law firm) from March 2005 to July 2006; Adjunct Professor of Law, Northwestern University fromSeptember 2004 to June 2006; Director, UAL Corporation (airline) from February 2006 to July 2006;Chief Administrative Officer and Senior Vice President, Kmart Holding Corporation (consumer goods)from September 2003 to March 2004. Oversees 52; None
Janet Langford Kelly (Born 1957)c/o Columbia ManagementInvestment Advisers, LLC 225 Franklin Street Boston, MA 02110 Trustee (since 1996)
Senior Vice President, Partner and Director of Marketing, Wellington Management Company, LLP(investment adviser) from 1997 to 2010; Chair, Wellington Management Investment Portfolios(commingled non-U.S. investment pools) from 2007 to 2010; Director, Wellington Trust Company, NAand other Wellington affiliates from 1997 to 2010. Oversees 52; None
Nancy T. Lukitsh (Born 1956)c/o Columbia ManagementInvestment Advisers, LLC 225 Franklin Street Boston, MA 02110 Trustee (since 2011)
Partner, Park Avenue Equity Partners (private equity) since February 1999; Dean and Professor,College of Business and Management, University of Maryland from 1992 to 1996. Oversees 52;DynaVox Inc. (speech creation); Lee Enterprises (print media); WR Hambrecht + Co. (financial serviceprovider) from 2000 to 2012; BlackRock Kelso Capital Corporation (investment company)
William E. Mayer (Born 1940)c/o Columbia ManagementInvestment Advisers, LLC 225 Franklin Street Boston, MA 02110 Trustee (since 1994)
Retired. Chief Executive Officer, Federal Home Loan Mortgage Corporation, from 2008 to 2009;Senior Adviser, Global Financial Services Group, Carlyle Group, Inc., from 2007 to 2008; ViceChairman and Chief Financial Officer, U.S. Bancorp, from 1993 to 2007. Oversees 52; CIT Group Inc.(commercial and consumer finance); eBay Inc. (online trading community); MBIA Inc. (financial serviceprovider); E.W. Scripps Co. (print and television media), Building Materials Holding Corp. (buildingmaterials and construction services); and University of Oklahoma Foundation.
David M. Moffett (Born 1952)c/o Columbia ManagementInvestment Advisers, LLC 225 Franklin Street Boston, MA 02110 Trustee (since 2011)
Retired Professor Emeritus, University of Washington, since 2011; Professor of Economics, Universityof Washington from January 1976 to 2011; Ford and Louisa Van Voorhis Professor of PoliticalEconomy, University of Washington from 1993 to 2011; Adjunct Professor of Statistics, University ofWashington from 1980 to 2011; Associate Editor, Journal of Money Credit and Banking from 1993 to2008; consultant on econometric and statistical matters. Oversees 52; None
Charles R. Nelson (Born 1942)c/o Columbia ManagementInvestment Advisers, LLC 225 Franklin Street Boston, MA 02110 Trustee (since 1981)
President, Saint Michael’s College, since August 2007; Director or Trustee of several non-profitorganizations, including Fletcher Allen Health Care, Inc.; University Professor, Boston College fromNovember 2005 to August 2007; Academic Vice President and Dean of Faculties, Boston Collegefrom August 1999 to October 2005. Oversees 52; Liberty All-Star Equity Fund and Liberty All-StarGrowth Fund (closed-end funds)
John J. Neuhauser (Born 1943)c/o Columbia ManagementInvestment Advisers, LLC 225 Franklin Street Boston, MA 02110 Trustee (since 1984)

Columbia Variable Portfolio — Strategic Income Fund
Trustees and Officers (continued)
60 Annual Report 2012
Independent Trustees (continued)
Name, Address and Year of Birth, Principal Occupation(s) During Past Five Years, Number of Funds in Columbia
Position with Funds, Year First Funds Complex Overseen by Trustee, Other Directorships Held
Elected or Appointed to Office
Interested Trustee
Name, Address and Year of Birth, Principal Occupation(s) During Past Five Years, Number of Funds in Columbia
Position with Funds, Year First Funds Complex Overseen by Trustee, Other Directorships Held
Elected or Appointed to Office
The Statement of Additional Information includes additional information about the Trustees of the Funds and is available,without charge, upon request by calling 1-800-345-6611.
The Board has appointed officers who are responsible for day-to-day business decisions based on policies it has established.The officers serve at the pleasure of the Board. In addition to Mr. Truscott, who is Senior Vice President, the Funds’ otherofficers are:
Officers
Name, Year of Birth and Address Principal Occupation(s) During the Past Five Years
Partner, Perkins Coie LLP (law firm). Oversees 52; NonePatrick J. Simpson (Born 1944)c/o Columbia ManagementInvestment Advisers, LLC 225 Franklin Street Boston, MA 02110 Trustee (since 2000)
Retired. General Manager — Global Education Industry from 1994 to 1997, President — ApplicationSystems Division from 1991 to 1994, Chief Financial Officer — US Marketing & Services from 1988to 1991, and Chief Information Officer from 1987 to 1988, IBM Corporation (computer andtechnology). Oversees 52; Enesco Group, Inc. (producer of giftware and home and garden decorproducts) from 2001 to 2006
Anne-Lee Verville (Born 1945)c/o Columbia ManagementInvestment Advisers, LLC 225 Franklin Street Boston, MA 02110 Trustee (since 1998)
President, Columbia Management Investment Advisers, LLC February 2012, (previously President,Chairman of the Board and Chief Investment Officer, 2001-April 2010); Chief Executive Officer, GlobalAsset Management, Ameriprise Financial, Inc. since September 2012 (previously Chief ExecutiveOfficer, U.S. Asset Management & President, Annuities, May 2010-September 2012 and President —U.S. Asset Management and Chief Investment Officer, 2005-April 2010); President and ChiefExecutive Officer, Ameriprise Certificate Company 2006-August 2012; Chief Executive Officer,Columbia Management Investment Distributors, Inc. since February 2012, (previously Chairman of theBoard and Chief Executive Officer, 2006-April 2010); Chairman of the Board and Chief ExecutiveOfficer, RiverSource Distributors, Inc. since 2006. Oversees 208; Columbia Funds Board.
William F. Truscott (born 1960)53600 Ameriprise Financial CenterMinneapolis, MN 55474Senior Vice President (since 2012)
Senior Vice President and General Manager — Mutual Fund Products, Columbia ManagementInvestment Advisers, LLC since May 2010; President, Columbia Funds, since 2009, and RiverSourceFunds, since May 2010 (previously Senior Vice President and Chief Financial Officer, Columbia Funds,from June 2008 to January 2009, Treasurer, Columbia Funds, from October 2003 to May 2008, andsenior officer of various other affiliated funds since 2000); Managing Director, Columbia ManagementAdvisors, LLC from December 2004 to April 2010.
J. Kevin Connaughton (Born 1964)225 Franklin Street Boston, MA 02110 President (since 2009)
Vice President, Columbia Management Investment Advisers, LLC since May 2010; Managing Directorof Fund Administration, Columbia Management Advisors, LLC, from September 2004 to April 2010;senior officer of Columbia Funds and affiliated funds since 2002.
Michael G. Clarke (Born 1969)225 Franklin Street Boston, MA 02110 Treasurer (since 2011) and ChiefFinancial Officer (since 2009)
Senior Vice President, Chief Legal Officer and Assistant Secretary, Columbia Management InvestmentAdvisers, LLC since June 2005; Vice President and Lead Chief Counsel — Asset Management,Ameriprise Financial, Inc. since May 2010 (previously Vice President and Chief Counsel — AssetManagement, from 2005 to April 2010); Vice President, Chief Counsel and Assistant Secretary,Columbia Management Investment Distributors, Inc. since 2008; Vice President, General Counsel andSecretary, Ameriprise Certificate Company since 2005; Chief Counsel, RiverSource Distributors, Inc.since 2006; Vice President, General Counsel and Secretary, RiverSource Funds sinceDecember 2006; Senior Vice President, Secretary and Chief Legal Officer, Columbia Funds, sinceMay 2010.
Scott R. Plummer (Born 1959)5228 Ameriprise Financial Center Minneapolis, MN 55474 Senior Vice President, AssistantSecretary and Chief Legal Officer(since 2010)

Columbia Variable Portfolio — Strategic Income Fund
Trustees and Officers (continued)
Officers (continued)
Name, Year of Birth and Address Principal Occupation(s) During the Past Five Years
Thomas P. McGuire (Born 1972)225 Franklin Street Boston, MA 02110 Chief Compliance Officer(since 2012)
Vice President — Asset Management Compliance, Columbia Management Investment Advisers, LLCsince 2010; Chief Compliance Officer, Ameriprise Certificate Company, since September 2010;Compliance Executive, Bank of America, 2005-2010.
Colin Moore (Born 1958)225 Franklin Street Boston, MA 02110 Senior Vice President (since 2010)
Director and Chief Investment Officer, Columbia Management Investment Advisers, LLC sinceMay 2010; Manager, Managing Director and Chief Investment Officer of Columbia ManagementAdvisors, LLC from 2007 to April 2010; Head of Equities, Columbia Management Advisors, LLC from2002 to 2007.
Amy Johnson (Born 1965)5228 Ameriprise Financial Center Minneapolis, MN 55474 Vice President (since 2010)
Senior Vice President and Chief Operating Officer, Columbia Management Investment Advisers, LLCsince May 2010 (previously Chief Administrative Officer, from 2009 until April 2010, Vice President —Asset Management and Trust Company Services, from 2006 to 2009, and Vice President —Operations and Compliance from 2004 to 2006).
Joseph F. DiMaria (Born 1968)225 Franklin Street Boston, MA 02110 Vice President (since 2011) andChief Accounting Officer (since 2008)
Vice President, Mutual Fund Administration, Columbia Management Investment Advisers, LLC, sinceMay 2010; Director of Fund Administration, Columbia Management Advisors, LLC from January 2006to April 2010; Head of Tax/Compliance and Assistant Treasurer, Columbia Management Advisors,LLC, from November 2004 to December 2005.
Stephen T. Welsh (born 1957)225 Franklin Street Boston, MA 02110 Vice President (since 2006)
President and Director, Columbia Management Investment Services Corp. since May 2010; Presidentand Director, Columbia Management Services, Inc. from July 2004 to April 2010; Managing Director,Columbia Management Distributors, Inc. from August 2007 to April 2010.
Paul D. Pearson (born 1956)10468 Ameriprise Financial Center Minneapolis, MN 55474 Vice President and AssistantTreasurer (since 2011)
Vice President, Investment Accounting, Columbia Management Investment Advisers, LLC, sinceMay 2010; Vice President, Managed Assets, Investment Accounting, Ameriprise FinancialCorporation.
Paul B. Goucher (born 1968)5228 Ameriprise Financial Center Minneapolis, MN 55474 Vice President and AssistantSecretary (since 2010)
Vice President and Lead Chief Counsel, Ameriprise Financial, Inc. since November 2008 andJanuary 2013, respectively (formerly, Chief Counsel from January 2010-January 2013 and GroupCounsel from November 2008-January 2010); Director, Managing Director and General Counsel,J. & W. Seligman & Co. Incorporated, July 2008-November 2008 (previously, Managing Director andAssociate General Counsel, January 2005-July 2008).
Christopher O. Petersen (born 1970)5228 Ameriprise Financial Center Minneapolis, MN 55474 Vice President (since 2010) andSecretary (since 2011)
Vice President and Chief Counsel, Ameriprise Financial since January 2010 (formerly Vice Presidentand Group Counsel or Counsel from April 2004 to January 2010); Assistant Secretary of RiverSourceFunds since January 2007; officer of Columbia Funds and affiliated funds since 2007.
Michael E. DeFao (born 1968)225 Franklin StreetBoston, MA 02110Vice President and AssistantSecretary (since 2011)
Vice President and Chief Counsel, Ameriprise Financial since May 2010; Associate General Counsel,Bank of America from June 2005 to April 2010.
Annual Report 2012 61

62 Annual Report 2012
This page intentionally left blank.

63Annual Report 2012
This page intentionally left blank.

64 Annual Report 2012
This page intentionally left blank.

65Annual Report 2012
The policy of the Board is to vote the proxies of the companies in which each fund holds investments consistent with theprocedures as stated in the Statement of Additional Information (SAI). You may obtain a copy of the SAI without charge bycalling 800.345.6611; contacting your financial intermediary; or searching the website of the Securities and ExchangeCommission (SEC) at sec.gov. Information regarding how each fund voted proxies relating to portfolio securities is filedwith the SEC by August 31 for the most recent 12-month period ending June 30 of that year, and is available without chargeby visiting columbiamanagement.com; or searching the website of the SEC at sec.gov.
Each fund files a complete schedule of portfolio holdings with the SEC for the first and third quarters of each fiscal year onForm N-Q. Each fund’s Form N-Q is available on the SEC’s website at sec.gov and may be reviewed and copied at theSEC’s Public Reference Room in Washington, D.C. Information on the operation of the Public Reference Room may beobtained by calling 800.SEC.0330. Each fund’s complete schedule of portfolio holdings, as filed on Form N-Q, can also beobtained without charge, upon request, by calling 800.345.6611.
Important Information About This Report
Columbia Variable Portfolio — Strategic Income Fund

This information is for use with concurrent or prior delivery of a fund prospectus. Please carefully consider theinvestment objectives, risks, charges and expenses of any variable fund and its related variable contract beforeinvesting. For variable fund and variable contract prospectuses, which contain this and other importantinformation, contact your financial advisor or insurance representative. Please read the prospectus carefullybefore you invest. The Fund is distributed by Columbia Management Investment Distributors, Inc., member FINRA,and managed by Columbia Management Investment Advisers, LLC. © 2013 Columbia Management Investment Advisers, LLC. All rights reserved.
C-1521 C (3/13)
Columbia Variable Portfolio — Strategic Income FundP.O. Box 8081Boston, MA 02266-8081

Annual ReportDecember 31, 2012
Columbia Variable Portfolio – DividendOpportunity Fund
Please remember that you may not buy (nor will you own) shares of the Fund directly. You invest by buying a variable annuitycontract or life insurance policy and allocating your purchase payments to the variable subaccount or variable account (thesubaccounts) that invests in the Fund. Please contact your financial advisor or insurance representative for more information.


Columbia Variable Portfolio – Dividend Opportunity Fund
Table of Contents
Performance Overview ................................................ 2
Manager Discussion of Fund Performance........................ 4
Understanding Your Fund’s Expenses ............................. 7
Portfolio of Investments .............................................. 8
Statement of Assets and Liabilities ................................13
Statement of Operations .............................................15
Statement of Changes in Net Assets ..............................16
Financial Highlights....................................................18
Notes to Financial Statements ......................................21
Report of Independent RegisteredPublic Accounting Firm ................................................27
Trustees and Officers .................................................28
Important Information About This Report..........................33
The views expressed in this report reflectthe current views of the respective parties.These views are not guarantees of futureperformance and involve certain risks,uncertainties and assumptions that aredifficult to predict, so actual outcomes andresults may differ significantly from theviews expressed. These views are subjectto change at any time based uponeconomic, market or other conditions andthe respective parties disclaim anyresponsibility to update such views. Theseviews may not be relied on as investmentadvice and, because investment decisionsfor a Columbia Fund are based onnumerous factors, may not be relied on asan indication of trading intent on behalf ofany particular Columbia Fund. Referencesto specific securities should not beconstrued as a recommendation orinvestment advice.
Annual Report 2012

Columbia Variable Portfolio – Dividend Opportunity Fund
Performance Overview
Performance Summary> Columbia Variable Portfolio — Dividend Opportunity Fund (the Fund) Class 3 shares returned 13.99% for the 12-month
period that ended December 31, 2012.
> The Fund underperformed its benchmark, the Russell 1000 Value Index, which returned 17.51% for the same time period.
> The Fund’s underperformance can be attributed primarily to sector allocation overall, which more than offset the modestlypositive contributions made by individual stock selection.
Average Annual Total Returns (%) (for period ended December 31, 2012)
Inception 1 Year 5 Years 10 Years
Class 1* 05/03/10 14.10 -0.73 8.97
Class 2* 05/03/10 13.86 -0.94 8.78
Class 3 09/15/99 13.99 -0.81 8.92
Russell 1000 Value Index 17.51 0.59 7.38
Performance data quoted represents past performance and current performance may be lower or higher. Past performance is no guarantee offuture results. The investment return and principal value will fluctuate so that shares, when redeemed, may be worth more or less than theoriginal cost. For current month-end performance information, please contact your insurance company.
Performance results reflect the effect of any fee waivers or reimbursements of fund expenses by Columbia Management Investment Advisers,LLC and/or any of its affiliates. Absent these fee waivers or expense reimbursement arrangements, performance results would have been lower.
Investment earnings, if any, are tax-deferred until distributed to shareholders, at which time taxes may become due. Total return performanceincludes changes in share price and assumes reinvestment of dividends and capital gains, if any. Performance results reflect the effect of all fundexpenses, but do not include any fees and expenses imposed under your variable annuity contract and/or variable life insurance policy orqualified pension or retirement plan. If performance results included the effect of these additional charges, they would be lower.
* The returns shown for periods prior to the share class inception date (including returns for the Life of the Fund, if shown, which are since Fundinception) include the returns of the Fund’s oldest share class. These returns are adjusted to reflect any higher class-related operating expensesof the newer share classes, as applicable. Please visit columbiamanagement.com/variable-products/appended-performance for more information.
The Russell 1000 Value Index, an unmanaged index, measures the performance of those stocks in the Russell 1000 Index with lower price-to-bookratios and lower forecasted growth values.
Indices are not available for investment, are not professionally managed and do not reflect sales charges, fees, brokerage commissions, taxes orother expenses of investing. Securities in the Fund may not match those in an index.
2 Annual Report 2012

Columbia Variable Portfolio – Dividend Opportunity Fund
Performance Overview (continued)
Performance of a Hypothetical $10,000 Investment (January 1, 2003 — December 31, 2012)
0
5,000
10,000
15,000
$30,000
$23,508
$20,38220,000
25,000
Columbia Variable Portfolio — Dividend Opportunity Fund Class 3 ($23,508)
Russell 1000 Value Index ($20,382)
12/03 12/04 12/05 12/06 12/07 12/08 12/09 12/10 12/11 12/1201/01/03
The chart above shows the change in value of a hypothetical $10,000 investment in Class 3 shares of Columbia Variable Portfolio — DividendOpportunity Fund during the stated time period, and does not reflect the deduction of taxes if any, that a shareholder may pay on Fund distributionsor on the redemption of Fund shares. The returns also do not reflect fees and expenses imposed under your variable annuity contract and/or variablelife insurance policy or qualified pension or retirement plan, if any.
Annual Report 2012 3

Columbia Variable Portfolio – Dividend Opportunity Fund
Manager Discussion of Fund Performance
Portfolio Management
Steve Schroll
Laton Spahr, CFA
Paul Stocking
Top Ten Holdings (%)(at December 31, 2012)
Enbridge, Inc. 3.2
Pfizer, Inc. 2.7
Royal Dutch Shell PLC, ADR 2.7
General Electric Co. 2.7
Cisco Systems, Inc. 2.6
JPMorgan Chase & Co. 2.4
Merck & Co., Inc. 2.2
XL Group PLC 2.1
Eaton Corp. Plc 2.0
Verizon Communications, Inc. 1.9
Percentages indicated are based upon totalinvestments (excluding Money Market Funds).
For further detail about these holdings, pleaserefer to the section entitled “Portfolio ofInvestments.”
Fund holdings are as of the date given, aresubject to change at any time, and are notrecommendations to buy or sell any security.
Effective June 29, 2012, Columbia Variable Portfolio — Diversified Equity IncomeFund was re-named Columbia Variable Portfolio — Dividend Opportunity Fundand its principal investment strategies were changed.
As of December 31, 2012, 25% or more of the Fund’s shares were owned in theaggregate by affiliated funds-of-funds managed by Columbia ManagementInvestment Advisers, LLC (the Investment Manager). As a result of asset allocationdecisions by the Investment Manager, it is possible that the Fund may experiencerelatively large purchases or redemptions from affiliated funds-of-funds. While theInvestment Manager seeks to minimize the impact of these transactions bystructuring them over a reasonable period of time, the Fund may experienceincreased expenses as it buys and sells securities as a result of purchases orredemptions by affiliated funds-of-funds.
For the 12-month period that ended December 31, 2012, the Fund’s Class 3 sharesreturned 13.99%. The Fund underperformed its benchmark, the Russell 1000 ValueIndex (Russell Index), which increased 17.51% for the period. The Fund’sunderperformance can be attributed primarily to sector allocation overall, whichmore than offset the modestly positive contributions made by individual stockselection.
U.S. Equity Market Rallied Despite Pronounced VolatilityThe U.S. equity market posted its best annual performance since 2007, but suchgains mask what was particularly pronounced market volatility throughout 2012.Such volatility was driven by worries about the then-looming U.S. fiscal cliff,about economic health in Europe and China and about a gridlocked, highly partisanpolitical environment at home.
Early in the annual period, the U.S. economic recovery generated enough solideconomic data, especially in the manufacturing, employment, retail and housingmarkets, to raise consumer expectations and restore investor confidence. Anunusually mild winter in the U.S. further supported economic activity. In turn, theS&P 500 Index, a broad measure of large company stock performance, gained12.59%, its strongest first-quarter gain since 1998. The second quarter, however,saw a pullback, led by disappointing economic data — especially lackluster jobformation. Europe’s reluctance to craft a meaningful long-term solution to itslingering debt problems, especially in Greece, also weighed on investor sentimentas did a continued slowdown in emerging market growth, especially in China. TheU.S. equity market declined during the second quarter, although a late agreementby Eurozone leaders to have a unified banking regulator lifted stocks in thequarter’s final trading session.
The U.S. equity market came back strong enough in the third quarter to more thanerase second quarter losses, as investors shrugged off still lackluster economic databoth here and abroad. Even though Europe’s sovereign debt problems continued todominate the headlines, the European Central Bank raised hopes for a longer-termsolution, and the U.S. Federal Reserve’s (the Fed) commitment to an additionalround of quantitative easing — buying up bonds to lower interest rates — furtherbolstered investor confidence.
The pace of economic growth remained sluggish but positive in the fourth quarter,as the Northeast U.S. recovered from the devastating effects of Hurricane Sandy,uncertainty dominated in advance of the November elections, and Congressdelayed action to avert the fiscal cliff of tax increases and spending cuts. Despitegenerally positive economic news regarding manufacturing activity, consumer
4 Annual Report 2012

Columbia Variable Portfolio – Dividend Opportunity Fund
Manager Discussion of Fund Performance (continued)
spending and housing market data and announcements by the Fed regarding theextension of its efforts to make financial conditions more accommodative, a cloudof uncertainty hung over the equity markets. Most major U.S. equity indicesgenerated flat returns for the quarter.
Despite such volatility and uncertainty, all ten sectors of the Russell Index postedpositive returns for the year. For the annual period overall, the consumerdiscretionary, financials and industrials sectors performed best on a relative basis.The utilities, energy and information technology sectors were the weakestperformers in the Russell Index during the annual period.
Sector Allocation Hampered Fund PerformanceThe Fund underperformed the Russell Index due primarily to sector allocationoverall. Individual stock selection contributed positively, albeit modestly, to theFund’s relative results.
Sector allocation in the financials sector negatively impacted the Fund’s annualresults most, more than offsetting the positive contribution made by stock selectionwithin the sector. The Fund had a significantly lesser exposure to financials thanthe Russell Index, which hurt, as the sector was the second strongest performerduring the annual period. Having an approximately 1.8% average position in cashand cash equivalents also detracted during an annual period when the U.S. equitymarket rallied so strongly.
The Fund’s results were also hurt by stock selection within the consumerdiscretionary sector. In particular, having sizable positions in auto parts companyJohnson Controls and fast-food restaurant retailer McDonald’s hampered results.Johnson Controls struggled during the annual period against weak automobilebattery demand amidst an inventory overhang and by poor results within its autointeriors business segment. McDonald’s disappointed given a seeming plateau in itsglobal same-store sales results and given an increasingly competitive environmentin the U.S.
In the energy sector, a position in oilfield services giant Halliburton detracted fromthe Fund’s relative performance. Halliburton’s shares were pressured by missedearnings, largely the result of low natural gas prices and a decline in natural-gasdirected wells.
Information Technology and Utilities Selection BoostedResultsOn the positive side, stock selection in the information technology and utilitiessectors proved particularly effective. In information technology, positions incomputers and peripherals giant Apple and global payment solutions providerMasterCard benefited the Fund during the annual period. Timing of our tradesduring the annual period in Apple proved especially prudent, contributingpositively to the Fund’s results. Shares of MasterCard advanced as the company’svolumes held up better than anticipated even in the face of a sluggish economy andafter the Fed announced its final decision on debit interchange rates (i.e. charges ondebit card transactions), which was more favorable for the company than themarket had anticipated.
In utilities, a position in gas distribution company Sempra Energy boosted theFund’s results most. During the annual period, investors responded favorably toSempra Energy’s investment in future liquid natural gas (LNG) capacity and its
Portfolio Breakdown (%)(at December 31, 2012)
Common Stocks 98.1
Consumer Discretionary 8.1
Consumer Staples 10.6
Energy 12.6
Financials 17.4
Health Care 13.7
Industrials 10.5
Information Technology 7.7
Materials 4.0
Telecommunication Services 6.6
Utilities 6.9
Convertible Bonds 0.2
Materials 0.2
Equity-Linked Notes 0.5
Money Market Funds 1.2
Total 100.0
Percentages indicated are based upon totalinvestments. The Fund’s portfolio compositionis subject to change.
Annual Report 2012 5

Columbia Variable Portfolio – Dividend Opportunity Fund
Manager Discussion of Fund Performance (continued)
efforts to get such capabilities approved by regulators. Amidst the worstperforming sector in the Russell Index, Sempra Energy was a standout performer.
Elsewhere, a position in industrials company Cooper Industries contributedpositively to the Fund’s relative results. Cooper Industries’ stock performed well asthe company was the subject of an agreed-upon takeout by Eaton in a deal valuedat about $11.46 billion.
New Fund Strategy Drove Fund Portfolio ChangesThrough much of the annual period, we added to the Fund’s allocation to thefinancials sector, as we felt there had been fundamental improvement in the creditstatistics and lending segments of the industry. Also, in transitioning the Fund to amore dividend-oriented investment strategy beginning on the last trading day ofJune, we decreased the Fund’s positions in the energy and industrials sectors andcorrespondingly increased its positions in utilities and health care sectors.
Looking AheadFrom a broad perspective, we believe the agreement reached regarding the fiscalcliff — the series of federal tax hikes and spending cuts that were due to take placeat the start of 2013 — resolved some of the details of the tax half of the questionbut did nothing to fix the cliff’s 10-year plan to cut spending by $1.2 trillion. Thatmeans Congress will have to finish that half of the problem at the same time itnegotiates an extension of the U.S.’ borrowing limits. Add to the mix a slew of neweconomic data for the markets to chew on and the result is likely continuedvolatility in the U.S. equity market.
That said, once these political budgetary and financial issues do fade, hopefully bythe end of the first calendar quarter, we believe the rhetoric surroundingWashington D.C. decision making that has weighed on both U.S. and internationalequity markets for some time now will be reduced and investors will be able to re-focus their attention on the pace of economic growth and on prospects for corporateearnings and revenue growth in 2013. As investors return to a fundamental analysisof the traditional drivers of performance, we believe the U.S. should be perceivedwell relative to the rest of the developed world and that the potential for equities’multiple expansion that has been suppressed by government-driven macro issueswill be enhanced. These factors, along with monetary policy that we believeremains in equity investors’ favor and signs that global economic growth is pickingup, particularly in China, lead us to be cautiously optimistic about the returns theU.S. equity market could generate in 2013.
6 Annual Report 2012

Columbia Variable Portfolio – Dividend Opportunity Fund
Understanding Your Fund’s Expenses(Unaudited)
As an investor, you incur ongoing costs, which generally include management fees, distribution and/or service (Rule 12b-1) fees,and other fund expenses. The following information is intended to help you understand your ongoing costs (in dollars) ofinvesting in the Fund and to help you compare these costs with the ongoing costs of investing in other mutual funds.
The information below does not reflect fees and expenses imposed under your variable annuity contract and/or variable lifeinsurance policy (collectively, Contracts) or qualified pension and retirement plan (Qualified Plan), if any. The total fees andexpenses you bear may therefore be higher than those shown below.
Analyzing Your Fund’s ExpensesTo illustrate these ongoing costs, we have provided examples and calculated the expenses paid by investors in each share class ofthe Fund during the period. The actual and hypothetical information in the table is based on an initial investment of $1,000 at thebeginning of the period indicated and held for the entire period. Expense information is calculated two ways and each methodprovides you with different information. The amount listed in the “Actual” column is calculated using the Fund’s actual operatingexpenses and total return for the period. You may use the Actual information, together with the amount invested, to estimate theexpenses that you paid over the period. Simply divide your account value by $1,000 (for example, an $8,600 account valuedivided by $1,000 = 8.6), then multiply the results by the expenses paid during the period under the Actual column. The amountlisted in the “Hypothetical” column assumes a 5% annual rate of return before expenses (which is not the Fund’s actual return)and then applies the Fund’s actual expense ratio for the period to the hypothetical return. You should not use the hypotheticalaccount values and expenses to estimate either your actual account balance at the end of the period or the expenses you paidduring the period. See “Compare With Other Funds” below for details on how to use the hypothetical data.
Compare With Other FundsSince all mutual funds are required to include the same hypothetical calculations about expenses in shareholder reports, you canuse this information to compare the ongoing cost of investing in the Fund with other funds. To do so, compare the hypotheticalexample with the 5% hypothetical examples that appear in the shareholder reports of other funds. As you compare hypotheticalexamples of other funds, it is important to note that hypothetical examples are meant to highlight the ongoing costs of investing ina fund only and do not reflect any transaction costs, such as redemption or exchange fees, or expenses that apply to thesubaccount or the contract. Therefore, the hypothetical calculations are useful in comparing ongoing costs only, and will not helpyou determine the relative total costs of owning different funds. If the fees and expenses imposed under your Contract orQualified Plan, if any, were included, your costs would be higher.
July 1, 2012 – December 31, 2012
Account Value at theBeginning of the
Period ($)
Account Value at theEnd of thePeriod ($)
Expenses Paid Duringthe Period ($)
Fund’s AnnualizedExpense Ratio (%)
Actual Hypothetical Actual Hypothetical Actual Hypothetical Actual
Class 1 1,000.00 1,000.00 1,056.00 1,021.79 3.59 3.53 0.69
Class 2 1,000.00 1,000.00 1,054.90 1,020.52 4.88 4.80 0.94
Class 3 1,000.00 1,000.00 1,055.50 1,021.18 4.21 4.14 0.81
Expenses paid during the period are equal to the annualized expense ratio for each class as indicated above, multiplied by the average account valueover the period and then multiplied by the number of days in the Fund’s most recent fiscal half year and divided by 366.
Expenses do not include fees and expenses incurred indirectly by the Fund from the underlying funds in which the Fund may invest (also referred toas “acquired funds”), including affiliated and non-affiliated pooled investment vehicles (including mutual funds and exchange-traded funds).
Annual Report 2012 7

Columbia Variable Portfolio – Dividend Opportunity Fund
Portfolio of InvestmentsDecember 31, 2012(Percentages represent value of investments compared to net assets)
Common Stocks 98.1%
Issuer Shares Value ($)
Consumer Discretionary 8.1%
Automobiles 0.8%
Ford Motor Co. 1,830,315 23,702,579
Hotels, Restaurants & Leisure 2.4%
Carnival Corp. 403,708 14,844,343
Intercontinental Hotels Group PLC 320,413 8,984,498
Las Vegas Sands Corp. 157,300 7,260,968
McDonald’s Corp. 442,100 38,997,641
Total 70,087,450
Household Durables 1.2%
Leggett & Platt, Inc. 937,713 25,524,548
Whirlpool Corp. 107,961 10,985,032
Total 36,509,580
Media 2.5%
Cinemark Holdings, Inc. 285,800 7,425,084
Gannett Co., Inc. 673,245 12,125,142
National CineMedia, Inc. 943,093 13,325,904
Regal Entertainment Group, Class A 1,168,097 16,294,953
Time Warner, Inc. 370,508 17,721,398
Viacom, Inc., Class B 146,732 7,738,646
Total 74,631,127
Multiline Retail 0.6%
Macy’s, Inc. 419,659 16,375,094
Specialty Retail 0.6%
Buckle, Inc. (The) 116,400 5,196,096
GameStop Corp., Class A 543,600 13,638,924
Total 18,835,020
Total Consumer Discretionary 240,140,850
Consumer Staples 10.7%
Beverages 1.2%
Coca-Cola Co. (The) 473,800 17,175,250
PepsiCo, Inc. 257,667 17,632,153
Total 34,807,403
Food & Staples Retailing 0.7%
Costco Wholesale Corp. 120,100 11,862,277
SYSCO Corp. 232,100 7,348,286
Total 19,210,563
Food Products 2.9%
B&G Foods, Inc. 816,511 23,115,426
ConAgra Foods, Inc. 290,100 8,557,950
Hershey Co. (The) 105,200 7,597,544
Kraft Foods Group, Inc. 234,628 10,668,535
Common Stocks (continued)
Issuer Shares Value ($)
Mondelez International, Inc., Class A 703,884 17,927,926
Unilever NV — NY Shares 500,500 19,169,150
Total 87,036,531
Household Products 2.1%
Kimberly-Clark Corp. 344,796 29,111,126
Procter & Gamble Co. (The) 465,358 31,593,155
Total 60,704,281
Personal Products 0.2%
Avon Products, Inc. 466,700 6,701,812
Tobacco 3.6%
Altria Group, Inc. 763,235 23,980,844
Lorillard, Inc. 435,565 50,817,368
Philip Morris International, Inc. 378,584 31,664,766
Total 106,462,978
Total Consumer Staples 314,923,568
Energy 12.5%
Energy Equipment & Services 0.9%
Seadrill Ltd. 746,208 27,460,455
Oil, Gas & Consumable Fuels 11.6%
BP PLC, ADR 708,100 29,485,284
Chevron Corp. 462,430 50,007,180
Enbridge, Inc. 2,143,453 92,854,384
Kinder Morgan, Inc. 674,827 23,841,638
Occidental Petroleum Corp. 347,068 26,588,879
Royal Dutch Shell PLC, ADR 1,135,639 78,302,309
Spectra Energy Corp. 507,500 13,895,350
Total SA, ADR 292,092 15,191,705
Williams Companies, Inc. (The) 410,939 13,454,143
Total 343,620,872
Total Energy 371,081,327
Financials 17.4%
Capital Markets 2.0%
BlackRock, Inc. 105,752 21,859,996
Goldman Sachs Group, Inc. (The) 234,033 29,853,249
New Mountain Finance Corp. 586,562 8,739,774
Total 60,453,019
Commercial Banks 5.5%
Bank of Montreal 453,000 27,768,900
Fifth Third Bancorp 585,900 8,899,821
M&T Bank Corp. 323,700 31,874,739
U.S. Bancorp 1,333,200 42,582,408
Wells Fargo & Co. 1,500,780 51,296,660
Total 162,422,528
The accompanying Notes to Financial Statements are an integral part of this statement.
8 Annual Report 2012

Columbia Variable Portfolio – Dividend Opportunity Fund
Portfolio of Investments (continued)
December 31, 2012
Common Stocks (continued)
Issuer Shares Value ($)
Diversified Financial Services 4.2%
Citigroup, Inc. 1,099,243 43,486,077
JPMorgan Chase & Co. 1,619,911 71,227,487
NYSE Euronext 260,200 8,206,708
Total 122,920,272
Insurance 5.4%
ACE Ltd. 344,856 27,519,509
Aflac, Inc. 246,400 13,088,768
Allstate Corp. (The) 617,036 24,786,336
Endurance Specialty Holdings Ltd. 172,717 6,855,138
PartnerRe Ltd. 118,298 9,521,806
Travelers Companies, Inc. (The) 231,132 16,599,900
XL Group PLC 2,465,016 61,773,301
Total 160,144,758
Real Estate Investment Trusts (REITs) 0.3%
Omega Healthcare Investors, Inc. 320,400 7,641,540
Total Financials 513,582,117
Health Care 13.7%
Biotechnology 0.2%
Amgen, Inc. 82,700 7,138,664
Pharmaceuticals 13.5%
Abbott Laboratories 382,900 25,079,950
AstraZeneca PLC, ADR 474,206 22,415,718
Bristol-Myers Squibb Co. 1,031,095 33,603,386
Eli Lilly & Co. 333,900 16,467,948
GlaxoSmithKline PLC, ADR 647,800 28,159,866
Johnson & Johnson 783,323 54,910,942
Merck & Co., Inc. 1,594,161 65,264,951
Novartis AG, ADR 568,367 35,977,631
Pfizer, Inc. 3,160,984 79,277,479
Roche Holding AG, ADR 442,676 22,355,138
Warner Chilcott PLC, Class A 1,322,100 15,918,084
Total 399,431,093
Total Health Care 406,569,757
Industrials 10.5%
Aerospace & Defense 1.6%
Honeywell International, Inc. 278,322 17,665,098
Lockheed Martin Corp. 314,870 29,059,352
Total 46,724,450
Commercial Services & Supplies 2.2%
ADT Corp. (The) 136,259 6,334,681
Deluxe Corp. 515,500 16,619,720
Common Stocks (continued)
Issuer Shares Value ($)
Pitney Bowes, Inc. 1,073,941 11,426,732
RR Donnelley & Sons Co. 1,129,000 10,161,000
Tyco International Ltd. 272,519 7,971,181
Waste Management, Inc. 361,900 12,210,506
Total 64,723,820
Electrical Equipment 2.3%
Eaton Corp. PLC 1,078,978 58,480,607
Hubbell, Inc., Class B 122,525 10,369,291
Total 68,849,898
Industrial Conglomerates 3.0%
General Electric Co. 3,712,900 77,933,771
Siemens AG, ADR 95,188 10,420,230
Total 88,354,001
Machinery 1.4%
Harsco Corp. 584,100 13,726,350
Illinois Tool Works, Inc. 405,714 24,671,468
Pentair Ltd. 65,389 3,213,870
Total 41,611,688
Total Industrials 310,263,857
Information Technology 7.7%
Communications Equipment 2.6%
Cisco Systems, Inc. 3,843,036 75,515,658
Computers & Peripherals 0.3%
Dell, Inc. 966,200 9,787,606
Internet Software & Services 0.4%
AOL, Inc. 408,031 12,081,798
Semiconductors & Semiconductor Equipment 3.5%
Analog Devices, Inc. 478,300 20,117,298
Intel Corp. 1,251,676 25,822,076
Maxim Integrated Products, Inc. 771,100 22,670,340
Microchip Technology, Inc. 1,054,158 34,355,009
Total 102,964,723
Software 0.9%
Microsoft Corp. 1,038,847 27,768,380
Total Information Technology 228,118,165
Materials 4.0%
Chemicals 1.6%
Dow Chemical Co. (The) 243,976 7,885,304
Mosaic Co. (The) 389,220 22,041,529
Olin Corp. 847,200 18,291,048
Total 48,217,881
Metals & Mining 0.6%
Southern Copper Corp. 462,300 17,502,678
The accompanying Notes to Financial Statements are an integral part of this statement.
Annual Report 2012 9

Columbia Variable Portfolio – Dividend Opportunity Fund
Portfolio of Investments (continued)
December 31, 2012
Common Stocks (continued)
Issuer Shares Value ($)
Paper & Forest Products 1.8%
International Paper Co. 912,277 36,345,116
MeadWestvaco Corp. 517,300 16,486,351
Total 52,831,467
Total Materials 118,552,026
Telecommunication Services 6.6%
Diversified Telecommunication Services 6.0%
AT&T, Inc. 1,281,465 43,198,185
BCE, Inc. 356,100 15,290,934
CenturyLink, Inc. 862,390 33,736,697
Deutsche Telekom AG, ADR 1,198,563 13,621,668
Telstra Corp., Ltd. 1,525,500 6,951,288
Verizon Communications, Inc. 1,298,013 56,165,022
Windstream Corp. 807,645 6,687,301
Total 175,651,095
Wireless Telecommunication Services 0.6%
Vodafone Group PLC, ADR 729,201 18,368,573
Total Telecommunication Services 194,019,668
Utilities 6.9%
Electric Utilities 2.8%
American Electric Power Co., Inc. 347,440 14,828,739
Duke Energy Corp. 322,500 20,575,500
FirstEnergy Corp. 350,515 14,637,507
NextEra Energy, Inc. 228,630 15,818,910
PPL Corp. 560,702 16,052,898
Total 81,913,554
Multi-Utilities 4.1%
Ameren Corp. 456,800 14,032,896
Dominion Resources, Inc. 467,402 24,211,423
National Grid PLC 1,088,700 12,486,755
PG&E Corp. 522,994 21,013,899
Public Service Enterprise Group, Inc. 182,300 5,578,380
SCANA Corp. 171,200 7,813,568
Sempra Energy 333,197 23,636,995
TECO Energy, Inc. 749,900 12,568,324
Total 121,342,240
Total Utilities 203,255,794
Total Common Stocks(Cost: $2,626,208,250) 2,900,507,129
Equity-Linked Notes 0.5%
IssuerCoupon
Rate Shares Value ($)
Deutsche Bank AGMandatoryExchangeable Notes(linked to commonstock of CiscoSystems, Inc.)(a)
02/12/13 11.67% 412,500 15,906,412
Total Equity-Linked Notes(Cost: $15,031,500) 15,906,412
Convertible Bonds 0.2%
PrincipalAmount Value ($)
Building Materials 0.2%
Cemex SAB de CV Subordinated Notes03/15/18 3.750% 5,139,000 5,839,189
Total Convertible Bonds(Cost: $5,139,000) 5,839,189
Money Market Funds 1.2%
Shares Value ($)
Columbia Short-Term Cash Fund,0.142%(b)(c) 35,930,083 35,930,083
Total Money Market Funds(Cost: $35,930,083) 35,930,083
Total Investments(Cost: $2,682,308,833) 2,958,182,813
Other Assets & Liabilities, Net (1,067,778)
Net Assets 2,957,115,035
The accompanying Notes to Financial Statements are an integral part of this statement.
10 Annual Report 2012

Columbia Variable Portfolio – Dividend Opportunity Fund
Portfolio of Investments (continued)
December 31, 2012
Notes to Portfolio of Investments(a) Security exempt from registration pursuant to Rule 144A under the Securities Act of 1933. This security may be resold in transactions exempt
from registration, normally to qualified institutional buyers. At December 31, 2012, the value of these securities amounted to $15,906,412 or0.54% of net assets.
(b) The rate shown is the seven-day current annualized yield at December 31, 2012.
(c) As defined in the Investment Company Act of 1940, an affiliated company is one in which the Fund owns 5% or more of its outstanding votingsecurities, or a company which is under common ownership or control with the Fund. Holdings and transactions in these affiliated companiesduring the year ended December 31, 2012, are as follows:
IssuerBeginning
Cost ($)PurchaseCost ($)
Sales Cost/Proceeds
From Sales ($)Ending
Cost ($)
Dividendsor InterestIncome ($) Value ($)
Columbia Short-Term Cash Fund 79,103,189 927,380,229 (970,553,335) 35,930,083 85,486 35,930,083
Abbreviation LegendADR American Depositary Receipt
Fair Value MeasurementsGenerally accepted accounting principles (GAAP) require disclosure regarding the inputs and valuation techniques used to measure fair value and anychanges in valuation inputs or techniques. In addition, investments shall be disclosed by major category.
The Fund categorizes its fair value measurements according to a three-level hierarchy that maximizes the use of observable inputs and minimizes theuse of unobservable inputs by prioritizing that the most observable input be used when available. Observable inputs are those that marketparticipants would use in pricing an investment based on market data obtained from sources independent of the reporting entity. Unobservableinputs are those that reflect the Fund’s assumptions about the information market participants would use in pricing an investment. An investment’slevel within the fair value hierarchy is based on the lowest level of any input that is deemed significant to the asset or liability’s fair valuemeasurement. The input levels are not necessarily an indication of the risk or liquidity associated with investments at that level. For example, certainU.S. government securities are generally high quality and liquid, however, they are reflected as Level 2 because the inputs used to determine fairvalue may not always be quoted prices in an active market.
Fair value inputs are summarized in the three broad levels listed below:
> Level 1 — Valuations based on quoted prices for investments in active markets that the Fund has the ability to access at the measurement date(including NAV for open-end mutual funds). Valuation adjustments are not applied to Level 1 investments.
> Level 2 — Valuations based on other significant observable inputs (including quoted prices for similar securities, interest rates, prepaymentspeeds, credit risks, etc.).
> Level 3 — Valuations based on significant unobservable inputs (including the Fund’s own assumptions and judgment in determining the fair valueof investments).
Inputs that are used in determining fair value of an investment may include price information, credit data, volatility statistics, and other factors.These inputs can be either observable or unobservable. The availability of observable inputs can vary between investments, and is affected byvarious factors such as the type of investment, and the volume and level of activity for that investment or similar investments in the marketplace.The inputs will be considered by the Investment Manager, along with any other relevant factors in the calculation of an investment’s fair value. TheFund uses prices and inputs that are current as of the measurement date, which may include periods of market dislocations. During these periods,the availability of prices and inputs may be reduced for many investments. This condition could cause an investment to be reclassified between thevarious levels within the hierarchy.
Investments falling into the Level 3 category are primarily supported by quoted prices from brokers and dealers participating in the market for thoseinvestments. However, these may be classified as Level 3 investments due to lack of market transparency and corroboration to support thesequoted prices. Additionally, valuation models may be used as the pricing source for any remaining investments classified as Level 3. These modelsrely on one or more significant unobservable inputs and/or significant assumptions by the Investment Manager. Inputs used in valuations mayinclude, but are not limited to, financial statement analysis, capital account balances, discount rates and estimated cash flows, and comparablecompany data.
Under the direction of the Fund’s Board of Trustees (the Board), the Investment Manager’s Valuation Committee (the Committee) is responsible forcarrying out the valuation procedures approved by the Board. The Committee consists of voting and non-voting members from various groups withinthe Investment Manager’s organization, including operations and accounting, trading and investments, compliance, risk management and legal.
The Committee meets at least monthly to review and approve valuation matters, which may include a description of specific valuationdeterminations, data regarding pricing information received from approved pricing vendors and brokers and the results of Board-approved valuationcontrol policies and procedures (the Policies). The Policies address, among other things, instances when market quotations are readily available,including recommendations of third party pricing vendors and a determination of appropriate pricing methodologies; events that require specificvaluation determinations and assessment of fair value techniques; securities with a potential for stale pricing, including those that are illiquid,restricted, or in default; and the effectiveness of third- party pricing vendors, including periodic reviews of vendors. The Committee meets morefrequently, as needed, to discuss additional valuation matters, which may include the need to review back-testing results, review time-sensitiveinformation or approve related valuation actions. The Committee reports to the Board, with members of the Committee meeting with the Board ateach of its regularly scheduled meetings to discuss valuation matters and actions during the period, similar to those described earlier.
The accompanying Notes to Financial Statements are an integral part of this statement.
Annual Report 2012 11

Columbia Variable Portfolio – Dividend Opportunity Fund
Portfolio of Investments (continued)
December 31, 2012
Fair Value Measurements (continued)
For investments categorized as Level 3, the Committee monitors information similar to that described above, which may include: (i) data specific tothe issuer or comparable issuers, (ii) general market or specific sector news and (iii) quoted prices and specific or similar security transactions. TheCommittee considers this data and any changes from prior periods in order to assess the reasonableness of observable and unobservable inputs,any assumptions or internal models used to value those securities and changes in fair value. This data is also used to corroborate, when available,information received from approved pricing vendors and brokers. Various factors impact the frequency of monitoring this information (which mayoccur as often as daily). However, the Committee may determine that changes to inputs, assumptions and models are not required as a result of themonitoring procedures performed.
The following table is a summary of the inputs used to value the Fund’s investments at December 31, 2012:
Description
Level 1Quoted Prices in Active
Markets for IdenticalAssets ($)
Level 2Other Significant
Observable Inputs ($)
Level 3Significant
Unobservable Inputs ($) Total ($)
Equity Securities
Common Stocks
Consumer Discretionary 231,156,352 8,984,498 — 240,140,850
Consumer Staples 314,923,568 — — 314,923,568
Energy 371,081,327 — — 371,081,327
Financials 513,582,117 — — 513,582,117
Health Care 406,569,757 — — 406,569,757
Industrials 310,263,857 — — 310,263,857
Information Technology 228,118,165 — — 228,118,165
Materials 118,552,026 — — 118,552,026
Telecommunication Services 187,068,380 6,951,288 — 194,019,668
Utilities 190,769,039 12,486,755 — 203,255,794
Total Equity Securities 2,872,084,588 28,422,541 — 2,900,507,129
Bonds
Convertible Bonds — 5,839,189 — 5,839,189
Total Bonds — 5,839,189 — 5,839,189
Other
Equity-Linked Notes — 15,906,412 — 15,906,412
Money Market Funds 35,930,083 — — 35,930,083
Total Other 35,930,083 15,906,412 — 51,836,495
Total 2,908,014,671 50,168,142 — 2,958,182,813
See the Portfolio of Investments for all investment classifications not indicated in the table.
The Fund’s assets assigned to the Level 2 input category are generally valued using the market approach, in which a security’s value is determinedthrough reference to prices and information from market transactions for similar or identical assets. These assets include certain foreign securitiesfor which a third party statistical pricing service may be employed for purposes of fair market valuation. The models utilized by the third partystatistical pricing service take into account a security’s correlation to available market data including, but not limited to, intraday index, ADR, and ETFmovements.
There were no transfers of financial assets between Levels 1 and 2 during the period.
The accompanying Notes to Financial Statements are an integral part of this statement.
12 Annual Report 2012

Columbia Variable Portfolio – Dividend Opportunity Fund
Statement of Assets and LiabilitiesDecember 31, 2012
Assets
Investments, at value
Unaffiliated issuers (identified cost $2,646,378,750) $2,922,252,730
Affiliated issuers (identified cost $35,930,083) 35,930,083
Total investments (identified cost $2,682,308,833) 2,958,182,813
Receivable for:
Capital shares sold 148,248
Dividends 5,833,057
Interest 56,743
Reclaims 144,846
Prepaid expenses 12,447
Trustees’ deferred compensation plan 39,108
Total assets 2,964,417,262
Liabilities
Payable for:
Investments purchased 1,802,749
Capital shares purchased 3,323,610
Investment management fees 1,421,759
Distribution and/or service fees 124,204
Transfer agent fees 150,118
Administration fees 131,452
Compensation of board members 166,990
Other expenses 142,237
Trustees’ deferred compensation plan 39,108
Total liabilities 7,302,227
Net assets applicable to outstanding capital stock $2,957,115,035
Represented by
Partners’ capital $2,957,115,035
Total — representing net assets applicable to outstanding capital stock $2,957,115,035
The accompanying Notes to Financial Statements are an integral part of this statement.
Annual Report 2012 13

Columbia Variable Portfolio – Dividend Opportunity Fund
Statement of Assets and Liabilities (continued)
December 31, 2012
Class 1
Net assets $1,803,840,726
Shares outstanding 125,997,330
Net asset value per share $14.32
Class 2
Net assets $18,872,705
Shares outstanding 1,328,140
Net asset value per share $14.21
Class 3
Net assets $1,134,401,604
Shares outstanding 79,548,016
Net asset value per share $14.26
The accompanying Notes to Financial Statements are an integral part of this statement.
14 Annual Report 2012

Columbia Variable Portfolio – Dividend Opportunity Fund
Statement of OperationsYear Ended December 31, 2012
Net investment income
Income:
Dividends — unaffiliated issuers $108,740,162
Dividends — affiliated issuers 85,486
Interest 192,713
Income from securities lending — net 1,114,426
Foreign taxes withheld (1,652,460)
Total income 108,480,327
Expenses:
Investment management fees 17,216,129
Distribution and/or service fees
Class 2 43,041
Class 3 1,508,201
Transfer agent fees
Class 1 1,088,005
Class 2 10,330
Class 3 723,917
Administration fees 1,587,676
Compensation of board members 59,268
Custodian fees 23,809
Printing and postage fees 95,190
Professional fees 36,037
Other 142,054
Total expenses 22,533,657
Net investment income 85,946,670
Realized and unrealized gain (loss) — net
Net realized gain (loss) on:
Investments 378,415,327
Foreign currency translations (5,086)
Net realized gain 378,410,241
Net change in unrealized appreciation (depreciation) on:
Investments (66,685,629)
Foreign currency translations 1,795
Net change in unrealized appreciation (depreciation) (66,683,834)
Net realized and unrealized gain 311,726,407
Net increase in net assets resulting from operations $397,673,077
The accompanying Notes to Financial Statements are an integral part of this statement.
Annual Report 2012 15

Columbia Variable Portfolio – Dividend Opportunity Fund
Statement of Changes in Net Assets
Year EndedDecember 31, 2012
Year EndedDecember 31, 2011
Operations
Net investment income $85,946,670 $51,213,002
Net realized gain 378,410,241 204,439,145
Net change in unrealized appreciation (depreciation) (66,683,834) (412,526,615)
Net increase (decrease) in net assets resulting from operations 397,673,077 (156,874,468)
Increase (decrease) in net assets from capital stock activity (415,817,977) 3,168,911
Total decrease in net assets (18,144,900) (153,705,557)
Net assets at beginning of year 2,975,259,935 3,128,965,492
Net assets at end of year $2,957,115,035 $2,975,259,935
The accompanying Notes to Financial Statements are an integral part of this statement.
16 Annual Report 2012

Columbia Variable Portfolio – Dividend Opportunity Fund
Statement of Changes in Net Assets (continued)
Year Ended December 31, 2012 Year Ended December 31, 2011
Shares Dollars ($) Shares Dollars ($)
Capital stock activity
Class 1 shares
Subscriptions 3,786,956 52,203,219 17,256,979 220,285,452
Fund merger — — 6,125,550 88,211,428
Redemptions (16,273,548) (221,363,348) (2,823,265) (37,086,803)
Net increase (decrease) (12,486,592) (169,160,129) 20,559,264 271,410,077
Class 2 shares
Subscriptions 291,652 4,009,538 308,167 4,015,852
Fund merger — — 1,032,751 14,804,552
Redemptions (217,297) (2,958,122) (177,675) (2,294,173)
Net increase 74,355 1,051,416 1,163,243 16,526,231
Class 3 Shares
Subscriptions 18,303 254,141 181,510 2,239,870
Redemptions (18,134,719) (247,963,405) (21,961,167) (287,007,267)
Net increase (18,116,416) (247,709,264) (21,779,657) (284,767,397)
Total net decrease (30,528,653) (415,817,977) (57,150) 3,168,911
The accompanying Notes to Financial Statements are an integral part of this statement.
Annual Report 2012 17

Columbia Variable Portfolio – Dividend Opportunity Fund
Financial Highlights
The following tables are intended to help you understand the Fund’s financial performance. Certain information reflects financialresults for a single share of a class held for the periods shown. Per share net investment income (loss) amounts are calculatedbased on average shares outstanding during the period. Total return assumes reinvestment of all dividends and distributions. Totalreturn does not reflect payment of the expenses that apply to the variable accounts or contract charges, if any, and are notannualized for periods of less than one year.
Year Ended December 31,
Class 1 2012 2011 2010(a)
Per share dataNet asset value, beginning of period $12.55 $13.19 $12.05
Income from investment operations:
Net investment income 0.40 0.23 0.13
Net realized and unrealized gain (loss) 1.37 (0.87) 1.01
Total from investment operations 1.77 (0.64) 1.14
Net asset value, end of period $14.32 $12.55 $13.19
Total return 14.10% (4.85%) 9.46%
Ratios to average net assets(b)
Total gross expenses 0.69% 0.74% 0.78%(c)
Total net expenses(d) 0.69% 0.74% 0.78%(c)
Net investment income 2.89% 1.74% 1.68%(c)
Supplemental data
Net assets, end of period (in thousands) $1,803,841 $1,737,503 $1,554,975
Portfolio turnover 64% 41% 26%
Notes to Financial Highlights
(a)For the period from May 3, 2010 (commencement of operations) to December 31, 2010.
(b) In addition to the fees and expenses which the Fund bears directly, the Fund indirectly bears a pro rata share of the fees and expenses of theacquired funds in which it invests. Such indirect expenses are not included in the reported expense ratios.
(c) Annualized.
(d)Total net expenses include the impact of certain waivers/reimbursements made by the Investment Manager and certain of its affiliates, ifapplicable.
The accompanying Notes to Financial Statements are an integral part of this statement.
18 Annual Report 2012

Columbia Variable Portfolio – Dividend Opportunity Fund
Financial Highlights (continued)
Year Ended December 31,
Class 2 2012 2011 2010(a)
Per share dataNet asset value, beginning of period $12.48 $13.15 $12.05
Income from investment operations:
Net investment income 0.37 0.22 0.11
Net realized and unrealized gain (loss) 1.36 (0.89) 0.99
Total from investment operations 1.73 (0.67) 1.10
Net asset value, end of period $14.21 $12.48 $13.15
Total return 13.86% (5.09%) 9.13%
Ratios to average net assets(b)
Total gross expenses 0.94% 0.97% 1.03%(c)
Total net expenses(d) 0.94% 0.97% 1.03%(c)
Net investment income 2.69% 1.71% 1.37%(c)
Supplemental data
Net assets, end of period (in thousands) $18,873 $15,653 $1,191
Portfolio turnover 64% 41% 26%
Notes to Financial Highlights
(a)For the period from May 3, 2010 (commencement of operations) to December 31, 2010.
(b) In addition to the fees and expenses which the Fund bears directly, the Fund indirectly bears a pro rata share of the fees and expenses of theacquired funds in which it invests. Such indirect expenses are not included in the reported expense ratios.
(c) Annualized.
(d)Total net expenses include the impact of certain waivers/reimbursements made by the Investment Manager and certain of its affiliates, ifapplicable.
The accompanying Notes to Financial Statements are an integral part of this statement.
Annual Report 2012 19

Columbia Variable Portfolio – Dividend Opportunity Fund
Financial Highlights (continued)
Year Ended December 31,
Class 3 2012 2011 2010 2009 2008
Per share dataNet asset value, beginning of period $12.51 $13.17 $11.27 $8.84 $16.24
Income from investment operations:
Net investment income 0.38 0.20 0.17 0.20 0.23
Net realized and unrealized gain (loss) 1.37 (0.86) 1.73 2.23 (6.35)
Total from investment operations 1.75 (0.66) 1.90 2.43 (6.12)
Net investment income — — — — (0.01)
Net realized gains — — — — (1.27)
Total distributions to shareholders — — — — (1.28)
Net asset value, end of period $14.26 $12.51 $13.17 $11.27 $8.84
Total return 13.99% (5.01%) 16.83% 27.46% (40.47%)
Ratios to average net assets(a)
Total gross expenses 0.82% 0.86% 0.90% 0.76% 0.86%
Total net expenses(b) 0.82% 0.86% 0.90% 0.76% 0.86%
Net investment income 2.74% 1.57% 1.42% 2.14% 2.03%
Supplemental data
Net assets, end of period (in thousands) $1,134,402 $1,222,104 $1,572,800 $3,857,317 $2,765,112
Portfolio turnover 64% 41% 26% 49% 41%
Notes to Financial Highlights
(a) In addition to the fees and expenses which the Fund bears directly, the Fund indirectly bears a pro rata share of the fees and expenses of theacquired funds in which it invests. Such indirect expenses are not included in the reported expense ratios.
(b)Total net expenses include the impact of certain waivers/reimbursements made by the Investment Manager and certain of its affiliates, ifapplicable.
The accompanying Notes to Financial Statements are an integral part of this statement.
20 Annual Report 2012

Columbia Variable Portfolio – Dividend Opportunity Fund
Notes to Financial StatementsDecember 31, 2012
Note 1. OrganizationColumbia Variable Portfolio — Dividend Opportunity Fund(the Fund), formerly known as Columbia Variable Portfolio— Diversified Equity Income Fund, a series of ColumbiaFunds Variable Series Trust II (the Trust), is a diversifiedfund. The Trust is registered under the Investment CompanyAct of 1940, as amended (the 1940 Act), as an open-endmanagement investment company organized as aMassachusetts business trust.
Fund Shares
The Trust may issue an unlimited number of shares (withoutpar value). The Fund offers Class 1, Class 2 and Class 3 sharesto separate accounts funding variable annuity contracts andvariable life insurance policies (collectively, Contracts) issuedby affiliated and unaffiliated life insurance companies as wellas qualified pension and retirement plans (Qualified Plans) andother qualified institutional investors authorized by ColumbiaManagement Investment Distributors, Inc. (the Distributor).You may not buy (nor will you own) shares of the Funddirectly. You invest by participating in a Qualified Plan orbuying a Contract and making allocations to the Fund. Allshare classes have identical voting, dividend and liquidationrights. Each share class has its own expense structure.
Note 2. Summary of Significant AccountingPoliciesUse of Estimates
The preparation of financial statements in accordance withU.S. generally accepted accounting principles (GAAP)requires management to make certain estimates andassumptions that affect the reported amounts of assets andliabilities, the disclosure of contingent assets and liabilities atthe date of the financial statements and the reported amountsof revenue and expenses during the reporting period. Actualresults could differ from those estimates.
The following is a summary of significant accounting policiesconsistently followed by the Fund in the preparation of itsfinancial statements.
Security Valuation
All equity securities are valued at the close of business of theNew York Stock Exchange (NYSE). Equity securities arevalued at the last quoted sales price on the principal exchangeor market on which they trade, except for securities traded onthe NASDAQ Stock Market, which are valued at theNASDAQ official close price. Unlisted securities or listedsecurities for which there were no sales during the day arevalued at the mean of the latest quoted bid and ask prices onsuch exchanges or markets.
Debt securities generally are valued by pricing servicesapproved by the Board of Trustees (the Board) based uponmarket transactions for normal, institutional-size trading unitsof similar securities. The services may use various pricingtechniques which take into account appropriate factors such asyield, quality, coupon rate, maturity, type of issue, tradingcharacteristics and other data, as well as broker quotes. Debtsecurities for which quotations are readily available may alsobe valued based upon an over-the-counter or exchange bidquotation.
Foreign securities are valued based on quotations from theprincipal market in which such securities are normally traded.If any foreign share prices are not readily available as a resultof limited share activity the securities are valued at the meanof the latest quoted bid and ask prices on such exchanges ormarkets. Foreign currency exchange rates are generallydetermined at 4:00 p.m. Eastern (U.S.) time. However, manysecurities markets and exchanges outside the U.S. close priorto the close of the NYSE; therefore, the closing prices forsecurities in such markets or on such exchanges may not fullyreflect events that occur after such close but before the closeof the NYSE. In those situations, foreign securities will be fairvalued pursuant to the policy adopted by the Board, includingutilizing a third party pricing service to determine these fairvalues. The third party pricing service takes into accountmultiple factors, including, but not limited to, movements inthe U.S. securities markets, certain depositary receipts, futurescontracts and foreign exchange rates that have occurredsubsequent to the close of the foreign exchange or market, todetermine a good faith estimate that reasonably reflects thecurrent market conditions as of the close of the NYSE. Thefair value of a security is likely to be different from the quotedor published price, if available.
Investments in other open-end investment companies,including money market funds, are valued at net asset value.
Short-term securities purchased within 60 days to maturity arevalued at amortized cost, which approximates market value.The value of short-term securities originally purchased withmaturities greater than 60 days is determined based on anamortized value to par upon reaching 60 days to maturity.Short-term securities maturing in more than 60 days from thevaluation date are valued at the market price or approximatemarket value based on current interest rates.
Investments for which market quotations are not readilyavailable, or that have quotations which management believesare not reliable, are valued at fair value as determined ingood faith under consistently applied procedures establishedby and under the general supervision of the Board. If asecurity or class of securities (such as foreign securities) is
Annual Report 2012 21

Columbia Variable Portfolio – Dividend Opportunity Fund
Notes to Financial Statements (continued)
December 31, 2012
valued at fair value, such value is likely to be different fromthe last quoted market price for the security.
The determination of fair value often requires significantjudgment. To determine fair value, management may useassumptions including but not limited to future cash flows andestimated risk premiums. Multiple inputs from various sourcesmay be used to determine fair value.
Foreign Currency Transactions and Translations
The values of all assets and liabilities denominated in foreigncurrencies are translated into U.S. dollars at that day’sexchange rates. Net realized and unrealized gains (losses) onforeign currency transactions and translations include gains(losses) arising from the fluctuation in exchange rates betweentrade and settlement dates on securities transactions, gains(losses) arising from the disposition of foreign currency andcurrency gains (losses) between the accrual and payment dateson dividends, interest income and foreign withholding taxes.
For financial statement purposes, the Fund does notdistinguish that portion of gains (losses) on investments whichis due to changes in foreign exchange rates from that which isdue to changes in market prices of the investments. Suchfluctuations are included with the net realized and unrealizedgains (losses) on investments in the Statement of Operations.
Equity-Linked Notes
The Fund may invest in equity-linked notes (ELNs). An ELNis a debt instrument whose value is based on the value of asingle equity security, basket of equity securities or an indexof equity securities (each, an Underlying Equity). An ELNtypically provides interest income, thereby offering a yieldadvantage over investing directly in an Underlying Equity.However, the holder of an ELN may have limited or nobenefit from any appreciation in the Underlying Equity, but isexposed to various risks, including, without limitation,volatility, issuer and market risk. The Fund may purchaseELNs that trade on a securities exchange or those that trade onthe over-the-counter markets, including securities offered andsold under Rule 144A of the Securities Act of 1933, asamended. The Fund may also purchase an ELN in a privatelynegotiated transaction with the issuer of the ELN (or itsbroker-dealer affiliate).
Security Transactions
Security transactions are accounted for on the trade date. Costis determined and gains (losses) are based upon the specificidentification method for both financial statement and federalincome tax purposes.
Income Recognition
Corporate actions and dividend income are recorded net ofany non-reclaimable tax withholdings, on the ex-dividend dateor upon receipt of ex-dividend notification in the case ofcertain foreign securities.
Awards from class action litigation are recorded as a reductionof cost basis if the Fund still owns the applicable securities onthe payment date. If the Fund no longer owns the applicablesecurities, the proceeds are recorded as realized gains.
Interest income is recorded on an accrual basis. Marketpremiums and discounts, including original issue discounts, areamortized and accreted, respectively, over the expected life ofthe security on all debt securities, unless otherwise noted.
The Fund may receive distributions from holdings in businessdevelopment companies (BDCs), exchange traded funds(ETFs) and real estate investment trusts (REITs), which reportinformation on the character of their distributions annually.These distributions are allocated to dividend income, capitalgain and return of capital based on estimates made by theFund’s management if actual information has not yet beenreported. Return of capital is recorded as a reduction of thecost basis of securities held. If the Fund no longer owns theapplicable securities, return of capital is recorded as realizedgain. Management’s estimates are subsequently adjusted whenthe actual character of the distributions is disclosed by theBDCs, ETFs and REITs, which could result in a proportionatechange in return of capital to shareholders.
Expenses
General expenses of the Trust are allocated to the Fund andother funds of the Trust based upon relative net assets or otherexpense allocation methodologies determined by the nature ofthe expense. Expenses directly attributable to the Fund arecharged to the Fund. Expenses directly attributable to aspecific class of shares are charged to that share class.
Determination of Class Net Asset Value
All income, expenses (other than class-specific expenses,which are charged to that share class, as shown in theStatement of Operations) and realized and unrealized gains(losses) are allocated to each class of the Fund on a dailybasis, based on the relative net assets of each class, forpurposes of determining the net asset value of each class.
Federal Income Tax Status
The Fund is treated as a partnership for federal income taxpurposes, and the Fund does not expect to make regulardistributions. The Fund will not be subject to federal incometax, and therefore, there is no provision for federal income
22 Annual Report 2012

Columbia Variable Portfolio – Dividend Opportunity Fund
Notes to Financial Statements (continued)
December 31, 2012
taxes. The partners of the Fund are subject to tax on theirdistributive share of the Fund’s income and loss. Thecomponents of the Fund’s net assets are reported at thepartner-level for federal income tax purposes, and therefore,are not presented in the Statement of Assets and Liabilities.
Management of the Fund has concluded that there are nosignificant uncertain tax positions that would requirerecognition in the financial statements. However,management’s conclusion may be subject to review andadjustment at a later date based on factors including, but notlimited to, new tax laws, regulations, and administrativeinterpretations (including relevant court decisions). Generally,the Fund’s federal tax returns for the prior three fiscal yearsremain subject to examination by the Internal RevenueService.
Foreign Taxes
The Fund may be subject to foreign taxes on income, gains oninvestments or currency repatriation, a portion of which maybe recoverable. The Fund will accrue such taxes andrecoveries, as applicable, based upon its current interpretationof tax rules and regulations that exist in the markets in whichit invests.
Realized gains in certain countries may be subject to foreigntaxes at the Fund level, based on statutory rates. The Fundaccrues for such foreign taxes on net realized and unrealizedgains at the appropriate rate for each jurisdiction, asapplicable. The amount, if any, is disclosed as a liability onthe Statement of Assets and Liabilities.
Guarantees and Indemnifications
Under the Trust’s organizational documents and, in somecases, by contract, its officers and trustees are indemnifiedagainst certain liabilities arising out of the performance oftheir duties to the Trust or its funds. In addition, certain of theFund’s contracts with its service providers contain generalindemnification clauses. The Fund’s maximum exposureunder these arrangements is unknown since the amount of anyfuture claims that may be made against the Fund cannot bedetermined, and the Fund has no historical basis for predictingthe likelihood of any such claims.
Recent Accounting Pronouncement
Disclosures about Offsetting Assets and Liabilities
In December 2011, the Financial Accounting Standards Board(FASB) issued Accounting Standards Update (ASU)No. 2011-11, Disclosures about Offsetting Assets andLiabilities. The objective of the FASB is to enhance currentdisclosure requirements on offsetting of certain assets andliabilities and to enable financial statement users to compare
financial statements prepared under GAAP and InternationalFinancial Reporting Standards.
Specifically, ASU No. 2011-11 requires an entity to discloseboth gross and net information for derivatives and otherfinancial instruments that are subject to a master nettingarrangement or similar agreement. The standard requiresdisclosure of collateral received in connection with the masternetting agreements or similar agreements. The effective dateof ASU No. 2011-11 is for interim and annual periodsbeginning on or after January 1, 2013. At this time,management is evaluating the implications of this guidanceand the impact it will have on the financial statement amountsand footnote disclosures, if any.
Note 3. Fees and Compensation Paid toAffiliatesInvestment Management Fees
Under an Investment Management Services Agreement,Columbia Management Investment Advisers, LLC (theInvestment Manager), a wholly-owned subsidiary ofAmeriprise Financial, Inc. (Ameriprise Financial), determineswhich securities will be purchased, held or sold. Theinvestment management fee is an annual fee that is equal to apercentage of the Fund’s average daily net assets that declinesfrom 0.66% to 0.49% as the Fund’s net assets increase. Theeffective investment management fee rate for the year endedDecember 31, 2012 was 0.57% of the Fund’s average daily netassets.
Administration Fees
Under an Administrative Services Agreement, the InvestmentManager also serves as the Fund Administrator. The Fundpays the Fund Administrator an annual fee for administrationand accounting services equal to a percentage of the Fund’saverage daily net assets that declines from 0.06% to 0.03% asthe Fund’s net assets increase. The effective administration feerate for the year ended December 31, 2012 was 0.05% of theFund’s average daily net assets.
Other Expenses
Other expenses are for, among other things, certain expensesof the Fund or the Board, including: Fund boardroom andoffice expense, employee compensation, employee health andretirement benefits, and certain other expenses. Payment ofthese Fund and Board expenses is facilitated by a companyproviding limited administrative services to the Fund and theBoard. For the year ended December 31, 2012, other expensespaid to this company were $10,487.
Annual Report 2012 23

Columbia Variable Portfolio – Dividend Opportunity Fund
Notes to Financial Statements (continued)
December 31, 2012
Compensation of Board Members
Board members are compensated for their services to the Fundas disclosed in the Statement of Operations. Under a DeferredCompensation Plan (the Plan), the Board members who arenot “interested persons” of the Fund, as defined under the1940 Act, may elect to defer payment of up to 100% of theircompensation. Deferred amounts are treated as thoughequivalent dollar amounts had been invested in shares ofcertain funds managed by the Investment Manager. TheFund’s liability for these amounts is adjusted for market valuechanges and remains in the Fund until distributed inaccordance with the Plan.
Transfer Agent Fees
The Fund has a Transfer Agency and Dividend DisbursingAgent Agreement with Columbia Management InvestmentServices Corp. (the Transfer Agent), an affiliate of theInvestment Manager and a wholly-owned subsidiary ofAmeriprise Financial. The annual fee rate under thisagreement is 0.06% of the Fund’s average daily net assets.The Transfer Agent also receives compensation from fees forvarious shareholder services and reimbursements for certainout-of-pocket fees.
Distribution Fees
The Fund has an agreement with Columbia ManagementInvestment Distributors, Inc. (the Distributor), an affiliate ofthe Investment Manager and a wholly-owned subsidiary ofAmeriprise Financial, for distribution services. Under a Planand Agreement of Distribution pursuant to Rule 12b-1, theFund pays a fee at an annual rate of up to 0.25% of the Fund’saverage daily net assets attributable to Class 2 shares and anannual rate of up to 0.125% of the Fund’s average daily netassets attributable to Class 3 shares. The Fund pays nodistribution and service fees for Class 1 shares.
Expenses Waived/Reimbursed by the InvestmentManager and its Affiliates
Effective May 1, 2012, the Investment Manager and certain ofits affiliates have contractually agreed to waive fees and/orreimburse expenses (excluding certain fees and expensesdescribed below), through April 30, 2013, unless soonerterminated at the sole discretion of the Board, so that theFund’s net operating expenses, after giving effect to feeswaived/expenses reimbursed and any balance credits and/oroverdraft charges from the Fund’s custodian, do not exceedthe following annual rates as a percentage of the class’average daily net assets:
Class 1 0.76%
Class 2 1.01
Class 3 0.885
Under the agreement governing these fee waivers and/orexpense reimbursement arrangements, the following fees andexpenses are excluded from the waiver/reimbursementcommitment, and therefore will be paid by the Fund, ifapplicable: taxes (including foreign transaction taxes),expenses associated with investments in affiliated andnon-affiliated pooled investment vehicles (including mutualfunds and exchange traded funds), transaction costs andbrokerage commissions, costs related to any securities lendingprogram, dividend expenses associated with securities soldshort, inverse floater program fees and expenses, transactioncharges and interest on borrowed money, interest,extraordinary expenses and any other expenses the exclusionof which is specifically approved by the Board. Thisagreement may be modified or amended only with approvalfrom all parties.
Prior to May 1, 2012, there was no contractual agreement towaive fees and/or reimburse expenses.
Note 4. Portfolio InformationThe cost of purchases and proceeds from sales of securities,excluding short-term obligations, aggregated to$1,900,878,613 and $2,184,192,936, respectively, for the yearended December 31, 2012.
Note 5. Lending of Portfolio SecuritiesEffective December 31, 2012, the Fund no longer participatesin securities lending activity. Prior to that date, the Fund hadentered into a Master Securities Lending Agreement (theAgreement) with JPMorgan Chase Bank, N.A. (JPMorgan).The Agreement authorized JPMorgan as lending agent to lendsecurities to authorized borrowers in order to generateadditional income on behalf of the Fund. Pursuant to theAgreement, the securities loaned were secured by cash orsecurities that either were issued or guaranteed as to principaland interest by the U.S. government, its agencies, authoritiesor instrumentalities with value equal to at least 100% of themarket value of the loaned securities. Any additional collateralrequired to maintain those levels due to market fluctuations ofthe loaned securities was requested to be delivered thefollowing business day. Cash collateral received was investedby the lending agent on behalf of the Fund into authorizedinvestments pursuant to the Agreement.
Pursuant to the Agreement, the Fund received income forlending its securities either in the form of fees or by earninginterest on invested cash collateral, net of negotiated rebatespaid to borrowers and fees paid to the lending agent forservices provided and any other securities lending expenses.Net income earned from securities lending for the year endedDecember 31, 2012 is disclosed in the Statement of
24 Annual Report 2012
Columbia Variable Portfolio – Dividend Opportunity Fund
Notes to Financial Statements (continued)
December 31, 2012
Operations. The Fund continued to earn and accrue interestand dividends on the securities loaned. At December 31, 2012,the Fund did not have any securities on loan.
Note 6. Affiliated Money Market FundThe Fund invests its daily cash balances in Columbia Short-Term Cash Fund, an affiliated money market fund establishedfor the exclusive use by the Fund and other affiliated funds. Theincome earned by the Fund from such investments is includedas “Dividends — affiliated issuers” in the Statement ofOperations. As an investing fund, the Fund indirectly bears itsproportionate share of the expenses of Columbia Short-TermCash Fund.
Note 7. Shareholder ConcentrationAt December 31, 2012, affiliated shareholder accounts owned97.5% of the outstanding shares of the Fund. Subscription andredemption activity by concentrated accounts may have asignificant effect on the operations of the Fund.
Note 8. Line of CreditThe Fund has entered into a revolving credit facility with asyndicate of banks led by JPMorgan whereby the Fund mayborrow for the temporary funding of shareholder redemptionsor for other temporary or emergency purposes. The creditfacility agreement, as amended, which is a collectiveagreement between the Fund and certain other funds managedby the Investment Manager, severally and not jointly, permitscollective borrowings up to $500 million. Interest is chargedto each participating fund based on its borrowings at a rateequal to the higher of (i) the overnight federal funds rate plus1.00% or (ii) the one-month LIBOR rate plus 1.00%. Eachborrowing under the credit facility matures no later than60 days after the date of borrowing. The Fund also pays acommitment fee equal to its pro rata share of the amount ofthe credit facility at a rate of 0.08% per annum.
The Fund had no borrowings during the year endedDecember 31, 2012.
Note 9. Fund MergerAt the close of business on April 29, 2011, the Fund acquiredthe assets and assumed the identified liabilities of ColumbiaLarge Cap Value Fund, Variable Series (the acquired fund), aseries of Columbia Funds Variable Insurance Trust. Thereorganization was completed after shareholders of theacquired fund approved a plan of reorganization onFebruary 15, 2011. The purpose of the transaction was tocombine two funds managed by the Investment Manager withcomparable investment objectives and strategies.
The aggregate net assets of the Fund immediately before theacquisition were $3,334,199,867 and the combined net assetsimmediately after the acquisition were $3,437,215,847.
The merger was accomplished by a tax-free exchange of7,555,251 shares of the acquired fund valued at $103,015,980(including $24,411,317 of unrealized appreciation).
In exchange for the acquired fund’s shares, the Fund issuedthe following number of shares:
Shares
Class 1 6,125,550
Class 2 1,032,751
For financial reporting purposes, net assets received andshares issued by the Fund were recorded at fair value;however, the acquired fund’s cost of investments was carriedforward. The financial statements reflect the operations of theFund for the period prior to the merger and the combinedFund for the period subsequent to the merger. Because thecombined investment portfolios have been managed as asingle integrated portfolio since the merger was completed, itis not practicable to separate the amounts of revenue andearnings of the acquired fund that have been included in thecombined Fund’s Statement of Operations since the mergerwas completed.
Assuming the merger had been completed on January 1, 2011,the Fund’s pro-forma net investment income, net gain oninvestments, net change in unrealized depreciation and netdecrease in net assets from operations for the year endedDecember 31, 2011, would have been approximately $52.9million, $209.8 million, $(411.6) million and $(148.9) million,respectively.
Note 10. Subsequent EventsManagement has evaluated the events and transactions thathave occurred through the date the financial statements wereissued and noted no items requiring adjustment of thefinancial statements or additional disclosure.
Note 11. Information Regarding Pendingand Settled Legal ProceedingsIn December 2005, without admitting or denying theallegations, American Express Financial Corporation (AEFC,which is now known as Ameriprise Financial, Inc.(Ameriprise Financial)) entered into settlement agreementswith the Securities and Exchange Commission (SEC) andMinnesota Department of Commerce (MDOC) related tomarket timing activities. As a result, AEFC was censured andordered to cease and desist from committing or causing any
Annual Report 2012 25

Columbia Variable Portfolio – Dividend Opportunity Fund
Notes to Financial Statements (continued)
December 31, 2012
violations of certain provisions of the Investment AdvisersAct of 1940, the Investment Company Act of 1940, andvarious Minnesota laws. AEFC agreed to pay disgorgement of$10 million and civil money penalties of $7 million. AEFCalso agreed to retain an independent distribution consultant toassist in developing a plan for distribution of all disgorgementand civil penalties ordered by the SEC in accordance withvarious undertakings detailed at www.sec.gov/litigation/admin/ia-2451.pdf. Ameriprise Financial and its affiliateshave cooperated with the SEC and the MDOC in these legalproceedings, and have made regular reports to the funds’Boards of Trustees.
Ameriprise Financial and certain of its affiliates havehistorically been involved in a number of legal, arbitration andregulatory proceedings, including routine litigation, classactions, and governmental actions, concerning matters arisingin connection with the conduct of their business activities.Ameriprise Financial believes that the Funds are not currentlythe subject of, and that neither Ameriprise Financial nor anyof its affiliates are the subject of, any pending legal,arbitration or regulatory proceedings that are likely to have amaterial adverse effect on the Funds or the ability ofAmeriprise Financial or its affiliates to perform under theircontracts with the Funds. Ameriprise Financial is required tomake 10-Q, 10-K and, as necessary, 8-K filings with theSecurities and Exchange Commission on legal and regulatorymatters that relate to Ameriprise Financial and its affiliates.Copies of these filings may be obtained by accessing the SECwebsite at www.sec.gov.
There can be no assurance that these matters, or the adversepublicity associated with them, will not result in increasedfund redemptions, reduced sale of fund shares or otheradverse consequences to the Funds. Further, although webelieve proceedings are not likely to have a material adverseeffect on the Funds or the ability of Ameriprise Financial or itsaffiliates to perform under their contracts with the Funds,these proceedings are subject to uncertainties and, as such, weare unable to estimate the possible loss or range of loss thatmay result. An adverse outcome in one or more of theseproceedings could result in adverse judgments, settlements,fines, penalties or other relief that could have a materialadverse effect on the consolidated financial condition orresults of operations of Ameriprise Financial.
26 Annual Report 2012

Columbia Variable Portfolio – Dividend Opportunity Fund
Report of Independent Registered Public Accounting Firm
To the Trustees of Columbia Funds Variable Series Trust II and the Shareholders ofColumbia Variable Portfolio — Dividend Opportunity Fund(formerly Columbia Variable Portfolio — Diversified Equity Income Fund)
In our opinion, the accompanying statement of assets and liabilities, including the portfolio of investments, and the relatedstatements of operations and of changes in net assets and the financial highlights present fairly, in all material respects, thefinancial position of Columbia Variable Portfolio — Dividend Opportunity Fund (formerly Columbia Variable Portfolio —Diversified Equity Income Fund) (the “Fund”) (a series of Columbia Funds Variable Series Trust II) at December 31, 2012, theresults of its operations, the changes in its net assets and the financial highlights for the year then ended, in conformity withaccounting principles generally accepted in the United States of America. These financial statements and financial highlights(hereafter referred to as “financial statements”) are the responsibility of the Fund’s management. Our responsibility is to expressan opinion on these financial statements based on our audit. We conducted our audit of these financial statements in accordancewith the standards of the Public Company Accounting Oversight Board (United States). Those standards require that we plan andperform the audit to obtain reasonable assurance about whether the financial statements are free of material misstatement. Anaudit includes examining, on a test basis, evidence supporting the amounts and disclosures in the financial statements, assessingthe accounting principles used and significant estimates made by management, and evaluating the overall financial statementpresentation. We believe that our audit, which included confirmation of securities at December 31, 2012 by correspondence withthe custodian, transfer agent and brokers, provides a reasonable basis for our opinion. The statement of changes in net assets andthe financial highlights of the Fund for the periods ended December 31, 2011 and prior were audited by another independentregistered public accounting firm whose report dated February 17, 2012 expressed an unqualified opinion on those statements andhighlights.
PricewaterhouseCoopers LLPMinneapolis, MinnesotaFebruary 19, 2013
Annual Report 2012 27

Columbia Variable Portfolio – Dividend Opportunity Fund
Trustees and Officers
Shareholders elect the Board that oversees the funds’ operations. The Board appoints officers who are responsible for day-to-daybusiness decisions based on policies set by the Board. The following table provides basic biographical information about thefunds’ Board members, including their principal occupations during the past five years, although specific titles for individualsmay have varied over the period. Under current Board policy, members may serve until the next Board meeting after he or shereaches the mandatory retirement age established by the Board, or the fifteenth anniversary of the first Board meeting theyattended as a member of the Board.
Mr. Edward J. Boudreau, Jr., Mr. William P. Carmichael, Mr. William A. Hawkins, Mr. R. Glenn Hilliard, Ms. Minor M. Shawand Dr. Anthony M. Santomero, were members of the Legacy Columbia Nations funds’ Board (“Nations Funds”), which includesColumbia Funds Series Trust, Columbia Funds Variable Insurance Trust I and Columbia Funds Master Investment Trust, LLCand began service on the Board for the Legacy RiverSource funds (“RiverSource Funds”) effective June 1, 2011.
Independent Trustees
Name,Address,Year of Birth
Position HeldWith Funds andLength of Service Principal Occupation During Past Five Years
Number ofFunds in theFund FamilyOverseen byBoard Member
Other Present orPast Directorships/Trusteeships(Within Past 5 Years)
Kathleen Blatz901 S. Marquette Ave.Minneapolis, MN 554021954
Board membersince 1/06 forRiverSource Fundsand since 6/11 forNations Funds
Attorney; Chief Justice, Minnesota SupremeCourt, 1998-2006
152 None
Edward J. Boudreau, Jr.225 Franklin StreetBoston, MA 021101944
Board membersince 6/11 forRiverSource Fundsand since 1/05 forNations Funds
Managing Director, E.J. Boudreau & Associates(consulting) since 2000
145 Former Trustee, BofAFunds Series Trust(11 funds)
Pamela G. Carlton901 S. Marquette Ave.Minneapolis, MN 554021954
Board membersince 7/07 forRiverSource Fundsand since 6/11 forNations Funds
President, Springboard — Partners in CrossCultural Leadership (consulting company)
152 None
William P. Carmichael225 Franklin StreetBoston, MA 021101943
Board membersince 6/11 forRiverSource Fundsand since 1999 forNations Funds
Retired 145 Director, CobraElectronicsCorporation (electronicequipmentmanufacturer); TheFinish Line (athleticshoes and apparel)since July 2003;McMoRan ExplorationCompany (oil and gasexploration anddevelopment) since2010; former Trustee,BofA Funds SeriesTrust (11 funds);former Director,Spectrum Brands, Inc.(consumer products);former Director,Simmons Company(bedding)
Patricia M. Flynn901 S. Marquette Ave.Minneapolis, MN 554021950
Board membersince 11/04 forRiverSource Fundsand since 6/11 forNations Funds
Trustee Professor of Economics andManagement, Bentley University; former Dean,McCallum Graduate School of Business, BentleyUniversity
152 None
28 Annual Report 2012

Columbia Variable Portfolio – Dividend Opportunity Fund
Trustees and Officers (continued)
Independent Trustees (continued)
Name,Address,Year of Birth
Position HeldWith Funds andLength of Service Principal Occupation During Past Five Years
Number ofFunds in theFund FamilyOverseen byBoard Member
Other Present orPast Directorships/Trusteeships(Within Past 5 Years)
William A. Hawkins225 Franklin StreetBoston, MA 021101942
Board membersince 6/11 forRiverSource Fundsand since 1/05 forNations Funds
Managing Director, Overton Partners (financialconsulting), since August 2010; President andChief Executive Officer, California General Bank,N.A., January 2008-August 2010
145 Trustee, BofA FundsSeries Trust(11 funds)
R. Glenn Hilliard225 Franklin StreetBoston, MA 021101943
Board membersince 6/11 forRiverSource Fundsand since 1/05 forNations Funds
Chairman and Chief Executive Officer, HilliardGroup LLC (investing and consulting), since April2003; Non-Executive Director & Chairman, CNOFinancial Group, Inc. (insurance), September2003-May 2011
145 Chairman, BofA FundSeries Trust(11 funds); formerDirector, CNOFinancial Group, Inc.(insurance)
Stephen R. Lewis, Jr.901 S. Marquette Ave.Minneapolis, MN 554021939
Chair of the Boardfor RiverSourceFunds since 1/07,Board member forRiverSource Fundssince 1/02 andsince 6/11 forNations Funds
President Emeritus and Professor of EconomicsEmeritus, Carleton College
152 Director, ValmontIndustries, Inc.(manufacturesirrigation systems)since 2002
Catherine James Paglia901 S. Marquette Ave.Minneapolis, MN 554021952
Board membersince 11/04 forRiverSource Fundsand since 6/11 forNations Funds
Director, Enterprise Asset Management, Inc.(private real estate and asset managementcompany)
152 None
Leroy C. Richie901 S. Marquette Ave.Minneapolis, MN 554021941
Board member since2000 for LegacySeligman Funds,since 11/08 forRiverSource Fundsand since 6/11 forNations Funds
Counsel, Lewis & Munday, P.C. since 2004;former Vice President and General Counsel,Automotive Legal Affairs, Chrysler Corporation
152 Lead Outside Director,Digital Ally, Inc. (digitalimaging) sinceSeptember 2005;Infinity, Inc. (oil andgas exploration andproduction); OGEEnergy Corp. (energyand energy services)since November 2007
Minor M. Shaw225 Franklin StreetBoston, MA 021101947
Board membersince 6/11 forRiverSource Fundsand since 2003 forNations Funds
President, Micco LLC (private investments) 145 Director, PiedmontNatural Gas; Director,BlueCross BlueShieldof South Carolinasince April 2008;Former Trustee, BofAFunds Series Trust (11funds)
Alison Taunton-Rigby901 S. Marquette Ave.Minneapolis, MN 554021944
Board membersince 11/02 forRiverSource Fundsand since 6/11 forNations Funds
Chief Executive Officer and Director, RiboNovix,Inc., 2003-2010 (biotechnology); formerPresident, Aquila Biopharmaceuticals
152 Director, Healthways,Inc. (healthmanagementprograms) since 2005;Director, ICI MutualInsurance Company,RRG; Director, AbtAssociates(governmentcontractor)
Annual Report 2012 29

Columbia Variable Portfolio – Dividend Opportunity Fund
Trustees and Officers (continued)
Interested Trustee Not Affiliated with Investment Manager*
Name,Address,Year of Birth
Position HeldWith Funds andLength of Service Principal Occupation During Past Five Years
Number ofFunds in theFund FamilyOverseen byBoard Member
Other Present orPast Directorships/Trusteeships(Within Past 5 Years)
Anthony M. Santomero225 Franklin StreetBoston, MA 021101946
Board membersince 6/11 forRiverSource Fundsand since 1/08 forNations Funds
Richard K. Mellon Professor Emeritus of Finance,The Wharton School, University of Pennsylvania,since 2002; Senior Advisor, McKinsey &Company (consulting), 2006-2008
145 Director, RenaissanceReinsurance Ltd. sinceMay 2008; Trustee,Penn Mutual LifeInsurance Company;Director, Citigroupsince 2009; Director,Citibank, N.A. since2009; former Trustee,BofA Funds SeriesTrust (11 funds)
* Dr. Santomero is not an affiliated person of the investment manager or Ameriprise Financial. However, he is currently deemed by the funds to bean “interested person” (as defined in the 1940 Act) of the funds because he serves as a Director of Citigroup, Inc. and Citibank N.A., companiesthat may directly or through subsidiaries and affiliates engage from time-to-time in brokerage execution, principal transactions and lendingrelationships with the funds or accounts advised/managed by the investment manager.
Interested Trustee Affiliated with Investment Manager*
Name,Address,Year of Birth
Position HeldWith Funds andLength of Service Principal Occupation During Past Five Years
Number ofFunds in theFund FamilyOverseen byBoard Member
Other Present orPast Directorships/Trusteeships(Within Past 5 Years)
William F. Truscott53600 AmeripriseFinancial CenterMinneapolis, MN 554741960
Board membersince 11/01 forRiverSource Fundsand since 6/11 forNations Funds;Senior VicePresident since2002
President, Columbia Management InvestmentAdvisers, LLC February 2012, (previouslyPresident, Chairman of the Board and ChiefInvestment Officer, 2001-April 2010); ChiefExecutive Officer, Global Asset Management,Ameriprise Financial, Inc. since September 2012(previously Chief Executive Officer, U.S. AssetManagement & President, Annuities, May 2010-September 2012 and President — U.S. AssetManagement and Chief Investment Officer, 2005-April 2010); President and Chief ExecutiveOfficer, Ameriprise Certificate Company 2006-August 2012; Chief Executive Officer, ColumbiaManagement Investment Distributors, Inc. sinceFebruary 2012, (previously Chairman of the Boardand Chief Executive Officer, 2006-April 2010);Chairman of the Board and Chief ExecutiveOfficer, RiverSource Distributors, Inc. since 2006
204 Chairman of theBoard, ColumbiaManagementInvestment Advisers,LLC since May 2012;Director, ColumbiaManagementInvestmentDistributors, Inc. sinceMay 2010; Director,Ameriprise CertificateCompany, 2006-January 2013
* Interested person (as defined under the 1940 Act) by reason of being an officer, director, security holder and/or employee of the investmentmanager or Ameriprise Financial.
The SAI has additional information about the Fund’s Board members and is available, without charge, upon request by calling800.345.6611 or contacting your financial intermediary.
30 Annual Report 2012

Columbia Variable Portfolio – Dividend Opportunity Fund
Trustees and Officers (continued)
The Board has appointed officers who are responsible for day-to-day business decisions based on policies it has established. Theofficers serve at the pleasure of the Board. In addition to Mr. Truscott, who is Senior Vice President, the funds’ other officers are:
Officers
Name,Address,Year of Birth
Position HeldWith Funds andLength of Service Principal Occupation During Past Five Years
J. Kevin Connaughton225 Franklin StreetBoston, MA 021101964
President andPrincipal ExecutiveOfficer since 5/10for RiverSourceFunds and 2009for Nations Funds
Senior Vice President and General Manager — Mutual Fund Products, ColumbiaManagement Investment Advisers, LLC since May 2010; Managing Director of ColumbiaManagement Advisors, LLC, December 2004-April 2010; Senior Vice President and ChiefFinancial Officer, Columbia Funds, June 2008-January 2009; Treasurer, Columbia Funds,October 2003-May 2008
Amy K. Johnson5228 AmeripriseFinancial CenterMinneapolis, MN 554741965
Vice Presidentsince 12/06 forRiverSource Fundsand 5/10 forNations Funds
Senior Vice President and Chief Operating Officer, Columbia Management InvestmentAdvisers, LLC since May 2010 (previously Chief Administrative Officer, 2009-April 2010and Vice President — Asset Management and Trust Company Services, 2006-2009)
Michael G. Clarke225 Franklin StreetBoston, MA 021101969
Treasurer since1/11 and ChiefFinancial Officersince 4/11RiverSource Fundsand Treasurersince 3/11 andChief FinancialOfficer since 2009for Nations Funds
Vice President, Columbia Management Investment Advisers, LLC since May 2010;Managing Director of Fund Administration, Columbia Management Advisors, LLC,September 2004-April 2010; senior officer of Columbia Funds and affiliated funds since2002
Scott R. Plummer5228 AmeripriseFinancial CenterMinneapolis, MN 554741959
Senior VicePresident andChief Legal Officersince 12/06 andAssistant Secretarysince 6/11 forRiverSource Fundsand Senior VicePresident andChief Legal Officersince 5/10 andAssistant Secretarysince 6/11 forNations Funds
Senior Vice President, Chief Legal Officer and Assistant Secretary, Columbia ManagementInvestment Advisers, LLC since June 2005; Vice President and Lead Chief Counsel —Asset Management, Ameriprise Financial, Inc. since May 2010 (previously Vice Presidentand Chief Counsel — Asset Management, 2005-April 2010); Vice President, ChiefCounsel and Assistant Secretary, Columbia Management Investment Distributors, Inc.since 2008; Vice President, General Counsel and Secretary, Ameriprise CertificateCompany since 2005; Chief Counsel, RiverSource Distributors, Inc. since 2006
Colin Moore225 Franklin StreetBoston, MA 021101958
Senior VicePresident since5/10 forRiverSource Fundsand Nations Funds
Director and Chief Investment Officer, Columbia Management Investment Advisers, LLCsince May 2010; Manager, Managing Director and Chief Investment Officer, ColumbiaManagement Advisors, LLC, 2007- April 2010
Thomas P. McGuire225 Franklin StreetBoston, MA 021101972
Chief ComplianceOfficersince 3/12
Vice President-Asset Management Compliance, Columbia Management InvestmentAdvisers, LLC since 2010; Chief Compliance Officer, Ameriprise Certificate Companysince September 2010; Compliance Executive, Bank of America, 2005-2010
Stephen T. Welsh225 Franklin StreetBoston, MA 021101957
Vice Presidentsince 4/11 forRiverSource Fundsand 2006 forNations Funds
President and Director, Columbia Management Investment Services Corp. since May2010; President and Director, Columbia Management Services, Inc., July 2004-April2010; Managing Director, Columbia Management Distributors, Inc., August 2007-April2010
Christopher O. Petersen5228 Ameriprise FinancialCenterMinneapolis, MN 554741970
Vice President andSecretary since4/11 forRiverSource Fundsand 3/11 forNations Funds
Vice President and Chief Counsel, Ameriprise Financial since January 2010 (formerly VicePresident and Group Counsel or Counsel, April 2004-January 2010); Assistant Secretaryof Legacy RiverSource Funds, January 2007-April 2011 and of the Nations Funds, May2010-March 2011
Annual Report 2012 31

Columbia Variable Portfolio – Dividend Opportunity Fund
Trustees and Officers (continued)
Officers (continued)
Name,Address,Year of Birth
Position HeldWith Funds andLength of Service Principal Occupation During Past Five Years
Paul D. Pearson10468 Ameriprise FinancialCenterMinneapolis, MN 554741956
Vice Presidentsince 4/11 andAssistant Treasurersince 1999 forRiverSource Fundsand Vice Presidentand AssistantTreasurer since6/11 for NationsFunds
Vice President — Investment Accounting, Columbia Management Investment Advisers,LLC, since May 2010; Vice President — Managed Assets, Investment Accounting,Ameriprise Financial Corporation, February 1998-May 2010
Joseph F. DiMaria225 Franklin StreetBoston, MA 021101968
Vice President andChief AccountingOfficer since 4/11and Vice Presidentsince 3/11 andChief AccountingOfficer since 2008for Nations Funds
Vice President, Mutual Fund Administration, Columbia Management Investment Advisers,LLC, since May 2010; Director of Fund Administration, Columbia Management Advisors,LLC, January 2006-April 2010
Paul B. Goucher100 Park AvenueNew York, NY 100171968
Vice Presidentsince 4/11 andAssistant Secretarysince 11/08 forRiverSource Fundsand 5/10 forNations Funds
Vice President and Lead Chief Counsel, Ameriprise Financial, Inc. since November 2008and January 2013, respectively (formerly, Chief Counsel from January 2010-January 2013and Group Counsel from November 2008-January 2010); Director, Managing Director andGeneral Counsel, J. & W. Seligman & Co. Incorporated, July 2008-November 2008(previously, Managing Director and Associate General Counsel, January 2005-July 2008)
Michael E. DeFao225 Franklin StreetBoston, MA 021101968
Vice Presidentsince 4/11 andAssistant Secretarysince 5/10 forRiverSource Fundsand 2011 forNations Funds
Vice President and Chief Counsel, Ameriprise Financial since May 2010; AssociateGeneral Counsel Bank of America, June 2005-April 2010
32 Annual Report 2012

Columbia Variable Portfolio – Dividend Opportunity Fund
Important Information About This Report
The policy of the Board is to vote the proxies of the companies in which each fund holds investments consistent with theprocedures as stated in the Statement of Additional Information (SAI). You may obtain a copy of the SAI without charge bycalling 800.345.6611; contacting your financial intermediary; or searching the website of the Securities and ExchangeCommission (SEC) at sec.gov. Information regarding how each fund voted proxies relating to portfolio securities is filed with theSEC by August 31 for the most recent 12-month period ending June 30 of that year, and is available without charge by visitingcolumbiamanagement.com; or searching the website of the SEC at sec.gov.
Each fund files a complete schedule of portfolio holdings with the SEC for the first and third quarters of each fiscal year onForm N-Q. Each fund’s Form N-Q is available on the SEC’s website at sec.gov and may be reviewed and copied at the SEC’sPublic Reference Room in Washington, D.C. Information on the operation of the Public Reference Room may be obtained bycalling 800.SEC.0330. Each fund’s complete schedule of portfolio holdings, as filed on Form N-Q, can also be obtained withoutcharge, upon request, by calling 800.345.6611.
Annual Report 2012 33

Columbia Variable Portfolio – Dividend Opportunity FundP.O. Box 8081Boston, MA 02266-8081
This information is for use with concurrent or prior delivery of a fund prospectus. Please carefully consider theinvestment objectives, risks, charges and expenses of any variable fund and its related variable contract beforeinvesting. For variable fund and variable contract prospectuses, which contain this and other important information,contact your financial advisor or insurance representative. Please read the prospectus carefully before you invest. TheFund is distributed by Columbia Management Investment Distributors, Inc., member FINRA, and managed byColumbia Management Investment Advisers, LLC.© 2013 Columbia Management Investment Advisers, LLC. All rights reserved.
S-6468 C (3/13)

Annual Report
December 31, 2012
Columbia Variable Portfolio — Asset Allocation Fund
Not FDIC insured • No bank guarantee • May lose value
Please remember that you may not buy (nor will you own) shares of the Fund directly. You invest by buying a variable annuitycontract or life insurance policy and allocating your purchase payments to the variable subaccount or variable account (thesubaccounts) that invests in the Fund. Please contact your financial advisor or insurance representative for more information.


Table of Contents
Performance Overview.............................................................2
Manager Discussion of Fund Performance ................................4
Understanding Your Fund’s Expenses .......................................6
Portfolio of Investments ..........................................................7
Statement of Assets and Liabilities........................................13
Statement of Operations .......................................................15
Statement of Changes in Net Assets......................................16
Financial Highlights...............................................................18
Notes to Financial Statements...............................................20
Report of Independent RegisteredPublic Accounting Firm ..........................................................25
Federal Income Tax Information..............................................26
Trustees and Officers ............................................................27
Important Information About This Report ................................33
Annual Report 2012
Columbia Variable Portfolio — Asset Allocation Fund
The views expressed in this report reflect
the current views of the respective parties.
These views are not guarantees of future
performance and involve certain risks,
uncertainties and assumptions that are
difficult to predict, so actual outcomes and
results may differ significantly from the
views expressed. These views are subject to
change at any time based upon economic,
market or other conditions and the
respective parties disclaim any
responsibility to update such views. These
views may not be relied on as investment
advice and, because investment decisions
for a Columbia Fund are based on numerous
factors, may not be relied on as an
indication of trading intent on behalf of any
particular Columbia Fund. References to
specific securities should not be construed
as a recommendation or investment advice.
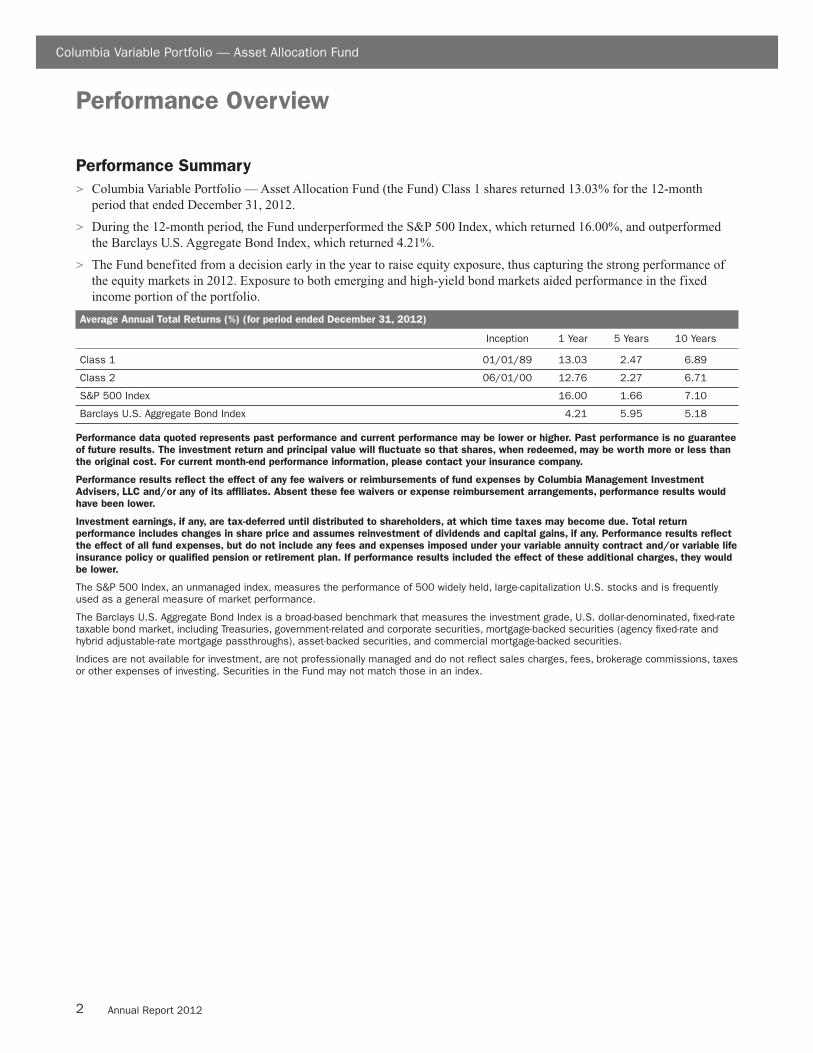
2 Annual Report 2012
Performance Overview
Performance Summary
> Columbia Variable Portfolio — Asset Allocation Fund (the Fund) Class 1 shares returned 13.03% for the 12-monthperiod that ended December 31, 2012.
> During the 12-month period, the Fund underperformed the S&P 500 Index, which returned 16.00%, and outperformedthe Barclays U.S. Aggregate Bond Index, which returned 4.21%.
> The Fund benefited from a decision early in the year to raise equity exposure, thus capturing the strong performance ofthe equity markets in 2012. Exposure to both emerging and high-yield bond markets aided performance in the fixedincome portion of the portfolio.
Average Annual Total Returns (%) (for period ended December 31, 2012)
Inception 1 Year 5 Years 10 Years
Class 1 01/01/89 13.03 2.47 6.89
Class 2 06/01/00 12.76 2.27 6.71
S&P 500 Index 16.00 1.66 7.10
Barclays U.S. Aggregate Bond Index 4.21 5.95 5.18
Performance data quoted represents past performance and current performance may be lower or higher. Past performance is no guarantee
of future results. The investment return and principal value will fluctuate so that shares, when redeemed, may be worth more or less than
the original cost. For current month-end performance information, please contact your insurance company.
Performance results reflect the effect of any fee waivers or reimbursements of fund expenses by Columbia Management Investment
Advisers, LLC and/or any of its affiliates. Absent these fee waivers or expense reimbursement arrangements, performance results would
have been lower.
Investment earnings, if any, are tax-deferred until distributed to shareholders, at which time taxes may become due. Total return
performance includes changes in share price and assumes reinvestment of dividends and capital gains, if any. Performance results reflect
the effect of all fund expenses, but do not include any fees and expenses imposed under your variable annuity contract and/or variable life
insurance policy or qualified pension or retirement plan. If performance results included the effect of these additional charges, they would
be lower.
The S&P 500 Index, an unmanaged index, measures the performance of 500 widely held, large-capitalization U.S. stocks and is frequentlyused as a general measure of market performance.
The Barclays U.S. Aggregate Bond Index is a broad-based benchmark that measures the investment grade, U.S. dollar-denominated, fixed-ratetaxable bond market, including Treasuries, government-related and corporate securities, mortgage-backed securities (agency fixed-rate andhybrid adjustable-rate mortgage passthroughs), asset-backed securities, and commercial mortgage-backed securities.
Indices are not available for investment, are not professionally managed and do not reflect sales charges, fees, brokerage commissions, taxesor other expenses of investing. Securities in the Fund may not match those in an index.
Columbia Variable Portfolio — Asset Allocation Fund

3Annual Report 2012
Performance Overview (continued)
Performance of a Hypothetical $10,000 Investment (January 1, 2003 – December 31, 2012)
The chart above shows the change in value of a hypothetical $10,000 investment in Class 1 shares of Columbia Variable Portfolio — AssetAllocation Fund during the stated time period, and does not reflect the deduction of taxes, if any, that a shareholder may pay on Funddistributions or on the redemption of Fund shares. The returns also do not reflect fees and expenses imposed under your variable annuitycontract and/or variable life insurance policy or qualified pension or retirement plan, if any.
0
5,000
10,000
15,000
$25,000
20,000 $19,858$19,465
$16,575
12/1212/1112/1012/0912/0812/0712/0612/0512/0412/0301/01/03
Columbia Variable Portfolio — Asset Allocation Fund Class 1 ($19,465) S&P 500 Index ($19,858)Barclays U.S. Aggregate Bond Index ($16,575)
Columbia Variable Portfolio — Asset Allocation Fund

4 Annual Report 2012
Manager Discussion of Fund Performance
For the 12-month period that ended December 31, 2012, the Fund’s Class 1 sharesreturned 13.03%. During the period, the Fund underperformed the S&P 500 Index,which returned 16.00%, and outperformed the Barclays U.S. Aggregate BondIndex, which returned 4.21%. The Fund benefited from a decision early in theyear to raise equity exposure, thus capturing the strong performance of the equitymarkets in 2012. Exposure to both emerging and high-yield bond markets aidedperformance in the fixed income portion of the portfolio.
Modest Economic Growth
The U.S. economy expanded at a modest but sluggish pace in 2012. Job growthpicked up but failed to reach a level that could drive unemployment significantlylower. Manufacturing activity stalled during the summer and again late in theyear, a sign that the engine of this recovery had lost some steam. The housingmarket showed steady improvement throughout the year, but its contribution togrowth was modest. A host of other factors weighed on the economy. SuperstormSandy battered the Northeast in October, with damage estimated to exceed$65 billion. Europe’s debt woes, economic slowdown in China and Congressionalwrangling over the fiscal cliff of tax increases and spending cuts scheduled foryear end all contributed to an uncertain environment.
Despite these challenges, the financial markets were buoyed by the actions ofEuropean and U.S. policymakers, who opened the liquidity spigots. In August,the European Central Bank unveiled a package of measures that involved buyingsovereign bonds to ease the strain of Europe’s debt crisis and safeguard the euro.In the United States, the Federal Reserve (the Fed) announced that it would keepshort-term interest rates near zero until unemployment declined to 6.5% orinflation exceeded 2.5%. The Fed also extended its purchase of long-termTreasury and agency-backed mortgage securities to maintain downward pressureon longer-term interest rates, support mortgage markets and help make broaderfinancial conditions more accommodative. Against this backdrop, the U.S. andforeign stocks and the riskiest sectors of the fixed income markets all generatedrobust gains in 2012.
Allocation Decisions Aided Fund Results
With expectations that the U.S. economy would continue to generate modestgrowth, we increased the Fund’s equity allocation from a significant underweightat the end of 2011. With strong performance from both growth and value, small,mid and large caps in the U.S. market, the Fund benefited from this decision.Continued weakness in Europe left us cautious on eurozone markets, and wereduced the Fund’s European exposure, which was a slight drag on performance.Despite a challenging environment, the MSCI EAFE Index, a broad proxyfor developed foreign market performance, performed even better than theS&P 500 Index for the year, as investors responded to the ECB’s action to protectthe euro. Within fixed income, allocations to high yield and emerging-marketbonds aided returns, as both sectors delivered returns on par with equities andneither is included in the Fund’s fixed-income benchmark, the Barclays U.S.Aggregate Bond Index. Outside traditional asset classes, an increase in exposureto convertible securities aided performance, as convertibles enjoyed returnsnearly on par with equities. At the end of 2012, equities accounted for close to61% of the Fund’s assets, fixed income accounted for approximately 31% andthe remaining 8% was invested in alternative asset classes, convertibles and cash.
Portfolio Management
Anwiti Bahuguna, PhD
Melda Mergen, CFA, CAIA
Colin Moore
Marie Schofield, CFA
Beth Vanney, CFA
Portfolio Breakdown (%)
(at December 31, 2012)
Equity Funds 60.8
Dividend Income 6.0
International 8.2
U.S. Large Cap 31.4
U.S. Mid Cap 9.1
U.S. Small Cap 6.1
Fixed-Income Funds 30.8
Convertible 3.0
Emerging Markets 2.0
International 2.0
Investment Grade 23.8
Alternative Investments 5.0
Inflation-Indexed Bonds 2.7
Money Market Funds 0.7
Total 100.0
Percentages indicated are based upon totalinvestments.
Columbia Variable Portfolio — Asset Allocation Fund

5Annual Report 2012
Manager Discussion of Fund Performance (continued)
Of the underlying equity funds in the portfolio, performance benefited most frompositions in Columbia Large Cap Growth Fund, Columbia Emerging MarketsFund and Columbia Contrarian Core Fund. All three Funds outperformed theirbenchmarks by a solid margin. Columbia Small Cap Value Fund I, ColumbiaMid Cap Growth Fund and Columbia Dividend Income Fund were the mostsignificant benchmark laggards. On the fixed income side of the portfolio,Columbia International Bond Fund, Columbia U.S. Government Mortgage Fundand Columbia Emerging Market Bond Fund all outperformed their benchmarks.Columbia’s fixed income funds had a remarkable year, with only ColumbiaIncome Opportunities Fund underperforming its benchmark. The shortfall for theFund was sufficiently narrow to be considered insignificant.
Looking Ahead
At the very last minute, Congress raised income, dividend, capital gains andestate taxes on the wealthiest Americans in an effort to raise revenues. However,it failed to produce meaningful spending cuts that would reduce the budgetdeficit or address the debt-ceiling limit that the federal government will reachearly in 2013. Against this backdrop, the Fund’s neutral equity reflects ourcautious optimism on global growth and its impact on the world’s stock markets.We currently continue to underweight fixed income relative to its targetallocation, with an emphasis on sectors that offer better yields than governmentsecurities and have the potential for capital appreciation. However, we cut backsomewhat on the Fund’s exposure to investment grade and high-yield bonds.With interest rates at historical lows across the maturity spectrum, we kept U.S.Treasury exposure low but modestly raised exposure to mortgages. We also mademodest increases to developed market and emerging market debt. Currently,yields on emerging market debt are attractive and monetary policy remainsaccommodative. At present, we continue to maintain positions in alternative assetclasses as their relatively low correlation to traditional assets help broadendiversification within the portfolio. However, we eliminated the Fund’s positionin commodities during the year.
Columbia Variable Portfolio — Asset Allocation Fund

6 Annual Report 2012
Columbia Variable Portfolio — Asset Allocation Fund
Understanding Your Fund’s Expenses(Unaudited)
As an investor, you incur ongoing costs, which generally include distribution and/or service (Rule 12b-1) fees, and otherfund expenses. The following information is intended to help you understand your ongoing costs (in dollars) of investing inthe Fund and to help you compare these costs with the ongoing costs of investing in other mutual funds.
The information below does not reflect fees and expenses imposed under your variable annuity contract and/or variable lifeinsurance policy (collectively, Contracts) or qualified pension and retirement plan (Qualified Plan), if any. The total fees andexpenses you bear may therefore be higher than those shown below.
Analyzing Your Fund’s Expenses
To illustrate these ongoing costs, we have provided examples and calculated the expenses paid by investors in each shareclass of the Fund during the period. The actual and hypothetical information in the table is based on an initial investment of$1,000 at the beginning of the period indicated and held for the entire period. Expense information is calculated two waysand each method provides you with different information. The amount listed in the “Actual” column is calculated using theFund’s actual operating expenses and total return for the period. You may use the Actual information, together with theamount invested, to estimate the expenses that you paid over the period. Simply divide your account value by $1,000 (forexample, an $8,600 account value divided by $1,000 = 8.6), then multiply the results by the expenses paid during the periodunder the Actual column. The amount listed in the “Hypothetical” column assumes a 5% annual rate of return beforeexpenses (which is not the Fund’s actual return) and then applies the Fund’s actual expense ratio for the period to thehypothetical return. You should not use the hypothetical account values and expenses to estimate either your actual accountbalance at the end of the period or the expenses you paid during the period. See “Compare With Other Funds” below fordetails on how to use the hypothetical data.
In addition to the ongoing expenses which the Fund bears directly, the Fund’s shareholders indirectly bear the Fund’sallocable share of the costs and expenses of each underlying fund in which the Fund invests. You can also estimate theeffective expenses paid during the period, which includes the indirect fees associated with investing in the underlying funds,by using the amounts listed in the effective expenses paid during the period column.
Compare With Other Funds
Since all mutual funds are required to include the same hypothetical calculations about expenses in shareholder reports, youcan use this information to compare the ongoing cost of investing in the Fund with other funds. To do so, compare thehypothetical example with the 5% hypothetical examples that appear in the shareholder reports of other funds. As youcompare hypothetical examples of other funds, it is important to note that hypothetical examples are meant to highlight theongoing costs of investing in a fund only and do not reflect any transaction costs, such as redemption or exchange fees, orexpenses that apply to the subaccount or the contract. Therefore, the hypothetical calculations are useful in comparingongoing costs only, and will not help you determine the relative total costs of owning different funds. If the fees andexpenses imposed under your Contract or Qualified Plan, if any, were included, your costs would be higher.
July 1, 2012 – December 31, 2012
Account Value at Account Value Expenses Paid Effective Expenses Fund’s Effective
the Beginning of at the End of During the Fund’s Annualized Paid During the Annualized
the Period ($) the Period ($) Period ($) Expense Ratio (%) Period ($) Expense Ratio (%)
Actual Hypothetical Actual Hypothetical Actual Hypothetical Actual Actual Hypothetical Actual
Class 1 1,000.00 1,000.00 1,068.70 1,024.52 0.78 0.77 0.15 4.65 4.55 0.89
Class 2 1,000.00 1,000.00 1,067.50 1,023.25 2.09 2.05 0.40 5.96 5.83 1.14
Expenses paid during the period are equal to the Fund’s annualized expense ratio for each class as indicated above, multiplied by the averageaccount value over the period and then multiplied by the number of days in the Fund’s most recent fiscal half year and divided by 366.
Effective expenses paid during the period and the Fund’s effective annualized expense ratio include expenses borne directly to the class plusthe Fund’s pro rata portion of the ongoing expenses charged by the underlying funds using the expense ratio of each class of the underlyingfunds as of the underlying fund’s most recent shareholder report.
Had Columbia Management Investment Advisers, LLC and/or certain of its affiliates not waived/reimbursed certain fees and expenses,account value at the end of the period would have been reduced.

7Annual Report 2012
Portfolio of InvestmentsDecember 31, 2012(Percentages represent value of investments compared to net assets)
Dividend Income 6.0%
Columbia Dividend Income Fund, Class I Shares(a) 195,061 2,879,100
Columbia Dividend Opportunity Fund, Class I Shares(a) 332,693 2,901,088
Total 5,780,188
International 8.3%
Columbia Emerging Markets Fund, Class I Shares(a) 470,696 4,899,946
Columbia Greater China Fund, Class I Shares(a) 19,157 992,135
Columbia Overseas Value Fund, Class I Shares(a) 269,024 2,009,611
Total 7,901,692
U.S. Large Cap 31.3%
Columbia Contrarian Core Fund, Class I Shares(a) 569,520 9,197,748
Columbia Large Cap Growth Fund, Class I Shares(a) 175,915 4,842,937
Columbia Large Core Quantitative Fund, Class I Shares(a) 1,420,526 9,219,211
Columbia Large Growth Quantitative Fund, Class I Shares(a) 497,239 3,858,575
Columbia Large Value Quantitative Fund, Class I Shares(a) 271,651 1,934,153
Columbia Select Large-Cap Value Fund, Class I Shares(a) 59,878 974,223
Total 30,026,847
U.S. Mid Cap 9.1%
Columbia Mid Cap Growth Fund, Class I Shares(a)(b) 163,781 4,376,233
Columbia Mid Cap Value Fund, Class I Shares(a) 295,754 4,377,161
Total 8,753,394
U.S. Small Cap 6.1%
Columbia Small Cap Growth Fund I, Class I Shares(a)(b) 106,272 2,930,970
Columbia Small Cap Value Fund I, Class I Shares(a) 22,375 980,468
Columbia Variable Portfolio — Asset Allocation Fund
The accompanying Notes to Financial Statements are an integral part of this statement.
Equity Funds 60.8%
Shares Value ($)
Equity Funds (continued)
Shares Value ($)
Columbia Small Cap Value Fund II, Class I Shares(a) 132,274 1,962,950
Total 5,874,388
Total Equity Funds
(Cost: $55,630,495) 58,336,509
Fixed-Income Funds 30.8%
Convertible 3.0%
Columbia Convertible Securities Fund, Class I Shares(a) 194,079 2,913,130
Emerging Markets 2.0%
Columbia Emerging Markets Bond Fund, Class I Shares(a) 152,891 1,937,127
International 2.0%
Columbia International Bond Fund, Class I Shares(a) 165,273 1,928,736
Investment Grade 23.8%
Columbia Corporate Income Fund, Class I Shares(a) 826,769 8,730,675
Columbia Income Opportunities Fund, Class I Shares(a) 432,432 4,354,593
Columbia Limited Duration Credit Fund, Class I Shares(a) 287,319 2,907,672
Columbia U.S. Government Mortgage Fund, Class I Shares(a) 1,210,851 6,792,873
Total 22,785,813
Total Fixed-Income Funds
(Cost: $28,261,217) 29,564,806
Alternative Investments 5.0%
Columbia Absolute Return Currency and Income Fund, Class I Shares(a)(b) 188,174 1,930,669
Columbia Absolute Return Multi-Strategy Fund, Class I Shares(a) 290,254 2,890,928
Total Alternative Investments
(Cost: $4,789,561) 4,821,597

8 Annual Report 2012
Portfolio of Investments (continued)December 31, 2012
U.S. Treasury Inflation-Indexed Bond04/15/29 3.875% 274,383 454,78901/15/25 2.375% 374,287 504,90702/15/40 2.125% 107,022 157,03807/15/13 1.875% 188,918 191,95801/15/14 2.000% 200,302 206,70301/15/15 1.625% 254,400 270,28001/15/16 2.000% 203,955 226,13607/15/17 2.625% 167,414 200,60801/15/19 2.125% 215,480 261,62301/15/21 1.125% 84,595 99,347
Total Inflation-Indexed Bonds
(Cost: $2,251,838) 2,573,389
Notes to Portfolio of Investments
(a) As defined in the Investment Company Act of 1940, an affiliated company is one in which the Fund owns 5% or more of its outstandingvoting securities, or a company which is under common ownership or control with the Fund. Holdings and transactions in these affiliatedcompanies during the year ended December 31, 2012, are as follows:
Dividends
Beginning Purchase Proceeds Realized Ending Capital Gain or Interest
Issuer Cost ($) Cost ($) From Sales ($) Gain/Loss ($) Cost ($) Distributions ($) Income ($) Value ($)
Columbia Absolute Return Currency and Income Fund, Class I Shares 3,258,871 178,239 (1,563,324) 25,789 1,899,575 43,220 — 1,930,669
Columbia Absolute Return Multi-Strategy Fund, Class I Shares 5,076,932 417,150 (2,612,638) 8,542 2,889,986 — 35,010 2,890,928
Columbia Bond Fund, Class I Shares 4,053,724 10,492 (4,102,960) 38,744 — — 30,750 —
Columbia Commodity Strategy Fund, Class I Shares — 1,606,618 (1,593,169) (13,449) — — — —
Columbia Contrarian Core Fund, Class I Shares 5,158,776 4,809,698 (1,356,440) 540 8,612,574 10,546 109,000 9,197,748
Columbia Convertible Securities Fund, Class I Shares 2,243,159 1,087,209 (405,025) (26,083) 2,899,260 — 77,171 2,913,130
Columbia Corporate Income Fund, Class I Shares 6,933,690 3,089,475 (1,968,933) 42,831 8,097,063 172,228 321,906 8,730,675
Columbia Dividend Income Fund, Class I Shares 2,512,183 639,036 (579,725) 16,364 2,587,858 — 83,028 2,879,100
Columbia Dividend Opportunity Fund, Class I Shares 1,329,267 1,979,780 (541,259) 7,962 2,775,750 — 132,448 2,901,088
Columbia Variable Portfolio — Asset Allocation Fund
The accompanying Notes to Financial Statements are an integral part of this statement.
Inflation-Indexed Bonds 2.7%
Coupon Principal
Issuer Rate Amount ($) Value ($)
Money Market Funds 0.7%
Shares Value ($)
Columbia Short-Term Cash Fund, 0.142%(a)(c) 688,066 688,066
Total Money Market Funds
(Cost: $688,066) 688,066
Total Investments
(Cost: $91,621,177) 95,984,367
Other Assets and Liabilities (32,450)
Net Assets 95,951,917

9Annual Report 2012
Portfolio of Investments (continued)December 31, 2012
Dividends
Beginning Purchase Proceeds Realized Ending Capital Gain or Interest
Issuer Cost ($) Cost ($) From Sales ($) Gain/Loss ($) Cost ($) Distributions ($) Income ($) Value ($)
Columbia Emerging Markets Fund, Class I Shares 3,571,347 3,807,223 (2,318,080) (293,540) 4,766,950 276,609 28,883 4,899,946
Columbia Emerging Markets Bond Fund, Class I Shares 1,804,138 390,481 (483,620) 18,504 1,729,503 12,499 110,700 1,937,127
Columbia Energy and Natural Resources Fund, Class I Shares 2,867,923 5,034 (3,164,305) 291,348 — — — —
Columbia European Equity Fund, Class I Shares 4,076,886 51,273 (4,042,576) (85,583) — — — —
Columbia Greater China Fund, Class I Shares 1,975,939 75,760 (720,017) (206,272) 1,125,410 — 14,064 992,135
Columbia High Yield Bond Fund, Class I Shares 4,703,406 119,419 (4,975,126) 152,301 — — 114,016 —
Columbia Income Opportunities Fund, Class I Shares — 4,764,044 (569,328) 5,861 4,200,577 — 165,971 4,354,593
Columbia International Bond Fund, Class I Shares 1,789,150 351,304 (302,242) 1,346 1,839,558 — 38,325 1,928,736
Columbia Large Cap Growth Fund, Class I Shares 4,599,697 1,957,847 (2,647,315) 337,415 4,247,644 — 31,815 4,842,937
Columbia Large Cap Core Fund, Class I Shares 4,307,105 — (4,523,937) 216,832 — — — —
Columbia Large Core Quantitative Fund, Class I Shares 2,597,610 7,439,716 (1,381,758) 32,088 8,687,656 — 168,786 9,219,211
Columbia Large Growth Quantitative Fund, Class I Shares — 4,414,196 (254,869) 12,063 4,171,390 334,803 73,102 3,858,575
Columbia Large Value Quantitative Fund, Class I Shares 1,713,293 662,100 (447,773) (25,141) 1,902,479 47,943 66,133 1,934,153
Columbia Limited Duration Credit Fund, Class I Shares 3,600,960 276,237 (1,005,377) 1,335 2,873,155 43,901 76,092 2,907,672
Columbia Mid Cap Growth Fund, Class I Shares 3,832,156 1,282,749 (1,142,219) 71,564 4,044,250 123,630 — 4,376,233
Columbia Mid Cap Value Fund, Class I Shares 2,931,754 1,687,098 (885,721) 10,539 3,743,670 — 52,983 4,377,161
Columbia Variable Portfolio — Asset Allocation Fund
The accompanying Notes to Financial Statements are an integral part of this statement.
Notes to Portfolio of Investments (continued)

10 Annual Report 2012
Portfolio of Investments (continued)December 31, 2012
Dividends
Beginning Purchase Proceeds Realized Ending Capital Gain or Interest
Issuer Cost ($) Cost ($) From Sales ($) Gain/Loss ($) Cost ($) Distributions ($) Income ($) Value ($)
Columbia Multi-Advisor International Equity Fund, Class I Shares 5,297,433 8,624 (5,150,198) (155,859) — — — —
Columbia Overseas Value Fund, Class I Shares 2,646,403 174,352 (722,897) (56,150) 2,041,708 — 48,011 2,009,611
Columbia Pacific/Asia Fund, Class I Shares 1,688,701 1,105,952 (2,769,775) (24,878) — — 17,243 —
Columbia Select Large Cap Growth Fund, Class I Shares 3,770,584 611,025 (4,524,320) 142,711 — — — —
Columbia Select Large-Cap Value Fund, Class I Shares 855,040 335,310 (231,710) (543) 958,097 31,515 16,214 974,223
Columbia Short-Term Cash Fund 23,041 3,229,001 (2,563,976) — 688,066 — 1,535 688,066
Columbia Small Cap Growth Fund I, Class I Shares 755,476 3,314,837 (921,759) (18,290) 3,130,264 286,074 — 2,930,970
Columbia Small Cap Growth Fund II, Class I Shares 988,369 9,998 (980,894) (17,473) — — — —
Columbia Small Cap Value Fund I, Class I Shares 1,844,386 132,924 (1,073,869) 45,162 948,603 35,740 9,403 980,468
Columbia Small Cap Value Fund II, Class I Shares 1,056,008 1,167,120 (332,745) (4,190) 1,886,193 41,946 23,418 1,962,950
Columbia U.S. Government Mortgage Fund, Class I Shares 4,707,163 2,977,935 (1,064,991) 1,993 6,622,100 128,992 192,430 6,792,873
Mortgage- and Asset-Backed Portfolio 3,492,604 198,367 (3,707,713) 16,742 — 111,347 51,838 —
Total 102,063,174 54,367,623 (67,632,583) 571,125 89,369,339 1,700,993 2,090,275 93,410,978
(b) Non-income producing.
(c) The rate shown is the seven-day current annualized yield at December 31, 2012.
Columbia Variable Portfolio — Asset Allocation Fund
The accompanying Notes to Financial Statements are an integral part of this statement.
Notes to Portfolio of Investments (continued)

11Annual Report 2012
Portfolio of Investments (continued)December 31, 2012
Fair Value Measurements
Generally accepted accounting principles (GAAP) require disclosure regarding the inputs and valuation techniques used to measure fair valueand any changes in valuation inputs or techniques. In addition, investments shall be disclosed by major category.
The Fund categorizes its fair value measurements according to a three-level hierarchy that maximizes the use of observable inputs andminimizes the use of unobservable inputs by prioritizing that the most observable input be used when available. Observable inputs are thosethat market participants would use in pricing an investment based on market data obtained from sources independent of the reporting entity.Unobservable inputs are those that reflect the Fund’s assumptions about the information market participants would use in pricing aninvestment. An investment’s level within the fair value hierarchy is based on the lowest level of any input that is deemed significant to theasset or liability’s fair value measurement. The input levels are not necessarily an indication of the risk or liquidity associated withinvestments at that level. For example, certain U.S. government securities are generally high quality and liquid, however, they are reflected asLevel 2 because the inputs used to determine fair value may not always be quoted prices in an active market.
Fair value inputs are summarized in the three broad levels listed below:
> Level 1 — Valuations based on quoted prices for investments in active markets that the Fund has the ability to access at themeasurement date (to include NAV for open-end mutual funds). Valuation adjustments are not applied to Level 1 investments.
> Level 2 — Valuations based on other significant observable inputs (including quoted prices for similar securities, interest rates,prepayment speeds, credit risks, etc.).
> Level 3 — Valuations based on significant unobservable inputs (including the Fund’s own assumptions and judgment in determining thefair value of investments).
Inputs that are used in determining fair value of an investment may include price information, credit data, volatility statistics, and otherfactors. These inputs can be either observable or unobservable. The availability of observable inputs can vary between investments, and isaffected by various factors such as the type of investment, and the volume and level of activity for that investment or similar investments inthe marketplace. The inputs will be considered by the Investment Manager, along with any other relevant factors in the calculation of aninvestment’s fair value. The Fund uses prices and inputs that are current as of the measurement date, which may include periods of marketdislocations. During these periods, the availability of prices and inputs may be reduced for many investments. This condition could cause aninvestment to be reclassified between the various levels within the hierarchy.
Investments falling into the Level 3 category are primarily supported by quoted prices from brokers and dealers participating in the market forthose investments. However, these may be classified as Level 3 investments due to lack of market transparency and corroboration to supportthese quoted prices. Additionally, valuation models may be used as the pricing source for any remaining investments classified as Level 3.These models rely on one or more significant unobservable inputs and/or significant assumptions by the Investment Manager. Inputs used invaluations may include, but are not limited to, financial statement analysis, capital account balances, discount rates and estimated cashflows, and comparable company data.
Under the direction of the Fund’s Board of Trustees (the Board), the Investment Manager’s Valuation Committee (the Committee) isresponsible for carrying out the valuation procedures approved by the Board. The Committee consists of voting and non-voting members fromvarious groups within the Investment Manager’s organization, including operations and accounting, trading and investments, compliance, riskmanagement and legal.
The Committee meets at least monthly to review and approve valuation matters, which may include a description of specific valuationdeterminations, data regarding pricing information received from approved pricing vendors and brokers and the results of Board-approvedvaluation control policies and procedures (the Policies). The Policies address, among other things, instances when market quotations arereadily available, including recommendations of third party pricing vendors and a determination of appropriate pricing methodologies; eventsthat require specific valuation determinations and assessment of fair value techniques; securities with a potential for stale pricing, includingthose that are illiquid, restricted, or in default; and the effectiveness of third-party pricing vendors, including periodic reviews of vendors. TheCommittee meets more frequently, as needed, to discuss additional valuation matters, which may include the need to review back-testingresults, review time-sensitive information or approve related valuation actions. The Committee reports to the Board, with members of theCommittee meeting with the Board at each of its regularly scheduled meetings to discuss valuation matters and actions during the period,similar to those described earlier.
For investments categorized as Level 3, the Committee monitors information similar to that described above, which may include: (i) dataspecific to the issuer or comparable issuers, (ii) general market or specific sector news and (iii) quoted prices and specific or similar securitytransactions. The Committee considers this data and any changes from prior periods in order to assess the reasonableness of observableand unobservable inputs, any assumptions or internal models used to value those securities and changes in fair value. This data is also usedto corroborate, when available, information received from approved pricing vendors and brokers. Various factors impact the frequency ofmonitoring this information (which may occur as often as daily). However, the Committee may determine that changes to inputs, assumptionsand models are not required as a result of the monitoring procedures performed.
Columbia Variable Portfolio — Asset Allocation Fund
The accompanying Notes to Financial Statements are an integral part of this statement.

12 Annual Report 2012
Portfolio of Investments (continued)December 31, 2012
Fair Value Measurements (continued)
The following table is a summary of the inputs used to value the Fund’s investments at December 31, 2012:
Level 1
Quoted Prices in Active Level 2 Level 3
Markets for Identical Other Significant Significant
Description Assets ($) Observable Inputs ($) Unobservable Inputs ($) Total ($)
Mutual Funds
Investments in Affiliated Funds 93,410,978 — — 93,410,978
Total Mutual Funds 93,410,978 — — 93,410,978
Bonds
Inflation-Indexed Bonds — 2,573,389 — 2,573,389
Total Bonds — 2,573,389 — 2,573,389
Total 93,410,978 2,573,389 — 95,984,367
See the Portfolio of Investments for all investment classifications not indicated in the table.
The Fund’s assets assigned to the Level 2 input category are generally valued using the market approach, in which a security’s value isdetermined through reference to prices and information from market transactions for similar or identical assets.
There were no transfers of financial assets between Levels 1 and 2 during the period.
Columbia Variable Portfolio — Asset Allocation Fund
The accompanying Notes to Financial Statements are an integral part of this statement.

13Annual Report 2012
Statement of Assets and LiabilitiesDecember 31, 2012
Columbia Variable Portfolio — Asset Allocation Fund
The accompanying Notes to Financial Statements are an integral part of this statement.
Assets
Investments, at value
Unaffiliated issuers (identified cost $2,251,838) $2,573,389
Affiliated issuers (identified cost $89,369,339) 93,410,978
Total investments (identified cost $91,621,177) 95,984,367
Receivable for:
Investments sold 136,810
Capital shares sold 786
Dividends 97,190
Interest 17,925
Reclaims 1,078
Expense reimbursement due from Investment Manager 588
Prepaid expenses 931
Trustees’ deferred compensation plan 36,078
Total assets 96,275,753
Liabilities
Payable for:
Investments purchased 95,912
Capital shares purchased 139,160
Investment management fees 150
Distribution and/or service fees 365
Transfer agent fees 468
Administration fees 156
Compensation of board members 18,566
Chief compliance officer expenses 23
Other expenses 32,958
Trustees’ deferred compensation plan 36,078
Total liabilities 323,836
Net assets applicable to outstanding capital stock $95,951,917
Represented by
Paid-in capital $93,948,804
Undistributed net investment income 2,177,826
Accumulated net realized loss (4,537,923)
Unrealized appreciation (depreciation) on:
Investments — unaffiliated issuers 321,551
Investments — affiliated issuers 4,041,639
Foreign currency translations 20
Total — representing net assets applicable to outstanding capital stock $95,951,917
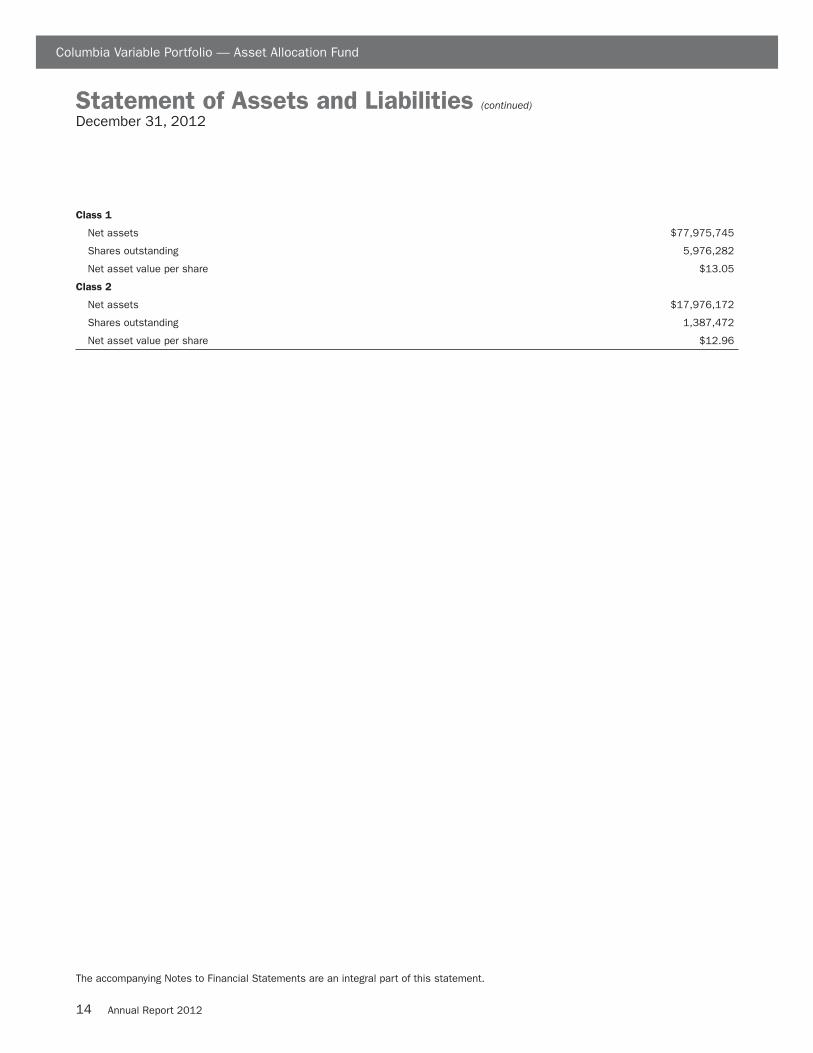
14 Annual Report 2012
Statement of Assets and Liabilities (continued)December 31, 2012
Columbia Variable Portfolio — Asset Allocation Fund
The accompanying Notes to Financial Statements are an integral part of this statement.
Class 1
Net assets $77,975,745
Shares outstanding 5,976,282
Net asset value per share $13.05
Class 2
Net assets $17,976,172
Shares outstanding 1,387,472
Net asset value per share $12.96

15Annual Report 2012
Statement of OperationsYear Ended December 31, 2012
Columbia Variable Portfolio — Asset Allocation Fund
The accompanying Notes to Financial Statements are an integral part of this statement.
Net investment income
Income:Dividends — unaffiliated issuers $6,097Dividends — affiliated issuers 2,090,275Interest 64,097Foreign taxes withheld (56)
Total income 2,160,413
Expenses:Investment management fees 28,572Distribution and/or service fees
Class 2 49,220Transfer agent fees
Class 1 48,646Class 2 11,813
Administration fees 20,153Compensation of board members 26,111Custodian fees 27,303Printing and postage fees 50,987Professional fees 27,725Chief compliance officer expenses 47Other 2,760
Total expenses 293,337Fees waived or expenses reimbursed by Investment Manager and its affiliates (84,550)Total net expenses 208,787Net investment income 1,951,626
Realized and unrealized gain (loss) — net
Net realized gain (loss) on:Investments — unaffiliated issuers 13,055Investments — affiliated issuers 571,125Capital gain distributions from underlying affiliated funds 1,700,993Foreign currency translations (81)
Net realized gain 2,285,092Net change in unrealized appreciation (depreciation) on:
Investments — unaffiliated issuers 103,436Investments — affiliated issuers 7,873,854Foreign currency translations 21
Net change in unrealized appreciation (depreciation) 7,977,311Net realized and unrealized gain 10,262,403
Net increase in net assets resulting from operations $12,214,029

16 Annual Report 2012
Statement of Changes in Net Assets
Columbia Variable Portfolio — Asset Allocation Fund
The accompanying Notes to Financial Statements are an integral part of this statement.
Year Ended Year Ended
December 31, December 31,
2012 2011
Operations
Net investment income $1,951,626 $2,094,314
Net realized gain 2,285,092 5,392,082
Net change in unrealized appreciation (depreciation) 7,977,311 (7,997,733)
Net increase (decrease) in net assets resulting from operations 12,214,029 (511,337)
Distributions to shareholders
Net investment income
Class 1 (1,786,909) (2,270,728)
Class 2 (384,448) (557,108)
Total distributions to shareholders (2,171,357) (2,827,836)
Increase (decrease) in net assets from capital stock activity (15,128,888) (16,278,298)
Total decrease in net assets (5,086,216) (19,617,471)
Net assets at beginning of year 101,038,133 120,655,604
Net assets at end of year $95,951,917 $101,038,133
Undistributed net investment income $2,177,826 $2,085,406

17Annual Report 2012
Statement of Changes in Net Assets (continued)
Columbia Variable Portfolio — Asset Allocation Fund
The accompanying Notes to Financial Statements are an integral part of this statement.
Year Ended December 31, 2012 Year Ended December 31, 2011
Shares Dollars ($) Shares Dollars ($)
Capital stock activity
Class 1 shares
Subscriptions 117,978 1,499,786 191,136 2,302,234
Distributions reinvested 144,222 1,786,909 182,241 2,270,728
Redemptions (1,142,678) (14,398,989) (1,294,033) (15,938,289)
Net decrease (880,478) (11,112,294) (920,656) (11,365,327)
Class 2 shares
Subscriptions 58,726 744,771 69,299 842,247
Distributions reinvested 31,231 384,448 44,964 557,108
Redemptions (410,087) (5,145,813) (515,726) (6,312,326)
Net decrease (320,130) (4,016,594) (401,463) (4,912,971)
Total net decrease (1,200,608) (15,128,888) (1,322,119) (16,278,298)

18 Annual Report 2012
Financial Highlights
Columbia Variable Portfolio — Asset Allocation Fund
The accompanying Notes to Financial Statements are an integral part of this statement.
The following tables are intended to help you understand the Fund’s financial performance. Certain information reflectsfinancial results for a single share of a class held for the periods shown. Per share net investment income (loss) amounts arecalculated based on average shares outstanding during the period. Total return assumes reinvestment of all dividends anddistributions. Total return does not reflect payment of the expenses that apply to the variable accounts or contract charges, ifany, and are not annualized for periods of less than one year.
Year Ended December 31,
Class 1 2012 2011 2010 2009 2008
Per share data
Net asset value, beginning of period $11.81 $12.22 $11.08 $9.32 $15.25
Income from investment operations:
Net investment income 0.25 0.24 0.26 0.25 0.35
Net realized and unrealized gain (loss) 1.27 (0.33) 1.19 1.93 (4.24)
Total from investment operations 1.52 (0.09) 1.45 2.18 (3.89)
Less distributions to shareholders:
Net investment income (0.28) (0.32) (0.31) (0.42) (0.44)
Net realized gains — — — — (1.60)
Total distributions to shareholders (0.28) (0.32) (0.31) (0.42) (2.04)
Net asset value, end of period $13.05 $11.81 $12.22 $11.08 $9.32
Total return 13.03% (0.85%) 13.43% 24.00%(a) (28.32%)
Ratios to average net assets(b)
Total gross expenses 0.24% 0.40% 0.97% 1.00% 0.87%
Total net expenses(c) 0.16% 0.13% 0.68%(d) 0.80%(d) 0.75%(d)
Net investment income 1.99% 1.93% 2.27% 2.48% 2.75%
Supplemental data
Net assets, end of period (in thousands) $77,976 $81,002 $95,031 $97,435 $93,500
Portfolio turnover 51% 89% 234%(e) 103% 94%
Notes to Financial Highlights
(a) Total return includes a reimbursement of a loss experienced by the Fund due to a compliance violation. The reimbursement had an impactof less than 0.01% on total return.
(b) In addition to the fees and expenses which the Fund bears directly, the Fund indirectly bears a pro rata share of the fees and expenses ofthe acquired funds in which it invests. Such indirect expenses are not included in the reported expense ratios.
(c) Total net expenses include the impact of certain waivers/reimbursements made by the Investment Manager and certain of its affiliates, ifapplicable.
(d) The benefits derived from expense reductions had an impact of less than 0.01%.
(e) Effective October 22, 2010, the Fund transitioned to a fund-of-funds structure. If the Fund had not transitioned, portfolio turnover wouldhave been lower.

19Annual Report 2012
Financial Highlights (continued)
Columbia Variable Portfolio — Asset Allocation Fund
The accompanying Notes to Financial Statements are an integral part of this statement.
Year Ended December 31,
Class 2 2012 2011 2010 2009 2008
Per share data
Net asset value, beginning of period $11.73 $12.15 $11.02 $9.27 $15.18
Income from investment operations:
Net investment income 0.22 0.20 0.24 0.23 0.32
Net realized and unrealized gain (loss) 1.26 (0.32) 1.18 1.92 (4.21)
Total from investment operations 1.48 (0.12) 1.42 2.15 (3.89)
Less distributions to shareholders:
Net investment income (0.25) (0.30) (0.29) (0.40) (0.42)
Net realized gains — — — — (1.60)
Total distributions to shareholders (0.25) (0.30) (0.29) (0.40) (2.02)
Net asset value, end of period $12.96 $11.73 $12.15 $11.02 $9.27
Total return 12.76% (1.09%) 13.26% 23.79%(a) (28.45%)
Ratios to average net assets(b)
Total gross expenses 0.49% 0.68% 1.22% 1.25% 1.12%
Total net expenses(c) 0.41% 0.38% 0.85%(d) 0.95%(d) 0.90%(d)
Net investment income 1.72% 1.66% 2.10% 2.34% 2.60%
Supplemental data
Net assets, end of period (in thousands) $17,976 $20,036 $25,624 $27,677 $29,985
Portfolio turnover 51% 89% 234%(e) 103% 94%
Notes to Financial Highlights
(a) Total return includes a reimbursement of a loss experienced by the Fund due to a compliance violation. The reimbursement had an impactof less than 0.01% on total return.
(b) In addition to the fees and expenses which the Fund bears directly, the Fund indirectly bears a pro rata share of the fees and expenses ofthe acquired funds in which it invests. Such indirect expenses are not included in the reported expense ratios.
(c) Total net expenses include the impact of certain waivers/reimbursements made by the Investment Manager and certain of its affiliates, ifapplicable.
(d) The benefits derived from expense reductions had an impact of less than 0.01%.
(e) Effective October 22, 2010, the Fund transitioned to a fund-of-funds structure. If the Fund had not transitioned, portfolio turnover wouldhave been lower.

20 Annual Report 2012
Notes to Financial StatementsDecember 31, 2012
Note 1. Organization
Columbia Variable Portfolio — Asset Allocation Fund (theFund), a series of Columbia Funds Variable Insurance Trust(the Trust), is a diversified fund. The Trust is registered underthe Investment Company Act of 1940, as amended (the1940 Act), as an open-end management investment companyorganized as a Massachusetts business trust.
Under normal circumstances, the Fund invests most of itsassets in shares of mutual funds managed by ColumbiaManagement Investment Advisers, LLC (the InvestmentManager) or its affiliates (Columbia Funds), exchange-tradedfunds (ETFs) and third party-advised funds (collectively,Underlying Funds), equity and fixed income securities,including Treasury Inflation Protected Securities (TIPS), andother instruments such as derivatives. The financial statementsof the Underlying Funds in which the Fund invests should beread in conjunction with the Fund’s financial statements.
Fund Shares
The Trust may issue an unlimited number of shares (withoutpar value). The Fund offers Class 1 and Class 2 shares toseparate accounts funding variable annuity contracts andvariable life insurance policies (collectively, Contracts) issuedby affiliated and unaffiliated life insurance companies as wellas qualified pension and retirement plans (Qualified Plans)and other qualified institutional investors authorized byColumbia Management Investment Distributors, Inc. (theDistributor). You may not buy (nor will you own) shares of theFund directly. You invest by participating in a Qualified Planor buying a Contract and making allocations to the Fund. Allshare classes have identical voting, dividend and liquidationrights. Each share class has its own expense structure.
Note 2. Summary of Significant
Accounting Policies
Use of Estimates
The preparation of financial statements in accordance withU.S. generally accepted accounting principles (GAAP)requires management to make certain estimates andassumptions that affect the reported amounts of assets andliabilities, the disclosure of contingent assets and liabilities atthe date of the financial statements and the reported amountsof revenue and expenses during the reporting period. Actualresults could differ from those estimates.
The following is a summary of significant accounting policiesconsistently followed by the Fund in the preparation of itsfinancial statements.
Security Valuation
Investments in the Underlying Funds are valued at the netasset value of each class of the respective Underlying Fund
determined as of the close of the New York Stock Exchange onthe valuation date.
Debt securities generally are valued by pricing servicesapproved by the Board of Trustees (the Board) based uponmarket transactions for normal, institutional-size trading unitsof similar securities. The services may use various pricingtechniques which take into account appropriate factors such asyield, quality, coupon rate, maturity, type of issue, tradingcharacteristics and other data, as well as broker quotes. Debtsecurities for which quotations are readily available may alsobe valued based upon an over-the-counter or exchange bidquotation.
Investments for which market quotations are not readilyavailable, or that have quotations which management believesare not reliable, are valued at fair value as determined in goodfaith under consistently applied procedures established by andunder the general supervision of the Board. If a security orclass of securities (such as foreign securities) is valued at fairvalue, such value is likely to be different from the last quotedmarket price for the security.
The determination of fair value often requires significantjudgment. To determine fair value, management may useassumptions including but not limited to future cash flows andestimated risk premiums. Multiple inputs from various sourcesmay be used to determine fair value.
Foreign Currency Transactions and Translations
The values of all assets and liabilities denominated in foreigncurrencies are translated into U.S. dollars at that day’sexchange rates. Net realized and unrealized gains (losses) onforeign currency transactions and translations include gains(losses) arising from the fluctuation in exchange rates betweentrade and settlement dates on securities transactions, gains(losses) arising from the disposition of foreign currency andcurrency gains (losses) between the accrual and payment dateson dividends, interest income and foreign withholding taxes.
For financial statement purposes, the Fund does notdistinguish that portion of gains (losses) on investments whichis due to changes in foreign exchange rates from that which isdue to changes in market prices of the investments. Suchfluctuations are included with the net realized and unrealizedgains (losses) on investments in the Statement of Operations.
Treasury Inflation Protected Securities
The Fund may invest in treasury inflation protected securities(TIPS). The principal amount of TIPS is adjusted periodicallyand is increased for inflation or decreased for deflation basedon a monthly published index. Interest payments are based onthe adjusted principal at the time the interest is paid. Theseadjustments are recorded as interest income in the Statementof Operations.
Columbia Variable Portfolio — Asset Allocation Fund
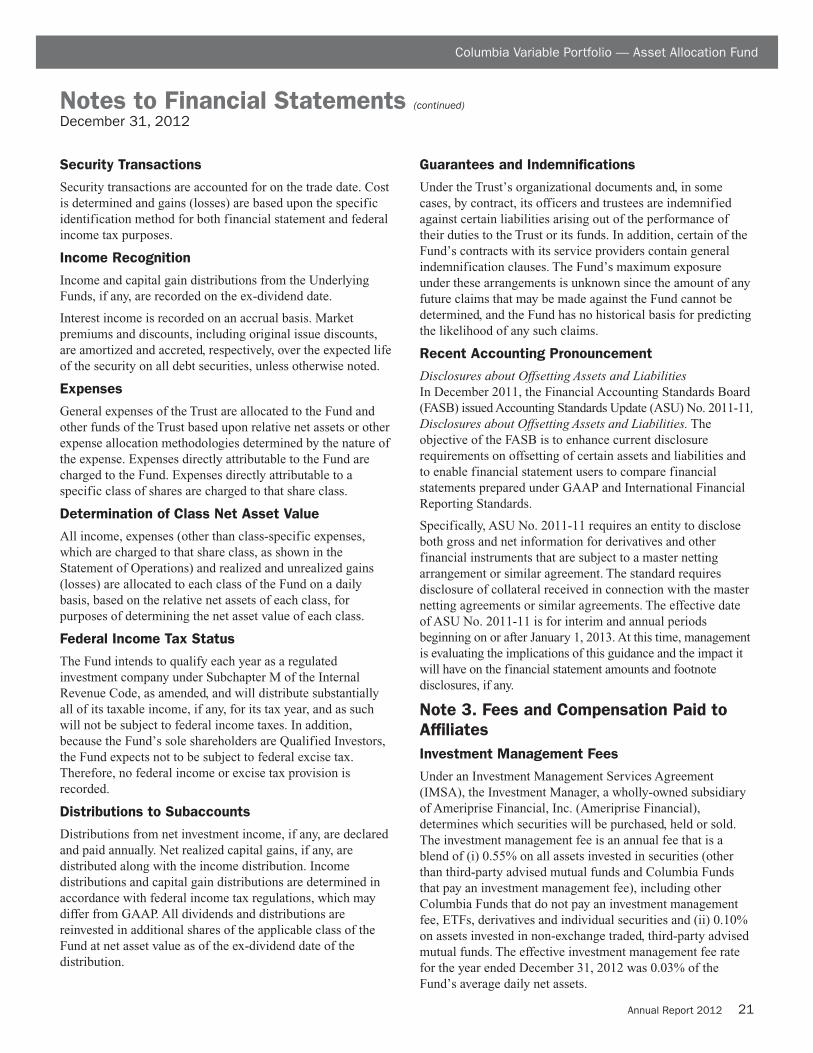
21Annual Report 2012
Notes to Financial Statements (continued)December 31, 2012
Security Transactions
Security transactions are accounted for on the trade date. Costis determined and gains (losses) are based upon the specificidentification method for both financial statement and federalincome tax purposes.
Income Recognition
Income and capital gain distributions from the UnderlyingFunds, if any, are recorded on the ex-dividend date.
Interest income is recorded on an accrual basis. Marketpremiums and discounts, including original issue discounts,are amortized and accreted, respectively, over the expected lifeof the security on all debt securities, unless otherwise noted.
Expenses
General expenses of the Trust are allocated to the Fund andother funds of the Trust based upon relative net assets or otherexpense allocation methodologies determined by the nature ofthe expense. Expenses directly attributable to the Fund arecharged to the Fund. Expenses directly attributable to aspecific class of shares are charged to that share class.
Determination of Class Net Asset Value
All income, expenses (other than class-specific expenses,which are charged to that share class, as shown in theStatement of Operations) and realized and unrealized gains(losses) are allocated to each class of the Fund on a dailybasis, based on the relative net assets of each class, forpurposes of determining the net asset value of each class.
Federal Income Tax Status
The Fund intends to qualify each year as a regulatedinvestment company under Subchapter M of the InternalRevenue Code, as amended, and will distribute substantiallyall of its taxable income, if any, for its tax year, and as suchwill not be subject to federal income taxes. In addition,because the Fund’s sole shareholders are Qualified Investors,the Fund expects not to be subject to federal excise tax.Therefore, no federal income or excise tax provision isrecorded.
Distributions to Subaccounts
Distributions from net investment income, if any, are declaredand paid annually. Net realized capital gains, if any, aredistributed along with the income distribution. Incomedistributions and capital gain distributions are determined inaccordance with federal income tax regulations, which maydiffer from GAAP. All dividends and distributions arereinvested in additional shares of the applicable class of theFund at net asset value as of the ex-dividend date of thedistribution.
Guarantees and Indemnifications
Under the Trust’s organizational documents and, in somecases, by contract, its officers and trustees are indemnifiedagainst certain liabilities arising out of the performance oftheir duties to the Trust or its funds. In addition, certain of theFund’s contracts with its service providers contain generalindemnification clauses. The Fund’s maximum exposureunder these arrangements is unknown since the amount of anyfuture claims that may be made against the Fund cannot bedetermined, and the Fund has no historical basis for predictingthe likelihood of any such claims.
Recent Accounting Pronouncement
Disclosures about Offsetting Assets and LiabilitiesIn December 2011, the Financial Accounting Standards Board(FASB) issued Accounting Standards Update (ASU) No. 2011-11,Disclosures about Offsetting Assets and Liabilities. Theobjective of the FASB is to enhance current disclosurerequirements on offsetting of certain assets and liabilities andto enable financial statement users to compare financialstatements prepared under GAAP and International FinancialReporting Standards.
Specifically, ASU No. 2011-11 requires an entity to discloseboth gross and net information for derivatives and otherfinancial instruments that are subject to a master nettingarrangement or similar agreement. The standard requiresdisclosure of collateral received in connection with the masternetting agreements or similar agreements. The effective dateof ASU No. 2011-11 is for interim and annual periodsbeginning on or after January 1, 2013. At this time, managementis evaluating the implications of this guidance and the impact itwill have on the financial statement amounts and footnotedisclosures, if any.
Note 3. Fees and Compensation Paid to
Affiliates
Investment Management Fees
Under an Investment Management Services Agreement(IMSA), the Investment Manager, a wholly-owned subsidiaryof Ameriprise Financial, Inc. (Ameriprise Financial),determines which securities will be purchased, held or sold.The investment management fee is an annual fee that is ablend of (i) 0.55% on all assets invested in securities (otherthan third-party advised mutual funds and Columbia Fundsthat pay an investment management fee), including otherColumbia Funds that do not pay an investment managementfee, ETFs, derivatives and individual securities and (ii) 0.10%on assets invested in non-exchange traded, third-party advisedmutual funds. The effective investment management fee ratefor the year ended December 31, 2012 was 0.03% of theFund’s average daily net assets.
Columbia Variable Portfolio — Asset Allocation Fund

22 Annual Report 2012
Notes to Financial Statements (continued)December 31, 2012
Administration Fees
Under an Administrative Services Agreement, the InvestmentManager serves as the Fund Administrator. The Fund pays theFund Administrator an annual fee for administration andaccounting services equal to 0.02% of the Fund’s averagedaily net assets.
Compensation of Board Members
Board members are compensated for their services to the Fundas disclosed in the Statement of Operations. The Trust’seligible Trustees may participate in a Deferred CompensationPlan (the Plan) which may be terminated at any time. Obligationsof the Plan will be paid solely out of the Fund’s assets.
Compensation of Chief Compliance Officer
The Board has appointed a Chief Compliance Officer to theFund in accordance with federal securities regulations. TheFund pays its pro-rata share of the expenses associated withthe Chief Compliance Officer. The Fund’s expenses for theChief Compliance Officer will not exceed $15,000 per year.
Transfer Agent Fees
The Fund has a Transfer Agency and Dividend DisbursingAgent Agreement with Columbia Management InvestmentServices Corp. (the Transfer Agent), an affiliate of theInvestment Manager and a wholly-owned subsidiary ofAmeriprise Financial. The annual fee rate under thisagreement is 0.06% of the Fund’s average daily net assets.The Transfer Agent also receives compensation from feesfor various shareholder services and reimbursements forcertain out-of-pocket fees.
Distribution Fees
The Fund has an agreement with the Distributor, an affiliate ofthe Investment Manager and a wholly-owned subsidiary ofAmeriprise Financial, for distribution services. Pursuant toRule 12b-1 under the 1940 Act, the Board has approved, andthe Fund has adopted, a distribution plan (the Plan) which setsthe distribution fees for the Fund. These fees are calculateddaily and are intended to compensate the Distributor forselling shares of the Fund. The Plan requires the payment of amonthly distribution fee to the Distributor at the maximumannual rate of 0.25% of the average daily net assets attributableto Class 2 shares of the Fund.
Expenses Waived/Reimbursed by the Investment
Manager and its Affiliates
The Investment Manager and certain of its affiliates havecontractually agreed to waive fees and/or reimburse expenses(excluding certain fees and expenses described below),through April 30, 2013, unless sooner terminated at the solediscretion of the Board, so that the Fund’s net operating
expenses, after giving effect to fees waived/expensesreimbursed and any balance credits and/or overdraft chargesfrom the Fund’s custodian, do not exceed the following annualrates as a percentage of the class’ average daily net assets:
Class 1 0.13%
Class 2 0.38
Under the agreement governing these fee waivers and/or expensereimbursement arrangements, the following fees and expensesare excluded from the waiver/reimbursement commitment, andtherefore will be paid by the Fund, if applicable: taxes (includingforeign transaction taxes), expenses associated with investmentsin affiliated and non-affiliated pooled investment vehicles(including mutual funds and exchange traded funds), transactioncosts and brokerage commissions, costs related to any securitieslending program, dividend expenses associated with securitiessold short, inverse floater program fees and expenses, transactioncharges and interest on borrowed money, interest, extraordinaryexpenses and any other expenses the exclusion of which isspecifically approved by the Board. This agreement may bemodified or amended only with approval from all parties.
Note 4. Federal Tax Information
The timing and character of income and capital gaindistributions are determined in accordance with income taxregulations, which may differ from GAAP because oftemporary or permanent book to tax differences.
At December 31, 2012, these differences are primarily due todiffering treatment for capital loss carryforwards,deferral/reversal of wash sale losses, Trustees’ deferredcompensation, foreign currency transactions, andre-characterization of distributions from investments. To theextent these differences are permanent, reclassifications aremade among the components of the Fund’s net assets in theStatement of Assets and Liabilities. Temporary differences donot require reclassifications. In the Statement of Assets andLiabilities the following reclassifications were made:
Undistributed net investment income $312,151
Accumulated net realized loss (312,150)
Paid-in capital (1)
Net investment income and net realized gains (losses), asdisclosed in the Statement of Operations, and net assets werenot affected by this reclassification.
The tax character of distributions paid during the yearsindicated was as follows:
Year Ended December 31, 2012 2011
Ordinary income $2,171,357 $2,827,836
Long-term capital gains — —
Total $2,171,357 $2,827,836
Columbia Variable Portfolio — Asset Allocation Fund

23Annual Report 2012
Notes to Financial Statements (continued)December 31, 2012
Short-term capital gain distributions, if any, are consideredordinary income distributions for tax purposes.
At December 31, 2012, the components of distributableearnings on a tax basis were as follows:
Undistributed ordinary income $2,231,186
Undistributed accumulated long-term gain —
Accumulated realized losses (4,317,053)
Unrealized appreciation 4,142,320
At December 31, 2012, the cost of investments for federalincome tax purposes was $91,842,047 and the aggregate grossunrealized appreciation and depreciation based on that cost was:
Unrealized appreciation $4,819,801
Unrealized depreciation (677,481)
Net unrealized appreciation $4,142,320
The following capital loss carryforward, determined atDecember 31, 2012, may be available to reduce taxableincome arising from future net realized gains on investments,if any, to the extent permitted by the Internal Revenue Code:
Year of Expiration Amount
2017 $4,317,053
Total $4,317,053
For the year ended December 31, 2012, $2,050,442 of capitalloss carryforward was utilized.
Management of the Fund has concluded that there are nosignificant uncertain tax positions that would requirerecognition in the financial statements. However,management’s conclusion may be subject to review andadjustment at a later date based on factors including, but notlimited to, new tax laws, regulations, and administrativeinterpretations (including relevant court decisions). Generally,the Fund’s federal tax returns for the prior three fiscal yearsremain subject to examination by the Internal RevenueService.
Note 5. Portfolio Information
The cost of purchases and proceeds from sales of securities,excluding short-term obligations, aggregated to $51,139,006and $65,620,739, respectively, for the year ended December 31,2012, of which $0 and $31,975, respectively, were U.S.government securities.
Note 6. Shareholder Concentration
At December 31, 2012, two unaffiliated shareholder accountsowned an aggregate of 76.3% of the outstanding shares of theFund. The Fund has no knowledge about whether any portionof those shares was owned beneficially by such accounts.
Subscription and redemption activity by concentrated accountsmay have a significant effect on the operations of the Fund.
Note 7. Line of Credit
The Fund has entered into a revolving credit facility with asyndicate of banks led by JPMorgan Chase Bank N.A.whereby the Fund may borrow for the temporary funding ofshareholder redemptions or for other temporary or emergencypurposes. The credit facility agreement, as amended, which isa collective agreement between the Fund and certain otherfunds managed by the Investment Manager, severally and notjointly, permits collective borrowings up to $500 million.Interest is charged to each participating fund based on itsborrowings at a rate equal to the higher of (i) the overnightfederal funds rate plus 1.00% or (ii) the one-month LIBORrate plus 1.00%. Each borrowing under the credit facilitymatures no later than 60 days after the date of borrowing. TheFund also pays a commitment fee equal to its pro rata share ofthe amount of the credit facility at a rate of 0.08% per annum.
The Fund had no borrowings during the year endedDecember 31, 2012.
Note 8. Subsequent Events
Management has evaluated the events and transactions thathave occurred through the date the financial statements wereissued and noted no items requiring adjustment of thefinancial statements or additional disclosure.
Note 9. Information Regarding Pending
and Settled Legal Proceedings
In December 2005, without admitting or denying theallegations, American Express Financial Corporation (AEFC,which is now known as Ameriprise Financial, Inc. (AmeripriseFinancial)) entered into settlement agreements with theSecurities and Exchange Commission (SEC) and MinnesotaDepartment of Commerce (MDOC) related to market timingactivities. As a result, AEFC was censured and ordered tocease and desist from committing or causing any violations ofcertain provisions of the Investment Advisers Act of 1940, theInvestment Company Act of 1940, and various Minnesotalaws. AEFC agreed to pay disgorgement of $10 million andcivil money penalties of $7 million. AEFC also agreed to retainan independent distribution consultant to assist in developing aplan for distribution of all disgorgement and civil penaltiesordered by the SEC in accordance with various undertakingsdetailed at www.sec.gov/litigation/admin/ia-2451.pdf.Ameriprise Financial and its affiliates have cooperated withthe SEC and the MDOC in these legal proceedings, and havemade regular reports to the funds’ Boards of Trustees.
Ameriprise Financial and certain of its affiliates havehistorically been involved in a number of legal, arbitration and
Columbia Variable Portfolio — Asset Allocation Fund

24 Annual Report 2012
Notes to Financial Statements (continued)December 31, 2012
regulatory proceedings, including routine litigation, classactions, and governmental actions, concerning matters arisingin connection with the conduct of their business activities.Ameriprise Financial believes that the Funds are not currentlythe subject of, and that neither Ameriprise Financial nor any ofits affiliates are the subject of, any pending legal, arbitration orregulatory proceedings that are likely to have a materialadverse effect on the Funds or the ability of AmeripriseFinancial or its affiliates to perform under their contracts withthe Funds. Ameriprise Financial is required to make 10-Q,10-K and, as necessary, 8-K filings with the Securities andExchange Commission on legal and regulatory matters thatrelate to Ameriprise Financial and its affiliates. Copies ofthese filings may be obtained by accessing the SEC website atwww.sec.gov.
There can be no assurance that these matters, or the adversepublicity associated with them, will not result in increasedfund redemptions, reduced sale of fund shares or other adverseconsequences to the Funds. Further, although we believeproceedings are not likely to have a material adverse effect onthe Funds or the ability of Ameriprise Financial or its affiliatesto perform under their contracts with the Funds, theseproceedings are subject to uncertainties and, as such, we areunable to estimate the possible loss or range of loss that mayresult. An adverse outcome in one or more of theseproceedings could result in adverse judgments, settlements,fines, penalties or other relief that could have a materialadverse effect on the consolidated financial condition orresults of operations of Ameriprise Financial.
Columbia Variable Portfolio — Asset Allocation Fund

Annual Report 2012 25
To the Trustees of Columbia Funds Variable Insurance Trust and the Shareholders of
Columbia Variable Portfolio — Asset Allocation Fund
In our opinion, the accompanying statement of assets and liabilities, including the portfolio of investments, and the relatedstatements of operations and of changes in net assets and the financial highlights present fairly, in all material respects, thefinancial position of Columbia Variable Portfolio — Asset Allocation Fund (the “Fund”) (a series of Columbia FundsVariable Insurance Trust) at December 31, 2012, the results of its operations, the changes in its net assets, and the financialhighlights for each of the periods indicated, in conformity with accounting principles generally accepted in the United Statesof America. These financial statements and financial highlights (hereafter referred to as “financial statements”) are theresponsibility of the Fund’s management. Our responsibility is to express an opinion on these financial statements based onour audit. We conducted our audit of these financial statements in accordance with the standards of the Public CompanyAccounting Oversight Board (United States). Those standards require that we plan and perform the audit to obtainreasonable assurance about whether the financial statements are free of material misstatement. An audit includes examining,on a test basis, evidence supporting the amounts and disclosures in the financial statements, assessing the accountingprinciples used and significant estimates made by management, and evaluating the overall financial statement presentation.We believe that our audits, which included confirmation of securities at December 31, 2012 by correspondence with thecustodian, transfer agent and brokers, provides a reasonable basis for our opinion.
PricewaterhouseCoopers LLPMinneapolis, MinnesotaFebruary 19, 2013
Columbia Variable Portfolio — Asset Allocation Fund
Report of Independent Registered Public Accounting Firm

26 Annual Report 2012
The Fund hereby designates the following tax attributes for the fiscal year ended December 31, 2012.
Tax Designations:
Dividends Received Deduction . . . . . . . . . . . . . . . . . . . . . . . . . . . . . . . . . . . . . 20.06%
Dividend Received Deduction. The percentage of ordinary income dividends paid during the fiscal year that qualifies forthe corporate dividend received deduction.
Federal Income Tax Information(Unaudited)
Columbia Variable Portfolio — Asset Allocation Fund

Trustees and Officers
Columbia Variable Portfolio — Asset Allocation Fund
27Annual Report 2012
The Trustees serve terms of indefinite duration. The names, addresses and birth years of the Trustees and Officers of theFunds in Columbia Funds Variable Insurance Trust, the year each was first elected or appointed to office, their principalbusiness occupations during at least the last five years, the number of Funds overseen by each Trustee and otherdirectorships they hold are shown below. Each officer listed below serves as an officer of each Fund in Columbia FundsVariable Insurance Trust.
Independent Trustees
Name, Address and Year of Birth, Principal Occupation(s) During Past Five Years, Number of Funds in Columbia
Position with Funds, Year First Funds Complex Overseen by Trustee, Other Directorships Held
Elected or Appointed to Office
Independent consultant since 2010; Co-Founder of Baringo Capital LLC (private equity) from 1997 to2008; CEO of Crystal River Capital, Inc. (real estate investment trust) from 2003 to 2010; Oversees52; Jackson Hewitt Tax Service Inc. (tax preparation services from 2004 to 2011); CelgeneCorporation (global biotechnology company); Student Loan Corporation (student loan provider from2005 to 2010); Celgene Corporation (global biotechnology company); The Helios Funds andBrookfield Funds (closed-end funds); Crystal River Capital, Inc. from 2005 to 2010; ParsonsBrinckerhoff from 1995 to 2008; and Apex Silver Mines Ltd. from 2007 to 2009
Rodman L. Drake (Born 1943)c/o Columbia ManagementInvestment Advisers, LLC 225 Franklin Street Boston, MA 02110 Trustee (since 1994) and Chairman of the Board (since 2009)
Independent business executive since May 2006; Executive Vice President — Strategy of UnitedAirlines from December 2002 to May 2006; President of UAL Loyalty Services (airline marketingcompany) from September 2001 to December 2002; Executive Vice President and Chief FinancialOfficer of United Airlines from July 1999 to September 2001. Oversees 52; Nash Finch Company (fooddistributor); Aircastle Limited (aircraft leasing); and SeaCube Container Leasing Ltd. (container leasing)
Douglas A. Hacker (Born 1955)c/o Columbia ManagementInvestment Advisers, LLC 225 Franklin Street Boston, MA 02110 Trustee (since 1996)
Senior Vice President, General Counsel and Corporate Secretary, ConocoPhillips (integrated energycompany) since September 2007; Deputy General Counsel — Corporate Legal Services,ConocoPhillips from August 2006 to August 2007; Partner, Zelle, Hofmann, Voelbel, Mason & GetteLLP (law firm) from March 2005 to July 2006; Adjunct Professor of Law, Northwestern University fromSeptember 2004 to June 2006; Director, UAL Corporation (airline) from February 2006 to July 2006;Chief Administrative Officer and Senior Vice President, Kmart Holding Corporation (consumer goods)from September 2003 to March 2004. Oversees 52; None
Janet Langford Kelly (Born 1957)c/o Columbia ManagementInvestment Advisers, LLC 225 Franklin Street Boston, MA 02110 Trustee (since 1996)
Senior Vice President, Partner and Director of Marketing, Wellington Management Company, LLP(investment adviser) from 1997 to 2010; Chair, Wellington Management Investment Portfolios(commingled non-U.S. investment pools) from 2007 to 2010; Director, Wellington Trust Company, NAand other Wellington affiliates from 1997 to 2010. Oversees 52; None
Nancy T. Lukitsh (Born 1956)c/o Columbia ManagementInvestment Advisers, LLC 225 Franklin Street Boston, MA 02110 Trustee (since 2011)
Partner, Park Avenue Equity Partners (private equity) since February 1999; Dean and Professor,College of Business and Management, University of Maryland from 1992 to 1996. Oversees 52;DynaVox Inc. (speech creation); Lee Enterprises (print media); WR Hambrecht + Co. (financial serviceprovider) from 2000 to 2012; BlackRock Kelso Capital Corporation (investment company)
William E. Mayer (Born 1940)c/o Columbia ManagementInvestment Advisers, LLC 225 Franklin Street Boston, MA 02110 Trustee (since 1994)
Retired. Chief Executive Officer, Federal Home Loan Mortgage Corporation, from 2008 to 2009;Senior Adviser, Global Financial Services Group, Carlyle Group, Inc., from 2007 to 2008; ViceChairman and Chief Financial Officer, U.S. Bancorp, from 1993 to 2007. Oversees 52; CIT Group Inc.(commercial and consumer finance); eBay Inc. (online trading community); MBIA Inc. (financial serviceprovider); E.W. Scripps Co. (print and television media), Building Materials Holding Corp. (buildingmaterials and construction services); and University of Oklahoma Foundation.
David M. Moffett (Born 1952)c/o Columbia ManagementInvestment Advisers, LLC 225 Franklin Street Boston, MA 02110 Trustee (since 2011)
Retired Professor Emeritus, University of Washington, since 2011; Professor of Economics, Universityof Washington from January 1976 to 2011; Ford and Louisa Van Voorhis Professor of PoliticalEconomy, University of Washington from 1993 to 2011; Adjunct Professor of Statistics, University ofWashington from 1980 to 2011; Associate Editor, Journal of Money Credit and Banking from 1993 to2008; consultant on econometric and statistical matters. Oversees 52; None
Charles R. Nelson (Born 1942)c/o Columbia ManagementInvestment Advisers, LLC 225 Franklin Street Boston, MA 02110 Trustee (since 1981)
President, Saint Michael’s College, since August 2007; Director or Trustee of several non-profitorganizations, including Fletcher Allen Health Care, Inc.; University Professor, Boston College fromNovember 2005 to August 2007; Academic Vice President and Dean of Faculties, Boston Collegefrom August 1999 to October 2005. Oversees 52; Liberty All-Star Equity Fund and Liberty All-StarGrowth Fund (closed-end funds)
John J. Neuhauser (Born 1943)c/o Columbia ManagementInvestment Advisers, LLC 225 Franklin Street Boston, MA 02110 Trustee (since 1984)

Columbia Variable Portfolio — Asset Allocation Fund
Trustees and Officers (continued)
28 Annual Report 2012
Independent Trustees (continued)
Name, Address and Year of Birth, Principal Occupation(s) During Past Five Years, Number of Funds in Columbia
Position with Funds, Year First Funds Complex Overseen by Trustee, Other Directorships Held
Elected or Appointed to Office
Interested Trustee
Name, Address and Year of Birth, Principal Occupation(s) During Past Five Years, Number of Funds in Columbia
Position with Funds, Year First Funds Complex Overseen by Trustee, Other Directorships Held
Elected or Appointed to Office
The Statement of Additional Information includes additional information about the Trustees of the Funds and is available,without charge, upon request by calling 1-800-345-6611.
The Board has appointed officers who are responsible for day-to-day business decisions based on policies it has established.The officers serve at the pleasure of the Board. In addition to Mr. Truscott, who is Senior Vice President, the Funds’ otherofficers are:
Officers
Name, Year of Birth and Address Principal Occupation(s) During the Past Five Years
Partner, Perkins Coie LLP (law firm). Oversees 52; NonePatrick J. Simpson (Born 1944)c/o Columbia ManagementInvestment Advisers, LLC 225 Franklin Street Boston, MA 02110 Trustee (since 2000)
Retired. General Manager — Global Education Industry from 1994 to 1997, President — ApplicationSystems Division from 1991 to 1994, Chief Financial Officer — US Marketing & Services from 1988to 1991, and Chief Information Officer from 1987 to 1988, IBM Corporation (computer andtechnology). Oversees 52; Enesco Group, Inc. (producer of giftware and home and garden decorproducts) from 2001 to 2006
Anne-Lee Verville (Born 1945)c/o Columbia ManagementInvestment Advisers, LLC 225 Franklin Street Boston, MA 02110 Trustee (since 1998)
President, Columbia Management Investment Advisers, LLC since February 2012, (previouslyPresident, Chairman of the Board and Chief Investment Officer, 2001-April 2010); Chief ExecutiveOfficer, Global Asset Management, Ameriprise Financial, Inc. since September 2012 (previously ChiefExecutive Officer, U.S. Asset Management & President, Annuities, May 2010-September 2012 andPresident — U.S. Asset Management and Chief Investment Officer, 2005-April 2010); President andChief Executive Officer, Ameriprise Certificate Company 2006-August 2012; Chief Executive Officer,Columbia Management Investment Distributors, Inc. since February 2012, (previously Chairman of theBoard and Chief Executive Officer, 2006-April 2010); Chairman of the Board and Chief ExecutiveOfficer, RiverSource Distributors, Inc. since 2006. Oversees 208; Columbia Funds Board.
William F. Truscott (born 1960)53600 Ameriprise Financial CenterMinneapolis, MN 55474Senior Vice President (since 2012)
Senior Vice President and General Manager — Mutual Fund Products, Columbia ManagementInvestment Advisers, LLC since May 2010; President, Columbia Funds, since 2009, and RiverSourceFunds, since May 2010 (previously Senior Vice President and Chief Financial Officer, Columbia Funds,from June 2008 to January 2009, Treasurer, Columbia Funds, from October 2003 to May 2008, andsenior officer of various other affiliated funds since 2000); Managing Director, Columbia ManagementAdvisors, LLC from December 2004 to April 2010.
J. Kevin Connaughton (Born 1964)225 Franklin Street Boston, MA 02110 President (since 2009)
Vice President, Columbia Management Investment Advisers, LLC since May 2010; Managing Directorof Fund Administration, Columbia Management Advisors, LLC, from September 2004 to April 2010;senior officer of Columbia Funds and affiliated funds since 2002.
Michael G. Clarke (Born 1969)225 Franklin Street Boston, MA 02110 Treasurer (since 2011) and ChiefFinancial Officer (since 2009)
Senior Vice President, Chief Legal Officer and Assistant Secretary, Columbia Management InvestmentAdvisers, LLC since June 2005; Vice President and Lead Chief Counsel — Asset Management,Ameriprise Financial, Inc. since May 2010 (previously Vice President and Chief Counsel — AssetManagement, from 2005 to April 2010); Vice President, Chief Counsel and Assistant Secretary,Columbia Management Investment Distributors, Inc. since 2008; Vice President, General Counsel andSecretary, Ameriprise Certificate Company since 2005; Chief Counsel, RiverSource Distributors, Inc.since 2006; Vice President, General Counsel and Secretary, RiverSource Funds sinceDecember 2006; Senior Vice President, Secretary and Chief Legal Officer, Columbia Funds, sinceMay 2010.
Scott R. Plummer (Born 1959)5228 Ameriprise Financial Center Minneapolis, MN 55474 Senior Vice President, AssistantSecretary and Chief Legal Officer(since 2010)

Columbia Variable Portfolio — Asset Allocation Fund
Trustees and Officers (continued)
Officers (continued)
Name, Year of Birth and Address Principal Occupation(s) During the Past Five Years
Thomas P. McGuire (Born 1972)225 Franklin Street Boston, MA 02110 Chief Compliance Officer(since 2012)
Vice President — Asset Management Compliance, Columbia Management Investment Advisers, LLCsince 2010; Chief Compliance Officer, Ameriprise Certificate Company, since September 2010;Compliance Executive, Bank of America, 2005-2010.
Colin Moore (Born 1958)225 Franklin Street Boston, MA 02110 Senior Vice President (since 2010)
Director and Chief Investment Officer, Columbia Management Investment Advisers, LLC sinceMay 2010; Manager, Managing Director and Chief Investment Officer of Columbia ManagementAdvisors, LLC from 2007 to April 2010; Head of Equities, Columbia Management Advisors, LLC from2002 to 2007.
Amy Johnson (Born 1965)5228 Ameriprise Financial Center Minneapolis, MN 55474 Vice President (since 2010)
Senior Vice President and Chief Operating Officer, Columbia Management Investment Advisers, LLCsince May 2010 (previously Chief Administrative Officer, from 2009 until April 2010, Vice President —Asset Management and Trust Company Services, from 2006 to 2009, and Vice President —Operations and Compliance from 2004 to 2006).
Joseph F. DiMaria (Born 1968)225 Franklin Street Boston, MA 02110 Vice President (since 2011) andChief Accounting Officer (since 2008)
Vice President, Mutual Fund Administration, Columbia Management Investment Advisers, LLC, sinceMay 2010; Director of Fund Administration, Columbia Management Advisors, LLC from January 2006to April 2010; Head of Tax/Compliance and Assistant Treasurer, Columbia Management Advisors,LLC, from November 2004 to December 2005.
Stephen T. Welsh (born 1957)225 Franklin Street Boston, MA 02110 Vice President (since 2006)
President and Director, Columbia Management Investment Services Corp. since May 2010; Presidentand Director, Columbia Management Services, Inc. from July 2004 to April 2010; Managing Director,Columbia Management Distributors, Inc. from August 2007 to April 2010.
Paul D. Pearson (born 1956)10468 Ameriprise Financial Center Minneapolis, MN 55474 Vice President and AssistantTreasurer (since 2011)
Vice President, Investment Accounting, Columbia Management Investment Advisers, LLC, sinceMay 2010; Vice President, Managed Assets, Investment Accounting, Ameriprise FinancialCorporation.
Paul B. Goucher (born 1968)5228 Ameriprise Financial Center Minneapolis, MN 55474 Vice President and AssistantSecretary (since 2010)
Vice President and Lead Chief Counsel, Ameriprise Financial, Inc. since November 2008 andJanuary 2013, respectively (formerly, Chief Counsel from January 2010-January 2013 and GroupCounsel from November 2008-January 2010); Director, Managing Director and General Counsel,J. & W. Seligman & Co. Incorporated, July 2008-November 2008 (previously, Managing Director andAssociate General Counsel, January 2005-July 2008).
Christopher O. Petersen (born 1970)5228 Ameriprise Financial Center Minneapolis, MN 55474 Vice President (since 2010) andSecretary (since 2011)
Vice President and Chief Counsel, Ameriprise Financial since January 2010 (formerly Vice Presidentand Group Counsel or Counsel from April 2004 to January 2010); Assistant Secretary of RiverSourceFunds since January 2007; officer of Columbia Funds and affiliated funds since 2007.
Michael E. DeFao (born 1968)225 Franklin StreetBoston, MA 02110Vice President and AssistantSecretary (since 2011)
Vice President and Chief Counsel, Ameriprise Financial since May 2010; Associate General Counsel,Bank of America from June 2005 to April 2010.
Annual Report 2012 29

30 Annual Report 2012
This page intentionally left blank.

31Annual Report 2012
This page intentionally left blank.

32 Annual Report 2012
This page intentionally left blank.

33Annual Report 2012
The policy of the Board is to vote the proxies of the companies in which each fund holds investments consistent with theprocedures as stated in the Statement of Additional Information (SAI). You may obtain a copy of the SAI without charge bycalling 800.345.6611; contacting your financial intermediary; or searching the website of the Securities and ExchangeCommission (SEC) at sec.gov. Information regarding how each fund voted proxies relating to portfolio securities is filedwith the SEC by August 31 for the most recent 12-month period ending June 30 of that year, and is available without chargeby visiting columbiamanagement.com; or searching the website of the SEC at sec.gov.
Each fund files a complete schedule of portfolio holdings with the SEC for the first and third quarters of each fiscal year onForm N-Q. Each fund’s Form N-Q is available on the SEC’s website at sec.gov and may be reviewed and copied at theSEC’s Public Reference Room in Washington, D.C. Information on the operation of the Public Reference Room may beobtained by calling 800.SEC.0330. Each fund’s complete schedule of portfolio holdings, as filed on Form N-Q, can also beobtained without charge, upon request, by calling 800.345.6611.
Important Information About This Report
Columbia Variable Portfolio — Asset Allocation Fund

This information is for use with concurrent or prior delivery of a fund prospectus. Please carefully consider theinvestment objectives, risks, charges and expenses of any variable fund and its related variable contract beforeinvesting. For variable fund and variable contract prospectuses, which contain this and other importantinformation, contact your financial advisor or insurance representative. Please read the prospectus carefullybefore you invest. The Fund is distributed by Columbia Management Investment Distributors, Inc., member FINRA,and managed by Columbia Management Investment Advisers, LLC. © 2013 Columbia Management Investment Advisers, LLC. All rights reserved.
C-1471 C (3/13)
Columbia Variable Portfolio — Asset Allocation FundP.O. Box 8081Boston, MA 02266-8081

Annual ReportDecember 31, 2012
Columbia Variable Portfolio – Large Cap Growth Fund
Please remember that you may not buy (nor will you own) shares of the Fund directly. You invest by buying a variable annuitycontract or life insurance policy and allocating your purchase payments to the variable subaccount or variable account (thesubaccounts) that invests in the Fund. Please contact your financial advisor or insurance representative for more information.


Columbia Variable Portfolio – Large Cap Growth Fund
Table of Contents
Performance Overview ................................................ 2
Manager Discussion of Fund Performance........................ 4
Understanding Your Fund’s Expenses ............................. 6
Portfolio of Investments .............................................. 7
Statement of Assets and Liabilities ................................11
Statement of Operations .............................................13
Statement of Changes in Net Assets ..............................14
Financial Highlights....................................................16
Notes to Financial Statements ......................................19
Report of Independent RegisteredPublic Accounting Firm ................................................26
Trustees and Officers .................................................27
Important Information About This Report..........................33
The views expressed in this report reflectthe current views of the respective parties.These views are not guarantees of futureperformance and involve certain risks,uncertainties and assumptions that aredifficult to predict, so actual outcomes andresults may differ significantly from theviews expressed. These views are subjectto change at any time based uponeconomic, market or other conditions andthe respective parties disclaim anyresponsibility to update such views. Theseviews may not be relied on as investmentadvice and, because investment decisionsfor a Columbia Fund are based onnumerous factors, may not be relied on asan indication of trading intent on behalf ofany particular Columbia Fund. Referencesto specific securities should not beconstrued as a recommendation orinvestment advice.
Annual Report 2012

Columbia Variable Portfolio – Large Cap Growth Fund
Performance Overview
Performance Summary> Columbia Variable Portfolio — Large Cap Growth Fund (the Fund) Class 3 shares returned 20.15% for the 12 months ended
December 31, 2012.
> The Fund outperformed its benchmark, the Russell 1000 Growth Index, which gained 15.26% for the same 12-month period.
> Strong stock selection across multiple industry sectors contributed to the Fund’s outperformance of its benchmark.
Average Annual Total Returns (%) (for period ended December 31, 2012)
Inception 1 Year 5 Years 10 Years
Class 1* 05/03/10 20.27 0.82 5.47
Class 2* 05/03/10 20.06 0.61 5.28
Class 3 09/15/99 20.15 0.77 5.44
Russell 1000 Growth Index 15.26 3.12 7.52
Performance data quoted represents past performance and current performance may be lower or higher. Past performance is no guarantee offuture results. The investment return and principal value will fluctuate so that shares, when redeemed, may be worth more or less than theoriginal cost. For current month-end performance information, please contact your insurance company.
Performance results reflect the effect of any fee waivers or reimbursements of fund expenses by Columbia Management Investment Advisers,LLC and/or any of its affiliates. Absent these fee waivers or expense reimbursement arrangements, performance results would have been lower.
Investment earnings, if any, are tax-deferred until distributed to shareholders, at which time taxes may become due. Total return performanceincludes changes in share price and assumes reinvestment of dividends and capital gains, if any. Performance results reflect the effect of all fundexpenses, but do not include any fees and expenses imposed under your variable annuity contract and/or variable life insurance policy orqualified pension or retirement plan. If performance results included the effect of these additional charges, they would be lower.
* The returns shown for periods prior to the share class inception date (including returns for the Life of the Fund, if shown, which are since Fundinception) include the returns of the Fund’s oldest share class. These returns are adjusted to reflect any higher class-related operating expensesof the newer share classes, as applicable. Please visit columbiamanagement.com/variable-products/appended-performance for more information.
The Russell 1000 Growth Index, an unmanaged index, measures the performance of those Russell 1000 Index companies with higher price-to-bookratios and higher forecasted growth values.
Indices are not available for investment, are not professionally managed and do not reflect sales charges, fees, brokerage commissions, taxes orother expenses of investing. Securities in the Fund may not match those in an index.
2 Annual Report 2012

Columbia Variable Portfolio – Large Cap Growth Fund
Performance Overview (continued)
Performance of a Hypothetical $10,000 Investment (January 1, 2003 — December 31, 2012)
$20,651
$16,991
0
$20,000
$25,000
15,000
10,000
5,000
Columbia Variable Portfolio — Large Cap Growth Fund Class 3 ($16,991)
Russell 1000 Growth Index ($20,651)
12/1212/1112/1012/0912/0812/0712/0612/0512/0412/0301/01/03
The chart above shows the change in value of a hypothetical $10,000 investment in Class 3 shares of Columbia Variable Portfolio — Large CapGrowth Fund during the stated time period, and does not reflect the deduction of taxes, if any, that a shareholder may pay on Fund distributions or onthe redemption of Fund shares. The returns also do not reflect fees and expenses imposed under your variable annuity contract and/or variable lifeinsurance policy or qualified pension or retirement plan, if any.
Annual Report 2012 3

Columbia Variable Portfolio – Large Cap Growth Fund
Manager Discussion of Fund Performance
Portfolio Management
John Wilson, CFA
Peter Deininger, CFA, CAIA
Top Ten Holdings (%)(at December 31, 2012)
Apple, Inc. 5.8
Google, Inc., Class A 4.3
QUALCOMM, Inc. 2.9
Oracle Corp. 2.8
Gilead Sciences, Inc. 2.4
eBay, Inc. 2.3
Amazon.com, Inc. 2.2
Honeywell International, Inc. 2.2
EMC Corp. 2.1
Mastercard, Inc., Class A 2.0
Percentages indicated are based upon totalinvestments (excluding Money Market Funds).
For further detail about these holdings, pleaserefer to the section entitled “Portfolio ofInvestments.”
Fund holdings are as of the date given, aresubject to change at any time, and are notrecommendations to buy or sell any security.
Columbia Variable Portfolio — Large Cap Growth Fund (the Fund) Class 3 sharesreturned 20.15% for the 12 months ended December 31, 2012. The Fundoutperformed its benchmark, the Russell 1000 Growth Index, which gained 15.26%for the same 12-month period. Strong stock selection across multiple industrysectors contributed to the Fund’s outperformance of its benchmark.
Stock Selection Across Sectors Led to RelativeOutperformanceThe Fund outperformed its benchmark against the backdrop of a positively trendingequity market. Though investor sentiment frequently fluctuated between desiringand avoiding risk, we began to see more discrimination based on individual stockattributes. Our investment process is very much focused on stock selection, ratherthan market timing or sector bets, so 2012 was the kind of equity market where wewould expect the Fund to perform well and it did.
The breadth of the Fund’s performance was particularly rewarding to us. The Fundoutperformed its benchmark in nine of 12 months and seven of the 10 marketsectors where we invest. Positioning in the consumer discretionary, informationtechnology, health care, consumer staples and industrials sectors had the mostsignificant positive effects on the Fund’s relative performance.
Within consumer discretionary, outperformance was driven by overweights andstock selection in three industry groups: internet retail, specialty retail and media.The Fund benefited from holdings of on-line travel companies Expedia andPriceline, which increased their share of the travel industry’s on-line bookings.Amazon.com was another strong performer due to its broad-based on-line retailpresence and greater appreciation of the company’s expansion into the separatebusiness of cloud computing services. Specialty retailers that added to relativereturn included Home Depot, which benefited from the housing recovery, and TJX,operator of TJ Maxx and other retailers, which benefited from solid execution andmarket share gains in the discount retail segment. Media giant Comcast wasanother notable contributor as fears about internet television competition seem tohave been premature.
Information technology performance was largely driven by the IT services, internetand computing industries. Having limited exposure to semiconductors was alsoadvantageous. Individual contributor eBay was able to stabilize and reaccelerate itscore marketplace business while also benefiting from momentum in its PayPal unit.Another contributor, Teradata, provides computer systems and software that letcompanies analyze tremendous amounts of data to better manage their businesses.
There were some negatives for the Fund within technology. Positioning in thecommunications equipment, electrical equipment and software industries modestlydetracted from relative return. The Fund’s position in Cisco Systems and beingunderweight in Apple relative to the benchmark also detracted. We prematurelyanticipated a positive inflection in Cisco’s business, while with Apple, we wereearly in predicting decelerating growth and a narrowing innovation window.Though Apple’s deceleration did not materialize during the Fund’s fiscal year, wehave since seen signs of it and think it could continue.
The Fund benefited from strong performance from a number of health caresegments, including pharmaceuticals, biotechnology and health care equipment.Though it is usually difficult to find compelling growth opportunities in consumerstaples, our choice of beverage makers and food and staples retailers had afavorable effect. Within industrials, fourth quarter outperformance from
4 Annual Report 2012

Columbia Variable Portfolio – Large Cap Growth Fund
Manager Discussion of Fund Performance (continued)
commercial services stocks and positioning in logistics, road and railroad stockspositively affected performance.
Financials and Energy UnderperformedTwo smaller sectors within the benchmark and the portfolio — financials andenergy — had minimal negative effects on relative performance. In the financialssector, an underweight in real estate investment trusts (REITs) wasdisadvantageous. We believe REITs lack attractive growth and risk/rewardcharacteristics, but they performed well as investors sought yield opportunitiesoutside fixed income. In energy, a positive contribution from ContinentalResources was offset by Halliburton, where unexpectedly higher North Americancosts seemed to overshadow an improved international picture, leading todownward earnings revisions.
Modest Sector Changes Favored IndustrialsThere were no meaningful positioning shifts or strategy changes as we continued tofocus on individual stock selection. Sector weightings changed modestly, based onwhere we found opportunities. In the second half of the year, we slightly trimmedthe Fund’s consumer discretionary allocation, where reductions in luxury goodsproviders, apparel and restaurant/leisure stocks were partly offset by an increase inspecialty retailers.
We also slightly reduced technology by lowering exposure to semiconductorcompanies and mega-cap services and software companies. We trimmedsemiconductors because of lackluster demand and excess inventory and we believe wefound more attractive growth opportunities away from the largest technology names.
We increased the industrials weighting in the second half, with increasedallocations to aerospace, electrical equipment and commercial services where, inour opinion, valuations started to more fully reflect cyclical growth concerns andwe saw greater opportunity for earnings to rise in 2013.
Opportunity in Quality Growth CompaniesWe are currently encouraged by recent economic signs, including a seeminglyimproving U.S. housing market and a rebound in China’s growth. However, we arealso mindful of potential turbulence, such as Washington’s political stalemate andimpending fiscal decisions, which could stall the nascent economic recovery andtemper enthusiasm for equities. We are also watching the Eurozone situation,which seems to ebb and flow without a comprehensive resolution, and tensions inthe Middle East and Asia.
In spite of these uncertainties, we see opportunity in quality growth companies. Weare focused on owning growth companies that are current or emerging leaders in theirindustries. Our baseline is to seek companies supported by healthy balance sheets,capable management teams and solid risk/reward profiles. We then try to identifycompanies that are also either increasing their global reach, in the midst of strongproduct cycles or able to expand their market share. Certainly, we hope that theequity markets continue to reward individual stock characteristics as we think such anenvironment would favor our investment process, with its focus on stock selection.
Portfolio Breakdown (%)(at December 31, 2012)
Common Stocks 95.8
Consumer Discretionary 17.1
Consumer Staples 8.6
Energy 4.4
Financials 4.8
Health Care 13.0
Industrials 11.6
Information Technology 31.6
Materials 3.7
Telecommunication Services 1.0
Convertible Preferred Stocks 1.2
Industrials 1.2
Money Market Funds 3.0
Total 100.0
Percentages indicated are based upon totalinvestments. The Fund’s portfolio compositionis subject to change.
Annual Report 2012 5

Columbia Variable Portfolio – Large Cap Growth Fund
Understanding Your Fund’s Expenses(Unaudited)
As an investor, you incur ongoing costs, which generally include management fees, distribution and/or service (Rule 12b-1) fees,and other fund expenses. The following information is intended to help you understand your ongoing costs (in dollars) ofinvesting in the Fund and to help you compare these costs with the ongoing costs of investing in other mutual funds.
The information below does not reflect fees and expenses imposed under your variable annuity contract and/or variable lifeinsurance policy (collectively, Contracts) or qualified pension and retirement plan (Qualified Plan), if any. The total fees andexpenses you bear may therefore be higher than those shown below.
Analyzing Your Fund’s ExpensesTo illustrate these ongoing costs, we have provided examples and calculated the expenses paid by investors in each share class ofthe Fund during the period. The actual and hypothetical information in the table is based on an initial investment of $1,000 at thebeginning of the period indicated and held for the entire period. Expense information is calculated two ways and each methodprovides you with different information. The amount listed in the “Actual” column is calculated using the Fund’s actual operatingexpenses and total return for the period. You may use the Actual information, together with the amount invested, to estimate theexpenses that you paid over the period. Simply divide your account value by $1,000 (for example, an $8,600 account valuedivided by $1,000 = 8.6), then multiply the results by the expenses paid during the period under the Actual column. The amountlisted in the “Hypothetical” column assumes a 5% annual rate of return before expenses (which is not the Fund’s actual return)and then applies the Fund’s actual expense ratio for the period to the hypothetical return. You should not use the hypotheticalaccount values and expenses to estimate either your actual account balance at the end of the period or the expenses you paidduring the period. See “Compare With Other Funds” below for details on how to use the hypothetical data.
Compare With Other FundsSince all mutual funds are required to include the same hypothetical calculations about expenses in shareholder reports, you canuse this information to compare the ongoing cost of investing in the Fund with other funds. To do so, compare the hypotheticalexample with the 5% hypothetical examples that appear in the shareholder reports of other funds. As you compare hypotheticalexamples of other funds, it is important to note that hypothetical examples are meant to highlight the ongoing costs of investing ina fund only and do not reflect any transaction costs, such as redemption or exchange fees, or expenses that apply to thesubaccount or the contract. Therefore, the hypothetical calculations are useful in comparing ongoing costs only, and will not helpyou determine the relative total costs of owning different funds. If the fees and expenses imposed under your Contract orQualified Plan, if any, were included, your costs would be higher.
July 1, 2012 – December 31, 2012
Account Value at theBeginning of the
Period ($)
Account Value at theEnd of thePeriod ($)
Expenses Paid Duringthe Period ($)
Fund’s AnnualizedExpense Ratio (%)
Actual Hypothetical Actual Hypothetical Actual Hypothetical Actual
Class 1 1,000.00 1,000.00 1,067.10 1,021.28 4.13 4.04 0.79
Class 2 1,000.00 1,000.00 1,066.10 1,020.02 5.43 5.31 1.04
Class 3 1,000.00 1,000.00 1,065.90 1,020.67 4.75 4.65 0.91
Expenses paid during the period are equal to the annualized expense ratio for each class as indicated above, multiplied by the average account valueover the period and then multiplied by the number of days in the Fund’s most recent fiscal half year and divided by 366.
Expenses do not include fees and expenses incurred indirectly by the Fund from the underlying funds in which the Fund may invest (also referred toas “acquired funds”), including affiliated and non-affiliated pooled investment vehicles (including mutual funds and exchange-traded funds).
6 Annual Report 2012

Columbia Variable Portfolio – Large Cap Growth Fund
Portfolio of InvestmentsDecember 31, 2012(Percentages represent value of investments compared to net assets)
Common Stocks 95.6%
Issuer Shares Value ($)
Consumer Discretionary 17.1%
Automobiles 1.0%
Ford Motor Co. 186,047 2,409,308
Distributors 0.7%
LKQ Corp.(a) 88,730 1,872,203
Hotels, Restaurants & Leisure 2.2%
Las Vegas Sands Corp. 56,604 2,612,841
Yum! Brands, Inc. 42,498 2,821,867
Total 5,434,708
Internet & Catalog Retail 2.8%
Amazon.com, Inc.(a) 21,293 5,347,524
Expedia, Inc. 26,913 1,653,804
Total 7,001,328
Media 4.5%
Comcast Corp., Class A 78,594 2,937,844
Discovery Communications, Inc.,Class A(a) 37,132 2,357,139
DISH Network Corp., Class A 81,028 2,949,419
News Corp., Class A 123,460 3,153,169
Total 11,397,571
Multiline Retail 1.2%
Target Corp. 48,973 2,897,732
Specialty Retail 4.7%
Dick’s Sporting Goods, Inc. 35,990 1,637,185
Gap, Inc. (The) 78,700 2,442,848
Home Depot, Inc. (The) 27,127 1,677,805
Lowe’s Companies, Inc. 126,430 4,490,794
Urban Outfitters, Inc.(a) 41,903 1,649,302
Total 11,897,934
Total Consumer Discretionary 42,910,784
Consumer Staples 8.5%
Food & Staples Retailing 2.9%
Costco Wholesale Corp. 25,195 2,488,510
CVS Caremark Corp. 96,740 4,677,379
Total 7,165,889
Food Products 2.3%
Hershey Co. (The) 36,000 2,599,920
Kraft Foods Group, Inc. 71,085 3,232,235
Total 5,832,155
Household Products 1.3%
Procter & Gamble Co. (The) 49,920 3,389,069
Personal Products 1.3%
Estee Lauder Companies, Inc. (The),Class A 53,740 3,216,876
Common Stocks (continued)
Issuer Shares Value ($)
Tobacco 0.7%
Philip Morris International, Inc. 21,868 1,829,040
Total Consumer Staples 21,433,029
Energy 4.4%
Energy Equipment & Services 2.4%
Ensco PLC, Class A 55,964 3,317,546
National Oilwell Varco, Inc. 40,665 2,779,453
Total 6,096,999
Oil, Gas & Consumable Fuels 2.0%
Anadarko Petroleum Corp. 28,719 2,134,109
Kinder Morgan Management LLC(a)(b) 1,381 1
Pioneer Natural Resources Co. 25,735 2,743,093
Total 4,877,203
Total Energy 10,974,202
Financials 4.8%
Capital Markets 1.3%
BlackRock, Inc. 15,436 3,190,775
Commercial Banks 2.1%
Fifth Third Bancorp 157,965 2,399,488
Wells Fargo & Co. 84,620 2,892,312
Total 5,291,800
Diversified Financial Services 0.8%
Citigroup, Inc. 55,251 2,185,730
Real Estate Investment Trusts (REITs) 0.6%
Simon Property Group, Inc. 9,390 1,484,465
Total Financials 12,152,770
Health Care 13.0%
Biotechnology 5.4%
Amgen, Inc. 44,230 3,817,934
Gilead Sciences, Inc.(a) 78,985 5,801,448
Onyx Pharmaceuticals, Inc.(a) 30,312 2,289,465
Vertex Pharmaceuticals, Inc.(a) 38,923 1,632,431
Total 13,541,278
Health Care Equipment & Supplies 2.4%
Edwards Lifesciences Corp.(a) 16,878 1,521,889
Hologic, Inc.(a) 87,690 1,756,431
Zimmer Holdings, Inc. 38,918 2,594,274
Total 5,872,594
Life Sciences Tools & Services 1.5%
Life Technologies Corp.(a) 1,671 82,013
Thermo Fisher Scientific, Inc. 58,320 3,719,649
Total 3,801,662
The accompanying Notes to Financial Statements are an integral part of this statement.
Annual Report 2012 7

Columbia Variable Portfolio – Large Cap Growth Fund
Portfolio of Investments (continued)
December 31, 2012
Common Stocks (continued)
Issuer Shares Value ($)
Pharmaceuticals 3.7%
Allergan, Inc. 44,092 4,044,559
Johnson & Johnson 37,905 2,657,141
Watson Pharmaceuticals, Inc.(a) 31,037 2,669,182
Total 9,370,882
Total Health Care 32,586,416
Industrials 11.6%
Aerospace & Defense 3.7%
Honeywell International, Inc. 83,197 5,280,514
Precision Castparts Corp. 21,310 4,036,540
Total 9,317,054
Commercial Services & Supplies 2.4%
ADT Corp. (The) 55,978 2,602,417
Tyco International Ltd. 117,356 3,432,663
Total 6,035,080
Electrical Equipment 2.6%
Eaton Corp. PLC 52,120 2,824,904
Rockwell Automation, Inc. 43,334 3,639,623
Total 6,464,527
Machinery 0.9%
Pall Corp. 38,939 2,346,464
Road & Rail 2.0%
JB Hunt Transport Services, Inc. 48,903 2,919,998
Kansas City Southern 25,174 2,101,525
Total 5,021,523
Total Industrials 29,184,648
Information Technology 31.5%
Communications Equipment 4.0%
F5 Networks, Inc.(a) 32,921 3,198,275
QUALCOMM, Inc. 112,934 7,004,167
Total 10,202,442
Computers & Peripherals 9.0%
Apple, Inc. 26,630 14,194,589
EMC Corp.(a) 206,497 5,224,374
NCR Corp.(a) 122,061 3,110,114
Total 22,529,077
Internet Software & Services 8.2%
eBay, Inc.(a) 110,945 5,660,414
Facebook, Inc., Class A(a) 97,243 2,589,581
Common Stocks (continued)
Issuer Shares Value ($)
Google, Inc., Class A(a) 14,658 10,397,946
LinkedIn Corp., Class A(a) 16,200 1,860,084
Total 20,508,025
IT Services 4.6%
Accenture PLC, Class A 41,212 2,740,598
Alliance Data Systems Corp.(a) 17,193 2,488,858
Mastercard, Inc., Class A 9,982 4,903,957
Teradata Corp.(a) 24,857 1,538,400
Total 11,671,813
Software 5.7%
Citrix Systems, Inc.(a) 36,735 2,415,326
Oracle Corp. 205,530 6,848,260
Salesforce.com, Inc.(a) 22,270 3,743,587
ServiceNow, Inc.(a) 41,233 1,238,227
Total 14,245,400
Total Information Technology 79,156,757
Materials 3.7%
Chemicals 3.7%
Airgas, Inc. 24,110 2,201,002
LyondellBasell Industries NV, Class A 42,113 2,404,231
Monsanto Co. 48,150 4,557,398
Total 9,162,631
Total Materials 9,162,631
Telecommunication Services 1.0%
Diversified Telecommunication Services 1.0%
Verizon Communications, Inc. 57,680 2,495,814
Total Telecommunication Services 2,495,814
Total Common Stocks(Cost: $206,002,925) 240,057,051
Convertible Preferred Stocks 1.2%
Industrials 1.2%
Aerospace & Defense 1.2%
United Technologies Corp., 7.500% 54,530 3,037,866
Total Industrials 3,037,866
Total Convertible Preferred Stocks(Cost: $2,858,766) 3,037,866
The accompanying Notes to Financial Statements are an integral part of this statement.
8 Annual Report 2012

Columbia Variable Portfolio – Large Cap Growth Fund
Portfolio of Investments (continued)
December 31, 2012
Money Market Funds 3.0%
Shares Value ($)
Columbia Short-Term CashFund, 0.142%(c)(d) 7,578,886 7,578,886
Total Money Market Funds(Cost: $7,578,886) 7,578,886
Total Investments(Cost: $216,440,577) 250,673,803
Other Assets & Liabilities, Net 448,737
Net Assets 251,122,540
Notes to Portfolio of Investments(a) Non-income producing.
(b) Identifies issues considered to be illiquid as to their marketability. The aggregate value of such securities at December 31, 2012 was $1,representing less than 0.01% of net assets. Information concerning such security holdings at December 31, 2012 is as follows:
Security Description Acquisition Dates Cost ($)
Kinder Morgan Management LLC 12/19/03 – 01/18/05 —
(c) The rate shown is the seven-day current annualized yield at December 31, 2012.
(d) As defined in the Investment Company Act of 1940, an affiliated company is one in which the Fund owns 5% or more of its outstanding votingsecurities, or a company which is under common ownership or control with the Fund. Holdings and transactions in these affiliated companiesduring the year ended December 31, 2012, are as follows:
IssuerBeginning
Cost ($)PurchaseCost ($)
ProceedsFrom Sales ($)
EndingCost ($)
Dividendsor InterestIncome ($) Value ($)
Columbia Short-Term Cash Fund 3,085,176 90,596,324 (86,102,614) 7,578,886 9,559 7,578,886
Fair Value MeasurementsGenerally accepted accounting principles (GAAP) require disclosure regarding the inputs and valuation techniques used to measure fair value and anychanges in valuation inputs or techniques. In addition, investments shall be disclosed by major category.
The Fund categorizes its fair value measurements according to a three-level hierarchy that maximizes the use of observable inputs and minimizes theuse of unobservable inputs by prioritizing that the most observable input be used when available. Observable inputs are those that marketparticipants would use in pricing an investment based on market data obtained from sources independent of the reporting entity. Unobservableinputs are those that reflect the Fund’s assumptions about the information market participants would use in pricing an investment. An investment’slevel within the fair value hierarchy is based on the lowest level of any input that is deemed significant to the asset or liability’s fair valuemeasurement. The input levels are not necessarily an indication of the risk or liquidity associated with investments at that level. For example, certainU.S. government securities are generally high quality and liquid, however, they are reflected as Level 2 because the inputs used to determine fairvalue may not always be quoted prices in an active market.
Fair value inputs are summarized in the three broad levels listed below:
> Level 1 — Valuations based on quoted prices for investments in active markets that the Fund has the ability to access at the measurement date(including NAV for open-end mutual funds). Valuation adjustments are not applied to Level 1 investments.
> Level 2 — Valuations based on other significant observable inputs (including quoted prices for similar securities, interest rates, prepaymentspeeds, credit risks, etc.).
> Level 3 — Valuations based on significant unobservable inputs (including the Fund’s own assumptions and judgment in determining the fair valueof investments).
Inputs that are used in determining fair value of an investment may include price information, credit data, volatility statistics, and other factors.These inputs can be either observable or unobservable. The availability of observable inputs can vary between investments, and is affected byvarious factors such as the type of investment, and the volume and level of activity for that investment or similar investments in the marketplace.The inputs will be considered by the Investment Manager, along with any other relevant factors in the calculation of an investment’s fair value. TheFund uses prices and inputs that are current as of the measurement date, which may include periods of market dislocations. During these periods,the availability of prices and inputs may be reduced for many investments. This condition could cause an investment to be reclassified between thevarious levels within the hierarchy.
Investments falling into the Level 3 category are primarily supported by quoted prices from brokers and dealers participating in the market for thoseinvestments. However, these may be classified as Level 3 investments due to lack of market transparency and corroboration to support thesequoted prices. Additionally, valuation models may be used as the pricing source for any remaining investments classified as Level 3. These models
The accompanying Notes to Financial Statements are an integral part of this statement.
Annual Report 2012 9

Columbia Variable Portfolio – Large Cap Growth Fund
Portfolio of Investments (continued)
December 31, 2012
Fair Value Measurements (continued)
rely on one or more significant unobservable inputs and/or significant assumptions by the Investment Manager. Inputs used in valuations mayinclude, but are not limited to, financial statement analysis, capital account balances, discount rates and estimated cash flows, and comparablecompany data.
Under the direction of the Fund’s Board of Trustees (the Board), the Investment Manager’s Valuation Committee (the Committee) is responsible forcarrying out the valuation procedures approved by the Board. The Committee consists of voting and non-voting members from various groups withinthe Investment Manager’s organization, including operations and accounting, trading and investments, compliance, risk management and legal.
The Committee meets at least monthly to review and approve valuation matters, which may include a description of specific valuationdeterminations, data regarding pricing information received from approved pricing vendors and brokers and the results of Board-approved valuationcontrol policies and procedures (the Policies). The Policies address, among other things, instances when market quotations are readily available,including recommendations of third party pricing vendors and a determination of appropriate pricing methodologies; events that require specificvaluation determinations and assessment of fair value techniques; securities with a potential for stale pricing, including those that are illiquid,restricted, or in default; and the effectiveness of third-party pricing vendors, including periodic reviews of vendors. The Committee meets morefrequently, as needed, to discuss additional valuation matters, which may include the need to review back-testing results, review time-sensitiveinformation or approve related valuation actions. The Committee reports to the Board, with members of the Committee meeting with the Board ateach of its regularly scheduled meetings to discuss valuation matters and actions during the period, similar to those described earlier.
For investments categorized as Level 3, the Committee monitors information similar to that described above, which may include: (i) data specific tothe issuer or comparable issuers, (ii) general market or specific sector news and (iii) quoted prices and specific or similar security transactions. TheCommittee considers this data and any changes from prior periods in order to assess the reasonableness of observable and unobservable inputs,any assumptions or internal models used to value those securities and changes in fair value. This data is also used to corroborate, when available,information received from approved pricing vendors and brokers. Various factors impact the frequency of monitoring this information (which mayoccur as often as daily). However, the Committee may determine that changes to inputs, assumptions and models are not required as a result of themonitoring procedures performed.
The following table is a summary of the inputs used to value the Fund’s investments at December 31, 2012:
Description
Level 1Quoted Prices in Active
Markets for IdenticalAssets ($)
Level 2Other Significant
Observable Inputs ($)
Level 3Significant
Unobservable Inputs ($) Total ($)
Equity Securities
Common Stocks
Consumer Discretionary 42,910,784 — — 42,910,784
Consumer Staples 21,433,029 — — 21,433,029
Energy 10,974,201 1 — 10,974,202
Financials 12,152,770 — — 12,152,770
Health Care 32,586,416 — — 32,586,416
Industrials 29,184,648 — — 29,184,648
Information Technology 79,156,757 — — 79,156,757
Materials 9,162,631 — — 9,162,631
Telecommunication Services 2,495,814 — — 2,495,814
Convertible Preferred Stocks
Industrials 3,037,866 — — 3,037,866
Total Equity Securities 243,094,916 1 — 243,094,917
Other
Money Market Funds 7,578,886 — — 7,578,886
Total Other 7,578,886 — — 7,578,886
Total 250,673,802 1 — 250,673,803
See the Portfolio of Investments for all investment classifications not indicated in the table.
The Fund’s assets assigned to the Level 2 input category are generally valued using the market approach, in which a security’s value is determinedthrough reference to prices and information from market transactions for similar or identical assets.
There were no transfers of financial assets between Levels 1 and 2 during the period.
The accompanying Notes to Financial Statements are an integral part of this statement.
10 Annual Report 2012

Columbia Variable Portfolio – Large Cap Growth Fund
Statement of Assets and LiabilitiesDecember 31, 2012
Assets
Investments, at value
Unaffiliated issuers (identified cost $208,861,691) $243,094,917
Affiliated issuers (identified cost $7,578,886) 7,578,886
Total investments (identified cost $216,440,577) 250,673,803
Receivable for:
Investments sold 785,927
Capital shares sold 35,500
Dividends 125,061
Reclaims 16,817
Expense reimbursement due from Investment Manager 12,667
Prepaid expenses 2,607
Trustees’ deferred compensation plan 27,326
Total assets 251,679,708
Liabilities
Payable for:
Capital shares purchased 281,437
Investment management fees 150,897
Distribution and/or service fees 22,657
Transfer agent fees 12,752
Administration fees 12,752
Compensation of board members 14,361
Other expenses 34,986
Trustees’ deferred compensation plan 27,326
Total liabilities 557,168
Net assets applicable to outstanding capital stock $251,122,540
Represented by
Partners’ capital $251,122,540
Total — representing net assets applicable to outstanding capital stock $251,122,540
The accompanying Notes to Financial Statements are an integral part of this statement.
Annual Report 2012 11

Columbia Variable Portfolio – Large Cap Growth Fund
Statement of Assets and Liabilities (continued)
December 31, 2012
Class 1
Net assets $46,511,688
Shares outstanding 5,851,043
Net asset value per share $7.95
Class 2
Net assets $9,740,947
Shares outstanding 1,233,718
Net asset value per share $7.90
Class 3
Net assets $194,869,905
Shares outstanding 24,567,853
Net asset value per share $7.93
The accompanying Notes to Financial Statements are an integral part of this statement.
12 Annual Report 2012

Columbia Variable Portfolio – Large Cap Growth Fund
Statement of OperationsYear ended December 31, 2012
Net investment income
Income:
Dividends — unaffiliated issuers $3,716,983
Dividends — affiliated issuers 9,559
Income from securities lending — net 35,984
Foreign taxes withheld (100,073)
Total income 3,662,453
Expenses:
Investment management fees 1,820,957
Distribution and/or service fees
Class 2 22,077
Class 3 249,913
Transfer agent fees
Class 1 28,626
Class 2 5,298
Class 3 119,955
Administration fees 153,880
Compensation of board members 13,409
Custodian fees 7,489
Printing and postage fees 60,582
Professional fees 26,888
Other 15,488
Total expenses 2,524,562
Fees waived or expenses reimbursed by Investment Manager and its affiliates (247,319)
Total net expenses 2,277,243
Net investment income 1,385,210
Realized and unrealized gain (loss) — net
Net realized gain (loss) on:
Investments 28,502,932
Options contracts written 3,509
Net realized gain 28,506,441
Net change in unrealized appreciation (depreciation) on:
Investments 16,866,269Foreign currency translations 402
Net change in unrealized appreciation (depreciation) 16,866,671
Net realized and unrealized gain 45,373,112
Net increase in net assets resulting from operations $46,758,322
The accompanying Notes to Financial Statements are an integral part of this statement.
Annual Report 2012 13

Columbia Variable Portfolio – Large Cap Growth Fund
Statement of Changes in Net Assets
2012 2011
Operations
Net investment income $1,385,210 $641,872
Net realized gain 28,506,441 22,433,441
Net change in unrealized appreciation (depreciation) 16,866,671 (36,648,548)
Net increase (decrease) in net assets resulting from operations 46,758,322 (13,573,235)
Increase (decrease) in net assets from capital stock activity (36,486,623) 20,933,627
Total increase in net assets 10,271,699 7,360,392
Net assets at beginning of year 240,850,841 233,490,449
Net assets at end of year $251,122,540 $240,850,841
The accompanying Notes to Financial Statements are an integral part of this statement.
14 Annual Report 2012

Columbia Variable Portfolio – Large Cap Growth Fund
Statement of Changes in Net Assets (continued)
Year Ended December 31, 2012 Year Ended December 31, 2011
Shares Dollars ($) Shares Dollars ($)
Capital stock activity
Class 1 shares
Subscriptions 156,040 1,179,982 176,322 1,277,429
Fund merger — — 7,273,180 54,764,794
Redemptions (977,650) (7,482,082) (777,638) (5,364,332)
Net increase (decrease) (821,610) (6,302,100) 6,671,864 50,677,891
Class 2 shares
Subscriptions 337,437 2,535,468 175,215 1,209,414
Fund merger — — 1,137,310 8,542,419
Redemptions (305,378) (2,293,895) (157,827) (1,085,793)
Net increase 32,059 241,573 1,154,698 8,666,040
Class 3 Shares
Subscriptions 291,816 2,239,547 194,766 1,366,110
Redemptions (4,330,703) (32,665,643) (5,765,203) (39,776,414)
Net decrease (4,038,887) (30,426,096) (5,570,437) (38,410,304)
Total net increase (decrease) (4,828,438) (36,486,623) 2,256,125 20,933,627
The accompanying Notes to Financial Statements are an integral part of this statement.
Annual Report 2012 15

Columbia Variable Portfolio – Large Cap Growth Fund
Financial Highlights
The following tables are intended to help you understand the Fund’s financial performance. Certain information reflects financialresults for a single share of a class held for the periods shown. For periods ended 2009 and after, per share net investment income(loss) amounts are calculated based on average shares outstanding during the period. Total return assumes reinvestment of alldividends and distributions. Total return does not reflect payment of the expenses that apply to the variable accounts or contractcharges, if any, and are not annualized for periods of less than one year.
Year Ended December 31,
Class 1 2012 2011 2010(a)
Per share dataNet asset value, beginning of period $6.61 $6.82 $6.34
Income from investment operations:
Net investment income 0.05 0.03 0.02
Net realized and unrealized gain (loss) 1.29 (0.24) 0.46
Total from investment operations 1.34 (0.21) 0.48
Net asset value, end of period $7.95 $6.61 $6.82
Total return 20.27% (3.08%) 7.57%
Ratios to average net assets(b)
Total gross expenses 0.88% 0.89% 0.83%(c)
Total net expenses(d) 0.78% 0.77% 0.83%(c)
Net investment income 0.64% 0.51% 0.60%(c)
Supplemental data
Net assets, end of period (in thousands) $46,512 $44,092 $5
Portfolio turnover 102% 104% 152%
Notes to Financial Highlights
(a)For the period from May 3, 2010 (commencement of operations) to December 31, 2010.
(b) In addition to the fees and expenses which the Fund bears directly, the Fund indirectly bears a pro rata share of the fees and expenses of theacquired funds in which it invests. Such indirect expenses are not included in the reported expense ratios.
(c) Annualized.
(d)Total net expenses include the impact of certain waivers/reimbursements made by the Investment Manager and certain of its affiliates, ifapplicable.
The accompanying Notes to Financial Statements are an integral part of this statement.
16 Annual Report 2012
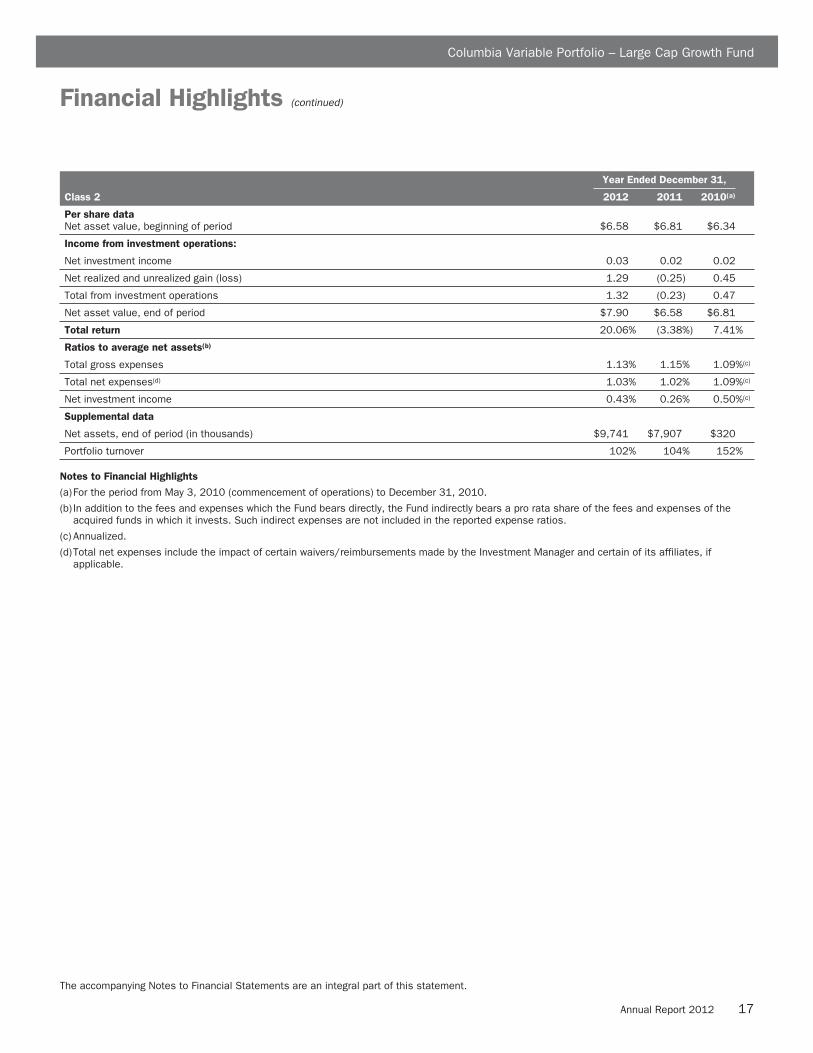
Columbia Variable Portfolio – Large Cap Growth Fund
Financial Highlights (continued)
Year Ended December 31,
Class 2 2012 2011 2010(a)
Per share dataNet asset value, beginning of period $6.58 $6.81 $6.34
Income from investment operations:
Net investment income 0.03 0.02 0.02
Net realized and unrealized gain (loss) 1.29 (0.25) 0.45
Total from investment operations 1.32 (0.23) 0.47
Net asset value, end of period $7.90 $6.58 $6.81
Total return 20.06% (3.38%) 7.41%
Ratios to average net assets(b)
Total gross expenses 1.13% 1.15% 1.09%(c)
Total net expenses(d) 1.03% 1.02% 1.09%(c)
Net investment income 0.43% 0.26% 0.50%(c)
Supplemental data
Net assets, end of period (in thousands) $9,741 $7,907 $320
Portfolio turnover 102% 104% 152%
Notes to Financial Highlights
(a)For the period from May 3, 2010 (commencement of operations) to December 31, 2010.
(b) In addition to the fees and expenses which the Fund bears directly, the Fund indirectly bears a pro rata share of the fees and expenses of theacquired funds in which it invests. Such indirect expenses are not included in the reported expense ratios.
(c) Annualized.
(d)Total net expenses include the impact of certain waivers/reimbursements made by the Investment Manager and certain of its affiliates, ifapplicable.
The accompanying Notes to Financial Statements are an integral part of this statement.
Annual Report 2012 17

Columbia Variable Portfolio – Large Cap Growth Fund
Financial Highlights (continued)
Year Ended December 31,
Class 3 2012 2011 2010 2009 2008
Per share dataNet asset value, beginning of period $6.60 $6.82 $5.82 $4.25 $7.65
Income from investment operations:
Net investment income (loss) 0.04 0.01 0.02 0.03 0.10
Net realized and unrealized gain (loss) 1.29 (0.23) 0.98 1.54 (3.48)
Total from investment operations 1.33 (0.22) 1.00 1.57 (3.38)
Less distributions to shareholders:
Net investment income — — — — (0.02)
Total distributions to shareholders — — — — (0.02)
Net asset value, end of period $7.93 $6.60 $6.82 $5.82 $4.25
Total return 20.15% (3.23%) 17.16% 37.00% (44.35%)
Ratios to average net assets(a)
Total gross expenses 1.00% 0.99% 0.93% 0.80% 0.75%
Total net expenses(b) 0.91% 0.92% 0.93% 0.80% 0.75%
Net investment income 0.52% 0.21% 0.34% 0.71% 1.36%
Supplemental data
Net assets, end of period (in thousands) $194,870 $188,852 $233,165 $240,404 $275,348
Portfolio turnover 102% 104% 152% 152% 150%
Notes to Financial Highlights
(a) In addition to the fees and expenses which the Fund bears directly, the Fund indirectly bears a pro rata share of the fees and expenses of theacquired funds in which it invests. Such indirect expenses are not included in the reported expense ratios.
(b)Total net expenses include the impact of certain waivers/reimbursements made by the Investment Manager and certain of its affiliates, ifapplicable.
The accompanying Notes to Financial Statements are an integral part of this statement.
18 Annual Report 2012

Columbia Variable Portfolio – Large Cap Growth Fund
Notes to Financial StatementsDecember 31, 2012
Note 1. OrganizationColumbia Variable Portfolio — Large Cap Growth Fund (theFund), a series of Columbia Funds Variable Series Trust II(the Trust), is a diversified fund. The Trust is registered underthe Investment Company Act of 1940, as amended (the1940 Act), as an open-end management investment companyorganized as a Massachusetts business trust.
Fund Shares
The Trust may issue an unlimited number of shares (withoutpar value). The Fund offers Class 1, Class 2 and Class 3 sharesto separate accounts funding variable annuity contracts andvariable life insurance policies (collectively, Contracts) issuedby affiliated and unaffiliated life insurance companies as wellas qualified pension and retirement plans (Qualified Plans)and other qualified institutional investors authorized byColumbia Management Investment Distributors, Inc. (theDistributor). You may not buy (nor will you own) shares ofthe Fund directly. You invest by participating in a QualifiedPlan or buying a Contract and making allocations to the Fund.All share classes have identical voting, dividend andliquidation rights. Each share class has its own expensestructure.
Note 2. Summary of Significant AccountingPoliciesUse of Estimates
The preparation of financial statements in accordance withU.S. generally accepted accounting principles (GAAP)requires management to make certain estimates andassumptions that affect the reported amounts of assets andliabilities, the disclosure of contingent assets and liabilities atthe date of the financial statements and the reported amountsof revenue and expenses during the reporting period. Actualresults could differ from those estimates.
The following is a summary of significant accounting policiesconsistently followed by the Fund in the preparation of itsfinancial statements.
Security Valuation
All equity securities are valued at the close of business of theNew York Stock Exchange (NYSE). Equity securities arevalued at the last quoted sales price on the principal exchangeor market on which they trade, except for securities traded onthe NASDAQ Stock Market, which are valued at theNASDAQ official close price. Unlisted securities or listedsecurities for which there were no sales during the day arevalued at the mean of the latest quoted bid and ask prices onsuch exchanges or markets.
Foreign securities are valued based on quotations from theprincipal market in which such securities are normally traded.If any foreign share prices are not readily available as a resultof limited share activity the securities are valued at the meanof the latest quoted bid and ask prices on such exchanges ormarkets. Foreign currency exchange rates are generallydetermined at 4:00 p.m. Eastern (U.S.) time. However, manysecurities markets and exchanges outside the U.S. close priorto the close of the NYSE; therefore, the closing prices forsecurities in such markets or on such exchanges may not fullyreflect events that occur after such close but before the closeof the NYSE. In those situations, foreign securities will be fairvalued pursuant to the policy adopted by the Board of Trustees(the Board), including utilizing a third party pricing service todetermine these fair values. The third party pricing servicetakes into account multiple factors, including, but not limitedto, movements in the U.S. securities markets, certaindepositary receipts, futures contracts and foreign exchangerates that have occurred subsequent to the close of the foreignexchange or market, to determine a good faith estimate thatreasonably reflects the current market conditions as of theclose of the NYSE. The fair value of a security is likely to bedifferent from the quoted or published price, if available.
Investments in other open-end investment companies,including money market funds, are valued at net asset value.
Short-term securities purchased within 60 days to maturity arevalued at amortized cost, which approximates market value.The value of short-term securities originally purchased withmaturities greater than 60 days is determined based on anamortized value to par upon reaching 60 days to maturity.Short-term securities maturing in more than 60 days from thevaluation date are valued at the market price or approximatemarket value based on current interest rates.
Option contracts are valued at the mean of the latest quotedbid and asked prices on their primary exchanges. Optioncontracts, including over-the-counter (OTC) option contracts,with no readily available market value are valued usingquotations obtained from independent brokers as of the closeof the NYSE.
Investments for which market quotations are not readilyavailable, or that have quotations which management believesare not reliable, are valued at fair value as determined in goodfaith under consistently applied procedures established by andunder the general supervision of the Board. If a security orclass of securities (such as foreign securities) is valued at fairvalue, such value is likely to be different from the last quotedmarket price for the security.
The determination of fair value often requires significantjudgment. To determine fair value, management may use
Annual Report 2012 19

Columbia Variable Portfolio – Large Cap Growth Fund
Notes to Financial Statements (continued)
December 31, 2012
assumptions including but not limited to future cash flows andestimated risk premiums. Multiple inputs from various sourcesmay be used to determine fair value.
Foreign Currency Transactions and Translations
The values of all assets and liabilities denominated in foreigncurrencies are translated into U.S. dollars at that day’sexchange rates. Net realized and unrealized gains (losses) onforeign currency transactions and translations include gains(losses) arising from the fluctuation in exchange rates betweentrade and settlement dates on securities transactions, gains(losses) arising from the disposition of foreign currency andcurrency gains (losses) between the accrual and payment dateson dividends, interest income and foreign withholding taxes.
For financial statement purposes, the Fund does notdistinguish that portion of gains (losses) on investments whichis due to changes in foreign exchange rates from that which isdue to changes in market prices of the investments. Suchfluctuations are included with the net realized and unrealizedgains (losses) on investments in the Statement of Operations.
Derivative Instruments
The Fund invests in certain derivative instruments, as detailedbelow, to meet its investment objectives. Derivatives areinstruments whose values depend on, or are derived from, inwhole or in part, the value of one or more other assets, such assecurities, currencies, commodities or indices. Derivativeinstruments may be used to maintain cash reserves whilemaintaining exposure to certain other assets, to offsetanticipated declines in values of investments, to facilitatetrading, to reduce transaction costs and to pursue higherinvestment returns. The Fund may also use derivativeinstruments to mitigate certain investment risks, such asforeign currency exchange rate risk, interest rate risk andcredit risk. Derivatives may involve various risks, includingthe potential inability of the counterparty to fulfill itsobligation under the terms of the contract, the potential for anilliquid secondary market and the potential for marketmovements which may expose the Fund to gains or losses inexcess of the amount shown in the Statement of Assets andLiabilities.
The Fund and any counterparty are required to maintain anagreement that requires the Fund and that counterparty tomonitor (on a daily basis) the net fair value of all derivativesentered into pursuant to the agreement between the Fund andsuch counterparty. If the net fair value of such derivativesbetween the Fund and that counterparty exceeds a certainthreshold (as defined in the agreement), the Fund or thecounterparty (as the case may be) is required to post cash and/or securities as collateral. Fair values of derivatives presented
in the financial statements are not netted with the fair value ofother derivatives or with any collateral amounts posted by theFund or any counterparty.
Options Contracts
Options are contracts which entitle the holder to purchase orsell securities or other identified assets at a specified price, orin the case of index option contracts, to receive or pay thedifference between the index value and the strike price of theindex option contract. The Fund wrote option contracts todecrease the Fund’s exposure to equity risk and to increasereturn on investments. Completion of transactions for optioncontracts traded in the OTC market depends upon theperformance of the other party. Cash collateral may becollected or posted by the Fund to secure certain OTC optioncontract trades. Cash collateral held or posted by the Fund forsuch option contract trades must be returned to thecounterparty or the Fund upon closure, exercise or expirationof the contract.
Option contracts purchased are recorded as investments andoptions contracts written are recorded as liabilities of theFund. The Fund will realize a gain or loss when the optioncontract expires. When option contracts are exercised, theproceeds on sales for a written call or purchased put optioncontract, or the purchase cost for a written put or purchasedcall option contract, is adjusted by the amount of premiumreceived or paid.
The risk in buying an option contract is that the Fund pays apremium whether or not the option contract is exercised. TheFund also has the additional risk of being unable to enter intoa closing transaction if a liquid secondary market does notexist. The risk in writing a call option contract is that the Fundgives up the opportunity for profit if the market price of thesecurity increases. The risk in writing a put option contract isthat the Fund may incur a loss if the market price of thesecurity decreases and the option contract is exercised. TheFund’s maximum payout in the case of written put optioncontracts represents the maximum potential amount of futurepayments (undiscounted) that the Fund could be required tomake under the contract. For OTC options contracts, thetransaction is also subject to counterparty credit risk. Themaximum payout amount may be offset by the subsequentsale, if any, of assets obtained upon the exercise of the putoption contracts by holders of the option contracts or proceedsreceived upon entering into the contracts.
20 Annual Report 2012

Columbia Variable Portfolio – Large Cap Growth Fund
Notes to Financial Statements (continued)
December 31, 2012
Contracts and premiums associated with options contractswritten for the year ended December 31, 2012 are as follows:
Calls
Contracts Premiums ($)
Balance at December 31, 2011 — —Opened 30 3,509Expired (30) (3,509)
Balance at December 31, 2012 — —
Effects of Derivative Transactions in the FinancialStatements
The following tables are intended to provide additionalinformation about the effect of derivatives on the financialstatements of the Fund, including: the fair value of derivativesby risk category and the location of those fair values in theStatement of Assets and Liabilities; the impact of derivativetransactions on the Fund’s operations over the periodincluding realized gains or losses and unrealized gains orlosses. The derivative schedules following the Portfolio ofInvestments present additional information regardingderivative instruments outstanding at the end of the period, ifany.
At December 31, 2012, the fund had no outstandingderivatives.
The effect of derivative instruments in the Statement ofOperations for the year ended December 31, 2012:
Amount of Realized Gain (Loss) on Derivatives Recognized inIncome
Risk Exposure Category
Options ContractsWritten and
Purchased ($)
Equity contracts 3,509
The following table is a summary of the volume of derivativeinstruments for the year ended December 31, 2012:
Derivative Instrument Contracts Opened
Options contracts 30
Security Transactions
Security transactions are accounted for on the trade date. Costis determined and gains (losses) are based upon the specificidentification method for both financial statement and federalincome tax purposes.
Income Recognition
Corporate actions and dividend income are recorded net ofany non-reclaimable tax withholdings, on the ex-dividend dateor upon receipt of ex-dividend notification in the case ofcertain foreign securities.
Interest income is recorded on an accrual basis.
Awards from class action litigation are recorded as a reductionof cost basis if the Fund still owns the applicable securities onthe payment date. If the Fund no longer owns the applicablesecurities, the proceeds are recorded as realized gains.
Expenses
General expenses of the Trust are allocated to the Fund andother funds of the Trust based upon relative net assets or otherexpense allocation methodologies determined by the nature ofthe expense. Expenses directly attributable to the Fund arecharged to the Fund. Expenses directly attributable to aspecific class of shares are charged to that share class.
Determination of Class Net Asset Value
All income, expenses (other than class-specific expenses,which are charged to that share class, as shown in theStatement of Operations) and realized and unrealized gains(losses) are allocated to each class of the Fund on a dailybasis, based on the relative net assets of each class, forpurposes of determining the net asset value of each class.
Federal Income Tax Status
The Fund is treated as a partnership for federal income taxpurposes, and the Fund does not expect to make regulardistributions. The Fund will not be subject to federal incometax, and therefore, there is no provision for federal incometaxes. The partners of the Fund are subject to tax on theirdistributive share of the Fund’s income and loss. Thecomponents of the Fund’s net assets are reported at thepartner-level for federal income tax purposes, and therefore,are not presented in the Statement of Assets and Liabilities.
Management of the Fund has concluded that there are nosignificant uncertain tax positions that would requirerecognition in the financial statements. However,management’s conclusion may be subject to review andadjustment at a later date based on factors including, but notlimited to, new tax laws, regulations, and administrativeinterpretations (including relevant court decisions). Generally,the Fund’s federal tax returns for the prior three fiscal yearsremain subject to examination by the Internal RevenueService.
Foreign Taxes
The Fund may be subject to foreign taxes on income, gains oninvestments or currency repatriation, a portion of which maybe recoverable. The Fund will accrue such taxes andrecoveries, as applicable, based upon its current interpretationof tax rules and regulations that exist in the markets in whichit invests.
Annual Report 2012 21

Columbia Variable Portfolio – Large Cap Growth Fund
Notes to Financial Statements (continued)
December 31, 2012
Realized gains in certain countries may be subject to foreigntaxes at the Fund level, based on statutory rates. The Fundaccrues for such foreign taxes on net realized and unrealizedgains at the appropriate rate for each jurisdiction, asapplicable. The amount, if any, is disclosed as a liability onthe Statement of Assets and Liabilities.
Guarantees and Indemnifications
Under the Trust’s organizational documents and, in somecases, by contract, its officers and trustees are indemnifiedagainst certain liabilities arising out of the performance oftheir duties to the Trust or its funds. In addition, certain of theFund’s contracts with its service providers contain generalindemnification clauses. The Fund’s maximum exposureunder these arrangements is unknown since the amount of anyfuture claims that may be made against the Fund cannot bedetermined, and the Fund has no historical basis for predictingthe likelihood of any such claims.
Recent Accounting Pronouncement
Disclosures about Offsetting Assets and Liabilities
In December 2011, the Financial Accounting Standards Board(FASB) issued Accounting Standards Update (ASU)No. 2011-11, Disclosures about Offsetting Assets andLiabilities. The objective of the FASB is to enhance currentdisclosure requirements on offsetting of certain assets andliabilities and to enable financial statement users to comparefinancial statements prepared under GAAP and InternationalFinancial Reporting Standards.
Specifically, ASU No. 2011-11 requires an entity to discloseboth gross and net information for derivatives and otherfinancial instruments that are subject to a master nettingarrangement or similar agreement. The standard requiresdisclosure of collateral received in connection with the masternetting agreements or similar agreements. The effective dateof ASU No. 2011-11 is for interim and annual periodsbeginning on or after January 1, 2013. At this time,management is evaluating the implications of this guidanceand the impact it will have on the financial statement amountsand footnote disclosures, if any.
Note 3. Fees and Compensation Paid toAffiliatesInvestment Management Fees
Under an Investment Management Services Agreement,Columbia Management Investment Advisers, LLC (theInvestment Manager), a wholly-owned subsidiary ofAmeriprise Financial, Inc. (Ameriprise Financial), determineswhich securities will be purchased, held or sold. The
investment management fee is an annual fee that is equal to apercentage of the Fund’s average daily net assets that declinesfrom 0.71% to 0.54% as the Fund’s net assets increase. Theeffective investment management fee rate for the year endedDecember 31, 2012 was 0.71% of the Fund’s average daily netassets.
Administration Fees
Under an Administrative Services Agreement, the InvestmentManager also serves as the Fund Administrator. The Fundpays the Fund Administrator an annual fee for administrationand accounting services equal to a percentage of the Fund’saverage daily net assets that declines from 0.06% to 0.03% asthe Fund’s net assets increase. The effective administration feerate for the year ended December 31, 2012 was 0.06% of theFund’s average daily net assets.
Other Expenses
Other expenses are for, among other things, certain expensesof the Fund or the Board, including: Fund boardroom andoffice expense, employee compensation, employee health andretirement benefits, and certain other expenses. Payment ofthese Fund and Board expenses is facilitated by a companyproviding limited administrative services to the Fund and theBoard. For the year ended December 31, 2012, other expensespaid to this company were $2,118.
Compensation of Board Members
Board members are compensated for their services to the Fundas disclosed in the Statement of Operations. Under a DeferredCompensation Plan (the Plan), the Board members who arenot “interested persons” of the Fund, as defined under the1940 Act, may elect to defer payment of up to 100% of theircompensation. Deferred amounts are treated as thoughequivalent dollar amounts had been invested in shares ofcertain funds managed by the Investment Manager. TheFund’s liability for these amounts is adjusted for market valuechanges and remains in the Fund until distributed inaccordance with the Plan.
Transfer Agent Fees
The Fund has a Transfer Agency and Dividend DisbursingAgent Agreement with Columbia Management InvestmentServices Corp. (the Transfer Agent), an affiliate of theInvestment Manager and a wholly-owned subsidiary ofAmeriprise Financial. The annual fee rate under thisagreement is 0.06% of the Fund’s average daily net assets.The Transfer Agent also receives compensation from fees forvarious shareholder services and reimbursements for certainout-of-pocket fees.
22 Annual Report 2012

Columbia Variable Portfolio – Large Cap Growth Fund
Notes to Financial Statements (continued)
December 31, 2012
Distribution Fees
The Fund has an agreement with Columbia ManagementInvestment Distributors, Inc. (the Distributor), an affiliate ofthe Investment Manager and a wholly-owned subsidiary ofAmeriprise Financial, for distribution services. Under a Planand Agreement of Distribution pursuant to Rule 12b-1, theFund pays a fee at an annual rate of up to 0.25% of the Fund’saverage daily net assets attributable to Class 2 shares and anannual rate of up to 0.125% of the Fund’s average daily netassets attributable to Class 3 shares. The Fund pays nodistribution and service fees for Class 1 shares.
Expenses Waived/Reimbursed by the InvestmentManager and its Affiliates
Effective May 1, 2012, the Investment Manager and certain ofits affiliates have contractually agreed to waive fees and/orreimburse expenses (excluding certain fees and expensesdescribed below), through April 30, 2013, unless soonerterminated at the sole discretion of the Board, so that theFund’s net operating expenses, after giving effect to feeswaived/expenses reimbursed and any balance credits and/oroverdraft charges from the Fund’s custodian, do not exceedthe following annual rates as a percentage of the class’average daily net assets:
Class 1 0.790%
Class 2 1.040
Class 3 0.915
Prior to May 1, 2012, the Investment Manager and certain ofits affiliates contractually agreed to waive fees and/orreimburse expenses (excluding certain fees and expensesdescribed below), so that the Fund’s net operating expenses,after giving effect to fees waived/expenses reimbursed andany balance credits and/or overdraft charges from the Fund’scustodian, did not exceed the following annual rates as apercentage of the class’ average daily net assets:
Class 1 0.765%
Class 2 1.015
Class 3 0.890
Under the agreement governing these fee waivers and/orexpense reimbursement arrangements, the following fees andexpenses are excluded from the waiver/reimbursementcommitment, and therefore will be paid by the Fund, ifapplicable: taxes (including foreign transaction taxes),expenses associated with investments in affiliated andnon-affiliated pooled investment vehicles (including mutualfunds and exchange traded funds), transaction costs andbrokerage commissions, costs related to any securities lendingprogram, dividend expenses associated with securities sold
short, inverse floater program fees and expenses, transactioncharges and interest on borrowed money, interest,extraordinary expenses and any other expenses the exclusionof which is specifically approved by the Board. Thisagreement may be modified or amended only with approvalfrom all parties.
Note 4. Portfolio InformationThe cost of purchases and proceeds from sales of securities,excluding short-term obligations, aggregated to $253,694,071and $294,023,212, respectively, for the year endedDecember 31, 2012.
Note 5. Lending of Portfolio SecuritiesEffective December 31, 2012, the Fund no longer participatesin securities lending activity. Prior to that date, the Fund hadentered into a Master Securities Lending Agreement (theAgreement) with JPMorgan Chase Bank, N.A. (JPMorgan).The Agreement authorized JPMorgan as lending agent to lendsecurities to authorized borrowers in order to generateadditional income on behalf of the Fund. Pursuant to theAgreement, the securities loaned were secured by cash orsecurities that either were issued or guaranteed as to principaland interest by the U.S. government, its agencies, authoritiesor instrumentalities with value equal to at least 100% of themarket value of the loaned securities. Any additional collateralrequired to maintain those levels due to market fluctuations ofthe loaned securities was requested to be delivered thefollowing business day. Cash collateral received was investedby the lending agent on behalf of the Fund into authorizedinvestments pursuant to the Agreement.
Pursuant to the Agreement, the Fund received income forlending its securities either in the form of fees or by earninginterest on invested cash collateral, net of negotiated rebatespaid to borrowers and fees paid to the lending agent forservices provided and any other securities lending expenses.Net income earned from securities lending for the year endedDecember 31, 2012 is disclosed in the Statement ofOperations. The Fund continued to earn and accrue interestand dividends on the securities loaned. At December 31, 2012,the Fund did not have any securities on loan.
Note 6. Affiliated Money Market FundThe Fund invests its daily cash balances in Columbia Short-Term Cash Fund, an affiliated money market fund establishedfor the exclusive use by the Fund and other affiliated funds.The income earned by the Fund from such investments isincluded as “Dividends — affiliated issuers” in the Statementof Operations. As an investing fund, the Fund indirectly bearsits proportionate share of the expenses of Columbia Short-Term Cash Fund.
Annual Report 2012 23

Columbia Variable Portfolio – Large Cap Growth Fund
Notes to Financial Statements (continued)
December 31, 2012
Note 7. Shareholder ConcentrationAt December 31, 2012, one unaffiliated shareholder accountowned 10.4% of the outstanding shares of the Fund. The Fundhas no knowledge about whether any portion of those shareswas owned beneficially by such account. Affiliatedshareholder accounts owned 78.9% of the outstanding sharesof the Fund. Subscription and redemption activity byconcentrated accounts may have a significant effect on theoperations of the Fund.
Note 8. Line of CreditThe Fund has entered into a revolving credit facility with asyndicate of banks led by JPMorgan whereby the Fund mayborrow for the temporary funding of shareholder redemptionsor for other temporary or emergency purposes. The creditfacility agreement, as amended, which is a collectiveagreement between the Fund and certain other funds managedby the Investment Manager, severally and not jointly, permitscollective borrowings up to $500 million. Interest is chargedto each participating fund based on its borrowings at a rateequal to the higher of (i) the overnight federal funds rate plus1.00% or (ii) the one-month LIBOR rate plus 1.00%. Eachborrowing under the credit facility matures no later than60 days after the date of borrowing. The Fund also pays acommitment fee equal to its pro rata share of the amount ofthe credit facility at a rate of 0.08% per annum.
The Fund had no borrowings during the year endedDecember 31, 2012.
Note 9. Fund MergerAt the close of business on April 29, 2011, the Fund acquiredthe assets and assumed the identified liabilities of ColumbiaLarge Cap Growth Fund, Variable Series (the acquired fund),a series of Columbia Funds Variable Insurance Trust. Thereorganization was completed after shareholders of theacquired fund approved a plan of reorganization onFebruary 15, 2011. The purpose of the transaction was tocombine two funds managed by the Investment Manager withcomparable investment objectives and strategies.
The aggregate net assets of the Fund immediately before theacquisition were $244,494,303 and the combined net assetsimmediately after the acquisition were $307,801,516.
The merger was accomplished by a tax-free exchange of1,979,922 shares of the acquired fund valued at $63,307,213(including $13,585,216 of unrealized appreciation).
In exchange for the acquired fund’s shares, the Fund issuedthe following number of shares:
Shares
Class 1 7,273,180
Class 2 1,137,310
For financial reporting purposes, net assets received andshares issued by the Fund were recorded at fair value;however, the acquired fund’s cost of investments was carriedforward. The financial statements reflect the operations of theFund for the period prior to the merger and the combinedFund for the period subsequent to the merger. Because thecombined investment portfolios have been managed as asingle integrated portfolio since the merger was completed, itis not practicable to separate the amounts of revenue andearnings of the acquired fund that have been included in thecombined Fund’s Statement of Operations since the mergerwas completed.
Assuming the merger had been completed on January 1, 2011,the Fund ‘s pro-forma net investment income, net gain oninvestments, net change in unrealized depreciation and netdecrease in net assets from operations for the year endedDecember 31, 2011, would have been approximately$0.7 million, $26.4 million, $(34.5) million and $(7.4) million,respectively.
Note 10. Significant RisksInformation Technology Sector Risk
The Fund’s portfolio managers may invest significantly inissuers operating in the information technology sector. TheFund may be more susceptible to the particular risks of thissector than if the Fund were invested in a wider variety ofissuers operating in unrelated sectors.
Note 11. Subsequent EventsManagement has evaluated the events and transactions thathave occurred through the date the financial statements wereissued and noted no items requiring adjustment of thefinancial statements or additional disclosure.
Note 12. Information Regarding Pendingand Settled Legal ProceedingsIn December 2005, without admitting or denying theallegations, American Express Financial Corporation (AEFC,which is now known as Ameriprise Financial, Inc.(Ameriprise Financial)) entered into settlement agreementswith the Securities and Exchange Commission (SEC) andMinnesota Department of Commerce (MDOC) related tomarket timing activities. As a result, AEFC was censured and
24 Annual Report 2012

Columbia Variable Portfolio – Large Cap Growth Fund
Notes to Financial Statements (continued)
December 31, 2012
ordered to cease and desist from committing or causing anyviolations of certain provisions of the Investment AdvisersAct of 1940, the Investment Company Act of 1940, andvarious Minnesota laws. AEFC agreed to pay disgorgement of$10 million and civil money penalties of $7 million. AEFCalso agreed to retain an independent distribution consultant toassist in developing a plan for distribution of all disgorgementand civil penalties ordered by the SEC in accordance withvarious undertakings detailed at www.sec.gov/litigation/admin/ia-2451.pdf. Ameriprise Financial and its affiliateshave cooperated with the SEC and the MDOC in these legalproceedings, and have made regular reports to the funds’Boards of Trustees.
Ameriprise Financial and certain of its affiliates havehistorically been involved in a number of legal, arbitration andregulatory proceedings, including routine litigation, classactions, and governmental actions, concerning matters arisingin connection with the conduct of their business activities.Ameriprise Financial believes that the Funds are not currentlythe subject of, and that neither Ameriprise Financial nor anyof its affiliates are the subject of, any pending legal,arbitration or regulatory proceedings that are likely to have amaterial adverse effect on the Funds or the ability ofAmeriprise Financial or its affiliates to perform under theircontracts with the Funds. Ameriprise Financial is required tomake 10-Q, 10-K and, as necessary, 8-K filings with theSecurities and Exchange Commission on legal and regulatorymatters that relate to Ameriprise Financial and its affiliates.Copies of these filings may be obtained by accessing the SECwebsite at www.sec.gov.
There can be no assurance that these matters, or the adversepublicity associated with them, will not result in increasedfund redemptions, reduced sale of fund shares or other adverseconsequences to the Funds. Further, although we believeproceedings are not likely to have a material adverse effect onthe Funds or the ability of Ameriprise Financial or its affiliatesto perform under their contracts with the Funds, theseproceedings are subject to uncertainties and, as such, we areunable to estimate the possible loss or range of loss that mayresult. An adverse outcome in one or more of theseproceedings could result in adverse judgments, settlements,fines, penalties or other relief that could have a materialadverse effect on the consolidated financial condition orresults of operations of Ameriprise Financial.
Annual Report 2012 25

Columbia Variable Portfolio – Large Cap Growth Fund
Report of Independent Registered Public Accounting Firm
To the Trustees of Columbia Funds Variable Series Trust II and the Shareholders ofColumbia Variable Portfolio — Large Cap Growth Fund
In our opinion, the accompanying statement of assets and liabilities, including the portfolio of investments, and the relatedstatements of operations and of changes in net assets and the financial highlights present fairly, in all material respects, thefinancial position of Columbia Variable Portfolio — Large Cap Growth Fund (the “Fund”) (a series of Columbia Funds VariableSeries Trust II) at December 31, 2012, the results of its operations, the changes in its net assets and the financial highlights for theyear then ended, in conformity with accounting principles generally accepted in the United States of America. These financialstatements and financial highlights (hereafter referred to as “financial statements”) are the responsibility of the Fund’smanagement. Our responsibility is to express an opinion on these financial statements based on our audit. We conducted our auditof these financial statements in accordance with the standards of the Public Company Accounting Oversight Board (UnitedStates). Those standards require that we plan and perform the audit to obtain reasonable assurance about whether the financialstatements are free of material misstatement. An audit includes examining, on a test basis, evidence supporting the amounts anddisclosures in the financial statements, assessing the accounting principles used and significant estimates made by management,and evaluating the overall financial statement presentation. We believe that our audit, which included confirmation of securities atDecember 31, 2012 by correspondence with the custodian, transfer agent and brokers, provides a reasonable basis for our opinion.The statement of changes in net assets and the financial highlights of the Fund for the periods ended December 31, 2011 and priorwere audited by another independent registered public accounting firm whose report dated February 17, 2012 expressed anunqualified opinion on those statements and highlights.
PricewaterhouseCoopers LLPMinneapolis, MinnesotaFebruary 19, 2013
26 Annual Report 2012

Columbia Variable Portfolio – Large Cap Growth Fund
Trustees and Officers
Shareholders elect the Board that oversees the funds’ operations. The Board appoints officers who are responsible for day-to-daybusiness decisions based on policies set by the Board. The following table provides basic biographical information about thefunds’ Board members, including their principal occupations during the past five years, although specific titles for individualsmay have varied over the period. Under current Board policy, members may serve until the next Board meeting after he or shereaches the mandatory retirement age established by the Board, or the fifteenth anniversary of the first Board meeting theyattended as a member of the Board.
Mr. Edward J. Boudreau, Jr., Mr. William P. Carmichael, Mr. William A. Hawkins, Mr. R. Glenn Hilliard, Ms. Minor M. Shawand Dr. Anthony M. Santomero, were members of the Legacy Columbia Nations funds’ Board (“Nations Funds”), which includesColumbia Funds Series Trust, Columbia Funds Variable Insurance Trust I and Columbia Funds Master Investment Trust, LLCand began service on the Board for the Legacy RiverSource funds (“RiverSource Funds”) effective June 1, 2011.
Independent Trustees
Name,Address,Year of Birth
Position HeldWith Funds andLength of Service Principal Occupation During Past Five Years
Number ofFunds in theFund FamilyOverseen byBoard Member
Other Present orPast Directorships/Trusteeships(Within Past 5 Years)
Kathleen Blatz901 S. Marquette Ave.Minneapolis, MN 554021954
Board membersince 1/06 forRiverSource Fundsand since 6/11 forNations Funds
Attorney; Chief Justice, Minnesota SupremeCourt, 1998-2006
152 None
Edward J. Boudreau, Jr.225 Franklin StreetBoston, MA 021101944
Board membersince 6/11 forRiverSource Fundsand since 1/05 forNations Funds
Managing Director, E.J. Boudreau & Associates(consulting) since 2000
145 Former Trustee, BofAFunds Series Trust(11 funds)
Pamela G. Carlton901 S. Marquette Ave.Minneapolis, MN 554021954
Board membersince 7/07 forRiverSource Fundsand since 6/11 forNations Funds
President, Springboard — Partners in CrossCultural Leadership (consulting company)
152 None
William P. Carmichael225 Franklin StreetBoston, MA 021101943
Board membersince 6/11 forRiverSource Fundsand since 1999 forNations Funds
Retired 145 Director, CobraElectronicsCorporation (electronicequipmentmanufacturer); TheFinish Line (athleticshoes and apparel)since July 2003;McMoRan ExplorationCompany (oil and gasexploration anddevelopment) since2010; former Trustee,BofA Funds SeriesTrust (11 funds);former Director,Spectrum Brands, Inc.(consumer products);former Director,Simmons Company(bedding)
Patricia M. Flynn901 S. Marquette Ave.Minneapolis, MN 554021950
Board membersince 11/04 forRiverSource Fundsand since 6/11 forNations Funds
Trustee Professor of Economics andManagement, Bentley University; former Dean,McCallum Graduate School of Business, BentleyUniversity
152 None
Annual Report 2012 27

Columbia Variable Portfolio – Large Cap Growth Fund
Trustees and Officers (continued)
Independent Trustees (continued)
Name,Address,Year of Birth
Position HeldWith Funds andLength of Service Principal Occupation During Past Five Years
Number ofFunds in theFund FamilyOverseen byBoard Member
Other Present orPast Directorships/Trusteeships(Within Past 5 Years)
William A. Hawkins225 Franklin StreetBoston, MA 021101942
Board membersince 6/11 forRiverSource Fundsand since 1/05 forNations Funds
Managing Director, Overton Partners (financialconsulting), since August 2010; President andChief Executive Officer, California General Bank,N.A., January 2008-August 2010
145 Trustee, BofA FundsSeries Trust(11 funds)
R. Glenn Hilliard225 Franklin StreetBoston, MA 021101943
Board membersince 6/11 forRiverSource Fundsand since 1/05 forNations Funds
Chairman and Chief Executive Officer, HilliardGroup LLC (investing and consulting), since April2003; Non-Executive Director & Chairman, CNOFinancial Group, Inc. (insurance), September2003-May 2011
145 Chairman, BofA FundSeries Trust(11 funds); formerDirector, CNOFinancial Group, Inc.(insurance)
Stephen R. Lewis, Jr.901 S. Marquette Ave.Minneapolis, MN 554021939
Chair of the Boardfor RiverSourceFunds since 1/07,Board member forRiverSource Fundssince 1/02 andsince 6/11 forNations Funds
President Emeritus and Professor of EconomicsEmeritus, Carleton College
152 Director, ValmontIndustries, Inc.(manufacturesirrigation systems)since 2002
Catherine James Paglia901 S. Marquette Ave.Minneapolis, MN 554021952
Board membersince 11/04 forRiverSource Fundsand since 6/11 forNations Funds
Director, Enterprise Asset Management, Inc.(private real estate and asset managementcompany)
152 None
Leroy C. Richie901 S. Marquette Ave.Minneapolis, MN 554021941
Board member since2000 for LegacySeligman Funds,since 11/08 forRiverSource Fundsand since 6/11 forNations Funds
Counsel, Lewis & Munday, P.C. since 2004;former Vice President and General Counsel,Automotive Legal Affairs, Chrysler Corporation
152 Lead Outside Director,Digital Ally, Inc. (digitalimaging) sinceSeptember 2005;Infinity, Inc. (oil andgas exploration andproduction); OGEEnergy Corp. (energyand energy services)since November 2007
Minor M. Shaw225 Franklin StreetBoston, MA 021101947
Board membersince 6/11 forRiverSource Fundsand since 2003 forNations Funds
President, Micco LLC (private investments) 145 Director, PiedmontNatural Gas; Director,BlueCross BlueShieldof South Carolinasince April 2008;Former Trustee, BofAFunds Series Trust (11funds)
Alison Taunton-Rigby901 S. Marquette Ave.Minneapolis, MN 554021944
Board membersince 11/02 forRiverSource Fundsand since 6/11 forNations Funds
Chief Executive Officer and Director, RiboNovix,Inc., 2003-2010 (biotechnology); formerPresident, Aquila Biopharmaceuticals
152 Director, Healthways,Inc. (healthmanagementprograms) since 2005;Director, ICI MutualInsurance Company,RRG; Director, AbtAssociates(governmentcontractor)
28 Annual Report 2012

Columbia Variable Portfolio – Large Cap Growth Fund
Trustees and Officers (continued)
Interested Trustee Not Affiliated with Investment Manager*
Name,Address,Year of Birth
Position HeldWith Funds andLength of Service Principal Occupation During Past Five Years
Number ofFunds in theFund FamilyOverseen byBoard Member
Other Present orPast Directorships/Trusteeships(Within Past 5 Years)
Anthony M. Santomero225 Franklin StreetBoston, MA 021101946
Board membersince 6/11 forRiverSource Fundsand since 1/08 forNations Funds
Richard K. Mellon Professor Emeritus of Finance,The Wharton School, University of Pennsylvania,since 2002; Senior Advisor, McKinsey &Company (consulting), 2006-2008
145 Director, RenaissanceReinsurance Ltd. sinceMay 2008; Trustee,Penn Mutual LifeInsurance Company;Director, Citigroupsince 2009; Director,Citibank, N.A. since2009; former Trustee,BofA Funds SeriesTrust (11 funds)
* Dr. Santomero is not an affiliated person of the investment manager or Ameriprise Financial. However, he is currently deemed by the funds to bean “interested person” (as defined in the 1940 Act) of the funds because he serves as a Director of Citigroup, Inc. and Citibank N.A., companiesthat may directly or through subsidiaries and affiliates engage from time-to-time in brokerage execution, principal transactions and lendingrelationships with the funds or accounts advised/managed by the investment manager.
Interested Trustee Affiliated with Investment Manager*
Name,Address,Year of Birth
Position HeldWith Funds andLength of Service Principal Occupation During Past Five Years
Number ofFunds in theFund FamilyOverseen byBoard Member
Other Present orPast Directorships/Trusteeships(Within Past 5 Years)
William F. Truscott53600 AmeripriseFinancial CenterMinneapolis, MN 554741960
Board membersince 11/01 forRiverSource Fundsand since 6/11 forNations Funds;Senior VicePresident since2002
President, Columbia Management InvestmentAdvisers, LLC February 2012, (previouslyPresident, Chairman of the Board and ChiefInvestment Officer, 2001-April 2010); ChiefExecutive Officer, Global Asset Management,Ameriprise Financial, Inc. since September 2012(previously Chief Executive Officer, U.S. AssetManagement & President, Annuities, May 2010-September 2012 and President – U.S. AssetManagement and Chief Investment Officer, 2005-April 2010); President and Chief ExecutiveOfficer, Ameriprise Certificate Company 2006-August 2012; Chief Executive Officer, ColumbiaManagement Investment Distributors, Inc. sinceFebruary 2012, (previously Chairman of the Boardand Chief Executive Officer, 2006-April 2010);Chairman of the Board and Chief ExecutiveOfficer, RiverSource Distributors, Inc. since 2006
204 Chairman of theBoard, ColumbiaManagementInvestment Advisers,LLC since May 2012;Director, ColumbiaManagementInvestmentDistributors, Inc. sinceMay 2010; Director,Ameriprise CertificateCompany, 2006 –January 2013
* Interested person (as defined under the 1940 Act) by reason of being an officer, director, security holder and/or employee of the investmentmanager or Ameriprise Financial.
The SAI has additional information about the Fund’s Board members and is available, without charge, upon request by calling800.345.6611 or contacting your financial intermediary.
Annual Report 2012 29

Columbia Variable Portfolio – Large Cap Growth Fund
Trustees and Officers (continued)
The Board has appointed officers who are responsible for day-to-day business decisions based on policies it has established. Theofficers serve at the pleasure of the Board. In addition to Mr. Truscott, who is Senior Vice President, the funds’ other officers are:
Officers
Name,Address,Year of Birth
Position HeldWith Funds andLength of Service Principal Occupation During Past Five Years
J. Kevin Connaughton225 Franklin StreetBoston, MA 021101964
President andPrincipal ExecutiveOfficer since 5/10for RiverSourceFunds and 2009for Nations Funds
Senior Vice President and General Manager — Mutual Fund Products, ColumbiaManagement Investment Advisers, LLC since May 2010; Managing Director of ColumbiaManagement Advisors, LLC, December 2004-April 2010; Senior Vice President and ChiefFinancial Officer, Columbia Funds, June 2008-January 2009; Treasurer, Columbia Funds,October 2003-May 2008
Amy K. Johnson5228 Ameriprise FinancialCenterMinneapolis, MN 554741965
Vice Presidentsince 12/06 forRiverSource Fundsand 5/10 forNations Funds
Senior Vice President and Chief Operating Officer, Columbia Management InvestmentAdvisers, LLC since May 2010 (previously Chief Administrative Officer, 2009-April 2010and Vice President — Asset Management and Trust Company Services, 2006-2009)
Michael G. Clarke225 Franklin StreetBoston, MA 021101969
Treasurer since1/11 and ChiefFinancial Officersince 4/11RiverSource Fundsand Treasurersince 3/11 andChief FinancialOfficer since 2009for Nations Funds
Vice President, Columbia Management Investment Advisers, LLC since May 2010;Managing Director of Fund Administration, Columbia Management Advisors, LLC,September 2004-April 2010; senior officer of Columbia Funds and affiliated funds since2002
Scott R. Plummer5228 Ameriprise FinancialCenterMinneapolis, MN 554741959
Senior VicePresident andChief Legal Officersince 12/06 andAssistant Secretarysince 6/11 forRiverSource Fundsand Senior VicePresident andChief Legal Officersince 5/10 andAssistant Secretarysince 6/11 forNations Funds
Senior Vice President, Chief Legal Officer and Assistant Secretary, Columbia ManagementInvestment Advisers, LLC since June 2005; Vice President and Lead Chief Counsel —Asset Management, Ameriprise Financial, Inc. since May 2010 (previously Vice Presidentand Chief Counsel — Asset Management, 2005-April 2010); Vice President, ChiefCounsel and Assistant Secretary, Columbia Management Investment Distributors, Inc.since 2008; Vice President, General Counsel and Secretary, Ameriprise CertificateCompany since 2005; Chief Counsel, RiverSource Distributors, Inc. since 2006
Colin Moore225 Franklin StreetBoston, MA 021101958
Senior VicePresident since5/10 forRiverSource Fundsand Nations Funds
Director and Chief Investment Officer, Columbia Management Investment Advisers, LLCsince May 2010; Manager, Managing Director and Chief Investment Officer, ColumbiaManagement Advisors, LLC, 2007-April 2010
Thomas P. McGuire225 Franklin StreetBoston, MA 021101972
Chief ComplianceOfficersince 3/12
Vice President-Asset Management Compliance, Columbia Management InvestmentAdvisers, LLC since 2010; Chief Compliance Officer, Ameriprise Certificate Companysince September 2010; Compliance Executive, Bank of America, 2005-2010
Stephen T. Welsh225 Franklin StreetBoston, MA 021101957
Vice Presidentsince 4/11 forRiverSource Fundsand 2006 forNations Funds
President and Director, Columbia Management Investment Services Corp. since May2010; President and Director, Columbia Management Services, Inc., July 2004-April2010; Managing Director, Columbia Management Distributors, Inc., August 2007-April2010
30 Annual Report 2012

Columbia Variable Portfolio – Large Cap Growth Fund
Trustees and Officers (continued)
Officers (continued)
Name,Address,Year of Birth
Position HeldWith Funds andLength of Service Principal Occupation During Past Five Years
Christopher O. Petersen5228 Ameriprise FinancialCenterMinneapolis, MN 554741970
Vice President andSecretary since4/11 forRiverSource Fundsand 3/11 forNations Funds
Vice President and Chief Counsel, Ameriprise Financial since January 2010 (formerly VicePresident and Group Counsel or Counsel, April 2004-January 2010); Assistant Secretaryof Legacy RiverSource Funds, January 2007-April 2011 and of the Nations Funds, May2010-March 2011
Paul D. Pearson10468 Ameriprise FinancialCenterMinneapolis, MN 554741956
Vice Presidentsince 4/11 andAssistant Treasurersince 1999 forRiverSource Fundsand Vice Presidentand AssistantTreasurer since6/11 for NationsFunds
Vice President — Investment Accounting, Columbia Management Investment Advisers,LLC, since May 2010; Vice President — Managed Assets, Investment Accounting,Ameriprise Financial Corporation, February 1998-May 2010
Joseph F. DiMaria225 Franklin StreetBoston, MA 021101968
Vice President andChief AccountingOfficer since 4/11and Vice Presidentsince 3/11 andChief AccountingOfficer since 2008for Nations Funds
Vice President, Mutual Fund Administration, Columbia Management Investment Advisers,LLC, since May 2010; Director of Fund Administration, Columbia Management Advisors,LLC, January 2006-April 2010
Paul B. Goucher100 Park AvenueNew York, NY 100171968
Vice Presidentsince 4/11 andAssistant Secretarysince 11/08 forRiverSource Fundsand 5/10 forNations Funds
Vice President and Lead Chief Counsel, Ameriprise Financial, Inc. since November 2008and January 2013, respectively (formerly, Chief Counsel from January 2010 – January2013 and Group Counsel from November 2008 – January 2010); Director, ManagingDirector and General Counsel, J. & W. Seligman & Co. Incorporated, July 2008 –November 2008 (previously, Managing Director and Associate General Counsel, January2005 – July 2008)
Michael E. DeFao225 Franklin StreetBoston, MA 021101968
Vice Presidentsince 4/11 andAssistant Secretarysince 5/10 forRiverSource Fundsand 2011 forNations Funds
Vice President and Chief Counsel, Ameriprise Financial since May 2010; AssociateGeneral Counsel Bank of America, June 2005-April 2010
Annual Report 2012 31

Columbia Variable Portfolio – Large Cap Growth Fund
[THIS PAGE INTENTIONALLY LEFT BLANK]
32 Annual Report 2012
Columbia Variable Portfolio – Large Cap Growth Fund
Important Information About This Report
The policy of the Board is to vote the proxies of the companies in which each fund holds investments consistent with theprocedures as stated in the Statement of Additional Information (SAI). You may obtain a copy of the SAI without charge bycalling 800.345.6611; contacting your financial intermediary; or searching the website of the Securities and ExchangeCommission (SEC) at sec.gov. Information regarding how each fund voted proxies relating to portfolio securities is filed with theSEC by August 31 for the most recent 12-month period ending June 30 of that year, and is available without charge by visitingcolumbiamanagement.com; or searching the website of the SEC at sec.gov.
Each fund files a complete schedule of portfolio holdings with the SEC for the first and third quarters of each fiscal year onForm N-Q. Each fund’s Form N-Q is available on the SEC’s website at sec.gov and may be reviewed and copied at the SEC’sPublic Reference Room in Washington, D.C. Information on the operation of the Public Reference Room may be obtained bycalling 800.SEC.0330. Each fund’s complete schedule of portfolio holdings, as filed on Form N-Q, can also be obtained withoutcharge, upon request, by calling 800.345.6611.
Annual Report 2012 33

Columbia Variable Portfolio – Large Cap Growth FundP.O. Box 8081Boston, MA 02266-8081
This information is for use with concurrent or prior delivery of a fund prospectus. Please carefully consider theinvestment objectives, risks, charges and expenses of any variable fund and its related variable contract beforeinvesting. For variable fund and variable contract prospectuses, which contain this and other important information,contact your financial advisor or insurance representative. Please read the prospectus carefully before you invest. TheFund is distributed by Columbia Management Investment Distributors, Inc., member FINRA, and managed byColumbia Management Investment Advisers, LLC.© 2013 Columbia Management Investment Advisers, LLC. All rights reserved.
S-6464 C (3/13)

Columbia Variable Portfolio — Money Market Fund
Not FDIC insured • No bank guarantee • May lose value
Annual Report
December 31, 2012
Please carefully consider the investment objectives, risks, charges and expenses of any variable fund and its related variablecontract before investing. For variable fund and variable contract prospectuses, which contain this and other importantinformation, contact your financial advisor or insurance representative. Please read the prospectus carefully before you invest.


Table of Contents
Performance Overview.............................................................2
Portfolio Overview ...................................................................3
Understanding Your Fund’s Expenses .......................................4
Portfolio of Investments ..........................................................5
Statement of Assets and Liabilities..........................................9
Statement of Operations .......................................................10
Statement of Changes in Net Assets......................................11
Financial Highlights...............................................................12
Notes to Financial Statements...............................................13
Report of Independent RegisteredPublic Accounting Firm ..........................................................17
Trustees and Officers............................................................18
Important Information About This Report ................................21
Annual Report 2012
Columbia Variable Portfolio — Money Market Fund
The views expressed in this report reflect
the current views of the respective parties.
These views are not guarantees of future
performance and involve certain risks,
uncertainties and assumptions that are
difficult to predict, so actual outcomes and
results may differ significantly from the
views expressed. These views are subject to
change at any time based upon economic,
market or other conditions and the
respective parties disclaim any
responsibility to update such views. These
views may not be relied on as investment
advice and, because investment decisions
for a Columbia Fund are based on numerous
factors, may not be relied on as an
indication of trading intent on behalf of any
particular Columbia Fund. References to
specific securities should not be construed
as a recommendation or investment advice.

2 Annual Report 2012
Performance Overview
Performance Summary
> Columbia Variable Portfolio — Money Market Fund (the Fund) Class 1 shares returned 0.00% for the 12-month periodthat ended December 31, 2012.
> The 7-day yield for the Fund as of December 31, 2012 was 0.00%. The 7-day yield reflects the earnings of the Fund as ofDecember 31, 2012, while the total return reflects past holding periods.
Average Annual Total Returns (%) (for period ended December 31, 2012)
Inception 1 Year 5 Years 10 Years
Class 1 01/01/89 0.00 0.56 1.68
Performance data quoted represents past performance and current performance may be lower or higher. Past performance is no guarantee
of future results. The investment return and principal value will fluctuate so that shares, when redeemed, may be worth more or less than
the original cost. For current month-end performance information, please contact your insurance company.
Performance results reflect the effect of any fee waivers or reimbursements of fund expenses by Columbia Management Investment
Advisers, LLC and/or any of its affiliates. Absent these fee waivers or expense reimbursement arrangements, performance results would
have been lower.
Investment earnings, if any, are tax-deferred until distributed to shareholders, at which time taxes may become due. Total return
performance includes changes in share price and assumes reinvestment of dividends and capital gains, if any. Performance results reflect
the effect of all fund expenses, but do not include any fees and expenses imposed under your variable annuity contract and/or variable life
insurance policy or qualified pension or retirement plan. If performance results included the effect of these additional charges, they would
be lower.
An investment in the Fund is not bank deposit and is not insured or guaranteed by Federal Deposit Insurance Corporation or any other
government agency. Although the Fund seeks to preserve the value of your investment at $1.00 per share, it is possible to lose money by
investing in the Fund.
Columbia Variable Portfolio — Money Market Fund

3Annual Report 2012
Portfolio Overview
Portfolio Breakdown (%)
(at December 31, 2012)
Asset-Backed Commercial Paper 17.5
Asset-Backed Securities — Non-Agency 3.7
Certificates of Deposit 15.7
Commercial Paper 30.6
Repurchase Agreements 11.6
Treasury Bills 5.8
U.S. Government & Agency Obligations 15.1
Total 100.0
Percentages indicated are based upon total investments. The Fund’s portfolio composition issubject to change.
Columbia Variable Portfolio — Money Market Fund

4 Annual Report 2012
Columbia Variable Portfolio — Money Market Fund
Understanding Your Fund’s Expenses(Unaudited)
As an investor, you incur ongoing costs, which generally include management fees, distribution and/or service (Rule 12b-1)fees, and other fund expenses. The following information is intended to help you understand your ongoing costs (in dollars)of investing in the Fund and to help you compare these costs with the ongoing costs of investing in other mutual funds.
The information below does not reflect fees and expenses imposed under your variable annuity contract and/or variable lifeinsurance policy (collectively, Contracts) or qualified pension and retirement plan (Qualified Plan), if any. The total fees andexpenses you bear may therefore be higher than those shown below.
Analyzing Your Fund’s Expenses
To illustrate these ongoing costs, we have provided examples and calculated the expenses paid by investors in each shareclass of the Fund during the period. The actual and hypothetical information in the table is based on an initial investment of$1,000 at the beginning of the period indicated and held for the entire period. Expense information is calculated two waysand each method provides you with different information. The amount listed in the “Actual” column is calculated using theFund’s actual operating expenses and total return for the period. You may use the Actual information, together with theamount invested, to estimate the expenses that you paid over the period. Simply divide your account value by $1,000 (forexample, an $8,600 account value divided by $1,000 = 8.6), then multiply the results by the expenses paid during the periodunder the Actual column. The amount listed in the “Hypothetical” column assumes a 5% annual rate of return beforeexpenses (which is not the Fund’s actual return) and then applies the Fund’s actual expense ratio for the period to thehypothetical return. You should not use the hypothetical account values and expenses to estimate either your actual accountbalance at the end of the period or the expenses you paid during the period. See “Compare With Other Funds” below fordetails on how to use the hypothetical data.
Compare With Other Funds
Since all mutual funds are required to include the same hypothetical calculations about expenses in shareholder reports, youcan use this information to compare the ongoing cost of investing in the Fund with other funds. To do so, compare thehypothetical example with the 5% hypothetical examples that appear in the shareholder reports of other funds. As youcompare hypothetical examples of other funds, it is important to note that hypothetical examples are meant to highlight theongoing costs of investing in a fund only and do not reflect any transaction costs, such as redemption or exchange fees, orexpenses that apply to the subaccount or the contract. Therefore, the hypothetical calculations are useful in comparingongoing costs only, and will not help you determine the relative total costs of owning different funds. If the fees andexpenses imposed under your Contract or Qualified Plan, if any, were included, your costs would be higher.
July 1, 2012 – December 31, 2012
Account Value at the Beginning Account Value at the End of the Expenses Paid During the Fund’s Annualized
of the Period ($) Period ($) Period ($) Expense Ratio (%)
Actual Hypothetical Actual Hypothetical Actual Hypothetical Actual
Class 1 1,000.00 1,000.00 1,000.00 1,024.52 0.76 0.77 0.15
Expenses paid during the period are equal to the annualized expense ratio for each class as indicated above, multiplied by the averageaccount value over the period and then multiplied by the number of days in the Fund’s most recent fiscal half year and divided by 366.
Expenses do not include fees and expenses incurred indirectly by the Fund from the underlying funds in which the Fund may invest (alsoreferred to as “acquired funds”), including affiliated and non-affiliated pooled investment vehicles (including mutual funds and exchange-traded funds).
Had Columbia Management Investment Advisers, LLC and/or certain of its affiliates not waived/reimbursed certain fees and expenses,account value at the end of the period would have been reduced.

5Annual Report 2012
Portfolio of InvestmentsDecember 31, 2012(Percentages represent value of investments compared to net assets)
Columbia Variable Portfolio — Money Market Fund
The accompanying Notes to Financial Statements are an integral part of this statement.
Fairway Finance Co. LLC(a)
03/18/13 0.210% 2,000,000 1,999,113
Market Street Funding LLC(a)
02/22/13 0.190% 2,000,000 1,999,451
MetLife Short Term Funding LLC(a)
01/15/13 0.150% 2,000,000 1,999,876
Old Line Funding LLC(a)
03/25/13 0.200% 2,000,000 1,999,078
Regency Markets No. 1 LLC01/17/13 0.200% 1,000,000 999,90701/25/13 0.210% 1,000,000 999,853
Thunder Bay Funding LLC(a)
01/07/13 0.130% 2,000,000 1,999,950
Total Asset-Backed Commercial Paper
(Cost: $11,997,228) 11,997,228
Asset-Backed Securities — Non-Agency 3.7%
Coupon Principal
Issuer Rate Amount ($) Value ($)
ABS Other 1.7%
CIT Equipment CollateralSeries 2012-VT1 Class A1(a)
04/22/13 0.441% 74,894 74,894
CNH Equipment TrustSeries 2012-C Class A110/15/13 0.230% 731,500 731,500
GE Equipment Small Ticket LLCSeries 2012-1A Class A1(a)
06/21/13 0.433% 81,494 81,494
Macquarie Equipment Funding TrustSeries 2012-A Class A1(a)
10/21/13 0.290% 227,955 227,955
Wheels SPV LLCSeries 2012-1 Class A1(a)
05/20/13 0.500% 43,575 43,575
Total 1,159,418
Car Loan 2.0%
AmeriCredit Automobile Receivables TrustSeries 2012-5 Class A112/09/13 0.270% 277,301 277,301
Ford Credit Auto Lease TrustSeries 2012-B Class A1(a)
10/15/13 0.230% 261,585 261,585
Asset-Backed Commercial Paper 17.5%
Par ($)/
Effective Principal ($)/
Issuer Yield Shares Value ($)
Asset-Backed Securities — Non-Agency (continued)
Coupon Principal
Issuer Rate Amount ($) Value ($)
SMART TrustSeries 2012-4US Class A110/14/13 0.290% 382,281 382,281
Westlake Automobile Receivables TrustSeries 2012-1A Class A1(a)
09/16/13 0.426% 463,199 463,199
Total 1,384,366
Total Asset-Backed Securities — Non-Agency
(Cost: $2,543,784) 2,543,784
Certificates of Deposit 15.8%
Par ($)/
Effective Principal ($)/
Issuer Yield Shares Value ($)
BB&T Corp.01/23/13 0.170% 1,500,000 1,500,000
Bank Of Montreal01/03/13 0.050% 2,500,000 2,500,000
Canadian Imperial Bank of Commerce01/07/13 0.110% 2,500,000 2,500,000
Royal Bank of Canada01/02/13 0.050% 2,300,000 2,300,000
Toronto Dominion Bank01/14/13 0.200% 2,000,000 2,000,000
Total Certificates of Deposit
(Cost: $10,800,000) 10,800,000
Commercial Paper 30.6%
Banking 8.8%
Bank of Nova Scotia Trust Co.01/02/13 0.050% 2,500,000 2,499,993
HSBC Bank PLC01/02/13 0.110% 1,500,000 1,499,991
State Street Corp.01/10/13 0.160% 2,000,000 1,999,910
Total 5,999,894
Consumer Products 2.2%
Procter & Gamble Co. (The)(a)
01/14/13 0.150% 1,500,000 1,499,913

6 Annual Report 2012
Portfolio of Investments (continued)December 31, 2012
Columbia Variable Portfolio — Money Market Fund
The accompanying Notes to Financial Statements are an integral part of this statement.
Integrated Energy 5.8%
Chevron Corp.(a)
01/18/13 0.110% 2,000,000 1,999,887
Exxon Mobil Corp.01/07/13 0.010% 2,000,000 1,999,995
Total 3,999,882
Non-Captive Diversified 3.6%
General Electric Capital Corp.01/04/13 0.020% 2,500,000 2,499,994
Pharmaceuticals 5.8%
Merck & Co., Inc.01/28/13 0.100% 2,000,000 1,999,850
Roche Holdings, Inc.(a)
01/17/13 0.110% 2,000,000 1,999,893
Total 3,999,743
Property & Casualty 1.5%
Travelers Companies, Inc. (The)(a)
01/16/13 0.090% 1,000,000 999,962
Retailers 2.9%
Wal-Mart Stores, Inc.01/24/13 0.090% 2,000,000 1,999,879
Total Commercial Paper
(Cost: $20,999,267) 20,999,267
Treasury Bills 5.8%
U.S. Treasury Bills01/03/13 0.000% 4,000,000 4,000,000
Total Treasury Bills
(Cost: $4,000,000) 4,000,000
Commercial Paper (continued)
Par ($)/
Effective Principal ($)/
Issuer Yield Shares Value ($)
U.S. Government & Agency Obligations 15.2%
Par ($)/
Effective Principal ($)/
Issuer Yield Shares Value ($)
Federal Home Loan Banks01/09/13 0.020% 3,000,000 2,999,98201/18/13 0.010% 1,000,000 999,99501/23/13 0.020% 1,000,000 999,98801/28/13 0.020% 2,000,000 1,999,97002/06/13 0.050% 3,000,000 2,999,83512/23/13 0.250% 400,000 400,000
Total U.S. Government & Agency Obligations
(Cost: $10,399,770) 10,399,770
Repurchase Agreements 11.7%
RBC Capital Markets LLC dated 12/31/12, due 01/02/13 at 2.000%, collateralized by U.S. Treasury obligation maturing 07/15/14, market value $8,160,055 (repurchase proceeds $8,000,067) 0.150% 8,000,000 8,000,000
Total Repurchase Agreements
(Cost: $8,000,000) 8,000,000
Total Investments
(Cost: $68,740,049) 68,740,049
Other Assets & Liabilities, Net (186,871)
Net Assets 68,553,178
Notes to Portfolio of Investments
(a) Security exempt from registration pursuant to Rule 144A under the Securities Act of 1933. This security may be resold in transactionsexempt from registration, normally to qualified institutional buyers. At December 31, 2012, the value of these securities amounted to$17,649,825 or 25.75% of net assets.

7Annual Report 2012
Portfolio of Investments (continued)December 31, 2012
Fair Value Measurements
Generally accepted accounting principles (GAAP) require disclosure regarding the inputs and valuation techniques used to measure fair valueand any changes in valuation inputs or techniques. In addition, investments shall be disclosed by major category.
The Fund categorizes its fair value measurements according to a three-level hierarchy that maximizes the use of observable inputs andminimizes the use of unobservable inputs by prioritizing that the most observable input be used when available. Observable inputs are thosethat market participants would use in pricing an investment based on market data obtained from sources independent of the reporting entity.Unobservable inputs are those that reflect the Fund’s assumptions about the information market participants would use in pricing aninvestment. An investment’s level within the fair value hierarchy is based on the lowest level of any input that is deemed significant to theasset or liability’s fair value measurement. The input levels are not necessarily an indication of the risk or liquidity associated withinvestments at that level. For example, certain U.S. government securities are generally high quality and liquid, however, they are reflected asLevel 2 because the inputs used to determine fair value may not always be quoted prices in an active market.
Fair value inputs are summarized in the three broad levels listed below:
> Level 1 — Valuations based on quoted prices for investments in active markets that the Fund has the ability to access at themeasurement date (including NAV for open-end mutual funds). Valuation adjustments are not applied to Level 1 investments.
> Level 2 — Valuations based on other significant observable inputs (including quoted prices for similar securities, interest rates,prepayment speeds, credit risks, etc.).
> Level 3 — Valuations based on significant unobservable inputs (including the Fund’s own assumptions and judgment in determining thefair value of investments).
Inputs that are used in determining fair value of an investment may include price information, credit data, volatility statistics, and otherfactors. These inputs can be either observable or unobservable. The availability of observable inputs can vary between investments, and isaffected by various factors such as the type of investment, and the volume and level of activity for that investment or similar investments inthe marketplace. The inputs will be considered by the Investment Manager, along with any other relevant factors in the calculation of aninvestment’s fair value. The Fund uses prices and inputs that are current as of the measurement date, which may include periods of marketdislocations. During these periods, the availability of prices and inputs may be reduced for many investments. This condition could cause aninvestment to be reclassified between the various levels within the hierarchy.
Short-term securities are valued using amortized cost, as permitted under Rule 2a-7 of the Investment Company Act of 1940, as amended.Generally, amortized cost approximates the current fair value of these securities, but because the value is not obtained from a quoted price inan active market, such securities are reflected as Level 2.
Investments falling into the Level 3 category are primarily supported by quoted prices from brokers and dealers participating in the market forthose investments. However, these may be classified as Level 3 investments due to lack of market transparency and corroboration to supportthese quoted prices. Additionally, valuation models may be used as the pricing source for any remaining investments classified as Level 3.These models rely on one or more significant unobservable inputs and/or significant assumptions by the Investment Manager. Inputs used invaluations may include, but are not limited to, financial statement analysis, capital account balances, discount rates and estimated cashflows, and comparable company data.
Under the direction of the Fund’s Board of Trustees (the Board), the Investment Manager’s Valuation Committee (the Committee) isresponsible for carrying out the valuation procedures approved by the Board. The Committee consists of voting and non-voting members fromvarious groups within the Investment Manager’s organization, including operations and accounting, trading and investments, compliance, riskmanagement and legal.
The Committee meets at least monthly to review and approve valuation matters, which may include a description of specific valuationdeterminations, data regarding pricing information received from approved pricing vendors and brokers and the results of Board-approvedvaluation control policies and procedures (the Policies). The Policies address, among other things, instances when market quotations arereadily available, including recommendations of third party pricing vendors and a determination of appropriate pricing methodologies; eventsthat require specific valuation determinations and assessment of fair value techniques; securities with a potential for stale pricing, includingthose that are illiquid, restricted, or in default; and the effectiveness of third-party pricing vendors, including periodic reviews of vendors. TheCommittee meets more frequently, as needed, to discuss additional valuation matters, which may include the need to review back-testingresults, review time-sensitive information or approve related valuation actions. The Committee reports to the Board, with members of theCommittee meeting with the Board at each of its regularly scheduled meetings to discuss valuation matters and actions during the period,similar to those described earlier.
For investments categorized as Level 3, the Committee monitors information similar to that described above, which may include: (i) dataspecific to the issuer or comparable issuers, (ii) general market or specific sector news and (iii) quoted prices and specific or similar securitytransactions. The Committee considers this data and any changes from prior periods in order to assess the reasonableness of observableand unobservable inputs, any assumptions or internal models used to value those securities and changes in fair value. This data is also usedto corroborate, when available, information received from approved pricing vendors and brokers. Various factors impact the frequency ofmonitoring this information (which may occur as often as daily). However, the Committee may determine that changes to inputs, assumptionsand models are not required as a result of the monitoring procedures performed.
Columbia Variable Portfolio — Money Market Fund
The accompanying Notes to Financial Statements are an integral part of this statement.
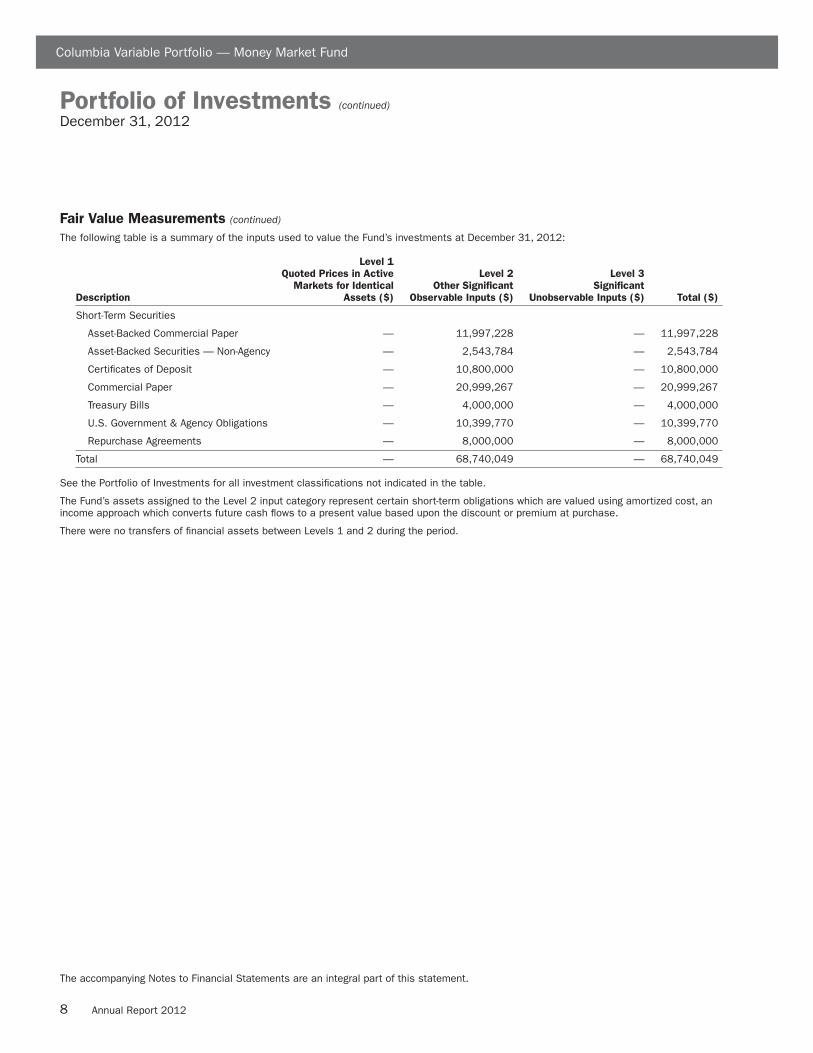
8 Annual Report 2012
Portfolio of Investments (continued)December 31, 2012
Fair Value Measurements (continued)
The following table is a summary of the inputs used to value the Fund’s investments at December 31, 2012:
Level 1
Quoted Prices in Active Level 2 Level 3
Markets for Identical Other Significant Significant
Description Assets ($) Observable Inputs ($) Unobservable Inputs ($) Total ($)
Short-Term Securities
Asset-Backed Commercial Paper — 11,997,228 — 11,997,228
Asset-Backed Securities — Non-Agency — 2,543,784 — 2,543,784
Certificates of Deposit — 10,800,000 — 10,800,000
Commercial Paper — 20,999,267 — 20,999,267
Treasury Bills — 4,000,000 — 4,000,000
U.S. Government & Agency Obligations — 10,399,770 — 10,399,770
Repurchase Agreements — 8,000,000 — 8,000,000
Total — 68,740,049 — 68,740,049
See the Portfolio of Investments for all investment classifications not indicated in the table.
The Fund’s assets assigned to the Level 2 input category represent certain short-term obligations which are valued using amortized cost, anincome approach which converts future cash flows to a present value based upon the discount or premium at purchase.
There were no transfers of financial assets between Levels 1 and 2 during the period.
Columbia Variable Portfolio — Money Market Fund
The accompanying Notes to Financial Statements are an integral part of this statement.

9Annual Report 2012
Statement of Assets and LiabilitiesDecember 31, 2012
Columbia Variable Portfolio — Money Market Fund
The accompanying Notes to Financial Statements are an integral part of this statement.
Assets
Investments, at value
(identified cost $60,740,049) $60,740,049
Repurchase agreements (identified cost $8,000,000) 8,000,000
Total investments (identified cost $68,740,049) 68,740,049
Cash 43,307
Receivable for:
Capital shares sold 12,910
Interest 1,957
Expense reimbursement due from Investment Manager 25,099
Prepaid expenses 755
Trustees’ deferred compensation plan 39,095
Total assets 68,863,172
Liabilities
Payable for:
Capital shares purchased 204,543
Investment management fees 20,501
Transfer agent fees 3,514
Administration fees 8,786
Compensation of board members 172
Chief compliance officer expenses 20
Other expenses 33,363
Trustees’ deferred compensation plan 39,095
Total liabilities 309,994
Net assets applicable to outstanding capital stock $68,553,178
Represented by
Paid-in capital $68,592,175
Excess of distributions over net investment income (34,345)
Accumulated net realized loss (4,652)
Total — representing net assets applicable to outstanding capital stock $68,553,178
Class 1
Net assets $68,553,178
Shares outstanding 68,638,779
Net asset value per share $1.00

10 Annual Report 2012
Statement of OperationsYear Ended December 31, 2012
Columbia Variable Portfolio — Money Market Fund
The accompanying Notes to Financial Statements are an integral part of this statement.
Net investment income
Income:Interest $112,618
Total income 112,618
Expenses:Investment management fees 273,721Transfer agent fees 46,922Administration fees 117,310Compensation of board members 22,809Custodian fees 11,767Printing and postage fees 26,262Professional fees 20,232Other 3,125
Total expenses 522,148Fees waived or expenses reimbursed by Investment Manager and its affiliates (409,530)Total net expenses 112,618Net investment income —
Realized and unrealized gain (loss) — net
Net realized gain (loss) on:Investments (2)
Net realized loss (2)
Net decrease in net assets from operations $(2)

11Annual Report 2012
Statement of Changes in Net Assets
Columbia Variable Portfolio — Money Market Fund
The accompanying Notes to Financial Statements are an integral part of this statement.
Year Ended Year Ended
December 31, December 31,
2012 2011
Operations
Net investment income $ — $ —
Net realized gain (loss) (2) 290
Net increase (decrease) in net assets resulting from operations (2) 290
Increase (decrease) in net assets from capital stock activity (16,414,496) (24,686,233)
Total decrease in net assets (16,414,498) (24,685,943)
Net assets at beginning of year 84,967,676 109,653,619
Net assets at end of year $68,553,178 $84,967,676
Excess of distributions over net investment income $(34,345) $(34,345)
Year Ended December 31, 2012 Year Ended December 31, 2011
Shares Dollars ($) Shares Dollars ($)
Capital stock activity
Class 1 shares
Subscriptions 20,091,597 20,091,597 24,995,324 24,995,324
Redemptions (36,506,093) (36,506,093) (49,681,557) (49,681,557)
Net decrease (16,414,496) (16,414,496) (24,686,233) (24,686,233)
Total net decrease (16,414,496) (16,414,496) (24,686,233) (24,686,233)

12 Annual Report 2012
Financial Highlights
Columbia Variable Portfolio — Money Market Fund
The accompanying Notes to Financial Statements are an integral part of this statement.
The following table is intended to help you understand the Fund’s financial performance. Certain information reflectsfinancial results for a single share of a class held for the periods shown. Per share net investment income (loss) amounts arecalculated based on average shares outstanding during the period. Total return assumes reinvestment of all dividends anddistributions. Total return does not reflect payment of the expenses that apply to the variable accounts or contract charges, ifany, and are not annualized for periods of less than one year.
Year Ended December 31,
Class 1 2012 2011 2010 2009 2008
Per share data
Net asset value, beginning of period $1.00 $1.00 $1.00 $1.00 $1.00
Income from investment operations:
Net investment income — — — 0.00(a) 0.03
Net realized and unrealized gain (loss) (0.00)(a) 0.00(a) (0.00)(a) — 0.00(a)
Total from investment operations (0.00)(a) 0.00(a) (0.00)(a) 0.00(a) 0.03
Less distributions to shareholders:
Net investment income — — (0.00)(a) (0.00)(a) (0.03)
Total distributions to shareholders — — (0.00)(a) (0.00)(a) (0.03)
Net asset value, end of period $1.00 $1.00 $1.00 $1.00 $1.00
Total return 0.00% 0.00% 0.03% 0.23% 2.58%(b)
Ratios to average net assets
Total gross expenses 0.67% 0.69% 0.67% 0.67% 0.64%
Total net expenses(c) 0.14% 0.16%(d) 0.26%(d) 0.44%(d) 0.46%(d)
Net investment income 0.00% 0.00% 0.00% 0.25% 2.56%
Supplemental data
Net assets, end of period (in thousands) $68,553 $84,968 $109,654 $128,732 $164,340
Notes to Financial Highlights
(a) Rounds to less than $0.01.
(b) Had affiliates of the Investment Manager not reimbursed the Fund for realized losses on securities and not provided capital support, totalreturn would have been 1.87%.
(c) Total net expenses include the impact of certain waivers/reimbursements made by the Investment Manager and certain of its affiliates, ifapplicable.
(d) The benefits derived from expense reductions had an impact of less than 0.01%.

13Annual Report 2012
Notes to Financial StatementsDecember 31, 2012
Note 1. Organization
Columbia Variable Portfolio — Money Market Fund (theFund), a series of Columbia Funds Variable Insurance Trust(the Trust), is a diversified fund. The Trust is registered underthe Investment Company Act of 1940, as amended (the1940 Act), as an open-end management investment companyorganized as a Massachusetts business trust.
Fund Shares
The Trust may issue an unlimited number of shares (withoutpar value). The Fund offers Class 1 shares to separate accountsfunding variable annuity contracts and variable life insurancepolicies (collectively, Contracts) issued by affiliated andunaffiliated life insurance companies as well as qualifiedpension and retirement plans (Qualified Plans) and otherqualified institutional investors authorized by ColumbiaManagement Investment Distributors, Inc. (the Distributor).You may not buy (nor will you own) shares of the Funddirectly. You invest by participating in a Qualified Plan orbuying a Contract and making allocations to the Fund.
Note 2. Summary of Significant
Accounting Policies
Use of Estimates
The preparation of financial statements in accordance withU.S. generally accepted accounting principles (GAAP)requires management to make certain estimates andassumptions that affect the reported amounts of assets andliabilities, the disclosure of contingent assets and liabilities atthe date of the financial statements and the reported amountsof revenue and expenses during the reporting period. Actualresults could differ from those estimates.
The following is a summary of significant accounting policiesconsistently followed by the Fund in the preparation of itsfinancial statements.
Security Valuation
Securities in the Fund are valued utilizing the amortized costvaluation method permitted in accordance with Rule 2a-7under the 1940 Act provided certain conditions are met,including that the Board of Trustees (the Board) continues tobelieve that the amortized cost valuation method fairly reflectsthe market-based net asset value per share of the Fund. Thismethod involves valuing a portfolio security initially at its costand thereafter assuming a constant accretion or amortizationto maturity of any discount or premium, respectively. TheBoard has established procedures intended to stabilize theFund’s net asset value for purposes of sales and redemptionsat $1.00 per share. These procedures include determinations,at such intervals as the Board deems appropriate andreasonable in light of current market conditions, of the extent,
if any, to which the Fund’s market-based net asset valuedeviates from $1.00 per share. In the event such deviationexceeds 1/2 of 1%, the Board will promptly consider whataction, if any, should be initiated.
Repurchase Agreements
The Fund may engage in repurchase agreement transactionswith institutions that management has determined arecreditworthy. The Fund, through the custodian, receivesdelivery of the underlying securities collateralizing arepurchase agreement. Management is responsible fordetermining that the collateral is at least equal, at all times, tothe value of the repurchase obligation including interest. Arepurchase agreement transaction involves certain risks in theevent of default or insolvency of the counterparty. These risksinclude possible delays in or restrictions on the Fund’s abilityto dispose of the underlying securities and a possible declinein the value of the underlying securities during the periodwhile the Fund seeks to assert its rights.
Security Transactions
Security transactions are accounted for on the trade date. Costis determined and gains (losses) are based upon the specificidentification method for both financial statement and federalincome tax purposes.
Income Recognition
Interest income is recorded on an accrual basis. Marketpremiums and discounts, including original issue discounts,are amortized and accreted, respectively, over the expected lifeof the security on all debt securities, unless otherwise noted.
Expenses
General expenses of the Trust are allocated to the Fund andother funds of the Trust based upon relative net assets or otherexpense allocation methodologies determined by the nature ofthe expense. Expenses directly attributable to the Fund arecharged to the Fund.
Federal Income Tax Status
The Fund intends to qualify each year as a regulatedinvestment company under Subchapter M of the InternalRevenue Code, as amended, and will distribute substantiallyall of its taxable income, if any, for its tax year, and as suchwill not be subject to federal income taxes. In addition,because the Fund’s sole shareholders are Qualified Investors,the Fund expects not to be subject to federal excise tax.Therefore, no federal income or excise tax provision isrecorded.
Distributions to Subaccounts
Distributions from net investment income, if any, are declareddaily and paid monthly. Net realized capital gains, if any, are
Columbia Variable Portfolio — Money Market Fund

14 Annual Report 2012
Notes to Financial Statements (continued)December 31, 2012
distributed at least annually after the fiscal year in which thecapital gains were earned or more frequently to seek to maintaina net asset value of $1.00 per share, unless offset by anyavailable capital loss carryforward. Income distributions andcapital gain distributions are determined in accordance withfederal income tax regulations, which may differ from GAAP.
Guarantees and Indemnifications
Under the Trust’s organizational documents and, in somecases, by contract, its officers and trustees are indemnifiedagainst certain liabilities arising out of the performance oftheir duties to the Trust or its funds. In addition, certain of theFund’s contracts with its service providers contain generalindemnification clauses. The Fund’s maximum exposureunder these arrangements is unknown since the amount of anyfuture claims that may be made against the Fund cannot bedetermined, and the Fund has no historical basis for predictingthe likelihood of any such claims.
Recent Accounting Pronouncement
Disclosures about Offsetting Assets and LiabilitiesIn December 2011, the Financial Accounting Standards Board(FASB) issued Accounting Standards Update (ASU)No. 2011-11, Disclosures about Offsetting Assets andLiabilities. The objective of the FASB is to enhance currentdisclosure requirements on offsetting of certain assets andliabilities and to enable financial statement users to comparefinancial statements prepared under GAAP and InternationalFinancial Reporting Standards.
Specifically, ASU No. 2011-11 requires an entity to discloseboth gross and net information for derivatives and otherfinancial instruments that are subject to a master nettingarrangement or similar agreement. The standard requiresdisclosure of collateral received in connection with the masternetting agreements or similar agreements. The effective dateof ASU No. 2011-11 is for interim and annual periodsbeginning on or after January 1, 2013. At this time,management is evaluating the implications of this guidanceand the impact it will have on the financial statement amountsand footnote disclosures, if any.
Note 3. Fees and Compensation Paid to
Affiliates
Investment Management Fees
Under an Investment Management Services Agreement,Columbia Management Investment Advisers, LLC (theInvestment Manager), a wholly-owned subsidiary ofAmeriprise Financial, Inc. (Ameriprise Financial), determineswhich securities will be purchased, held or sold. Theinvestment management fee is an annual fee that is equal to apercentage of the Fund’s average daily net assets that declines
from 0.35% to 0.25% as the Fund’s net assets increase. Theannualized effective investment management fee rate for theyear ended December 31, 2012 was 0.35% of the Fund’saverage daily net assets.
Administration Fees
Under an Administrative Services Agreement, the InvestmentManager also serves as the Fund Administrator. The Fund paysthe Fund Administrator an annual fee for administration andaccounting services equal to 0.15% of the Fund’s averagedaily net assets.
Compensation of Board Members
Board members are compensated for their services to the Fundas disclosed in the Statement of Operations. The Trust’s eligibleTrustees may participate in a Deferred Compensation Plan (thePlan) which may be terminated at any time. Obligations of thePlan will be paid solely out of the Fund’s assets.
Compensation of Chief Compliance Officer
The Board has appointed a Chief Compliance Officer to theFund in accordance with federal securities regulations. TheFund pays its pro-rata share of the expenses associated withthe Chief Compliance Officer. The Fund’s expenses for theChief Compliance Officer will not exceed $15,000 per year.
Transfer Agent Fees
The Fund has a Transfer Agency and Dividend DisbursingAgent Agreement with Columbia Management InvestmentServices Corp. (the Transfer Agent), an affiliate of theInvestment Manager and a wholly-owned subsidiary ofAmeriprise Financial. The annual fee rate under thisagreement is 0.06% of the Fund’s average daily net assets. TheTransfer Agent also receives compensation from fees forvarious shareholder services and reimbursements for certainout-of-pocket fees.
Expenses Waived/Reimbursed by the Investment
Manager and its Affiliates
The Investment Manager and certain of its affiliates havecontractually agreed to waive fees and/or reimburse expenses(excluding certain fees and expenses described below), throughApril 30, 2013, unless sooner terminated at the sole discretionof the Board, so that the Fund’s net operating expenses, aftergiving effect to fees waived/expenses reimbursed and anybalance credits and/or overdraft charges from the Fund’scustodian, do not exceed the annual rate of 0.45% of theFund’s average daily net assets attributable to Class 1 shares.
Under the agreement governing these fee waivers and/orexpense reimbursement arrangements, the following fees andexpenses are excluded from the waiver/reimbursementcommitment, and therefore will be paid by the Fund, if
Columbia Variable Portfolio — Money Market Fund

15Annual Report 2012
Notes to Financial Statements (continued)December 31, 2012
Columbia Variable Portfolio — Money Market Fund
applicable: taxes (including foreign transaction taxes), expensesassociated with investments in affiliated and non-affiliatedpooled investment vehicles (including mutual funds andexchange traded funds), transaction costs and brokeragecommissions, costs related to any securities lending program,dividend expenses associated with securities sold short,inverse floater program fees and expenses, transaction chargesand interest on borrowed money, interest, extraordinaryexpenses and any other expenses the exclusion of which isspecifically approved by the Board. This agreement may bemodified or amended only with approval from all parties.
In addition, the Investment Manager has voluntarily undertakento waive its receipt of certain Fund expenses (consisting ofinvestment management and administration fees) to the extentnecessary in order to maintain a minimum annualized net yieldof 0.00% for the Fund. This arrangement may be modified orterminated by the Investment Manager at any time.
Note 4. Federal Tax Information
The timing and character of income and capital gaindistributions are determined in accordance with income taxregulations, which may differ from GAAP because oftemporary or permanent book to tax differences.
At December 31, 2012, these differences are primarily due todiffering treatment for capital loss carryforwards and Trustees’deferred compensation. To the extent these differences arepermanent, reclassifications are made among the componentsof the Fund’s net assets in the Statement of Assets andLiabilities. Temporary differences do not requirereclassifications.
The Fund did not have any permanent differences; therefore,no reclassifications were made to the Statement of Assets andLiabilities.
For the years ended December 31, 2012 and 2011, there wereno distributions.
At December 31, 2012, the components of distributableearnings on a tax basis were as follows:
Undistributed ordinary income $3,608
Accumulated realized loss (4,653)
At December 31, 2012, the cost of investments for federalincome tax purposes was $68,740,049 and the aggregate grossunrealized appreciation and depreciation based on that cost was:
Unrealized appreciation $ —
Unrealized depreciation —
Net unrealized appreciation $ —
The following capital loss carryforward, determined atDecember 31, 2012, may be available to reduce taxable
income arising from future net realized gains on investments,if any, to the extent permitted by the Internal Revenue Code:
Year of Expiration Amount ($)
2013 417
2014 1,707
2015 2,520
2018 6
Unlimited short-term 3
Total 4,653
Unlimited capital loss carryforwards are required to beutilized prior to any capital losses which carry an expirationdate. As a result of this ordering rule, capital losscarryforwards which carry an expiration date may be morelikely to expire unused.
Management of the Fund has concluded that there are nosignificant uncertain tax positions that would requirerecognition in the financial statements. However,management’s conclusion may be subject to review andadjustment at a later date based on factors including, but notlimited to, new tax laws, regulations, and administrativeinterpretations (including relevant court decisions). Generally,the Fund’s federal tax returns for the prior three fiscal yearsremain subject to examination by the Internal RevenueService.
Note 5. Shareholder Concentration
At December 31, 2012, one unaffiliated shareholder accountowned 76.7% of the outstanding shares of the Fund. The Fundhas no knowledge about whether any portion of those shareswas owned beneficially by such account. Subscription andredemption activity by concentrated accounts may have asignificant effect on the operations of the Fund.
Note 6. Line of Credit
The Fund has entered into a revolving credit facility with asyndicate of banks led by JPMorgan Chase Bank N.A.whereby the Fund may borrow for the temporary funding ofshareholder redemptions or for other temporary or emergencypurposes. The credit facility agreement, as amended, which isa collective agreement between the Fund and certain otherfunds managed by the Investment Manager, severally and notjointly, permits collective borrowings up to $500 million.Interest is charged to each participating fund based on itsborrowings at a rate equal to the higher of (i) the overnightfederal funds rate plus 1.00% or (ii) the one-month LIBORrate plus 1.00%. Each borrowing under the credit facilitymatures no later than 60 days after the date of borrowing. TheFund also pays a commitment fee equal to its pro rata share ofthe amount of the credit facility at a rate of 0.08% per annum.

16 Annual Report 2012
Notes to Financial Statements (continued)December 31, 2012
The Fund had no borrowings during the year endedDecember 31, 2012.
Note 7. Proposed Fund Merger
In September 2012, the Board of Trustees approved a proposalto merge the Fund into Columbia Variable Portfolio — CashManagement Fund. Shareholders of the Fund will vote on theproposed merger at a special meeting of shareholders to beheld during the first half of 2013.
Note 8. Subsequent Events
Management has evaluated the events and transactions thathave occurred through the date the financial statements wereissued and noted no items requiring adjustment of thefinancial statements or additional disclosure.
Note 9. Information Regarding Pending
and Settled Legal Proceedings
In December 2005, without admitting or denying theallegations, American Express Financial Corporation (AEFC,which is now known as Ameriprise Financial, Inc. (AmeripriseFinancial)) entered into settlement agreements with theSecurities and Exchange Commission (SEC) and MinnesotaDepartment of Commerce (MDOC) related to market timingactivities. As a result, AEFC was censured and ordered to ceaseand desist from committing or causing any violations of certainprovisions of the Investment Advisers Act of 1940, theInvestment Company Act of 1940, and various Minnesota laws.AEFC agreed to pay disgorgement of $10 million and civilmoney penalties of $7 million. AEFC also agreed to retain anindependent distribution consultant to assist in developing aplan for distribution of all disgorgement and civil penaltiesordered by the SEC in accordance with various undertakingsdetailed at www.sec.gov/litigation/admin/ia-2451.pdf.Ameriprise Financial and its affiliates have cooperated with theSEC and the MDOC in these legal proceedings, and have maderegular reports to the funds’ Boards of Trustees.
Ameriprise Financial and certain of its affiliates havehistorically been involved in a number of legal, arbitration andregulatory proceedings, including routine litigation, classactions, and governmental actions, concerning matters arisingin connection with the conduct of their business activities.Ameriprise Financial believes that the Funds are not currentlythe subject of, and that neither Ameriprise Financial nor any ofits affiliates are the subject of, any pending legal, arbitration orregulatory proceedings that are likely to have a materialadverse effect on the Funds or the ability of AmeripriseFinancial or its affiliates to perform under their contracts withthe Funds. Ameriprise Financial is required to make 10-Q, 10-Kand, as necessary, 8-K filings with the Securities andExchange Commission on legal and regulatory matters that
relate to Ameriprise Financial and its affiliates. Copies ofthese filings may be obtained by accessing the SEC website atwww.sec.gov.
There can be no assurance that these matters, or the adversepublicity associated with them, will not result in increasedfund redemptions, reduced sale of fund shares or other adverseconsequences to the Funds. Further, although we believeproceedings are not likely to have a material adverse effect onthe Funds or the ability of Ameriprise Financial or its affiliatesto perform under their contracts with the Funds, theseproceedings are subject to uncertainties and, as such, we areunable to estimate the possible loss or range of loss that mayresult. An adverse outcome in one or more of theseproceedings could result in adverse judgments, settlements,fines, penalties or other relief that could have a materialadverse effect on the consolidated financial condition orresults of operations of Ameriprise Financial.
Columbia Variable Portfolio — Money Market Fund

Annual Report 2012 17
To the Trustees of Columbia Funds Variable Insurance Trust
and the Shareholders of Columbia Variable Portfolio — Money Market Fund
In our opinion, the accompanying statement of assets and liabilities, including the portfolio of investments, and the relatedstatements of operations and of changes in net assets and the financial highlights present fairly, in all material respects, thefinancial position of Columbia Variable Portfolio — Money Market Fund (the “Fund”) (a series of Columbia Funds VariableInsurance Trust) at December 31, 2012, the results of its operations, the changes in its net assets, and the financial highlightsfor each of the periods indicated, in conformity with accounting principles generally accepted in the United States of America.These financial statements and financial highlights (hereafter referred to as “financial statements”) are the responsibility ofthe Fund’s management. Our responsibility is to express an opinion on these financial statements based on our audit. Weconducted our audit of these financial statements in accordance with the standards of the Public Company AccountingOversight Board (United States). Those standards require that we plan and perform the audit to obtain reasonable assuranceabout whether the financial statements are free of material misstatement. An audit includes examining, on a test basis,evidence supporting the amounts and disclosures in the financial statements, assessing the accounting principles used andsignificant estimates made by management, and evaluating the overall financial statement presentation. We believe that ouraudits, which included confirmation of securities at December 31, 2012 by correspondence with the custodian and brokers,provides a reasonable basis for our opinion.
PricewaterhouseCoopers LLPMinneapolis, MinnesotaFebruary 19, 2013
Columbia Variable Portfolio — Money Market Fund
Report of Independent Registered Public Accounting Firm

Trustees and Officers
Columbia Variable Portfolio — Money Market Fund
18 Annual Report 2012
The Trustees serve terms of indefinite duration. The names, addresses and birth years of the Trustees and Officers of theFunds in Columbia Funds Series Trust I, the year each was first elected or appointed to office, their principal businessoccupations during at least the last five years, the number of Funds overseen by each Trustee and other directorships theyhold are shown below. Each officer listed below serves as an officer of each Fund in Columbia Funds Series Trust I.
Independent Trustees
Name, Address and Year of Birth, Principal Occupation(s) During Past Five Years, Number of Funds in Columbia
Position with Funds, Year First Funds Complex Overseen by Trustee, Other Directorships Held
Elected or Appointed to Office
Independent consultant since 2010; Co-Founder of Baringo Capital LLC (private equity) from 1997 to2008; CEO of Crystal River Capital, Inc. (real estate investment trust) from 2003 to 2010; Oversees52; Jackson Hewitt Tax Service Inc. (tax preparation services from 2004 to 2011); CelgeneCorporation (global biotechnology company); Student Loan Corporation (student loan provider from2005 to 2010); Celgene Corporation (global biotechnology company); The Helios Funds andBrookfield Funds (closed-end funds); Crystal River Capital, Inc. from 2005 to 2010; ParsonsBrinckerhoff from 1995 to 2008; and Apex Silver Mines Ltd. from 2007 to 2009
Rodman L. Drake (Born 1943)c/o Columbia ManagementInvestment Advisers, LLC 225 Franklin Street Boston, MA 02110 Trustee (since 1994) and Chairman of the Board (since 2009)
Independent business executive since May 2006; Executive Vice President — Strategy of UnitedAirlines from December 2002 to May 2006; President of UAL Loyalty Services (airline marketingcompany) from September 2001 to December 2002; Executive Vice President and Chief FinancialOfficer of United Airlines from July 1999 to September 2001. Oversees 52; Nash Finch Company (fooddistributor); Aircastle Limited (aircraft leasing); and SeaCube Container Leasing Ltd. (container leasing)
Douglas A. Hacker (Born 1955)c/o Columbia ManagementInvestment Advisers, LLC 225 Franklin Street Boston, MA 02110 Trustee (since 1996)
Senior Vice President, General Counsel and Corporate Secretary, ConocoPhillips (integrated energycompany) since September 2007; Deputy General Counsel — Corporate Legal Services,ConocoPhillips from August 2006 to August 2007; Partner, Zelle, Hofmann, Voelbel, Mason & GetteLLP (law firm) from March 2005 to July 2006; Adjunct Professor of Law, Northwestern University fromSeptember 2004 to June 2006; Director, UAL Corporation (airline) from February 2006 to July 2006;Chief Administrative Officer and Senior Vice President, Kmart Holding Corporation (consumer goods)from September 2003 to March 2004. Oversees 52; None
Janet Langford Kelly (Born 1957)c/o Columbia ManagementInvestment Advisers, LLC 225 Franklin Street Boston, MA 02110 Trustee (since 1996)
Senior Vice President, Partner and Director of Marketing, Wellington Management Company, LLP(investment adviser) from 1997 to 2010; Chair, Wellington Management Investment Portfolios(commingled non-U.S. investment pools) from 2007 to 2010; Director, Wellington Trust Company, NAand other Wellington affiliates from 1997 to 2010. Oversees 52; None
Nancy T. Lukitsh (Born 1956)c/o Columbia ManagementInvestment Advisers, LLC 225 Franklin Street Boston, MA 02110 Trustee (since 2011)
Partner, Park Avenue Equity Partners (private equity) since February 1999; Dean and Professor,College of Business and Management, University of Maryland from 1992 to 1996. Oversees 52;DynaVox Inc. (speech creation); Lee Enterprises (print media); WR Hambrecht + Co. (financial serviceprovider) from 2000 to 2012; BlackRock Kelso Capital Corporation (investment company)
William E. Mayer (Born 1940)c/o Columbia ManagementInvestment Advisers, LLC 225 Franklin Street Boston, MA 02110 Trustee (since 1994)
Retired. Chief Executive Officer, Federal Home Loan Mortgage Corporation, from 2008 to 2009;Senior Adviser, Global Financial Services Group, Carlyle Group, Inc., from 2007 to 2008; ViceChairman and Chief Financial Officer, U.S. Bancorp, from 1993 to 2007. Oversees 52; CIT Group Inc.(commercial and consumer finance); eBay Inc. (online trading community); MBIA Inc. (financial serviceprovider); E.W. Scripps Co. (print and television media), Building Materials Holding Corp. (buildingmaterials and construction services); and University of Oklahoma Foundation.
David M. Moffett (Born 1952)c/o Columbia ManagementInvestment Advisers, LLC 225 Franklin Street Boston, MA 02110 Trustee (since 2011)
Retired Professor Emeritus, University of Washington, since 2011; Professor of Economics, Universityof Washington from January 1976 to 2011; Ford and Louisa Van Voorhis Professor of PoliticalEconomy, University of Washington from 1993 to 2011; Adjunct Professor of Statistics, University ofWashington from 1980 to 2011; Associate Editor, Journal of Money Credit and Banking from 1993 to2008; consultant on econometric and statistical matters. Oversees 52; None
Charles R. Nelson (Born 1942)c/o Columbia ManagementInvestment Advisers, LLC 225 Franklin Street Boston, MA 02110 Trustee (since 1981)
President, Saint Michael’s College, since August 2007; Director or Trustee of several non-profitorganizations, including Fletcher Allen Health Care, Inc.; University Professor, Boston College fromNovember 2005 to August 2007; Academic Vice President and Dean of Faculties, Boston Collegefrom August 1999 to October 2005. Oversees 52; Liberty All-Star Equity Fund and Liberty All-StarGrowth Fund (closed-end funds)
John J. Neuhauser (Born 1943)c/o Columbia ManagementInvestment Advisers, LLC 225 Franklin Street Boston, MA 02110 Trustee (since 1984)

Columbia Variable Portfolio — Money Market Fund
Trustees and Officers (continued)
19Annual Report 2012
Independent Trustees (continued)
Name, Address and Year of Birth, Principal Occupation(s) During Past Five Years, Number of Funds in Columbia
Position with Funds, Year First Funds Complex Overseen by Trustee, Other Directorships Held
Elected or Appointed to Office
Interested Trustee
Name, Address and Year of Birth, Principal Occupation(s) During Past Five Years, Number of Funds in Columbia
Position with Funds, Year First Funds Complex Overseen by Trustee, Other Directorships Held
Elected or Appointed to Office
The Statement of Additional Information includes additional information about the Trustees of the Funds and is available,without charge, upon request by calling 1-800-345-6611.
The Board has appointed officers who are responsible for day-to-day business decisions based on policies it has established.The officers serve at the pleasure of the Board. In addition to Mr. Truscott, who is Senior Vice President, the Funds’ otherofficers are:
Officers
Name, Year of Birth and Address Principal Occupation(s) During the Past Five Years
Partner, Perkins Coie LLP (law firm). Oversees 52; NonePatrick J. Simpson (Born 1944)c/o Columbia ManagementInvestment Advisers, LLC 225 Franklin Street Boston, MA 02110 Trustee (since 2000)
Retired. General Manager — Global Education Industry from 1994 to 1997, President — ApplicationSystems Division from 1991 to 1994, Chief Financial Officer — US Marketing & Services from 1988to 1991, and Chief Information Officer from 1987 to 1988, IBM Corporation (computer andtechnology). Oversees 52; Enesco Group, Inc. (producer of giftware and home and garden decorproducts) from 2001 to 2006
Anne-Lee Verville (Born 1945)c/o Columbia ManagementInvestment Advisers, LLC 225 Franklin Street Boston, MA 02110 Trustee (since 1998)
President, Columbia Management Investment Advisers, LLC since February 2012, (previouslyPresident, Chairman of the Board and Chief Investment Officer, 2001-April 2010); Chief ExecutiveOfficer, Global Asset Management, Ameriprise Financial, Inc. since September 2012 (previously ChiefExecutive Officer, U.S. Asset Management & President, Annuities, May 2010-September 2012 andPresident — U.S. Asset Management and Chief Investment Officer, 2005-April 2010); President andChief Executive Officer, Ameriprise Certificate Company 2006-August 2012; Chief Executive Officer,Columbia Management Investment Distributors, Inc. since February 2012, (previously Chairman of theBoard and Chief Executive Officer, 2006-April 2010); Chairman of the Board and Chief ExecutiveOfficer, RiverSource Distributors, Inc. since 2006. Oversees 208; Columbia Funds Board.
William F. Truscott (born 1960)53600 Ameriprise Financial CenterMinneapolis, MN 55474Senior Vice President (since 2012)
Senior Vice President and General Manager — Mutual Fund Products, Columbia ManagementInvestment Advisers, LLC since May 2010; President, Columbia Funds, since 2009, and RiverSourceFunds, since May 2010 (previously Senior Vice President and Chief Financial Officer, Columbia Funds,from June 2008 to January 2009, Treasurer, Columbia Funds, from October 2003 to May 2008, andsenior officer of various other affiliated funds since 2000); Managing Director, Columbia ManagementAdvisors, LLC from December 2004 to April 2010.
J. Kevin Connaughton (Born 1964)225 Franklin Street Boston, MA 02110 President (since 2009)
Vice President, Columbia Management Investment Advisers, LLC since May 2010; Managing Directorof Fund Administration, Columbia Management Advisors, LLC, from September 2004 to April 2010;senior officer of Columbia Funds and affiliated funds since 2002.
Michael G. Clarke (Born 1969)225 Franklin Street Boston, MA 02110 Treasurer (since 2011) and ChiefFinancial Officer (since 2009)
Senior Vice President, Chief Legal Officer and Assistant Secretary, Columbia Management InvestmentAdvisers, LLC since June 2005; Vice President and Lead Chief Counsel — Asset Management,Ameriprise Financial, Inc. since May 2010 (previously Vice President and Chief Counsel — AssetManagement, from 2005 to April 2010); Vice President, Chief Counsel and Assistant Secretary,Columbia Management Investment Distributors, Inc. since 2008; Vice President, General Counsel andSecretary, Ameriprise Certificate Company since 2005; Chief Counsel, RiverSource Distributors, Inc.since 2006; Vice President, General Counsel and Secretary, RiverSource Funds sinceDecember 2006; Senior Vice President, Secretary and Chief Legal Officer, Columbia Funds, sinceMay 2010.
Scott R. Plummer (Born 1959)5228 Ameriprise Financial Center Minneapolis, MN 55474 Senior Vice President, AssistantSecretary and Chief Legal Officer(since 2010)

Columbia Variable Portfolio — Money Market Fund
Trustees and Officers (continued)
Officers (continued)
Name, Year of Birth and Address Principal Occupation(s) During the Past Five Years
Colin Moore (Born 1958)225 Franklin Street Boston, MA 02110 Senior Vice President (since 2010)
Director and Chief Investment Officer, Columbia Management Investment Advisers, LLC sinceMay 2010; Manager, Managing Director and Chief Investment Officer of Columbia ManagementAdvisors, LLC from 2007 to April 2010; Head of Equities, Columbia Management Advisors, LLC from2002 to 2007.
Amy Johnson (Born 1965)5228 Ameriprise Financial Center Minneapolis, MN 55474 Vice President (since 2010)
Senior Vice President and Chief Operating Officer, Columbia Management Investment Advisers, LLCsince May 2010 (previously Chief Administrative Officer, from 2009 until April 2010, Vice President —Asset Management and Trust Company Services, from 2006 to 2009, and Vice President —Operations and Compliance from 2004 to 2006).
Joseph F. DiMaria (Born 1968)225 Franklin Street Boston, MA 02110 Vice President (since 2011) andChief Accounting Officer (since 2008)
Vice President, Mutual Fund Administration, Columbia Management Investment Advisers, LLC, sinceMay 2010; Director of Fund Administration, Columbia Management Advisors, LLC from January 2006to April 2010; Head of Tax/Compliance and Assistant Treasurer, Columbia Management Advisors,LLC, from November 2004 to December 2005.
Stephen T. Welsh (born 1957)225 Franklin Street Boston, MA 02110 Vice President (since 2006)
President and Director, Columbia Management Investment Services Corp. since May 2010; Presidentand Director, Columbia Management Services, Inc. from July 2004 to April 2010; Managing Director,Columbia Management Distributors, Inc. from August 2007 to April 2010.
Paul D. Pearson (born 1956)10468 Ameriprise Financial Center Minneapolis, MN 55474 Vice President and AssistantTreasurer (since 2011)
Vice President, Investment Accounting, Columbia Management Investment Advisers, LLC, sinceMay 2010; Vice President, Managed Assets, Investment Accounting, Ameriprise FinancialCorporation.
Paul B. Goucher (born 1968)5228 Ameriprise Financial Center Minneapolis, MN 55474 Vice President and AssistantSecretary (since 2010)
Vice President and Lead Chief Counsel, Ameriprise Financial, Inc. since November 2008 and January2013, respectively (formerly, Chief Counsel from January 2010-January 2013 and Group Counsel fromNovember 2008-January 2010); Director, Managing Director and General Counsel, J. & W. Seligman &Co. Incorporated, July 2008-November 2008 (previously, Managing Director and Associate GeneralCounsel, January 2005-July 2008)
Christopher O. Petersen (born 1970)5228 Ameriprise Financial Center Minneapolis, MN 55474 Vice President (since 2010) andSecretary (since 2011)
Vice President and Chief Counsel, Ameriprise Financial since January 2010 (formerly Vice Presidentand Group Counsel or Counsel from April 2004 to January 2010); Assistant Secretary of RiverSourceFunds since January 2007; officer of Columbia Funds and affiliated funds since 2007.
Michael E. DeFao (born 1968)225 Franklin StreetBoston, MA 02110Vice President and AssistantSecretary (since 2011)
Vice President and Chief Counsel, Ameriprise Financial since May 2010; Associate General Counsel,Bank of America from June 2005 to April 2010.
Vice President — Asset Management Compliance, Columbia Management Investment Advisers, LLCsince 2010; Chief Compliance Officer, Ameriprise Certificate Company, since September 2010;Compliance Executive, Bank of America, 2005-2010.
Thomas P. McGuire (Born 1972)225 Franklin Street Boston, MA 02110 Chief Compliance Officer(since 2012)
Annual Report 201220

21Annual Report 2012
The policy of the Board is to vote the proxies of the companies in which each fund holds investments consistent with theprocedures as stated in the Statement of Additional Information (SAI). You may obtain a copy of the SAI without charge bycalling 800.345.6611; contacting your financial intermediary; or searching the website of the Securities and ExchangeCommission (SEC) at sec.gov. Information regarding how each fund voted proxies relating to portfolio securities is filedwith the SEC by August 31 for the most recent 12-month period ending June 30 of that year, and is available without chargeby visiting columbiamanagement.com; or searching the website of the SEC at sec.gov.
Each fund files a complete schedule of portfolio holdings with the SEC for the first and third quarters of each fiscal year onForm N-Q. Each fund’s Form N-Q is available on the SEC’s website at sec.gov and may be reviewed and copied at theSEC’s Public Reference Room in Washington, D.C. Information on the operation of the Public Reference Room may beobtained by calling 800.SEC.0330. Each fund’s complete schedule of portfolio holdings, as filed on Form N-Q, can also beobtained without charge, upon request, by calling 800.345.6611.
Important Information About This Report
Columbia Variable Portfolio — Money Market Fund

This information is for use with concurrent or prior delivery of a fund prospectus. Please carefully consider theinvestment objectives, risks, charges and expenses of any variable fund and its related variable contract beforeinvesting. For variable fund and variable contract prospectuses, which contain this and other importantinformation, contact your financial advisor or insurance representative. Please read the prospectus carefullybefore you invest. The Fund is distributed by Columbia Management Investment Distributors, Inc., member FINRA,and managed by Columbia Management Investment Advisers, LLC. © 2013 Columbia Management Investment Advisers, LLC. All rights reserved.
C-1511 C (3/13)
Columbia Variable Portfolio — Money Market FundP.O. Box 8081Boston, MA 02266-8081

Annual Report
December 31, 2012
Columbia Variable Portfolio — High Income Fund
Not FDIC insured • No bank guarantee • May lose value
Please remember that you may not buy (nor will you own) shares of the Fund directly. You invest by buying a variable annuitycontract or life insurance policy and allocating your purchase payments to the variable subaccount or variable account (thesubaccounts) that invests in the Fund. Please contact your financial advisor or insurance representative for more information.


Table of Contents
Performance Overview.............................................................2
Manager Discussion of Fund Performance ................................4
Understanding Your Fund’s Expenses .......................................5
Portfolio of Investments ..........................................................6
Statement of Assets and Liabilities........................................22
Statement of Operations .......................................................24
Statement of Changes in Net Assets......................................25
Financial Highlights...............................................................27
Notes to Financial Statements...............................................29
Report of Independent RegisteredPublic Accounting Firm ..........................................................35
Trustees and Officers............................................................36
Important Information About This Report ................................41
Annual Report 2012
The views expressed in this report reflect
the current views of the respective parties.
These views are not guarantees of future
performance and involve certain risks,
uncertainties and assumptions that are
difficult to predict, so actual outcomes and
results may differ significantly from the
views expressed. These views are subject to
change at any time based upon economic,
market or other conditions and the
respective parties disclaim any
responsibility to update such views. These
views may not be relied on as investment
advice and, because investment decisions
for a Columbia Fund are based on numerous
factors, may not be relied on as an
indication of trading intent on behalf of any
particular Columbia Fund. References to
specific securities should not be construed
as a recommendation or investment advice.
Columbia Variable Portfolio — High Income Fund

2 Annual Report 2012
Performance Overview
Performance Summary
> Columbia Variable Portfolio — High Income Fund (the Fund) Class 1 shares returned 15.06% for the 12-month periodthat ended December 31, 2012.
> The Fund outperformed its benchmark, the Credit Suisse High Yield Index, which returned 14.71% for the same time period.
> The Fund’s asset allocation and security selection added value in an already strong market.
Average Annual Total Returns (%) (for period ended December 31, 2012)
Inception 1 Year 5 Years 10 Years
Class 1 07/07/00 15.06 8.28 9.68
Class 2* 05/01/06 15.00 8.22 9.63
Credit Suisse High Yield Index 14.71 9.53 10.24
Performance data quoted represents past performance and current performance may be lower or higher. Past performance is no guarantee
of future results. The investment return and principal value will fluctuate so that shares, when redeemed, may be worth more or less than
the original cost. For current month-end performance information, please contact your insurance company.
Performance results reflect the effect of any fee waivers or reimbursements of fund expenses by Columbia Management Investment
Advisers, LLC and/or any of its affiliates. Absent these fee waivers or expense reimbursement arrangements, performance results would
have been lower.
Investment earnings, if any, are tax-deferred until distributed to shareholders, at which time taxes may become due. Total return
performance includes changes in share price and assumes reinvestment of dividends and capital gains, if any. Performance results reflect
the effect of all fund expenses, but do not include any fees and expenses imposed under your variable annuity contract and/or variable life
insurance policy or qualified pension or retirement plan. If performance results included the effect of these additional charges, they would
be lower.
*The returns shown for periods prior to the share class inception date (including returns for the Life of the Fund, if shown, which are sinceFund inception) include the returns of the Fund’s oldest share class. These returns are adjusted to reflect any higher class-related operatingexpenses of the newer share classes, as applicable. Please visit columbiamanagement.com/variable-products/appended-performance formore information.
The Credit Suisse High Yield Index is a broad-based index that tracks the performance of high-yield bonds.
Indices are not available for investment, are not professionally managed and do not reflect sales charges, fees, brokerage commissions, taxesor other expenses of investing. Securities in the Fund may not match those in an index.
Columbia Variable Portfolio — High Income Fund

3Annual Report 2012
Performance Overview (continued)
Performance of a Hypothetical $10,000 Investment (January 1, 2003 – December 31, 2012)
The chart above shows the change in value of a hypothetical $10,000 investment in Class 1 shares of Columbia Variable Portfolio — HighIncome Fund during the stated time period, and does not reflect the deduction of taxes, if any, that a shareholder may pay on Funddistributions or on the redemption of Fund shares. The returns also do not reflect fees and expenses imposed under your variable annuitycontract and/or variable life insurance policy or qualified pension or retirement plan, if any.
0
5,000
10,000
15,000
$30,000
20,000
25,000$26,520$25,182
12/1212/1112/1012/0912/0812/0712/0612/0512/0412/0301/01/03
Columbia Variable Portfolio — High Income Fund Class 1 ($25,182)
Credit Suisse High Yield Index ($26,520)
Columbia Variable Portfolio — High Income Fund
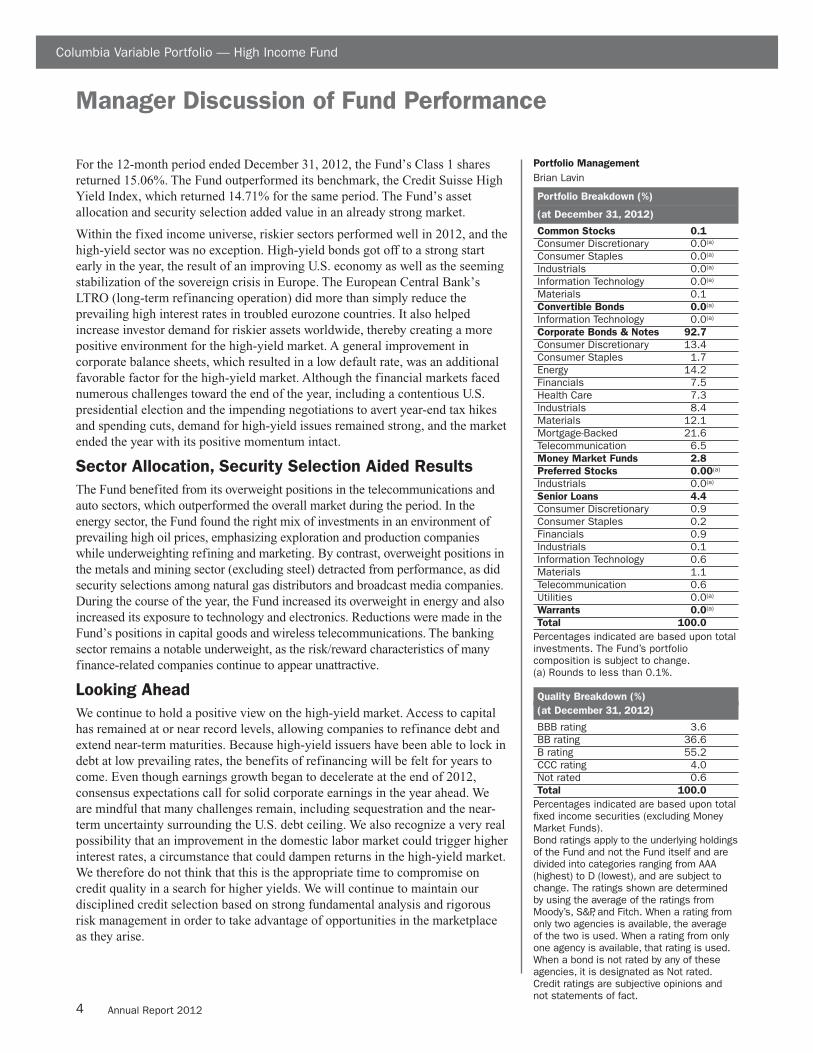
4 Annual Report 2012
Manager Discussion of Fund Performance
For the 12-month period ended December 31, 2012, the Fund’s Class 1 sharesreturned 15.06%. The Fund outperformed its benchmark, the Credit Suisse HighYield Index, which returned 14.71% for the same period. The Fund’s assetallocation and security selection added value in an already strong market.
Within the fixed income universe, riskier sectors performed well in 2012, and thehigh-yield sector was no exception. High-yield bonds got off to a strong startearly in the year, the result of an improving U.S. economy as well as the seemingstabilization of the sovereign crisis in Europe. The European Central Bank’sLTRO (long-term refinancing operation) did more than simply reduce theprevailing high interest rates in troubled eurozone countries. It also helpedincrease investor demand for riskier assets worldwide, thereby creating a morepositive environment for the high-yield market. A general improvement incorporate balance sheets, which resulted in a low default rate, was an additionalfavorable factor for the high-yield market. Although the financial markets facednumerous challenges toward the end of the year, including a contentious U.S.presidential election and the impending negotiations to avert year-end tax hikesand spending cuts, demand for high-yield issues remained strong, and the marketended the year with its positive momentum intact.
Sector Allocation, Security Selection Aided Results
The Fund benefited from its overweight positions in the telecommunications andauto sectors, which outperformed the overall market during the period. In theenergy sector, the Fund found the right mix of investments in an environment ofprevailing high oil prices, emphasizing exploration and production companieswhile underweighting refining and marketing. By contrast, overweight positions inthe metals and mining sector (excluding steel) detracted from performance, as didsecurity selections among natural gas distributors and broadcast media companies.During the course of the year, the Fund increased its overweight in energy and alsoincreased its exposure to technology and electronics. Reductions were made in theFund’s positions in capital goods and wireless telecommunications. The bankingsector remains a notable underweight, as the risk/reward characteristics of manyfinance-related companies continue to appear unattractive.
Looking Ahead
We continue to hold a positive view on the high-yield market. Access to capitalhas remained at or near record levels, allowing companies to refinance debt andextend near-term maturities. Because high-yield issuers have been able to lock indebt at low prevailing rates, the benefits of refinancing will be felt for years tocome. Even though earnings growth began to decelerate at the end of 2012,consensus expectations call for solid corporate earnings in the year ahead. Weare mindful that many challenges remain, including sequestration and the near-term uncertainty surrounding the U.S. debt ceiling. We also recognize a very realpossibility that an improvement in the domestic labor market could trigger higherinterest rates, a circumstance that could dampen returns in the high-yield market.We therefore do not think that this is the appropriate time to compromise oncredit quality in a search for higher yields. We will continue to maintain ourdisciplined credit selection based on strong fundamental analysis and rigorousrisk management in order to take advantage of opportunities in the marketplaceas they arise.
Portfolio Management
Brian Lavin
Portfolio Breakdown (%)
(at December 31, 2012)
Common Stocks 0.1
Consumer Discretionary 0.0(a)
Consumer Staples 0.0(a)
Industrials 0.0(a)
Information Technology 0.0(a)
Materials 0.1Convertible Bonds 0.0(a)
Information Technology 0.0(a)
Corporate Bonds & Notes 92.7
Consumer Discretionary 13.4Consumer Staples 1.7Energy 14.2Financials 7.5Health Care 7.3Industrials 8.4Materials 12.1Mortgage-Backed 21.6Telecommunication 6.5Money Market Funds 2.8
Preferred Stocks 0.00(a)
Industrials 0.0(a)
Senior Loans 4.4
Consumer Discretionary 0.9Consumer Staples 0.2Financials 0.9Industrials 0.1Information Technology 0.6Materials 1.1Telecommunication 0.6Utilities 0.0(a)
Warrants 0.0(a)
Total 100.0
Percentages indicated are based upon totalinvestments. The Fund’s portfoliocomposition is subject to change.(a) Rounds to less than 0.1%.
Quality Breakdown (%)
(at December 31, 2012)
BBB rating 3.6BB rating 36.6B rating 55.2CCC rating 4.0Not rated 0.6Total 100.0
Percentages indicated are based upon totalfixed income securities (excluding MoneyMarket Funds).Bond ratings apply to the underlying holdingsof the Fund and not the Fund itself and aredivided into categories ranging from AAA(highest) to D (lowest), and are subject tochange. The ratings shown are determinedby using the average of the ratings fromMoody’s, S&P, and Fitch. When a rating fromonly two agencies is available, the averageof the two is used. When a rating from onlyone agency is available, that rating is used.When a bond is not rated by any of theseagencies, it is designated as Not rated.Credit ratings are subjective opinions andnot statements of fact.
Columbia Variable Portfolio — High Income Fund

5Annual Report 2012
Columbia Variable Portfolio — High Income Fund
Understanding Your Fund’s Expenses(Unaudited)
As an investor, you incur ongoing costs, which generally include management fees, distribution and/or service (Rule 12b-1)fees, and other fund expenses. The following information is intended to help you understand your ongoing costs (in dollars)of investing in the Fund and to help you compare these costs with the ongoing costs of investing in other mutual funds.
The information below does not reflect fees and expenses imposed under your variable annuity contract and/or variable lifeinsurance policy (collectively, Contracts) or qualified pension and retirement plan (Qualified Plan), if any. The total fees andexpenses you bear may therefore be higher than those shown below.
Analyzing Your Fund’s Expenses
To illustrate these ongoing costs, we have provided examples and calculated the expenses paid by investors in each shareclass of the Fund during the period. The actual and hypothetical information in the table is based on an initial investment of$1,000 at the beginning of the period indicated and held for the entire period. Expense information is calculated two waysand each method provides you with different information. The amount listed in the “Actual” column is calculated using theFund’s actual operating expenses and total return for the period. You may use the Actual information, together with theamount invested, to estimate the expenses that you paid over the period. Simply divide your account value by $1,000 (forexample, an $8,600 account value divided by $1,000 = 8.6), then multiply the results by the expenses paid during the periodunder the Actual column. The amount listed in the “Hypothetical” column assumes a 5% annual rate of return beforeexpenses (which is not the Fund’s actual return) and then applies the Fund’s actual expense ratio for the period to thehypothetical return. You should not use the hypothetical account values and expenses to estimate either your actual accountbalance at the end of the period or the expenses you paid during the period. See “Compare With Other Funds” below fordetails on how to use the hypothetical data.
Compare With Other Funds
Since all mutual funds are required to include the same hypothetical calculations about expenses in shareholder reports, youcan use this information to compare the ongoing cost of investing in the Fund with other funds. To do so, compare thehypothetical example with the 5% hypothetical examples that appear in the shareholder reports of other funds. As youcompare hypothetical examples of other funds, it is important to note that hypothetical examples are meant to highlight theongoing costs of investing in a fund only and do not reflect any transaction costs, such as redemption or exchange fees, orexpenses that apply to the subaccount or the contract. Therefore, the hypothetical calculations are useful in comparingongoing costs only, and will not help you determine the relative total costs of owning different funds. If the fees andexpenses imposed under your Contract or Qualified Plan, if any, were included, your costs would be higher.
July 1, 2012 – December 31, 2012
Account Value at the Beginning Account Value at the End of the Expenses Paid During the Fund’s Annualized
of the Period ($) Period ($) Period ($) Expense Ratio (%)
Actual Hypothetical Actual Hypothetical Actual Hypothetical Actual
Class 1 1,000.00 1,000.00 1,079.00 1,021.63 3.78 3.68 0.72
Class 2 1,000.00 1,000.00 1,078.40 1,021.33 4.10 3.98 0.78
Expenses paid during the period are equal to the annualized expense ratio for each class as indicated above, multiplied by the averageaccount value over the period and then multiplied by the number of days in the Fund’s most recent fiscal half year and divided by 366.
Expenses do not include fees and expenses incurred indirectly by the Fund from the underlying funds in which the Fund may invest (alsoreferred to as “acquired funds”), including affiliated and non-affiliated pooled investment vehicles (including mutual funds and exchange-traded funds).
Had Columbia Management Investment Advisers, LLC and/or certain of its affiliates not waived/reimbursed certain fees and expenses,account value at the end of the period would have been reduced.

6 Annual Report 2012
Portfolio of InvestmentsDecember 31, 2012(Percentages represent value of investments compared to net assets)
Columbia Variable Portfolio — High Income Fund
The accompanying Notes to Financial Statements are an integral part of this statement.
Aerospace & Defense 2.9%
ADS Tactical, Inc.Senior Secured(a)
04/01/18 11.000% 1,254,000 1,279,080
Huntington Ingalls Industries, Inc.03/15/18 6.875% 590,000 641,625
Kratos Defense & Security Solutions, Inc.Senior Secured06/01/17 10.000% 1,673,000 1,836,117
Oshkosh Corp.03/01/17 8.250% 244,000 267,79003/01/20 8.500% 811,000 898,183
TransDigm, Inc.(a)
10/15/20 5.500% 355,000 369,200
Total 5,291,995
Automotive 1.6%
Chrysler Group LLC/Co-Issuer, Inc.Secured06/15/19 8.000% 284,000 309,56006/15/21 8.250% 436,000 479,600
Collins & Aikman Products Co.Senior Subordinated Notes(a)(b)(c)(d)
08/15/12 12.875% 620,000 62
Dana Holding Corp.Senior Unsecured02/15/21 6.750% 38,000 40,755
Lear Corp. Escrow Bond(b)(c)(f)
03/31/16 0.000% 595,000 893
Lear Corp.03/15/20 8.125% 400,000 452,000
Schaeffler Finance BV(a)
Senior Secured02/15/17 7.750% 275,000 305,25002/15/19 8.500% 322,000 362,250
Visteon Corp.04/15/19 6.750% 990,000 1,054,350
Total 3,004,720
Banking 0.4%
Synovus Financial Corp.Senior Unsecured02/15/19 7.875% 599,000 661,895
Brokerage 0.6%
E*TRADE Financial Corp.Senior Unsecured11/15/19 6.375% 511,000 523,775
Corporate Bonds & Notes 92.3%
Coupon Principal
Issuer Rate Amount ($) Value ($)
Corporate Bonds & Notes (continued)
Coupon Principal
Issuer Rate Amount ($) Value ($)
Neuberger Berman Group LLC/Finance Corp.(a)
Senior Unsecured03/15/20 5.625% 221,000 231,49803/15/22 5.875% 331,000 350,860
Total 1,106,133
Building Materials 1.4%
Building Materials Corp. of America(a)
Senior Notes05/01/21 6.750% 210,000 232,050Senior Secured02/15/20 7.000% 440,000 479,600
Gibraltar Industries, Inc.12/01/15 8.000% 472,000 477,900
Interface, Inc.12/01/18 7.625% 660,000 708,675
Norcraft Companies LP/Finance Corp.Secured12/15/15 10.500% 254,000 257,810
Nortek, Inc.12/01/18 10.000% 63,000 70,08704/15/21 8.500% 260,000 288,600
Total 2,514,722
Chemicals 4.6%
Ashland, Inc.(a)
08/15/22 4.750% 264,000 274,560
Celanese U.S. Holdings LLC06/15/21 5.875% 163,000 182,56011/15/22 4.625% 353,000 369,767
Huntsman International LLC(a)
11/15/20 4.875% 203,000 205,284
JM Huber Corp.Senior Notes(a)
11/01/19 9.875% 490,000 543,900
Koppers, Inc.12/01/19 7.875% 565,000 621,500
LyondellBasell Industries NVSenior Unsecured11/15/21 6.000% 1,644,000 1,927,59004/15/24 5.750% 1,039,000 1,220,825
Momentive Performance Materials, Inc.Senior Secured(a)
10/15/20 8.875% 449,000 453,490
Nova Chemicals Corp.Senior Unsecured11/01/19 8.625% 6,000 6,810
Nufarm Australia Ltd.(a)
10/15/19 6.375% 130,000 135,850

7Annual Report 2012
Portfolio of Investments (continued)December 31, 2012
Columbia Variable Portfolio — High Income Fund
The accompanying Notes to Financial Statements are an integral part of this statement.
PQ Corp.Secured(a)
05/01/18 8.750% 1,415,000 1,471,600
Polypore International, Inc.11/15/17 7.500% 545,000 594,050
Rockwood Specialties Group, Inc.10/15/20 4.625% 441,000 456,435
Total 8,464,221
Construction Machinery 2.8%
Ashtead Capital, Inc.Secured(a)
07/15/22 6.500% 132,000 142,560
CNH Capital LLC11/01/16 6.250% 692,000 762,930
Case New Holland, Inc.12/01/17 7.875% 1,663,000 1,966,497
Columbus McKinnon Corp.02/01/19 7.875% 188,000 201,630
H&E Equipment Services, Inc.(a)
09/01/22 7.000% 193,000 205,545
Neff Rental LLC/Finance Corp.Secured(a)
05/15/16 9.625% 739,000 764,865
United Rentals North America, Inc.12/15/19 9.250% 450,000 513,000
United Rentals North America, Inc.(a)
05/15/20 7.375% 223,000 244,185Secured07/15/18 5.750% 269,000 289,848
Total 5,091,060
Consumer Cyclical Services 1.2%
Goodman Networks, Inc.Senior Secured(a)
07/01/18 12.375% 497,000 544,215
Vivint, Inc.Senior Secured(a)
12/01/19 6.375% 1,632,000 1,617,720
Total 2,161,935
Consumer Products 1.3%
Libbey Glass, Inc.Senior Secured05/15/20 6.875% 196,000 210,700
Spectrum Brands Escrow Corp.(a)
Senior Unsecured11/15/20 6.375% 392,000 411,60011/15/22 6.625% 209,000 224,153
Corporate Bonds & Notes (continued)
Coupon Principal
Issuer Rate Amount ($) Value ($)
Corporate Bonds & Notes (continued)
Coupon Principal
Issuer Rate Amount ($) Value ($)
Spectrum Brands, Inc.Senior Secured06/15/18 9.500% 1,220,000 1,384,700
Spectrum Brands, Inc.(a)
03/15/20 6.750% 133,000 142,310
Tempur-Pedic International, Inc.(a)
12/15/20 6.875% 67,000 68,926
Total 2,442,389
Diversified Manufacturing 0.8%
Actuant Corp.06/15/22 5.625% 261,000 270,135
Amsted Industries, Inc.Senior Notes(a)
03/15/18 8.125% 1,095,000 1,171,650
Tomkins LLC/Inc.Secured10/01/18 9.000% 34,000 38,080
Total 1,479,865
Electric 1.3%
AES Corp.Senior Unsecured07/01/21 7.375% 472,000 523,920
CMS Energy Corp.Senior Unsecured03/15/22 5.050% 137,000 152,682
Calpine Corp.Senior Secured(a)
02/15/21 7.500% 387,000 427,635
GenOn Energy, Inc.Senior Unsecured10/15/18 9.500% 401,000 473,180
Ipalco Enterprises, Inc.Senior Secured05/01/18 5.000% 220,000 230,450
Ipalco Enterprises, Inc.(a)
Senior Secured04/01/16 7.250% 525,000 582,750
Total 2,390,617
Entertainment 0.9%
AMC Entertainment, Inc.06/01/19 8.750% 952,000 1,054,340
Cinemark USA, Inc.(a)
12/15/22 5.125% 199,000 201,488
Speedway Motorsports, Inc.02/01/19 6.750% 330,000 349,800
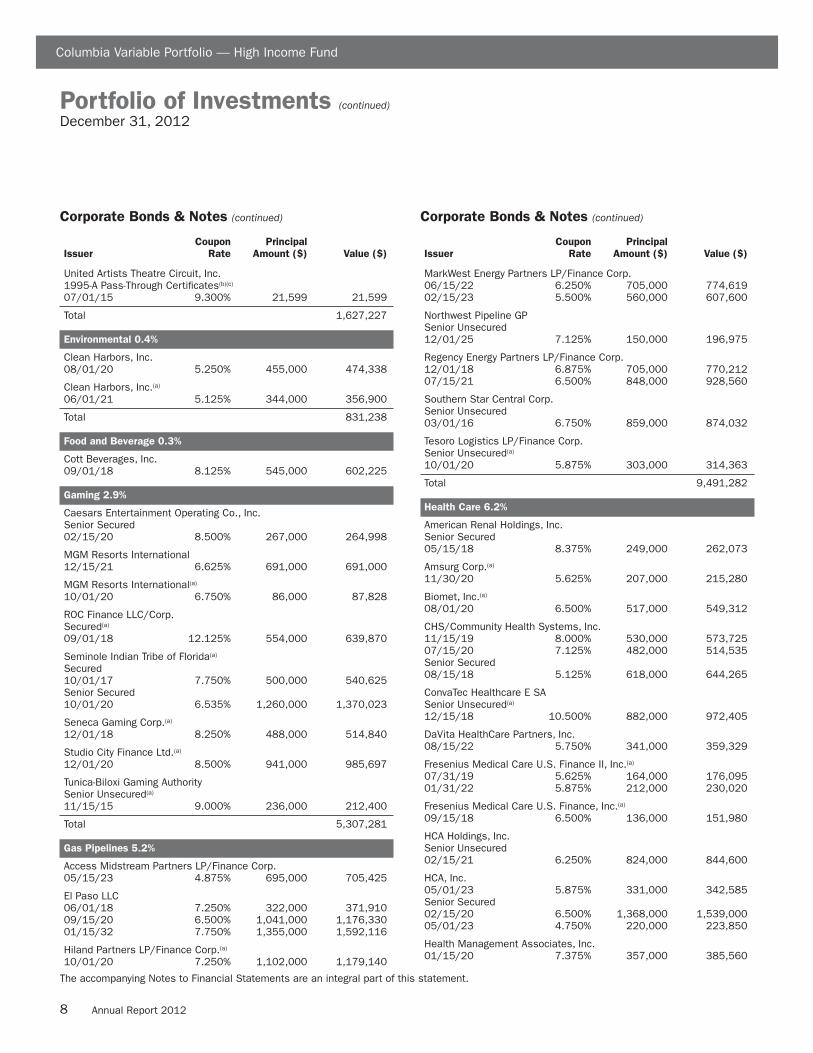
8 Annual Report 2012
Portfolio of Investments (continued)December 31, 2012
Columbia Variable Portfolio — High Income Fund
The accompanying Notes to Financial Statements are an integral part of this statement.
United Artists Theatre Circuit, Inc.1995-A Pass-Through Certificates(b)(c)
07/01/15 9.300% 21,599 21,599
Total 1,627,227
Environmental 0.4%
Clean Harbors, Inc.08/01/20 5.250% 455,000 474,338
Clean Harbors, Inc.(a)
06/01/21 5.125% 344,000 356,900
Total 831,238
Food and Beverage 0.3%
Cott Beverages, Inc.09/01/18 8.125% 545,000 602,225
Gaming 2.9%
Caesars Entertainment Operating Co., Inc.Senior Secured02/15/20 8.500% 267,000 264,998
MGM Resorts International12/15/21 6.625% 691,000 691,000
MGM Resorts International(a)
10/01/20 6.750% 86,000 87,828
ROC Finance LLC/Corp.Secured(a)
09/01/18 12.125% 554,000 639,870
Seminole Indian Tribe of Florida(a)
Secured10/01/17 7.750% 500,000 540,625Senior Secured10/01/20 6.535% 1,260,000 1,370,023
Seneca Gaming Corp.(a)
12/01/18 8.250% 488,000 514,840
Studio City Finance Ltd.(a)
12/01/20 8.500% 941,000 985,697
Tunica-Biloxi Gaming AuthoritySenior Unsecured(a)
11/15/15 9.000% 236,000 212,400
Total 5,307,281
Gas Pipelines 5.2%
Access Midstream Partners LP/Finance Corp.05/15/23 4.875% 695,000 705,425
El Paso LLC06/01/18 7.250% 322,000 371,91009/15/20 6.500% 1,041,000 1,176,33001/15/32 7.750% 1,355,000 1,592,116
Hiland Partners LP/Finance Corp.(a)
10/01/20 7.250% 1,102,000 1,179,140
Corporate Bonds & Notes (continued)
Coupon Principal
Issuer Rate Amount ($) Value ($)
Corporate Bonds & Notes (continued)
Coupon Principal
Issuer Rate Amount ($) Value ($)
MarkWest Energy Partners LP/Finance Corp.06/15/22 6.250% 705,000 774,61902/15/23 5.500% 560,000 607,600
Northwest Pipeline GPSenior Unsecured12/01/25 7.125% 150,000 196,975
Regency Energy Partners LP/Finance Corp.12/01/18 6.875% 705,000 770,21207/15/21 6.500% 848,000 928,560
Southern Star Central Corp.Senior Unsecured03/01/16 6.750% 859,000 874,032
Tesoro Logistics LP/Finance Corp.Senior Unsecured(a)
10/01/20 5.875% 303,000 314,363
Total 9,491,282
Health Care 6.2%
American Renal Holdings, Inc.Senior Secured05/15/18 8.375% 249,000 262,073
Amsurg Corp.(a)
11/30/20 5.625% 207,000 215,280
Biomet, Inc.(a)
08/01/20 6.500% 517,000 549,312
CHS/Community Health Systems, Inc.11/15/19 8.000% 530,000 573,72507/15/20 7.125% 482,000 514,535Senior Secured08/15/18 5.125% 618,000 644,265
ConvaTec Healthcare E SASenior Unsecured(a)
12/15/18 10.500% 882,000 972,405
DaVita HealthCare Partners, Inc.08/15/22 5.750% 341,000 359,329
Fresenius Medical Care U.S. Finance II, Inc.(a)
07/31/19 5.625% 164,000 176,09501/31/22 5.875% 212,000 230,020
Fresenius Medical Care U.S. Finance, Inc.(a)
09/15/18 6.500% 136,000 151,980
HCA Holdings, Inc.Senior Unsecured02/15/21 6.250% 824,000 844,600
HCA, Inc.05/01/23 5.875% 331,000 342,585Senior Secured02/15/20 6.500% 1,368,000 1,539,00005/01/23 4.750% 220,000 223,850
Health Management Associates, Inc.01/15/20 7.375% 357,000 385,560

9Annual Report 2012
Portfolio of Investments (continued)December 31, 2012
Columbia Variable Portfolio — High Income Fund
The accompanying Notes to Financial Statements are an integral part of this statement.
Hologic, Inc.(a)
08/01/20 6.250% 100,000 107,750
IMS Health, Inc.Senior Unsecured(a)
11/01/20 6.000% 289,000 302,727
Physio-Control International, Inc.Senior Secured(a)
01/15/19 9.875% 422,000 463,145
STHI Holding Corp.Secured(a)
03/15/18 8.000% 198,000 214,335
Tenet Healthcare Corp.Senior Secured(a)
06/01/20 4.750% 794,000 805,910
Universal Hospital Services, Inc.Secured(a)
08/15/20 7.625% 164,000 172,815
VWR Funding, Inc.(a)
09/15/17 7.250% 36,000 37,710
Vanguard Health Holding Co. II LLC/Inc.02/01/18 8.000% 800,000 828,00002/01/19 7.750% 388,000 401,580
Vanguard Health Holding Co. II LLC/Inc.(a)
02/01/19 7.750% 101,000 104,030
Total 11,422,616
Healthcare Insurance 0.2%
AMERIGROUP Corp.Senior Unsecured11/15/19 7.500% 292,000 350,400
Home Construction 0.9%
KB Home03/15/20 8.000% 210,000 238,35009/15/22 7.500% 164,000 179,375
Meritage Homes Corp.04/01/22 7.000% 198,000 215,325
Shea Homes LP/Funding Corp.Senior Secured05/15/19 8.625% 333,000 367,965
Taylor Morrison Communities, Inc./Monarch, Inc.(a)
04/15/20 7.750% 131,000 138,86004/15/20 7.750% 428,000 453,680
Total 1,593,555
Independent Energy 12.7%
Antero Resources Finance Corp.12/01/17 9.375% 31,000 34,02308/01/19 7.250% 114,000 124,260
Corporate Bonds & Notes (continued)
Coupon Principal
Issuer Rate Amount ($) Value ($)
Corporate Bonds & Notes (continued)
Coupon Principal
Issuer Rate Amount ($) Value ($)
Berry Petroleum Co.Senior Unsecured11/01/20 6.750% 180,000 193,500
Carrizo Oil & Gas, Inc.10/15/18 8.625% 519,000 560,520
Chaparral Energy, Inc.09/01/21 8.250% 260,000 282,10011/15/22 7.625% 60,000 63,150
Chesapeake Energy Corp.08/15/20 6.625% 1,219,000 1,311,94902/15/21 6.125% 993,000 1,030,237
Cimarex Energy Co.05/01/22 5.875% 631,000 690,945
Comstock Resources, Inc.06/15/20 9.500% 799,000 858,925
Concho Resources, Inc.10/01/17 8.625% 121,000 131,73901/15/21 7.000% 806,000 898,69001/15/22 6.500% 382,000 420,20004/01/23 5.500% 227,000 237,783
Continental Resources, Inc.10/01/19 8.250% 65,000 72,80010/01/20 7.375% 377,000 426,01004/01/21 7.125% 145,000 163,48809/15/22 5.000% 1,843,000 1,985,832
EP Energy Holdings LLC/Bond Co., Inc. PIKSenior Unsecured(a)
12/15/17 8.125% 278,000 275,568
EP Energy LLC/Everest Acquisition Finance, Inc.09/01/22 7.750% 82,000 86,920Senior Secured05/01/19 6.875% 553,000 602,770
EP Energy LLC/Finance, Inc.Senior Unsecured05/01/20 9.375% 802,000 904,255
Halcon Resources Corp.(a)
05/15/21 8.875% 328,000 347,680
Kodiak Oil & Gas Corp.12/01/19 8.125% 1,567,000 1,727,617
Laredo Petroleum, Inc.02/15/19 9.500% 863,000 964,40205/01/22 7.375% 352,000 381,920
MEG Energy Corp.(a)
03/15/21 6.500% 580,000 610,45001/30/23 6.375% 351,000 365,917
Oasis Petroleum, Inc.02/01/19 7.250% 676,000 726,70011/01/21 6.500% 670,000 711,87501/15/23 6.875% 428,000 459,030
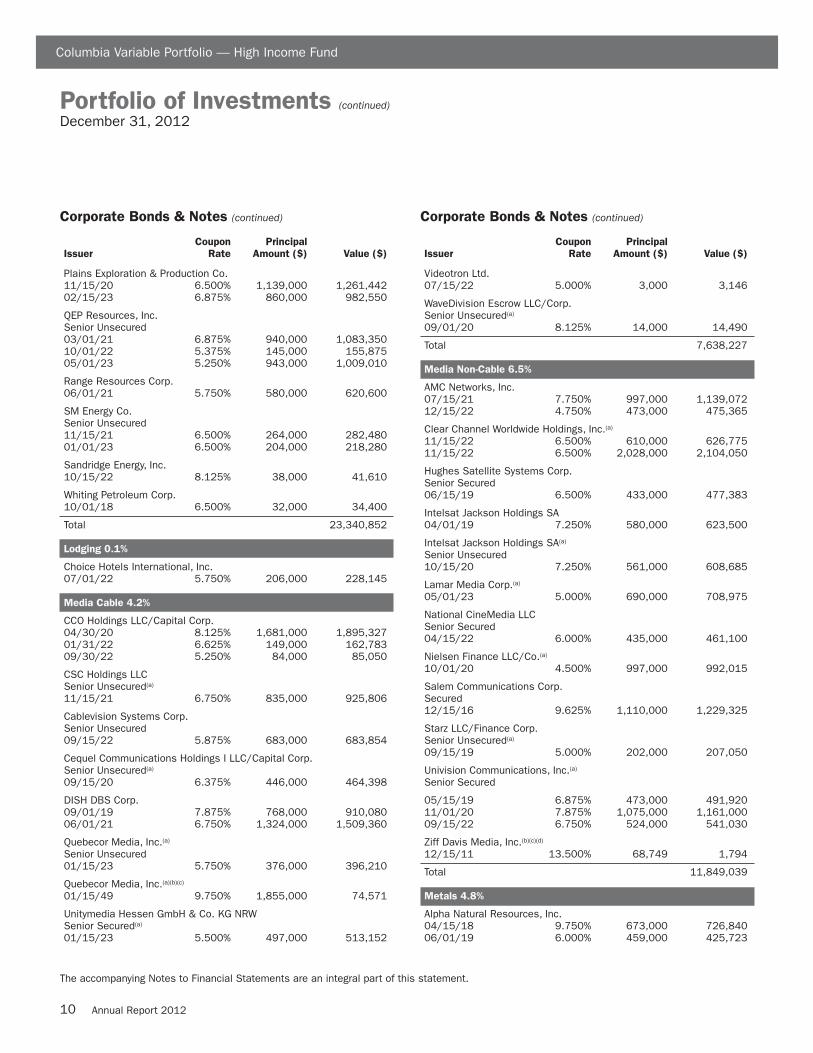
10 Annual Report 2012
Portfolio of Investments (continued)December 31, 2012
Columbia Variable Portfolio — High Income Fund
The accompanying Notes to Financial Statements are an integral part of this statement.
Plains Exploration & Production Co.11/15/20 6.500% 1,139,000 1,261,44202/15/23 6.875% 860,000 982,550
QEP Resources, Inc.Senior Unsecured03/01/21 6.875% 940,000 1,083,35010/01/22 5.375% 145,000 155,87505/01/23 5.250% 943,000 1,009,010
Range Resources Corp.06/01/21 5.750% 580,000 620,600
SM Energy Co.Senior Unsecured11/15/21 6.500% 264,000 282,48001/01/23 6.500% 204,000 218,280
Sandridge Energy, Inc.10/15/22 8.125% 38,000 41,610
Whiting Petroleum Corp.10/01/18 6.500% 32,000 34,400
Total 23,340,852
Lodging 0.1%
Choice Hotels International, Inc.07/01/22 5.750% 206,000 228,145
Media Cable 4.2%
CCO Holdings LLC/Capital Corp.04/30/20 8.125% 1,681,000 1,895,32701/31/22 6.625% 149,000 162,78309/30/22 5.250% 84,000 85,050
CSC Holdings LLCSenior Unsecured(a)
11/15/21 6.750% 835,000 925,806
Cablevision Systems Corp.Senior Unsecured09/15/22 5.875% 683,000 683,854
Cequel Communications Holdings I LLC/Capital Corp.Senior Unsecured(a)
09/15/20 6.375% 446,000 464,398
DISH DBS Corp.09/01/19 7.875% 768,000 910,08006/01/21 6.750% 1,324,000 1,509,360
Quebecor Media, Inc.(a)
Senior Unsecured01/15/23 5.750% 376,000 396,210
Quebecor Media, Inc.(a)(b)(c)
01/15/49 9.750% 1,855,000 74,571
Unitymedia Hessen GmbH & Co. KG NRWSenior Secured(a)
01/15/23 5.500% 497,000 513,152
Corporate Bonds & Notes (continued)
Coupon Principal
Issuer Rate Amount ($) Value ($)
Corporate Bonds & Notes (continued)
Coupon Principal
Issuer Rate Amount ($) Value ($)
Videotron Ltd.07/15/22 5.000% 3,000 3,146
WaveDivision Escrow LLC/Corp.Senior Unsecured(a)
09/01/20 8.125% 14,000 14,490
Total 7,638,227
Media Non-Cable 6.5%
AMC Networks, Inc.07/15/21 7.750% 997,000 1,139,07212/15/22 4.750% 473,000 475,365
Clear Channel Worldwide Holdings, Inc.(a)
11/15/22 6.500% 610,000 626,77511/15/22 6.500% 2,028,000 2,104,050
Hughes Satellite Systems Corp.Senior Secured06/15/19 6.500% 433,000 477,383
Intelsat Jackson Holdings SA04/01/19 7.250% 580,000 623,500
Intelsat Jackson Holdings SA(a)
Senior Unsecured10/15/20 7.250% 561,000 608,685
Lamar Media Corp.(a)
05/01/23 5.000% 690,000 708,975
National CineMedia LLCSenior Secured04/15/22 6.000% 435,000 461,100
Nielsen Finance LLC/Co.(a)
10/01/20 4.500% 997,000 992,015
Salem Communications Corp.Secured12/15/16 9.625% 1,110,000 1,229,325
Starz LLC/Finance Corp.Senior Unsecured(a)
09/15/19 5.000% 202,000 207,050
Univision Communications, Inc.(a)
Senior Secured
05/15/19 6.875% 473,000 491,92011/01/20 7.875% 1,075,000 1,161,00009/15/22 6.750% 524,000 541,030
Ziff Davis Media, Inc.(b)(c)(d)
12/15/11 13.500% 68,749 1,794
Total 11,849,039
Metals 4.8%
Alpha Natural Resources, Inc.04/15/18 9.750% 673,000 726,84006/01/19 6.000% 459,000 425,723

11Annual Report 2012
Portfolio of Investments (continued)December 31, 2012
Columbia Variable Portfolio — High Income Fund
The accompanying Notes to Financial Statements are an integral part of this statement.
ArcelorMittalSenior Unsecured03/01/21 6.000% 237,000 236,32102/25/22 6.750% 395,000 413,606
Arch Coal, Inc.06/15/19 7.000% 173,000 160,89006/15/21 7.250% 32,000 29,520
Arch Coal, Inc.(a)
06/15/19 9.875% 565,000 587,600
CONSOL Energy, Inc.04/01/20 8.250% 225,000 243,563
Calcipar SASenior Secured(a)
05/01/18 6.875% 834,000 850,680
FMG Resources August 2006 Proprietary Ltd.(a)
11/01/19 8.250% 1,253,000 1,337,577
Inmet Mining Corp.(a)
06/01/20 8.750% 1,000,000 1,092,50006/01/21 7.500% 273,000 283,238
JMC Steel Group, Inc.Senior Notes(a)
03/15/18 8.250% 417,000 435,765
Neenah Foundry Co.Secured PIK07/29/15 15.000% 271,397 249,685
Peabody Energy Corp.11/15/18 6.000% 518,000 550,37511/15/21 6.250% 562,000 597,125
Rain CII Carbon LLC/Corp.Senior Secured(a)
12/01/18 8.000% 635,000 646,112
Total 8,867,120
Non-Captive Consumer 0.8%
SLM Corp.Senior Unsecured03/25/20 8.000% 653,000 746,053
Springleaf Finance Corp.Senior Unsecured12/15/17 6.900% 799,000 715,105
Total 1,461,158
Non-Captive Diversified 5.6%
AerCap Aviation Solutions BV05/30/17 6.375% 473,000 496,650
Ally Financial, Inc.02/15/17 5.500% 344,000 367,99803/15/20 8.000% 3,194,000 3,912,65009/15/20 7.500% 52,000 62,790
Corporate Bonds & Notes (continued)
Coupon Principal
Issuer Rate Amount ($) Value ($)
Corporate Bonds & Notes (continued)
Coupon Principal
Issuer Rate Amount ($) Value ($)
CIT Group, Inc.Senior Unsecured05/15/20 5.375% 394,000 430,44508/15/22 5.000% 228,000 243,120
CIT Group, Inc.(a)
Senior Secured04/01/18 6.625% 695,000 785,350Senior Unsecured02/15/19 5.500% 1,174,000 1,273,790
International Lease Finance Corp.Senior Unsecured09/01/17 8.875% 145,000 170,37504/01/19 5.875% 509,000 536,48612/15/20 8.250% 1,239,000 1,477,50801/15/22 8.625% 401,000 495,235
Total 10,252,397
Oil Field Services 1.5%
Atwood Oceanics, Inc.Senior Unsecured02/01/20 6.500% 799,000 858,925
Offshore Group Investments Ltd.Senior Secured08/01/15 11.500% 778,000 848,020
Oil States International, Inc.06/01/19 6.500% 557,000 593,205
Oil States International, Inc.(a)
01/15/23 5.125% 395,000 400,431
Total 2,700,581
Other Financial Institutions 0.1%
FTI Consulting, Inc.(a)
11/15/22 6.000% 269,000 278,415
Other Industry 0.6%
Interline Brands, Inc.11/15/18 7.500% 694,000 749,520
SPL Logistics Escrow LLC/Finance Corp.Senior Secured(a)
08/01/20 8.875% 319,000 340,533
Total 1,090,053
Packaging 1.2%
Reynolds Group Issuer, Inc./LLC08/15/19 9.875% 287,000 307,090Senior Secured08/15/19 7.875% 413,000 459,462
Reynolds Group Issuer, Inc./LLC(a)
Senior Secured10/15/20 5.750% 1,035,000 1,068,637

12 Annual Report 2012
Portfolio of Investments (continued)December 31, 2012
Columbia Variable Portfolio — High Income Fund
The accompanying Notes to Financial Statements are an integral part of this statement.
Sealed Air Corp.(a)
09/15/21 8.375% 185,000 211,363Senior Unsecured12/01/20 6.500% 147,000 158,760
Total 2,205,312
Pharmaceuticals 0.8%
Catalent Pharma Solutions, Inc.(a)
10/15/18 7.875% 443,000 446,323
Jaguar Holding Co. II/Merger Sub, Inc.Senior Unsecured(a)
12/01/19 9.500% 185,000 209,975
VPI Escrow Corp.(a)
10/15/20 6.375% 687,000 736,807
Valeant Pharmaceuticals InternationalSenior Notes(a)
10/15/20 6.375% 138,000 148,005
Total 1,541,110
Property & Casualty —%
Lumbermens Mutual Casualty Co.(a)(d)
12/01/97 8.450% 30,000 15Subordinated Notes07/01/26 9.150% 645,000 323
Total 338
Restaurants 0.2%
Shearer’s Foods, Inc. LLCSenior Secured(a)
11/01/19 9.000% 320,000 336,000
Retailers 1.2%
AutoNation, Inc.02/01/20 5.500% 37,000 39,683
Limited Brands, Inc.02/15/22 5.625% 649,000 705,787
Penske Automotive Group, Inc.(a)
10/01/22 5.750% 331,000 340,930
Rite Aid Corp.Senior Secured08/15/20 8.000% 870,000 993,975
Sally Holdings LLC/Capital, Inc.11/15/19 6.875% 180,000 198,900
Total 2,279,275
Technology 4.7%
Alliance Data Systems Corp.(a)
12/01/17 5.250% 432,000 438,48004/01/20 6.375% 245,000 257,250
Corporate Bonds & Notes (continued)
Coupon Principal
Issuer Rate Amount ($) Value ($)
Corporate Bonds & Notes (continued)
Coupon Principal
Issuer Rate Amount ($) Value ($)
Amkor Technology, Inc.Senior Unsecured06/01/21 6.625% 780,000 778,050
Amkor Technology, Inc.(a)
Senior Unsecured10/01/22 6.375% 446,000 439,310
Anixter, Inc.05/01/19 5.625% 131,000 137,878
Brocade Communications Systems, Inc.Senior Secured01/15/20 6.875% 520,000 560,300
CDW LLC/Finance Corp.04/01/19 8.500% 261,000 282,533Senior Secured12/15/18 8.000% 1,050,000 1,161,562
Cardtronics, Inc.09/01/18 8.250% 93,000 103,230
Equinix, Inc.Senior Unsecured07/15/21 7.000% 245,000 271,950
First Data Corp.(a)
Secured01/15/21 8.250% 459,000 459,000Senior Secured06/15/19 7.375% 885,000 918,18708/15/20 8.875% 165,000 179,85011/01/20 6.750% 695,000 703,687
Interactive Data Corp.08/01/18 10.250% 880,000 990,000
Nuance Communications, Inc.(a)
08/15/20 5.375% 889,000 929,005
Total 8,610,272
Textile 0.2%
PVH Corp.Senior Unsecured12/15/22 4.500% 331,000 334,310
Transportation Services 0.9%
Avis Budget Car Rental LLC/Finance, Inc.01/15/19 8.250% 402,000 444,21003/15/20 9.750% 290,000 334,950
Hertz Corp. (The)01/15/21 7.375% 606,000 666,600
Hertz Corp. (The)(a)
10/15/20 5.875% 80,000 83,60010/15/22 6.250% 68,000 72,420
Total 1,601,780

13Annual Report 2012
Portfolio of Investments (continued)December 31, 2012
Columbia Variable Portfolio — High Income Fund
The accompanying Notes to Financial Statements are an integral part of this statement.
Wireless 4.7%
Cricket Communications, Inc.10/15/20 7.750% 555,000 566,100Senior Secured05/15/16 7.750% 1,012,000 1,071,455
Crown Castle International Corp.Senior Unsecured(a)
01/15/23 5.250% 705,000 754,350
SBA Telecommunications, Inc.(a)
07/15/20 5.750% 871,000 925,437
Sprint Capital Corp.11/15/28 6.875% 1,205,000 1,253,200
Sprint Nextel Corp.(a)
11/15/18 9.000% 2,277,000 2,812,09503/01/20 7.000% 254,000 295,275
Wind Acquisition Finance SASenior Secured(a)
02/15/18 7.250% 956,000 969,384
Total 8,647,296
Wirelines 5.6%
CenturyLink, Inc.Senior Unsecured06/15/21 6.450% 1,690,000 1,867,44803/15/22 5.800% 1,312,000 1,386,951
CyrusOne LLP./Finance Corp.(a)
11/15/22 6.375% 441,000 459,743
Frontier Communications Corp.Senior Unsecured04/15/20 8.500% 772,000 887,80007/01/21 9.250% 575,000 674,18704/15/22 8.750% 190,000 220,400
Integra Telecom Holdings, Inc.Senior Secured(a)
04/15/16 10.750% 32,000 33,560
Level 3 Communications, Inc.Senior Unsecured(a)
06/01/19 8.875% 92,000 97,980
Level 3 Financing, Inc.02/01/18 10.000% 242,000 269,83004/01/19 9.375% 936,000 1,045,98007/01/19 8.125% 558,000 608,220
PAETEC Holding Corp.Senior Secured06/30/17 8.875% 499,000 535,177
Windstream Corp.10/15/20 7.750% 1,177,000 1,271,16006/01/22 7.500% 365,000 386,900
Corporate Bonds & Notes (continued)
Coupon Principal
Issuer Rate Amount ($) Value ($)
Corporate Bonds & Notes (continued)
Coupon Principal
Issuer Rate Amount ($) Value ($)
Zayo Group LLC/Capital, Inc.Senior Secured01/01/20 8.125% 326,000 362,675
tw telecom holdings, Inc.(a)
10/01/22 5.375% 206,000 215,785
Total 10,323,796
Total Corporate Bonds & Notes
(Cost: $158,727,148) 169,420,852
Convertible Bonds —%
Wirelines —%
At Home Corp.Subordinated Notes(b)(c)(d)
06/12/15 4.750% 296,350 30
Total Convertible Bonds
(Cost: $—) 30
Senior Loans 4.4%
Weighted Principal
Borrower Average Coupon Amount ($) Value ($)
Aerospace & Defense 0.1%
Silver II Borrower SCATerm Loan(e)(g)(h)
12/13/19 5.000% 102,000 102,892
Chemicals 0.4%
PQ Corp.Tranche B Term Loan(e)(g)
04/15/17 5.250% 663,000 666,222
Construction Machinery 0.5%
CPM Acquisition Corp.1st Lien Term Loan(e)(g)
08/29/17 6.250% 564,000 566,820
CPM Holdings, Inc.2nd Lien Term Loan(e)(g)
03/01/18 10.250% 362,000 364,715
Total 931,535
Consumer Cyclical Services 0.7%
New Breed, Inc.Term Loan(e)(g)
10/01/19 6.000% 641,000 632,988

14 Annual Report 2012
Portfolio of Investments (continued)December 31, 2012
Columbia Variable Portfolio — High Income Fund
The accompanying Notes to Financial Statements are an integral part of this statement.
West Corp.Tranche B6 Term Loan(e)(g)
06/30/18 5.750% 549,240 557,061
Total 1,190,049
Consumer Products 0.2%
Serta Simmons Holdings LLCTerm Loan(e)(g)
10/01/19 5.000% 364,000 364,302
Spectrum Brands, Inc.Term Loan(e)(g)(h)
12/17/19 4.500% 75,000 75,680
Total 439,982
Electric —%
BHM Technologies LLCTerm Loan(b)(c)(d)(e)(g)
11/26/13 6.313% 386,034 1,042
Health Care 0.1%
ConvaTec, Inc.Term Loan(e)(g)
12/22/16 5.000% 79,000 79,855
United Surgical Partners International, Inc.Tranche B Term Loan(e)(g)(h)
04/03/19 5.059% 108,000 108,630
Total 188,485
Life Insurance 0.1%
Alliant Holdings I, Inc.Term Loan(e)(g)(h)
12/07/19 5.000% 238,000 238,238
Media Cable 0.2%
WideOpenWest Finance LLCTerm Loan(e)(g)
07/17/18 6.250% 402,975 407,097
Metals 0.7%
FMG Resources August 2006 Proprietary Ltd.(e)(g)
Term Loan10/18/17 5.250% 494,760 498,471
FMG Resources August 2006 Proprietary Ltd.(e)(g)(h)
Term Loan10/18/17 5.250% 779,341 785,186
Total 1,283,657
Property & Casualty 0.8%
Asurion LLC1st Lien Term Loan(e)(g)
05/24/18 5.500% 439,000 443,061
Senior Loans (continued)
Weighted Principal
Borrower Average Coupon Amount ($) Value ($)
Senior Loans (continued)
Weighted Principal
Borrower Average Coupon Amount ($) Value ($)
Lonestar Intermediate Super Holdings LLCTerm Loan(e)(g)
09/02/19 11.000% 910,000 964,600
Total 1,407,661
Technology 0.6%
Ancestry.comTerm Loan(e)(g)(h)
12/18/18 7.000% 814,000 783,988
Blue Coat SystemsTerm Loan(e)(g)
02/15/18 5.750% 381,045 383,190
Total 1,167,178
Total Senior Loans
(Cost: $8,846,740) 8,024,038
Common Stocks 0.2%
Issuer Shares Value ($)
Consumer Discretionary —%
Media —%
Haights Cross Communications, Inc.(b)(c)(i) 27,056 —
Ziff Davis Holdings, Inc.(b)(c)(j) 553 6
Total 6
Total Consumer Discretionary 6
Consumer Staples —%
Beverages —%
Cott Corp. 1,700 13,651
Industrials 0.1%
Airlines —%
Delta Air Lines, Inc.(j) 399 4,736
Building Products —%
BHM Technologies LLC(b)(c) 35,922 359
Commercial Services & Supplies 0.1%
Quad/Graphics, Inc. 3,118 63,576
Road & Rail —%
Quality Distribution, Inc.(j) 195 1,170
Total 69,841

15Annual Report 2012
Portfolio of Investments (continued)December 31, 2012
Columbia Variable Portfolio — High Income Fund
The accompanying Notes to Financial Statements are an integral part of this statement.
Information Technology —%
Communications Equipment —%
Loral Space & Communications, Inc. 6 328
Total Information Technology 328
Materials 0.1%
Metals & Mining 0.1%
Neenah Enterprises, Inc.(b)(c)(j) 45,482 188,750
Total Materials 188,750
Utilities —%
Independent Power Producers & Energy Traders —%
Calpine Corp. Escrow(b)(c)(i) 6,049,000 —
Total Common Stocks
(Cost: $845,401) 272,576
Preferred Stocks —%
Industrials —%
Industrial Conglomerates —%
BHM Technologies LLC(b)(c)(j) 430 4
Total Preferred Stocks
(Cost: $23) 4
Common Stocks (continued)
Issuer Shares Value ($)
Warrants —%
Issuer Shares Value ($)
Consumer Discretionary —%
Media —%
ION Media Networks, Inc.12/18/16(b)(c)(j)(i) 61 —12/18/16(b)(c)(j) 62 1
Total 1
Total Warrants
(Cost: $316,604) 1
Money Market Funds 2.8%
Columbia Short-Term Cash Fund, 0.142%(k)(l) 5,180,012 5,180,012
Total Money Market Funds
(Cost: $5,180,012) 5,180,012
Total Investments
(Cost: $173,915,928) 182,897,513
Other Assets & Liabilities, Net 638,032
Net Assets 183,535,545
Notes to Portfolio of Investments
(a) Security exempt from registration pursuant to Rule 144A under the Securities Act of 1933. This security may be resold in transactionsexempt from registration, normally to qualified institutional buyers. At December 31, 2012, the value of these securities amounted to$59,474,993 or 32.41% of net assets.

16 Annual Report 2012
Portfolio of Investments (continued)December 31, 2012
(b) Identifies issues considered to be illiquid as to their marketability. The aggregate value of such securities at December 31, 2012 was$289,111, representing 0.16% of net assets. Information concerning such security holdings at December 31, 2012 is as follows:
Security Description Acquisition Dates Cost ($)
At Home Corp.Subordinated Notes4.750% 06/12/15 07/26/05 —
BHM Technologies LLCTerm Loan6.313% 11/26/13 06/21/07 - 03/31/10 951,580
BHM Technologies LLC 07/21/06 1,940
BHM Technologies LLC 07/21/06 23
Calpine Corp. Escrow 09/29/11 —
Collins & Aikman Products Co.Senior Subordinated Notes12.875% 08/15/12 08/12/04 - 04/12/05 488,810
Haights Cross Communications, Inc. 01/15/04 - 02/03/06 307,972
ION Media Networks, Inc.12/18/16 12/19/05 - 04/14/09 159,589
12/18/16 12/19/05 - 04/14/09 157,015
Lear Corp. Escrow Bond0.000% 03/31/16 11/20/06 - 07/24/08 —
Neenah Enterprises, Inc. 08/02/10 385,233
Quebecor Media, Inc.9.750% 01/15/49 01/17/07 - 07/24/08 16,478
United Artists Theatre Circuit, Inc.1995-A Pass-Through Certificates9.300% 07/01/15 01/27/03 20,915
Ziff Davis Holdings, Inc. 07/01/08 6
Ziff Davis Media, Inc.13.500% 12/15/11 07/01/08 - 04/15/11 53,372
(c) Represents fair value as determined in good faith under procedures approved by the Board of Trustees. At December 31, 2012, the valueof these securities amounted to $289,111, which represents 0.16% of net assets.
(d) Represents securities that have defaulted on payment of interest. The Fund has stopped accruing interest on these securities. AtDecember 31, 2012, the value of these securities amounted to $3,266, which represents less than 0.01% of net assets.
(e) Variable rate security.
(f) Zero coupon bond.
(g) Senior loans have rates of interest that float periodically based primarily on the London Interbank Offered Rate (“LIBOR”) and othershort-term rates. The interest rate shown reflects the weighted average coupon as of December 31, 2012. The interest rate shown forsenior loans purchased on a when-issued or delayed delivery basis, if any, reflects an estimated average coupon. Remaining maturities ofsenior loans may be less than the stated maturities shown as a result of contractual or optional prepayments by the borrower. Suchprepayments cannot be predicted with certainty.
(h) Represents a security purchased on a when-issued or delayed delivery basis.
(i) Negligible market value.
(j) Non-income producing.
Columbia Variable Portfolio — High Income Fund
The accompanying Notes to Financial Statements are an integral part of this statement.
Notes to Portfolio of Investments (continued)

17Annual Report 2012
Portfolio of Investments (continued)December 31, 2012
(k) As defined in the Investment Company Act of 1940, an affiliated company is one in which the Fund owns 5% or more of its outstandingvoting securities, or a company which is under common ownership or control with the Fund. Holdings and transactions in these affiliatedcompanies during the year ended December 31, 2012, are as follows:
Dividends
Beginning Purchase Proceeds Realized Ending or Interest
Issuer Cost ($) Cost ($) From Sales ($) Gain/Loss ($) Cost ($) Income ($) Value ($)
Columbia Short-Term Cash Fund 4,728,321 67,175,101 (66,723,410) — 5,180,012 7,971 5,180,012
(l) The rate shown is the seven-day current annualized yield at December 31, 2012.
Abbreviation Legend
ADS American Depositary Share
PIK Payment-in-Kind
Fair Value Measurements
Generally accepted accounting principles (GAAP) require disclosure regarding the inputs and valuation techniques used to measure fair valueand any changes in valuation inputs or techniques. In addition, investments shall be disclosed by major category.
The Fund categorizes its fair value measurements according to a three-level hierarchy that maximizes the use of observable inputs andminimizes the use of unobservable inputs by prioritizing that the most observable input be used when available. Observable inputs are thosethat market participants would use in pricing an investment based on market data obtained from sources independent of the reporting entity.Unobservable inputs are those that reflect the Fund’s assumptions about the information market participants would use in pricing aninvestment. An investment’s level within the fair value hierarchy is based on the lowest level of any input that is deemed significant to theasset or liability’s fair value measurement. The input levels are not necessarily an indication of the risk or liquidity associated withinvestments at that level. For example, certain U.S. government securities are generally high quality and liquid, however, they are reflected asLevel 2 because the inputs used to determine fair value may not always be quoted prices in an active market.
Fair value inputs are summarized in the three broad levels listed below:
> Level 1 — Valuations based on quoted prices for investments in active markets that the Fund has the ability to access at themeasurement date (including NAV for open-end mutual funds). Valuation adjustments are not applied to Level 1 investments.
> Level 2 — Valuations based on other significant observable inputs (including quoted prices for similar securities, interest rates,prepayment speeds, credit risks, etc.).
> Level 3 — Valuations based on significant unobservable inputs (including the Fund’s own assumptions and judgment in determining thefair value of investments).
Inputs that are used in determining fair value of an investment may include price information, credit data, volatility statistics, and otherfactors. These inputs can be either observable or unobservable. The availability of observable inputs can vary between investments, and isaffected by various factors such as the type of investment, and the volume and level of activity for that investment or similar investments inthe marketplace. The inputs will be considered by the Investment Manager, along with any other relevant factors in the calculation of aninvestment’s fair value. The Fund uses prices and inputs that are current as of the measurement date, which may include periods of marketdislocations. During these periods, the availability of prices and inputs may be reduced for many investments. This condition could cause aninvestment to be reclassified between the various levels within the hierarchy.
Investments falling into the Level 3 category are primarily supported by quoted prices from brokers and dealers participating in the market forthose investments. However, these may be classified as Level 3 investments due to lack of market transparency and corroboration to supportthese quoted prices. Additionally, valuation models may be used as the pricing source for any remaining investments classified as Level 3.These models rely on one or more significant unobservable inputs and/or significant assumptions by the Investment Manager. Inputs used invaluations may include, but are not limited to, financial statement analysis, capital account balances, discount rates and estimated cashflows, and comparable company data.
Under the direction of the Fund’s Board of Trustees (the Board), the Investment Manager’s Valuation Committee (the Committee) isresponsible for carrying out the valuation procedures approved by the Board. The Committee consists of voting and non-voting members fromvarious groups within the Investment Manager’s organization, including operations and accounting, trading and investments, compliance, riskmanagement and legal.
Columbia Variable Portfolio — High Income Fund
The accompanying Notes to Financial Statements are an integral part of this statement.
Notes to Portfolio of Investments (continued)

18 Annual Report 2012
Portfolio of Investments (continued)December 31, 2012
The Committee meets at least monthly to review and approve valuation matters, which may include a description of specific valuationdeterminations, data regarding pricing information received from approved pricing vendors and brokers and the results of Board-approvedvaluation control policies and procedures (the Policies). The Policies address, among other things, instances when market quotations arereadily available, including recommendations of third party pricing vendors and a determination of appropriate pricing methodologies; eventsthat require specific valuation determinations and assessment of fair value techniques; securities with a potential for stale pricing, includingthose that are illiquid, restricted, or in default; and the effectiveness of third-party pricing vendors, including periodic reviews of vendors. TheCommittee meets more frequently, as needed, to discuss additional valuation matters, which may include the need to review back-testingresults, review time-sensitive information or approve related valuation actions. The Committee reports to the Board, with members of theCommittee meeting with the Board at each of its regularly scheduled meetings to discuss valuation matters and actions during the period,similar to those described earlier.
For investments categorized as Level 3, the Committee monitors information similar to that described above, which may include: (i) dataspecific to the issuer or comparable issuers, (ii) general market or specific sector news and (iii) quoted prices and specific or similar securitytransactions. The Committee considers this data and any changes from prior periods in order to assess the reasonableness of observableand unobservable inputs, any assumptions or internal models used to value those securities and changes in fair value. This data is also usedto corroborate, when available, information received from approved pricing vendors and brokers. Various factors impact the frequency ofmonitoring this information (which may occur as often as daily). However, the Committee may determine that changes to inputs, assumptionsand models are not required as a result of the monitoring procedures performed.
The following table is a summary of the inputs used to value the Fund’s investments as of December 31, 2012:
Level 1
Quoted Prices in Active Level 2 Level 3
Markets for Identical Other Significant Significant
Description Assets ($) Observable Inputs ($) Unobservable Inputs ($) Total ($)
Bonds
Corporate Bonds & Notes
Aerospace & Defense — 5,291,995 — 5,291,995
Automotive — 3,003,765 955 3,004,720
Banking — 661,895 — 661,895
Brokerage — 1,106,133 — 1,106,133
Building Materials — 2,514,722 — 2,514,722
Chemicals — 8,464,221 — 8,464,221
Construction Machinery — 5,091,060 — 5,091,060
Consumer Cyclical Services — 2,161,935 — 2,161,935
Consumer Products — 2,442,389 — 2,442,389
Diversified Manufacturing — 1,479,865 — 1,479,865
Electric — 2,390,617 — 2,390,617
Entertainment — 1,605,628 21,599 1,627,227
Environmental — 831,238 — 831,238
Food and Beverage — 602,225 — 602,225
Gaming — 5,307,281 — 5,307,281
Gas Pipelines — 9,491,282 — 9,491,282
Health Care — 11,422,616 — 11,422,616
Health Care Insurance — 350,400 — 350,400
Home Construction — 1,593,555 — 1,593,555
Independent Energy — 23,340,852 — 23,340,852
Logding — 228,145 — 228,145
Media Cable — 7,563,656 74,571 7,638,227
Columbia Variable Portfolio — High Income Fund
The accompanying Notes to Financial Statements are an integral part of this statement.
Fair Value Measurements (continued)

19Annual Report 2012
Portfolio of Investments (continued)December 31, 2012
Level 1
Quoted Prices in Active Level 2 Level 3
Markets for Identical Other Significant Significant
Description Assets ($) Observable Inputs ($) Unobservable Inputs ($) Total ($)
Media Non-Cable — 11,847,245 1,794 11,849,039
Metals — 8,867,120 — 8,867,120
Non-Captive Consumer — 1,461,158 — 1,461,158
Non-Captive Diversified — 10,252,397 — 10,252,397
Oil Field Services — 2,700,581 — 2,700,581
Other Financial Institutions — 278,415 — 278,415
Other Industry — 1,090,053 — 1,090,053
Packaging — 2,205,312 — 2,205,312
Pharmaceuticals — 1,541,110 — 1,541,110
Property & Casualty — 338 — 338
Restaurants — 336,000 — 336,000
Retailers — 2,279,275 — 2,279,275
Technology — 8,610,272 — 8,610,272
Textile — 334,310 334,310
Transportation Services — 1,601,780 — 1,601,780
Wireless — 8,647,296 — 8,647,296
Wirelines — 10,323,796 — 10,323,796
Convertible Bonds — — 30 30
Total Bonds — 169,321,933 98,949 169,420,882
Senior Loans — — — —
Aerospace & Defense — 102,892 — 102,892
Chemicals — 666,222 — 666,222
Construction Machinery — 931,535 — 931,535
Consumer Cyclical Services — 1,190,049 — 1,190,049
Consumer Products — 439,982 — 439,982
Electric — — 1,042 1,042
Health Care — 188,485 — 188,485
Life Insurance — 238,238 — 238,238
Media Cable — 407,097 — 407,097
Metals — 1,283,657 — 1,283,657
Property & Casualty — 1,407,661 — 1,407,661
Technology — 1,167,178 — 1,167,178
Total Senior Loans 8,022,996 1,042 8,024,038
Equity Securities
Common Stocks
Consumer Discretionary — — 6 6
Consumer Staples 13,651 — — 13,651
Columbia Variable Portfolio — High Income Fund
The accompanying Notes to Financial Statements are an integral part of this statement.
Fair Value Measurements (continued)

20 Annual Report 2012
Portfolio of Investments (continued)December 31, 2012
Level 1
Quoted Prices in Active Level 2 Level 3
Markets for Identical Other Significant Significant
Description Assets ($) Observable Inputs ($) Unobservable Inputs ($) Total ($)
Industrials 69,482 — 359 69,841
Information Technology 328 — — 328
Materials — — 188,750 188,750
Preferred Stocks —
Industrials — — 4 4
Warrants —
Consumer Discretionary — — 1 1
Total Equity Securities 83,461 — 189,120 272,581
Other
Money Market Funds 5,180,012 — — 5,180,012
Total Other 5,180,012 — — 5,180,012
Total 5,263,473 177,344,929 289,111 182,897,513
See the Portfolio of Investments for all investment classifications not indicated in the table.
The Fund’s assets assigned to the Level 2 input category are generally valued using the market approach, in which a security’s value isdetermined through reference to prices and information from market transactions for similar or identical assets.
There were no transfers of financial assets between Levels 1 and 2 during the period.
The following table is a reconciliation of Level 3 assets for which significant observable and/or unobservable inputs were used to determinefair value.
Corporate
Bonds & Convertible Senior Common Preferred
Notes($) Bonds ($) Loans ($) Stocks ($) Stocks ($) Warrants ($) Total ($)
Balance as of December 31, 2011 127,721 30 1,042 204,579 4 1 333,377
Accrued discounts/premiums 2,458 — — — — — 2,458
Realized gain (loss) 114 — — — — — 114
Change in unrealized appreciation (depreciation)** (23,310) — — (15,464) — — (38,774)
Sales (8,064) — — — — — (8,064)
Purchases — — — — — — —
Transfers into Level 3 — — — — — — —
Transfers out of Level 3 — — — — — — —
Balance as of December 31, 2012 98,919 30 1,042 189,115 4 1 289,111
**Change in unrealized appreciation (depreciation) relating to securities held at December 31, 2012 was $(38,774).
The Fund does not hold any significant investments with unobservable inputs which are categorized as Level 3.
The Fund’s assets assigned to the Level 3 category are valued utilizing the valuation technique deemed the most appropriate in thecircumstances.
Certain corporate bonds, convertible bonds, senior loans, warrants, common and preferred stock classified as Level 3 are valued using anincome approach. To determine fair value for these securities, management considered estimates of future distributions from the liquidationof company assets or potential actions related to the respective company’s bankruptcy filing. Significant increases (decreases) to any of theseinputs would result in a significantly lower (higher) fair value measurement. Generally, a change in the bankruptcy filings would result in adirectionally similar change to estimates of future distributions.
Columbia Variable Portfolio — High Income Fund
The accompanying Notes to Financial Statements are an integral part of this statement.
Fair Value Measurements (continued)
21Annual Report 2012
Portfolio of Investments (continued)December 31, 2012
Certain common stocks classified as Level 3 are valued using a market approach. To determine fair value for these securities, managementconsidered various factors which may have included, but were not limited to, trades of similar securities, estimated earnings of the respectivecompany, market multiples derived from a set of comparable companies, and the position of the security within the respective company’scapital structure. Significant increases (decreases) to any of these inputs would result in a significantly lower (higher) fair value measurement.Generally, a change in estimated earnings of the respective company may result in a change to the comparable companies and marketmultiples utilized.
Columbia Variable Portfolio — High Income Fund
The accompanying Notes to Financial Statements are an integral part of this statement.
Fair Value Measurements (continued)

22 Annual Report 2012
Statement of Assets and LiabilitiesDecember 31, 2012
Columbia Variable Portfolio — High Income Fund
The accompanying Notes to Financial Statements are an integral part of this statement.
Assets
Investments, at value
Unaffiliated issuers (identified cost $168,735,916) $177,717,501
Affiliated issuers (identified cost $5,180,012) 5,180,012
Total investments (identified cost $173,915,928) 182,897,513
Cash 44,558
Receivable for:
Investments sold 681,414
Capital shares sold 1
Dividends 662
Interest 2,599,827
Reclaims 389
Prepaid expenses 2,361
Trustees’ deferred compensation plan 407
Total assets 186,227,132
Liabilities
Payable for:
Investments purchased on a delayed delivery basis 2,083,815
Capital shares purchased 388,282
Investment management fees 85,686
Distribution and/or service fees 6,996
Transfer agent fees 9,347
Administration fees 12,464
Compensation of board members 55,640
Expense reimbursement due to Investment Manager 2,058
Other expenses 46,892
Trustees’ deferred compensation plan 407
Total liabilities 2,691,587
Net assets applicable to outstanding capital stock $183,535,545
Represented by
Paid-in capital $188,711,793
Undistributed net investment income 10,531,927
Accumulated net realized loss (24,689,760)
Unrealized appreciation (depreciation) on:
Investments 8,981,585
Total — representing net assets applicable to outstanding capital stock $183,535,545

23Annual Report 2012
Statement of Assets and Liabilities (continued)December 31, 2012
Columbia Variable Portfolio — High Income Fund
The accompanying Notes to Financial Statements are an integral part of this statement.
Class 1
Net assets $45,950,226
Shares outstanding 4,304,253
Net asset value per share $10.68
Class 2
Net assets $137,585,319
Shares outstanding 12,897,985
Net asset value per share $10.67

24 Annual Report 2012
Statement of OperationsYear Ended December 31, 2012
Columbia Variable Portfolio — High Income Fund
The accompanying Notes to Financial Statements are an integral part of this statement.
Net investment income
Income:Dividends — unaffiliated issuers $9,713Dividends — affiliated issuers 7,971Interest 12,167,151Foreign taxes withheld (15)
Total income 12,184,820
Expenses:Investment management fees 1,006,439Distribution and/or service fees
Class 2 336,436Transfer agent fees
Class 1 29,051Class 2 80,740
Administration fees 146,392Compensation of board members 22,557Custodian fees 6,307Printing and postage fees 59,439Professional fees 30,420Other 13,018
Total expenses 1,730,799Fees waived or expenses reimbursed by Investment Manager and its affiliates (149,768)Fees waived by Distributor — Class 2 (255,696)Total net expenses 1,325,335Net investment income 10,859,485
Realized and unrealized gain (loss) — net
Net realized gain (loss) on:Investments 4,999,668
Net realized gain 4,999,668Net change in unrealized appreciation (depreciation) on:
Investments 9,570,327Net change in unrealized appreciation (depreciation) 9,570,327Net realized and unrealized gain 14,569,995
Net increase in net assets resulting from operations $25,429,480

25Annual Report 2012
Statement of Changes in Net Assets
Columbia Variable Portfolio — High Income Fund
The accompanying Notes to Financial Statements are an integral part of this statement.
Year Ended Year Ended
December 31, December 31,
2012 2011
Operations
Net investment income $10,859,485 $12,036,265
Net realized gain 4,999,668 3,317,200
Net change in unrealized appreciation (depreciation) 9,570,327 (3,798,592)
Net increase in net assets resulting from operations 25,429,480 11,554,873
Distributions to shareholders
Net investment income
Class 1 (3,163,298) (4,042,824)
Class 2 (8,983,740) (9,717,660)
Total distributions to shareholders (12,147,038) (13,760,484)
Increase (decrease) in net assets from capital stock activity (8,028,788) (11,688,749)
Total increase (decrease) in net assets 5,253,654 (13,894,360)
Net assets at beginning of year 178,281,891 192,176,251
Net assets at end of year $183,535,545 $178,281,891
Undistributed net investment income $10,531,927 $11,732,109
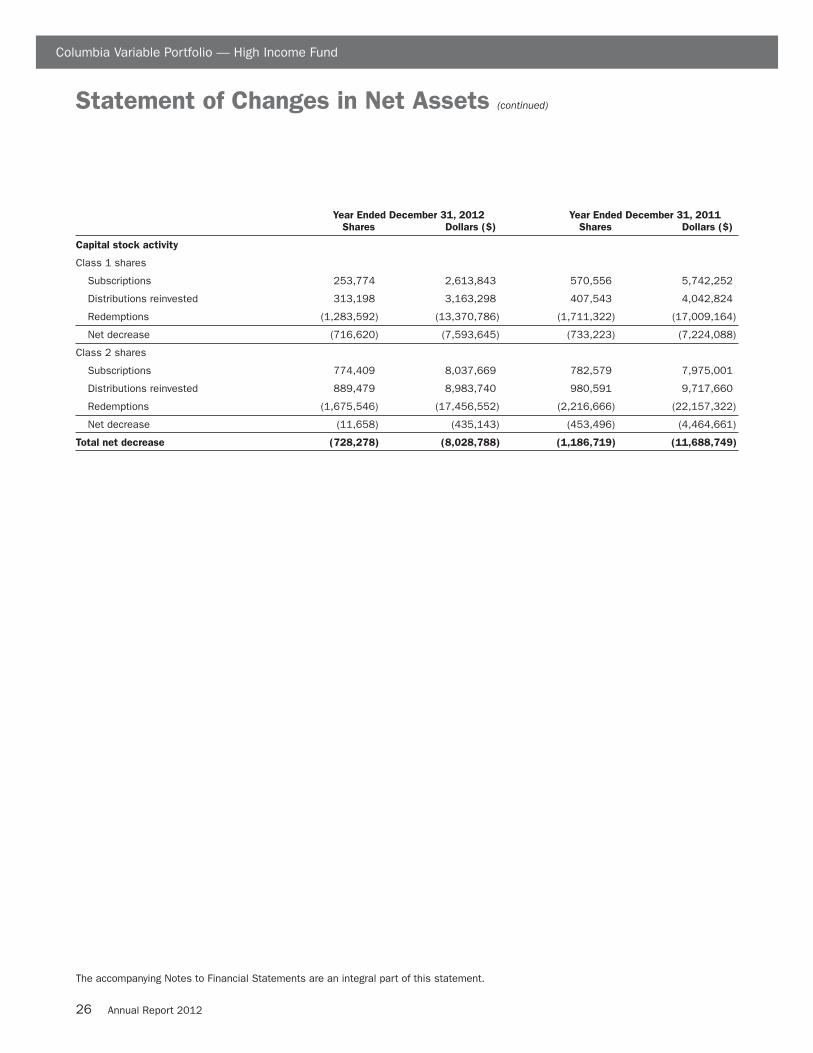
26 Annual Report 2012
Statement of Changes in Net Assets (continued)
Columbia Variable Portfolio — High Income Fund
The accompanying Notes to Financial Statements are an integral part of this statement.
Year Ended December 31, 2012 Year Ended December 31, 2011
Shares Dollars ($) Shares Dollars ($)
Capital stock activity
Class 1 shares
Subscriptions 253,774 2,613,843 570,556 5,742,252
Distributions reinvested 313,198 3,163,298 407,543 4,042,824
Redemptions (1,283,592) (13,370,786) (1,711,322) (17,009,164)
Net decrease (716,620) (7,593,645) (733,223) (7,224,088)
Class 2 shares
Subscriptions 774,409 8,037,669 782,579 7,975,001
Distributions reinvested 889,479 8,983,740 980,591 9,717,660
Redemptions (1,675,546) (17,456,552) (2,216,666) (22,157,322)
Net decrease (11,658) (435,143) (453,496) (4,464,661)
Total net decrease (728,278) (8,028,788) (1,186,719) (11,688,749)

27Annual Report 2012
Financial Highlights
Columbia Variable Portfolio — High Income Fund
The accompanying Notes to Financial Statements are an integral part of this statement.
The following tables are intended to help you understand the Fund’s financial performance. Certain information reflectsfinancial results for a single share of a class held for the periods shown. Per share net investment income (loss) amounts arecalculated based on average shares outstanding during the period. Total return assumes reinvestment of all dividends anddistributions. Total return does not reflect payment of the expenses that apply to the variable accounts or contract charges, ifany, and are not annualized for periods of less than one year.
Year Ended December 31,
Class 1 2012 2011 2010 2009 2008
Per share data
Net asset value, beginning of period $9.95 $10.06 $9.76 $7.53 $11.14
Income from investment operations:
Net investment income 0.62 0.65 0.72 0.73 0.81
Net realized and unrealized gain (loss) 0.84 (0.00)(a) 0.41 2.46 (3.33)
Total from investment operations 1.46 0.65 1.13 3.19 (2.52)
Less distributions to shareholders:
Net investment income (0.73) (0.76) (0.83) (0.96) (1.09)
Total distributions to shareholders (0.73) (0.76) (0.83) (0.96) (1.09)
Net asset value, end of period $10.68 $9.95 $10.06 $9.76 $7.53
Total return 15.06% 6.46% 12.07% 44.34% (24.88%)
Ratios to average net assets(b)
Total gross expenses 0.76% 0.80% 0.89% 0.93% 0.89%
Total net expenses(c) 0.68% 0.60%(d) 0.60%(d) 0.60%(d) 0.60%(d)
Net investment income 5.98% 6.42% 7.21% 8.33% 8.15%
Supplemental data
Net assets, end of period (in thousands) $45,950 $49,949 $57,870 $58,247 $47,162
Portfolio turnover 67% 98% 91% 36% 23%
Notes to Financial Highlights
(a) Rounds to less than $0.01.
(b) In addition to the fees and expenses which the Fund bears directly, the Fund indirectly bears a pro rata share of the fees and expenses ofthe acquired funds in which it invests. Such indirect expenses are not included in the reported expense ratios.
(c) Total net expenses include the impact of certain waivers/reimbursements made by the Investment Manager and certain of its affiliates, ifapplicable.
(d) The benefits derived from expense reductions had an impact of less than 0.01%.

28 Annual Report 2012
Financial Highlights (continued)
Columbia Variable Portfolio — High Income Fund
The accompanying Notes to Financial Statements are an integral part of this statement.
Year Ended December 31,
Class 2 2012 2011 2010 2009 2008
Per share data
Net asset value, beginning of period $9.94 $10.05 $9.75 $7.52 $11.13
Income from investment operations:
Net investment income 0.62 0.64 0.71 0.72 0.80
Net realized and unrealized gain (loss) 0.83 (0.00)(a) 0.41 2.46 (3.33)
Total from investment operations 1.45 0.64 1.12 3.18 (2.53)
Less distributions to shareholders:
Net investment income (0.72) (0.75) (0.82) (0.95) (1.08)
Total distributions to shareholders (0.72) (0.75) (0.82) (0.95) (1.08)
Net asset value, end of period $10.67 $9.94 $10.05 $9.75 $7.52
Total return 15.00% 6.41% 12.01% 44.30% (24.96%)
Ratios to average net assets(b)
Total gross expenses 1.01% 1.05% 1.14% 1.18% 1.14%
Total net expenses(c) 0.74% 0.66%(d) 0.66%(d) 0.66%(d) 0.66%(d)
Net investment income 5.92% 6.36% 7.15% 8.25% 8.11%
Supplemental data
Net assets, end of period (in thousands) $137,585 $128,333 $134,306 $132,449 $97,038
Portfolio turnover 67% 98% 91% 36% 23%
Notes to Financial Highlights
(a) Rounds to less than $0.01.
(b) In addition to the fees and expenses which the Fund bears directly, the Fund indirectly bears a pro rata share of the fees and expenses ofthe acquired funds in which it invests. Such indirect expenses are not included in the reported expense ratios.
(c) Total net expenses include the impact of certain waivers/reimbursements made by the Investment Manager and certain of its affiliates, ifapplicable.
(d) The benefits derived from expense reductions had an impact of less than 0.01%.

29Annual Report 2012
Notes to Financial StatementsDecember 31, 2012
Note 1. Organization
Columbia Variable Portfolio — High Income Fund (the Fund),a series of Columbia Funds Variable Insurance Trust I (theTrust), is a diversified fund. The Trust is registered under theInvestment Company Act of 1940, as amended (the 1940 Act),as an open-end management investment company organized asa Delaware statutory trust.
Fund Shares
The Trust may issue an unlimited number of shares (without parvalue). The Fund offers Class 1 and Class 2 shares to separateaccounts funding variable annuity contracts and variable lifeinsurance policies (collectively, Contracts) issued by affiliatedand unaffiliated life insurance companies as well as qualifiedpension and retirement plans (Qualified Plans) and otherqualified institutional investors authorized by ColumbiaManagement Investment Distributors, Inc. (the Distributor). Youmay not buy (nor will you own) shares of the Fund directly. Youinvest by participating in a Qualified Plan or buying a Contractand making allocations to the Fund. All share classes haveidentical voting, dividend and liquidation rights. Each shareclass has its own expense structure.
Note 2. Summary of Significant
Accounting Policies
Use of Estimates
The preparation of financial statements in accordance with U.S.generally accepted accounting principles (GAAP) requiresmanagement to make certain estimates and assumptions thataffect the reported amounts of assets and liabilities, thedisclosure of contingent assets and liabilities at the date of thefinancial statements and the reported amounts of revenue andexpenses during the reporting period. Actual results coulddiffer from those estimates.
The following is a summary of significant accounting policiesconsistently followed by the Fund in the preparation of itsfinancial statements.
Security Valuation
Debt securities generally are valued by pricing services approvedby the Board of Trustees (the Board) based upon markettransactions for normal, institutional-size trading units of similarsecurities. The services may use various pricing techniqueswhich take into account appropriate factors such as yield, quality,coupon rate, maturity, type of issue, trading characteristics andother data, as well as broker quotes. Debt securities for whichquotations are readily available may also be valued based uponan over-the-counter or exchange bid quotation.
All equity securities are valued at the close of business of theNew York Stock Exchange (NYSE). Equity securities arevalued at the last quoted sales price on the principal exchange
or market on which they trade, except for securities traded onthe NASDAQ Stock Market, which are valued at theNASDAQ official close price. Unlisted securities or listedsecurities for which there were no sales during the day arevalued at the mean of the latest quoted bid and ask prices onsuch exchanges or markets.
Foreign securities are valued based on quotations from theprincipal market in which such securities are normally traded. Ifany foreign share prices are not readily available as a result oflimited share activity the securities are valued at the mean of thelatest quoted bid and ask prices on such exchanges or markets.Foreign currency exchange rates are generally determined at4:00 p.m. Eastern (U.S.) time. However, many securities marketsand exchanges outside the U.S. close prior to the close of theNYSE; therefore, the closing prices for securities in suchmarkets or on such exchanges may not fully reflect events thatoccur after such close but before the close of the NYSE. In thosesituations, foreign securities will be fair valued pursuant to thepolicy adopted by the Board, including utilizing a third partypricing service to determine these fair values. The third partypricing service takes into account multiple factors, including, butnot limited to, movements in the U.S. securities markets, certaindepositary receipts, futures contracts and foreign exchange ratesthat have occurred subsequent to the close of the foreignexchange or market, to determine a good faith estimate thatreasonably reflects the current market conditions as of the closeof the NYSE. The fair value of a security is likely to be differentfrom the quoted or published price, if available.
Investments in other open-end investment companies,including money market funds, are valued at net asset value.
Short-term securities purchased within 60 days to maturity arevalued at amortized cost, which approximates market value.The value of short-term securities originally purchased withmaturities greater than 60 days is determined based on anamortized value to par upon reaching 60 days to maturity.Short-term securities maturing in more than 60 days from thevaluation date are valued at the market price or approximatemarket value based on current interest rates.
Investments for which market quotations are not readilyavailable, or that have quotations which management believesare not reliable, are valued at fair value as determined in goodfaith under consistently applied procedures established by andunder the general supervision of the Board. If a security orclass of securities (such as foreign securities) is valued at fairvalue, such value is likely to be different from the last quotedmarket price for the security.
The determination of fair value often requires significantjudgment. To determine fair value, management may useassumptions including but not limited to future cash flows andestimated risk premiums. Multiple inputs from various sourcesmay be used to determine fair value.
Columbia Variable Portfolio — High Income Fund

30 Annual Report 2012
Notes to Financial Statements (continued)December 31, 2012
Repurchase Agreements
The Fund may engage in repurchase agreement transactionswith institutions that management has determined arecreditworthy. The Fund, through the custodian, receivesdelivery of the underlying securities collateralizing arepurchase agreement. Management is responsible fordetermining that the collateral is at least equal, at all times, tothe value of the repurchase obligation including interest. Arepurchase agreement transaction involves certain risks in theevent of default or insolvency of the counterparty. These risksinclude possible delays in or restrictions on the Fund’s abilityto dispose of the underlying securities and a possible declinein the value of the underlying securities during the periodwhile the Fund seeks to assert its rights.
Loan Participations and Commitments
The Fund may invest in loan participations. When the Fundpurchases a loan participation, the Fund typically enters into acontractual relationship with the lender or third party sellingsuch participation (Selling Participant), but not the borrower.However, the Fund assumes the credit risk of the borrower,Selling Participant and any other persons interpositionedbetween the Fund and the borrower. The Fund may not directlybenefit from the collateral supporting the senior loan which ithas purchased from the Selling Participant.
Security Transactions
Security transactions are accounted for on the trade date. Costis determined and gains (losses) are based upon the specificidentification method for both financial statement and federalincome tax purposes.
Income Recognition
Interest income is recorded on an accrual basis. Marketpremiums and discounts, including original issue discounts,are amortized and accreted, respectively, over the expected lifeof the security on all debt securities, unless otherwise noted.
Corporate actions and dividend income are recorded net ofany non-reclaimable tax withholdings, on the ex-dividend dateor upon receipt of ex-dividend notification in the case ofcertain foreign securities.
Expenses
General expenses of the Trust are allocated to the Fund andother funds of the Trust based upon relative net assets or otherexpense allocation methodologies determined by the nature ofthe expense. Expenses directly attributable to the Fund arecharged to the Fund. Expenses directly attributable to aspecific class of shares are charged to that share class.
Determination of Class Net Asset Value
All income, expenses (other than class-specific expenses,which are charged to that share class, as shown in theStatement of Operations) and realized and unrealized gains(losses) are allocated to each class of the Fund on a dailybasis, based on the relative net assets of each class, forpurposes of determining the net asset value of each class.
Federal Income Tax Status
The Fund intends to qualify each year as a regulated investmentcompany under Subchapter M of the Internal Revenue Code, asamended, and will distribute substantially all of its taxableincome, if any, for its tax year, and as such will not be subjectto federal income taxes. In addition, because the Fund’s soleshareholders are Qualified Investors, the Fund expects not tobe subject to federal excise tax. Therefore, no federal income orexcise tax provision is recorded.
Distributions to Subaccounts
Distributions from net investment income, if any, are declaredand paid annually. Net realized capital gains, if any, aredistributed along with the income distribution. Incomedistributions and capital gain distributions are determined inaccordance with federal income tax regulations, which maydiffer from GAAP. All dividends and distributions arereinvested in additional shares of the applicable class of theFund at net asset value as of the ex-dividend date of thedistribution.
Guarantees and Indemnifications
Under the Trust’s organizational documents and, in somecases, by contract, its officers and trustees are indemnifiedagainst certain liabilities arising out of the performance oftheir duties to the Trust or its funds. In addition, certain of theFund’s contracts with its service providers contain generalindemnification clauses. The Fund’s maximum exposureunder these arrangements is unknown since the amount of anyfuture claims that may be made against the Fund cannot bedetermined, and the Fund has no historical basis for predictingthe likelihood of any such claims.
Recent Accounting Pronouncement
Disclosures about Offsetting Assets and LiabilitiesIn December 2011, the Financial Accounting Standards Board(FASB) issued Accounting Standards Update (ASU)No. 2011-11, Disclosures about Offsetting Assets andLiabilities. The objective of the FASB is to enhance currentdisclosure requirements on offsetting of certain assets andliabilities and to enable financial statement users to comparefinancial statements prepared under GAAP and InternationalFinancial Reporting Standards.
Columbia Variable Portfolio — High Income Fund

31Annual Report 2012
Notes to Financial Statements (continued)December 31, 2012
Specifically, ASU No. 2011-11 requires an entity to discloseboth gross and net information for derivatives and other financialinstruments that are subject to a master netting arrangement orsimilar agreement. The standard requires disclosure of collateralreceived in connection with the master netting agreements orsimilar agreements. The effective date of ASU No. 2011-11 isfor interim and annual periods beginning on or after January 1,2013. At this time, management is evaluating the implications ofthis guidance and the impact it will have on the financialstatement amounts and footnote disclosures, if any.
Note 3. Fees and Compensation Paid to
Affiliates
Investment Management Fees
Under an Investment Management Services Agreement,Columbia Management Investment Advisers, LLC (theInvestment Manager), a wholly-owned subsidiary ofAmeriprise Financial, Inc. (Ameriprise Financial), determineswhich securities will be purchased, held or sold. Theinvestment management fee is an annual fee that is equal to0.55% of the Fund’s average daily net assets.
Administration Fees
Under an Administrative Services Agreement, the InvestmentManager serves as the Fund Administrator. The Fund pays theFund Administrator an annual fee for administration andaccounting services equal to 0.08% of the Fund’s averagedaily net assets.
Other Expenses
Other expenses are for, among other things, certain expensesof the Fund or the Board, including: Fund boardroom andoffice expense, employee compensation, employee health andretirement benefits, and certain other expenses. Payment ofthese Fund and Board expenses is facilitated by a companyproviding limited administrative services to the Fund and theBoard. For the year ended December 31, 2012, other expensespaid to this company were $1,899.
Compensation of Board Members
Board members are compensated for their services to the Fundas disclosed in the Statement of Operations. Under a DeferredCompensation Plan (the Plan), the Board members who arenot “interested persons” of the Fund, as defined under the1940 Act, may elect to defer payment of up to 100% of theircompensation. Deferred amounts are treated as thoughequivalent dollar amounts had been invested in shares ofcertain funds managed by the Investment Manager. TheFund’s liability for these amounts is adjusted for market valuechanges and remains in the Fund until distributed inaccordance with the Plan.
Transfer Agent Fees
The Fund has a Transfer Agency and Dividend DisbursingAgent Agreement with Columbia Management InvestmentServices Corp. (the Transfer Agent), an affiliate of theInvestment Manager and a wholly-owned subsidiary ofAmeriprise Financial. The annual fee rate under thisagreement is 0.06% of the Fund’s average daily net assets. TheTransfer Agent also receives compensation from fees forvarious shareholder services and reimbursements for certainout-of-pocket fees.
Distribution Fees
The Fund has an agreement with the Distributor, an affiliate ofthe Investment Manager and a wholly-owned subsidiary ofAmeriprise Financial, for distribution services. Pursuant toRule 12b-1 under the 1940 Act, the Board has approved, andthe Fund has adopted, a distribution plan (the Plan) which setsthe distribution fees for the Fund. These fees are calculateddaily and are intended to compensate the Distributor forselling shares of the Fund. The Plan requires the payment of amonthly distribution fee to the Distributor at the maximumannual rate of 0.25% of the average daily net assets attributableto Class 2 shares of the Fund.
The Distributor has voluntarily agreed to waive 0.19% of thedistribution fee for Class 2 shares. This arrangement may bemodified or terminated by the Distributor at any time.
Expenses Waived/Reimbursed by the Investment
Manager and its Affiliates
Effective May 1, 2012, the Investment Manager and certain ofits affiliates have contractually agreed to waive fees and/orreimburse expenses (excluding certain fees and expensesdescribed below), through April 30, 2013, unless soonerterminated at the sole discretion of the Board, so that theFund’s net operating expenses, after giving effect to feeswaived/expenses reimbursed and any balance credits and/oroverdraft charges from the Fund’s custodian, do not exceedthe following annual rates as a percentage of the class’ averagedaily net assets:
Class 1 0.72%
Class 2 0.97
Under the agreement governing these fee waivers and/orexpense reimbursement arrangements, the following fees andexpenses are excluded from the waiver/reimbursementcommitment, and therefore will be paid by the Fund, ifapplicable: taxes (including foreign transaction taxes), expensesassociated with investments in affiliated and non-affiliatedpooled investment vehicles (including mutual funds andexchange traded funds), transaction costs and brokeragecommissions, costs related to any securities lending program,
Columbia Variable Portfolio — High Income Fund

32 Annual Report 2012
Notes to Financial Statements (continued)December 31, 2012
dividend expenses associated with securities sold short, inversefloater program fees and expenses, transaction charges andinterest on borrowed money, interest, extraordinary expensesand any other expenses the exclusion of which is specificallyapproved by the Board. This agreement may be modified oramended only with approval from all parties.
Prior to May 1, 2012, the Investment Manager voluntarilyagreed to reimburse a portion of the Fund’s expenses (excludingcertain expenses, such as brokerage commissions, interest, taxesand extraordinary expenses, but including custodian chargesrelating to overdrafts, if any) so that the Fund’s ordinary netoperating expenses, after giving effect to fees waived/expensesreimbursed, did not exceed the following annual rates as apercentage of the class’ average daily net assets:
Class 1 0.60%
Class 2 0.85
Note 4. Federal Tax Information
The timing and character of income and capital gaindistributions are determined in accordance with income taxregulations, which may differ from GAAP because oftemporary or permanent book to tax differences.
At December 31, 2012, these differences are primarily due todiffering treatment for capital loss carryforwards, principaland/or interest of fixed income securities, deferral/reversal ofwash sale losses and Trustees’ deferred compensation. To theextent these differences are permanent, reclassifications aremade among the components of the Fund’s net assets in theStatement of Assets and Liabilities. Temporary differences donot require reclassifications. In the Statement of Assets andLiabilities the following reclassifications were made:
Undistributed net investment income $87,371
Accumulated net realized loss (92,059)
Paid-in capital 4,688
Net investment income and net realized gains (losses), asdisclosed in the Statement of Operations, and net assets werenot affected by this reclassification.
The tax character of distributions paid during the yearsindicated was as follows:
Year Ended December 31, 2012 2011
Ordinary income $12,147,038 $13,760,484
Total $12,147,038 $13,760,484
Short-term capital gain distributions, if any, are consideredordinary income distributions for tax purposes.
At December 31, 2012, the components of distributableearnings on a tax basis were as follows:
Undistributed ordinary income $10,844,266
Accumulated realized loss (25,103,855)
Unrealized appreciation 9,261,024
At December 31, 2012, the cost of investments for federalincome tax purposes was $173,636,489 and the aggregate grossunrealized appreciation and depreciation based on that cost was:
Unrealized appreciation $11,945,097
Unrealized depreciation (2,684,073)
Net unrealized appreciation $9,261,024
The following capital loss carryforward, determined atDecember 31, 2012, may be available to reduce taxableincome arising from future net realized gains on investments,if any, to the extent permitted by the Internal Revenue Code:
Year of Expiration Amount
2016 $4,605,113
2017 20,498,742
Total $25,103,855
For the year ended December 31, 2012, $4,897,447 of capitalloss carryforward was utilized.
Management of the Fund has concluded that there are nosignificant uncertain tax positions that would requirerecognition in the financial statements. However, management’sconclusion may be subject to review and adjustment at a laterdate based on factors including, but not limited to, new tax laws,regulations, and administrative interpretations (includingrelevant court decisions). Generally, the Fund’s federal taxreturns for the prior three fiscal years remain subject toexamination by the Internal Revenue Service.
Note 5. Portfolio Information
The cost of purchases and proceeds from sales of securities,excluding short-term obligations, aggregated to $117,641,831and $124,628,868, respectively, for the year endedDecember 31, 2012.
Note 6. Affiliated Money Market Fund
The Fund invests its daily cash balances in Columbia Short-TermCash Fund, an affiliated money market fund established for theexclusive use by the Fund and other affiliated funds. The incomeearned by the Fund from such investments is included as“Dividends — affiliated issuers” in the Statement of Operations.As an investing fund, the Fund indirectly bears its proportionateshare of the expenses of Columbia Short-Term Cash Fund.
Columbia Variable Portfolio — High Income Fund

33Annual Report 2012
Notes to Financial Statements (continued)December 31, 2012
Note 7. Shareholder Concentration
At December 31, 2012, two unaffiliated shareholder accountsowned an aggregate of 21.4% of the outstanding shares of theFund. The Fund has no knowledge about whether any portionof those shares was owned beneficially by such accounts.Affiliated shareholder accounts owned 66.6% of the outstandingshares of the Fund. Subscription and redemption activity byconcentrated accounts may have a significant effect on theoperations of the Fund.
Note 8. Line of Credit
The Fund has entered into a revolving credit facility with asyndicate of banks led by JPMorgan Chase Bank N.A.whereby the Fund may borrow for the temporary funding ofshareholder redemptions or for other temporary or emergencypurposes. The credit facility agreement, as amended, which isa collective agreement between the Fund and certain otherfunds managed by the Investment Manager, severally and notjointly, permits collective borrowings up to $500 million.Interest is charged to each participating fund based on itsborrowings at a rate equal to the higher of (i) the overnightfederal funds rate plus 1.00% or (ii) the one-month LIBORrate plus 1.00%. Each borrowing under the credit facilitymatures no later than 60 days after the date of borrowing. TheFund also pays a commitment fee equal to its pro rata share ofthe amount of the credit facility at a rate of 0.08% per annum.
The Fund had no borrowings during the year endedDecember 31, 2012.
Note 9. Proposed Fund Merger
In September 2012, the Board of Trustees approved a proposalto merge the Fund into Columbia Variable Portfolio — IncomeOpportunities Fund. Shareholders of the Fund will vote on theproposed merger at a special meeting of shareholders to beheld during the first half of 2013.
Note 10. Significant Risks
High Yield Securities Risk
Investing in high-yield fixed income securities may involvegreater credit risk and considerations not typically associatedwith investing in U.S. Government bonds and other higherquality fixed income securities. These securities arenon-investment grade securities, often referred to as “junk”bonds. Economic downturns may disrupt the high yield marketand impair the ability of issuers to repay principal and interest.Also, an increase in interest rates would likely have an adverseimpact on the value of such obligations. Moreover, high-yieldsecurities may be less liquid to the extent that there is noestablished secondary market.
Note 11. Subsequent Events
Management has evaluated the events and transactions that haveoccurred through the date the financial statements were issuedand noted no items requiring adjustment of the financialstatements or additional disclosure.
Note 12. Information Regarding Pending
and Settled Legal Proceedings
In December 2005, without admitting or denying theallegations, American Express Financial Corporation (AEFC,which is now known as Ameriprise Financial, Inc. (AmeripriseFinancial)) entered into settlement agreements with theSecurities and Exchange Commission (SEC) and MinnesotaDepartment of Commerce (MDOC) related to market timingactivities. As a result, AEFC was censured and ordered to ceaseand desist from committing or causing any violations of certainprovisions of the Investment Advisers Act of 1940, theInvestment Company Act of 1940, and various Minnesota laws.AEFC agreed to pay disgorgement of $10 million and civilmoney penalties of $7 million. AEFC also agreed to retain anindependent distribution consultant to assist in developing aplan for distribution of all disgorgement and civil penaltiesordered by the SEC in accordance with various undertakingsdetailed at www.sec.gov/litigation/admin/ia-2451.pdf.Ameriprise Financial and its affiliates have cooperated with theSEC and the MDOC in these legal proceedings, and have maderegular reports to the funds’ Boards of Trustees.
Ameriprise Financial and certain of its affiliates havehistorically been involved in a number of legal, arbitration andregulatory proceedings, including routine litigation, classactions, and governmental actions, concerning matters arisingin connection with the conduct of their business activities.Ameriprise Financial believes that the Funds are not currentlythe subject of, and that neither Ameriprise Financial nor any ofits affiliates are the subject of, any pending legal, arbitration orregulatory proceedings that are likely to have a materialadverse effect on the Funds or the ability of AmeripriseFinancial or its affiliates to perform under their contracts withthe Funds. Ameriprise Financial is required to make 10-Q,10-K and, as necessary, 8-K filings with the Securities andExchange Commission on legal and regulatory matters thatrelate to Ameriprise Financial and its affiliates. Copies ofthese filings may be obtained by accessing the SEC website atwww.sec.gov.
There can be no assurance that these matters, or the adversepublicity associated with them, will not result in increasedfund redemptions, reduced sale of fund shares or other adverseconsequences to the Funds. Further, although we believeproceedings are not likely to have a material adverse effect onthe Funds or the ability of Ameriprise Financial or its affiliates
Columbia Variable Portfolio — High Income Fund

34 Annual Report 2012
Notes to Financial Statements (continued)December 31, 2012
to perform under their contracts with the Funds, theseproceedings are subject to uncertainties and, as such, we areunable to estimate the possible loss or range of loss that mayresult. An adverse outcome in one or more of these proceedingscould result in adverse judgments, settlements, fines, penaltiesor other relief that could have a material adverse effect on theconsolidated financial condition or results of operations ofAmeriprise Financial.
Columbia Variable Portfolio — High Income Fund

Annual Report 2012 35
To the Trustees of Columbia Funds Variable Insurance Trust I and the Shareholders of
Columbia Variable Portfolio — High Income Fund
In our opinion, the accompanying statement of assets and liabilities, including the portfolio of investments, and the relatedstatements of operations and of changes in net assets and the financial highlights present fairly, in all material respects, thefinancial position of Columbia Variable Portfolio — High Income Fund (the “Fund”) (a series of Columbia Funds VariableInsurance Trust I) at December 31, 2012, the results of its operations, the changes in its net assets, and the financialhighlights for each of the periods indicated, in conformity with accounting principles generally accepted in the United Statesof America. These financial statements and financial highlights (hereafter referred to as “financial statements”) are theresponsibility of the Fund’s management. Our responsibility is to express an opinion on these financial statements based onour audit. We conducted our audit of these financial statements in accordance with the standards of the Public CompanyAccounting Oversight Board (United States). Those standards require that we plan and perform the audit to obtainreasonable assurance about whether the financial statements are free of material misstatement. An audit includes examining,on a test basis, evidence supporting the amounts and disclosures in the financial statements, assessing the accountingprinciples used and significant estimates made by management, and evaluating the overall financial statement presentation.We believe that our audits, which included confirmation of securities at December 31, 2012 by correspondence with thecustodian, transfer agent, agent banks and brokers, provides a reasonable basis for our opinion.
PricewaterhouseCoopers LLP
Minneapolis, Minnesota
February 19, 2013
Columbia Variable Portfolio — High Income Fund
Report of Independent Registered Public Accounting Firm

Trustees and Officers
Columbia Variable Portfolio — High Income Fund
Shareholders elect the Board that oversees the funds’ operations. The Board appoints officers who are responsible forday-to-day business decisions based on policies set by the Board. The following table provides basic biographicalinformation about the funds’ Board members, including their principal occupations during the past five years, althoughspecific titles for individuals may have varied over the period. Under current Board policy, members may serve until thenext Board meeting after he or she reaches the mandatory retirement age established by the Board, or the fifteenthanniversary of the first Board meeting they attended as a member of the Board.
Mr. Edward J. Boudreau, Jr., Mr. William P. Carmichael, Mr. William A. Hawkins, Mr. R. Glenn Hilliard, Ms. Minor M. Shawand Dr. Anthony M. Santomero, were members of the Legacy Columbia Nations funds’ Board (“Nations Funds”), whichincludes Columbia Funds Series Trust, Columbia Funds Variable Insurance Trust I and Columbia Funds Master InvestmentTrust, LLC and began service on the Board for the Legacy RiverSource funds (“RiverSource Funds”) effective June 1, 2011.
Independent Trustees
Name, Position Held With Principal Occupation Number of Other Present or Past
Address, Funds and Length of During Past Five Years Funds in the Directorships/Trusteeships
Year of Birth Service Fund Family (Within Past 5 Years)
Overseen by
Board Member
None152Attorney; Chief Justice, MinnesotaSupreme Court, 1998-2006
Board member since1/06 for RiverSourceFunds and since 6/11for Nations Funds
Kathleen Blatz901 S. Marquette Ave.Minneapolis, MN 554021954
Former Trustee, BofA FundsSeries Trust (11 funds)
145Managing Director, E.J. Boudreau &Associates (consulting) since 2000
Board member since6/11 for RiverSourceFunds and since 1/05for Nations Funds
Edward J. Boudreau, Jr.225 Franklin StreetBoston, MA 021101944
None152President, Springboard — Partnersin Cross Cultural Leadership(consulting company)
Board member since7/07 for RiverSourceFunds and since 6/11for Nations Funds
Pamela G. Carlton901 S. Marquette Ave.Minneapolis, MN 554021954
Director, Cobra ElectronicsCorporation (electronicequipment manufacturer);The Finish Line (athleticshoes and apparel)since July 2003; McMoRanExploration Company (oiland gas exploration anddevelopment) since 2010;former Trustee, BofA FundsSeries Trust (11 funds);former Director, SpectrumBrands, Inc. (consumerproducts); former Director,Simmons Company (bedding)
145RetiredBoard member since6/11 for RiverSourceFunds and since 1999for Nations Funds
William P. Carmichael225 Franklin StreetBoston, MA 021101943
None152Trustee Professor of Economics andManagement, Bentley University;former Dean, McCallum GraduateSchool of Business, BentleyUniversity
Board member since11/04 for RiverSourceFunds and since 6/11for Nations Funds
Patricia M. Flynn901 S. Marquette Ave.Minneapolis, MN 554021950
Trustee, BofA Funds SeriesTrust (11 funds)
145Managing Director, Overton Partners(financial consulting), sinceAugust 2010; President and ChiefExecutive Officer, California GeneralBank, N.A., January 2008-August 2010
Board member since6/11 for RiverSourceFunds and since 1/05for Nations Funds
William A. Hawkins225 Franklin StreetBoston, MA 021101942
Annual Report 201236

Columbia Variable Portfolio — High Income Fund
Trustees and Officers (continued)
Independent Trustees (continued)
Name, Position Held With Principal Occupation Number of Other Present or Past
Address, Funds and Length of During Past Five Years Funds in the Directorships/Trusteeships
Year of Birth Service Fund Family (Within Past 5 Years)
Overseen by
Board Member
R. Glenn Hilliard225 Franklin StreetBoston, MA 021101943
Board member since6/11 for RiverSourceFunds and since 1/05for Nations Funds
Chairman and Chief ExecutiveOfficer, Hilliard Group LLC (investingand consulting), since April 2003;Non-Executive Director & Chairman,CNO Financial Group, Inc. (insurance),September 2003-May 2011
145 Chairman, BofA Fund SeriesTrust (11 funds); formerDirector, CNO FinancialGroup, Inc. (insurance)
Stephen R. Lewis, Jr.901 S. Marquette Ave.Minneapolis, MN 554021939
Chair of the Board forRiverSource Fundssince 1/07, Boardmember forRiverSource Fundssince 1/02 andsince 6/11 forNations Funds
President Emeritus and Professor ofEconomics Emeritus, CarletonCollege
152 Director, Valmont Industries,Inc. (manufactures irrigationsystems) since 2002
Catherine James Paglia901 S. Marquette Ave.Minneapolis, MN 554021952
Board member since11/04 for RiverSourceFunds and since 6/11for Nations Funds
Director, Enterprise AssetManagement, Inc. (private realestate and asset managementcompany)
152 None
Leroy C. Richie901 S. Marquette Ave.Minneapolis, MN 554021941
Board member since2000 for LegacySeligman Funds,since 11/08 forRiverSource Fundsand since 6/11 forNations Funds
Counsel, Lewis & Munday, P.C. since2004; former Vice President andGeneral Counsel, Automotive LegalAffairs, Chrysler Corporation
152 Lead Outside Director, DigitalAlly, Inc. (digital imaging)since September 2005;Infinity, Inc. (oil and gasexploration and production);OGE Energy Corp. (energyand energy services) sinceNovember 2007
Minor M. Shaw225 Franklin StreetBoston, MA 021101947
Board member since6/11 for RiverSourceFunds and since 2003for Nations Funds
President, Micco LLC (privateinvestments)
145 Director, Piedmont NaturalGas; Director, BlueCrossBlueShield of South Carolinasince April 2008; FormerTrustee, BofA Funds SeriesTrust (11 funds)
Alison Taunton-Rigby901 S. Marquette Ave.Minneapolis, MN 554021944
Board member since11/02 for RiverSourceFunds and since 6/11for Nations Funds
Chief Executive Officer and Director,RiboNovix, Inc., 2003-2010(biotechnology); former President,Aquila Biopharmaceuticals
152 Director, Healthways, Inc.(health managementprograms) since 2005;Director, ICI MutualInsurance Company, RRG;Director, Abt Associates(government contractor)
Annual Report 2012 37

Columbia Variable Portfolio — High Income Fund
Trustees and Officers (continued)
Interested Trustee Not Affiliated With Investment Manager*
Name, Position Held With Principal Occupation Number of Other Present or Past
Address, Funds and Length of During Past Five Years Funds in the Directorships/Trusteeships
Year of Birth Service Fund Family (Within Past 5 Years)
Overseen by
Board Member
*Dr. Santomero is not an affiliated person of the investment manager or Ameriprise Financial. However, he is currently deemed by the funds tobe an “interested person” (as defined in the 1940 Act) of the funds because he serves as a Director of Citigroup, Inc. and Citibank N.A.,companies that may directly or through subsidiaries and affiliates engage from time-to-time in brokerage execution, principal transactions andlending relationships with the funds or accounts advised/managed by the investment manager.
Interested Trustee Affiliated With Investment Manager*
Name, Position Held With Principal Occupation Number of Other Present or Past
Address, Funds and Length of During Past Five Years Funds in the Directorships/Trusteeships
Year of Birth Service Fund Family (Within Past 5 Years)
Overseen by
Board Member
*Interested person (as defined under the 1940 Act) by reason of being an officer, director, security holder and/or employee of the investmentmanager or Ameriprise Financial.
The SAI has additional information about the Fund’s Board members and is available, without charge, upon request bycalling 800.345.6611 or contacting your financial intermediary.
Anthony M. Santomero225 Franklin StreetBoston, MA 021101946
Board member since6/11 for RiverSourceFunds and since 1/08for Nations Funds
Richard K. Mellon ProfessorEmeritus of Finance, The WhartonSchool, University of Pennsylvania,since 2002; Senior Advisor,McKinsey & Company (consulting),2006-2008
145 Director, RenaissanceReinsurance Ltd. sinceMay 2008; Trustee, PennMutual Life InsuranceCompany; Director, Citigroupsince 2009; Director,Citibank, N.A. since 2009;former Trustee, BofA FundsSeries Trust (11 funds)
William F. Truscott53600 AmeripriseFinancial CenterMinneapolis, MN 554741960
Board member since11/01 for RiverSourceFunds and since 6/11for Nations Funds;Senior Vice Presidentsince 2002
President, Columbia ManagementInvestment Advisers, LLC sinceFebruary 2012, (previouslyPresident, Chairman of the Boardand Chief Investment Officer, 2001-April 2010); Chief Executive Officer,Global Asset Management,Ameriprise Financial, Inc. sinceSeptember 2012 (previously ChiefExecutive Officer, U.S. AssetManagement & President, Annuities,May 2010-September 2012 andPresident — U.S. AssetManagement and Chief InvestmentOfficer, 2005-April 2010); Presidentand Chief Executive Officer,Ameriprise Certificate Company2006-August 2012; Chief ExecutiveOfficer, Columbia ManagementInvestment Distributors, Inc. sinceFebruary 2012, (previously Chairmanof the Board and Chief ExecutiveOfficer, 2006-April 2010); Chairmanof the Board and Chief ExecutiveOfficer, RiverSource Distributors, Inc.since 2006.
204 Chairman of the Board,Columbia ManagementInvestment Advisers, LLCsince May 2012; Director,Columbia ManagementInvestment Distributors, Inc.since May 2010; Director,Ameriprise CertificateCompany, 2006-January 2013
Annual Report 201238

39Annual Report 2012
The Board has appointed officers who are responsible for day-to-day business decisions based on policies it has established.The officers serve at the pleasure of the Board. In addition to Mr. Truscott, who is Senior Vice President, the funds’ otherofficers are:
Officers
Name, Position Held With Principal Occupation During Past Five Years
Address, Funds and Length of
Year of Birth Service
J. Kevin Connaughton225 Franklin StreetBoston, MA 021101964
President and PrincipalExecutive Officer since5/10 for RiverSourceFunds and 2009 forNations Funds
Senior Vice President and General Manager — Mutual Fund Products, ColumbiaManagement Investment Advisers, LLC since May 2010; Managing Director ofColumbia Management Advisors, LLC, December 2004-April 2010; Senior VicePresident and Chief Financial Officer, Columbia Funds, June 2008-January 2009;Treasurer, Columbia Funds, October 2003-May 2008
Amy K. Johnson5228 AmeripriseFinancial CenterMinneapolis, MN 554741965
Vice President since12/06 for RiverSourceFunds and 5/10 forNations Funds
Senior Vice President and Chief Operating Officer, Columbia ManagementInvestment Advisers, LLC since May 2010 (previously Chief Administrative Officer,2009-April 2010 and Vice President — Asset Management and Trust CompanyServices, 2006-2009)
Michael G. Clarke225 Franklin StreetBoston, MA 021101969
Treasurer since 1/11and Chief FinancialOfficer since 4/11RiverSource Funds andTreasurer since 3/11and Chief FinancialOfficer since 2009 forNations Funds
Vice President, Columbia Management Investment Advisers, LLC since May 2010;Managing Director of Fund Administration, Columbia Management Advisors, LLC,September 2004-April 2010; senior officer of Columbia Funds and affiliated fundssince 2002
Scott R. Plummer5228 AmeripriseFinancial CenterMinneapolis, MN 554741959
Senior Vice Presidentand Chief LegalOfficer since 12/06and AssistantSecretary since 6/11for RiverSource Fundsand Senior VicePresident and ChiefLegal Officer since5/10 and AssistantSecretary since 6/11for Nations Funds
Senior Vice President, Chief Legal Officer and Assistant Secretary, ColumbiaManagement Investment Advisers, LLC since June 2005; Vice President and LeadChief Counsel — Asset Management, Ameriprise Financial, Inc. since May 2010(previously Vice President and Chief Counsel — Asset Management, 2005-April 2010); Vice President, Chief Counsel and Assistant Secretary, ColumbiaManagement Investment Distributors, Inc. since 2008; Vice President, GeneralCounsel and Secretary, Ameriprise Certificate Company since 2005; Chief Counsel,RiverSource Distributors, Inc. since 2006
Colin Moore225 Franklin StreetBoston, MA 021101958
Senior Vice Presidentsince 5/10 forRiverSource Fundsand Nations Funds
Director and Chief Investment Officer, Columbia Management Investment Advisers,LLC since May 2010; Manager, Managing Director and Chief Investment Officer,Columbia Management Advisors, LLC, 2007-April 2010
Thomas P. McGuire225 Franklin StreetBoston, MA 021101972
Chief ComplianceOfficer since 3/12
Vice President — Asset Management Compliance, Columbia ManagementInvestment Advisers, LLC since 2010; Chief Compliance Officer, AmeripriseCertificate Company since September 2010; Compliance Executive, Bank ofAmerica, 2005-2010
Stephen T. Welsh225 Franklin StreetBoston, MA 021101957
Vice President since4/11 for RiverSourceFunds and 2006 forNations Funds
President and Director, Columbia Management Investment Services Corp. sinceMay 2010; President and Director, Columbia Management Services, Inc., July 2004-April 2010; Managing Director, Columbia Management Distributors, Inc.,August 2007-April 2010
Christopher O. Petersen5228 AmeripriseFinancial CenterMinneapolis, MN 554741970
Vice President andSecretary since 4/11for RiverSource Fundsand 3/11 for NationsFunds
Vice President and Chief Counsel, Ameriprise Financial since January 2010(formerly Vice President and Group Counsel or Counsel, April 2004-January 2010);Assistant Secretary of Legacy RiverSource Funds, January 2007-April 2011 and ofthe Nations Funds, May 2010-March 2011
Trustees and Officers (continued)
Columbia Variable Portfolio — High Income Fund

Columbia Variable Portfolio — High Income Fund
Trustees and Officers (continued)
Officers (continued)
Name, Position Held With Principal Occupation During Past Five Years
Address, Funds and Length of
Year of Birth Service
Paul D. Pearson10468 AmeripriseFinancial CenterMinneapolis, MN 554741956
Vice President since4/11 and AssistantTreasurer since 1999for RiverSource Fundsand Vice Presidentand AssistantTreasurer since 6/11for Nations Funds
Vice President — Investment Accounting, Columbia Management InvestmentAdvisers, LLC, since May 2010; Vice President — Managed Assets, InvestmentAccounting, Ameriprise Financial Corporation, February 1998-May 2010
Joseph F. DiMaria225 Franklin StreetBoston, MA 021101968
Vice President andChief AccountingOfficer since 4/11and Vice Presidentsince 3/11 and ChiefAccounting Officersince 2008 forNations Funds
Vice President, Mutual Fund Administration, Columbia Management InvestmentAdvisers, LLC, since May 2010; Director of Fund Administration, ColumbiaManagement Advisors, LLC, January 2006-April 2010
Paul B. Goucher100 Park AvenueNew York, NY 100171968
Vice President since4/11 and AssistantSecretary since11/08 for RiverSourceFunds and 5/10 forNations Funds
Vice President and Lead Chief Counsel, Ameriprise Financial, Inc. sinceNovember 2008 and January 2013, respectively (formerly, Chief Counsel fromJanuary 2010-January 2013 and Group Counsel from November 2008-January 2010); Director, Managing Director and General Counsel, J. & W.Seligman & Co. Incorporated, July 2008-November 2008 (previously, ManagingDirector and Associate General Counsel, January 2005-July 2008)
Michael E. DeFao225 Franklin StreetBoston, MA 021101968
Vice President since4/11 and AssistantSecretary since 5/10for RiverSource Fundsand 2011 for NationsFunds
Vice President and Chief Counsel, Ameriprise Financial since May 2010; AssociateGeneral Counsel Bank of America, June 2005-April 2010
Annual Report 201240

41Annual Report 2012
The policy of the Board is to vote the proxies of the companies in which each fund holds investments consistent with theprocedures as stated in the Statement of Additional Information (SAI). You may obtain a copy of the SAI without charge bycalling 800.345.6611; contacting your financial intermediary; or searching the website of the Securities and ExchangeCommission (SEC) at sec.gov. Information regarding how each fund voted proxies relating to portfolio securities is filedwith the SEC by August 31 for the most recent 12-month period ending June 30 of that year, and is available without chargeby visiting columbiamanagement.com; or searching the website of the SEC at sec.gov.
Each fund files a complete schedule of portfolio holdings with the SEC for the first and third quarters of each fiscal year onForm N-Q. Each fund’s Form N-Q is available on the SEC’s website at sec.gov and may be reviewed and copied at theSEC’s Public Reference Room in Washington, D.C. Information on the operation of the Public Reference Room may beobtained by calling 800.SEC.0330. Each fund’s complete schedule of portfolio holdings, as filed on Form N-Q, can also beobtained without charge, upon request, by calling 800.345.6611.
Important Information About This Report
Columbia Variable Portfolio — High Income Fund

This information is for use with concurrent or prior delivery of a fund prospectus. Please carefully consider theinvestment objectives, risks, charges and expenses of any variable fund and its related variable contract beforeinvesting. For variable fund and variable contract prospectuses, which contain this and other importantinformation, contact your financial advisor or insurance representative. Please read the prospectus carefullybefore you invest. The Fund is distributed by Columbia Management Investment Distributors, Inc., member FINRA,and managed by Columbia Management Investment Advisers, LLC.© 2013 Columbia Management Investment Advisers, LLC. All rights reserved.
C-1531 C (3/13)
Columbia Variable Portfolio — High Income FundP.O. Box 8081Boston, MA 02266-8081
DreyfusStock Index Fund, Inc.
ANNUAL REPORT December 31, 2012

The views expressed in this report reflect those of the portfoliomanager only through the end of the period covered and do notnecessarily represent the views of Dreyfus or any other person inthe Dreyfus organization. Any such views are subject to change atany time based upon market or other conditions and Dreyfus dis-claims any responsibility to update such views. These views may notbe relied on as investment advice and, because investment decisionsfor a Dreyfus fund are based on numerous factors, may not be reliedon as an indication of trading intent on behalf of any Dreyfus fund.
Not FDIC-Insured • Not Bank-Guaranteed • May Lose Value
Save time. Save paper. View your next shareholder reportonline as soon as it’s available. Log into www.dreyfus.comand sign up for Dreyfus eCommunications. It’s simple andonly takes a few minutes.

Contents
T H E F U N D
2 A Letter from the President
3 Discussion of Fund Performance
6 Fund Performance
8 Understanding Your Fund’s Expenses
8 Comparing Your Fund’s Expenses With Those of Other Funds
9 Statement of Investments
26 Statement of Financial Futures
27 Statement of Assets and Liabilities
28 Statement of Operations
29 Statement of Changes in Net Assets
31 Financial Highlights
33 Notes to Financial Statements
45 Report of Independent Registered Public Accounting Firm
46 Important Tax Information
47 Proxy Results
48 Board Members Information
50 Officers of the Fund
F O R M O R E I N F O R M AT I O N
Back Cover

2
Dreyfus Stock Index Fund, Inc. The Fund
A L E T T E R F R O M T H E P R E S I D E N T
Dear Shareholder:
We are pleased to present this annual report for Dreyfus Stock Index Fund, Inc.,covering the 12-month period from January 1, 2012, through December 31, 2012.For information about how the fund performed during the reporting period, aswell as general market perspectives, we provide a Discussion of Fund Performanceon the pages that follow.
In retrospect, 2012 was notable for the global equity markets’ resilience in the face ofsome tough macroeconomic challenges. Worries regarding sluggish employmentgrowth, weak housing markets and Congressional gridlock weighed on investorsentiment in the United States at times during the year, yet U.S. stocks postedrespectable gains, on average. An ongoing debt crisis led to recessionary conditions inEurope, particularly for some of the continent’s more peripheral nations, but aggressiveactions from monetary policymakers helped some European stock markets producedouble-digit returns. While China’s economy slowed in response to inflation-fightingmeasures, officials there appeared to have engineered a “soft landing,” and Chinesestocks generally ended the year with positive absolute returns.
We currently expect the U.S. and global economies to be modestly stronger in 2013,especially during the second half of the year. The global economy seems likely to benefitfrom Europe’s ongoing efforts to support its banking system and common currency,and by China’s moves toward more stimulative fiscal policies under new governmentleadership. In the United States, greater certainty regarding U.S. tax and fiscal policies,the resumption of postponed spending by businesses, and a continued housing recoverycould support modestly higher rates of economic growth. We encourage you to discussthe implications of our economic analysis with your financial advisor, who can help youalign your investments with the year’s challenges and opportunities.
Thank you for your continued confidence and support.
Sincerely,
J. Charles CardonaPresidentThe Dreyfus CorporationJanuary 15, 2013

T h e F u n d 3
D I S C U S S I O N O F F U N D P E R F O R M A N C E
For the period of January 1, 2012, through December 31, 2012, as provided by Thomas J.Durante, CFA, Karen Q. Wong, CFA, and Richard A. Brown, CFA, Portfolio Managers
Fund and Market Performance Overview
For the 12-month period ended December 31, 2012, Dreyfus Stock Index Fund’sInitial shares produced a total return of 15.74%, and its Service shares produced atotal return of 15.47%.1 In comparison, the fund’s benchmark, the Standard &Poor’s 500 Composite Stock Price Index (“S&P 500 Index”), produced a totalreturn of 15.99% for the same period.2,3
Despite ongoing concerns regarding a variety of domestic and international macro-economic developments, U.S. stocks generally gained ground when improvingdomestic economic fundamentals—including stronger employment trends and arecovering housing market—helped bolster investor sentiment. Stock prices generallyadvanced as investors turned away from traditional safe havens and toward riskierassets. The difference in return between the fund and the S&P 500 Index wasprimarily the result of transaction costs and operating expenses that are notreflected in the S&P 500 Index’s results.
The Fund’s Investment Approach
The fund seeks to match the total return of the S&P 500 Index by generally investingin all 500 stocks in the S&P 500 Index in proportion to their respective weighting.Often considered a proxy for the stock market in general, the S&P 500 Index is madeup of 500 common stocks chosen to reflect the industries of the U.S. economy. Eachstock is weighted by its market capitalization; that is, larger companies have greaterrepresentation in the S&P 500 Index than smaller ones. The fund also may use stockindex futures as a substitute for the sale or purchase of securities.
Improving Macroeconomic Conditions Fueled Market Gains
A variety of positive domestic and international developments drove stocks higherduring the first quarter of 2012. These included strong corporate earnings reports,domestic employment gains, a quantitative easing program in Europe that forestalled a

4
D I S C U S S I O N O F F U N D P E R F O R M A N C E (continued)
more severe banking crisis in the region, and less restrictive monetary and fiscal policiesin China and, later, in Japan. However, investor sentiment turned more cautious duringthe spring, when the U.S. labor market’s rebound slowed and measures designed torelieve fiscal pressures in Europe encountered political resistance in some countries.
Stocks rebounded over the summer, reaching new highs for the year by Septemberamid more encouraging economic news, including sharp declines in the unemploy-ment rate and the start of a long-awaited recovery in U.S. housing markets. Stockslost ground again in November as concerns mounted over automatic tax hikes andspending cuts scheduled for the start of 2013. Nevertheless, continued corporateearnings strength and improving economic fundamentals in many parts of the worldenabled stocks to resume their rally as 2012 came to a close. As a result, the S&P 500Index ended the year with double-digit gains.
Financial Stocks Rebounded Strongly
The S&P 500 Index’s advance in 2012 was led by the financials sector, which stageda rebound after several years of weakness in the wake of the 2008 U.S. financial crisis.Major U.S. banking institutions reported better financial results as lending volumesimproved, legal issues were resolved, and regulatory pressures waned. Commercialbanks benefited from increased mortgage lending as housing markets recovered.Insurance companies also fared relatively well, largely due to better results from theirfixed-income investments and a relative scarcity of U.S. natural disasters in 2012. EvenSuperstorm Sandy had relatively little impact on insurers’ earnings.
Information technology stocks produced above-average results on the strength ofsecular trends toward cloud and mobile computing, which benefited makers of tabletcomputers and smartphones as well as software developers. Meanwhile, Internetretailers encountered higher sales volumes as more consumers shopped online. In theconsumer discretionary sector, media companies saw higher advertising revenues in anelection year, and home improvement retailers benefited from greater consumerconfidence and the recovering housing market. Apparel retailers advanced whenpersonal incomes and consumer spending improved.
Laggards in 2012 included the utilities sector, which eked out only modestly positiveabsolute returns, on average, due to rich valuations and the impact of tax policyuncertainty on higher yielding stocks. In the materials sector, metals-and-mining

T h e F u n d 5
companies suffered when an economic slowdown in China dampened industrialdemand and sent commodity prices lower. An oversupply of domestic natural gasweighed on results from the energy sector, hurting earnings of drillers and exploration-and-production companies.
Macroeconomic Headwinds Remain
Although we have been encouraged recently by positive U.S. and global economicdevelopments, we believe that heightened stock market volatility is likely to persist inthe face of ongoing global challenges, including the European debt crisis, slower growthin the emerging markets, and a subpar economic recovery in the United States. We havecontinued to monitor the fund’s investments in light of current market conditions. Inour experience, the fund’s broadly diversified portfolio may help limit the impact onthe overall portfolio of unexpected losses in individual sectors or holdings.
January 15, 2013
Equity funds are subject generally to market, market sector, market liquidity, issuer and investment style risks, amongother factors, to varying degrees, all of which are more fully described in the fund’s prospectus.
The fund is only available as a funding vehicle under variable life insurance policies or variable annuity contractsissued by insurance companies. Individuals may not purchase shares of the fund directly. A variable annuity is aninsurance contract issued by an insurance company that enables investors to accumulate assets on a tax-deferred basisfor retirement or other long-term goals. The investment objective and policies of Dreyfus Stock Index Fund madeavailable through insurance products may be similar to other funds managed by Dreyfus. However, the investmentresults of the fund may be higher or lower than, and may not be comparable to, those of any other Dreyfus fund.
1 Total return includes reinvestment of dividends and any capital gains paid. Past performance is no guarantee of futureresults. Share price and investment return fluctuate such that upon redemption fund shares may be worth more or lessthan their original cost. The fund’s performance does not reflect the deduction of additional charges and expensesimposed in connection with investing in variable insurance contracts, which will reduce returns.
2 SOURCE: LIPPER INC. — Reflects reinvestment of dividends daily and, where applicable, capital gaindistributions. The Standard & Poor’s 500 Composite Stock Price Index is a widely accepted, unmanaged index ofU.S. stock market performance. Investors cannot invest directly in any index.
3 “Standard & Poor’s®,” “S&P®,” “Standard & Poor’s 500™” and “S&P 500®” are trademarks of Standard& Poor’s Financial Services LLC (“Standard & Poor’s”) and have been licensed for use by the fund. The fund isnot sponsored, endorsed, sold or promoted by Standard & Poor’s and Standard & Poor’s does not make anyrepresentation regarding the advisability of investing in the fund.
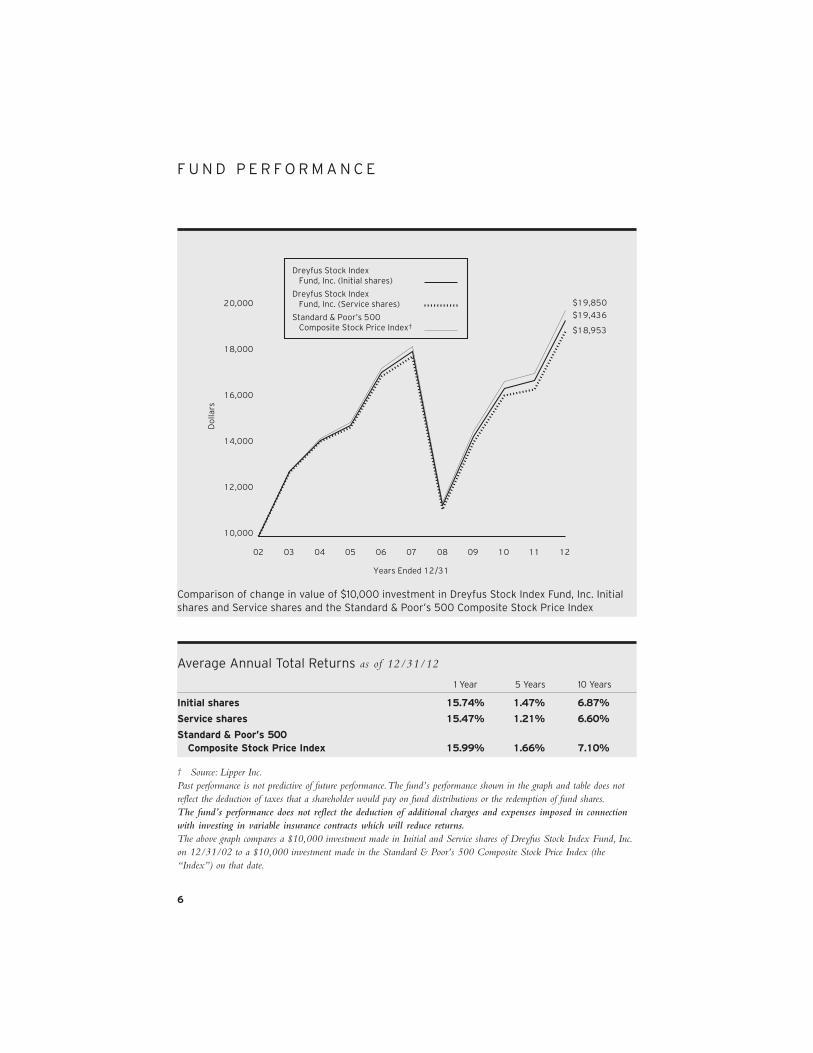
10,000
12,000
14,000
16,000
18,000
20,000
Do
llars
Years Ended 12/31
02 03 04 05 06 07 08 09 10 11 12
Dreyfus Stock Index Fund, Inc. (Initial shares)
Dreyfus Stock Index Fund, Inc. (Service shares)
Standard & Poor’s 500 Composite Stock Price Index†
$19,850
$19,436
$18,953
6
F U N D P E R F O R M A N C E
Comparison of change in value of $10,000 investment in Dreyfus Stock Index Fund, Inc. Initialshares and Service shares and the Standard & Poor’s 500 Composite Stock Price Index
Average Annual Total Returns as of 12/31/12
1 Year 5 Years 10 Years
Initial shares 15.74% 1.47% 6.87%
Service shares 15.47% 1.21% 6.60%
Standard & Poor’s 500 Composite Stock Price Index 15.99% 1.66% 7.10%
† Source: Lipper Inc.Past performance is not predictive of future performance. The fund’s performance shown in the graph and table does notreflect the deduction of taxes that a shareholder would pay on fund distributions or the redemption of fund shares.The fund’s performance does not reflect the deduction of additional charges and expenses imposed in connectionwith investing in variable insurance contracts which will reduce returns.The above graph compares a $10,000 investment made in Initial and Service shares of Dreyfus Stock Index Fund, Inc.on 12/31/02 to a $10,000 investment made in the Standard & Poor’s 500 Composite Stock Price Index (the“Index”) on that date.

T h e F u n d 7
The fund’s Initial shares are not subject to a Rule 12b-1 fee. The fund’s Service shares are subject to a 0.25% annualRule 12b-1 fee. All dividends and capital gain distributions are reinvested.The fund’s performance shown in the line graph above takes into account all applicable fund fees and expenses for Initialand Service shares (after any expense reimbursements). The Index is a widely accepted, unmanaged index of U.S. stockmarket performance. Unlike a mutual fund, the Index is not subject to charges, fees and other expenses. Investors cannotinvest directly in any index. Further information relating to fund performance, including expense reimbursements, ifapplicable, is contained in the Financial Highlights section of the prospectus and elsewhere in this report.

8
Expenses and Value of a $1,000 Investmentassuming actual returns for the six months ended December 31, 2012
Initial Shares Service Shares
Expenses paid per $1,000† $ 1.50 $ 2.74
Ending value (after expenses) $1,058.30 $1,056.90
U N D E R S TA N D I N G YO U R F U N D ’ S E X P E N S E S ( U n a u d i t e d )
As a mutual fund investor, you pay ongoing expenses, such as management fees and other expenses.Using the information below, you can estimate how these expenses affect your investment and comparethem with the expenses of other funds. You also may pay one-time transaction expenses, including salescharges (loads), redemption fees and expenses associated with variable annuity or insurance contracts,which are not shown in this section and would have resulted in higher total expenses. For moreinformation, see your fund’s prospectus or talk to your financial adviser.
Review your fund’s expenses
The table below shows the expenses you would have paid on a $1,000 investment inDreyfus Stock Index Fund, Inc. from July 1, 2012 to December 31, 2012. It also shows howmuch a $1,000 investment would be worth at the close of the period, assuming actualreturns and expenses.
Expenses and Value of a $1,000 Investmentassuming a hypothetical 5% annualized return for the six months ended December 31, 2012
Initial Shares Service Shares
Expenses paid per $1,000† $ 1.48 $ 2.69
Ending value (after expenses) $1,023.68 $1,022.47
C O M P A R I N G Y O U R F U N D ’ S E X P E N S E S W I T H T H O S E O F O T H E R F U N D S ( U n a u d i t e d )
Using the SEC’s method to compare expenses
The Securities and Exchange Commission (SEC) has established guidelines to helpinvestors assess fund expenses. Per these guidelines, the table below shows your fund’sexpenses based on a $1,000 investment, assuming a hypothetical 5% annualized return.You can use this information to compare the ongoing expenses (but not transactionexpenses or total cost) of investing in the fund with those of other funds. All mutual fundshareholder reports will provide this information to help you make this comparison.Please note that you cannot use this information to estimate your actual ending accountbalance and expenses paid during the period.
† Expenses are equal to the fund’s annualized expense ratio of .29% for Initial Shares and .53% for Service Shares,multiplied by the average account value over the period, multiplied by 184/366 (to reflect the one-half year period).

T h e F u n d 9
S TAT E M E N T O F I N V E S T M E N T SD e c e m b e r 3 1 , 2 0 1 2
Common Stocks—98.6% Shares Value ($)
Automobiles & Components—.8%
BorgWarner 15,012 a 1,075,159
Delphi Automotive 39,101 a 1,495,613
Ford Motor 507,096 6,566,893
Goodyear Tire & Rubber 30,040 a 414,852
Harley-Davidson 30,163 1,473,161
Johnson Controls 90,571 2,780,530
13,806,208
Banks—2.8%
BB&T 94,045 2,737,650
Comerica 25,392 770,393
Fifth Third Bancorp 121,307 1,842,653
First Horizon National 34,481 341,707
Hudson City Bancorp 64,738 526,320
Huntington Bancshares 111,419 711,967
KeyCorp 123,613 1,040,821
M&T Bank 16,053 b 1,580,739
People’s United Financial 44,393 536,711
PNC Financial Services Group 70,295 4,098,901
Regions Financial 190,572 1,356,873
SunTrust Banks 71,489 2,026,713
U.S. Bancorp 252,219 8,055,875
Wells Fargo & Co. 654,697 22,377,543
Zions Bancorporation 25,036 535,770
48,540,636
Capital Goods—7.7%
3M 84,631 7,857,988
Boeing 89,998 6,782,249
Caterpillar 86,927 7,786,921
Cummins 23,445 2,540,266
Danaher 78,174 4,369,927
Deere & Co. 52,433 4,531,260
Dover 24,214 1,591,102
Eaton 61,495 3,333,054
Emerson Electric 96,655 5,118,849
Fastenal 36,682 1,712,683
Flowserve 6,742 989,726

S TAT E M E N T O F I N V E S T M E N T S (continued)
Capital Goods (continued)
Fluor 22,639 1,329,815
General Dynamics 43,956 3,044,832
General Electric 1,402,494 29,438,349
Honeywell International 104,621 6,640,295
Illinois Tool Works 58,082 3,531,966
Ingersoll-Rand 37,800 1,812,888
Jacobs Engineering Group 17,975 a 765,196
Joy Global 14,661 935,079
L-3 Communications Holdings 13,187 1,010,388
Lockheed Martin 35,978 3,320,410
Masco 47,940 798,680
Northrop Grumman 32,964 2,227,707
PACCAR 46,729 2,112,618
Pall 15,361 925,654
Parker Hannifin 20,267 1,723,911
Pentair 27,422 1,347,791
Precision Castparts 19,286 3,653,154
Quanta Services 28,332 a 773,180
Raytheon 44,480 2,560,269
Rockwell Automation 19,101 1,604,293
Rockwell Collins 18,503 b 1,076,320
Roper Industries 12,840 1,431,403
Snap-on 7,385 583,341
Stanley Black & Decker 22,391 1,656,262
Textron 36,395 902,232
United Technologies 112,762 9,247,612
W.W. Grainger 7,993 1,617,543
Xylem 25,459 689,939
133,375,152
Commercial & Professional Services—.7%
ADT 31,150 1,448,163
Avery Dennison 13,279 463,703
Cintas 14,764 603,848
Dun & Bradstreet 5,788 b 455,226
Equifax 15,447 835,992
Iron Mountain 22,420 696,141
10
Common Stocks (continued) Shares Value ($)

T h e F u n d 11
Common Stocks (continued) Shares Value ($)
Commercial & Professional Services (continued)
Pitney Bowes 27,570 b 293,345
Republic Services 39,695 1,164,254
Robert Half International 18,973 603,721
Stericycle 11,032 a 1,028,955
Tyco International 62,300 1,822,275
Waste Management 57,560 1,942,074
11,357,697
Consumer Durables & Apparel—1.1%
Coach 38,340 2,128,253
D.R. Horton 35,504 702,269
Fossil 7,038 a 655,238
Garmin 14,662 b 598,503
Harman International Industries 8,150 363,816
Hasbro 16,061 b 576,590
Leggett & Platt 19,083 519,439
Lennar, Cl. A 22,486 b 869,534
Mattel 46,381 1,698,472
Newell Rubbermaid 37,233 829,179
NIKE, Cl. B 97,690 5,040,804
PulteGroup 44,106 a 800,965
Ralph Lauren 8,310 1,245,835
VF 11,948 1,803,790
Whirlpool 10,526 1,071,021
18,903,708
Consumer Services—1.8%
Apollo Group, Cl. A 14,827 a 310,181
Carnival 59,162 2,175,387
Chipotle Mexican Grill 4,198 a 1,248,737
Darden Restaurants 16,603 748,297
H&R Block 37,117 689,263
International Game Technology 34,374 487,080
Marriott International, Cl. A 34,251 1,276,535
McDonald’s 134,299 11,846,515
Starbucks 99,473 5,333,742
Starwood Hotels & Resorts Worldwide 26,487 c 1,519,294
Wyndham Worldwide 18,805 1,000,614

S TAT E M E N T O F I N V E S T M E N T S (continued)
Consumer Services (continued)
Wynn Resorts 10,674 1,200,718
Yum! Brands 61,031 4,052,458
31,888,821
Diversified Financials—6.4%
American Express 131,224 7,542,756
Ameriprise Financial 28,668 1,795,477
Bank of America 1,435,799 16,655,268
Bank of New York Mellon 158,049 4,061,859
BlackRock 16,783 3,469,214
Capital One Financial 77,178 4,470,922
Charles Schwab 144,815 2,079,543
Citigroup 390,665 15,454,707
CME Group 40,441 2,050,763
Discover Financial Services 69,037 2,661,376
E*TRADE Financial 31,226 a 279,473
Franklin Resources 18,508 2,326,456
Goldman Sachs Group 59,088 7,537,265
IntercontinentalExchange 9,937 a 1,230,300
Invesco 60,804 1,586,376
JPMorgan Chase & Co. 508,381 22,353,513
Legg Mason 15,358 395,008
Leucadia National 25,029 595,440
Moody’s 26,189 1,317,830
Morgan Stanley 183,456 3,507,679
NASDAQ OMX Group 16,720 418,167
Northern Trust 29,797 1,494,618
NYSE Euronext 31,582 996,096
SLM 63,886 1,094,367
State Street 62,184 2,923,270
T. Rowe Price Group 34,117 2,222,040
110,519,783
Energy—10.8%
Anadarko Petroleum 66,399 4,934,110
Apache 51,945 4,077,682
Baker Hughes 58,176 2,375,908
Cabot Oil & Gas 28,588 1,421,967
12
Common Stocks (continued) Shares Value ($)

T h e F u n d 13
Common Stocks (continued) Shares Value ($)
Energy (continued)
Cameron International 32,535 a 1,836,926
Chesapeake Energy 70,773 b 1,176,247
Chevron 261,546 a 28,283,584
ConocoPhillips 161,681 9,375,881
CONSOL Energy 31,076 997,540
Denbury Resources 51,990 a 842,238
Devon Energy 49,826 2,592,945
Diamond Offshore Drilling 8,837 b 600,563
Ensco, Cl. A 31,217 1,850,544
EOG Resources 35,864 4,332,013
EQT 20,214 1,192,222
Exxon Mobil 609,826 52,780,440
FMC Technologies 32,088 a 1,374,329
Halliburton 124,704 4,325,982
Helmerich & Payne 13,535 758,095
Hess 40,160 2,126,874
Kinder Morgan 83,852 2,962,491
Marathon Oil 94,959 2,911,443
Marathon Petroleum 45,321 2,855,223
Murphy Oil 24,585 1,464,037
Nabors Industries 36,637 a 529,405
National Oilwell Varco 57,335 3,918,847
Newfield Exploration 18,177 a 486,780
Noble 34,686 1,207,767
Noble Energy 23,999 2,441,658
Occidental Petroleum 107,792 8,257,945
Peabody Energy 36,868 981,057
Phillips 66 83,263 4,421,265
Pioneer Natural Resources 16,277 1,734,965
QEP Resources 24,072 728,659
Range Resources 21,759 1,367,118
Rowan, Cl. A 16,543 a 517,300
Schlumberger 176,737 12,246,107
Southwestern Energy 45,832 a 1,531,247
Spectra Energy 86,395 2,365,495
Tesoro 18,308 806,467

S TAT E M E N T O F I N V E S T M E N T S (continued)
Energy (continued)
Valero Energy 74,665 2,547,570
Williams 90,434 2,960,809
WPX Energy 26,988 a 401,581
186,901,326
Food & Staples Retailing—2.3%
Costco Wholesale 57,936 5,722,339
CVS Caremark 166,759 8,062,798
Kroger 67,821 1,764,702
Safeway 32,833 b 593,949
Sysco 78,727 2,492,497
Wal-Mart Stores 223,908 15,277,243
Walgreen 115,234 4,264,810
Whole Foods Market 22,700 2,073,191
40,251,529
Food, Beverage & Tobacco—5.9%
Altria Group 270,564 8,501,121
Archer-Daniels-Midland 87,172 2,387,641
Beam 21,063 1,286,739
Brown-Forman, Cl. B 19,900 1,258,675
Campbell Soup 23,038 b 803,796
Coca-Cola 515,908 18,701,665
Coca-Cola Enterprises 37,686 1,195,777
ConAgra Foods 54,096 1,595,832
Constellation Brands, Cl. A 20,043 a 709,322
Dean Foods 25,870 a 427,114
Dr. Pepper Snapple Group 27,536 1,216,540
General Mills 87,016 3,516,317
H.J. Heinz 43,076 2,484,624
Hershey 19,912 1,438,045
Hormel Foods 18,619 581,099
J.M. Smucker 14,530 1,253,067
Kellogg 33,110 1,849,193
Kraft Foods Group 78,495 3,569,168
Lorillard 17,258 2,013,491
McCormick & Co. 17,744 1,127,276
Mead Johnson Nutrition 26,892 1,771,914
14
Common Stocks (continued) Shares Value ($)

T h e F u n d 15
Common Stocks (continued) Shares Value ($)
Food, Beverage & Tobacco (continued)
Molson Coors Brewing, Cl. B 20,524 878,222
Mondelez International, Cl. A 237,828 6,057,479
Monster Beverage 20,708 a 1,095,039
PepsiCo 207,312 14,186,360
Philip Morris International 223,433 18,687,936
Reynolds American 44,223 1,832,159
Tyson Foods, Cl. A 37,136 720,438
101,146,049
Health Care Equipment & Services—3.7%
Aetna 44,168 2,044,978
AmerisourceBergen 30,976 1,337,544
Baxter International 73,283 4,885,045
Becton Dickinson & Co. 26,599 2,079,776
Boston Scientific 194,066 a 1,111,998
C.R. Bard 10,612 1,037,217
Cardinal Health 45,049 1,855,118
CareFusion 28,603 a 817,474
Cerner 19,568 a 1,519,260
Cigna 38,114 2,037,574
Coventry Health Care 18,222 816,892
Covidien 63,710 3,678,615
DaVita HealthCare Partners 10,866 a 1,201,019
DENTSPLY International 19,644 778,099
Edwards Lifesciences 15,486 a 1,396,373
Express Scripts Holding 108,630 a 5,866,020
Humana 21,715 1,490,300
Intuitive Surgical 5,363 a 2,629,854
Laboratory Corp. of America Holdings 12,716 a 1,101,460
McKesson 31,289 3,033,781
Medtronic 136,694 5,607,188
Patterson 11,346 388,374
Quest Diagnostics 21,325 1,242,608
St. Jude Medical 41,163 1,487,631
Stryker 38,229 2,095,714
Tenet Healthcare 13,053 a 423,831
UnitedHealth Group 137,400 7,452,576

S TAT E M E N T O F I N V E S T M E N T S (continued)
Health Care Equipment & Services (continued)
Varian Medical Systems 14,388 a 1,010,613
WellPoint 40,498 2,467,138
Zimmer Holdings 23,489 1,565,777
64,459,847
Household & Personal Products—2.3%
Avon Products 59,016 847,470
Clorox 17,355 1,270,733
Colgate-Palmolive 59,741 6,245,324
Estee Lauder, Cl. A 32,607 1,951,855
Kimberly-Clark 52,451 4,428,438
Procter & Gamble 365,691 24,826,762
39,570,582
Insurance—4.0%
ACE 45,500 3,630,900
Aflac 62,112 3,299,389
Allstate 65,017 2,611,733
American International Group 196,375 a 6,932,037
Aon 42,669 2,372,396
Assurant 11,443 397,072
Berkshire Hathaway, Cl. B 244,394 a 21,922,142
Chubb 35,657 2,685,685
Cincinnati Financial 19,911 779,715
Genworth Financial, Cl. A 68,350 a 513,308
Hartford Financial Services Group 58,898 1,321,671
Lincoln National 37,990 983,941
Loews 42,469 1,730,612
Marsh & McLennan 73,194 2,522,997
MetLife 145,868 4,804,892
Principal Financial Group 37,760 1,076,915
Progressive 76,271 1,609,318
Prudential Financial 61,799 3,295,741
Torchmark 12,455 643,550
Travelers 51,787 3,719,342
Unum Group 38,728 806,317
XL Group 42,023 1,053,096
68,712,769
16
Common Stocks (continued) Shares Value ($)

T h e F u n d 17
Common Stocks (continued) Shares Value ($)
Materials—3.6%
Air Products & Chemicals 28,383 2,384,740
Airgas 9,628 878,940
Alcoa 139,340 1,209,471
Allegheny Technologies 13,887 421,609
Ball 20,771 929,502
Bemis 14,387 481,389
CF Industries Holdings 8,263 1,678,711
Cliffs Natural Resources 19,020 b 733,411
Dow Chemical 160,442 5,185,485
E.I. du Pont de Nemours & Co. 124,637 5,604,926
Eastman Chemical 20,736 1,411,085
Ecolab 34,850 2,505,715
FMC 18,626 1,089,994
Freeport-McMoRan Copper & Gold 126,055 4,311,081
International Flavors & Fragrances 10,335 687,691
International Paper 57,845 2,304,545
LyondellBasell Industries, Cl. A 50,987 2,910,848
MeadWestvaco 22,877 729,090
Monsanto 71,435 6,761,323
Mosaic 36,968 2,093,498
Newmont Mining 66,833 3,103,725
Nucor 41,908 1,809,587
Owens-Illinois 22,187 a 471,917
PPG Industries 20,442 2,766,825
Praxair 39,597 4,333,892
Sealed Air 22,210 388,897
Sherwin-Williams 11,374 1,749,549
Sigma-Aldrich 16,463 1,211,348
United States Steel 19,606 b 467,995
Vulcan Materials 17,780 925,449
61,542,238
Media—3.5%
Cablevision Systems (NY Group), Cl. A 26,917 402,140
CBS, Cl. B 78,872 3,001,080
Comcast, Cl. A 356,413 13,322,718
DIRECTV 80,829 a 4,054,383

S TAT E M E N T O F I N V E S T M E N T S (continued)
18
Common Stocks (continued) Shares Value ($)
Media (continued)
Discovery Communications, Cl. A 32,667 a 2,073,701
Gannett 29,194 525,784
Interpublic Group of Cos. 57,023 628,393
McGraw-Hill 37,348 2,041,815
News, Cl. A 269,692 6,887,934
Omnicom Group 34,997 1,748,450
Scripps Networks Interactive, Cl. A 11,766 681,487
Time Warner 127,161 6,082,111
Time Warner Cable 40,666 3,952,329
Viacom, Cl. B 62,794 3,311,756
Walt Disney 237,023 11,801,375
Washington Post, Cl. B 514 b 187,718
60,703,174
Pharmaceuticals, Biotech & Life Sciences—8.1%
Abbott Laboratories 211,375 13,845,062
Agilent Technologies 46,018 1,883,977
Alexion Pharmaceuticals 25,935 a 2,432,962
Allergan 40,816 3,744,052
Amgen 102,595 8,856,000
Biogen Idec 31,401 a 4,605,585
Bristol-Myers Squibb 220,790 7,195,546
Celgene 57,307 a 4,511,207
Eli Lilly & Co. 135,824 6,698,840
Forest Laboratories 31,825 a 1,124,059
Gilead Sciences 100,664 a 7,393,771
Hospira 21,233 a 663,319
Johnson & Johnson 370,184 25,949,898
Life Technologies 23,827 a 1,169,429
Merck & Co. 405,809 16,613,820
Mylan 53,916 a 1,481,612
PerkinElmer 14,978 475,402
Perrigo 11,960 1,244,199
Pfizer 984,784 24,698,383

T h e F u n d 19
Common Stocks (continued) Shares Value ($)
Pharmaceuticals, Biotech & Life Sciences (continued)
Thermo Fisher Scientific 49,325 3,145,949
Waters 11,894 a 1,036,205
Watson Pharmaceuticals 16,765 a 1,441,790
140,211,067
Real Estate—2.2%
American Tower 52,460 4,053,584
Apartment Investment & Management, Cl. A 19,722 c 533,677
AvalonBay Communities 15,058 c 2,041,714
Boston Properties 20,089 c 2,125,617
CBRE Group, Cl. A 41,107 a 818,029
Equity Residential 43,007 c 2,437,207
HCP 60,438 c 2,730,589
Health Care 33,634 c 2,061,428
Host Hotels & Resorts 98,163 c 1,538,214
Kimco Realty 54,312 c 1,049,308
Plum Creek Timber 20,903 c 927,466
ProLogis 60,916 c 2,222,825
Public Storage 19,371 c 2,808,020
Simon Property Group 41,362 c 6,538,919
Ventas 39,527 c 2,558,187
Vornado Realty Trust 23,010 c 1,842,641
Weyerhaeuser 71,057 c 1,976,806
38,264,231
Retailing—4.1%
Abercrombie & Fitch, Cl. A 10,357 496,825
Amazon.com 48,166 a 12,096,409
AutoNation 4,721 a,b 187,424
AutoZone 5,061 a 1,793,770
Bed Bath & Beyond 30,651 a 1,713,697
Best Buy 37,813 448,084
Big Lots 8,410 a 239,349
CarMax 29,742 a 1,116,515
Dollar General 35,691 a 1,573,616

S TAT E M E N T O F I N V E S T M E N T S (continued)
20
Common Stocks (continued) Shares Value ($)
Retailing (continued)
Dollar Tree 31,428 a 1,274,720
Expedia 11,971 735,618
Family Dollar Stores 13,215 837,963
GameStop, Cl. A 15,711 b 394,189
Gap 40,587 1,259,820
Genuine Parts 20,478 1,301,991
Home Depot 200,767 12,417,439
J.C. Penney 20,198 b 398,103
Kohl’s 29,381 1,262,795
Limited Brands 31,784 1,495,755
Lowe’s 150,439 5,343,593
Macy’s 53,851 2,101,266
Netflix 7,217 a 669,593
Nordstrom 20,786 1,112,051
O’Reilly Automotive 16,176 a 1,446,458
PetSmart 14,702 1,004,735
priceline.com 6,616 a 4,109,859
Ross Stores 29,504 1,597,642
Staples 93,132 1,061,705
Target 87,046 5,150,512
Tiffany & Co. 16,201 928,965
TJX 98,536 4,182,853
TripAdvisor 13,824 a 580,055
Urban Outfitters 13,780 a 542,381
70,875,750
Semiconductors & Semiconductor Equipment—2.0%
Advanced Micro Devices 82,112 a,b 197,069
Altera 41,943 1,444,517
Analog Devices 39,273 1,651,822
Applied Materials 160,257 1,833,340
Broadcom, Cl. A 68,029 a 2,259,243
First Solar 7,628 a,b 235,553

T h e F u n d 21
Common Stocks (continued) Shares Value ($)
Semiconductors & Semiconductor Equipment (continued)
Intel 666,414 13,748,121
KLA-Tencor 22,841 1,090,886
Lam Research 22,069 a 797,353
Linear Technology 30,561 1,048,242
LSI 75,504 a 534,568
Microchip Technology 26,011 b 847,698
Micron Technology 138,381 a 878,719
NVIDIA 82,627 1,015,486
Teradyne 24,552 a 414,683
Texas Instruments 152,330 4,713,090
Xilinx 35,039 1,257,900
33,968,290
Software & Services—9.4%
Accenture, Cl. A 85,059 5,656,424
Adobe Systems 65,086 a 2,452,440
Akamai Technologies 22,882 a 936,103
Autodesk 29,599 a 1,046,325
Automatic Data Processing 65,110 3,711,921
BMC Software 19,979 a 792,367
CA 44,490 977,890
Citrix Systems 24,955 a 1,640,791
Cognizant Technology Solutions, Cl. A 39,865 a 2,952,003
Computer Sciences 21,610 865,480
eBay 154,333 a 7,874,070
Electronic Arts 41,318 a 600,351
Fidelity National Information Services 33,997 1,183,436
Fiserv 17,862 a 1,411,634
Google, Cl. A 35,573 a 25,234,419
International Business Machines 142,062 27,211,976
Intuit 36,513 2,172,523
MasterCard, Cl. A 14,388 7,068,537
Microsoft 1,012,666 27,068,562

S TAT E M E N T O F I N V E S T M E N T S (continued)
22
Common Stocks (continued) Shares Value ($)
Software & Services (continued)
Oracle 502,759 16,751,930
Paychex 43,587 1,357,299
Red Hat 25,249 a 1,337,187
SAIC 37,552 425,089
Salesforce.com 17,467 a 2,936,203
Symantec 93,733 a 1,763,118
Teradata 22,910 a 1,417,900
Total System Services 20,172 432,084
VeriSign 20,666 a 802,254
Visa, Cl. A 69,590 10,548,452
Western Union 78,931 1,074,251
Yahoo! 138,079 a 2,747,772
162,450,791
Technology Hardware & Equipment—7.4%
Amphenol, Cl. A 21,429 1,386,456
Apple 125,805 67,057,839
Cisco Systems 710,007 13,951,638
Corning 199,622 2,519,230
Dell 194,063 1,965,858
EMC 279,201 a 7,063,785
F5 Networks 10,419 a 1,012,206
FLIR Systems 18,628 415,591
Harris 15,059 737,289
Hewlett-Packard 260,945 3,718,466
Jabil Circuit 24,327 469,268
JDS Uniphase 31,303 a 423,843
Juniper Networks 70,645 a 1,389,587
Molex 19,018 b 519,762
Motorola Solutions 38,255 2,130,038
NetApp 48,862 a 1,639,320
QUALCOMM 226,900 14,072,338
SanDisk 33,020 a 1,438,351
Seagate Technology 44,964 b 1,370,503
TE Connectivity 57,400 2,130,688
Western Digital 30,278 1,286,512

Technology Hardware & Equipment (continued)
Xerox 175,188 1,194,782
127,893,350
Telecommunication Services—3.0%
AT&T 759,739 25,610,802
CenturyLink 83,616 3,271,058
Crown Castle International 38,819 a 2,801,179
Frontier Communications 135,514 b 580,000
MetroPCS Communications 42,878 a 426,207
Sprint Nextel 401,610 a 2,277,129
Verizon Communications 381,664 16,514,601
Windstream 80,533 b 666,813
52,147,789
Transportation—1.6%
C.H. Robinson Worldwide 21,239 1,342,730
CSX 137,778 2,718,360
Expeditors International of Washington 28,782 1,138,328
FedEx 38,745 3,553,691
Norfolk Southern 42,313 2,616,636
Ryder System 6,897 344,367
Southwest Airlines 101,115 1,035,418
Union Pacific 63,022 7,923,126
United Parcel Service, Cl. B 95,628 7,050,652
27,723,308
Utilities—3.4%
AES 83,991 898,704
AGL Resources 16,031 640,759
Ameren 33,246 1,021,317
American Electric Power 64,245 2,741,977
CenterPoint Energy 57,365 1,104,276
CMS Energy 35,654 869,245
Consolidated Edison 38,918 2,161,506
Dominion Resources 77,010 3,989,118
DTE Energy 22,870 1,373,343
Duke Energy 93,629 5,973,530
T h e F u n d 23
Common Stocks (continued) Shares Value ($)

S TAT E M E N T O F I N V E S T M E N T S (continued)
24
Common Stocks (continued) Shares Value ($)
Utilities (continued)
Edison International 43,042 1,945,068
Entergy 23,992 1,529,490
Exelon 115,035 3,421,141
FirstEnergy 55,325 2,310,372
Integrys Energy Group 9,923 518,179
NextEra Energy 56,121 3,883,012
NiSource 41,385 1,030,073
Northeast Utilities 42,468 1,659,649
NRG Energy 43,245 994,203
ONEOK 27,862 1,191,101
Pepco Holdings 31,659 b 620,833
PG&E 57,027 2,291,345
Pinnacle West Capital 14,687 748,743
PPL 77,967 2,232,195
Public Service Enterprise Group 67,146 2,054,668
SCANA 17,807 812,711
Sempra Energy 29,720 2,108,337
Southern 117,164 5,015,791
TECO Energy 27,160 455,202
Wisconsin Energy 30,050 1,107,343
Xcel Energy 66,376 1,772,903
58,476,134
Total Common Stocks (cost $1,099,126,810) 1,703,690,229
PrincipalShort-Term Investments—.1% Amount ($) Value ($)
U.S. Treasury Bills;
0.03%, 3/14/13 (cost $1,229,921) 1,230,000 d 1,229,921
Other Investment—1.2% Shares Value ($)
Registered Investment Company;
Dreyfus Institutional Preferred Plus Money Market Fund (cost $20,880,219) 20,880,219 e 20,880,219
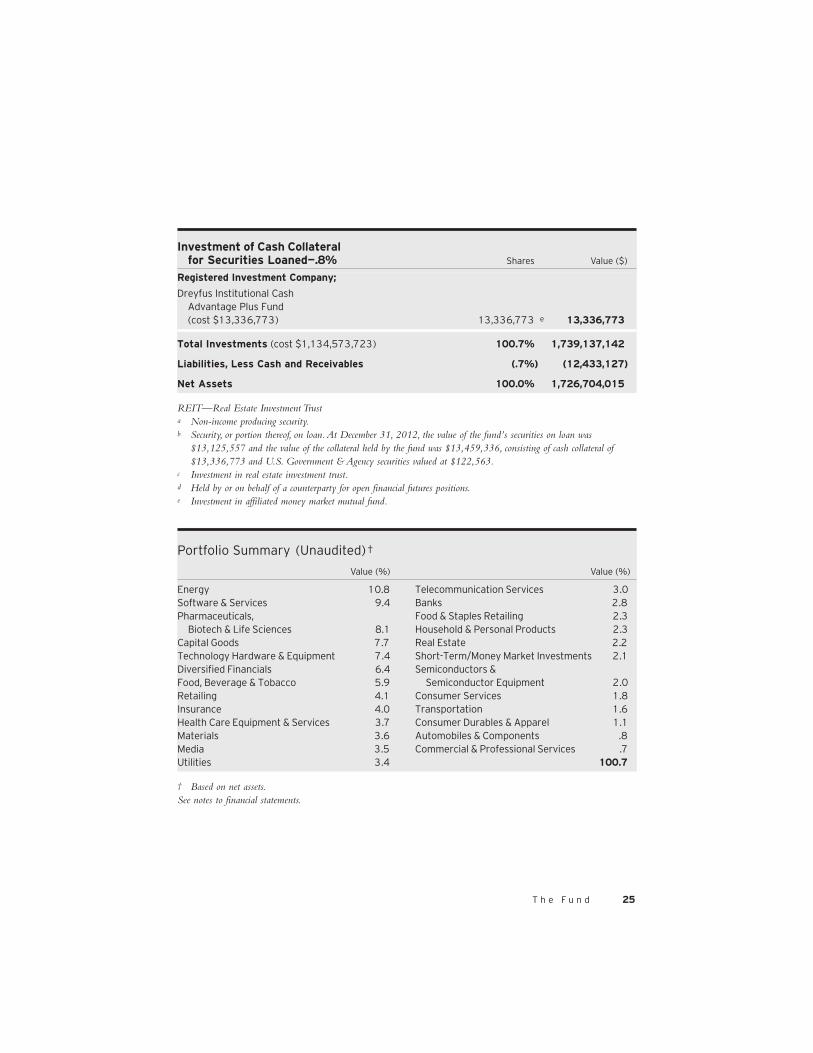
T h e F u n d 25
Investment of Cash Collateral for Securities Loaned—.8% Shares Value ($)
Registered Investment Company;
Dreyfus Institutional Cash Advantage Plus Fund (cost $13,336,773) 13,336,773 e 13,336,773
Total Investments (cost $1,134,573,723) 100.7% 1,739,137,142
Liabilities, Less Cash and Receivables (.7%) (12,433,127)
Net Assets 100.0% 1,726,704,015
REIT—Real Estate Investment Trusta Non-income producing security.b Security, or portion thereof, on loan. At December 31, 2012, the value of the fund’s securities on loan was
$13,125,557 and the value of the collateral held by the fund was $13,459,336, consisting of cash collateral of$13,336,773 and U.S. Government & Agency securities valued at $122,563.
c Investment in real estate investment trust.d Held by or on behalf of a counterparty for open financial futures positions.e Investment in affiliated money market mutual fund.
Portfolio Summary (Unaudited)†
Value (%) Value (%)
Energy 10.8Software & Services 9.4Pharmaceuticals, Biotech & Life Sciences 8.1Capital Goods 7.7Technology Hardware & Equipment 7.4Diversified Financials 6.4Food, Beverage & Tobacco 5.9Retailing 4.1Insurance 4.0Health Care Equipment & Services 3.7Materials 3.6Media 3.5Utilities 3.4
Telecommunication Services 3.0Banks 2.8Food & Staples Retailing 2.3Household & Personal Products 2.3Real Estate 2.2Short-Term/Money Market Investments 2.1Semiconductors & Semiconductor Equipment 2.0Consumer Services 1.8Transportation 1.6Consumer Durables & Apparel 1.1Automobiles & Components .8Commercial & Professional Services .7 100.7
† Based on net assets.See notes to financial statements.

S TAT E M E N T O F F I N A N C I A L F U T U R E SD e c e m b e r 3 1 , 2 0 1 2
26
Market Value Unrealized Covered by (Depreciation) Contracts Contracts ($) Expiration at 12/31/2012 ($)
Financial Futures Long
Standard & Poor’s 500 E-mini 345 24,496,725 March 2013 (20,498)
See notes to financial statements.

T h e F u n d 27
S TAT E M E N T O F A S S E T S A N D L I A B I L I T I E SD e c e m b e r 3 1 , 2 0 1 2
Cost Value
Assets ($):
Investments in securities—See Statement of Investments (including securities on loan, valued at $13,125,557)—Note 1(b): Unaffiliated issuers 1,100,356,731 1,704,920,150 Affiliated issuers 34,216,992 34,216,992
Cash 743,577
Dividends and securities lending income receivable 1,894,579
Receivable for futures variation margin—Note 4 617,614
Receivable for investment securities sold 260,242
Prepaid expenses 130,424
1,742,783,578
Liabilities ($):
Due to The Dreyfus Corporation and affiliates—Note 3(c) 403,732
Liability for securities on loan—Note 1(b) 13,336,773
Payable for shares of Common Stock redeemed 2,256,401
Accrued expenses 82,657
16,079,563
Net Assets ($) 1,726,704,015
Composition of Net Assets ($):
Paid-in capital 1,158,277,820
Accumulated undistributed investment income—net 188,369
Accumulated net realized gain (loss) on investments (36,305,095)
Accumulated net unrealized appreciation (depreciation) on investments [including ($20,498) net unrealized depreciation on financial futures] 604,542,921
Net Assets ($) 1,726,704,015
Net Asset Value Per Share Initial Shares Service Shares
Net Assets ($) 1,541,577,103 185,126,912
Shares Outstanding 48,384,979 5,804,020
Net Asset Value Per Share ($) 31.86 31.90
See notes to financial statements.

28
Investment Income ($):Income:
Cash dividends (net of $21,763 foreign taxes withheld at source): Unaffiliated issuers 39,650,010 Affiliated issuers 18,373
Income from securities lending—Note 1(b) 130,441
Interest 748
Total Income 39,799,572
Expenses:
Management fee—Note 3(a) 4,232,939
Distribution fees—Note 3(b) 448,664
Prospectus and shareholders’ reports 230,372
Directors’ fees and expenses—Note 3(d) 133,110
Professional fees 92,688
Shareholder servicing costs—Note 3(c) 37,508
Loan commitment fees—Note 2 16,801
Registration fees 1,394
Miscellaneous 136,999
Total Expenses 5,330,475
Less—reduction in expenses due to earnings credits—Note 3(c) (8)
Net Expenses 5,330,467
Investment Income—Net 34,469,105
Realized and Unrealized Gain (Loss) on Investments—Note 4 ($):Net realized gain (loss) on investments 10,542,407
Net realized gain (loss) on financial futures 6,405,716
Net Realized Gain (Loss) 16,948,123
Net unrealized appreciation (depreciation) on investments 202,013,575
Net unrealized appreciation (depreciation) on financial futures (970,994)
Net Unrealized Appreciation (Depreciation) 201,042,581
Net Realized and Unrealized Gain (Loss) on Investments 217,990,704
Net Increase in Net Assets Resulting from Operations 252,459,809
S TAT E M E N T O F O P E R AT I O N SYe a r E n d e d D e c e m b e r 3 1 , 2 0 1 2
See notes to financial statements.
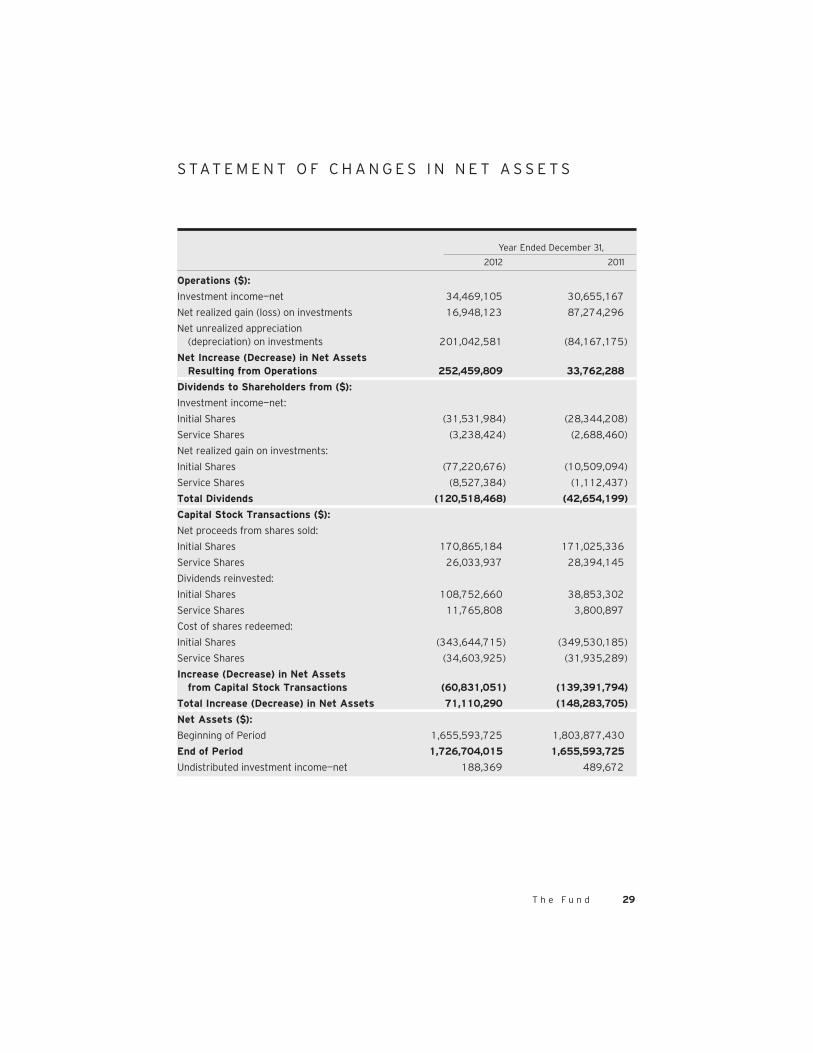
T h e F u n d 29
S TAT E M E N T O F C H A N G E S I N N E T A S S E T S
Year Ended December 31,
2012 2011
Operations ($):
Investment income—net 34,469,105 30,655,167
Net realized gain (loss) on investments 16,948,123 87,274,296
Net unrealized appreciation (depreciation) on investments 201,042,581 (84,167,175)
Net Increase (Decrease) in Net Assets Resulting from Operations 252,459,809 33,762,288
Dividends to Shareholders from ($):
Investment income—net:
Initial Shares (31,531,984) (28,344,208)
Service Shares (3,238,424) (2,688,460)
Net realized gain on investments:
Initial Shares (77,220,676) (10,509,094)
Service Shares (8,527,384) (1,112,437)
Total Dividends (120,518,468) (42,654,199)
Capital Stock Transactions ($):
Net proceeds from shares sold:
Initial Shares 170,865,184 171,025,336
Service Shares 26,033,937 28,394,145
Dividends reinvested:
Initial Shares 108,752,660 38,853,302
Service Shares 11,765,808 3,800,897
Cost of shares redeemed:
Initial Shares (343,644,715) (349,530,185)
Service Shares (34,603,925) (31,935,289)
Increase (Decrease) in Net Assets from Capital Stock Transactions (60,831,051) (139,391,794)
Total Increase (Decrease) in Net Assets 71,110,290 (148,283,705)
Net Assets ($):
Beginning of Period 1,655,593,725 1,803,877,430
End of Period 1,726,704,015 1,655,593,725
Undistributed investment income—net 188,369 489,672

S TAT E M E N T O F C H A N G E S I N N E T A S S E T S (continued)
30
Year Ended December 31,
2012 2011
Capital Share Transactions:
Initial Shares
Shares sold 5,457,760 5,767,892
Shares issued for dividends reinvested 3,454,350 1,300,359
Shares redeemed (10,985,766) (11,714,021)
Net Increase (Decrease) in Shares Outstanding (2,073,656) (4,645,770)
Service Shares
Shares sold 835,289 963,854
Shares issued for dividends reinvested 373,230 127,057
Shares redeemed (1,103,497) (1,074,192)
Net Increase (Decrease) in Shares Outstanding 105,022 16,719
See notes to financial statements.

T h e F u n d 31
a Based on average shares outstanding at each month end.See notes to financial statements.
F I N A N C I A L H I G H L I G H T S
The following tables describe the performance for each share class for the fiscalperiods indicated. All information (except portfolio turnover rate) reflects financialresults for a single fund share. Total return shows how much your investment in thefund would have increased (or decreased) during each period, assuming you hadreinvested all dividends and distributions. The fund’s total returns do not reflectexpenses associated with variable annuity or insurance contracts. These figures havebeen derived from the fund’s financial statements.
Year Ended December 31,
Initial Shares 2012 2011 2010 2009 2008
Per Share Data ($):
Net asset value, beginning of period 29.48 29.67 26.31 22.98 37.40
Investment Operations:
Investment income—neta .63 .54 .48 .48 .64
Net realized and unrealized gain (loss) on investments 3.95 .02 3.37 4.85 (14.40)
Total from Investment Operations 4.58 .56 3.85 5.33 (13.76)
Distributions:
Dividends from investment income—net (.64) (.55) (.49) (.48) (.66)
Dividends from net realized gain on investments (1.56) (.20) — (1.52) —
Total Distributions (2.20) (.75) (.49) (2.00) (.66)
Net asset value, end of period 31.86 29.48 29.67 26.31 22.98
Total Return (%) 15.74 1.88 14.84 26.33 (37.14)
Ratios/Supplemental Data (%):
Ratio of total expenses to average net assets .28 .27 .27 .29 .28
Ratio of net expenses to average net assets .28 .27 .27 .29 .28
Ratio of net investment income to average net assets 2.02 1.81 1.78 2.12 2.04
Portfolio Turnover Rate 3.13 3.27 4.46 5.42 4.69
Net Assets, end of period ($ x 1,000) 1,541,577 1,487,417 1,635,095 1,593,165 1,464,344

F I N A N C I A L H I G H L I G H T S (continued)
32
Year Ended December 31,
Service Shares 2012 2011 2010 2009 2008
Per Share Data ($):
Net asset value, beginning of period 29.51 29.70 26.34 23.00 37.41
Investment Operations:
Investment income—neta .56 .47 .41 .43 .57
Net realized and unrealized gain (loss) on investments 3.96 .02 3.38 4.85 (14.42)
Total from Investment Operations 4.52 .49 3.79 5.28 (13.85)
Distributions:
Dividends from investment income—net (.57) (.48) (.43) (.42) (.56)
Dividends from net realized gain on investments (1.56) (.20) — (1.52) —
Total Distributions (2.13) (.68) (.43) (1.94) (.56)
Net asset value, end of period 31.90 29.51 29.70 26.34 23.00
Total Return (%) 15.47 1.62 14.54 26.05 (37.32)
Ratios/Supplemental Data (%):
Ratio of total expenses to average net assets .53 .52 .52 .54 .53
Ratio of net expenses to average net assets .53 .52 .52 .54 .53
Ratio of net investment income to average net assets 1.78 1.56 1.53 1.86 1.72
Portfolio Turnover Rate 3.13 3.27 4.46 5.42 4.69
Net Assets, end of period ($ x 1,000) 185,127 168,177 168,782 150,369 124,614
a Based on average shares outstanding at each month end.See notes to financial statements.

NOTE 1—Significant Accounting Policies:
Dreyfus Stock Index Fund, Inc. (the “fund”) is registered under theInvestment Company Act of 1940, as amended (the “Act”), as a non-diversified open-end management investment company, that is intendedto be a funding vehicle for variable annuity contracts and variable lifeinsurance policies to be offered by the separate accounts of life insurancecompanies. The fund’s investment objective is to match the total returnof the Standard and Poor’s® 500 Composite Stock Price Index. TheDreyfus Corporation (the “Manager” or “Dreyfus”), a wholly-ownedsubsidiary of The Bank of New York Mellon Corporation (“BNYMellon”), serves as the fund’s investment adviser. Mellon CapitalManagement Corporation (“Mellon Capital”), an indirect wholly-owned subsidiary of BNY Mellon, serves as the fund’s index manager.
MBSC Securities Corporation (the “Distributor”), a wholly-ownedsubsidiary of Dreyfus, is the distributor of the fund’s shares, which aresold without a sales charge. The fund is authorized to issue 400 millionshares of $.001 par value Common Stock in each of the followingclasses of shares: Initial shares (250 million shares authorized) andService shares (150 million shares authorized). Initial shares are subjectto a Shareholder Services fee and Service shares are subject to aDistribution fee. Each class of shares has identical rights and privileges,except with respect to the Distribution Plan, Shareholder Services Plan,and the expenses borne by each class, the allocation of certain transferagency costs and certain voting rights. Income, expenses (other thanexpenses attributable to a specific class), and realized and unrealizedgains or losses on investments are allocated to each class of shares basedon its relative net assets.
The Financial Accounting Standards Board (“FASB”) AccountingStandards Codification is the exclusive reference of authoritative U.S.generally accepted accounting principles (“GAAP”) recognized by theFASB to be applied by nongovernmental entities. Rules and interpretivereleases of the Securities and Exchange Commission (“SEC”) under
T h e F u n d 33
N O T E S T O F I N A N C I A L S TAT E M E N T S

authority of federal laws are also sources of authoritative GAAP for SECregistrants. The fund’s financial statements are prepared in accordancewith GAAP, which may require the use of management estimates andassumptions. Actual results could differ from those estimates.
The fund enters into contracts that contain a variety of indemnifica-tions. The fund’s maximum exposure under these arrangements isunknown. The fund does not anticipate recognizing any loss related tothese arrangements.
(a) Portfolio valuation: The fair value of a financial instrument is theamount that would be received to sell an asset or paid to transfer a lia-bility in an orderly transaction between market participants at themeasurement date (i.e., the exit price). GAAP establishes a fair valuehierarchy that prioritizes the inputs of valuation techniques used tomeasure fair value. This hierarchy gives the highest priority to unad-justed quoted prices in active markets for identical assets or liabilities(Level 1 measurements) and the lowest priority to unobservable inputs(Level 3 measurements).
Additionally, GAAP provides guidance on determining whether thevolume and activity in a market has decreased significantly andwhether such a decrease in activity results in transactions that are notorderly. GAAP requires enhanced disclosures around valuation inputsand techniques used during annual and interim periods.
Various inputs are used in determining the value of the fund’s invest-ments relating to fair value measurements. These inputs are summarizedin the three broad levels listed below:
Level 1—unadjusted quoted prices in active markets for identical investments.
Level 2—other significant observable inputs (including quotedprices for similar investments, interest rates, prepayment speeds,credit risk, etc.).
Level 3—significant unobservable inputs (including the fund’sown assumptions in determining the fair value of investments).
34
N O T E S T O F I N A N C I A L S TAT E M E N T S (continued)
The inputs or methodology used for valuing securities are not necessar-ily an indication of the risk associated with investing in those securities.
Changes in valuation techniques may result in transfers in or out of anassigned level within the disclosure hierarchy. Valuation techniquesused to value the fund’s investments are as follows:
Investments in securities are valued at the last sales price on the secu-rities exchange or national securities market on which such securitiesare primarily traded. Securities listed on the National Market Systemfor which market quotations are available are valued at the official clos-ing price or, if there is no official closing price that day, at the last salesprice. Securities not listed on an exchange or the national securitiesmarket, or securities for which there were no transactions, are valuedat the average of the most recent bid and asked prices, except for openshort positions, where the asked price is used for valuation purposes.Bid price is used when no asked price is available. Registered invest-ment companies that are not traded on an exchange are valued at theirnet asset value. All of the preceding securities are categorized withinLevel 1 of the fair value hierarchy.
U.S. Treasury Bills are valued at the mean price between quoted bidprices and asked prices by an independent pricing service (the“Service”) approved by the fund’s Board of Directors (the “Board”).These securities are generally categorized within Level 2 of the fairvalue hierarchy.
The Service’s procedures are reviewed by Dreyfus under the generalsupervision of the Board.
Fair valuing of securities may be determined with the assistance of apricing service using calculations based on indices of domestic securi-ties and other appropriate indicators, such as prices of relevantAmerican Depository Receipts and financial futures. Utilizing thesetechniques may result in transfers between Level 1 and Level 2 of thefair value hierarchy.
T h e F u n d 35

When market quotations or official closing prices are not readily avail-able, or are determined not to reflect accurately fair value, such aswhen the value of a security has been significantly affected by eventsafter the close of the exchange or market on which the security isprincipally traded (for example, a foreign exchange or market), butbefore the fund calculates its net asset value, the fund may value theseinvestments at fair value as determined in accordance with the proce-dures approved by the Board. Certain factors may be considered whenfair valuing investments such as: fundamental analytical data, the natureand duration of restrictions on disposition, an evaluation of the forcesthat influence the market in which the securities are purchased andsold, and public trading in similar securities of the issuer or comparableissuers. These securities are either categorized within Level 2 or 3depending on the relevant inputs used.
For restricted securities where observable inputs are limited, assump-tions about market activity and risk are used and are categorizedwithin Level 3 of the fair value hierarchy.
Financial futures, which are traded on an exchange, are valued at thelast sales price on the securities exchange on which such securities areprimarily traded or at the last sales price on the national securitiesmarket on each business day. These securities are generally categorizedwithin Level 1 of the fair value hierarchy.
The following is a summary of the inputs used as of December 31,2012 in valuing the fund’s investments:
Level 2—Other Level 3—
Level 1— Significant Significant
Unadjusted Observable Unobservable
Quoted Prices Inputs Inputs Total
Assets ($)
Investments in Securities:
Equity Securities— Domestic Common Stocks† 1,701,839,685 — — 1,701,839,685
Equity Securities— Foreign Common Stocks† 1,850,544 — — 1,850,544
36
N O T E S T O F I N A N C I A L S TAT E M E N T S (continued)

Level 2—Other Level 3—
Level 1— Significant Significant
Unadjusted Observable Unobservable
Quoted Prices Inputs Inputs Total
Assets ($) (continued)
Mutual Funds 34,216,992 — — 34,216,992
U.S. Treasury — 1,229,921 — 1,229,921
Liabilities ($)
Other Financial Instruments:
Financial Futures†† (20,498) — — (20,498)
† See Statement of Investments for additional detailed categorizations.†† Amount shown represents unrealized (depreciation) at period end.
At December 31, 2012, there were no transfers between Level 1 andLevel 2 of the fair value hierarchy.
(b) Securities transactions and investment income: Securities trans-actions are recorded on a trade date basis. Realized gains and lossesfrom securities transactions are recorded on the identified cost basis.Dividend income is recognized on the ex-dividend date and interestincome, including, where applicable, accretion of discount and amor-tization of premium on investments, is recognized on the accrual basis.
Pursuant to a securities lending agreement with The Bank of NewYork Mellon, a subsidiary of BNY Mellon and an affiliate of Dreyfus,the fund may lend securities to qualified institutions. It is the fund’spolicy that, at origination, all loans are secured by collateral of at least102% of the value of U.S. securities loaned and 105% of the value offoreign securities loaned. Collateral equivalent to at least 100% of themarket value of securities on loan is maintained at all times. Collateralis either in the form of cash, which can be invested in certain moneymarket mutual funds managed by Dreyfus, U.S. Government andAgency securities or letters of credit. The fund is entitled to receive allincome on securities loaned, in addition to income earned as a resultof the lending transaction. Although each security loaned is fully col-lateralized, the fund bears the risk of delay in recovery of, or loss ofrights in, the securities loaned should a borrower fail to return the
T h e F u n d 37

securities in a timely manner. During the period ended December 31,2012. The Bank of New York Mellon earned $55,903 from lendingportfolio securities, pursuant to the securities lending agreement.
(c) Affiliated issuers: Investments in other investment companiesadvised by Dreyfus are defined as “affiliated” in the Act. Investmentsin affiliated investment companies for the period ended December 31,2012 were as follows:
Affiliated Investment Value Value Net Company 12/31/2011 ($) Purchases ($) Sales ($) 12/31/2012 ($) Assets (%)
Dreyfus Institutional Preferred Plus Money Market Fund 43,932,285 170,664,927 193,716,993 20,880,219 1.2
Dreyfus Institutional Cash Advantage Fund 17,596,811 113,442,590 117,702,628 13,336,773 .8
Total 61,529,096 284,107,517 311,419,621 34,216,992 2.0
(d) Dividends to shareholders: Dividends are recorded on the ex-dividend date. Dividends from investment income-net are declaredand paid on a quarterly basis. Dividends from net realized capital gains,if any, are normally declared and paid annually, but the fund may makedistributions on a more frequent basis to comply with the distributionrequirements of the Internal Revenue Code of 1986, as amended (the“Code”). To the extent that net realized capital gains can be offset bycapital loss carryovers, it is the policy of the fund not to distribute suchgains. Income and capital gain distributions are determined in accor-dance with income tax regulations, which may differ from GAAP.
(e) Federal income taxes: It is the policy of the fund to continue toqualify as a regulated investment company, if such qualification is in thebest interests of its shareholders, by complying with the applicable pro-visions of the Code, and to make distributions of taxable income suffi-cient to relieve it from substantially all federal income and excise taxes.
38
N O T E S T O F I N A N C I A L S TAT E M E N T S (continued)

As of and during the period ended December 31, 2012, the fund didnot have any liabilities for any uncertain tax positions. The fund rec-ognizes interest and penalties, if any, related to uncertain tax positionsas income tax expense in the Statement of Operations. During theperiod, the fund did not incur any interest or penalties.
Each of the tax years in the four-year period ended December 31,2012 remains subject to examination by the Internal Revenue Serviceand state taxing authorities.
At December 31, 2012, the components of accumulated earnings ona tax basis were as follows: undistributed ordinary income $3,937,990,undistributed capital gains $17,173,692 and unrealized appreciation$547,307,218.
The tax character of distributions paid to shareholders during the fiscalperiods ended December 31, 2012 and December 31, 2011 were as fol-lows: ordinary income $36,613,092 and $31,032,668 and long-termcapital gains $83,905,376 and $11,621,531, respectively.
(f) New Accounting Pronouncement: In December 2011, FASB issuedAccounting Standards Update No. 2011-11 “Disclosures aboutOffsetting Assets and Liabilities” (“ASU 2011-11”). These disclosurerequirements are intended to help investors and other financial statementusers to better assess the effect or potential effect of offsetting arrange-ments on a company’s financial position. They also improve transparencyin the reporting of how companies mitigate credit risk, including disclo-sure of related collateral pledged or received. In addition, ASU 2011-11facilitates comparison between those entities that prepare their financialstatements on the basis of GAAP and those entities that prepare theirfinancial statements on the basis of International Financial ReportingStandards (“IFRS”). ASU 2011-11 requires entities to: disclose both grossand net information about both instruments and transactions eligible foroffset in the financial statements; and disclose instruments and transactionssubject to an agreement similar to a master netting agreement. ASU2011-11 is effective for fiscal years beginning on or after January 1, 2013,
T h e F u n d 39

and interim periods within those annual periods. At this time, manage-ment is evaluating the implications of ASU 2011-11 and its impact onthe fund’s financial statement disclosures.
NOTE 2—Bank Lines of Credit:
The fund participates with other Dreyfus-managed funds in a $210million unsecured credit facility led by Citibank, N.A. and a $300million unsecured credit facility provided by The Bank of New YorkMellon (each a “Facility), each to be utilized primarily for temporaryor emergency purposes, including the financing of redemptions. Priorto October 10, 2012, the unsecured credit facility with Citibank,N.A., was $225 million. In connection therewith, the fund has agreedto pay its pro rata portion of commitment fees for each Facility.Interest is charged to the fund based on rates determined pursuant tothe terms of the respective Facility at the time of borrowing. Duringthe period ended December 31, 2012, the fund did not borrow underthe Facilities.
NOTE 3—Management Fee, Index Management Fee and OtherTransactions With Affiliates:
(a) Pursuant to a management agreement (“the Agreement”) withDreyfus, the management fee is computed at the annual rate of .245%of the value of the fund’s average daily net assets and is payablemonthly. Pursuant to the Agreement, the fund’s custody fee is includedin the management fee.
Dreyfus has agreed to pay Mellon Capital a monthly index-manage-ment fee at the annual rate of .07% of the value of the fund’s averagedaily net assets.
(b) Under the Distribution Plan adopted pursuant to Rule 12b-1 underthe Act, Service shares pay the Distributor for distributing its shares, forservicing and/or maintaining Service shares’ shareholder accounts andfor advertising and marketing for Service shares. The Distribution Planprovides for payments to be made at an annual rate of .25% of the valueof the Service shares’ average daily net assets. The Distributor may makepayments to Participating Insurance Companies and to brokers and
40
N O T E S T O F I N A N C I A L S TAT E M E N T S (continued)

dealers acting as principal underwriter for their variable insurance prod-ucts. The fees payable under the Distribution Plan are payable withoutregard to actual expenses incurred. During the period ended December31, 2012, Service shares were charged $448,664 pursuant to theDistribution Plan.
(c) Under the Shareholder Services Plan, Initial shares reimburse theDistributor an amount not to exceed an annual rate of .25% of the valueof the Initial shares’ average daily net assets for certain allocated expenseswith respect to servicing and/or maintaining Initial shares’ shareholderaccounts. During the period ended December 31, 2012, Initial shareswere charged $32,320 pursuant to the Shareholders Services Plan.
The fund has arrangements with the transfer agent and the custodianwhereby the fund may receive earnings credits when positive cashbalances are maintained, which are used to offset transfer agency andcustody fees. For financial reporting purposes, the fund includes netearnings credits as an expense offset in the Statement of Operations.
The fund compensates Dreyfus Transfer, Inc., a wholly-owned sub-sidiary of Dreyfus, under a transfer agency agreement for providingtransfer agency services for the fund and, since May 29, 2012, cashmanagement services related to fund subscriptions and redemptions.During the period ended December 31, 2012, the fund was charged$1,252 for transfer agency services and $40 for cash management ser-vices. Cash management fees were partially offset by earnings creditsof $4. These fees are included in Shareholder servicing costs in theStatement of Operations.
Prior to May 29, 2012, the fund compensated The Bank of New YorkMellon under a cash management agreement for performing cashmanagement services related to fund subscriptions and redemptions.During the period ended December 31, 2012, the fund was charged$93 pursuant to the cash management agreement, which is included inShareholder servicing costs in the Statement of Operations. These feeswere partially offset by earnings credits of $4.
T h e F u n d 41

During the period ended December 31, 2012, the fund was charged$8,783 for services performed by the Chief Compliance Officer andhis staff.
The components of “Due to The Dreyfus Corporation and affiliates”in the Statement of Assets and Liabilities consist of: management fees$357,800, Distribution Plan fees $39,192, Shareholder Services Planfees $2,375, Chief Compliance Officer fees $3,981 and transfer agencyfees $384.
(d) Each Board member also serves as a Board member of other fundswithin the Dreyfus complex. Annual retainer fees and attendance feesare allocated to each fund based on net assets.
NOTE 4—Securities Transactions:
The aggregate amount of purchases and sales of investment securi-ties, excluding short-term securities and financial futures, during theperiod ended December 31, 2012, amounted to $53,297,731 and$168,839,158, respectively.
Derivatives: A derivative is a financial instrument whose performanceis derived from the performance of another asset. Each type of deriv-ative instrument that was held by the fund during the period endedDecember 31, 2012 is discussed below.
Financial Futures: In the normal course of pursuing its investmentobjective, the fund is exposed to market risk, including equity pricerisk, as a result of changes in value of underlying financial instruments.The fund invests in financial futures in order to manage its exposure toor protect against changes in the market. A financial futures contractrepresents a commitment for the future purchase or a sale of an asset ata specified date. Upon entering into such contracts, these investmentsrequire initial margin deposits with a counterparty, which consist ofcash or cash equivalents. The amount of these deposits is determined bythe exchange or Board of Trade on which the contract is traded and issubject to change. Accordingly, variation margin payments are receivedor made to reflect daily unrealized gains or losses which are recorded inthe Statement of Operations. When the contracts are closed, the fund
42
N O T E S T O F I N A N C I A L S TAT E M E N T S (continued)

recognizes a realized gain or loss which is reflected in the Statement ofOperations. There is minimal counterparty credit risk to the fund withfinancial futures since they are exchange traded, and the exchange’sclearinghouse guarantees the financial futures against default. Financialfutures open at December 31, 2012 are set forth in the Statement ofFinancial Futures.
The following summarizes the average market value of derivatives out-standing during the period ended December 31, 2012:
Average Market Value ($)
Equity financial futures contracts 28,840,766
At December 31, 2012, the cost of investments for federal incometax purposes was $1,191,829,924; accordingly, accumulated net unre-alized appreciation on investments was $547,307,218, consisting of$750,190,676 gross unrealized appreciation and $202,883,458 grossunrealized depreciation.
NOTE 5—Pending Legal Matters:
The fund and many other entities have been named as defendants innumerous pending litigations as a result of their participation in the lever-aged buyout transaction (“LBO”) of the Tribune Company (“Tribune”).The cases allege that Tribune took on billions of dollars of debt in theLBO to purchase its own stock from shareholders at $34 per share. TheLBO was closed in a two step transaction with shares being repurchasedby Tribune in a tender offer in June 2007 and in a go-private merger inDecember 2007. In 2008, approximately one year after the LBO wasconcluded, Tribune filed for bankruptcy protection under Chapter 11.Thereafter, in approximately June 2011, certain Tribune creditors fileddozens of complaints in various courts throughout the country allegingthat the payments made to shareholders in the LBO were “fraudulentconveyances” under state and/or federal law, and that the shareholdersmust return the payments they received for their shares to satisfy theplaintiffs’ unpaid claims. These cases have been consolidated for coordi-nated pre-trial proceedings in a multi-district litigation in the UnitedStates District Court for the Southern District of New York titled In re
T h e F u n d 43

Tribune Company Fraudulent Conveyance Litigation (S.D.N.Y. Nos.11-md-2296 and 12-mc-2296 (WHP) (“Tribune MDL”)).
In addition, there was a case pending in United States BankruptcyCourt for the District of Delaware brought by the Unsecured CreditorsCommittee of the Tribune Company that has since been transferred tothe Tribune MDL (The Official Committee of Unsecured Creditors ofTribune Co. v. FitzSimons, et al., formerly Bankr. D. Del. Adv. Pro. No.10-54010 (KJC) and now S.D.N.Y. No. 12-cv-2652 (WHP)). The casewas originally filed on November 1, 2010. In a Fourth AmendedComplaint filed in November 2012, among other claims, the CreditorsCommittee seeks recovery under the Bankruptcy Code for alleged“fraudulent conveyances” from more than 6,000 Tribune shareholders,including the fund, and a defendants class of all shareholders who ten-dered their Tribune stock in the LBO and received cash in exchange.There are 35 other counts in the Fourth Amended Complaint that donot relate to claims against shareholder defendants, but instead arebrought against parties directly involved in approval or execution of theleveraged buyout. On January 10, 2013, pursuant to the Tribune bank-ruptcy plan, Mark S. Kirchner, as Litigation Trustee for the TribuneLitigation Trust, became the successor plaintiff to the CreditorsCommittee in this case.
On November 6, 2012, a motion to dismiss was filed in the TribuneMDL. The hearing on the motion is set for March 2013. If successful,the motion would dismiss all cases in the Tribune MDL, except theFitzSimons case, in full.
Per order of the Court, the FitzSimons case remains stayed until a deci-sion is rendered on the motion to dismiss in the Tribune MDL. Noresponse to that Fourth Amended Complaint is currently required.
At this stage in the proceedings, it is not possible to assess with anyreasonable certainty the probable outcomes of the pending litigations.Consequently, at this time, management is unable to estimate the pos-sible loss that may result.
44
N O T E S T O F I N A N C I A L S TAT E M E N T S (continued)

Shareholders and Board of Directors Dreyfus Stock Index Fund, Inc.
We have audited the accompanying statement of assets and liabilities ofDreyfus Stock Index Fund, Inc., including the statements of investmentsand financial futures, as of December 31, 2012, and the related statementof operations for the year then ended, the statement of changes in netassets for each of the two years in the period then ended, and the finan-cial highlights for each of the five years in the period then ended. Thesefinancial statements and financial highlights are the responsibility of theFund’s management. Our responsibility is to express an opinion on thesefinancial statements and financial highlights based on our audits.
We conducted our audits in accordance with the standards of the PublicCompany Accounting Oversight Board (United States). Those standardsrequire that we plan and perform the audit to obtain reasonable assur-ance about whether the financial statements and financial highlightsare free of material misstatement. We were not engaged to perform anaudit of the Fund’s internal control over financial reporting. Our auditsincluded consideration of internal control over financial reporting as abasis for designing audit procedures that are appropriate in the cir-cumstances, but not for the purpose of expressing an opinion on theeffectiveness of the Fund’s internal control over financial reporting.Accordingly, we express no such opinion. An audit also includes exam-ining, on a test basis, evidence supporting the amounts and disclosures inthe financial statements and financial highlights, assessing the accountingprinciples used and significant estimates made by management, andevaluating the overall financial statement presentation. Our proceduresincluded confirmation of securities owned as of December 31, 2012 bycorrespondence with the custodian and others. We believe that ouraudits provide a reasonable basis for our opinion.
In our opinion, the financial statements and financial highlights referredto above present fairly, in all material respects, the financial position ofDreyfus Stock Index Fund, Inc., at December 31, 2012, the results of itsoperations for the year then ended, the changes in its net assets for eachof the two years in the period then ended, and the financial highlightsfor each of the five years in the period then ended, in conformity withU.S. generally accepted accounting principles.
New York, New YorkFebruary 13, 2013
T h e F u n d 45
R E P O R T O F I N D E P E N D E N T R E G I S T E R E D P U B L I C A C C O U N T I N G F I R M

For federal tax purposes, the fund hereby designates 100% of the ordi-nary dividends paid during the fiscal year ended December 31, 2012as qualifying for the corporate dividends received deduction.Shareholders will receive notification in early 2013 of the percentageapplicable to the preparation of their 2012 income tax returns. Also,the fund hereby reports $.0335 per share as a short-term capital gaindistribution paid and $1.5254 per share as a long-term capital gaindistribution paid on March 30, 2012.
46
I M P O R TA N T TA X I N F O R M AT I O N ( U n a u d i t e d )

The fund held a special meeting of shareholders on August 3, 2012. The proposalconsidered at the meeting, and the results, are as follows:
T h e F u n d 47
P R O X Y R E S U LT S ( U n a u d i t e d )
Shares
Votes For Authority Withheld
To elect additional Board Members:
Lynn Martin† 49,214,830 1,991,395
Robin A. Melvin† 49,286,633 1,919,592
Philip L. Toia† 49,104,921 2,101,304
† Each new Board Member’s term commenced on September 1, 2012.In addition Peggy C. Davis, Joseph S. DiMartino, David P. Feldman, Ehud Houminer and Dr. Martin Peretz continueas Board Members of the fund.

48
B O A R D M E M B E R S I N F O R M AT I O N ( U n a u d i t e d )
Joseph S. DiMartino (69)Chairman of the Board (1995)
Principal Occupation During Past 5 Years:• Corporate Director and Trustee
Other Public Company Board Memberships During Past 5 Years:• CBIZ (formerly, Century Business Services, Inc.), a provider of outsourcing functions for small
and medium size companies, Director (1997-present)• Sunair Services Corporation, a provider of certain outdoor-related services to homes and
businesses, Director (2005-2009) • The Newark Group, a provider of a national market of paper recovery facilities, paperboard
mills and paperboard converting plants, Director (2000-2010)
No. of Portfolios for which Board Member Serves: 151
———————Peggy C. Davis (69)Board Member (2006)
Principal Occupation During Past 5 Years:• Shad Professor of Law, New York University School of Law (1983-present)
No. of Portfolios for which Board Member Serves: 63
———————David P. Feldman (73)Board Member (1996)
Principal Occupation During Past 5 Years:• Corporate Director and Trustee
Other Public Company Board Memberships During Past 5 Years:• BBH Mutual Funds Group (4 registered mutual funds), Director (1992-present)• QMed, Inc. a healthcare company, Director (1999-2007)
No. of Portfolios for which Board Member Serves: 46
———————Ehud Houminer (72)Board Member (1993)
Principal Occupation During Past 5 Years:• Executive-in-Residence at the Columbia Business School, Columbia University (1992-present)
Other Public Company Board Memberships During Past 5 Years:• Avnet Inc., an electronics distributor, Director (1993-2012)
No. of Portfolios for which Board Member Serves: 70

Lynn Martin (73)Board Member (2012)
Principal Occupation During Past 5 Years:• President of The Martin Hall Group LLC, a human resources consulting firm, from January
2005-present
Other Public Company Board Memberships During Past 5 Years:• AT&T Inc., a telecommunications company, Director (1999-2012)• Ryder System, Inc., a supply chain and transportation management company, Director (1993-2012)• The Proctor & Gamble Co., a consumer products company, Director (1994-2009)• Constellation Energy Group Inc., Director (2003-2009)
No. of Portfolios for which Board Member Serves: 46
———————Robin A. Melvin (49)Board Member (2012)
Principal Occupation During Past 5 Years:• Director, Boisi Family Foundation, a private family foundation that supports youth-serving orga-
nizations that promote the self sufficiency of youth from disadvantaged circumstances (1995-2012)
No. of Portfolios for which Board Member Serves: 97
———————Dr. Martin Peretz (73)Board Member (2006)
Principal Occupation During Past 5 Years:• Editor-in-Chief Emeritus of The New Republic Magazine (2010-present) (previously,
Editor-in-Chief, 1974-2010)• Director of TheStreet.com, a financial information service on the web (1996-present)
No. of Portfolios for which Board Member Serves: 46
———————Philip L. Toia (79)Board Member (2012)
Principal Occupation During Past 5 Years:• Private Investor
No. of Portfolios for which Board Member Serves: 56
———————Once elected all Board Members serve for an indefinite term, but achieve Emeritus status upon reaching age 80. Theaddress of the Board Members and Officers is c/o The Dreyfus Corporation, 200 Park Avenue, New York, New York10166. Additional information about the Board Members is available in the fund’s Statement of Additional Informationwhich can be obtained from Dreyfus free of charge by calling this toll free number: 1-800-DREYFUS.
James F. Henry, Emeritus Board MemberRosalind G. Jacobs, Emeritus Board MemberDr. Paul A. Marks, Emeritus Board MemberGloria Messinger, Emeritus Board Member
T h e F u n d 49

BRADLEY J. SKAPYAK, President sinceJanuary 2010.
Chief Operating Officer and a director of theManager since June 2009; from April 2003 toJune 2009, Mr. Skapyak was the head of theInvestment Accounting and SupportDepartment of the Manager. He is an officerof 69 investment companies (comprised of 150portfolios) managed by the Manager. He is 54years old and has been an employee of theManager since February 1988.
JANETTE E. FARRAGHER, Vice Presidentand Secretary since December 2011.
Assistant General Counsel of BNY Mellon,and an officer of 70 investment companies(comprised of 177 portfolios) managed by theManager. She is 50 years old and has been anemployee of the Manager since February 1984.
KIESHA ASTWOOD, Vice President andAssistant Secretary since January 2010.
Counsel of BNY Mellon, and an officer of 70investment companies (comprised of 177portfolios) managed by the Manager. She is 39years old and has been an employee of theManager since July 1995.
JAMES BITETTO, Vice President andAssistant Secretary since August 2005.
Senior Counsel of BNY Mellon and Secretaryof the Manager, and an officer of 70investment companies (comprised of 177portfolios) managed by the Manager. He is 46years old and has been an employee of theManager since December 1996.
JONI LACKS CHARATAN, Vice Presidentand Assistant Secretary since August 2005.
Senior Counsel of BNY Mellon, and an officerof 70 investment companies (comprised of 177portfolios) managed by the Manager. She is 57years old and has been an employee of theManager since October 1988.
JOSEPH M. CHIOFFI, Vice President andAssistant Secretary since August 2005.
Senior Counsel of BNY Mellon, and an officerof 70 investment companies (comprised of 177portfolios) managed by the Manager. He is 51years old and has been an employee of theManager since June 2000.
JOHN B. HAMMALIAN, Vice President andAssistant Secretary since August 2005.
Senior Managing Counsel of BNY Mellon,and an officer of 70 investment companies(comprised of 177 portfolios) managed by theManager. He is 49 years old and has been anemployee of the Manager since February 1991.
ROBERT R. MULLERY, Vice President andAssistant Secretary since August 2005.
Managing Counsel of BNY Mellon, and anofficer of 70 investment companies (comprisedof 177 portfolios) managed by the Manager.He is 60 years old and has been an employeeof the Manager since May 1986.
JEFF PRUSNOFSKY, Vice President andAssistant Secretary since September 2003.
Senior Managing Counsel of BNY Mellon,and an officer of 70 investment companies(comprised of 177 portfolios) managed by theManager. He is 47 years old and has been anemployee of the Manager since October 1990.
JAMES WINDELS, Treasurer sinceSeptember 2003.
Director – Mutual Fund Accounting of theManager, and an officer of 70 investmentcompanies (comprised of 177 portfolios)managed by the Manager. He is 54 years oldand has been an employee of the Managersince April 1985.
50
O F F I C E R S O F T H E F U N D ( U n a u d i t e d )

RICHARD CASSARO, Assistant Treasurersince January 2007.
Senior Accounting Manager – Money Marketand Municipal Bond Funds of the Manager,and an officer of 70 investment companies(comprised of 177 portfolios) managed by the Manager. He is 53 years old and has been an employee of the Manager sinceSeptember 1982.
GAVIN C. REILLY, Assistant Treasurersince December 2005.
Tax Manager of the Investment Accountingand Support Department of the Manager, andan officer of 70 investment companies(comprised of 177 portfolios) managed by theManager. He is 44 years old and has been anemployee of the Manager since April 1991.
ROBERT S. ROBOL, Assistant Treasurersince August 2005.
Senior Accounting Manager – Fixed IncomeFunds of the Manager, and an officer of 70investment companies (comprised of 177portfolios) managed by the Manager. He is 48years old and has been an employee of theManager since October 1988.
ROBERT SALVIOLO, Assistant Treasurersince July 2007.
Senior Accounting Manager – Equity Funds ofthe Manager, and an officer of 70 investmentcompanies (comprised of 177 portfolios)managed by the Manager. He is 45 years oldand has been an employee of the Managersince June 1989.
ROBERT SVAGNA, Assistant Treasurersince September 2003.
Senior Accounting Manager – Equity Funds ofthe Manager, and an officer of 70 investmentcompanies (comprised of 177 portfolios)managed by the Manager. He is 45 years oldand has been an employee of the Managersince November 1990.
JOSEPH W. CONNOLLY, Chief ComplianceOfficer since October 2004.
Chief Compliance Officer of the Manager andThe Dreyfus Family of Funds (70 investmentcompanies, comprised of 177 portfolios). He is55 years old and has served in variouscapacities with the Manager since 1980,including manager of the firm’s FundAccounting Department from 1997 throughOctober 2001.
MATTHEW D. CONNOLLY, Anti-MoneyLaundering Compliance Officer since April 2012.
Anti-Money Laundering Compliance Officerof the Distributor since October 2011; fromMarch 2010 to September 2011, Global Head,KYC Reviews and Director, UBS InvestmentBank; until March 2010, AML ComplianceOfficer and Senior Vice President, Citi GlobalWealth Management. He is an officer of 66investment companies (comprised of 173portfolios) managed by the Manager. He is 40years old and has been an employee of theDistributor since October 2011.
T h e F u n d 51

Dreyfus Stock Index Fund, Inc.
200 Park AvenueNew York, NY 10166
Manager
The Dreyfus Corporation200 Park AvenueNew York, NY 10166
Index Fund Manager
Mellon Capital ManagementCorporation500 Grant StreetPittsburgh, PA 15258
Custodian
The Bank of New York MellonOne Wall StreetNew York, NY 10286
Transfer Agent &Dividend Disbursing Agent
Dreyfus Transfer, Inc.200 Park AvenueNew York, NY 10166
Distributor
MBSC Securities Corporation200 Park AvenueNew York, NY 10166
For More Information
© 2013 MBSC Securities Corporation 0763AR1212
Telephone 1-800-554-4611 or 1-516-338-3300
Mail The Dreyfus Family of Funds, 144 Glenn Curtiss Boulevard, Uniondale, NY 11556-0144
Attn: Investments Division
The fund files its complete schedule of portfolio holdings with the Securities and Exchange
Commission (“SEC”) for the first and third quarters of each fiscal year on Form N-Q. The
fund’s Forms N-Q are available on the SEC’s website at http://www.sec.gov and may be
reviewed and copied at the SEC’s Public Reference Room in Washington, DC. Information on
the operation of the Public Reference Room may be obtained by calling 1-800-SEC-0330.
A description of the policies and procedures that the fund uses to determine how to vote
proxies relating to portfolio securities, and information regarding how the fund voted
these proxies for the most recent 12-month period ended June 30 is available at
http://www.dreyfus.com and on the SEC’s website at http://www.sec.gov. The
description of the policies and procedures is also available without charge,
upon request, by calling 1-800-DREYFUS.
®
Dreyfus VariableInvestment Fund,Appreciation Portfolio
ANNUAL REPORT December 31, 2012

The views expressed in this report reflect those of the portfoliomanager only through the end of the period covered and do notnecessarily represent the views of Dreyfus or any other person inthe Dreyfus organization. Any such views are subject to change atany time based upon market or other conditions and Dreyfus dis-claims any responsibility to update such views. These views may notbe relied on as investment advice and, because investment decisionsfor a Dreyfus fund are based on numerous factors, may not be reliedon as an indication of trading intent on behalf of any Dreyfus fund.
Not FDIC-Insured • Not Bank-Guaranteed • May Lose Value

Contents
T H E F U N D
2 A Letter from the President
3 Discussion of Fund Performance
6 Fund Performance
8 Understanding Your Fund’s Expenses
8 Comparing Your Fund’s Expenses With Those of Other Funds
9 Statement of Investments
13 Statement of Assets and Liabilities
14 Statement of Operations
15 Statement of Changes in Net Assets
17 Financial Highlights
19 Notes to Financial Statements
29 Report of Independent Registered Public Accounting Firm
30 Important Tax Information
31 Proxy Results
32 Board Members Information
34 Officers of the Fund
F O R M O R E I N F O R M AT I O N
Back Cover

2
Dreyfus Variable Investment Fund,Appreciation Portfolio The Fund
A L E T T E R F R O M T H E P R E S I D E N T
Dear Shareholder:
We are pleased to present this annual report for Dreyfus Variable Investment Fund,Appreciation Portfolio, covering the 12-month period from January 1, 2012, throughDecember 31, 2012. For information about how the fund performed during thereporting period, as well as general market perspectives, we provide a Discussion ofFund Performance on the pages that follow.
In retrospect, 2012 was notable for the global equity markets’ resilience in the face ofsome tough macroeconomic challenges. Worries regarding sluggish employmentgrowth, weak housing markets and Congressional gridlock weighed on investorsentiment in the United States at times during the year, yet U.S. stocks postedrespectable gains, on average. An ongoing debt crisis led to recessionary conditions inEurope, particularly for some of the continent’s more peripheral nations, but aggressiveactions from monetary policymakers helped some European stock markets producedouble-digit returns. While China’s economy slowed in response to inflation-fightingmeasures, officials there appeared to have engineered a “soft landing,” and Chinesestocks generally ended the year with positive absolute returns.
We currently expect the U.S. and global economies to be modestly stronger in 2013,especially during the second half of the year. The global economy seems likely to benefitfrom Europe’s ongoing efforts to support its banking system and common currency,and by China’s moves toward more stimulative fiscal policies under new governmentleadership. In the United States, greater certainty regarding U.S. tax and fiscal policies,the resumption of postponed spending by businesses, and a continued housing recoverycould support modestly higher rates of economic growth. We encourage you to discussthe implications of our economic analysis with your financial advisor, who can help youalign your investments with the year’s challenges and opportunities.
Thank you for your continued confidence and support.
Sincerely,
J. Charles CardonaPresidentThe Dreyfus CorporationJanuary 15, 2013

T h e F u n d 3
D I S C U S S I O N O F F U N D P E R F O R M A N C E
For the period of January 1, 2012, through December 31, 2012, as provided by FayezSarofim, Portfolio Manager of Fayez Sarofim & Co., Sub-Investment Adviser
Fund and Market Performance Overview
For the 12-month period ended December 31, 2012, Dreyfus Variable InvestmentFund, Appreciation Portfolio’s Initial shares produced a total return of 10.44%, andits Service shares produced a total return of 10.14%.1 In comparison, the total returnof the fund’s benchmark, the Standard & Poor’s 500 Composite Stock Price Index(“S&P 500 Index”), was 15.99% for the same period.2
Despite bouts of volatility, stocks generally advanced over the reporting period asglobal and domestic economic conditions improved. The fund produced lower returnsthan its benchmark, mainly due to shortfalls in the financials and energy sectors.
The Fund’s Investment Approach
The fund seeks long-term capital growth consistent with the preservation of capital. Itssecondary goal is current income. To pursue these goals, the fund normally invests atleast 80% of its assets in common stocks. The fund focuses on blue-chip companies withtotal market capitalizations of more than $5 billion at the time of purchase, includingmultinational companies. These are established companies that have demonstratedsustained patterns of profitability, strong balance sheets, an expanding global presenceand the potential to achieve predictable, above-average earnings growth.
In choosing stocks, the fund first identifies economic sectors it believes will expandover the next three to five years or longer. Using fundamental analysis, the fund thenseeks companies within these sectors that have proven track records and dominantpositions in their industries. The fund employs a “buy-and-hold” investment strategy,which generally has resulted in an annual portfolio turnover of below 15%. A lowportfolio turnover rate helps reduce the fund’s trading costs and minimizes tax liabilityby limiting the distribution of capital gains.3

4
D I S C U S S I O N O F F U N D P E R F O R M A N C E (continued)
Improving Macroeconomic Conditions Fueled Market Gains
Several positive macroeconomic developments drove stocks higher during the firstquarter of 2012. These included strong corporate earnings reports, domestic employ-ment gains, and a quantitative easing program in Europe that forestalled a more severeregional banking crisis. However, investor sentiment turned more cautious during thespring, when the U.S. labor market’s rebound slowed and measures designed to relievefiscal pressures in Europe encountered resistance.
Stocks rebounded over the summer, reaching new highs for the year by Septemberamid more encouraging economic news, including sharp declines in the unem-ployment rate. The market lost ground again in November as concerns mountedover automatic tax hikes and spending cuts scheduled for the start of 2013.Nevertheless, continued corporate earnings strength and signs of an improvingU.S. housing market enabled stocks to resume their rally, and the S&P 500 Indexended the year with double-digit gains.
Sector Allocations Weighed on Results
Although the fund participated significantly in the market’s gains, its relative perfor-mance was undermined by an overweighted position in the energy sector, where asluggish global economy and a glut of domestic, shale-sourced oil and gas pressuredlarge, integrated energy producers. Underweighted exposure to the financials sectorhelped support returns in previous years, but it prevented the fund from benefitingwhen major banks rallied from depressed levels.
The fund also was hindered by some disappointments among individual stocks.Brazilian casual dining franchisee Arcos Dorados Holdings, Cl. A struggled in a slowerlocal economy. Occidental Petroleum encountered weaker oil prices and problems atone of its oil fields. Fast food giant McDonald’s was hurt by lower same-store salescomparisons and weakness in Europe.
The fund achieved better results in other areas. The fund held no stocks in the laggingutilities sector. Among the fund’s information technology holdings, electronics innovatorApple continued to score impressive success with its tablet computer and smartphoneproducts. Consumer discretionary holding Christian Dior benefited from risingdemand for luxury goods in the recovering global economy. Media conglomerateNews Corp., Class A, gained value amid increased advertising spending and plans tounlock value by splitting the company in two.

T h e F u n d 5
We made a number of changes to the fund’s composition in 2012, adding new positionsin global spirits maker Diageo, brewer SAPMiller, Norwegian oil producer Statoil, andtechnology firm Xilinx. We eliminated only one holding, Green Mountain Coffee,during the year.
Stocks May Be Poised for Additional Gains
Aggressively accommodative monetary policies among the world’s central banksand continued signs of improvement in the U.S. and global economies underlie ourgenerally optimistic outlook for equities in 2013. We expect corporate earnings anddividends to continue to grow over the coming year, but at a lower rate than in2012. Meanwhile, valuations across most sectors remain attractive even in the wakeof recent market rallies, and persistently low interest rates may continue to attractinvestors to dividend-paying stocks. Therefore, we have maintained our focus onhigh quality, multinational companies with strong balance sheets, dominant brands,and above-average earnings and dividend growth characteristics.
January 15, 2013
Equity funds are subject generally to market, market sector, market liquidity, issuer, and investment style risks, amongother factors, to varying degrees, all of which are more fully described in the fund’s prospectus.
Fund shares are only available as a funding vehicle under variable life insurance policies or variable annuity contractsissued by insurance companies. Individuals may not purchase shares of the fund directly. A variable annuity is aninsurance contract issued by an insurance company that enables investors to accumulate assets on a tax-deferred basisfor retirement or other long-term goals. The investment objective and policies of Dreyfus Variable Investment Fund,Appreciation Portfolio made available through insurance products may be similar to other funds managed by Dreyfus.However, the investment results of the fund may be higher or lower than, and may not be comparable to, those of anyother Dreyfus fund.
1 Total return includes reinvestment of dividends and any capital gains paid. Past performance is no guarantee of futureresults. Share price and investment return fluctuate such that upon redemption fund shares may be worth more or lessthan their original cost. The fund’s performance does not reflect the deduction of additional charges and expensesimposed in connection with investing in variable insurance contracts, which will reduce returns.
2 SOURCE: LIPPER INC. — Reflects monthly reinvestment of dividends and, where applicable, capital gaindistributions. The Standard & Poor’s 500 Composite Stock Price Index is a widely accepted, unmanaged index ofU.S. stock market performance. Investors cannot invest directly in any index.
3 Achieving tax efficiency is not a part of the fund’s investment objective, and there can be no guarantee that the fundwill achieve any particular level of taxable distributions in future years. In periods when the manager has to sellsignificant amounts of securities (e.g., during periods of significant net redemptions or changes in index components)funds can be expected to be less tax efficient than during periods of more stable market conditions and asset flows.

10,000
12,000
14,000
16,000
18,000
20,000
Do
llars
Years Ended 12/31
02 03 04 05 06 07 08 09 10 11 12
Dreyfus Variable Investment Fund, Appreciation Portfolio (Initial shares)
Dreyfus Variable Investment Fund, Appreciation Portfolio (Service shares)
Standard & Poor’s 500 Composite Stock Price Index†
$19,871
$19,850
$19,375
6
F U N D P E R F O R M A N C E
Comparison of change in value of $10,000 investment in Dreyfus Variable Investment Fund,Appreciation Portfolio Initial shares and Service shares and the Standard & Poor’s 500Composite Stock Price Index
Average Annual Total Returns as of 12/31/12
1 Year 5 Years 10 Years
Initial shares 10.44% 3.69% 7.11%
Service shares 10.14% 3.43% 6.84%
Standard & Poor’s 500 Composite Stock Price Index 15.99% 1.66% 7.10%
† Source: Lipper Inc.Past performance is not predictive of future performance. The fund’s performance shown in the graph and table does notreflect the deduction of taxes that a shareholder would pay on fund distributions or the redemption of fund shares.The fund’s performance does not reflect the deduction of additional charges and expenses imposed in connectionwith investing in variable insurance contracts which will reduce returns.The above graph compares a $10,000 investment made in Initial and Service shares of Dreyfus Variable InvestmentFund, Appreciation Portfolio on 12/31/02 to a $10,000 investment made in the Standard & Poor’s 500 CompositeStock Price Index (the “Index”) on that date.

T h e F u n d 7
The fund’s Initial shares are not subject to a Rule 12b-1 fee. The fund’s Service shares are subject to a 0.25% annualRule 12b-1 fee. All dividends and capital gain distributions are reinvested.The fund’s performance shown in the line graph above takes into account all applicable fund fees and expenses for Initialand Service shares. The Index is a widely accepted, unmanaged index of U.S. stock market performance. Unlike a mutualfund, the Index is not subject to charges, fees and other expenses. Investors cannot invest directly in any index. Furtherinformation relating to fund performance, including expense reimbursements, if applicable, is contained in the FinancialHighlights section of the prospectus and elsewhere in this report.

8
Expenses and Value of a $1,000 Investmentassuming actual returns for the six months ended December 31, 2012
Initial Shares Service Shares
Expenses paid per $1,000† $ 4.13 $ 5.40
Ending value (after expenses) $1,030.00 $1,028.40
U N D E R S TA N D I N G YO U R F U N D ’ S E X P E N S E S ( U n a u d i t e d )
As a mutual fund investor, you pay ongoing expenses, such as management fees and other expenses.Using the information below, you can estimate how these expenses affect your investment and comparethem with the expenses of other funds. You also may pay one-time transaction expenses, including salescharges (loads), redemption fees and expenses associated with variable annuity or insurance contracts,which are not shown in this section and would have resulted in higher total expenses. For moreinformation, see your fund’s prospectus or talk to your financial adviser.
Review your fund’s expenses
The table below shows the expenses you would have paid on a $1,000 investment in DreyfusVariable Investment Fund, Appreciation Portfolio from July 1, 2012 to December 31, 2012.It also shows how much a $1,000 investment would be worth at the close of the period,assuming actual returns and expenses.
Expenses and Value of a $1,000 Investmentassuming a hypothetical 5% annualized return for the six months ended December 31, 2012
Initial Shares Service Shares
Expenses paid per $1,000† $ 4.12 $ 5.38
Ending value (after expenses) $1,021.06 $1,019.81
C O M P A R I N G Y O U R F U N D ’ S E X P E N S E S W I T H T H O S E O F O T H E R F U N D S ( U n a u d i t e d )
Using the SEC’s method to compare expenses
The Securities and Exchange Commission (SEC) has established guidelines to helpinvestors assess fund expenses. Per these guidelines, the table below shows your fund’sexpenses based on a $1,000 investment, assuming a hypothetical 5% annualized return.You can use this information to compare the ongoing expenses (but not transactionexpenses or total cost) of investing in the fund with those of other funds. All mutual fundshareholder reports will provide this information to help you make this comparison.Please note that you cannot use this information to estimate your actual ending accountbalance and expenses paid during the period.
† Expenses are equal to the fund’s annualized expense ratio of .81% for Initial Shares and 1.06% for Service Shares,multiplied by the average account value over the period, multiplied by 184/366 (to reflect the one-half year period).

T h e F u n d 9
Common Stocks—98.8% Shares Value ($)
Capital Goods—3.5%
Caterpillar 94,400 8,456,352
General Electric 194,800 4,088,852
United Technologies 89,000 7,298,890
19,844,094
Consumer Services—3.3%
Arcos Dorados Holdings, Cl. A 125,000 a 1,495,000
McDonald’s 195,900 17,280,339
18,775,339
Diversified Financials—4.1%
BlackRock 31,000 6,408,010
Franklin Resources 41,000 5,153,700
JPMorgan Chase & Co. 267,300 11,753,181
23,314,891
Energy—19.5%
Chevron 210,900 22,806,726
ConocoPhillips 165,100 9,574,149
Exxon Mobil 328,364 28,419,904
Imperial Oil 100,000 4,300,000
Occidental Petroleum 163,100 12,495,091
Phillips 66 92,550 4,914,405
Royal Dutch Shell, Cl. A, ADR 197,500 13,617,625
Statoil, ADR 145,000 3,630,800
Total, ADR 204,400 a 10,630,844
110,389,544
Food & Staples Retailing—1.6%
Walgreen 134,300 4,970,443
Whole Foods Market 45,100 4,118,983
9,089,426
Food, Beverage & Tobacco—23.4%
Altria Group 476,100 14,959,062
Coca-Cola 921,200 33,393,500
Diageo, ADR 25,000 2,914,500
Kraft Foods Group 56,666 2,576,603
S TAT E M E N T O F I N V E S T M E N T SD e c e m b e r 3 1 , 2 0 1 2

S TAT E M E N T O F I N V E S T M E N T S (continued)
Food, Beverage & Tobacco (continued)
Mondelez International, Cl. A 170,000 4,329,900
Nestle, ADR 317,400 20,684,958
PepsiCo 142,900 9,778,647
Philip Morris International 456,100 38,148,204
SABMiller 120,000 5,648,197
132,433,571
Health Care Equipment & Services—1.5%
Intuitive Surgical 12,000 b 5,884,440
Medtronic 60,200 2,469,404
8,353,844
Household & Personal Products—6.5%
Christian Dior 66,100 11,427,794
Estee Lauder, Cl. A 133,400 7,985,324
Procter & Gamble 255,000 17,311,950
36,725,068
Materials—4.4%
Air Products & Chemicals 20,000 1,680,400
Freeport-McMoRan Copper & Gold 200,000 6,840,000
Praxair 95,200 10,419,640
Rio Tinto, ADR 100,000 a 5,809,000
24,749,040
Media—4.2%
McGraw-Hill 107,100 5,855,157
News, Cl. A 283,136 7,231,294
Time Warner Cable 50,000 4,859,500
Walt Disney 120,000 5,974,800
23,920,751
Pharmaceuticals, Biotech & Life Sciences—8.6%
Abbott Laboratories 191,800 12,562,900
Johnson & Johnson 212,900 14,924,290
10
Common Stocks (continued) Shares Value ($)

Pharmaceuticals, Biotech & Life Sciences (continued)
Merck & Co. 63,200 2,587,408
Novo Nordisk, ADR 56,300 9,188,723
Roche Holding, ADR 185,700 9,377,850
48,641,171
Retailing—4.0%
Target 189,700 11,224,549
Wal-Mart Stores 171,600 11,708,268
22,932,817
Semiconductors & Semiconductor Equipment—3.4%
Intel 592,900 12,231,527
Texas Instruments 213,300 6,599,502
Xilinx 20,000 718,000
19,549,029
Software & Services—3.7%
Automatic Data Processing 100,400 5,723,804
International Business Machines 80,000 15,324,000
21,047,804
Technology Hardware & Equipment—7.1%
Apple 68,000 36,246,040
QUALCOMM 62,800 3,894,856
40,140,896
Total Common Stocks (cost $334,022,172) 559,907,285
Other Investment—.7%
Registered Investment Company;
Dreyfus Institutional Preferred Plus Money Market Fund (cost $3,916,352) 3,916,352 c 3,916,352
T h e F u n d 11
Common Stocks (continued) Shares Value ($)

S TAT E M E N T O F I N V E S T M E N T S (continued)
Registered Investment Company;
Dreyfus Institutional Cash Advantage Fund (cost $13,512,311) 13,512,311 c 13,512,311
Total Investments (cost $351,450,835) 101.9% 577,335,948
Liabilities, Less Cash and Receivables (1.9%) (10,782,495)
Net Assets 100.0% 566,553,453
12
Investment of Cash Collateral for Securities Loaned—2.4% Shares Value ($)
ADR—American Depository Receiptsa Security, or portion thereof, on loan. At December 31, 2012, the value of the fund’s securities on loan was
$13,338,021 and the value of the collateral held by the fund was $13,512,311.b Non-income producing security.c Investment in affiliated money market mutual fund.
Portfolio Summary (Unaudited)†
Value (%) Value (%)
Food, Beverage & Tobacco 23.4Energy 19.5Pharmaceuticals, Biotech & Life Sciences 8.6Technology Hardware & Equipment 7.1Household & Personal Products 6.5Materials 4.4Media 4.2Diversified Financials 4.1Retailing 4.0
Software & Services 3.7Capital Goods 3.5Semiconductors & Semiconductor Equipment 3.4Consumer Services 3.3Money Market Investments 3.1Food & Staples Retailing 1.6Health Care Equipment & Services 1.5
101.9
† Based on net assets.See notes to financial statements.

Cost Value
Assets ($):
Investments in securities—See Statement of Investments (including securities on loan, valued at $13,338,021)—Note 1(c): Unaffiliated issuers 334,022,172 559,907,285 Affiliated issuers 17,428,663 17,428,663
Cash 2,340,097
Dividends and securities lending income receivable 1,130,449
Prepaid expenses 31,014
580,837,508
Liabilities ($):
Due to The Dreyfus Corporation and affiliates—Note 3(b) 323,086
Due to Fayez Sarofim & Co. 104,248
Liability for securities on loan—Note 1(c) 13,512,311
Payable for shares of Beneficial Interest redeemed 304,098
Accrued expenses 40,312
14,284,055
Net Assets ($) 566,553,453
Composition of Net Assets ($):
Paid-in capital 339,985,268
Accumulated undistributed investment income—net 161,768
Accumulated net realized gain (loss) on investments 521,304
Accumulated net unrealized appreciation (depreciation) on investments 225,885,113
Net Assets ($) 566,553,453
S TAT E M E N T O F A S S E T S A N D L I A B I L I T I E SD e c e m b e r 3 1 , 2 0 1 2
See notes to financial statements.
T h e F u n d 13
Net Asset Value Per Share Initial Shares Service Shares
Net Assets ($) 345,985,202 220,568,251
Shares Outstanding 8,549,560 5,479,334
Net Asset Value Per Share ($) 40.47 40.25

Investment Income ($):Income:
Cash dividends (net of $443,439 foreign taxes withheld at source): Unaffiliated issuers 15,548,322 Affiliated issuers 6,081
Income from securities lending—Note 1(c) 120,724
Total Income 15,675,127
Expenses:
Investment advisory fee—Note 3(a) 2,943,952
Sub-investment advisory fee—Note 3(a) 1,202,460
Distribution fees—Note 3(b) 494,859
Professional fees 97,548
Prospectus and shareholders’ reports 76,874
Trustees’ fees and expenses—Note 3(c) 42,840
Custodian fees—Note 3(b) 41,412
Shareholder servicing costs—Note 3(b) 8,911
Loan commitment fees—Note 2 4,655
Interest expense—Note 2 2,093
Miscellaneous 45,005
Total Expenses 4,960,609
Less—reduction in fees due to earnings credits—Note 3(b) (10)
Net Expenses 4,960,599
Investment Income—Net 10,714,528
Realized and Unrealized Gain (Loss) on Investments—Note 4 ($):Net realized gain (loss) on investments and foreign currency transactions 3,173,613
Net unrealized appreciation (depreciation) on investments 39,110,502
Net Realized and Unrealized Gain (Loss) on Investments 42,284,115
Net Increase in Net Assets Resulting from Operations 52,998,643
S TAT E M E N T O F O P E R AT I O N SYe a r E n d e d D e c e m b e r 3 1 , 2 0 1 2
14
See notes to financial statements.

S TAT E M E N T O F C H A N G E S I N N E T A S S E T S
T h e F u n d 15
Year Ended December 31,
2012 2011
Operations ($):
Investment income—net 10,714,528 8,849,225
Net realized gain (loss) on investments 3,173,613 (368,068)
Net unrealized appreciation (depreciation) on investments 39,110,502 31,468,680
Net Increase (Decrease) in Net Assets Resulting from Operations 52,998,643 39,949,837
Dividends to Shareholders from ($):
Investment income—net:
Initial Shares (12,974,543) (5,339,622)
Service Shares (6,423,266) (2,014,556)
Total Dividends (19,397,809) (7,354,178)
Beneficial Interest Transactions ($):
Net proceeds from shares sold:
Initial Shares 55,289,006 46,939,033
Service Shares 75,211,364 64,879,366
Dividends reinvested:
Initial Shares 12,974,543 5,339,622
Service Shares 6,423,266 2,014,556
Cost of shares redeemed:
Initial Shares (70,383,596) (58,474,591)
Service Shares (47,166,478) (28,370,572)
Increase (Decrease) in Net Assets from Beneficial Interest Transactions 32,348,105 32,327,414
Total Increase (Decrease) in Net Assets 65,948,939 64,923,073
Net Assets ($):
Beginning of Period 500,604,514 435,681,441
End of Period 566,553,453 500,604,514
Undistributed investment income—net 161,768 8,843,223

Year Ended December 31,
2012 2011
Capital Share Transactions:
Initial Shares
Shares sold 1,377,683 1,285,530
Shares issued for dividends reinvested 319,206 147,422
Shares redeemed (1,739,175) (1,599,685)
Net Increase (Decrease) in Shares Outstanding (42,286) (166,733)
Service Shares
Shares sold 1,876,463 1,791,766
Shares issued for dividends reinvested 158,878 55,897
Shares redeemed (1,171,311) (789,159)
Net Increase (Decrease) in Shares Outstanding 864,030 1,058,504
See notes to financial statements.
16
S TAT E M E N T O F C H A N G E S I N N E T A S S E T S (continued)

T h e F u n d 17
Year Ended December 31,
Initial Shares 2012 2011 2010 2009 2008
Per Share Data ($):
Net asset value, beginning of period 37.99 35.44 31.40 28.88 44.86
Investment Operations:
Investment income—neta .82 .73 .64 .63 .67
Net realized and unrealized gain (loss) on investments 3.14 2.42 4.09 4.95 (13.01)
Total from Investment Operations 3.96 3.15 4.73 5.58 (12.34)
Distributions:
Dividends from investment income—net (1.48) (.60) (.69) (.78) (.77)
Dividends from net realized gain on investments — — — (2.28) (2.87)
Total Distributions (1.48) (.60) (.69) (3.06) (3.64)
Net asset value, end of period 40.47 37.99 35.44 31.40 28.88
Total Return (%) 10.44 9.01 15.32 22.56 (29.55)
Ratios/Supplemental Data (%):
Ratio of total expenses to average net assets .81 .80 .81 .80 .81
Ratio of net expenses to average net assets .81 .80 .81 .80 .81
Ratio of net investment income to average net assets 2.02 1.99 2.01 2.31 1.82
Portfolio Turnover Rate 3.05 4.24 11.90 1.49 3.41
Net Assets, end of period ($ x 1,000) 345,985 326,445 310,385 290,073 274,782
F I N A N C I A L H I G H L I G H T S
The following tables describe the performance for each share class for the fiscalperiods indicated. All information (except portfolio turnover rate) reflects financialresults for a single fund share. Total return shows how much your investment in thefund would have increased (or decreased) during each period, assuming you hadreinvested all dividends and distributions. The fund’s total returns do not reflectexpenses associated with variable annuity or insurance contracts. These figures havebeen derived from the fund’s financial statements.
a Based on average shares outstanding at each month end.See notes to financial statements.

F I N A N C I A L H I G H L I G H T S (continued)
Year Ended December 31,
Service Shares 2012 2011 2010 2009 2008
Per Share Data ($):
Net asset value, beginning of period 37.74 35.23 31.21 28.70 44.59
Investment Operations:
Investment income—neta .72 .63 .58 .59 .58
Net realized and unrealized gain (loss) on investments 3.10 2.42 4.05 4.89 (12.94)
Total from Investment Operations 3.82 3.05 4.63 5.48 (12.36)
Distributions:
Dividends from investment income—net (1.31) (.54) (.61) (.69) (.66)
Dividends from net realized gain on investments — — — (2.28) (2.87)
Total Distributions (1.31) (.54) (.61) (2.97) (3.53)
Net asset value, end of period 40.25 37.74 35.23 31.21 28.70
Total Return (%) 10.14 8.74 15.04 22.23 (29.72)
Ratios/Supplemental Data (%):
Ratio of total expenses to average net assets 1.06 1.05 1.06 1.05 1.06
Ratio of net expenses to average net assets 1.06 1.05 1.06 1.05 1.06
Ratio of net investment income to average net assets 1.79 1.75 1.74 2.15 1.61
Portfolio Turnover Rate 3.05 4.24 11.90 1.49 3.41
Net Assets, end of period ($ x 1,000) 220,568 174,160 125,296 71,893 88,606
18
a Based on average shares outstanding at each month end.See notes to financial statements.

NOTE 1—Significant Accounting Policies:
Dreyfus Variable Investment Fund (the “Company”) is registeredunder the Investment Company Act of 1940, as amended (the “Act”),as an open-end management investment company, operating as a seriescompany currently offering seven series, including the AppreciationPortfolio (the “fund”). The fund is only offered to separate accountsestablished by insurance companies to fund variable annuity contractsand variable life insurance policies. The fund is a diversified series. Thefund’s investment objective is to seek long-term capital growth con-sistent with the preservation of capital. The Dreyfus Corporation (the“Manager” or “Dreyfus”), a wholly-owned subsidiary of The Bank ofNew York Mellon Corporation (“BNY Mellon”), serves as the fund’sinvestment adviser. Fayez Sarofim & Co. (“Sarofim & Co.”) serves asthe fund’s sub-investment adviser.
MBSC Securities Corporation (the “Distributor”), a wholly-ownedsubsidiary of Dreyfus, is the distributor of the fund’s shares, which aresold without a sales charge. The fund is authorized to issue an unlim-ited number of $.001 par value shares of Beneficial Interest in each ofthe following classes of shares: Initial and Service. Each class of shareshas identical rights and privileges, except with respect to theDistribution Plan and the expenses borne by each class, the allocationof certain transfer agency costs and certain voting rights. Income,expenses (other than expenses attributable to a specific class), and real-ized and unrealized gains or losses on investments are allocated to eachclass of shares based on its relative net assets.
The Company accounts separately for the assets, liabilities and opera-tions of each series. Expenses directly attributable to each series arecharged to that series’ operations; expenses which are applicable to allseries are allocated among them on a pro rata basis.
The Financial Accounting Standards Board (“FASB”) AccountingStandards Codification is the exclusive reference of authoritative U.S.generally accepted accounting principles (“GAAP”) recognized by theFASB to be applied by nongovernmental entities. Rules and interpretive
T h e F u n d 19
N O T E S T O F I N A N C I A L S TAT E M E N T S

releases of the Securities and Exchange Commission (“SEC”) underauthority of federal laws are also sources of authoritative GAAP for SECregistrants. The fund’s financial statements are prepared in accordancewith GAAP, which may require the use of management estimates andassumptions. Actual results could differ from those estimates.
The Company enters into contracts that contain a variety of indem-nifications. The fund’s maximum exposure under these arrangementsis unknown. The fund does not anticipate recognizing any loss relatedto these arrangements.
(a) Portfolio valuation: The fair value of a financial instrument is theamount that would be received to sell an asset or paid to transfer a lia-bility in an orderly transaction between market participants at themeasurement date (i.e., the exit price). GAAP establishes a fair valuehierarchy that prioritizes the inputs of valuation techniques used tomeasure fair value. This hierarchy gives the highest priority to unad-justed quoted prices in active markets for identical assets or liabilities(Level 1 measurements) and the lowest priority to unobservable inputs(Level 3 measurements).
Additionally, GAAP provides guidance on determining whether thevolume and activity in a market has decreased significantly andwhether such a decrease in activity results in transactions that are notorderly. GAAP requires enhanced disclosures around valuation inputsand techniques used during annual and interim periods.
Various inputs are used in determining the value of the fund’s invest-ments relating to fair value measurements. These inputs are summarizedin the three broad levels listed below:
Level 1—unadjusted quoted prices in active markets for identical investments.
Level 2—other significant observable inputs (including quotedprices for similar investments, interest rates, prepayment speeds,credit risk, etc.).
Level 3—significant unobservable inputs (including the fund’sown assumptions in determining the fair value of investments).
20
N O T E S T O F I N A N C I A L S TAT E M E N T S (continued)

The inputs or methodology used for valuing securities are not necessar-ily an indication of the risk associated with investing in those securities.
Changes in valuation techniques may result in transfers in or out of anassigned level within the disclosure hierarchy. Valuation techniquesused to value the fund’s investments are as follows:
Investments in securities are valued at the last sales price on the securi-ties exchange or national securities market on which such securities areprimarily traded. Securities listed on the National Market System forwhich market quotations are available are valued at the official closingprice or, if there is no official closing price that day, at the last sales price.Securities not listed on an exchange or the national securities market,or securities for which there were no transactions, are valued at theaverage of the most recent bid and asked prices, except for open shortpositions, where the asked price is used for valuation purposes. Bidprice is used when no asked price is available. Registered investmentcompanies that are not traded on an exchange are valued at their netasset value. All of the preceding securities are categorized within Level1 of the fair value hierarchy.
Fair valuing of securities may be determined with the assistance of apricing service using calculations based on indices of domestic securi-ties and other appropriate indicators, such as prices of relevant ADRsand financial futures. Utilizing these techniques may result in transfersbetween Level 1 and Level 2 of the fair value hierarchy.
When market quotations or official closing prices are not readily avail-able, or are determined not to reflect accurately fair value, such as whenthe value of a security has been significantly affected by events after theclose of the exchange or market on which the security is principallytraded (for example, a foreign exchange or market), but before the fundcalculates its net asset value, the fund may value these investments at fairvalue as determined in accordance with the procedures approved by theCompany’s Board of Trustees (the “Board”). Certain factors may beconsidered when fair valuing investments such as: fundamental analytical
T h e F u n d 21

data, the nature and duration of restrictions on disposition, an evaluationof the forces that influence the market in which the securities are pur-chased and sold, and public trading in similar securities of the issuer orcomparable issuers. These securities are either categorized within Level2 or 3 depending on the relevant inputs used.
For restricted securities where observable inputs are limited, assump-tions about market activity and risk are used and are categorizedwithin Level 3 of the fair value hierarchy.
Investments denominated in foreign currencies are translated to U.S.dollars at the prevailing rates of exchange.
The following is a summary of the inputs used as of December 31,2012 in valuing the fund’s investments:
Level 2—Other Level 3—
Level 1— Significant Significant
Unadjusted Observable Unobservable
Quoted Prices Inputs Inputs Total
Assets ($)
Investments in Securities:
Equity Securities— Domestic Common Stocks† 461,181,994 — — 461,181,994
Equity Securities— Foreign Common Stocks† 81,649,300 17,075,991†† — 98,725,291
Mutual Funds 17,428,663 — — 17,428,663
† See Statement of Investments for additional detailed categorizations.†† Securities classified as Level 2 at period end as the values were determined pursuant to the fund’s
fair valuation procedures.
At December 31, 2011, no exchange traded foreign equity securitieswere classified within Level 2 of the fair value hierarchy.
(b) Foreign currency transactions:The fund does not isolate that por-tion of the results of operations resulting from changes in foreignexchange rates on investments from the fluctuations arising from changesin the market prices of securities held. Such fluctuations are includedwith the net realized and unrealized gain or loss on investments.
22
N O T E S T O F I N A N C I A L S TAT E M E N T S (continued)

Net realized foreign exchange gains or losses arise from sales of foreigncurrencies, currency gains or losses realized on securities transactionsbetween trade and settlement date, and the difference between theamounts of dividends, interest and foreign withholding taxes recordedon the fund’s books and the U.S. dollar equivalent of the amountsactually received or paid. Net unrealized foreign exchange gains andlosses arise from changes in the value of assets and liabilities other thaninvestments resulting from changes in exchange rates. Foreign currencygains and losses on investments are also included with net realized andunrealized gain or loss on investments.
(c) Securities transactions and investment income: Securities trans-actions are recorded on a trade date basis. Realized gains and lossesfrom securities transactions are recorded on the identified cost basis.Dividend income is recognized on the ex-dividend date and interestincome, including, where applicable, accretion of discount and amor-tization of premium on investments, is recognized on the accrual basis.
Pursuant to a securities lending agreement with The Bank of NewYork Mellon, a subsidiary of BNY Mellon and an affiliate of Dreyfus,the fund may lend securities to qualified institutions. It is the fund’spolicy that, at origination, all loans are secured by collateral of at least102% of the value of U.S. securities loaned and 105% of the value offoreign securities loaned. Collateral equivalent to at least 100% of themarket value of securities on loan is maintained at all times. Collateralis either in the form of cash, which can be invested in certain moneymarket mutual funds managed by Dreyfus, U.S. Government andAgency securities or letters of credit. The fund is entitled to receive allincome on securities loaned, in addition to income earned as a resultof the lending transaction. Although each security loaned is fullycollateralized, the fund bears the risk of delay in recovery of, or loss ofrights in, the securities loaned should a borrower fail to return thesecurities in a timely manner. During the period ended December 31,2012, The Bank of New York Mellon earned $51,739 from lendingportfolio securities, pursuant to the securities lending agreement.
T h e F u n d 23

(d) Affiliated issuers: Investments in other investment companiesadvised by Dreyfus are defined as “affiliated” in the Act. Investmentsin affiliated investment companies for the period ended December 31,2012 were as follows:
Affiliated Investment Value Value Net Company 12/31/2011 ($) Purchases ($) Sales ($) 12/31/2012 ($) Assets (%)
Dreyfus Institutional Preferred Plus Money Market Fund 7,593,542 65,607,460 69,284,650 3,916,352 .7
Dreyfus Institutional Cash Advantage Fund 2,642,191 253,085,249 242,215,129 13,512,311 2.4
Total 10,235,733 318,692,709 311,499,779 17,428,663 3.1
(e) Dividends to shareholders: Dividends are recorded on the ex-dividend date. Effective March 31, 2012, dividends from investmentincome-net are declared and paid quarterly. Prior to March 31, 2012,dividends from investment income-net were declared and paid annually.Dividends from net realized capital gains, if any, are normally declaredand paid annually, but the fund may make distributions on a more fre-quent basis to comply with the distribution requirements of the InternalRevenue Code of 1986, as amended (the “Code”). To the extent thatnet realized capital gains can be offset by capital loss carryovers, it is thepolicy of the fund not to distribute such gains. Income and capital gaindistributions are determined in accordance with income tax regulations,which may differ from GAAP.
(f) Federal income taxes: It is the policy of the fund to continue toqualify as a regulated investment company, if such qualification is in thebest interests of its shareholders, by complying with the applicable pro-visions of the Code, and to make distributions of taxable income suffi-cient to relieve it from substantially all federal income and excise taxes.
24
N O T E S T O F I N A N C I A L S TAT E M E N T S (continued)

As of and during the period ended December 31, 2012, the fund didnot have any liabilities for any uncertain tax positions. The fund rec-ognizes interest and penalties, if any, related to uncertain tax positionsas income tax expense in the Statement of Operations. During theperiod, the fund did not incur any interest or penalties.
Each of the tax years in the four-year period ended December 31,2012 remains subject to examination by the Internal Revenue Serviceand state taxing authorities.
At December 31, 2012, the components of accumulated earnings ona tax basis were as follows: undistributed ordinary income $161,768,undistributed capital gains $1,413,409 and unrealized appreciation$224,993,008.
The tax character of distributions paid to shareholders during the fiscalperiods ended December 31,2012 and December 31, 2011 were asfollows: ordinary income $19,397,809 and $7,354,178, respectively.
During the period ended December 31, 2012, as a result of perma-nent book to tax differences, primarily due to the tax treatment forforeign currency exchange gains and losses, the fund increasedaccumulated undistributed investment income-net by $1,826 anddecreased accumulated net realized gain (loss) on investments by thesame amount. Net assets and net asset value per share were notaffected by this reclassification.
NOTE 2—Bank Lines of Credit:
The fund participates with other Dreyfus-managed funds in a $210million unsecured credit facility led by Citibank, N.A. and a $300 mil-lion unsecured credit facility provided by The Bank of New YorkMellon (each, a “Facility”), each to be utilized primarily for temporaryor emergency purposes, including the financing of redemptions. Priorto October 10, 2012, the unsecured credit facility with Citibank, N.A.,
T h e F u n d 25

was $225 million. In connection therewith, the fund has agreed to payits pro rata portion of commitment fees for each Facility. Interest ischarged to the fund based on rates determined pursuant to the termsof the respective Facility at the time of borrowing.
The average amount of borrowings outstanding under the Facilities dur-ing the period ended December 31, 2012 was approximately $177,300,with a related weighted average annualized interest rate of 1.18%.
NOTE 3—Investment Advisory Fee, Sub-Investment AdvisoryFee and Other Transactions With Affiliates:
(a) Pursuant to an investment advisory agreement with Dreyfus, theinvestment advisory fee is computed at the annual rate of .5325% ofthe value of the fund’s average daily net assets. Pursuant to a sub-investment advisory agreement with Sarofim & Co., the fund paysSarofim & Co. a monthly sub-investment advisory fee at the annualrate of .2175% of the value of the fund’s average daily net assets. Bothfees are payable monthly.
(b) Under the Distribution Plan adopted pursuant to Rule 12b-1under the Act, Service shares pay the Distributor for distributing itsshares, for servicing and/or maintaining Service shares’ shareholderaccounts and for advertising and marketing for Service shares. TheDistribution Plan provides for payments to be made at an annual rateof .25% of the value of the Service shares’ average daily net assets. TheDistributor may make payments to Participating Insurance Companiesand to brokers and dealers acting as principal underwriter for theirvariable insurance products. The fees payable under the DistributionPlan are payable without regard to actual expenses incurred. Duringthe period ended December 31, 2012, Service shares were charged$494,859 pursuant to the Distribution Plan.
The fund has arrangements with the transfer agent and the custodianwhereby the fund may receive earnings credits when positive cash
26
N O T E S T O F I N A N C I A L S TAT E M E N T S (continued)

balances are maintained, which are used to offset transfer agency andcustody fees. For financial reporting purposes, the fund includes netearnings credits as an expense offset in the Statement of Operations.
The fund compensates Dreyfus Transfer, Inc., a wholly-owned subsidiaryof Dreyfus, under a transfer agency agreement for providing transferagency services for the fund and, since May 29, 2012, cash managementservices related to fund subscriptions and redemptions. During the periodended December 31, 2012, the fund was charged $1,577 for transferagency services and $47 for cash management services. Cash manage-ment fees were partially offset by earnings credits of $6. These fees areincluded in Shareholder servicing costs in the Statement of Operations.
The fund compensates The Bank of New York Mellon under a cus-tody agreement for providing custodial services for the fund. Duringthe period ended December 31, 2012, the fund was charged $41,412pursuant to the custody agreement.
Prior to May 29, 2012, the fund compensated The Bank of New YorkMellon under a cash management agreement for performing cashmanagement services related to fund subscriptions and redemptions.During the period ended December 31, 2012, the fund was charged$109 pursuant to the cash management agreement, which is includedin Shareholder servicing costs in the Statement of Operations. Thesefees were partially offset by earnings credits of $4.
During the period ended December 31, 2012, the fund was charged$8,783 for services performed by the Chief Compliance Officer andhis staff.
The components of “Due to The Dreyfus Corporation and affiliates”in the Statement of Assets and Liabilities consist of: investment advisoryfees $255,229, Distribution Plan fees $45,947, custodian fees $17,500,Chief Compliance Officer fees $3,981 and transfer agency fees $429.
T h e F u n d 27

(c) Each Board member also serves as a Board member of other fundswithin the Dreyfus complex. Annual retainer fees and attendance feesare allocated to each fund based on net assets.
NOTE 4—Securities Transactions:
The aggregate amount of purchases and sales of investment securities,excluding short-term securities, during the period ended December 31,2012, amounted to $43,269,216 and $16,623,891, respectively.
At December 31, 2012, the cost of investments for federal incometax purposes was $352,342,940; accordingly, accumulated net unre-alized appreciation on investments was $224,993,008, consisting of$233,534,632 gross unrealized appreciation and $8,541,624 grossunrealized depreciation.
28
N O T E S T O F I N A N C I A L S TAT E M E N T S (continued)
Shareholders and Board of Trustees Dreyfus Variable Investment Fund, Appreciation Portfolio
We have audited the accompanying statement of assets and liabilities,including the statement of investments, of Dreyfus Variable InvestmentFund, Appreciation Portfolio (one of the series comprising DreyfusVariable Investment Fund) as of December 31, 2012, and the relatedstatement of operations for the year then ended, the statement of changesin net assets for each of the two years in the period then ended, and thefinancial highlights for each of the five years in the period then ended.These financial statements and financial highlights are the responsibilityof the Fund’s management. Our responsibility is to express an opinion onthese financial statements and financial highlights based on our audits.We conducted our audits in accordance with the standards of the PublicCompany Accounting Oversight Board (United States). Those standardsrequire that we plan and perform the audit to obtain reasonable assur-ance about whether the financial statements and financial highlights arefree of material misstatement. We were not engaged to perform anaudit of the Fund’s internal control over financial reporting. Our auditsincluded consideration of internal control over financial reporting as abasis for designing audit procedures that are appropriate in the circum-stances, but not for the purpose of expressing an opinion on theeffectiveness of the Fund’s internal control over financial reporting.Accordingly, we express no such opinion. An audit also includes exam-ining, on a test basis, evidence supporting the amounts and disclosures inthe financial statements and financial highlights, assessing the accountingprinciples used and significant estimates made by management, andevaluating the overall financial statement presentation. Our proceduresincluded confirmation of securities owned as of December 31, 2012 bycorrespondence with the custodian and others. We believe that ouraudits provide a reasonable basis for our opinion.In our opinion, the financial statements and financial highlights referredto above present fairly, in all material respects, the financial position ofDreyfus Variable Investment Fund, Appreciation Portfolio at December31, 2012, the results of its operations for the year then ended, the changesin its net assets for each of the two years in the period then ended, andthe financial highlights for each of the five years in the period then ended,in conformity with U.S. generally accepted accounting principles.
New York, New YorkFebruary 13, 2013
T h e F u n d 29
R E P O R T O F I N D E P E N D E N T R E G I S T E R E D P U B L I C A C C O U N T I N G F I R M

For federal tax purposes, the portfolio hereby reports 100% of theordinary dividends paid during the fiscal year ended December 31,2012 as qualifying for the corporate dividends received deduction.Shareholders will receive notification in early 2013 of the percentageapplicable to the preparation of their 2012 income tax returns.
30
I M P O R TA N T TA X I N F O R M AT I O N ( U n a u d i t e d )

T h e F u n d 31
P R O X Y R E S U LT S ( U n a u d i t e d )
The Company held a special meeting of shareholders on August 3, 2012.The proposalconsidered at the meeting, and the results, are as follows:
Shares
Votes For Authority Withheld
To elect additional Board Members:
Lynn Martin† 151,161,716 5,464,193
Robin A. Melvin† 151,549,664 5,076,245
Philip L. Toia† 150,421,381 6,204,528
† Each new Board Member’s term commenced on September 1, 2012.In addition, Peggy C. Davis, Joseph S. DiMartino, David P. Feldman, Ehud Houminer and Dr. Martin Peretz continueas Board Members of the Company.

32
B O A R D M E M B E R S I N F O R M AT I O N ( U n a u d i t e d )
Joseph S. DiMartino (69)Chairman of the Board (1995)
Principal Occupation During Past 5 Years:• Corporate Director and Trustee
Other Public Company Board Memberships During Past 5 Years:• CBIZ (formerly, Century Business Services, Inc.), a provider of outsourcing functions for small
and medium size companies, Director (1997-present)• Sunair Services Corporation, a provider of certain outdoor-related services to homes and
businesses, Director (2005-2009) • The Newark Group, a provider of a national market of paper recovery facilities, paperboard
mills and paperboard converting plants, Director (2000-2010)
No. of Portfolios for which Board Member Serves: 151
———————Peggy C. Davis (69)Board Member (2006)
Principal Occupation During Past 5 Years:• Shad Professor of Law, New York University School of Law (1983-present)
No. of Portfolios for which Board Member Serves: 63
———————David P. Feldman (73)Board Member (1994)
Principal Occupation During Past 5 Years:• Corporate Director and Trustee
Other Public Company Board Memberships During Past 5 Years:• BBH Mutual Funds Group (4 registered mutual funds), Director (1992-present)• QMed, Inc. a healthcare company, Director (1999-2007)
No. of Portfolios for which Board Member Serves: 46
———————Ehud Houminer (72)Board Member (2006)
Principal Occupation During Past 5 Years:• Executive-in-Residence at the Columbia Business School, Columbia University (1992-present)
Other Public Company Board Memberships During Past 5 Years:• Avnet Inc., an electronics distributor, Director (1993-2012)
No. of Portfolios for which Board Member Serves: 70

Lynn Martin (73)Board Member (2012)
Principal Occupation During Past 5 Years:• President of The Martin Hall Group LLC, a human resources consulting firm, from January
2005-present
Other Public Company Board Memberships During Past 5 Years:• AT&T Inc., a telecommunications company, Director (1999-2012)• Ryder System, Inc., a supply chain and transportation management company, Director (1993-2012)• The Proctor & Gamble Co., a consumer products company, Director (1994-2009)• Constellation Energy Group Inc., Director (2003-2009)
No. of Portfolios for which Board Member Serves: 46
———————Robin A. Melvin (49)Board Member (2012)
Principal Occupation During Past 5 Years:• Director, Boisi Family Foundation, a private family foundation that supports youth-serving orga-
nizations that promote the self sufficiency of youth from disadvantaged circumstances (1995-2012)
No. of Portfolios for which Board Member Serves: 97
———————Dr. Martin Peretz (73)Board Member (1990)
Principal Occupation During Past 5 Years:• Editor-in-Chief Emeritus of The New Republic Magazine (2010-present) (previously,
Editor-in-Chief, 1974-2010)• Director of TheStreet.com, a financial information service on the web (1996-present)
No. of Portfolios for which Board Member Serves: 46
———————Philip L. Toia (79)Board Member (2012)
Principal Occupation During Past 5 Years:• Private Investor
No. of Portfolios for which Board Member Serves: 56
———————Once elected all Board Members serve for an indefinite term, but achieve Emeritus status upon reaching age 80. Theaddress of the Board Members and Officers is c/o The Dreyfus Corporation, 200 Park Avenue, New York, New York10166. Additional information about the Board Members is available in the fund’s Statement of Additional Informationwhich can be obtained from Dreyfus free of charge by calling this toll free number: 1-800-DREYFUS.
James F. Henry, Emeritus Board MemberRosalind G. Jacobs, Emeritus Board MemberDr. Paul A. Marks, Emeritus Board MemberGloria Messinger, Emeritus Board Member
T h e F u n d 33

BRADLEY J. SKAPYAK, President sinceJanuary 2010.
Chief Operating Officer and a director of theManager since June 2009; from April 2003 toJune 2009, Mr. Skapyak was the head of theInvestment Accounting and SupportDepartment of the Manager. He is an officerof 69 investment companies (comprised of 150portfolios) managed by the Manager. He is 54years old and has been an employee of theManager since February 1988.
JANETTE E. FARRAGHER, Vice Presidentand Secretary since December 2011.
Assistant General Counsel of BNY Mellon,and an officer of 70 investment companies(comprised of 177 portfolios) managed by theManager. She is 50 years old and has been anemployee of the Manager since February 1984.
KIESHA ASTWOOD, Vice President andAssistant Secretary since January 2010.
Counsel of BNY Mellon, and an officer of 70investment companies (comprised of 177portfolios) managed by the Manager. She is 39years old and has been an employee of theManager since July 1995.
JAMES BITETTO, Vice President andAssistant Secretary since August 2005.
Senior Counsel of BNY Mellon and Secretaryof the Manager, and an officer of 70investment companies (comprised of 177portfolios) managed by the Manager. He is 46years old and has been an employee of theManager since December 1996.
JONI LACKS CHARATAN, Vice Presidentand Assistant Secretary since August 2005.
Senior Counsel of BNY Mellon, and an officerof 70 investment companies (comprised of 177portfolios) managed by the Manager. She is 57years old and has been an employee of theManager since October 1988.
JOSEPH M. CHIOFFI, Vice President andAssistant Secretary since August 2005.
Senior Counsel of BNY Mellon, and an officerof 70 investment companies (comprised of 177portfolios) managed by the Manager. He is 51years old and has been an employee of theManager since June 2000.
JOHN B. HAMMALIAN, Vice President andAssistant Secretary since August 2005.
Senior Managing Counsel of BNY Mellon,and an officer of 70 investment companies(comprised of 177 portfolios) managed by theManager. He is 49 years old and has been anemployee of the Manager since February 1991.
ROBERT R. MULLERY, Vice President andAssistant Secretary since August 2005.
Managing Counsel of BNY Mellon, and anofficer of 70 investment companies (comprisedof 177 portfolios) managed by the Manager.He is 60 years old and has been an employeeof the Manager since May 1986.
JEFF PRUSNOFSKY, Vice President andAssistant Secretary since August 2005.
Senior Managing Counsel of BNY Mellon,and an officer of 70 investment companies(comprised of 177 portfolios) managed by theManager. He is 47 years old and has been anemployee of the Manager since October 1990.
JAMES WINDELS, Treasurer sinceNovember 2001.
Director – Mutual Fund Accounting of theManager, and an officer of 70 investmentcompanies (comprised of 177 portfolios)managed by the Manager. He is 54 years oldand has been an employee of the Managersince April 1985.
34
O F F I C E R S O F T H E F U N D ( U n a u d i t e d )

RICHARD CASSARO, Assistant Treasurersince January 2008.
Senior Accounting Manager – Money Marketand Municipal Bond Funds of the Manager,and an officer of 70 investment companies(comprised of 177 portfolios) managed by the Manager. He is 53 years old and has been an employee of the Manager sinceSeptember 1982.
GAVIN C. REILLY, Assistant Treasurersince December 2005.
Tax Manager of the Investment Accountingand Support Department of the Manager, andan officer of 70 investment companies(comprised of 177 portfolios) managed by theManager. He is 44 years old and has been anemployee of the Manager since April 1991.
ROBERT S. ROBOL, Assistant Treasurersince August 2005.
Senior Accounting Manager – Fixed IncomeFunds of the Manager, and an officer of 70investment companies (comprised of 177portfolios) managed by the Manager. He is 48years old and has been an employee of theManager since October 1988.
ROBERT SALVIOLO, Assistant Treasurersince July 2007.
Senior Accounting Manager – Equity Funds ofthe Manager, and an officer of 70 investmentcompanies (comprised of 177 portfolios)managed by the Manager. He is 45 years oldand has been an employee of the Managersince June 1989.
ROBERT SVAGNA, Assistant Treasurersince December 2002.
Senior Accounting Manager – Equity Funds ofthe Manager, and an officer of 70 investmentcompanies (comprised of 177 portfolios)managed by the Manager. He is 45 years oldand has been an employee of the Managersince November 1990.
JOSEPH W. CONNOLLY, Chief ComplianceOfficer since October 2004.
Chief Compliance Officer of the Manager andThe Dreyfus Family of Funds (70 investmentcompanies, comprised of 177 portfolios). He is55 years old and has served in variouscapacities with the Manager since 1980,including manager of the firm’s FundAccounting Department from 1997 throughOctober 2001.
MATTHEW D. CONNOLLY, Anti-MoneyLaundering Compliance Officer since April 2012.
Anti-Money Laundering Compliance Officerof the Distributor since October 2011; fromMarch 2010 to September 2011, Global Head,KYC Reviews and Director, UBS InvestmentBank; until March 2010, AML ComplianceOfficer and Senior Vice President, Citi GlobalWealth Management. He is an officer of 66investment companies (comprised of 173portfolios) managed by the Manager. He is 40years old and has been an employee of theDistributor since October 2011.
T h e F u n d 35
Dreyfus VariableInvestment Fund,Appreciation Portfolio
200 Park AvenueNew York, NY 10166
Investment Adviser
The Dreyfus Corporation200 Park AvenueNew York, NY 10166
Sub-Investment Adviser
Fayez Sarofim & Co.Two Houston CenterSuite 2907Houston, TX 77010
Custodian
The Bank of New York MellonOne Wall StreetNew York, NY 10286
Transfer Agent &Dividend Disbursing Agent
Dreyfus Transfer, Inc.200 Park AvenueNew York, NY 10166
Distributor
MBSC Securities Corporation200 Park AvenueNew York, NY 10166
For More Information
© 2013 MBSC Securities Corporation 0112AR1212
Telephone 1-800-554-4611 or 1-516-338-3300
Mail The Dreyfus Family of Funds, 144 Glenn Curtiss Boulevard, Uniondale, NY 11556-0144Attn: Investments Division
The fund files its complete schedule of portfolio holdings with the Securities and Exchange
Commission (“SEC”) for the first and third quarters of each fiscal year on Form N-Q. The fund’s
Forms N-Q are available on the SEC’s website at http://www.sec.gov and may be reviewed and
copied at the SEC’s Public Reference Room in Washington, DC. Information on the operation of
the Public Reference Room may be obtained by calling 1-800-SEC-0330.
A description of the policies and procedures that the fund uses to determine how to vote
proxies relating to portfolio securities, and information regarding how the fund voted
these proxies for the most recent 12-month period ended June 30 is available at
http://www.dreyfus.com and on the SEC’s website at http://www.sec.gov. The
description of the policies and procedures is also available without charge,
upon request, by calling 1-800-DREYFUS.
®

The Dreyfus SociallyResponsibleGrowth Fund, Inc.
ANNUAL REPORT December 31, 2012

The views expressed in this report reflect those of the portfoliomanager only through the end of the period covered and do notnecessarily represent the views of Dreyfus or any other person inthe Dreyfus organization. Any such views are subject to change atany time based upon market or other conditions and Dreyfus dis-claims any responsibility to update such views. These views may notbe relied on as investment advice and, because investment decisionsfor a Dreyfus fund are based on numerous factors, may not be reliedon as an indication of trading intent on behalf of any Dreyfus fund.
Not FDIC-Insured • Not Bank-Guaranteed • May Lose Value

Contents
T H E F U N D
2 A Letter from the President
3 Discussion of Fund Performance
6 Fund Performance
8 Understanding Your Fund’s Expenses
8 Comparing Your Fund’s Expenses With Those of Other Funds
9 Statement of Investments
14 Statement of Assets and Liabilities
15 Statement of Operations
16 Statement of Changes in Net Assets
18 Financial Highlights
20 Notes to Financial Statements
30 Report of Independent Registered Public Accounting Firm
31 Important Tax Information
32 Information About the Renewal of the Fund’s Management Agreement
37 Board Members Information
39 Officers of the Fund
F O R M O R E I N F O R M AT I O N
Back Cover

2
The Dreyfus Socially ResponsibleGrowth Fund, Inc. The Fund
A L E T T E R F R O M T H E P R E S I D E N T
Dear Shareholder:
We are pleased to present this annual report for The Dreyfus Socially ResponsibleGrowth Fund, Inc., covering the 12-month period from January 1, 2012, throughDecember 31, 2012. For information about how the fund performed during thereporting period, as well as general market perspectives, we provide a Discussion ofFund Performance on the pages that follow.
In retrospect, 2012 was notable for the global equity markets’ resilience in the face ofsome tough macroeconomic challenges. Worries regarding sluggish employmentgrowth, weak housing markets and Congressional gridlock weighed on investorsentiment in the United States at times during the year, yet U.S. stocks postedrespectable gains, on average. An ongoing debt crisis led to recessionary conditions inEurope, particularly for some of the continent’s more peripheral nations, but aggressiveactions from monetary policymakers helped some European stock markets producedouble-digit returns. While China’s economy slowed in response to inflation-fightingmeasures, officials there appeared to have engineered a “soft landing,” and Chinesestocks generally ended the year with positive absolute returns.
We currently expect the U.S. and global economies to be modestly stronger in 2013,especially during the second half of the year. The global economy seems likely to benefitfrom Europe’s ongoing efforts to support its banking system and common currency,and by China’s moves toward more stimulative fiscal policies under new governmentleadership. In the United States, greater certainty regarding U.S. tax and fiscal policies,the resumption of postponed spending by businesses, and a continued housing recoverycould support modestly higher rates of economic growth. We encourage you to discussthe implications of our economic analysis with your financial advisor, who can help youalign your investments with the year’s challenges and opportunities.
Thank you for your continued confidence and support.
Sincerely,
J. Charles CardonaPresidentThe Dreyfus CorporationJanuary 15, 2013

T h e F u n d 3
D I S C U S S I O N O F F U N D P E R F O R M A N C E
For the period of January 1, 2012, through December 31, 2012, as provided by Jocelin Reed,Warren Chiang, C. Wesley Boggs and Ronald Gala, Portfolio Managers
Fund and Market Performance Overview
For the 12-month period ended December 31, 2012, The Dreyfus SociallyResponsible Growth Fund’s Initial shares produced a total return of 11.98%, and thefund’s Service shares returned 11.70%.1 In comparison, the fund’s benchmark, theStandard & Poor’s 500 Composite Stock Price Index (“S&P 500 Index”), produceda total return of 15.99% for the same period.2
Improving economic data generally drove stocks higher in 2012. The fund’s returnslagged its benchmark, primarily due to shortfalls in the information technology,consumer discretionary and financials sectors.
The Fund’s Investment Approach
The fund seeks capital growth, with current income as a secondary objective. Topursue these goals, the fund invests at least 80% of its net assets in the commonstocks of companies that, in our opinion, meet traditional investment standardswhile simultaneously conducting their businesses in a manner that contributes tothe enhancement of the quality of life in America. In selecting stocks, we usequantitative research to identify and rank stocks within an industry or sector.Next, using fundamental analysis, we designate the most attractive of the higherranked securities as potential purchase candidates. We then evaluate whether eachcompany meets the fund’s socially responsible investment criteria in order todetermine whether the company is eligible for purchase or retention by the fund.With respect to those eligible securities, we then select investments that we considerto be the most attractive based on financial considerations.
The fund normally focuses on large-cap growth stocks; however, the fund also mayinvest in value-oriented stocks, midcap stocks and small-cap stocks.
Improving Macroeconomic Conditions Fueled Market Gains
Several positive macroeconomic developments drove stocks higher during the firstquarter of 2012. These included strong corporate earnings reports, domestic employ-

4
D I S C U S S I O N O F F U N D P E R F O R M A N C E (continued)
ment gains, and a quantitative easing program in Europe that forestalled a more severeregional banking crisis. However, investor sentiment turned more cautious during thespring, when the U.S. labor market’s rebound slowed and measures designed torelieve fiscal pressures in Europe encountered resistance.
Stocks rebounded over the summer, reaching new highs for the year by Septemberamid more encouraging economic news, including sharp declines in the unemploy-ment rate. Stocks lost ground again in November as concerns mounted over automatictax hikes and spending cuts scheduled for the start of 2013. Nevertheless, continuedcorporate earnings strength and signs of an improving U.S. housing marketenabled stocks to resume their rally, and the S&P 500 Index ended the year withdouble-digit gains.
Quality Bias Hampered Relative Performance
In this environment, the valuation factors considered by our security selectionprocess worked well, but quality-related factors generally did not. This developmenthindered the fund’s sector allocation strategy, as overweighted exposure to theinformation technology sector and underweighted positions in the financials andconsumer discretionary sectors weighed on results.
Our stock selection strategy in the information technology sector also undercut thefund’s relative performance. Hardware makers Dell, Hewlett-Packard, and AdvancedMicro Devices struggled with an industry-wide transition from personal computers tomobile devices. Moreover, labor issues led the fund to hold underweighted exposureto electronics innovator Apple, which is leading the mobile computing trend. Amongconsumer discretionary stocks, electronics retailer Best Buy encountered obstacles in itsinternational expansion, and office supplies seller Staples struggled with falling papersales. The fund did not hold retailer The Home Depot, missing out on its gains. Resultsfrom the financials sector were dampened by lack of participation in gains amonglarge, diversified financial institutions that did not meet our investment criteria.Instead, we favored smaller, higher quality commercial and regional banks, whichlagged sector averages.
The fund achieved better results in the consumer staples sector, where buying clubCostco Wholesale reported rising membership subscriptions, strong geographicexpansion and high profit margins. Organic grocer Whole Foods Market postedsteady store growth and raised its dividend. The fund’s energy investments benefited

T h e F u n d 5
from Canadian natural gas producer Nexen, which was acquired by China’s state-runoil company, and offshore transportation provider Bristow Group, which encounteredrising demand.
Economic Recovery Remains Intact
Despite lingering macroeconomic uncertainties over the near term, we are optimisticabout the longer-term prospects for U.S. stocks. Low interest rates and accommodativemonetary policies are expected to keep the economy growing, but at a moderate pace.Therefore, we have retained the fund’s tilt toward higher quality stocks.
Providing Third World Access to Medicine
Pressure has intensified on major pharmaceutical developers to make medicinesavailable at affordable prices in developing regions, such as Africa. Healthcare advocatesalso are seeking greater flexibility to evaluate and treat patients in areas with fewmedical professionals. Fund holding AstraZeneca, ADR has been in the forefront ofefforts to respond to these requests, working effectively to ensure distribution and useof its products where they are needed most.
January 15, 2013
Please note, the position in any security highlighted with italicized typeface was sold during the reporting period. Equity funds are subject generally to market, market sector, market liquidity, issuer and investment style risks, among
other factors, to varying degrees, all of which are more fully described in the fund’s prospectus. The fund’s socially responsible investment criteria may limit the number of investment opportunities available to the
fund, and as a result, at times, the fund may produce more modest gains than funds that are not subject to suchspecial investment considerations.
The fund is only available as a funding vehicle under variable life insurance policies or variable annuity contractsissued by insurance companies. Individuals may not purchase shares of the fund directly. A variable annuity is aninsurance contract issued by an insurance company that enables investors to accumulate assets on a tax-deferred basisfor retirement or other long-term goals. The investment objective and policies of The Dreyfus Socially ResponsibleGrowth Fund made available through insurance products may be similar to other funds managed by Dreyfus.However, the investment results of the fund may be higher or lower than, and may not be comparable to, those of anyother Dreyfus fund.
1 Total return includes reinvestment of dividends and any capital gains paid. Past performance is no guarantee of futureresults. Share price and investment return fluctuate such that upon redemption, fund shares may be worth more or lessthan their original cost. The fund’s performance does not reflect the deduction of additional charges and expensesimposed in connection with investing in variable insurance contracts, which will reduce returns.
2 SOURCE: LIPPER INC. — Reflects reinvestment of dividends and, where applicable, capital gain distributions.The Standard & Poor’s 500 Composite Stock Price Index is a widely accepted, unmanaged index of U.S. stockmarket performance. Investors cannot invest directly in any index.

6
F U N D P E R F O R M A N C E
10,000
12,000
14,000
16,000
18,000
20,000
Do
llars
Years Ended 12/31
02 03 04 05 06 07 08 09 10 11 12
The Dreyfus Socially Responsible Growth Fund, Inc. (Initial shares)
The Dreyfus Socially Responsible Growth Fund, Inc. (Service shares)
Standard & Poor’s 500 Composite Stock Price Index†
$19,850
$18,571
$18,128
Comparison of change in value of $10,000 investment in The Dreyfus Socially ResponsibleGrowth Fund, Inc. Initial shares and Service shares and the Standard & Poor’s 500 CompositeStock Price Index
Average Annual Total Returns as of 12/31/12
1 Year 5 Years 10 Years
Initial shares 11.98% 2.62% 6.39%
Service shares 11.70% 2.37% 6.13%
Standard & Poor’s 500 Composite Stock Price Index 15.99% 1.66% 7.10%
† Source: Lipper Inc.Past performance is not predictive of future performance. The fund’s performance shown in the graph and table does notreflect the deduction of taxes that a shareholder would pay on fund distributions or the redemption of fund shares.The fund’s performance does not reflect the deduction of additional charges and expenses imposed in connectionwith investing in variable insurance contracts which will reduce returns.The above graph compares a $10,000 investment made in Initial and Service shares of The Dreyfus SociallyResponsible Growth Fund, Inc. on 12/31/02 to a $10,000 investment made in the Standard & Poor’s 500Composite Stock Price Index (the “Index”) on that date.

T h e F u n d 7
The fund’s Initial shares are not subject to a Rule 12b-1 fee. The fund’s Service shares are subject to a 0.25% annualRule 12b-1 fee. All dividends and capital gain distributions are reinvested.The fund’s performance shown in the line graph above takes into account all applicable fund fees and expenses for Initialand Service shares. The Index is a widely accepted, unmanaged index of U.S. stock market performance. Unlike a mutualfund, the Index is not subject to charges, fees and other expenses. Investors cannot invest directly in any index. Furtherinformation relating to fund performance, including expense reimbursements, if applicable, is contained in the FinancialHighlights section of the prospectus and elsewhere in this report.

8
Expenses and Value of a $1,000 Investmentassuming actual returns for the six months ended December 31, 2012
Initial Shares Service Shares
Expenses paid per $1,000† $ 4.30 $ 5.57
Ending value (after expenses) $1,034.20 $1,032.90
U N D E R S TA N D I N G YO U R F U N D ’ S E X P E N S E S ( U n a u d i t e d )
As a mutual fund investor, you pay ongoing expenses, such as management fees and other expenses.Using the information below, you can estimate how these expenses affect your investment and comparethem with the expenses of other funds. You also may pay one-time transaction expenses, including salescharges (loads), redemption fees and expenses associated with variable annuity or insurance contracts,which are not shown in this section and would have resulted in higher total expenses. For moreinformation, see your fund’s prospectus or talk to your financial adviser.
Review your fund’s expenses
The table below shows the expenses you would have paid on a $1,000 investment in TheDreyfus Socially Responsible Growth Fund, Inc. from July 1, 2012 to December 31, 2012.It also shows how much a $1,000 investment would be worth at the close of the period,assuming actual returns and expenses.
Expenses and Value of a $1,000 Investmentassuming a hypothetical 5% annualized return for the six months ended December 31, 2012
Initial Shares Service Shares
Expenses paid per $1,000† $ 4.27 $ 5.53
Ending value (after expenses) $1,020.91 $1,019.66
C O M P A R I N G Y O U R F U N D ’ S E X P E N S E S W I T H T H O S E O F O T H E R F U N D S ( U n a u d i t e d )
Using the SEC’s method to compare expenses
The Securities and Exchange Commission (SEC) has established guidelines to helpinvestors assess fund expenses. Per these guidelines, the table below shows your fund’sexpenses based on a $1,000 investment, assuming a hypothetical 5% annualized return.You can use this information to compare the ongoing expenses (but not transactionexpenses or total cost) of investing in the fund with those of other funds. All mutual fundshareholder reports will provide this information to help you make this comparison.Please note that you cannot use this information to estimate your actual ending accountbalance and expenses paid during the period.
† Expenses are equal to the fund’s annualized expense ratio of .84% for Initial Shares and 1.09% for Service Shares,multiplied by the average account value over the period, multiplied by 184/366 (to reflect the one-half year period).

T h e F u n d 9
Common Stocks—98.8% Shares Value ($)
Automobiles & Components—1.3%
Thor Industries 76,700 2,870,881
Banks—6.9%
BB&T 84,600 2,462,706
Comerica 129,500 3,929,030
KeyCorp 510,900 4,301,778
People’s United Financial 83,300 1,007,097
Regions Financial 420,000 2,990,400
14,691,011
Capital Goods—5.5%
3M 17,700 1,643,445
Donaldson 50,850 1,669,914
Eaton 11,467 621,506
Fluor 20,300 1,192,422
General Electric 78,900 1,656,111
Parker Hannifin 42,400 3,606,544
Rockwell Collins 25,200 a 1,465,884
11,855,826
Consumer Services—1.9%
Marriott International, Cl. A 109,100 4,066,157
Diversified Financials—5.6%
American Express 56,400 3,241,872
Discover Financial Services 88,100 3,396,255
NASDAQ OMX Group 71,800 1,795,718
Northern Trust 37,000 1,855,920
Waddell & Reed Financial, Cl. A 48,750 1,697,475
11,987,240
Energy—10.8%
Apache 44,500 3,493,250
Bristow Group 45,700 2,452,262
ConocoPhillips 71,100 4,123,089
Denbury Resources 192,700 b 3,121,740
Devon Energy 46,350 2,412,054
EnCana 137,700 a 2,720,952
Noble Energy 12,500 1,271,750
S TAT E M E N T O F I N V E S T M E N T SD e c e m b e r 3 1 , 2 0 1 2

S TAT E M E N T O F I N V E S T M E N T S (continued)
Energy (continued)
Pioneer Natural Resources 17,900 1,907,961
Spectra Energy 58,300 1,596,254
23,099,312
Food & Staples Retailing—3.6%
Costco Wholesale 33,700 3,328,549
Kroger 47,900 1,246,358
Whole Foods Market 33,750 3,082,387
7,657,294
Food, Beverage & Tobacco—3.8%
Campbell Soup 98,800 a 3,447,132
Coca-Cola Enterprises 46,800 1,484,964
ConAgra Foods 61,100 1,802,450
Mead Johnson Nutrition 22,500 1,482,525
8,217,071
Health Care Equipment & Services—3.1%
AmerisourceBergen 25,900 1,118,362
Becton Dickinson & Co. 27,875 2,179,546
Humana 34,400 2,360,872
Patterson 30,600 1,047,438
6,706,218
Household & Personal Products—1.7%
Clorox 15,300 1,120,266
Estee Lauder, Cl. A 26,300 1,574,318
Procter & Gamble 12,525 850,322
3,544,906
Insurance—1.5%
Aflac 60,500 3,213,760
Materials—1.7%
Ball 83,100 3,718,725
Media—2.0%
Discovery Communications, Cl. A 49,500 b 3,142,260
Scripps Networks Interactive, Cl. A 17,600 1,019,392
4,161,652
10
Common Stocks (continued) Shares Value ($)

Pharmaceuticals, Biotech & Life Sciences—10.3%
Agilent Technologies 59,500 2,435,930
Allergan 11,700 1,073,241
AstraZeneca, ADR 50,450 2,384,772
Biogen Idec 20,200 b 2,962,734
Bristol-Myers Squibb 148,600 4,842,874
Life Technologies 76,600 b 3,759,528
Novartis, ADR 40,800 2,582,640
Waters 22,900 b 1,995,048
22,036,767
Retailing—4.2%
Gap 31,000 962,240
Nordstrom 47,700 2,551,950
O’Reilly Automotive 18,500 b 1,654,270
Staples 242,700 a 2,766,780
TJX 23,900 1,014,555
8,949,795
Semiconductors & Semiconductor Equipment—4.1%
Applied Materials 304,400 3,482,336
Intel 132,100 2,725,223
LSI 346,800 b 2,455,344
8,662,903
Software & Services—10.5%
Accenture, Cl. A 19,100 1,270,150
Akamai Technologies 52,000 b 2,127,320
BMC Software 25,000 b 991,500
CA 70,850 1,557,283
International Business Machines 28,875 5,531,006
Intuit 28,800 1,713,600
Microsoft 152,400 4,073,652
Oracle 117,375 3,910,935
Western Union 85,525 1,163,995
22,339,441
T h e F u n d 11
Common Stocks (continued) Shares Value ($)

S TAT E M E N T O F I N V E S T M E N T S (continued)
Technology Hardware & Equipment—10.6%
Apple 12,450 6,636,223
Avnet 42,575 b 1,303,221
Cisco Systems 199,575 3,921,649
Dell 240,800 2,439,304
EMC 154,025 b 3,896,833
Hewlett-Packard 99,400 1,416,450
Motorola Solutions 56,200 3,129,216
22,742,896
Telecommunication Services—4.9%
AT&T 124,400 4,193,524
Verizon Communications 146,900 6,356,363
10,549,887
Transportation—1.5%
Norfolk Southern 18,100 1,119,304
United Parcel Service, Cl. B 28,800 2,123,424
3,242,728
Utilities—3.3%
Consolidated Edison 46,500 2,582,610
Pinnacle West Capital 46,000 2,345,080
Xcel Energy 80,700 2,155,497
7,083,187
Total Common Stocks (cost $182,747,692) 211,397,657
Other Investment—.9%
Registered Investment Company;
Dreyfus Institutional Preferred Plus Money Market Fund (cost $1,964,219) 1,964,219 c 1,964,219
12
Common Stocks (continued) Shares Value ($)

Registered Investment Company;
Dreyfus Institutional Cash Advantage Fund (cost $8,465,115) 8,465,115 c 8,465,115
Total Investments (cost $193,177,026) 103.7% 221,826,991
Liabilities, Less Cash and Receivables (3.7%) (7,891,974)
Net Assets 100.0% 213,935,017
T h e F u n d 13
Investment of Cash Collateral for Securities Loaned—4.0% Shares Value ($)
ADR—American Depository Receiptsa Security, or portion thereof, on loan. At December 31, 2012, the value of the fund’s securities on loan was
$8,363,025 and the value of the collateral held by the fund was $8,465,115.b Non-income producing security.c Investment in affiliated money market mutual fund.
Portfolio Summary (Unaudited)†
Value (%) Value (%)
Energy 10.8Technology Hardware & Equipment 10.6Software & Services 10.5Pharmaceuticals, Biotech & Life Sciences 10.3Banks 6.9Diversified Financials 5.6Capital Goods 5.5Money Market Investments 4.9Telecommunication Services 4.9Retailing 4.2Semiconductors & Semiconductor Equipment 4.1
Food, Beverage & Tobacco 3.8Food & Staples Retailing 3.6Utilities 3.3Health Care Equipment & Services 3.1Media 2.0Consumer Services 1.9Household & Personal Products 1.7Materials 1.7Insurance 1.5Transportation 1.5Automobiles & Components 1.3
103.7
† Based on net assets.See notes to financial statements.
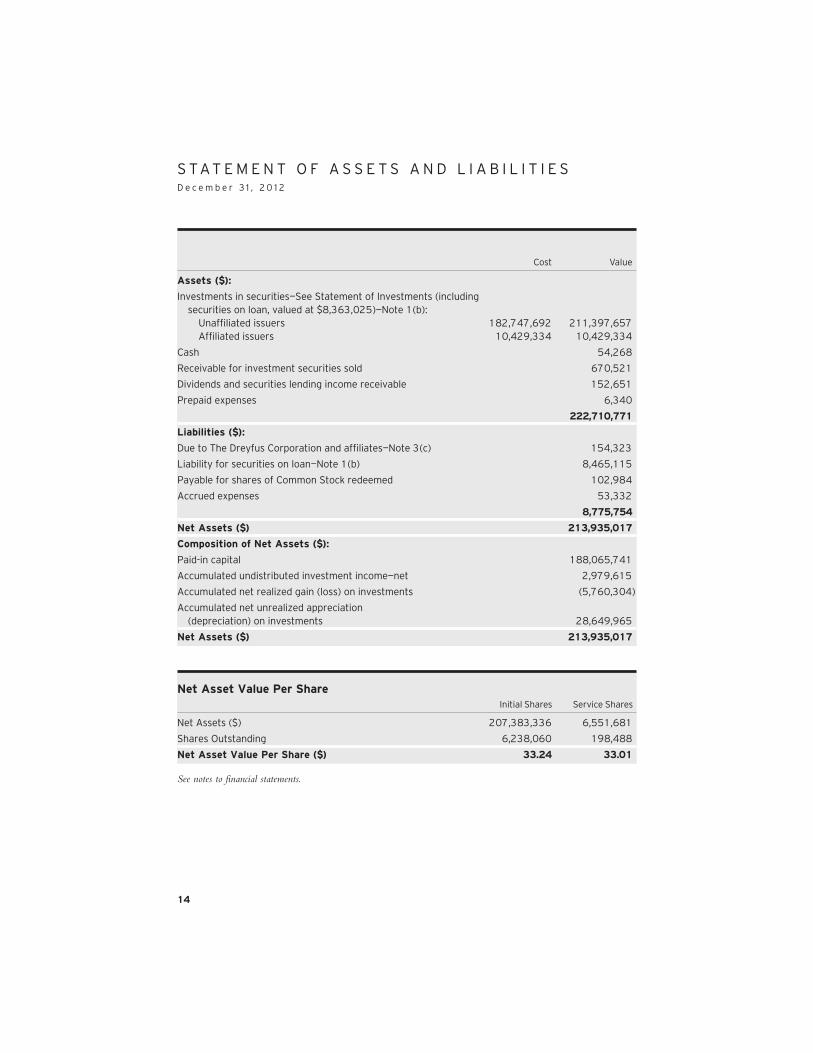
S TAT E M E N T O F A S S E T S A N D L I A B I L I T I E SD e c e m b e r 3 1 , 2 0 1 2
See notes to financial statements.
14
Cost Value
Assets ($):
Investments in securities—See Statement of Investments (including securities on loan, valued at $8,363,025)—Note 1(b): Unaffiliated issuers 182,747,692 211,397,657 Affiliated issuers 10,429,334 10,429,334
Cash 54,268
Receivable for investment securities sold 670,521
Dividends and securities lending income receivable 152,651
Prepaid expenses 6,340
222,710,771
Liabilities ($):
Due to The Dreyfus Corporation and affiliates—Note 3(c) 154,323
Liability for securities on loan—Note 1(b) 8,465,115
Payable for shares of Common Stock redeemed 102,984
Accrued expenses 53,332
8,775,754
Net Assets ($) 213,935,017
Composition of Net Assets ($):
Paid-in capital 188,065,741
Accumulated undistributed investment income—net 2,979,615
Accumulated net realized gain (loss) on investments (5,760,304)
Accumulated net unrealized appreciation (depreciation) on investments 28,649,965
Net Assets ($) 213,935,017
Net Asset Value Per Share Initial Shares Service Shares
Net Assets ($) 207,383,336 6,551,681
Shares Outstanding 6,238,060 198,488
Net Asset Value Per Share ($) 33.24 33.01

Investment Income ($):Income:
Cash dividends (net of $22,584 foreign taxes withheld at source): Unaffiliated issuers 4,726,970 Affiliated issuers 806
Income from securities lending—Note 1(b) 154,617
Total Income 4,882,393
Expenses:
Management fee—Note 3(a) 1,680,564
Professional fees 89,481
Prospectus and shareholders’ reports 64,979
Custodian fees—Note 3(c) 18,459
Distribution fees—Note 3(b) 16,451
Shareholder servicing costs—Note 3(c) 11,043
Directors’ fees and expenses—Note 3(d) 7,412
Loan commitment fees—Note 2 1,886
Interest expense—Note 2 142
Miscellaneous 8,186
Total Expenses 1,898,603
Less—reduction in fees due to earnings credits—Note 3(c) (9)
Net Expenses 1,898,594
Investment Income—Net 2,983,799
Realized and Unrealized Gain (Loss) on Investments—Note 4 ($):Net realized gain (loss) on investments 5,162,418
Net unrealized appreciation (depreciation) on investments 16,937,445
Net Realized and Unrealized Gain (Loss) on Investments 22,099,863
Net Increase in Net Assets Resulting from Operations 25,083,662
S TAT E M E N T O F O P E R AT I O N SYe a r E n d e d D e c e m b e r 3 1 , 2 0 1 2
See notes to financial statements.
T h e F u n d 15

Year Ended December 31,
2012 2011
Operations ($):
Investment income—net 2,983,799 1,809,131
Net realized gain (loss) on investments 5,162,418 25,953,466
Net unrealized appreciation (depreciation) on investments 16,937,445 (25,448,830)
Net Increase (Decrease) in Net Assets Resulting from Operations 25,083,662 2,313,767
Dividends to Shareholders from ($):
Investment income—net:
Initial Shares (1,775,288) (1,991,777)
Service Shares (37,298) (43,526)
Total Dividends (1,812,586) (2,035,303)
Capital Stock Transactions ($):
Net proceeds from shares sold:
Initial Shares 10,025,466 11,511,549
Service Shares 932,920 769,413
Dividends reinvested:
Initial Shares 1,775,288 1,991,777
Service Shares 37,298 43,526
Cost of shares redeemed:
Initial Shares (35,033,427) (33,671,498)
Service Shares (1,254,125) (1,130,073)
Increase (Decrease) in Net Assets from Capital Stock Transactions (23,516,580) (20,485,306)
Total Increase (Decrease) in Net Assets (245,504) (20,206,842)
Net Assets ($):
Beginning of Period 214,180,521 234,387,363
End of Period 213,935,017 214,180,521
Undistributed investment income—net 2,979,615 1,808,402
S TAT E M E N T O F C H A N G E S I N N E T A S S E T S
16
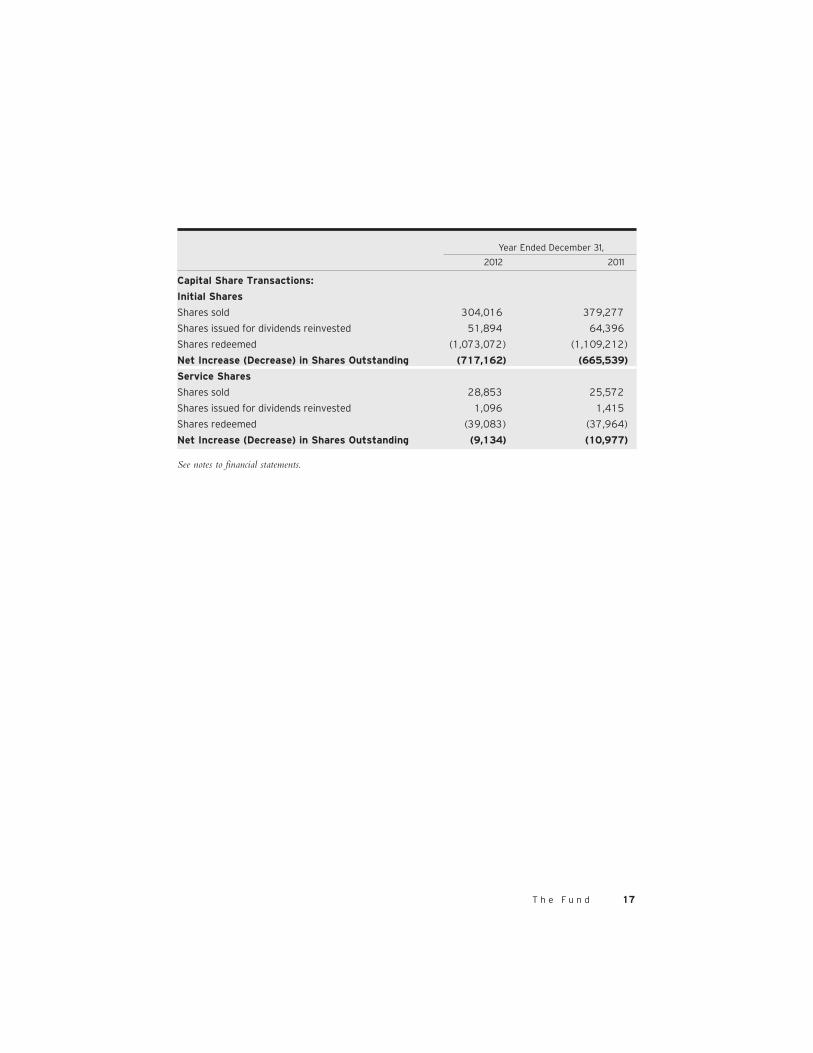
Year Ended December 31,
2012 2011
Capital Share Transactions:
Initial Shares
Shares sold 304,016 379,277
Shares issued for dividends reinvested 51,894 64,396
Shares redeemed (1,073,072) (1,109,212)
Net Increase (Decrease) in Shares Outstanding (717,162) (665,539)
Service Shares
Shares sold 28,853 25,572
Shares issued for dividends reinvested 1,096 1,415
Shares redeemed (39,083) (37,964)
Net Increase (Decrease) in Shares Outstanding (9,134) (10,977)
T h e F u n d 17
See notes to financial statements.

Year Ended December 31,
Initial Shares 2012 2011 2010 2009 2008
Per Share Data ($):
Net asset value, beginning of period 29.91 29.90 26.26 19.86 30.50
Investment Operations:
Investment income—neta .44 .24 .25 .21 .19
Net realized and unrealized gain (loss) on investments 3.15 .04 3.62 6.40 (10.64)
Total from Investment Operations 3.59 .28 3.87 6.61 (10.45)
Distributions:
Dividends from investment income—net (.26) (.27) (.23) (.21) (.19)
Net asset value, end of period 33.24 29.91 29.90 26.26 19.86
Total Return (%) 11.98 .90 14.82 33.75 (34.42)
Ratios/Supplemental Data (%):
Ratio of total expenses to average net assets .85 .85 .89 .89 .85
Ratio of net expenses to average net assets .85 .85 .89 .89 .85
Ratio of net investment income to average net assets 1.34 .80 .93 .97 .72
Portfolio Turnover Rate 48.84 67.88 32.75 34.00 31.74
Net Assets, end of period ($ x 1,000) 207,383 208,013 227,893 222,600 184,813
18
F I N A N C I A L H I G H L I G H T S
The following tables describe the performance for each share class for the fiscalperiods indicated. All information (except portfolio turnover rate) reflects financialresults for a single fund share. Total return shows how much your investment in thefund would have increased (or decreased) during each period, assuming you hadreinvested all dividends and distributions. The fund’s total returns do not reflectexpenses associated with variable annuity or insurance contracts.These figures havebeen derived from the fund’s financial statements.
a Based on average shares outstanding at each month end.See notes to financial statements.

Year Ended December 31,
Service Shares 2012 2011 2010 2009 2008
Per Share Data ($):
Net asset value, beginning of period 29.70 29.71 26.10 19.71 30.25
Investment Operations:
Investment income—neta .36 .17 .18 .16 .12
Net realized and unrealized gain (loss) on investments 3.13 .02 3.60 6.37 (10.55)
Total from Investment Operations 3.49 .19 3.78 6.53 (10.43)
Distributions:
Dividends from investment income—net (.18) (.20) (.17) (.14) (.11)
Net asset value, end of period 33.01 29.70 29.71 26.10 19.71
Total Return (%) 11.70 .65 14.54 33.44 (34.58)
Ratios/Supplemental Data (%):
Ratio of total expenses to average net assets 1.10 1.10 1.14 1.14 1.10
Ratio of net expenses to average net assets 1.10 1.10 1.14 1.14 1.10
Ratio of net investment income to average net assets 1.09 .55 .68 .72 .47
Portfolio Turnover Rate 48.84 67.88 32.75 34.00 31.74
Net Assets, end of period ($ x 1,000) 6,552 6,167 6,494 6,070 5,008
T h e F u n d 19
a Based on average shares outstanding at each month end.See notes to financial statements.

NOTE 1—Significant Accounting Policies:
The Dreyfus Socially Responsible Growth Fund, Inc. (the “fund”) isregistered under the Investment Company Act of 1940, as amended (the“Act”), as a diversified open-end management investment company. Thefund’s investment objective seeks to provide capital growth. The fund isonly offered to separate accounts established by insurance companies tofund variable annuity contracts and variable life insurance policies. TheDreyfus Corporation (the “Manager” or “Dreyfus”), a wholly-ownedsubsidiary of The Bank of New York Mellon Corporation (“BNYMellon”), serves as the fund’s investment adviser.
MBSC Securities Corporation (the “Distributor”), a wholly-ownedsubsidiary of the Manager, is the distributor of the fund’s shares, whichare sold without a sales charge. The fund is authorized to issue 300 mil-lion shares of $.001 par value Common Stock. The fund currentlyoffers two classes of shares: Initial shares (150 million shares authorized)and Service shares (150 million shares authorized). Initial shares aresubject to a shareholder services fee and Service shares are subject toa distribution fee. Each class of shares has identical rights and privileges,except with respect to the Distribution Plan, Shareholder Services Planand the expenses borne by each class, the allocation of certain transferagency costs and certain voting rights. Income, expenses (other thanexpenses attributable to a specific class), and realized and unrealizedgains or losses on investments are allocated to each class of shares basedon its relative net assets.
The Financial Accounting Standards Board (“FASB”) AccountingStandards Codification is the exclusive reference of authoritative U.S.generally accepted accounting principles (“GAAP”) recognized by theFASB to be applied by nongovernmental entities. Rules and interpretivereleases of the Securities and Exchange Commission (“SEC”) underauthority of federal laws are also sources of authoritative GAAP for SECregistrants. The fund’s financial statements are prepared in accordancewith GAAP, which may require the use of management estimates andassumptions. Actual results could differ from those estimates.
20
N O T E S T O F I N A N C I A L S TAT E M E N T S

The fund enters into contracts that contain a variety of indemnifica-tions. The fund’s maximum exposure under these arrangements isunknown. The fund does not anticipate recognizing any loss related tothese arrangements.
(a) Portfolio valuation: The fair value of a financial instrument is theamount that would be received to sell an asset or paid to transfer a lia-bility in an orderly transaction between market participants at themeasurement date (i.e., the exit price). GAAP establishes a fair valuehierarchy that prioritizes the inputs of valuation techniques used tomeasure fair value. This hierarchy gives the highest priority to unad-justed quoted prices in active markets for identical assets or liabilities(Level 1 measurements) and the lowest priority to unobservable inputs(Level 3 measurements).
Additionally, GAAP provides guidance on determining whether thevolume and activity in a market has decreased significantly andwhether such a decrease in activity results in transactions that are notorderly. GAAP requires enhanced disclosures around valuation inputsand techniques used during annual and interim periods.
Various inputs are used in determining the value of the fund’s invest-ments relating to fair value measurements. These inputs are summarizedin the three broad levels listed below:
Level 1—unadjusted quoted prices in active markets for identical investments.
Level 2—other significant observable inputs (including quotedprices for similar investments, interest rates, prepayment speeds,credit risk, etc.).
Level 3—significant unobservable inputs (including the fund’sown assumptions in determining the fair value of investments).
The inputs or methodology used for valuing securities are not necessar-ily an indication of the risk associated with investing in those securities.
T h e F u n d 21

Changes in valuation techniques may result in transfers in or out of anassigned level within the disclosure hierarchy. Valuation techniquesused to value the fund’s investments are as follows:
Investments in securities are valued at the last sales price on the securi-ties exchange or national securities market on which such securities areprimarily traded. Securities listed on the National Market System forwhich market quotations are available are valued at the official closingprice or, if there is no official closing price that day, at the last sales price.Securities not listed on an exchange or the national securities market,or securities for which there were no transactions, are valued at theaverage of the most recent bid and asked prices, except for open shortpositions, where the asked price is used for valuation purposes. Bidprice is used when no asked price is available. Registered investmentcompanies that are not traded on an exchange are valued at their netasset value. All of the preceding securities are categorized within Level1 of the fair value hierarchy.
Fair valuing of securities may be determined with the assistance of apricing service using calculations based on indices of domestic securi-ties and other appropriate indicators, such as prices of relevant ADRsand financial futures. Utilizing these techniques may result in transfersbetween Level 1 and Level 2 of the fair value hierarchy.
When market quotations or official closing prices are not readily avail-able, or are determined not to reflect accurately fair value, such as whenthe value of a security has been significantly affected by events after theclose of the exchange or market on which the security is principallytraded (for example, a foreign exchange or market), but before the fundcalculates its net asset value, the fund may value these investments at fairvalue as determined in accordance with the procedures approved by thefund’s Board of Directors (the “Board”). Certain factors may be con-sidered when fair valuing investments such as: fundamental analyticaldata, the nature and duration of restrictions on disposition, an evalua-
22
N O T E S T O F I N A N C I A L S TAT E M E N T S (continued)

tion of the forces that influence the market in which the securities arepurchased and sold, and public trading in similar securities of the issueror comparable issuers. These securities are either categorized withinLevel 2 or 3 depending on the relevant inputs used.
For restricted securities where observable inputs are limited, assump-tions about market activity and risk are used and are categorizedwithin Level 3 of the fair value hierarchy.
The following is a summary of the inputs used as of December 31,2012 in valuing the fund’s investments:
Level 2—Other Level 3—
Level 1— Significant Significant
Unadjusted Observable Unobservable
Quoted Prices Inputs Inputs Total
Assets ($)
Investments in Securities:
Equity Securities— Domestic Common Stocks† 203,709,293 — — 203,709,293
Equity Securities— Foreign Common Stocks† 7,688,364 — — 7,688,364
Mutual Funds 10,429,334 — — 10,429,334
† See Statement of Investments for additional detailed categorizations.
At December 31, 2012, there were no transfers between Level 1 andLevel 2 of the fair value hierarchy.
(b) Securities transactions and investment income: Securities trans-actions are recorded on a trade date basis. Realized gains and lossesfrom securities transactions are recorded on the identified cost basis.Dividend income is recognized on the ex-dividend date and interestincome, including, where applicable, accretion of discount and amor-tization of premium on investments, is recognized on the accrual basis.
T h e F u n d 23

Pursuant to a securities lending agreement with The Bank of NewYork Mellon, a subsidiary of BNY Mellon and an affiliate of Dreyfus,the fund may lend securities to qualified institutions. It is the fund’spolicy that, at origination, all loans are secured by collateral of at least102% of the value of U.S. securities loaned and 105% of the value offoreign securities loaned. Collateral equivalent to at least 100% of themarket value of securities on loan is maintained at all times. Collateralis either in the form of cash, which can be invested in certain moneymarket mutual funds managed by the Manager, U.S. Government andAgency securities or letters of credit. The fund is entitled to receive allincome on securities loaned, in addition to income earned as a resultof the lending transaction. Although each security loaned is fully col-lateralized, the fund bears the risk of delay in recovery of, or loss ofrights in, the securities loaned should a borrower fail to return thesecurities in a timely manner. During the period ended December 31,2012, The Bank of New York Mellon earned $66,264 from lendingportfolio securities, pursuant to the securities lending agreement.
(c) Affiliated issuers: Investments in other investment companiesadvised by Dreyfus are defined as “affiliated” in the Act. Investmentsin affiliated investment companies for the period ended December 31,2012 were as follows:
Affiliated Investment Value Value Net Company 12/31/2011 ($) Purchases ($) Sales ($) 12/31/2012 ($) Assets (%)
Dreyfus Institutional Preferred Plus Money Market Fund 1,532,244 23,645,793 23,213,818 1,964,219 .9
Dreyfus Institutional Cash Advantage Fund 8,730,754 112,353,127 112,618,766 8,465,115 4.0
Total 10,262,998 135,998,920 135,832,584 10,429,334 4.9
24
N O T E S T O F I N A N C I A L S TAT E M E N T S (continued)

(d) Dividends to shareholders: Dividends are recorded on the ex-dividend date. Dividends from investment income-net and dividendsfrom net realized capital gains, if any, are normally declared and paidannually, but the fund may make distributions on a more frequent basisto comply with the distribution requirements of the Internal RevenueCode of 1986, as amended (the “Code”). To the extent that net real-ized capital gains can be offset by capital loss carryovers, it is the policyof the fund not to distribute such gains. Income and capital gain dis-tributions are determined in accordance with income tax regulations,which may differ from GAAP.
(e) Federal income taxes: It is the policy of the fund to continue toqualify as a regulated investment company, if such qualification is in thebest interests of its shareholders, by complying with the applicable pro-visions of the Code, and to make distributions of taxable income suffi-cient to relieve it from substantially all federal income and excise taxes.
As of and during the period ended December 31, 2012, the fund didnot have any liabilities for any uncertain tax positions. The fund rec-ognizes interest and penalties, if any, related to uncertain tax positionsas income tax expense in the Statement of Operations. During theperiod, the fund did not incur any interest or penalties.
Each of the tax years in the four-year period ended December 31,2012 remains subject to examination by the Internal Revenue Serviceand state taxing authorities.
At December 31, 2012, the components of accumulated earnings on atax basis were as follows: undistributed ordinary income $2,979,615,accumulated capital losses $3,414,859 and unrealized appreciation$28,645,019. In addition, the fund had $2,340,499 of capital lossesrealized after October 31, 2012, which were deferred for tax purposesto the first day of the following fiscal year.
T h e F u n d 25

Under the Regulated Investment Company Modernization Act of 2010(the “2010 Act”), the fund is permitted to carry forward capital lossesincurred in taxable years beginning after December 22, 2010 (“post-enactment losses”) for an unlimited period. Furthermore, post-enactmentcapital loss carryovers retain their character as either short-term or long-term capital losses rather than short-term as they were under previousstatute. The 2010 Act requires post-enactment losses to be utilized beforethe utilization of losses incurred in taxable years prior to the effective dateof the 2010 Act (“pre-enactment losses”). As a result of this ordering rule,pre-enactment losses may be more likely to expire unused.
The accumulated capital loss carryover is available for federal incometax purposes to be applied against future net realized capital gains, ifany, realized subsequent to December 31, 2012. If not applied, the car-ryover expires in fiscal year 2017.
The tax character of distributions paid to shareholders during the fiscalperiods ended December 31, 2012 and December 31, 2011 were asfollows: ordinary income $1,812,586 and $2,035,303, respectively.
NOTE 2—Bank Lines of Credit:
The fund participates with other Dreyfus-managed funds in a $210million unsecured credit facility led by Citibank, N.A. and a $300 mil-lion unsecured credit facility provided by The Bank of New YorkMellon (each, a “Facility”), each to be utilized primarily for temporaryor emergency purposes, including the financing of redemptions. Priorto October 10, 2012, the unsecured credit facility with Citibank, N.A.,was $225 million. In connection therewith, the fund has agreed to payits pro rata portion of commitment fees for each Facility. Interest ischarged to the fund based on rates determined pursuant to the termsof the respective Facility at the time of borrowing.
The average amount of borrowings outstanding under the Facilities dur-ing the period ended December 31, 2012 was approximately $12,000with a related weighted average annualized interest rate of 1.18%.
26
N O T E S T O F I N A N C I A L S TAT E M E N T S (continued)

NOTE 3—Management Fee and Other Transactions WithAffiliates:
(a) Pursuant to a management agreement with the Manager, the man-agement fee is computed at the annual rate of .75% of the value of thefund’s average daily net assets and is payable monthly.
(b) Under the Distribution Plan adopted pursuant to Rule 12b-1 underthe Act, Service shares pay the Distributor for distributing its shares, forservicing and/or maintaining Service shares’ shareholder accounts andfor advertising and marketing for Service shares. The Distribution Planprovides for payments to be made at an annual rate of .25% of the valueof the Service shares’ average daily net assets. The Distributor may makepayments to Participating Insurance Companies and to brokers anddealers acting as principal underwriter for their variable insuranceproducts. The fees payable under the Distribution Plan are payablewithout regard to actual expenses incurred. During the period endedDecember 31, 2012, Service shares were charged $16,451 pursuant tothe Distribution Plan.
(c) Under the Shareholder Services Plan, Initial shares reimburse theDistributor an amount not to exceed an annual rate of .25% of thevalue of the Initial shares average daily net assets for certain allocatedexpenses with respect to servicing and/or maintaining Initial sharesshareholder accounts.
The fund has arrangements with the transfer agent and the custodianwhereby the fund may receive earnings credits when positive cashbalances are maintained, which are used to offset transfer agency andcustody fees. For financial reporting purposes, the fund includes netearnings credits as an expense offset in the Statement of Operations.
The fund compensates Dreyfus Transfer, Inc., a wholly-owned subsidiaryof the Manager, under a transfer agency agreement for providing transferagency services for the fund and, since May 29, 2012, cash management
T h e F u n d 27

services related to fund subscriptions and redemptions. During the periodended December 31, 2012, the fund was charged $1,311 for transferagency services and $43 for cash management services. Cash manage-ment fees were partially offset by earnings credits of $5. These fees areincluded in Shareholder servicing costs in the Statement of Operations.
The fund compensates The Bank of New York Mellon under a cus-tody agreement for providing custodial services for the fund. Duringthe period ended December 31, 2012, the fund was charged $18,459pursuant to the custody agreement.
Prior to May 29, 2012, the fund compensated The Bank of New YorkMellon under a cash management agreement for performing cashmanagement services related to fund subscriptions and redemptions.During the period ended December 31, 2012, the fund was charged$99 pursuant to the cash management agreement, which is included inShareholder servicing costs in the Statement of Operations. These feeswere partially offset by earnings credits of $4.
During the period ended December 31, 2012, the fund was charged$8,783 for services performed by the Chief Compliance Officer andhis staff.
The components of “Due to The Dreyfus Corporation and affiliates”in the Statement of Assets and Liabilities consist of: management fees$136,183, Distribution Plan fees $1,391, Shareholder Services Planfees $5,810, custodian fees $6,540, Chief Compliance Officer fees$3,981 and transfer agency fees $418.
(d) Each Board member also serves as a Board member of other fundswithin the Dreyfus complex. Annual retainer fees and attendance feesare allocated to each fund based on net assets.
28
N O T E S T O F I N A N C I A L S TAT E M E N T S (continued)

NOTE 4—Securities Transactions:
The aggregate amount of purchases and sales of investment securities,excluding short-term securities, during the period ended December 31,2012, amounted to $108,510,900 and $131,812,487, respectively.
At December 31, 2012, the cost of investments for federal incometax purposes was $193,181,972; accordingly, accumulated net unre-alized appreciation on investments was $28,645,019, consisting of$34,443,258 gross unrealized appreciation and $5,798,239 grossunrealized depreciation.
T h e F u n d 29

Shareholders and Board of DirectorsThe Dreyfus Socially Responsible Growth Fund, Inc.
We have audited the accompanying statement of assets and liabilities ofThe Dreyfus Socially Responsible Growth Fund, Inc., including thestatement of investments, as of December 31, 2012, and the related state-ment of operations for the year then ended, the statement of changes innet assets for each of the two years in the period then ended, and thefinancial highlights for each of the five years in the period then ended.These financial statements and financial highlights are the responsibilityof the Fund’s management. Our responsibility is to express an opinion onthese financial statements and financial highlights based on our audits.We conducted our audits in accordance with the standards of the PublicCompany Accounting Oversight Board (United States). Those standardsrequire that we plan and perform the audit to obtain reasonable assur-ance about whether the financial statements and financial highlightsare free of material misstatement. We were not engaged to perform anaudit of the Fund’s internal control over financial reporting. Our auditsincluded consideration of internal control over financial reporting asa basis for designing audit procedures that are appropriate in the cir-cumstances, but not for the purpose of expressing an opinion on theeffectiveness of the Fund’s internal control over financial reporting.Accordingly, we express no such opinion. An audit also includes exam-ining, on a test basis, evidence supporting the amounts and disclosures inthe financial statements and financial highlights, assessing the account-ing principles used and significant estimates made by management, andevaluating the overall financial statement presentation. Our proceduresincluded confirmation of securities owned as of December 31, 2012 bycorrespondence with the custodian and others. We believe that ouraudits provide a reasonable basis for our opinion.In our opinion, the financial statements and financial highlights referredto above present fairly, in all material respects, the financial position ofThe Dreyfus Socially Responsible Growth Fund, Inc., at December 31,2012, the results of its operations for the year then ended, the changes inits net assets for each of the two years in the period then ended, and thefinancial highlights for each of the five years in the period then ended,in conformity with U.S. generally accepted accounting principles.
New York, New YorkFebruary 13, 2013
30
R E P O R T O F I N D E P E N D E N T R E G I S T E R E D P U B L I C A C C O U N T I N G F I R M

For federal tax purposes, the fund hereby reports 100% of the ordinarydividends paid during the fiscal year ended December 31, 2012 as qual-ifying for the corporate dividends received deduction. Shareholders willreceive notification in early 2013 of the percentage applicable to thepreparation of their 2012 income tax returns.
T h e F u n d 31
I M P O R TA N T TA X I N F O R M AT I O N ( U n a u d i t e d )

At a meeting of the fund’s Board of Directors held on July 18 and 19,2012, the Board considered the renewal of the fund’s ManagementAgreement pursuant to which Dreyfus provides the fund with invest-ment advisory and administrative services (the “Agreement”). TheBoard members, none of whom are “interested persons” (as defined inthe Investment Company Act of 1940, as amended) of the fund, wereassisted in their review by independent legal counsel and met withcounsel in executive session separate from Dreyfus representatives. Inconsidering the renewal of the Agreement, the Board considered allfactors that it believed to be relevant, including those discussed below.The Board did not identify any one factor as dispositive, and each Boardmember may have attributed different weights to the factors considered.
Analysis of Nature, Extent, and Quality of Services Provided to theFund.The Board considered information previously provided to themin presentations from Dreyfus representatives regarding the nature,extent, and quality of the services provided to funds in the Dreyfus fundcomplex, and Dreyfus representatives confirmed that there had been nomaterial changes in this information. Dreyfus provided the number ofopen accounts in the fund, the fund’s asset size and the allocation of fundassets among distribution channels. Dreyfus also had previously providedinformation regarding the diverse intermediary relationships and distri-bution channels of funds in the Dreyfus fund complex (such as retaildirect or intermediary, in which intermediaries typically are paid by thefund and/or Dreyfus) and Dreyfus’ corresponding need for broad, deep,and diverse resources to be able to provide ongoing shareholder servicesto each intermediary or distribution channel, as applicable to the fund.
The Board also considered research support available to, and portfoliomanagement capabilities of, the fund’s portfolio management personneland that Dreyfus also provides oversight of day-to-day fund operations,including fund accounting and administration and assistance in meetinglegal and regulatory requirements. The Board also considered Dreyfus’extensive administrative, accounting, and compliance infrastructures.The Board also considered portfolio management’s brokerage policies
32
INFORMATION ABOUT THE RENEWAL OF THE FUND’S MANAGEMENT AGREEMENT (Unaudited)

and practices (including policies and practices regarding soft dollars)and the standards applied in seeking best execution.
Comparative Analysis of the Fund’s Performance and Management Feeand Expense Ratio. The Board reviewed reports prepared by Lipper,Inc. (“Lipper”), an independent provider of investment company data,which included information comparing (1) the fund’s performancewith the performance of a group of comparable funds (“PerformanceGroup 1”) and with a broader group of funds (“Performance Universe1”), with each group consisting of funds from the same LipperCategory as that of the fund, all for various periods ended May 31,2012, (2) the fund’s performance with the performance of a group ofsocial criteria funds from different Lipper categories included at therequest of Dreyfus (“Performance Group 2”) and with a broader groupof funds (“Performance Universe 2”), all for various periods ended May31, 2012, and (3) the fund’s actual and contractual management fees andtotal expenses with those of groups of comparable funds identical toPerformance Group 1 (“Expense Group 1”) and Performance Group 2(“Expense Group 2”) and with broader groups of funds that includedthe Performance Group 1 funds (“Expense Universe 1”) and thePerformance Group 2 funds (“Expense Universe 2”), the informationfor which was derived in part from fund financial statements availableto Lipper as of the date of its analysis. Dreyfus previously had furnishedthe Board with a description of the methodology Lipper used to selectthe Performance Groups and Performance Universes and the ExpenseGroups and Expense Universes.
Dreyfus representatives stated that the usefulness of performance compar-isons may be affected by a number of factors, including different invest-ment limitations that may be applicable to the fund and comparisonfunds. The Board discussed the results of the comparisons and noted thatthe fund’s total return performance was at or above the medians of thePerformance Groups and Performance Universes for all periods exceptthe ten-year period. Dreyfus also provided a comparison of the fund’s cal-endar year total returns to the returns of the fund’s benchmark index.
T h e F u n d 33

The Board also reviewed the range of actual and contractual manage-ment fees and total expenses of the funds in each Expense Group andeach Expense Universe and discussed the results of the comparisons.The Board noted that the fund’s contractual management fee was atthe Expense Group 1 median and above the Expense Group 2 median,the fund’s actual management fee was at the Expense Group 1 medianand above the Expense Universe 1, Expense Group 2 and ExpenseUniverse 2 medians and the fund’s total expenses were above theExpense Group 1 median and below the Expense Universe 1, ExpenseGroup 2 and Expense Universe 2 medians.
Dreyfus representatives reviewed with the Board the management orinvestment advisory fees (1) paid by funds advised or administered byDreyfus that are in the same Lipper category as the fund and (2) paidto Dreyfus or the Dreyfus-affiliated primary employer of the fund’s pri-mary portfolio manager(s) for advising any separate accounts and/orother types of client portfolios that are considered to have similarinvestment strategies and policies as the fund (the “Similar Clients”),and explained the nature of the Similar Clients. They discussed differ-ences in fees paid and the relationship of the fees paid in light of anydifferences in the services provided and other relevant factors. TheBoard considered the relevance of the fee information provided for theSimilar Clients to evaluate the appropriateness and reasonableness ofthe fund’s management fee.
Analysis of Profitability and Economies of Scale. Dreyfus representa-tives reviewed the expenses allocated and profit received by Dreyfusand the resulting profitability percentage for managing the fund andthe aggregate profitability percentage to Dreyfus of managing thefunds in the Dreyfus fund complex, and the method used to determinethe expenses and profit. The Board concluded that the profitabilityresults were not unreasonable, given the services rendered and servicelevels provided by Dreyfus. The Board also had been provided withinformation prepared by an independent consulting firm regardingDreyfus’ approach to allocating costs to, and determining the prof-itability of, individual funds and the entire Dreyfus fund complex. The
34
I N FO R M AT I O N A B O U T T H E R E N E WA L O F T H E F U N D ’ S M A N A G E M E N T A G R E E M E N T ( U n a u d i t e d ) (continued)

consulting firm also had analyzed where any economies of scale mightemerge in connection with the management of a fund.
The Board’s counsel stated that the Board should consider the profitabil-ity analysis (1) as part of the evaluation of whether the fees under theAgreement bear a reasonable relationship to the mix of services providedby Dreyfus, including the nature, extent and quality of such services, and(2) in light of the relevant circumstances for the fund and the extent towhich economies of scale would be realized if the fund grows andwhether fee levels reflect these economies of scale for the benefit of fundshareholders. Dreyfus representatives noted that a discussion ofeconomies of scale is predicated on a fund having achieved a substantialsize with increasing assets and that, if a fund’s assets had been stable ordecreasing, the possibility that Dreyfus may have realized any economiesof scale would be less. Dreyfus representatives also noted that, as a resultof shared and allocated costs among funds in the Dreyfus fund complex,the extent of economies of scale could depend substantially on the levelof assets in the complex as a whole, so that increases and decreases incomplex-wide assets can affect potential economies of scale in a mannerthat is disproportionate to, or even in the opposite direction from,changes in the fund’s asset level. The Board also considered potentialbenefits to Dreyfus from acting as investment adviser and noted the softdollar arrangements in effect for trading the fund’s investments.
At the conclusion of these discussions, the Board agreed that it hadbeen furnished with sufficient information to make an informedbusiness decision with respect to the renewal of the Agreement. Basedon the discussions and considerations as described above, the Boardconcluded and determined as follows.
• The Board concluded that the nature, extent and quality of theservices provided by Dreyfus are adequate and appropriate.
• The Board was satisfied with the fund’s relative performance.
• The Board concluded that the fee paid to Dreyfus was reasonable inlight of the considerations described above.
T h e F u n d 35

• The Board determined that the economies of scale which may accrueto Dreyfus and its affiliates in connection with the management of thefund had been adequately considered by Dreyfus in connection withthe fee rate charged to the fund pursuant to the Agreement and that,to the extent in the future it were determined that materialeconomies of scale had not been shared with the fund, the Boardwould seek to have those economies of scale shared with the fund.
In evaluating the Agreement, the Board considered these conclusionsand determinations and also relied on its previous knowledge, gainedthrough meetings and other interactions with Dreyfus and its affiliates,of the fund and the services provided to the fund by Dreyfus. The Boardalso relied on information received on a routine and regular basisthroughout the year relating to the operations of the fund and the invest-ment management and other services provided under the Agreement,including information on the investment performance of the fund incomparison to similar mutual funds and benchmark performanceindices; general market outlook as applicable to the fund; and compli-ance reports. In addition, it should be noted that the Board’s considera-tion of the contractual fee arrangements for this fund had the benefit ofa number of years of reviews of prior or similar agreements duringwhich lengthy discussions took place between the Board and Dreyfusrepresentatives. Certain aspects of the arrangements may receive greaterscrutiny in some years than in others, and the Board’s conclusions maybe based, in part, on their consideration of the same or similar arrange-ments in prior years. The Board determined that renewal of theAgreement was in the best interests of the fund and its shareholders.
36
I N FO R M AT I O N A B O U T T H E R E N E WA L O F T H E F U N D ’ S M A N A G E M E N T A G R E E M E N T ( U n a u d i t e d ) (continued)

Joseph S. DiMartino (69)Chairman of the Board (1995)
Principal Occupation During Past 5 Years:• Corporate Director and Trustee
Other Public Company Board Memberships During Past 5 Years:• CBIZ (formerly, Century Business Services, Inc.), a provider of outsourcing functions for small
and medium size companies, Director (1997-present)• Sunair Services Corporation, a provider of certain outdoor-related services to homes and
businesses, Director (2005-2009) • The Newark Group, a provider of a national market of paper recovery facilities, paperboard
mills and paperboard converting plants, Director (2000-2010)
No. of Portfolios for which Board Member Serves: 151
———————Clifford L. Alexander, Jr. (79)Board Member (1992)
Principal Occupation During Past 5 Years:• President of Alexander & Associates, Inc., a management consulting firm ( January 1981-present)
No. of Portfolios for which Board Member Serves: 41
———————Gordon J. Davis (71)Board Member (2012)
Principal Occupation During Past 5 Years:• Partner in the law firm of Venable, LLP (2012-present)• Partner in the law firm of Dewey & LeBoeuf, LLP (1994-2012)
Other Public Company Board Memberships During Past 5 Years:• Consolidated Edison, Inc., a utility company, Director (1997-present)• The Phoenix Companies, Inc., a life insurance company, Director (2000-present)
No. of Portfolios for which Board Member Serves: 46
———————Whitney I. Gerard (78)Board Member (2003)
Principal Occupation During Past 5 Years:• Partner of Chadbourne & Parke LLP
No. of Portfolios for which Board Member Serves: 22
T h e F u n d 37
B O A R D M E M B E R S I N F O R M AT I O N ( U n a u d i t e d )

Nathan Leventhal (69)Board Member (2009)
Principal Occupation During Past 5 Years:• Chairman of the Avery-Fisher Artist Program (November 1997-present)• Commissioner, NYC Planning Commission (March 2007-November 2011)
Other Public Company Board Memberships During Past 5 Years:• Movado Group, Inc., Director (2003-present)
No. of Portfolios for which Board Member Serves: 39
———————George L. Perry (78)Board Member (2003)
Principal Occupation During Past 5 Years:• Economist and Senior Fellow at Brookings Institution
No. of Portfolios for which Board Member Serves: 22
———————Benaree Pratt Wiley (66)Board Member (2009)
Principal Occupation During Past 5 Years:• Principal, The Wiley Group, a firm specializing in strategy and business development (2005-present)
Other Public Company Board Memberships During Past 5 Years:• CBIZ (formerly, Century Business Services, Inc.), a provider of outsourcing functions for small
and medium size companies, Director (2008-present)
No. of Portfolios for which Board Member Serves: 60
———————Once elected all Board Members serve for an indefinite term, but achieve Emeritus status upon reaching age 80. Theaddress of the Board Members and Officers is c/o The Dreyfus Corporation, 200 Park Avenue, New York, New York10166. Additional information about the Board Members is available in the fund’s Statement of Additional Informationwhich can be obtained from Dreyfus free of charge by calling this toll free number: 1-800-DREYFUS.
Lucy Wilson Benson, Emeritus Board MemberDavid W. Burke, Emeritus Board MemberArthur A. Hartman, Emeritus Board Member
38
B O A R D M E M B E R S I N F O R M AT I O N ( U n a u d i t e d ) (continued)

BRADLEY J. SKAPYAK, President sinceJanuary 2010.
Chief Operating Officer and a director of theManager since June 2009; from April 2003 toJune 2009, Mr. Skapyak was the head of theInvestment Accounting and SupportDepartment of the Manager. He is an officerof 69 investment companies (comprised of 150portfolios) managed by the Manager. He is 54years old and has been an employee of theManager since February 1988.
JANETTE E. FARRAGHER, Vice Presidentand Secretary since December 2011.
Assistant General Counsel of BNY Mellon,and an officer of 70 investment companies(comprised of 177 portfolios) managed by theManager. She is 50 years old and has been anemployee of the Manager since February 1984.
KIESHA ASTWOOD, Vice President andAssistant Secretary since January 2010.
Counsel of BNY Mellon, and an officer of 70investment companies (comprised of 177portfolios) managed by the Manager. She is 39years old and has been an employee of theManager since July 1995.
JAMES BITETTO, Vice President andAssistant Secretary since August 2005.
Senior Counsel of BNY Mellon and Secretaryof the Manager, and an officer of 70investment companies (comprised of 177portfolios) managed by the Manager. He is 46years old and has been an employee of theManager since December 1996.
JONI LACKS CHARATAN, Vice Presidentand Assistant Secretary since August 2005.
Senior Counsel of BNY Mellon, and an officerof 70 investment companies (comprised of 177portfolios) managed by the Manager. She is 57years old and has been an employee of theManager since October 1988.
JOSEPH M. CHIOFFI, Vice President andAssistant Secretary since August 2005.
Senior Counsel of BNY Mellon, and an officerof 70 investment companies (comprised of 177portfolios) managed by the Manager. He is 51years old and has been an employee of theManager since June 2000.
JOHN B. HAMMALIAN, Vice President andAssistant Secretary since August 2005.
Senior Managing Counsel of BNY Mellon,and an officer of 70 investment companies(comprised of 177 portfolios) managed by theManager. He is 49 years old and has been anemployee of the Manager since February 1991.
ROBERT R. MULLERY, Vice President andAssistant Secretary since August 2005.
Managing Counsel of BNY Mellon, and anofficer of 70 investment companies (comprisedof 177 portfolios) managed by the Manager.He is 60 years old and has been an employeeof the Manager since May 1986.
JEFF PRUSNOFSKY, Vice President andAssistant Secretary since August 2005.
Senior Managing Counsel of BNY Mellon,and an officer of 70 investment companies(comprised of 177 portfolios) managed by theManager. He is 47 years old and has been anemployee of the Manager since October 1990.
JAMES WINDELS, Treasurer sinceNovember 2001.
Director – Mutual Fund Accounting of theManager, and an officer of 70 investmentcompanies (comprised of 177 portfolios)managed by the Manager. He is 54 years oldand has been an employee of the Managersince April 1985.
T h e F u n d 39
O F F I C E R S O F T H E F U N D ( U n a u d i t e d )

40
O F F I C E R S O F T H E F U N D ( U n a u d i t e d ) (continued)
RICHARD CASSARO, Assistant Treasurersince January 2008.
Senior Accounting Manager – Money Marketand Municipal Bond Funds of the Manager,and an officer of 70 investment companies(comprised of 177 portfolios) managed by the Manager. He is 53 years old and has been an employee of the Manager sinceSeptember 1982.
GAVIN C. REILLY, Assistant Treasurersince December 2005.
Tax Manager of the Investment Accountingand Support Department of the Manager, andan officer of 70 investment companies(comprised of 177 portfolios) managed by theManager. He is 44 years old and has been anemployee of the Manager since April 1991.
ROBERT S. ROBOL, Assistant Treasurersince August 2005.
Senior Accounting Manager – Fixed IncomeFunds of the Manager, and an officer of 70investment companies (comprised of 177portfolios) managed by the Manager. He is 48years old and has been an employee of theManager since October 1988.
ROBERT SALVIOLO, Assistant Treasurersince July 2007.
Senior Accounting Manager – Equity Funds ofthe Manager, and an officer of 70 investmentcompanies (comprised of 177 portfolios)managed by the Manager. He is 45 years oldand has been an employee of the Managersince June 1989.
ROBERT SVAGNA, Assistant Treasurersince December 2002.
Senior Accounting Manager – Equity Funds ofthe Manager, and an officer of 70 investmentcompanies (comprised of 177 portfolios)managed by the Manager. He is 45 years oldand has been an employee of the Managersince November 1990.
JOSEPH W. CONNOLLY, Chief ComplianceOfficer since October 2004.
Chief Compliance Officer of the Manager andThe Dreyfus Family of Funds (70 investmentcompanies, comprised of 177 portfolios). He is55 years old and has served in variouscapacities with the Manager since 1980,including manager of the firm’s FundAccounting Department from 1997 throughOctober 2001.
MATTHEW D. CONNOLLY, Anti-MoneyLaundering Compliance Officer since April 2012.
Anti-Money Laundering Compliance Officerof the Distributor since October 2011; fromMarch 2010 to September 2011, Global Head,KYC Reviews and Director, UBS InvestmentBank; until March 2010, AML ComplianceOfficer and Senior Vice President, Citi GlobalWealth Management. He is an officer of 66investment companies (comprised of 173portfolios) managed by the Manager. He is 40years old and has been an employee of theDistributor since October 2011.


The Dreyfus Socially ResponsibleGrowth Fund, Inc.
200 Park AvenueNew York, NY 10166
Manager
The Dreyfus Corporation200 Park AvenueNew York, NY 10166
Custodian
The Bank of New York MellonOne Wall StreetNew York, NY 10286
Transfer Agent &Dividend Disbursing Agent
Dreyfus Transfer, Inc.200 Park AvenueNew York, NY 10166
Distributor
MBSC Securities Corporation200 Park AvenueNew York, NY 10166
For More Information
© 2013 MBSC Securities Corporation 0111AR1212
Telephone 1-800-554-4611 or 1-516-338-3300
Mail The Dreyfus Family of Funds, 144 Glenn Curtiss Boulevard, Uniondale, NY 11556-0144Attn: Investments Division
The fund files its complete schedule of portfolio holdings with the Securities and Exchange
Commission (“SEC”) for the first and third quarters of each fiscal year on Form N-Q. The
fund’s Forms N-Q are available on the SEC’s website at http://www.sec.gov and may be
reviewed and copied at the SEC’s Public Reference Room in Washington, DC. Information on
the operation of the Public Reference Room may be obtained by calling 1-800-SEC-0330.
A description of the policies and procedures that the fund uses to determine how to vote
proxies relating to portfolio securities, and information regarding how the fund voted
these proxies for the most recent 12-month period ended June 30 is available at
http://www.dreyfus.com and on the SEC’s website at http://www.sec.gov. The
description of the policies and procedures is also available without charge,
upon request, by calling 1-800-DREYFUS.
®
Printed on recycled paper.50% post-consumer.Process chlorine free.Vegetable-based ink.
Printed in U.S.A.

DreyfusInvestment Portfolios,Technology GrowthPortfolio
ANNUAL REPORT December 31, 2012

The views expressed in this report reflect those of the portfoliomanager only through the end of the period covered and do notnecessarily represent the views of Dreyfus or any other person inthe Dreyfus organization. Any such views are subject to change atany time based upon market or other conditions and Dreyfus dis-claims any responsibility to update such views. These views may notbe relied on as investment advice and, because investment decisionsfor a Dreyfus fund are based on numerous factors, may not be reliedon as an indication of trading intent on behalf of any Dreyfus fund.
Not FDIC-Insured • Not Bank-Guaranteed • May Lose Value

Contents
T H E F U N D
2 A Letter from the President
3 Discussion of Fund Performance
6 Fund Performance
8 Understanding Your Fund’s Expenses
8 Comparing Your Fund’s Expenses With Those of Other Funds
9 Statement of Investments
12 Statement of Assets and Liabilities
13 Statement of Operations
14 Statement of Changes in Net Assets
15 Financial Highlights
17 Notes to Financial Statements
26 Report of Independent Registered Public Accounting Firm
27 Proxy Results
28 Information About the Renewal of the Fund’s Management Agreement
33 Board Members Information
35 Officers of the Fund
F O R M O R E I N F O R M AT I O N
Back Cover

2
Dreyfus Investment Portfolios,Technology Growth Portfolio The Fund
A L E T T E R F R O M T H E P R E S I D E N T
Dear Shareholder:
We are pleased to present this annual report for Dreyfus Investment Portfolios,Technology Growth Portfolio, covering the 12-month period from January 1, 2012,through December 31, 2012. For information about how the fund performed duringthe reporting period, as well as general market perspectives, we provide a Discussionof Fund Performance on the pages that follow.
In retrospect, 2012 was notable for the global equity markets’ resilience in the face ofsome tough macroeconomic challenges. Worries regarding sluggish employmentgrowth, weak housing markets and Congressional gridlock weighed on investorsentiment in the United States at times during the year, yet U.S. stocks postedrespectable gains, on average. An ongoing debt crisis led to recessionary conditions inEurope, particularly for some of the continent’s more peripheral nations, but aggressiveactions from monetary policymakers helped some European stock markets producedouble-digit returns. While China’s economy slowed in response to inflation-fightingmeasures, officials there appeared to have engineered a “soft landing,” and Chinesestocks generally ended the year with positive absolute returns.
We currently expect the U.S. and global economies to be modestly stronger in 2013,especially during the second half of the year. The global economy seems likely to benefitfrom Europe’s ongoing efforts to support its banking system and common currency,and by China’s moves toward more stimulative fiscal policies under new governmentleadership. In the United States, greater certainty regarding U.S. tax and fiscal policies,the resumption of postponed spending by businesses, and a continued housing recoverycould support modestly higher rates of economic growth. We encourage you to discussthe implications of our economic analysis with your financial advisor, who can help youalign your investments with the year’s challenges and opportunities.
Thank you for your continued confidence and support.
Sincerely,
J. Charles CardonaPresidentThe Dreyfus CorporationJanuary 15, 2013

T h e F u n d 3
D I S C U S S I O N O F F U N D P E R F O R M A N C E
For the period of January 1, 2012, through December 31, 2012, as provided by Barry K.Mills, CFA, Portfolio Manager
Fund and Market Performance Overview
For the 12-month period ended December 31, 2012, Dreyfus Investment Portfolios,Technology Growth Portfolio’s Initial shares produced a total return of 15.62%, andits Service shares produced a total return of 15.35%.1 The fund’s benchmarks, theMorgan Stanley High Technology 35 Index (“MS High Tech 35 Index”) and theStandard & Poor’s 500 Composite Stock Price Index (“S&P 500 Index”), producedtotal returns of 18.18% and 15.99%, respectively, over the same period.2,3
Although improving economic fundamentals generally boosted stock prices in2012, the information technology sector exceeded broader market averages due togains among companies at the forefront of major technological trends. The fundproduced lower results than the MS High Tech 35 Index, mainly due to its lack ofexposure to some of the sector’s top performers.
The Fund’s Investment Approach
The fund seeks capital appreciation. To pursue its goal the fund normally invests at least80% of its net assets in the stocks of growth companies of any size that Dreyfus believesto be leading producers or beneficiaries of technological innovation. In choosingstocks, the fund looks for technology companies with the potential for strong earningsor revenue growth rates, although some of the fund’s investments may currently beexperiencing losses. The fund’s investment process centers on a multi-dimensionalapproach that looks for opportunities across emerging growth, cyclical or stablegrowth companies. The fund’s investment approach seeks companies that appear tohave strong earnings momentum, positive earnings revisions, favorable growth, productor market cycles and/or favorable valuations.
Fundamentals Improved Amid Waning Economic Concerns
The year 2012 got off to a good start, as investors responded positively to strongcorporate earnings reports, domestic employment gains, a quantitative easing programin Europe, and less restrictive monetary and fiscal policies in China. Although investor

4
D I S C U S S I O N O F F U N D P E R F O R M A N C E (continued)
sentiment turned more cautious during the spring when the U.S. labor market’srebound slowed and concerns in Europe resurfaced, stocks generally rebounded overthe summer amid more encouraging economic news, including a short drop in the U.S.unemployment rate. They lost ground again in November as worries mounted overautomatic tax hikes and spending cuts scheduled for the start of 2013. Nevertheless,continued corporate earnings strength and signs of an improving U.S. housing marketenabled equity markets to resume their rally as the year came to a close.
Although information technology stocks participated more than fully in the broadermarket’s gains, on average, a closer look reveals mixed results within the sector.Substantial gains among companies engaged in the secular trends of cloud computing,server virtualization, data management, and mobile computing were partly offset byweakness among companies with exposure to dwindling sales of personal computers.In addition, some wireless handset manufacturers stumbled when they proved unableto create competitive products for a rapidly changing smartphone market.
Focus on Positive Secular Trends
An emphasis on companies that we regarded as beneficiaries of positive trends in thetechnology industry helped bolster the fund’s performance in 2012. However, lackof exposure to some of the year’s top performers in other areas—most notablyonline retailer eBay and enterprise software developer SAP—dampened resultscompared to the MS High Tech 35 Index.
The fund achieved better results through underweighted positions in some of thesector’s weaker areas, particularly makers of personal computers and companies thatcontribute to the industry’s supply chain. Lack of exposure to PC-related companiessuch as Hewlett-Packard, Intel, and NVIDIA proved beneficial to performance.Instead, the fund focused on companies at the forefront of cloud and mobile computing.For example, despite a swoon late in the year, electronics innovator Apple gainedsubstantial value in 2012 when it attracted more consumers to its tablets and smart-phones. Software-as-a-service specialist salesforce.com advanced as it demonstrated thevalue of cloud computing for customers’ sales management efforts. Software solutionsprovider Red Hat showed leadership in open source technologies. Internet contentdelivery specialist Akamai Technologies recovered from a shaky start to the year asmore companies added streaming video to their online capabilities.
T h e F u n d 5
In addition to disappointments related to stocks the fund did not hold, relative perfor-mance was undermined by unfortunate timing in the purchase and sale of hard drivemaker Seagate Technology. In addition, videogame producer Electronic Arts suffered aftera disappointing product launch, and data integration company Informatica missedquarterly earnings targets due to problems in its European operations.
Capital Spending May Rise
While we remain concerned regarding sluggish U.S. economic growth and continuedturmoil in Europe, we believe that the positive, secular technology trends that helpeddrive the fund’s gains over the reporting period remain intact. In addition, we expectbusiness spending on technology to accelerate in 2013, potentially benefitingcompanies with productivity-enhancing products and services. We have continued tofind relatively few opportunities among companies selling legacy technologies.
January 15, 2013
Please note, the position in any security highlighted with italicized typeface was sold during the reporting period. The technology sector has been among the most volatile sectors of the stock market. Technology companies involve
greater risk because their revenue and/or earnings tend to be less predictable and some companies may be experiencingsignificant losses.
Equity funds are subject generally to market, market sector, market liquidity, issuer and investment style risks, amongother factors, to varying degrees, all of which are more fully described in the fund’s prospectus.
The fund is only available as a funding vehicle under variable life insurance policies or variable annuity contractsissued by insurance companies. Individuals may not purchase shares of the fund directly. A variable annuity is aninsurance contract issued by an insurance company that enables investors to accumulate assets on a tax-deferred basisfor retirement or other long-term goals.
1 Total return includes reinvestment of dividends and any capital gains paid. Past performance is no guarantee of futureresults. Share price and investment return fluctuate such that upon redemption, fund shares may be worth more or lessthan their original cost. The fund’s performance does not reflect the deduction of additional charges and expensesimposed in connection with investing in variable insurance contracts, which will reduce returns.
2 SOURCE: BLOOMBERG L.P. — Reflects reinvestment of net dividends and, where applicable, capital gaindistributions. The Morgan Stanley High Technology 35 Index is an unmanaged, equal dollar-weighted index of 35stocks from the electronics-based subsectors. Investors cannot invest directly in any index.
3 SOURCE: LIPPER INC. — Reflects monthly reinvestment of dividends and, where applicable, capital gaindistributions. The Standard & Poor’s 500® Composite Stock Price Index is a widely accepted, unmanaged index ofU.S. stock market performance. Investors cannot invest directly in any index.
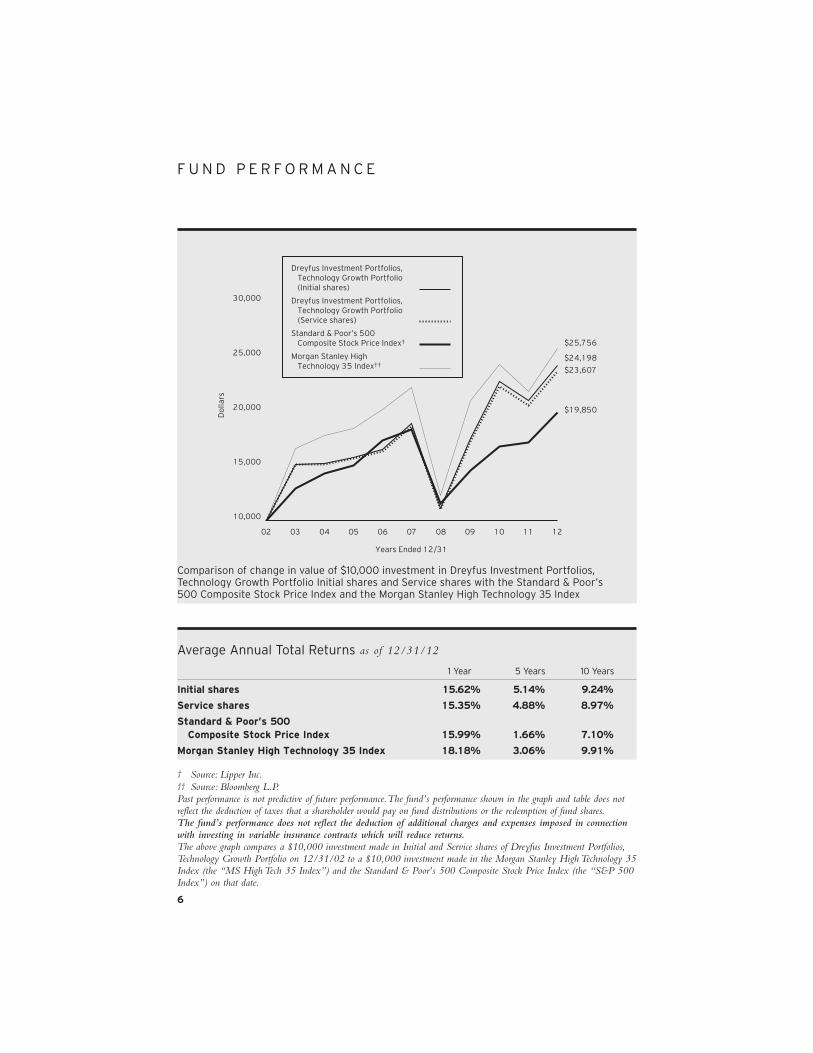
10,000
15,000
20,000
25,000
30,000
Do
llars
Years Ended 12/31
02 03 04 05 06 07 08 09 10 11 12
Dreyfus Investment Portfolios, Technology Growth Portfolio (Initial shares)
Dreyfus Investment Portfolios, Technology Growth Portfolio (Service shares)
Standard & Poor’s 500 Composite Stock Price Index†
Morgan Stanley High Technology 35 Index††
$25,756
$24,198
$23,607
$19,850
6
F U N D P E R F O R M A N C E
Comparison of change in value of $10,000 investment in Dreyfus Investment Portfolios,Technology Growth Portfolio Initial shares and Service shares with the Standard & Poor’s 500 Composite Stock Price Index and the Morgan Stanley High Technology 35 Index
Average Annual Total Returns as of 12/31/12
1 Year 5 Years 10 Years
Initial shares 15.62% 5.14% 9.24%
Service shares 15.35% 4.88% 8.97%
Standard & Poor’s 500 Composite Stock Price Index 15.99% 1.66% 7.10%
Morgan Stanley High Technology 35 Index 18.18% 3.06% 9.91%
† Source: Lipper Inc.†† Source: Bloomberg L.P.Past performance is not predictive of future performance. The fund’s performance shown in the graph and table does notreflect the deduction of taxes that a shareholder would pay on fund distributions or the redemption of fund shares.The fund’s performance does not reflect the deduction of additional charges and expenses imposed in connectionwith investing in variable insurance contracts which will reduce returns.The above graph compares a $10,000 investment made in Initial and Service shares of Dreyfus Investment Portfolios,Technology Growth Portfolio on 12/31/02 to a $10,000 investment made in the Morgan Stanley High Technology 35Index (the “MS High Tech 35 Index”) and the Standard & Poor’s 500 Composite Stock Price Index (the “S&P 500Index”) on that date.

T h e F u n d 7
The fund’s Initial shares are not subject to a Rule 12b-1 fee. The fund’s Service shares are subject to a 0.25% annualRule 12b-1 fee. All dividends and capital gain distributions are reinvested.The fund’s performance shown in the line graph above takes into account all applicable fund fees and expenses for Initialand Service shares. The MS High Tech 35 Index is an unmanaged, equal dollar-weighted index of 35 stocks from theelectronics-based subsectors. The S&P 500 Index is a widely accepted, unmanaged index of U.S. stock marketperformance. Unlike a mutual fund, the indices are not subject to charges, fees and other expenses. Investors cannot investdirectly in any index. Further information relating to fund performance, including expense reimbursements, if applicable, iscontained in the Financial Highlights section of the prospectus and elsewhere in this report.

8
Expenses and Value of a $1,000 Investmentassuming actual returns for the six months ended December 31, 2012
Initial Shares Service Shares
Expenses paid per $1,000† $ 4.26 $ 5.54
Ending value (after expenses) $1,040.60 $1,039.40
U N D E R S TA N D I N G YO U R F U N D ’ S E X P E N S E S ( U n a u d i t e d )
As a mutual fund investor, you pay ongoing expenses, such as management fees and other expenses.Using the information below, you can estimate how these expenses affect your investment and comparethem with the expenses of other funds. You also may pay one-time transaction expenses, including salescharges (loads), redemption fees and expenses associated with variable annuity or insurance contracts,which are not shown in this section and would have resulted in higher total expenses. For moreinformation, see your fund’s prospectus or talk to your financial adviser.
Review your fund’s expenses
The table below shows the expenses you would have paid on a $1,000 investment in DreyfusInvestment Portfolios, Technology Growth Portfolio from July 1, 2012 to December 31,2012. It also shows how much a $1,000 investment would be worth at the close of theperiod, assuming actual returns and expenses.
Expenses and Value of a $1,000 Investmentassuming a hypothetical 5% annualized return for the six months ended December 31, 2012
Initial Shares Service Shares
Expenses paid per $1,000† $ 4.22 $ 5.48
Ending value (after expenses) $1,020.96 $1,019.71
C O M P A R I N G Y O U R F U N D ’ S E X P E N S E S W I T H T H O S E O F O T H E R F U N D S ( U n a u d i t e d )
Using the SEC’s method to compare expenses
The Securities and Exchange Commission (SEC) has established guidelines to helpinvestors assess fund expenses. Per these guidelines, the table below shows your fund’sexpenses based on a $1,000 investment, assuming a hypothetical 5% annualized return.You can use this information to compare the ongoing expenses (but not transactionexpenses or total cost) of investing in the fund with those of other funds. All mutual fundshareholder reports will provide this information to help you make this comparison.Please note that you cannot use this information to estimate your actual ending accountbalance and expenses paid during the period.
† Expenses are equal to the fund’s annualized expense ratio of .83% for Initial Shares and 1.08% for Service Shares,multiplied by the average account value over the period, multiplied by 184/366 (to reflect the one-half year period).
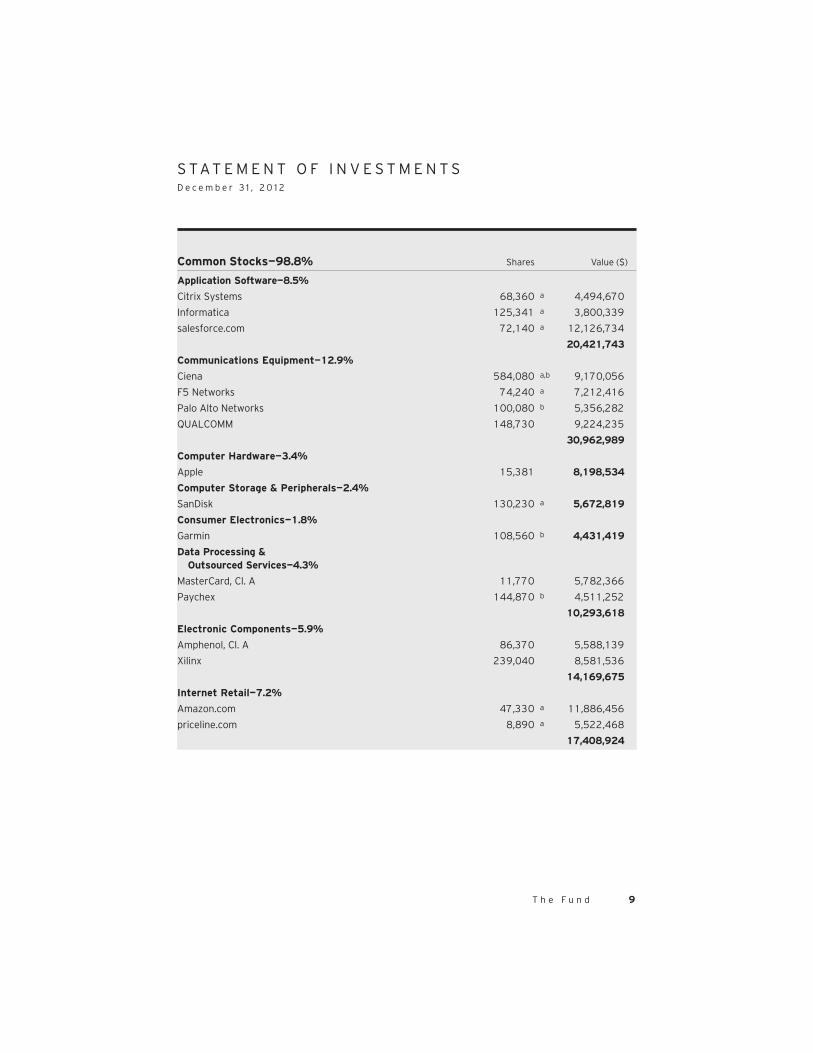
T h e F u n d 9
Common Stocks—98.8% Shares Value ($)
Application Software—8.5%
Citrix Systems 68,360 a 4,494,670
Informatica 125,341 a 3,800,339
salesforce.com 72,140 a 12,126,734
20,421,743
Communications Equipment—12.9%
Ciena 584,080 a,b 9,170,056
F5 Networks 74,240 a 7,212,416
Palo Alto Networks 100,080 b 5,356,282
QUALCOMM 148,730 9,224,235
30,962,989
Computer Hardware—3.4%
Apple 15,381 8,198,534
Computer Storage & Peripherals—2.4%
SanDisk 130,230 a 5,672,819
Consumer Electronics—1.8%
Garmin 108,560 b 4,431,419
Data Processing & Outsourced Services—4.3%
MasterCard, Cl. A 11,770 5,782,366
Paychex 144,870 b 4,511,252
10,293,618
Electronic Components—5.9%
Amphenol, Cl. A 86,370 5,588,139
Xilinx 239,040 8,581,536
14,169,675
Internet Retail—7.2%
Amazon.com 47,330 a 11,886,456
priceline.com 8,890 a 5,522,468
17,408,924
S TAT E M E N T O F I N V E S T M E N T SD e c e m b e r 3 1 , 2 0 1 2

S TAT E M E N T O F I N V E S T M E N T S (continued)
Internet Software & Services—15.0%
Akamai Technologies 335,720 a 13,734,305
Google, Cl. A 13,850 a 9,824,774
LinkedIn, Cl. A 107,230 a 12,312,149
35,871,228
IT Consulting & Other Services—6.1%
Cognizant Technology Solutions, Cl. A 114,795 a 8,500,569
Teradata 99,100 a 6,133,299
14,633,868
Semiconductors—21.6%
Analog Devices 241,050 10,138,563
Avago Technologies 239,940 7,596,500
Broadcom, Cl. A 255,630 a 8,489,472
Skyworks Solutions 375,370 a 7,620,011
Taiwan Semiconductor Manufacturing, ADR 498,600 8,555,976
Texas Instruments 303,440 9,388,434
51,788,956
Systems Software—9.7%
Oracle 282,703 9,419,664
Red Hat 113,960 a 6,035,322
VMware, Cl. A 82,450 a 7,761,843
23,216,829
Total Common Stocks (cost $202,542,503) 237,070,602
Other Investment—1.3%
Registered Investment Company;
Dreyfus Institutional Preferred Plus Money Market Fund (cost $3,054,491) 3,054,491 c 3,054,491
10
Common Stocks (continued) Shares Value ($)

Registered Investment Company;
Dreyfus Institutional Cash Advantage Fund (cost $15,302,500) 15,302,500 c 15,302,500
Total Investments (cost $220,899,494) 106.5% 255,427,593
Liabilities, Less Cash and Receivables (6.5%) (15,666,259)
Net Assets 100.0% 239,761,334
T h e F u n d 11
Investment of Cash Collateral for Securities Loaned—6.4% Shares Value ($)
ADR—American Depository Receiptsa Non-income producing security.b Security, or portion thereof, on loan. At December 31, 2012, the value of the fund’s securities on loan was
$15,212,220 and the value of the collateral held by the fund was $15,302,500.c Investment in affiliated money market mutual fund.
Portfolio Summary (Unaudited)†
Value (%) Value (%)
Semiconductors 21.6Internet Software & Services 15.0Communications Equipment 12.9Systems Software 9.7Application Software 8.5Money Market Investments 7.7Internet Retail 7.2
IT Consulting & Other Services 6.1Electronic Components 5.9Data Processing & Outsourced Services 4.3Computer Hardware 3.4Computer Storage & Peripherals 2.4Consumer Electronics 1.8 106.5
† Based on net assets.See notes to financial statements.
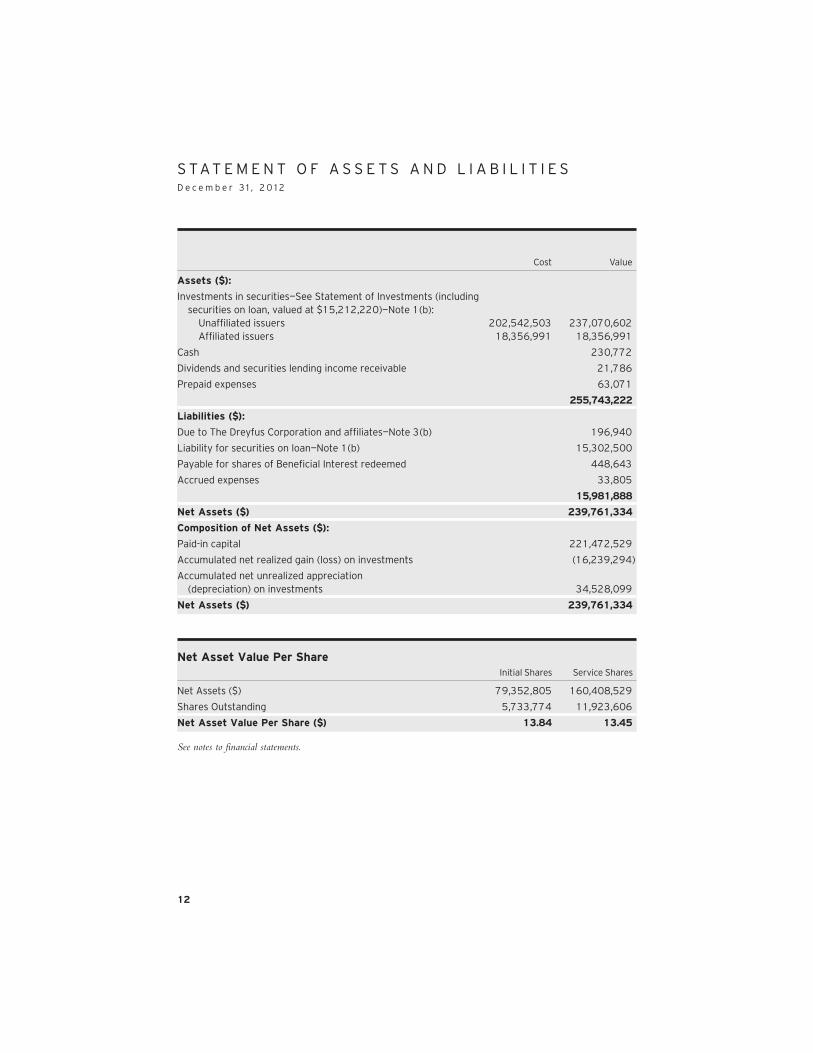
S TAT E M E N T O F A S S E T S A N D L I A B I L I T I E SD e c e m b e r 3 1 , 2 0 1 2
12
Net Asset Value Per Share Initial Shares Service Shares
Net Assets ($) 79,352,805 160,408,529
Shares Outstanding 5,733,774 11,923,606
Net Asset Value Per Share ($) 13.84 13.45
See notes to financial statements.
Cost Value
Assets ($):
Investments in securities—See Statement of Investments (including securities on loan, valued at $15,212,220)—Note 1(b): Unaffiliated issuers 202,542,503 237,070,602 Affiliated issuers 18,356,991 18,356,991
Cash 230,772
Dividends and securities lending income receivable 21,786
Prepaid expenses 63,071
255,743,222
Liabilities ($):
Due to The Dreyfus Corporation and affiliates—Note 3(b) 196,940
Liability for securities on loan—Note 1(b) 15,302,500
Payable for shares of Beneficial Interest redeemed 448,643
Accrued expenses 33,805
15,981,888
Net Assets ($) 239,761,334
Composition of Net Assets ($):
Paid-in capital 221,472,529
Accumulated net realized gain (loss) on investments (16,239,294)
Accumulated net unrealized appreciation (depreciation) on investments 34,528,099
Net Assets ($) 239,761,334

Investment Income ($):Income:
Cash dividends (net of $48,324 foreign taxes withheld at source): Unaffiliated issuers 1,956,367 Affiliated issuers 9,892
Income from securities lending—Note 1(b) 48,691
Total Income 2,014,950
Expenses:
Management fee—Note 3(a) 1,760,014
Distribution fees—Note 3(b) 379,184
Professional fees 75,361
Prospectus and shareholders’ reports 55,283
Custodian fees—Note 3(b) 17,056
Trustees’ fees and expenses—Note 3(c) 8,728
Shareholder servicing costs—Note 3(b) 3,499
Loan commitment fees—Note 2 3,187
Miscellaneous 19,656
Total Expenses 2,321,968
Less—reduction in fees due to earnings credits—Note 3(b) (4)
Net Expenses 2,321,964
Investment (Loss)—Net (307,014)
Realized and Unrealized Gain (Loss) on Investments—Note 4 ($):Net realized gain (loss) on investments 14,160,108
Net unrealized appreciation (depreciation) on investments 16,843,108
Net Realized and Unrealized Gain (Loss) on Investments 31,003,216
Net Increase in Net Assets Resulting from Operations 30,696,202
S TAT E M E N T O F O P E R AT I O N SYe a r E n d e d D e c e m b e r 3 1 , 2 0 1 2
T h e F u n d 13
See notes to financial statements.

S TAT E M E N T O F C H A N G E S I N N E T A S S E T S
14
See notes to financial statements.
Year Ended December 31,
2012 2011
Operations ($):
Investment (loss)—net (307,014) (932,927)
Net realized gain (loss) on investments 14,160,108 10,066,680
Net unrealized appreciation (depreciation) on investments 16,843,108 (27,944,303)
Net Increase (Decrease) in Net Assets Resulting from Operations 30,696,202 (18,810,550)
Beneficial Interest Transactions ($):
Net proceeds from shares sold:
Initial Shares 9,748,204 10,719,132
Service Shares 37,102,127 34,172,366
Cost of shares redeemed:
Initial Shares (16,867,505) (21,000,679)
Service Shares (20,852,628) (42,189,252)
Increase (Decrease) in Net Assets from Beneficial Interest Transactions 9,130,198 (18,298,433)
Total Increase (Decrease) in Net Assets 39,826,400 (37,108,983)
Net Assets ($):
Beginning of Period 199,934,934 237,043,917
End of Period 239,761,334 199,934,934
Capital Share Transactions (Shares):
Initial Shares
Shares sold 726,742 831,404
Shares redeemed (1,253,988) (1,643,642)
Net Increase (Decrease) in Shares Outstanding (527,246) (812,238)
Service Shares
Shares sold 2,804,136 2,677,951
Shares redeemed (1,599,229) (3,414,028)
Net Increase (Decrease) in Shares Outstanding 1,204,907 (736,077)

T h e F u n d 15
Year Ended December 31,
Initial Shares 2012 2011 2010 2009 2008
Per Share Data ($):
Net asset value, beginning of period 11.97 12.98 9.99 6.37 10.83
Investment Operations:
Investment income (loss)—neta .00b (.03) (.03) (.01) .03
Net realized and unrealized gain (loss) on investments 1.87 (.98) 3.02 3.67 (4.49)
Total from Investment Operations 1.87 (1.01) 2.99 3.66 (4.46)
Distributions:
Dividends from investment income—net — — — (.04) —
Net asset value, end of period 13.84 11.97 12.98 9.99 6.37
Total Return (%) 15.62 (7.78) 29.93 57.67 (41.18)
Ratios/Supplemental Data (%):
Ratio of total expenses to average net assets .83 .83 .81 .86 .85
Ratio of net expenses to average net assets .83 .83 .81 .75 .65
Ratio of net investment income (loss) to average net assets .03 (.25) (.33) (.15) .39
Portfolio Turnover Rate 52.00 79.60 103.90 141.37 118.50
Net Assets, end of period ($ x 1,000) 79,353 74,929 91,806 73,422 45,890
F I N A N C I A L H I G H L I G H T S
The following tables describe the performance for each share class for the fiscalperiods indicated. All information (except portfolio turnover rate) reflects financialresults for a single fund share. Total return shows how much your investment in thefund would have increased (or decreased) during each period, assuming you hadreinvested all dividends and distributions. The fund’s total returns do not reflectexpenses associated with variable annuity or insurance contracts. These figures havebeen derived from the fund’s financial statements.
a Based on average shares outstanding at each month end.b Amount represents less than $.01 per share.See notes to financial statements.

F I N A N C I A L H I G H L I G H T S (continued)
Year Ended December 31,
Service Shares 2012 2011 2010 2009 2008
Per Share Data ($):
Net asset value, beginning of period 11.66 12.68 9.78 6.24 10.62
Investment Operations:
Investment income (loss)—neta (.03) (.06) (.06) (.03) .01
Net realized and unrealized gain (loss) on investments 1.82 (.96) 2.96 3.58 (4.39)
Total from Investment Operations 1.79 (1.02) 2.90 3.55 (4.38)
Distributions:
Dividends from investment income—net — — — (.01) —
Net asset value, end of period 13.45 11.66 12.68 9.78 6.24
Total Return (%) 15.35 (8.05) 29.65 57.07 (41.24)
Ratios/Supplemental Data (%):
Ratio of total expenses to average net assets 1.08 1.08 1.06 1.11 1.10
Ratio of net expenses to average net assets 1.08 1.08 1.06 1.00 .90
Ratio of net investment income (loss) to average net assets (.22) (.50) (.58) (.42) .15
Portfolio Turnover Rate 52.00 79.60 103.90 141.37 118.50
Net Assets, end of period ($ x 1,000) 160,409 125,006 145,238 107,123 54,523
16
a Based on average shares outstanding at each month end.See notes to financial statements.
NOTE 1—Significant Accounting Policies:
Dreyfus Investment Portfolios (the “Company”) is registered underthe Investment Company Act of 1940, as amended (the “Act”), as anopen-end management investment company, operating as a seriescompany, currently offering four series, including the TechnologyGrowth Portfolio (the “fund”). The fund is only offered to separateaccounts established by insurance companies to fund variable annuitycontracts and variable life insurance policies. The fund is a diversifiedseries. The fund’s investment objective is to seek capital appreciation.The Dreyfus Corporation (the “Manager” or “Dreyfus”), a wholly-owned subsidiary of The Bank of New York Mellon Corporation(“BNY Mellon”), serves as the fund’s investment adviser.
MBSC Securities Corporation (the “Distributor”), a wholly-ownedsubsidiary of the Manager, is the distributor of the fund’s shares, whichare sold without a sales charge. The fund is authorized to issue anunlimited number of $.001 par value shares of Beneficial Interest ineach of the following classes of shares: Initial and Service. Each class ofshares has identical rights and privileges, except with respect to theDistribution Plan, the expenses borne by each class, the allocation ofcertain transfer agency costs and certain voting rights. Income, expenses(other than expenses attributable to a specific class), and realized andunrealized gains or losses on investments are allocated to each class ofshares based on its relative net assets.
The Company accounts separately for the assets, liabilities and opera-tions of each series. Expenses directly attributable to each series arecharged to that series’ operations; expenses which are applicable to allseries are allocated among them on a pro rata basis.
The Financial Accounting Standards Board (“FASB”) AccountingStandards Codification is the exclusive reference of authoritative U.S.generally accepted accounting principles (“GAAP”) recognized by theFASB to be applied by nongovernmental entities. Rules and interpretivereleases of the Securities and Exchange Commission (“SEC”) under
T h e F u n d 17
N O T E S T O F I N A N C I A L S TAT E M E N T S

authority of federal laws are also sources of authoritative GAAP for SECregistrants. The fund’s financial statements are prepared in accordancewith GAAP, which may require the use of management estimates andassumptions. Actual results could differ from those estimates.
The Company enters into contracts that contain a variety of indem-nifications. The fund’s maximum exposure under these arrangementsis unknown. The fund does not anticipate recognizing any loss relatedto these arrangements.
(a) Portfolio valuation: The fair value of a financial instrument is theamount that would be received to sell an asset or paid to transfer a lia-bility in an orderly transaction between market participants at themeasurement date (i.e., the exit price). GAAP establishes a fair valuehierarchy that prioritizes the inputs of valuation techniques used tomeasure fair value. This hierarchy gives the highest priority to unad-justed quoted prices in active markets for identical assets or liabilities(Level 1 measurements) and the lowest priority to unobservable inputs(Level 3 measurements).
Additionally, GAAP provides guidance on determining whether thevolume and activity in a market has decreased significantly andwhether such a decrease in activity results in transactions that are notorderly. GAAP requires enhanced disclosures around valuation inputsand techniques used during annual and interim periods.
Various inputs are used in determining the value of the fund’s invest-ments relating to fair value measurements. These inputs are summarizedin the three broad levels listed below:
Level 1—unadjusted quoted prices in active markets for identical investments.
Level 2—other significant observable inputs (including quotedprices for similar investments, interest rates, prepayment speeds,credit risk, etc.).
Level 3—significant unobservable inputs (including the fund’sown assumptions in determining the fair value of investments).
18
N O T E S T O F I N A N C I A L S TAT E M E N T S (continued)
The inputs or methodology used for valuing securities are not necessar-ily an indication of the risk associated with investing in those securities.
Changes in valuation techniques may result in transfers in or out of anassigned level within the disclosure hierarchy. Valuation techniquesused to value the fund’s investments are as follows:
Investments in securities are valued at the last sales price on the securi-ties exchange or national securities market on which such securities areprimarily traded. Securities listed on the National Market System forwhich market quotations are available are valued at the official closingprice or, if there is no official closing price that day, at the last sales price.Securities not listed on an exchange or the national securities market,or securities for which there were no transactions, are valued at theaverage of the most recent bid and asked prices, except for open shortpositions, where the asked price is used for valuation purposes. Bidprice is used when no asked price is available. Registered investmentcompanies that are not traded on an exchange are valued at their netasset value. All of the preceding securities are categorized within Level1 of the fair value hierarchy.
Fair valuing of securities may be determined with the assistance of apricing service using calculations based on indices of domestic securi-ties and other appropriate indicators, such as prices of relevant ADRsand financial futures. Utilizing these techniques may result in transfersbetween Level 1 and Level 2 of the fair value hierarchy.
When market quotations or official closing prices are not readily avail-able, or are determined not to reflect accurately fair value, such as whenthe value of a security has been significantly affected by events after theclose of the exchange or market on which the security is principallytraded (for example, a foreign exchange or market), but before the fundcalculates its net asset value, the fund may value these investments at fairvalue as determined in accordance with the procedures approved by theCompany’s Board of Trustees (the “Board”). Certain factors may be
T h e F u n d 19

considered when fair valuing investments such as: fundamental analyticaldata, the nature and duration of restrictions on disposition, an evaluationof the forces that influence the market in which the securities are pur-chased and sold, and public trading in similar securities of the issuer orcomparable issuers. These securities are either categorized within Level2 or 3 depending on the relevant inputs used.
For restricted securities where observable inputs are limited, assump-tions about market activity and risk are used and are categorizedwithin Level 3 of the fair value hierarchy.
The following is a summary of the inputs used as of December 31,2012 in valuing the fund’s investments:
Level 2—Other Level 3—
Level 1— Significant Significant
Unadjusted Observable Unobservable
Quoted Prices Inputs Inputs Total
Assets ($)
Investments in Securities:
Equity Securities— Domestic Common Stocks† 220,918,126 — — 220,918,126
Equity Securities— Foreign Common Stocks† 16,152,476 — — 16,152,476
Mutual Funds 18,356,991 — — 18,356,991
† See Statement of Investments for additional detailed categorizations.
At December 31, 2012, there were no transfers between Level 1 andLevel 2 of the fair value hierarchy.
(b) Securities transactions and investment income: Securities trans-actions are recorded on a trade date basis. Realized gains and lossesfrom securities transactions are recorded on the identified cost basis.Dividend income is recognized on the ex-dividend date and interestincome, including, where applicable, accretion of discount and amor-tization of premium on investments, is recognized on the accrual basis.
20
N O T E S T O F I N A N C I A L S TAT E M E N T S (continued)

Pursuant to a securities lending agreement with The Bank of NewYork Mellon, a subsidiary of BNY Mellon and an affiliate of Dreyfus,the fund may lend securities to qualified institutions. It is the fund’spolicy that, at origination, all loans are secured by collateral of at least102% of the value of U.S. securities loaned and 105% of the value offoreign securities loaned. Collateral equivalent to at least 100% of themarket value of securities on loan is maintained at all times. Collateralis either in the form of cash, which can be invested in certain moneymarket mutual funds managed by the Manager, U.S. Government andAgency securities or letters of credit. The fund is entitled to receive allincome on securities loaned, in addition to income earned as a resultof the lending transaction. Although each security loaned is fullycollateralized, the fund bears the risk of delay in recovery of, or loss ofrights in, the securities loaned should a borrower fail to return thesecurities in a timely manner. During the period ended December 31,2012, The Bank of New York Mellon earned $16,230 from lendingportfolio securities, pursuant to the securities lending agreement.
(c) Affiliated issuers: Investments in other investment companiesadvised by Dreyfus are defined as “affiliated” in the Act. Investmentsin affiliated investment companies for the period ended December 31,2012 were as follows:
Affiliated Investment Value Value Net Company 12/31/2011 ($) Purchases ($) Sales ($) 12/31/2012 ($) Assets (%)
Dreyfus Institutional Preferred Plus Money Market Fund 4,277,772 89,950,892 91,174,173 3,054,491 1.3
Dreyfus Institutional Cash Advantage Fund 66,944 123,159,628 107,924,072 15,302,500 6.4
Total 4,344,716 213,110,520 199,098,245 18,356,991 7.7
T h e F u n d 21

(d) Dividends to shareholders: Dividends are recorded on the ex-div-idend date. Dividends from investment income-net and dividends fromnet realized capital gains, if any, are normally declared and paid annually,but the fund may make distributions on a more frequent basis tocomply with the distribution requirements of the Internal RevenueCode of 1986, as amended (the “Code”). To the extent that net real-ized capital gains can be offset by capital loss carryovers, it is the policyof the fund not to distribute such gains. Income and capital gain distri-butions are determined in accordance with income tax regulations,which may differ from GAAP.
(e) Federal income taxes: It is the policy of the fund to continue toqualify as a regulated investment company, if such qualification is in thebest interests of its shareholders, by complying with the applicable pro-visions of the Code, and to make distributions of taxable income suffi-cient to relieve it from substantially all federal income and excise taxes.
As of and during the period ended December 31, 2012, the fund didnot have any liabilities for any uncertain tax positions. The fund rec-ognizes interest and penalties, if any, related to uncertain tax positionsas income tax expense in the Statement of Operations. During theperiod, the fund did not incur any interest or penalties.
Each of the tax years in the four-year period ended December 31,2012 remains subject to examination by the Internal Revenue Serviceand state taxing authorities.
At December 31, 2012, the components of accumulated earnings on atax basis were as follows: accumulated capital losses $14,517,369 andunrealized appreciation $33,048,910. In addition, the fund had $242,736of capital losses realized after October 31, 2012, which were deferred fortax purposes to the first day of the following fiscal year.
Under the Regulated Investment Company Modernization Act of 2010(the “2010 Act”), the fund is permitted to carry forward capital losses
22
N O T E S T O F I N A N C I A L S TAT E M E N T S (continued)

incurred in taxable years beginning after December 22, 2010 (“post-enactment losses”) for an unlimited period. Furthermore, post-enactmentcapital loss carryovers retain their character as either short-term or long-term capital losses rather than short-term as they were under previousstatute. The 2010 Act requires post-enactment losses to be utilized beforethe utilization of losses incurred in taxable years prior to the effective dateof the 2010 Act (“pre-enactment losses”). As a result of this ordering rule,pre-enactment losses may be more likely to expire unused.
The accumulated capital loss carryover is available for federal incometax purposes to be applied against future net realized capital gains, if any,realized subsequent to December 31, 2012. If not applied, the carryoverexpires in fiscal year 2017.
During the period ended December 31, 2012, as a result of permanentbook to tax differences, primarily due to the tax treatment for netoperating losses, the fund increased accumulated undistributed invest-ment income-net by $307,014 and decreased paid-in capital by thesame amount. Net assets and net asset value per share were not affectedby this reclassification.
NOTE 2—Bank Lines of Credit:
The fund participates with other Dreyfus-managed funds in a $210 mil-lion unsecured credit facility led by Citibank, N.A. and a $300 millionunsecured credit facility provided by The Bank of New York Mellon(each, a “Facility”), each to be utilized primarily for temporary oremergency purposes, including the financing of redemptions. Prior toOctober 10, 2012, the unsecured credit facility with Citibank, N.A., was$225 million. In connection therewith, the fund has agreed to pay its prorata portion of commitment fees for each Facility. Interest is chargedto the fund based on rates determined pursuant to the terms of therespective Facility at the time of borrowing. During the period endedDecember 31, 2012, the fund did not borrow under the Facilities.
T h e F u n d 23

NOTE 3—Management Fee and Other Transactions WithAffiliates:
(a) Pursuant to a management agreement with the Manager, the man-agement fee is computed at the annual rate of .75% of the value of thefund’s average daily net assets and is payable monthly.
(b) Under the Distribution Plan adopted pursuant to Rule 12b-1 underthe Act, Service shares pay the Distributor for distributing its shares, forservicing and/or maintaining Service shares’ shareholder accounts andfor advertising and marketing for Service shares. The Distribution Planprovides for payments to be made at an annual rate of .25% of the valueof the Service shares’ average daily net assets. The Distributor may makepayments to Participating Insurance Companies and to brokers anddealers acting as principal underwriter for their variable insuranceproducts. The fees payable under the Distribution Plan are payablewithout regard to actual expenses incurred. During the period endedDecember 31, 2012, Service shares were charged $379,184 pursuant tothe Distribution Plan.
The fund has arrangements with the transfer agent and the custodianwhereby the fund may receive earnings credits when positive cashbalances are maintained, which are used to offset transfer agency andcustody fees. For financial reporting purposes, the fund includes netearnings credits as an expense offset in the Statement of Operations.
The fund compensates Dreyfus Transfer, Inc., a wholly-owned subsidiaryof the Manager, under a transfer agency agreement for providing transferagency services for the fund and, since May 29, 2012, cash managementservices related to fund subscriptions and redemptions. During theperiod ended December 31, 2012, the fund was charged $616 for trans-fer agency services and $19 for cash management services. Cash man-agement fees were partially offset by earnings credits of $2. These fees areincluded in Shareholder servicing costs in the Statement of Operations.
The fund compensates The Bank of New York Mellon under a cus-tody agreement for providing custodial services for the fund. During
24
N O T E S T O F I N A N C I A L S TAT E M E N T S (continued)

the period ended December 31, 2012, the fund was charged $17,056pursuant to the custody agreement.
Prior to May 29, 2012, the fund compensated The Bank of New YorkMellon under a cash management agreement for performing cashmanagement services related to fund subscriptions and redemptions.During the period ended December 31, 2012, the fund was charged$44 pursuant to the cash management agreement, which is included inShareholder servicing costs in the Statement of Operations. These feeswere partially offset by earnings credits of $2.
During the period ended December 31, 2012, the fund was charged$8,783 for services performed by the Chief Compliance Officer andhis staff.
The components of “Due to The Dreyfus Corporation and affiliates”in the Statement of Assets and Liabilities consist of: management fees$151,894, Distribution Plan fees $33,899, custodian fees $7,000, ChiefCompliance Officer fees $3,981 and transfer agency fees $166.
(c) Each Board member also serves as a Board member of other fundswithin the Dreyfus complex. Annual retainer fees and attendance feesare allocated to each fund based on net assets.
NOTE 4—Securities Transactions:
The aggregate amount of purchases and sales of investment securities,excluding short-term securities, during the period ended December 31,2012, amounted to $127,239,868 and $116,799,483, respectively.
At December 31, 2012, the cost of investments for federal incometax purposes was $222,378,683; accordingly, accumulated net unre-alized appreciation on investments was $33,048,910, consisting of$39,598,549 gross unrealized appreciation and $6,549,639 grossunrealized depreciation.
T h e F u n d 25

Shareholders and Board of Trustees Dreyfus Investment Portfolios, Technology Growth Portfolio
We have audited the accompanying statement of assets and liabilities,including the statement of investments, of Dreyfus Investment Portfolios,Technology Growth Portfolio (one of the series comprising DreyfusInvestment Portfolios) as of December 31, 2012, and the related state-ment of operations for the year then ended, the statement of changes innet assets for each of the two years in the period then ended, and thefinancial highlights for each of the five years in the period then ended.These financial statements and financial highlights are the responsibilityof the Fund’s management. Our responsibility is to express an opinion onthese financial statements and financial highlights based on our audits.We conducted our audits in accordance with the standards of the PublicCompany Accounting Oversight Board (United States). Those standardsrequire that we plan and perform the audit to obtain reasonable assur-ance about whether the financial statements and financial highlightsare free of material misstatement. We were not engaged to performan audit of the Fund’s internal control over financial reporting. Ouraudits included consideration of internal control over financialreporting as a basis for designing audit procedures that are appropriatein the circumstances, but not for the purpose of expressing an opinionon the effectiveness of the Fund’s internal control over financial report-ing. Accordingly, we express no such opinion. An audit also includesexamining, on a test basis, evidence supporting the amounts and disclo-sures in the financial statements and financial highlights, assessing theaccounting principles used and significant estimates made by manage-ment, and evaluating the overall financial statement presentation. Ourprocedures included confirmation of securities owned as of December31, 2012 by correspondence with the custodian and others. We believethat our audits provide a reasonable basis for our opinion.In our opinion, the financial statements and financial highlights referredto above present fairly, in all material respects, the financial positionof Dreyfus Investment Portfolios, Technology Growth Portfolio atDecember 31, 2012, the results of its operations for the year thenended, the changes in its net assets for each of the two years in theperiod then ended, and the financial highlights for each of the five yearsin the period then ended, in conformity with U.S. generally acceptedaccounting principles.
New York, New YorkFebruary 13, 2013
26
R E P O R T O F I N D E P E N D E N T R E G I S T E R E D P U B L I C A C C O U N T I N G F I R M

T h e F u n d 27
The Company held a special meeting of shareholders on August 3, 2012. The proposalconsidered at the meeting, and the results, are as follows:
P R O X Y R E S U LT S ( U n a u d i t e d )
Shares
Votes For Authority Withheld
To elect additional Board Members:
Gordon J. Davis† 40,383,221 1,880,340
Nathan Leventhal† 40,484,976 1,778,585
Benaree Pratt Wiley† 40,471,151 1,792,410
† Each of the above Board Members were duly elected by shareholders at the fund’s August 3, 2012 shareholdermeeting. Nathan Leventhal and Benaree Pratt Wiley were existing Board Members previously having been elected bythe fund’s Board. In addition, Clifford L. Alexander, Jr., Joseph S. DiMartino, Whitney I. Gerard and George L.Perry continue as Board Members of the Company.

28
At a meeting of the fund’s Board of Trustees held on July 18 and 19,2012, the Board considered the renewal of the fund’s ManagementAgreement pursuant to which Dreyfus provides the fund with invest-ment advisory and administrative services (the “Agreement”). TheBoard members, none of whom are “interested persons” (as defined inthe Investment Company Act of 1940, as amended) of the fund, wereassisted in their review by independent legal counsel and met withcounsel in executive session separate from Dreyfus representatives. Inconsidering the renewal of the Agreement, the Board considered allfactors that it believed to be relevant, including those discussed below.The Board did not identify any one factor as dispositive, and each Boardmember may have attributed different weights to the factors considered.
Analysis of Nature, Extent, and Quality of Services Provided to theFund.The Board considered information previously provided to themin presentations from Dreyfus representatives regarding the nature,extent, and quality of the services provided to funds in the Dreyfus fundcomplex, and Dreyfus representatives confirmed that there had been nomaterial changes in this information. Dreyfus provided the number ofopen accounts in the fund, the fund’s asset size and the allocation of fundassets among distribution channels. Dreyfus also had previously providedinformation regarding the diverse intermediary relationships and distri-bution channels of funds in the Dreyfus fund complex (such as retaildirect or intermediary, in which intermediaries typically are paid by thefund and/or Dreyfus) and Dreyfus’ corresponding need for broad, deep,and diverse resources to be able to provide ongoing shareholder servicesto each intermediary or distribution channel, as applicable to the fund.
The Board also considered research support available to, and portfoliomanagement capabilities of, the fund’s portfolio management personneland that Dreyfus also provides oversight of day-to-day fund operations,including fund accounting and administration and assistance in meetinglegal and regulatory requirements. The Board also considered Dreyfus’
INFORMATION ABOUT THE RENEWAL OF THE FUND’S MANAGEMENT AGREEMENT (Unaudited)

T h e F u n d 29
extensive administrative, accounting, and compliance infrastructures.The Board also considered portfolio management’s brokerage policiesand practices (including policies and practices regarding soft dollars)and the standards applied in seeking best execution.
Comparative Analysis of the Fund’s Performance and Management Feeand Expense Ratio.The Board reviewed reports prepared by Lipper,Inc. (“Lipper”), an independent provider of investment companydata, which included information comparing (1) the fund’s perfor-mance with the performance of a group of comparable funds (the“Performance Group”) and with a broader group of funds (the“Performance Universe”), all for various periods ended May 31, 2012,and (2) the fund’s actual and contractual management fees and totalexpenses with those of a group of comparable funds (the “ExpenseGroup”) and with a broader group of funds (the “Expense Universe”),the information for which was derived in part from fund financial state-ments available to Lipper as of the date of its analysis. Dreyfus previouslyhad furnished the Board with a description of the methodology Lipperused to select the Performance Group and Performance Universe andthe Expense Group and Expense Universe.
Dreyfus representatives stated that the usefulness of performance com-parisons may be affected by a number of factors, including differentinvestment limitations that may be applicable to the fund and compar-ison funds. The Board discussed the results of the comparisons andnoted that the fund’s total return performance was generally at orabove the Performance Group and Performance Universe medians forall periods. Dreyfus also provided a comparison of the fund’s calendaryear total returns to the returns of the fund’s benchmark index.
The Board also reviewed the range of actual and contractual manage-ment fees and total expenses of the Expense Group and ExpenseUniverse funds and discussed the results of the comparisons. The Board

30
I N FO R M AT I O N A B O U T T H E R E N E WA L O F T H E F U N D ’ S M A N A G E M E N T A G R E E M E N T ( U n a u d i t e d ) (continued)
noted that, with respect to Initial shares, the fund’s contractual man-agement fee was below the Expense Group median and the fund’sactual management fee and total expenses were below the ExpenseGroup and Expense Universe medians. The Board noted that, withrespect to Service shares, the fund’s actual total expenses were abovethe Expense Group median and below the Expense Universe median.
Dreyfus representatives reviewed with the Board the management orinvestment advisory fees (1) paid by funds advised or administered byDreyfus that are in the same Lipper category as the fund and (2) paidto Dreyfus or the Dreyfus-affiliated primary employer of the fund’s pri-mary portfolio manager(s) for advising any separate accounts and/orother types of client portfolios that are considered to have similarinvestment strategies and policies as the fund (the “Similar Clients”),and explained the nature of the Similar Clients. They discussed differ-ences in fees paid and the relationship of the fees paid in light of anydifferences in the services provided and other relevant factors. TheBoard considered the relevance of the fee information provided for theSimilar Clients to evaluate the appropriateness and reasonableness ofthe fund’s management fee.
Analysis of Profitability and Economies of Scale. Dreyfus representa-tives reviewed the expenses allocated and profit received by Dreyfusand the resulting profitability percentage for managing the fund andthe aggregate profitability percentage to Dreyfus of managing thefunds in the Dreyfus fund complex, and the method used to determinethe expenses and profit. The Board concluded that the profitabilityresults were not unreasonable, given the services rendered and servicelevels provided by Dreyfus. The Board also had been provided withinformation prepared by an independent consulting firm regardingDreyfus’ approach to allocating costs to, and determining the prof-itability of, individual funds and the entire Dreyfus fund complex. Theconsulting firm also had analyzed where any economies of scale mightemerge in connection with the management of a fund.

T h e F u n d 31
The Board’s counsel stated that the Board should consider the prof-itability analysis (1) as part of the evaluation of whether the fees underthe Agreement bear a reasonable relationship to the mix of servicesprovided by Dreyfus, including the nature, extent and quality of suchservices, and (2) in light of the relevant circumstances for the fund andthe extent to which economies of scale would be realized if the fundgrows and whether fee levels reflect these economies of scale for thebenefit of fund shareholders. Dreyfus representatives noted that a dis-cussion of economies of scale is predicated on a fund having achieveda substantial size with increasing assets and that, if a fund’s assets hadbeen stable or decreasing, the possibility that Dreyfus may have realizedany economies of scale would be less. Dreyfus representatives alsonoted that, as a result of shared and allocated costs among funds in theDreyfus fund complex, the extent of economies of scale could dependsubstantially on the level of assets in the complex as a whole, so thatincreases and decreases in complex-wide assets can affect potentialeconomies of scale in a manner that is disproportionate to, or even inthe opposite direction from, changes in the fund’s asset level. TheBoard also considered potential benefits to Dreyfus from acting asinvestment adviser and noted the soft dollar arrangements in effect fortrading the fund’s investments.
At the conclusion of these discussions, the Board agreed that it hadbeen furnished with sufficient information to make an informedbusiness decision with respect to the renewal of the Agreement. Basedon the discussions and considerations as described above, the Boardconcluded and determined as follows.
• The Board concluded that the nature, extent and quality of theservices provided by Dreyfus are adequate and appropriate.
• The Board generally was satisfied with the fund’s performance.
• The Board concluded that the fee paid to Dreyfus was reasonable inlight of the considerations described above.

32
• The Board determined that the economies of scale which may accrueto Dreyfus and its affiliates in connection with the management of thefund had been adequately considered by Dreyfus in connection withthe fee rate charged to the fund pursuant to the Agreement and that,to the extent in the future it were determined that materialeconomies of scale had not been shared with the fund, the Boardwould seek to have those economies of scale shared with the fund.
In evaluating the Agreement, the Board considered these conclusionsand determinations and also relied on its previous knowledge, gainedthrough meetings and other interactions with Dreyfus and its affiliates,of the fund and the services provided to the fund by Dreyfus. The Boardalso relied on information received on a routine and regular basisthroughout the year relating to the operations of the fund and the invest-ment management and other services provided under the Agreement,including information on the investment performance of the fund incomparison to similar mutual funds and benchmark performanceindices; general market outlook as applicable to the fund; and compli-ance reports. In addition, it should be noted that the Board’s considera-tion of the contractual fee arrangements for this fund had the benefit ofa number of years of reviews of prior or similar agreements duringwhich lengthy discussions took place between the Board and Dreyfusrepresentatives. Certain aspects of the arrangements may receive greaterscrutiny in some years than in others, and the Board’s conclusions maybe based, in part, on their consideration of the same or similararrangements in prior years. The Board determined that renewal of theAgreement was in the best interests of the fund and its shareholders.
I N FO R M AT I O N A B O U T T H E R E N E WA L O F T H E F U N D ’ S M A N A G E M E N T A G R E E M E N T ( U n a u d i t e d ) (continued)

T h e F u n d 33
Joseph S. DiMartino (69)Chairman of the Board (1998)
Principal Occupation During Past 5 Years:• Corporate Director and Trustee
Other Public Company Board Memberships During Past 5 Years:• CBIZ (formerly, Century Business Services, Inc.), a provider of outsourcing functions for small
and medium size companies, Director (1997-present)• Sunair Services Corporation, a provider of certain outdoor-related services to homes and
businesses, Director (2005-2009) • The Newark Group, a provider of a national market of paper recovery facilities, paperboard
mills and paperboard converting plants, Director (2000-2010)
No. of Portfolios for which Board Member Serves: 151
———————Clifford L. Alexander, Jr. (79)Board Member (1998)
Principal Occupation During Past 5 Years:• President of Alexander & Associates, Inc., a management consulting firm ( January 1981-present)
No. of Portfolios for which Board Member Serves: 41
———————Gordon J. Davis (71)Board Member (2012)
Principal Occupation During Past 5 Years:• Partner in the law firm of Venable, LLP (2012-present)• Partner in the law firm of Dewey & LeBoeuf, LLP (1994-2012)
Other Public Company Board Memberships During Past 5 Years:• Consolidated Edison, Inc., a utility company, Director (1997-present)• The Phoenix Companies, Inc., a life insurance company, Director (2000-present)
No. of Portfolios for which Board Member Serves: 46
———————Whitney I. Gerard (78)Board Member (2003)
Principal Occupation During Past 5 Years:• Partner of Chadbourne & Parke LLP
No. of Portfolios for which Board Member Serves: 22
B O A R D M E M B E R S I N F O R M AT I O N ( U n a u d i t e d )

34
Nathan Leventhal (69)Board Member (2009)
Principal Occupation During Past 5 Years:• Chairman of the Avery-Fisher Artist Program (November 1997-present)• Commissioner, NYC Planning Commission (March 2007-November 2011)
Other Public Company Board Memberships During Past 5 Years:• Movado Group, Inc., Director (2003-present)
No. of Portfolios for which Board Member Serves: 39
———————George L. Perry (78)Board Member (2003)
Principal Occupation During Past 5 Years:• Economist and Senior Fellow at Brookings Institution
No. of Portfolios for which Board Member Serves: 22
———————Benaree Pratt Wiley (66)Board Member (2009)
Principal Occupation During Past 5 Years:• Principal, The Wiley Group, a firm specializing in strategy and business development (2005-present)
Other Public Company Board Memberships During Past 5 Years:• CBIZ (formerly, Century Business Services, Inc.), a provider of outsourcing functions for small
and medium size companies, Director (2008-present)
No. of Portfolios for which Board Member Serves: 60
———————Once elected all Board Members serve for an indefinite term, but achieve Emeritus status upon reaching age 80. Theaddress of the Board Members and Officers is c/o The Dreyfus Corporation, 200 Park Avenue, New York, New York10166. Additional information about the Board Members is available in the fund’s Statement of Additional Informationwhich can be obtained from Dreyfus free of charge by calling this toll free number: 1-800-DREYFUS.
Lucy Wilson Benson, Emeritus Board MemberDavid W. Burke, Emeritus Board MemberArthur A. Hartman, Emeritus Board Member
B O A R D M E M B E R S I N F O R M AT I O N ( U n a u d i t e d ) (continued)

T h e F u n d 35
BRADLEY J. SKAPYAK, President sinceJanuary 2010.
Chief Operating Officer and a director of theManager since June 2009; from April 2003 toJune 2009, Mr. Skapyak was the head of theInvestment Accounting and SupportDepartment of the Manager. He is an officerof 69 investment companies (comprised of 150portfolios) managed by the Manager. He is 54years old and has been an employee of theManager since February 1988.
JANETTE E. FARRAGHER, Vice Presidentand Secretary since December 2011.
Assistant General Counsel of BNY Mellon,and an officer of 70 investment companies(comprised of 177 portfolios) managed by theManager. She is 50 years old and has been anemployee of the Manager since February 1984.
KIESHA ASTWOOD, Vice President andAssistant Secretary since January 2010.
Counsel of BNY Mellon, and an officer of 70investment companies (comprised of 177portfolios) managed by the Manager. She is 39years old and has been an employee of theManager since July 1995.
JAMES BITETTO, Vice President andAssistant Secretary since August 2005.
Senior Counsel of BNY Mellon and Secretaryof the Manager, and an officer of 70investment companies (comprised of 177portfolios) managed by the Manager. He is 46years old and has been an employee of theManager since December 1996.
JONI LACKS CHARATAN, Vice Presidentand Assistant Secretary since August 2005.
Senior Counsel of BNY Mellon, and an officerof 70 investment companies (comprised of 177portfolios) managed by the Manager. She is 57years old and has been an employee of theManager since October 1988.
JOSEPH M. CHIOFFI, Vice President andAssistant Secretary since August 2005.
Senior Counsel of BNY Mellon, and an officerof 70 investment companies (comprised of 177portfolios) managed by the Manager. He is 51years old and has been an employee of theManager since June 2000.
JOHN B. HAMMALIAN, Vice President andAssistant Secretary since August 2005.
Senior Managing Counsel of BNY Mellon,and an officer of 70 investment companies(comprised of 177 portfolios) managed by theManager. He is 49 years old and has been anemployee of the Manager since February 1991.
ROBERT R. MULLERY, Vice President andAssistant Secretary since August 2005.
Managing Counsel of BNY Mellon, and anofficer of 70 investment companies (comprisedof 177 portfolios) managed by the Manager.He is 60 years old and has been an employeeof the Manager since May 1986.
JEFF PRUSNOFSKY, Vice President andAssistant Secretary since August 2005.
Senior Managing Counsel of BNY Mellon,and an officer of 70 investment companies(comprised of 177 portfolios) managed by theManager. He is 47 years old and has been anemployee of the Manager since October 1990.
JAMES WINDELS, Treasurer sinceNovember 2001.
Director – Mutual Fund Accounting of theManager, and an officer of 70 investmentcompanies (comprised of 177 portfolios)managed by the Manager. He is 54 years oldand has been an employee of the Managersince April 1985.
O F F I C E R S O F T H E F U N D ( U n a u d i t e d )

36
O F F I C E R S O F T H E F U N D ( U n a u d i t e d ) (continued)
RICHARD CASSARO, Assistant Treasurersince January 2008.
Senior Accounting Manager – Money Marketand Municipal Bond Funds of the Manager,and an officer of 70 investment companies(comprised of 177 portfolios) managed by the Manager. He is 53 years old and has been an employee of the Manager sinceSeptember 1982.
GAVIN C. REILLY, Assistant Treasurersince December 2005.
Tax Manager of the Investment Accountingand Support Department of the Manager, andan officer of 70 investment companies(comprised of 177 portfolios) managed by theManager. He is 44 years old and has been anemployee of the Manager since April 1991.
ROBERT S. ROBOL, Assistant Treasurersince August 2005.
Senior Accounting Manager – Fixed IncomeFunds of the Manager, and an officer of 70investment companies (comprised of 177portfolios) managed by the Manager. He is 48years old and has been an employee of theManager since October 1988.
ROBERT SALVIOLO, Assistant Treasurersince July 2007.
Senior Accounting Manager – Equity Funds ofthe Manager, and an officer of 70 investmentcompanies (comprised of 177 portfolios)managed by the Manager. He is 45 years oldand has been an employee of the Managersince June 1989.
ROBERT SVAGNA, Assistant Treasurersince December 2002.
Senior Accounting Manager – Equity Funds ofthe Manager, and an officer of 70 investmentcompanies (comprised of 177 portfolios)managed by the Manager. He is 45 years oldand has been an employee of the Managersince November 1990.
JOSEPH W. CONNOLLY, Chief ComplianceOfficer since October 2004.
Chief Compliance Officer of the Manager andThe Dreyfus Family of Funds (70 investmentcompanies, comprised of 177 portfolios). He is55 years old and has served in variouscapacities with the Manager since 1980,including manager of the firm’s FundAccounting Department from 1997 throughOctober 2001.
MATTHEW D. CONNOLLY, Anti-MoneyLaundering Compliance Officer since April 2012.
Anti-Money Laundering Compliance Officerof the Distributor since October 2011; fromMarch 2010 to September 2011, Global Head,KYC Reviews and Director, UBS InvestmentBank; until March 2010, AML ComplianceOfficer and Senior Vice President, Citi GlobalWealth Management. He is an officer of 66investment companies (comprised of 173portfolios) managed by the Manager. He is 40years old and has been an employee of theDistributor since October 2011.


Dreyfus Investment Portfolios,Technology Growth Portfolio
200 Park AvenueNew York, NY 10166
Manager
The Dreyfus Corporation200 Park AvenueNew York, NY 10166
Custodian
The Bank of New York MellonOne Wall StreetNew York, NY 10286
Transfer Agent &Dividend Disbursing Agent
Dreyfus Transfer, Inc.200 Park AvenueNew York, NY 10166
Distributor
MBSC Securities Corporation200 Park AvenueNew York, NY 10166
For More Information
© 2013 MBSC Securities Corporation 0175AR1212
Telephone 1-800-554-4611 or 1-516-338-3300
Mail The Dreyfus Family of Funds, 144 Glenn Curtiss Boulevard, Uniondale, NY 11556-0144Attn: Investments Division
The fund files its complete schedule of portfolio holdings with the Securities and Exchange
Commission (“SEC”) for the first and third quarters of each fiscal year on Form N-Q. The fund’s
Forms N-Q are available on the SEC’s website at http://www.sec.gov and may be reviewed and
copied at the SEC’s Public Reference Room in Washington, DC. Information on the operation of
the Public Reference Room may be obtained by calling 1-800-SEC-0330.
A description of the policies and procedures that the fund uses to determine how to vote
proxies relating to portfolio securities, and information regarding how the fund voted
these proxies for the most recent 12-month period ended June 30 is available at
http://www.dreyfus.com and on the SEC’s website at http://www.sec.gov. The
description of the policies and procedures is also available without charge,
upon request, by calling 1-800-DREYFUS.
®

DECEMBER 31 , 2012
Franklin TempletonVariable Insurance Products Trust
ANNUALREPORT

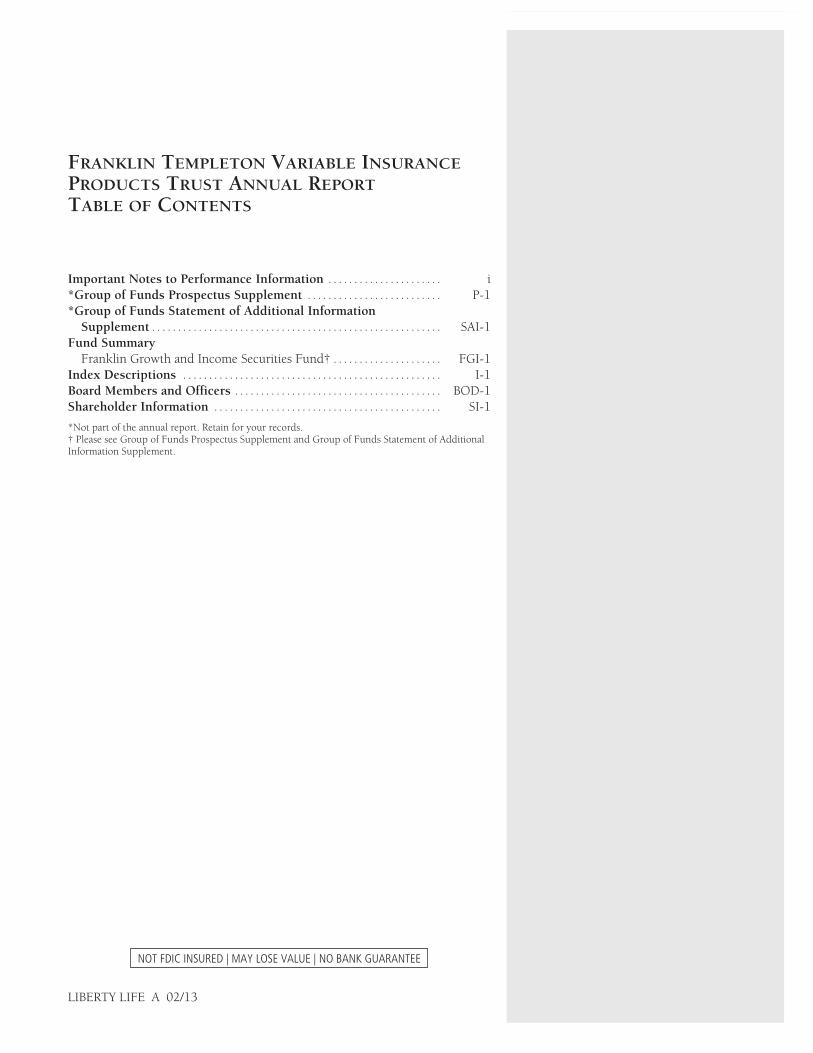
FRANKLIN TEMPLETON VARIABLE INSURANCEPRODUCTS TRUST ANNUAL REPORTTABLE OF CONTENTS
Important Notes to Performance Information . . . . . . . . . . . . . . . . . . . . . . i*Group of Funds Prospectus Supplement . . . . . . . . . . . . . . . . . . . . . . . . . . P-1*Group of Funds Statement of Additional Information
Supplement . . . . . . . . . . . . . . . . . . . . . . . . . . . . . . . . . . . . . . . . . . . . . . . . . . . . . . . . SAI-1Fund Summary
Franklin Growth and Income Securities Fund† . . . . . . . . . . . . . . . . . . . . . FGI-1Index Descriptions . . . . . . . . . . . . . . . . . . . . . . . . . . . . . . . . . . . . . . . . . . . . . . . . . . I-1Board Members and Officers . . . . . . . . . . . . . . . . . . . . . . . . . . . . . . . . . . . . . . . . BOD-1Shareholder Information . . . . . . . . . . . . . . . . . . . . . . . . . . . . . . . . . . . . . . . . . . . . SI-1
*Not part of the annual report. Retain for your records.† Please see Group of Funds Prospectus Supplement and Group of Funds Statement of AdditionalInformation Supplement.
NOT FDIC INSURED | MAY LOSE VALUE | NO BANK GUARANTEE
LIBERTY LIFE A 02/13

IMPORTANT NOTES TOPERFORMANCE INFORMATION
Performance data is historical and cannot predict or guarantee futureresults. Principal value and investment return will fluctuate with marketconditions, and you may have a gain or loss when you withdraw yourmoney. Inception dates of the funds may have preceded the effectivedates of the subaccounts, contracts, or their availability in all states.
When reviewing the index comparisons, please keep in mind thatindexes have a number of inherent performance differentials over thefunds. First, unlike the funds, which must hold a minimum amount ofcash to maintain liquidity, indexes do not have a cash component.Second, the funds are actively managed and, thus, are subject tomanagement fees to cover salaries of securities analysts or portfoliomanagers in addition to other expenses. Indexes are unmanaged and donot include any commissions or other expenses typically associatedwith investing in securities. Third, indexes often contain a different mixof securities than the fund to which they are compared. Additionally,please remember that indexes are simply a measure of performance andcannot be invested in directly.
i

SUPPLEMENT DATED JANUARY 1, 2013TO THE PROSPECTUSES
DATED MAY 1, 2012OF
FRANKLIN GLOBAL REAL ESTATE SECURITIES FUND
FRANKLIN GROWTH AND INCOME SECURITIES FUND
FRANKLIN HIGH INCOME SECURITIES FUND
FRANKLIN INCOME SECURITIES FUND
FRANKLIN STRATEGIC INCOME SECURITIES FUND
MUTUAL GLOBAL DISCOVERY SECURITIES FUND
MUTUAL INTERNATIONAL SECURITIES FUND
MUTUAL SHARES SECURITIES FUND
TEMPLETON GLOBAL BOND SECURITIES FUND(Series of Franklin Templeton Variable Insurance Products Trust)
The Prospectus is amended as follows:
I. For the Franklin Global Real Estate Securities Fund, Franklin Strategic Income SecuritiesFund, Mutual Global Discovery Securities Fund, Mutual International Securities Fund,Mutual Shares Securities Fund and Templeton Global Bond Securities Fund, the “PrincipalInvestment Policies and Practices - Commodity Exchange Act Exclusion” section of the FundDetails is replaced with the following:
The Fund is not intended as a vehicle for trading in the futures, commodity options orswaps markets. With respect to the Fund, the investment manager has claimed anexclusion from the definition of “commodity pool operator” (CPO) under theCommodity Exchange Act (CEA) and the rules of the Commodity Futures TradingCommission (CFTC) and, therefore, is not subject to CFTC registration or regulation asa CPO. In addition, the investment manager is relying upon a related exclusion from thedefinition of “commodity trading advisor” (CTA) under the CEA and the rules of theCFTC.
As of January 1, 2013, the terms of the CPO exclusion require the Fund, among otherthings, to adhere to certain limits on its investments in futures, commodity options,swaps and non-deliverable foreign currency forwards (used for purposes other thanbona fide hedging). Because the investment manager and the Fund intend to complywith the terms of the CPO exclusion, the Fund may need to adjust its investmentstrategies to limit its investments in these types of instruments. The CFTC has neitherreviewed nor approved the investment manager’s reliance on these exclusions, or theFund, its investment strategies or this prospectus.
P-1

II. For the Franklin Growth and Income Securities Fund, Franklin High Income SecuritiesFund and Franklin Income Securities Fund, the following is added above the “PrincipalInvestment Policies and Practices - Temporary Investments” section of the Fund Details:
The Fund is not intended as a vehicle for trading in the futures, commodity optionsor swaps markets. With respect to the Fund, the investment manager has claimedan exclusion from the definition of “commodity pool operator” (CPO) under theCommodity Exchange Act (CEA) and the rules of the Commodity Futures TradingCommission (CFTC) and, therefore, is not subject to CFTC registration orregulation as a CPO. In addition, the investment manager is relying upon a relatedexclusion from the definition of “commodity trading advisor” (CTA) under the CEAand the rules of the CFTC.
As of January 1, 2013, the terms of the CPO exclusion require the Fund, amongother things, to adhere to certain limits on its investments in futures, commodityoptions, swaps and non-deliverable foreign currency forwards (used for purposesother than bona fide hedging). Because the investment manager and the Fundintend to comply with the terms of the CPO exclusion, the Fund may need toadjust its investment strategies to limit its investments in these types ofinstruments. The CFTC has neither reviewed nor approved the investmentmanager’s reliance on these exclusions, or the Fund, its investment strategies or thisprospectus.
Please keep this supplement for future reference
P-2

SUPPLEMENT DATED JANUARY 1, 2013TO THE STATEMENT OF ADDITIONAL INFORMATION
DATED MAY 1, 2012OF
FRANKLIN GLOBAL REAL ESTATE SECURITIES FUND
FRANKLIN GROWTH AND INCOME SECURITIES FUND
FRANKLIN HIGH INCOME SECURITIES FUND
FRANKLIN INCOME SECURITIES FUND
FRANKLIN STRATEGIC INCOME SECURITIES FUND
FRANKLIN TEMPLETON VIP FOUNDING FUNDS ALLOCATION FUND
MUTUAL GLOBAL DISCOVERY SECURITIES FUND
MUTUAL INTERNATIONAL SECURITIES FUND
MUTUAL SHARES SECURITIES FUND
TEMPLETON GLOBAL BOND SECURITIES FUND(Series of Franklin Templeton Variable Insurance Products Trust)
The statement of additional information is amended as follows:
The fourth paragraph on page 23 under “Glossary of Investments, Techniques, Strategies andTheir Risks - Derivative instruments” is replaced with the following paragraphs:
The Fund is not intended as a vehicle for trading in the futures, commodity options or swapsmarkets. With respect to the Fund, the investment manager has claimed an exclusion fromthe definition of “commodity pool operator” (CPO) under the Commodity Exchange Act(CEA) and the rules of the Commodity Futures Trading Commission (CFTC) and, therefore,is not subject to CFTC registration or regulation as a CPO. In addition, the investmentmanager is relying upon a related exclusion from the definition of “commodity tradingadvisor” (CTA) under the CEA and the rules of the CFTC.
As of January 1, 2013, the terms of the CPO exclusion require the Fund, among other things,to adhere to certain limits on its investments in futures, commodity options, swaps andnon-deliverable foreign currency forwards (used for purposes other than bona fide hedging).Because the investment manager and the Fund intend to comply with the terms of the CPOexclusion, the Fund may need to adjust its investment strategies to limit its investments inthese types of instruments. The CFTC has neither reviewed nor approved the investmentmanager’s reliance on these exclusions, or the Fund, its investment strategies or thisstatement of additional information.
Please keep this supplement for future reference
SAI-1

THIS PAGE HAS BEEN INTENTIONALLY LEFT BLANK

FRANKLIN GROWTH AND INCOME SECURITIES FUND
This annual report for Franklin Growth and IncomeSecurities Fund covers the fiscal year endedDecember 31, 2012.
Performance Summary as of 12/31/12
Average annual total return of Class 2 shares represents the averageannual change in value, assuming reinvestment of dividends and capitalgains. Average returns smooth out variations in returns, which can besignificant; they are not the same as year-by-year results.
Periods ended 12/31/12
1-Year 5-Year 10-Year
Average Annual Total Return +12.23% +1.94% +5.94%
Total Return Index Comparisonfor a Hypothetical $10,000 Investment (1/1/03–12/31/12)
The graph below shows the change in value of a hypothetical $10,000investment in the Fund over the indicated period and includesreinvestment of any income or distributions. The Fund’s performance iscompared to the performance of the Standard & Poor’s® 500 Index(S&P 500®), the Lipper VIP Equity Income Funds ClassificationAverage and the Consumer Price Index (CPI). One cannot investdirectly in an index, and an index is not representative of the Fund’sportfolio. Please see Important Notes to Performance Informationpreceding the Fund Summaries.
$5,000
$10,000
$15,000
$20,000
Franklin Growthand IncomeSecurities Fund
S&P 500* CPI*Lipper VIP EquityIncome FundsClassificationAverage**
$17,810
$12,692
$19,858$19,293
1/03 12/04 12/06 12/08 12/10 12/12
*Source: © 2013 Morningstar. Please see Index Descriptions following the Fund Summaries.**Source: Lipper Inc. Please see Index Descriptions following the Fund Summaries.
Franklin Growth andIncome Securities FundClass 2
Performance reflects the Fund’sClass 2 operating expenses, butdoes not include any contract fees,expenses or sales charges. If theyhad been included, performancewould be lower. These charges anddeductions, particularly forvariable life policies, can have asignificant effect on contractvalues and insurance benefits. Seethe contract prospectus for acomplete description of theseexpenses, including sales charges.
Performance data representpast performance, whichdoes not guarantee futureresults. Investment returnand principal value willfluctuate, and you mayhave a gain or loss whenyou sell your shares.Current performance maydiffer from figures shown.
FGI-1

Fund Goals and Main Investments: Franklin Growth and Income Securities
Fund seeks capital appreciation with current income as a secondary goal.
Under normal market conditions, the Fund invests predominantly in equity
securities, including securities convertible into common stock.
Performance Overview
You can find the Fund’s one-year total return in the PerformanceSummary. The Fund underperformed its benchmark, the S&P 500,which produced a +16.00% total return.1 The Fund also under-performed its peers as measured by the Lipper VIP Equity IncomeFunds Classification Average, which posted a +14.99% return for thesame period.2
Economic and Market Overview
The U.S. economy, as measured by gross domestic product, grewmoderately in 2012, supported by positive construction, housing andlabor market trends. U.S. home prices increased in most regions due tohigher demand based on near to record-low mortgage rates, affordablehousing prices, low new-home inventories and a five-year low in U.S.foreclosures. Home construction became a leading source of economicgrowth after reaching a multi-year high in 2012, further enhancing con-fidence in the housing market. Consumer spending and personal in-come levels climbed, and inflation was generally mild with theexception of energy and food prices. Consumer sentiment reached itshighest level in five years, although the potential U.S. tax hikes andspending cuts scheduled to take effect in 2013 dampened confidencenear year-end. Nevertheless, the federal budget deficit for fiscal year2012 fell to its lowest level since 2008. Just after year-end, Congresspassed compromise legislation that preserved lower income tax rates formost U.S. households and delayed far-reaching federal spending cuts.
For the 12-month period, U.S. stocks, as measured by the S&P 500,fluctuated as investors reacted to news headlines and shifted betweenrisk taking and risk aversion. Toward period-end uncertainty eased sur-rounding the European fiscal crisis as leaders made progress oneconomic reforms and management of Greek debt, but slowingeconomic growth in Asia, particularly China, curbed global economicrecovery and markets. In its December meeting, the Federal Open
1. Source: © 2013 Morningstar.2. Source: Lipper Inc.One cannot invest directly in an index, and an index is not representative of the Fund’s portfolio.Please see Index Descriptions following the Fund Summaries.
Fund Risks: All investments in-
volve risks, including possible
loss of principal. Stock prices
fluctuate, sometimes rapidly and
dramatically, due to factors af-
fecting individual companies,
particular industries or sectors,
or general market conditions.
Convertible securities are sub-
ject to the risks of stocks when
the underlying stock price is high
relative to the conversion price
and debt securities when the
underlying stock price is low
relative to the conversion price.
The Fund’s investment in foreign
securities also involves special
risks, including currency
fluctuations and economic as
well as political uncertainty. The
Fund is actively managed but
there is no guarantee that the
manager’s investment decisions
will produce the desired results.
The Fund’s prospectus also in-
cludes a description of the main
investment risks.
FGI-2

Market Committee (FOMC) announced a 6.5% unemployment target asa guide to maintaining the historically low federal funds target rate. TheFOMC also said it intended to continue purchasing longer term Treas-uries and agency mortgage-backed securities. Despite modest third-quarter U.S. company revenues suggesting a drop in global demand, ahard-fought national election and budget deadline concerns, domesticstock markets made strong gains for the year. Value stocks generally out-performed growth stocks, and all sectors generated positive returns, asrepresented by the S&P 500. Not all investors favored stocks, however,and many sought perceived safe havens such as gold bullion, the Japa-nese yen and U.S. Treasuries. By year-end, the yield on the 10-year U.S.Treasury note declined to 1.78% from 1.89% at the beginning of 2012.
Investment Strategy
We seek to invest in a broadly diversified portfolio of equity securitiesthat we consider to be financially strong, with a focus on “blue chip”companies. We apply a bottom-up approach to investing in individualsecurities. We will assess the market price of a company’s securitiesrelative to our evaluation of the company’s long-term earnings, assetvalue and cash flow potential. We also consider a company’s price/earnings ratio, profit margins, balance sheet and liquidation value. Weconsider dividend yield in selecting stocks for the Fund because we be-lieve that, over time, dividend income can contribute significantly tototal return and can be a more consistent source of investment returnthan capital appreciation. We seek to take advantage of price dis-locations that result from the market’s short-term focus and choose toinvest in those companies that, in our opinion, offer the best trade-offbetween growth opportunity, business and financial risk, and valuation.
Manager’s Discussion
Nearly every sector the Fund invested in rose in value, as did most ofthe portfolio’s individual securities, supporting overall performanceduring the Fund’s fiscal year. Key contributing sectors included finan-cials, consumer discretionary and industrials. Within the financials sec-tor, convertible preferred and common stock holdings of diversifiedfinancial services company Bank of America were key contributors, aswere common stock holdings of JPMorgan Chase & Co. Insurer Aflacwas another key contributor among financials. The Fund’s consumerdiscretionary holdings were led by cable company Comcast and retailchain operators Lowe’s, which specializes in home improvement, andLimited Brands, which focuses on apparel and personal care products.
Portfolio BreakdownFranklin Growth and Income Securities FundBased on Total Net Assets as of 12/31/12
Financials
Utilities
Health Care
Information Technology
Energy
Industrials
16.7%
14.6%
11.8%
11.1%
Consumer Discretionary 11.6%
7.8%
Materials8.7%
Consumer Staples8.5%
5.9%
Telecommunication Services2.6%
Short-Term Investments & Other Net Assets0.7%
FGI-3

Among industrials, leading performers included conglomerate GeneralElectric and trucking company J.B. Hunt Transport Services, wheregrowth in the intermodal transportation division helped the companypost strong earnings and increase its dividend.
In contrast, some disappointing investments, mainly in the energy,materials and utilities sectors, hindered the Fund’s results. Major energysector detractors included equity-linked investments in oilfield servicesfirm Halliburton and shares of natural gas producer Spectra Energy,which was hurt by low natural gas prices. In the materials sector, nota-ble detractors included Dow Chemical and mining companies Freeport-McMoRan Copper & Gold equity-linked notes and AngloGold AshantiHoldings Finance convertible preferred stock. Among utilities, invest-ments in PG&E and Duke Energy detracted from performance.
Thank you for your participation in Franklin Growth and Income Secu-rities Fund. We look forward to serving your future investment needs.
The foregoing information reflects our analysis, opinions and portfolio holdings as ofDecember 31, 2012, the end of the reporting period. The way we implement our maininvestment strategies and the resulting portfolio holdings may change depending on factorssuch as market and economic conditions. These opinions may not be relied upon as invest-ment advice or an offer for a particular security. The information is not a complete analysis ofevery aspect of any market, country, industry, security or the Fund. Statements of fact arefrom sources considered reliable, but the investment manager makes no representation orwarranty as to their completeness or accuracy. Although historical performance is no guaran-tee of future results, these insights may help you understand our investment managementphilosophy.
Top 10 HoldingsFranklin Growth and IncomeSecurities Fund12/31/12
CompanySector/Industry
% of TotalNet Assets
JPMorgan Chase & Co. 2.5%Financials
Exxon Mobil Corp. 2.2%Energy
General Electric Co. 2.2%Industrials
NIKE Inc., B 2.1%Consumer Discretionary
BlackRock Inc. 2.1%Financials
Cisco Systems Inc. 2.1%Information Technology
Honeywell International Inc. 2.1%Industrials
Royal Dutch Shell PLC, A 2.0%Energy
Bank of America Corp.,ord. & cvt. pfd. 2.0%Financials
Aflac Inc. 2.0%Financials
The dollar value, number of shares orprincipal amount, and names of allportfolio holdings are listed in theFund’s Statement of Investments.
FGI-4

Fund ExpensesAs an investor in a variable insurance contract (Contract) that indirectlyprovides for investment in an underlying mutual fund, you can incurtransaction and/or ongoing expenses at both the Fund level and theContract level.
• Transaction expenses can include sales charges (loads) on purchases,redemption fees, surrender fees, transfer fees and premium taxes.
• Ongoing expenses can include management fees, distribution andservice (12b-1) fees, contract fees, annual maintenance fees, mortalityand expense risk fees and other fees and expenses. All mutual fundsand Contracts have some types of ongoing expenses.
The expenses shown in the table are meant to highlight ongoing expenses atthe Fund level only and do not include ongoing expenses at the Contract level,or transaction expenses at either the Fund or Contract level. While the Funddoes not have transaction expenses, if the transaction and ongoing expensesat the Contract level were included, the expenses shown would be higher. Youshould consult your Contract prospectus or disclosure document for moreinformation.
The table shows Fund-level ongoing expenses and can help you under-stand these expenses and compare them with those of other mutualfunds offered through the Contract. The table assumes a $1,000investment held for the six months indicated. Please refer to the Fundprospectus for additional information on operating expenses.
Actual Fund ExpensesThe first line (Actual) of the table provides actual account values andexpenses. The “Ending Account Value” is derived from the Fund’s ac-tual return, which includes the effect of ongoing Fund expenses, butdoes not include the effect of ongoing Contract expenses.
You can estimate the Fund-level expenses you incurred during theperiod by following these steps. Of course, your account value andexpenses will differ from those in this illustration:
1. Divide your account value by $1,000.If an account had an $8,600 value, then $8,600 ÷ $1,000 = 8.6.
2. Multiply the result by the number under the heading “Fund-LevelExpenses Incurred During Period.”If Fund-Level Expenses Incurred During Period were $7.50, then8.6 x $7.50 = $64.50.
In this illustration, the estimated expenses incurred this period at theFund level are $64.50.
Franklin Growth andIncome Securities FundClass 2
FGI-5

Hypothetical Example for Comparison with Other MutualFunds
Information in the second line (Hypothetical) of the table can help youcompare ongoing expenses of the Fund with those of other mutualfunds offered through the Contract. This information may not be usedto estimate the actual ending account balance or expenses you incurredduring the period. The hypothetical “Ending Account Value” is basedon the Fund’s actual expense ratio and an assumed 5% annual rate ofreturn before expenses, which does not represent the Fund’s actual re-turn. The figure under the heading “Fund-Level Expenses IncurredDuring Period” shows the hypothetical expenses your account wouldhave incurred under this scenario. You can compare this figure with the5% hypothetical examples that appear in shareholder reports of otherfunds offered through a Contract.
Class 2
BeginningAccount
Value 7/1/12
EndingAccount
Value 12/31/12
Fund-LevelExpenses Incurred
During Period*7/1/12–12/31/12
Actual . . . . . . . . . . . . . . . . . . . . . . . . . . . . . $1,000 $1,062.20 $4.41Hypothetical (5% return before
expenses) . . . . . . . . . . . . . . . . . . . . . . . . $1,000 $1,020.86 $4.32
*Expenses are calculated using the most recent six-month annualized expense ratio forthe Fund’s Class 2 shares (0.85%), which does not include any ongoing expenses of theContract for which the Fund is an investment option, multiplied by the averageaccount value over the period, multiplied by 184/366 to reflect the one-half yearperiod.
FGI-6

Franklin Templeton Variable Insurance Products Trust
Financial Highlights
Franklin Growth and Income Securities Fund
Year Ended December 31,
Class 1 2012 2011 2010 2009 2008
Per share operating performance(for a share outstanding throughout the year)
Net asset value, beginning of year . . . . . . . . . . . . . . . . . . . . . . . . . . . . . . . . . . . . . . . . . . . . $ 11.60 $ 11.76 $ 10.47 $ 8.72 $ 15.07
Income from investment operationsa:Net investment incomeb . . . . . . . . . . . . . . . . . . . . . . . . . . . . . . . . . . . . . . . . . . . . . . . . . 0.35 0.33 0.38 0.31 0.39Net realized and unrealized gains (losses) . . . . . . . . . . . . . . . . . . . . . . . . . . . . . . . . . . . . 1.08 (0.03) 1.32 1.92 (5.17)
Total from investment operations . . . . . . . . . . . . . . . . . . . . . . . . . . . . . . . . . . . . . . . . . . . . 1.43 0.30 1.70 2.23 (4.78)
Less distributions from:Net investment income . . . . . . . . . . . . . . . . . . . . . . . . . . . . . . . . . . . . . . . . . . . . . . . . . . (0.39) (0.46) (0.41) (0.48) (0.45)Net realized gains . . . . . . . . . . . . . . . . . . . . . . . . . . . . . . . . . . . . . . . . . . . . . . . . . . . . . . — — — — (1.12)
Total distributions . . . . . . . . . . . . . . . . . . . . . . . . . . . . . . . . . . . . . . . . . . . . . . . . . . . . . . . . (0.39) (0.46) (0.41) (0.48) (1.57)
Net asset value, end of year . . . . . . . . . . . . . . . . . . . . . . . . . . . . . . . . . . . . . . . . . . . . . . . . $ 12.64 $ 11.60 $ 11.76 $ 10.47 $ 8.72
Total returnc . . . . . . . . . . . . . . . . . . . . . . . . . . . . . . . . . . . . . . . . . . . . . . . . . . . . . . . . . . . . 12.53% 2.64% 16.93% 26.82% (34.95)%
Ratios to average net assetsExpenses . . . . . . . . . . . . . . . . . . . . . . . . . . . . . . . . . . . . . . . . . . . . . . . . . . . . . . . . . . . . . . 0.60% 0.59% 0.59% 0.60%d 0.55%d
Net investment income . . . . . . . . . . . . . . . . . . . . . . . . . . . . . . . . . . . . . . . . . . . . . . . . . . . . 2.86% 2.80% 3.62% 3.46% 3.17%
Supplemental dataNet assets, end of year (000’s) . . . . . . . . . . . . . . . . . . . . . . . . . . . . . . . . . . . . . . . . . . . . . . $154,463 $156,830 $176,590 $174,403 $ 162,936Portfolio turnover rate . . . . . . . . . . . . . . . . . . . . . . . . . . . . . . . . . . . . . . . . . . . . . . . . . . . . . 30.00% 32.93% 26.83% 51.05% 30.66%
aThe amount shown for a share outstanding throughout the period may not correlate with the Statement of Operations for the period due to the timing of salesand repurchases of the Fund shares in relation to income earned and/or fluctuating market value of the investments of the Fund.bBased on average daily shares outstanding.cTotal return does not include fees, charges or expenses imposed by the variable annuity and life insurance contracts for which the Franklin Templeton VariableInsurance Products Trust serves as an underlying investment vehicle.dBenefit of expense reduction rounds to less than 0.01%.
The accompanying notes are an integral part of these financial statements. FGI-7

Franklin Templeton Variable Insurance Products Trust
Financial Highlights (continued)
Franklin Growth and Income Securities Fund
Year Ended December 31,
Class 2 2012 2011 2010 2009 2008
Per share operating performance(for a share outstanding throughout the year)
Net asset value, beginning of year . . . . . . . . . . . . . . . . . . . . . . . . . . . . . . . . . . . . . . . . . . . . $ 11.44 $ 11.60 $ 10.33 $ 8.59 $ 14.86
Income from investment operationsa:Net investment incomeb . . . . . . . . . . . . . . . . . . . . . . . . . . . . . . . . . . . . . . . . . . . . . . . . . 0.32 0.29 0.35 0.28 0.35Net realized and unrealized gains (losses) . . . . . . . . . . . . . . . . . . . . . . . . . . . . . . . . . . . . 1.05 (0.02) 1.31 1.90 (5.10)
Total from investment operations . . . . . . . . . . . . . . . . . . . . . . . . . . . . . . . . . . . . . . . . . . . . 1.37 0.27 1.66 2.18 (4.75)
Less distributions from:Net investment income . . . . . . . . . . . . . . . . . . . . . . . . . . . . . . . . . . . . . . . . . . . . . . . . . . (0.35) (0.43) (0.39) (0.44) (0.40)Net realized gains . . . . . . . . . . . . . . . . . . . . . . . . . . . . . . . . . . . . . . . . . . . . . . . . . . . . . . — — — — (1.12)
Total distributions . . . . . . . . . . . . . . . . . . . . . . . . . . . . . . . . . . . . . . . . . . . . . . . . . . . . . . . . (0.35) (0.43) (0.39) (0.44) (1.52)
Net asset value, end of year . . . . . . . . . . . . . . . . . . . . . . . . . . . . . . . . . . . . . . . . . . . . . . . . $ 12.46 $ 11.44 $ 11.60 $ 10.33 $ 8.59
Total returnc . . . . . . . . . . . . . . . . . . . . . . . . . . . . . . . . . . . . . . . . . . . . . . . . . . . . . . . . . . . . 12.23% 2.41% 16.68% 26.55% (35.14)%
Ratios to average net assetsExpenses . . . . . . . . . . . . . . . . . . . . . . . . . . . . . . . . . . . . . . . . . . . . . . . . . . . . . . . . . . . . . . 0.85% 0.84% 0.84% 0.85%d 0.80%d
Net investment income . . . . . . . . . . . . . . . . . . . . . . . . . . . . . . . . . . . . . . . . . . . . . . . . . . . . 2.61% 2.55% 3.37% 3.21% 2.92%
Supplemental dataNet assets, end of year (000’s) . . . . . . . . . . . . . . . . . . . . . . . . . . . . . . . . . . . . . . . . . . . . . . $131,400 $129,309 $151,481 $152,077 $ 141,359Portfolio turnover rate . . . . . . . . . . . . . . . . . . . . . . . . . . . . . . . . . . . . . . . . . . . . . . . . . . . . . 30.00% 32.93% 26.83% 51.05% 30.66%
aThe amount shown for a share outstanding throughout the period may not correlate with the Statement of Operations for the period due to the timing of salesand repurchases of the Fund shares in relation to income earned and/or fluctuating market value of the investments of the Fund.bBased on average daily shares outstanding.cTotal return does not include fees, charges or expenses imposed by the variable annuity and life insurance contracts for which the Franklin Templeton VariableInsurance Products Trust serves as an underlying investment vehicle.dBenefit of expense reduction rounds to less than 0.01%.
The accompanying notes are an integral part of these financial statements.FGI-8

Franklin Templeton Variable Insurance Products TrustStatement of Investments, December 31, 2012
Franklin Growth and Income Securities Fund Country Shares Value
Common Stocks 88.1%Consumer Discretionary 10.4%Comcast Corp., A . . . . . . . . . . . . . . . . . . . . . . . . . . . . . . . . . . . . . . . . . . . . . . . . . . . . . . . . . . . . . . United States 115,680 $ 4,324,119Limited Brands Inc. . . . . . . . . . . . . . . . . . . . . . . . . . . . . . . . . . . . . . . . . . . . . . . . . . . . . . . . . . . . . United States 92,200 4,338,932Lowe’s Cos. Inc. . . . . . . . . . . . . . . . . . . . . . . . . . . . . . . . . . . . . . . . . . . . . . . . . . . . . . . . . . . . . . . . United States 116,000 4,120,320McDonald’s Corp. . . . . . . . . . . . . . . . . . . . . . . . . . . . . . . . . . . . . . . . . . . . . . . . . . . . . . . . . . . . . . United States 62,600 5,521,946NIKE Inc., B . . . . . . . . . . . . . . . . . . . . . . . . . . . . . . . . . . . . . . . . . . . . . . . . . . . . . . . . . . . . . . . . . . United States 118,400 6,109,440Target Corp. . . . . . . . . . . . . . . . . . . . . . . . . . . . . . . . . . . . . . . . . . . . . . . . . . . . . . . . . . . . . . . . . . United States 88,500 5,236,545
29,651,302
Consumer Staples 8.5%The Coca-Cola Co. . . . . . . . . . . . . . . . . . . . . . . . . . . . . . . . . . . . . . . . . . . . . . . . . . . . . . . . . . . . . . United States 83,200 3,016,000Diageo PLC, ADR . . . . . . . . . . . . . . . . . . . . . . . . . . . . . . . . . . . . . . . . . . . . . . . . . . . . . . . . . . . . . . United Kingdom 44,100 5,141,178Kellogg Co. . . . . . . . . . . . . . . . . . . . . . . . . . . . . . . . . . . . . . . . . . . . . . . . . . . . . . . . . . . . . . . . . . . United States 78,900 4,406,565PepsiCo Inc. . . . . . . . . . . . . . . . . . . . . . . . . . . . . . . . . . . . . . . . . . . . . . . . . . . . . . . . . . . . . . . . . . United States 72,300 4,947,489The Procter & Gamble Co. . . . . . . . . . . . . . . . . . . . . . . . . . . . . . . . . . . . . . . . . . . . . . . . . . . . . . . . United States 45,600 3,095,784Unilever NV, N.Y. shs. . . . . . . . . . . . . . . . . . . . . . . . . . . . . . . . . . . . . . . . . . . . . . . . . . . . . . . . . . . Netherlands 93,800 3,592,540
24,199,556
Energy 8.1%BP PLC, ADR . . . . . . . . . . . . . . . . . . . . . . . . . . . . . . . . . . . . . . . . . . . . . . . . . . . . . . . . . . . . . . . . . United Kingdom 66,900 2,785,716Chevron Corp. . . . . . . . . . . . . . . . . . . . . . . . . . . . . . . . . . . . . . . . . . . . . . . . . . . . . . . . . . . . . . . . . United States 47,000 5,082,580Exxon Mobil Corp. . . . . . . . . . . . . . . . . . . . . . . . . . . . . . . . . . . . . . . . . . . . . . . . . . . . . . . . . . . . . . United States 71,944 6,226,753Royal Dutch Shell PLC, A, ADR . . . . . . . . . . . . . . . . . . . . . . . . . . . . . . . . . . . . . . . . . . . . . . . . . . . . United Kingdom 83,100 5,729,745Spectra Energy Corp. . . . . . . . . . . . . . . . . . . . . . . . . . . . . . . . . . . . . . . . . . . . . . . . . . . . . . . . . . . . United States 126,700 3,469,046
23,293,840
Financials 14.2%Aflac Inc. . . . . . . . . . . . . . . . . . . . . . . . . . . . . . . . . . . . . . . . . . . . . . . . . . . . . . . . . . . . . . . . . . . . . United States 105,000 5,577,600Bank of America Corp. . . . . . . . . . . . . . . . . . . . . . . . . . . . . . . . . . . . . . . . . . . . . . . . . . . . . . . . . . . United States 180,800 2,097,280BlackRock Inc. . . . . . . . . . . . . . . . . . . . . . . . . . . . . . . . . . . . . . . . . . . . . . . . . . . . . . . . . . . . . . . . . United States 28,900 5,973,919JPMorgan Chase & Co. . . . . . . . . . . . . . . . . . . . . . . . . . . . . . . . . . . . . . . . . . . . . . . . . . . . . . . . . . United States 162,070 7,126,218Marsh & McLennan Cos. Inc. . . . . . . . . . . . . . . . . . . . . . . . . . . . . . . . . . . . . . . . . . . . . . . . . . . . . . United States 96,000 3,309,120MetLife Inc. . . . . . . . . . . . . . . . . . . . . . . . . . . . . . . . . . . . . . . . . . . . . . . . . . . . . . . . . . . . . . . . . . . United States 41,382 1,363,123People’s United Financial Inc. . . . . . . . . . . . . . . . . . . . . . . . . . . . . . . . . . . . . . . . . . . . . . . . . . . . . . United States 234,500 2,835,105QBE Insurance Group Ltd. . . . . . . . . . . . . . . . . . . . . . . . . . . . . . . . . . . . . . . . . . . . . . . . . . . . . . . . Australia 257,900 2,957,699T. Rowe Price Group Inc. . . . . . . . . . . . . . . . . . . . . . . . . . . . . . . . . . . . . . . . . . . . . . . . . . . . . . . . . United States 68,000 4,428,840Wells Fargo & Co. . . . . . . . . . . . . . . . . . . . . . . . . . . . . . . . . . . . . . . . . . . . . . . . . . . . . . . . . . . . . . United States 141,500 4,836,470
40,505,374
Health Care 7.8%Abbott Laboratories . . . . . . . . . . . . . . . . . . . . . . . . . . . . . . . . . . . . . . . . . . . . . . . . . . . . . . . . . . . . United States 53,200 3,484,600Johnson & Johnson . . . . . . . . . . . . . . . . . . . . . . . . . . . . . . . . . . . . . . . . . . . . . . . . . . . . . . . . . . . . United States 64,600 4,528,460Merck & Co. Inc. . . . . . . . . . . . . . . . . . . . . . . . . . . . . . . . . . . . . . . . . . . . . . . . . . . . . . . . . . . . . . . United States 134,461 5,504,833Pfizer Inc. . . . . . . . . . . . . . . . . . . . . . . . . . . . . . . . . . . . . . . . . . . . . . . . . . . . . . . . . . . . . . . . . . . . United States 190,800 4,785,264Roche Holding AG . . . . . . . . . . . . . . . . . . . . . . . . . . . . . . . . . . . . . . . . . . . . . . . . . . . . . . . . . . . . . Switzerland 19,300 3,879,609
22,182,766
Industrials 14.2%3M Co. . . . . . . . . . . . . . . . . . . . . . . . . . . . . . . . . . . . . . . . . . . . . . . . . . . . . . . . . . . . . . . . . . . . . . United States 46,000 4,271,100The Boeing Co. . . . . . . . . . . . . . . . . . . . . . . . . . . . . . . . . . . . . . . . . . . . . . . . . . . . . . . . . . . . . . . . United States 55,200 4,159,872Caterpillar Inc. . . . . . . . . . . . . . . . . . . . . . . . . . . . . . . . . . . . . . . . . . . . . . . . . . . . . . . . . . . . . . . . . United States 36,600 3,278,628Emerson Electric Co. . . . . . . . . . . . . . . . . . . . . . . . . . . . . . . . . . . . . . . . . . . . . . . . . . . . . . . . . . . . United States 96,700 5,121,232General Electric Co. . . . . . . . . . . . . . . . . . . . . . . . . . . . . . . . . . . . . . . . . . . . . . . . . . . . . . . . . . . . . United States 293,200 6,154,268Honeywell International Inc. . . . . . . . . . . . . . . . . . . . . . . . . . . . . . . . . . . . . . . . . . . . . . . . . . . . . . . United States 92,400 5,864,628J.B. Hunt Transport Services Inc. . . . . . . . . . . . . . . . . . . . . . . . . . . . . . . . . . . . . . . . . . . . . . . . . . . . United States 54,300 3,242,253
FGI-9

Franklin Templeton Variable Insurance Products TrustStatement of Investments, December 31, 2012 (continued)
Franklin Growth and Income Securities Fund Country Shares Value
Common Stocks (continued)Industrials (continued)Republic Services Inc. . . . . . . . . . . . . . . . . . . . . . . . . . . . . . . . . . . . . . . . . . . . . . . . . . . . . . . . . . . . United States 144,900 $ 4,249,917United Parcel Service Inc., B . . . . . . . . . . . . . . . . . . . . . . . . . . . . . . . . . . . . . . . . . . . . . . . . . . . . . . United States 59,600 4,394,308
40,736,206
Information Technology 10.0%Analog Devices Inc. . . . . . . . . . . . . . . . . . . . . . . . . . . . . . . . . . . . . . . . . . . . . . . . . . . . . . . . . . . . . United States 113,400 4,769,604Cisco Systems Inc. . . . . . . . . . . . . . . . . . . . . . . . . . . . . . . . . . . . . . . . . . . . . . . . . . . . . . . . . . . . . . United States 301,508 5,924,632Intel Corp. . . . . . . . . . . . . . . . . . . . . . . . . . . . . . . . . . . . . . . . . . . . . . . . . . . . . . . . . . . . . . . . . . . . United States 233,700 4,821,231International Business Machines Corp. . . . . . . . . . . . . . . . . . . . . . . . . . . . . . . . . . . . . . . . . . . . . . . United States 27,400 5,248,470Microsoft Corp. . . . . . . . . . . . . . . . . . . . . . . . . . . . . . . . . . . . . . . . . . . . . . . . . . . . . . . . . . . . . . . . United States 146,300 3,910,599Paychex Inc. . . . . . . . . . . . . . . . . . . . . . . . . . . . . . . . . . . . . . . . . . . . . . . . . . . . . . . . . . . . . . . . . . United States 121,900 3,795,966
28,470,502
Materials 6.4%BHP Billiton Ltd., ADR . . . . . . . . . . . . . . . . . . . . . . . . . . . . . . . . . . . . . . . . . . . . . . . . . . . . . . . . . . Australia 62,900 4,933,876The Dow Chemical Co. . . . . . . . . . . . . . . . . . . . . . . . . . . . . . . . . . . . . . . . . . . . . . . . . . . . . . . . . . . United States 117,700 3,804,064E. I. du Pont de Nemours and Co. . . . . . . . . . . . . . . . . . . . . . . . . . . . . . . . . . . . . . . . . . . . . . . . . . . United States 102,900 4,627,413Rio Tinto PLC, ADR . . . . . . . . . . . . . . . . . . . . . . . . . . . . . . . . . . . . . . . . . . . . . . . . . . . . . . . . . . . . United Kingdom 83,800 4,867,942
18,233,295
Telecommunication Services 2.6%AT&T Inc. . . . . . . . . . . . . . . . . . . . . . . . . . . . . . . . . . . . . . . . . . . . . . . . . . . . . . . . . . . . . . . . . . . . United States 123,297 4,156,342Vodafone Group PLC, ADR . . . . . . . . . . . . . . . . . . . . . . . . . . . . . . . . . . . . . . . . . . . . . . . . . . . . . . . United Kingdom 135,500 3,413,245
7,569,587
Utilities 5.9%American Electric Power Co. Inc. . . . . . . . . . . . . . . . . . . . . . . . . . . . . . . . . . . . . . . . . . . . . . . . . . . United States 107,100 4,571,028Duke Energy Corp. . . . . . . . . . . . . . . . . . . . . . . . . . . . . . . . . . . . . . . . . . . . . . . . . . . . . . . . . . . . . . United States 82,003 5,231,791Great Plains Energy Inc. . . . . . . . . . . . . . . . . . . . . . . . . . . . . . . . . . . . . . . . . . . . . . . . . . . . . . . . . . United States 111,748 2,269,602PG&E Corp. . . . . . . . . . . . . . . . . . . . . . . . . . . . . . . . . . . . . . . . . . . . . . . . . . . . . . . . . . . . . . . . . . . United States 120,800 4,853,744
16,926,165
Total Common Stocks (Cost $200,029,538) . . . . . . . . . . . . . . . . . . . . . . . . . . . . . 251,768,593
aEquity-Linked Securities 5.2%Energy 2.6%
bBank of America Corp. into Halliburton Co., 5.00%, 144A . . . . . . . . . . . . . . . . . . . . . . . . . . . . . . . United States 105,000 3,691,286bJPMorgan Chase & Co. into Schlumberger Ltd., 6.00%, 144A . . . . . . . . . . . . . . . . . . . . . . . . . . . . . United States 54,000 3,811,752
7,503,038
Information Technology 1.1%bBarclays Bank PLC into Apple Inc., 7.50%, 144A . . . . . . . . . . . . . . . . . . . . . . . . . . . . . . . . . . . . . . United States 6,000 3,263,016
Materials 1.5%Credit Suisse New York into Freeport-McMoRan Copper & Gold Inc., 8.40%, B . . . . . . . . . . . . . . . . United States 120,000 4,239,432
Total Equity-Linked Securities (Cost $15,821,100) . . . . . . . . . . . . . . . . . . . . . . 15,005,486
Convertible Preferred Stocks 5.8%Consumer Discretionary 1.2%General Motors Co., 4.75%, cvt. pfd., B . . . . . . . . . . . . . . . . . . . . . . . . . . . . . . . . . . . . . . . . . . . . . United States 77,000 3,398,010
Energy 1.1%bChesapeake Energy Corp., 5.75%, cvt. pfd., 144A . . . . . . . . . . . . . . . . . . . . . . . . . . . . . . . . . . . . . United States 3,500 3,137,697
FGI-10

Franklin Templeton Variable Insurance Products TrustStatement of Investments, December 31, 2012 (continued)
Franklin Growth and Income Securities Fund Country Shares Value
Convertible Preferred Stocks (continued)Financials 2.3%Bank of America Corp., 7.25%, cvt. pfd., L . . . . . . . . . . . . . . . . . . . . . . . . . . . . . . . . . . . . . . . . . . . United States 3,100 $ 3,518,500MetLife Inc., 5.00%, cvt. pfd. . . . . . . . . . . . . . . . . . . . . . . . . . . . . . . . . . . . . . . . . . . . . . . . . . . . . . United States 71,100 3,161,817
6,680,317
Industrials 0.4%Genesee & Wyoming Inc., 5.00%, cvt. pfd. . . . . . . . . . . . . . . . . . . . . . . . . . . . . . . . . . . . . . . . . . . . United States 9,200 1,024,972
Materials 0.8%AngloGold Ashanti Holdings Finance PLC, 6.00%, cvt. pfd. . . . . . . . . . . . . . . . . . . . . . . . . . . . . . . . South Africa 65,000 2,429,050
Total Convertible Preferred Stocks (Cost $17,087,496) . . . . . . . . . . . . . . . . . 16,670,046
Preferred Stocks (Cost $8,133,100) 0.2%Financials 0.2%
cFannie Mae, 8.25%, pfd. . . . . . . . . . . . . . . . . . . . . . . . . . . . . . . . . . . . . . . . . . . . . . . . . . . . . . . . . United States 325,000 542,750
Total Investments before Short Term Investments(Cost $241,071,234) . . . . . . . . . . . . . . . . . . . . . . . . . . . . . . . . . . . . . . . . . . . . . . . . . . 283,986,875
PrincipalAmount
Short Term Investments (Cost $2,162,058) 0.8%Repurchase Agreements 0.8%
dJoint Repurchase Agreement, 0.154%, 1/02/13 (Maturity Value $2,162,077) . . . . . . . . . . . . . . . . . United States $2,162,058 2,162,058BNP Paribas Securities Corp. (Maturity Value $281,459)Credit Suisse Securities (USA) LLC (Maturity Value $351,835)Deutsche Bank Securities Inc. (Maturity Value $227,018)HSBC Securities (USA) Inc. (Maturity Value $633,294)Merrill Lynch, Pierce, Fenner & Smith Inc. (Maturity Value $281,459)Morgan Stanley & Co. LLC (Maturity Value $105,553)UBS Securities LLC (Maturity Value $281,459)
Collateralized by U.S. Government Agency Securities, 0.00% - 6.21%, 1/15/13 - 1/22/37;U.S. Treasury Bonds, 11.25%, 2/15/15; and U.S. Treasury Notes, 0.25% - 2.00%,11/30/13 - 9/15/15 (valued at $2,205,544)
Total Investments (Cost $243,233,292) 100.1% . . . . . . . . . . . . . . . . . . . . . . . . 286,148,933
Other Assets, less Liabilities (0.1)% . . . . . . . . . . . . . . . . . . . . . . . . . . . . . . . . . . . . . (285,338)
Net Assets 100.0% . . . . . . . . . . . . . . . . . . . . . . . . . . . . . . . . . . . . . . . . . . . . . . . . . . . . . . $285,863,595
See abbreviations on page FGI-23.
aSee Note 1(e) regarding equity-linked securities.bSecurity was purchased pursuant to Rule 144A under the Securities Act of 1933 and may be sold in transactions exempt from registration only to qualifiedinstitutional buyers or in a public offering registered under the Securities Act of 1933. These securities have been deemed liquid under guidelines approved by theTrust’s Board of Trustees. At December 31, 2012, the aggregate value of these securities was $13,903,751, representing 4.86% of net assets.cNon-income producing.dSee Note 1(c) regarding joint repurchase agreement.
The accompanying notes are an integral part of these financial statements. FGI-11
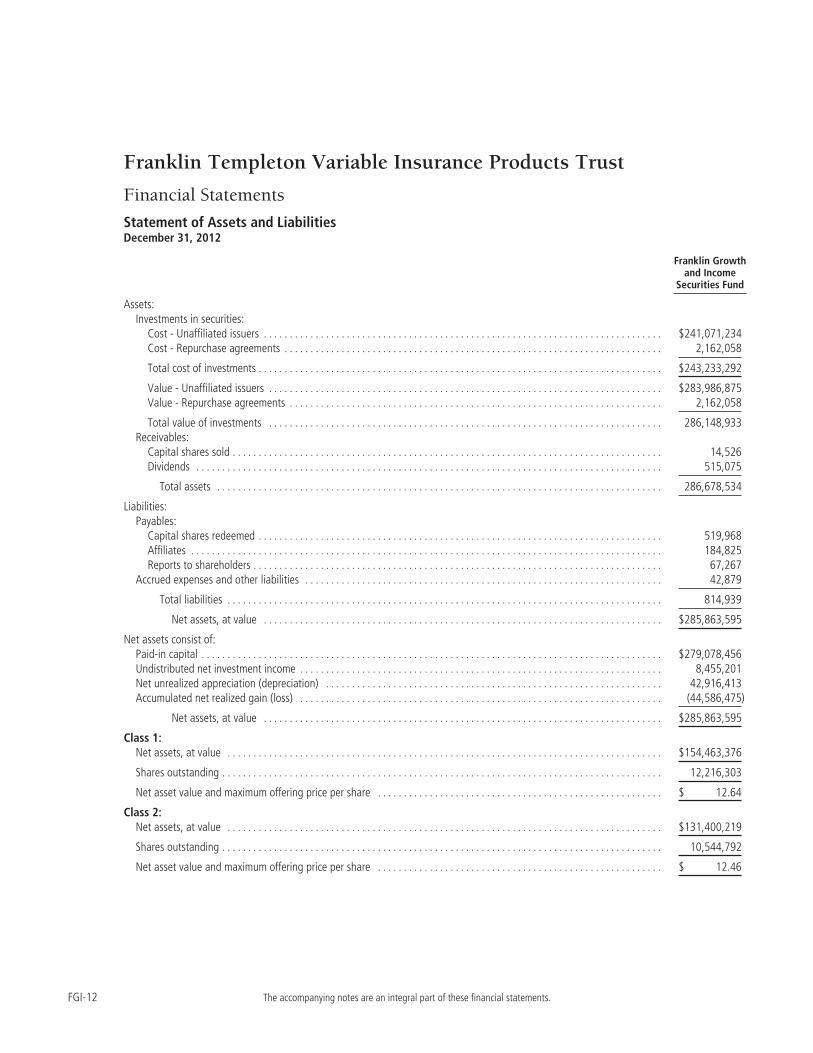
Franklin Templeton Variable Insurance Products Trust
Financial Statements
Statement of Assets and LiabilitiesDecember 31, 2012
Franklin Growthand Income
Securities Fund
Assets:Investments in securities:
Cost - Unaffiliated issuers . . . . . . . . . . . . . . . . . . . . . . . . . . . . . . . . . . . . . . . . . . . . . . . . . . . . . . . . . . . . . . . . . . . . . . . . . . . . . $241,071,234Cost - Repurchase agreements . . . . . . . . . . . . . . . . . . . . . . . . . . . . . . . . . . . . . . . . . . . . . . . . . . . . . . . . . . . . . . . . . . . . . . . . . 2,162,058
Total cost of investments . . . . . . . . . . . . . . . . . . . . . . . . . . . . . . . . . . . . . . . . . . . . . . . . . . . . . . . . . . . . . . . . . . . . . . . . . . . . . . $243,233,292
Value - Unaffiliated issuers . . . . . . . . . . . . . . . . . . . . . . . . . . . . . . . . . . . . . . . . . . . . . . . . . . . . . . . . . . . . . . . . . . . . . . . . . . . . $283,986,875Value - Repurchase agreements . . . . . . . . . . . . . . . . . . . . . . . . . . . . . . . . . . . . . . . . . . . . . . . . . . . . . . . . . . . . . . . . . . . . . . . . 2,162,058
Total value of investments . . . . . . . . . . . . . . . . . . . . . . . . . . . . . . . . . . . . . . . . . . . . . . . . . . . . . . . . . . . . . . . . . . . . . . . . . . . . 286,148,933Receivables:
Capital shares sold . . . . . . . . . . . . . . . . . . . . . . . . . . . . . . . . . . . . . . . . . . . . . . . . . . . . . . . . . . . . . . . . . . . . . . . . . . . . . . . . . . . 14,526Dividends . . . . . . . . . . . . . . . . . . . . . . . . . . . . . . . . . . . . . . . . . . . . . . . . . . . . . . . . . . . . . . . . . . . . . . . . . . . . . . . . . . . . . . . . . . 515,075
Total assets . . . . . . . . . . . . . . . . . . . . . . . . . . . . . . . . . . . . . . . . . . . . . . . . . . . . . . . . . . . . . . . . . . . . . . . . . . . . . . . . . . . . . . 286,678,534
Liabilities:Payables:
Capital shares redeemed . . . . . . . . . . . . . . . . . . . . . . . . . . . . . . . . . . . . . . . . . . . . . . . . . . . . . . . . . . . . . . . . . . . . . . . . . . . . . . 519,968Affiliates . . . . . . . . . . . . . . . . . . . . . . . . . . . . . . . . . . . . . . . . . . . . . . . . . . . . . . . . . . . . . . . . . . . . . . . . . . . . . . . . . . . . . . . . . . . 184,825Reports to shareholders . . . . . . . . . . . . . . . . . . . . . . . . . . . . . . . . . . . . . . . . . . . . . . . . . . . . . . . . . . . . . . . . . . . . . . . . . . . . . . . 67,267
Accrued expenses and other liabilities . . . . . . . . . . . . . . . . . . . . . . . . . . . . . . . . . . . . . . . . . . . . . . . . . . . . . . . . . . . . . . . . . . . . . 42,879
Total liabilities . . . . . . . . . . . . . . . . . . . . . . . . . . . . . . . . . . . . . . . . . . . . . . . . . . . . . . . . . . . . . . . . . . . . . . . . . . . . . . . . . . . . 814,939
Net assets, at value . . . . . . . . . . . . . . . . . . . . . . . . . . . . . . . . . . . . . . . . . . . . . . . . . . . . . . . . . . . . . . . . . . . . . . . . . . . . . $285,863,595
Net assets consist of:Paid-in capital . . . . . . . . . . . . . . . . . . . . . . . . . . . . . . . . . . . . . . . . . . . . . . . . . . . . . . . . . . . . . . . . . . . . . . . . . . . . . . . . . . . . . . . . . $279,078,456Undistributed net investment income . . . . . . . . . . . . . . . . . . . . . . . . . . . . . . . . . . . . . . . . . . . . . . . . . . . . . . . . . . . . . . . . . . . . . . 8,455,201Net unrealized appreciation (depreciation) . . . . . . . . . . . . . . . . . . . . . . . . . . . . . . . . . . . . . . . . . . . . . . . . . . . . . . . . . . . . . . . . . 42,916,413Accumulated net realized gain (loss) . . . . . . . . . . . . . . . . . . . . . . . . . . . . . . . . . . . . . . . . . . . . . . . . . . . . . . . . . . . . . . . . . . . . . . (44,586,475)
Net assets, at value . . . . . . . . . . . . . . . . . . . . . . . . . . . . . . . . . . . . . . . . . . . . . . . . . . . . . . . . . . . . . . . . . . . . . . . . . . . . . $285,863,595
Class 1:Net assets, at value . . . . . . . . . . . . . . . . . . . . . . . . . . . . . . . . . . . . . . . . . . . . . . . . . . . . . . . . . . . . . . . . . . . . . . . . . . . . . . . . . . . . $154,463,376
Shares outstanding . . . . . . . . . . . . . . . . . . . . . . . . . . . . . . . . . . . . . . . . . . . . . . . . . . . . . . . . . . . . . . . . . . . . . . . . . . . . . . . . . . . . . 12,216,303
Net asset value and maximum offering price per share . . . . . . . . . . . . . . . . . . . . . . . . . . . . . . . . . . . . . . . . . . . . . . . . . . . . . . . $ 12.64
Class 2:Net assets, at value . . . . . . . . . . . . . . . . . . . . . . . . . . . . . . . . . . . . . . . . . . . . . . . . . . . . . . . . . . . . . . . . . . . . . . . . . . . . . . . . . . . . $131,400,219
Shares outstanding . . . . . . . . . . . . . . . . . . . . . . . . . . . . . . . . . . . . . . . . . . . . . . . . . . . . . . . . . . . . . . . . . . . . . . . . . . . . . . . . . . . . . 10,544,792
Net asset value and maximum offering price per share . . . . . . . . . . . . . . . . . . . . . . . . . . . . . . . . . . . . . . . . . . . . . . . . . . . . . . . $ 12.46
The accompanying notes are an integral part of these financial statements.FGI-12

Franklin Templeton Variable Insurance Products Trust
Financial Statements (continued)
Statement of Operationsfor the year ended December 31, 2012
Franklin Growthand Income
Securities Fund
Investment income:Dividends . . . . . . . . . . . . . . . . . . . . . . . . . . . . . . . . . . . . . . . . . . . . . . . . . . . . . . . . . . . . . . . . . . . . . . . . . . . . . . . . . . . . . . . . . . . . . $10,047,164Interest . . . . . . . . . . . . . . . . . . . . . . . . . . . . . . . . . . . . . . . . . . . . . . . . . . . . . . . . . . . . . . . . . . . . . . . . . . . . . . . . . . . . . . . . . . . . . . 32,831
Total investment income . . . . . . . . . . . . . . . . . . . . . . . . . . . . . . . . . . . . . . . . . . . . . . . . . . . . . . . . . . . . . . . . . . . . . . . . . . . . 10,079,995
Expenses:Management fees (Note 3a) . . . . . . . . . . . . . . . . . . . . . . . . . . . . . . . . . . . . . . . . . . . . . . . . . . . . . . . . . . . . . . . . . . . . . . . . . . . . . 1,563,339Distribution fees - Class 2 (Note 3c) . . . . . . . . . . . . . . . . . . . . . . . . . . . . . . . . . . . . . . . . . . . . . . . . . . . . . . . . . . . . . . . . . . . . . . . 332,414Unaffiliated transfer agent fees . . . . . . . . . . . . . . . . . . . . . . . . . . . . . . . . . . . . . . . . . . . . . . . . . . . . . . . . . . . . . . . . . . . . . . . . . . . 158Custodian fees (Note 4) . . . . . . . . . . . . . . . . . . . . . . . . . . . . . . . . . . . . . . . . . . . . . . . . . . . . . . . . . . . . . . . . . . . . . . . . . . . . . . . . . 6,411Reports to shareholders . . . . . . . . . . . . . . . . . . . . . . . . . . . . . . . . . . . . . . . . . . . . . . . . . . . . . . . . . . . . . . . . . . . . . . . . . . . . . . . . . 120,585Professional fees . . . . . . . . . . . . . . . . . . . . . . . . . . . . . . . . . . . . . . . . . . . . . . . . . . . . . . . . . . . . . . . . . . . . . . . . . . . . . . . . . . . . . . . 35,738Trustees’ fees and expenses . . . . . . . . . . . . . . . . . . . . . . . . . . . . . . . . . . . . . . . . . . . . . . . . . . . . . . . . . . . . . . . . . . . . . . . . . . . . . 1,154Other . . . . . . . . . . . . . . . . . . . . . . . . . . . . . . . . . . . . . . . . . . . . . . . . . . . . . . . . . . . . . . . . . . . . . . . . . . . . . . . . . . . . . . . . . . . . . . . . 13,938
Total expenses . . . . . . . . . . . . . . . . . . . . . . . . . . . . . . . . . . . . . . . . . . . . . . . . . . . . . . . . . . . . . . . . . . . . . . . . . . . . . . . . . . . . 2,073,737
Net investment income . . . . . . . . . . . . . . . . . . . . . . . . . . . . . . . . . . . . . . . . . . . . . . . . . . . . . . . . . . . . . . . . . . . . . . . . 8,006,258
Realized and unrealized gains (losses):Net realized gain (loss) from:
Investments . . . . . . . . . . . . . . . . . . . . . . . . . . . . . . . . . . . . . . . . . . . . . . . . . . . . . . . . . . . . . . . . . . . . . . . . . . . . . . . . . . . . . . . . 14,587,339Foreign currency transactions . . . . . . . . . . . . . . . . . . . . . . . . . . . . . . . . . . . . . . . . . . . . . . . . . . . . . . . . . . . . . . . . . . . . . . . . . . 4,487
Net realized gain (loss) . . . . . . . . . . . . . . . . . . . . . . . . . . . . . . . . . . . . . . . . . . . . . . . . . . . . . . . . . . . . . . . . . . . . . . . . 14,591,826
Net change in unrealized appreciation (depreciation) on:Investments . . . . . . . . . . . . . . . . . . . . . . . . . . . . . . . . . . . . . . . . . . . . . . . . . . . . . . . . . . . . . . . . . . . . . . . . . . . . . . . . . . . . . . . . 11,482,370Translation of other assets and liabilities denominated in foreign currencies . . . . . . . . . . . . . . . . . . . . . . . . . . . . . . . . . . . . (2,149)
Net change in unrealized appreciation (depreciation) . . . . . . . . . . . . . . . . . . . . . . . . . . . . . . . . . . . . . . . . . . . . . . . . 11,480,221
Net realized and unrealized gain (loss) . . . . . . . . . . . . . . . . . . . . . . . . . . . . . . . . . . . . . . . . . . . . . . . . . . . . . . . . . . . . . . . . . . . . . . . 26,072,047
Net increase (decrease) in net assets resulting from operations . . . . . . . . . . . . . . . . . . . . . . . . . . . . . . . . . . . . . . . . . . . . . . . . . . . $34,078,305
The accompanying notes are an integral part of these financial statements. FGI-13

Franklin Templeton Variable Insurance Products Trust
Financial Statements (continued)
Statements of Changes in Net Assets
Franklin Growth and IncomeSecurities Fund
Year Ended December 31,2012 2011
Increase (decrease) in net assets:Operations:
Net investment income . . . . . . . . . . . . . . . . . . . . . . . . . . . . . . . . . . . . . . . . . . . . . . . . . . . . . . . . . . . . . . . . . . $ 8,006,258 $ 8,197,307Net realized gain (loss) from investments and foreign currency transactions . . . . . . . . . . . . . . . . . . . . . . . 14,591,826 24,190,927Net change in unrealized appreciation (depreciation) on investments and translation of other assets
and liabilities denominated in foreign currencies . . . . . . . . . . . . . . . . . . . . . . . . . . . . . . . . . . . . . . . . . . . 11,480,221 (24,900,751)
Net increase (decrease) in net assets resulting from operations . . . . . . . . . . . . . . . . . . . . . . . . . . . . . . . 34,078,305 7,487,483
Distributions to shareholders from:Net investment income:
Class 1 . . . . . . . . . . . . . . . . . . . . . . . . . . . . . . . . . . . . . . . . . . . . . . . . . . . . . . . . . . . . . . . . . . . . . . . . . . . . . (4,951,744) (6,502,022)Class 2 . . . . . . . . . . . . . . . . . . . . . . . . . . . . . . . . . . . . . . . . . . . . . . . . . . . . . . . . . . . . . . . . . . . . . . . . . . . . . (3,811,748) (5,102,769)
Total distributions to shareholders . . . . . . . . . . . . . . . . . . . . . . . . . . . . . . . . . . . . . . . . . . . . . . . . . . . . . . . . . . . (8,763,492) (11,604,791)
Capital share transactions: (Note 2)Class 1 . . . . . . . . . . . . . . . . . . . . . . . . . . . . . . . . . . . . . . . . . . . . . . . . . . . . . . . . . . . . . . . . . . . . . . . . . . . . . (16,240,212) (17,555,780)Class 2 . . . . . . . . . . . . . . . . . . . . . . . . . . . . . . . . . . . . . . . . . . . . . . . . . . . . . . . . . . . . . . . . . . . . . . . . . . . . . (9,349,674) (20,259,007)Class 4 . . . . . . . . . . . . . . . . . . . . . . . . . . . . . . . . . . . . . . . . . . . . . . . . . . . . . . . . . . . . . . . . . . . . . . . . . . . . . — (4,301)
Total capital share transactions . . . . . . . . . . . . . . . . . . . . . . . . . . . . . . . . . . . . . . . . . . . . . . . . . . . . . . . . . . . . . . (25,589,886) (37,819,088)
Net increase (decrease) in net assets . . . . . . . . . . . . . . . . . . . . . . . . . . . . . . . . . . . . . . . . . . . . . . . . . . . . . (275,073) (41,936,396)Net assets:
Beginning of year . . . . . . . . . . . . . . . . . . . . . . . . . . . . . . . . . . . . . . . . . . . . . . . . . . . . . . . . . . . . . . . . . . . . . . . . . 286,138,668 328,075,064
End of year . . . . . . . . . . . . . . . . . . . . . . . . . . . . . . . . . . . . . . . . . . . . . . . . . . . . . . . . . . . . . . . . . . . . . . . . . . . . . . $285,863,595 $286,138,668
Undistributed net investment income included in net assets:End of year . . . . . . . . . . . . . . . . . . . . . . . . . . . . . . . . . . . . . . . . . . . . . . . . . . . . . . . . . . . . . . . . . . . . . . . . . . . . . . $ 8,455,201 $ 8,605,551
The accompanying notes are an integral part of these financial statements.FGI-14

Franklin Templeton Variable Insurance Products Trust
Notes to Financial Statements
Franklin Growth and Income Securities Fund
1. ORGANIZATION AND SIGNIFICANT ACCOUNTING POLICIES
Franklin Templeton Variable Insurance Products Trust (Trust) is registered under the Investment Company Act of 1940, asamended, (1940 Act) as an open-end investment company, consisting of twenty separate funds. The Franklin Growth andIncome Securities Fund (Fund) is included in this report. The financial statements of the remaining funds in the Trust arepresented separately. Shares of the Fund are generally sold only to insurance company separate accounts to fund the benefits ofvariable life insurance policies or variable annuity contracts. At December 31, 2012, 77.41% of the Fund’s shares were heldthrough one insurance company. Investment activities of these insurance company separate accounts could have a materialimpact on the Fund. The Fund offers two classes of shares: Class 1 and Class 2. Each class of shares differs by its distributionfees, voting rights on matters affecting a single class and its exchange privilege.
The following summarizes the Fund’s significant accounting policies.
a. Financial Instrument Valuation
The Fund’s investments in financial instruments are carried at fair value daily. Fair value is the price that would be received tosell an asset or paid to transfer a liability in an orderly transaction between market participants on the measurement date. Underprocedures approved by the Trust’s Board of Trustees (the Board), the Fund’s administrator, investment manager and otheraffiliates have formed the Valuation and Liquidity Oversight Committee (VLOC). The VLOC provides administration andoversight of the Fund’s valuation policies and procedures, which are approved annually by the Board. Among other things, theseprocedures allow the Fund to utilize independent pricing services, quotations from securities and financial instrument dealers,and other market sources to determine fair value.
Equity securities and derivative financial instruments (derivatives) listed on an exchange or on the NASDAQ National MarketSystem are valued at the last quoted sale price or the official closing price of the day, respectively. Foreign equity securities arevalued as of the close of trading on the foreign stock exchange on which the security is primarily traded, or the NYSE, whicheveris earlier. The value is then converted into its U.S. dollar equivalent at the foreign exchange rate in effect at the close of the NYSEon the day that the value of the security is determined. Over-the-counter (OTC) securities are valued within the range of themost recent quoted bid and ask prices. Securities that trade in multiple markets or on multiple exchanges are valued accordingto the broadest and most representative market. Certain equity securities are valued based upon fundamental characteristics orrelationships to similar securities.
Debt and certain preferred securities generally trade in the OTC market rather than on a securities exchange. The Fund’s pricingservices use multiple valuation techniques to determine fair value. In instances where sufficient market activity exists, the pricingservices may utilize a market-based approach through which quotes from market makers are used to determine fair value. Ininstances where sufficient market activity may not exist or is limited, the pricing services also utilize proprietary valuation modelswhich may consider market characteristics such as benchmark yield curves, credit spreads, estimated default rates, anticipatedmarket interest rate volatility, coupon rates, anticipated timing of principal repayments, underlying collateral, and other uniquesecurity features in order to estimate the relevant cash flows, which are then discounted to calculate the fair value. Repurchaseagreements are valued at cost, which approximates market value.
The Fund has procedures to determine the fair value of financial instruments for which market prices are not reliable or readilyavailable. Under these procedures, the VLOC convenes on a regular basis to review such financial instruments and considers anumber of factors, including significant unobservable valuation inputs, when arriving at fair value. The VLOC primarily employsa market-based approach which may use related or comparable assets or liabilities, recent transactions, market multiples, bookvalues, and other relevant information for the investment to determine the fair value of the investment. An income-basedvaluation approach may also be used in which the anticipated future cash flows of the investment are discounted to calculate fairvalue. Discounts may also be applied due to the nature or duration of any restrictions on the disposition of the investments. Dueto the inherent uncertainty of valuations of such investments, the fair values may differ significantly from the values that would
FGI-15

Franklin Templeton Variable Insurance Products Trust
Notes to Financial Statements (continued)
Franklin Growth and Income Securities Fund
1. ORGANIZATION AND SIGNIFICANT ACCOUNTING POLICIES (continued)
a. Financial Instrument Valuation (continued)
have been used had an active market existed. The VLOC employs various methods for calibrating these valuation approachesincluding a regular review of key inputs and assumptions, transactional back-testing or disposition analysis, and reviews of anyrelated market activity.
Trading in securities on foreign securities stock exchanges and OTC markets may be completed before the daily close of businesson the NYSE. Occasionally, events occur between the time at which trading in a foreign security is completed and the close of theNYSE that might call into question the reliability of the value of a portfolio security held by the Fund. As a result, differencesmay arise between the value of the Fund’s portfolio securities as determined at the foreign market close and the latest indicationsof value at the close of the NYSE. In order to minimize the potential for these differences, the VLOC monitors price movementsfollowing the close of trading in foreign stock markets through a series of country specific market proxies (such as baskets ofAmerican Depositary Receipts, futures contracts and exchange traded funds). These price movements are measured againstestablished trigger thresholds for each specific market proxy to assist in determining if an event has occurred that may call intoquestion the reliability of the values of the foreign securities held by the Fund. If such an event occurs, the securities may bevalued using fair value procedures, which may include the use of independent pricing services. At December 31, 2012, a marketevent occurred resulting in a portion of the securities held by the Fund being valued using fair value procedures.
b. Foreign Currency Translation
Portfolio securities and other assets and liabilities denominated in foreign currencies are translated into U.S. dollars based on theexchange rate of such currencies against U.S. dollars on the date of valuation. The Fund may enter into foreign currencyexchange contracts to facilitate transactions denominated in a foreign currency. Purchases and sales of securities, income andexpense items denominated in foreign currencies are translated into U.S. dollars at the exchange rate in effect on the transactiondate. Portfolio securities and assets and liabilities denominated in foreign currencies contain risks that those currencies willdecline in value relative to the U.S. dollar. Occasionally, events may impact the availability or reliability of foreign exchange ratesused to convert the U.S. dollar equivalent value. If such an event occurs, the foreign exchange rate will be valued at fair valueusing procedures established and approved by the Board.
The Fund does not separately report the effect of changes in foreign exchange rates from changes in market prices on securitiesheld. Such changes are included in net realized and unrealized gain or loss from investments on the Statement of Operations.
Realized foreign exchange gains or losses arise from sales of foreign currencies, currency gains or losses realized between thetrade and settlement dates on securities transactions and the difference between the recorded amounts of dividends, interest, andforeign withholding taxes and the U.S. dollar equivalent of the amounts actually received or paid. Net unrealized foreignexchange gains and losses arise from changes in foreign exchange rates on foreign denominated assets and liabilities other thaninvestments in securities held at the end of the reporting period.
c. Joint Repurchase Agreement
The Fund enters into a joint repurchase agreement whereby its uninvested cash balance is deposited into a joint cash accountwith other funds managed by the investment manager or an affiliate of the investment manager and is used to invest in one ormore repurchase agreements. The value and face amount of the joint repurchase agreement are allocated to the funds based ontheir pro-rata interest. A repurchase agreement is accounted for as a loan by the fund to the seller, collateralized by securitieswhich are delivered to the fund’s custodian. The market value, including accrued interest, of the initial collateralization isrequired to be at least 102% of the dollar amount invested by the funds, with the value of the underlying securities marked tomarket daily to maintain coverage of at least 100%. The joint repurchase agreement held by the Fund at year end had beenentered into on December 31, 2012.
FGI-16

Franklin Templeton Variable Insurance Products Trust
Notes to Financial Statements (continued)
Franklin Growth and Income Securities Fund
1. ORGANIZATION AND SIGNIFICANT ACCOUNTING POLICIES (continued)
d. Derivative Financial Instruments
The Fund invested in derivatives in order to manage risk or gain exposure to various other investments or markets. Derivativesare financial contracts based on an underlying or notional amount, require no initial investment or an initial net investment thatis smaller than would normally be required to have a similar response to changes in market factors, and require or permit netsettlement. Derivatives contain various risks including the potential inability of the counterparty to fulfill their obligations underthe terms of the contract, the potential for an illiquid secondary market, and/or the potential for market movements whichexpose the Fund to gains or losses in excess of the amounts shown on the Statement of Assets and Liabilities. Realized gain andloss and unrealized appreciation and depreciation on these contracts for the period are included in the Statement of Operations.
The Fund purchased or wrote exchange traded option contracts primarily to manage and/or gain exposure to equity price risk.An option is a contract entitling the holder to purchase or sell a specific amount of shares or units of an asset or notional amountof a swap (swaption), at a specified price. Options purchased are recorded as an asset while options written are recorded as aliability. Upon exercise of an option, the acquisition cost or sales proceeds of the underlying investment is adjusted by anypremium received or paid. Upon expiration of an option, any premium received or paid is recorded as a realized gain or loss.Upon closing an option other than through expiration or exercise, the difference between the premium and the cost to close theposition is recorded as a realized gain or loss. Pursuant to the terms of the written option contract, cash or securities may berequired to be deposited as collateral.
See Notes 6 and 8 regarding investment transactions and other derivative information, respectively.
e. Equity-Linked Securities
The Fund invests in equity-linked securities. Equity-linked securities are hybrid financial instruments that generally combineboth debt and equity characteristics into a single note form. Income received from equity linked securities is recorded as realizedgains in the Statement of Operations and may be based on the performance of an underlying equity security, an equity index, oran option position. The risks of investing in equity-linked securities include unfavorable price movements in the underlyingsecurity and the credit risk of the issuing financial institution. There may be no guarantee of a return of principal with equitylinked securities and the appreciation potential may be limited. Equity-linked securities may be more volatile and less liquid thanother investments held by the Fund.
f. Income and Deferred Taxes
It is the Fund’s policy to qualify as a regulated investment company under the Internal Revenue Code. The Fund intends todistribute to shareholders substantially all of its taxable income and net realized gains to relieve it from federal income and ifapplicable, excise taxes. As a result, no provision for U.S. federal income taxes is required.
The Fund may be subject to foreign taxation related to income received, capital gains on the sale of securities and certain foreigncurrency transactions in the foreign jurisdictions in which it invests. Foreign taxes, if any, are recorded based on the taxregulations and rates that exist in the foreign markets in which the Fund invests. When a capital gain tax is determined to applythe Fund records an estimated deferred tax liability in an amount that would be payable if the securities were disposed of on thevaluation date.
The Fund recognizes the tax benefits of uncertain tax positions only when the position is “more likely than not” to be sustainedupon examination by the tax authorities based on the technical merits of the tax position. As of December 31, 2012, and for allopen tax years, the Fund has determined that no liability for unrecognized tax benefits is required in the Fund’s financialstatements related to uncertain tax positions taken on a tax return (or expected to be taken on future tax returns). Open tax yearsare those that remain subject to examination and are based on each tax jurisdiction statute of limitation.
FGI-17
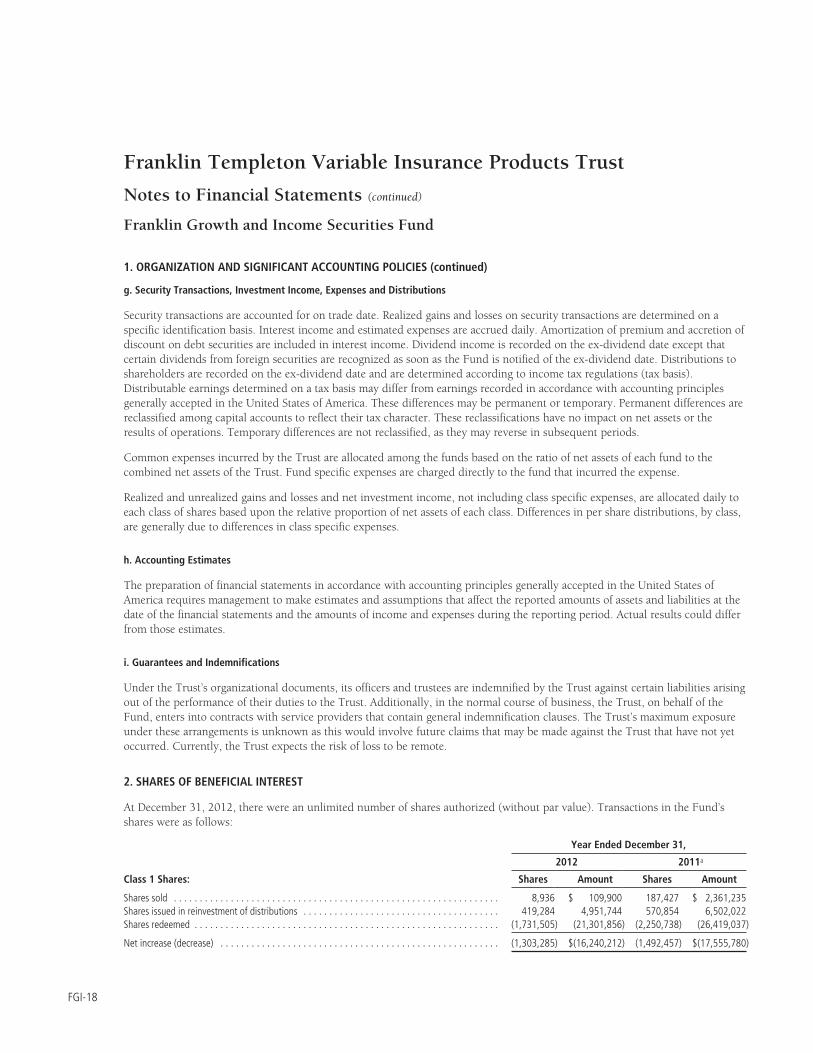
Franklin Templeton Variable Insurance Products Trust
Notes to Financial Statements (continued)
Franklin Growth and Income Securities Fund
1. ORGANIZATION AND SIGNIFICANT ACCOUNTING POLICIES (continued)
g. Security Transactions, Investment Income, Expenses and Distributions
Security transactions are accounted for on trade date. Realized gains and losses on security transactions are determined on aspecific identification basis. Interest income and estimated expenses are accrued daily. Amortization of premium and accretion ofdiscount on debt securities are included in interest income. Dividend income is recorded on the ex-dividend date except thatcertain dividends from foreign securities are recognized as soon as the Fund is notified of the ex-dividend date. Distributions toshareholders are recorded on the ex-dividend date and are determined according to income tax regulations (tax basis).Distributable earnings determined on a tax basis may differ from earnings recorded in accordance with accounting principlesgenerally accepted in the United States of America. These differences may be permanent or temporary. Permanent differences arereclassified among capital accounts to reflect their tax character. These reclassifications have no impact on net assets or theresults of operations. Temporary differences are not reclassified, as they may reverse in subsequent periods.
Common expenses incurred by the Trust are allocated among the funds based on the ratio of net assets of each fund to thecombined net assets of the Trust. Fund specific expenses are charged directly to the fund that incurred the expense.
Realized and unrealized gains and losses and net investment income, not including class specific expenses, are allocated daily toeach class of shares based upon the relative proportion of net assets of each class. Differences in per share distributions, by class,are generally due to differences in class specific expenses.
h. Accounting Estimates
The preparation of financial statements in accordance with accounting principles generally accepted in the United States ofAmerica requires management to make estimates and assumptions that affect the reported amounts of assets and liabilities at thedate of the financial statements and the amounts of income and expenses during the reporting period. Actual results could differfrom those estimates.
i. Guarantees and Indemnifications
Under the Trust’s organizational documents, its officers and trustees are indemnified by the Trust against certain liabilities arisingout of the performance of their duties to the Trust. Additionally, in the normal course of business, the Trust, on behalf of theFund, enters into contracts with service providers that contain general indemnification clauses. The Trust’s maximum exposureunder these arrangements is unknown as this would involve future claims that may be made against the Trust that have not yetoccurred. Currently, the Trust expects the risk of loss to be remote.
2. SHARES OF BENEFICIAL INTEREST
At December 31, 2012, there were an unlimited number of shares authorized (without par value). Transactions in the Fund’sshares were as follows:
Year Ended December 31,
2012 2011a
Class 1 Shares: Shares Amount Shares Amount
Shares sold . . . . . . . . . . . . . . . . . . . . . . . . . . . . . . . . . . . . . . . . . . . . . . . . . . . . . . . . . . . . . . . 8,936 $ 109,900 187,427 $ 2,361,235Shares issued in reinvestment of distributions . . . . . . . . . . . . . . . . . . . . . . . . . . . . . . . . . . . . . . 419,284 4,951,744 570,854 6,502,022Shares redeemed . . . . . . . . . . . . . . . . . . . . . . . . . . . . . . . . . . . . . . . . . . . . . . . . . . . . . . . . . . . (1,731,505) (21,301,856) (2,250,738) (26,419,037)
Net increase (decrease) . . . . . . . . . . . . . . . . . . . . . . . . . . . . . . . . . . . . . . . . . . . . . . . . . . . . . . (1,303,285) $(16,240,212) (1,492,457) $(17,555,780)
FGI-18

Franklin Templeton Variable Insurance Products Trust
Notes to Financial Statements (continued)
Franklin Growth and Income Securities Fund
2. SHARES OF BENEFICIAL INTEREST (continued)
Year Ended December 31,
2012 2011a
Class 2 Shares: Shares Amount Shares Amount
Shares sold . . . . . . . . . . . . . . . . . . . . . . . . . . . . . . . . . . . . . . . . . . . . . . . . . . . . . . . . . . . . . . . 876,993 $ 10,575,390 624,568 $ 7,137,921Shares issued in reinvestment of distributions . . . . . . . . . . . . . . . . . . . . . . . . . . . . . . . . . . . . . . 327,189 3,811,748 453,579 5,102,769Shares redeemed . . . . . . . . . . . . . . . . . . . . . . . . . . . . . . . . . . . . . . . . . . . . . . . . . . . . . . . . . . . (1,967,485) (23,736,812) (2,828,839) (32,499,697)
Net increase (decrease) . . . . . . . . . . . . . . . . . . . . . . . . . . . . . . . . . . . . . . . . . . . . . . . . . . . . . . (763,303) $ (9,349,674) (1,750,692) $(20,259,007)
Class 4 Shares:Shares redeemed . . . . . . . . . . . . . . . . . . . . . . . . . . . . . . . . . . . . . . . . . . . . . . . . . . . . . . . . . . . (353) $ (4,301)
Net increase (decrease) . . . . . . . . . . . . . . . . . . . . . . . . . . . . . . . . . . . . . . . . . . . . . . . . . . . . . . (353) $ (4,301)
aEffective March 4, 2011, Class 4 was liquidated.
3. TRANSACTIONS WITH AFFILIATES
Franklin Resources, Inc. is the holding company for various subsidiaries that together are referred to as Franklin TempletonInvestments. Certain officers and trustees of the Fund are also officers and/or directors of the following subsidiaries:
Subsidiary Affiliation
Franklin Advisers, Inc. (Advisers) Investment managerFranklin Templeton Services, LLC (FT Services) Administrative managerFranklin Templeton Distributors, Inc. (Distributors) Principal underwriterFranklin Templeton Investor Services, LLC (Investor Services) Transfer agent
a. Management Fees
The Fund pays an investment management fee to Advisers based on the average daily net assets of the Fund as follows:
Annualized Fee Rate Net Assets
0.625% Up to and including $100 million0.500% Over $100 million, up to and including $250 million0.450% Over $250 million, up to and including $7.5 billion0.440% Over $7.5 billion, up to and including $10 billion0.430% Over $10 billion, up to and including $12.5 billion0.420% Over $12.5 billion, up to and including $15 billion0.400% In excess of $15 billion
b. Administrative Fees
FT Services, under terms of an agreement, provides administrative services to the Fund and is not paid by the Fund for theservices.
c. Distribution Fees
The Board has adopted a distribution plan for Class 2 shares pursuant to Rule 12b-1 under the 1940 Act. Under the Fund’scompensation distribution plan, the Fund pays Distributors for costs incurred in connection with the servicing, sale anddistribution of the Fund’s shares up to 0.35% per year of its average daily net assets. Some distribution fees are not charged onshares held by affiliates. The Board has agreed to limit the current rate to 0.25% per year for Class 2.
FGI-19

Franklin Templeton Variable Insurance Products Trust
Notes to Financial Statements (continued)
Franklin Growth and Income Securities Fund
3. TRANSACTIONS WITH AFFILIATES (continued)
d. Transfer Agent Fees
Investor Services, under terms of an agreement, performs shareholder servicing for the Fund and is not paid by the Fund for theservices.
4. EXPENSE OFFSET ARRANGEMENT
The Fund has entered into an arrangement with its custodian whereby credits realized as a result of uninvested cash balances areused to reduce a portion of the Fund’s custodian expenses. During the year ended December 31, 2012, there were no creditsearned.
5. INCOME TAXES
For tax purposes, capital losses may be carried over to offset future capital gains, if any. Capital loss carryforwards with noexpiration, if any, must be fully utilized before those losses with expiration dates.
At December 31, 2012, the Fund had capital loss carryforwards of $44,326,124 expiring in 2017. During the year endedDecember 31, 2012, the Fund utilized $13,765,081 of capital loss carryforwards.
The tax character of distributions paid during the years ended December 31, 2012 and 2011, was as follows:
2012 2011
Distributions paid from ordinary income . . . . . . . . . . . . . . . . . $8,763,492 $11,604,791
At December 31, 2012, the cost of investments, net unrealized appreciation (depreciation), and undistributed ordinary incomefor income tax purposes were as follows:
Cost of investments . . . . . . . . . . . . . . . . . . . . . . . . . . . . . . . . . . . . . . . . . . $243,206,832
Unrealized appreciation . . . . . . . . . . . . . . . . . . . . . . . . . . . . . . . . . . . . . . . $ 58,882,749Unrealized depreciation . . . . . . . . . . . . . . . . . . . . . . . . . . . . . . . . . . . . . . . (15,940,648)
Net unrealized appreciation (depreciation) . . . . . . . . . . . . . . . . . . . . . . . . . . $ 42,942,101
Distributable earnings – undistributed ordinary income . . . . . . . . . . . . . . . . $ 8,314,239
Differences between income and/or capital gains as determined on a book basis and a tax basis are primarily due to differingtreatments of bond discounts and premiums, and corporate actions.
6. INVESTMENT TRANSACTIONS
Purchases and sales of investments (excluding short term securities) for the year ended December 31, 2012, aggregated$84,948,329 and $102,257,277, respectively.
FGI-20

Franklin Templeton Variable Insurance Products Trust
Notes to Financial Statements (continued)
Franklin Growth and Income Securities Fund
6. INVESTMENT TRANSACTIONS (continued)
Transactions in options written during the year ended December 31, 2012, were as follows:
Number ofContracts
PremiumsReceived
Options outstanding at December 31, 2011 . . . . . . . . . . . . . . . . . . . . . . . . . . . . . . . . . . . . . . . . . . . . . . . . . . . . . . . . . . . . . . . . — $ —Options written . . . . . . . . . . . . . . . . . . . . . . . . . . . . . . . . . . . . . . . . . . . . . . . . . . . . . . . . . . . . . . . . . . . . . . . . . . . . . . . . . . . . . 350 105,428Options expired . . . . . . . . . . . . . . . . . . . . . . . . . . . . . . . . . . . . . . . . . . . . . . . . . . . . . . . . . . . . . . . . . . . . . . . . . . . . . . . . . . . . . — —Options exercised . . . . . . . . . . . . . . . . . . . . . . . . . . . . . . . . . . . . . . . . . . . . . . . . . . . . . . . . . . . . . . . . . . . . . . . . . . . . . . . . . . . . (350) (105,428)Options closed . . . . . . . . . . . . . . . . . . . . . . . . . . . . . . . . . . . . . . . . . . . . . . . . . . . . . . . . . . . . . . . . . . . . . . . . . . . . . . . . . . . . . . — —
Options outstanding at December 31, 2012 . . . . . . . . . . . . . . . . . . . . . . . . . . . . . . . . . . . . . . . . . . . . . . . . . . . . . . . . . . . . . . . . — $ —
See Notes 1(d) and 8 regarding derivative financial instruments and other derivative information, respectively.
7. CREDIT RISK AND DEFAULTED SECURITIES
At December 31, 2012, the Fund had 10.15% of its portfolio invested in high yield or other securities rated below investmentgrade. These securities may be more sensitive to economic conditions causing greater price volatility and are potentially subjectto a greater risk of loss due to default than higher rated securities.
8. OTHER DERIVATIVE INFORMATION
For the period ended December 31, 2012, the effect of derivative contracts on the Fund’s Statement of Operations was asfollows:
Derivative Contracts Not Accountedfor as Hedging Instruments Statement of Operations Locations
Realized Gain(Loss) for the
Year
Change inUnrealized
Appreciation(Depreciation)
for theYear
Equity contracts Net realized gain (loss) from investments and written options/Netchange in unrealized appreciation (depreciation) on investments
$— $—
For the year ended December 31, 2012, the average month end market value of derivatives represented less than 0.01% ofaverage month end net assets. The average month end number of open derivative contracts for the year was less than 1.
See Note 1(d) and 6 regarding derivative financial instruments and investment transactions, respectively.
9. CREDIT FACILITY
The Fund, together with other U.S. registered and foreign investment funds (collectively, Borrowers), managed by FranklinTempleton Investments, are borrowers in a joint syndicated senior unsecured credit facility totaling $1.5 billion (Global CreditFacility) which matured on January 18, 2013. This Global Credit Facility provides a source of funds to the Borrowers fortemporary and emergency purposes, including the ability to meet future unanticipated or unusually large redemption requests.Effective January 18, 2013, the Borrowers renewed the Global Credit Facility which matures on January 17, 2014.
FGI-21

Franklin Templeton Variable Insurance Products Trust
Notes to Financial Statements (continued)
Franklin Growth and Income Securities Fund
9. CREDIT FACILITY (continued)
Under the terms of the Global Credit Facility, the Fund shall, in addition to interest charged on any borrowings made by theFund and other costs incurred by the Fund, pay its share of fees and expenses incurred in connection with the implementationand maintenance of the Global Credit Facility, based upon its relative share of the aggregate net assets of all of the Borrowers,including an annual commitment fee of 0.07% based upon the unused portion of the Global Credit Facility. These fees arereflected in other expenses on the Statement of Operations. During the year ended December 31, 2012, the Fund did not use theGlobal Credit Facility.
10. FAIR VALUE MEASUREMENTS
The Fund follows a fair value hierarchy that distinguishes between market data obtained from independent sources (observableinputs) and the Fund’s own market assumptions (unobservable inputs). These inputs are used in determining the value of theFund’s financial instruments and are summarized in the following fair value hierarchy:
• Level 1 – quoted prices in active markets for identical financial instruments• Level 2 – other significant observable inputs (including quoted prices for similar financial instruments, interest rates,
prepayment speed, credit risk, etc.)• Level 3 – significant unobservable inputs (including the Fund’s own assumptions in determining the fair value of
financial instruments)
The inputs or methodology used for valuing financial instruments are not an indication of the risk associated with investing inthose financial instruments.
For movements between the levels within the fair value hierarchy, the Fund has adopted a policy of recognizing the transfers asof the date of the underlying event which caused the movement. Additionally, at December 31, 2012, due to market events, theFund employed fair value procedures to value a portion of its holdings. Such procedures resulted in a temporary transfer offinancial instruments valued at $2,957,699 from Level 1 to Level 2 within the fair value hierarchy.
A summary of inputs used as of December 31, 2012, in valuing the Fund’s assets carried at fair value, is as follows:
Level 1 Level 2 Level 3 Total
Assets:Investments in Securities:
Equity Investments:a
Energy . . . . . . . . . . . . . . . . . . . . . . . . . . . . . . . . . . . . . . . . . . . . . . . . . . . . . . . . . . $ 23,293,840 $ 3,137,697 $ — $ 26,431,537Financials . . . . . . . . . . . . . . . . . . . . . . . . . . . . . . . . . . . . . . . . . . . . . . . . . . . . . . . . 44,770,742 2,957,699 — 47,728,441All Other Equity Investmentsb . . . . . . . . . . . . . . . . . . . . . . . . . . . . . . . . . . . . . . . . . . 194,821,411 — — 194,821,411
Equity-Linked Securities . . . . . . . . . . . . . . . . . . . . . . . . . . . . . . . . . . . . . . . . . . . . . . . . — 15,005,486 — 15,005,486Short Term Investments . . . . . . . . . . . . . . . . . . . . . . . . . . . . . . . . . . . . . . . . . . . . . . . . — 2,162,058 — 2,162,058
Total Investments in Securities . . . . . . . . . . . . . . . . . . . . . . . . . . . . . . . . . . . . . . . $262,885,993 $23,262,940 $ — $286,148,933
aIncludes common, preferred and convertible preferred stocks as well as other equity investments.bFor detailed categories, see the accompanying Statement of Investments.
11. NEW ACCOUNTING PRONOUNCEMENTS
In December 2011, the Financial Accounting Standards Board (FASB) issued Accounting Standards Update (ASU) No. 2011-11,Balance Sheet (Topic 210): Disclosures about Offsetting Assets and Liabilities. The amendments in the ASU enhance disclosuresabout offsetting of financial assets and liabilities to enable investors to understand the effect of these arrangements on a fund’s
FGI-22

Franklin Templeton Variable Insurance Products Trust
Notes to Financial Statements (continued)
Franklin Growth and Income Securities Fund
11. NEW ACCOUNTING PRONOUNCEMENTS (continued)
financial position. In January 2013, FASB issued ASU No. 2013-01, Balanced Sheet (Topic 210): Clarifying the Scope ofDisclosures about Offsetting Assets and Liabilities. The amendments in ASU No. 2013-01 clarify the intended scope ofdisclosures required by ASU No. 2011-11. These ASUs are effective for interim and annual reporting periods beginning on orafter January 1, 2013. The Fund believes the adoption of these ASUs will not have a material impact on its financial statements.
12. SUBSEQUENT EVENTS
The Fund has evaluated subsequent events through the issuance of the financial statements and determined that no events haveoccurred that require disclosure other than those already disclosed in the financial statements.
ABBREVIATIONS
Selected Portfolio
ADR - American Depositary Receipt
FGI-23

Franklin Templeton Variable Insurance Products Trust
Franklin Growth and Income Securities Fund
Report of Independent Registered Public Accounting Firm
To the Board of Trustees and Shareholders ofFranklin Templeton Variable Insurance Products TrustIn our opinion, the accompanying statement of assets and liabilities, including the statement of investments, and the relatedstatements of operations and of changes in net assets and the financial highlights present fairly, in all material respects, thefinancial position of Franklin Growth and Income Securities Fund (the “Fund”) at December 31, 2012, the results of itsoperations for the year then ended, the changes in its net assets for each of the two years in the period then ended and thefinancial highlights for each of the five years in the period then ended, in conformity with accounting principles generallyaccepted in the United States of America. These financial statements and financial highlights (hereafter referred to as “financialstatements”) are the responsibility of the Fund’s management. Our responsibility is to express an opinion on these financialstatements based on our audits. We conducted our audits of these financial statements in accordance with the standards of thePublic Company Accounting Oversight Board (United States). Those standards require that we plan and perform the audit toobtain reasonable assurance about whether the financial statements are free of material misstatement. An audit includesexamining, on a test basis, evidence supporting the amounts and disclosures in the financial statements, assessing the accountingprinciples used and significant estimates made by management, and evaluating the overall financial statement presentation. Webelieve that our audits, which included confirmation of securities at December 31, 2012 by correspondence with the custodianand brokers, provide a reasonable basis for our opinion.
PricewaterhouseCoopers LLP
San Francisco, CaliforniaFebruary 15, 2013
FGI-24

Franklin Templeton Variable Insurance Products Trust
Tax Information (unaudited)
Franklin Growth and Income Securities Fund
Under Section 854(b)(1)(A) of the Internal Revenue Code (Code), the Fund hereby reports 96.32% of the ordinary incomedividends as income qualifying for the dividends received deduction for the fiscal year ended December 31, 2012.
FGI-25

THIS PAGE HAS BEEN INTENTIONALLY LEFT BLANK

INDEX DESCRIPTIONS
The indexes are unmanaged and include reinvested distributions.
For indexes sourced by Morningstar: © 2013 Morningstar. All Rights Reserved. The information contained herein: (1) isproprietary to Morningstar and/or its content providers; (2) may not be copied or distributed; and (3) is not warranted to beaccurate, complete or timely. Neither Morningstar nor its content providers are responsible for any damages or losses arisingfrom any use of this information.
Russell® is a trademark and RussellTM is a servicemark of the Frank Russell Company.
Barclays U.S. Aggregate Index is a market capitalization-weighted index representing the U.S. investment-grade, fixed-rate,taxable bond market with index components for government and corporate, mortgage pass-through and asset-backed securities.All issues included are SEC registered, taxable, dollar denominated and nonconvertible, must have at least one year to finalmaturity and must be rated investment grade (Baa3/BBB-/BBB- or higher) using the middle rating of Moody’s, Standard & Poor’sand Fitch, respectively.
Barclays U.S. Government Index: Intermediate Component is the intermediate component of the BC U.S. Government Index,which includes public obligations of the U.S. Treasury with at least one year to final maturity and publicly issued debt of U.S.government agencies, quasi-federal corporations, and corporate or foreign debt guaranteed by the U.S. government.
Citigroup World Government Bond Index is a market capitalization-weighted index consisting of investment-grade worldgovernment bond markets.
Consumer Price Index (CPI), calculated by the Bureau of Labor Statistics, is a commonly used measure of the inflation rate.
Credit Suisse (CS) High Yield Index is designed to mirror the investable universe of the U.S. dollar-denominated high yielddebt market.
FTSE EPRA/NAREIT Developed Index is a free float-adjusted index designed to measure the performance of publicly tradedreal estate securities in the North American, European and Asian real estate markets. FTSE® is a trademark of London StockExchange Plc and The Financial Times Limited and is used by FTSE under license.
J.P. Morgan (JPM) Global Government Bond Index (GGBI) tracks total returns for liquid, fixed-rate, domestic governmentbonds with maturities greater than one year issued by developed countries globally.
Lipper Multi-Sector Income Funds Classification Average is calculated by averaging the total returns of all funds within theLipper Multi-Sector Income Funds classification in the Lipper Open-End underlying funds universe. Lipper Multi-Sector IncomeFunds are defined as funds that seek current income by allocating assets among different fixed income securities sectors (notprimarily in one sector except for defensive purposes), including U.S. and foreign governments, with a significant portion ratedbelow investment grade. For the 12-month period ended 12/31/12, there were 229 funds in this category. Lipper calculations donot include contract fees, expenses or sales charges, and may have been different if such charges had been considered.
Lipper VIP Equity Income Funds Classification Average is an equally weighted average calculation of performance figures forall funds within the Lipper Equity Income Funds classification in the Lipper VIP underlying funds universe. Lipper EquityIncome Funds seek relatively high current income and growth of income through investing 60% or more of their portfolios inequities. For the 12-month period ended 12/31/12, there were 63 funds in this category. Lipper calculations do not includecontract fees, expenses or sales charges, and may have been different if such charges had been considered.
Lipper VIP General U.S. Government Funds Classification Average is an equally weighted average calculation ofperformance figures for all funds within the Lipper General U.S. Government Funds classification in the Lipper VIP underlyingfunds universe. Lipper General U.S. Government Funds invest primarily in U.S. government and agency issues. For the 12-month period ended 12/31/12, there were 51 funds in this category. Lipper calculations do not include contract fees, expenses orsales charges, and may have been different if such charges had been considered.
Lipper VIP High Yield Funds Classification Average is an equally weighted average calculation of performance figures for allfunds within the Lipper High Yield Funds Classification in the Lipper VIP underlying funds universe. Lipper High Yield Fundsaim at high (relative) current yield from fixed income securities, have no quality or maturity restrictions, and tend to invest inlower grade debt issues. For the 12-month period ended 12/31/12, there were 118 funds in this category. Lipper calculations donot include contract fees, expenses or sales charges, and may have been different if such charges had been considered.
I-1

MSCI All Country World Index (ACWI) is a free float-adjusted, market capitalization-weighted index designed to measureequity market performance in global developed and emerging markets.
MSCI Emerging Markets (EM) Index is a free float-adjusted, market capitalization-weighted index designed to measure equitymarket performance in global emerging markets.
MSCI Europe, Australasia, Far East (EAFE) Index is a free float-adjusted, market capitalization-weighted index designed tomeasure equity market performance in global developed markets excluding the U.S. and Canada.
MSCI Europe, Australasia, Far East (EAFE) Index Net Return (Local Currency) is a free float-adjusted, marketcapitalization-weighted index designed to measure equity market performance of global developed markets excluding the U.S.and Canada. The index is calculated in local currency and includes reinvested daily net dividends.
MSCI World Index is a free float-adjusted, market capitalization-weighted index designed to measure equity marketperformance in global developed markets.
Russell 1000® Growth Index is market capitalization weighted and measures performance of those Russell 1000 Indexcompanies with higher price-to-book ratios and higher forecasted growth values.
Russell 1000® Index is market capitalization weighted and measures performance of the largest companies in the Russell 3000®
Index, which represents the majority of the U.S. market’s total capitalization.
Russell 1000® Value Index is market capitalization weighted and measures performance of those Russell 1000® Indexcompanies with lower price-to-book ratios and lower forecasted growth values.
Russell 2500™ Index is market capitalization weighted and measures performance of the smallest companies in the Russell3000® Index, which represent a modest amount of the Russell 3000® Index’s total market capitalization.
Russell 2500™ Value Index is market capitalization weighted and measures performance of those Russell 2500™ Indexcompanies with lower price-to-book ratios and lower forecasted growth values.
Russell 3000® Growth Index is market capitalization weighted and measures performance of those Russell 3000® Indexcompanies with higher price-to-book ratios and higher forecasted growth values.
Russell 3000® Index is market capitalization weighted and measures performance of the largest U.S. companies based on totalmarket capitalization and represents the majority of the investable U.S. equity market.
Russell Midcap® Growth Index is market capitalization weighted and measures performance of those Russell Midcap® Indexcompanies with higher price-to-book ratios and higher forecasted growth values.
Russell Midcap® Index is market capitalization weighted and measures performance of the smallest companies in the Russell1000® Index, which represent a modest amount of the Russell 1000® Index’s total market capitalization.
Standard & Poor’s 500 Index (S&P 500) is a market capitalization-weighted index of 500 stocks designed to measure totalU.S. equity market performance. STANDARD & POOR’S®, S&P® and S&P 500® are registered trademarks of Standard & Poor’sFinancial Services LLC.
Standard & Poor’s/International Finance Corporation Investable (S&P/IFCI) Composite Index is a free float-adjusted,market capitalization-weighted index designed to measure equity performance in global emerging markets.
I-2

Board Members and Officers
The name, year of birth and address of the officers and board members, as well as their affiliations,positions held with the Trust, principal occupation during at least the past five years and number ofportfolios overseen in the Franklin Templeton Investments fund complex are shown below. Generally,each board member serves until that person’s successor is elected and qualified.
Independent Board Members
Name, Year of Birth and Address PositionLength ofTime Served
Number ofPortfolios in FundComplex Overseenby Board Member*
Other Directorships HeldDuring at Least the Past 5 Years
Harris J. Ashton (1932)One Franklin ParkwaySan Mateo, CA 94403-1906
Trustee Since 1988 132 Bar-S Foods (meat packing company) (1981-2010).
Principal Occupation During at Least the Past 5 Years:Director of various companies; and formerly, Director, RBC Holdings, Inc. (bank holding company) (until 2002); and President, Chief Executive Officer andChairman of the Board, General Host Corporation (nursery and craft centers) (until 1998).
Sam Ginn (1937)One Franklin ParkwaySan Mateo, CA 94403-1906
Trustee Since 2007 107 ICO Global Communications (Holdings) Limited (satellitecompany) (2006-2010), Chevron Corporation (global energycompany) (1989-2009), Hewlett-Packard Company(technology company) (1996-2002), Safeway, Inc. (groceryretailer) (1991-1998) and TransAmerica Corporation (insurancecompany) (1989-1999).
Principal Occupation During at Least the Past 5 Years:Private investor; Chairman, First Responder Network Authority (FirstNet) (interoperable wireless broadband network) (August 2012); and formerly, Chairman ofthe Board, Vodafone AirTouch, PLC (wireless company) (1999-2000); Chairman of the Board and Chief Executive Officer, AirTouch Communications (cellularcommunications) (1993-1998) and Pacific Telesis Group (telephone holding company) (1988-1994).
Edith E. Holiday (1952)One Franklin ParkwaySan Mateo, CA 94403-1906
Trustee Since 2005 132 Hess Corporation (exploration and refining of oil and gas),H.J. Heinz Company (processed foods and allied products),RTI International Metals, Inc. (manufacture and distribution oftitanium), Canadian National Railway (railroad) and WhiteMountains Insurance Group, Ltd. (holding company).
Principal Occupation During at Least the Past 5 Years:Director or Trustee of various companies and trusts; and formerly, Assistant to the President of the United States and Secretary of the Cabinet (1990-1993);General Counsel to the United States Treasury Department (1989-1990); and Counselor to the Secretary and Assistant Secretary for Public Affairs and PublicLiaison-United States Treasury Department (1988-1989).
J. Michael Luttig (1954)One Franklin ParkwaySan Mateo, CA 94403-1906
Trustee Since 2009 132 Boeing Capital Corporation (aircraft financing).
Principal Occupation During at Least the Past 5 Years:Executive Vice President, General Counsel and member of Executive Council, The Boeing Company (aerospace company); and formerly, Federal Appeals CourtJudge, U.S. Court of Appeals for the Fourth Circuit (1991-2006).
Frank A. Olson (1932)One Franklin ParkwaySan Mateo, CA 94403-1906
Trustee Since 2005 132 Hess Corporation (exploration and refining of oil and gas).
Principal Occupation During at Least the Past 5 Years:Chairman Emeritus, The Hertz Corporation (car rental) (since 2000) (Chairman of the Board (1980-2000) and Chief Executive Officer (1977-1999)); andformerly, Chairman of the Board, President and Chief Executive Officer, UAL Corporation (airlines).
BOD-1

Name, Year of Birth and Address PositionLength ofTime Served
Number ofPortfolios in FundComplex Overseenby Board Member*
Other Directorships HeldDuring at Least the Past 5 Years
Larry D. Thompson (1945)One Franklin ParkwaySan Mateo, CA 94403-1906
Trustee Since 2007 142 Cbeyond, Inc. (business communications provider),The Southern Company (energy company) (2010-2012) and The Washington Post Company(education and media organization).
Principal Occupation During at Least the Past 5 Years:Executive Vice President—Government Affairs, General Counsel and Corporate Secretary, PepsiCo, Inc. (consumer products) (June 2012); and formerly, John A.Sibley Professor of Corporate and Business Law, University of Georgia School of Law (2011-2012); Senior Vice President—Government Affairs, General Counseland Secretary, PepsiCo, Inc. (2004-2011); Senior Fellow of The Brookings Institution (2003-2004); Visiting Professor, University of Georgia School of Law (2004);and Deputy Attorney General, U.S. Department of Justice (2001-2003).
John B. Wilson (1959)One Franklin ParkwaySan Mateo, CA 94403-1906
LeadIndependentTrustee
Trustee since 2007and Lead IndependentTrustee since 2008
107 None
Principal Occupation During at Least the Past 5 Years:President, Staples Europe (office supplies) (October 2012); President and Founder, Hyannis Port Capital, Inc. (real estate and private equity investing); serves onprivate and non-profit boards; and formerly, Chief Operating Officer and Executive Vice President, Gap, Inc. (retail) (1996-2000); Chief Financial Officer andExecutive Vice President—Finance and Strategy, Staples, Inc. (1992-1996); Senior Vice President—Corporate Planning, Northwest Airlines, Inc. (airlines) (1990-1992); and Vice President and Partner, Bain & Company (consulting firm) (1986-1990).
Interested Board Members and Officers
Name, Year of Birth and Address PositionLength ofTime Served
Number ofPortfolios in FundComplex Overseenby Board Member*
Other Directorships HeldDuring at Least the Past 5 Years
**Charles B. Johnson (1933)300 S.E. 2nd StreetFort Lauderdale, FL 33301-1923
Trustee andChairman ofthe Board
Trustee since 1988and Chairman of theBoard since 1993
132 None
Principal Occupation During at Least the Past 5 Years:Chairman of the Board, Member—Office of the Chairman and Director, Franklin Resources, Inc.; and officer and/or director or trustee, as the case may be, ofsome of the other subsidiaries of Franklin Resources, Inc. and of 41 of the investment companies in Franklin Templeton Investments.
**Rupert H. Johnson, Jr. (1940)One Franklin ParkwaySan Mateo, CA 94403-1906
Trustee Since 1988 50 None
Principal Occupation During at Least the Past 5 Years:Vice Chairman, Member—Office of the Chairman and Director, Franklin Resources, Inc.; Director, Franklin Advisers, Inc.; Senior Vice President, Franklin AdvisoryServices, LLC; and officer and/or director or trustee, as the case may be, of some of the other subsidiaries of Franklin Resources, Inc. and of 25 of the investmentcompanies in Franklin Templeton Investments.
Alison E. Baur (1964)One Franklin ParkwaySan Mateo, CA 94403-1906
Vice President Since April 2012 NotApplicable
Not Applicable
Principal Occupation During at Least the Past 5 Years:Deputy General Counsel, Franklin Templeton Investments; and officer of some of the other subsidiaries of Franklin Resources, Inc. and of 46 of the investmentcompanies in Franklin Templeton Investments.
BOD-2

Name, Year of Birth and Address PositionLength ofTime Served
Number ofPortfolios in FundComplex Overseenby Board Member*
Other Directorships HeldDuring at Least the Past 5 Years
Breda M. Beckerle (1958)600 Fifth AvenueNew York, NY 10020
ChiefComplianceOfficer and VicePresident
Since May 2012 NotApplicable
Not Applicable
Principal Occupation During at Least the Past 5 Years:Chief Compliance Officer, Fiduciary International, Inc., Franklin Advisers, Inc., Franklin Advisory Services, LLC, Franklin Investment Advisory Services, LLC, FranklinMutual Advisers, LLC, Franklin Templeton Institutional, LLC; Vice President and Compliance Officer—Commingled Trusts, Fiduciary Trust International of theSouth; and officer of some of the other subsidiaries of Franklin Resources, Inc. and of 46 of the investment companies in Franklin Templeton Investments.
Laura F. Fergerson (1962)One Franklin ParkwaySan Mateo, CA 94403-1906
Chief ExecutiveOfficer—Finance andAdministration
Since 2009 NotApplicable
Not Applicable
Principal Occupation During at Least the Past 5 Years:Senior Vice President, Franklin Templeton Services, LLC; and officer of 46 of the investment companies in Franklin Templeton Investments.
Gaston Gardey (1967)One Franklin ParkwaySan Mateo, CA 94403-1906
Treasurer, ChiefFinancial Officerand ChiefAccountingOfficer
Since 2009 NotApplicable
Not Applicable
Principal Occupation During at Least the Past 5 Years:Director, Fund Accounting, Franklin Templeton Investments; and officer of 27 of the investment companies in Franklin Templeton Investments.
Aliya S. Gordon (1973)One Franklin ParkwaySan Mateo, CA 94403-1906
Vice President Since 2009 NotApplicable
Not Applicable
Principal Occupation During at Least the Past 5 Years:Senior Associate General Counsel, Franklin Templeton Investments; officer of 46 of the investment companies in Franklin Templeton Investments; and formerly,Litigation Associate, Steefel, Levitt & Weiss, LLP (2000-2004).
Steven J. Gray (1955)One Franklin ParkwaySan Mateo, CA 94403-1906
Vice President Since 2009 NotApplicable
Not Applicable
Principal Occupation During at Least the Past 5 Years:Senior Associate General Counsel, Franklin Templeton Investments; Vice President, Franklin Templeton Distributors, Inc.; and officer of 46 of the investmentcompanies in Franklin Templeton Investments.
Selena L. Holmes (1965)100 Fountain ParkwaySt. Petersburg, FL 33716-1205
Vice President—AML Compliance
Since May 2012 NotApplicable
Not Applicable
Principal Occupation During at Least the Past 5 Years:Director, Global Compliance Monitoring; and officer of 46 of the investment companies in Franklin Templeton Investments.
Edward B. Jamieson (1948)One Franklin ParkwaySan Mateo, CA 94403-1906
President andChief ExecutiveOfficer—InvestmentManagement
Since 2010 NotApplicable
Not Applicable
Principal Occupation During at Least the Past 5 Years:President, Chief Investment Officer and Director, Franklin Advisers, Inc.; Executive Vice President, Franklin Templeton Institutional, LLC; and officer and/or trustee,as the case may be, of some of the other subsidiaries of Franklin Resources, Inc. and of 10 of the investment companies in Franklin Templeton Investments.
BOD-3

Name, Year of Birth and Address PositionLength ofTime Served
Number ofPortfolios in FundComplex Overseenby Board Member*
Other Directorships HeldDuring at Least the Past 5 Years
Robert C. Rosselot (1960)300 S.E. 2nd StreetFort Lauderdale, FL 33301-1923
Vice President Since 2009 NotApplicable
Not Applicable
Principal Occupation During at Least the Past 5 Years:Senior Associate General Counsel, Franklin Templeton Investments; Assistant Secretary, Franklin Resources, Inc.; Vice President and Secretary, TempletonInvestment Counsel, LLC; Vice President, Secretary and Trust Officer, Fiduciary Trust International of the South; and officer of 46 of the investment companies inFranklin Templeton Investments.
Karen L. Skidmore (1952)One Franklin ParkwaySan Mateo, CA 94403-1906
Vice Presidentand Secretary
Since 2006 NotApplicable
Not Applicable
Principal Occupation During at Least the Past 5 Years:Senior Associate General Counsel, Franklin Templeton Investments; and officer of 46 of the investment companies in Franklin Templeton Investments.
Craig S. Tyle (1960)One Franklin ParkwaySan Mateo, CA 94403-1906
Vice President Since 2005 NotApplicable
Not Applicable
Principal Occupation During at Least the Past 5 Years:General Counsel and Executive Vice President, Franklin Resources, Inc.; officer of some of the other subsidiaries of Franklin Resources, Inc. and of 46 of theinvestment companies in Franklin Templeton Investments; and formerly, Partner, Shearman & Sterling, LLP (2004-2005); and General Counsel, InvestmentCompany Institute (ICI) (1997-2004).
Lori A. Weber (1964)300 S.E. 2nd StreetFort Lauderdale, FL 33301-1923
Vice President Since 2011 NotApplicable
Not Applicable
Principal Occupation During at Least the Past 5 Years:Associate General Counsel, Franklin Templeton Investments; Assistant Secretary, Franklin Resources, Inc.; Vice President and Assistant Secretary, TempletonInvestment Counsel, LLC; and officer of 46 of the investment companies in Franklin Templeton Investments.
*We base the number of portfolios on each separate series of the U.S. registered investment companies within the Franklin Templeton Investments fundcomplex. These portfolios have a common investment manager or affiliated investment managers.
**Charles B. Johnson and Rupert H. Johnson, Jr. are considered to be interested persons of the Trust under the federal securities laws due to their positions asofficers and directors and major shareholders of Franklin Resources, Inc., which is the parent company of the Trust’s investment manager and distributor.
Note 1: Charles B. Johnson and Rupert H. Johnson, Jr. are brothers.Note 2: Officer information is current as of the date of this report. It is possible that after this date, information about officers may change.
The Sarbanes-Oxley Act of 2002 and Rules adopted by the Securities and Exchange Commission require the Fund to disclose whether theFund’s Audit Committee includes at least one member who is an audit committee financial expert within the meaning of such Act andRules. The Fund’s Board has determined that there is at least one such financial expert on the Audit Committee and has designated John B.Wilson as its audit committee financial expert. The Board believes that Mr. Wilson qualifies as such an expert in view of his extensivebusiness background and experience, including service as chief financial officer of Staples, Inc. from 1992 to 1996. Mr. Wilson has been aMember and Chairman of the Fund’s Audit Committee since 2007. As a result of such background and experience, the Board believes thatMr. Wilson has acquired an understanding of generally accepted accounting principles and financial statements, the general application ofsuch principles in connection with the accounting estimates, accruals and reserves, and analyzing and evaluating financial statements thatpresent a breadth and level of complexity of accounting issues generally comparable to those of the Fund, as well as an understanding ofinternal controls and procedures for financial reporting and an understanding of audit committee functions. Mr. Wilson is an independentBoard member as that term is defined under the relevant Securities and Exchange Commission Rules and Releases.
The Statement of Additional Information (SAI) includes additional information about the board members and is available, without charge,upon request. Shareholders may call (800) 321-8563 or their insurance companies to request the SAI.
BOD-4

Franklin Templeton Variable Insurance Products Trust
Shareholder Information
Proxy Voting Policies and Procedures
The Trust’s investment manager has established Proxy Voting Policies and Procedures (Policies) that the Trust uses to determinehow to vote proxies relating to portfolio securities. Shareholders may view the Trust’s complete Policies online atfranklintempleton.com. Alternatively, shareholders may request copies of the Policies free of charge by calling the Proxy Groupcollect at (954) 527-7678 or by sending a written request to: Franklin Templeton Companies, LLC, 300 S.E. 2nd Street, FortLauderdale, FL 33301, Attention: Proxy Group. Copies of the Trust’s proxy voting records are also made available online atfranklintempleton.com and posted on the U.S. Securities and Exchange Commission’s website at sec.gov and reflect the mostrecent 12-month period ended June 30.
Quarterly Statement of Investments
The Trust files a complete statement of investments with the U.S. Securities and Exchange Commission for the first and thirdquarters for each fiscal year on Form N-Q. Shareholders may view the filed Form N-Q by visiting the Commission’s website atsec.gov. The filed form may also be viewed and copied at the Commission’s Public Reference Room in Washington, DC.Information regarding the operations of the Public Reference Room may be obtained by calling (800) SEC-0330.
SI-1

VALUE BLEND GROWTH SECTOR GLOBAL INTERNATIONAL HYBRID ASSET ALLOCATION FIXED INCOME
< GAIN FROM OUR PERSPECTIVE® >
Annual Report
Franklin TempletonVariable Insurance Products Trust
Investment ManagersFranklin Advisers, Inc.Franklin Advisory Services, LLCFranklin Mutual Advisers, LLCFranklin Templeton Institutional, LLCTempleton Asset Management, Ltd.Templeton Global Advisors LimitedTempleton Investment Counsel, LLC
Fund AdministratorFranklin Templeton Services, LLC
DistributorFranklin Templeton Distributors, Inc.
Franklin Templeton Variable Insurance Products Trust (FTVIP) shares are not offered to the public; they areoffered and sold only to: (1) insurance company separate accounts (Separate Account) to serve as theunderlying investment vehicle for variable contracts; (2) certain qualified plans; and (3) other mutual funds(funds of funds).
Authorized for distribution to investors in Separate Accounts only when accompanied or preceded by thecurrent prospectus for the applicable contract, which includes the Separate Account and the FTVIPprospectuses. Investors should carefully consider a fund’s investment goals, risks, charges and expensesbefore investing. The prospectus contains this and other information; please read it carefully before investing.
To ensure the highest quality of service, telephone calls to or from our service departments may be monitored, recorded andaccessed. These calls can be identified by the presence of a regular beeping tone.
©2013 Franklin Templeton Investments. All rights reserved. VIP A 02/13

DECEMBER 31 , 2012
Franklin TempletonVariable Insurance Products Trust
ANNUALREPORT


FRANKLIN TEMPLETON VARIABLE INSURANCEPRODUCTS TRUST ANNUAL REPORTTABLE OF CONTENTS
Important Notes to Performance Information . . . . . . . . . . . . . . . . . . . . . . iFund Summary
Templeton Growth Securities Fund . . . . . . . . . . . . . . . . . . . . . . . . . . . . . . . . TG-1Index Descriptions . . . . . . . . . . . . . . . . . . . . . . . . . . . . . . . . . . . . . . . . . . . . . . . . . . I-1Board Members and Officers . . . . . . . . . . . . . . . . . . . . . . . . . . . . . . . . . . . . . . . . BOD-1Shareholder Information . . . . . . . . . . . . . . . . . . . . . . . . . . . . . . . . . . . . . . . . . . . . SI-1
NOT FDIC INSURED | MAY LOSE VALUE | NO BANK GUARANTEE
LIBERTY LIFE A 02/13
IMPORTANT NOTES TOPERFORMANCE INFORMATION
Performance data is historical and cannot predict or guarantee futureresults. Principal value and investment return will fluctuate with marketconditions, and you may have a gain or loss when you withdraw yourmoney. Inception dates of the funds may have preceded the effectivedates of the subaccounts, contracts, or their availability in all states.
When reviewing the index comparisons, please keep in mind thatindexes have a number of inherent performance differentials over thefunds. First, unlike the funds, which must hold a minimum amount ofcash to maintain liquidity, indexes do not have a cash component.Second, the funds are actively managed and, thus, are subject tomanagement fees to cover salaries of securities analysts or portfoliomanagers in addition to other expenses. Indexes are unmanaged and donot include any commissions or other expenses typically associatedwith investing in securities. Third, indexes often contain a different mixof securities than the fund to which they are compared. Additionally,please remember that indexes are simply a measure of performance andcannot be invested in directly.
i
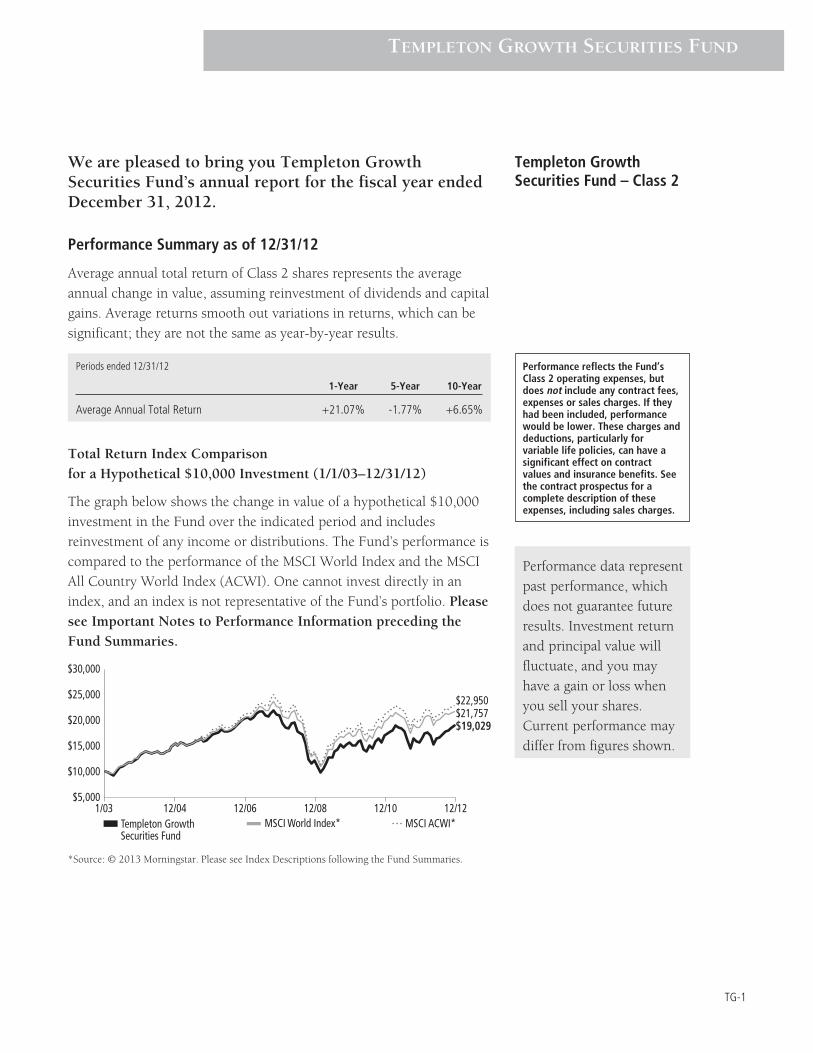
TEMPLETON GROWTH SECURITIES FUND
We are pleased to bring you Templeton GrowthSecurities Fund’s annual report for the fiscal year endedDecember 31, 2012.
Performance Summary as of 12/31/12
Average annual total return of Class 2 shares represents the averageannual change in value, assuming reinvestment of dividends and capitalgains. Average returns smooth out variations in returns, which can besignificant; they are not the same as year-by-year results.
Periods ended 12/31/12
1-Year 5-Year 10-Year
Average Annual Total Return +21.07% -1.77% +6.65%
Total Return Index Comparisonfor a Hypothetical $10,000 Investment (1/1/03–12/31/12)
The graph below shows the change in value of a hypothetical $10,000investment in the Fund over the indicated period and includesreinvestment of any income or distributions. The Fund’s performance iscompared to the performance of the MSCI World Index and the MSCIAll Country World Index (ACWI). One cannot invest directly in anindex, and an index is not representative of the Fund’s portfolio. Pleasesee Important Notes to Performance Information preceding theFund Summaries.
$21,757$19,029
$22,950
1/03 12/04 12/06 12/08 12/10 12/12$5,000
$10,000
$15,000
$20,000
$30,000
$25,000
Templeton GrowthSecurities Fund
MSCI World Index* MSCI ACWI*
*Source: © 2013 Morningstar. Please see Index Descriptions following the Fund Summaries.
Templeton GrowthSecurities Fund – Class 2
Performance reflects the Fund’sClass 2 operating expenses, butdoes not include any contract fees,expenses or sales charges. If theyhad been included, performancewould be lower. These charges anddeductions, particularly forvariable life policies, can have asignificant effect on contractvalues and insurance benefits. Seethe contract prospectus for acomplete description of theseexpenses, including sales charges.
Performance data representpast performance, whichdoes not guarantee futureresults. Investment returnand principal value willfluctuate, and you mayhave a gain or loss whenyou sell your shares.Current performance maydiffer from figures shown.
TG-1

Fund Goal and Main Investments: Templeton Growth Securities Fund seeks
long-term capital growth. Under normal market conditions, the Fund invests
primarily in equity securities of companies located anywhere in the world,
including those in the U.S. and in emerging markets.
Performance Overview
You can find the Fund’s one-year total return in the Performance Sum-mary. The Fund outperformed the MSCI ACWI’s +16.80% total returnand the MSCI World Index’s +16.54% total return for the same period.1
Economic and Market Overview
Global developed and emerging stocks, as measured by the MSCIACWI, rallied through the spring of 2012 before a brief drop in earlysummer gave way to a recovery, leading to solid 12-month gains. Peri-odic downturns were primarily attributable to concerns about slowingglobal economic growth, European sovereign debt and U.S. fiscal nego-tiations. The market’s focus early in 2012 was Europe’s debt crisis.Seeking to address it, relatively new leaders in Italy and Greece and forthe International Monetary Fund, World Bank and European CentralBank (ECB) offered plans for stability and growth. The leadership’s ini-tial policy responses — which included enhanced liquidity measuresand an ineffective Spanish banking bailout — did little to address thestructural imbalances of eurozone economies or the solvency fears pla-guing the region’s banking system. Thus, debt yields for certain coun-tries spiked to record levels in the first quarter of 2012. However,measures intended to address the seemingly toxic link between Eu-rope’s banks and sovereign bonds emerged when European Unionleaders agreed to a deployment of temporary and permanent bailoutfunds. ECB President Mario Draghi’s declaration that “the ECB is readyto do whatever it takes to preserve the euro” further buoyed markets.
In the U.S., the Federal Reserve Board announced additional rounds ofquantitative easing and opted to extend its strategy designed to lowersystemically important interest rates. In Asia, the People’s Bank ofChina cut borrowing costs for the first time since the global financialcrisis began, and the Bank of Japan launched its eighth round of quanti-tative easing in little more than a decade. Headwinds to growth neg-atively affected most world regions during 2012, including recentlyresilient emerging markets, and the International Monetary Fund
1. Source: © 2013 Morningstar. One cannot invest directly in an index, and an index is notrepresentative of the Fund’s portfolio. Please see Index Descriptions following the FundSummaries.
Fund Risks: Special risks are
associated with foreign investing,
including currency fluctuations,
economic instability and political
developments; investments in
emerging markets involve
heightened risks related to the
same factors. To the extent the
Fund focuses on particular
countries, regions, industries,
sectors or types of investment
from time to time, it may be
subject to greater risks of ad-
verse developments in such
areas of focus than a fund that
invests in a wider variety of
countries, regions, industries,
sectors or investments. Current
political uncertainty surround-
ing the European Union (EU)
and its membership may in-
crease market volatility. The
financial instability of some
countries in the EU, including
Greece, Italy and Spain,
together with the risk of that
impacting other more stable
countries, may increase the eco-
nomic risk of investing in
companies in Europe. The Fund
is actively managed but there is
no guarantee that the manager’s
investment decisions will pro-
duce the desired results. The
Fund’s prospectus also includes
a description of the main
investment risks.
TG-2

lowered its global growth outlook. However, the slowdown appearedless severe than expected in developed markets such as Germany andthe U.S. In the latter half of 2012, policy measures seemed to take holdand supported global economic recovery, contributing to expansion inthe U.S. and many emerging market countries as well as a slowing rateof contraction in Europe. Toward year-end, investor focus shifted to theU.S., where policymakers sought to avert automatic spending cuts andtax hikes, commonly known as the “fiscal cliff.” Just after year-end,Congress passed compromise legislation that preserved lower incometax rates for most U.S. households and delayed far-reaching federalspending cuts. Despite adversity and uncertainty throughout the 12-month period, virtually all major asset classes finished 2012 with pos-itive returns.
Investment Strategy
Our investment philosophy is bottom up, value oriented and long term.In choosing investments, we will focus on the market price of acompany’s securities relative to our evaluation of the company’s poten-tial long-term earnings, asset value and cash flow. Among factors wemay consider are a company’s historical value measures, includingprice/earnings ratio, profit margins and liquidation value. We do in-depth research to construct a bargain list from which we buy.
Manager’s Discussion
All major stock sectors in the MSCI ACWI and the Fund delivered pos-itive returns in 2012. Although weak sentiment in early 2012 left manyinvestors ill-prepared for the stock market rally, our value disciplinepositioned the Fund in low valued stocks with what we viewed as thegreatest potential for appreciation, and the Fund performed well.
Stock selection was the primary contributor to the Fund’s performancerelative to the benchmark, with some of the Fund’s highest conviction,long-term holdings delivering healthy returns. The Fund’s overweightedconsumer discretionary sector holdings were major absolute and rela-tive contributors to performance, with a particularly strong boost fromthe media industry.2 U.S cable companies Comcast and Time WarnerCable and content producer News Corp. led returns for the sector.America’s leading cable companies have come to dominate the valuablebroadband pipeline permitting bundled delivery of voice, data andvideo, and content producers have seen a surge in demand for their
2. The consumer discretionary sector comprises auto components, automobiles, media, multilineretail and specialty retail in the SOI.
Geographic BreakdownTempleton Growth Securities FundBased on Total Net Assets as of 12/31/12
Europe 49.5%
North America 35.5%
Asia 12.5%
Latin America & Caribbean 1.3%
Short-Term Investments& Other Net Assets 1.2%
TG-3

products as new devices and opportunities for media consumption pro-liferate. These media stocks have provided attractive long-term returnsfor the Fund, and although we are encouraged by their ongoing cashgeneration and market share consolidation, we believe our largest in-dustry holdings are not as undervalued as in the past. Also from theconsumer discretionary sector, French tire maker Michelin ralliedstrongly in 2012 as earnings beat expectations after sales improved forhigh-margin specialty tires for agriculture and mining equipment.3
Stock selection in the financials sector also supported relative perform-ance, led by European reinsurers and lenders, such as Swiss Re(Switzerland), Muenchener Ruecksversicherungs-Gesellschaft (MunichReinsurance; Germany) and BNP Paribas (France).4 Reinsurers bene-fited from lower-than-expected catastrophe levels and judiciousunderwriting discipline, and could return excess capital to share-holders. BNP Paribas rallied after doubling its third-quarter profit andboosting capital levels. We maintained our favorable view of the globalfinancials sector, in particular European banks. Even after robust gainsin 2012, European bank stock performance has still lagged that of U.S.banks since 2009 and remained near two-decade low valuations, sug-gesting to us further appreciation potential for a sector that has under-gone intensive fundamental repair and recapitalization. The Fund’sindustrials positions also aided performance as European airlines Deut-sche Lufthansa (Germany) and off-benchmark International Con-solidated Airlines Group (U.K.) reported improved profits on increasedair traffic volume and ongoing restructuring initiatives.5 We purchasedthese airline stocks at valuations we saw as low amid uncertainty sur-rounding global economic growth, fuel costs and competitive pressures,and we were encouraged to see managements taking what we viewed asnecessary steps to enhance shareholder value.
Long-standing overweighted positions in information technology, tele-communication services and health care also performed well.6 Top
3. Listed as Cie Generale des Etablissements Michelin in the SOI.4. The financials sector comprises capital markets, commercial banks, consumer finance,diversified financial services and insurance in the SOI.5. The industrials sector comprises aerospace and defense, airlines, automobiles, chemicals,construction and engineering, construction materials, electrical equipment, industrialconglomerates, machinery, metals and mining, and trading companies and distributors in the SOI.6. The information technology sector comprises communications equipment; computers andperipherals; electronic equipment, instruments and components; semiconductors andsemiconductor equipment; and software in the SOI. The telecommunication services sectorcomprises diversified telecommunication services and wireless telecommunication services in theSOI. The health care sector comprises biotechnology, life sciences tools and services, andpharmaceuticals in the SOI.
Top 10 HoldingsTempleton Growth Securities Fund12/31/12
CompanySector/Industry,Country
% of TotalNet Assets
Samsung Electronics Co. Ltd. 2.9%Semiconductors &Semiconductor Equipment,South Korea
Pfizer Inc. 2.1%Pharmaceuticals, U.S.
Sanofi 2.0%Pharmaceuticals, France
Deutsche Lufthansa AG 1.8%Airlines, Germany
Roche Holding AG 1.8%Pharmaceuticals, Switzerland
Amgen Inc. 1.8%Biotechnology, U.S.
ING Groep NV 1.7%Diversified Financial Services,Netherlands
Total SA, B 1.7%Oil, Gas & Consumable Fuels,France
Comcast Corp., Special A 1.7%Media, U.S.
GlaxoSmithKline PLC 1.6%Pharmaceuticals, U.K.
The dollar value, number of shares orprincipal amount, and names of allportfolio holdings are listed in theFund’s Statement of Investments (SOI).
TG-4

performing technology stocks included hardware manufacturer SeagateTechnology7 and semiconductor and consumer electronicsmanufacturer Samsung Electronics (South Korea). Our analysisidentified what we viewed as tremendous cash-flow generating capa-bilities and the cleanest balance sheets of any global sector for certaintechnology companies, which prospered as customers targeting costefficiencies prioritized productivity-enhancing investments overcapacity-enhancing capital expenditures. Our analysis indicated thesector has become more fully valued and we selectively reduced ex-posure to information technology during the period.
Telecommunication services stocks, in contrast, remained undervaluedin our view as regulatory and competitive issues and anemic revenuegrowth kept the sector out of favor, allowing us to buy companies wesaw as highly profitable and having healthy dividend yields at de-pressed valuations. Although the Fund’s overweighted position in theunpopular sector weighed on relative performance, stock selectionadded value. Sprint Nextel, a U.S. mobile operator, was a top perform-er, more than doubling in value during the year. Management re-sponded to investors’ liquidity concerns by cutting costs, tapping debtmarkets and securing vendor financing; however, the stock appearedunduly cheap to us, and Japanese telecom Softbank acquired a majoritystake in the company in October. We believe Sprint could benefit fromthe firm’s upcoming iPhone offering and transition to a new 4G net-work, which could continue to reduce the company’s inflated cost baseand stem subscriber defections. We believe the unpopularity of tele-communications stocks has created opportunities to acquire shares inhighly profitable telecommunications companies with diverse revenuestreams and healthy dividend yields at bargain valuations.
Health care sector positions, also a Fund overweighting, benefited per-formance as the sector exhibited greater market strength than tele-communication services. We favored higher growth companies, oftenwith emerging market exposure, such as biotechnology firm Amgen andpharmaceutical maker Sanofi (France), which gets more than one-thirdof its revenue from emerging markets and has been diversifying itspipeline into longer duration products. Amgen, the Fund’s top-performing health care stock in 2012, is an excellent example of ourapproach to the sector. When we first purchased the stock five yearsago, the market seemed to us overly focused on research and
7. No longer held at period-end.
TG-5
development risks and slowing top line growth, overlooking Amgen’sability to generate cash and develop new products over the long run.Since then, the company has demonstrated an ability to manage itsmaturing product portfolio while spurring pipeline innovation and pri-oritizing shareholder returns, and the stock price rose to a new high.
Overweighted energy stocks were laggards as positions generally de-clined because of weaker oil prices and a North American natural gasglut.8 These conditions reduced demand for drilling rigs and equip-ment, pressuring U.S. oilfield services provider Baker Hughes, a sectorlaggard in 2012. However, in our view the stock remains attractivelyvalued and management is pursuing a sensible strategy that could posi-tion Baker well for both a domestic recovery and international growthopportunities. We also believe some exploration and production and oilservices firms with advanced technology, sound capital discipline andoperational flexibility can gain market share as hydrocarbon extractionmoves to increasingly challenging and remote locations. Stock-specificweakness in consumer staples also weighed on results as U.K. grocerTesco declined considerably in January 2012 after warning that the in-creased capital expenditures required to win back customers wouldlikely result in lower near-term profits.9 We believe Tesco’s investmentscould help the company retain market share in its domestic environ-ment, and that international expansion and a proactive move towardonline retailing remain underappreciated potential growth drivers.Elsewhere in the consumer staples sector, value opportunities remainedelusive. Food and personal product manufacturer stocks appearedovervalued to us, with investors willing to pay a premium for the in-dustry’s perceived mix of defensive characteristics and emerging marketexposure, while food retailers, which may appear cheap to some, strug-gled to redefine their model amid increasing industry fragmentation.
Geographically, all major regions helped the Fund, particularly over-weighting in the eurozone and stock selection in the U.S. and Asia ex-Japan. However, stock selection in Spain, Sweden and the U.K. hurtrelative performance. At the end of 2012, Europe remained the Fund’slargest relative and absolute allocation. Despite producing someleading-market returns in 2012, developed Europe was still home toeight of the world’s 10 cheapest markets (on cyclically adjustedprice-to-earnings ratios) at period-end. The region’s dramatic policy
8. The energy sector comprises energy equipment and services; and oil, gas and consumable fuelsin the SOI.9. The consumer staples sector comprises food and staples retailing in the SOI.
TG-6

progress has made European stocks more attractive to many investors,mainly through the European Central Bank’s efforts to neutralize tailrisks with unconventional monetary tools to repair sovereign balancesheets via fiscal austerity. Although challenges remain, we are stillfavorable toward Europe in light of what we see as the region’s funda-mental stabilization and many inexpensive, high-yielding stocks withglobal revenue streams.
Thank you for your participation in Templeton Growth SecuritiesFund. We look forward to serving your future investment needs.
The foregoing information reflects our analysis, opinions and portfolio holdings as ofDecember 31, 2012, the end of the reporting period. The way we implement our maininvestment strategies and the resulting portfolio holdings may change depending on factorssuch as market and economic conditions. These opinions may not be relied upon as invest-ment advice or an offer for a particular security. The information is not a complete analysis ofevery aspect of any market, country, industry, security or the Fund. Statements of fact arefrom sources considered reliable, but the investment manager makes no representation orwarranty as to their completeness or accuracy. Although historical performance is no guaran-tee of future results, these insights may help you understand our investment managementphilosophy.
TG-7

Fund Expenses
As an investor in a variable insurance contract (Contract) that indirectlyprovides for investment in an underlying mutual fund, you can incurtransaction and/or ongoing expenses at both the Fund level and theContract level.
• Transaction expenses can include sales charges (loads) on purchases,redemption fees, surrender fees, transfer fees and premium taxes.
• Ongoing expenses can include management fees, distribution andservice (12b-1) fees, contract fees, annual maintenance fees, mortalityand expense risk fees and other fees and expenses. All mutual fundsand Contracts have some types of ongoing expenses.
The expenses shown in the table are meant to highlight ongoing expenses at
the Fund level only and do not include ongoing expenses at the Contract level,
or transaction expenses at either the Fund or Contract level. While the Fund
does not have transaction expenses, if the transaction and ongoing expenses
at the Contract level were included, the expenses shown below would be high-
er. You should consult your Contract prospectus or disclosure document for
more information.
The table shows Fund-level ongoing expenses and can help you under-stand these expenses and compare them with those of other mutualfunds offered through the Contract. The table assumes a $1,000investment held for the six months indicated. Please refer to the Fundprospectus for additional information on operating expenses.
Actual Fund Expenses
The first line (Actual) of the table provides actual account values andexpenses. The “Ending Account Value” is derived from the Fund’s ac-tual return, which includes the effect of ongoing Fund expenses, butdoes not include the effect of ongoing Contract expenses.
You can estimate the Fund-level expenses you incurred during theperiod by following these steps. Of course, your account value and ex-
penses will differ from those in this illustration:
1. Divide your account value by $1,000.If an account had an $8,600 value, then $8,600 ÷ $1,000 = 8.6.
2. Multiply the result by the number under the heading “Fund-LevelExpenses Incurred During Period.”If Fund-Level Expenses Incurred During Period were $7.50, then
8.6 x $7.50 = $64.50.
In this illustration, the estimated expenses incurred this period at theFund level are $64.50.
Templeton GrowthSecurities Fund – Class 2
TG-8

Hypothetical Example for Comparison with Other MutualFunds
Information in the second line (Hypothetical) of the table can help youcompare ongoing expenses of the Fund with those of other mutualfunds offered through the Contract. This information may not be usedto estimate the actual ending account balance or expenses you incurredduring the period. The hypothetical “Ending Account Value” is basedon the Fund’s actual expense ratio and an assumed 5% annual rate ofreturn before expenses, which does not represent the Fund’s actual re-turn. The figure under the heading “Fund-Level Expenses IncurredDuring Period” shows the hypothetical expenses your account wouldhave incurred under this scenario. You can compare this figure with the5% hypothetical examples that appear in shareholder reports of otherfunds offered through a Contract.
Class 2
BeginningAccount
Value 7/1/12
EndingAccount
Value 12/31/12
Fund-LevelExpenses Incurred
During Period*7/1/12–12/31/12
Actual . . . . . . . . . . . . . . . . . . . . . . . . . . . . . $1,000 $1,163.30 $5.60Hypothetical (5% return
before expenses) . . . . . . . . . . . . . . . . . . $1,000 $1,019.96 $5.23
*Expenses are calculated using the most recent six-month annualized expense ratio forthe Fund’s Class 2 shares (1.03%), which does not include any ongoing expenses of theContract for which the Fund is an investment option, multiplied by the average accountvalue over the period, multiplied by 184/366 to reflect the one-half year period.
TG-9

Franklin Templeton Variable Insurance Products Trust
Financial Highlights
Templeton Growth Securities Fund
Year Ended December 31,
Class 1 2012 2011 2010 2009 2008
Per share operating performance(for a share outstanding throughout the year)
Net asset value, beginning of year . . . . . . . . . . . . . . . . . . . . . . . . . . . . . . . . . . . . . . . . . $ 10.27 $ 11.19 $ 10.56 $ 8.34 $ 15.68
Income from investment operationsa:Net investment incomeb . . . . . . . . . . . . . . . . . . . . . . . . . . . . . . . . . . . . . . . . . . . . . . 0.27 0.25 0.17 0.17 0.29Net realized and unrealized gains (losses) . . . . . . . . . . . . . . . . . . . . . . . . . . . . . . . . . 1.88 (0.99) 0.62 2.36 (6.50)
Total from investment operations . . . . . . . . . . . . . . . . . . . . . . . . . . . . . . . . . . . . . . . . . 2.15 (0.74) 0.79 2.53 (6.21)
Less distributions from:Net investment income . . . . . . . . . . . . . . . . . . . . . . . . . . . . . . . . . . . . . . . . . . . . . . . (0.26) (0.18) (0.16) (0.31) (0.26)Net realized gains . . . . . . . . . . . . . . . . . . . . . . . . . . . . . . . . . . . . . . . . . . . . . . . . . . . — — — — (0.87)
Total distributions . . . . . . . . . . . . . . . . . . . . . . . . . . . . . . . . . . . . . . . . . . . . . . . . . . . . . (0.26) (0.18) (0.16) (0.31) (1.13)
Net asset value, end of year . . . . . . . . . . . . . . . . . . . . . . . . . . . . . . . . . . . . . . . . . . . . . $ 12.16 $ 10.27 $ 11.19 $ 10.56 $ 8.34
Total returnc . . . . . . . . . . . . . . . . . . . . . . . . . . . . . . . . . . . . . . . . . . . . . . . . . . . . . . . . . 21.40% (6.80)% 7.74% 31.33% (42.13)%
Ratios to average net assetsExpensesd . . . . . . . . . . . . . . . . . . . . . . . . . . . . . . . . . . . . . . . . . . . . . . . . . . . . . . . . . . . 0.78% 0.78% 0.77% 0.79% 0.78%Net investment income . . . . . . . . . . . . . . . . . . . . . . . . . . . . . . . . . . . . . . . . . . . . . . . . . 2.31% 2.22% 1.71% 2.00% 2.64%
Supplemental dataNet assets, end of year (000’s) . . . . . . . . . . . . . . . . . . . . . . . . . . . . . . . . . . . . . . . . . . . $476,954 $1,200,682 $1,348,622 $824,575 $ 371,700Portfolio turnover rate . . . . . . . . . . . . . . . . . . . . . . . . . . . . . . . . . . . . . . . . . . . . . . . . . . 18.73%e 42.13%e 9.61% 14.95% 18.37%
aThe amount shown for a share outstanding throughout the period may not correlate with the Statement of Operations for the period due to the timing of salesand repurchases of the Fund shares in relation to income earned and/or fluctuating market value of the investments of the Fund.bBased on average daily shares outstanding.cTotal return does not include fees, charges or expenses imposed by the variable annuity and life insurance contracts for which the Franklin Templeton VariableInsurance Products Trust serves as an underlying investment vehicle.dBenefit of expense reduction rounds to less than 0.01%.eExcludes the value of portfolio securities delivered as a result of a redemption in-kind.
The accompanying notes are an integral part of these financial statements.TG-10

Franklin Templeton Variable Insurance Products Trust
Financial Highlights (continued)
Templeton Growth Securities Fund
Year Ended December 31,
Class 2 2012 2011 2010 2009 2008
Per share operating performance(for a share outstanding throughout the year)
Net asset value, beginning of year . . . . . . . . . . . . . . . . . . . . . . . . . . . . . . . . . . . . . $ 10.11 $ 11.01 $ 10.40 $ 8.20 $ 15.44
Income from investment operationsa:Net investment incomeb . . . . . . . . . . . . . . . . . . . . . . . . . . . . . . . . . . . . . . . . . . . 0.21 0.21 0.15 0.16 0.29Net realized and unrealized gains (losses) . . . . . . . . . . . . . . . . . . . . . . . . . . . . . . 1.88 (0.96) 0.60 2.32 (6.44)
Total from investment operations . . . . . . . . . . . . . . . . . . . . . . . . . . . . . . . . . . . . . . 2.09 (0.75) 0.75 2.48 (6.15)
Less distributions from:Net investment income . . . . . . . . . . . . . . . . . . . . . . . . . . . . . . . . . . . . . . . . . . . (0.23) (0.15) (0.14) (0.28) (0.22)Net realized gains . . . . . . . . . . . . . . . . . . . . . . . . . . . . . . . . . . . . . . . . . . . . . . . — — — — (0.87)
Total distributions . . . . . . . . . . . . . . . . . . . . . . . . . . . . . . . . . . . . . . . . . . . . . . . . . (0.23) (0.15) (0.14) (0.28) (1.09)
Net asset value, end of year . . . . . . . . . . . . . . . . . . . . . . . . . . . . . . . . . . . . . . . . . . $ 11.97 $ 10.11 $ 11.01 $ 10.40 $ 8.20
Total returnc . . . . . . . . . . . . . . . . . . . . . . . . . . . . . . . . . . . . . . . . . . . . . . . . . . . . . 21.07% (6.97)% 7.39% 31.10% (42.32)%
Ratios to average net assetsExpensesd . . . . . . . . . . . . . . . . . . . . . . . . . . . . . . . . . . . . . . . . . . . . . . . . . . . . . . . 1.03% 1.03% 1.02% 1.04% 1.03%Net investment income . . . . . . . . . . . . . . . . . . . . . . . . . . . . . . . . . . . . . . . . . . . . . 2.06% 1.97% 1.46% 1.75% 2.39%
Supplemental dataNet assets, end of year (000’s) . . . . . . . . . . . . . . . . . . . . . . . . . . . . . . . . . . . . . . . . $1,352,554 $1,254,193 $1,626,885 $1,718,894 $1,513,557Portfolio turnover rate . . . . . . . . . . . . . . . . . . . . . . . . . . . . . . . . . . . . . . . . . . . . . . 18.73%e 42.13%e 9.61% 14.95% 18.37%
aThe amount shown for a share outstanding throughout the period may not correlate with the Statement of Operations for the period due to the timing of salesand repurchases of the Fund shares in relation to income earned and/or fluctuating market value of the investments of the Fund.bBased on average daily shares outstanding.cTotal return does not include fees, charges or expenses imposed by the variable annuity and life insurance contracts for which the Franklin Templeton VariableInsurance Products Trust serves as an underlying investment vehicle.dBenefit of expense reduction rounds to less than 0.01%.eExcludes the value of portfolio securities delivered as a result of a redemption in-kind.
The accompanying notes are an integral part of these financial statements. TG-11

Franklin Templeton Variable Insurance Products Trust
Financial Highlights (continued)
Templeton Growth Securities Fund
Year Ended December 31,
Class 4 2012 2011 2010 2009 2008a
Per share operating performance(for a share outstanding throughout the year)
Net asset value, beginning of year . . . . . . . . . . . . . . . . . . . . . . . . . . . . . . . . . . . . . . . . . . . . . . $ 10.19 $ 11.11 $ 10.50 $ 8.31 $ 14.08
Income from investment operationsb:Net investment incomec . . . . . . . . . . . . . . . . . . . . . . . . . . . . . . . . . . . . . . . . . . . . . . . . . . . 0.20 0.20 0.14 0.14 0.09Net realized and unrealized gains (losses) . . . . . . . . . . . . . . . . . . . . . . . . . . . . . . . . . . . . . . 1.90 (0.98) 0.61 2.36 (4.73)
Total from investment operations . . . . . . . . . . . . . . . . . . . . . . . . . . . . . . . . . . . . . . . . . . . . . . 2.10 (0.78) 0.75 2.50 (4.64)
Less distributions from:Net investment income . . . . . . . . . . . . . . . . . . . . . . . . . . . . . . . . . . . . . . . . . . . . . . . . . . . . (0.22) (0.14) (0.14) (0.31) (0.26)Net realized gains . . . . . . . . . . . . . . . . . . . . . . . . . . . . . . . . . . . . . . . . . . . . . . . . . . . . . . . — — — — (0.87)
Total distributions . . . . . . . . . . . . . . . . . . . . . . . . . . . . . . . . . . . . . . . . . . . . . . . . . . . . . . . . . (0.22) (0.14) (0.14) (0.31) (1.13)
Net asset value, end of year . . . . . . . . . . . . . . . . . . . . . . . . . . . . . . . . . . . . . . . . . . . . . . . . . . $ 12.07 $ 10.19 $ 11.11 $ 10.50 $ 8.31
Total returnd . . . . . . . . . . . . . . . . . . . . . . . . . . . . . . . . . . . . . . . . . . . . . . . . . . . . . . . . . . . . . . 21.02% (7.14)% 7.31% 30.98% (35.79)%
Ratios to average net assetse
Expensesf . . . . . . . . . . . . . . . . . . . . . . . . . . . . . . . . . . . . . . . . . . . . . . . . . . . . . . . . . . . . . . . . 1.13% 1.13% 1.12% 1.14% 1.13%Net investment income . . . . . . . . . . . . . . . . . . . . . . . . . . . . . . . . . . . . . . . . . . . . . . . . . . . . . . 1.96% 1.87% 1.36% 1.65% 2.29%
Supplemental dataNet assets, end of year (000’s) . . . . . . . . . . . . . . . . . . . . . . . . . . . . . . . . . . . . . . . . . . . . . . . . $ 67,158 $ 56,170 $60,569 $ 56,218 $ 24,877Portfolio turnover rate . . . . . . . . . . . . . . . . . . . . . . . . . . . . . . . . . . . . . . . . . . . . . . . . . . . . . . 18.73%g 42.13%g 9.61% 14.95% 18.37%
aFor the period February 29, 2008 (effective date) to December 31, 2008.bThe amount shown for a share outstanding throughout the period may not correlate with the Statement of Operations for the period due to the timing of salesand repurchases of the Fund shares in relation to income earned and/or fluctuating market value of the investments of the Fund.cBased on average daily shares outstanding.dTotal return does not include fees, charges or expenses imposed by the variable annuity and life insurance contracts for which the Franklin Templeton VariableInsurance Products Trust serves as an underlying investment vehicle. Total return is not annualized for periods less than one year.eRatios are annualized for periods less than one year.fBenefit of expense reduction rounds to less than 0.01%.gExcludes the value of portfolio securities delivered as a result of a redemption in-kind.
The accompanying notes are an integral part of these financial statements.TG-12

Franklin Templeton Variable Insurance Products TrustStatement of Investments, December 31, 2012
Templeton Growth Securities Fund Country Shares Value
Common Stocks 97.5%Aerospace & Defense 0.5%BAE Systems PLC . . . . . . . . . . . . . . . . . . . . . . . . . . . . . . . . . . . . . . . . . . . . . . . . . . . . . . . . . . . United Kingdom 1,730,147 $ 9,621,162
Air Freight & Logistics 1.5%FedEx Corp. . . . . . . . . . . . . . . . . . . . . . . . . . . . . . . . . . . . . . . . . . . . . . . . . . . . . . . . . . . . . . . United States 137,650 12,625,258United Parcel Service Inc., B . . . . . . . . . . . . . . . . . . . . . . . . . . . . . . . . . . . . . . . . . . . . . . . . . . . United States 213,890 15,770,110
28,395,368
Airlines 3.4%Deutsche Lufthansa AG . . . . . . . . . . . . . . . . . . . . . . . . . . . . . . . . . . . . . . . . . . . . . . . . . . . . . . Germany 1,852,934 35,019,057
aInternational Consolidated Airlines Group SA . . . . . . . . . . . . . . . . . . . . . . . . . . . . . . . . . . . . . . United Kingdom 9,750,507 29,569,326
64,588,383
Auto Components 1.5%Cie Generale des Etablissements Michelin, B . . . . . . . . . . . . . . . . . . . . . . . . . . . . . . . . . . . . . . France 304,259 29,146,006
Automobiles 2.6%aMazda Motor Corp. . . . . . . . . . . . . . . . . . . . . . . . . . . . . . . . . . . . . . . . . . . . . . . . . . . . . . . . . . Japan 5,893,690 12,078,973Nissan Motor Co. Ltd. . . . . . . . . . . . . . . . . . . . . . . . . . . . . . . . . . . . . . . . . . . . . . . . . . . . . . . . Japan 1,197,020 11,342,660Toyota Motor Corp. . . . . . . . . . . . . . . . . . . . . . . . . . . . . . . . . . . . . . . . . . . . . . . . . . . . . . . . . . Japan 547,420 25,527,034
48,948,667
Biotechnology 2.0%Amgen Inc. . . . . . . . . . . . . . . . . . . . . . . . . . . . . . . . . . . . . . . . . . . . . . . . . . . . . . . . . . . . . . . . United States 394,160 34,023,891
aElan Corp. PLC, ADR . . . . . . . . . . . . . . . . . . . . . . . . . . . . . . . . . . . . . . . . . . . . . . . . . . . . . . . . Ireland 294,500 3,006,845aProthena Corp. PLC . . . . . . . . . . . . . . . . . . . . . . . . . . . . . . . . . . . . . . . . . . . . . . . . . . . . . . . . . Ireland 5,524 40,494
37,071,230
Capital Markets 3.3%Credit Suisse Group AG . . . . . . . . . . . . . . . . . . . . . . . . . . . . . . . . . . . . . . . . . . . . . . . . . . . . . . Switzerland 1,002,529 24,380,068Morgan Stanley . . . . . . . . . . . . . . . . . . . . . . . . . . . . . . . . . . . . . . . . . . . . . . . . . . . . . . . . . . . . United States 985,150 18,836,068UBS AG . . . . . . . . . . . . . . . . . . . . . . . . . . . . . . . . . . . . . . . . . . . . . . . . . . . . . . . . . . . . . . . . . Switzerland 1,243,876 19,391,611
62,607,747
Chemicals 1.2%Akzo Nobel NV . . . . . . . . . . . . . . . . . . . . . . . . . . . . . . . . . . . . . . . . . . . . . . . . . . . . . . . . . . . . Netherlands 345,572 22,869,662
Commercial Banks 8.8%BNP Paribas SA . . . . . . . . . . . . . . . . . . . . . . . . . . . . . . . . . . . . . . . . . . . . . . . . . . . . . . . . . . . . France 501,247 28,528,429
aCredit Agricole SA . . . . . . . . . . . . . . . . . . . . . . . . . . . . . . . . . . . . . . . . . . . . . . . . . . . . . . . . . . France 2,476,096 20,160,137DBS Group Holdings Ltd. . . . . . . . . . . . . . . . . . . . . . . . . . . . . . . . . . . . . . . . . . . . . . . . . . . . . . Singapore 932,690 11,451,583HSBC Holdings PLC . . . . . . . . . . . . . . . . . . . . . . . . . . . . . . . . . . . . . . . . . . . . . . . . . . . . . . . . . United Kingdom 1,913,864 20,076,403ICICI Bank Ltd., ADR . . . . . . . . . . . . . . . . . . . . . . . . . . . . . . . . . . . . . . . . . . . . . . . . . . . . . . . . India 261,909 11,421,851Intesa Sanpaolo SpA . . . . . . . . . . . . . . . . . . . . . . . . . . . . . . . . . . . . . . . . . . . . . . . . . . . . . . . . Italy 12,521,254 21,647,397KB Financial Group Inc. . . . . . . . . . . . . . . . . . . . . . . . . . . . . . . . . . . . . . . . . . . . . . . . . . . . . . . South Korea 657,984 23,445,521SunTrust Banks Inc. . . . . . . . . . . . . . . . . . . . . . . . . . . . . . . . . . . . . . . . . . . . . . . . . . . . . . . . . . United States 313,620 8,891,127
aUniCredit SpA . . . . . . . . . . . . . . . . . . . . . . . . . . . . . . . . . . . . . . . . . . . . . . . . . . . . . . . . . . . . . Italy 4,430,841 21,813,672
167,436,120
Communications Equipment 3.1%aBrocade Communications Systems Inc. . . . . . . . . . . . . . . . . . . . . . . . . . . . . . . . . . . . . . . . . . . . United States 1,648,830 8,788,264Cisco Systems Inc. . . . . . . . . . . . . . . . . . . . . . . . . . . . . . . . . . . . . . . . . . . . . . . . . . . . . . . . . . . United States 1,476,640 29,015,976Ericsson, B . . . . . . . . . . . . . . . . . . . . . . . . . . . . . . . . . . . . . . . . . . . . . . . . . . . . . . . . . . . . . . . Sweden 2,161,202 21,641,440
59,445,680
Computers & Peripherals 1.4%Dell Inc. . . . . . . . . . . . . . . . . . . . . . . . . . . . . . . . . . . . . . . . . . . . . . . . . . . . . . . . . . . . . . . . . . United States 978,970 9,916,966
TG-13

Franklin Templeton Variable Insurance Products TrustStatement of Investments, December 31, 2012 (continued)
Templeton Growth Securities Fund Country Shares Value
Common Stocks (continued)Computers & Peripherals (continued)Hewlett-Packard Co. . . . . . . . . . . . . . . . . . . . . . . . . . . . . . . . . . . . . . . . . . . . . . . . . . . . . . . . United States 1,154,460 $ 16,451,055
26,368,021
Construction & Engineering 0.1%Carillion PLC . . . . . . . . . . . . . . . . . . . . . . . . . . . . . . . . . . . . . . . . . . . . . . . . . . . . . . . . . . . . . United Kingdom 506,846 2,635,293
Construction Materials 1.4%CRH PLC . . . . . . . . . . . . . . . . . . . . . . . . . . . . . . . . . . . . . . . . . . . . . . . . . . . . . . . . . . . . . . . . Ireland 1,277,393 25,970,299
Consumer Finance 0.6%American Express Co. . . . . . . . . . . . . . . . . . . . . . . . . . . . . . . . . . . . . . . . . . . . . . . . . . . . . . . United States 201,170 11,563,251
Diversified Financial Services 4.3%Citigroup Inc. . . . . . . . . . . . . . . . . . . . . . . . . . . . . . . . . . . . . . . . . . . . . . . . . . . . . . . . . . . . . United States 770,990 30,500,364
aING Groep NV . . . . . . . . . . . . . . . . . . . . . . . . . . . . . . . . . . . . . . . . . . . . . . . . . . . . . . . . . . . . Netherlands 3,399,906 32,283,667JPMorgan Chase & Co. . . . . . . . . . . . . . . . . . . . . . . . . . . . . . . . . . . . . . . . . . . . . . . . . . . . . . United States 440,760 19,380,217
82,164,248
Diversified Telecommunication Services 4.3%China Telecom Corp. Ltd., ADR . . . . . . . . . . . . . . . . . . . . . . . . . . . . . . . . . . . . . . . . . . . . . . . China 179,195 10,187,236France Telecom SA . . . . . . . . . . . . . . . . . . . . . . . . . . . . . . . . . . . . . . . . . . . . . . . . . . . . . . . . France 1,226,401 13,601,851Singapore Telecommunications Ltd. . . . . . . . . . . . . . . . . . . . . . . . . . . . . . . . . . . . . . . . . . . . . Singapore 10,915,970 29,706,312Telefonica SA . . . . . . . . . . . . . . . . . . . . . . . . . . . . . . . . . . . . . . . . . . . . . . . . . . . . . . . . . . . . Spain 900,340 12,186,503Vivendi SA . . . . . . . . . . . . . . . . . . . . . . . . . . . . . . . . . . . . . . . . . . . . . . . . . . . . . . . . . . . . . . France 739,654 16,723,523
82,405,425
Electrical Equipment 1.5%Alstom SA . . . . . . . . . . . . . . . . . . . . . . . . . . . . . . . . . . . . . . . . . . . . . . . . . . . . . . . . . . . . . . . France 590,117 23,765,902Dongfang Electric Corp. Ltd., H . . . . . . . . . . . . . . . . . . . . . . . . . . . . . . . . . . . . . . . . . . . . . . . China 2,016,600 4,069,498
27,835,400
Electronic Equipment, Instruments & Components 0.8%aFlextronics International Ltd. . . . . . . . . . . . . . . . . . . . . . . . . . . . . . . . . . . . . . . . . . . . . . . . . . Singapore 1,241,008 7,706,660TE Connectivity Ltd. . . . . . . . . . . . . . . . . . . . . . . . . . . . . . . . . . . . . . . . . . . . . . . . . . . . . . . . . United States 210,968 7,831,132
15,537,792
Energy Equipment & Services 3.7%Baker Hughes Inc. . . . . . . . . . . . . . . . . . . . . . . . . . . . . . . . . . . . . . . . . . . . . . . . . . . . . . . . . . United States 594,950 24,297,758Halliburton Co. . . . . . . . . . . . . . . . . . . . . . . . . . . . . . . . . . . . . . . . . . . . . . . . . . . . . . . . . . . . United States 731,720 25,383,367Noble Corp. . . . . . . . . . . . . . . . . . . . . . . . . . . . . . . . . . . . . . . . . . . . . . . . . . . . . . . . . . . . . . United States 470,410 16,379,676
aSBM Offshore NV . . . . . . . . . . . . . . . . . . . . . . . . . . . . . . . . . . . . . . . . . . . . . . . . . . . . . . . . . Netherlands 228,380 3,219,921
69,280,722
Food & Staples Retailing 2.2%CVS Caremark Corp. . . . . . . . . . . . . . . . . . . . . . . . . . . . . . . . . . . . . . . . . . . . . . . . . . . . . . . . United States 389,620 18,838,127Tesco PLC . . . . . . . . . . . . . . . . . . . . . . . . . . . . . . . . . . . . . . . . . . . . . . . . . . . . . . . . . . . . . . . United Kingdom 3,999,235 22,044,102
40,882,229
Health Care Equipment & Supplies 1.1%Medtronic Inc. . . . . . . . . . . . . . . . . . . . . . . . . . . . . . . . . . . . . . . . . . . . . . . . . . . . . . . . . . . . . United States 497,540 20,409,091
Industrial Conglomerates 2.1%Koninklijke Philips Electronics NV . . . . . . . . . . . . . . . . . . . . . . . . . . . . . . . . . . . . . . . . . . . . . . Netherlands 707,508 18,729,970Siemens AG . . . . . . . . . . . . . . . . . . . . . . . . . . . . . . . . . . . . . . . . . . . . . . . . . . . . . . . . . . . . . Germany 201,712 22,051,465
40,781,435
Insurance 5.3%aAmerican International Group Inc. . . . . . . . . . . . . . . . . . . . . . . . . . . . . . . . . . . . . . . . . . . . . . United States 221,040 7,802,712
TG-14

Franklin Templeton Variable Insurance Products TrustStatement of Investments, December 31, 2012 (continued)
Templeton Growth Securities Fund Country Shares Value
Common Stocks (continued)Insurance (continued)Aviva PLC . . . . . . . . . . . . . . . . . . . . . . . . . . . . . . . . . . . . . . . . . . . . . . . . . . . . . . . . . . . . . . . . . United Kingdom 3,976,260 $ 24,609,908AXA SA . . . . . . . . . . . . . . . . . . . . . . . . . . . . . . . . . . . . . . . . . . . . . . . . . . . . . . . . . . . . . . . . . . France 1,338,128 24,197,568Muenchener Rueckversicherungs-Gesellschaft AG . . . . . . . . . . . . . . . . . . . . . . . . . . . . . . . . . . . . Germany 98,161 17,716,074Swiss Re AG . . . . . . . . . . . . . . . . . . . . . . . . . . . . . . . . . . . . . . . . . . . . . . . . . . . . . . . . . . . . . . . Switzerland 352,506 25,378,429
99,704,691
Life Sciences Tools & Services 0.3%Lonza Group AG . . . . . . . . . . . . . . . . . . . . . . . . . . . . . . . . . . . . . . . . . . . . . . . . . . . . . . . . . . . . Switzerland 120,746 6,511,195
Machinery 0.8%aNavistar International Corp. . . . . . . . . . . . . . . . . . . . . . . . . . . . . . . . . . . . . . . . . . . . . . . . . . . . . United States 725,430 15,792,611
Media 6.0%Comcast Corp., Special A . . . . . . . . . . . . . . . . . . . . . . . . . . . . . . . . . . . . . . . . . . . . . . . . . . . . . . United States 872,552 31,368,244News Corp., A . . . . . . . . . . . . . . . . . . . . . . . . . . . . . . . . . . . . . . . . . . . . . . . . . . . . . . . . . . . . . . United States 610,902 15,602,437Time Warner Cable Inc. . . . . . . . . . . . . . . . . . . . . . . . . . . . . . . . . . . . . . . . . . . . . . . . . . . . . . . . United States 204,750 19,899,652Time Warner Inc. . . . . . . . . . . . . . . . . . . . . . . . . . . . . . . . . . . . . . . . . . . . . . . . . . . . . . . . . . . . . United States 420,870 20,130,212Viacom Inc., B . . . . . . . . . . . . . . . . . . . . . . . . . . . . . . . . . . . . . . . . . . . . . . . . . . . . . . . . . . . . . . United States 164,298 8,665,077The Walt Disney Co. . . . . . . . . . . . . . . . . . . . . . . . . . . . . . . . . . . . . . . . . . . . . . . . . . . . . . . . . . United States 367,850 18,315,252
113,980,874
Metals & Mining 0.3%POSCO . . . . . . . . . . . . . . . . . . . . . . . . . . . . . . . . . . . . . . . . . . . . . . . . . . . . . . . . . . . . . . . . . . . South Korea 15,450 5,069,431
Multiline Retail 0.6%Target Corp. . . . . . . . . . . . . . . . . . . . . . . . . . . . . . . . . . . . . . . . . . . . . . . . . . . . . . . . . . . . . . . . United States 191,680 11,341,706
Oil, Gas & Consumable Fuels 8.6%BP PLC . . . . . . . . . . . . . . . . . . . . . . . . . . . . . . . . . . . . . . . . . . . . . . . . . . . . . . . . . . . . . . . . . . . United Kingdom 3,119,588 21,696,277Chesapeake Energy Corp. . . . . . . . . . . . . . . . . . . . . . . . . . . . . . . . . . . . . . . . . . . . . . . . . . . . . . United States 728,380 12,105,676Chevron Corp. . . . . . . . . . . . . . . . . . . . . . . . . . . . . . . . . . . . . . . . . . . . . . . . . . . . . . . . . . . . . . . United States 195,030 21,090,544Eni SpA . . . . . . . . . . . . . . . . . . . . . . . . . . . . . . . . . . . . . . . . . . . . . . . . . . . . . . . . . . . . . . . . . . . Italy 776,759 19,023,613Galp Energia SGPS SA, B . . . . . . . . . . . . . . . . . . . . . . . . . . . . . . . . . . . . . . . . . . . . . . . . . . . . . . Portugal 857,860 13,312,697Royal Dutch Shell PLC, B . . . . . . . . . . . . . . . . . . . . . . . . . . . . . . . . . . . . . . . . . . . . . . . . . . . . . . United Kingdom 539,383 19,243,072Talisman Energy Inc. . . . . . . . . . . . . . . . . . . . . . . . . . . . . . . . . . . . . . . . . . . . . . . . . . . . . . . . . . Canada 2,121,220 24,025,900Total SA, B . . . . . . . . . . . . . . . . . . . . . . . . . . . . . . . . . . . . . . . . . . . . . . . . . . . . . . . . . . . . . . . . France 618,659 32,182,077
162,679,856
Pharmaceuticals 10.2%aForest Laboratories Inc. . . . . . . . . . . . . . . . . . . . . . . . . . . . . . . . . . . . . . . . . . . . . . . . . . . . . . . . United States 139,200 4,916,544GlaxoSmithKline PLC . . . . . . . . . . . . . . . . . . . . . . . . . . . . . . . . . . . . . . . . . . . . . . . . . . . . . . . . . United Kingdom 1,418,813 30,889,719Merck & Co. Inc. . . . . . . . . . . . . . . . . . . . . . . . . . . . . . . . . . . . . . . . . . . . . . . . . . . . . . . . . . . . . United States 666,781 27,298,014Merck KGaA . . . . . . . . . . . . . . . . . . . . . . . . . . . . . . . . . . . . . . . . . . . . . . . . . . . . . . . . . . . . . . . Germany 129,667 17,084,895Pfizer Inc. . . . . . . . . . . . . . . . . . . . . . . . . . . . . . . . . . . . . . . . . . . . . . . . . . . . . . . . . . . . . . . . . . United States 1,566,733 39,293,664Roche Holding AG . . . . . . . . . . . . . . . . . . . . . . . . . . . . . . . . . . . . . . . . . . . . . . . . . . . . . . . . . . . Switzerland 172,833 34,742,199Sanofi . . . . . . . . . . . . . . . . . . . . . . . . . . . . . . . . . . . . . . . . . . . . . . . . . . . . . . . . . . . . . . . . . . . . France 404,337 38,335,195
192,560,230
Professional Services 1.6%Adecco SA . . . . . . . . . . . . . . . . . . . . . . . . . . . . . . . . . . . . . . . . . . . . . . . . . . . . . . . . . . . . . . . . Switzerland 88,434 4,641,251Hays PLC . . . . . . . . . . . . . . . . . . . . . . . . . . . . . . . . . . . . . . . . . . . . . . . . . . . . . . . . . . . . . . . . . United Kingdom 2,280 3,105Randstad Holding NV . . . . . . . . . . . . . . . . . . . . . . . . . . . . . . . . . . . . . . . . . . . . . . . . . . . . . . . . Netherlands 708,650 26,296,064
30,940,420
Semiconductors & Semiconductor Equipment 3.5%Samsung Electronics Co. Ltd. . . . . . . . . . . . . . . . . . . . . . . . . . . . . . . . . . . . . . . . . . . . . . . . . . . . South Korea 38,670 55,334,267Taiwan Semiconductor Manufacturing Co. Ltd. . . . . . . . . . . . . . . . . . . . . . . . . . . . . . . . . . . . . . . Taiwan 3,053,585 10,190,874
65,525,141
TG-15

Franklin Templeton Variable Insurance Products TrustStatement of Investments, December 31, 2012 (continued)
Templeton Growth Securities Fund Country Shares Value
Common Stocks (continued)Software 3.4%Microsoft Corp. . . . . . . . . . . . . . . . . . . . . . . . . . . . . . . . . . . . . . . . . . . . . . . . . . . . . . . . . . . . United States 1,099,279 $ 29,383,728Nintendo Co. Ltd. . . . . . . . . . . . . . . . . . . . . . . . . . . . . . . . . . . . . . . . . . . . . . . . . . . . . . . . . . Japan 99,240 10,581,921Oracle Corp. . . . . . . . . . . . . . . . . . . . . . . . . . . . . . . . . . . . . . . . . . . . . . . . . . . . . . . . . . . . . . United States 332,460 11,077,567SAP AG . . . . . . . . . . . . . . . . . . . . . . . . . . . . . . . . . . . . . . . . . . . . . . . . . . . . . . . . . . . . . . . . . Germany 157,602 12,669,822
63,713,038
Specialty Retail 1.0%Kingfisher PLC . . . . . . . . . . . . . . . . . . . . . . . . . . . . . . . . . . . . . . . . . . . . . . . . . . . . . . . . . . . . United Kingdom 4,012,231 18,740,579
Trading Companies & Distributors 0.4%Itochu Corp. . . . . . . . . . . . . . . . . . . . . . . . . . . . . . . . . . . . . . . . . . . . . . . . . . . . . . . . . . . . . . Japan 770,990 8,137,396
Wireless Telecommunication Services 4.1%aSprint Nextel Corp. . . . . . . . . . . . . . . . . . . . . . . . . . . . . . . . . . . . . . . . . . . . . . . . . . . . . . . . . United States 4,601,360 26,089,711aTurkcell Iletisim Hizmetleri AS, ADR . . . . . . . . . . . . . . . . . . . . . . . . . . . . . . . . . . . . . . . . . . . . Turkey 1,477,723 23,850,449Vodafone Group PLC . . . . . . . . . . . . . . . . . . . . . . . . . . . . . . . . . . . . . . . . . . . . . . . . . . . . . . . United Kingdom 11,383,719 28,660,903
78,601,063
Total Common Stocks (Cost $1,713,263,190) . . . . . . . . . . . . . . . . . . . . . . . 1,849,261,462
Preferred Stocks 0.6%Metals & Mining 0.4%Vale SA, ADR, pfd., A . . . . . . . . . . . . . . . . . . . . . . . . . . . . . . . . . . . . . . . . . . . . . . . . . . . . . . Brazil 372,875 7,569,362
Oil, Gas & Consumable Fuels 0.2%Petroleo Brasileiro SA, ADR, pfd. . . . . . . . . . . . . . . . . . . . . . . . . . . . . . . . . . . . . . . . . . . . . . . Brazil 172,602 3,331,219
Total Preferred Stocks (Cost $11,833,237) . . . . . . . . . . . . . . . . . . . . . . . . . . 10,900,581
Non-Registered Mutual Funds (Cost $11,935,000) 0.7%Diversified Financial Services 0.7%
a,b,c,dTempleton China Opportunities Fund Ltd., Reg D . . . . . . . . . . . . . . . . . . . . . . . . . . . . . . . . . . Cayman Islands 1,194,518 13,689,174
Total Investments before Short Term Investments(Cost $1,737,031,427) . . . . . . . . . . . . . . . . . . . . . . . . . . . . . . . . . . . . . . . . . . . . 1,873,851,217
PrincipalAmount
Short Term Investments (Cost $26,000,000) 1.4%Time Deposits 1.4%Royal Bank of Canada, 0.05%, 1/02/13 . . . . . . . . . . . . . . . . . . . . . . . . . . . . . . . . . . . . . . . . . United States $26,000,000 26,000,000
Total Investments (Cost $1,763,031,427) 100.2% . . . . . . . . . . . . . . . . . . 1,899,851,217
Other Assets, less Liabilities (0.2)% . . . . . . . . . . . . . . . . . . . . . . . . . . . . . . . . (3,184,901)
Net Assets 100.0% . . . . . . . . . . . . . . . . . . . . . . . . . . . . . . . . . . . . . . . . . . . . . . . . . . $1,896,666,316
See abbreviations on page TG-30.
aNon-income producing.bSee Note 1(c) regarding investment in Templeton China Opportunities Fund, Ltd.cSee Note 8 regarding restricted securities.dSee Note 9 regarding holdings of 5% voting securities.
The accompanying notes are an integral part of these financial statements.TG-16

Franklin Templeton Variable Insurance Products Trust
Financial Statements
Statement of Assets and LiabilitiesDecember 31, 2012
TempletonGrowth
Securities Fund
Assets:Investments in securities:
Cost - Unaffiliated issuers . . . . . . . . . . . . . . . . . . . . . . . . . . . . . . . . . . . . . . . . . . . . . . . . . . . . . . . . . . . . . . . . . . . . . . . . . . . . . $1,751,096,427Cost - Non-controlled affiliated issuers (Note 9) . . . . . . . . . . . . . . . . . . . . . . . . . . . . . . . . . . . . . . . . . . . . . . . . . . . . . . . . . . . 11,935,000
Total cost of investments . . . . . . . . . . . . . . . . . . . . . . . . . . . . . . . . . . . . . . . . . . . . . . . . . . . . . . . . . . . . . . . . . . . . . . . . . . . . . . $1,763,031,427
Value - Unaffiliated issuers . . . . . . . . . . . . . . . . . . . . . . . . . . . . . . . . . . . . . . . . . . . . . . . . . . . . . . . . . . . . . . . . . . . . . . . . . . . . $1,886,162,043Value - Non-controlled affiliated issuers (Note 9) . . . . . . . . . . . . . . . . . . . . . . . . . . . . . . . . . . . . . . . . . . . . . . . . . . . . . . . . . . 13,689,174
Total value of investments . . . . . . . . . . . . . . . . . . . . . . . . . . . . . . . . . . . . . . . . . . . . . . . . . . . . . . . . . . . . . . . . . . . . . . . . . . . . . 1,899,851,217Cash . . . . . . . . . . . . . . . . . . . . . . . . . . . . . . . . . . . . . . . . . . . . . . . . . . . . . . . . . . . . . . . . . . . . . . . . . . . . . . . . . . . . . . . . . . . . . . . . . 431,212Receivables:
Capital shares sold . . . . . . . . . . . . . . . . . . . . . . . . . . . . . . . . . . . . . . . . . . . . . . . . . . . . . . . . . . . . . . . . . . . . . . . . . . . . . . . . . . . 162,634Dividends and interest . . . . . . . . . . . . . . . . . . . . . . . . . . . . . . . . . . . . . . . . . . . . . . . . . . . . . . . . . . . . . . . . . . . . . . . . . . . . . . . . 2,695,418
Other assets . . . . . . . . . . . . . . . . . . . . . . . . . . . . . . . . . . . . . . . . . . . . . . . . . . . . . . . . . . . . . . . . . . . . . . . . . . . . . . . . . . . . . . . . . . . 61
Total assets . . . . . . . . . . . . . . . . . . . . . . . . . . . . . . . . . . . . . . . . . . . . . . . . . . . . . . . . . . . . . . . . . . . . . . . . . . . . . . . . . . . . . . 1,903,140,542
Liabilities:Payables:
Investment securities purchased . . . . . . . . . . . . . . . . . . . . . . . . . . . . . . . . . . . . . . . . . . . . . . . . . . . . . . . . . . . . . . . . . . . . . . . . 883,672Capital shares redeemed . . . . . . . . . . . . . . . . . . . . . . . . . . . . . . . . . . . . . . . . . . . . . . . . . . . . . . . . . . . . . . . . . . . . . . . . . . . . . . 2,787,099Affiliates . . . . . . . . . . . . . . . . . . . . . . . . . . . . . . . . . . . . . . . . . . . . . . . . . . . . . . . . . . . . . . . . . . . . . . . . . . . . . . . . . . . . . . . . . . . 2,304,855Reports to shareholders . . . . . . . . . . . . . . . . . . . . . . . . . . . . . . . . . . . . . . . . . . . . . . . . . . . . . . . . . . . . . . . . . . . . . . . . . . . . . . . 373,231
Accrued expenses and other liabilities . . . . . . . . . . . . . . . . . . . . . . . . . . . . . . . . . . . . . . . . . . . . . . . . . . . . . . . . . . . . . . . . . . . . . 125,369
Total liabilities . . . . . . . . . . . . . . . . . . . . . . . . . . . . . . . . . . . . . . . . . . . . . . . . . . . . . . . . . . . . . . . . . . . . . . . . . . . . . . . . . . . . 6,474,226
Net assets, at value . . . . . . . . . . . . . . . . . . . . . . . . . . . . . . . . . . . . . . . . . . . . . . . . . . . . . . . . . . . . . . . . . . . . . . . . . . . . . . $1,896,666,316
Net assets consist of:Paid-in capital . . . . . . . . . . . . . . . . . . . . . . . . . . . . . . . . . . . . . . . . . . . . . . . . . . . . . . . . . . . . . . . . . . . . . . . . . . . . . . . . . . . . . . . . . $1,999,113,705Undistributed net investment income . . . . . . . . . . . . . . . . . . . . . . . . . . . . . . . . . . . . . . . . . . . . . . . . . . . . . . . . . . . . . . . . . . . . . . 54,035,591Net unrealized appreciation (depreciation) . . . . . . . . . . . . . . . . . . . . . . . . . . . . . . . . . . . . . . . . . . . . . . . . . . . . . . . . . . . . . . . . . . 136,855,890Accumulated net realized gain (loss) . . . . . . . . . . . . . . . . . . . . . . . . . . . . . . . . . . . . . . . . . . . . . . . . . . . . . . . . . . . . . . . . . . . . . . . (293,338,870)
Net assets, at value . . . . . . . . . . . . . . . . . . . . . . . . . . . . . . . . . . . . . . . . . . . . . . . . . . . . . . . . . . . . . . . . . . . . . . . . . . . . . . $1,896,666,316
The accompanying notes are an integral part of these financial statements. TG-17

Franklin Templeton Variable Insurance Products Trust
Financial Statements (continued)
Statement of Assets and Liabilities (continued)December 31, 2012
TempletonGrowth
Securities Fund
Class 1:Net assets, at value . . . . . . . . . . . . . . . . . . . . . . . . . . . . . . . . . . . . . . . . . . . . . . . . . . . . . . . . . . . . . . . . . . . . . . . . . . . . . . . . . . . . $ 476,954,253
Shares outstanding . . . . . . . . . . . . . . . . . . . . . . . . . . . . . . . . . . . . . . . . . . . . . . . . . . . . . . . . . . . . . . . . . . . . . . . . . . . . . . . . . . . . . 39,231,294
Net asset value and maximum offering price per share . . . . . . . . . . . . . . . . . . . . . . . . . . . . . . . . . . . . . . . . . . . . . . . . . . . . . . . . $ 12.16
Class 2:Net assets, at value . . . . . . . . . . . . . . . . . . . . . . . . . . . . . . . . . . . . . . . . . . . . . . . . . . . . . . . . . . . . . . . . . . . . . . . . . . . . . . . . . . . . $1,352,554,115
Shares outstanding . . . . . . . . . . . . . . . . . . . . . . . . . . . . . . . . . . . . . . . . . . . . . . . . . . . . . . . . . . . . . . . . . . . . . . . . . . . . . . . . . . . . . 112,970,230
Net asset value and maximum offering price per share . . . . . . . . . . . . . . . . . . . . . . . . . . . . . . . . . . . . . . . . . . . . . . . . . . . . . . . . $ 11.97
Class 4:Net assets, at value . . . . . . . . . . . . . . . . . . . . . . . . . . . . . . . . . . . . . . . . . . . . . . . . . . . . . . . . . . . . . . . . . . . . . . . . . . . . . . . . . . . . $ 67,157,948
Shares outstanding . . . . . . . . . . . . . . . . . . . . . . . . . . . . . . . . . . . . . . . . . . . . . . . . . . . . . . . . . . . . . . . . . . . . . . . . . . . . . . . . . . . . . 5,563,777
Net asset value and maximum offering price per share . . . . . . . . . . . . . . . . . . . . . . . . . . . . . . . . . . . . . . . . . . . . . . . . . . . . . . . . $ 12.07
The accompanying notes are an integral part of these financial statements.TG-18

Franklin Templeton Variable Insurance Products Trust
Financial Statements (continued)
Statement of Operationsfor the year ended December 31, 2012
TempletonGrowth
Securities Fund
Investment income:Dividends (net of foreign taxes $5,567,047) . . . . . . . . . . . . . . . . . . . . . . . . . . . . . . . . . . . . . . . . . . . . . . . . . . . . . . . . . . . . . . . . . $ 75,236,783Interest . . . . . . . . . . . . . . . . . . . . . . . . . . . . . . . . . . . . . . . . . . . . . . . . . . . . . . . . . . . . . . . . . . . . . . . . . . . . . . . . . . . . . . . . . . . . . . . 53,195Income from securities loaned . . . . . . . . . . . . . . . . . . . . . . . . . . . . . . . . . . . . . . . . . . . . . . . . . . . . . . . . . . . . . . . . . . . . . . . . . . . . 2,601,913
Total investment income . . . . . . . . . . . . . . . . . . . . . . . . . . . . . . . . . . . . . . . . . . . . . . . . . . . . . . . . . . . . . . . . . . . . . . . . . . . . 77,891,891
Expenses:Management fees (Note 3a) . . . . . . . . . . . . . . . . . . . . . . . . . . . . . . . . . . . . . . . . . . . . . . . . . . . . . . . . . . . . . . . . . . . . . . . . . . . . . . 18,785,943Distribution fees: (Note 3c)
Class 2 . . . . . . . . . . . . . . . . . . . . . . . . . . . . . . . . . . . . . . . . . . . . . . . . . . . . . . . . . . . . . . . . . . . . . . . . . . . . . . . . . . . . . . . . . . . 3,248,515Class 4 . . . . . . . . . . . . . . . . . . . . . . . . . . . . . . . . . . . . . . . . . . . . . . . . . . . . . . . . . . . . . . . . . . . . . . . . . . . . . . . . . . . . . . . . . . . 217,813
Unaffiliated transfer agent fees . . . . . . . . . . . . . . . . . . . . . . . . . . . . . . . . . . . . . . . . . . . . . . . . . . . . . . . . . . . . . . . . . . . . . . . . . . . . 1,232Custodian fees (Note 4) . . . . . . . . . . . . . . . . . . . . . . . . . . . . . . . . . . . . . . . . . . . . . . . . . . . . . . . . . . . . . . . . . . . . . . . . . . . . . . . . . . 260,580Reports to shareholders . . . . . . . . . . . . . . . . . . . . . . . . . . . . . . . . . . . . . . . . . . . . . . . . . . . . . . . . . . . . . . . . . . . . . . . . . . . . . . . . . . 363,995Professional fees . . . . . . . . . . . . . . . . . . . . . . . . . . . . . . . . . . . . . . . . . . . . . . . . . . . . . . . . . . . . . . . . . . . . . . . . . . . . . . . . . . . . . . . . 131,200Trustees’ fees and expenses . . . . . . . . . . . . . . . . . . . . . . . . . . . . . . . . . . . . . . . . . . . . . . . . . . . . . . . . . . . . . . . . . . . . . . . . . . . . . . 10,637Other . . . . . . . . . . . . . . . . . . . . . . . . . . . . . . . . . . . . . . . . . . . . . . . . . . . . . . . . . . . . . . . . . . . . . . . . . . . . . . . . . . . . . . . . . . . . . . . . . 58,700
Total expenses . . . . . . . . . . . . . . . . . . . . . . . . . . . . . . . . . . . . . . . . . . . . . . . . . . . . . . . . . . . . . . . . . . . . . . . . . . . . . . . . . . . . . 23,078,615Expense reductions (Note 4) . . . . . . . . . . . . . . . . . . . . . . . . . . . . . . . . . . . . . . . . . . . . . . . . . . . . . . . . . . . . . . . . . . . . . . . . . (199)
Net expenses . . . . . . . . . . . . . . . . . . . . . . . . . . . . . . . . . . . . . . . . . . . . . . . . . . . . . . . . . . . . . . . . . . . . . . . . . . . . . . . . . . . 23,078,416
Net investment income . . . . . . . . . . . . . . . . . . . . . . . . . . . . . . . . . . . . . . . . . . . . . . . . . . . . . . . . . . . . . . . . . . . . . . . . . 54,813,475
Realized and unrealized gains (losses):Net realized gain (loss) from:
Investments (includes gains from a redemption in-kind of $18,346,694) (Note 11) . . . . . . . . . . . . . . . . . . . . . . . . . . . . . . . 52,542,423Foreign currency transactions . . . . . . . . . . . . . . . . . . . . . . . . . . . . . . . . . . . . . . . . . . . . . . . . . . . . . . . . . . . . . . . . . . . . . . . . . . . (507,903)
Net realized gain (loss) . . . . . . . . . . . . . . . . . . . . . . . . . . . . . . . . . . . . . . . . . . . . . . . . . . . . . . . . . . . . . . . . . . . . . . . . . 52,034,520
Net change in unrealized appreciation (depreciation) on:Investments . . . . . . . . . . . . . . . . . . . . . . . . . . . . . . . . . . . . . . . . . . . . . . . . . . . . . . . . . . . . . . . . . . . . . . . . . . . . . . . . . . . . . . . . . 384,754,033Translation of other assets and liabilities denominated in foreign currencies . . . . . . . . . . . . . . . . . . . . . . . . . . . . . . . . . . . . 109,661
Net change in unrealized appreciation (depreciation) . . . . . . . . . . . . . . . . . . . . . . . . . . . . . . . . . . . . . . . . . . . . . . . . 384,863,694
Net realized and unrealized gain (loss) . . . . . . . . . . . . . . . . . . . . . . . . . . . . . . . . . . . . . . . . . . . . . . . . . . . . . . . . . . . . . . . . . . . . . . . . 436,898,214
Net increase (decrease) in net assets resulting from operations . . . . . . . . . . . . . . . . . . . . . . . . . . . . . . . . . . . . . . . . . . . . . . . . . . . . $491,711,689
The accompanying notes are an integral part of these financial statements. TG-19

Franklin Templeton Variable Insurance Products Trust
Financial Statements (continued)
Statements of Changes in Net Assets
Templeton GrowthSecurities Fund
Year Ended December 31,2012 2011
Increase (decrease) in net assets:Operations:
Net investment income . . . . . . . . . . . . . . . . . . . . . . . . . . . . . . . . . . . . . . . . . . . . . . . . . . . . . . . . . . . . . . $ 54,813,475 $ 60,824,912Net realized gain (loss) from investments and foreign currency transactions . . . . . . . . . . . . . . . . . . . 52,034,520 119,363,548Net change in unrealized appreciation (depreciation) on investments and translation of other
assets and liabilities denominated in foreign currencies . . . . . . . . . . . . . . . . . . . . . . . . . . . . . . . . . . 384,863,694 (404,407,949)
Net increase (decrease) in net assets resulting from operations . . . . . . . . . . . . . . . . . . . . . . . . . . . 491,711,689 (224,219,489)
Distributions to shareholders from:Net investment income:
Class 1 . . . . . . . . . . . . . . . . . . . . . . . . . . . . . . . . . . . . . . . . . . . . . . . . . . . . . . . . . . . . . . . . . . . . . . . . . (30,925,492) (23,962,804)Class 2 . . . . . . . . . . . . . . . . . . . . . . . . . . . . . . . . . . . . . . . . . . . . . . . . . . . . . . . . . . . . . . . . . . . . . . . . . (26,587,764) (19,367,342)Class 4 . . . . . . . . . . . . . . . . . . . . . . . . . . . . . . . . . . . . . . . . . . . . . . . . . . . . . . . . . . . . . . . . . . . . . . . . . (1,228,892) (766,075)
Total distributions to shareholders . . . . . . . . . . . . . . . . . . . . . . . . . . . . . . . . . . . . . . . . . . . . . . . . . . . . . . . (58,742,148) (44,096,221)
Capital share transactions: (Note 2)Class 1 . . . . . . . . . . . . . . . . . . . . . . . . . . . . . . . . . . . . . . . . . . . . . . . . . . . . . . . . . . . . . . . . . . . . . . . . . (922,021,789) 15,269,781Class 2 . . . . . . . . . . . . . . . . . . . . . . . . . . . . . . . . . . . . . . . . . . . . . . . . . . . . . . . . . . . . . . . . . . . . . . . . . (125,611,247) (272,568,653)Class 4 . . . . . . . . . . . . . . . . . . . . . . . . . . . . . . . . . . . . . . . . . . . . . . . . . . . . . . . . . . . . . . . . . . . . . . . . . 284,692 582,974
Total capital share transactions . . . . . . . . . . . . . . . . . . . . . . . . . . . . . . . . . . . . . . . . . . . . . . . . . . . . . . . . . . (1,047,348,344) (256,715,898)
Net increase (decrease) in net assets . . . . . . . . . . . . . . . . . . . . . . . . . . . . . . . . . . . . . . . . . . . . . . . . . (614,378,803) (525,031,608)Net assets:
Beginning of year . . . . . . . . . . . . . . . . . . . . . . . . . . . . . . . . . . . . . . . . . . . . . . . . . . . . . . . . . . . . . . . . . . . . . 2,511,045,119 3,036,076,727
End of year . . . . . . . . . . . . . . . . . . . . . . . . . . . . . . . . . . . . . . . . . . . . . . . . . . . . . . . . . . . . . . . . . . . . . . . . . . $ 1,896,666,316 $2,511,045,119
Undistributed net investment income included in net assets:End of year . . . . . . . . . . . . . . . . . . . . . . . . . . . . . . . . . . . . . . . . . . . . . . . . . . . . . . . . . . . . . . . . . . . . . . . . . . $ 54,035,591 $ 58,485,038
The accompanying notes are an integral part of these financial statements.TG-20

Franklin Templeton Variable Insurance Products Trust
Notes to Financial Statements
Templeton Growth Securities Fund
1. ORGANIZATION AND SIGNIFICANT ACCOUNTING POLICIES
Franklin Templeton Variable Insurance Products Trust (Trust) is registered under the Investment Company Act of 1940, asamended, (1940 Act) as an open-end investment company, consisting of twenty separate funds. The Templeton GrowthSecurities Fund (Fund) is included in this report. The financial statements of the remaining funds in the Trust are presentedseparately. Shares of the Fund are generally sold only to insurance company separate accounts to fund the benefits of variable lifeinsurance policies or variable annuity contracts. Investment activities of these insurance company separate accounts could have amaterial impact on the Fund. The Fund offers, three classes of shares: Class 1, Class 2 and Class 4. Each class of shares differs byits distribution fees, voting rights on matters affecting a single class and its exchange privilege.
The following summarizes the Fund’s significant accounting policies.
a. Financial Instrument Valuation
The Fund’s investments in financial instruments are carried at fair value daily. Fair value is the price that would be received tosell an asset or paid to transfer a liability in an orderly transaction between market participants on the measurement date. Underprocedures approved by the Trust’s Board of Trustees (the Board), the Fund’s administrator, investment manager and otheraffiliates have formed the Valuation and Liquidity Oversight Committee (VLOC). The VLOC provides administration andoversight of the Fund’s valuation policies and procedures, which are approved annually by the Board. Among other things, theseprocedures allow the Fund to utilize independent pricing services, quotations from securities and financial instrument dealers,and other market sources to determine fair value.
Equity securities listed on an exchange or on the NASDAQ National Market System are valued at the last quoted sale price or theofficial closing price of the day, respectively. Foreign equity securities are valued as of the close of trading on the foreign stockexchange on which the security is primarily traded, or the NYSE, whichever is earlier. The value is then converted into its U.S.dollar equivalent at the foreign exchange rate in effect at the close of the NYSE on the day that the value of the security isdetermined. Over-the-counter (OTC) securities are valued within the range of the most recent quoted bid and ask prices.Securities that trade in multiple markets or on multiple exchanges are valued according to the broadest and most representativemarket. Certain equity securities are valued based upon fundamental characteristics or relationships to similar securities.
Debt securities generally trade in the OTC market rather than on a securities exchange. The Fund’s pricing services use multiplevaluation techniques to determine fair value. In instances where sufficient market activity exists, the pricing services may utilize amarket-based approach through which quotes from market makers are used to determine fair value. In instances where sufficientmarket activity may not exist or is limited, the pricing services also utilize proprietary valuation models which may considermarket characteristics such as benchmark yield curves, credit spreads, estimated default rates, anticipated market interest ratevolatility, coupon rates, anticipated timing of principal repayments, underlying collateral, and other unique security features inorder to estimate the relevant cash flows, which are then discounted to calculate the fair value. Securities denominated in aforeign currency are converted into their U.S. dollar equivalent at the foreign exchange rate in effect at the close of the NYSE onthe date that the values of the foreign debt securities are determined. Time deposits are valued at cost, which approximatesmarket value.
The Fund has procedures to determine the fair value of financial instruments for which market prices are not reliable or readilyavailable. Under these procedures, the VLOC convenes on a regular basis to review such financial instruments and considers anumber of factors, including significant unobservable valuation inputs, when arriving at fair value. The VLOC primarily employsa market-based approach which may use related or comparable assets or liabilities, recent transactions, market multiples, bookvalues, and other relevant information for the investment to determine the fair value of the investment. An income-basedvaluation approach may also be used in which the anticipated future cash flows of the investment are discounted to calculate fairvalue. Discounts may also be applied due to the nature or duration of any restrictions on the disposition of the investments. Dueto the inherent uncertainty of valuations of such investments, the fair values may differ significantly from the values that wouldhave been used had an active market existed. The VLOC employs various methods for calibrating these valuation approaches
TG-21

Franklin Templeton Variable Insurance Products Trust
Notes to Financial Statements (continued)
Templeton Growth Securities Fund
1. ORGANIZATION AND SIGNIFICANT ACCOUNTING POLICIES (continued)
a. Financial Instrument Valuation (continued)
including a regular review of key inputs and assumptions, transactional back-testing or disposition analysis, and reviews of anyrelated market activity.
Trading in securities on foreign securities stock exchanges and OTC markets may be completed before the daily close of businesson the NYSE. Occasionally, events occur between the time at which trading in a foreign security is completed and the close of theNYSE that might call into question the reliability of the value of a portfolio security held by the Fund. As a result, differencesmay arise between the value of the Fund’s portfolio securities as determined at the foreign market close and the latest indicationsof value at the close of the NYSE. In order to minimize the potential for these differences, the VLOC monitors price movementsfollowing the close of trading in foreign stock markets through a series of country specific market proxies (such as baskets ofAmerican Depositary Receipts, futures contracts and exchange traded funds). These price movements are measured againstestablished trigger thresholds for each specific market proxy to assist in determining if an event has occurred that may call intoquestion the reliability of the values of the foreign securities held by the Fund. If such an event occurs, the securities may bevalued using fair value procedures, which may include the use of independent pricing services. At December 31, 2012, a marketevent occurred resulting in a portion of the securities held by the Fund being valued using fair value procedures.
b. Foreign Currency Translation
Portfolio securities and other assets and liabilities denominated in foreign currencies are translated into U.S. dollars based on theexchange rate of such currencies against U.S. dollars on the date of valuation. The Fund may enter into foreign currencyexchange contracts to facilitate transactions denominated in a foreign currency. Purchases and sales of securities, income andexpense items denominated in foreign currencies are translated into U.S. dollars at the exchange rate in effect on the transactiondate. Portfolio securities and assets and liabilities denominated in foreign currencies contain risks that those currencies willdecline in value relative to the U.S. dollar. Occasionally, events may impact the availability or reliability of foreign exchange ratesused to convert the U.S. dollar equivalent value. If such an event occurs, the foreign exchange rate will be valued at fair valueusing procedures established and approved by the Board.
The Fund does not separately report the effect of changes in foreign exchange rates from changes in market prices on securitiesheld. Such changes are included in net realized and unrealized gain or loss from investments on the Statement of Operations.
Realized foreign exchange gains or losses arise from sales of foreign currencies, currency gains or losses realized between thetrade and settlement dates on securities transactions and the difference between the recorded amounts of dividends, interest, andforeign withholding taxes and the U.S. dollar equivalent of the amounts actually received or paid. Net unrealized foreignexchange gains and losses arise from changes in foreign exchange rates on foreign denominated assets and liabilities other thaninvestments in securities held at the end of the reporting period.
c. Investment in Templeton China Opportunities Fund, Ltd.
The Fund invests in Templeton China Opportunities Fund, Ltd. (China Fund), a private offering of unregistered shares in aCayman Islands Exempt Company. The China Fund investment objective is to seek capital growth primarily throughinvestments in A-shares of Chinese companies listed on the Shanghai and Shenzhen stock exchanges. Chinese A-shares aretraded in Chinese Renminbi and are only available as an investment to domestic (Chinese) investors and holders of a QualifiedForeign Institutional Investors license. The China Fund is managed by Templeton Investment Counsel, LLC (an affiliate of theinvestment manager). No additional management or administrative fees are incurred on assets invested in the China Fund.
The China Fund may be subject to certain restrictions and administrative processes relating to its ability to repatriate cashbalances, investment proceeds and earnings associated with its investment, as such activities are subject to approval by agencies
TG-22
Franklin Templeton Variable Insurance Products Trust
Notes to Financial Statements (continued)
Templeton Growth Securities Fund
1. ORGANIZATION AND SIGNIFICANT ACCOUNTING POLICIES (continued)
c. Investment in Templeton China Opportunities Fund, Ltd. (continued)
of the Chinese government and thus the Fund may incur delays in redeeming its investment in the China Fund. The Fund’sinvestment in the China Fund is valued based upon the fair value of the China Fund’s portfolio securities and other assets andliabilities.
d. Securities Lending
The Fund participates in an agency based securities lending program. The Fund receives cash collateral against the loanedsecurities in an amount equal to at least 102% of the market value of the loaned securities. Collateral is maintained over the lifeof the loan in an amount not less than 100% of the market value of loaned securities, as determined at the close of fund businesseach day; any additional collateral required due to changes in security values is delivered to the Fund on the next businessday. The collateral is invested in a non-registered money fund. The Fund receives income from the investment of cash collateral,in addition to lending fees and rebates paid by the borrower. The Fund bears the market risk with respect to the collateralinvestment, securities loaned, and the risk that the agent may default on its obligations to the Fund. The securities lending agenthas agreed to indemnify the Fund in the event of default by a third party borrower. At December 31, 2012, the Fund had nosecurities on loan.
e. Income and Deferred Taxes
It is the Fund’s policy to qualify as a regulated investment company under the Internal Revenue Code. The Fund intends todistribute to shareholders substantially all of its taxable income and net realized gains to relieve it from federal income and excisetaxes. As a result, no provision for U.S. federal income taxes is required.
The Fund may be subject to foreign taxation related to income received, capital gains on the sale of securities and certain foreigncurrency transactions in the foreign jurisdictions in which it invests. Foreign taxes, if any, are recorded based on the taxregulations and rates that exist in the foreign markets in which the Fund invests. When a capital gain tax is determined to applythe Fund records an estimated deferred tax liability in an amount that would be payable if the securities were disposed of on thevaluation date.
The Fund recognizes the tax benefits of uncertain tax positions only when the position is “more likely than not” to be sustainedupon examination by the tax authorities based on the technical merits of the tax position. As of December 31, 2012, and for allopen tax years, the Fund has determined that no liability for unrecognized tax benefits is required in the Fund’s financialstatements related to uncertain tax positions taken on a tax return (or expected to be taken on future tax returns). Open tax yearsare those that remain subject to examination and are based on each tax jurisdiction statute of limitation.
f. Security Transactions, Investment Income, Expenses and Distributions
Security transactions are accounted for on trade date. Realized gains and losses on security transactions are determined on aspecific identification basis. Interest income and estimated expenses are accrued daily. Amortization of premium and accretion ofdiscount on debt securities are included in interest income. Dividend income is recorded on the ex-dividend date except thatcertain dividends from foreign securities are recognized as soon as the Fund is notified of the ex-dividend date. Distributions toshareholders are recorded on the ex-dividend date and are determined according to income tax regulations (tax basis).Distributable earnings determined on a tax basis may differ from earnings recorded in accordance with accounting principlesgenerally accepted in the United States of America. These differences may be permanent or temporary. Permanent differences arereclassified among capital accounts to reflect their tax character. These reclassifications have no impact on net assets or theresults of operations. Temporary differences are not reclassified, as they may reverse in subsequent periods.
TG-23

Franklin Templeton Variable Insurance Products Trust
Notes to Financial Statements (continued)
Templeton Growth Securities Fund
1. ORGANIZATION AND SIGNIFICANT ACCOUNTING POLICIES (continued)
f. Security Transactions, Investment Income, Expenses and Distributions (continued)
Common expenses incurred by the Trust are allocated among the funds based on the ratio of net assets of each fund to thecombined net assets of the Trust. Fund specific expenses are charged directly to the fund that incurred the expense.
Realized and unrealized gains and losses and net investment income, not including class specific expenses, are allocated daily toeach class of shares based upon the relative proportion of net assets of each class. Differences in per share distributions, by class,are generally due to differences in class specific expenses.
g. Accounting Estimates
The preparation of financial statements in accordance with accounting principles generally accepted in the United States ofAmerica requires management to make estimates and assumptions that affect the reported amounts of assets and liabilities at thedate of the financial statements and the amounts of income and expenses during the reporting period. Actual results could differfrom those estimates.
h. Guarantees and Indemnifications
Under the Trust’s organizational documents, its officers and trustees are indemnified by the Trust against certain liabilities arisingout of the performance of their duties to the Trust. Additionally, in the normal course of business, the Trust, on behalf of theFund, enters into contracts with service providers that contain general indemnification clauses. The Trust’s maximum exposureunder these arrangements is unknown as this would involve future claims that may be made against the Trust that have not yetoccurred. Currently, the Trust expects the risk of loss to be remote.
2. SHARES OF BENEFICIAL INTEREST
At December 31, 2012, there were an unlimited number of shares authorized (without par value). Transactions in the Fund’sshares were as follows:
Year Ended December 31,
2012 2011
Class 1 Shares: Shares Amount Shares Amount
Shares sold . . . . . . . . . . . . . . . . . . . . . . . . . . . . . . . . . . . . . . . . . . . . . . . . . . . . . . . . . . 39,146,115 $ 423,930,779 64,351,377 $ 689,220,432Shares issued in reinvestment of distributions . . . . . . . . . . . . . . . . . . . . . . . . . . . . . . . . . 3,052,862 30,925,492 2,081,912 23,962,804Shares redeemed in-kind (Note 11) . . . . . . . . . . . . . . . . . . . . . . . . . . . . . . . . . . . . . . . . (90,515,836) (1,060,908,757) (62,046) (778,675)Shares redeemed . . . . . . . . . . . . . . . . . . . . . . . . . . . . . . . . . . . . . . . . . . . . . . . . . . . . . . (29,409,088) (315,969,303) (69,960,205) (697,134,780)
Net increase (decrease) . . . . . . . . . . . . . . . . . . . . . . . . . . . . . . . . . . . . . . . . . . . . . . . . . (77,725,947) $ (922,021,789) (3,588,962) $ 15,269,781
Class 2 Shares:Shares sold . . . . . . . . . . . . . . . . . . . . . . . . . . . . . . . . . . . . . . . . . . . . . . . . . . . . . . . . . . 9,278,139 $ 99,327,364 8,669,643 $ 93,168,510Shares issued in reinvestment of distributions . . . . . . . . . . . . . . . . . . . . . . . . . . . . . . . . . 2,661,438 26,587,764 1,706,374 19,367,342Shares redeemed in-kind (Note 11) . . . . . . . . . . . . . . . . . . . . . . . . . . . . . . . . . . . . . . . . — — (7,322,431) (90,358,797)Shares redeemed . . . . . . . . . . . . . . . . . . . . . . . . . . . . . . . . . . . . . . . . . . . . . . . . . . . . . . (23,060,322) (251,526,375) (26,665,336) (294,745,708)
Net increase (decrease) . . . . . . . . . . . . . . . . . . . . . . . . . . . . . . . . . . . . . . . . . . . . . . . . . (11,120,745) $ (125,611,247) (23,611,750) $(272,568,653)
TG-24
Franklin Templeton Variable Insurance Products Trust
Notes to Financial Statements (continued)
Templeton Growth Securities Fund
2. SHARES OF BENEFICIAL INTEREST (continued)
Year Ended December 31,
2012 2011
Class 4 Shares: Shares Amount Shares Amount
Shares sold . . . . . . . . . . . . . . . . . . . . . . . . . . . . . . . . . . . . . . . . . . . . . . . . . . . . . . . . . . . . . . . . . . . . 712,668 $ 7,687,691 552,161 $ 6,020,586Shares issued on reinvestment of distributions . . . . . . . . . . . . . . . . . . . . . . . . . . . . . . . . . . . . . . . . . . . 121,914 1,228,892 66,906 766,075Shares redeemed . . . . . . . . . . . . . . . . . . . . . . . . . . . . . . . . . . . . . . . . . . . . . . . . . . . . . . . . . . . . . . . . (782,111) (8,631,891) (559,011) (6,203,687)
Net increase (decrease) . . . . . . . . . . . . . . . . . . . . . . . . . . . . . . . . . . . . . . . . . . . . . . . . . . . . . . . . . . . 52,471 $ 284,692 60,056 $ 582,974
3. TRANSACTIONS WITH AFFILIATES
Franklin Resources, Inc. is the holding company for various subsidiaries that together are referred to as Franklin TempletonInvestments. Certain officers and trustees of the Fund are also officers and/or directors of the following subsidiaries:
Subsidiary Affiliation
Templeton Global Advisors Limited (TGAL) Investment managerFranklin Templeton Services, LLC (FT Services) Administrative managerFranklin Templeton Distributors, Inc. (Distributors) Principal underwriterFranklin Templeton Investor Services, LLC (Investor Services) Transfer agent
a. Management Fees
The Fund pays an investment management fee to TGAL based on the average daily net assets of the Fund as follows:
Annualized Fee Rate Net Assets
1.000% Up to and including $100 million0.900% over $100 million, up to and including $250 million0.800% over $250 million, up to and including $500 million0.750% over $500 million, up to and including $1 billion0.700% over $1 billion, up to and including $5 billion0.675% over $5 billion, up to and including $10 billion0.655% over $10 billion, up to and including $15 billion0.635% over $15 billion, up to and including $20 billion0.615% In excess of $20 billion
b. Administrative Fees
FT Services, under terms of an agreement, provides administrative services to the Fund and is not paid by the Fund for theservices.
c. Distribution Fees
The Board has adopted distribution plans for Class 2 and Class 4 shares pursuant to Rule 12b-1 under the 1940 Act. Under theFund’s compensation distribution plans, the Fund pays Distributors for costs incurred in connection with the servicing, sale anddistribution of the Fund’s shares up to 0.35% per year of its average daily net assets of each class. Some distribution fees are notcharged on shares held by affiliates. The Board has agreed to limit the current rate to 0.25% per year for Class 2.
TG-25

Franklin Templeton Variable Insurance Products Trust
Notes to Financial Statements (continued)
Templeton Growth Securities Fund
3. TRANSACTIONS WITH AFFILIATES (continued)
d. Transfer Agent Fees
Investor Services, under terms of an agreement, performs shareholder servicing for the Fund and is not paid by the Fund for theservices.
e. Other Affiliated Transactions
At December 31, 2012, Franklin Templeton Variable Insurance Products Trust – Franklin Templeton VIP Founding FundsAllocation Fund owned 16.71% of the Fund’s outstanding shares. Investment activities of this investment company could have amaterial impact on the Fund.
4. EXPENSE OFFSET ARRANGEMENT
The Fund has entered into an arrangement with its custodian whereby credits realized as a result of uninvested cash balances areused to reduce a portion of the Fund’s custodian expenses. During the year ended December 31, 2012, the custodian fees werereduced as noted in the Statement of Operations.
5. INCOME TAXES
For tax purposes, capital losses may be carried over to offset future capital gains, if any. Capital loss carryforwards with noexpiration, if any, must be fully utilized before those losses with expiration dates.
At December 31, 2012, capital loss carryforwards were as follows:
Capital loss carryforwards expiring in:2017 . . . . . . . . . . . . . . . . . . . . . . . . . . . . . . . . . . . . . . . . . . . . . . . . . . . $215,277,2252018 . . . . . . . . . . . . . . . . . . . . . . . . . . . . . . . . . . . . . . . . . . . . . . . . . . . 55,299,629
$270,576,854
During the year ended December 31, 2012, the Fund utilized $25,377,477 of capital loss carryforwards.
The tax character of distributions paid during the years ended December 31, 2012 and 2011, was as follows:
2012 2011
Distributions paid from ordinary income . . . . . . . . . . . . . . . . $58,742,148 $44,096,221
At December 31, 2012, the cost of investments, net unrealized appreciation (depreciation), undistributed ordinary income forincome tax purposes were as follows:
Cost of investments . . . . . . . . . . . . . . . . . . . . . . . . . . . . . . . . . . . . . . . . . $1,787,547,618
Unrealized appreciation . . . . . . . . . . . . . . . . . . . . . . . . . . . . . . . . . . . . . . $ 316,201,161Unrealized depreciation . . . . . . . . . . . . . . . . . . . . . . . . . . . . . . . . . . . . . . (203,897,562)
Net unrealized appreciation (depreciation) . . . . . . . . . . . . . . . . . . . . . . . . $ 112,303,599
Distributable earnings - undistributed ordinary income . . . . . . . . . . . . . . . $ 55,789,766
TG-26

Franklin Templeton Variable Insurance Products Trust
Notes to Financial Statements (continued)
Templeton Growth Securities Fund
5. INCOME TAXES (continued)
Differences between income and/or capital gains as determined on a book basis and a tax basis are primarily due to differingtreatments of foreign currency transactions, wash sales and gains realized on in-kind shareholder redemptions.
6. INVESTMENT TRANSACTIONS
Purchases and sales of investments (excluding short term securities) for the year ended December 31, 2012, aggregated$536,120,562 and $447,857,998, respectively. Sales of investments excludes redemptions in-kind of $1,060,908,757.
7. CONCENTRATION OF RISK
Investing in foreign securities may include certain risks and considerations not typically associated with investing in U.S.securities, such as fluctuating currency values and changing local and regional economic, political and social conditions, whichmay result in greater market volatility. In addition, certain foreign securities may not be as liquid as U.S. securities.
8. RESTRICTED SECURITIES
The Fund invests in securities that are restricted under the Securities Act of 1933 (1933 Act) or which are subject to legal,contractual, or other agreed upon restrictions on resale. Restricted securities are often purchased in private placementtransactions, and cannot be sold without prior registration unless the sale is pursuant to an exemption under the 1933 Act.Disposal of these securities may require greater effort and expense, and prompt sale at an acceptable price may be difficult. TheFund may have registration rights for restricted securities. The issuer generally incurs all registration costs.
At December 31, 2012, the Fund held investments in restricted securities, excluding certain securities exempt from registrationunder the 1933 Act deemed to be liquid, as follows:
Shares IssuerAcquisition
Dates Cost Value
1,194,518 Templeton China Opportunities Fund Ltd., Reg D (0.72% of Net Assets) . . . . . . . . . . . . . . 3/17/10-12/1/11 $11,935,000 $13,689,174
9. HOLDINGS OF 5% VOTING SECURITIES OF PORTFOLIO COMPANIES
The 1940 Act defines “affiliated companies” to include investments in portfolio companies in which a fund owns 5% or more ofthe outstanding voting securities. Investments in “affiliated companies” for the Fund for the year ended December 31, 2012, wereas shown below.
Name of Issuer
Number ofSharesHeld at
Beginningof Year
GrossAdditions
GrossReductions
Number ofSharesHeld at
End of YearValue at
End of YearInvestment
Income
RealizedCapital
Gain (Loss)
Non-Controlled AffiliatesTempleton China Opportunities Fund Ltd., Reg D . . 1,194,518 — — 1,194,518 $13,689,174 $— $—
Total Affiliated Securities (0.72% of Net Assets)
TG-27
Franklin Templeton Variable Insurance Products Trust
Notes to Financial Statements (continued)
Templeton Growth Securities Fund
10. CREDIT FACILITY
The Fund, together with other U.S. registered and foreign investment funds (collectively, Borrowers), managed by FranklinTempleton Investments, are borrowers in a joint syndicated senior unsecured credit facility totaling $1.5 billion (Global CreditFacility) which matured on January 18, 2013. This Global Credit Facility provides a source of funds to the Borrowers fortemporary and emergency purposes, including the ability to meet future unanticipated or unusually large redemption requests.Effective January 18, 2013, the Borrowers renewed the Global Credit Facility, which matures on January 17, 2014.
Under the terms of the Global Credit Facility, the Fund shall, in addition to interest charged on any borrowings made by theFund and other costs incurred by the Fund, pay its share of fees and expenses incurred in connection with the implementationand maintenance of the Global Credit Facility, based upon its relative share of the aggregate net assets of all of the Borrowers,including an annual commitment fee of 0.07% based upon the unused portion of the Global Credit Facility, which is reflected inother expenses on the Statement of Operations. During the year ended December 31, 2012, the Fund did not use the GlobalCredit Facility.
11. REDEMPTION IN-KIND
During the year ended December 31, 2012 and year ended December 31, 2011, the Fund realized $18,346,694 and $9,941,638,respectively, of net gains resulting from redemptions in-kind in which a shareholder redeemed fund shares for securities held bythe Fund rather than for cash. Because such gains are not taxable to the Fund and are not distributed to remaining shareholders,they have been reclassified from accumulated net realized gains to paid-in capital.
12. FAIR VALUE MEASUREMENTS
The Fund follows a fair value hierarchy that distinguishes between market data obtained from independent sources (observableinputs) and the Fund’s own market assumptions (unobservable inputs). These inputs are used in determining the value of theFund’s financial instruments and are summarized in the following fair value hierarchy:
• Level 1 – quoted prices in active markets for identical financial instruments• Level 2 – other significant observable inputs (including quoted prices for similar financial instruments, interest rates,
prepayment speed, credit risk, etc.)• Level 3 – significant unobservable inputs (including the Fund’s own assumptions in determining the fair value of
financial instruments)
The inputs or methodology used for valuing financial instruments are not an indication of the risk associated with investing inthose financial instruments.
For movements between the levels within the fair value hierarchy, the Fund has adopted a policy of recognizing the transfers asof the date of the underlying event which caused the movement. Additionally, at December 31, 2012, due to market events theFund employed fair value procedures to value a portion of its holdings. Such procedures resulted in a temporary transfer offinancial instruments valued at $851,762,094 from Level 1 to Level 2 within the fair value hierarchy.
TG-28

Franklin Templeton Variable Insurance Products Trust
Notes to Financial Statements (continued)
Templeton Growth Securities Fund
12. FAIR VALUE MEASUREMENTS (continued)
A summary of inputs used as of December 31, 2012, in valuing the Fund’s assets carried at fair value, is as follows:
Level 1 Level 2 Level 3 Total
Assets:Investments in Securities:
Equity Investments:Aerospace & Defense . . . . . . . . . . . . . . . . . . . . . . . . . . . . . . . . . . . . . . . . $ — $ 9,621,162 $ — $ 9,621,162Airlines . . . . . . . . . . . . . . . . . . . . . . . . . . . . . . . . . . . . . . . . . . . . . . . . . . — 64,588,383 — 64,588,383Auto Components . . . . . . . . . . . . . . . . . . . . . . . . . . . . . . . . . . . . . . . . . . — 29,146,006 — 29,146,006Automobiles . . . . . . . . . . . . . . . . . . . . . . . . . . . . . . . . . . . . . . . . . . . . . . — 48,948,667 — 48,948,667Chemicals . . . . . . . . . . . . . . . . . . . . . . . . . . . . . . . . . . . . . . . . . . . . . . . . — 22,869,662 — 22,869,662Commercial Banks . . . . . . . . . . . . . . . . . . . . . . . . . . . . . . . . . . . . . . . . . . 63,834,902 103,601,218 — 167,436,120Construction & Engineering . . . . . . . . . . . . . . . . . . . . . . . . . . . . . . . . . . . — 2,635,293 — 2,635,293Construction Materials . . . . . . . . . . . . . . . . . . . . . . . . . . . . . . . . . . . . . . . — 25,970,299 — 25,970,299Diversified Financial Services . . . . . . . . . . . . . . . . . . . . . . . . . . . . . . . . . . . 49,880,581 32,283,667 13,689,174 95,853,422Diversified Telecommunication Services . . . . . . . . . . . . . . . . . . . . . . . . . . . 10,187,236 72,218,189 — 82,405,425Electrical Equipment . . . . . . . . . . . . . . . . . . . . . . . . . . . . . . . . . . . . . . . . . 4,069,498 23,765,902 — 27,835,400Energy Equipment & Services . . . . . . . . . . . . . . . . . . . . . . . . . . . . . . . . . . 66,060,801 3,219,921 — 69,280,722Food & Staples Retailing . . . . . . . . . . . . . . . . . . . . . . . . . . . . . . . . . . . . . . 18,838,127 22,044,102 — 40,882,229Industrial Conglomerates . . . . . . . . . . . . . . . . . . . . . . . . . . . . . . . . . . . . . — 40,781,435 — 40,781,435Insurance . . . . . . . . . . . . . . . . . . . . . . . . . . . . . . . . . . . . . . . . . . . . . . . . . 33,181,141 66,523,550 — 99,704,691Oil, Gas & Consumable Fuels . . . . . . . . . . . . . . . . . . . . . . . . . . . . . . . . . . 73,866,036 92,145,039 — 166,011,075Pharmaceuticals . . . . . . . . . . . . . . . . . . . . . . . . . . . . . . . . . . . . . . . . . . . . 106,250,421 86,309,809 — 192,560,230Professional Services . . . . . . . . . . . . . . . . . . . . . . . . . . . . . . . . . . . . . . . . 4,641,251 26,299,169 — 30,940,420Software . . . . . . . . . . . . . . . . . . . . . . . . . . . . . . . . . . . . . . . . . . . . . . . . . 40,461,295 23,251,743 — 63,713,038Specialty Retail . . . . . . . . . . . . . . . . . . . . . . . . . . . . . . . . . . . . . . . . . . . . — 18,740,579 — 18,740,579Trading Companies & Distributors . . . . . . . . . . . . . . . . . . . . . . . . . . . . . . . — 8,137,396 — 8,137,396Wireless Telecommunication Services . . . . . . . . . . . . . . . . . . . . . . . . . . . . 49,940,160 28,660,903 — 78,601,063All Other Equity Investmentsa,b . . . . . . . . . . . . . . . . . . . . . . . . . . . . . . . . . 487,188,500 — — 487,188,500
Short Term Investments . . . . . . . . . . . . . . . . . . . . . . . . . . . . . . . . . . . . . . . . 26,000,000 — — 26,000,000
Total Investments in Securities . . . . . . . . . . . . . . . . . . . . . . . . . . . . . . . $1,034,399,949 $851,762,094 $13,689,174 $1,899,851,217
aIncludes common and preferred stocks as well as other equity investments.bFor detailed categories, see the accompanying Statement of Investments.
13. NEW ACCOUNTING PRONOUNCEMENTS
In December 2011, the Financial Accounting Standards Board (FASB) issued Accounting Standards Update (ASU) No. 2011-11,Balance Sheet (Topic 210): Disclosures about Offsetting Assets and Liabilities. The amendments in the ASU enhance disclosuresabout offsetting of financial assets and liabilities to enable investors to understand the effect of these arrangements on a fund’sfinancial position. In January 2013, FASB issued ASU No. 2013-01, Balance Sheet (Topic 210): Clarifying the Scope of Disclosuresabout Offsetting Assets and Liabilities. The amendments in ASU No. 2013-01 clarify the intended scope of disclosures required byASU No. 2011-11. These ASUs are effective for interim and annual reporting periods beginning on or after January 1, 2013. TheFund believes the adoption of these ASUs will not have a material impact on its financial statements.
TG-29

Franklin Templeton Variable Insurance Products Trust
Notes to Financial Statements (continued)
Templeton Growth Securities Fund
14. SUBSEQUENT EVENTS
The Fund has evaluated subsequent events through the issuance of the financial statements and determined that no events haveoccurred that require disclosure other than those already disclosed in the financial statements.
ABBREVIATIONS
Selected Portfolio
ADR - American Depositary Receipt
TG-30

Franklin Templeton Variable Insurance Products Trust
Templeton Growth Securities Fund
Report of Independent Registered Public Accounting Firm
To the Board of Trustees and Shareholders ofFranklin Templeton Variable Insurance Products TrustIn our opinion, the accompanying statement of assets and liabilities, including the statement of investments, and the relatedstatements of operations and of changes in net assets and the financial highlights present fairly, in all material respects, thefinancial position of Templeton Growth Securities Fund (the “Fund”) at December 31, 2012, the results of its operations for theyear then ended, the changes in its net assets for each of the two years in the period then ended and the financial highlights forthe periods presented, in conformity with accounting principles generally accepted in the United States of America. Thesefinancial statements and financial highlights (hereafter referred to as “financial statements”) are the responsibility of the Fund’smanagement. Our responsibility is to express an opinion on these financial statements based on our audits. We conducted ouraudits of these financial statements in accordance with the standards of the Public Company Accounting Oversight Board(United States). Those standards require that we plan and perform the audit to obtain reasonable assurance about whether thefinancial statements are free of material misstatement. An audit includes examining, on a test basis, evidence supporting theamounts and disclosures in the financial statements, assessing the accounting principles used and significant estimates made bymanagement, and evaluating the overall financial statement presentation. We believe that our audits, which includedconfirmation of securities at December 31, 2012 by correspondence with the custodian, transfer agent and brokers, provide areasonable basis for our opinion.
PricewaterhouseCoopers LLP
San Francisco, CaliforniaFebruary 15, 2013
TG-31

Franklin Templeton Variable Insurance Products Trust
Tax Information (unaudited)
Templeton Growth Securities Fund
Under Section 854(b)(1)(A) of the Internal Revenue Code (Code), the Fund hereby reports 29.32% of the ordinary incomedividends as income qualifying for the dividends received deduction for the fiscal year ended December 31, 2012.
At December 31, 2012, more than 50% of the Fund’s total assets were invested in securities of foreign issuers. In most instances,foreign taxes were withheld from income paid to the Fund on these investments. The Fund elects to treat foreign taxes paid asallowed under Section 853 of the Code. This election will allow shareholders of record as of the 2013 distribution date, to treattheir proportionate share of foreign taxes paid by the Fund as having been paid directly by them. The shareholder shall considerthese amounts as foreign taxes paid in the tax year in which they receive the Fund distribution.
TG-32

INDEX DESCRIPTIONS
The indexes are unmanaged and include reinvested distributions.
For indexes sourced by Morningstar: © 2013 Morningstar. All Rights Reserved. The information contained herein: (1) isproprietary to Morningstar and/or its content providers; (2) may not be copied or distributed; and (3) is not warranted to beaccurate, complete or timely. Neither Morningstar nor its content providers are responsible for any damages or losses arisingfrom any use of this information.
Russell® is a trademark and RussellTM is a servicemark of the Frank Russell Company.
Barclays U.S. Aggregate Index is a market capitalization-weighted index representing the U.S. investment-grade, fixed-rate,taxable bond market with index components for government and corporate, mortgage pass-through and asset-backed securities.All issues included are SEC registered, taxable, dollar denominated and nonconvertible, must have at least one year to finalmaturity and must be rated investment grade (Baa3/BBB-/BBB- or higher) using the middle rating of Moody’s, Standard & Poor’sand Fitch, respectively.
Barclays U.S. Government Index: Intermediate Component is the intermediate component of the BC U.S. Government Index,which includes public obligations of the U.S. Treasury with at least one year to final maturity and publicly issued debt of U.S.government agencies, quasi-federal corporations, and corporate or foreign debt guaranteed by the U.S. government.
Citigroup World Government Bond Index is a market capitalization-weighted index consisting of investment-grade worldgovernment bond markets.
Consumer Price Index (CPI), calculated by the Bureau of Labor Statistics, is a commonly used measure of the inflation rate.
Credit Suisse (CS) High Yield Index is designed to mirror the investable universe of the U.S. dollar-denominated high yielddebt market.
FTSE EPRA/NAREIT Developed Index is a free float-adjusted index designed to measure the performance of publicly tradedreal estate securities in the North American, European and Asian real estate markets. FTSE® is a trademark of London StockExchange Plc and The Financial Times Limited and is used by FTSE under license.
J.P. Morgan (JPM) Global Government Bond Index (GGBI) tracks total returns for liquid, fixed-rate, domestic governmentbonds with maturities greater than one year issued by developed countries globally.
Lipper Multi-Sector Income Funds Classification Average is calculated by averaging the total returns of all funds within theLipper Multi-Sector Income Funds classification in the Lipper Open-End underlying funds universe. Lipper Multi-Sector IncomeFunds are defined as funds that seek current income by allocating assets among different fixed income securities sectors (notprimarily in one sector except for defensive purposes), including U.S. and foreign governments, with a significant portion ratedbelow investment grade. For the 12-month period ended 12/31/12, there were 229 funds in this category. Lipper calculations donot include contract fees, expenses or sales charges, and may have been different if such charges had been considered.
Lipper VIP Equity Income Funds Classification Average is an equally weighted average calculation of performance figures forall funds within the Lipper Equity Income Funds classification in the Lipper VIP underlying funds universe. Lipper EquityIncome Funds seek relatively high current income and growth of income through investing 60% or more of their portfolios inequities. For the 12-month period ended 12/31/12, there were 63 funds in this category. Lipper calculations do not includecontract fees, expenses or sales charges, and may have been different if such charges had been considered.
Lipper VIP General U.S. Government Funds Classification Average is an equally weighted average calculation ofperformance figures for all funds within the Lipper General U.S. Government Funds classification in the Lipper VIP underlyingfunds universe. Lipper General U.S. Government Funds invest primarily in U.S. government and agency issues. For the 12-month period ended 12/31/12, there were 51 funds in this category. Lipper calculations do not include contract fees, expenses orsales charges, and may have been different if such charges had been considered.
Lipper VIP High Yield Funds Classification Average is an equally weighted average calculation of performance figures for allfunds within the Lipper High Yield Funds Classification in the Lipper VIP underlying funds universe. Lipper High Yield Fundsaim at high (relative) current yield from fixed income securities, have no quality or maturity restrictions, and tend to invest inlower grade debt issues. For the 12-month period ended 12/31/12, there were 118 funds in this category. Lipper calculations donot include contract fees, expenses or sales charges, and may have been different if such charges had been considered.
I-1

MSCI All Country World Index (ACWI) is a free float-adjusted, market capitalization-weighted index designed to measureequity market performance in global developed and emerging markets.
MSCI Emerging Markets (EM) Index is a free float-adjusted, market capitalization-weighted index designed to measure equitymarket performance in global emerging markets.
MSCI Europe, Australasia, Far East (EAFE) Index is a free float-adjusted, market capitalization-weighted index designed tomeasure equity market performance in global developed markets excluding the U.S. and Canada.
MSCI Europe, Australasia, Far East (EAFE) Index Net Return (Local Currency) is a free float-adjusted, marketcapitalization-weighted index designed to measure equity market performance of global developed markets excluding the U.S.and Canada. The index is calculated in local currency and includes reinvested daily net dividends.
MSCI World Index is a free float-adjusted, market capitalization-weighted index designed to measure equity marketperformance in global developed markets.
Russell 1000® Growth Index is market capitalization weighted and measures performance of those Russell 1000 Indexcompanies with higher price-to-book ratios and higher forecasted growth values.
Russell 1000® Index is market capitalization weighted and measures performance of the largest companies in the Russell 3000®
Index, which represents the majority of the U.S. market’s total capitalization.
Russell 1000® Value Index is market capitalization weighted and measures performance of those Russell 1000® Indexcompanies with lower price-to-book ratios and lower forecasted growth values.
Russell 2500™ Index is market capitalization weighted and measures performance of the smallest companies in the Russell3000® Index, which represent a modest amount of the Russell 3000® Index’s total market capitalization.
Russell 2500™ Value Index is market capitalization weighted and measures performance of those Russell 2500™ Indexcompanies with lower price-to-book ratios and lower forecasted growth values.
Russell 3000® Growth Index is market capitalization weighted and measures performance of those Russell 3000® Indexcompanies with higher price-to-book ratios and higher forecasted growth values.
Russell 3000® Index is market capitalization weighted and measures performance of the largest U.S. companies based on totalmarket capitalization and represents the majority of the investable U.S. equity market.
Russell Midcap® Growth Index is market capitalization weighted and measures performance of those Russell Midcap® Indexcompanies with higher price-to-book ratios and higher forecasted growth values.
Russell Midcap® Index is market capitalization weighted and measures performance of the smallest companies in the Russell1000® Index, which represent a modest amount of the Russell 1000® Index’s total market capitalization.
Standard & Poor’s 500 Index (S&P 500) is a market capitalization-weighted index of 500 stocks designed to measure totalU.S. equity market performance. STANDARD & POOR’S®, S&P® and S&P 500® are registered trademarks of Standard & Poor’sFinancial Services LLC.
Standard & Poor’s/International Finance Corporation Investable (S&P/IFCI) Composite Index is a free float-adjusted,market capitalization-weighted index designed to measure equity performance in global emerging markets.
I-2

Board Members and Officers
The name, year of birth and address of the officers and board members, as well as their affiliations,positions held with the Trust, principal occupation during at least the past five years and number ofportfolios overseen in the Franklin Templeton Investments fund complex are shown below. Generally,each board member serves until that person’s successor is elected and qualified.
Independent Board Members
Name, Year of Birth and Address PositionLength ofTime Served
Number ofPortfolios in FundComplex Overseenby Board Member*
Other Directorships HeldDuring at Least the Past 5 Years
Harris J. Ashton (1932)One Franklin ParkwaySan Mateo, CA 94403-1906
Trustee Since 1988 132 Bar-S Foods (meat packing company) (1981-2010).
Principal Occupation During at Least the Past 5 Years:Director of various companies; and formerly, Director, RBC Holdings, Inc. (bank holding company) (until 2002); and President, Chief Executive Officer andChairman of the Board, General Host Corporation (nursery and craft centers) (until 1998).
Sam Ginn (1937)One Franklin ParkwaySan Mateo, CA 94403-1906
Trustee Since 2007 107 ICO Global Communications (Holdings) Limited (satellitecompany) (2006-2010), Chevron Corporation (global energycompany) (1989-2009), Hewlett-Packard Company(technology company) (1996-2002), Safeway, Inc. (groceryretailer) (1991-1998) and TransAmerica Corporation (insurancecompany) (1989-1999).
Principal Occupation During at Least the Past 5 Years:Private investor; Chairman, First Responder Network Authority (FirstNet) (interoperable wireless broadband network) (August 2012); and formerly, Chairman ofthe Board, Vodafone AirTouch, PLC (wireless company) (1999-2000); Chairman of the Board and Chief Executive Officer, AirTouch Communications (cellularcommunications) (1993-1998) and Pacific Telesis Group (telephone holding company) (1988-1994).
Edith E. Holiday (1952)One Franklin ParkwaySan Mateo, CA 94403-1906
Trustee Since 2005 132 Hess Corporation (exploration and refining of oil and gas),H.J. Heinz Company (processed foods and allied products),RTI International Metals, Inc. (manufacture and distribution oftitanium), Canadian National Railway (railroad) and WhiteMountains Insurance Group, Ltd. (holding company).
Principal Occupation During at Least the Past 5 Years:Director or Trustee of various companies and trusts; and formerly, Assistant to the President of the United States and Secretary of the Cabinet (1990-1993);General Counsel to the United States Treasury Department (1989-1990); and Counselor to the Secretary and Assistant Secretary for Public Affairs and PublicLiaison-United States Treasury Department (1988-1989).
J. Michael Luttig (1954)One Franklin ParkwaySan Mateo, CA 94403-1906
Trustee Since 2009 132 Boeing Capital Corporation (aircraft financing).
Principal Occupation During at Least the Past 5 Years:Executive Vice President, General Counsel and member of Executive Council, The Boeing Company (aerospace company); and formerly, Federal Appeals CourtJudge, U.S. Court of Appeals for the Fourth Circuit (1991-2006).
Frank A. Olson (1932)One Franklin ParkwaySan Mateo, CA 94403-1906
Trustee Since 2005 132 Hess Corporation (exploration and refining of oil and gas).
Principal Occupation During at Least the Past 5 Years:Chairman Emeritus, The Hertz Corporation (car rental) (since 2000) (Chairman of the Board (1980-2000) and Chief Executive Officer (1977-1999)); andformerly, Chairman of the Board, President and Chief Executive Officer, UAL Corporation (airlines).
BOD-1
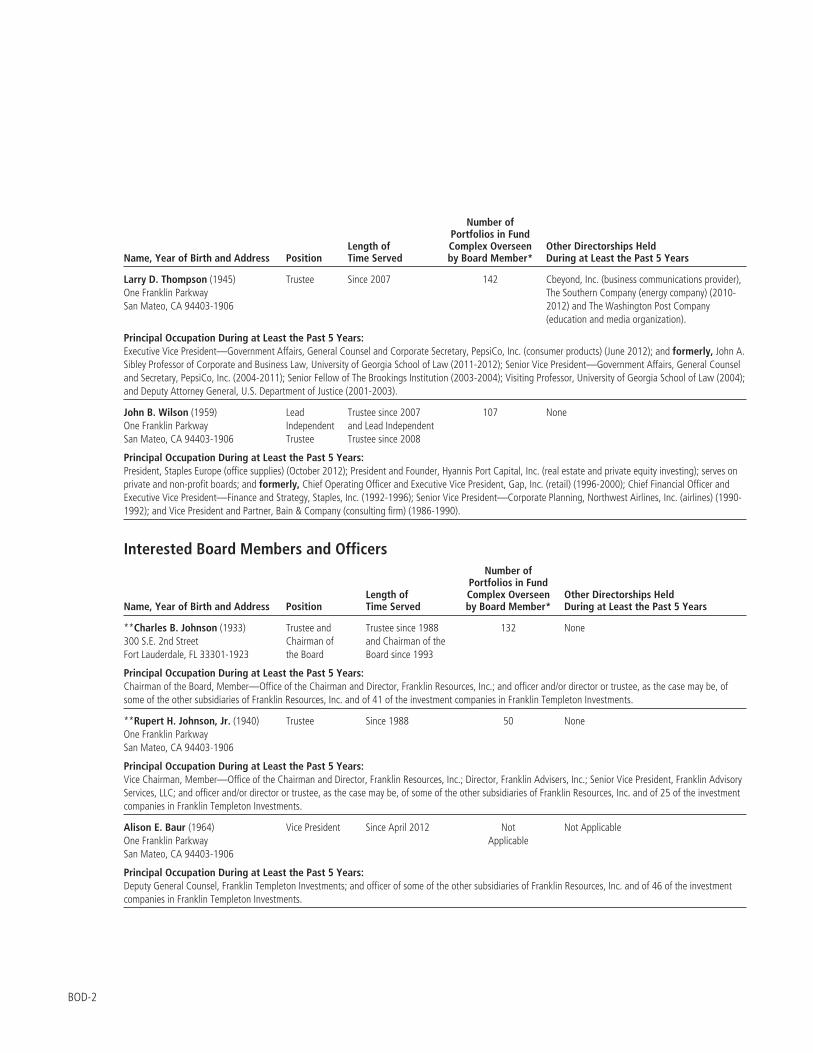
Name, Year of Birth and Address PositionLength ofTime Served
Number ofPortfolios in FundComplex Overseenby Board Member*
Other Directorships HeldDuring at Least the Past 5 Years
Larry D. Thompson (1945)One Franklin ParkwaySan Mateo, CA 94403-1906
Trustee Since 2007 142 Cbeyond, Inc. (business communications provider),The Southern Company (energy company) (2010-2012) and The Washington Post Company(education and media organization).
Principal Occupation During at Least the Past 5 Years:Executive Vice President—Government Affairs, General Counsel and Corporate Secretary, PepsiCo, Inc. (consumer products) (June 2012); and formerly, John A.Sibley Professor of Corporate and Business Law, University of Georgia School of Law (2011-2012); Senior Vice President—Government Affairs, General Counseland Secretary, PepsiCo, Inc. (2004-2011); Senior Fellow of The Brookings Institution (2003-2004); Visiting Professor, University of Georgia School of Law (2004);and Deputy Attorney General, U.S. Department of Justice (2001-2003).
John B. Wilson (1959)One Franklin ParkwaySan Mateo, CA 94403-1906
LeadIndependentTrustee
Trustee since 2007and Lead IndependentTrustee since 2008
107 None
Principal Occupation During at Least the Past 5 Years:President, Staples Europe (office supplies) (October 2012); President and Founder, Hyannis Port Capital, Inc. (real estate and private equity investing); serves onprivate and non-profit boards; and formerly, Chief Operating Officer and Executive Vice President, Gap, Inc. (retail) (1996-2000); Chief Financial Officer andExecutive Vice President—Finance and Strategy, Staples, Inc. (1992-1996); Senior Vice President—Corporate Planning, Northwest Airlines, Inc. (airlines) (1990-1992); and Vice President and Partner, Bain & Company (consulting firm) (1986-1990).
Interested Board Members and Officers
Name, Year of Birth and Address PositionLength ofTime Served
Number ofPortfolios in FundComplex Overseenby Board Member*
Other Directorships HeldDuring at Least the Past 5 Years
**Charles B. Johnson (1933)300 S.E. 2nd StreetFort Lauderdale, FL 33301-1923
Trustee andChairman ofthe Board
Trustee since 1988and Chairman of theBoard since 1993
132 None
Principal Occupation During at Least the Past 5 Years:Chairman of the Board, Member—Office of the Chairman and Director, Franklin Resources, Inc.; and officer and/or director or trustee, as the case may be, ofsome of the other subsidiaries of Franklin Resources, Inc. and of 41 of the investment companies in Franklin Templeton Investments.
**Rupert H. Johnson, Jr. (1940)One Franklin ParkwaySan Mateo, CA 94403-1906
Trustee Since 1988 50 None
Principal Occupation During at Least the Past 5 Years:Vice Chairman, Member—Office of the Chairman and Director, Franklin Resources, Inc.; Director, Franklin Advisers, Inc.; Senior Vice President, Franklin AdvisoryServices, LLC; and officer and/or director or trustee, as the case may be, of some of the other subsidiaries of Franklin Resources, Inc. and of 25 of the investmentcompanies in Franklin Templeton Investments.
Alison E. Baur (1964)One Franklin ParkwaySan Mateo, CA 94403-1906
Vice President Since April 2012 NotApplicable
Not Applicable
Principal Occupation During at Least the Past 5 Years:Deputy General Counsel, Franklin Templeton Investments; and officer of some of the other subsidiaries of Franklin Resources, Inc. and of 46 of the investmentcompanies in Franklin Templeton Investments.
BOD-2

Name, Year of Birth and Address PositionLength ofTime Served
Number ofPortfolios in FundComplex Overseenby Board Member*
Other Directorships HeldDuring at Least the Past 5 Years
Breda M. Beckerle (1958)600 Fifth AvenueNew York, NY 10020
ChiefComplianceOfficer and VicePresident
Since May 2012 NotApplicable
Not Applicable
Principal Occupation During at Least the Past 5 Years:Chief Compliance Officer, Fiduciary International, Inc., Franklin Advisers, Inc., Franklin Advisory Services, LLC, Franklin Investment Advisory Services, LLC, FranklinMutual Advisers, LLC, Franklin Templeton Institutional, LLC; Vice President and Compliance Officer—Commingled Trusts, Fiduciary Trust International of theSouth; and officer of some of the other subsidiaries of Franklin Resources, Inc. and of 46 of the investment companies in Franklin Templeton Investments.
Laura F. Fergerson (1962)One Franklin ParkwaySan Mateo, CA 94403-1906
Chief ExecutiveOfficer—Finance andAdministration
Since 2009 NotApplicable
Not Applicable
Principal Occupation During at Least the Past 5 Years:Senior Vice President, Franklin Templeton Services, LLC; and officer of 46 of the investment companies in Franklin Templeton Investments.
Gaston Gardey (1967)One Franklin ParkwaySan Mateo, CA 94403-1906
Treasurer, ChiefFinancial Officerand ChiefAccountingOfficer
Since 2009 NotApplicable
Not Applicable
Principal Occupation During at Least the Past 5 Years:Director, Fund Accounting, Franklin Templeton Investments; and officer of 27 of the investment companies in Franklin Templeton Investments.
Aliya S. Gordon (1973)One Franklin ParkwaySan Mateo, CA 94403-1906
Vice President Since 2009 NotApplicable
Not Applicable
Principal Occupation During at Least the Past 5 Years:Senior Associate General Counsel, Franklin Templeton Investments; officer of 46 of the investment companies in Franklin Templeton Investments; and formerly,Litigation Associate, Steefel, Levitt & Weiss, LLP (2000-2004).
Steven J. Gray (1955)One Franklin ParkwaySan Mateo, CA 94403-1906
Vice President Since 2009 NotApplicable
Not Applicable
Principal Occupation During at Least the Past 5 Years:Senior Associate General Counsel, Franklin Templeton Investments; Vice President, Franklin Templeton Distributors, Inc.; and officer of 46 of the investmentcompanies in Franklin Templeton Investments.
Selena L. Holmes (1965)100 Fountain ParkwaySt. Petersburg, FL 33716-1205
Vice President—AML Compliance
Since May 2012 NotApplicable
Not Applicable
Principal Occupation During at Least the Past 5 Years:Director, Global Compliance Monitoring; and officer of 46 of the investment companies in Franklin Templeton Investments.
Edward B. Jamieson (1948)One Franklin ParkwaySan Mateo, CA 94403-1906
President andChief ExecutiveOfficer—InvestmentManagement
Since 2010 NotApplicable
Not Applicable
Principal Occupation During at Least the Past 5 Years:President, Chief Investment Officer and Director, Franklin Advisers, Inc.; Executive Vice President, Franklin Templeton Institutional, LLC; and officer and/or trustee,as the case may be, of some of the other subsidiaries of Franklin Resources, Inc. and of 10 of the investment companies in Franklin Templeton Investments.
BOD-3

Name, Year of Birth and Address PositionLength ofTime Served
Number ofPortfolios in FundComplex Overseenby Board Member*
Other Directorships HeldDuring at Least the Past 5 Years
Robert C. Rosselot (1960)300 S.E. 2nd StreetFort Lauderdale, FL 33301-1923
Vice President Since 2009 NotApplicable
Not Applicable
Principal Occupation During at Least the Past 5 Years:Senior Associate General Counsel, Franklin Templeton Investments; Assistant Secretary, Franklin Resources, Inc.; Vice President and Secretary, TempletonInvestment Counsel, LLC; Vice President, Secretary and Trust Officer, Fiduciary Trust International of the South; and officer of 46 of the investment companies inFranklin Templeton Investments.
Karen L. Skidmore (1952)One Franklin ParkwaySan Mateo, CA 94403-1906
Vice Presidentand Secretary
Since 2006 NotApplicable
Not Applicable
Principal Occupation During at Least the Past 5 Years:Senior Associate General Counsel, Franklin Templeton Investments; and officer of 46 of the investment companies in Franklin Templeton Investments.
Craig S. Tyle (1960)One Franklin ParkwaySan Mateo, CA 94403-1906
Vice President Since 2005 NotApplicable
Not Applicable
Principal Occupation During at Least the Past 5 Years:General Counsel and Executive Vice President, Franklin Resources, Inc.; officer of some of the other subsidiaries of Franklin Resources, Inc. and of 46 of theinvestment companies in Franklin Templeton Investments; and formerly, Partner, Shearman & Sterling, LLP (2004-2005); and General Counsel, InvestmentCompany Institute (ICI) (1997-2004).
Lori A. Weber (1964)300 S.E. 2nd StreetFort Lauderdale, FL 33301-1923
Vice President Since 2011 NotApplicable
Not Applicable
Principal Occupation During at Least the Past 5 Years:Associate General Counsel, Franklin Templeton Investments; Assistant Secretary, Franklin Resources, Inc.; Vice President and Assistant Secretary, TempletonInvestment Counsel, LLC; and officer of 46 of the investment companies in Franklin Templeton Investments.
*We base the number of portfolios on each separate series of the U.S. registered investment companies within the Franklin Templeton Investments fundcomplex. These portfolios have a common investment manager or affiliated investment managers.
**Charles B. Johnson and Rupert H. Johnson, Jr. are considered to be interested persons of the Trust under the federal securities laws due to their positions asofficers and directors and major shareholders of Franklin Resources, Inc., which is the parent company of the Trust’s investment manager and distributor.
Note 1: Charles B. Johnson and Rupert H. Johnson, Jr. are brothers.Note 2: Officer information is current as of the date of this report. It is possible that after this date, information about officers may change.
The Sarbanes-Oxley Act of 2002 and Rules adopted by the Securities and Exchange Commission require the Fund to disclose whether theFund’s Audit Committee includes at least one member who is an audit committee financial expert within the meaning of such Act andRules. The Fund’s Board has determined that there is at least one such financial expert on the Audit Committee and has designated John B.Wilson as its audit committee financial expert. The Board believes that Mr. Wilson qualifies as such an expert in view of his extensivebusiness background and experience, including service as chief financial officer of Staples, Inc. from 1992 to 1996. Mr. Wilson has been aMember and Chairman of the Fund’s Audit Committee since 2007. As a result of such background and experience, the Board believes thatMr. Wilson has acquired an understanding of generally accepted accounting principles and financial statements, the general application ofsuch principles in connection with the accounting estimates, accruals and reserves, and analyzing and evaluating financial statements thatpresent a breadth and level of complexity of accounting issues generally comparable to those of the Fund, as well as an understanding ofinternal controls and procedures for financial reporting and an understanding of audit committee functions. Mr. Wilson is an independentBoard member as that term is defined under the relevant Securities and Exchange Commission Rules and Releases.
The Statement of Additional Information (SAI) includes additional information about the board members and is available, without charge,upon request. Shareholders may call (800) 321-8563 or their insurance companies to request the SAI.
BOD-4

Franklin Templeton Variable Insurance Products Trust
Shareholder Information
Proxy Voting Policies and Procedures
The Trust’s investment manager has established Proxy Voting Policies and Procedures (Policies) that the Trust uses to determinehow to vote proxies relating to portfolio securities. Shareholders may view the Trust’s complete Policies online atfranklintempleton.com. Alternatively, shareholders may request copies of the Policies free of charge by calling the Proxy Groupcollect at (954) 527-7678 or by sending a written request to: Franklin Templeton Companies, LLC, 300 S.E. 2nd Street, FortLauderdale, FL 33301, Attention: Proxy Group. Copies of the Trust’s proxy voting records are also made available online atfranklintempleton.com and posted on the U.S. Securities and Exchange Commission’s website at sec.gov and reflect the mostrecent 12-month period ended June 30.
Quarterly Statement of Investments
The Trust files a complete statement of investments with the U.S. Securities and Exchange Commission for the first and thirdquarters for each fiscal year on Form N-Q. Shareholders may view the filed Form N-Q by visiting the Commission’s website atsec.gov. The filed form may also be viewed and copied at the Commission’s Public Reference Room in Washington, DC.Information regarding the operations of the Public Reference Room may be obtained by calling (800) SEC-0330.
SI-1

VALUE BLEND GROWTH SECTOR GLOBAL INTERNATIONAL HYBRID ASSET ALLOCATION FIXED INCOME
< GAIN FROM OUR PERSPECTIVE® >
Annual Report
Franklin TempletonVariable Insurance Products Trust
Investment ManagersFranklin Advisers, Inc.Franklin Advisory Services, LLCFranklin Mutual Advisers, LLCFranklin Templeton Institutional, LLCTempleton Asset Management, Ltd.Templeton Global Advisors LimitedTempleton Investment Counsel, LLC
Fund AdministratorFranklin Templeton Services, LLC
DistributorFranklin Templeton Distributors, Inc.
Franklin Templeton Variable Insurance Products Trust (FTVIP) shares are not offered to the public; they areoffered and sold only to: (1) insurance company separate accounts (Separate Account) to serve as theunderlying investment vehicle for variable contracts; (2) certain qualified plans; and (3) other mutual funds(funds of funds).
Authorized for distribution to investors in Separate Accounts only when accompanied or preceded by thecurrent prospectus for the applicable contract, which includes the Separate Account and the FTVIPprospectuses. Investors should carefully consider a fund’s investment goals, risks, charges and expensesbefore investing. The prospectus contains this and other information; please read it carefully before investing.
To ensure the highest quality of service, telephone calls to or from our service departments may be monitored, recorded andaccessed. These calls can be identified by the presence of a regular beeping tone.
©2013 Franklin Templeton Investments. All rights reserved. VIP A 02/13

DECEMBER 31 , 2012
Franklin TempletonVariable Insurance Products Trust
ANNUALREPORT


FRANKLIN TEMPLETON VARIABLE INSURANCEPRODUCTS TRUST ANNUAL REPORTTABLE OF CONTENTS
Important Notes to Performance Information . . . . . . . . . . . . . . . . . . . . . . i*Group of Funds Prospectus Supplement . . . . . . . . . . . . . . . . . . . . . . . . . . P-1*Group of Funds Statement of Additional Information
Supplement . . . . . . . . . . . . . . . . . . . . . . . . . . . . . . . . . . . . . . . . . . . . . . . . . . . . . . . . SAI-1Fund Summary
Franklin Strategic Income Securities Fund† . . . . . . . . . . . . . . . . . . . . . . . . FSI-1*Statement of Additional Information Supplement . . . . . . . . . . . FSI-9
Index Descriptions . . . . . . . . . . . . . . . . . . . . . . . . . . . . . . . . . . . . . . . . . . . . . . . . . . I-1Board Members and Officers . . . . . . . . . . . . . . . . . . . . . . . . . . . . . . . . . . . . . . . . BOD-1Shareholder Information . . . . . . . . . . . . . . . . . . . . . . . . . . . . . . . . . . . . . . . . . . . . SI-1
*Not part of the annual report. Retain for your records.† Please see Group of Funds Prospectus Supplement and Group of Funds Statement of AdditionalInformation Supplement.
NOT FDIC INSURED | MAY LOSE VALUE | NO BANK GUARANTEE
LIBERTY LIFE A 02/13

IMPORTANT NOTES TOPERFORMANCE INFORMATION
Performance data is historical and cannot predict or guarantee futureresults. Principal value and investment return will fluctuate with marketconditions, and you may have a gain or loss when you withdraw yourmoney. Inception dates of the funds may have preceded the effectivedates of the subaccounts, contracts, or their availability in all states.
When reviewing the index comparisons, please keep in mind thatindexes have a number of inherent performance differentials over thefunds. First, unlike the funds, which must hold a minimum amount ofcash to maintain liquidity, indexes do not have a cash component.Second, the funds are actively managed and, thus, are subject tomanagement fees to cover salaries of securities analysts or portfoliomanagers in addition to other expenses. Indexes are unmanaged and donot include any commissions or other expenses typically associatedwith investing in securities. Third, indexes often contain a different mixof securities than the fund to which they are compared. Additionally,please remember that indexes are simply a measure of performance andcannot be invested in directly.
i

SUPPLEMENT DATED JANUARY 1, 2013TO THE PROSPECTUSES
DATED MAY 1, 2012OF
FRANKLIN GLOBAL REAL ESTATE SECURITIES FUND
FRANKLIN GROWTH AND INCOME SECURITIES FUND
FRANKLIN HIGH INCOME SECURITIES FUND
FRANKLIN INCOME SECURITIES FUND
FRANKLIN STRATEGIC INCOME SECURITIES FUND
MUTUAL GLOBAL DISCOVERY SECURITIES FUND
MUTUAL INTERNATIONAL SECURITIES FUND
MUTUAL SHARES SECURITIES FUND
TEMPLETON GLOBAL BOND SECURITIES FUND(Series of Franklin Templeton Variable Insurance Products Trust)
The Prospectus is amended as follows:
I. For the Franklin Global Real Estate Securities Fund, Franklin Strategic Income SecuritiesFund, Mutual Global Discovery Securities Fund, Mutual International Securities Fund,Mutual Shares Securities Fund and Templeton Global Bond Securities Fund, the “PrincipalInvestment Policies and Practices - Commodity Exchange Act Exclusion” section of the FundDetails is replaced with the following:
The Fund is not intended as a vehicle for trading in the futures, commodity options orswaps markets. With respect to the Fund, the investment manager has claimed anexclusion from the definition of “commodity pool operator” (CPO) under theCommodity Exchange Act (CEA) and the rules of the Commodity Futures TradingCommission (CFTC) and, therefore, is not subject to CFTC registration or regulation asa CPO. In addition, the investment manager is relying upon a related exclusion from thedefinition of “commodity trading advisor” (CTA) under the CEA and the rules of theCFTC.
As of January 1, 2013, the terms of the CPO exclusion require the Fund, among otherthings, to adhere to certain limits on its investments in futures, commodity options,swaps and non-deliverable foreign currency forwards (used for purposes other thanbona fide hedging). Because the investment manager and the Fund intend to complywith the terms of the CPO exclusion, the Fund may need to adjust its investmentstrategies to limit its investments in these types of instruments. The CFTC has neitherreviewed nor approved the investment manager’s reliance on these exclusions, or theFund, its investment strategies or this prospectus.
P-1

II. For the Franklin Growth and Income Securities Fund, Franklin High Income SecuritiesFund and Franklin Income Securities Fund, the following is added above the “PrincipalInvestment Policies and Practices - Temporary Investments” section of the Fund Details:
The Fund is not intended as a vehicle for trading in the futures, commodity optionsor swaps markets. With respect to the Fund, the investment manager has claimedan exclusion from the definition of “commodity pool operator” (CPO) under theCommodity Exchange Act (CEA) and the rules of the Commodity Futures TradingCommission (CFTC) and, therefore, is not subject to CFTC registration orregulation as a CPO. In addition, the investment manager is relying upon a relatedexclusion from the definition of “commodity trading advisor” (CTA) under the CEAand the rules of the CFTC.
As of January 1, 2013, the terms of the CPO exclusion require the Fund, amongother things, to adhere to certain limits on its investments in futures, commodityoptions, swaps and non-deliverable foreign currency forwards (used for purposesother than bona fide hedging). Because the investment manager and the Fundintend to comply with the terms of the CPO exclusion, the Fund may need toadjust its investment strategies to limit its investments in these types ofinstruments. The CFTC has neither reviewed nor approved the investmentmanager’s reliance on these exclusions, or the Fund, its investment strategies or thisprospectus.
Please keep this supplement for future reference
P-2

SUPPLEMENT DATED JANUARY 1, 2013TO THE STATEMENT OF ADDITIONAL INFORMATION
DATED MAY 1, 2012OF
FRANKLIN GLOBAL REAL ESTATE SECURITIES FUND
FRANKLIN GROWTH AND INCOME SECURITIES FUND
FRANKLIN HIGH INCOME SECURITIES FUND
FRANKLIN INCOME SECURITIES FUND
FRANKLIN STRATEGIC INCOME SECURITIES FUND
FRANKLIN TEMPLETON VIP FOUNDING FUNDS ALLOCATION FUND
MUTUAL GLOBAL DISCOVERY SECURITIES FUND
MUTUAL INTERNATIONAL SECURITIES FUND
MUTUAL SHARES SECURITIES FUND
TEMPLETON GLOBAL BOND SECURITIES FUND(Series of Franklin Templeton Variable Insurance Products Trust)
The statement of additional information is amended as follows:
The fourth paragraph on page 23 under “Glossary of Investments, Techniques, Strategies andTheir Risks - Derivative instruments” is replaced with the following paragraphs:
The Fund is not intended as a vehicle for trading in the futures, commodity options or swapsmarkets. With respect to the Fund, the investment manager has claimed an exclusion fromthe definition of “commodity pool operator” (CPO) under the Commodity Exchange Act(CEA) and the rules of the Commodity Futures Trading Commission (CFTC) and, therefore,is not subject to CFTC registration or regulation as a CPO. In addition, the investmentmanager is relying upon a related exclusion from the definition of “commodity tradingadvisor” (CTA) under the CEA and the rules of the CFTC.
As of January 1, 2013, the terms of the CPO exclusion require the Fund, among other things,to adhere to certain limits on its investments in futures, commodity options, swaps andnon-deliverable foreign currency forwards (used for purposes other than bona fide hedging).Because the investment manager and the Fund intend to comply with the terms of the CPOexclusion, the Fund may need to adjust its investment strategies to limit its investments inthese types of instruments. The CFTC has neither reviewed nor approved the investmentmanager’s reliance on these exclusions, or the Fund, its investment strategies or thisstatement of additional information.
Please keep this supplement for future reference
SAI-1

THIS PAGE HAS BEEN INTENTIONALLY LEFT BLANK

FRANKLIN STRATEGIC INCOME SECURITIES FUND
We are pleased to bring you Franklin Strategic IncomeSecurities Fund’s annual report for the fiscal year endedDecember 31, 2012.
Performance Summary as of 12/31/12
Average annual total return of Class 2 shares represents the averageannual change in value, assuming reinvestment of dividends and capitalgains. Average returns smooth out variations in returns, which can besignificant; they are not the same as year-by-year results.
Periods ended 12/31/12
1-Year 5-Year 10-Year
Average Annual Total Return +12.75% +7.44% +8.18%
Total Return Index Comparisonfor a Hypothetical $10,000 Investment (1/1/03–12/31/12)
The graph below shows the change in value of a hypothetical $10,000investment in the Fund over the indicated period and includesreinvestment of any income or distributions. The Fund’s performance iscompared to the performance of the Barclays U.S. Aggregate Index andthe Lipper Multi-Sector Income Funds Classification Average. Onecannot invest directly in an index, and an index is not representative ofthe Fund’s portfolio. Please see Important Notes to PerformanceInformation preceding the Fund Summaries.
$5,000
$10,000
$20,000
$15,000
$25,000
Franklin StrategicIncome Securities Fund
Barclays U.S.Aggregate Index*
Lipper Multi-SectorIncome FundsClassification Average**
$21,961
$16,575
$20,219
1/03 12/04 12/06 12/08 12/10 12/12
*Source: © 2013 Morningstar. Please see Index Descriptions following the Fund Summaries.**Source: Lipper Inc. Please see Index Descriptions following the Fund Summaries.
Franklin Strategic IncomeSecurities Fund – Class 2
Performance reflects the Fund’sClass 2 operating expenses, butdoes not include any contract fees,expenses or sales charges. If theyhad been included, performancewould be lower. These charges anddeductions, particularly forvariable life policies, can have asignificant effect on contractvalues and insurance benefits. Seethe contract prospectus for acomplete description of theseexpenses, including sales charges.
Performance data representpast performance, whichdoes not guarantee futureresults. Investment returnand principal value willfluctuate, and you mayhave a gain or loss whenyou sell your shares.Current performance maydiffer from figures shown.
FSI-1

Fund Goals and Main Investments: Franklin Strategic Income Securities
Fund seeks a high level of current income, with capital appreciation over the
long term as a secondary goal. Under normal market conditions, the Fund
invests primarily to predominantly in U.S. and foreign debt securities,
including those in emerging markets.
Performance Overview
You can find the Fund’s one-year total return in the Performance Sum-mary. The Fund outperformed the +4.21% total return of its bench-mark, the Barclays U.S. Aggregate Index.1 The Fund also outperformedthe +11.21% total return of its peers, as measured by the Lipper Multi-Sector Income Funds Classification Average.2
Economic and Market Overview
During the 12 months under review, U.S. economic data remainedmixed. Oil prices declined, and the housing sector strengthened withnew and existing home sales as well as prices pointing toward a gradualstrengthening trend, albeit from a low base. Consumer spending gen-erally increased and consumer confidence reached its highest level dur-ing the period in November. However, manufacturing indicatorsweakened and gross domestic product growth was moderate.
The global economic recovery was also mixed during 2012. Emergingmarkets continued to lead the recovery with many economies returningto and exceeding pre-crisis activity levels. Although some developedeconomies also enjoyed relatively strong recoveries, growth in the G-3(U.S., eurozone and Japan) continued to be slow by the standards ofprevious recoveries. Despite ongoing uncertainty, eurozone leadersmade meaningful progress and began to deploy policy solutions aimedat correcting long-unaddressed structural issues. Policymakers in thelargest developed economies increased their already unprecedented ef-forts to supply liquidity and with few exceptions, policymakers else-where in the world paused their tightening cycles or reduced rates inresponse to the risks to domestic activity from a potential deteriorationin the global outlook. European Central Bank (ECB) President MarioDraghi declared, “the ECB is ready to do whatever it takes to preservethe euro,” buoying markets in the summer. In Asia, China’s and Japan’scentral banks took measures to stimulate their countries’ growth.
1. Source: © 2013 Morningstar.2. Source: Lipper Inc.One cannot invest directly in an index, and an index is not representative of the Fund’s portfolio.Please see Index Descriptions following the Fund Summaries.
Fund Risks: All investments
involve risks, including possible
loss of principal. As the prices of
bonds in the Fund adjust to a
rise in interest rates, the Fund’s
share price may decline. Risks
associated with higher yielding,
lower rated securities (junk
bonds) include higher risk of
default and loss of principal.
Floating rate loans and high
yield corporate bonds are rated
below investment grade and are
subject to greater risk of default,
which could result in loss of
principal. Investments in foreign
securities involve risks such
as currency fluctuations and
political uncertainty. Invest-
ments in developing markets
involve heightened risks related
to the same factors, in addition
to those associated with their
relatively small size and lesser
liquidity. Investing in derivative
securities and the use of foreign
currency techniques involve
special risks as such may not
achieve the anticipated benefits
and/or may result in losses to
the Fund. The Fund is actively
managed but there is no
guarantee that the manager’s
investment decisions will
produce the desired results. The
Fund’s prospectus also includes
a description of the main
investment risks.
FSI-2

In September, the Federal Reserve Board (Fed) acknowledged the needfor further policy accommodation and announced a third round ofquantitative easing (QE3). QE3 consisted of additional $40 billionmonthly purchases of mortgage-backed securities until the labor marketimproves. The Fed also continued buying long-term Treasuries and sell-ing short-term Treasuries in an effort to put downward pressure onlong-term interest rates. In December, the Fed announced a 6.5% un-employment target as a guide to maintaining the historically low federalfunds target rate. Economists, business leaders and market watcherswere concerned about the U.S. “fiscal cliff” when, unless Congress act-ed, automatic income tax increases and federal budget cuts werescheduled to take effect in 2013. They feared these events could causeanother U.S. recession. Not knowing whether Congress and the Presi-dent would avert these measures after the U.S. election, many busi-nesses delayed major investment and hiring decisions. Lawmakersreached a late compromise on January 1, 2013, a day after the reportingperiod ended. The approved legislation will maintain some tax cuts formost Americans but increase rates on the wealthiest. It will also delaythe automatic federal spending cuts scheduled to start in January 2013.
Ongoing investor concerns about the fiscal cliff and eurozoneuncertainty drove the 10-year U.S. Treasury note yield to 1.78% atyear-end from 1.89% on December 31, 2011. During the 12 monthsunder review, below-investment-grade corporate bonds, as measuredby the Credit Suisse High Yield Index, produced strong returns andoutperformed investment-grade fixed income markets, as measured bythe Barclays U.S. Aggregate Index.3
3. Please see Index Descriptions following the Fund Summaries.
FSI-3
Investment Strategy
We allocate our investments among the various types of debt availablebased on our assessment of changing economic, global market, industryand issuer conditions. We use a top-down analysis of macroeconomictrends, combined with a bottom-up fundamental analysis of marketsectors, industries and issuers, seeking to take advantage of varying sec-tor reactions to economic events. For example, we may evaluate busi-ness cycles, yield curves, country risk, and the relative interest ratesamong currencies, and values between and within markets. In selectingdebt securities, we generally conduct our own analysis of the security’sintrinsic value rather than simply relying on the coupon rate or rating.We may also enter into various transactions involving certain currency-,interest rate- or credit-related derivative instruments for hedging pur-poses, to enhance returns or to obtain exposure to various marketsectors.
Manager’s Discussion
Global economic and political headlines continued to influence finan-cial markets in 2012. During the first half of 2012, weak economic dataalong with renewed eurozone concerns pressured financial markets,and U.S. stocks, as measured by the Standard & Poor’s® 500 Index(S&P 500®), fell in the second quarter.3 However, similar to the back-and-forth pattern of the past couple of years, financial markets ralliedduring the second half of the year, and the S&P 500 delivered a+16.00% total return in 2012.1 Renewed optimism stemmed fromindications of further monetary easing from central banks in theU.S., eurozone and Japan, as well as improving economic indicators inthe U.S. and China toward period-end. In this environment, long-termU.S. rates fluctuated, but ultimately ended the reporting period atslightly lower levels. Amid relatively steady interest rates and a moresupportive credit market environment by period-end, most fixedincome sectors delivered positive total returns. Given greater financialmarket optimism, many “spread” sectors of the fixed income marketoutperformed U.S. Treasuries. Similarly, a rebound in certain foreigncurrencies compared to the U.S. dollar drove many international fixedincome currency markets to positive performance.
The Fund’s overweighted exposure to noninvestment-grade corporatecredit sectors positively impacted performance relative to the BarclaysU.S. Aggregate Index. Compared to the Lipper peer average, the Fund’shigher exposure to certain non-dollar holdings aided returns.
What is a currency forwardcontract?A currency forward contract is anagreement between the Fund and acounterparty to buy or sell a foreigncurrency for a specific exchange rateon a future date.
FSI-4

Corporate credit fundamentals remained broadly supportive during theperiod, with ample corporate liquidity and default rates well below thehistorical average. Although companies began focusing more onshareholder-friendly activities, such as stock buybacks and increasingdividends, in general management teams remained cautious regardingbalance sheet liquidity and accessed the public debt markets torefinance existing debt at lower interest rates. Similarly, although banks’reluctance to lend curbed corporate spending initiatives, increases inglobal capital ratios and liquidity buffers for global banks strengthenedthe banking sector’s perceived credit safety. Consequently, corporatespread sectors delivered positive performance as spreads tightenedduring the period. The Fund’s largest corporate credit exposureremained in high yield bonds, although given the compression inspreads between higher quality and lower rated securities, the Fundraised its exposure to leveraged bank loans and investment gradecorporate bonds while reducing its weighting in high yield corporatebonds.
The global financial market rally also drove positive performance formany of the underlying currencies held in the Fund’s global bond posi-tions. In particular, many positions denominated in Asian currencies incountries such as South Korea and the Philippines, some of which in-cluded currency forward contracts, performed well versus the U.S. dol-lar. Similarly, Fund holdings in Polish and Hungarian bonds generatedpositive returns, as they were proxy-hedged against short euro currencyforward contracts, and the euro underperformed the two currenciesduring the period. In Latin America, the Fund’s exposure to the Mex-ican peso and Chilean peso benefited returns, given the strength ofthose currencies. Toward period-end, weakness in the Japanese yen alsohelped Fund performance, as the Fund had sold the yen using currencyforward contracts. In most global positions, the Fund maintained rela-tively short duration, focusing on yield in short-term maturity instru-ments and seeking potential currency appreciation. Finally, wemaintained only a modest weighting in hard currency (U.S. dollar andeuro) emerging market sovereign bonds, given valuations that remainedrich compared to longer term averages.
With relatively flat longer term U.S. interest rates, the more rate-sensitive U.S. fixed income sectors, including Treasuries, agencies andmortgage-backed securities (MBS), generally delivered positive returnsfor the period, although lagging returns of the broader fixed incomemarket. The Fund maintained lower exposure to these sectors,
Asset AllocationFranklin Strategic Income Securities FundBased on Total Net Assets
12/31/12 12/31/11
Short-Term Investments & Other Net Assets*
Convertible Securities
Common Stocks
Asset-Backed Securities
Municipal Bonds
U.S. Treasury Securities
Commercial Mortgage-Backed Securities
International Government & Agency Bonds ($US)
Mortgage-Backed Securities
Investment Grade Corporate Bonds & Preferred Securities
Floating Rate Bank Loans
International Government & Agency Bonds (non-$US)
High Yield Corporate Bonds & Preferred Securities27.7%
30.8%
23.1%25.0%
17.6%16.1%
6.0%5.0%
6.0%5.0%
2.5%3.1%
2.5%2.4%
2.1%1.5%
1.9%3.5%
0.8%1.0%
0.8%0.5%
0.0%0.2%
9.0%5.9%
*Includes unrealized gains/losses on currency forward contracts. Does not include short-term foreign government securities.
The dollar value, number of shares or principal amount, and names of all portfolioholdings are listed in the Fund’s Statementof Investments.
FSI-5

considering historically low U.S. rates, preferring higher income oppor-tunities in the corporate and global markets. Within the U.S. rate sec-tors, the Fund favored agency MBS, given their somewhat highercurrent yields and considering the Fed’s continued purchases of agencyMBS through quantitative easing programs. For municipal bond hold-ings, the Fund realized gains by selling certain longer maturity munici-pal bonds while adding diversified floating-rate exposure with a basketof municipal issuers via a derivatives index instrument.
Thank you for your participation in Franklin Strategic Income Secu-rities Fund. We look forward to serving your future investment needs.
The foregoing information reflects our analysis, opinions and portfolio holdings as ofDecember 31, 2012, the end of the reporting period. The way we implement our maininvestment strategies and the resulting portfolio holdings may change depending on factorssuch as market and economic conditions. These opinions may not be relied upon as invest-ment advice or an offer for a particular security. The information is not a complete analysis ofevery aspect of any market, country, industry, security or the Fund. Statements of fact arefrom sources considered reliable, but the investment manager makes no representation orwarranty as to their completeness or accuracy. Although historical performance is no guaran-tee of future results, these insights may help you understand our investment managementphilosophy.
FSI-6

Fund Expenses
As an investor in a variable insurance contract (Contract) that indirectlyprovides for investment in an underlying mutual fund, you can incurtransaction and/or ongoing expenses at both the Fund level and theContract level.
• Transaction expenses can include sales charges (loads) on purchases,redemption fees, surrender fees, transfer fees and premium taxes.
• Ongoing expenses can include management fees, distribution andservice (12b-1) fees, contract fees, annual maintenance fees, mortalityand expense risk fees and other fees and expenses. All mutual fundsand Contracts have some types of ongoing expenses.
The expenses shown in the table are meant to highlight ongoing expenses at
the Fund level only and do not include ongoing expenses at the Contract level,
or transaction expenses at either the Fund or Contract level. While the Fund
does not have transaction expenses, if the transaction and ongoing expenses
at the Contract level were included, the expenses shown below would be high-
er. You should consult your Contract prospectus or disclosure document for
more information.
The table shows Fund-level ongoing expenses and can help you under-stand these expenses and compare them with those of other mutualfunds offered through the Contract. The table assumes a $1,000investment held for the six months indicated. Please refer to the Fundprospectus for additional information on operating expenses.
Actual Fund ExpensesThe first line (Actual) of the table provides actual account values andexpenses. The “Ending Account Value” is derived from the Fund’s ac-tual return, which includes the effect of ongoing Fund expenses, butdoes not include the effect of ongoing Contract expenses.
You can estimate the Fund-level expenses you incurred during theperiod by following these steps. Of course, your account value and ex-
penses will differ from those in this illustration:
1. Divide your account value by $1,000.If an account had an $8,600 value, then $8,600 ÷ $1,000 = 8.6.
2. Multiply the result by the number under the heading “Fund-LevelExpenses Incurred During Period.”If Fund-Level Expenses Incurred During Period were $7.50, then
8.6 x $7.50 = $64.50.
In this illustration, the estimated expenses incurred this period at theFund level are $64.50.
Franklin Strategic IncomeSecurities Fund – Class 2
FSI-7
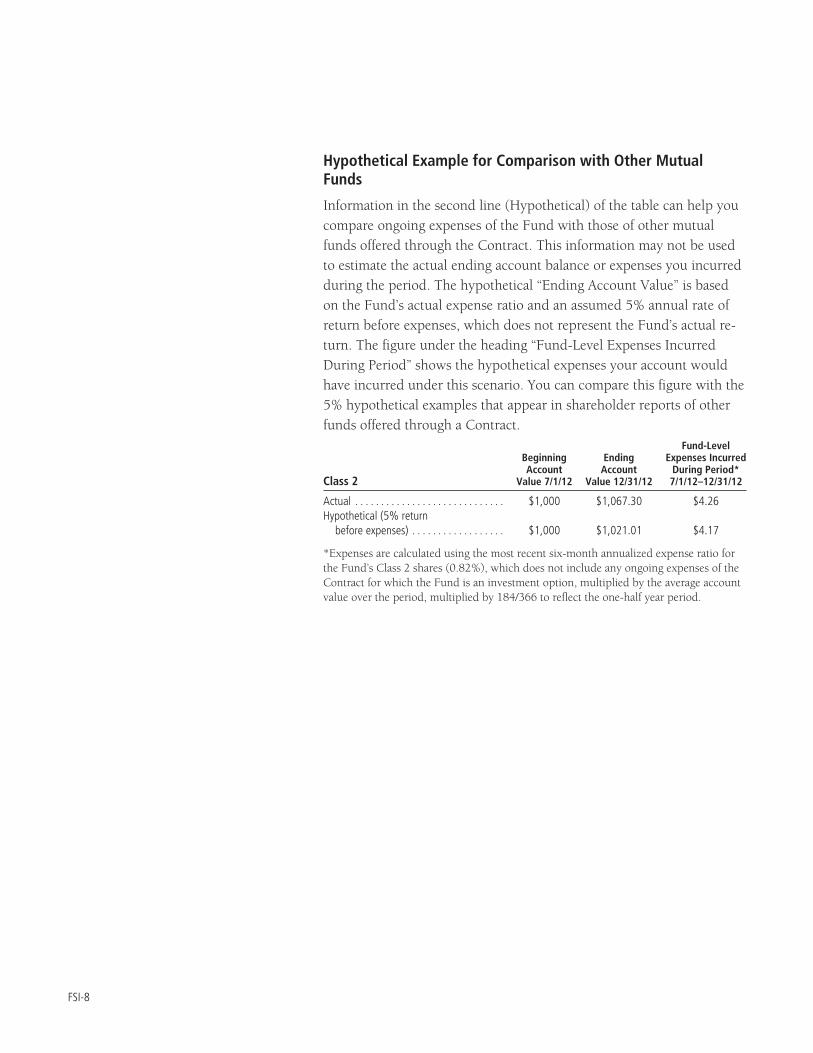
Hypothetical Example for Comparison with Other MutualFunds
Information in the second line (Hypothetical) of the table can help youcompare ongoing expenses of the Fund with those of other mutualfunds offered through the Contract. This information may not be usedto estimate the actual ending account balance or expenses you incurredduring the period. The hypothetical “Ending Account Value” is basedon the Fund’s actual expense ratio and an assumed 5% annual rate ofreturn before expenses, which does not represent the Fund’s actual re-turn. The figure under the heading “Fund-Level Expenses IncurredDuring Period” shows the hypothetical expenses your account wouldhave incurred under this scenario. You can compare this figure with the5% hypothetical examples that appear in shareholder reports of otherfunds offered through a Contract.
Class 2
BeginningAccount
Value 7/1/12
EndingAccount
Value 12/31/12
Fund-LevelExpenses Incurred
During Period*7/1/12–12/31/12
Actual . . . . . . . . . . . . . . . . . . . . . . . . . . . . . $1,000 $1,067.30 $4.26Hypothetical (5% return
before expenses) . . . . . . . . . . . . . . . . . . $1,000 $1,021.01 $4.17
*Expenses are calculated using the most recent six-month annualized expense ratio forthe Fund’s Class 2 shares (0.82%), which does not include any ongoing expenses of theContract for which the Fund is an investment option, multiplied by the average accountvalue over the period, multiplied by 184/366 to reflect the one-half year period.
FSI-8

SUPPLEMENT DATED SEPTEMBER 14, 2012TO THE STATEMENT OF ADDITIONAL INFORMATION
DATED MAY 1, 2012FRANKLIN STRATEGIC INCOME SECURITIES FUND
(A series of Franklin Templeton Variable Insurance Products Trust)
The Statement of Additional Information is amended as follows:
I. For Franklin Strategic Income Securities Fund, the Section entitled “Goals, Strategiesand Risks – Additional Strategies/Additional Considerations” on page 7 is amended to reflectthat the Fund may invest up to 5% of its net assets in collateralized debt obligations,including collateralized loan obligations.
II. For Franklin Strategic Income Securities Fund, the Section entitled “Goals,Strategies and Risks – Glossary of Investments, Techniques, Strategies and Their Risks –Collateralized loan obligations,” beginning on page 12 is replaced with the following:
Collateralized Debt Obligations Collateralized debt obligations and similarlystructured securities, sometimes known generally as CDOs, are interests in a trust orother special purpose entity (SPE) and are typically backed by a diversified pool ofbonds, loans or other debt obligations. CDOs are not limited to investments in onetype of debt and, accordingly, a CDO may be collateralized by corporate bonds,commercial loans, asset-backed securities, residential mortgage-backed securities,REITs, commercial mortgage-backed securities, emerging market debt, andmunicipal bonds. Certain CDOs may use derivatives contracts, such as credit defaultswaps, to create “synthetic” exposure to assets rather than holding such assetsdirectly, which entails the risks of derivative instruments described elsewhere in thisSAI.
Common varieties of CDOs include the following:
Collateralized loan obligations Collateralized loan obligations (CLOs) are interests in atrust typically collateralized substantially by a pool of loans, which may include,among others, domestic and foreign senior secured loans, senior unsecured loans,and subordinate corporate loans made to domestic and foreign borrowers, includingloans that may be rated below investment grade or equivalent unrated loans.
Collateralized bond obligations Collateralized bond obligations (CBOs) are interests in atrust typically backed substantially by a diversified pool of high risk, belowinvestment grade fixed income securities.
FSI-9
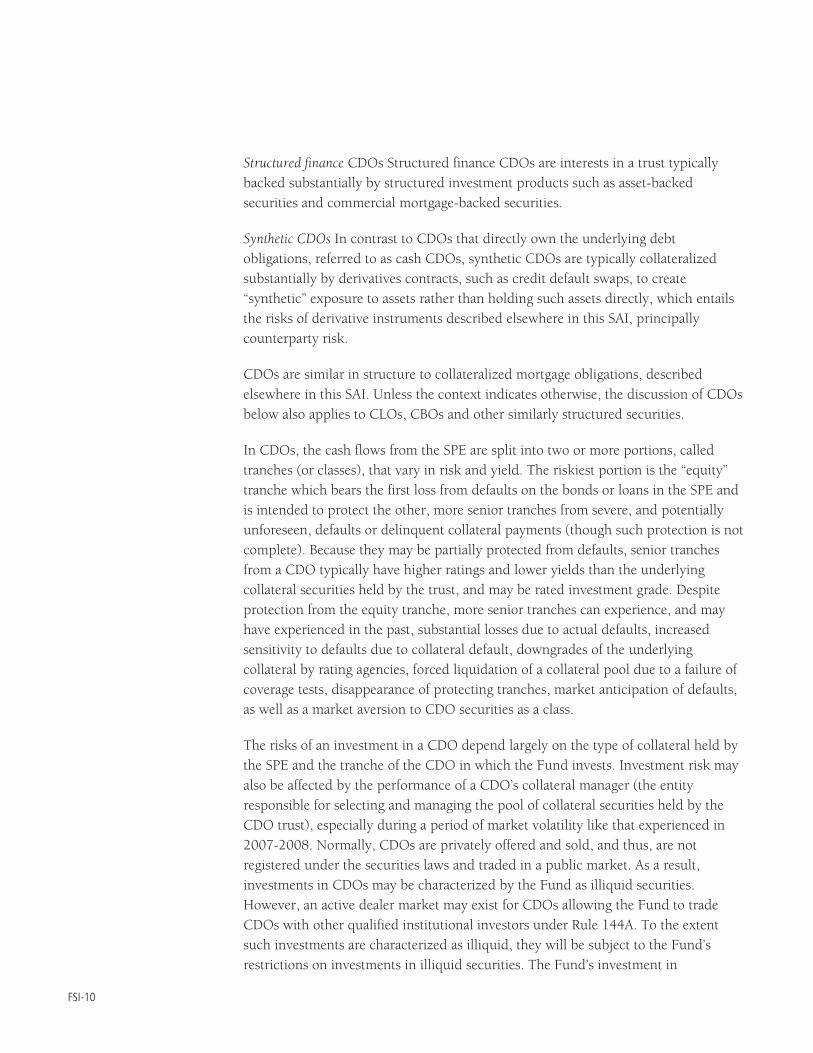
Structured finance CDOs Structured finance CDOs are interests in a trust typicallybacked substantially by structured investment products such as asset-backedsecurities and commercial mortgage-backed securities.
Synthetic CDOs In contrast to CDOs that directly own the underlying debtobligations, referred to as cash CDOs, synthetic CDOs are typically collateralizedsubstantially by derivatives contracts, such as credit default swaps, to create“synthetic” exposure to assets rather than holding such assets directly, which entailsthe risks of derivative instruments described elsewhere in this SAI, principallycounterparty risk.
CDOs are similar in structure to collateralized mortgage obligations, describedelsewhere in this SAI. Unless the context indicates otherwise, the discussion of CDOsbelow also applies to CLOs, CBOs and other similarly structured securities.
In CDOs, the cash flows from the SPE are split into two or more portions, calledtranches (or classes), that vary in risk and yield. The riskiest portion is the “equity”tranche which bears the first loss from defaults on the bonds or loans in the SPE andis intended to protect the other, more senior tranches from severe, and potentiallyunforeseen, defaults or delinquent collateral payments (though such protection is notcomplete). Because they may be partially protected from defaults, senior tranchesfrom a CDO typically have higher ratings and lower yields than the underlyingcollateral securities held by the trust, and may be rated investment grade. Despiteprotection from the equity tranche, more senior tranches can experience, and mayhave experienced in the past, substantial losses due to actual defaults, increasedsensitivity to defaults due to collateral default, downgrades of the underlyingcollateral by rating agencies, forced liquidation of a collateral pool due to a failure ofcoverage tests, disappearance of protecting tranches, market anticipation of defaults,as well as a market aversion to CDO securities as a class.
The risks of an investment in a CDO depend largely on the type of collateral held bythe SPE and the tranche of the CDO in which the Fund invests. Investment risk mayalso be affected by the performance of a CDO’s collateral manager (the entityresponsible for selecting and managing the pool of collateral securities held by theCDO trust), especially during a period of market volatility like that experienced in2007-2008. Normally, CDOs are privately offered and sold, and thus, are notregistered under the securities laws and traded in a public market. As a result,investments in CDOs may be characterized by the Fund as illiquid securities.However, an active dealer market may exist for CDOs allowing the Fund to tradeCDOs with other qualified institutional investors under Rule 144A. To the extentsuch investments are characterized as illiquid, they will be subject to the Fund’srestrictions on investments in illiquid securities. The Fund’s investment in
FSI-10

unregistered securities such as CDOs will not receive the same investor protection asan investment in registered securities.
All tranches of CDOs, including senior tranches with high credit ratings, canexperience, and many have recently experienced, substantial losses due to actualdefaults, increased sensitivity to future defaults due to the disappearance ofprotecting tranches, market anticipation of defaults, as well as market aversion toCDO securities as a class. Recently, prices of CDO tranches have declinedconsiderably. The drop in prices was initially triggered by the subprime mortgagecrisis. Subprime mortgages make up a significant portion of the mortgage securitiesthat collateralize many CDOs. As floating interest rates and mortgage default ratesincreased, the rating agencies that had rated the mortgage securities and CDOtransactions backed by such mortgages realized their default assumptions were toolow and began to downgrade the credit rating of these transactions. There can be noassurance that additional losses of equal or greater magnitude will not occur in thefuture.
In addition to the normal risks associated with debt securities and asset backedsecurities (e.g., interest rate risk, credit risk and default risk) described elsewhere inthis SAI, CDOs carry additional risks including, but not limited to: (i) the possibilitythat distributions from collateral securities will not be adequate to make interest orother payments; (ii) the quality of the collateral may decline in value or quality or gointo default or be downgraded; (iii) the Fund may invest in tranches of a CDO thatare subordinate to other classes; and (iv) the complex structure of the security maynot be fully understood at the time of investment and may produce disputes with theissuer, difficulty in valuing the security or unexpected investment results.
Certain issuers of CDOs may be deemed to be “investment companies” as defined inthe 1940 Act. As a result, the Fund’s investment in these structured investments fromthese issuers may be limited by the restrictions contained in the 1940 Act. CDOsgenerally charge management fees and administrative expenses that the shareholdersof the Fund would pay indirectly.
Please keep this supplement for future reference.
FSI-11

Franklin Templeton Variable Insurance Products Trust
Financial Highlights
Franklin Strategic Income Securities Fund
Year Ended December 31,
Class 1 2012 2011 2010 2009 2008
Per share operating performance(for a share outstanding throughout the year)
Net asset value, beginning of year . . . . . . . . . . . . . . . . . . . . . . . . . . . . . . . . . . . . . . $ 12.55 $ 12.99 $ 12.28 $ 10.58 $ 12.78
Income from investment operationsa:Net investment incomeb . . . . . . . . . . . . . . . . . . . . . . . . . . . . . . . . . . . . . . . . . . . 0.65 0.69 0.72 0.70 0.69Net realized and unrealized gains (losses) . . . . . . . . . . . . . . . . . . . . . . . . . . . . . . 0.92 (0.32) 0.61 1.95 (1.99)
Total from investment operations . . . . . . . . . . . . . . . . . . . . . . . . . . . . . . . . . . . . . . 1.57 0.37 1.33 2.65 (1.30)
Less distributions from:Net investment income and net of foreign currency gains . . . . . . . . . . . . . . . . . . . (0.93) (0.81) (0.62) (0.95) (0.87)Net realized gains . . . . . . . . . . . . . . . . . . . . . . . . . . . . . . . . . . . . . . . . . . . . . . . . (0.02) — — — (0.03)
Total distributions . . . . . . . . . . . . . . . . . . . . . . . . . . . . . . . . . . . . . . . . . . . . . . . . . . (0.95) (0.81) (0.62) (0.95) (0.90)
Net asset value, end of year . . . . . . . . . . . . . . . . . . . . . . . . . . . . . . . . . . . . . . . . . . $ 13.17 $ 12.55 $ 12.99 $ 12.28 $ 10.58
Total returnc . . . . . . . . . . . . . . . . . . . . . . . . . . . . . . . . . . . . . . . . . . . . . . . . . . . . . . 13.12% 2.78% 11.21% 26.11% (11.03)%
Ratios to average net assetsExpenses . . . . . . . . . . . . . . . . . . . . . . . . . . . . . . . . . . . . . . . . . . . . . . . . . . . . . . . . 0.58% 0.60%d 0.59%d 0.58%d 0.61%d
Net investment income . . . . . . . . . . . . . . . . . . . . . . . . . . . . . . . . . . . . . . . . . . . . . . 5.04% 5.36% 5.71% 6.13% 5.83%
Supplemental dataNet assets, end of year (000’s) . . . . . . . . . . . . . . . . . . . . . . . . . . . . . . . . . . . . . . . . $1,019,537 $1,043,690 $1,195,149 $1,173,313 $ 903,358Portfolio turnover rate . . . . . . . . . . . . . . . . . . . . . . . . . . . . . . . . . . . . . . . . . . . . . . . 49.98% 55.65% 56.46% 56.19% 47.68%Portfolio turnover rate excluding mortgage dollar rollse . . . . . . . . . . . . . . . . . . . . . . . 48.75% 55.65% 56.46% 56.19% 47.68%
aThe amount shown for a share outstanding throughout the period may not correlate with the Statement of Operations for the period due to the timing of salesand repurchases of the Fund shares in relation to income earned and/or fluctuating market value of the investments of the Fund.bBased on average daily shares outstanding.cTotal return does not include fees, charges or expenses imposed by the variable annuity and life insurance contracts for which the Franklin Templeton VariableInsurance Products Trust serves as an underlying investment vehicle.dBenefit of expense reduction rounds to less than 0.01%.eSee Note 1(h) regarding mortgage dollar rolls.
The accompanying notes are an integral part of these financial statements.FSI-12

Franklin Templeton Variable Insurance Products Trust
Financial Highlights (continued)
Franklin Strategic Income Securities Fund
Year Ended December 31,
Class 2 2012 2011 2010 2009 2008
Per share operating performance(for a share outstanding throughout the year)
Net asset value, beginning of year . . . . . . . . . . . . . . . . . . . . . . . . . . . . . . . . . . . . . . . . . . . . $ 12.27 $ 12.72 $ 12.05 $ 10.41 $ 12.60
Income from investment operationsa:Net investment incomeb . . . . . . . . . . . . . . . . . . . . . . . . . . . . . . . . . . . . . . . . . . . . . . . . . 0.60 0.64 0.68 0.66 0.65Net realized and unrealized gains (losses) . . . . . . . . . . . . . . . . . . . . . . . . . . . . . . . . . . . . 0.89 (0.30) 0.59 1.91 (1.96)
Total from investment operations . . . . . . . . . . . . . . . . . . . . . . . . . . . . . . . . . . . . . . . . . . . . . 1.49 0.34 1.27 2.57 (1.31)
Less distributions from:Net investment income and net of foreign currency gains . . . . . . . . . . . . . . . . . . . . . . . . . (0.90) (0.79) (0.60) (0.93) (0.85)Net realized gains . . . . . . . . . . . . . . . . . . . . . . . . . . . . . . . . . . . . . . . . . . . . . . . . . . . . . . (0.02) — — — (0.03)
Total distributions . . . . . . . . . . . . . . . . . . . . . . . . . . . . . . . . . . . . . . . . . . . . . . . . . . . . . . . . (0.92) (0.79) (0.60) (0.93) (0.88)
Net asset value, end of year . . . . . . . . . . . . . . . . . . . . . . . . . . . . . . . . . . . . . . . . . . . . . . . . . $ 12.84 $ 12.27 $ 12.72 $ 12.05 $ 10.41
Total returnc . . . . . . . . . . . . . . . . . . . . . . . . . . . . . . . . . . . . . . . . . . . . . . . . . . . . . . . . . . . . 12.75% 2.57% 10.91% 25.75% (11.24)%
Ratios to average net assetsExpenses . . . . . . . . . . . . . . . . . . . . . . . . . . . . . . . . . . . . . . . . . . . . . . . . . . . . . . . . . . . . . . 0.83% 0.85%d 0.84%d 0.83%d 0.86%d
Net investment income . . . . . . . . . . . . . . . . . . . . . . . . . . . . . . . . . . . . . . . . . . . . . . . . . . . . 4.79% 5.11% 5.46% 5.88% 5.58%
Supplemental dataNet assets, end of year (000’s) . . . . . . . . . . . . . . . . . . . . . . . . . . . . . . . . . . . . . . . . . . . . . . . $158,451 $123,749 $101,347 $ 68,240 $ 33,155Portfolio turnover rate . . . . . . . . . . . . . . . . . . . . . . . . . . . . . . . . . . . . . . . . . . . . . . . . . . . . . 49.98% 55.65% 56.46% 56.19% 47.68%Portfolio turnover rate excluding mortgage dollar rollse . . . . . . . . . . . . . . . . . . . . . . . . . . . . . 48.75% 55.65% 56.46% 56.19% 47.68%
aThe amount shown for a share outstanding throughout the period may not correlate with the Statement of Operations for the period due to the timing of salesand repurchases of the Fund shares in relation to income earned and/or fluctuating market value of the investments of the Fund.bBased on average daily shares outstanding.cTotal return does not include fees, charges or expenses imposed by the variable annuity and life insurance contracts for which the Franklin Templeton VariableInsurance Products Trust serves as an underlying investment vehicle.dBenefit of expense reduction rounds to less than 0.01%.eSee Note 1(h) regarding mortgage dollar rolls.
The accompanying notes are an integral part of these financial statements. FSI-13

Franklin Templeton Variable Insurance Products Trust
Financial Highlights (continued)
Franklin Strategic Income Securities Fund
Year Ended December 31,
Class 4 2012 2011 2010 2009 2008a
Per share operating performance(for a share outstanding throughout the year)
Net asset value, beginning of year . . . . . . . . . . . . . . . . . . . . . . . . . . . . . . . . . . . . . . . . . . . . $ 12.44 $ 12.88 $ 12.20 $ 10.54 $ 12.84
Income from investment operationsb:Net investment incomec . . . . . . . . . . . . . . . . . . . . . . . . . . . . . . . . . . . . . . . . . . . . . . . . . 0.60 0.64 0.67 0.66 0.53Net realized and unrealized gains (losses) . . . . . . . . . . . . . . . . . . . . . . . . . . . . . . . . . . . . 0.91 (0.31) 0.60 1.94 (1.93)
Total from investment operations . . . . . . . . . . . . . . . . . . . . . . . . . . . . . . . . . . . . . . . . . . . . 1.51 0.33 1.27 2.60 (1.40)
Less distributions from:Net investment income and net of foreign currency gains . . . . . . . . . . . . . . . . . . . . . . . . . (0.89) (0.77) (0.59) (0.94) (0.87)Net realized gains . . . . . . . . . . . . . . . . . . . . . . . . . . . . . . . . . . . . . . . . . . . . . . . . . . . . . . (0.02) — — — (0.03)
Total distributions . . . . . . . . . . . . . . . . . . . . . . . . . . . . . . . . . . . . . . . . . . . . . . . . . . . . . . . . (0.91) (0.77) (0.59) (0.94) (0.90)
Net asset value, end of year . . . . . . . . . . . . . . . . . . . . . . . . . . . . . . . . . . . . . . . . . . . . . . . . $ 13.04 $ 12.44 $ 12.88 $ 12.20 $ 10.54
Total returnd . . . . . . . . . . . . . . . . . . . . . . . . . . . . . . . . . . . . . . . . . . . . . . . . . . . . . . . . . . . . 12.67% 2.46% 10.88% 25.52% (11.69)%
Ratios to average net assetse
Expenses . . . . . . . . . . . . . . . . . . . . . . . . . . . . . . . . . . . . . . . . . . . . . . . . . . . . . . . . . . . . . . 0.93% 0.95%f 0.94%f 0.93%f 0.96%f
Net investment income . . . . . . . . . . . . . . . . . . . . . . . . . . . . . . . . . . . . . . . . . . . . . . . . . . . . 4.69% 5.01% 5.36% 5.78% 5.48%
Supplemental dataNet assets, end of year (000’s) . . . . . . . . . . . . . . . . . . . . . . . . . . . . . . . . . . . . . . . . . . . . . . $196,479 $188,786 $188,178 $162,074 $ 59,766Portfolio turnover rate . . . . . . . . . . . . . . . . . . . . . . . . . . . . . . . . . . . . . . . . . . . . . . . . . . . . . 49.98% 55.65% 56.46% 56.19% 47.68%Portfolio turnover rate excluding mortgage dollar rollsg . . . . . . . . . . . . . . . . . . . . . . . . . . . . 48.75% 55.65% 56.46% 56.19% 47.68%
aFor the period February 29, 2008 (effective date) to December 31, 2008.bThe amount shown for a share outstanding throughout the period may not correlate with the Statement of Operations for the period due to the timing of salesand repurchases of the Fund shares in relation to income earned and/or fluctuating market value of the investments of the Fund.cBased on average daily shares outstanding.dTotal return does not include fees, charges or expenses imposed by the variable annuity and life insurance contracts for which the Franklin Templeton VariableInsurance Products Trust serves as an underlying investment vehicle. Total return is not annualized for periods less than one year.eRatios are annualized for periods less than one year.fBenefit of expense reduction rounds to less than 0.01%.gSee Note 1(h) regarding mortgage dollar rolls.
The accompanying notes are an integral part of these financial statements.FSI-14

Franklin Templeton Variable Insurance Products TrustStatement of Investments, December 31, 2012
Franklin Strategic Income Securities Fund Country Shares Value
Common Stocks and Other Equity Interests 0.8%Consumer Durables & Apparel 0.0%
a,bComfort Co. Inc., Escrow Account . . . . . . . . . . . . . . . . . . . . . . . . . . . . . . . . . . . . . . . . . . . United States 13,427 $ —
Consumer Services 0.1%a,c,dTurtle Bay Resort . . . . . . . . . . . . . . . . . . . . . . . . . . . . . . . . . . . . . . . . . . . . . . . . . . . . . . . United States 1,901,449 1,730,319
Materials 0.1%a,bNewPage Corp., Litigation Trust . . . . . . . . . . . . . . . . . . . . . . . . . . . . . . . . . . . . . . . . . . . . United States 2,500,000 —a,eNewPage Holdings Inc. . . . . . . . . . . . . . . . . . . . . . . . . . . . . . . . . . . . . . . . . . . . . . . . . . . . United States 10,000 958,000
958,000
Media 0.6%aMGM Holdings Inc., A . . . . . . . . . . . . . . . . . . . . . . . . . . . . . . . . . . . . . . . . . . . . . . . . . . . United States 207,949 7,936,727
Total Common Stocks (Cost $10,612,261) . . . . . . . . . . . . . . . . . . . . . . . . 10,625,046
Preferred Stocks (Cost $865,000) 0.1%Diversified Financials 0.1%GMAC Capital Trust I, 8.125%, pfd. . . . . . . . . . . . . . . . . . . . . . . . . . . . . . . . . . . . . . . . . . United States 34,600 922,090
PrincipalAmount*
Corporate Bonds 34.1%Automobiles & Components 0.4%Exide Technologies, senior secured note, 8.625%, 2/01/18 . . . . . . . . . . . . . . . . . . . . . . . . United States 1,400,000 1,193,500Ford Motor Credit Co. LLC, senior note,
6.625%, 8/15/17 . . . . . . . . . . . . . . . . . . . . . . . . . . . . . . . . . . . . . . . . . . . . . . . . . . . . . United States 1,000,000 1,169,2715.00%, 5/15/18 . . . . . . . . . . . . . . . . . . . . . . . . . . . . . . . . . . . . . . . . . . . . . . . . . . . . . . United States 1,000,000 1,105,5188.125%, 1/15/20 . . . . . . . . . . . . . . . . . . . . . . . . . . . . . . . . . . . . . . . . . . . . . . . . . . . . . United States 1,200,000 1,540,9475.75%, 2/01/21 . . . . . . . . . . . . . . . . . . . . . . . . . . . . . . . . . . . . . . . . . . . . . . . . . . . . . . United States 600,000 691,660
5,700,896
Banks 1.4%fBanco do Brasil SA, sub. note, 144A, 5.875%, 1/26/22 . . . . . . . . . . . . . . . . . . . . . . . . . . . Brazil 3,500,000 3,867,903CIT Group Inc., senior note,
5.375%, 5/15/20 . . . . . . . . . . . . . . . . . . . . . . . . . . . . . . . . . . . . . . . . . . . . . . . . . . . . . United States 1,600,000 1,756,0005.00%, 8/15/22 . . . . . . . . . . . . . . . . . . . . . . . . . . . . . . . . . . . . . . . . . . . . . . . . . . . . . . United States 1,300,000 1,391,291
f144A, 6.625%, 4/01/18 . . . . . . . . . . . . . . . . . . . . . . . . . . . . . . . . . . . . . . . . . . . . . . . . United States 500,000 567,500HSBC USA Inc., sub. note, 5.00%, 9/27/20 . . . . . . . . . . . . . . . . . . . . . . . . . . . . . . . . . . . . United States 3,500,000 3,824,303Regions Bank, sub. note, 7.50%, 5/15/18 . . . . . . . . . . . . . . . . . . . . . . . . . . . . . . . . . . . . . United States 1,000,000 1,208,750Regions Financial Corp., senior note,
7.75%, 11/10/14 . . . . . . . . . . . . . . . . . . . . . . . . . . . . . . . . . . . . . . . . . . . . . . . . . . . . . United States 2,500,000 2,778,2505.75%, 6/15/15 . . . . . . . . . . . . . . . . . . . . . . . . . . . . . . . . . . . . . . . . . . . . . . . . . . . . . . United States 300,000 325,125
Royal Bank of Scotland Group PLC, sub. note, 6.125%, 12/15/22 . . . . . . . . . . . . . . . . . . . United Kingdom 400,000 422,750The Royal Bank of Scotland PLC, sub. note, 6.934%, 4/09/18 . . . . . . . . . . . . . . . . . . . . . . United Kingdom 2,300,000 EUR 3,429,640
19,571,512
Capital Goods 0.8%fAbengoa Finance SAU, senior note, 144A, 8.875%, 11/01/17 . . . . . . . . . . . . . . . . . . . . . . Spain 3,500,000 3,307,500fKM Germany Holdings GmbH, secured note, 144A, 8.75%, 12/15/20 . . . . . . . . . . . . . . . . Germany 1,200,000 EUR 1,659,727Meritor Inc., senior note, 10.625%, 3/15/18 . . . . . . . . . . . . . . . . . . . . . . . . . . . . . . . . . . . United States 3,000,000 3,142,500Navistar International Corp., senior note, 8.25%, 11/01/21 . . . . . . . . . . . . . . . . . . . . . . . . United States 1,600,000 1,552,000Terex Corp., senior note, 6.00%, 5/15/21 . . . . . . . . . . . . . . . . . . . . . . . . . . . . . . . . . . . . . United States 1,200,000 1,269,000
10,930,727
Commercial & Professional Services 0.5%fAlgeco Scotsman Global Finance PLC, secured note, 144A, 8.50%, 10/15/18 . . . . . . . . . . . United Kingdom 2,500,000 2,595,313United Rentals North America Inc., senior sub. note, 8.375%, 9/15/20 . . . . . . . . . . . . . . . . United States 3,500,000 3,893,750
6,489,063
FSI-15

Franklin Templeton Variable Insurance Products TrustStatement of Investments, December 31, 2012 (continued)
Franklin Strategic Income Securities Fund CountryPrincipalAmount* Value
Corporate Bonds (continued)Consumer Durables & Apparel 0.7%Jarden Corp., senior sub. note, 7.50%, 5/01/17 . . . . . . . . . . . . . . . . . . . . . . . . . . . . . . . . . . . United States 2,500,000 $ 2,828,125M/I Homes Inc., senior note, 8.625%, 11/15/18 . . . . . . . . . . . . . . . . . . . . . . . . . . . . . . . . . . . United States 2,400,000 2,652,000Shea Homes LP/Funding Corp., senior secured note, 8.625%, 5/15/19 . . . . . . . . . . . . . . . . . . United States 2,000,000 2,220,000Visant Corp., senior note, 10.00%, 10/01/17 . . . . . . . . . . . . . . . . . . . . . . . . . . . . . . . . . . . . . United States 2,800,000 2,527,000
10,227,125
Consumer Services 1.2%ClubCorp Club Operations Inc., senior note, 10.00%, 12/01/18 . . . . . . . . . . . . . . . . . . . . . . . United States 2,900,000 3,240,750
f,gFontainebleau Las Vegas, 144A, 11.00%, 6/15/15 . . . . . . . . . . . . . . . . . . . . . . . . . . . . . . . . United States 2,500,000 1,575Harrah’s Operating Co. Inc., senior secured note, 11.25%, 6/01/17 . . . . . . . . . . . . . . . . . . . . United States 4,500,000 4,843,125MGM Resorts International, senior note,
6.625%, 7/15/15 . . . . . . . . . . . . . . . . . . . . . . . . . . . . . . . . . . . . . . . . . . . . . . . . . . . . . . . United States 3,500,000 3,771,2506.625%, 12/15/21 . . . . . . . . . . . . . . . . . . . . . . . . . . . . . . . . . . . . . . . . . . . . . . . . . . . . . . United States 400,000 400,500
f144A, 6.75%, 10/01/20 . . . . . . . . . . . . . . . . . . . . . . . . . . . . . . . . . . . . . . . . . . . . . . . . . . United States 200,000 204,750Pinnacle Entertainment Inc., senior note, 8.625%, 8/01/17 . . . . . . . . . . . . . . . . . . . . . . . . . . United States 1,500,000 1,618,125
fShingle Springs Tribal Gaming Authority, senior note, 144A, 9.375%, 6/15/15 . . . . . . . . . . . . United States 2,000,000 1,970,000
16,050,075
Diversified Financials 3.4%Ally Financial Inc., senior note, 7.50%, 9/15/20 . . . . . . . . . . . . . . . . . . . . . . . . . . . . . . . . . . . United States 2,500,000 3,028,125Bank of America Corp.,
hpfd., sub. bond, M, 8.125% to 5/15/18, FRN thereafter, Perpetual . . . . . . . . . . . . . . . . . . . United States 4,000,000 4,434,040senior note, 5.65%, 5/01/18 . . . . . . . . . . . . . . . . . . . . . . . . . . . . . . . . . . . . . . . . . . . . . . . United States 1,500,000 1,746,552
Capital One Capital VI, pfd., junior sub. bond, 8.875%, 5/15/40 . . . . . . . . . . . . . . . . . . . . . . United States 2,000,000 2,000,000Citigroup Inc., senior note,
6.125%, 11/21/17 . . . . . . . . . . . . . . . . . . . . . . . . . . . . . . . . . . . . . . . . . . . . . . . . . . . . . . United States 1,500,000 1,786,5455.375%, 8/09/20 . . . . . . . . . . . . . . . . . . . . . . . . . . . . . . . . . . . . . . . . . . . . . . . . . . . . . . . United States 1,000,000 1,179,274
E*TRADE Financial Corp., senior note, 6.375%, 11/15/19 . . . . . . . . . . . . . . . . . . . . . . . . . . . United States 1,400,000 1,442,000General Electric Capital Corp.,
senior note, A, 8.50%, 4/06/18 . . . . . . . . . . . . . . . . . . . . . . . . . . . . . . . . . . . . . . . . . . . . . United States 55,000,000 MXN 4,622,150sub. note, 5.30%, 2/11/21 . . . . . . . . . . . . . . . . . . . . . . . . . . . . . . . . . . . . . . . . . . . . . . . . United States 1,000,000 1,161,639
GMAC Inc., sub. note, 8.00%, 12/31/18 . . . . . . . . . . . . . . . . . . . . . . . . . . . . . . . . . . . . . . . . United States 900,000 1,057,500International Lease Finance Corp.,
senior note, 8.25%, 12/15/20 . . . . . . . . . . . . . . . . . . . . . . . . . . . . . . . . . . . . . . . . . . . . . . United States 1,000,000 1,195,000fsenior secured note, 144A, 6.75%, 9/01/16 . . . . . . . . . . . . . . . . . . . . . . . . . . . . . . . . . . . United States 2,000,000 2,255,000
JPMorgan Chase & Co.,6.00%, 1/15/18 . . . . . . . . . . . . . . . . . . . . . . . . . . . . . . . . . . . . . . . . . . . . . . . . . . . . . . . . United States 1,500,000 1,797,137senior note, 4.25%, 10/15/20 . . . . . . . . . . . . . . . . . . . . . . . . . . . . . . . . . . . . . . . . . . . . . . United States 2,500,000 2,782,362senior note, 3.25%, 9/23/22 . . . . . . . . . . . . . . . . . . . . . . . . . . . . . . . . . . . . . . . . . . . . . . . United States 2,000,000 2,061,448
fKKR Group Finance Co., senior note, 144A, 6.375%, 9/29/20 . . . . . . . . . . . . . . . . . . . . . . . . United States 3,000,000 3,484,065Merrill Lynch & Co. Inc., senior note, 6.40%, 8/28/17 . . . . . . . . . . . . . . . . . . . . . . . . . . . . . . United States 2,000,000 2,350,348Morgan Stanley, senior note,
6.00%, 4/28/15 . . . . . . . . . . . . . . . . . . . . . . . . . . . . . . . . . . . . . . . . . . . . . . . . . . . . . . . . United States 2,000,000 2,179,4645.50%, 7/24/20 . . . . . . . . . . . . . . . . . . . . . . . . . . . . . . . . . . . . . . . . . . . . . . . . . . . . . . . . United States 1,500,000 1,688,6785.50%, 7/28/21 . . . . . . . . . . . . . . . . . . . . . . . . . . . . . . . . . . . . . . . . . . . . . . . . . . . . . . . . United States 800,000 908,993
fNeuberger Berman Group LLC/Finance Corp., senior note, 144A,5.625%, 3/15/20 . . . . . . . . . . . . . . . . . . . . . . . . . . . . . . . . . . . . . . . . . . . . . . . . . . . . . . . United States 600,000 631,5005.875%, 3/15/22 . . . . . . . . . . . . . . . . . . . . . . . . . . . . . . . . . . . . . . . . . . . . . . . . . . . . . . . United States 1,400,000 1,491,000
fNuveen Investments Inc., senior note, 144A, 9.50%, 10/15/20 . . . . . . . . . . . . . . . . . . . . . . . United States 1,800,000 1,800,000
47,082,820
Energy 6.8%Apache Corp., senior bond, 2.625%, 1/15/23 . . . . . . . . . . . . . . . . . . . . . . . . . . . . . . . . . . . . United States 5,000,000 4,995,435
FSI-16

Franklin Templeton Variable Insurance Products TrustStatement of Investments, December 31, 2012 (continued)
Franklin Strategic Income Securities Fund CountryPrincipalAmount* Value
Corporate Bonds (continued)Energy (continued)Atlas Pipeline Partners LP, senior note, 8.75%, 6/15/18 . . . . . . . . . . . . . . . . . . . . . . . . . . . United States 2,000,000 $ 2,140,000Chaparral Energy Inc., senior note,
9.875%, 10/01/20 . . . . . . . . . . . . . . . . . . . . . . . . . . . . . . . . . . . . . . . . . . . . . . . . . . . . United States 1,500,000 1,713,7508.25%, 9/01/21 . . . . . . . . . . . . . . . . . . . . . . . . . . . . . . . . . . . . . . . . . . . . . . . . . . . . . . United States 1,000,000 1,090,0007.625%, 11/15/22 . . . . . . . . . . . . . . . . . . . . . . . . . . . . . . . . . . . . . . . . . . . . . . . . . . . . United States 300,000 316,500
CHC Helicopter SA, senior secured note, first lien, 9.25%, 10/15/20 . . . . . . . . . . . . . . . . . . Canada 3,500,000 3,701,250Chesapeake Energy Corp., senior note,
6.625%, 8/15/20 . . . . . . . . . . . . . . . . . . . . . . . . . . . . . . . . . . . . . . . . . . . . . . . . . . . . . United States 4,000,000 4,310,0006.125%, 2/15/21 . . . . . . . . . . . . . . . . . . . . . . . . . . . . . . . . . . . . . . . . . . . . . . . . . . . . . United States 1,500,000 1,563,750
Compagnie Generale de Geophysique-Veritas, senior note,7.75%, 5/15/17 . . . . . . . . . . . . . . . . . . . . . . . . . . . . . . . . . . . . . . . . . . . . . . . . . . . . . . France 1,500,000 1,567,5006.50%, 6/01/21 . . . . . . . . . . . . . . . . . . . . . . . . . . . . . . . . . . . . . . . . . . . . . . . . . . . . . . France 2,000,000 2,150,000
CONSOL Energy Inc., senior note,8.00%, 4/01/17 . . . . . . . . . . . . . . . . . . . . . . . . . . . . . . . . . . . . . . . . . . . . . . . . . . . . . . United States 1,500,000 1,631,2508.25%, 4/01/20 . . . . . . . . . . . . . . . . . . . . . . . . . . . . . . . . . . . . . . . . . . . . . . . . . . . . . . United States 1,500,000 1,631,2506.375%, 3/01/21 . . . . . . . . . . . . . . . . . . . . . . . . . . . . . . . . . . . . . . . . . . . . . . . . . . . . . United States 200,000 206,000
Crosstex Energy LP/Crosstex Energy Finance Corp., senior note, 8.875%, 2/15/18 . . . . . . . . United States 3,000,000 3,255,000El Paso Corp., senior bond, 6.50%, 9/15/20 . . . . . . . . . . . . . . . . . . . . . . . . . . . . . . . . . . . United States 1,500,000 1,699,743Energy Transfer Equity LP, senior note, 7.50%, 10/15/20 . . . . . . . . . . . . . . . . . . . . . . . . . . United States 3,500,000 4,060,000Energy Transfer Partners LP, senior note, 5.20%, 2/01/22 . . . . . . . . . . . . . . . . . . . . . . . . . United States 900,000 1,027,453Energy XXI Gulf Coast Inc., senior note, 9.25%, 12/15/17 . . . . . . . . . . . . . . . . . . . . . . . . . United States 2,500,000 2,868,750Enterprise Products Operating LLC, junior sub. note, 7.034% to 1/15/18, FRN
thereafter, 1/15/68 . . . . . . . . . . . . . . . . . . . . . . . . . . . . . . . . . . . . . . . . . . . . . . . . . . . . United States 2,000,000 2,292,462fExpro Finance Luxembourg, senior secured note, 144A, 8.50%, 12/15/16 . . . . . . . . . . . . . United Kingdom 3,113,000 3,268,650
f,iGaz Capital SA, (OJSC Gazprom), loan participation,senior bond, 144A, 6.51%, 3/07/22 . . . . . . . . . . . . . . . . . . . . . . . . . . . . . . . . . . . . . . . Russia 500,000 598,750senior note, 144A, 5.092%, 11/29/15 . . . . . . . . . . . . . . . . . . . . . . . . . . . . . . . . . . . . . Russia 3,000,000 3,222,720
fHalcon Resources Corp., senior note, 144A, 8.875%, 5/15/21 . . . . . . . . . . . . . . . . . . . . . . United States 1,000,000 1,065,000fKinder Morgan Finance Co. LLC, senior secured note, 144A, 6.00%, 1/15/18 . . . . . . . . . . . United States 3,500,000 3,863,153Linn Energy LLC/Finance Corp., senior note,
8.625%, 4/15/20 . . . . . . . . . . . . . . . . . . . . . . . . . . . . . . . . . . . . . . . . . . . . . . . . . . . . . United States 3,000,000 3,285,0007.75%, 2/01/21 . . . . . . . . . . . . . . . . . . . . . . . . . . . . . . . . . . . . . . . . . . . . . . . . . . . . . . United States 1,000,000 1,070,000
Martin Midstream Partners LP, senior note, 8.875%, 4/01/18 . . . . . . . . . . . . . . . . . . . . . . United States 1,754,000 1,876,780Offshore Group Investment Ltd.,
ffirst lien, 144A, 7.50%, 11/01/19 . . . . . . . . . . . . . . . . . . . . . . . . . . . . . . . . . . . . . . . . . United States 2,200,000 2,233,000senior secured note, 11.50%, 8/01/15 . . . . . . . . . . . . . . . . . . . . . . . . . . . . . . . . . . . . . United States 1,352,000 1,477,060
fPBF Holding Co. LLC, senior secured note, 144A, 8.25%, 2/15/20 . . . . . . . . . . . . . . . . . . . United States 2,100,000 2,273,250Peabody Energy Corp., senior note,
6.00%, 11/15/18 . . . . . . . . . . . . . . . . . . . . . . . . . . . . . . . . . . . . . . . . . . . . . . . . . . . . . United States 700,000 747,2506.50%, 9/15/20 . . . . . . . . . . . . . . . . . . . . . . . . . . . . . . . . . . . . . . . . . . . . . . . . . . . . . . United States 2,500,000 2,693,7506.25%, 11/15/21 . . . . . . . . . . . . . . . . . . . . . . . . . . . . . . . . . . . . . . . . . . . . . . . . . . . . . United States 1,000,000 1,067,500
fPenn Virginia Resource Partners LP/Finance Corp. II, senior note, 144A,8.375%, 6/01/20 . . . . . . . . . . . . . . . . . . . . . . . . . . . . . . . . . . . . . . . . . . . . . . . . . . . . . United States 1,600,000 1,732,000
Plains Exploration & Production Co., senior note,7.625%, 6/01/18 . . . . . . . . . . . . . . . . . . . . . . . . . . . . . . . . . . . . . . . . . . . . . . . . . . . . . United States 3,000,000 3,172,5006.125%, 6/15/19 . . . . . . . . . . . . . . . . . . . . . . . . . . . . . . . . . . . . . . . . . . . . . . . . . . . . . United States 600,000 657,0006.875%, 2/15/23 . . . . . . . . . . . . . . . . . . . . . . . . . . . . . . . . . . . . . . . . . . . . . . . . . . . . . United States 1,000,000 1,147,500
QR Energy LP/QRE Finance, senior note, 9.25%, 8/01/20 . . . . . . . . . . . . . . . . . . . . . . . . . . United States 1,800,000 1,899,000Quicksilver Resources Inc., senior note,
8.25%, 8/01/15 . . . . . . . . . . . . . . . . . . . . . . . . . . . . . . . . . . . . . . . . . . . . . . . . . . . . . . United States 3,000,000 2,790,0009.125%, 8/15/19 . . . . . . . . . . . . . . . . . . . . . . . . . . . . . . . . . . . . . . . . . . . . . . . . . . . . . United States 500,000 447,500
fSamson Investment Co., senior note, 144A, 9.75%, 2/15/20 . . . . . . . . . . . . . . . . . . . . . . . United States 3,500,000 3,718,750
FSI-17

Franklin Templeton Variable Insurance Products TrustStatement of Investments, December 31, 2012 (continued)
Franklin Strategic Income Securities Fund CountryPrincipalAmount* Value
Corporate Bonds (continued)Energy (continued)SandRidge Energy Inc., senior note,
8.75%, 1/15/20 . . . . . . . . . . . . . . . . . . . . . . . . . . . . . . . . . . . . . . . . . . . . . . . . . . . . . . United States 1,000,000 $ 1,100,000f144A, 8.00%, 6/01/18 . . . . . . . . . . . . . . . . . . . . . . . . . . . . . . . . . . . . . . . . . . . . . . . . . United States 3,000,000 3,195,000
W&T Offshore Inc., senior note,8.50%, 6/15/19 . . . . . . . . . . . . . . . . . . . . . . . . . . . . . . . . . . . . . . . . . . . . . . . . . . . . . . United States 2,000,000 2,160,000
f144A, 8.50%, 6/15/19 . . . . . . . . . . . . . . . . . . . . . . . . . . . . . . . . . . . . . . . . . . . . . . . . . United States 800,000 864,000
93,845,206
Food & Staples Retailing 0.8%fCencosud SA, senior note, 144A, 4.875%, 1/20/23 . . . . . . . . . . . . . . . . . . . . . . . . . . . . . . Chile 3,500,000 3,592,592Rite Aid Corp., senior secured note,
9.75%, 6/12/16 . . . . . . . . . . . . . . . . . . . . . . . . . . . . . . . . . . . . . . . . . . . . . . . . . . . . . . United States 1,700,000 1,848,7508.00%, 8/15/20 . . . . . . . . . . . . . . . . . . . . . . . . . . . . . . . . . . . . . . . . . . . . . . . . . . . . . . United States 1,300,000 1,491,750
Safeway Inc., senior bond, 3.95%, 8/15/20 . . . . . . . . . . . . . . . . . . . . . . . . . . . . . . . . . . . . United States 3,500,000 3,503,304
10,436,396
Food, Beverage & Tobacco 1.1%fBoparan Finance PLC, senior note, 144A, 9.75%, 4/30/18 . . . . . . . . . . . . . . . . . . . . . . . . . United Kingdom 2,000,000 EUR 2,995,492fCEDC Finance Corp. International Inc., senior secured note, 144A, 9.125%, 12/01/16 . . . . Russia 1,800,000 1,119,375Del Monte Corp., senior note, 7.625%, 2/15/19 . . . . . . . . . . . . . . . . . . . . . . . . . . . . . . . . United States 4,000,000 4,190,000JBS USA LLC/Finance Inc., senior note,
11.625%, 5/01/14 . . . . . . . . . . . . . . . . . . . . . . . . . . . . . . . . . . . . . . . . . . . . . . . . . . . . United States 1,500,000 1,680,000f144A, 8.25%, 2/01/20 . . . . . . . . . . . . . . . . . . . . . . . . . . . . . . . . . . . . . . . . . . . . . . . . . United States 1,700,000 1,810,500
fKraft Foods Group Inc., senior bond, 144A, 3.50%, 6/06/22 . . . . . . . . . . . . . . . . . . . . . . . United States 3,000,000 3,204,939Pinnacle Foods Finance LLC/Pinnacle Foods Finance Corp., senior note, 9.25%, 4/01/15 . . . United States 496,000 505,920
15,506,226
Health Care Equipment & Services 1.3%CHS/Community Health Systems Inc.,
senior note, 8.00%, 11/15/19 . . . . . . . . . . . . . . . . . . . . . . . . . . . . . . . . . . . . . . . . . . . United States 2,100,000 2,283,750senior note, 7.125%, 7/15/20 . . . . . . . . . . . . . . . . . . . . . . . . . . . . . . . . . . . . . . . . . . . United States 700,000 748,125senior secured note, 5.125%, 8/15/18 . . . . . . . . . . . . . . . . . . . . . . . . . . . . . . . . . . . . . United States 1,100,000 1,149,500
DaVita HealthCare Partners Inc., senior note, 5.75%, 8/15/22 . . . . . . . . . . . . . . . . . . . . . . United States 1,400,000 1,482,250Emergency Medical Services Corp., senior note, 8.125%, 6/01/19 . . . . . . . . . . . . . . . . . . . United States 2,300,000 2,537,188HCA Inc.,
senior note, 6.50%, 2/15/16 . . . . . . . . . . . . . . . . . . . . . . . . . . . . . . . . . . . . . . . . . . . . United States 800,000 874,000senior note, 7.50%, 2/15/22 . . . . . . . . . . . . . . . . . . . . . . . . . . . . . . . . . . . . . . . . . . . . United States 2,000,000 2,300,000senior note, 5.875%, 5/01/23 . . . . . . . . . . . . . . . . . . . . . . . . . . . . . . . . . . . . . . . . . . . United States 500,000 518,750senior secured bond, 7.25%, 9/15/20 . . . . . . . . . . . . . . . . . . . . . . . . . . . . . . . . . . . . . . United States 300,000 333,750senior secured note, 5.875%, 3/15/22 . . . . . . . . . . . . . . . . . . . . . . . . . . . . . . . . . . . . . United States 1,900,000 2,075,750
fHologic Inc., senior note, 144A, 6.25%, 8/01/20 . . . . . . . . . . . . . . . . . . . . . . . . . . . . . . . . United States 900,000 974,250Laboratory Corp. of America Holdings, senior bond, 3.75%, 8/23/22 . . . . . . . . . . . . . . . . . United States 400,000 424,557Vanguard Health Holding Co. II LLC/Inc., senior note, 8.00%, 2/01/18 . . . . . . . . . . . . . . . . United States 2,000,000 2,080,000Vanguard Health Systems Inc., senior note, zero cpn., 2/01/16 . . . . . . . . . . . . . . . . . . . . . . United States 30,000 22,800
17,804,670
Insurance 0.5%MetLife Inc., junior sub. note, 6.40% to 12/15/36, FRN thereafter, 12/15/66 . . . . . . . . . . . United States 3,500,000 3,750,876
fMitsui Sumitomo Insurance Co. Ltd., junior sub. note, 144A, 7.00% to 3/15/22, FRNthereafter, 3/15/72 . . . . . . . . . . . . . . . . . . . . . . . . . . . . . . . . . . . . . . . . . . . . . . . . . . . . Japan 3,000,000 3,447,780
7,198,656
FSI-18
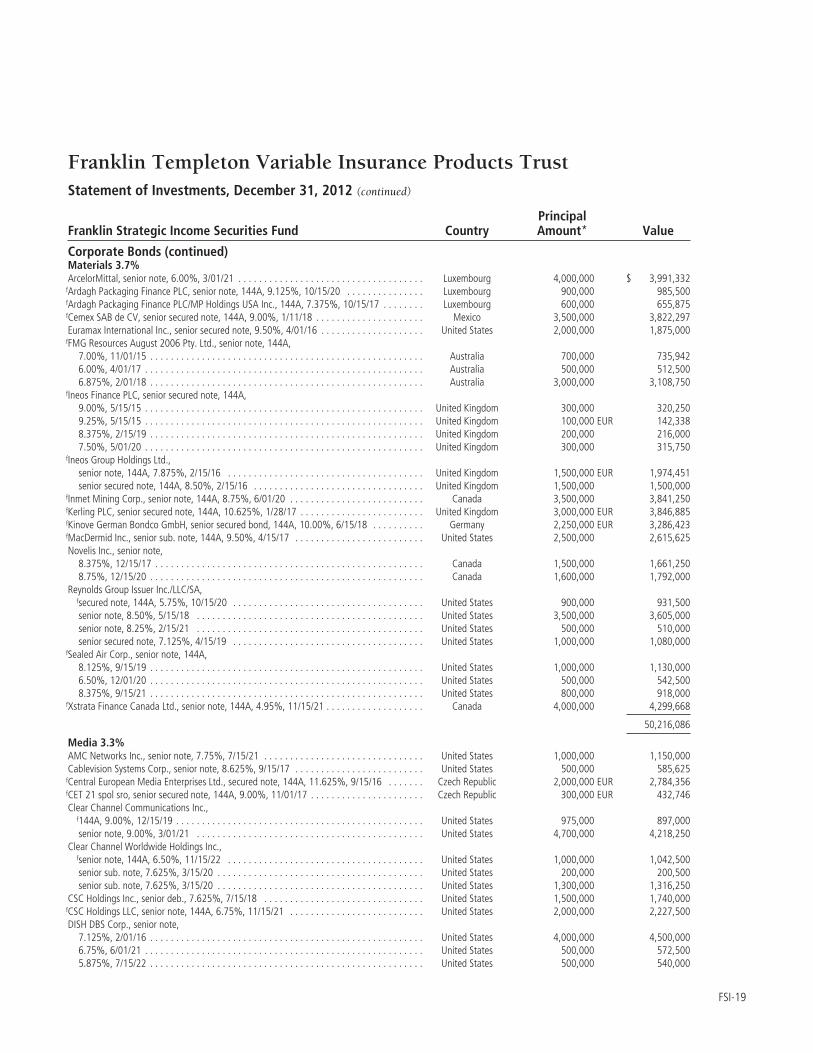
Franklin Templeton Variable Insurance Products TrustStatement of Investments, December 31, 2012 (continued)
Franklin Strategic Income Securities Fund CountryPrincipalAmount* Value
Corporate Bonds (continued)Materials 3.7%ArcelorMittal, senior note, 6.00%, 3/01/21 . . . . . . . . . . . . . . . . . . . . . . . . . . . . . . . . . . . . Luxembourg 4,000,000 $ 3,991,332
fArdagh Packaging Finance PLC, senior note, 144A, 9.125%, 10/15/20 . . . . . . . . . . . . . . . Luxembourg 900,000 985,500fArdagh Packaging Finance PLC/MP Holdings USA Inc., 144A, 7.375%, 10/15/17 . . . . . . . . Luxembourg 600,000 655,875fCemex SAB de CV, senior secured note, 144A, 9.00%, 1/11/18 . . . . . . . . . . . . . . . . . . . . . Mexico 3,500,000 3,822,297Euramax International Inc., senior secured note, 9.50%, 4/01/16 . . . . . . . . . . . . . . . . . . . . United States 2,000,000 1,875,000
fFMG Resources August 2006 Pty. Ltd., senior note, 144A,7.00%, 11/01/15 . . . . . . . . . . . . . . . . . . . . . . . . . . . . . . . . . . . . . . . . . . . . . . . . . . . . . Australia 700,000 735,9426.00%, 4/01/17 . . . . . . . . . . . . . . . . . . . . . . . . . . . . . . . . . . . . . . . . . . . . . . . . . . . . . . Australia 500,000 512,5006.875%, 2/01/18 . . . . . . . . . . . . . . . . . . . . . . . . . . . . . . . . . . . . . . . . . . . . . . . . . . . . . Australia 3,000,000 3,108,750
fIneos Finance PLC, senior secured note, 144A,9.00%, 5/15/15 . . . . . . . . . . . . . . . . . . . . . . . . . . . . . . . . . . . . . . . . . . . . . . . . . . . . . . United Kingdom 300,000 320,2509.25%, 5/15/15 . . . . . . . . . . . . . . . . . . . . . . . . . . . . . . . . . . . . . . . . . . . . . . . . . . . . . . United Kingdom 100,000 EUR 142,3388.375%, 2/15/19 . . . . . . . . . . . . . . . . . . . . . . . . . . . . . . . . . . . . . . . . . . . . . . . . . . . . . United Kingdom 200,000 216,0007.50%, 5/01/20 . . . . . . . . . . . . . . . . . . . . . . . . . . . . . . . . . . . . . . . . . . . . . . . . . . . . . . United Kingdom 300,000 315,750
fIneos Group Holdings Ltd.,senior note, 144A, 7.875%, 2/15/16 . . . . . . . . . . . . . . . . . . . . . . . . . . . . . . . . . . . . . . United Kingdom 1,500,000 EUR 1,974,451senior secured note, 144A, 8.50%, 2/15/16 . . . . . . . . . . . . . . . . . . . . . . . . . . . . . . . . . United Kingdom 1,500,000 1,500,000
fInmet Mining Corp., senior note, 144A, 8.75%, 6/01/20 . . . . . . . . . . . . . . . . . . . . . . . . . . Canada 3,500,000 3,841,250fKerling PLC, senior secured note, 144A, 10.625%, 1/28/17 . . . . . . . . . . . . . . . . . . . . . . . . United Kingdom 3,000,000 EUR 3,846,885fKinove German Bondco GmbH, senior secured bond, 144A, 10.00%, 6/15/18 . . . . . . . . . . Germany 2,250,000 EUR 3,286,423fMacDermid Inc., senior sub. note, 144A, 9.50%, 4/15/17 . . . . . . . . . . . . . . . . . . . . . . . . . United States 2,500,000 2,615,625Novelis Inc., senior note,
8.375%, 12/15/17 . . . . . . . . . . . . . . . . . . . . . . . . . . . . . . . . . . . . . . . . . . . . . . . . . . . . Canada 1,500,000 1,661,2508.75%, 12/15/20 . . . . . . . . . . . . . . . . . . . . . . . . . . . . . . . . . . . . . . . . . . . . . . . . . . . . . Canada 1,600,000 1,792,000
Reynolds Group Issuer Inc./LLC/SA,fsecured note, 144A, 5.75%, 10/15/20 . . . . . . . . . . . . . . . . . . . . . . . . . . . . . . . . . . . . . United States 900,000 931,500senior note, 8.50%, 5/15/18 . . . . . . . . . . . . . . . . . . . . . . . . . . . . . . . . . . . . . . . . . . . . United States 3,500,000 3,605,000senior note, 8.25%, 2/15/21 . . . . . . . . . . . . . . . . . . . . . . . . . . . . . . . . . . . . . . . . . . . . United States 500,000 510,000senior secured note, 7.125%, 4/15/19 . . . . . . . . . . . . . . . . . . . . . . . . . . . . . . . . . . . . . United States 1,000,000 1,080,000
fSealed Air Corp., senior note, 144A,8.125%, 9/15/19 . . . . . . . . . . . . . . . . . . . . . . . . . . . . . . . . . . . . . . . . . . . . . . . . . . . . . United States 1,000,000 1,130,0006.50%, 12/01/20 . . . . . . . . . . . . . . . . . . . . . . . . . . . . . . . . . . . . . . . . . . . . . . . . . . . . . United States 500,000 542,5008.375%, 9/15/21 . . . . . . . . . . . . . . . . . . . . . . . . . . . . . . . . . . . . . . . . . . . . . . . . . . . . . United States 800,000 918,000
fXstrata Finance Canada Ltd., senior note, 144A, 4.95%, 11/15/21 . . . . . . . . . . . . . . . . . . . Canada 4,000,000 4,299,668
50,216,086
Media 3.3%AMC Networks Inc., senior note, 7.75%, 7/15/21 . . . . . . . . . . . . . . . . . . . . . . . . . . . . . . . United States 1,000,000 1,150,000Cablevision Systems Corp., senior note, 8.625%, 9/15/17 . . . . . . . . . . . . . . . . . . . . . . . . . United States 500,000 585,625
fCentral European Media Enterprises Ltd., secured note, 144A, 11.625%, 9/15/16 . . . . . . . Czech Republic 2,000,000 EUR 2,784,356fCET 21 spol sro, senior secured note, 144A, 9.00%, 11/01/17 . . . . . . . . . . . . . . . . . . . . . . Czech Republic 300,000 EUR 432,746Clear Channel Communications Inc.,
f144A, 9.00%, 12/15/19 . . . . . . . . . . . . . . . . . . . . . . . . . . . . . . . . . . . . . . . . . . . . . . . . United States 975,000 897,000senior note, 9.00%, 3/01/21 . . . . . . . . . . . . . . . . . . . . . . . . . . . . . . . . . . . . . . . . . . . . United States 4,700,000 4,218,250
Clear Channel Worldwide Holdings Inc.,fsenior note, 144A, 6.50%, 11/15/22 . . . . . . . . . . . . . . . . . . . . . . . . . . . . . . . . . . . . . . United States 1,000,000 1,042,500senior sub. note, 7.625%, 3/15/20 . . . . . . . . . . . . . . . . . . . . . . . . . . . . . . . . . . . . . . . . United States 200,000 200,500senior sub. note, 7.625%, 3/15/20 . . . . . . . . . . . . . . . . . . . . . . . . . . . . . . . . . . . . . . . . United States 1,300,000 1,316,250
CSC Holdings Inc., senior deb., 7.625%, 7/15/18 . . . . . . . . . . . . . . . . . . . . . . . . . . . . . . . United States 1,500,000 1,740,000fCSC Holdings LLC, senior note, 144A, 6.75%, 11/15/21 . . . . . . . . . . . . . . . . . . . . . . . . . . United States 2,000,000 2,227,500DISH DBS Corp., senior note,
7.125%, 2/01/16 . . . . . . . . . . . . . . . . . . . . . . . . . . . . . . . . . . . . . . . . . . . . . . . . . . . . . United States 4,000,000 4,500,0006.75%, 6/01/21 . . . . . . . . . . . . . . . . . . . . . . . . . . . . . . . . . . . . . . . . . . . . . . . . . . . . . . United States 500,000 572,5005.875%, 7/15/22 . . . . . . . . . . . . . . . . . . . . . . . . . . . . . . . . . . . . . . . . . . . . . . . . . . . . . United States 500,000 540,000
FSI-19

Franklin Templeton Variable Insurance Products TrustStatement of Investments, December 31, 2012 (continued)
Franklin Strategic Income Securities Fund CountryPrincipalAmount* Value
Corporate Bonds (continued)Media (continued)Media General Inc., senior secured note, 11.75%, 2/15/17 . . . . . . . . . . . . . . . . . . . . . . . . United States 1,400,000 $ 1,624,000
fNara Cable Funding Ltd., senior note, 144A, 8.875%, 12/01/18 . . . . . . . . . . . . . . . . . . . . Spain 800,000 818,000jRadio One Inc., senior sub. note, PIK, 12.25%, 5/24/16 . . . . . . . . . . . . . . . . . . . . . . . . . . . United States 2,280,619 2,026,538fSeat Pagine Gialle SpA, senior secured note, 144A, 10.50%, 1/31/17 . . . . . . . . . . . . . . . . Italy 1,000,000 EUR 802,482Time Warner Inc.,
7.625%, 4/15/31 . . . . . . . . . . . . . . . . . . . . . . . . . . . . . . . . . . . . . . . . . . . . . . . . . . . . . United States 2,500,000 3,444,005senior bond, 3.40%, 6/15/22 . . . . . . . . . . . . . . . . . . . . . . . . . . . . . . . . . . . . . . . . . . . . United States 500,000 522,003
fUnitymedia Hessen/NRW,secured bond, 144A, 5.75%, 1/15/23 . . . . . . . . . . . . . . . . . . . . . . . . . . . . . . . . . . . . . . Germany 800,000 EUR 1,103,186senior secured note, 144A, 9.50%, 3/15/21 . . . . . . . . . . . . . . . . . . . . . . . . . . . . . . . . . Germany 1,000,000 EUR 1,534,860
fUnivision Communications Inc.,secured bond, 144A, 6.75%, 9/15/22 . . . . . . . . . . . . . . . . . . . . . . . . . . . . . . . . . . . . . . United States 500,000 518,750senior secured note, 144A, 7.875%, 11/01/20 . . . . . . . . . . . . . . . . . . . . . . . . . . . . . . . United States 2,500,000 2,718,750
fUPC Holding BV, senior note, 144A, 6.375%, 9/15/22 . . . . . . . . . . . . . . . . . . . . . . . . . . . Netherlands 500,000 EUR 675,883fUPCB Finance II Ltd., senior secured note, 144A, 6.375%, 7/01/20 . . . . . . . . . . . . . . . . . . Netherlands 2,000,000 EUR 2,820,302fUPCB Finance VI Ltd., senior secured note, 144A, 6.875%, 1/15/22 . . . . . . . . . . . . . . . . . . Netherlands 500,000 541,562fZiggo Bond Co., senior bond, 144A, 8.00%, 5/15/18 . . . . . . . . . . . . . . . . . . . . . . . . . . . . Netherlands 2,500,000 EUR 3,641,271
44,998,819
Pharmaceuticals, Biotechnology & Life Sciences 1.5%fAbbVie Inc., senior note, 144A, 2.90%, 11/06/22 . . . . . . . . . . . . . . . . . . . . . . . . . . . . . . . United States 1,500,000 1,529,004fCapsugel FinanceCo SCA, senior note, 144A, 9.875%, 8/01/19 . . . . . . . . . . . . . . . . . . . . . United States 2,000,000 EUR 2,983,945Endo Health Solutions Inc., senior note, 7.00%, 7/15/19 . . . . . . . . . . . . . . . . . . . . . . . . . . United States 1,500,000 1,606,875Gilead Sciences Inc., senior note,
4.50%, 4/01/21 . . . . . . . . . . . . . . . . . . . . . . . . . . . . . . . . . . . . . . . . . . . . . . . . . . . . . . United States 2,000,000 2,287,4644.40%, 12/01/21 . . . . . . . . . . . . . . . . . . . . . . . . . . . . . . . . . . . . . . . . . . . . . . . . . . . . . United States 1,000,000 1,140,879
Grifols Inc., senior note, 8.25%, 2/01/18 . . . . . . . . . . . . . . . . . . . . . . . . . . . . . . . . . . . . . . Spain 3,000,000 3,318,750finVentiv Health Inc., senior note, 144A,
9.00%, 1/15/18 . . . . . . . . . . . . . . . . . . . . . . . . . . . . . . . . . . . . . . . . . . . . . . . . . . . . . . United States 600,000 607,50010.00%, 8/15/18 . . . . . . . . . . . . . . . . . . . . . . . . . . . . . . . . . . . . . . . . . . . . . . . . . . . . . United States 2,300,000 2,006,750
f,jJaguar Holding Co. I, senior note, 144A, PIK, 9.375%, 10/15/17 . . . . . . . . . . . . . . . . . . . . United States 1,900,000 2,004,500fVPI Escrow Corp., senior note, 144A, 6.375%, 10/15/20 . . . . . . . . . . . . . . . . . . . . . . . . . . United States 2,900,000 3,124,750
20,610,417
Real Estate 0.0%†Forest City Enterprises Inc., senior note, 7.625%, 6/01/15 . . . . . . . . . . . . . . . . . . . . . . . . . United States 595,000 595,744
Retailing 0.9%fAcademy Ltd./Finance Corp., senior note, 144A, 9.25%, 8/01/19 . . . . . . . . . . . . . . . . . . . . United States 2,000,000 2,230,000
f,kEdcon Pty. Ltd., senior secured note, 144A, FRN, 3.433%, 6/15/14 . . . . . . . . . . . . . . . . . . South Africa 3,000,000 EUR 3,800,468fMatalan Finance Ltd., senior secured note, 144A, 8.875%, 4/29/16 . . . . . . . . . . . . . . . . . . United Kingdom 1,500,000 GBP 2,515,049Michaels Stores Inc., senior note, 7.75%, 11/01/18 . . . . . . . . . . . . . . . . . . . . . . . . . . . . . . United States 3,000,000 3,307,500
11,853,017
Semiconductors & Semiconductor Equipment 0.3%Freescale Semiconductor Inc.,
senior note, 8.875%, 12/15/14 . . . . . . . . . . . . . . . . . . . . . . . . . . . . . . . . . . . . . . . . . . United States 182,000 184,048senior note, 8.05%, 2/01/20 . . . . . . . . . . . . . . . . . . . . . . . . . . . . . . . . . . . . . . . . . . . . United States 1,600,000 1,600,000senior note, 10.75%, 8/01/20 . . . . . . . . . . . . . . . . . . . . . . . . . . . . . . . . . . . . . . . . . . . United States 1,382,000 1,489,105
fsenior secured note, 144A, 9.25%, 4/15/18 . . . . . . . . . . . . . . . . . . . . . . . . . . . . . . . . . United States 500,000 548,750
3,821,903
Software & Services 0.9%fCeridian Corp., secured note, 144A, 8.875%, 7/15/19 . . . . . . . . . . . . . . . . . . . . . . . . . . . . United States 1,000,000 1,090,000First Data Corp.,
senior bond, 12.625%, 1/15/21 . . . . . . . . . . . . . . . . . . . . . . . . . . . . . . . . . . . . . . . . . . United States 300,000 317,250fsenior secured bond, 144A, 8.25%, 1/15/21 . . . . . . . . . . . . . . . . . . . . . . . . . . . . . . . . . United States 4,500,000 4,522,500
FSI-20

Franklin Templeton Variable Insurance Products TrustStatement of Investments, December 31, 2012 (continued)
Franklin Strategic Income Securities Fund CountryPrincipalAmount* Value
Corporate Bonds (continued)Software & Services (continued)Sitel LLC/Finance Corp., senior note, 11.50%, 4/01/18 . . . . . . . . . . . . . . . . . . . . . . . . . . . United States 2,500,000 $ 1,775,000Sterling International Inc., senior note, 11.00%, 10/01/19 . . . . . . . . . . . . . . . . . . . . . . . . . United States 1,100,000 1,127,500West Corp., senior note, 7.875%, 1/15/19 . . . . . . . . . . . . . . . . . . . . . . . . . . . . . . . . . . . . United States 3,300,000 3,432,000
12,264,250
Technology Hardware & Equipment 0.5%CDW LLC/Finance Corp., senior note, 8.50%, 4/01/19 . . . . . . . . . . . . . . . . . . . . . . . . . . . . United States 3,500,000 3,806,250
fCommScope Inc., senior note, 144A, 8.25%, 1/15/19 . . . . . . . . . . . . . . . . . . . . . . . . . . . . United States 3,000,000 3,300,000
7,106,250
Telecommunication Services 2.8%fCC Holdings GS V LLC, senior secured bond, 144A, 3.849%, 4/15/23 . . . . . . . . . . . . . . . . United States 2,300,000 2,341,991CenturyLink Inc., senior note,
6.00%, 4/01/17 . . . . . . . . . . . . . . . . . . . . . . . . . . . . . . . . . . . . . . . . . . . . . . . . . . . . . . United States 1,500,000 1,662,2896.45%, 6/15/21 . . . . . . . . . . . . . . . . . . . . . . . . . . . . . . . . . . . . . . . . . . . . . . . . . . . . . . United States 1,000,000 1,105,800
Cricket Communications Inc., senior note, 7.75%, 10/15/20 . . . . . . . . . . . . . . . . . . . . . . . United States 3,000,000 3,075,000fDigicel Group Ltd., senior note, 144A, 8.25%, 9/30/20 . . . . . . . . . . . . . . . . . . . . . . . . . . . Jamaica 2,000,000 2,197,500fDigicel Ltd., senior note, 144A, 8.25%, 9/01/17 . . . . . . . . . . . . . . . . . . . . . . . . . . . . . . . . Jamaica 300,000 324,000feAccess Ltd., senior note, 144A,
8.25%, 4/01/18 . . . . . . . . . . . . . . . . . . . . . . . . . . . . . . . . . . . . . . . . . . . . . . . . . . . . . . Japan 1,400,000 1,581,1258.375%, 4/01/18 . . . . . . . . . . . . . . . . . . . . . . . . . . . . . . . . . . . . . . . . . . . . . . . . . . . . . Japan 600,000 EUR 896,668
Frontier Communications Corp., senior note,8.50%, 4/15/20 . . . . . . . . . . . . . . . . . . . . . . . . . . . . . . . . . . . . . . . . . . . . . . . . . . . . . . United States 2,500,000 2,887,5008.75%, 4/15/22 . . . . . . . . . . . . . . . . . . . . . . . . . . . . . . . . . . . . . . . . . . . . . . . . . . . . . . United States 1,000,000 1,165,0007.125%, 1/15/23 . . . . . . . . . . . . . . . . . . . . . . . . . . . . . . . . . . . . . . . . . . . . . . . . . . . . . United States 500,000 531,875
Intelsat Jackson Holdings SA, senior note,7.50%, 4/01/21 . . . . . . . . . . . . . . . . . . . . . . . . . . . . . . . . . . . . . . . . . . . . . . . . . . . . . . Luxembourg 2,000,000 2,215,000
f144A, 7.25%, 10/15/20 . . . . . . . . . . . . . . . . . . . . . . . . . . . . . . . . . . . . . . . . . . . . . . . . Luxembourg 1,600,000 1,746,000f144A, 6.625%, 12/15/22 . . . . . . . . . . . . . . . . . . . . . . . . . . . . . . . . . . . . . . . . . . . . . . . Luxembourg 1,600,000 1,655,000
Intelsat Luxembourg SA, senior note, 11.25%, 2/04/17 . . . . . . . . . . . . . . . . . . . . . . . . . . . Luxembourg 400,000 424,500MetroPCS Wireless Inc., senior note, 7.875%, 9/01/18 . . . . . . . . . . . . . . . . . . . . . . . . . . . United States 700,000 761,250Sprint Nextel Corp., senior note,
8.375%, 8/15/17 . . . . . . . . . . . . . . . . . . . . . . . . . . . . . . . . . . . . . . . . . . . . . . . . . . . . . United States 3,000,000 3,502,500f144A, 9.00%, 11/15/18 . . . . . . . . . . . . . . . . . . . . . . . . . . . . . . . . . . . . . . . . . . . . . . . . United States 2,000,000 2,475,000f144A, 7.00%, 3/01/20 . . . . . . . . . . . . . . . . . . . . . . . . . . . . . . . . . . . . . . . . . . . . . . . . . United States 800,000 932,000
Telefonica Emisiones SAU, senior note, 5.462%, 2/16/21 . . . . . . . . . . . . . . . . . . . . . . . . . Spain 2,600,000 2,773,550fWind Acquisition Finance SA, senior secured note, 144A, 11.75%, 7/15/17 . . . . . . . . . . . . Italy 3,500,000 3,683,750
f,jWind Acquisition Holdings Finance SA, senior secured note, 144A, PIK,12.25%, 7/15/17 . . . . . . . . . . . . . . . . . . . . . . . . . . . . . . . . . . . . . . . . . . . . . . . . . . . . . Italy 679,540 EUR 845,976
38,783,274
Transportation 0.4%fCEVA Group PLC, senior secured note, 144A,
11.625%, 10/01/16 . . . . . . . . . . . . . . . . . . . . . . . . . . . . . . . . . . . . . . . . . . . . . . . . . . . United Kingdom 300,000 309,7508.375%, 12/01/17 . . . . . . . . . . . . . . . . . . . . . . . . . . . . . . . . . . . . . . . . . . . . . . . . . . . . United Kingdom 1,500,000 1,494,37511.50%, 4/01/18 . . . . . . . . . . . . . . . . . . . . . . . . . . . . . . . . . . . . . . . . . . . . . . . . . . . . . United Kingdom 1,000,000 845,000
fHDTFS Inc., senior note, 144A, 6.25%, 10/15/22 . . . . . . . . . . . . . . . . . . . . . . . . . . . . . . . United States 300,000 321,000fHertz Corp., senior note, 144A, 6.75%, 4/15/19 . . . . . . . . . . . . . . . . . . . . . . . . . . . . . . . . United States 2,200,000 2,411,750
5,381,875
FSI-21

Franklin Templeton Variable Insurance Products TrustStatement of Investments, December 31, 2012 (continued)
Franklin Strategic Income Securities Fund CountryPrincipalAmount* Value
Corporate Bonds (continued)Utilities 0.9%
fCalpine Corp., senior secured note, 144A,7.875%, 7/31/20 . . . . . . . . . . . . . . . . . . . . . . . . . . . . . . . . . . . . . . . . . . . . . . . . . . . . . . . United States 982,000 $ 1,107,2057.50%, 2/15/21 . . . . . . . . . . . . . . . . . . . . . . . . . . . . . . . . . . . . . . . . . . . . . . . . . . . . . . . . United States 1,700,000 1,887,0007.875%, 1/15/23 . . . . . . . . . . . . . . . . . . . . . . . . . . . . . . . . . . . . . . . . . . . . . . . . . . . . . . . United States 470,000 533,450
CMS Energy Corp., senior note, 8.75%, 6/15/19 . . . . . . . . . . . . . . . . . . . . . . . . . . . . . . . . . . United States 1,500,000 1,957,617fIntergen NV, senior secured note, 144A, 9.00%, 6/30/17 . . . . . . . . . . . . . . . . . . . . . . . . . . . . Netherlands 3,000,000 2,700,000fTexas Competitive Electric Holdings Co. LLC/Texas Competitive Electric Holdings Finance Inc.,
senior secured note, 144A, 11.50%, 10/01/20 . . . . . . . . . . . . . . . . . . . . . . . . . . . . . . . . . United States 5,400,000 4,252,500
12,437,772
Total Corporate Bonds (Cost $436,439,869) . . . . . . . . . . . . . . . . . . . . . . . . 468,912,779
k,lSenior Floating Rate Interests 17.6%Automobiles & Components 0.3%August Luxuk Holding Co., Lux Second Lien, 10.50%, 4/27/19 . . . . . . . . . . . . . . . . . . . . . . . . Luxembourg 1,246,997 1,259,467August U.S. Holding Co. Inc., U.S. Second Lien, 10.50%, 4/27/19 . . . . . . . . . . . . . . . . . . . . . United States 960,077 969,678
mFederal-Mogul Corp.,Tranche B Term Loan, 2.148%, 12/27/14 . . . . . . . . . . . . . . . . . . . . . . . . . . . . . . . . . . . . . United States 1,046,071 963,039Tranche C Term Loan, 2.148%, 12/27/15 . . . . . . . . . . . . . . . . . . . . . . . . . . . . . . . . . . . . . United States 533,721 491,357
FPC Holdings Inc. (FleetPride), Initial Loan (2nd Lien), 9.25%, 5/19/20 . . . . . . . . . . . . . . . . . . United States 557,300 548,940FRAM Group Holdings Inc. (Autoparts Holdings), Second Lien Term Loan, 10.50%, 1/29/18 . . United States 400,802 382,766
4,615,247
Capital Goods 1.6%mAir Distribution Technologies (Tomkins Air Distr.), Second Lien Initial Loan, 9.25%, 5/09/20 . . United States 737,891 756,338Allison Transmission Inc., Term B-3 Loan, 4.25%, 8/23/19 . . . . . . . . . . . . . . . . . . . . . . . . . . . United States 1,783,117 1,803,177
mFLY Funding II S.A.R.L., Loans, 7.75%, 8/08/18 . . . . . . . . . . . . . . . . . . . . . . . . . . . . . . . . . . . Ireland 255,000 257,152mRBS Global Inc. (Rexnord), Term B Loan, 4.50%, 4/01/18 . . . . . . . . . . . . . . . . . . . . . . . . . . . . United States 4,823,815 4,873,563Sensus USA Inc., Second Lien Term Loan, 8.50%, 5/09/18 . . . . . . . . . . . . . . . . . . . . . . . . . . . United States 2,582,186 2,595,097
mSilver II US Holdings LLC, Term Loan, 6.00%, 12/13/19 . . . . . . . . . . . . . . . . . . . . . . . . . . . . . United States 2,235,600 2,258,155Terex Corp., U.S. Term Loan, 4.50%, 4/28/17 . . . . . . . . . . . . . . . . . . . . . . . . . . . . . . . . . . . . United States 3,576,419 3,619,336Tomkins LLC and Tomkins Inc., Term B-1 Loan, 4.25%, 9/21/16 . . . . . . . . . . . . . . . . . . . . . . . United States 2,805,942 2,828,740TransDigm Inc.,
Tranche B1 Term Loan, 4.00%, 2/14/17 . . . . . . . . . . . . . . . . . . . . . . . . . . . . . . . . . . . . . . United States 1,799,857 1,814,201Tranche B2 Term Loan, 4.00%, 2/14/17 . . . . . . . . . . . . . . . . . . . . . . . . . . . . . . . . . . . . . . United States 507,575 511,654
Wesco Distribution Inc., Tranche B-1 Loan, 4.50%, 12/12/19 . . . . . . . . . . . . . . . . . . . . . . . . . United States 724,300 729,189
22,046,602
Commercial & Professional Services 1.3%ARAMARK Corp.,
Extended Synthetic L/C, 3.309%, 7/26/16 . . . . . . . . . . . . . . . . . . . . . . . . . . . . . . . . . . . . . United States 143,344 144,194Extended U.S. Term Loan B-3, 3.462% - 3.561%, 7/26/16 . . . . . . . . . . . . . . . . . . . . . . . . United States 1,138,629 1,145,382Synthetic L/C-3, 3.309%, 7/26/16 . . . . . . . . . . . . . . . . . . . . . . . . . . . . . . . . . . . . . . . . . . . United States 91,726 92,270Term Loan B Extended, 3.462%, 7/26/16 . . . . . . . . . . . . . . . . . . . . . . . . . . . . . . . . . . . . . United States 2,178,033 2,190,951
mU.S. Term C Loan, 6.50%, 7/26/16 . . . . . . . . . . . . . . . . . . . . . . . . . . . . . . . . . . . . . . . . . . United States 980,600 986,416Brock Holdings III Inc., Second Lien Term Loan, 10.00%, 3/16/18 . . . . . . . . . . . . . . . . . . . . . . United States 1,187,270 1,196,175EnviroSolutions Real Property Holdings, Second Lien Term Loan, 8.00%, 7/29/14 . . . . . . . . . . United States 502,938 503,567Interactive Data Corp., Term B Loans, 4.50%, 2/11/18 . . . . . . . . . . . . . . . . . . . . . . . . . . . . . . United States 5,873,824 5,912,332KAR Auction Services Inc. (Adesa), Term Loan, 5.00%, 5/19/17 . . . . . . . . . . . . . . . . . . . . . . . United States 5,436,709 5,494,474
17,665,761
FSI-22

Franklin Templeton Variable Insurance Products TrustStatement of Investments, December 31, 2012 (continued)
Franklin Strategic Income Securities Fund CountryPrincipalAmount* Value
k,lSenior Floating Rate Interests (continued)Consumer Durables & Apparel 0.2%
mPVH Corp., Term Loan B, 4.75%, 12/20/19 . . . . . . . . . . . . . . . . . . . . . . . . . . . . . . . . . . . . . . United States 2,608,900 $ 2,628,000
Consumer Services 1.1%Ameristar Casinos Inc., B Term Loan, 4.00%, 4/14/18 . . . . . . . . . . . . . . . . . . . . . . . . . . . . . . United States 2,295,714 2,315,444Burger King Corp., Tranche B Term Loan, 3.75%, 9/28/19 . . . . . . . . . . . . . . . . . . . . . . . . . . . United States 2,600,041 2,621,166DineEquity Inc., Term B-1 Loan, 4.25%, 10/19/17 . . . . . . . . . . . . . . . . . . . . . . . . . . . . . . . . . United States 1,363,692 1,377,329MGM Resorts International, Term B Loan, 4.25%, 12/20/19 . . . . . . . . . . . . . . . . . . . . . . . . . . United States 753,200 762,380
d,jTurtle Bay Holdings LLC,Term Loan A, PIK, 10.25%, 3/01/15 . . . . . . . . . . . . . . . . . . . . . . . . . . . . . . . . . . . . . . . . . United States 2,116,501 2,116,501Term Loan B, PIK, 3.00%, 3/01/15 . . . . . . . . . . . . . . . . . . . . . . . . . . . . . . . . . . . . . . . . . . United States 4,154,266 3,738,839
Wendy’s International Inc., Closing Date Term Loan, 4.75%, 5/15/19 . . . . . . . . . . . . . . . . . . . United States 2,772,613 2,804,301
15,735,960
Diversified Financials 0.9%Asurion LLC,
Amortizing Term Loans (B1), 4.75%, 7/23/17 . . . . . . . . . . . . . . . . . . . . . . . . . . . . . . . . . . United States 707,672 713,268Second Lien Term Loan, 9.00%, 5/24/19 . . . . . . . . . . . . . . . . . . . . . . . . . . . . . . . . . . . . . . United States 2,013,553 2,078,994Term Loan (TLB), 5.50%, 5/24/18 . . . . . . . . . . . . . . . . . . . . . . . . . . . . . . . . . . . . . . . . . . . United States 494,873 500,543
MoneyGram Payment Systems Worldwide Inc.,Term Loan, 4.25%, 11/18/17 . . . . . . . . . . . . . . . . . . . . . . . . . . . . . . . . . . . . . . . . . . . . . . United States 3,357,159 3,352,963Tranche B-1 Loan, 4.25%, 11/18/17 . . . . . . . . . . . . . . . . . . . . . . . . . . . . . . . . . . . . . . . . . United States 1,073,388 1,072,046
TransUnion LLC/TransUnion FICO, Replacement Term Loan, 5.50%, 2/10/18 . . . . . . . . . . . . . United States 3,967,779 4,028,950
11,746,764
Energy 0.7%Arch Coal Inc., Term Loans, 5.75%, 5/16/18 . . . . . . . . . . . . . . . . . . . . . . . . . . . . . . . . . . . . . United States 4,556,788 4,614,564
mATP Oil & Gas Corp.,Additional NM Loans (DIP), 10.75%, 3/01/14 . . . . . . . . . . . . . . . . . . . . . . . . . . . . . . . . . . United States 5,532 4,713DIP, 10.75%, 3/01/14 . . . . . . . . . . . . . . . . . . . . . . . . . . . . . . . . . . . . . . . . . . . . . . . . . . . United States 48,443 41,273Refinancing Loan (DIP), 10.75%, 3/01/14 . . . . . . . . . . . . . . . . . . . . . . . . . . . . . . . . . . . . . United States 82,858 70,595
FTS International LLC (Frac Tech), Term Loan, 8.50%, 5/06/16 . . . . . . . . . . . . . . . . . . . . . . . . United States 447,523 373,402Patriot Coal Corp., DIP Term Loan, 9.25%, 10/03/13 . . . . . . . . . . . . . . . . . . . . . . . . . . . . . . . United States 2,512,495 2,531,339Plains Exploration & Production Co., 7-Year Term Loan, 4.00%, 11/30/19 . . . . . . . . . . . . . . . United States 1,973,600 1,982,645
9,618,531
Food & Staples Retailing 0.2%AdvancePierre Foods Inc.,
Loans, 5.75%, 7/10/17 . . . . . . . . . . . . . . . . . . . . . . . . . . . . . . . . . . . . . . . . . . . . . . . . . . . United States 1,061,401 1,075,332Second Lien Term Loan, 9.50%, 10/10/17 . . . . . . . . . . . . . . . . . . . . . . . . . . . . . . . . . . . . . United States 1,619,009 1,659,484
2,734,816
Food, Beverage & Tobacco 0.6%Del Monte Foods Co., Initial Term Loan, 4.50%, 3/08/18 . . . . . . . . . . . . . . . . . . . . . . . . . . . . United States 8,621,296 8,651,832
Health Care Equipment & Services 2.4%mArdent Medical Services Inc., Second Lien Term Loan, 11.75%, 1/02/19 . . . . . . . . . . . . . . . . . United States 1,195,436 1,220,839Bausch & Lomb Inc., Parent Term Loan, 5.25%, 5/18/19 . . . . . . . . . . . . . . . . . . . . . . . . . . . . United States 4,602,815 4,650,487Community Health Systems Inc., New Extended Term Loan, 3.811%, 1/25/17 . . . . . . . . . . . . . United States 7,487,232 7,542,780DaVita Inc.,
Tranche B Term Loan, 4.50%, 10/20/16 . . . . . . . . . . . . . . . . . . . . . . . . . . . . . . . . . . . . . . United States 2,660,317 2,682,265Tranche B-2 Term Loan, 4.00%, 8/24/19 . . . . . . . . . . . . . . . . . . . . . . . . . . . . . . . . . . . . . . United States 3,464,300 3,496,043
HCA Inc., Tranche B-2 Term Loan, 3.561%, 3/31/17 . . . . . . . . . . . . . . . . . . . . . . . . . . . . . . . United States 8,318,841 8,352,640Hologic Inc., Tranche B Term Loan, 4.50%, 8/01/19 . . . . . . . . . . . . . . . . . . . . . . . . . . . . . . . . United States 2,099,816 2,127,594
FSI-23

Franklin Templeton Variable Insurance Products TrustStatement of Investments, December 31, 2012 (continued)
Franklin Strategic Income Securities Fund CountryPrincipalAmount* Value
k,lSenior Floating Rate Interests (continued)Health Care Equipment & Services (continued)Universal Health Services Inc., New Tranche B Term Loan, 3.75%, 11/15/16 . . . . . . . . . . . . . . United States 2,247,659 $ 2,260,583
32,333,231
Household & Personal Products 0.0%†Spectrum Brands Inc., Initial U.S. Term Loan, 4.50%, 12/17/19 . . . . . . . . . . . . . . . . . . . . . . . United States 380,400 382,842
Materials 2.4%American Rock Salt Co. LLC, Initial Loan, 5.50%, 4/25/17 . . . . . . . . . . . . . . . . . . . . . . . . . . . United States 1,898,223 1,876,076Exopack LLC, Term B Loan, 6.50%, 5/31/17 . . . . . . . . . . . . . . . . . . . . . . . . . . . . . . . . . . . . . United States 232,279 232,279FMG America Finance Inc., Loans, 5.25%, 10/18/17 . . . . . . . . . . . . . . . . . . . . . . . . . . . . . . . United States 2,535,845 2,561,401Ineos US Finance LLC, Dollar Term Loan, 6.50%, 4/27/18 . . . . . . . . . . . . . . . . . . . . . . . . . . . United States 4,093,474 4,144,004NewPage Corp., Term Loan, 8.75%, 12/21/18 . . . . . . . . . . . . . . . . . . . . . . . . . . . . . . . . . . . . United States 2,757,776 2,757,776PL Propylene LLC (PetroLogistics), Tranche B Term Loan, 7.00%, 3/27/17 . . . . . . . . . . . . . . . . United States 2,305,976 2,337,683Reynolds Group Holdings Inc., U.S. Term Loan, 4.75%, 9/28/18 . . . . . . . . . . . . . . . . . . . . . . . United States 6,944,627 7,039,720Road Infrastructure Investment LLC (Ennis Flint), Second Lien Term Loan, 10.25%, 9/30/18 . . . United States 5,351,561 5,257,909Tronox Pigments (Netherlands) BV,
Closing Date Term Loan, 4.25%, 2/08/18 . . . . . . . . . . . . . . . . . . . . . . . . . . . . . . . . . . . . . Netherlands 1,385,341 1,400,926Delayed Draw Term Loan, 4.25%, 2/08/18 . . . . . . . . . . . . . . . . . . . . . . . . . . . . . . . . . . . . Netherlands 377,820 381,717
Walter Energy Inc., B Term Loan, 5.75%, 4/01/18 . . . . . . . . . . . . . . . . . . . . . . . . . . . . . . . . . United States 4,251,841 4,291,702
32,281,193
Media 2.3%Cinemark USA Inc., Term Loan, 3.21%, 12/13/19 . . . . . . . . . . . . . . . . . . . . . . . . . . . . . . . . . United States 1,732,380 1,739,743Clear Channel Communications Inc.,
Tranche A Term Loan, 3.612%, 5/13/14 . . . . . . . . . . . . . . . . . . . . . . . . . . . . . . . . . . . . . . United States 666,228 649,780Tranche B Term Loan, 3.862%, 1/29/16 . . . . . . . . . . . . . . . . . . . . . . . . . . . . . . . . . . . . . . United States 3,254,857 2,705,600
CSC Holdings Inc. (Cablevision), Incremental B-2 Extended Term Loan, 1.962%, 3/29/16 . . . . United States 2,754,274 2,771,488mCumulus Media Holdings Inc., Second Lien Term Loan, 7.50%, 9/16/19 . . . . . . . . . . . . . . . . . United States 6,593,187 6,807,466FoxCo Acquisition Sub LLC, Initial Term Loan, 5.50%, 7/14/17 . . . . . . . . . . . . . . . . . . . . . . . . United States 1,079,794 1,096,441Hubbard Radio LLC, Second Lien Term Loan, 8.75%, 4/29/18 . . . . . . . . . . . . . . . . . . . . . . . . United States 1,488,810 1,518,587Regal Cinemas Corp., Term Loan, 3.212% - 3.311%, 8/23/17 . . . . . . . . . . . . . . . . . . . . . . . . United States 2,871,730 2,887,114Sinclair Television Group Inc., New Tranche B Term Loan, 4.00%, 10/29/16 . . . . . . . . . . . . . . United States 1,035,169 1,042,493Telesat Canada, U.S. Term B Loan, 4.25%, 3/28/19 . . . . . . . . . . . . . . . . . . . . . . . . . . . . . . . . Canada 2,796,582 2,821,052TWCC Holding Corp., Term Loan, 4.25%, 2/11/17 . . . . . . . . . . . . . . . . . . . . . . . . . . . . . . . . . United States 2,882,032 2,916,855UPC Financing Partnership,
Term Loan AF, 4.00%, 1/29/21 . . . . . . . . . . . . . . . . . . . . . . . . . . . . . . . . . . . . . . . . . . . . . Netherlands 736,600 736,370Term Loan T, 3.714%, 12/30/16 . . . . . . . . . . . . . . . . . . . . . . . . . . . . . . . . . . . . . . . . . . . . Netherlands 3,158,518 3,146,674Term Loan X, 3.714%, 12/31/17 . . . . . . . . . . . . . . . . . . . . . . . . . . . . . . . . . . . . . . . . . . . . Netherlands 1,384,751 1,383,713
32,223,376
Pharmaceuticals, Biotechnology & Life Sciences 0.9%Par Pharmaceutical Cos. Inc., Term B Loans, 5.00%, 9/30/19 . . . . . . . . . . . . . . . . . . . . . . . . . United States 1,669,774 1,672,034
mQuintiles Transnational Corp., Term B-2 Loan, 5.50%, 6/08/18 . . . . . . . . . . . . . . . . . . . . . . . United States 38,400 38,712Valeant Pharmaceuticals International Inc.,
mSeries C Tranche B Term Loan, 5.50%, 2/13/19 . . . . . . . . . . . . . . . . . . . . . . . . . . . . . . . . . Canada 2,568,200 2,588,746Series D Tranche B Term Loan, 4.25%, 2/13/19 . . . . . . . . . . . . . . . . . . . . . . . . . . . . . . . . . Canada 2,458,840 2,476,256
Warner Chilcott Co. LLC, Term B-2 Loan, 4.25%, 3/15/18 . . . . . . . . . . . . . . . . . . . . . . . . . . . Puerto Rico 1,184,331 1,193,319Warner Chilcott Corp.,
Additional Term B-1 Loan, 4.25%, 3/15/18 . . . . . . . . . . . . . . . . . . . . . . . . . . . . . . . . . . . . United States 899,549 906,376Term B-1 Loan, 4.25%, 3/15/18 . . . . . . . . . . . . . . . . . . . . . . . . . . . . . . . . . . . . . . . . . . . . United States 2,368,662 2,386,638
WC Luxco S.A.R.L., Term B-3 Loan, 4.25%, 3/15/18 . . . . . . . . . . . . . . . . . . . . . . . . . . . . . . . Luxembourg 1,628,455 1,640,813
12,902,894
FSI-24

Franklin Templeton Variable Insurance Products TrustStatement of Investments, December 31, 2012 (continued)
Franklin Strategic Income Securities Fund CountryPrincipalAmount* Value
k,lSenior Floating Rate Interests (continued)Retailing 1.1%BJ’s Wholesale Club Inc.,
Initial Loan, 5.75%, 9/26/19 . . . . . . . . . . . . . . . . . . . . . . . . . . . . . . . . . . . . . . . . . . . . . . . United States 6,334,857 $ 6,431,014Second Lien Term Loan, 9.75%, 3/26/20 . . . . . . . . . . . . . . . . . . . . . . . . . . . . . . . . . . . . . . United States 2,652,243 2,741,756
Evergreen AcqCo. 1 LP (Savers), Term Loan, 5.00%, 7/09/19 . . . . . . . . . . . . . . . . . . . . . . . . . United States 3,539,376 3,558,181Party City Holdings Inc., Term Loans, 5.75%, 7/27/19 . . . . . . . . . . . . . . . . . . . . . . . . . . . . . . United States 2,307,623 2,335,748
15,066,699
Software & Services 0.2%AVG Technologies NV, Term Loan, 7.50%, 3/15/16 . . . . . . . . . . . . . . . . . . . . . . . . . . . . . . . . Netherlands 387,393 390,299
mSunGard Data Systems Inc., Tranche D Term Loan, 6.00%, 1/31/20 . . . . . . . . . . . . . . . . . . . . United States 554,300 560,536Vertafore Inc., Second Lien Term Loan, 9.75%, 10/27/17 . . . . . . . . . . . . . . . . . . . . . . . . . . . . United States 1,872,942 1,882,306
2,833,141
Technology Hardware & Equipment 0.1%Flextronics International USA Inc.,
A Closing Date Loan, 2.462%, 10/01/14 . . . . . . . . . . . . . . . . . . . . . . . . . . . . . . . . . . . . . . United States 95,127 95,294A-1-A Delayed Draw Term Loan, 2.462%, 10/01/14 . . . . . . . . . . . . . . . . . . . . . . . . . . . . . United States 27,335 27,383A-1-B Delayed Draw Term Loan, 2.462%, 10/01/14 . . . . . . . . . . . . . . . . . . . . . . . . . . . . . United States 195,392 195,820A-2 Delayed Draw Term Loan, 2.462%, 10/01/14 . . . . . . . . . . . . . . . . . . . . . . . . . . . . . . . United States 669,983 671,449A-3 Delayed Draw Term Loan, 2.462%, 10/01/14 . . . . . . . . . . . . . . . . . . . . . . . . . . . . . . . United States 213,575 214,043
mRiverbed Technology Inc., Term Loan B, 5.25%, 12/18/19 . . . . . . . . . . . . . . . . . . . . . . . . . . . United States 665,000 671,650
1,875,639
Telecommunication Services 0.7%Intelsat Jackson Holdings SA, Tranche B-1 Term Loan, 4.50%, 4/02/18 . . . . . . . . . . . . . . . . . . Luxembourg 8,721,642 8,802,631
mNTELOS Inc., Term B Advance, 7.00%, 11/11/19 . . . . . . . . . . . . . . . . . . . . . . . . . . . . . . . . . . United States 234,776 226,265
9,028,896
Transportation 0.6%Avis Budget Car Rental LLC, Tranche C Term Loan, 4.25%, 3/15/19 . . . . . . . . . . . . . . . . . . . . United States 3,077,494 3,111,346Evergreen International Aviation Inc., Term Loan, 11.50%, 6/30/15 . . . . . . . . . . . . . . . . . . . . United States 2,010,458 1,970,249Hertz Corp.,
Credit Linked Deposit, 3.75%, 3/11/18 . . . . . . . . . . . . . . . . . . . . . . . . . . . . . . . . . . . . . . . United States 847,103 849,750Tranche B-1 Term Loan, 3.75%, 3/12/18 . . . . . . . . . . . . . . . . . . . . . . . . . . . . . . . . . . . . . . United States 2,298,900 2,305,367
8,236,712
Total Senior Floating Rate Interests (Cost $238,910,354) . . . . . . . . . . 242,608,136
Foreign Government and Agency Securities 21.1%Government of Australia, senior bond, 6.50%, 5/15/13 . . . . . . . . . . . . . . . . . . . . . . . . . . . . . Australia 5,700,000 AUD 6,005,255Government of Hungary,
5.50%, 2/12/14 . . . . . . . . . . . . . . . . . . . . . . . . . . . . . . . . . . . . . . . . . . . . . . . . . . . . . . . . Hungary 1,443,700,000 HUF 6,567,8435.50%, 2/12/16 . . . . . . . . . . . . . . . . . . . . . . . . . . . . . . . . . . . . . . . . . . . . . . . . . . . . . . . . Hungary 1,864,700,000 HUF 8,424,5866.50%, 6/24/19 . . . . . . . . . . . . . . . . . . . . . . . . . . . . . . . . . . . . . . . . . . . . . . . . . . . . . . . . Hungary 206,000,000 HUF 962,7007.50%, 11/12/20 . . . . . . . . . . . . . . . . . . . . . . . . . . . . . . . . . . . . . . . . . . . . . . . . . . . . . . . Hungary 312,600,000 HUF 1,551,198senior note, 6.25%, 1/29/20 . . . . . . . . . . . . . . . . . . . . . . . . . . . . . . . . . . . . . . . . . . . . . . . Hungary 5,507,000 6,102,444senior note, 6.375%, 3/29/21 . . . . . . . . . . . . . . . . . . . . . . . . . . . . . . . . . . . . . . . . . . . . . . Hungary 1,550,000 1,726,313
fGovernment of Iceland, 144A, 5.875%, 5/11/22 . . . . . . . . . . . . . . . . . . . . . . . . . . . . . . . . . . Iceland 3,010,000 3,396,604Government of Indonesia,
FR19, 14.25%, 6/15/13 . . . . . . . . . . . . . . . . . . . . . . . . . . . . . . . . . . . . . . . . . . . . . . . . . . Indonesia 26,830,000,000 IDR 2,916,027FR20, 14.275%, 12/15/13 . . . . . . . . . . . . . . . . . . . . . . . . . . . . . . . . . . . . . . . . . . . . . . . . Indonesia 23,637,000,000 IDR 2,682,086FR26, 11.00%, 10/15/14 . . . . . . . . . . . . . . . . . . . . . . . . . . . . . . . . . . . . . . . . . . . . . . . . . Indonesia 1,800,000,000 IDR 207,890FR34, 12.80%, 6/15/21 . . . . . . . . . . . . . . . . . . . . . . . . . . . . . . . . . . . . . . . . . . . . . . . . . . Indonesia 37,155,000,000 IDR 5,857,672
FSI-25

Franklin Templeton Variable Insurance Products TrustStatement of Investments, December 31, 2012 (continued)
Franklin Strategic Income Securities Fund CountryPrincipalAmount* Value
Foreign Government and Agency Securities (continued)Government of Indonesia, (continued)
FR42, 10.25%, 7/15/27 . . . . . . . . . . . . . . . . . . . . . . . . . . . . . . . . . . . . . . . . . . . . . . . . . . . . Indonesia 2,000,000,000 IDR $ 293,126FR44, 10.00%, 9/15/24 . . . . . . . . . . . . . . . . . . . . . . . . . . . . . . . . . . . . . . . . . . . . . . . . . . . . Indonesia 9,300,000,000 IDR 1,320,783
Government of Ireland,4.60%, 4/18/16 . . . . . . . . . . . . . . . . . . . . . . . . . . . . . . . . . . . . . . . . . . . . . . . . . . . . . . . . . Ireland 344,000 EUR 484,5935.90%, 10/18/19 . . . . . . . . . . . . . . . . . . . . . . . . . . . . . . . . . . . . . . . . . . . . . . . . . . . . . . . . Ireland 2,228,000 EUR 3,226,8724.50%, 4/18/20 . . . . . . . . . . . . . . . . . . . . . . . . . . . . . . . . . . . . . . . . . . . . . . . . . . . . . . . . . Ireland 2,029,000 EUR 2,698,6875.00%, 10/18/20 . . . . . . . . . . . . . . . . . . . . . . . . . . . . . . . . . . . . . . . . . . . . . . . . . . . . . . . . Ireland 3,562,000 EUR 4,871,980senior bond, 4.40%, 6/18/19 . . . . . . . . . . . . . . . . . . . . . . . . . . . . . . . . . . . . . . . . . . . . . . . . Ireland 3,338,000 EUR 4,450,018senior bond, 5.40%, 3/13/25 . . . . . . . . . . . . . . . . . . . . . . . . . . . . . . . . . . . . . . . . . . . . . . . . Ireland 2,534,000 EUR 3,424,069
Government of Israel,5.00%, 3/31/13 . . . . . . . . . . . . . . . . . . . . . . . . . . . . . . . . . . . . . . . . . . . . . . . . . . . . . . . . . Israel 4,370,000 ILS 1,180,2783.50%, 9/30/13 . . . . . . . . . . . . . . . . . . . . . . . . . . . . . . . . . . . . . . . . . . . . . . . . . . . . . . . . . Israel 16,505,000 ILS 4,478,908
Government of Malaysia,3.434%, 8/15/14 . . . . . . . . . . . . . . . . . . . . . . . . . . . . . . . . . . . . . . . . . . . . . . . . . . . . . . . . Malaysia 1,695,000 MYR 557,809senior bond, 3.702%, 2/25/13 . . . . . . . . . . . . . . . . . . . . . . . . . . . . . . . . . . . . . . . . . . . . . . . Malaysia 2,323,000 MYR 760,347senior bond, 3.70%, 5/15/13 . . . . . . . . . . . . . . . . . . . . . . . . . . . . . . . . . . . . . . . . . . . . . . . . Malaysia 2,695,000 MYR 883,367senior bond, 3.21%, 5/31/13 . . . . . . . . . . . . . . . . . . . . . . . . . . . . . . . . . . . . . . . . . . . . . . . . Malaysia 15,375,000 MYR 5,031,039senior bond, 3.461%, 7/31/13 . . . . . . . . . . . . . . . . . . . . . . . . . . . . . . . . . . . . . . . . . . . . . . . Malaysia 15,030,000 MYR 4,926,665senior bond, 8.00%, 10/30/13 . . . . . . . . . . . . . . . . . . . . . . . . . . . . . . . . . . . . . . . . . . . . . . . Malaysia 50,000 MYR 17,008senior bond, 5.094%, 4/30/14 . . . . . . . . . . . . . . . . . . . . . . . . . . . . . . . . . . . . . . . . . . . . . . . Malaysia 5,925,000 MYR 1,989,085senior bond, 3.814%, 2/15/17 . . . . . . . . . . . . . . . . . . . . . . . . . . . . . . . . . . . . . . . . . . . . . . . Malaysia 11,400,000 MYR 3,820,521senior bond, 4.24%, 2/07/18 . . . . . . . . . . . . . . . . . . . . . . . . . . . . . . . . . . . . . . . . . . . . . . . . Malaysia 600,000 MYR 205,079
Government of Mexico,9.00%, 6/20/13 . . . . . . . . . . . . . . . . . . . . . . . . . . . . . . . . . . . . . . . . . . . . . . . . . . . . . . . . . Mexico 1,074,360n MXN 8,542,7358.00%, 12/19/13 . . . . . . . . . . . . . . . . . . . . . . . . . . . . . . . . . . . . . . . . . . . . . . . . . . . . . . . . Mexico 1,062,700n MXN 8,541,7077.00%, 6/19/14 . . . . . . . . . . . . . . . . . . . . . . . . . . . . . . . . . . . . . . . . . . . . . . . . . . . . . . . . . Mexico 192,800n MXN 1,549,6099.50%, 12/18/14 . . . . . . . . . . . . . . . . . . . . . . . . . . . . . . . . . . . . . . . . . . . . . . . . . . . . . . . . Mexico 526,900n MXN 4,469,4978.00%, 12/17/15 . . . . . . . . . . . . . . . . . . . . . . . . . . . . . . . . . . . . . . . . . . . . . . . . . . . . . . . . Mexico 140,000n MXN 1,182,784
Government of Poland,5.25%, 4/25/13 . . . . . . . . . . . . . . . . . . . . . . . . . . . . . . . . . . . . . . . . . . . . . . . . . . . . . . . . . Poland 7,895,000 PLN 2,569,4505.00%, 10/24/13 . . . . . . . . . . . . . . . . . . . . . . . . . . . . . . . . . . . . . . . . . . . . . . . . . . . . . . . . Poland 3,845,000 PLN 1,262,7445.75%, 4/25/14 . . . . . . . . . . . . . . . . . . . . . . . . . . . . . . . . . . . . . . . . . . . . . . . . . . . . . . . . . Poland 38,255,000 PLN 12,785,4845.50%, 4/25/15 . . . . . . . . . . . . . . . . . . . . . . . . . . . . . . . . . . . . . . . . . . . . . . . . . . . . . . . . . Poland 5,975,000 PLN 2,034,0516.25%, 10/24/15 . . . . . . . . . . . . . . . . . . . . . . . . . . . . . . . . . . . . . . . . . . . . . . . . . . . . . . . . Poland 12,680,000 PLN 4,443,3315.75%, 9/23/22 . . . . . . . . . . . . . . . . . . . . . . . . . . . . . . . . . . . . . . . . . . . . . . . . . . . . . . . . . Poland 1,000,000 PLN 379,374
kFRN, 5.15%, 1/25/17 . . . . . . . . . . . . . . . . . . . . . . . . . . . . . . . . . . . . . . . . . . . . . . . . . . . . . Poland 1,660,000 PLN 540,185kFRN, 5.15%, 1/25/21 . . . . . . . . . . . . . . . . . . . . . . . . . . . . . . . . . . . . . . . . . . . . . . . . . . . . . Poland 1,683,000 PLN 542,544Strip, 7/25/13 . . . . . . . . . . . . . . . . . . . . . . . . . . . . . . . . . . . . . . . . . . . . . . . . . . . . . . . . . . . Poland 9,270,000 PLN 2,948,217Strip, 1/25/14 . . . . . . . . . . . . . . . . . . . . . . . . . . . . . . . . . . . . . . . . . . . . . . . . . . . . . . . . . . . Poland 12,960,000 PLN 4,059,242
fGovernment of Russia, senior bond, 144A, 7.50%, 3/31/30 . . . . . . . . . . . . . . . . . . . . . . . . . . . Russia 3,674,275 4,705,460Government of Sri Lanka,
A, 8.50%, 1/15/13 . . . . . . . . . . . . . . . . . . . . . . . . . . . . . . . . . . . . . . . . . . . . . . . . . . . . . . . Sri Lanka 50,900,000 LKR 398,299A, 13.50%, 2/01/13 . . . . . . . . . . . . . . . . . . . . . . . . . . . . . . . . . . . . . . . . . . . . . . . . . . . . . . Sri Lanka 59,500,000 LKR 466,723A, 7.50%, 8/01/13 . . . . . . . . . . . . . . . . . . . . . . . . . . . . . . . . . . . . . . . . . . . . . . . . . . . . . . . Sri Lanka 48,640,000 LKR 373,288A, 7.00%, 3/01/14 . . . . . . . . . . . . . . . . . . . . . . . . . . . . . . . . . . . . . . . . . . . . . . . . . . . . . . . Sri Lanka 7,020,000 LKR 52,220A, 11.25%, 7/15/14 . . . . . . . . . . . . . . . . . . . . . . . . . . . . . . . . . . . . . . . . . . . . . . . . . . . . . . Sri Lanka 176,100,000 LKR 1,370,050A, 11.75%, 3/15/15 . . . . . . . . . . . . . . . . . . . . . . . . . . . . . . . . . . . . . . . . . . . . . . . . . . . . . . Sri Lanka 1,160,000 LKR 9,066A, 6.50%, 7/15/15 . . . . . . . . . . . . . . . . . . . . . . . . . . . . . . . . . . . . . . . . . . . . . . . . . . . . . . . Sri Lanka 28,980,000 LKR 200,828A, 11.00%, 8/01/15 . . . . . . . . . . . . . . . . . . . . . . . . . . . . . . . . . . . . . . . . . . . . . . . . . . . . . . Sri Lanka 200,400,000 LKR 1,537,886A, 6.40%, 8/01/16 . . . . . . . . . . . . . . . . . . . . . . . . . . . . . . . . . . . . . . . . . . . . . . . . . . . . . . . Sri Lanka 19,500,000 LKR 128,232B, 8.50%, 7/15/13 . . . . . . . . . . . . . . . . . . . . . . . . . . . . . . . . . . . . . . . . . . . . . . . . . . . . . . . Sri Lanka 1,110,000 LKR 8,582B, 11.75%, 4/01/14 . . . . . . . . . . . . . . . . . . . . . . . . . . . . . . . . . . . . . . . . . . . . . . . . . . . . . . Sri Lanka 6,990,000 LKR 54,750
FSI-26

Franklin Templeton Variable Insurance Products TrustStatement of Investments, December 31, 2012 (continued)
Franklin Strategic Income Securities Fund CountryPrincipalAmount* Value
Foreign Government and Agency Securities (continued)Government of Sri Lanka, (continued)
B, 6.60%, 6/01/14 . . . . . . . . . . . . . . . . . . . . . . . . . . . . . . . . . . . . . . . . . . . . . . . . . . . . . . . Sri Lanka 7,100,000 LKR $ 51,983B, 6.40%, 10/01/16 . . . . . . . . . . . . . . . . . . . . . . . . . . . . . . . . . . . . . . . . . . . . . . . . . . . . . . Sri Lanka 16,000,000 LKR 104,747
Government of Sweden,1.50%, 8/30/13 . . . . . . . . . . . . . . . . . . . . . . . . . . . . . . . . . . . . . . . . . . . . . . . . . . . . . . . . . Sweden 106,380,000 SEK 16,453,2576.75%, 5/05/14 . . . . . . . . . . . . . . . . . . . . . . . . . . . . . . . . . . . . . . . . . . . . . . . . . . . . . . . . . Sweden 109,020,000 SEK 18,106,528
Government of the Philippines,senior bond, 8.75%, 3/03/13 . . . . . . . . . . . . . . . . . . . . . . . . . . . . . . . . . . . . . . . . . . . . . . . Philippines 57,170,000 PHP 1,407,854senior note, 6.25%, 1/27/14 . . . . . . . . . . . . . . . . . . . . . . . . . . . . . . . . . . . . . . . . . . . . . . . Philippines 121,000,000 PHP 3,071,970
fGovernment of Ukraine,144A, 7.75%, 9/23/20 . . . . . . . . . . . . . . . . . . . . . . . . . . . . . . . . . . . . . . . . . . . . . . . . . . . . Ukraine 6,000,000 6,178,170senior bond, 144A, 7.80%, 11/28/22 . . . . . . . . . . . . . . . . . . . . . . . . . . . . . . . . . . . . . . . . . Ukraine 1,310,000 1,323,100senior note, 144A, 7.95%, 2/23/21 . . . . . . . . . . . . . . . . . . . . . . . . . . . . . . . . . . . . . . . . . . Ukraine 2,120,000 2,201,048
oGovernment of Uruguay, senior note, Index Linked, 4.375%, 12/15/28 . . . . . . . . . . . . . . . . . . Uruguay 135,613,104 UYU 8,422,946fGovernment of Vietnam, 144A, 6.75%, 1/29/20 . . . . . . . . . . . . . . . . . . . . . . . . . . . . . . . . . . . Vietnam 1,500,000 1,717,500Indonesia Retail Bond, senior bond, ORI7, 7.95%, 8/15/13 . . . . . . . . . . . . . . . . . . . . . . . . . . . Indonesia 8,300,000,000 IDR 880,166Korea Monetary Stabilization Bond,
senior bond, 3.76%, 6/02/13 . . . . . . . . . . . . . . . . . . . . . . . . . . . . . . . . . . . . . . . . . . . . . . . South Korea 707,150,000 KRW 667,516senior bond, 3.90%, 8/02/13 . . . . . . . . . . . . . . . . . . . . . . . . . . . . . . . . . . . . . . . . . . . . . . . South Korea 1,325,900,000 KRW 1,254,616senior bond, 3.59%, 10/02/13 . . . . . . . . . . . . . . . . . . . . . . . . . . . . . . . . . . . . . . . . . . . . . . South Korea 1,237,510,000 KRW 1,170,438senior bond, 3.48%, 12/02/13 . . . . . . . . . . . . . . . . . . . . . . . . . . . . . . . . . . . . . . . . . . . . . . South Korea 2,121,430,000 KRW 2,006,671senior bond, 3.47%, 2/02/14 . . . . . . . . . . . . . . . . . . . . . . . . . . . . . . . . . . . . . . . . . . . . . . . South Korea 2,916,950,000 KRW 2,761,944senior bond, 3.59%, 4/02/14 . . . . . . . . . . . . . . . . . . . . . . . . . . . . . . . . . . . . . . . . . . . . . . . South Korea 4,287,030,000 KRW 4,069,507senior note, 3.28%, 6/02/14 . . . . . . . . . . . . . . . . . . . . . . . . . . . . . . . . . . . . . . . . . . . . . . . South Korea 5,082,540,000 KRW 4,809,407senior note, 2.82%, 8/02/14 . . . . . . . . . . . . . . . . . . . . . . . . . . . . . . . . . . . . . . . . . . . . . . . South Korea 509,400,000 KRW 478,916senior note, 2.78%, 10/02/14 . . . . . . . . . . . . . . . . . . . . . . . . . . . . . . . . . . . . . . . . . . . . . . South Korea 2,030,900,000 KRW 1,908,087senior note, 2.84%, 12/02/14 . . . . . . . . . . . . . . . . . . . . . . . . . . . . . . . . . . . . . . . . . . . . . . South Korea 717,280,000 KRW 674,607
Korea Treasury Bond,senior bond, 5.00%, 3/26/13 . . . . . . . . . . . . . . . . . . . . . . . . . . . . . . . . . . . . . . . . . . . . . . . South Korea 1,163,000,000 KRW 1,098,798senior bond, 3.75%, 6/10/13 . . . . . . . . . . . . . . . . . . . . . . . . . . . . . . . . . . . . . . . . . . . . . . . South Korea 4,210,340,000 KRW 3,975,228senior bond, 3.00%, 12/10/13 . . . . . . . . . . . . . . . . . . . . . . . . . . . . . . . . . . . . . . . . . . . . . . South Korea 15,972,210,000 KRW 15,045,186senior bond, 3.50%, 6/10/14 . . . . . . . . . . . . . . . . . . . . . . . . . . . . . . . . . . . . . . . . . . . . . . . South Korea 2,788,920,000 KRW 2,647,662senior note, 5.25%, 3/10/13 . . . . . . . . . . . . . . . . . . . . . . . . . . . . . . . . . . . . . . . . . . . . . . . South Korea 346,570,000 KRW 327,319senior note, 3.25%, 12/10/14 . . . . . . . . . . . . . . . . . . . . . . . . . . . . . . . . . . . . . . . . . . . . . . South Korea 1,261,950,000 KRW 1,195,856
New South Wales Treasury Corp.,5.25%, 5/01/13 . . . . . . . . . . . . . . . . . . . . . . . . . . . . . . . . . . . . . . . . . . . . . . . . . . . . . . . . . Australia 1,605,000 AUD 1,681,1935.50%, 8/01/13 . . . . . . . . . . . . . . . . . . . . . . . . . . . . . . . . . . . . . . . . . . . . . . . . . . . . . . . . . Australia 3,305,000 AUD 3,486,491
Nota Do Tesouro Nacional,10.00%, 1/01/14 . . . . . . . . . . . . . . . . . . . . . . . . . . . . . . . . . . . . . . . . . . . . . . . . . . . . . . . . Brazil 2,700p BRL 1,352,09210.00%, 1/01/17 . . . . . . . . . . . . . . . . . . . . . . . . . . . . . . . . . . . . . . . . . . . . . . . . . . . . . . . . Brazil 7,400p BRL 3,807,622
qIndex Linked, 6.00%, 5/15/15 . . . . . . . . . . . . . . . . . . . . . . . . . . . . . . . . . . . . . . . . . . . . . . Brazil 3,890p BRL 4,618,172qIndex Linked, 6.00%, 8/15/16 . . . . . . . . . . . . . . . . . . . . . . . . . . . . . . . . . . . . . . . . . . . . . . Brazil 1,604p BRL 1,955,646qIndex Linked, 6.00%, 8/15/18 . . . . . . . . . . . . . . . . . . . . . . . . . . . . . . . . . . . . . . . . . . . . . . Brazil 1,525p BRL 1,924,614
Queensland Treasury Corp., senior note, 6.00%, 8/14/13 . . . . . . . . . . . . . . . . . . . . . . . . . . . . . Australia 600,000 AUD 635,694Uruguay Notas del Tesoro,
9.00%, 1/27/14 . . . . . . . . . . . . . . . . . . . . . . . . . . . . . . . . . . . . . . . . . . . . . . . . . . . . . . . . . Uruguay 7,570,000 UYU 393,10310.50%, 3/21/15 . . . . . . . . . . . . . . . . . . . . . . . . . . . . . . . . . . . . . . . . . . . . . . . . . . . . . . . . Uruguay 1,700,000 UYU 90,51710.25%, 8/22/15 . . . . . . . . . . . . . . . . . . . . . . . . . . . . . . . . . . . . . . . . . . . . . . . . . . . . . . . . Uruguay 58,780,000 UYU 3,079,9749.50%, 1/27/16 . . . . . . . . . . . . . . . . . . . . . . . . . . . . . . . . . . . . . . . . . . . . . . . . . . . . . . . . . Uruguay 9,220,000 UYU 483,197
oIndex Linked, 2.25%, 8/23/17 . . . . . . . . . . . . . . . . . . . . . . . . . . . . . . . . . . . . . . . . . . . . . . Uruguay 22,309,878 UYU 1,163,249Western Australia Treasury Corp., 8.00%, 6/15/13 . . . . . . . . . . . . . . . . . . . . . . . . . . . . . . . . . Australia 4,602,000 AUD 4,890,905
Total Foreign Government and Agency Securities(Cost $273,901,323) . . . . . . . . . . . . . . . . . . . . . . . . . . . . . . . . . . . . . . . . . . . . . . . 289,750,686
FSI-27

Franklin Templeton Variable Insurance Products TrustStatement of Investments, December 31, 2012 (continued)
Franklin Strategic Income Securities Fund CountryPrincipalAmount* Value
U.S. Government and Agency Securities 2.1%U.S. Treasury Bond,
4.50%, 2/15/16 . . . . . . . . . . . . . . . . . . . . . . . . . . . . . . . . . . . . . . . . . . . . . . . . . . . . . . United States 3,000,000 $ 3,381,3307.875%, 2/15/21 . . . . . . . . . . . . . . . . . . . . . . . . . . . . . . . . . . . . . . . . . . . . . . . . . . . . . United States 900,000 1,353,4457.125%, 2/15/23 . . . . . . . . . . . . . . . . . . . . . . . . . . . . . . . . . . . . . . . . . . . . . . . . . . . . . United States 1,980,000 2,982,684
U.S. Treasury Note,2.375%, 3/31/16 . . . . . . . . . . . . . . . . . . . . . . . . . . . . . . . . . . . . . . . . . . . . . . . . . . . . . United States 3,500,000 3,721,4844.625%, 2/15/17 . . . . . . . . . . . . . . . . . . . . . . . . . . . . . . . . . . . . . . . . . . . . . . . . . . . . . United States 600,000 699,2814.75%, 8/15/17 . . . . . . . . . . . . . . . . . . . . . . . . . . . . . . . . . . . . . . . . . . . . . . . . . . . . . . United States 2,900,000 3,442,6193.75%, 11/15/18 . . . . . . . . . . . . . . . . . . . . . . . . . . . . . . . . . . . . . . . . . . . . . . . . . . . . . United States 7,000,000 8,147,342
oIndex Linked, 0.125%, 4/15/16 . . . . . . . . . . . . . . . . . . . . . . . . . . . . . . . . . . . . . . . . . . . United States 2,410,349 2,538,774oIndex Linked, 0.625%, 7/15/21 . . . . . . . . . . . . . . . . . . . . . . . . . . . . . . . . . . . . . . . . . . . United States 2,565,844 2,916,644
Total U.S. Government and Agency Securities(Cost $26,704,627) . . . . . . . . . . . . . . . . . . . . . . . . . . . . . . . . . . . . . . . . . . . . . 29,183,603
Asset-Backed Securities and Commercial Mortgage-BackedSecurities 3.3%
Banks 1.5%Banc of America Commercial Mortgage Inc., 2006-4, AJ, 5.695%, 7/10/46 . . . . . . . . . . . . . United States 1,547,000 1,474,519
f,kBanc of America Large Loan, 2010-HLTN, 144A, FRN, 2.509%, 11/15/15 . . . . . . . . . . . . . . United States 4,119,670 4,122,626Bear Stearns Commercial Mortgage Securities Inc.,
k2006-PW11, AJ, FRN, 5.452%, 3/11/39 . . . . . . . . . . . . . . . . . . . . . . . . . . . . . . . . . . . . United States 500,000 511,8132006-PW13, AJ, 5.611%, 9/11/41 . . . . . . . . . . . . . . . . . . . . . . . . . . . . . . . . . . . . . . . . United States 5,100,000 4,986,140
kGreenwich Capital Commercial Funding Corp., 2006-GG7, AJ, FRN, 5.867%, 7/10/38 . . . . United States 2,260,000 2,199,311f,kWachovia Bank Commercial Mortgage Trust, 2007-WHL8, A1, 144A, FRN,
0.289%, 6/15/20 . . . . . . . . . . . . . . . . . . . . . . . . . . . . . . . . . . . . . . . . . . . . . . . . . . . . . United States 4,752,247 4,680,049Wells Fargo Mortgage Backed Securities Trust,
k2004-W, A9, FRN, 2.762%, 11/25/34 . . . . . . . . . . . . . . . . . . . . . . . . . . . . . . . . . . . . . . United States 1,859,052 1,931,0982007-3, 3A1, 5.50%, 4/25/37 . . . . . . . . . . . . . . . . . . . . . . . . . . . . . . . . . . . . . . . . . . . . United States 1,432,052 1,482,550
21,388,106
Diversified Financials 1.8%f,kARES CLO Funds, 2007-12A, B, 144A, FRN, 1.312%, 11/25/20 . . . . . . . . . . . . . . . . . . . . . Cayman Islands 1,380,000 1,297,869f,kCent CDO Ltd., 2007-15A, A2B, 144A, FRN, 0.65%, 3/11/21 . . . . . . . . . . . . . . . . . . . . . . . Cayman Islands 1,251,000 1,144,771
Citigroup Commercial Mortgage Trust,2006-C5, AJ, 5.482%, 10/15/49 . . . . . . . . . . . . . . . . . . . . . . . . . . . . . . . . . . . . . . . . . . United States 1,700,000 1,622,947
k2007-C6, AM, FRN, 5.885%, 6/10/17 . . . . . . . . . . . . . . . . . . . . . . . . . . . . . . . . . . . . . . United States 1,700,000 1,935,437k2008-C7, A4, FRN, 6.072%, 12/10/49 . . . . . . . . . . . . . . . . . . . . . . . . . . . . . . . . . . . . . United States 6,200,000 7,505,162
kCitigroup/Deutsche Bank Commercial Mortgage Trust, 2006-CD3, AJ, FRN,5.688%, 10/15/48 . . . . . . . . . . . . . . . . . . . . . . . . . . . . . . . . . . . . . . . . . . . . . . . . . . . . United States 2,120,000 1,801,081
f,kColumbus Nova CLO Ltd., 2007-2A, A2, 144A, FRN, 1.34%, 10/15/21 . . . . . . . . . . . . . . . . Cayman Islands 860,000 811,616f,kCommercial Industrial Finance Corp., 2007-3A, A1J, 144A, FRN, 0.714%, 7/26/21 . . . . . . . Cayman Islands 960,000 882,996
Countrywide Asset-Backed Certificates, 2005-11, AF4, 5.21%, 3/25/34 . . . . . . . . . . . . . . . United States 1,275,000 858,178f,kGleneagles CLO Ltd., 2005-1A, A2, 144A, FRN, 0.713%, 11/01/17 . . . . . . . . . . . . . . . . . . Cayman Islands 1,000,000 909,580f,kMAPS CLO Fund LLC, 2005-1A, B, 144A, FRN, 0.81%, 12/21/17 . . . . . . . . . . . . . . . . . . . . United States 1,400,000 1,385,510
kMorgan Stanley Capital I Trust, 2006-HQ8, AJ, FRN, 5.68%, 3/12/44 . . . . . . . . . . . . . . . . . United States 200,000 203,283Residential Asset Securities Corp., 2004-KS1, AI4, 4.213%, 4/25/32 . . . . . . . . . . . . . . . . . . United States 68,193 67,759
f,kWestchester CLO Ltd., 2007-1A, A1A, 144A, FRN, 0.538%, 8/01/22 . . . . . . . . . . . . . . . . . Cayman Islands 4,379,921 4,123,170
24,549,359
Total Asset-Backed Securities and CommercialMortgage-Backed Securities (Cost $41,738,738) . . . . . . . . . . . . . . . 45,937,465
FSI-28

Franklin Templeton Variable Insurance Products TrustStatement of Investments, December 31, 2012 (continued)
Franklin Strategic Income Securities Fund CountryPrincipalAmount* Value
Mortgage-Backed Securities 6.0%kFederal Home Loan Mortgage Corp. (FHLMC) Adjustable Rate 0.0%†FHLMC, 2.348%, 1/01/33 . . . . . . . . . . . . . . . . . . . . . . . . . . . . . . . . . . . . . . . . . . . . . . . . . . . United States 74,452 $ 77,627
Federal Home Loan Mortgage Corp. (FHLMC) Fixed Rate 1.0%FHLMC Gold 15 Year, 4.50%, 10/01/18 - 6/01/19 . . . . . . . . . . . . . . . . . . . . . . . . . . . . . . . . . United States 754,108 799,653FHLMC Gold 15 Year, 5.00%, 12/01/17 - 9/01/19 . . . . . . . . . . . . . . . . . . . . . . . . . . . . . . . . . United States 992,106 1,067,544FHLMC Gold 15 Year, 5.50%, 7/01/17 - 7/01/19 . . . . . . . . . . . . . . . . . . . . . . . . . . . . . . . . . . United States 244,341 264,961FHLMC Gold 15 Year, 6.00%, 5/01/17 . . . . . . . . . . . . . . . . . . . . . . . . . . . . . . . . . . . . . . . . . United States 9,614 10,407FHLMC Gold 15 Year, 6.50%, 5/01/16 . . . . . . . . . . . . . . . . . . . . . . . . . . . . . . . . . . . . . . . . . United States 2,264 2,404FHLMC Gold 30 Year, 3.00%, 11/01/42 . . . . . . . . . . . . . . . . . . . . . . . . . . . . . . . . . . . . . . . . United States 2,897,092 3,032,635FHLMC Gold 30 Year, 3.50%, 4/01/42 . . . . . . . . . . . . . . . . . . . . . . . . . . . . . . . . . . . . . . . . . United States 192,531 204,955FHLMC Gold 30 Year, 4.00%, 9/01/40 . . . . . . . . . . . . . . . . . . . . . . . . . . . . . . . . . . . . . . . . . United States 1,494,925 1,597,786FHLMC Gold 30 Year, 4.50%, 10/01/40 . . . . . . . . . . . . . . . . . . . . . . . . . . . . . . . . . . . . . . . . United States 2,232,411 2,404,651FHLMC Gold 30 Year, 5.00%, 4/01/34 - 8/01/35 . . . . . . . . . . . . . . . . . . . . . . . . . . . . . . . . . . United States 822,534 889,090FHLMC Gold 30 Year, 5.50%, 3/01/33 - 6/01/36 . . . . . . . . . . . . . . . . . . . . . . . . . . . . . . . . . . United States 2,479,656 2,721,244FHLMC Gold 30 Year, 6.00%, 4/01/33 - 2/01/36 . . . . . . . . . . . . . . . . . . . . . . . . . . . . . . . . . . United States 696,663 769,777FHLMC Gold 30 Year, 6.50%, 12/01/23 - 6/01/36 . . . . . . . . . . . . . . . . . . . . . . . . . . . . . . . . . United States 131,223 149,607FHLMC Gold 30 Year, 7.00%, 9/01/21 - 4/01/30 . . . . . . . . . . . . . . . . . . . . . . . . . . . . . . . . . . United States 53,441 62,002FHLMC Gold 30 Year, 7.50%, 3/01/30 - 7/01/31 . . . . . . . . . . . . . . . . . . . . . . . . . . . . . . . . . . United States 1,733 1,886
13,978,602
kFederal National Mortgage Association (FNMA) Adjustable Rate 0.0%†FNMA, 2.33%, 4/01/20 . . . . . . . . . . . . . . . . . . . . . . . . . . . . . . . . . . . . . . . . . . . . . . . . . . . . United States 54,785 56,498FNMA, 2.332%, 12/01/34 . . . . . . . . . . . . . . . . . . . . . . . . . . . . . . . . . . . . . . . . . . . . . . . . . . United States 253,358 270,091
326,589
Federal National Mortgage Association (FNMA) Fixed Rate 4.8%FNMA 15 Year, 2.50%, 6/01/27 - 11/01/27 . . . . . . . . . . . . . . . . . . . . . . . . . . . . . . . . . . . . . United States 7,140,562 7,474,532FNMA 15 Year, 3.00%, 3/01/22 . . . . . . . . . . . . . . . . . . . . . . . . . . . . . . . . . . . . . . . . . . . . . . United States 2,234,140 2,359,881
mFNMA 15 Year, 3.50%, 1/01/27 . . . . . . . . . . . . . . . . . . . . . . . . . . . . . . . . . . . . . . . . . . . . . . United States 1,750,000 1,856,914mFNMA 15 Year, 4.00%, 1/01/27 . . . . . . . . . . . . . . . . . . . . . . . . . . . . . . . . . . . . . . . . . . . . . . United States 1,750,000 1,874,414FNMA 15 Year, 4.50%, 6/01/19 - 3/01/20 . . . . . . . . . . . . . . . . . . . . . . . . . . . . . . . . . . . . . . United States 200,599 216,350FNMA 15 Year, 5.00%, 10/01/17 - 6/01/18 . . . . . . . . . . . . . . . . . . . . . . . . . . . . . . . . . . . . . United States 205,724 223,600FNMA 15 Year, 5.50%, 11/01/13 - 11/01/18 . . . . . . . . . . . . . . . . . . . . . . . . . . . . . . . . . . . . United States 1,699,586 1,825,225FNMA 15 Year, 6.00%, 4/01/16 - 7/01/16 . . . . . . . . . . . . . . . . . . . . . . . . . . . . . . . . . . . . . . United States 3,423 3,639
mFNMA 30 Year, 3.00%, 10/01/42 - 1/01/43 . . . . . . . . . . . . . . . . . . . . . . . . . . . . . . . . . . . . . United States 15,149,706 15,892,583FNMA 30 Year, 3.50%, 9/01/42 . . . . . . . . . . . . . . . . . . . . . . . . . . . . . . . . . . . . . . . . . . . . . . United States 746,545 798,426FNMA 30 Year, 4.00%, 11/01/40 - 1/01/41 . . . . . . . . . . . . . . . . . . . . . . . . . . . . . . . . . . . . . United States 2,482,972 2,665,150FNMA 30 Year, 4.50%, 12/01/40 . . . . . . . . . . . . . . . . . . . . . . . . . . . . . . . . . . . . . . . . . . . . . United States 4,351,537 4,717,076FNMA 30 Year, 5.00%, 4/01/30 - 6/01/41 . . . . . . . . . . . . . . . . . . . . . . . . . . . . . . . . . . . . . . United States 19,192,892 20,867,561FNMA 30 Year, 5.50%, 8/01/33 - 9/01/35 . . . . . . . . . . . . . . . . . . . . . . . . . . . . . . . . . . . . . . United States 1,285,373 1,408,142FNMA 30 Year, 6.00%, 6/01/34 - 5/01/38 . . . . . . . . . . . . . . . . . . . . . . . . . . . . . . . . . . . . . . United States 1,913,438 2,109,549FNMA 30 Year, 6.50%, 6/01/28 - 10/01/37 . . . . . . . . . . . . . . . . . . . . . . . . . . . . . . . . . . . . . United States 933,078 1,049,708
65,342,750
Government National Mortgage Association (GNMA) Fixed Rate 0.2%GNMA I SF 30 Year, 5.00%, 11/15/33 - 7/15/34 . . . . . . . . . . . . . . . . . . . . . . . . . . . . . . . . . . United States 758,947 834,611GNMA I SF 30 Year, 5.50%, 12/15/32 - 6/15/36 . . . . . . . . . . . . . . . . . . . . . . . . . . . . . . . . . . United States 886,663 979,168GNMA I SF 30 Year, 6.50%, 11/15/31 - 2/15/32 . . . . . . . . . . . . . . . . . . . . . . . . . . . . . . . . . . United States 4,007 4,757GNMA I SF 30 Year, 7.00%, 10/15/28 - 6/15/32 . . . . . . . . . . . . . . . . . . . . . . . . . . . . . . . . . . United States 42,951 51,466GNMA I SF 30 Year, 7.50%, 9/15/30 . . . . . . . . . . . . . . . . . . . . . . . . . . . . . . . . . . . . . . . . . . United States 1,933 2,371GNMA II SF 30 Year, 5.00%, 9/20/33 - 11/20/33 . . . . . . . . . . . . . . . . . . . . . . . . . . . . . . . . . United States 213,182 234,909GNMA II SF 30 Year, 6.00%, 11/20/34 . . . . . . . . . . . . . . . . . . . . . . . . . . . . . . . . . . . . . . . . . United States 253,113 284,775GNMA II SF 30 Year, 6.50%, 4/20/31 - 2/20/34 . . . . . . . . . . . . . . . . . . . . . . . . . . . . . . . . . . United States 102,063 117,290
FSI-29

Franklin Templeton Variable Insurance Products TrustStatement of Investments, December 31, 2012 (continued)
Franklin Strategic Income Securities Fund CountryPrincipalAmount* Value
Mortgage-Backed Securities (continued)Government National Mortgage Association (GNMA) Fixed Rate (continued)GNMA II SF 30 Year, 7.50%, 1/20/28 - 4/20/32 . . . . . . . . . . . . . . . . . . . . . . . . . . . . . . . . . . United States 22,195 $ 27,185
2,536,532
Total Mortgage-Backed Securities (Cost $80,673,342) . . . . . . . . . . . . . 82,262,100
Municipal Bonds 1.9%California State GO,
Refunding, 5.00%, 4/01/38 . . . . . . . . . . . . . . . . . . . . . . . . . . . . . . . . . . . . . . . . . . . . . . . United States 7,000,000 7,752,849Various Purpose, 6.00%, 4/01/38 . . . . . . . . . . . . . . . . . . . . . . . . . . . . . . . . . . . . . . . . . . . United States 2,500,000 2,996,250Various Purpose, 6.00%, 11/01/39 . . . . . . . . . . . . . . . . . . . . . . . . . . . . . . . . . . . . . . . . . . United States 160,000 194,819Various Purpose, 5.25%, 11/01/40 . . . . . . . . . . . . . . . . . . . . . . . . . . . . . . . . . . . . . . . . . . United States 560,000 651,515Various Purpose, Refunding, 5.25%, 3/01/38 . . . . . . . . . . . . . . . . . . . . . . . . . . . . . . . . . . United States 1,500,000 1,688,370Various Purpose, Refunding, NATL Insured, 4.50%, 12/01/32 . . . . . . . . . . . . . . . . . . . . . . United States 300,000 323,364Various Purpose, Refunding, Series 1, AGMC Insured, 4.75%, 9/01/31 . . . . . . . . . . . . . . . . United States 290,000 311,425
Illinois State GO,5.877%, 3/01/19 . . . . . . . . . . . . . . . . . . . . . . . . . . . . . . . . . . . . . . . . . . . . . . . . . . . . . . . United States 3,575,000 4,118,865Build America Bonds, 7.35%, 7/01/35 . . . . . . . . . . . . . . . . . . . . . . . . . . . . . . . . . . . . . . . . United States 3,000,000 3,632,130
Redondo Beach USD, GO, Build America Bonds, Election of 2008, Direct Payment to District,Series D, 6.461%, 8/01/40 . . . . . . . . . . . . . . . . . . . . . . . . . . . . . . . . . . . . . . . . . . . . . . . . United States 1,510,000 1,639,694
Sonoma County Pension Obligation Revenue, Series A, 6.00%, 12/01/29 . . . . . . . . . . . . . . . . United States 2,100,000 2,345,511
Total Municipal Bonds (Cost $22,148,562) . . . . . . . . . . . . . . . . . . . . . . . . . 25,654,792
Total Investments before Short Term Investments(Cost $1,131,994,076) . . . . . . . . . . . . . . . . . . . . . . . . . . . . . . . . . . . . . . . . . . . . 1,195,856,697
Short Term Investments 13.1%Foreign Government and Agency Securities 4.0%
rBank of Negara Monetary Note, 1/10/13 - 12/12/13 . . . . . . . . . . . . . . . . . . . . . . . . . . . . . . . Malaysia 58,815,000 MYR 19,007,920Government of Singapore, senior bond, 1.625%, 4/01/13 . . . . . . . . . . . . . . . . . . . . . . . . . . . Singapore 2,400,000 SGD 1,971,399Korea Monetary Stabilization Bond,
senior bond, 3.38%, 5/09/13 . . . . . . . . . . . . . . . . . . . . . . . . . . . . . . . . . . . . . . . . . . . . . . South Korea 4,420,000,000 KRW 4,164,368senior note, 3.83%, 4/02/13 . . . . . . . . . . . . . . . . . . . . . . . . . . . . . . . . . . . . . . . . . . . . . . . South Korea 441,970,000 KRW 416,623senior note, 3.28%, 6/09/13 . . . . . . . . . . . . . . . . . . . . . . . . . . . . . . . . . . . . . . . . . . . . . . . South Korea 4,397,300,000 KRW 4,143,155
rMalaysia Treasury Bills, 1/25/13 - 6/28/13 . . . . . . . . . . . . . . . . . . . . . . . . . . . . . . . . . . . . . . . Malaysia 5,900,000 MYR 1,902,993rMexican Cetes Treasury Bill, 9/19/13 . . . . . . . . . . . . . . . . . . . . . . . . . . . . . . . . . . . . . . . . . . . Mexico 325,000 MXN 244,796rPhilippine Treasury Bills, 2/20/13 - 11/13/13 . . . . . . . . . . . . . . . . . . . . . . . . . . . . . . . . . . . . . Philippines 239,680,000 PHP 5,823,608rSingapore Treasury Bills, 1/10/13 - 11/01/13 . . . . . . . . . . . . . . . . . . . . . . . . . . . . . . . . . . . . . Singapore 12,310,000 SGD 10,074,879rSri Lanka Treasury Bills, 8/02/13 - 10/11/13 . . . . . . . . . . . . . . . . . . . . . . . . . . . . . . . . . . . . . . Sri Lanka 3,260,000 LKR 23,784rSweden Treasury Bills, 3/20/13 - 6/19/13 . . . . . . . . . . . . . . . . . . . . . . . . . . . . . . . . . . . . . . . . Sweden 19,410,000 SEK 2,976,593Uruguay Treasury Bills,
r8/09/13 . . . . . . . . . . . . . . . . . . . . . . . . . . . . . . . . . . . . . . . . . . . . . . . . . . . . . . . . . . . . . . Uruguay 16,070,000 UYU 795,100Strip, 9/09/13 . . . . . . . . . . . . . . . . . . . . . . . . . . . . . . . . . . . . . . . . . . . . . . . . . . . . . . . . . . Uruguay 58,400,000 UYU 2,861,914
Total Foreign Government and Agency Securities(Cost $52,597,129) . . . . . . . . . . . . . . . . . . . . . . . . . . . . . . . . . . . . . . . . . . . . . . . 54,407,132
Total Investments before Money Market Funds(Cost $1,184,591,205) . . . . . . . . . . . . . . . . . . . . . . . . . . . . . . . . . . . . . . . . . . . . 1,250,263,829
FSI-30

Franklin Templeton Variable Insurance Products TrustStatement of Investments, December 31, 2012 (continued)
Franklin Strategic Income Securities Fund Country Shares Value
Money Market Funds (Cost $125,449,996) 9.1%a,sInstitutional Fiduciary Trust Money Market Portfolio . . . . . . . . . . . . . . . . . . . . . . . . . . . . . . . . . . United States 125,449,996 $ 125,449,996
Total Investments (Cost $1,310,041,201) 100.1% . . . . . . . . . . . . . . . . . . . . 1,375,713,825
Other Assets, less Liabilities (0.1)% . . . . . . . . . . . . . . . . . . . . . . . . . . . . . . . . . . . (1,247,144)
Net Assets 100.0% . . . . . . . . . . . . . . . . . . . . . . . . . . . . . . . . . . . . . . . . . . . . . . . . . . . . $1,374,466,681
See Abbreviations on page FSI-51.
†Rounds to less than 0.1% of net assets.*The principal amount is stated in U.S. dollars unless otherwise indicated.aNon-income producing.bSecurity has been deemed illiquid because it may not be able to be sold within seven days.cSee Note 1(g) regarding investment in FT Holdings Corporation III.dAt December 31, 2012, pursuant to the Fund’s policies and the requirements of applicable securities law, the Fund may be restricted from trading thesesecurities for a limited or extended period of time due to ownership limits and/or potential possession of material non-public information.eSee Note 9 regarding restricted securities.fSecurity was purchased pursuant to Rule 144A under the Securities Act of 1933 and may be sold in transactions exempt from registration only to qualifiedinstitutional buyers or in a public offering registered under the Securities Act of 1933. These securities have been deemed liquid under guidelines approved by theTrust’s Board of Trustees. At December 31, 2012, the aggregate value of these securities was $228,960,011, representing 16.66% of net assets.gSee Note 8 regarding defaulted securities.hPerpetual security with no stated maturity date.iSee Note 1(f) regarding loan participation notes.jIncome may be received in additional securities and/or cash.kThe coupon rate shown represents the rate at period end.lSee Note 1(i) regarding senior floating rate interests.mA portion or all of the security purchased on a delayed delivery or to-be-announced (TBA) basis. See Note 1(c).nPrincipal amount is stated in 100 Mexican Peso Units.oPrincipal amount of security is adjusted for inflation. See Note 1(k).pPrincipal amount is stated in 1,000 Brazilian Real Units.qRedemption price at maturity is adjusted for inflation. See Note 1(k).rThe security is traded on a discount basis with no stated coupon rate.sSee Note 7 regarding investments in the Institutional Fiduciary Trust Money Market Portfolio.
FSI-31

Franklin Templeton Variable Insurance Products TrustStatement of Investments, December 31, 2012 (continued)
Franklin Strategic Income Securities Fund
At December 31, 2012, the Fund had the following forward exchange contracts outstanding. See Note 1(d).
Forward Exchange Contracts
Currency Counterparty Type QuantityContractAmount
SettlementDate
UnrealizedAppreciation
UnrealizedDepreciation
Euro DBAB Sell 239,450 $ 305,897 1/03/13 $ — $ (10,089)Euro DBAB Buy 239,450 316,194 1/03/13 — (207)Philippine Peso DBAB Buy 12,562,000 301,899 1/07/13 4,079 —Chilean Peso DBAB Sell 1,000,000,000 1,969,859 1/10/13 — (116,038)Chilean Peso DBAB Buy 2,449,000,000 4,646,177 1/10/13 462,185 —Indian Rupee HSBC Buy 94,400,000 1,702,318 1/10/13 14,618 —Japanese Yen HSBC Sell 183,560,000 2,402,932 1/10/13 286,909 —Euro UBSW Sell 3,940,000 5,039,654 1/11/13 — (160,090)Euro BZWS Sell 1,691,484 2,164,339 1/11/13 — (67,967)Euro JPHQ Sell 1,802,953 2,299,576 1/14/13 — (79,903)Euro DBAB Sell 2,187,000 2,808,327 1/14/13 — (78,006)Euro DBAB Buy 321,959 416,551 1/14/13 8,361 —Japanese Yen BZWS Sell 460,675,000 6,026,228 1/15/13 715,481 —Philippine Peso JPHQ Buy 2,317,000 55,861 1/15/13 582 —Indian Rupee JPHQ Buy 192,280,000 3,606,152 1/16/13 — (113,433)Euro DBAB Sell 252,750 330,243 1/17/13 — (3,337)Euro DBAB Buy 212,200 273,993 1/17/13 6,070 —Euro BZWS Sell 2,912,410 3,716,235 1/22/13 — (127,750)Euro DBAB Sell 186,978 238,990 1/22/13 — (7,796)Japanese Yen DBAB Buy 271,680,000 3,466,810 1/22/13 — (334,646)Japanese Yen DBAB Sell 271,680,000 3,556,021 1/22/13 423,857 —Euro DBAB Sell 465,260 603,675 1/24/13 — (10,416)Euro DBAB Sell 3,774,662 4,908,633 1/28/13 — (73,679)Euro BZWS Sell 1,007,118 1,313,231 1/28/13 — (16,100)Euro DBAB Buy 572,313 758,114 1/28/13 — (2,698)Euro DBAB Buy 3,177,772 4,098,910 1/28/13 95,546 —Indian Rupee JPHQ Buy 54,590,000 1,000,000 1/29/13 — (11,110)Euro DBAB Sell 4,032,721 5,311,900 1/30/13 — (11,130)Euro DBAB Sell 3,014,151 3,960,293 1/31/13 — (18,299)Chilean Peso DBAB Buy 725,000,000 1,434,167 2/07/13 72,222 —Chilean Peso JPHQ Buy 482,900,000 958,325 2/08/13 44,911 —Indian Rupee HSBC Buy 186,760,000 3,668,507 2/08/13 — (291,139)Chilean Peso BZWS Buy 1,487,300,000 2,958,623 2/11/13 130,137 —Euro UBSW Sell 2,151,000 2,862,400 2/13/13 22,831 —Singapore Dollar DBAB Buy 578,000 462,289 2/25/13 10,902 —Japanese Yen BZWS Sell 37,600,000 480,327 2/27/13 46,723 —Singapore Dollar DBAB Buy 361,500 288,301 2/28/13 7,648 —Euro UBSW Sell 2,581,000 3,478,156 3/01/13 70,477 —Japanese Yen JPHQ Sell 85,800,000 1,073,842 3/01/13 84,379 —Japanese Yen HSBC Sell 85,800,000 1,073,070 3/01/13 83,607 —Euro DBAB Sell 5,979,967 8,000,000 3/04/13 104,464 —Indian Rupee HSBC Buy 32,771,000 592,320 3/04/13 — (2,064)Japanese Yen UBSW Sell 95,700,000 1,194,048 3/04/13 90,388 —Japanese Yen DBAB Sell 257,790,000 3,153,395 3/04/13 180,430 —Indian Rupee HSBC Buy 5,576,000 100,950 3/11/13 — (645)Indian Rupee HSBC Buy 14,080,000 255,600 3/13/13 — (2,408)Euro DBAB Sell 324,000 424,084 3/18/13 — (3,760)Indian Rupee DBAB Buy 14,156,000 256,505 3/18/13 — (2,175)Singapore Dollar JPHQ Buy 700,000 573,395 3/19/13 — (322)
FSI-32

Franklin Templeton Variable Insurance Products TrustStatement of Investments, December 31, 2012 (continued)
Franklin Strategic Income Securities Fund
Forward Exchange Contracts (continued)
Currency Counterparty Type QuantityContractAmount
SettlementDate
UnrealizedAppreciation
UnrealizedDepreciation
Singapore Dollar DBAB Buy 973,400 $ 768,696 3/19/13 $28,202 $ —Singapore Dollar HSBC Buy 1,113,000 880,747 3/19/13 30,438 —Indian Rupee DBAB Buy 12,894,000 231,786 3/20/13 — (212)Indian Rupee JPHQ Buy 55,600,000 1,000,000 3/21/13 — (1,616)Singapore Dollar DBAB Buy 1,048,000 835,592 3/21/13 22,380 —Singapore Dollar HSBC Buy 837,000 667,251 3/21/13 17,980 —Euro DBAB Sell 333,108 440,136 3/26/13 232 —Euro DBAB Sell 7,647,393 10,159,601 4/02/13 59,755 —Euro DBAB Sell 222,456 297,469 4/03/13 3,670 —Indian Rupee HSBC Buy 108,100,000 2,000,000 4/03/13 — (63,363)Euro BZWS Sell 132,570 176,948 4/05/13 1,859 —Philippine Peso DBAB Buy 12,557,000 302,149 4/05/13 3,677 —Philippine Peso DBAB Buy 20,621,000 496,999 4/10/13 5,173 —Philippine Peso JPHQ Buy 6,636,000 159,919 4/10/13 1,684 —British Pound DBAB Sell 456,285 720,246 4/11/13 — (20,969)British Pound DBAB Buy 456,285 738,725 4/11/13 2,489 —Euro DBAB Sell 949,814 1,251,011 4/11/13 — (3,511)Philippine Peso HSBC Buy 10,293,000 247,779 4/11/13 2,875 —Indian Rupee DBAB Buy 20,841,000 383,696 4/12/13 — (10,894)Chilean Peso MSCO Buy 116,230,000 229,138 4/15/13 10,254 —Indian Rupee DBAB Buy 44,691,000 817,214 4/15/13 — (18,192)Indian Rupee DBAB Sell 28,000,000 486,280 4/15/13 — (14,327)Philippine Peso HSBC Buy 8,192,000 197,502 4/15/13 1,972 —Euro HSBC Sell 142,717 188,818 4/16/13 307 —Indian Rupee JPHQ Buy 30,019,000 550,585 4/16/13 — (13,971)Indian Rupee JPHQ Buy 29,466,000 538,595 4/18/13 — (12,045)Chilean Peso MSCO Buy 104,150,000 205,505 4/19/13 8,887 —Euro BZWS Sell 130,134 171,152 4/19/13 — (743)Indian Rupee JPHQ Buy 14,719,000 269,695 4/22/13 — (6,848)Indian Rupee DBAB Buy 10,360,000 189,582 4/22/13 — (4,577)Euro JPHQ Sell 36,314 48,058 4/23/13 88 —Euro BZWS Sell 1,659,340 2,160,809 4/25/13 — (31,161)Indian Rupee DBAB Buy 20,931,000 373,361 4/26/13 165 —Chilean Peso JPHQ Buy 234,301,000 462,680 4/29/13 18,958 —Chilean Peso CITI Buy 377,668,000 747,857 4/29/13 28,490 —Indian Rupee JPHQ Buy 17,801,000 319,386 4/29/13 — (1,878)Euro DBAB Sell 753,750 1,000,000 4/30/13 4,256 —Euro BZWS Sell 91,515 121,559 4/30/13 663 —Indian Rupee JPHQ Buy 14,829,000 265,529 4/30/13 — (1,076)Singapore Dollar DBAB Buy 6,168,500 5,059,963 4/30/13 — (9,832)British Pound DBAB Sell 453,906 732,877 5/02/13 — (4,415)British Pound DBAB Buy 230,355 370,520 5/02/13 3,652 —Euro DBAB Sell 71,000 93,003 5/02/13 — (794)Philippine Peso JPHQ Buy 91,360,000 2,144,953 5/06/13 78,675 —Chilean Peso DBAB Buy 574,000,000 1,134,051 5/08/13 44,412 —Singapore Dollar DBAB Buy 3,707,640 2,984,016 5/10/13 51,439 —Euro DBAB Sell 429,000 557,357 5/13/13 — (9,448)British Pound DBAB Sell 2,287,500 3,654,968 5/17/13 — (60,468)British Pound DBAB Buy 2,157,182 3,433,090 5/17/13 70,680 —Euro JPHQ Sell 201,376 258,322 5/23/13 — (7,766)Euro DBAB Sell 1,053,792 1,310,844 6/05/13 — (81,764)
FSI-33

Franklin Templeton Variable Insurance Products TrustStatement of Investments, December 31, 2012 (continued)
Franklin Strategic Income Securities Fund
Forward Exchange Contracts (continued)
Currency Counterparty Type QuantityContractAmount
SettlementDate
UnrealizedAppreciation
UnrealizedDepreciation
Singapore Dollar JPHQ Buy 4,945,200 $4,052,446 6/05/13 $ — $ (3,720)Euro UBSW Sell 4,274,000 5,354,467 6/28/13 — (294,985)Euro DBAB Sell 320,700 402,767 6/28/13 — (21,140)Japanese Yen BZWS Sell 620,288,000 7,871,176 7/02/13 710,321 —British Pound DBAB Sell 297,656 461,665 7/09/13 — (21,702)Euro DBAB Sell 478,724 590,553 7/23/13 — (42,403)Euro DBAB Sell 218,913 267,380 7/25/13 — (22,067)Euro BZWS Sell 1,993,000 2,589,505 7/26/13 — (45,678)Euro DBAB Sell 190,862 231,697 7/26/13 — (20,665)Euro CITI Sell 648,569 841,907 7/26/13 — (15,643)Euro DBAB Sell 3,280,000 3,997,336 7/29/13 — (339,685)Euro DBAB Sell 870,275 1,077,313 7/31/13 — (73,443)British Pound DBAB Sell 169,385 264,765 8/01/13 — (10,277)Euro JPHQ Sell 667,276 815,828 8/06/13 — (66,562)Euro CITI Sell 317,220 395,948 8/08/13 — (23,546)Euro CITI Sell 92,411 115,487 8/09/13 — (6,719)Japanese Yen DBAB Sell 35,465,000 452,961 8/19/13 43,331 —Chilean Peso JPHQ Buy 1,141,336,600 2,278,117 8/20/13 34,406 —Euro BZWS Sell 2,084,000 2,579,784 8/20/13 — (176,470)Japanese Yen JPHQ Sell 15,928,000 201,793 8/20/13 17,818 —Japanese Yen HSBC Sell 65,957,000 835,957 8/20/13 74,129 —Japanese Yen UBSW Sell 32,055,000 407,125 8/20/13 36,878 —Euro DBAB Sell 193,056 238,881 8/21/13 — (16,453)Euro UBSW Sell 3,500,000 4,331,775 8/22/13 — (297,350)Japanese Yen BZWS Sell 15,895,000 201,075 8/22/13 17,478 —Euro BZWS Sell 704,462 882,127 8/23/13 — (49,609)Japanese Yen DBAB Buy 15,708,000 201,147 8/23/13 — (19,708)Japanese Yen CITI Sell 31,757,000 401,758 8/23/13 34,942 —Japanese Yen DBAB Sell 15,708,000 198,848 8/23/13 17,409 —Japanese Yen HSBC Sell 31,524,000 399,250 8/23/13 35,125 —Euro BZWS Sell 3,068,753 3,844,657 8/26/13 — (214,275)Euro UBSW Sell 2,397,698 3,000,000 8/26/13 — (171,351)Japanese Yen JPHQ Sell 31,689,000 401,992 8/26/13 35,949 —Japanese Yen UBSW Sell 34,903,000 442,426 8/26/13 39,258 —Japanese Yen BZWS Sell 44,152,000 560,376 8/26/13 50,371 —Singapore Dollar DBAB Buy 580,000 464,595 8/26/13 10,270 —Euro DBAB Sell 810,000 1,024,091 8/27/13 — (47,279)Japanese Yen DBAB Buy 44,915,000 575,059 8/27/13 — (56,236)Japanese Yen JPHQ Sell 15,991,000 204,547 8/27/13 19,832 —Japanese Yen HSBC Sell 50,145,000 641,240 8/27/13 62,004 —Japanese Yen DBAB Sell 72,099,000 921,699 8/27/13 88,868 —Singapore Dollar DBAB Buy 722,000 581,742 8/27/13 9,383 —Euro DBAB Sell 1,978,657 2,487,970 8/28/13 — (129,187)Euro DBAB Sell 651,325 823,796 8/29/13 — (37,717)Japanese Yen JPHQ Sell 15,743,000 201,079 8/30/13 19,223 —Singapore Dollar DBAB Buy 361,500 289,269 8/30/13 6,702 —Euro DBAB Sell 601,984 760,606 9/04/13 — (35,694)Euro BZWS Sell 271,320 343,478 9/10/13 — (15,446)Euro BZWS Sell 266,006 341,467 9/12/13 — (10,435)Euro BZWS Sell 759,073 982,734 9/16/13 — (21,494)Euro UBSW Sell 708,181 916,245 9/17/13 — (20,666)
FSI-34

Franklin Templeton Variable Insurance Products TrustStatement of Investments, December 31, 2012 (continued)
Franklin Strategic Income Securities Fund
Forward Exchange Contracts (continued)
Currency Counterparty Type QuantityContractAmount
SettlementDate
UnrealizedAppreciation
UnrealizedDepreciation
Euro BZWS Sell 178,354 $ 234,946 9/19/13 $ — $ (1,018)Singapore Dollar JPHQ Buy 694,000 567,364 9/19/13 836 —Euro UBSW Sell 2,137,312 2,824,950 9/20/13 — (2,766)Japanese Yen DBAB Sell 335,180,000 4,000,000 9/20/13 127,280 —Euro DBAB Sell 495,470 648,967 9/23/13 — (6,574)Euro BZWS Sell 469,210 609,870 9/24/13 — (10,933)Euro DBAB Sell 1,550,000 1,999,268 9/30/13 — (51,657)Philippine Peso DBAB Buy 21,010,000 502,632 10/04/13 7,654 —Philippine Peso HSBC Buy 16,853,000 404,013 10/04/13 5,308 —Euro UBSW Sell 2,850,000 3,691,121 10/07/13 — (80,280)Euro DBAB Sell 185,654 240,385 10/07/13 — (5,291)Philippine Peso HSBC Buy 25,126,000 604,150 10/07/13 6,005 —Euro BZWS Sell 2,749,000 3,575,075 10/11/13 — (62,864)Philippine Peso JPHQ Buy 8,232,000 198,166 10/11/13 1,695 —Philippine Peso HSBC Buy 14,493,000 348,716 10/11/13 3,153 —Euro DBAB Sell 121,043 157,162 10/15/13 — (3,031)Philippine Peso DBAB Buy 4,913,000 118,047 10/16/13 1,201 —Euro DBAB Sell 587,951 769,510 10/18/13 — (8,637)Malaysian Ringgit JPHQ Buy 763,000 245,614 10/18/13 — (706)Malaysian Ringgit DBAB Buy 10,212,000 3,293,662 10/23/13 — (16,621)Malaysian Ringgit HSBC Buy 6,809,796 2,196,000 10/24/13 — (10,837)Euro BZWS Sell 217,715 283,992 10/25/13 — (4,178)Japanese Yen JPHQ Sell 270,990,000 3,408,572 10/28/13 275,918 —Euro UBSW Sell 369,000 481,010 10/29/13 — (7,428)Euro DBAB Sell 1,494,524 1,934,250 10/31/13 — (44,074)Japanese Yen JPHQ Sell 360,360,000 4,532,853 11/01/13 366,844 —Euro DBAB Sell 243,767 318,112 11/04/13 — (4,583)Euro BZWS Sell 529,706 689,577 11/05/13 — (11,649)Euro JPHQ Sell 473,670 606,523 11/12/13 — (20,580)Euro DBAB Sell 800,000 1,050,560 11/14/13 — (8,607)Euro DBAB Sell 227,970 291,031 11/15/13 — (10,796)Japanese Yen MSCO Sell 12,500,000 158,018 11/15/13 13,481 —Euro DBAB Sell 63,419 81,477 11/19/13 — (2,493)Malaysian Ringgit DBAB Buy 623,200 200,000 11/19/13 — (279)Euro UBSW Sell 1,480,440 1,895,111 11/20/13 — (65,084)Euro JPHQ Sell 221,993 283,400 11/20/13 — (10,533)Malaysian Ringgit HSBC Buy 376,000 120,466 11/20/13 28 —Euro UBSW Sell 1,245,000 1,623,169 12/03/13 — (25,570)Euro UBSW Sell 3,400,000 4,463,418 12/09/13 — (39,517)Euro DBAB Sell 5,049,917 6,629,027 12/10/13 — (59,134)Japanese Yen UBSW Sell 187,760,000 2,293,448 12/12/13 121,562 —Euro DBAB Sell 1,200,000 1,565,760 12/13/13 — (23,595)Euro CITI Sell 3,868,000 5,079,844 12/17/13 — (43,445)Euro DBAB Sell 486,875 643,016 12/18/13 — (1,875)Euro DBAB Sell 262,167 348,111 12/20/13 847 —Euro DBAB Sell 239,450 317,415 1/03/14 184 —
Unrealized appreciation (depreciation) 5,765,812 (4,897,317)
Net unrealized appreciation (depreciation) $ 868,495
FSI-35

Franklin Templeton Variable Insurance Products TrustStatement of Investments, December 31, 2012 (continued)
Franklin Strategic Income Securities Fund
At December 31, the Fund had the following credit default swap contracts outstanding. See Note 1(d).
Credit Default Swap Contracts
DescriptionCounter-
partyaNotionalAmountb
PeriodicPayment
RateExpiration
Date
UpfrontPremiums
Paid(Received)
UnrealizedAppreciation
UnrealizedDepreciation
MarketValue Ratingc
Contracts to Sell Protectiond
Traded IndexMCDX.NA.19 CITI $12,500,000 1.00% 12/20/17 $(322,747) $ 9,191 $— (313,556) Non Investment
GradeMCDX.NA.19 GSCO 500,000 1.00% 12/20/17 (14,415) 1,873 — (12,542) Non Investment
GradeMCDX.NA.19 MSCO 7,000,000 1.00% 12/20/17 (171,750) — (3,841) (175,591) Non Investment
Grade
Unrealized appreciation (depreciation) 11,064 (3,841)
Net unrealized appreciation (depreciation) $ 7,223
aPositions are generally not collateralized if the market value is under $250,000. Collateral requirements may be net of current positions at the individualcounterparty for the fund. The table below summarizes the cash and/or securities held as collateral for each applicable counterparty at year end:Counterparty Collateral Posted (Received)
CITI . . . . . . . . . . . . . . . . . . . . . . . . . . . . . . . . . . . . . . $260,000
bIn U.S. dollars unless otherwise indicated. For contracts to sell protection, the notional amount is equal to the maximum potential amount of the futurepayments and no recourse provisions have been entered into in association with the contracts.cBased on Standard and Poor’s (S&P) Rating for single name swaps and internal ratings for index swaps. Internal ratings based on mapping into equivalentratings from external vendors.dThe fund enters contracts to sell protection to create a long credit position. Performance triggers include failure to pay or bankruptcy of the underlying securitiesfor traded index swaps.
See Abbreviations on page FSI-51.
The accompanying notes are an integral part of these financial statements.FSI-36

Franklin Templeton Variable Insurance Products Trust
Financial Statements
Statement of Assets and LiabilitiesDecember 31, 2012
FranklinStrategic IncomeSecurities Fund
Assets:Investments in securities:
Cost - Unaffiliated issuers . . . . . . . . . . . . . . . . . . . . . . . . . . . . . . . . . . . . . . . . . . . . . . . . . . . . . . . . . . . . . . . . . . . . . . . . . . . . $1,184,591,205Cost - Sweep Money Fund (Note 7) . . . . . . . . . . . . . . . . . . . . . . . . . . . . . . . . . . . . . . . . . . . . . . . . . . . . . . . . . . . . . . . . . . . . 125,449,996
Total cost of investments . . . . . . . . . . . . . . . . . . . . . . . . . . . . . . . . . . . . . . . . . . . . . . . . . . . . . . . . . . . . . . . . . . . . . . . . . . . . $1,310,041,201
Value - Unaffiliated issuers . . . . . . . . . . . . . . . . . . . . . . . . . . . . . . . . . . . . . . . . . . . . . . . . . . . . . . . . . . . . . . . . . . . . . . . . . . . $1,250,263,829Value - Sweep Money Fund (Note 7) . . . . . . . . . . . . . . . . . . . . . . . . . . . . . . . . . . . . . . . . . . . . . . . . . . . . . . . . . . . . . . . . . . . 125,449,996
Total value of investments . . . . . . . . . . . . . . . . . . . . . . . . . . . . . . . . . . . . . . . . . . . . . . . . . . . . . . . . . . . . . . . . . . . . . . . . . . . 1,375,713,825Cash . . . . . . . . . . . . . . . . . . . . . . . . . . . . . . . . . . . . . . . . . . . . . . . . . . . . . . . . . . . . . . . . . . . . . . . . . . . . . . . . . . . . . . . . . . . . . . . 1,743,381Restricted cash (Note 1e) . . . . . . . . . . . . . . . . . . . . . . . . . . . . . . . . . . . . . . . . . . . . . . . . . . . . . . . . . . . . . . . . . . . . . . . . . . . . . . . 685,000Foreign currency, at value (cost $1,402,602) . . . . . . . . . . . . . . . . . . . . . . . . . . . . . . . . . . . . . . . . . . . . . . . . . . . . . . . . . . . . . . 1,402,035Receivables:
Investment securities sold . . . . . . . . . . . . . . . . . . . . . . . . . . . . . . . . . . . . . . . . . . . . . . . . . . . . . . . . . . . . . . . . . . . . . . . . . . . . 3,879,221Capital shares sold . . . . . . . . . . . . . . . . . . . . . . . . . . . . . . . . . . . . . . . . . . . . . . . . . . . . . . . . . . . . . . . . . . . . . . . . . . . . . . . . . 457,848Interest . . . . . . . . . . . . . . . . . . . . . . . . . . . . . . . . . . . . . . . . . . . . . . . . . . . . . . . . . . . . . . . . . . . . . . . . . . . . . . . . . . . . . . . . . . . 15,217,191
Due from brokers . . . . . . . . . . . . . . . . . . . . . . . . . . . . . . . . . . . . . . . . . . . . . . . . . . . . . . . . . . . . . . . . . . . . . . . . . . . . . . . . . . . . . 1,320,000Unrealized appreciation on forward exchange contracts . . . . . . . . . . . . . . . . . . . . . . . . . . . . . . . . . . . . . . . . . . . . . . . . . . . . . 5,765,812Unrealized appreciation on swap contracts . . . . . . . . . . . . . . . . . . . . . . . . . . . . . . . . . . . . . . . . . . . . . . . . . . . . . . . . . . . . . . . . 11,064Other assets . . . . . . . . . . . . . . . . . . . . . . . . . . . . . . . . . . . . . . . . . . . . . . . . . . . . . . . . . . . . . . . . . . . . . . . . . . . . . . . . . . . . . . . . . 34
Total assets . . . . . . . . . . . . . . . . . . . . . . . . . . . . . . . . . . . . . . . . . . . . . . . . . . . . . . . . . . . . . . . . . . . . . . . . . . . . . . . . . . . . . 1,406,195,411
Liabilities:Payables:
Investment securities purchased . . . . . . . . . . . . . . . . . . . . . . . . . . . . . . . . . . . . . . . . . . . . . . . . . . . . . . . . . . . . . . . . . . . . . . . 19,833,559Capital shares redeemed . . . . . . . . . . . . . . . . . . . . . . . . . . . . . . . . . . . . . . . . . . . . . . . . . . . . . . . . . . . . . . . . . . . . . . . . . . . . . 4,263,339Affiliates . . . . . . . . . . . . . . . . . . . . . . . . . . . . . . . . . . . . . . . . . . . . . . . . . . . . . . . . . . . . . . . . . . . . . . . . . . . . . . . . . . . . . . . . . . 804,533
Due to brokers . . . . . . . . . . . . . . . . . . . . . . . . . . . . . . . . . . . . . . . . . . . . . . . . . . . . . . . . . . . . . . . . . . . . . . . . . . . . . . . . . . . . . . . 685,000Swaps (premiums received $526,681) . . . . . . . . . . . . . . . . . . . . . . . . . . . . . . . . . . . . . . . . . . . . . . . . . . . . . . . . . . . . . . . . . . . . 508,912Unrealized depreciation on forward exchange contracts . . . . . . . . . . . . . . . . . . . . . . . . . . . . . . . . . . . . . . . . . . . . . . . . . . . . . 4,897,317Unrealized depreciation on swap contracts . . . . . . . . . . . . . . . . . . . . . . . . . . . . . . . . . . . . . . . . . . . . . . . . . . . . . . . . . . . . . . . . 3,841Deferred tax . . . . . . . . . . . . . . . . . . . . . . . . . . . . . . . . . . . . . . . . . . . . . . . . . . . . . . . . . . . . . . . . . . . . . . . . . . . . . . . . . . . . . . . . . 209,403Accrued expenses and other liabilities . . . . . . . . . . . . . . . . . . . . . . . . . . . . . . . . . . . . . . . . . . . . . . . . . . . . . . . . . . . . . . . . . . . . 522,826
Total liabilities . . . . . . . . . . . . . . . . . . . . . . . . . . . . . . . . . . . . . . . . . . . . . . . . . . . . . . . . . . . . . . . . . . . . . . . . . . . . . . . . . . . 31,728,730
Net assets, at value . . . . . . . . . . . . . . . . . . . . . . . . . . . . . . . . . . . . . . . . . . . . . . . . . . . . . . . . . . . . . . . . . . . . . . . . . . . . $1,374,466,681
Net assets consist of:Paid-in capital . . . . . . . . . . . . . . . . . . . . . . . . . . . . . . . . . . . . . . . . . . . . . . . . . . . . . . . . . . . . . . . . . . . . . . . . . . . . . . . . . . . . . . . . $1,223,254,980Undistributed net investment income . . . . . . . . . . . . . . . . . . . . . . . . . . . . . . . . . . . . . . . . . . . . . . . . . . . . . . . . . . . . . . . . . . . . . 68,571,868Net unrealized appreciation (depreciation) . . . . . . . . . . . . . . . . . . . . . . . . . . . . . . . . . . . . . . . . . . . . . . . . . . . . . . . . . . . . . . . . 66,464,631Accumulated net realized gain (loss) . . . . . . . . . . . . . . . . . . . . . . . . . . . . . . . . . . . . . . . . . . . . . . . . . . . . . . . . . . . . . . . . . . . . . 16,175,202
Net assets, at value . . . . . . . . . . . . . . . . . . . . . . . . . . . . . . . . . . . . . . . . . . . . . . . . . . . . . . . . . . . . . . . . . . . . . . . . . . . . $1,374,466,681
The accompanying notes are an integral part of these financial statements. FSI-37

Franklin Templeton Variable Insurance Products Trust
Financial Statements (continued)
Statement of Assets and Liabilities (continued)December 31, 2012
FranklinStrategic IncomeSecurities Fund
Class 1:Net assets, at value . . . . . . . . . . . . . . . . . . . . . . . . . . . . . . . . . . . . . . . . . . . . . . . . . . . . . . . . . . . . . . . . . . . . . . . . . . . . . . . . . . . $1,019,536,948
Shares outstanding . . . . . . . . . . . . . . . . . . . . . . . . . . . . . . . . . . . . . . . . . . . . . . . . . . . . . . . . . . . . . . . . . . . . . . . . . . . . . . . . . . . . 77,412,494
Net asset value and maximum offering price per share . . . . . . . . . . . . . . . . . . . . . . . . . . . . . . . . . . . . . . . . . . . . . . . . . . . . . . $ 13.17
Class 2:Net assets, at value . . . . . . . . . . . . . . . . . . . . . . . . . . . . . . . . . . . . . . . . . . . . . . . . . . . . . . . . . . . . . . . . . . . . . . . . . . . . . . . . . . . $ 158,451,035
Shares outstanding . . . . . . . . . . . . . . . . . . . . . . . . . . . . . . . . . . . . . . . . . . . . . . . . . . . . . . . . . . . . . . . . . . . . . . . . . . . . . . . . . . . . 12,336,191
Net asset value and maximum offering price per share . . . . . . . . . . . . . . . . . . . . . . . . . . . . . . . . . . . . . . . . . . . . . . . . . . . . . . $ 12.84
Class 4:Net assets, at value . . . . . . . . . . . . . . . . . . . . . . . . . . . . . . . . . . . . . . . . . . . . . . . . . . . . . . . . . . . . . . . . . . . . . . . . . . . . . . . . . . . $ 196,478,698
Shares outstanding . . . . . . . . . . . . . . . . . . . . . . . . . . . . . . . . . . . . . . . . . . . . . . . . . . . . . . . . . . . . . . . . . . . . . . . . . . . . . . . . . . . . 15,065,356
Net asset value and maximum offering price per share . . . . . . . . . . . . . . . . . . . . . . . . . . . . . . . . . . . . . . . . . . . . . . . . . . . . . . $ 13.04
The accompanying notes are an integral part of these financial statements.FSI-38
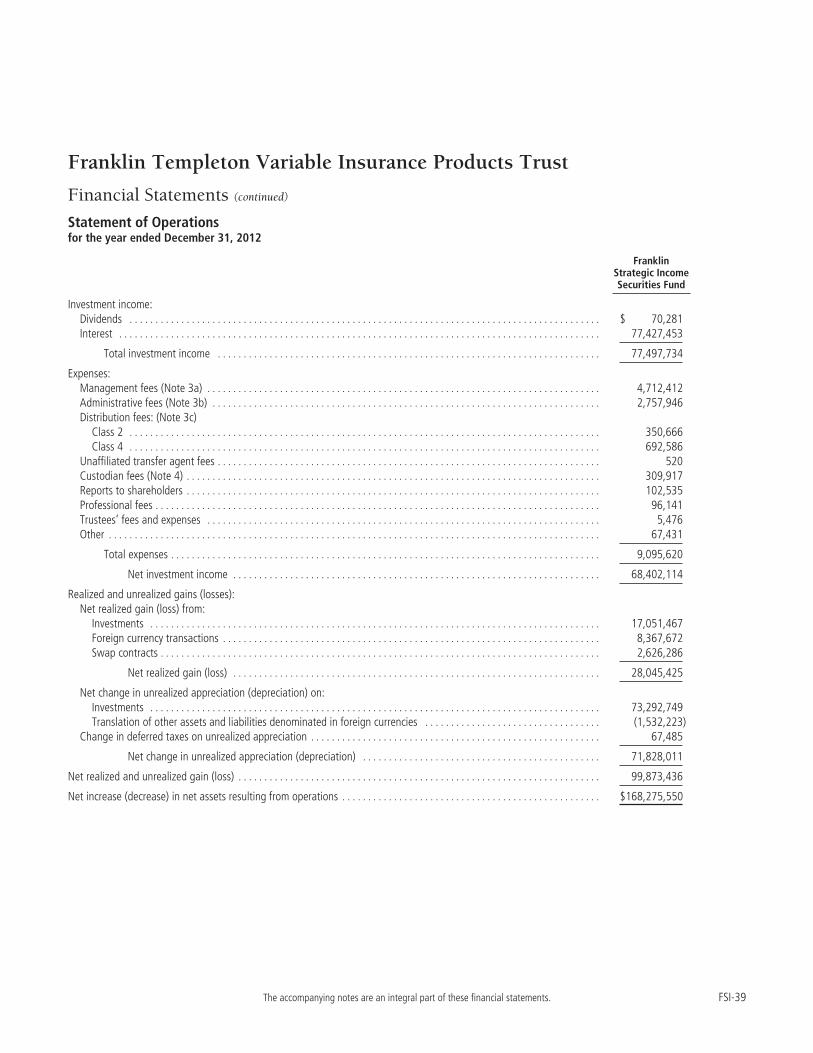
Franklin Templeton Variable Insurance Products Trust
Financial Statements (continued)
Statement of Operationsfor the year ended December 31, 2012
FranklinStrategic IncomeSecurities Fund
Investment income:Dividends . . . . . . . . . . . . . . . . . . . . . . . . . . . . . . . . . . . . . . . . . . . . . . . . . . . . . . . . . . . . . . . . . . . . . . . . . . . . . . . . . . . . . . . . . . . $ 70,281Interest . . . . . . . . . . . . . . . . . . . . . . . . . . . . . . . . . . . . . . . . . . . . . . . . . . . . . . . . . . . . . . . . . . . . . . . . . . . . . . . . . . . . . . . . . . . . . 77,427,453
Total investment income . . . . . . . . . . . . . . . . . . . . . . . . . . . . . . . . . . . . . . . . . . . . . . . . . . . . . . . . . . . . . . . . . . . . . . . . . . 77,497,734
Expenses:Management fees (Note 3a) . . . . . . . . . . . . . . . . . . . . . . . . . . . . . . . . . . . . . . . . . . . . . . . . . . . . . . . . . . . . . . . . . . . . . . . . . . . . 4,712,412Administrative fees (Note 3b) . . . . . . . . . . . . . . . . . . . . . . . . . . . . . . . . . . . . . . . . . . . . . . . . . . . . . . . . . . . . . . . . . . . . . . . . . . . 2,757,946Distribution fees: (Note 3c)
Class 2 . . . . . . . . . . . . . . . . . . . . . . . . . . . . . . . . . . . . . . . . . . . . . . . . . . . . . . . . . . . . . . . . . . . . . . . . . . . . . . . . . . . . . . . . . . . 350,666Class 4 . . . . . . . . . . . . . . . . . . . . . . . . . . . . . . . . . . . . . . . . . . . . . . . . . . . . . . . . . . . . . . . . . . . . . . . . . . . . . . . . . . . . . . . . . . . 692,586
Unaffiliated transfer agent fees . . . . . . . . . . . . . . . . . . . . . . . . . . . . . . . . . . . . . . . . . . . . . . . . . . . . . . . . . . . . . . . . . . . . . . . . . . 520Custodian fees (Note 4) . . . . . . . . . . . . . . . . . . . . . . . . . . . . . . . . . . . . . . . . . . . . . . . . . . . . . . . . . . . . . . . . . . . . . . . . . . . . . . . . 309,917Reports to shareholders . . . . . . . . . . . . . . . . . . . . . . . . . . . . . . . . . . . . . . . . . . . . . . . . . . . . . . . . . . . . . . . . . . . . . . . . . . . . . . . . 102,535Professional fees . . . . . . . . . . . . . . . . . . . . . . . . . . . . . . . . . . . . . . . . . . . . . . . . . . . . . . . . . . . . . . . . . . . . . . . . . . . . . . . . . . . . . . 96,141Trustees’ fees and expenses . . . . . . . . . . . . . . . . . . . . . . . . . . . . . . . . . . . . . . . . . . . . . . . . . . . . . . . . . . . . . . . . . . . . . . . . . . . . 5,476Other . . . . . . . . . . . . . . . . . . . . . . . . . . . . . . . . . . . . . . . . . . . . . . . . . . . . . . . . . . . . . . . . . . . . . . . . . . . . . . . . . . . . . . . . . . . . . . . 67,431
Total expenses . . . . . . . . . . . . . . . . . . . . . . . . . . . . . . . . . . . . . . . . . . . . . . . . . . . . . . . . . . . . . . . . . . . . . . . . . . . . . . . . . . . 9,095,620
Net investment income . . . . . . . . . . . . . . . . . . . . . . . . . . . . . . . . . . . . . . . . . . . . . . . . . . . . . . . . . . . . . . . . . . . . . . . 68,402,114
Realized and unrealized gains (losses):Net realized gain (loss) from:
Investments . . . . . . . . . . . . . . . . . . . . . . . . . . . . . . . . . . . . . . . . . . . . . . . . . . . . . . . . . . . . . . . . . . . . . . . . . . . . . . . . . . . . . . . 17,051,467Foreign currency transactions . . . . . . . . . . . . . . . . . . . . . . . . . . . . . . . . . . . . . . . . . . . . . . . . . . . . . . . . . . . . . . . . . . . . . . . . . 8,367,672Swap contracts . . . . . . . . . . . . . . . . . . . . . . . . . . . . . . . . . . . . . . . . . . . . . . . . . . . . . . . . . . . . . . . . . . . . . . . . . . . . . . . . . . . . . 2,626,286
Net realized gain (loss) . . . . . . . . . . . . . . . . . . . . . . . . . . . . . . . . . . . . . . . . . . . . . . . . . . . . . . . . . . . . . . . . . . . . . . . 28,045,425
Net change in unrealized appreciation (depreciation) on:Investments . . . . . . . . . . . . . . . . . . . . . . . . . . . . . . . . . . . . . . . . . . . . . . . . . . . . . . . . . . . . . . . . . . . . . . . . . . . . . . . . . . . . . . . 73,292,749Translation of other assets and liabilities denominated in foreign currencies . . . . . . . . . . . . . . . . . . . . . . . . . . . . . . . . . . (1,532,223)
Change in deferred taxes on unrealized appreciation . . . . . . . . . . . . . . . . . . . . . . . . . . . . . . . . . . . . . . . . . . . . . . . . . . . . . . . . 67,485
Net change in unrealized appreciation (depreciation) . . . . . . . . . . . . . . . . . . . . . . . . . . . . . . . . . . . . . . . . . . . . . . 71,828,011
Net realized and unrealized gain (loss) . . . . . . . . . . . . . . . . . . . . . . . . . . . . . . . . . . . . . . . . . . . . . . . . . . . . . . . . . . . . . . . . . . . . . . 99,873,436
Net increase (decrease) in net assets resulting from operations . . . . . . . . . . . . . . . . . . . . . . . . . . . . . . . . . . . . . . . . . . . . . . . . . . $168,275,550
The accompanying notes are an integral part of these financial statements. FSI-39

Franklin Templeton Variable Insurance Products Trust
Financial Statements (continued)
Statements of Changes in Net Assets
Franklin Strategic IncomeSecurities Fund
Year Ended December 31,2012 2011
Increase (decrease) in net assets:Operations:
Net investment income . . . . . . . . . . . . . . . . . . . . . . . . . . . . . . . . . . . . . . . . . . . . . . . . . . . . . . . . . . . . . . . $ 68,402,114 $ 76,340,737Net realized gain (loss) from investments, foreign currency transactions and swap contracts . . . . . . 28,045,425 33,514,759Net change in unrealized appreciation (depreciation) on investments, translation of other assets
and liabilities denominated in foreign currencies and deferred taxes . . . . . . . . . . . . . . . . . . . . . . . . 71,828,011 (71,081,939)
Net increase (decrease) in net assets resulting from operations . . . . . . . . . . . . . . . . . . . . . . . . . . . . 168,275,550 38,773,557
Distributions to shareholders from:Net investment income and net foreign currency gains:
Class 1 . . . . . . . . . . . . . . . . . . . . . . . . . . . . . . . . . . . . . . . . . . . . . . . . . . . . . . . . . . . . . . . . . . . . . . . . . . (72,486,947) (69,631,166)Class 2 . . . . . . . . . . . . . . . . . . . . . . . . . . . . . . . . . . . . . . . . . . . . . . . . . . . . . . . . . . . . . . . . . . . . . . . . . . (9,567,293) (7,304,903)Class 4 . . . . . . . . . . . . . . . . . . . . . . . . . . . . . . . . . . . . . . . . . . . . . . . . . . . . . . . . . . . . . . . . . . . . . . . . . . (13,446,008) (11,235,444)
Net realized gains:Class 1 . . . . . . . . . . . . . . . . . . . . . . . . . . . . . . . . . . . . . . . . . . . . . . . . . . . . . . . . . . . . . . . . . . . . . . . . . . (1,182,191) —Class 2 . . . . . . . . . . . . . . . . . . . . . . . . . . . . . . . . . . . . . . . . . . . . . . . . . . . . . . . . . . . . . . . . . . . . . . . . . . (160,795) —Class 4 . . . . . . . . . . . . . . . . . . . . . . . . . . . . . . . . . . . . . . . . . . . . . . . . . . . . . . . . . . . . . . . . . . . . . . . . . . (230,338) —
Total distributions to shareholders . . . . . . . . . . . . . . . . . . . . . . . . . . . . . . . . . . . . . . . . . . . . . . . . . . . . . . . . (97,073,572) (88,171,513)
Capital share transactions: (Note 2)Class 1 . . . . . . . . . . . . . . . . . . . . . . . . . . . . . . . . . . . . . . . . . . . . . . . . . . . . . . . . . . . . . . . . . . . . . . . . . . (78,499,832) (114,013,494)Class 2 . . . . . . . . . . . . . . . . . . . . . . . . . . . . . . . . . . . . . . . . . . . . . . . . . . . . . . . . . . . . . . . . . . . . . . . . . . 27,715,617 27,304,975Class 4 . . . . . . . . . . . . . . . . . . . . . . . . . . . . . . . . . . . . . . . . . . . . . . . . . . . . . . . . . . . . . . . . . . . . . . . . . . (2,176,836) 7,657,719
Total capital share transactions . . . . . . . . . . . . . . . . . . . . . . . . . . . . . . . . . . . . . . . . . . . . . . . . . . . . . . . . . . (52,961,051) (79,050,800)
Net increase (decrease) in net assets . . . . . . . . . . . . . . . . . . . . . . . . . . . . . . . . . . . . . . . . . . . . . . . . . 18,240,927 (128,448,756)Net assets:
Beginning of year . . . . . . . . . . . . . . . . . . . . . . . . . . . . . . . . . . . . . . . . . . . . . . . . . . . . . . . . . . . . . . . . . . . . . . 1,356,225,754 1,484,674,510
End of year . . . . . . . . . . . . . . . . . . . . . . . . . . . . . . . . . . . . . . . . . . . . . . . . . . . . . . . . . . . . . . . . . . . . . . . . . . . $1,374,466,681 $1,356,225,754
Undistributed net investment income included in net assets:End of year . . . . . . . . . . . . . . . . . . . . . . . . . . . . . . . . . . . . . . . . . . . . . . . . . . . . . . . . . . . . . . . . . . . . . . . . . . . $ 68,571,868 $ 84,105,225
The accompanying notes are an integral part of these financial statements.FSI-40
Franklin Templeton Variable Insurance Products Trust
Notes to Financial Statements
Franklin Strategic Income Securities Fund
1. ORGANIZATION AND SIGNIFICANT ACCOUNTING POLICIES
Franklin Templeton Variable Insurance Products Trust (Trust) is registered under the Investment Company Act of 1940, asamended, (1940 Act) as an open-end investment company, consisting of twenty separate funds. The Franklin Strategic IncomeSecurities Fund (Fund) is included in this report. The financial statements of the remaining funds in the Trust are presentedseparately. Shares of the Fund are generally sold only to insurance company separate accounts to fund the benefits of variable lifeinsurance policies or variable annuity contracts. At December 31, 2012, 89.42% of the Fund’s shares were held through oneinsurance company. Investment activities of these insurance company separate accounts could have a material impact on theFund. The Fund offers, three classes of shares: Class 1, Class 2, and Class 4. Each class of shares differs by its distribution fees,voting rights on matters affecting a single class and its exchange privilege.
The following summarizes the Fund’s significant accounting policies.
a. Financial Instrument Valuation
The Fund’s investments in financial instruments are carried at fair value daily. Fair value is the price that would be received tosell an asset or paid to transfer a liability in an orderly transaction between market participants on the measurement date. Underprocedures approved by the Trust’s Board of Trustees (the Board), the Fund’s administrator, investment manager and otheraffiliates have formed the Valuation and Liquidity Oversight Committee (VLOC). The VLOC provides administration andoversight of the Fund’s valuation policies and procedures, which are approved annually by the Board. Among other things, theseprocedures allow the Fund to utilize independent pricing services, quotations from securities and financial instrument dealers,and other market sources to determine fair value.
Equity securities listed on an exchange or on the NASDAQ National Market System are valued at the last quoted sale price or theofficial closing price of the day, respectively. Over-the-counter (OTC) securities are valued within the range of the most recentquoted bid and ask prices. Securities that trade in multiple markets or on multiple exchanges are valued according to thebroadest and most representative market. Certain equity securities are valued based upon fundamental characteristics orrelationships to similar securities. Investments in open-end mutual funds are valued at the closing net asset value
Debt securities generally trade in the OTC market rather than on a securities exchange. The Fund’s pricing services use multiplevaluation techniques to determine fair value. In instances where sufficient market activity exists, the pricing services may utilize amarket-based approach through which quotes from market makers are used to determine fair value. In instances where sufficientmarket activity may not exist or is limited, the pricing services also utilize proprietary valuation models which may considermarket characteristics such as benchmark yield curves, credit spreads, estimated default rates, anticipated market interest ratevolatility, coupon rates, anticipated timing of principal repayments, underlying collateral, and other unique security features inorder to estimate the relevant cash flows, which are then discounted to calculate the fair value. Securities denominated in aforeign currency are converted into their U.S. dollar equivalent at the foreign exchange rate in effect at the close of the NYSE onthe date that the values of the foreign debt securities are determined.
Certain derivative financial instruments (derivatives) trade in the OTC market. The Fund’s pricing services use varioustechniques including industry standard option pricing models and proprietary discounted cash flow models to determine the fairvalue of those instruments. The Fund’s net benefit or obligation under the derivative contract, as measured by the fair marketvalue of the contract, is included in net assets.
The Fund has procedures to determine the fair value of financial instruments for which market prices are not reliable or readilyavailable. Under these procedures, the VLOC convenes on a regular basis to review such financial instruments and considers anumber of factors, including significant unobservable valuation inputs, when arriving at fair value. The VLOC primarily employsa market-based approach which may use related or comparable assets or liabilities, recent transactions, market multiples, bookvalues, and other relevant information for the investment to determine the fair value of the investment. An income-basedvaluation approach may also be used in which the anticipated future cash flows of the investment are discounted to calculate fairvalue. Discounts may also be applied due to the nature or duration of any restrictions on the disposition of the investments. Due
FSI-41

Franklin Templeton Variable Insurance Products Trust
Notes to Financial Statements (continued)
Franklin Strategic Income Securities Fund
1. ORGANIZATION AND SIGNIFICANT ACCOUNTING POLICIES (continued)
a. Financial Instrument Valuation (continued)
to the inherent uncertainty of valuations of such investments, the fair values may differ significantly from the values that wouldhave been used had an active market existed. The VLOC employs various methods for calibrating these valuation approachesincluding a regular review of key inputs and assumptions, transactional back-testing or disposition analysis, and reviews of anyrelated market activity.
b. Foreign Currency Translation
Portfolio securities and other assets and liabilities denominated in foreign currencies are translated into U.S. dollars based on theexchange rate of such currencies against U.S. dollars on the date of valuation. The Fund may enter into foreign currencyexchange contracts to facilitate transactions denominated in a foreign currency. Purchases and sales of securities, income andexpense items denominated in foreign currencies are translated into U.S. dollars at the exchange rate in effect on the transactiondate. Portfolio securities and assets and liabilities denominated in foreign currencies contain risks that those currencies willdecline in value relative to the U.S. dollar. Occasionally, events may impact the availability or reliability of foreign exchange ratesused to convert the U.S. dollar equivalent value. If such an event occurs, the foreign exchange rate will be valued at fair valueusing procedures established and approved by the Board.
The Fund does not separately report the effect of changes in foreign exchange rates from changes in market prices on securitiesheld. Such changes are included in net realized and unrealized gain or loss from investments on the Statement of Operations.
Realized foreign exchange gains or losses arise from sales of foreign currencies, currency gains or losses realized between thetrade and settlement dates on securities transactions and the difference between the recorded amounts of dividends, interest, andforeign withholding taxes and the U.S. dollar equivalent of the amounts actually received or paid. Net unrealized foreignexchange gains and losses arise from changes in foreign exchange rates on foreign denominated assets and liabilities other thaninvestments in securities held at the end of the reporting period.
c. Securities Purchased on a Delayed Delivery and TBA Basis
The Fund purchases securities on a delayed delivery and to-be-announced (TBA) basis, with payment and delivery scheduled fora future date. These transactions are subject to market fluctuations and are subject to the risk that the value at delivery may bemore or less than the trade date purchase price. Although the Fund will generally purchase these securities with the intention ofholding the securities, it may sell the securities before the settlement date. Sufficient assets have been segregated for thesesecurities.
d. Derivative Financial Instruments
The Fund invested in derivatives in order to manage risk or gain exposure to various other investments or markets. Derivativesare financial contracts based on an underlying or notional amount, require no initial investment or an initial net investment thatis smaller than would normally be required to have a similar response to changes in market factors, and require or permit netsettlement. Derivatives contain various risks including the potential inability of the counterparty to fulfill their obligations underthe terms of the contract, the potential for an illiquid secondary market, and/or the potential for market movements whichexpose the Fund to gains or losses in excess of the amounts shown on the Statement of Assets and Liabilities. Realized gain andloss and unrealized appreciation and depreciation on these contracts for the period are included in the Statement of Operations.
The Fund’s investments in OTC derivatives are subject to the terms of International Swaps and Derivatives Association MasterAgreements and other related agreements between the Fund and certain derivative counterparties. These agreements containvarious provisions, including but not limited to collateral requirements, events of default, requirements for the Fund to maintain
FSI-42

Franklin Templeton Variable Insurance Products Trust
Notes to Financial Statements (continued)
Franklin Strategic Income Securities Fund
1. ORGANIZATION AND SIGNIFICANT ACCOUNTING POLICIES (continued)
d. Derivative Financial Instruments (continued)
certain net asset levels and/or limit the decline in net assets over various periods of time. Should the Fund fail to meet any ofthese provisions, the derivative counterparty has the right to terminate the derivative contract and require immediate payment bythe Fund for those OTC derivatives with that particular counterparty that are in a net liability position.
At December 31, 2012, the Fund had OTC derivatives in a net liability position of $1,374,810 and the aggregate value ofcollateral pledged for such contracts was $1,320,000.
The Fund entered into OTC forward exchange contracts primarily to manage and/or gain exposure to certain foreign currencies.A forward exchange contract is an agreement between the Fund and a counterparty to buy or sell a foreign currency for a specificexchange rate on a future date. Pursuant to the terms of the forward exchange contracts, cash or securities may be required to bedeposited as collateral. Unrestricted cash may be invested according to the Fund’s investment objectives.
The Fund entered into OTC credit default swap contracts primarily to manage exposure to credit risk. A credit default swap is anagreement between the Fund and a counterparty whereby the buyer of the contract receives credit protection and the seller of thecontract guarantees the credit worthiness of a referenced debt obligation. The underlying referenced debt obligation may be asingle issuer of corporate or sovereign debt, a credit index, or a tranche of a credit index. In the event of a default of theunderlying referenced debt obligation, the buyer is entitled to receive the notional amount of the credit default swap contractfrom the seller in exchange for the referenced debt obligation, a net settlement amount equal to the notional amount of the creditdefault swap less the recovery value of the referenced debt obligation, or other agreed upon amount. Over the term of thecontract, the buyer pays the seller a periodic stream of payments, provided that no event of default has occurred. Such periodicpayments are accrued daily as an unrealized appreciation or depreciation until the payments are made, at which time they arerealized. Payments received or paid to initiate a credit default swap contract are reflected on the Statement of Assets andLiabilities and represent compensating factors between stated terms of the credit default swap agreement and prevailing marketconditions (credit spreads and other relevant factors). These upfront payments are amortized over the term of the contract as arealized gain or loss on the Statement of Operations. Pursuant to the terms of the credit default swap contract, cash or securitiesmay be required to be deposited as collateral. Unrestricted cash may be invested according to the Fund’s investment objectives.
At December 31, 2012, the Fund held $148,494 in U.S treasury bonds and notes as collateral for derivatives.
See Note 10 regarding other derivative information.
e. Restricted Cash
At December 31, 2012, the Fund held restricted cash in connection with investments in certain derivative securities. Restrictedcash is held in a segregated account with the Fund’s custodian and is reflected in the Statement of Assets and Liabilities.
f. Loan Participation Notes
The Fund invests in loan participation notes (“Participations”). Participations are loans originally issued to a borrower by one ormore financial institutions (the “Lender”) and subsequently sold to other investors, such as the Fund. Participations typicallyresult in the Fund having a contractual relationship only with the Lender, and not with the borrower. The Fund has the right toreceive from the Lender any payments of principal, interest and fees which the Lender received from the borrower. The Fundgenerally has no rights to either enforce compliance by the borrower with the terms of the loan agreement or to any collateralrelating to the original loan. As a result, the Fund assumes the credit risk of both the borrower and the Lender that is selling theParticipation. The Participations may also involve interest rate risk and liquidity risk, including the potential default orinsolvency of the borrower and/or the Lender.
FSI-43

Franklin Templeton Variable Insurance Products Trust
Notes to Financial Statements (continued)
Franklin Strategic Income Securities Fund
1. ORGANIZATION AND SIGNIFICANT ACCOUNTING POLICIES (continued)
g. FT Holdings Corporation III (FT Subsidiary)
The Fund invests in certain securities through its investment in FT Subsidiary, a Delaware Corporation and a wholly-ownedsubsidiary of the Fund. The FT Subsidiary has the ability to invest in securities consistent with the investment objective of theFund. At December 31, 2012, all FT Subsidiary investments as well as any other assets and liabilities are reflected in the Fund’sStatement of Investments and Statement of Assets and Liabilities. All income and expenses of the FT Subsidiary during the yearended December 31, 2012, have been included in the Fund’s Statement of Operations.
h. Mortgage Dollar Rolls
The Fund enters into mortgage dollar rolls, typically on a TBA basis. Mortgage dollar rolls are agreements between the Fund anda financial institution to simultaneously sell and repurchase mortgage-backed securities at a future date. Gains or losses arerealized on the initial sale, and the difference between the repurchase price and the sale price is recorded as an unrealized gain orloss to the Fund upon entering into the mortgage dollar roll. In addition, the Fund may invest the cash proceeds that arereceived from the initial sale. During the period between the sale and repurchase, the Fund is not entitled to principal andinterest paid on the mortgage backed securities. The risks of mortgage dollar roll transactions include the potential inability ofthe counterparty to fulfill its obligations.
i. Senior Floating Rate Interests
The Fund invests in senior secured corporate loans that pay interest at rates which are periodically reset by reference to a baselending rate plus a spread. These base lending rates are generally the prime rate offered by a designated U.S. bank or the LondonInterBank Offered Rate (LIBOR). Senior secured corporate loans often require prepayment of principal from excess cash flows orat the discretion of the borrower. As a result, actual maturity may be substantially less than the stated maturity.
Senior secured corporate loans in which the Fund invests are generally readily marketable, but may be subject to somerestrictions on resale.
j. Income and Deferred Taxes
It is the Fund’s policy to qualify as a regulated investment company under the Internal Revenue Code. The Fund intends todistribute to shareholders substantially all of its taxable income and net realized gains to relieve it from federal income and ifapplicable, excise taxes. As a result, no provision for U.S. federal income taxes is required.
The Fund may be subject to foreign taxation related to income received, capital gains on the sale of securities and certain foreigncurrency transactions in the foreign jurisdictions in which it invests. Foreign taxes, if any, are recorded based on the taxregulations and rates that exist in the foreign markets in which the Fund invests. When a capital gain tax is determined to applythe Fund records an estimated deferred tax liability in an amount that would be payable if the securities were disposed of on thevaluation date.
The Fund recognizes the tax benefits of uncertain tax positions only when the position is “more likely than not” to be sustainedupon examination by the tax authorities based on the technical merits of the tax position. As of December 31, 2012, and for allopen tax years, the Fund has determined that no liability for unrecognized tax benefits is required in the Fund’s financialstatements related to uncertain tax positions taken on a tax return (or expected to be taken on future tax returns). Open tax yearsare those that remain subject to examination and are based on each tax jurisdiction statute of limitation.
FSI-44

Franklin Templeton Variable Insurance Products Trust
Notes to Financial Statements (continued)
Franklin Strategic Income Securities Fund
1. ORGANIZATION AND SIGNIFICANT ACCOUNTING POLICIES (continued)
k. Security Transactions, Investment Income, Expenses and Distributions
Security transactions are accounted for on trade date. Realized gains and losses on security transactions are determined on aspecific identification basis. Interest income and estimated expenses are accrued daily. Amortization of premium and accretion ofdiscount on debt securities are included in interest income. Facility fees are recognized as income over the expected term of theloan. Dividend income is recorded on the ex-dividend date. Distributions to shareholders are recorded on the ex-dividend dateand are determined according to income tax regulations (tax basis). Distributable earnings determined on a tax basis may differfrom earnings recorded in accordance with accounting principles generally accepted in the United States of America. Thesedifferences may be permanent or temporary. Permanent differences are reclassified among capital accounts to reflect their taxcharacter. These reclassifications have no impact on net assets or the results of operations. Temporary differences are notreclassified, as they may reverse in subsequent periods.
Common expenses incurred by the Trust are allocated among the funds based on the ratio of net assets of each fund to thecombined net assets of the Trust. Fund specific expenses are charged directly to the fund that incurred the expense.
Realized and unrealized gains and losses and net investment income, not including class specific expenses, are allocated daily toeach class of shares based upon the relative proportion of net assets of each class. Differences in per share distributions, by class,are generally due to differences in class specific expenses.
Inflation-indexed bonds are adjusted for inflation through periodic increases or decreases in the security’s interest accruals, faceamount, or principal redemption value, by amounts corresponding to the rate of inflation as measured by an index. Any increaseor decrease in the face amount or principal redemption value will be included as interest income on the Statement of Operations.
l. Accounting Estimates
The preparation of financial statements in accordance with accounting principles generally accepted in the United States ofAmerica requires management to make estimates and assumptions that affect the reported amounts of assets and liabilities at thedate of the financial statements and the amounts of income and expenses during the reporting period. Actual results could differfrom those estimates.
m. Guarantees and Indemnifications
Under the Trust’s organizational documents, its officers and trustees are indemnified by the Trust against certain liabilities arisingout of the performance of their duties to the Trust. Additionally, in the normal course of business, the Trust, on behalf of theFund, enters into contracts with service providers that contain general indemnification clauses. The Trust’s maximum exposureunder these arrangements is unknown as this would involve future claims that may be made against the Trust that have not yetoccurred. Currently, the Trust expects the risk of loss to be remote.
FSI-45

Franklin Templeton Variable Insurance Products Trust
Notes to Financial Statements (continued)
Franklin Strategic Income Securities Fund
2. SHARES OF BENEFICIAL INTEREST
At December 31, 2012, there were an unlimited number of shares authorized (without par value). Transactions in the Fund’sshares were as follows:
Year Ended December 31,
2012 2011
Class 1 Shares: Shares Amount Shares Amount
Shares sold . . . . . . . . . . . . . . . . . . . . . . . . . . . . . . . . . . . . . . . . . . . . . . . . . . . . . . . . . . . 3,209,922 $ 41,235,226 2,569,621 $ 33,265,626Shares issued in reinvestment of distributions . . . . . . . . . . . . . . . . . . . . . . . . . . . . . . . . . . 6,063,304 73,669,138 5,474,148 69,631,166Shares redeemed . . . . . . . . . . . . . . . . . . . . . . . . . . . . . . . . . . . . . . . . . . . . . . . . . . . . . . . (14,997,522) (193,404,196) (16,887,770) (216,910,286)
Net increase (decrease) . . . . . . . . . . . . . . . . . . . . . . . . . . . . . . . . . . . . . . . . . . . . . . . . . . (5,724,296) $ (78,499,832) (8,844,001) $(114,013,494)
Class 2 Shares:Shares sold . . . . . . . . . . . . . . . . . . . . . . . . . . . . . . . . . . . . . . . . . . . . . . . . . . . . . . . . . . . 3,441,994 $ 43,341,865 3,778,943 $ 48,008,160Shares issued in reinvestment of distributions . . . . . . . . . . . . . . . . . . . . . . . . . . . . . . . . . . 819,552 9,728,087 586,739 7,304,903Shares redeemed . . . . . . . . . . . . . . . . . . . . . . . . . . . . . . . . . . . . . . . . . . . . . . . . . . . . . . . (2,012,180) (25,354,335) (2,243,563) (28,008,088)
Net increase (decrease) . . . . . . . . . . . . . . . . . . . . . . . . . . . . . . . . . . . . . . . . . . . . . . . . . . 2,249,366 $ 27,715,617 2,122,119 $ 27,304,975
Class 4 Shares:Shares sold . . . . . . . . . . . . . . . . . . . . . . . . . . . . . . . . . . . . . . . . . . . . . . . . . . . . . . . . . . . 1,353,603 $ 17,206,420 2,126,744 $ 27,218,734Shares issued on reinvestment of distributions . . . . . . . . . . . . . . . . . . . . . . . . . . . . . . . . . . 1,134,025 13,676,347 889,584 11,235,444Shares redeemed . . . . . . . . . . . . . . . . . . . . . . . . . . . . . . . . . . . . . . . . . . . . . . . . . . . . . . . (2,599,542) (33,059,603) (2,444,718) (30,796,459)
Net increase (decrease) . . . . . . . . . . . . . . . . . . . . . . . . . . . . . . . . . . . . . . . . . . . . . . . . . . (111,914) $ (2,176,836) 571,610 $ 7,657,719
3. TRANSACTIONS WITH AFFILIATES
Franklin Resources, Inc. is the holding company for various subsidiaries that together are referred to as Franklin TempletonInvestments. Certain officers and trustees of the Fund are also officers and/or directors of the following subsidiaries:
Subsidiary Affiliation
Franklin Advisers, Inc. (Advisers) Investment managerFranklin Templeton Services, LLC (FT Services) Administrative managerFranklin Templeton Distributors, Inc. (Distributors) Principal underwriterFranklin Templeton Investor Services, LLC (Investor Services) Transfer agent
a. Management Fees
The Fund pays an investment management fee to Advisers based on the average daily net assets of the Fund as follows:
Annualized Fee Rate Net Assets
0.425% Up to and including $500 million0.325% Over $500 million, up to and including $1 billion0.280% Over $1 billion, up to and including $1.5 billion0.235% Over $1.5 billion, up to and including $6.5 billion0.215% Over $6.5 billion, up to and including $11.5 billion0.200% Over $11.5 billion, up to and including $16.5 billion0.190% Over $16.5 billion, up to and including $19 billion0.180% Over $19 billion, up to and including $21.5 billion0.170% In excess of $21.5 billion
FSI-46

Franklin Templeton Variable Insurance Products Trust
Notes to Financial Statements (continued)
Franklin Strategic Income Securities Fund
3. TRANSACTIONS WITH AFFILIATES (continued)
b. Administrative Fees
The Fund pays an administrative fee to FT Services of 0.20% per year of the average daily net assets of the Fund.
c. Distribution Fees
The Board has adopted distribution plans for Class 2 and Class 4 shares pursuant to Rule 12b-1 under the 1940 Act. Under theFund’s compensation distribution plans, the Fund pays Distributors for costs incurred in connection with the servicing, sale anddistribution of the Fund’s shares up to 0.25% and 0.35% per year of its average daily net assets of Class 2 and Class 4,respectively. Some distribution fees are not charged on shares held by affiliates.
d. Transfer Agent Fees
Investor Services, under terms of an agreement, performs shareholder servicing for the Fund and is not paid by the Fund for theservices.
4. EXPENSE OFFSET ARRANGEMENT
The Fund has entered into an arrangement with its custodian whereby credits realized as a result of uninvested cash balances areused to reduce a portion of the Fund’s custodian expenses. During the year ended December 31, 2012, there were no creditsearned.
5. INCOME TAXES
The tax character of distributions paid during the years ended December 31, 2012 and 2011, was as follows:
2012 2011
Distributions paid from:Ordinary income . . . . . . . . . . . . . . . . . . . . . . . . . . . . . . . $95,500,248 $88,171,513Long term capital gain . . . . . . . . . . . . . . . . . . . . . . . . . . . 1,573,324 —
$97,073,572 $88,171,513
At December 31, 2012, the cost of investments, net unrealized appreciation (depreciation), undistributed ordinary income andundistributed long term capital gains for income tax purposes were as follows:
Cost of investments . . . . . . . . . . . . . . . . . . . . . . . . . . . . . . . . . . . . . . . . . $1,313,823,506
Unrealized appreciation . . . . . . . . . . . . . . . . . . . . . . . . . . . . . . . . . . . . . . $ 76,496,104Unrealized depreciation . . . . . . . . . . . . . . . . . . . . . . . . . . . . . . . . . . . . . . (14,605,785)
Net unrealized appreciation (depreciation) . . . . . . . . . . . . . . . . . . . . . . . . $ 61,890,319
Undistributed ordinary income . . . . . . . . . . . . . . . . . . . . . . . . . . . . . . . . . $ 77,793,606Undistributed long term capital gains . . . . . . . . . . . . . . . . . . . . . . . . . . . . 12,345,735
Distributable earnings . . . . . . . . . . . . . . . . . . . . . . . . . . . . . . . . . . . . . . . $ 90,139,341
Differences between income and/or capital gains as determined on a book basis and a tax basis are primarily due to differingtreatments of paydown losses and bond discounts and premiums.
FSI-47

Franklin Templeton Variable Insurance Products Trust
Notes to Financial Statements (continued)
Franklin Strategic Income Securities Fund
6. INVESTMENT TRANSACTIONS
Purchases and sales of investments (excluding short term securities) for the year ended December 31, 2012, aggregated$626,303,249 and $735,554,475, respectively.
7. INVESTMENTS IN INSTITUTIONAL FIDUCIARY TRUST MONEY MARKET PORTFOLIO
The Fund invests in the Institutional Fiduciary Trust Money Market Portfolio (Sweep Money Fund), an open-end investmentcompany managed by Advisers. Management fees paid by the Fund are reduced on assets invested in the Sweep Money Fund, inan amount not to exceed the management and administrative fees paid by the Sweep Money Fund.
8. CREDIT RISK AND DEFAULTED SECURITIES
At December 31, 2012, the Fund had 49.25% of its portfolio invested in high yield securities, senior secured floating rate notes,or other securities rated below investment grade. These securities may be more sensitive to economic conditions causing greaterprice volatility and are potentially subject to a greater risk of loss due to default than higher rated securities.
The Fund held a defaulted security and/or other securities for which the income has been deemed uncollectible. AtDecember 31, 2012, the value of this security represents less than 0.05% of the Fund’s net assets. The Fund discontinuesaccruing income on securities for which income has been deemed uncollectible and provides an estimate for losses on interestreceivable. The security has been identified on the accompanying Statement of Investments.
9. RESTRICTED SECURITIES
The Fund invests in securities that are restricted under the Securities Act of 1933 (1933 Act) or which are subject to legal,contractual, or other agreed upon restrictions on resale. Restricted securities are often purchased in private placementtransactions, and cannot be sold without prior registration unless the sale is pursuant to an exemption under the 1933 Act.Disposal of these securities may require greater effort and expense, and prompt sale at an acceptable price may be difficult. TheFund may have registration rights for restricted securities. The issuer generally incurs all registration costs.
At December 31, 2012, the Fund held investments in restricted securities, excluding certain securities exempt from registrationunder the 1933 Act deemed to be liquid, as follows:
Shares IssuerAcquisition
Dates Cost Value
10,000 aNewPage Holdings Inc. (Value is 0.07% of Net Assets) . . . . . . . . . . . . . . . . . . . . . . . . . . . . . . 9/17/09-3/3/10 $2,411,281 $958,000
aThe Fund also invests in unrestricted security or other investments in the issuer, valued at $– as of December 31, 2012.
10. OTHER DERIVATIVE INFORMATION
At December 31, 2012, the Fund’s investments in derivative contracts are reflected on the Statement of Assets and Liabilities asfollows:
Asset Derivatives Liability Derivatives
Derivative Contracts Not Accountedfor as Hedging Instruments
Statement of Assets andLiabilities Location
Fair ValueAmount
Statement of Assets andLiabilities Location
Fair ValueAmount
Foreign exchange contracts Unrealized appreciation on forwardexchange contracts
$5,765,812 Unrealized depreciation on forwardexchange contracts
$4,897,317
Credit contracts Unrealized appreciation on swapcontracts
11,064 Unrealized depreciation on swapcontracts
3,841
FSI-48

Franklin Templeton Variable Insurance Products Trust
Notes to Financial Statements (continued)
Franklin Strategic Income Securities Fund
10. OTHER DERIVATIVE INFORMATION (continued)
For the year ended December 31, 2012, the effect of derivative contracts on the Fund’s Statement of Operations was as follows:
Derivative Contracts Not Accountedfor as Hedging Instruments Statement of Operations Locations
Realized Gain(Loss) for the
Year
Change inUnrealized
Appreciation(Depreciation)
for theYear
Foreign exchange contracts Net realized gain (loss) from foreign currency transactions / Net changein unrealized appreciation (depreciation) on translation of other assetsand liabilities denominated in foreign currencies
$8,760,074 $(1,967,454)
Credit contracts Net realized gain (loss) from swap contracts / Net change in unrealizedappreciation (depreciation) on investments
2,626,286 (769,556)
For the year ended December 31, 2012, the average month end market value of derivatives represented 0.83% of average monthend net assets. The average month end number of open derivative contracts for the year was 207.
See Note 1(d) regarding derivative financial instruments.
11. CREDIT FACILITY
The Fund, together with other U.S. registered and foreign investment funds (collectively, Borrowers), managed by FranklinTempleton Investments, are borrowers in a joint syndicated senior unsecured credit facility totaling $1.5 billion (Global CreditFacility) which matured on January 18, 2013. This Global Credit Facility provides a source of funds to the Borrowers fortemporary and emergency purposes, including the ability to meet future unanticipated or unusually large redemption requests.Effective January 18, 2013, the Borrowers renewed the Global Credit Facility, which matures on January 17, 2014.
Under the terms of the Global Credit Facility, the Fund shall, in addition to interest charged on any borrowings made by theFund and other costs incurred by the Fund, pay its share of fees and expenses incurred in connection with the implementationand maintenance of the Global Credit Facility, based upon its relative share of the aggregate net assets of all of the Borrowers,including an annual commitment fee of 0.07% based upon the unused portion of the Global Credit Facility. These fees arereflected in other expenses on the Statement of Operations. During the year ended December 31, 2012, the Fund did not use theGlobal Credit Facility.
12. FAIR VALUE MEASUREMENTS
The Fund follows a fair value hierarchy that distinguishes between market data obtained from independent sources (observableinputs) and the Fund’s own market assumptions (unobservable inputs). These inputs are used in determining the value of theFund’s financial instruments and are summarized in the following fair value hierarchy:
• Level 1 – quoted prices in active markets for identical financial instruments• Level 2 – other significant observable inputs (including quoted prices for similar financial instruments, interest rates,
prepayment speed, credit risk, etc.)• Level 3 – significant unobservable inputs (including the Fund’s own assumptions in determining the fair value of
financial instruments)
FSI-49

Franklin Templeton Variable Insurance Products Trust
Notes to Financial Statements (continued)
Franklin Strategic Income Securities Fund
12. FAIR VALUE MEASUREMENTS (continued)
The inputs or methodology used for valuing financial instruments are not an indication of the risk associated with investing inthose financial instruments.
For movements between the levels within the fair value hierarchy, the Fund has adopted a policy of recognizing the transfers asof the date of the underlying event which caused the movement.
A summary of inputs used as of December 31, 2012, in valuing the Fund’s assets and liabilities carried at fair value, is as follows:
Level 1 Level 2 Level 3 Total
Assets:Investments in Securities:
Equity Investments:a
Consumer Services . . . . . . . . . . . . . . . . . . . . . . . . . . . . . . . . . . . . . . . . . . . . . . . . $ — $ 1,730,319 $— $ 1,730,319Materials . . . . . . . . . . . . . . . . . . . . . . . . . . . . . . . . . . . . . . . . . . . . . . . . . . . . . . . — 958,000 —c 958,000Media . . . . . . . . . . . . . . . . . . . . . . . . . . . . . . . . . . . . . . . . . . . . . . . . . . . . . . . . . — 7,936,727 — 7,936,727Other Equity Investmentsb . . . . . . . . . . . . . . . . . . . . . . . . . . . . . . . . . . . . . . . . . . 922,090 — —c 922,090
Corporate Bonds . . . . . . . . . . . . . . . . . . . . . . . . . . . . . . . . . . . . . . . . . . . . . . . . . . . — 468,912,779 — 468,912,779Senior Floating Rate Interests . . . . . . . . . . . . . . . . . . . . . . . . . . . . . . . . . . . . . . . . . . — 242,608,136 — 242,608,136Foreign Government and Agency Securities . . . . . . . . . . . . . . . . . . . . . . . . . . . . . . . . — 289,750,686 — 289,750,686U.S. Government and Agency Securities . . . . . . . . . . . . . . . . . . . . . . . . . . . . . . . . . . — 29,183,603 — 29,183,603Asset-Backed Securities and Commercial Mortgage-Backed Securities . . . . . . . . . . . . — 45,937,465 — 45,937,465Mortgage-Backed Securities . . . . . . . . . . . . . . . . . . . . . . . . . . . . . . . . . . . . . . . . . . . — 82,262,100 — 82,262,100Municipal Bonds . . . . . . . . . . . . . . . . . . . . . . . . . . . . . . . . . . . . . . . . . . . . . . . . . . . — 25,654,792 — 25,654,792Short Term Investments . . . . . . . . . . . . . . . . . . . . . . . . . . . . . . . . . . . . . . . . . . . . . . 125,449,996 54,407,132 — 179,857,128
Total Investments in Securities . . . . . . . . . . . . . . . . . . . . . . . . . . . . . . . . . . . . . $126,372,086 $1,249,341,739 $— $1,375,713,825
Forward Exchange Contracts . . . . . . . . . . . . . . . . . . . . . . . . . . . . . . . . . . . . . . . . . . . . — 5,765,812 — 5,765,812Swaps . . . . . . . . . . . . . . . . . . . . . . . . . . . . . . . . . . . . . . . . . . . . . . . . . . . . . . . . . . . . . — 11,064 — 11,064
Liabilities:Forward Exchange Contracts . . . . . . . . . . . . . . . . . . . . . . . . . . . . . . . . . . . . . . . . . . . . — 4,897,317 — 4,897,317Swaps . . . . . . . . . . . . . . . . . . . . . . . . . . . . . . . . . . . . . . . . . . . . . . . . . . . . . . . . . . . . . — 3,841 — 3,841
aIncludes common and preferred stocks as well as other equity investments.bFor detailed categories, see the accompanying Statement of Investments.cIncludes securities determined to have no value at December 31, 2012.
A reconciliation of assets in which Level 3 inputs are used in determining fair value is presented when there are significantLevel 3 investments at the end of the year.
13. NEW ACCOUNTING PRONOUNCEMENTS
In December 2011, the Financial Accounting Standards Board (FASB) issued Accounting Standards Update (ASU) No. 2011-11,Balance Sheet (Topic 210): Disclosures about Offsetting Assets and Liabilities. The amendments in the ASU enhance disclosuresabout offsetting of financial assets and liabilities to enable investors to understand the effect of these arrangements on a fund’sfinancial position. In January 2013, FASB issued ASU No. 2013-01, Balance Sheet (Topic 210): Clarifying the Scope ofDisclosures about Offsetting Assets and Liabilities. The amendments in ASU No. 2013-01 clarify the intended scope ofdisclosures required by ASU No. 2011-11. These ASUs are effective for interim and annual reporting periods beginning on orafter January 1, 2013. The Fund believes the adoption of these ASUs will not have a material impact on its financial statements.
FSI-50


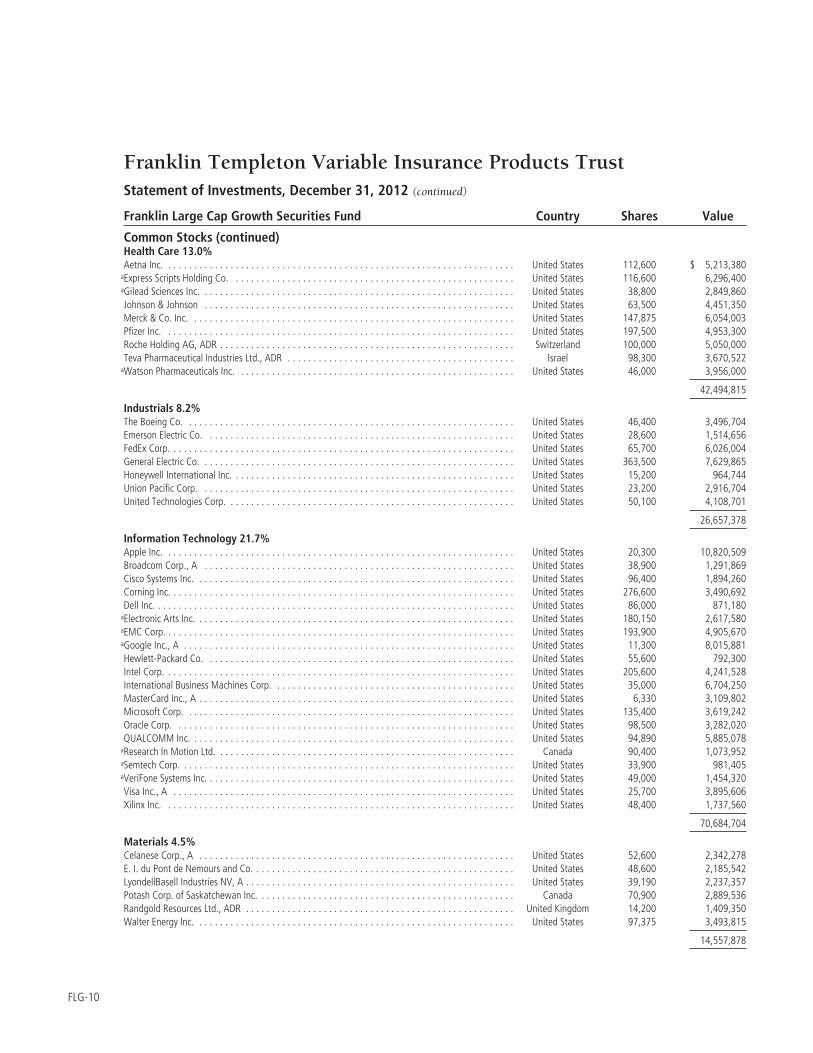


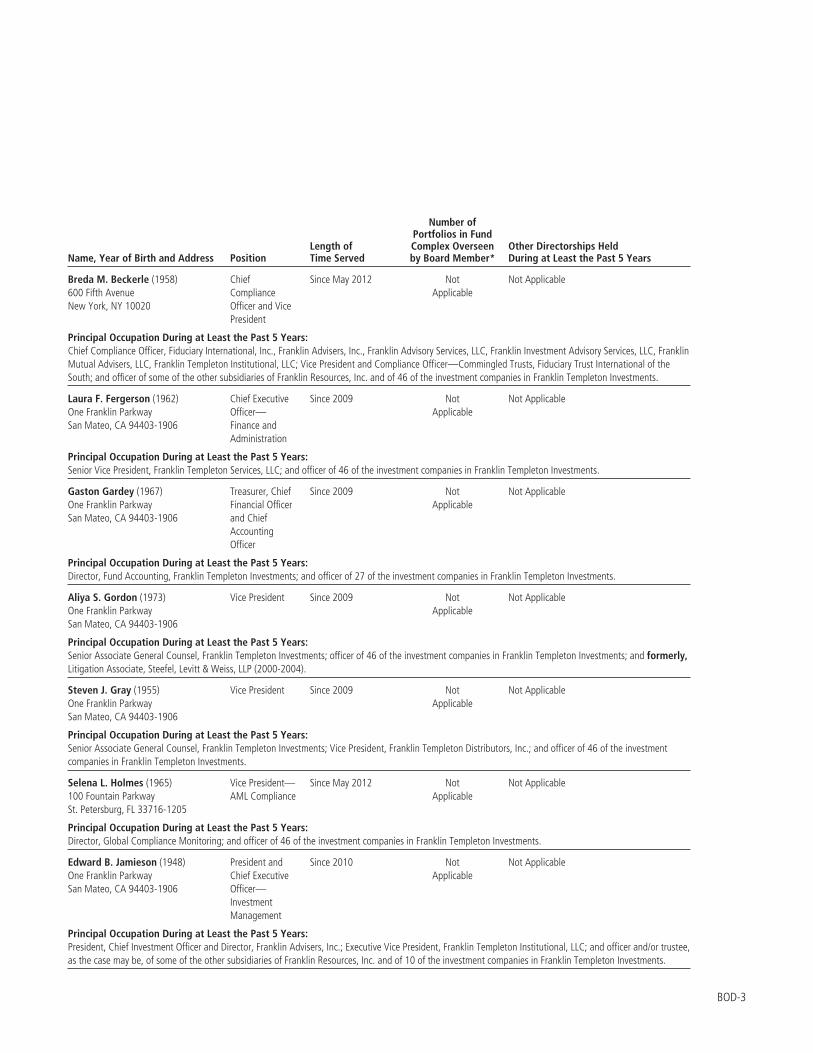


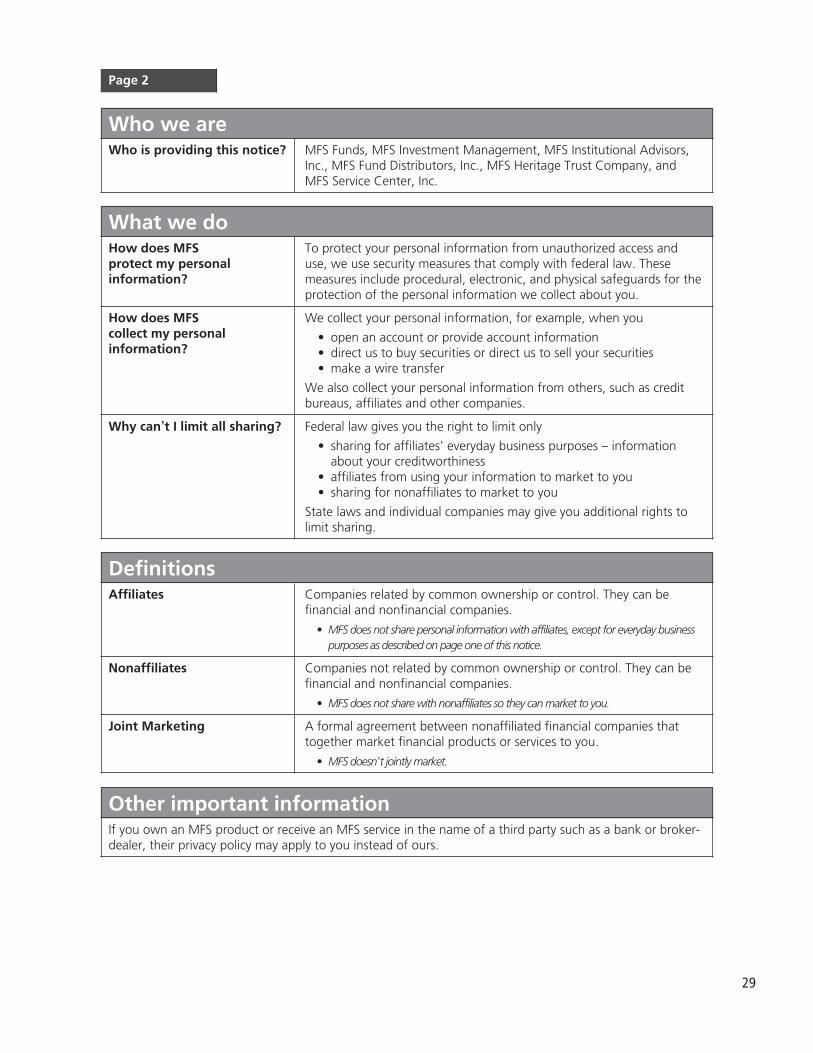


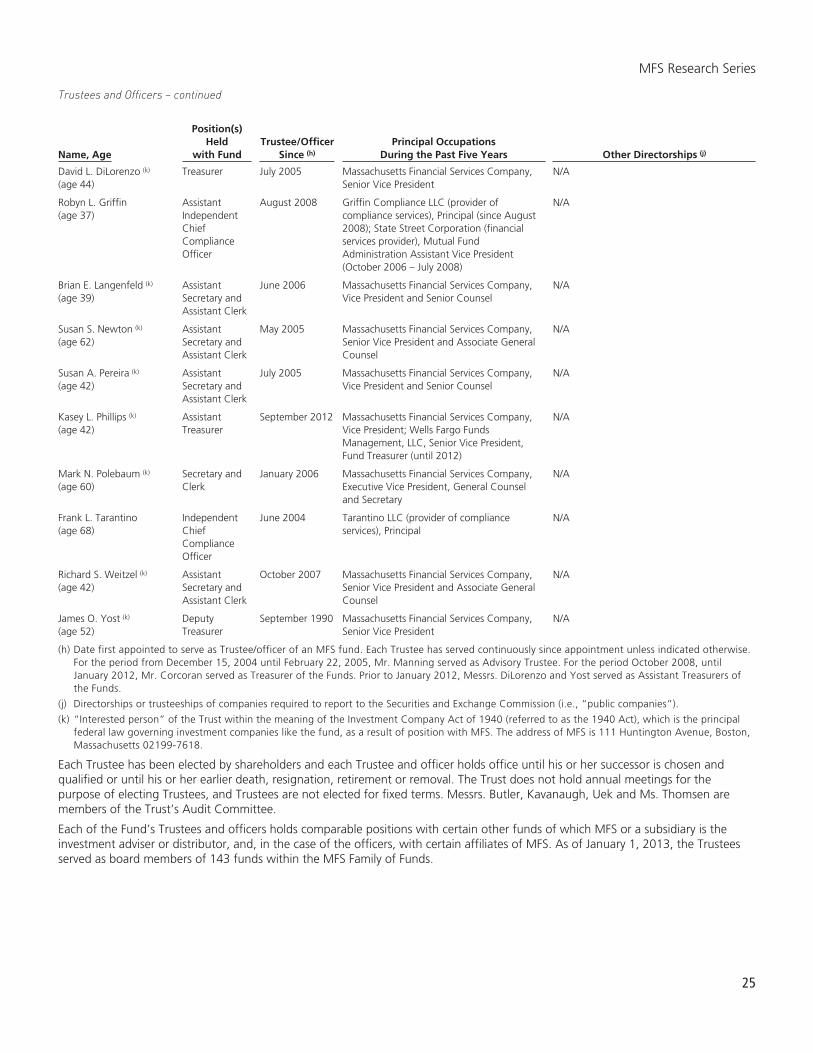


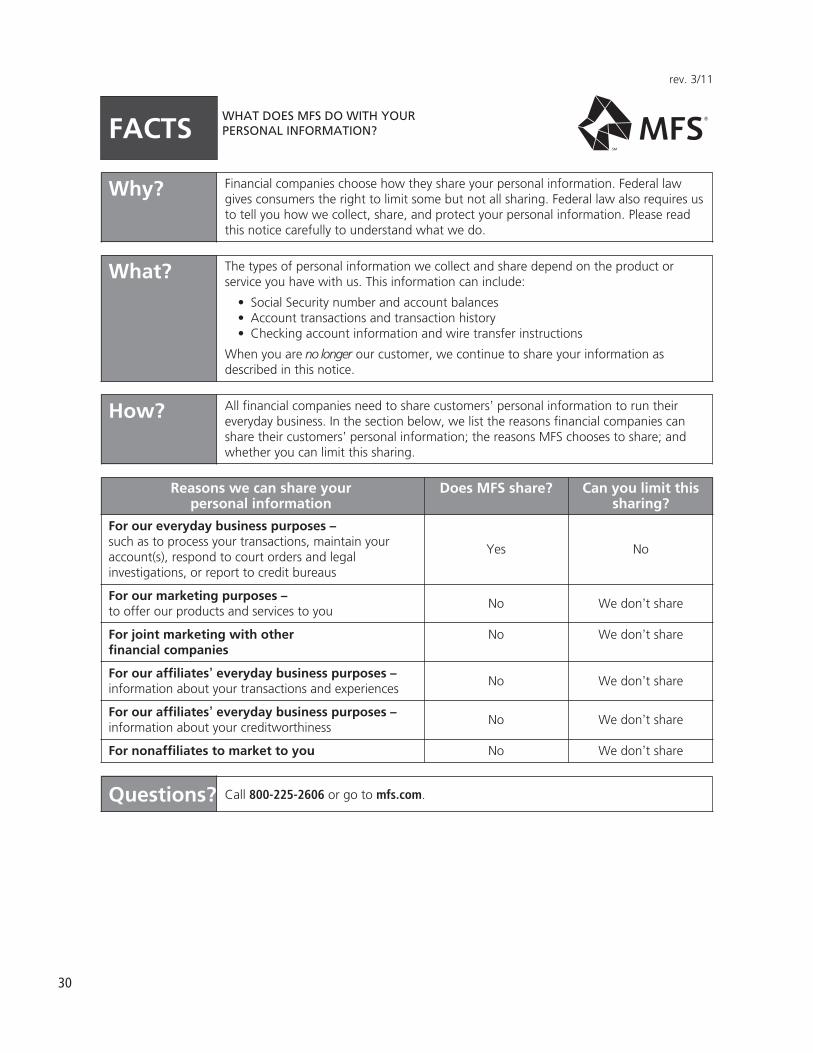


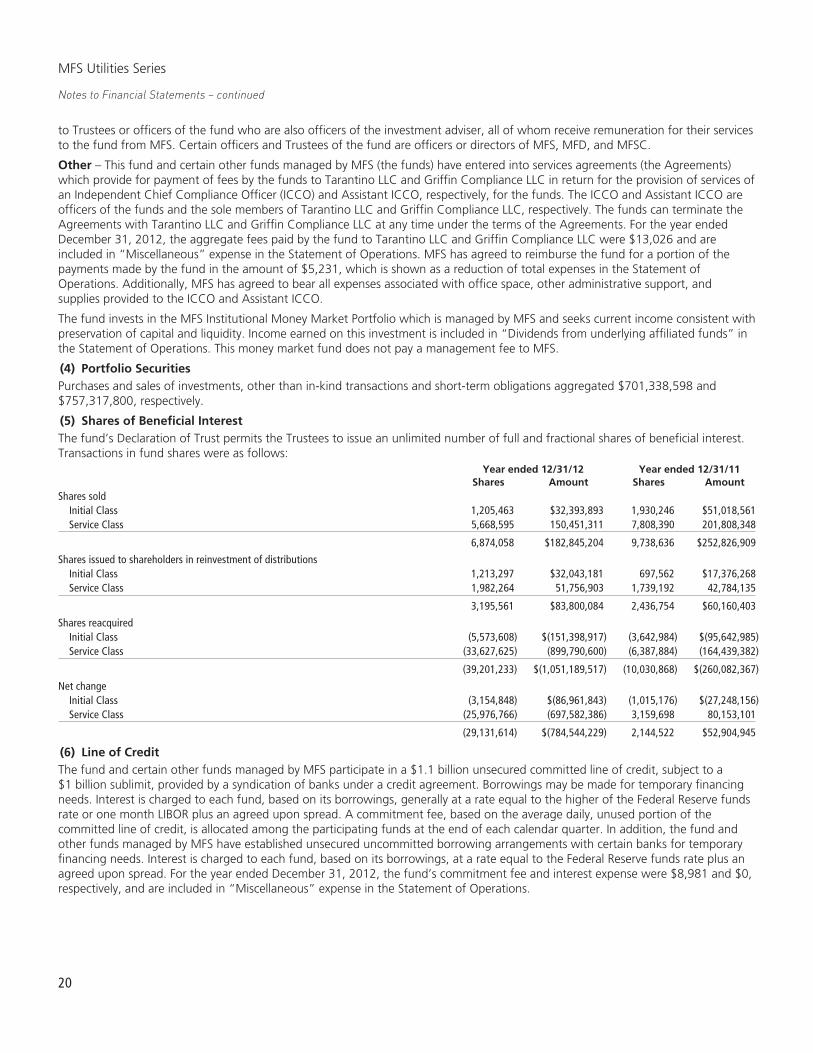


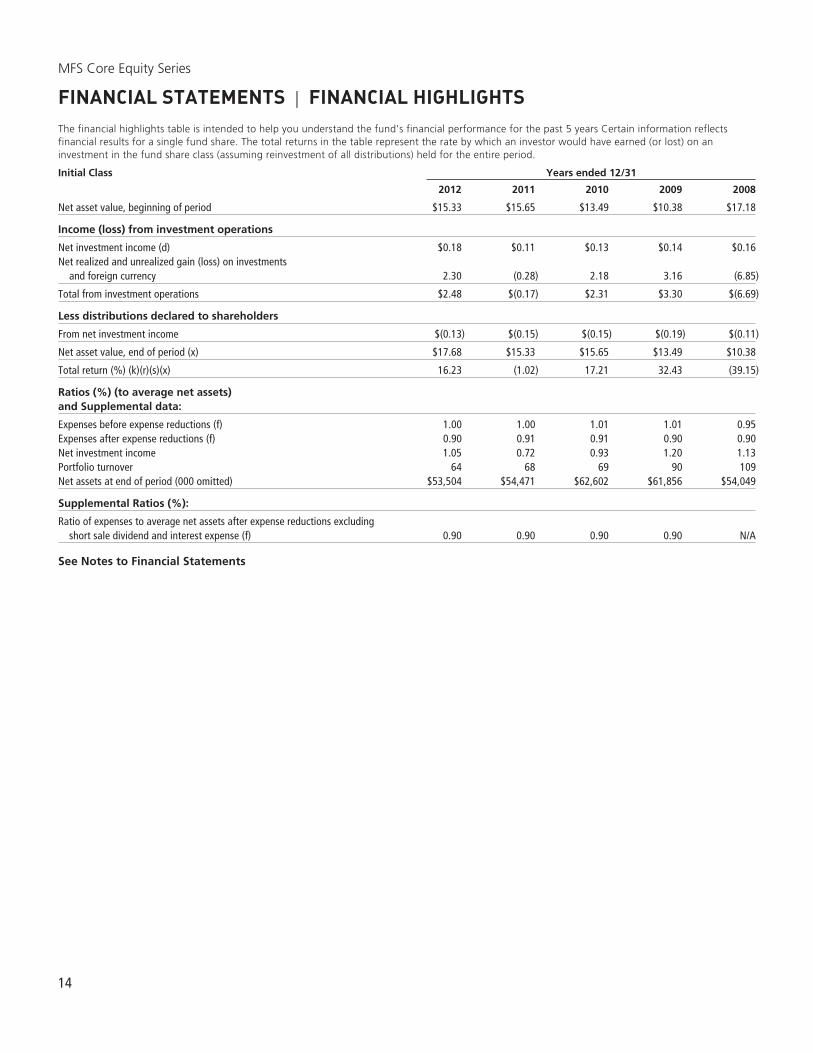


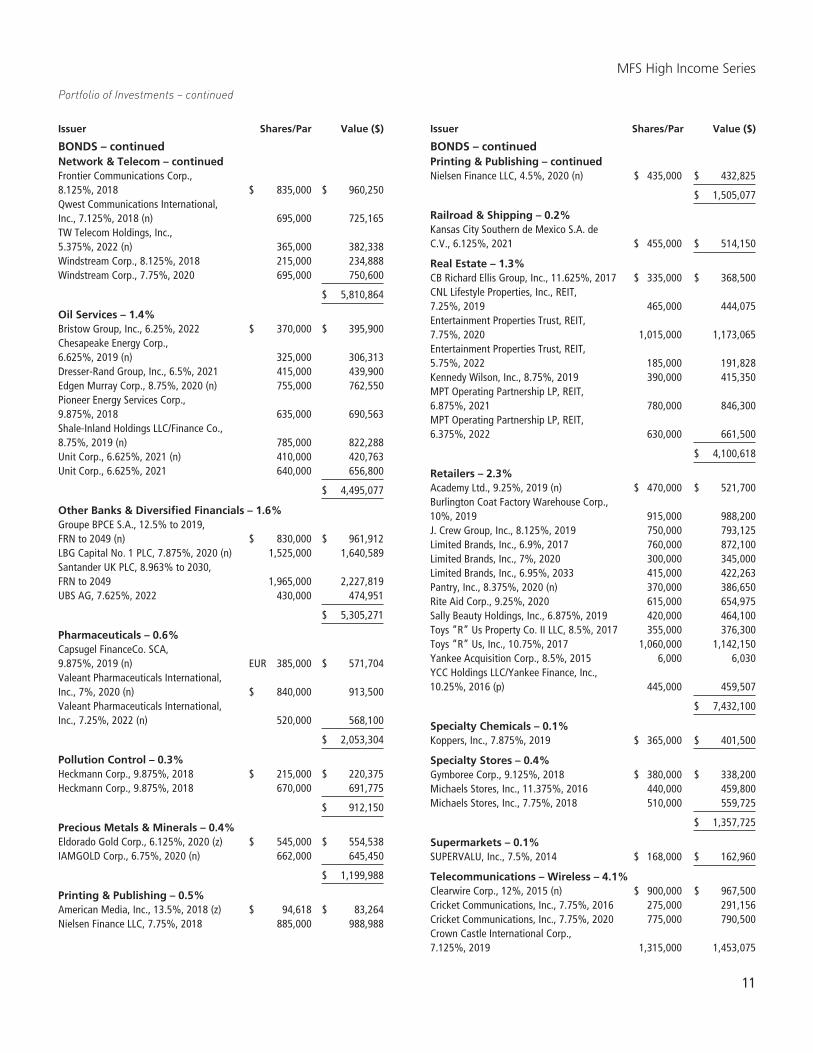

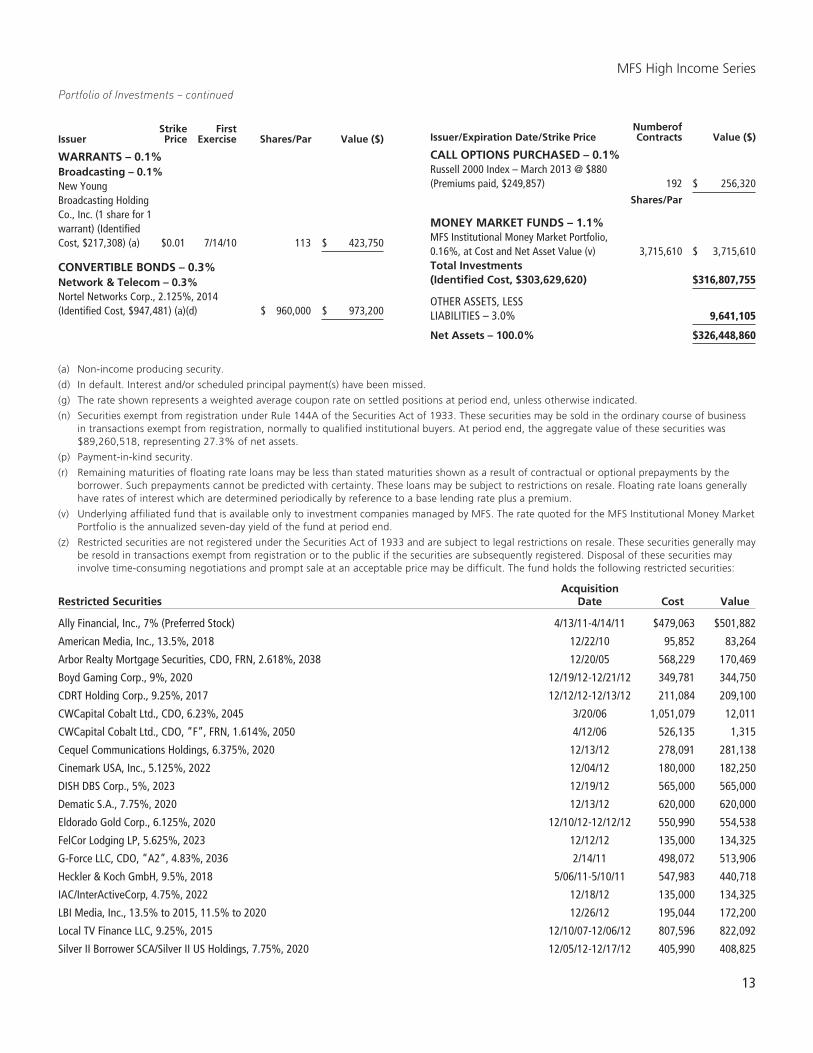

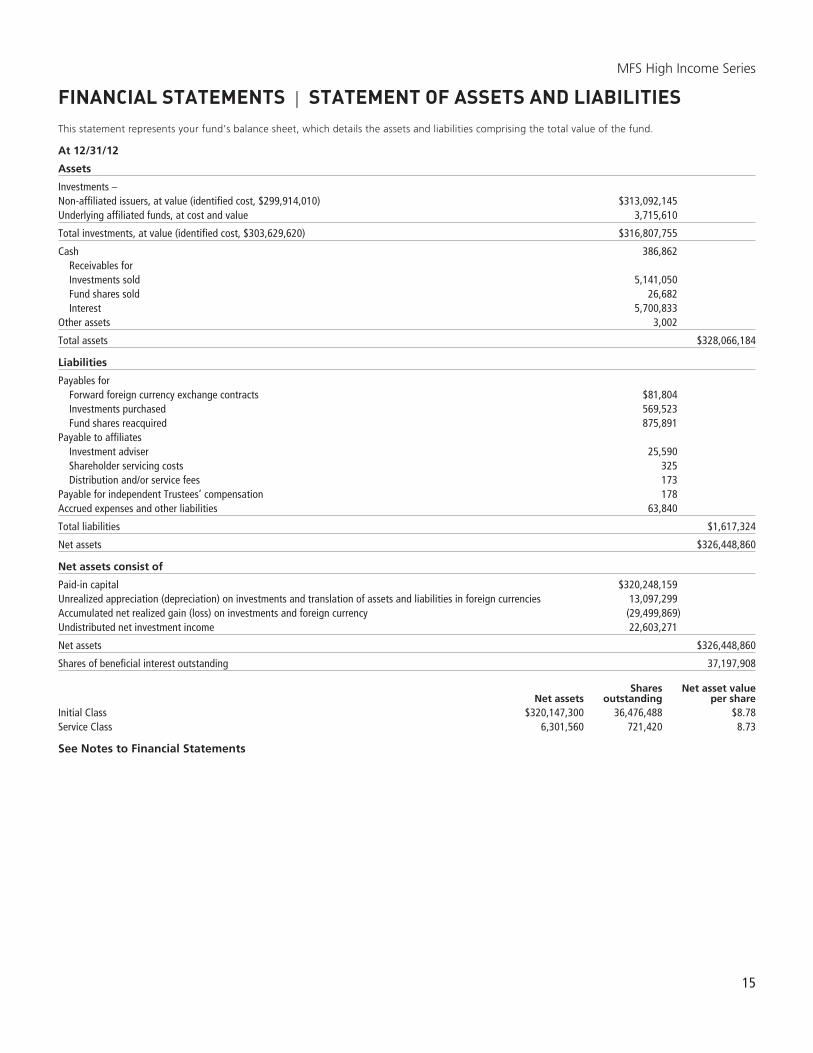


![IECV2_CFSV2[1][1].0_MT2_V2.0.mdb (3) send by ajay](https://static.fdocuments.net/doc/165x107/577d28e21a28ab4e1ea5783f/iecv2cfsv2110mt2v20mdb-3-send-by-ajay.jpg)