Archaeology and Culture Vol. 1, No. 1, 2018 ISSN 2578-1871 ...
13
Archaeology and Culture Vol. 1, No. 1, 2018 www.scholink.org/ojs/index.php/ac ISSN 2578-1871 (Print) ISSN 2578-188X (Online) 55 Original Paper Describing and Comparing Archaeological Spatial Structures Case Study Meymanat Abad Bita Sodaei 1 , Rohollah Yosefi Zoshk 2 , Hojat Hmadpour 2 , Majid Zeighami 3 & Saeed Baghizadeh 4 1 Department of Archaeology, College of human Science, Varamin-Pishva Branch, Islamic Azad university, Varamin, Iran 2 Eberhard Karis University of Tuebingen, Germany 3 Bu Ali Sina University, Hamedan, Iran 4 Department of Archaeology, Islamic Azad University of Tehran, Central Branch, Iran Received: September 18, 2018 Accepted: October 31, 2018 Online Published: November 21, 2018 doi:10.22158/ac.v1n1p55 URL: http://dx.doi.org/10.22158/ac.v1n1p55 Abstract Traditionally, occupation phases, without clearly identifiable contexts, have been excavated according to arbitrarily defined vertical spits. The disadvantages of this approach are obvious—where occupation occurred on an undulating or sloped surface, stratigraphic levels or activity horizons, if they existed, are often unlikely to be identified and it becomes almost impossible to differentiate different phases of occupation within any period. Recently, three-dimensional recording of artefact locations with survey equipment, such as total stations, has become more common on these types of sites. In this paper, this method for recording and modeling stratigraphic relationships using 3D analysis a ”Arcmap” programs is applied. Keywords GIS, interpolation, stratigraphic excavation, tepe meymanatabad, occupation phase 1. Introduction Interest in the analysis of patterns of spatial distribution of artifacts on prehistoric occupation floors has been growing rapidly in recent years. Virtually all archaeological examples of analysis of spatial patterns have been based upon inspection and impressionistic interpretation (de Lumley et al., 1969). The methods used for excavating sites with few defined features or clear contexts have evolved with time, however they have tended to have at the basis of any method a “vertical spit” approach (Mellars, 1987). Sites are rarely excavated stratigraphically as, although phases of occupation may exist, apparent differences in context often prove to be geomorphologic in origin, or more commonly, clear
Transcript of Archaeology and Culture Vol. 1, No. 1, 2018 ISSN 2578-1871 ...

Archaeology and Culture Vol. 1, No. 1, 2018
www.scholink.org/ojs/index.php/ac ISSN 2578-1871 (Print) ISSN 2578-188X (Online)
55
Original Paper
Describing and Comparing Archaeological Spatial Structures
Case Study Meymanat Abad
Bita Sodaei1, Rohollah Yosefi Zoshk2, Hojat Hmadpour2, Majid Zeighami3 & Saeed Baghizadeh4 1 Department of Archaeology, College of human Science, Varamin-Pishva Branch, Islamic Azad
university, Varamin, Iran 2 Eberhard Karis University of Tuebingen, Germany 3 Bu Ali Sina University, Hamedan, Iran 4 Department of Archaeology, Islamic Azad University of Tehran, Central Branch, Iran
Received: September 18, 2018 Accepted: October 31, 2018 Online Published: November 21, 2018
doi:10.22158/ac.v1n1p55 URL: http://dx.doi.org/10.22158/ac.v1n1p55
Abstract
Traditionally, occupation phases, without clearly identifiable contexts, have been excavated according
to arbitrarily defined vertical spits. The disadvantages of this approach are obvious—where occupation
occurred on an undulating or sloped surface, stratigraphic levels or activity horizons, if they existed,
are often unlikely to be identified and it becomes almost impossible to differentiate different phases of
occupation within any period. Recently, three-dimensional recording of artefact locations with survey
equipment, such as total stations, has become more common on these types of sites. In this paper, this
method for recording and modeling stratigraphic relationships using 3D analysis a ”Arcmap”
programs is applied.
Keywords
GIS, interpolation, stratigraphic excavation, tepe meymanatabad, occupation phase
1. Introduction
Interest in the analysis of patterns of spatial distribution of artifacts on prehistoric occupation floors has
been growing rapidly in recent years. Virtually all archaeological examples of analysis of spatial
patterns have been based upon inspection and impressionistic interpretation (de Lumley et al., 1969).
The methods used for excavating sites with few defined features or clear contexts have evolved with
time, however they have tended to have at the basis of any method a “vertical spit” approach (Mellars,
1987). Sites are rarely excavated stratigraphically as, although phases of occupation may exist,
apparent differences in context often prove to be geomorphologic in origin, or more commonly, clear

www.scholink.org/ojs/index.php/ac Archaeology and Culture Vol. 1, No. 1, 2018
56 Published by SCHOLINK INC.
differences in soil color or texture are not apparent. Given the problems with their definition, any
stratigraphic (or rather sedimentological) levels are often left recorded only as sections, although their
relationship to artefact distributions is obviously important. The disadvantages of this system are
obvious. Unless the palaeosol was perfectly level, “intact” phases of occupation on a once sloped or
undulating surface become separated into many different vertical “spits”, and artefacts related to each
other may never be associated (Figure 1).
In recent years, more and more attention has been focused on the retrieval and analysis of information
from smaller scales within archaeological sites as it becomes easier to record artefacts at higher
resolutions (and in three dimensions) with specialist survey equipment (Dibble & Lenoir, 1995).
However, the means of relating artefacts to potential stratigraphic levels (whether clearly visible or not)
is far from straightforward (Harris & Lock, 1996). Significant progress has been made since the 1980s
on visualizing three-dimensional relationships in excavations, such as using solid modeling techniques
(Reilly & Shennan, 1989) or linking databases to graphics facilities (Reilly, Locker, & Shennan, 1988),
an area of research made more feasible recently by developments in three-dimensional Computer Aided
Design packages. Displaying three-dimensional relationships can be an important aid in understanding
stratigraphical relationships and identifying potential patterning.
However the further step towards three-dimensional spatial analysis is proving a serious challenge. The
need to develop a method for analyzing phasing on prehistoric sites has become more pressing,
particularly with increasing interest in the subsequent occupation of particular sites. Identifying
repeated occupation by human communities with similar technologies depends on differentiating
phases of occupation on excavated sites.

www.scholink.org/ojs/index.php/ac Archaeology and Culture Vol. 1, No. 1, 2018
57 Published by SCHOLINK INC.
Figure 1. The Effect of Palaeosol Topography on the Interpreted Vertical Distribution of
Artefacts (Yosefi Zoshk, 2011)
2. Method
In the summer 2011, during the first season of excavations at Tepe Meymanatabad (Yousefi, 2011), all
artefacts including pottery sherds, bone fragments, metal object and etc… were registered by recording
the artefact locations in three dimensions as well as a grid of points describing sedimentological
boundaries (using laser Total Station TS02-7 based survey equipment). The analysis and interpretation
of Tepe Meymanatabad—one from the most important late Chalcolithic sites—allowed the
development of a method for linking artefact distributions to recorded stratigraphy and assessing the
disturbance of artefacts, and thus forming the basis for interpretations of the nature of occupation at
Tepe Meymanatabad. He site of Tepe Meymanatabad stands near the margin of the fertile Tehran Plain,
which is one of the largest plain in Northern Central Iranian Plateau. Today, what remains of the mound
covers approximately 5.3 ha, much of which is quite low, rising only 4.731 m above the surrounding
ground surface. A modern village, also called Meymanatabad, now lies to the west of the site. It
appears that, the site was deliberately damaged by bulldozers and ploughing, particularly on the eastern
side. As a result of these site formation processes, it is particularly difficult to estimate how large Tepe
Meymanatabad was before the recent damage, and this makes it virtually impossible to estimate how
large the site was in antiquity. The site consists of two low mounds hereafter called northern mound and
southern mound.

www.scholink.org/ojs/index.php/ac Archaeology and Culture Vol. 1, No. 1, 2018
58 Published by SCHOLINK INC.
Figure 2. Digital Elevation Model of Tehran Province and Location of Tepe Meymanatabad
(Yosefi Zoshk, 2011)
2.1 Operation at Trench 1 at Tepe Meymanatabad
Preliminary excavations at Tepe Meymanatabad were carried out in late summer of 2011. The initial
aim of this excavation was to expose a stratigraphically defined sequence of occupation at the site, and
when this was combined with the results of the excavations at Tepe Ghabrestan (Fazeli et al., 2005,
2009; Matthews & Fazeli 2004; Majidzadeh, 1976, 1981), it was hoped that this would provide a
preliminary insight into the ceramic sequence and the occupational history of the Northern Central
Iranian Plateau as a whole during the 4th millennium B.C. Furthermore, an area of 5 m by 5 m at Tepe
Meymanatabad, hereby called “Trench 1” was excavated. Excavation proceeded by the identification
and removal of discretely stratified layers or “units”, whether they were originally produced by natural
deposition processes or as a result of human action. A unit can be any type of stratified deposit, such as
pit fill, a wall, foundation material, floor surface, bench, hearth, collapse, fill, and wash etcetera.
During the excavation, each stratigraphic unit was referred to as a Locus, which was delimited,
excavated separately, and allocated a sequential ID number, in this case, from 1001 to 1054. Each locus
was recorded on a separate data sheet, where the nature of the deposit was characterized through the
selection of a relevant tick-box and a written description. The location and extent of each locus was
also drawn in plan, and absolute levels were taken so that it could be defined in three-dimensional
space.

www.scholink.org/ojs/index.php/ac Archaeology and Culture Vol. 1, No. 1, 2018
59 Published by SCHOLINK INC.
Figure 3. Digital Elevation Model of Tepe Meymanatabad and Location of Trench 1(Yosefi Zoshk,
2011)
The small size of the sounding sometimes meant that individual deposits were excavated in a number
of different parts, which were each allocated their own locus number, but which could be combined
later. The stratigraphic relationships between each locus were also recorded, and the relationships for
all of the deposits in the sounding are illustrated using a standard Harris matrix. After digitally recorded,
all cultural artefacts, animal bone or carbonized material and pottery sherds recovered from a locus was
placed in a clean plastic bag together with a separately bagged label marked with the date, site name,
the trench number, the sequential locus number and a description of the type of object. Apparently
associated with these artefacts were three occupation phases, dated to approximately 3400 to 3200 B.C
based on pottery classification. Careful excavation began from 1052.993 m above the sea level. All
artefacts with no exception—3699 artefacts in total—were individually numbered and recorded in three
dimensions using a Total Station, TS02-7 and planned on recording sheets (Table 1).
Table 1. Absolute Heights of Tepe Meymanatabad and Sounding (Yosefi Zoshk, 2011)
Location of Measurement Absolute Height (m asl)
Highest point on Tepe Meymanatabad 1053.966
Top of Sounding 1052.993
Lowest Level Reached in Sounding 1050.198
Level of Surrounding Plain 1049.235

www.scholink.org/ojs/index.php/ac Archaeology and Culture Vol. 1, No. 1, 2018
60 Published by SCHOLINK INC.
Figure 4. Artifact Distributions at Trench 1, Tepe Meymanatabad (Yosefi Zoshk, 2011)
All excavated deposits were sieved both dry and wet to check for artefacts and micro artefacts. Three
major sedimentological changes were visible in the field—first occupational phase (about 87 cm in
depth from the datum) which overlay a pale brownish soil, under which lay an interface between this
soil and the virgin soil which it covers. A further lower level within the sandstone consisted of a very
distinctive soft fine grained soil (Table 2).
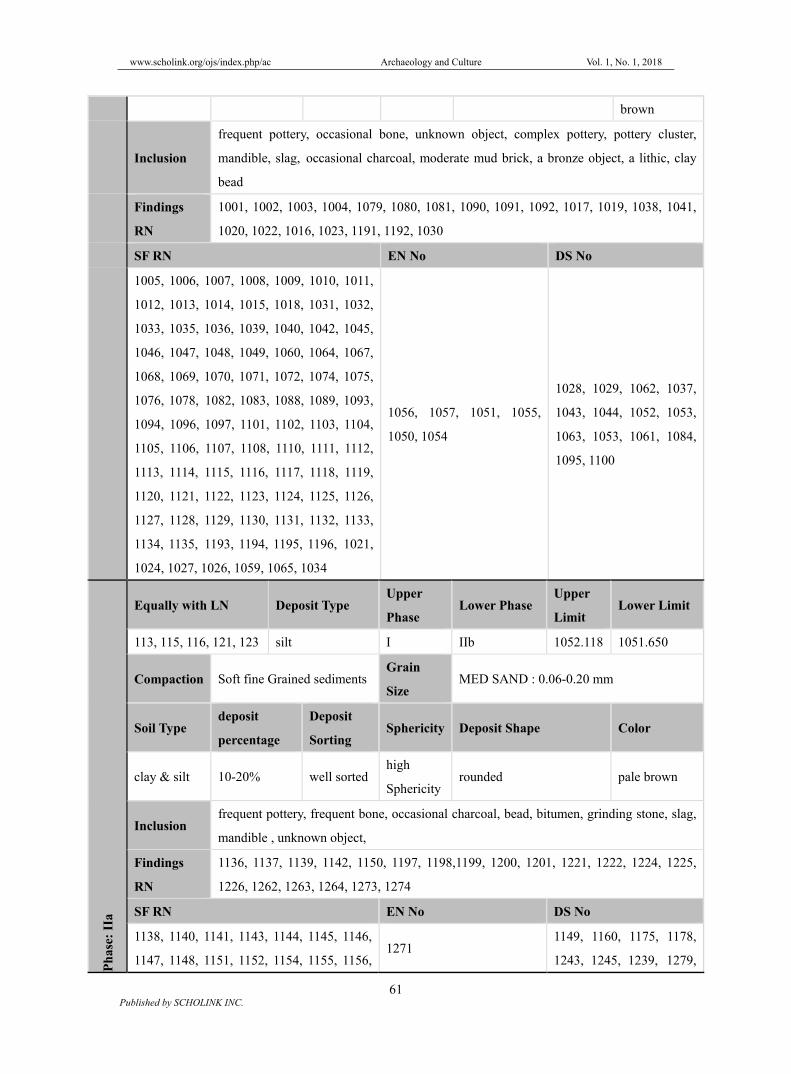
Table 2. Three Major Sedimentological Phasing at Tepe Meymanatabad (Yosefi Zoshk, 2011)
Ph
ase:
I
Deposit Table
Equally with LN Deposit Type Upper
Phase Lower Phase
Upper
Limit Lower Limit
101, 105, 106, 107, 108,
112, 114 Clay silt - IIa 1052.993 1052.118
Compaction Soft/very soft fine grained
sediments
Grain
Size FINE SAND : 0.02-0.06 mm
Soil Type deposit
percentage
Deposit
Sorting Sphericity Deposit Shape Color
clay & silt 15-30% moderately
sorted
Low
Sphericityangular & sub – angular
pale
brown/mid
www.scholink.org/ojs/index.php/ac Archaeology and Culture Vol. 1, No. 1, 2018
61 Published by SCHOLINK INC.
brown
Inclusion
frequent pottery, occasional bone, unknown object, complex pottery, pottery cluster,
mandible, slag, occasional charcoal, moderate mud brick, a bronze object, a lithic, clay
bead
Findings
RN
1001, 1002, 1003, 1004, 1079, 1080, 1081, 1090, 1091, 1092, 1017, 1019, 1038, 1041,
1020, 1022, 1016, 1023, 1191, 1192, 1030
SF RN EN No DS No
1005, 1006, 1007, 1008, 1009, 1010, 1011,
1012, 1013, 1014, 1015, 1018, 1031, 1032,
1033, 1035, 1036, 1039, 1040, 1042, 1045,
1046, 1047, 1048, 1049, 1060, 1064, 1067,
1068, 1069, 1070, 1071, 1072, 1074, 1075,
1076, 1078, 1082, 1083, 1088, 1089, 1093,
1094, 1096, 1097, 1101, 1102, 1103, 1104,
1105, 1106, 1107, 1108, 1110, 1111, 1112,
1113, 1114, 1115, 1116, 1117, 1118, 1119,
1120, 1121, 1122, 1123, 1124, 1125, 1126,
1127, 1128, 1129, 1130, 1131, 1132, 1133,
1134, 1135, 1193, 1194, 1195, 1196, 1021,
1024, 1027, 1026, 1059, 1065, 1034
1056, 1057, 1051, 1055,
1050, 1054
1028, 1029, 1062, 1037,
1043, 1044, 1052, 1053,
1063, 1053, 1061, 1084,
1095, 1100
Ph
ase:
IIa
Equally with LN Deposit Type Upper
Phase Lower Phase
Upper
Limit Lower Limit
113, 115, 116, 121, 123 silt I IIb 1052.118 1051.650
Compaction Soft fine Grained sedimentsGrain
Size MED SAND : 0.06-0.20 mm
Soil Type deposit
percentage
Deposit
Sorting Sphericity Deposit Shape Color
clay & silt 10-20% well sortedhigh
Sphericityrounded pale brown
Inclusion frequent pottery, frequent bone, occasional charcoal, bead, bitumen, grinding stone, slag,
mandible , unknown object,
Findings
RN
1136, 1137, 1139, 1142, 1150, 1197, 1198,1199, 1200, 1201, 1221, 1222, 1224, 1225,
1226, 1262, 1263, 1264, 1273, 1274
SF RN EN No DS No
1138, 1140, 1141, 1143, 1144, 1145, 1146,
1147, 1148, 1151, 1152, 1154, 1155, 1156, 1271
1149, 1160, 1175, 1178,
1243, 1245, 1239, 1279,

www.scholink.org/ojs/index.php/ac Archaeology and Culture Vol. 1, No. 1, 2018
62 Published by SCHOLINK INC.
1157, 1158, 1159, 1161, 1162, 1163, 1164,
1165, 1166, 1167, 1168, 1169, 1170, 1171,
1172, 1173, 1174, 1176, 1177, 1179, 1180,
1181, 1182, 1183, 1184, 1217, 1218, 1219,
1220, 1223, 1228, 1229, 1230, 1231, 1232,
1233, 1234, 1235, 1236, 1237, 1238, 1240,
1241, 1242, 1244, 1246, 1247, 1313, 1248,
1249, 1250, 1251, 1252, 1253, 1255, 1256,
1257, 1258, 1259, 1254, 1265, 1266, 1267,
1268, 1269, 1270,1276, 1278, 1280, 1281,
1282, 1283, 1284, 1286, 1287, 1288, 1289,
1290, 1291, 1292, 1293, 1294, 1295, 1296,
1297, 1298, 1299, 1300, 1301, 1277
1291, 1302, 1303, 1275,
1285, 1314
Ph
ase:
IIb
Equally with LN Deposit Type Upper
Phase Lower Phase
Upper
Limit Lower Limit
124, 125, 126, 127 peat IIa Virgin Soil 1051.650 1051.318
Compaction compact coarse grained
sediments
Grain
Size MED SAND : 0.06-0.20 mm
Soil Type deposit
percentage
Deposit
Sorting Sphericity Deposit Shape Color
clay & silt 10-20% moderately
sorted
Low
Sphericityrounded & sub – rounded
Light reddish
brown
Inclusion moderate pottery, moderate bone, occasional charcoal
Findings
RN 1304, 1305,1306, 1307,1311, 1312
SF RN EN No DS No
- - 1308, 1309, 1310
The silt pan is likely to have formed after before the occupation initiated, its formation relating to the
development of the peat. However (as is often observed) the undulations of this level were clearly
related to the structure of the upper two surfaces. The spatial distribution of artefacts themselves and in
relation to the features proved particularly interesting. The artefact re-fit patterns (shown in Figure 5)
appeared to relate to distinctive activity patterns on the floor of the first occupation phase. The
dimensions of the artefact concentrations accorded well within the first apparent level. An obvious
query thus arose as to the integrity of site—in effect whether a coherent explanation could be put
forward to explain the apparent distribution patterns, or whether in fact, post-depositional processes

www.scholink.org/ojs/index.php/ac Archaeology and Culture Vol. 1, No. 1, 2018
63 Published by SCHOLINK INC.
had had a major influence on the distribution of artefacts, forming a chance association in the upper
deposits. Since the upper levels at many of low mounds are often assumed to be fairly disturbed
contexts, a site of this type with minimal post-depositional disturbance and a coherent “story” could be
significant not only in the context of the specific activities which might be reconstructed, but also in
terms of the potential for recovering other similar late Chalcolithic sites. One accepted method of
assessing the integrity of these types of sites is to assess the vertical displacement of artefacts (Barton
1987). The vertical displacement of the finds from the 2010 season’s excavations at Trench 1 is shown
in (Figure 7 & 8). Points on each of the soil interfaces had been recorded as the area was excavated.
First, the gridded points taken from each sediment interface was interpolated to produce three surfaces
(see Figure 8) corresponding to the soil interfaces. The method used for this interpolation is essentially
the same as that for modeling much larger scale landscape surfaces.
Figure 5. Stratigraphical Phasing at Tepe Meymanatabad and Related Possible Floors (Yosefi
Zoshk, 2011)

www.scholink.org/ojs/index.php/ac Archaeology and Culture Vol. 1, No. 1, 2018
64 Published by SCHOLINK INC.
In this case, the points were entered into ArcInfo as a series of points used to form a TIN surface and
interpolated using quantic interpolation to calculate a surface from which the z coordinates of any point
could be determined. These surfaces (which had similar forms, although at different heights) provided a
model of the shape of the past land surface, and as such a guide to the original relative locations of the
artefacts. By calculating the vertical disturbance of each artefact from each of the surfaces (which
would have been “parallel” to the past land surface) we can get a measure of the relative displacement
from the past land surface on which they were deposited. This is done within GIS by “projecting” the
artifacts onto each surface and subtracting the “projected” height from the actual excavated height.
Figure 6. Stratigraphical Phasing Supplemented with Pottery Assemblage at Tepe
Meymanatabad (Yosefi Zoshk, 2011)
In effect, by calculating the height of each soil surface at each x, y point (for each artefact) and then the
difference between this height and that at which the artefact was recovered. The finds had a very
similar vertical concentration in relation to each surface, displaying a bell-shaped distribution with a
standard deviation. The vertical distribution of finds was remarkably tightly concentrated, shown with
reference to the sandstone layer in Figure 8.
Figure 7. (a) Vertical Distribution of Bones at Trench1 on the Basis of Interpolated Stratigraphy.
(b) Vertical Distribution of Pottery Sherds at Trench1 on the Basis of Interpolated Stratigraphy.
(Yosefi Zoshk, 2011)
We may assume that maximum vertical concentration of artefacts marks the past land surface on which
they were deposited. Other lines of evidence also support the idea of a minimal vertical dispersal of

www.scholink.org/ojs/index.php/ac Archaeology and Culture Vol. 1, No. 1, 2018
65 Published by SCHOLINK INC.
artefacts from the original land surface. Micro-debris analysis and micro-morphology studies revealed
the same distribution patterns for micro-debris as shown for all finds above. Likewise the results of
pollen concentration analysis at this site currently undertaken by Dr. Maghsudi from Tehran University
demonstrated that pollen, spores and charcoal had not moved down the profile and become
concentrated at the base of the deposits (Personal communications).
Figure 8. Comparative Analysis of Vertical Distribution of Bones and Pottery Sherds with
Stratigraphic Occupation Phases at Trench1 on the Basis of Interpolated Stratigraphy (Yosefi
Zoshk, 2011)
In order to test the relative movement of different size classes of artefacts, the vertical distribution from
the modeled stratigraphy of the largest size class—big Pottery sherds and bones—was considered
separately. The mean difference in depth between the two classes was 0·006 m (89% CI); a t-test on the
difference in the mean depth between the two classes gave P=0·711. As the confidence interval
included 0 and the P value was very large it is safe to conclude that there is no significant difference
between the two classes. A possible explanation for the minimal influence of post-depositional
processes may lie in the timing of occupation of the site. If occupation occurred at the time of incipient

www.scholink.org/ojs/index.php/ac Archaeology and Culture Vol. 1, No. 1, 2018
66 Published by SCHOLINK INC.
peat formation, the deposition of artefacts may have coincided with a low intensity of biological
processes such as earthworm activity. It is clear that the GIS method used provides a “better” means of
assessing disturbance than simply considering vertical heights (as shown in Figure 8). The results are
particularly important in demonstrating the high integrity of the site, with apparently only a minimal
influence of post-depositional processes in disturbing artefact locations, at least where the vertical
movement of artefacts is concerned.
3. Result and Decoction
Careful excavation, three-dimensional recording and the use of GIS to model sedimentological levels
jointly proved very valuable tools in the analysis of occupation phases at Tepe Meymanatabad. The
results from the careful, albeit slow and painstaking excavation and three-dimensional recording of the
site described above clearly justify the time involved in excavation. Whilst widely available and easy to
use “truly three dimensional” programs for site analysis are still not available, we suggest that the GIS
based method described above might provide a useful tool for the interpretation of many sites. It can
provide a means of assessing the integrity of the site and the influence of post depositional processes
where only a limited span of occupation has taken place, and the potential for identifying different
phases of occupation where these phases are vertically separated. We recommend the use of this
technique for most sites, at least as a preliminary study used before selecting an appropriate excavation
method and look forward to seeing new applications and developments in this field.
Acknowledgement
We would particularly like to thank the field teams, without whom the success of the project would not
have been possible.
References
Barton, R. N. E. (1987). Vertical Distribution of Artefacts and Some Post-Depositional Factors
Affecting Site Formation. In P. Rowley-Conwy, M. Zvelebil, & H. P. Blankholm (Eds.),
Mesolithic North-West Europe: Recent Trends (pp. 55-62). John R. Collis.
Barton, R. N. E., & Bergman, C. A. (1982). Hunters at Hengistbury: Some evidence from experimental
archaeology. World Archaeology, 14(2), 237-248. https://doi.org/10.1080/00438243.1982.9979864
Barton, R. N. E., Berridge, P. J., Walker, M. J. C., & Bevins, R. E. (1995). Persistent places in the
Mesolithic Landscape: An example from the Black Mountain Uplands of South Wales.
Proceedings of the Prehistoric Society, 61, 81-116. https://doi.org/10.1017/S0079497X00003042
De Lumley et al. (1969). Une Cabane Acheuleenne dans la Grotte du Lazaret (Nice). Societe
prehistorique Memoires.
Dibble, H. L., & Lenoir, M. (1995). The Middle Palaeolithic site of Combe-Capelle-Bas, France.
Philadelphia: University of Pennsylvania.

www.scholink.org/ojs/index.php/ac Archaeology and Culture Vol. 1, No. 1, 2018
67 Published by SCHOLINK INC.
Fazeli Nashli, H., Wong, E. H., & Potts, D. T. (2005). The Qazvin Plain revisited: A reappraisal of the
chronology of the Northwestern Central Plateau, Iran, in the 6th to 4th millennium BC. Ancient
Near Eastern Studies, 42, 3-82. https://doi.org/10.2143/ANES.42.0.2004448
Fazeli Nashli, H., Beshkani, A, Markosian, A, Ilkani, H., Abbasnegad Seresty, R., & Young, R (2009).
The Neolithic to Chalcolithic transition in the Qazvin Plain, Iran: chronology and subsistence
strategies. Archaologische Mitteilungen aus Iran uns Turan, 41, 1-21.
Harris, T. M., & Lock, G. R. (1996). Multi-dimensional GIS: exploratory approaches to spatial and
temporal relationships within archaeological stratigraphy. In H. Kamermans, & K. Fennema (Eds.),
Interfacing the Past: Computer Applications and Quantitative Methods in Archaeology CAA95
(vol II). Analecta Praehistorica Leidensia 28. University of Leiden.
Majidzadeh, Y. (1976). The early Prehistoric cultures of the Central Plateau of Iran: An archaeological
history of its development during the fifth and fourth millennia B.C. (Ph.D. dissertation).
Department of Near Eastern Languages and Civilizations.
Majidzadeh, Y. (1981). Majidzadeh, Sialk III and the pottery sequence at Tepe Ghabristan: The
coherence of the cultures of the Iranian Plateau (Vol 19, pp. 141-146).
Matthews, R., & Fazeli Nashli, H. (2004). Copper and Complexity: Iran and Mesopotamia in the
Fourth Millennium B.C. (Vol. 42, pp. 61-75). Iran. https://doi.org/10.2307/4300663
Mellars, P. (1987). Excavations on Oronsay: Prehistoric human ecology on a small island. Edinburgh:
Edinburgh University Press.
Reilly, P., Locker, A., & Shennan, S. (1988). Pattern recognition in sub-surface artefact distributions:
expanding the role of computer graphics in the analysis of buried data. In S. Rahtz (Ed.),
Computer and Quantitative Methods in Archaeology (pp. 265-294). British Archaeological
Reports International Series.
Reilly, P., & Shennan, S. (1989). Applying solid modeling and animated three-dimensional graphics. In
S. Rahtz, & J. Richards (Eds.), Computer Applications and Quantitative Methods in Archaeology
(pp. 157-165). British Archaeological Reports International Series.
Yosefi Zoshk, R. (2011). Archaeological Report of Meymanat Abad excavation. Excavation report
Deposited: ICAR.