Stochastic electrotransport selectively enhances the transport of ...

Article
Corticostriatal Transmissi
on Is SelectivelyEnhanced in Striatonigral Neurons with PostnatalLoss of Tsc1Graphical Abstract
Highlights
d Postnatal loss of Tsc1 causes hyperexcitability of dSPNs but
not iSPNs
d Tsc1 KO dSPNs have altered somatic and dendritic
morphology
d Tsc1 KO dSPNs have increased excitatory synaptic drive with
no change in inhibition
d Corticostriatal transmission is selectively enhanced onto
Tsc1 KO dSPNs
Benthall et al., 2018, Cell Reports 23, 3197–3208June 12, 2018 ª 2018 The Authors.https://doi.org/10.1016/j.celrep.2018.05.037
Authors
Katelyn N. Benthall, Stacie L. Ong,
Helen S. Bateup
In Brief
Benthall et al. demonstrate that postnatal
deletion of the autism-risk gene Tsc1
causes cell-type-specific changes in
striatal neuron morphology and
physiology. They find that Tsc1 KO
striatonigral, but not striatopallidal,
neurons are hyperexcitable and have
enhanced cortical excitatory synaptic
transmission in the absence of changes
to inhibition.
Cell Reports
Article
Corticostriatal Transmission Is SelectivelyEnhanced in Striatonigral Neuronswith Postnatal Loss of Tsc1Katelyn N. Benthall,1 Stacie L. Ong,1 and Helen S. Bateup1,2,3,*1Department of Molecular and Cell Biology, University of California, Berkeley, Berkeley, CA 94720, USA2Helen Wills Neuroscience Institute, University of California, Berkeley, Berkeley, CA 94720, USA3Lead Contact
*Correspondence: [email protected]
https://doi.org/10.1016/j.celrep.2018.05.037
SUMMARY
mTORC1 is a central signaling hub that integratesintra- and extracellular signals to regulate a varietyof cellular metabolic processes. Mutations in regula-tors of mTORC1 lead to neurodevelopmental disor-ders associated with autism, which is characterizedby repetitive, inflexible behaviors. These behaviorsmay result from alterations in striatal circuits thatcontrol motor learning and habit formation. However,the consequences of mTORC1 dysregulation onstriatal neuron function are largely unknown. Toinvestigate this, we deleted the mTORC1 negativeregulator Tsc1 from identified striatonigral and stria-topallidal neurons and examined how cell-autono-mous upregulation of mTORC1 activity affects theirmorphology and physiology. We find that loss ofTsc1 increases the excitability of striatonigral, butnot striatopallidal, neurons and selectively enhancescorticostriatal synaptic transmission. These findingshighlight the critical role of mTORC1 in regulatingstriatal activity in a cell type- and input-specificmanner, with implications for striatonigral pathwaydysfunction in neuropsychiatric disease.
INTRODUCTION
The mechanistic target of rapamycin (mTOR) signaling pathway
is a central coordinator of cell growth andmetabolism. Activation
of mTOR complex 1 (mTORC1) signals anabolic processes
via stimulation of protein synthesis, organelle biogenesis, and
suppression of autophagy (Saxton and Sabatini, 2017). In the
nervous system, mTORC1 controls neuronal output by regu-
lating intrinsic excitability, synaptic transmission, and long-
term synaptic plasticity in a cell-type-specific manner (Bateup
et al., 2011, 2013; Tavazoie et al., 2005; Ehninger et al., 2008;
Tsai et al., 2012; Normand et al., 2013; Yang et al., 2012). Tight
regulation of mTOR signaling is essential, as its dysregulation
is associated with a variety of neurological and psychiatric disor-
ders (Costa-Mattioli and Monteggia, 2013; Lipton and Sahin,
2014). In particular, several neurodevelopmental disorders are
caused by mutations in regulators of mTORC1. One of these,
CelThis is an open access article under the CC BY-N
tuberous sclerosis complex (TSC), is caused by mutations in
the TSC1 or TSC2 genes, which encode components of a protein
complex that negatively regulates mTORC1 signaling (Crino
et al., 2006). Loss of the TSC1/2 complex causes deregulated
and constitutively active mTORC1, leading to a syndrome
characterized by high rates of epilepsy, intellectual disability,
and autism spectrum disorder (ASD) (Crino, 2013; Curatolo
et al., 2015). How dysregulated mTORC1 signaling causes these
diverse phenotypes is not well understood, but current hypothe-
ses suggest that mTOR-dependent alterations in neuronal excit-
ability and synaptic balance cause aberrant circuit development
and function.
The specific physiological phenotypes associated with
mTORC1 deregulation are cell type dependent, indicating that
the cellular context plays an important role in determining the
outcome of mTOR pathway mutations. For example, in the
hippocampus, loss of Tsc1 impairs mGluR-dependent long-
term depression and inhibitory synapse function, leading to
network hyperactivity (Bateup et al., 2011, 2013; Ehninger
et al., 2008; Weston et al., 2014). Mosaic deletion of Tsc1 from
thalamic neurons alters their passive membrane properties and
action potential kinetics in an age-dependent manner (Normand
et al., 2013). Loss of Tsc1 in the hypothalamus causes intrinsic
hypoexcitability of Pomc- but not Agrp-expressing neurons
(Yang et al., 2012). In the cerebellum, deletion of Tsc1 from
Purkinje cells causes hypoexcitability and cell death, with no
major effects on synaptic transmission (Tsai et al., 2012). This
diversity of responses to mTORC1 activation highlights the
need to examine the consequences of mTOR signaling alter-
ations in a cell-type- and circuit-specific manner.
Emerging evidence suggests that changes in the activity of
striatal neurons may underlie the repetitive, inflexible behaviors
associated with ASD (Fuccillo, 2016). The striatum is the main
input structure of the basal ganglia, a group of subcortical nuclei
that control action selection, motor learning, and habit formation
(Graybiel, 2005; Graybiel and Grafton, 2015). The principal cells
of the striatum are GABAergic spiny projection neurons (SPNs)
that can be divided into two subtypes: striatonigral neurons of
the direct pathway (dSPNs) that express type 1 dopamine recep-
tors (D1) and striatopallidal neurons of the indirect pathway
(iSPNs) that express type 2 dopamine receptors (D2) (Gerfen
and Surmeier, 2011). Striatal SPNs are driven by glutamatergic
inputs from the cortex and thalamus and project to distinct basal
ganglia nuclei on the basis of their subtype (Smith et al., 1998;
l Reports 23, 3197–3208, June 12, 2018 ª 2018 The Authors. 3197C-ND license (http://creativecommons.org/licenses/by-nc-nd/4.0/).

Figure 1. Mosaic Loss of Tsc1 from Striatal Neurons Induces mTORC1 Activation and Somatic Hypertrophy
(A) Schematic showing the four cell types present in each striatal slice of a Tsc1fl/fl;D2-GFPmouse injected with AAV5-Cre-mCherry. iSPNs are identified by GFP
fluorescence, and Tsc1 KO neurons are identified by nuclear mCherry expression.
(B–F) Confocal images of a striatal section showing NeuN immunostaining (B), D2-GFP fluorescence (C), Cre-mCherry fluorescence (D), phosphorylated S6
immunostaining (p-S6, Ser240/244) (E), and a merged image (F). Red arrows show Tsc1 KO dSPNs, yellow arrows show Tsc1 KO iSPNs, grey arrowheads
indicate WT dSPNs and green arrowheads indicate WT iSPNs.
(G and H) Cumulative distributions of p-S6 levels (G) and soma volume (H) for neurons of each genotype. n = 300 neurons per genotype from 3mice, 100 neurons
per mouse. ***p < 0.0001, K-S test; red stars indicate significance for dSPN KO versus dSPNWT, yellow stars denote significance for iSPN KO versus iSPN WT,
and green stars indicate significance for dSPN WT versus iSPN WT.
See also Figure S1.
Kreitzer, 2009). Coordinated activity among ensembles of
dSPNs and iSPNs determines basal ganglia output such that
appropriate actions are selected while competing actions are
suppressed (Mink, 2003; Klaus et al., 2017). Disruptions in the
balance of activity between dSPNs and iSPNs result in altered
motor behaviors in a variety of neurological and psychiatric dis-
orders (Gunaydin and Kreitzer, 2016; Kravitz et al., 2010; Bateup
et al., 2010), including mouse models of ASD (Fuccillo, 2016).
Despite the known involvement of mTOR signaling in ASD,
both in TSC and in other forms of autism (Curatolo et al., 2010;
Davis et al., 2015; Huber et al., 2015; Subramanian et al.,
2015), the consequences of mTORC1 deregulation on striatal
activity are largely unknown.
To elucidate the impact of TSC-mTOR signaling on striatal
neuron function, we conditionally deleted Tsc1 from a subset
of striatonigral and striatopallidal neurons and examined their
morphological and physiological properties. We found that post-
natal deletion of Tsc1 resulted in a cell-type-specific increase in
dSPN excitability, mediated by changes in passive membrane
properties, potassium channels, and dendritic morphology. In
addition, loss of Tsc1 caused a selective enhancement of corti-
costriatal synaptic inputs onto dSPNs, with no major changes to
thalamic or inhibitory synaptic transmission. These results indi-
cate that increased excitability of dSPNs is a primary effect of
deregulated TSC-mTOR signaling, which may lead to striatal
circuit dysfunction by altering the balance of activity between
dSPNs and iSPNs.
3198 Cell Reports 23, 3197–3208, June 12, 2018
RESULTS
Upregulation of mTORC1 and Somatic Hypertrophy inSPNs with Tsc1 DeletionTo define the consequences of mTORC1 activation on striatal
neuron function, we used a viral strategy to delete Tsc1 from
a subset of neurons in the dorsolateral striatum. We injected
dilute AAV5-Cre-mCherry or AAV5-Cre-GFP virus into the stria-
tum of juvenile Tsc1fl/fl;D2-GFP or Tsc1fl/fl;D1-tdTomato mice,
respectively, and performed experiments 11–15 days later.
This paradigm enabled fluorescence-based identification and
subsequent comparison of control (wild-type, WT) and Tsc1
knockout (Tsc1 KO) dSPNs and iSPNs in the same striatal slice
(Figures 1A–1F and S1A–S1F). With this approach, we could
isolate the cell-autonomous effects of mTORC1 deregulation, in-
dependent of developmental or compensatory alterations, as
�25% of cells in the injection area express Cre recombinase
and the injection site is restricted to dorsal striatum (Figures
S1G and S1H). In striatal sections, immunostaining with a phos-
pho-antibody against the downstream mTORC1 pathway target
S6 (p-S6, Ser240/244) revealed an increase in mTORC1 activity
in Tsc1 KO dSPNs and iSPNs compared with neighboring unin-
fected neurons (Figures 1B–1G and S1B–S1F). This confirms
that Tsc1/2 complex function is impaired and mTORC1 is cell
autonomously upregulated in Cre-expressing neurons.
A common phenotype associated with upregulation of
mTORC1 signaling is somatic hypertrophy, which likely results

from overactivation of mTORC1-regulated growth processes
(Bateup et al., 2011; Meikle et al., 2007; Normand et al., 2013;
Tavazoie et al., 2005; Tsai et al., 2012). To investigate if striatal
neurons display this phenotype, we reconstructed somata in
three dimensions from histology sections and measured soma
volume using the NeuN signal. Tsc1 KO dSPNs and iSPNs had
significantly increased soma volume compared with controls
(Figure 1H), consistent with previous findings. A significant differ-
ence in soma volume was also detected between dSPN and
iSPN control cells, with dSPNs having slightly larger cell bodies
(Figure 1H). We confirmed the effects of Tsc1 loss on soma
size in a separate analysis of iSPNs in Tsc1fl/fl;D2-GFP mice
using the GFP signal to measure soma volume (iSPN WT
mean = 255.5 ± 2.4 mm3, iSPN KO mean = 291.8 ± 2.7 mm3,
p < 0.0001, Kolmogorov-Smirnov [K-S] test).
Intrinsic Excitability Is Selectively Enhanced in Tsc1 KOdSPNsTo understand how loss of Tsc1 affects striatal neuron function,
we first investigated how intrinsic excitability is affected by Tsc1
deletion. We performed whole-cell current-clamp recordings of
identified WT and Tsc1 KO dSPNs and iSPNs in striatal slices
from Tsc1fl/fl;D2-GFP mice injected with AAV5-Cre-mCherry.
Recordings for this and all subsequent experiments were
performed from cells in the dorsolateral striatum. We injected a
depolarizing current step (75–400 pA, 500 ms) and measured
firing frequency as a function of current step amplitude. We
observed the previously reported difference in frequency-cur-
rent relationship between dSPN and iSPN control cells (Gertler
et al., 2008), with iSPNs having significantly increased intrinsic
excitability (Figures 2A and 2B; Table S1). Interestingly, we found
a significant difference between dSPN WT and Tsc1 KO neu-
rons, with dSPN KO cells firing at a higher rate in response to
current injection (Figures 2A and 2B; Table S1). Notably, no sig-
nificant difference in frequency-current relationship was found
between iSPN WT and KO neurons (Figures 2A and 2B).
As another measure of excitability, we determined the rheo-
base, the minimum current required to elicit a single action
potential, by applying a series of depolarizing current steps in
10 pA increments (75–300 pA, 500 ms). Rheobase was signifi-
cantly decreased in dSPN Tsc1 KO cells compared with
controls, with no changes in Tsc1 KO iSPNs (Figure 2C). Lower
rheobase current in Tsc1 KO dSPNs is consistent with increased
excitability, as it indicates that less depolarization is required to
evoke action potential firing. Consistent with the enhanced excit-
ability of Tsc1 KO dSPNs, membrane resistance was signifi-
cantly increased and capacitance was significantly decreased
compared with controls (Figures S1I and S1J). We found no
differences in the passive properties of iSPN WT and Tsc1 KO
cells (Figures S1I–S1K). Together these findings show that post-
natal loss of Tsc1 selectively enhances the intrinsic excitability of
dSPNs.
In addition to passivemembrane properties, inwardly rectifying
potassium channels (Kirs) are important for setting themembrane
excitability of SPNs (Gertler et al., 2008;Kreitzer, 2009;Shen et al.,
2007). Previousworkhas shown that theexcitability differencebe-
tween SPN subtypes is associated with greater Kir current in
dSPNs compared with iSPNs (Gertler et al., 2008). We therefore
testedwhether loss of Tsc1 affects Kir currents in striatal neurons.
To activate potassium conductances, we applied a series of
voltage steps (�150 to �60 mV, 500 ms) in 10 mV increments in
whole-cell voltage-clamp recordings. The predominant current
in SPNs at hyperpolarized membrane potentials is through Kir
channels; however, there is some contribution of leak conduc-
tances. To isolate Kir current, we blocked Kir channels with
1 mM CsCl and repeated the voltage step protocol. Kir currents
were isolated from the Cs-insensitive leak conductances using
digital subtraction (Figure 2D) (Cazorla et al., 2012). As previously
reported (Gertler et al, 2008), Kir current was significantly larger in
dSPN than iSPN control cells (Figures 2D and 2E; Table S1).
Consistent with the enhanced intrinsic excitability of dSPN Tsc1
KO neurons, there was a significant decrease in Kir current in
dSPN Tsc1 KO cells compared with controls (Figures 2D and
2E; Table S1). We also observed a small enhancement of Kir cur-
rent at the most hyperpolarized membrane potential in Tsc1 KO
iSPNs compared with WT iSPNs (Figures 2D and 2E; Table S1).
Dendritic Complexity Is Reduced in Tsc1 KO dSPNsThe degree of dendritic arborization strongly influences the
membrane excitability of SPNs (Gertler et al., 2008). We there-
fore examined how dendritic morphology is affected by loss of
Tsc1, as this could contribute to changes in excitability. Neuro-
biotin was dialyzed into cells during whole-cell recordings and
visualized in fixed tissue sections using fluorophore-conjugated
avidin. Dendritic arbors were reconstructed in three dimensions
(Figure 3A), and arborizationwas quantified by Sholl analysis.We
found that the dendritic complexity of dSPN Tsc1 KO cells was
significantly decreased compared with that of controls, while
iSPN Tsc1 KO and control cells had a similar Sholl profile (Fig-
ures 3A–3C; Table S1). Consistent with these findings, total
dendrite length was significantly decreased in dSPN Tsc1 KO
cells, resulting from decreased dendrite branching (Figures
3D–3F; Tables S2 and S3). Similar to prior studies (Gertler
et al., 2008), we found that dSPN control cells had significantly
greater dendritic complexity, total dendritic length, number of
primary dendrites, and branchpoints compared with iSPNs (Fig-
ures 3D–3F; Tables S2 and S3). Taken together, these results
demonstrate that acute loss of Tsc1 and cell autonomous activa-
tion of mTORC1 signaling affects the intrinsic properties of
dSPNs in multiple ways, with the net effect of enhancing their
excitability.
Loss of Tsc1 Does Not Affect Synaptic Inhibition ontoSPNsmTORC1 is an important regulator of synaptic properties in
several neuron types, and changes in synaptic function are
thought to underlie mTOR-related disorders (Hoeffer and
Klann, 2010). For example, in hippocampal neurons, loss of
Tsc1 and activation of mTORC1 increases the excitatory/inhibi-
tory synaptic ratio because of a strong decrease in inhibitory
synapse function (Bateup et al., 2013). To determine how loss
of Tsc1 affects inhibition onto striatal neurons, we examined
baseline inhibitory transmission by recording miniature inhibitory
postsynaptic currents (mIPSCs) in Tsc1fl/fl;D2-GFPmice injected
with AAV5-Cre-mCherry (Figure 4A). No differences in average
mIPSC amplitude or frequency were observed with Tsc1
Cell Reports 23, 3197–3208, June 12, 2018 3199

Figure 2. Postnatal Loss of Tsc1 Increases the Intrinsic Excitability of dSPNs
(A) Example traces showing action potentials evoked by a 250 pA current step for each cell type. The resting membrane potential is indicated to the left of each
trace.
(B) Frequency-current relationship for control (WT) and Tsc1 KO dSPNs and iSPNs, displayed asmean ± SEM. Two-way ANOVA p values are shown. p values for
Sidak’s post hoc tests are in Table S1. dSPNWT n = 18 neurons from 15mice, dSPN KO n = 21 neurons from 14mice, iSPNWT n = 18 neurons from 16mice, and
iSPN KO n = 17 neurons from 13 mice.
(C) Bar graph shows the mean ± SEM rheobase for each condition. Dots indicate the values for individual neurons. *p < 0.05 and ***p < 0.001, one-way ANOVA
with Sidak’s post hoc test (see Table S2 for all p values); dSPNWT n = 17 neurons from 15mice, dSPN KO n = 16 neurons from 13mice, iSPNWT n = 18 neurons
from 16 mice, and iSPN KO n = 17 neurons from 13 mice.
(D) Example traces of inward-rectifying potassium channel currents in dSPNs and iSPNs. Kir channel currents were obtained by applying negative voltage steps
to the membrane (�150 to �60 mV in 10 mV increments) in the presence and absence of 1 mM CsCl. The cesium-sensitive component (IKir) was revealed using
digital subtraction.
(E) Quantification of IKir at different membrane potentials across genotypes.
Data are represented asmean ±SEM. Two-way ANOVA p values are shown. p values for the Sidak’s post hoc tests are in Table S2. dSPNWT n = 10 neurons from
10 mice, dSPN KO n = 10 neurons from 8 mice, iSPN WT n = 10 neurons from 10 mice, and iSPN KO n = 9 neurons from 9 mice.
See also Figure S1.
deletion in either SPN type (Figures 4B–4E). To determine
whether loss of Tsc1 affects evoked inhibitory synaptic transmis-
sion, we recorded electrically evoked IPSCs in simultaneously
recorded pairs of WT and Tsc1 KO dSPNs or iSPNs. We found
no difference in IPSC amplitude between Tsc1 KO SPNs and
controls (Figures 4F–4H). Because SPNs receive many sources
of inhibition (Tepper et al., 2010) that could be differentially
affected by Tsc1 deletion, we assayed inhibition in an input-spe-
cific manner. Fast-spiking parvalbumin-expressing interneurons
3200 Cell Reports 23, 3197–3208, June 12, 2018
(PV cells) control the activity of SPNs via feedforward inhibition
(Koos and Tepper, 1999), and their dysfunction has been
implicated in striatal-based disorders (Gittis and Kreitzer,
2012). To selectively activate inputs from PV cells, we bred
the Tsc1fl/fl;D1-tdTomato mice to mice expressing optimized
FLP recombinase (FlpO) under the Pvalb (parvalbumin) promoter
(Pvalb-2A-FlpO-D; Madisen et al., 2010). Juvenile mice were
injected with AAV5-fDIO-ChR2-EYFP (Fenno et al., 2014)
and AAV5-Cre-GFP to selectively express channelrhodopsin

Figure 3. Tsc1 KO dSPNs Have Reduced
Dendritic Arborization
(A) Example three-dimensional (3D) reconstructions
of neurobiotin-filled SPNs of each condition.
(B and C) Three-dimensional Sholl analysis of dSPN
(B) and iSPN (C) dendritic arbors. Circles of
increasing radii were drawn at 1 mm intervals from
the center of the soma and the number of dendrite
crossings was quantified for each condition. Black
lines indicate the mean and shaded regions show
the SEM. Two-way ANOVA p values are shown for
(B) and (C) combined (see also Table S1).
(D–F) Mean ± SEM of the total dendrite length (D),
number of primary dendrites (E), and number of
dendrite branch points (F) per neuron quantified by
3D Sholl analysis for each condition.
Dots indicate the values for individual neurons.
*p < 0.05, Kruskal-Wallis with Dunn’s post hoc test
(total dendrite length and number of branch points;
see Table S3 for p values) and one-way ANOVAwith
Sidak’s post hoc test (number of primary dendrites;
see Table S2 for p values). For all graphs, dSPN WT
n = 22 neurons from 21 mice, dSPN KO n = 24
neurons from 19mice, iSPNWT n = 19 neurons from
19 mice, and iSPN KO n = 17 neurons from 16mice.
(ChR2) in PV cells and delete Tsc1 from a subset of striatal neu-
rons, respectively. We performed simultaneous paired record-
ings of Tsc1 KO and control dSPNs and activated PV cell inputs
using full-field optical stimulation (Figures 4I and 4J). We found
no difference in the amplitude of optically evoked IPSCs
(oIPSCs) between Tsc1 KO and control dSPNs (Figure 4K).
Together these results show that acute, postnatal loss of Tsc1
does not strongly affect inhibitory synaptic function in SPNs.
Synaptic Excitation Is Selectively Increased in Tsc1 KOdSPNsSPNs exhibit low baseline firing activity but are strongly driven by
glutamatergic inputs (Wilson and Kawaguchi, 1996). To test
whether loss of Tsc1 affects excitatory synaptic transmission
in SPNs, we recordedminiature excitatory postsynaptic currents
(mEPSCs) in Tsc1fl/fl;D2-GFP mice injected with AAV5-Cre-
mCherry (Figure 5A). No difference in averagemEPSC amplitude
Cell
was found between conditions. However,
the frequency of mEPSCs was selectively
increased in dSPN Tsc1 KO cells
compared with controls (Figures 5B–5E).
We verified that these results were not
specific to the D2-GFP transgenic mouse
line by repeating this experiment in
Tsc1fl/fl;D1-tdTomato mice. Again, we
found a selective increase in mEPSC
frequency in Tsc1 KO dSPNs but not iSPNs
(Figures S2A–S2C). Enhanced mEPSC fre-
quency can result from either an increase in
the number of excitatory synapses or an in-
crease in presynaptic release probability.
To test whether synapse number was
affected by Tsc1 loss, we measured the
density of dendritic spines, the sites of excitatory synapses
onto SPNs, and found no difference between control and Tsc1
KO dSPNs (Figures S2D and S2E).
To determine whether loss of Tsc1 affects evoked excitatory
synaptic transmission, we recorded electrically evoked EPSCs
in simultaneously recorded pairs of WT and Tsc1 KO dSPNs or
iSPNs (Figure 5F). Consistent with the mEPSC experiments,
dSPN Tsc1 KO cells had significantly larger EPSCs than controls
(Figure 5G). No difference in EPSC amplitude was observed
between iSPNWT and Tsc1 KO cells (Figure 5H). To test whether
the increased EPSC amplitude and mEPSC frequency in Tsc1
KO dSPNs were due to changes in presynaptic release probabil-
ity, we performed paired-pulse experiments and found a
decrease in paired-pulse ratio in dSPN Tsc1 KO cells compared
with controls, indicating enhanced presynaptic release probabil-
ity (Figures 5I and 5J). No difference in the paired-pulse ratio was
observed between iSPN WT and Tsc1 KO cells (Figures 5I and
Reports 23, 3197–3208, June 12, 2018 3201
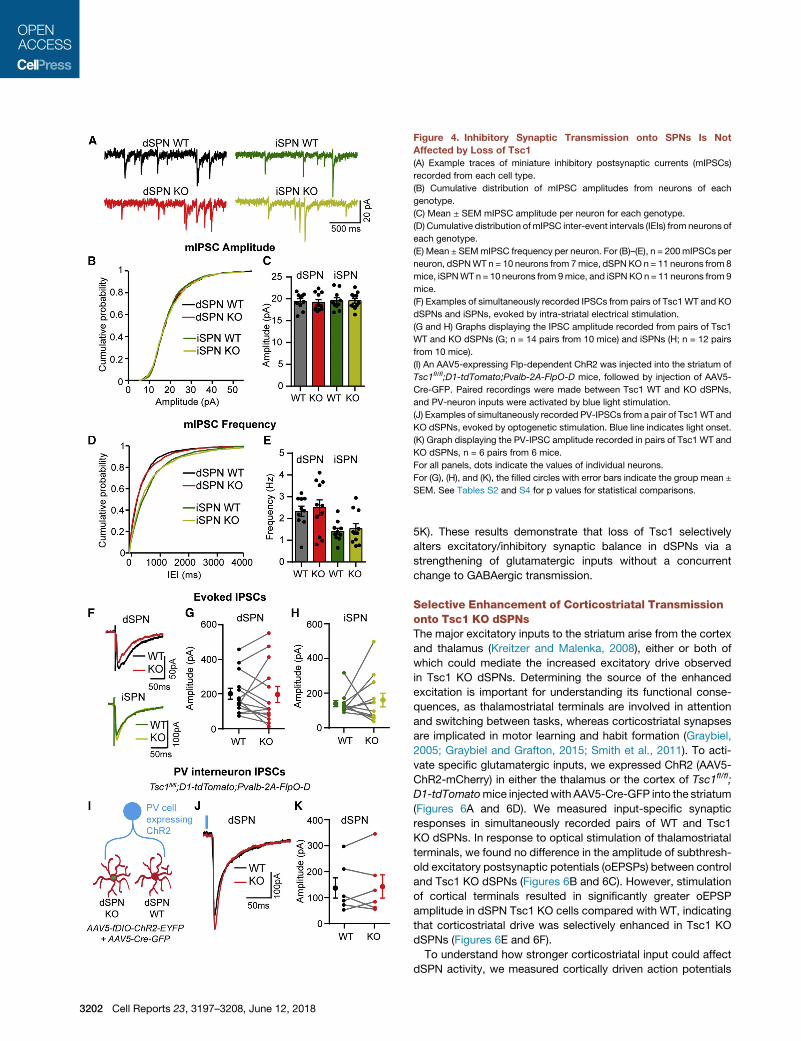
Figure 4. Inhibitory Synaptic Transmission onto SPNs Is Not
Affected by Loss of Tsc1
(A) Example traces of miniature inhibitory postsynaptic currents (mIPSCs)
recorded from each cell type.
(B) Cumulative distribution of mIPSC amplitudes from neurons of each
genotype.
(C) Mean ± SEM mIPSC amplitude per neuron for each genotype.
(D) Cumulative distribution ofmIPSC inter-event intervals (IEIs) from neurons of
each genotype.
(E) Mean ± SEMmIPSC frequency per neuron. For (B)–(E), n = 200mIPSCs per
neuron, dSPNWT n = 10 neurons from 7mice, dSPN KO n = 11 neurons from 8
mice, iSPNWTn = 10 neurons from 9mice, and iSPNKOn = 11 neurons from 9
mice.
(F) Examples of simultaneously recorded IPSCs from pairs of Tsc1WT and KO
dSPNs and iSPNs, evoked by intra-striatal electrical stimulation.
(G and H) Graphs displaying the IPSC amplitude recorded from pairs of Tsc1
WT and KO dSPNs (G; n = 14 pairs from 10 mice) and iSPNs (H; n = 12 pairs
from 10 mice).
(I) An AAV5-expressing Flp-dependent ChR2 was injected into the striatum of
Tsc1fl/fl;D1-tdTomato;Pvalb-2A-FlpO-D mice, followed by injection of AAV5-
Cre-GFP. Paired recordings were made between Tsc1 WT and KO dSPNs,
and PV-neuron inputs were activated by blue light stimulation.
(J) Examples of simultaneously recorded PV-IPSCs from a pair of Tsc1WT and
KO dSPNs, evoked by optogenetic stimulation. Blue line indicates light onset.
(K) Graph displaying the PV-IPSC amplitude recorded in pairs of Tsc1 WT and
KO dSPNs, n = 6 pairs from 6 mice.
For all panels, dots indicate the values of individual neurons.
For (G), (H), and (K), the filled circles with error bars indicate the group mean ±
SEM. See Tables S2 and S4 for p values for statistical comparisons.
3202 Cell Reports 23, 3197–3208, June 12, 2018
5K). These results demonstrate that loss of Tsc1 selectively
alters excitatory/inhibitory synaptic balance in dSPNs via a
strengthening of glutamatergic inputs without a concurrent
change to GABAergic transmission.
Selective Enhancement of Corticostriatal Transmissiononto Tsc1 KO dSPNsThe major excitatory inputs to the striatum arise from the cortex
and thalamus (Kreitzer and Malenka, 2008), either or both of
which could mediate the increased excitatory drive observed
in Tsc1 KO dSPNs. Determining the source of the enhanced
excitation is important for understanding its functional conse-
quences, as thalamostriatal terminals are involved in attention
and switching between tasks, whereas corticostriatal synapses
are implicated in motor learning and habit formation (Graybiel,
2005; Graybiel and Grafton, 2015; Smith et al., 2011). To acti-
vate specific glutamatergic inputs, we expressed ChR2 (AAV5-
ChR2-mCherry) in either the thalamus or the cortex of Tsc1fl/fl;
D1-tdTomatomice injectedwith AAV5-Cre-GFP into the striatum
(Figures 6A and 6D). We measured input-specific synaptic
responses in simultaneously recorded pairs of WT and Tsc1
KO dSPNs. In response to optical stimulation of thalamostriatal
terminals, we found no difference in the amplitude of subthresh-
old excitatory postsynaptic potentials (oEPSPs) between control
and Tsc1 KO dSPNs (Figures 6B and 6C). However, stimulation
of cortical terminals resulted in significantly greater oEPSP
amplitude in dSPN Tsc1 KO cells compared with WT, indicating
that corticostriatal drive was selectively enhanced in Tsc1 KO
dSPNs (Figures 6E and 6F).
To understand how stronger corticostriatal input could affect
dSPN activity, we measured cortically driven action potentials

Figure 5. Excitatory Synaptic Transmission Is Increased in Tsc1 KO
dSPNs
(A) Example traces of miniature excitatory postsynaptic currents (mEPSCs)
recorded from each cell type.
(B) Cumulative distribution of mEPSC amplitudes from neurons of each
genotype.
(C) Mean ± SEM mEPSC amplitude per neuron for each genotype.
(D) Cumulative distribution of mEPSC inter-event intervals (IEIs) from neurons
of each genotype.
(E) Mean ± SEM mEPSC frequency per neuron. *p < 0.05, one-way ANOVA
with Sidak’s post hoc test. For (B)–(E), n = 200 mEPSCs per neuron, dSPNWT
n = 14 neurons from 10mice, dSPN KO n = 14 neurons from 10mice, iSPNWT
n = 12 neurons from 8 mice, and iSPN KO n = 12 neurons from 8 mice.
(F) Examples of simultaneously recorded EPSCs from Tsc1WT and KOpairs of
dSPN and iSPNs evoked by intra-striatal electrical stimulation.
(G and H) Graphs displaying the EPSC amplitude recorded from pairs of Tsc1
WT and KO dSPNs (G; n = 22 pairs from 19 mice) and iSPNs (H; n = 11 pairs
from 6 mice). **p < 0.01, paired t test. Filled circles with error bars indicate the
group mean ± SEM.
(I) Example recordings of electrically evoked EPSCs from two stimuli delivered
50 ms apart.
(J and K) Mean ± SEM paired pulse ratio (PPR; defined as the amplitude of the
second EPSC peak divided by the first) in Tsc1 WT and KO dSPNs (J; n = 21
cells from 19 mice) and iSPNs (K; n = 9 cells from 6 mice). *p < 0.05, unpaired
t test.
For all panels, dots indicate the values of individual neurons. See Tables S2
and S4 for p values for statistical comparisons. See also Figure S2.
(oAPs) in simultaneously recorded pairs of dSPN WT and Tsc1
KO cells in the absence of synaptic blockers. To achieve robust
cortical ChR2 expression sufficient to drive SPN firing, we bred
Tsc1fl/fl;D1-tdTomatomice to mice expressing ChR2-YFP under
the Thy1 promoter (Thy1-ChR2-YFP) (Arenkiel et al., 2007).
Optical stimulation of corticostriatal terminals resulted in a signif-
icantly shorter latency to fire in Tsc1 KO dSPNs compared with
simultaneously recorded controls (Figures 6G–6I). We also
observed a trend toward decreased jitter in Tsc1 KO dSPNs
(Figure 6J). These results demonstrate that loss of Tsc1 from
dSPNs enhances corticostriatal transmission and alters their
firing properties in response to cortical stimulation.
DISCUSSION
In this study, we determined how activation of mTORC1
signaling affects striatal physiology by deleting the mTORC1
negative regulator Tsc1 from a subset of neurons in the dorsal
striatum. With this approach, we gained an understanding of
how TSC-mTORC1 signaling affects SPNmorphology and func-
tion in a cell autonomous manner, independent of major network
or developmental alterations. We found that the primary effect of
Tsc1 loss was an increase in dSPN excitability with minimal
effects on iSPNs. Both intrinsic and corticostriatal synaptic excit-
ability were enhanced by deletion of Tsc1 from dSPNs without
concurrent changes to synaptic inhibition or thalamostriatal
excitation. The net effect of these changes was decreased
latency of Tsc1 KO dSPNs to fire in response to cortical stimula-
tion. These findings demonstrate that loss of Tsc1 and constitu-
tive activation of mTORC1 signaling strongly affect the proper-
ties of direct pathway neurons such that cortical excitation is
facilitated, with relatively little impact on neurons comprising
the indirect pathway.
Cell Reports 23, 3197–3208, June 12, 2018 3203

Figure 6. Corticostriatal Synaptic Transmis-
sion Is Selectively Enhanced in Tsc1 KO
dSPNs
(A) AAV5-ChR2-mCherry was injected into the
thalamus of neonate Tsc1fl/fl;D1-tdTomato mice,
followed by injection of AAV5-Cre-GFP into the
dorsal striatum at P14–P16. Confocal image of a
sagittal section showing ChR2-mCherry expres-
sion in the thalamus (arrow). DAPI staining is in
blue.
(B) Examples of simultaneously recorded excit-
atory postsynaptic potentials (EPSPs) from a pair
of Tsc1 WT and KO dSPNs, evoked by blue light
stimulation of thalamostriatal terminals (blue line).
(C) Graph displaying thalamostriatal optogeneti-
cally evoked EPSP (oEPSP) amplitude recorded in
pairs of Tsc1 WT and KO dSPNs, n = 8 pairs of
neurons from five mice.
(D) AAV5-ChR2-mCherry was injected into the
cortex of neonate Tsc1fl/fl;D1-tdTomato mice, fol-
lowed by injection of AAV5-Cre-GFP into the dor-
sal striatum at P14–P16. Confocal image of a
sagittal section showing ChR2-mCherry expres-
sion in the cortex (arrow). DAPI staining is in blue.
(E) Examples of simultaneously recorded EPSPs
from a pair of Tsc1 WT and KO dSPNs, evoked by
blue light stimulation of corticostriatal terminals
(blue line).
(F) Graph displaying corticostriatal oEPSP ampli-
tude recorded in pairs of Tsc1 WT and KO dSPNs.
*p < 0.05, paired t test; n = 9 pairs of neurons from
eight mice.
(G) Tsc1fl/fl;D1-tdTomato;Thy1-ChR2-YFP mice
were injected with AAV5-Cre-GFP, and recordings
of light-evoked cortically driven action potentials
(oAPs) were made from simultaneous pairs of Tsc1
WT and KO dSPNs.
(H) Examples of corticostriatal oAPs recorded over
ten trials from a pair of Tsc1 WT and KO dSPNs.
Blue line indicates light onset.
(I) Graph displaying the average spike latency per
neuron for pairs of simultaneously recorded Tsc1
WT and KO dSPNs. Spike latency was defined as
the time in milliseconds from the onset of blue light stimulation to the action potential threshold. *p < 0.05, paired t test.
(J) Graph displaying the spike jitter per neuron for pairs of simultaneously recorded Tsc1WT and KO dSPNs. Jitter was defined as the SD of the latency to action
potential threshold for 4–11 stimulation trials per neuron. For (I) and (J), n = 9 pairs of neurons from nine mice.
For (C), (F), (I), and (J), dots indicate the values of individual neurons, and filled circles with error bars indicate the group mean ± SEM for paired recordings. See
Table S4 for p values for statistical comparisons.
An interesting aspect of our study is the observed increase in
dSPN, but not iSPN, intrinsic excitability due to postnatal loss of
Tsc1. The increased excitability of Tsc1 KO dSPNs contrasts
with the reduced excitability that has been observed in other
cell types with Tsc1 loss, including hippocampal CA1 neurons,
thalamic neurons, and Purkinje cells (Bateup et al., 2013;
Normand et al., 2013; Tsai et al., 2012). Compared with these
cell types, we observed a relatively modest increase in soma
size in Tsc1 KO SPNs (a 14% increase in SPNs versus a 41%
increase in CA1 neurons with Tsc1 loss; Bateup et al., 2011).
We also found that dendritic arborization was reduced in Tsc1
KO dSPNs. This decreased dendritic complexity likely has a
stronger impact on the cell’s passive membrane properties
than the small increase in soma size, leading to a net decrease
in membrane capacitance and increase in resistance. These
3204 Cell Reports 23, 3197–3208, June 12, 2018
changes in passive membrane properties, together with the
reduced Kir currents we observed, likely drive increased excit-
ability in Tsc1 KO dSPNs. The fact that Tsc1 KO iSPNs showed
a similar small increase in soma size as dSPNs but did not have
major changes in dendritic morphology or Kir currents further
indicates that these factors were responsible for the excitability
changes in Tsc1 KO dSPNs. Notably, loss of Tsc1 has been
shown to have cell-type-specific effects on the excitability of
hypothalamic neurons, whereby Pomc-expressing Tsc1 KO
neurons exhibit hypoexcitability but Agrp-expressing Tsc1 KO
neurons show no change in excitability (Yang et al., 2012).
Cell-type-specific changes in intrinsic excitability and den-
dritic morphology have been observed in SPNs in response to
a variety of disease-related insults. For example, intrinsic excit-
ability is increased and dendritic arborization is decreased in

dSPNs but not iSPNs in L-DOPA-induced dyskinesia, in which
mTOR signaling is hyperactive (Fieblinger et al., 2014; Santini
et al., 2009; Santini et al., 2012). Huntington’s disease mouse
models are associated with low mTOR signaling and display
altered potassium currents as well as iSPN-specific degenera-
tion (Lee et al., 2015; Mitchell et al., 1999; Tong et al., 2014).
The fact that phenotypes specific to either dSPNs or iSPNs are
seen across mTOR-associated diseases is likely due to molecu-
lar differences between the two SPN subtypes. Although dSPNs
and iSPNs are similar in many respects, they express distinct
profiles of receptors and signaling molecules (Heiman et al.,
2008), which will define their response to disease-related pertur-
bations. Because the mTOR pathway integrates a variety of
intra- and extracellular signals and shows extensive cross-talk
with other signaling pathways, the outcomes of its activation
are highly sensitive to the cellular context. Here we find no differ-
ences in the basal phosphorylation state of the mTORC1
pathway target S6 between dSPNs and iSPNs. In addition,
Tsc1 loss elevated p-S6 levels to a similar extent in dSPNs and
iSPNs. These observations suggest that the core components
of mTORC1 signaling are not different between dSPNs and
iSPNs but that the consequences of mTORC1 activation on
downstream pathways differs by cell type.
Changes in synaptic transmission are often, but not always
(Tsai et al., 2012), observed in response to loss of Tsc1 (Tavazoie
et al., 2005; Bateup et al., 2011, 2013; Weston et al., 2014). In
particular, a previous study showed that deletion of Tsc1 from
hippocampal CA1 neurons causes a loss of inhibitory synaptic
transmission resulting in increased excitatory/inhibitory synaptic
ratio (Bateup et al., 2013). Changes in E/I balance are hypothe-
sized to contribute to ASD pathophysiology (Rubenstein and
Merzenich, 2003), and a recent study showed cell-type-specific
alterations in excitatory/inhibitory (E/I) ratio in dSPNs resulting
from mutations in the ASD-risk gene Nlgn3 (Rothwell et al.,
2014). Here we found that synaptic E/I balance was also selec-
tively altered in dSPNs following Tsc1 deletion; however, this
was driven by an increase in excitatory synaptic drive without
a change in inhibition. The downstream consequences of
increased E/I ratio in dSPNs remain to be explored, but such a
change is likely to increase the efficacy of the direct pathway
to suppress basal ganglia output nuclei, thereby relieving their in-
hibition of downstreammotor centers (Kravitz et al., 2010; Rose-
berry et al., 2016). Notably, corticostriatal synaptic transmission
was selectively increased in Tsc1 KO dSPNs, while thalamostria-
tal transmission was unaltered. Similar increases in corticostria-
tal transmission have been observed in the Shank3B�/� mouse
model of autism and in the Sapap3�/� mouse model of obses-
sive-compulsive disorder (Peixoto et al., 2016; Wan et al.,
2014), suggesting that enhanced corticostriatal activity in the
dorsal striatum may be involved in the pathophysiology of multi-
ple psychiatric disorders.
We found that the enhanced corticostriatal transmission in
Tsc1 KO dSPNs was mediated by an increase in presynaptic
release probability. This is supported by our observation of
decreased paired-pulse ratio with no changes in mEPSC ampli-
tude or dendritic spine density, which would indicate alterations
in postsynaptic strength or synapse number, respectively.
Because Cre expression was limited to striatal neurons in our
model and the cortical inputs were WT for Tsc1, this suggests
a change in retrograde signaling from SPN dendrites to cortical
presynaptic terminals. Corticostriatal synapses are known to
undergo endocannabinoid-dependent long-term depression
(eCB-LTD), which is mediated by changes in presynaptic release
probability (Surmeier et al., 2009). It is possible that deregulated
mTORC1 signaling interferes with the production or release of
retrograde signaling molecules from dSPNs, a direction that
could be explored in future studies. Such a mechanism may
also explain the input specificity of the phenotype, as thalamos-
triatal synapses do not undergo substantial eCB-LTD (Wu et al.,
2015).
The relative timing of activation of the direct and indirect path-
ways is important for habit formation (O’Hare et al., 2016). For
example, shorter latency of dSPNs to fire relative to iSPNs in
response to cortical stimulation is correlated with preference to
use more habitual strategies when learning an operant task
(O’Hare et al., 2016). Interestingly, we found that Tsc1 deletion
caused dSPNs to fire with reduced latency in response to
cortical stimulation. Furthermore, there was a trend toward
decreased action potential jitter in Tsc1 KO dSPNs across mul-
tiple stimulation trials, which could have implications for spike
timing-dependent plasticity (Shen et al., 2008). These results
suggest that loss of Tsc1 and upregulation of mTORC1 in
SPNs enhances cortical activation of the direct pathway. Future
studies will determine if these cellular changes result in altered
striatal-associated behaviors, with the goal of understanding
how striatal dysfunction contributes to psychiatric disorders
such as ASD.
EXPERIMENTAL PROCEDURES
Mice
Animal experiments were performed in accordance with protocols approved
by the University of California, Berkeley, Animal Care and Use Committee.
Male and female mice were used for all experiments. Please see Supplemental
Experimental Procedures for a list of mouse lines used and a detailed descrip-
tion of the methods.
Stereotaxic Surgery
800nl of an AAV5 chicken b-actin promoter-driven Cre-mCherry or Cre-GFP
virus (Penn Vector Core) was unilaterally injected into the dorsolateral striatum
of postnatal day (P) 14–16 Tsc1fl/fl;D2-GFP or Tsc1fl/fl;D1-tdTomato mice,
respectively. Cre virus was diluted 20–30 times in sterile saline to achieve
sparse transduction. Mice were used for experiments 11–15 days after Cre
virus injection.
For the oIPSC experiments, Flp-dependent, Ef1a promoter-driven AAV5-
fDIO-ChR2-EYFP virus (Fenno et al., 2014) was injected unilaterally into the
dorsolateral striatum of P15–P17 Tsc1;D1-tdTomato;Pvalb-2A-FlpO-D mice,
followed by injection of AAV5-Cre-GFP at P34–P37. For oAP experiments,
Tsc1fl/fl;D1-tdTomato;Thy1-ChR2-YFP mice were injected with AAV5-Cre-
GFP into the dorsolateral striatum at P20–P27. For oEPSP experiments,
CAG promoter-driven AAV5-ChR2-mCherry was injected into either the cortex
or thalamus of neonatal mice. At P14–P16, AAV5-Cre-GFP virus was injected
into the dorsolateral striatum as described above. Injection coordinates are
listed in the Supplemental Experimental Procedures.
Immunohistochemistry
P25–P31micewere perfused transcardially. Brainswere post-fixed in 4%para-
formaldehyde overnight and sectioned at 30 mm. Sections were blocked for 1 hr
at room temperature (RT) in BlockAid (Thermo Fisher Scientific) and incubated
overnight at 4�C with antibodies against phosphorylated (Ser240/244) S6
Cell Reports 23, 3197–3208, June 12, 2018 3205

ribosomal protein (1:800; catalog no. 5364S, Cell Signaling Technology),
GFP (1:5,000; catalog no. ab13970, Abcam) and NeuN (1:800; catalog no.
MAB377, Millipore). Sections were washed and incubated for 1 hr at RT with
Alexa Fluor 633-, 488-, and 405-conjugated secondary antibodies (1:500; cata-
log nos. A-21070, A11039, and A-31553, Invitrogen). Sections were mounted
onto slides using ProLong Gold antifade reagent (Invitrogen).
Imaging and Analysis
Z stack images were taken on a confocal microscope (Olympus Fluoview
FV1000) with a 203 objective using the same exposure and acquisition
settings for each section. To quantify p-S6 levels and soma volume, regions
of interest (ROIs) were automatically generated in Imaris software based on
the NeuN or D2-GFP signal. The mean p-S6 fluorescence intensity per ROI
and average soma volume were calculated using Imaris.
Dendrite Morphology Reconstruction
For anatomical reconstruction, 4mg/mL neurobiotin was included in the internal
solution during whole-cell recordings. Slices were recovered and fixed in 4%
paraformaldehyde for 24–48 hr. After washes in PBS, slices were reacted with
1:750 streptavidin-Alexa Fluor 633 (Invitrogen) for 1 h. Sections were then
washed and coverslipped using ProLongGold antifade reagent. Dendrite arbor-
ization was quantified using 3D Sholl analysis in Imaris software. For dendritic
spine analysis, proximal (50 mm from soma) and distal (100 mm from soma) den-
drites were imaged on a Zeiss LSM 880 NLO AxioExaminer with Airyscan. Den-
dritesandspineswere reconstructed in threedimensionsandanalyzed in Imaris.
Electrophysiology
Mice were perfused transcardially with ice-cold ACSF (pH 7.4) containing
127 mM NaCl, 25 mM NaHCO3, 1.25 mM NaH2PO4, 2.5 mM KCl, 1 mM
MgCl2, 2 mM CaCl2, and 25 mM glucose. Brains were rapidly removed, and
coronal slices (275 mm) were cut on a VT1000S vibrotome (Leica) in oxygen-
ated ice-cold choline-based external solution (pH 7.8) containing 110 mM
choline chloride, 25 mM NaHCO3, 1.25 mM NaHPO4, 2.5 mM KCl, 7 mM
MgCl2, 0.5 mM CaCl2, 25 mM glucose, 11.6 mM sodium ascorbate, and
3.1 mM sodium pyruvate. Slices were recovered in ACSF at 34�C for 15 min
and then kept at RT. Recordings were made with a MultiClamp 700B amplifier
(Molecular Devices) at RT using 3–5 MU glass patch electrodes. Current-
clamp recordings were made using a potassium-based internal solution (pH
7.4) containing 135 mM KMeSO4, 5 mM KCl, 5 mM HEPES, 4 mM Mg-ATP,
0.3 mM Na-GTP, 10 mM phosphocreatine, and 1 mM EGTA. Voltage-clamp
recordings were made using a cesium-based internal solution (pH 7.4) con-
taining 120 mM CsMeSO4, 15 mM CsCl, 10 mM TEA-Cl, 8 mM NaCl, 10 mM
HEPES, 0.2–5 mM EGTA, 5 mM QX-314, 4 mM Mg-ATP, and 0.3 mM
Na-GTP. For eIPSC experiments, recordings were made using a high chloride
cesium-based internal solution (pH 7.2) to maximize IPSC amplitude, contain-
ing 125 mM CsCl, 10 mM TEA-Cl, 10 mM HEPES, 4 mM Mg-ATP, 0.3 mM
Na-GTP, 8 mM Na2CrePO4, 0.1 mM EGTA, and 3.3 mM QX-314. For experi-
ments measuring synaptic currents, cells were held at�80mV, and recordings
were acquired with the amplifier’s Bessel filter set at 3 kHz.
Statistical Analyses
Two-tailed paired or unpaired t tests were used for comparisons between two
groups. A one-way ANOVA with Sidak’s post hoc test was used to compare
the means of three or more groups. A two-way ANOVA with Sidak’s post
hoc test was used to compare mean differences between groups for experi-
ments with two independent variables. p values were corrected for multiple
comparisons. For data that did not pass the D’Agostino and Pearson normality
test, the Kruskal-Wallis with Dunn’s post hoc test was used. Cumulative distri-
butions were analyzed using the K-S test. Values for all statistical comparisons
are provided in Tables S1–S4.
SUPPLEMENTAL INFORMATION
Supplemental Information includes Supplemental Experimental Procedures,
two figures, and four tables and can be found with this article online at
https://doi.org/10.1016/j.celrep.2018.05.037.
3206 Cell Reports 23, 3197–3208, June 12, 2018
ACKNOWLEDGMENTS
We thank the members of the Bateup lab for their feedback on this work. This
project was supported by Simons Foundation Autism Research Initiative
(SFARI) Pilot Award 307866 and National Institute of Mental Health (NIMH)
grant R56MH111821. H.S.B. is supported by a fellowship from the Alfred
P. Sloan Foundation (FR-2015-65790). K.N.B. is supported by the National
Science Foundation Graduate Research Fellowship under grant DGE
1106400.
AUTHOR CONTRIBUTIONS
Conceptualization, H.S.B.; Methodology, K.N.B. and S.L.O.; Formal Analysis,
K.N.B. and S.L.O.; Investigation, K.N.B. and S.L.O.; Writing – Original Draft,
K.N.B.; Writing – Review & Editing, K.N.B. and H.S.B.; Visualization, K.N.B.
and H.S.B.; Supervision, K.N.B. and H.S.B.; Funding Acquisition, H.S.B.
DECLARATION OF INTERESTS
The authors declare no competing interests.
Received: December 21, 2017
Revised: March 29, 2018
Accepted: May 12, 2018
Published: June 12, 2018
REFERENCES
Arenkiel, B.R., Peca, J., Davison, I.G., Feliciano, C., Deisseroth, K., Augustine,
G.J., Ehlers, M.D., and Feng, G. (2007). In vivo light-induced activation of neu-
ral circuitry in transgenic mice expressing channelrhodopsin-2. Neuron 54,
205–218.
Bateup, H.S., Santini, E., Shen, W., Birnbaum, S., Valjent, E., Surmeier, D.J.,
Fisone, G., Nestler, E.J., and Greengard, P. (2010). Distinct subclasses of me-
dium spiny neurons differentially regulate striatal motor behaviors. Proc. Natl.
Acad. Sci. U S A 107, 14845–14850.
Bateup, H.S., Takasaki, K.T., Saulnier, J.L., Denefrio, C.L., and Sabatini, B.L.
(2011). Loss of Tsc1 in vivo impairs hippocampal mGluR-LTD and increases
excitatory synaptic function. J. Neurosci. 31, 8862–8869.
Bateup, H.S., Johnson, C.A., Denefrio, C.L., Saulnier, J.L., Kornacker, K., and
Sabatini, B.L. (2013). Excitatory/inhibitory synaptic imbalance leads to hippo-
campal hyperexcitability in mouse models of tuberous sclerosis. Neuron 78,
510–522.
Cazorla, M., Shegda, M., Ramesh, B., Harrison, N.L., and Kellendonk, C.
(2012). Striatal D2 receptors regulate dendritic morphology of medium spiny
neurons via Kir2 channels. J. Neurosci. 32, 2398–2409.
Costa-Mattioli, M., and Monteggia, L.M. (2013). mTOR complexes in neurode-
velopmental and neuropsychiatric disorders. Nat. Neurosci. 16, 1537–1543.
Crino, P.B. (2013). Evolving neurobiology of tuberous sclerosis complex. Acta
Neuropathol. 125, 317–332.
Crino, P.B., Nathanson, K.L., and Henske, E.P. (2006). The tuberous sclerosis
complex. N. Engl. J. Med. 355, 1345–1356.
Curatolo, P., Napolioni, V., andMoavero, R. (2010). Autism spectrumdisorders
in tuberous sclerosis: pathogenetic pathways and implications for treatment.
J. Child Neurol. 25, 873–880.
Curatolo, P., Moavero, R., and de Vries, P.J. (2015). Neurological and neuro-
psychiatric aspects of tuberous sclerosis complex. Lancet Neurol. 14,
733–745.
Davis, P.E., Peters, J.M., Krueger, D.A., and Sahin, M. (2015). Tuberous scle-
rosis: a new frontier in targeted treatment of autism. Neurotherapeutics 12,
572–583.
Ehninger, D., Han, S., Shilyansky, C., Zhou, Y., Li, W., Kwiatkowski, D.J., Ra-
mesh, V., and Silva, A.J. (2008). Reversal of learning deficits in a Tsc2+/-
mouse model of tuberous sclerosis. Nat. Med. 14, 843–848.

Fenno, L.E., Mattis, J., Ramakrishnan, C., Hyun, M., Lee, S.Y., He, M., Tucciar-
one, J., Selimbeyoglu, A., Berndt, A., Grosenick, L., et al. (2014). Targeting
cells with single vectors using multiple-feature Boolean logic. Nat. Methods
11, 763–772.
Fieblinger, T., Graves, S.M., Sebel, L.E., Alcacer, C., Plotkin, J.L., Gertler, T.S.,
Chan, C.S., Heiman, M., Greengard, P., Cenci, M.A., and Surmeier, D.J.
(2014). Cell type-specific plasticity of striatal projection neurons in parkin-
sonism and L-DOPA-induced dyskinesia. Nat. Commun. 5, 5316.
Fuccillo, M.V. (2016). Striatal circuits as a common node for autism pathophys-
iology. Front. Neurosci. 10, 27.
Gerfen, C.R., and Surmeier, D.J. (2011). Modulation of striatal projection sys-
tems by dopamine. Annu. Rev. Neurosci. 34, 441–466.
Gertler, T.S., Chan, C.S., and Surmeier, D.J. (2008). Dichotomous anatomical
properties of adult striatal medium spiny neurons. J. Neurosci. 28, 10814–
10824.
Gittis, A.H., and Kreitzer, A.C. (2012). Striatal microcircuitry and movement
disorders. Trends Neurosci. 35, 557–564.
Graybiel, A.M. (2005). The basal ganglia: learning new tricks and loving it. Curr.
Opin. Neurobiol. 15, 638–644.
Graybiel, A.M., and Grafton, S.T. (2015). The striatum: where skills and habits
meet. Cold Spring Harb. Perspect. Biol. 7, a021691.
Gunaydin, L.A., and Kreitzer, A.C. (2016). Cortico-basal ganglia circuit function
in psychiatric disease. Annu. Rev. Physiol. 78, 327–350.
Heiman, M., Schaefer, A., Gong, S., Peterson, J.D., Day, M., Ramsey, K.E.,
Suarez-Farinas, M., Schwarz, C., Stephan, D.A., Surmeier, D.J., et al. (2008).
A translational profiling approach for the molecular characterization of CNS
cell types. Cell 135, 738–748.
Hoeffer, C.A., and Klann, E. (2010). mTOR signaling: at the crossroads of plas-
ticity, memory and disease. Trends Neurosci. 33, 67–75.
Huber, K.M., Klann, E., Costa-Mattioli, M., and Zukin, R.S. (2015). Dysregula-
tion of mammalian target of rapamycin signaling in mouse models of autism.
J. Neurosci. 35, 13836–13842.
Klaus, A., Martins, G.J., Paixao, V.B., Zhou, P., Paninski, L., and Costa, R.M.
(2017). The spatiotemporal organization of the striatum encodes action space.
Neuron 95, 1171–1180.e7.
Koos, T., and Tepper, J.M. (1999). Inhibitory control of neostriatal projection
neurons by GABAergic interneurons. Nat. Neurosci. 2, 467–472.
Kravitz, A.V., Freeze, B.S., Parker, P.R., Kay, K., Thwin, M.T., Deisseroth, K.,
and Kreitzer, A.C. (2010). Regulation of parkinsonian motor behaviours by
optogenetic control of basal ganglia circuitry. Nature 466, 622–626.
Kreitzer, A.C. (2009). Physiology and pharmacology of striatal neurons. Annu.
Rev. Neurosci. 32, 127–147.
Kreitzer, A.C., and Malenka, R.C. (2008). Striatal plasticity and basal ganglia
circuit function. Neuron 60, 543–554.
Lee, J.H., Tecedor, L., Chen, Y.H., Monteys, A.M., Sowada, M.J., Thompson,
L.M., and Davidson, B.L. (2015). Reinstating aberrant mTORC1 activity in Hun-
tington’s disease mice improves disease phenotypes. Neuron 85, 303–315.
Lipton, J.O., and Sahin, M. (2014). The neurology of mTOR. Neuron 84,
275–291.
Madisen, L., Zwingman, T.A., Sunkin, S.M., Oh, S.W., Zariwala, H.A., Gu, H.,
Ng, L.L., Palmiter, R.D., Hawrylycz, M.J., Jones, A.R., et al. (2010). A robust
and high-throughput Cre reporting and characterization system for the whole
mouse brain. Nat. Neurosci. 13, 133–140.
Meikle, L., Talos, D.M., Onda, H., Pollizzi, K., Rotenberg, A., Sahin, M., Jensen,
F.E., and Kwiatkowski, D.J. (2007). A mouse model of tuberous sclerosis:
neuronal loss of Tsc1 causes dysplastic and ectopic neurons, reduced myeli-
nation, seizure activity, and limited survival. J. Neurosci. 27, 5546–5558.
Mink, J.W. (2003). The basal ganglia and involuntary movements: impaired
inhibition of competing motor patterns. Arch. Neurol. 60, 1365–1368.
Mitchell, I.J., Cooper, A.J., and Griffiths, M.R. (1999). The selective vulnera-
bility of striatopallidal neurons. Prog. Neurobiol. 59, 691–719.
Normand, E.A., Crandall, S.R., Thorn, C.A.,Murphy, E.M., Voelcker, B., Brown-
ing, C., Machan, J.T., Moore, C.I., Connors, B.W., and Zervas, M. (2013).
Temporal and mosaic Tsc1 deletion in the developing thalamus disrupts thala-
mocortical circuitry, neural function, and behavior. Neuron 78, 895–909.
O’Hare, J.K., Ade, K.K., Sukharnikova, T., Van Hooser, S.D., Palmeri, M.L., Yin,
H.H., and Calakos, N. (2016). Pathway-specific striatal substrates for habitual
behavior. Neuron 89, 472–479.
Peixoto, R.T., Wang, W., Croney, D.M., Kozorovitskiy, Y., and Sabatini, B.L.
(2016). Early hyperactivity and precocious maturation of corticostriatal circuits
in Shank3B(-/-) mice. Nat. Neurosci. 19, 716–724.
Roseberry, T.K., Lee, A.M., Lalive, A.L., Wilbrecht, L., Bonci, A., and Kreitzer,
A.C. (2016). Cell-type-specific control of brainstem locomotor circuits by basal
ganglia. Cell 164, 526–537.
Rothwell, P.E., Fuccillo, M.V., Maxeiner, S., Hayton, S.J., Gokce, O., Lim, B.K.,
Fowler, S.C., Malenka, R.C., and S€udhof, T.C. (2014). Autism-associated
neuroligin-3 mutations commonly impair striatal circuits to boost repetitive
behaviors. Cell 158, 198–212.
Rubenstein, J.L., andMerzenich, M.M. (2003). Model of autism: increased ratio
of excitation/inhibition in key neural systems. Genes Brain Behav. 2, 255–267.
Santini, E., Heiman, M., Greengard, P., Valjent, E., and Fisone, G. (2009). Inhi-
bition of mTOR signaling in Parkinson’s disease prevents L-DOPA–induced
dyskinesia. Neuroscience 2, 1–11.
Santini, E., Feyder, M., Gangarossa, G., Bateup, H.S., Greengard, P., and Fi-
sone, G. (2012). Dopamine- and cAMP-regulated phosphoprotein of 32-kDa
(DARPP-32)-dependent activation of extracellular signal-regulated kinase
(ERK) and mammalian target of rapamycin complex 1 (mTORC1) signaling in
experimental parkinsonism. J. Biol. Chem. 287, 27806–27812.
Saxton, R.A., and Sabatini, D.M. (2017). mTOR signaling in growth, meta-
bolism, and disease. Cell 168, 960–976.
Shen, W., Tian, X., Day, M., Ulrich, S., Tkatch, T., Nathanson, N.M., and Sur-
meier, D.J. (2007). Cholinergicmodulation of Kir2 channels selectively elevates
dendritic excitability in striatopallidal neurons. Nat. Neurosci. 10, 1458–1466.
Shen, W., Flajolet, M., Greengard, P., and Surmeier, D.J. (2008). Dichotomous
dopaminergic control of striatal synaptic plasticity. Science 321, 848–851.
Smith, Y., Bevan, M.D., Shink, E., and Bolam, J.P. (1998). Microcircuitry of the
direct and indirect pathways of the basal ganglia. Neuroscience 86, 353–387.
Smith, Y., Surmeier, D.J., Redgrave, P., and Kimura, M. (2011). Thalamic con-
tributions to Basal Ganglia-related behavioral switching and reinforcement.
J. Neurosci. 31, 16102–16106.
Subramanian, M., Timmerman, C.K., Schwartz, J.L., Pham, D.L., and Meffert,
M.K. (2015). Characterizing autism spectrum disorders by key biochemical
pathways. Front. Neurosci. 9, 313.
Surmeier, D.J., Plotkin, J., and Shen, W. (2009). Dopamine and synaptic plas-
ticity in dorsal striatal circuits controlling action selection. Curr. Opin. Neuro-
biol. 19, 621–628.
Tavazoie, S.F., Alvarez, V.A., Ridenour, D.A., Kwiatkowski, D.J., and Sabatini,
B.L. (2005). Regulation of neuronal morphology and function by the tumor sup-
pressors Tsc1 and Tsc2. Nat. Neurosci. 8, 1727–1734.
Tepper, J.M., Tecuapetla, F., Koos, T., and Ibanez-Sandoval, O. (2010). Het-
erogeneity and diversity of striatal GABAergic interneurons. Front. Neuroanat.
4, 150.
Tong, X., Ao, Y., Faas, G.C., Nwaobi, S.E., Xu, J., Haustein, M.D., Anderson,
M.A., Mody, I., Olsen,M.L., Sofroniew,M.V., and Khakh, B.S. (2014). Astrocyte
Kir4.1 ion channel deficits contribute to neuronal dysfunction in Huntington’s
disease model mice. Nat. Neurosci. 17, 694–703.
Tsai, P.T., Hull, C., Chu, Y., Greene-Colozzi, E., Sadowski, A.R., Leech, J.M.,
Steinberg, J., Crawley, J.N., Regehr, W.G., and Sahin, M. (2012). Autistic-like
behaviour and cerebellar dysfunction in Purkinje cell Tsc1mutant mice. Nature
488, 647–651.
Wan, Y., Ade, K.K., Caffall, Z., IlcimOzlu,M., Eroglu, C., Feng, G., andCalakos,
N. (2014). Circuit-selective striatal synaptic dysfunction in the Sapap3
knockout mouse model of obsessive-compulsive disorder. Biol. Psychiatry
75, 623–630.
Cell Reports 23, 3197–3208, June 12, 2018 3207

Weston, M.C., Chen, H., and Swann, J.W. (2014). Loss of mTOR repressors
Tsc1 or Pten has divergent effects on excitatory and inhibitory synaptic trans-
mission in single hippocampal neuron cultures. Front. Mol. Neurosci. 7, 1.
Wilson, C.J., and Kawaguchi, Y. (1996). The origins of two-state spontaneous
membrane potential fluctuations of neostriatal spiny neurons. J. Neurosci. 16,
2397–2410.
3208 Cell Reports 23, 3197–3208, June 12, 2018
Wu, Y.W., Kim, J.I., Tawfik, V.L., Lalchandani, R.R., Scherrer, G., and Ding,
J.B. (2015). Input- and cell-type-specific endocannabinoid-dependent LTD
in the striatum. Cell Rep. 10, 75–87.
Yang, S.B., Tien, A.C., Boddupalli, G., Xu, A.W., Jan, Y.N., and Jan, L.Y. (2012).
Rapamycin ameliorates age-dependent obesity associated with increased
mTOR signaling in hypothalamic POMC neurons. Neuron 75, 425–436.