CORRELATIONS BETWEEN ELECTROCHEMICAL ACTIVITY AND ... · Correlations Between Electrochemical...
21
Instructions for use Title CORRELATIONS BETWEEN ELECTROCHEMICAL ACTIVITY AND HETEROGENEOUS CATALYSIS FOR HYDROGEN DISSOCIATION ON PLATINUM Author(s) ROSS, P. N.; STONEHART, P. Citation JOURNAL OF THE RESEARCH INSTITUTE FOR CATALYSIS HOKKAIDO UNIVERSITY, 22(1), 22-41 Issue Date 1975-02 Doc URL http://hdl.handle.net/2115/24964 Type bulletin (article) File Information 22(1)_P22-41.pdf Hokkaido University Collection of Scholarly and Academic Papers : HUSCAP
Transcript of CORRELATIONS BETWEEN ELECTROCHEMICAL ACTIVITY AND ... · Correlations Between Electrochemical...

Instructions for use
Title CORRELATIONS BETWEEN ELECTROCHEMICAL ACTIVITY AND HETEROGENEOUS CATALYSIS FORHYDROGEN DISSOCIATION ON PLATINUM
Author(s) ROSS, P. N.; STONEHART, P.
Citation JOURNAL OF THE RESEARCH INSTITUTE FOR CATALYSIS HOKKAIDO UNIVERSITY, 22(1), 22-41
Issue Date 1975-02
Doc URL http://hdl.handle.net/2115/24964
Type bulletin (article)
File Information 22(1)_P22-41.pdf
Hokkaido University Collection of Scholarly and Academic Papers : HUSCAP

J. Res. Inst. Catalysis, Hokkaido Univ., Vol. 22 No.1, pp. 22 to 41 (1974)
CORRELATIONS BETWEEN ELECTROCHEMICAL ACTIVITY AND
HETEROGENEOUS CATALYSIS FOR HYDROGEN DISSOCIATION ON PLATINUM
By
P. N. Ross* and P. STONEHART*
(Received May 15, 1974)
Abstract
Hydrogen-deuterium exchange rates on platinum surfaces have been compared to
equivalent hydrogen molecule and adsorbed hydrogen atom electrochemical oxidation rates
on the same surfaces. Over a temperature range of 293 to 3600 K the first order rate con
stants for Hz-Dz exchange and hydrogen molecule electrochemical oxidation are the same,
showing that the adsorption-dissociation reaction (T AFEL,BoNHOEFFER-F ARKAS) is rate
controlling. The rate of oxidation of the adsorbed hydrogen atom reaction involving
electron transfer (VOLMER) is an order of magnitude larger.
The hydrogen evolution reaction has been the subject of numerous mechanistic investigations which has resulted in the determination of reasonably accepted mechanisms for a number of substrates. All the acceptable reaction paths have one reaction step in common which, in acid electrolyte, is the electronation of hydrogen ions to form neutral hydrogen species adsorbed on the electrode surface.
M+H++e - <===t MH
This charge transfer step was originally discussed by ERDEy-GRUZ and VOLMER!), and subsequently has been referred to as the Volmer reaction. Two different reaction paths for hydrogen evolution may be distinguished. These two paths differ in the manner in which the adsorbed hydrogen atoms are desorbed from the surface to form molecular hydrogen. T AFEL2
)
suggested a desorption step which did not involve charge transfer,
2MH .---. Hz + 2M
* Materials Engineering and Research Laboratory, Pratt & Whitney Aircraft, Middletown, Connecticut 06457 U. S. A.
22

Correlations Between Electrochemical Activity and Heterogeneous Catalysis
which is a purely chemical step and often referred to as catalytic recombination or TAFEL recombination. It is termed in this work as the TAFEL reaction. A second possible desorption step is desorption accompanied by charge transfer.
MH+H++e- == H2+M
The latter reaction is attributed by VETTER3) to HEYROVSKI4
) and is usually referred to as the Heyrovski reaction. For any given electrode material, the reaction path for hydrogen evolution could be either of the two pairs of sequential steps, VOLMER-TAFEL or VOLMER-HEYROVSKI, and anyone of the three individual steps could be the rate-determining step. BOCKRIS5
)
has catalogued the probable reaction paths and rate-determining steps for hydrogen evolution from a number of electrode materials in acid electrolyte. In the particular case of Pt electrocatalysts in acid electrolyte, the VOLMER-TAFEL sequence is most probable.
The electrochemical oxidation of molecular hydrogen historically has received less attention and the mechanism for this reaction is not necessarily identical to the mechanism for hydrogen evolution. Hydrogen evolution is observed at potentials where (at room temperature) for most transition metals the electrode surface contains at least a monolayer of adsorbed hydrogen6
). Hydrogen oxidation occurs at more positive potentials, where the hydrogen coverage is generally less than a monolayer for these metals7
).
Since one would expect the coverage of the electrode surface by adsorbed hydrogen to play a critical role in either of these hydrogen reactions, it is quite clear that the mechanism may change in going from cathodic to anodic potential regions. Of all possible mechanisms, the T AFEL-VOLMER and HEYROVSKI-VOLMER sequences are again most probable. A non-dissociative adsorption of hydrogen to form a hydrogen molecule-ion intermediate was proposed by HORIUTI8
) as the rate determining step for some substrates. The Horiuti mechanism can be represented as
H2 + M == H2M == HiM + e
HiM==MH+H+
BAGOTZKY et. al.9) recently proposed a mechanism similar to the HORIUTI
mechanism for hydrogen oxidation on Pt in acid electrolytes. There are a number of possible variations of the steps in the HORIUTI mechanism, all of them having the same essential feature that the hydrogen molecule adsorption step is not accompanied by hydrogen dissociation and requires only a single isolated site for the reaction. In the HEYROVSKI-VOLMER
23

24
P. N. Ross and P. STONEHART
sequence, hydrogen adsorption is dissociative but requires only a single site. Only the TAFEL-VOLMER sequence requires dual-sites, which are nearest neighbor sites for hydrogen dissociation. The principal question, therefore, is to determine whether an electron transfer step, a molecular adsorption step, or an adsorption-dissociation step is rate limiting. This differentiation is essential for an analysis of the operation of electrochemical fuel cell anode catalysts.
The rate of oxidation of adsorbed hydrogen atoms (VOLMER reaction) on platinum has been measured previouslylO) and found to be at least an order of magnitude greater than the electrochemical rate of hydrogen molecule oxidationll
). Although these results eliminate the VOLMER reaction as the rate limiting step, they do not provide a differentiation between the TAFEL-VOLMER, HEYROVSKI-VOLMER or HORIUTI mechanisms. Such a differentiation could be provided by separately measuring the rates of either the TAFEL or HEYOVSKI reaction for the Pt surface. In gas phase heterogeneous catalysis, the TAFEL reaction corresponds to the dissociative chemisorption of hydrogen molecules on the metal surface and is usually the first step in hydrogen reactions on transition metals (T> 2000K). Recent studies12
,13) of hydrogen-deuterium exchange reactions over platinum have shown that for T>200oK, both the equilibration and heterogeneous exchange reaction follow the Bonhoeffer-Farkas mechanism,
In the temperature region between 300-500oK, the rate of surface diffusion is very rapid and the rate limiting step is indicated to be the dissociative chemisorption of hydrogen and deuterium, rather than the exchange in the atomically held layer. It is, therefore, possible to measure the rate of gas phase hydrogen dissociative chemisorption on platinum in the temperature region of interest for electrochemical kinetics but in the absence of an electron transfer step. With the hydrogen dissociation step rate determining, the rate of hydrogen-deuterium exchange will be given by
( 1 )
where () is the coverage of the metal surface by adsorbed hydrogen and deuterium at the conditions of exchange (total pressure, temperature), kHD
is the hydrogen (or deuterium) dissociation rate constant, and kr is the hydrogen (or deuterium) desorption rate constant. If for the electrochemical oxidation of hydrogen the TAFEL-VOLMER sequence is correct, then with the hydrogen dissociation step rate determining the anodic current density

Cprrelations Between Electrochemical Activity and Heterogeneous Catalysis
will be given by
iA = nFkatCn,(1-0)2-nFkcll ( 2 )
where 0 is the coverage of the metal surface by adsorbed hydrogen, kat and ket are the anodic and cathodic rate constants, respectively. Comparison of (1) and (2) indicates that the forms of the expressions are identical, di.ffering only by the conversion from chemical units, moleJcm2
, to electrochemical units, ampJcm2
• Therefore, the gas-phase rate constant kHD and the electrochemical rate constant kat refer to the same elementary step, the dissociation of molecular hydrogen by the transition metal surface but differ in the nature of the chemical environments of the hydrogen moleculemetal surface systems. The absolute magnitudes of kHD and kat mayor may not be the same, depending on the degree to which either a) the molecules in the electrolyte, or b) the electric field gradient at the electrolyte-metal interface alter the shape of the potential energy surface along the H 2-metal reaction coordinates or the nature of the H 2-metal transition state. This complication, however, does not affect the conclusion that can be drawn from a positive correlation of the hydrogen-deuterium exchange rate constant with the electrochemical hydrogen oxidation rate constant. A positive correlation is possible only if the T AFEL-VOLMER sequence is the operating mechanism and only if the electrolyte and electrified interface do not affect the absolute rate of hydrogen dissociation. This paper presents the results of studies of H 2·-D2 exchange and electrochemical hydrogen oxidations on platinum, showing a correlation between the rate of H2-D2 exchange and electrochemical hydrogen oxidation rate parameters at equivalent temperatures and hydrogen concentrations, providing a resolution of the mechanism for the electrochemical oxidation of hydrogen on platinum.
THEORY OF CYCLIC VOLTAMMETRY
Cyclic triangular wave voltammetry provides a direct measure of electrode reversibility because the potential at which oxidation and reduction occur are observed directly. At sufficiently low potentiodynamic scan rates a condition of quasi-equilibrium is maintained at the electrode surface. Under these conditions the separation of anodic and cathodic current peaks potentials is about 59Jn m V, where n is the total electron transfer for the reaction, the reaction is reversible and under total diffusional control. When the potentiodynamic scan rate is increased, a point is reached at which the kinetics of electron transfer become comparable to the rate of potential change and the separation of the oxidation and reduction current peaks
25

26
P. N. Ross and P. STONEHART
becomes greater than 59/n m V. NICHOLSON14) has shown that the standard
(chemical) rate constant is in general a calculable function of the frequency at which the current peaks separation is greater than 59/n m V. For the reversible hydrogen reaction on platinum in acid, it is not possible to measure both an oxidation and reduction peak due to the inequality of the reactant and product concentrations CH+» CH • Since, therefore, it may , be assumed that under kinetic interference both the oxidation and reduction peaks will shift symmetrically about a mid-point when the transfer coefncient is 0.5, measurements obtained on the oxidation peak potential of dissolved hydrogen as a function of the potentiodynamic scan rate will suffice. From potentiodynamic i/e traces for the oxidation of dissolved hydrogen, a peak shift from the quasi-equilibrium peak potential can be measured experimentally as a function of sweep rate from which the kinetic rate constant can be calculated.
NICHOLSON14) has developed the theory of cyclic voltammetry for elec
tron transfer reactions described by the electrochemical absolute rate equation. In NICHOLSON's derivation, the current-potential relation at a plane electrode for the reaction
k. 2H++2e- ~H2
IS i = nFk. exp [-2aF(e-E)/RT] [(CHo+)-(CH~)exp[2F(e-E)/RTJ] ( 3 )
where e is the electrode potential, E the standard potential, k. is the standard (chemical) rate constant at e = E, a is the (cathodic) transfer coefficient and CI~+ and CH~ are the hydrogen ion and hydrogen molecule concentrations at the electrode surface, respectively. This expression was used to derive a relation between the separation in the anodic and cathodic potentiodynamic current peak potentials JEp and a kinetic parameter containing the rate constant, k., and the potentiodynamic sweep rate. This relation is valid for a= 1/2 and for the experimental condition where H2 (or in general, the reduced species) is absent initially in the electrolyte. NICHOLSON'S theory can be applied directly to the hydrogen reaction at a Pt electrode only in approximate sense. The pre-exponential terms in Equation (3) measure the rates of the anodic and cathodic partial currents at the standard potential and the exponential terms describe the retarding or accelerating effect of the potential on the partial reactions. This will be true only if k. is independent of potential. For a Pt electrode at e~0.2 V (nhe) this will generally not be true, since hydrogen adsorption will affect the rate

Correlations Between Electrochemical Activity and Heterogeneous Catalysis
of the hydrogen reaction. NICHOLSON'S theory has, therefore, been modified to account for the changing surface condition during the potential sweep.
The correct current-potential relation for the hydrogen reaction at a plane electrode is
i=io[l- g:~ eXP[2F(e-E)/RT]] ( 4 )
where io is the exchange current density for the hydrogen oxidation reaction, CH, and CH~ are the hydrogen concentrations at the electrode surface and in the bulk of the electrolyte, respectively. This expression is derived in detail elsewhere15J, and is valid for a number of different mechanisms when the electrode potential, e, is close to the equilibrium potential, E, as IS the case experimentally.
For diffusion to a plane electrode we have
D i?Cn , _ acH , ( 5 ) ------ax2 at
t=o, x~o Cn , = CH~ ( 6 )
t>O, x--oo CH, --CH~ (7)
t>o, X=O
and e-E=vt, v=.de/dt, for an anodic potentiodynamic scan. This system of partial differential equation may be converted into a
single linear Volterra integral equation by using Laplace transfoms. The rasult is
where
X(y)e-Y = l-e-Y- [Y X(z)dz ¢ Jo ~ y-z
X(y) = ( D~~~ )/CH~hraD ¢ = io/(2FCH~~ 7raD) = ks/ ~ 7raD
2F y=--vt=at RT
( 9 )
The integral equation was solved numerically to generate potentiodynamic curves of X(y), vs. y from which the potentials at the current peak
27
28
10
20
30
40
P. N. Ross and P. STONEHART
5.-----------------------------------------,
lj! = 100
0.100
ELECTRODE POTENTIAL, V
Fig. 1. Computer generated potentiodynamic scanning curves for the hydrogen molecule oxidation current showing the shift in the anodic current peak potential with increasing scan rates <p = ks;./ 7r aD.
-2 -1 o
LOG '" Fig. 2. Working curve for calculating hydrogen molecule oxidation
rate constants from the shift (JEp) in the anodic current peak potential from the quasi-equilibrium peak potential.
2

Correlations Between Electrochemical .1ctivity and Heterogeneous Catalysis
maxima could be selected. Examples of computer generated anodic potential sweep curves are shown in Figure 1 for different values of the kinetic parameter ¢. The reversible, quasi-equilibrium, hydrogen molecule oxidation current peak for a potential scan starting at zero potential (nhe) occurs at 10.67 m V (nhe). An increase in sweep rate from this reversible condition by a factor of 500 results in a shift in current peak potential of 16.83 m V from the reversible peak potential with a broadening of the peak shape. In general, as the sweep rate increases, the hydrogen molecule oxidation current peak potential shifts to higher potential, the peak shape broadens,
and the peak maximum, which is proportional to ip/-J v, where ip is the maximum in the oxidation current, drops slightly. A new working curve of LlEp versus ¢ for the application of cyclic voltammetry to hydrogen molecule oxidation is shown in Figure 2. This working curve may be used to calculate a first-order reaction rate constant k.=(io/2FCH~)' the corresponding first-order reaction rate, k. C H " and the exchange current density, 2F k. CH~' for hydrogen molecule oxidation.
EXPERIMENTAL DETAILS
Electrochemical Hydrogen Molecule Oxidation Kinetics
A conventional three chamber gas tight cell was used with extensive purification of the electrolyte. The test electrode consisted of a small platinum disc sheathed with PTFE. Purified nitrogen was passed through the cell, after which the electrolyte was saturated with hydrogen by the passage of hydrogen through the cell. For experiments above ambient temperature, the entire cell was placed in an oven with temperature control of ±1°K. A WENKING potentiostat programmed by a WAVETEK Model 112 signal generator was used for potentiodynamic scanning and the i- V curves recorded by a TEKTRONIX 561A oscilloscope with camera attachment. Both continuous cycling between 0 V (nhe) and 1.25 V (nhe), and single sweep scans from 0 V (nhe) were used. The internal resistance between the test electrode and the reference probe was measured by a current interrupter technique because at high potentiodynamic scan rates a significant error in the current peak potential shift can be introduced.
Hydrogen-Deuterium Exchange
The apparatus for measuring Hz-D! exchange rates is depicted in Figure 3. The reactor, gas mixing and sampling system were constructed entirely from Pyrex. The Hz, Dz and HD concentrations were measured with a CEC mass-spectrometer, Model 21-614. A cylindrical Pyrex tube reactor
29

30
P. N. Ross and P. STONE HART
__ ~ ___ '---_....L..-_-QP-_ VENT
r-------,D
L~ r~ -. I I
I I I
I I I I I L _____ ~
R
IG
Fig. 3. Schematic of hydrogen-deuterium exchange apparatus. PI, Pz, micro-pirani gauges; IG, Bendix G-17 ionization gauge; S, gas mixing bulb; L, liquid nitrogen trap; D, ground glass Dekker valve; R, catalytic reactor; X, 6 mm glass stopcocks; ® needle valves.
containing the Pt wire catalyst was connected to the vacuum manifold and gas mixture bulb via a magnetically operated ground glass Dekker valve with intervening liquid N z trap, and to the mass-spectrometer sampling system by a 3 ft. length of 250 pm Pyrex capillary. Precision Gas Products Research Grade Dz (97.5% Dz) and Precision Gas Products Ultra High Purity Grade Hz (99.999% Hz) gases were separately metered into the storage bulb with partial pressures monitored by a calibrated micropirani gauge. Sampling from the reactor was continuous and at constant pressure, with the rate adjusted by a micrometer calibrated fine metering valve. Experiments carried out in an empty reactor confirmed there was no exchange in the gas handling system or on the walls of the mass-spectrometer.
Prior to sealing the platinum wire catalyst in the reactor tube, the platinum was electrochemically cleaned by potentiodynamic cycling and the absolute area obtained from the hydrogen atom adsorption in the usual mannerI6). This gave a determination of the true platinum surface area as opposed to the geometric area of the wire. The wire was then dipped into boiling nitric acid, washed in triply distilled water and sealed into the reactor tube. Prior to a run, the system was outgassed in vacuum at

Correlations Between Electrochemical Activity and Heterogeneous Catalysis
773°K for 12 hours. For the purposes of comparison with BREAKSPEARE
et al.12), a cycle of treatments at 1 torr oxygen at 773-973°K followed by
reduction in 2 torr hydrogen at 773°K and by outgassing at 773°K was also used. The exchange rate observed following this cycle of treatments was not significantly different from that observed following simple outgassing. The vacuum indicated by the ionization gauge was 2 x 10⁻⁶ torr and was limited by the vapor pressure of the silicone stopcock grease at room temperature. Since, however, the stopcocks were separated from the Pt wire catalyst by the liquid nitrogen trap, the effective vacuum in the reactor tube was probably in the ultra-high vacuum range, ,....,10-9 torr.
Analysis of Exchange Reaction Kinetics
The H2-D2 exchange reaction was carried out batch-wise, by admitting the gas mixture to the reactor and closing the Dekker valve. Time zero was established by the appearance of D2 in the mass-spectrometer. Due to a residual background of H2 in the mass-spectrometer, the time progress of the reaction was monitored from the relative heights of the HD and D2 peaks.
-2.0
o 30 60 90 120 150 REACTION TIME lsi
Fig. 4. Temperature dependence of In (l-Y/Ye) with time for stoichiometric mixtures of H2 and D2 on a platinum wire catalyst. 5 torr total pressure. • 293; ... 357; • 415°K.
31

32
P. N. Ross and P. STONEHART
Let y be the conversion at time t, Y. the conversion at equilibrium.
H2 + D2 ~ 2HD 1-y 1-y
2 2 Mole fractions: y
Partial pressures :
If R = (height of D2 peak/height of HD peak) = PD,/PHD , then y =
1/(2R + 1). The sampling rate was adjusted so that over the time course of the reaction to equilibrium the total reactor pressure changed less than 10%. If both the forward and reverse reactions follow first-order rate laws, then, for constant total pressure,
(10)
It was found that for pressures from 0.5-10 torr and temperatures from 300-500oK, plots of In [1-y/y.l vs. t yielded straight lines, with slopes -k (sec-I), as shown in Figures 4 and 5. Then the absolute rate of exchange was calculated from
o 30 60 90 150
REACTION TIME (sl Fig. 5. Pressure dependence of In (I-yiy.) with time for
stoichiometric mixtures of H2 and D2 on a platinum wire catalyst. Temp. 293°K. • 5.0; .. 2;0; • 0.5 torr.

Correlations Between Electrochemical Activity and Heterogeneous Catalysis
r ( molecules) = kN cmzsec it
(11)
where N is the number of molecules in the reactor and it the area of the wire. For the purpose of comparison with the electrochemical results, it IS convenient to define a rate-constant, k., such that the absolute rate IS
k.(N/V) = r
Vk where V is the reactor volume, and k. em/sec, IS equivalent to
it
RESULTS
(12)
As easily seen from Figure 5, the first-order rate constant for Hz-Dz exchange was not independent of the total pressure for the temperatures of this investigation (> 293°K). The true order of the reaction over the pressure range of 0.5-5 torr was 0-0.5, tending to zero at the highest pressure. For the purposes of comparing the rate of H z-D2 exchange with the electrochemical rate of hydrogen oxidation, the rate constants used were those measured at total pressures such that the coverage of the surface by adsorbed hydrogen and deuterium would approach a monolayer, which was the zero-order region of 5-10 torr total pressure.
> ~ .... .... <J
0
5
10
15
20
25
30
35 -2 -1 0
lOG 11/.JV1 Fig. 6. Comparison of theoretical (solid line) curve for 11Ep vs.
l/./v with k.=O.23 em/sec to the peak shift measured
at different scan rates (v) at 293°K.
+1
33

34
P. N. Ross and P. STONEHART
10 VIS
3.6
3.0
>--..... Co.) .... 2.4 CI)
CC ::E
1.8 ~
~ ::::::-
1.2
°o~~~--~--~~~~~~---L--~ 0.01 0.02 0.03 0.04 0.05 0.06 0.07
ELECTRODE POTENTIAL, V
Fig. 7. Observed potentiodynamic scans showing the shift in the normalized anodic current peak potential from the quasi-equilibrium potential with increasing scan rate.
The shifts in oxidation current peak potentials as a function of sweep rate observed at 25°C are shown in Figure 6, and examples of i-a curves observed at different scan rates are shown in Figure 7. The observed i-a curves include, of course, the current produced by oxidation of adsorbed hydrogen which causes some overlap with the hydrogen oxidation current peak and produces the rising tail off the end of the peaks. The theoretical calculations were made only for the current produced by hydrogen molecule oxidation and therefore did not contain this background current. Qualitatively, the observed i-a curves had the same features as the calculated curves, with the oxidation current peaks broadening and the normalized
current, iI/v, dropping slightly as the peaks shifted with scan rate. The i-a curves produced by continuous cycling from 0 V to 1.25 V (nhe) were identical to those produced by single sweeps from a rest potential of 0 V (nhe). It was observed experimentally that the switching potential could be lowered below 0 to -.040 V (nhe) without affecting the peak shift from the quasi-equilibrium peak. For negative switching -.020 V and -.040 V (nhe), i-a curves for hydrogen saturated electrolyte were identical to those observed with the electrolyte purged with nitrogen. Apparently, the catho-

Correlations Between Electrochemical .4ctivity and Heterogeneous Catalysis
dic sweep to these negative potentials produces sufficient hydrogen evolution to saturate the diffusion layer around the plane electrode, so that for the anodic sweep, the initial condition is that of a hydrogen saturated electrolyte. The hydrogen molecule oxidation first-order rate constant, k., can be calculated from the peak shift observed for a given v and the value of cp corresponding to the observed peak shift. This procedure yields a slightly different value of k. for each v. A better procedure is to find the value of k. which produces the best fit of the theoretical line for AEp vs. iN v . This was the procedure followed to find k. for each temperature.
The first-order rate constants, k. (em/sec), calculated for H2-D2 exchange and the electrochemical hydrogen oxidation are shown in Figure 8 over a temperature range of 294-360oK. In calculating the electrochemical rate constant, the following physical constants were used: the hydrogen solubility in 20% H2S04 was taken as 1 x 10⁻⁶ mole/em3 and assumed to be essentially invariant over this temperature range; the hydrogen diffusivity was taken as D = 3.34 X 10⁻⁴ exp (- 2 x 10³/RT) em2/see. The exponential factor of 2 keal/mole was assumed to be reasonable and the pre-exponential calculated from the observed9
) diffusivity at room temperature. The apparent activation energy for H2-D2 exchange was 2.5 keal/mole, and that for electrochemical hydrogen molecule oxidation was 4.2 keal/mole. In view of the assumed temperature dependencies for the calculation of the electrochemical rate constant, the difference between 2.5 and 4.2 kcal/mole cannot be considered significant. In addition, the temperature dependence of the limiting current for hydrogen molecule oxidation in platinum porous layer electrodes17) indicated an apparent activation energy18) of 3.2 keal/mole (298-433°K, 96% H 3P04).
The corresponding absolute reaction rates for Ct:, (or N/V) of 1 x 10⁻⁶
moles/em2 for H2-D2 exchange and electrochemical hydrogen molecule oxi
dation are shown in Figure 9, along with the separately measured rates of the oxidation of adsorbed hydrogen (VOLMER reaction). The rates of oxidation of adsorbed hydrogen were calculated from the rate constants for adsorbed hydrogen oxidation reported by STONEHART and LUNDQUIST10) and the surface concentration of adsorbed hydrogen on platinum, assumed to be 1.25 x 10¹⁵ molecules/cm2, corresponding to a monolayer of adsorbed hydrogen atoms12), and independent of temperature.
DISCUSSION
The two main reasons, other than cleaning, for the electrochemical treatment of the Pt wire prior to insertion in the H2-D2 system were,
35

86
P. N. Ross and P. STONEHART
firstly, to obtain an electrochemical measure of the active site area of the wire from hydrogen atom adsorptionlO
) and secondly, to prepare a surface for the gas phase experiments which closely corresponded to the surface in the electrochemical experiments. The results presented in Figures 8 and 9 are based on two different normalizations, one using the nominal geometric area of the wire and the other using the area determined from the hydrogen atom adsorption using a potentiodynamic scan. Potential scanning of platinum in acid electrolyte is knownl9
) to roughen the surface. To some extent, this roughness was lost when the platinum wire was heated to 773°K in the vacuum system. When the wire was removed from the system after the H 2-D2 exchange experiments, the area determined from the first few potential scans was closer to the geometric area. The crosshatched regions, therefore, of Figures 8 and 9 represent the uncertainty in determining the active surface present during the measure of the H2-D2
exchange rate. On the other hand, the potentiodynamic method of NrCHOL
SON14) utilized in this work for measuring the rate constant, k., for hydro
gen oxidation does not depend on the active surface area present, so in this sense the electrochemical rate constants are more accurately determined than the gas phase rate parameters.
The absolute rates of H2-D2 exchange measured in this work compare favorably with the results reported by BREAKSPEARE et al.12
) using Pt cleaned in ultrahigh vacuum (2 x 10⁻¹⁰ torr). In Ref (12), the absolute rate (273°K, 0.4 torr) was reported as 1.2 x 10¹⁷ for the wire cleaned by outgassing at T> 1223°K. In the present work, the absolute rate (293°K, 0.5 torr) calculated from Figure 3 and Equation (2) was 6.6 x 10¹⁶ based· on geometric area for the electrochemically cleaned wire. This difference is less than a factor of two which could easily be accounted for by differences in the roughness of the surface. The apparent activation energy reported by BREAKSPEARE et alY) for the temperature 300-500oK was 3.0 kcal/mole, compared to 2.5 kcal/mole in the present work. In the present work, however, cyclic oxidation-reduction treatments of the Pt wire at 773-973°K did not produce a significant increase in the measured rate constant compared to a simple outgassing pre-treatment. BREAKSPEARE et al. 12
) showed an increase by a factor of three (200-500 0 K) for oxidation-reduction pre-treatment at 1073-1273°K. This enhancement must be associated with the higher temperature of their oxygen treatment and probably produced an increased roughness in the wire surface.
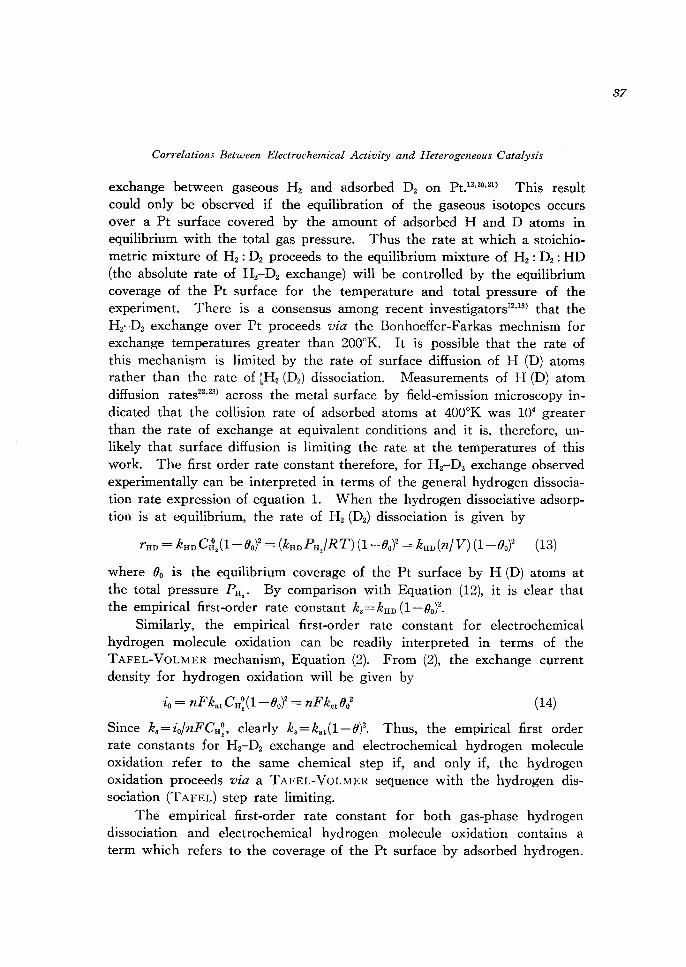
For temperatures above 200oK, the absolute rate of H2-D2 equilibration over Pt (both isotopes in the gas phase) is equal to the absolute rate of
Correlations Between Electrochemical Activity and Heterogeneous Catalysis
exchange between gaseous H2 and adsorbed D2 on Pt.13,20,21) This result could only be observed if the equilibration of the gaseous isotopes occurs over a Pt surface covered by the amount of adsorbed Hand D atoms in equilibrium with the total gas pressure. Thus the rate at which a stoichiometric mixture of H2 : D2 proceeds to the equilibrium mixture of H2 : D2 : HD (the absolute rate of H2-D2 exchange) will be controlled by the equilibrium coverage of the Pt surface for the temperature and total pressure of the experiment. There is a consensus among recent investigators12,13) that the H2-D2 exchange over Pt proceeds via the Bonhoeffer-Farkas mechnism for exchange temperatures greater than 2000K. It is possible that the rate of this mechanism is limited by the rate of surface diffusion of H (D) atoms rather than the rate of lH2 (D2) dissociation. Measurements of H (D) atom diffusion rates22 ,23) across the metal surface by field-emission microscopy indicated that the collision rate of adsorbed atoms at 4000K was 104 greater than the rate of exchange at equivalent conditions and it is, therefore, unlikely that surface diffusion is limiting the rate at the temperatures of this work. The first order rate constant therefore, for H 2-Dz exchange observed experimentally can be interpreted in terms of the general hydrogen dissociation rate expression of equation 1. When the hydrogen dissociative adsorption is at equilibrium, the rate of H2 (D2) dissociation is given by
where 00 is the equilibrium coverage of the Pt surface by H (D) atoms at the total pressure PH,. By comparison with Equation (12), it is clear that the empirical first-order rate constant k.=kHD (1-00)2.
Similarly, the empirical first-order rate constant for electrochemical hydrogen molecule oxidation can be readily interpreted in terms of the TAFEL-VOLMER mechanism, Equation (2). From (2), the exchange current density for hydrogen oxidation will be given by
(14)
Since k. = iolnFCH~' clearly k. = kat (1-0)2. Thus, the empirical first order rate constants for H2-D2 exchange and electrochemical hydrogen molecule oxidation refer to the same chemical step if, and only if, the hydrogen oxidation proceeds via a TAFEL-VOLMER sequence with the hydrogen dissociation (TAFEL) step rate limiting.
The empirical first-order rate constant for both gas-phase hydrogen dissociation and electrochemical hydrogen molecule oxidation contains a term which refers to the coverage of the Pt surface by adsorbed hydrogen.
37

38
P. N. Ross and P. STONEHART
For a comparison of the absolute value of the rate constants for the two systems to be meaningful, it is necessary that for the experimental conditions of measurement, the coverage of the Pt surface by adsorbed hydrogen be the same for the two systems. The H2-D2 exchange reactions were carried out at total pressures (5-10 torr) where, for the temperature range 273-373°K, adsorption of hydrogen on Pt from the gas phase reaches monolayer saturation coverage as indicated by the order of the exchange reaction approaching zero at this pressure. BETT et al.24l have shown
0.5r-----------------,
Co.) .... en -...... ~ Co.)
'" .oc: ..... -Z ocr: ..... 0 en z c Co.)
.... ..... ocr: a::: z c i= Co.)
ocr: .... a::: a::: -0.5 .... c a::: c ..... en a::: j:;:
(.!J c -'
-1.0'------::'-:---::-'-:-----::'-:---~:__-__::_l 2.8 3.0 3.2 3.4 3.6
103/T IOK-11
Fig. 8. Comparison of first order rate constants for electrocatalytic oxidation of hydrogen molecules on platinum with the gas phase first order rate constants for hydrogen-deuterium exchange.
A, Electrocatalytic hydrogen molecule oxidation (real surface area)
0, H 2-D2 exchange (geometric area) ., H2-D2 exchange ("real" surface area from electro
chemical determination of Pt site density).

Correlations Between Electrochemical Activity and Heterogeneous Catalysis
that the equilibrium coverage of adsorbed hydrogen on Pt in acid electrolyte is equal to the gas-phase saturation hydrogen coverage on Pt at 298°K.
This coverage is usually taken arbitrarily as a monolayer for the purposes of surface area calculations. For the purpose here of comparing rate constants, the absolute magnitude of the coverage is not of concern. The necessary and important conclusion is that the hydrogn coverages on Pt are equivalent in the two systems for the experimental conditions of this work.
19.5,-------------------.
19.0 (.) ..... en
'" :::IE (.) ......... 18.5 en ..... ..... :::;) (.) ..... ..... Q
:::IE 18.0 ..... ..... cE cc: Z Q
i= (.)
17.5 cE ..... cc: ~ Q .....
17.0
16.5 L...-__ --'--__ ---'-__ ---''--__ -'--__ .....
2.6 2.8 3.0 3.2 3.4 3.6
Fig. 9. Comparison of absolute reaction rates for electrocatalytic hydrogen molecule oxidation and adsorbed hydrogen atom oxidation on platinum with the gas phase H 2-D2 exchange .
• , Electrocatalytic adsorbed hydrogen atom oxidation (VOLMER reaction, real surface area)
.A., Electrocatalytic hydrogen molecule oxidation (real surface area)
0, H 2-D2 exchange (geometric area) e, H 2-D2 exchange ("real" surface area from electro
chemical determination of Pt site density).
39

40
P. N. Ross and P. STONEHART
It is clear from Figure 8 that the first-order rate constants for H 2-D2
exchange on platinum and electrochemical hydrogen oxidation are in close agreement. The agreement appears even better when the absolute rates of H 2-D2 exchange and hydrogen molecule oxidation, shown in Figure 9, are compared to the absolute rates of the electron transfer (VOLMER) reaction, which is more than an order of magnitude larger than either of the former reactions. In addition, the activation energy for the VOLMER reaction is twice as great as the hydrogen molecule oxidation reaction and H 2-D2 exchange (BONHOEFFER-FARKAS) reaction. The results obtained in this work show that the elementary surface reactions on platinum catalysts involving hydrogen molecules are the same in both gas phase and electrochemical catalysis. The proviso is that kinetic comparisons must be carried out at equivalent adsorbed hydrogen coverages. The correspondence between the electrochemical rate data and the gas phase exchange results argues that the rate determining step for the electrochemical hydrogen molecule oxidation is the dissociative chemisorption of the hydrogen molecule (TAFEL reaction) rather than the HEYROVSKI or HORIUTI reactions. It would be extremely unlikely that the rates of either the HEYROVSKI or HORIUT! reactions would be numerically equal to the TAFEL reaction and at the same time give identical activation energies. In any case, the H 2-D2 exchange reaction can be used as a test reaction for directly determining the activity of model electrocatalysts. This technique has the special advantage that it eliminates the complications that arise from porous electrode structures and electrolyte impurities.
References
1) T. ERDEY-GRUZ, M. VOLMER, Z. Physik Chem., 150A, 203 (1930). 2) J. TAFEL, Z. Physik Chem., 50, 641 (1905). 3) K. J. VETTER, "Electrochemical Kinetics", Academic Press, New York-London
p. 519 (1967). 4) J. HEYROVSKI, Rec. Trav. Chim. Pays-Bas, 46, 582 (1927). 5) J. O'M. BOCKRIS and A. K. N. REDDY, "Modern Electrochemistry", Volume 2,
Plenum Press, New York, p. 1250 (1970). 6) R. WOODS, J. Electroanal. 49, 217 (1974). 7) M. BREITER, "Electrochemical Processes in Fuel Cells", Springer-Verlag, New
York, p. 51 (1969). 8) J. HORIUTI and G. OKAMOTO, Sci. Papers In st. Phys. Chon. Res. (Tokyo) 28, 231
(1936) and]. HORIUTI, this Journal 3, 52 (1954). 9) J. S. BAGOTZKY and N. V. OSETROV A, J. Electroanal. Chem. 43. 233 (1973).
10) P. STONEHART and J. T. LUNDQUIST, Electrochim. Acta, 18, 907 (1973). 11) P. STONEHART and G. KOHLMA YER, Electrochim. Acta, 17, 369 (1972).

Correlations Between Electrochemical Activity and Heterogeneous Catalysis
12) R. J. BREAKSPEARE, D. D. ELEY and P. R. NORTON, J. Catalysis, 27, 215 (1972).
13) S. TSUCHIYA, T. AMENOMIYA and R. J. CVETANOVIC, J. Catalysis, 20, 1 (1971).
14) R. S. NICHOLSON, Analytical Chemistry, 37, 1351 (1965).
15) W. VOGEL, J. LUNDQUIST, P. Ross and P. STONE HART, Electrochim. Acta 20, (1975).
16) P. STONEHART, Electrochim. Acta, 15, 1853 (1970).
17) W. VOGEL, J. T. LUNDQUIST and A. BRADFORD. Electrochim. Acta, 17, 1735.
(1972).
18) G. NASHICK, Paper # 32, Electrochem. Soc. Meeting, Detroit, Mich. 1969.
19) K. KINOSHITA, J. T. LUNDQUIST and P. STONEHART, J. Electroanal. Chem., 48,
157 (1973).
20) G. C. A. SCHUlT and L. L. Van REIJEN, Advan. in Catalysis 10, 242 (1958).
21) G. K. BORESKOV and A. A. VASSILEVITCH, Actes Congr. Int. Catal. 2nd 1960, 1,
1095 (1961).
22) R. GOMER, R. WORTMAN and R. LUNDY, J. Chem. Phys., 26, 1147 (1957).
23) R. LEWIS and R. GOMER, Surface Science, 17, 333 (1969).
24) J. A. S. BETT, K. KINOSHITA, K. ROUTS IS and P. STONE HART, J. Catalysis, 29, 160 (1973).
41