Corporate Presentation 2Q18...UNIFIN at a glance UNIFIN Financiera SAB de CV SOFOM ENR UNIFIN Credit...
24
Corporate Presentation 2Q18
Transcript of Corporate Presentation 2Q18...UNIFIN at a glance UNIFIN Financiera SAB de CV SOFOM ENR UNIFIN Credit...

Corporate Presentation 2Q18

Starts operations
1st public debt issuance
1st-ever leasing
securitization
International Markets Debut
US$400 million
Initial Public Offering (IPO)
US$237 million
Sub-perpetual notes US$250
million
Track record building experience and know-how
2,664 3,903 6,155 9,297 11,488 18,855 30,142 41,672 48,116
0.99% 0.65% 0.34%
1.92% 0.61% 0.59% 0.59% 0.74% 0.84%
2010 2011 2012 2013 2014 2015 2016 2017 6M18
Total portfolio
NPL ratio
Source: Company public filings.
Portfolio evolutionUNIFIN’s portfolio has grown consistently over the years while maintaining low NPLs
1993 2002 2006 2014 2015 2018
Company evolutionUNIFIN has a strong track-record in local and international markets
2

UNIFIN at a glance
UNIFINFinanciera
SAB de CV SOFOM ENR
UNIFINCredit
SA de CV SOFOM ENR
Factoring
Auto loans & others
UNIFINAutos
SA de CV
Asset procurement
Leasing14.1% 5.9%
5.5% 2.7%
80.5% 91.4%
1
2
3
4
5
Overview
Ass
ets
67,855
Tota
l po
rtfo
lio/
NPL
rat
io
48,116/ 0.8%
Shar
e-ho
lder
seq
uity
12,726
Net
inco
me
406
RO
AE
21.2%
RO
AA
3.4%
Equi
ty/
asse
ts
17.3%
Key financial & operating data
#1 independent operating leasing company in Latin America(1) (25 years operating)
Loan portfolio and net income have grown at a ’14–’17 CAGR of 54% and 54%, respectively
Strong profitability, with an average ROAE(2) and ROAA(3) of 30% and 4%, over the last 4 years
Strong asset quality with leasing NPLs(4) historically below 1%
Targets mainly the expanding SME segment
UNIFIN overview and key metrics
As % of total portfolio
As % of total revenue 3

Corporate strengths
Leadership -1Origination process -2
Profitability -3
Financial flexibility -
4
Expanding footprint -
5
Broad experience -
6
Leading operating leasing company focused in a market with strong growth potential
Streamlined origination process with robust credit risk management practices
Sound financial performance delivering strong growth and profitability
Strong balance sheet, supported by conservative leverage and sound liquidity
Expanding commercial structure, lean national platform, and regional presence in consolidation
Highly experienced management team with corporate governance an best-in-class practices
Sound Portfolio -4Sound financial performance delivering strong growth and profitability
Vastly diversified portfolio with low client base concentration
74

128111
53 56
86
6247
27
Chile Brazil Colombia Mexico
Total Credit % GDP Banking credit % GDP
Corporates are still underserved in Mexico…
Operating leasing adheres to the SME’s needs
99%
72% 52%
19%
28%
48%
81%
Economic units Employment % of GDP Financing
SME's Other enterprises
…mainly in SME segment
Leasing provides SMEs with the benefits of owning capital assets, without having a relevant impact on their liquidity
Source: World bank (2016) Source: INEGI as of 2014 and CNBV as of 2017.
US$247 Bn US$1,796 Bn US$282 Bn US$1,046 BnGDP
Target market
Use of capital asset without upfront purchase
No use of equity or bank debt
Lease payments are an operating expense and are tax deductible
SME market overview
• Increase market share within the SME segment
• Focus on continue growing our backlog of clients prospectuses
• Maximize profitability and minimize risk of our portfolio
• Unique product offering vis-à-vis the traditional banking system
5

Source: Company public filings, INEGI.
12.2%
9.7%
7.2% 6.1% 5.9%
State ofMexico
MexicoCity
Jalisco Puebla Veracruz
Distribution of SMEs by state (%)
National presence
The 14 offices in which UNIFIN is present represent 63.1% of Mexico’s GDP and 57.6% of the total SMEs… additionally, this presence includes the top 5 regions in number of SMEs
17.5%
8.7% 7.2% 6.8%
4.8%
MexicoCity
State ofMexico
NuevoLeon
Jalisco Veracruz
Distribution of GDP by state (%)
Northern region
Central region
Southeastern region
UNIFIN is in the process of consolidating its national presenceFocusing on the top economic regions of Mexico
6

7,516
10,326
11,604
22,565
27,149
28,381
38,636
42,181
80,678
87,994
Relevant leasing companies in Mexico
1 According to The Alta Group 20162 Source: Banxico as of September 2016. SME’s portfolio3 UNIFIN portfolio as of 6M18
Competitors
Competitors and market overviewSME exposure to financial institutions(2)
International
Brand / Specialized
Bank related
Local / Independent
UNIFIN is the #1 leasing independent company in Latin America(1)
7
UNIFIN3
portfolio as of 6M18 48,116

Competitive advantages
• 25 years operating, serving the needs of the SME segment• Customized systems and technology• Robust origination and collection processes• Tailored credit analysis model (16 scorecards)
• Total assets of Ps. 67,855 million as of June 2018• 565 employees and offices in 14 cities located in Mexico’s main economic hubs• Required infrastructure in place to support expected growth• Purchasing power with dealers and suppliers
• Shareholders’ equity of Ps. 12,276 million as of June 2018• Access to multiple and competitive funding sources• Securitizations, public debt (local and international), bank loans, development banks and strong
cash flow generation
Know-how
Scale &presence
Capital & funding
8

Origination process
Acceptance rate of ~40%
• Dedicated centralized area to define potential clients per regionClient prospecting
• Financial figures• Tax reports• Sector outlook
Receive application
• Default history• NPL history• Litigation history
Credit & legal bureau
• Requires banking and commercial referencesReferences
• Loan-to-value and residual value assessment• Secondary market value assessment Asset valuation
• Analyse and interpret (credit scoring)• Electronic, physical and corporate committees (depending on lease
size)Credit committee
• 82% of clients renew their leases• 100% of the assets are sold at the end of the contractRenewals/sales of assets
1
2
3
4
5
6
7
9

11,713
18,800
22,585
6,123 6,272
2015 2016 2017 2Q17 2Q18
CAGR ’15–’17: 39%
Var: 2%
Business lines
Leasing is the core business accounting for 80% and 91% of the total portfolio and revenues in 2Q18, respectively
33%
32%
15%
10%
10%
Economic sector Industry &manufacturing
Services
Commerce
Construction
Transportation
50%
24%
11%
5%4%3% 3%
Geographic sector Mexico City &metro area
Others
Nuevo Leon
Queretaro
Jalisco
Veracruz
Sonora
39%
36%
25%
Type of asset
Machinery
Others
Transportation
Note: Other loans account for 10.0% of total portfolio.Source: Company public filings.
Leasing Leasing
Destination Machinery, equipment & vehicles
As % of total portfolio 80.5%
Target market SMEs and individuals with business activities
Amount Ps. 100,000 - 150,000,000
Origination volume 6,272
Portfolio balance 38,712
Avg. maturity (months) 40
Number of clients 4,592
Tenor 12-48 months
10

Source: Company public filings.
7,686 9,675
11,739
3,069 2,600
2015 2016 2017 2Q17 2Q18
CAGR ’15–’17: 24%
Var: -15%
Business lines
44%
24%
22%
6%4%
Economic sectorServices
Commerce
Industry
Construction
Transportation
69%
10%
7%
6%
4%2% 2%
Geographic zone Mexico City & metro area
Tabasco
Others
Jalisco
Nuevo Leon
Veracruz
Queretaro
Factoring business account for 5.5% and 2.7% of the total portfolio and revenues in 2Q18, respectively
Factoring FactoringDestination Working capital
As % of total portfolio 5.5%
Target marketSMEs and individuals with business
activities
Amount Ps. 500,000 - 150,000,000
Origination volume 2,600
Portfolio balance 2,626
Avg. maturity (days) 95
Number of clients 1,156
Tenor 8-180 days
11

Source: Company.
401
1,157
1,628
430 343
2015 2016 2017 2Q17 2Q18
CAGR ’15–’17: 101%
Var: -20%
Business lines
53%35%
10%1%1%
Economic sectorServices
Transportation
Commerce
Industry & mfg
Construction
58%32%
4%2%
2%1%1%
Geographic zone Mexcio City &metro area
Others
Guanajuato
Queretaro
Coahuila
Hidalgo
Morelos
Auto loans business account for 4.1% of the total portfolio in 2Q18
Auto loans Auto loans
Destination Any type of vehicle
As % of total portfolio 4.1%
Target market SMEs and individuals
Amount Up to 80% of the vehicle´s price
Origination volume 343
Portfolio balance 1,962
Avg. maturity (months) 33
Number of clients 2,220
Tenor 12-60 months
12

Source: Company.(1) Non-performing loans, with more than 30 days past due.
Collection driven by distinct, specialized teams at each stage of the collection process
Client’s shareholder(s) and / or top management are personally liable in case of default or the asset not being returned
Collection is greatly facilitated given the fact that UNIFIN maintains ownership of the asset
UNIFIN’s specialized collection processes have helped maintain NPLs consistentlybelow 1%(1)
Friendlyreminder
Due date Secondreminder
Call centeraction
Extrajudicialcollection
Workout Judicialcollection
Portfolio administration
+7,968 clients Largest exposure represents <1.7% Top 25 represent <17%
Diversified portfolio with fragmented client base
-5 0 61 to 90 >902 to 7 8 to 30 31 to 60
13

Results
1,424 1,462 2,300 938 1,122
2015 2016 2017 6M17 6M18
Operating incomeCAGR: 27.1%
Var. 19.6%
1,093 1,210 1,771 706 877
2015 2016 2017 6M17 6M18
Net incomeCAGR: 27.3%
Var. 24.2%
1,821 2,376 3,182 1,455 1,823
27.8%25.0%
22.2% 22.9% 20.6%
2015 2016 2017 6M17 6M18
6,546 9,486 14,315 6,364 8,837
2015 2016 2017 6M17 6M18
Var. 38.8%
Total revenueCAGR: 47.9% CAGR: 32.2%
Var. 25.2%
Nominal financial margin and margin as % of total revenue
Continuously delivering positive results
14
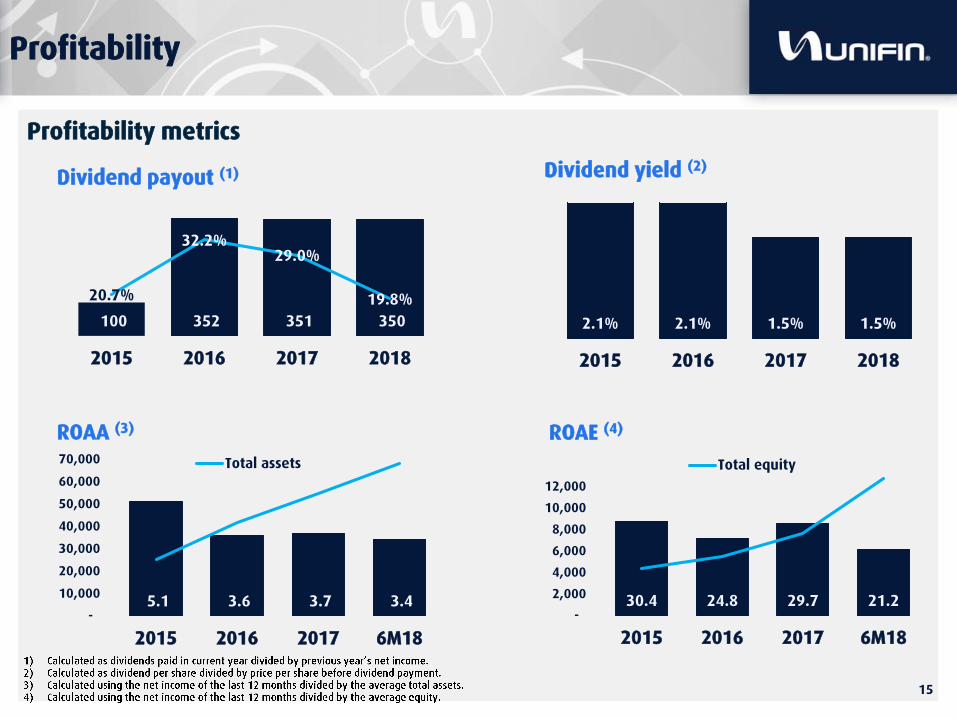
5.1 3.6 3.7 3.4 -
10,000
20,000
30,000
40,000
50,000
60,000
70,000
2015 2016 2017 6M18
Total assets
30.4 24.8 29.7 21.2
2015 2016 2017 6M18 -
2,000
4,000
6,000
8,000
10,000
12,000
Total equity
ROAA (3) ROAE (4)
100 352 351 350
20.7%
32.2%29.0%
19.8%
2015 2016 2017 2018
Dividend payout (1)
2.1% 2.1% 1.5% 1.5%
2015 2016 2017 2018
Dividend yield (2)
Profitability
Profitability metrics
15

Funding & financial liabilities profile(Ps. million)
Enhanced debt profile
61.8%74.2%
22.0%11.8%
16.2% 14.0%
6M17 6M18
Variable Cap @ 7.33 Fixed
86.0%
83.8%
37% 41% 42% 32% 34% 31%
39% 47%
29%
28%
19% 21%
18,837
29,562
42,634 48,879
2015 2016 2017 6M18
Securitizations International Notes BanksFunding profile
Maturity profile
18.6% 15.0%9.2%
3.4%
26.8%11.8%
45.4%
11.3%
58.5%
Total portfolio Financial liabilities
0-12 months 13-24 months 25-36 months37-48 months 49-80 months
48,116 48,879
WAVG maturity:
37 months
WAVG maturity:
53 months9.59
0.06
0.
326M18
6M17 ∆ Rate Volume
Funding costRate: 9.97%
Prudent risk management & strong funding profile
16

4,347 5,501 7,584 12,726 1
2015 2016 2017 6M18
18,837 29,562 42,634 48,879
2015 2016 2017 6M18
CAGR ’15–’17: 32%Equity
CAGR ’15–’17: 50%Financial liabilities (incl. securitizations) Leverage (excl. securitizations)
Equity to assets
Capital Structure
(1) Includes Ps. 4,531 million from the perpetual notes registered at faced value with no revaluation through time.
Strong balance sheet, supported by conservative leverage levels
17.4
%
13.2
%
13.9
%
18.8
%
17.6
%
12.7
%
12.5
%
17.3
%
2015 2016 2017 6M18
Accounting excl. MTM
2015 2016 2017 6M18
Financial leverageFinancial leverage excl. MTM
17
2.8x
3.3x
3.3x
2.6x
2.7x
3.3x
3.7x
2.9x
2015 2016 2017 6M18

Staff
35%
31%
15%
9% 6% 4% Sales force
Administration & finance
Operations
Innovation
I.T.
Corporate
430 508 530 565
2015 2016 2017 6M18
(Number of employees)
…while maintaining strong levels of operating efficiency
UNIFIN continues to increase its workforce… …mainly comprised of an incentivized, variably compensated sales force…
10.7% 8.4% 6.2% 6.2%
2015 2016 2017 6M18
Operating expense / total revenues
1.3x
39.5% 34.3% 28.6% 30.4%
2015 2016 2017 6M18
Efficiency ratio(1)
15.2 18.7 27.0 22.9
2015 2016 2017 6M18
Revenue per employee
UNIFIN has maintained a high level of operating efficiency
18

19
Staff
Source: Company information 1 Formally reports to the Audit Committee
Administration and financeOperationsBusiness
• Leasing• Factoring• Auto Loans• Insurance• Commercial Coordinator• Marketing• Business Intelligence
• Credit• Procurement department• Asset appraisal team• Leasing Comptroller’s desk• Factoring & auto comptroller’s
desk• Documents and control
management• Contracts
• Corporate Comptroller• Corporate Finance• Treasury• Investor Relations• Servicer• Compliance and Risk
Management• Legal • Audit1• Human Resources• Material Resources• I.T.
Highlights
Strong relationship with clients
High operating efficiency levels
Efficient sales force structure with ability to continue
growing origination
UNIFIN’s three main pillars (25 areas)
19

Corporatecredit
committee
Reviews and approves credit transactions
exceeding MXN150mm
Corporate governance
Audit and corporate practices
committee
Finance and planning
committee
Money laundering prevention committee
Creditcommittee
Approves, reviews, and amends general guidelines
for internal control and audit
In charge of macroeconomic, financial
and capital structure strategy
Assures compliance with anti-money laundering
obligations
Reviews and approves credit and lending
transactions between MXN$7.5 and 150 mm
•ChairmanRodrigo Lebois
•Executive memberLuis Barroso
• Executive memberRodrigo Balli
• Owner memberAlmudena Lebois Ocejo
• Owner memberRodrigo Lebois Ocejo
• Independent memberFederico Chavez Peon
• Independent memberJose Luis Llamas
• Independent memberJose Luis Fernandez
• Independent memberJuan Marco Gutierrez
• Independent memberEnrique Castillo
Management team
Executive board committees
Luis Barroso Gonzalez CEOFinancial sector experience: 34
Sergio Camacho CarmonaCFOFinancial sector experience: 20
Rodrigo Balli ThieleCOOFinancial sector experience: 18
Gerardo Tietzsch Rodriguez-PeñaCBOFinancial sector experience: 18
Board of directors
20

Selected financial information
*All figures throughout the presentation are expresed in Ps. million
2Q18 2Q17 % Var 6M18 6M17 % Var
Total revenue 4,450 3,664 21.5% 8,837 6,364 38.8%Depreciation (1,936) (1,593) 21.5% (3,732) (2,853) 30.8%Interest & other expenses (1,641) (1,252) 31.0% (3,282) (2,055) 59.7%Financial margin 873 819 6.7% 1,823 1,455 25.2%As % of total revenue 19.6% 22.3% 20.6% 22.9%Admin. and promotional expenses (280) (244) 14.5% (546) (439) 24.4%As % of total revenue 6.3% 6.7% 6.2% 6.9%Operating income 499 525 (5.0%) 1,122 938 19.6%Income tax expense (104) (137) (23.7%) (256) (247) 3.6%Net income 406 403 0.8% 877 706 24.2%
21

22
Selected financial information
*All figures throughout the presentation are expresed in Ps. million
6M18 6M17 Var. %AssetsCash & cash equivalents 7,753 2,282 239.7%Derivatives with hedging purposes 5,624 1,558 261.0%Performing loan portfolio 5,541 5,774 (4.0%)Past due loan portfolio 149 46 223.6%Loan portfolio 5,690 5,820 (2.2%)Property, machinery & equipment - Net 37,395 27,832 34.4%Total other assets 3,997 3,304 21.0%Total assets 67,855 46,088 47.2%Liabilities and Stockholders' equityTotal Financial Liabilities 49,751 35,643 39.6%Total other accounts payable 5,378 5,188 3.7%Total liabilities 55,129 40,831 35.0%Stockholders' equity 12,726 5,257 142.1%Total liabilities & stockholders' equity 67,855 46,088 47.2%Total memorandum accounts 36,612 25,632 42.8%
22

This document may contain certain forward-looking statements. These statements are non-historical facts, and they are based onthe current vision of the Management of Unifin Financiera, S.A.B. de C.V., SOFOM, ENR for future economic circumstances, theconditions of the industry, the performance of the Company and its financial results. The terms "anticipated", "believe","estimate", "expect", "plan" and other similar terms related to the Company, are solely intended to identify estimates orpredictions. The statements relating to the declaration or the payment of dividends, the implementation of the main operationaland financial strategies and plans of investment of equity, the direction of future operations and the factors or trends that affectthe financial condition, the liquidity or the operating results of the Company are examples of such statements. Such statementsreflect the current expectations of the management and are subject to various risks and uncertainties. There is no guarantee thatthe expected events, trends or results will occur. The statements are based on several suppositions and factors, includingeconomic general conditions and market conditions, industry conditions and various factors of operation. Any change in suchsuppositions or factors may cause the actual results to differ from expectations.
UNIFIN is a non-regulated Mexican leasing company, operating as a non-banking financial services company, specializing in threemain business lines: operating leasing, factoring and auto and other lending. Through UNIFIN’s leasing business line, its corebusiness line, the Company offers operating leases for all types of equipment and machinery, various types of transportationvehicles (including cars, trucks, helicopters, airplanes and other vessels) and other assets in a variety of industries. Through itsfactoring business line, UNIFIN provides liquidity and financing solutions to its customers by purchasing or discounting accountsreceivables and by providing vendor financing. UNIFIN’s auto loans and other lending business line is focused on financing theacquisition of new and used vehicles, while the other lending portion of such business line includes financing working capitalneeds and the acquisition of other capital assets.
Disclaimer
About UNIFIN

Presidente Masaryk 111 • Polanco • México D.F. 11560 • www.unifin.com.mx
Contact
David PernasHead, Corporate Finance & Investor RelationsT: +52 (55) [email protected]