Corporate Credit Spreads and the Sovereign Ceiling in Latin America · 2010-06-02 · 1 Corporate...
45
1 Corporate Credit Spreads and the Sovereign Ceiling in Latin America Martin Grandes* Pontifical Catholic University of Argentina and Center for Financial Stability Alicia Moreau de Justo 1600 (C1107AAZ), Buenos Aires, Argentina Office: +54 11 4349 0200 ext. 2110 or 2443 Fax: +54 11 4349 0443 [email protected] Demian Tupac Panigo Universidad Nacional de La Plata, Center for Financial Stability and CEIL-PIETTE-CONICET [email protected] Ricardo Aníbal Pasquini Center for Financial Stability and Universidad Torcuato Di Tella Av Corrientes 753 1° Piso – C1043AAH Buenos Aires, Argentina Office and Fax:+54 11 4328 7280 [email protected] *Corresponding author
Transcript of Corporate Credit Spreads and the Sovereign Ceiling in Latin America · 2010-06-02 · 1 Corporate...

1
Corporate Credit Spreads and the Sovereign Ceiling in Latin America
Martin Grandes* Pontifical Catholic University of Argentina and Center for Financial Stability
Alicia Moreau de Justo 1600 (C1107AAZ), Buenos Aires, Argentina Office: +54 11 4349 0200 ext. 2110 or 2443
Fax: +54 11 4349 0443 [email protected]
Demian Tupac Panigo
Universidad Nacional de La Plata, Center for Financial Stability and CEIL-PIETTE-CONICET
Ricardo Aníbal Pasquini Center for Financial Stability and Universidad Torcuato Di Tella
Av Corrientes 753 1° Piso – C1043AAH Buenos Aires, Argentina Office and Fax:+54 11 4328 7280
*Corresponding author
2
Abstract
We exploit a panel of 72 US dollar-denominated bonds issued by Latin American publicly listed firms between 1996 and 2005 to answer the following three questions: 1) is sovereign risk an statistical and economically significant determinant of the corporate credit spread, controlling for firm and bond specific characteristics?, 2) If yes, do market participants apply the sovereign ceiling rule adopted by rating agencies in the pricing of our bond market data?, and 3) how do market views compare with the rating agencies ceiling policy for each corporate? We find strong evidence of an economically and statistically significant effect of sovereign risk on corporate spreads across different panel econometric specifications and bonds. Moreover, markets do not apply the ceiling rule in 77% to 90% of the bonds we sample and these findings are consistent with rating agencies’ policies towards the latter for about 50% of the firms. JEL codes: F34, G0, G1, G2.
Keywords: Emerging Bond Markets, Latin America, Credit risk models, Corporate bond spreads, Sovereign Ceiling.

3
Table of Contents 1. Introduction and Literature Review.............................................................................. 4 2.Theoretical framework .................................................................................................. 6
2-1 Sovereign risk effect on corporate credit spreads and the sovereign ceiling ......... 6 2-2 Firm and bond-idiosyncratic control variables ...................................................... 7 2-3 Other Potential Determinants ................................................................................. 9
3- Data and econometric framework .............................................................................. 10 3-1 Data set, variable operationalization and measurement issues ............................ 10
3-1-1 Dependent Variable: How Corporate Default Spreads are Measured .......... 10 3-1-2 Explanatory Variables................................................................................... 12 B -Other Determinants ........................................................................................... 12
3-2 Econometric framework....................................................................................... 12 4-Empirical results.......................................................................................................... 14
4-1 Data ...................................................................................................................... 14 4-2 Econometric Results................................................................................................. 14
4-2-1 Statistical significance of sovereign spreads and the sovereign ceiling test. 15 4-2-2 Statistical significance of firm and bond-idiosyncratic determinants........... 17 4-2-3 Economic significance .................................................................................. 17
5- Summary and conclusions.......................................................................................... 18 References 19
删除的内容: 11
删除的内容: 15
删除的内容: 18
删除的内容: 20
4
1. Introduction and Literature Review Bond finance is becoming a more prominent source of funding for corporations in emerging and developing countries seeking out new investment opportunities, the expansion of their production capacity, and looking to meet the increasing demand for bond securities worldwide. The cost of bond financing is acknowledgeably a strategic variable for businesses when making capital budgeting decisions. In turn, the cost of bond capital raised on public markets impacts aggregate investment plans and future expected output growth.. As corporate bond markets develop in emerging economies (see IMF, 2009) not only does the volume but also the cost of bond financing and in particular the spread of this cost attributable to firm or country specific risks become pervasive. In this paper we aim to answer the following questions: 1) is sovereign risk an statistical and economically significant determinant of the corporate credit spread1, controlling for firm and bond specific characteristics?, 2) If yes, do market participants apply the sovereign ceiling rule adopted by rating agencies in the pricing of our bond market data?, and 3) how do market views compare with the rating agencies ceiling policy for each corporate? While there is a wealth of literature on the determinants of corporate bond spreads in mature markets2, the question of what determines emerging markets corporate spreads, including the role of sovereign spreads as a major explanatory variable and the test for the sovereign ceiling hypothesis, has only been recently investigated. To the best of our knowledge, Durbin and Ng [1999 and 2005], Grandes and Peter [2005], and Cavallo and Valenzuela [2010] are the only contributions to this literature. A related strand of the literature on emerging market corporate creditworthiness (Ferri et al [2002] or Borensztein et al [2006]) has researched the determinants of corporate ratings instead of looking at market prices and yield spreads. Durbin and Ng [1999 and 2005] study the relationship between secondary market spreads of foreign currency bonds issued by emerging market firms and by their countries. They span 108 bonds issued by 85 firms in 14 countries, including Latin American, Asian and Eastern Europe over the period of 1995-2000. Durbin and Ng find that market participants do not fully apply the sovereign ceiling, in contrast to the policy followed at the time by the rating agencies, in particular Standard & Poor´s. The limitation of their study is that they can only evaluate the proposition that “firms are always riskier than governments” and not the origin of risk transferred from the government to the firm. Moreover, they do not control for firm-idiosyncratic determinants or global push factors such as risk aversion, liquidity or stock market volatility which could drive both corporate and sovereign spreads if omitted in the relevant econometric model. Grandes and Peter [2005] study the importance of sovereign risk in explaining corporate spreads using a sample of 9 domestic currency bonds issued by 9 large South African firms in 2000-2003. They control for firm-specific variables and find that sovereign risk is the most significant and economically relevant variable to account for corporate 1 This paper will use interchangeably the terms “corporate bond spreads”, “(corporate) credit risk”, “credit yield spreads” and “corporate default premium”. 2 For a survey of this literature we refer the reader to Elton et al [2001], Cossin and Pirotte [2001]…

5
spreads on South African local currency bonds. Furthermore, these authors find that the sovereign ceiling applies to banks and not to firms in other sectors such as oil and gas or mining. Notwithstanding this latter finding, the authors do not include international foreign currency bonds issued by the same firms wherever possible, and limit their study to a short sample without offering additional evidence on other emerging market corporations having recently issued local currency bonds domestically and globally.3 Cavallo and Valenzuela [2010] estimate the determinants of corporate bond spreads for 139 firms in 10 emerging market economies, 6 from Latin America and 4 from East Asia. Using quarterly data of Option-adjusted spreads (OAS) extracted from Bloomberg in the period from June 1999 to June 2006, they find that corporate bond spreads are mainly determined by firm-specific variables (i.e., profitability, equity volatility, etc), bond characteristics (time to maturity), and to a lesser extent by sovereign risk and global factors (e.g, US “junk” bonds yield spreads, Treasury yields). Cavallo and Valenzuela also confirm the sovereign lite theory [Borensztein et al 2006] which points out that there should be an asymmetric impact of sovereign spreads on corporate default risk when spreads go up compared to when they decrease. A shortcoming of their contribution is that they fail to control for the term structure of sovereign risk. They use the EMBI+ indicator of sovereign risk across all firms/bonds in a given country at a given time instead of matching corporate bonds with sovereign bonds according to their maturity or duration, or even their coupon structure. Besides this, the authors do not test for the sovereign ceiling hypothesis In related literature, Ferri et al. [2002] evaluate the sensitivity of corporate rating changes to sovereign ones. They find the pass-through to be greater in low-income countries and particularly for downgrades. Borensztein et al [2006] also examine the link between corporate and sovereign ratings in foreign currency. In addition to emerging market borrowers also including advanced economies issuers over the past decade and conclude that the sovereign risk effect is pervasive and robust to macroeconomic conditions and firm financial strength indicators, non linear and stronger on banks than on industrial firms. Taking Latin American firms as a case study, we make a manifold contribution to the literature on emerging-market corporate bond pricing a) we use a “new” panel of 22 firms and 72 global dollar-denominated bonds –most of them issued by industrial firms- over 1996-2004, b) we control for firm and bond-idiosyncratic variables derived from the structural approach to pricing risky debt securities, c) we estimate an unbalanced panel model to quantify the statistical and economic significance of these attributes and sovereign spreads, and d) we introduce an adjusted test for the sovereign ceiling hypothesis and compare our results to previous findings in the literature (i.e. Durbin and Ng [1999], Grandes and Peter [2005]). The remainder of this paper is organized as follows. Section 2 sets out the theoretical framework. Section 3 describes our panel data features and explains how we the dependent variable (Latin American corporate bond spreads) and one of its determinants, the sovereign bond spreads. It also operationalizes the other control explanatory variables of corporate bond spreads. Section 4 presents the descriptive statistics of our 3 In a later unpublished version of their paper, Grandes and Peter [2006] are able to prove the robustness of their findings to the inclusion of global factors, namely the UST 10-year bond yield, the CBOE VIX measure of risk aversion and the volatility of global (MSCI) equity.

6
data set, and presents and discusses the results of the panel econometric regressions. Finally, Section 5 concludes. 2.Theoretical framework 2-1 Sovereign risk effect on corporate credit spreads and the sovereign ceiling The main argument in this paper is that in an emerging market context, sovereign (default or credit) risk has to be factored into the corporate default premium equation as an additional determinant. All structural models of corporate credit risk pricing implicitly assume that government bonds are risk-free, i.e., that sovereign risk is absent. As these models are implicitly placed in a context of an AAA-rated country (typically the US or the European Union), this assumption seems justified. In analyzing emerging bond markets, however, the “zero-sovereign-risk” assumption does not hold water. What is the economic rationale for sovereign risk to be a determinant of corporate default risk in foreign-currency terms? Empirically, there has been a high correlation between sovereign defaults and company defaults. That is, it has been very difficult for companies to avoid default once the sovereign of their jurisdiction has defaulted. This historical regularity has been used by all major rating agencies to justify their country or sovereign ceiling policy, which usually means that the debt of a company in a given country cannot be rated higher than the debt of its government. The economic rationale behind the sovereign rating ceiling for foreign-currency debt obligations is direct sovereign intervention risk, also called transfer and inconvertibility risk. The term transfer risk is usually only used in a foreign-currency context (recall that this paper studies Latin American dollar-denominated bonds). It refers to the probability that a government with (foreign) debt servicing difficulties will impose foreign exchange payment restrictions (e.g., debt payment moratoria) on otherwise solvent companies and/or individuals in its jurisdiction, forcing them to default on their own foreign-currency obligations. Until 2001, the “big three” main rating agencies, Moody’s Investors Service, Standard & Poor’s, and Fitch Ratings –these latter two de facto-, followed their country or sovereign ceiling policy more or less strictly.4 They amended it, however, under increasing pressure from capital markets after the (ex post) zero-transfer-risk experience in Russia (1998), Pakistan (1998), Ecuador (1999), and Ukraine (2000) (see Moody’s Investors Service [2001b], Standard & Poor’s [2001], Fitch Ratings [2001] or more recently Moody’s [2006]). Moody’s—the last among the big three to abandon the strict sovereign ceiling rule—justified the policy shift as follows: “This shift in our analytic approach is a response to recent experience with respect to transfer risk in Ecuador, Pakistan, Russia, and Ukraine). Over the past few years, the behavior of governments in default suggested that they may now have good reasons to allow foreign currency payments on some favored classes of obligors or obligations, especially if an entity’s default would inflict substantial damage on the country’s economy.”5
4 Standard & Poor´s in 1997 allowed some emerging market firms to pierce the foreign currency long term rating ceiling under very strict conditions. Among these firms, some were from Latin America. See Standard & Poors [1997]. 5 See Moody’s Investors Service [2001a, p.1].

7
Under specific and very strict conditions, rating agencies now allow firms to obtain a higher rating than the sovereign of their incorporation (or location). The conditions for “piercing” the sovereign foreign-currency rating are stricter than for the sovereign local-currency rating [Moody’s 2006]. Bank ratings are almost never allowed to exceed the sovereign ceiling (in both foreign and domestic currency terms) because their fate tends to be closely tied to that of the government. As a result, the default risk of any firm is likely to be a positive function of sovereign risk. To test whether the sovereign ceiling applies in our dollar-denominated corporate spreads data, we resort to a result obtained by Durbin and Ng [1999]. In a simple theoretical model similar to the framework used in this section, Durbin and Ng [1999] show that a 100 percent transfer risk implies that a one-percent increase in the government spread should be associated with an increase in the firm spread of at least one percent. In other words, in a regression of corporate spread changes on corresponding sovereign spread changes, 100 percent transfer risk implies that the beta-coefficient (point estimate associated with sovereign spreads) should be greater than or equal to one. In the logic of their model, the size of this estimated coefficient can be interpreted as the market’s appreciation of transfer risk: a coefficient that is larger than one would imply that the market prices in transfer risk of 100 percent; a coefficient statistically significantly smaller than one would imply that the market judges transfer risk to be less than 100 percent. In Section 4, we will first test whether the sovereign spread can be considered as an additional determinant of corporate credit spreads. We would expect the associated beta-coefficient ( / sovs s∂ ∂ ) to be positive, as increasing sovereign risk should be associated with higher corporate risk as well. Then, if the sovereign spread turns out to be a significant explanatory factor for corporate spreads, the size of the coefficient
/ sovs s∂ ∂ will be a test of whether the sovereign ceiling applies or not: If / 1sovs s∂ ∂ ≥ , the sovereign ceiling in spreads applies; / 1sovs s∂ ∂ < , the sovereign ceiling does not apply. In Section 4.2 we will present two tests of the sovereign ceiling hypothesis, one similar to the one performed by Durbin and Ng [1999 and 2005] or Grandes and Peter [2005], and the other a conditional test which improves the accuracy of the results and hence avoids potential biases in the conclusions about the transferability of sovereign default risk to corporate default risk. 2-2 Firm and bond-idiosyncratic control variables To control for firm or bond specific factors we follow the structural approach to pricing defaultable fixed income securities (see Black and Scholes [1973], Merton [1974], Shimko, Tejima, and Van Deventer [1993] or Longstaff and Schwartz ([995])6.
6 Other theoretical frameworks are 1) the classical or actuarial (for a survey of these methods, see for instance Caouette, Altman, and Narayanan [1998]), and 2) reduced-form, statistical or intensity-based approach. Readers interested in reduced-form models are referred to the works of Pye [1974], Litterman and Iben [1991], Fons [1994], Das and Tufano [1996], Jarrow and Turnbull [1995], Jarrow, Lando, and Turnbull [1997], Lando [1998], Madan and Unal [1998], Duffie and Singleton [1999], Collin-Dufresne and Solnik [2001] and Duffie and Lando [2001], most of which are surveyed and nicely put into a broader context by Cossin and Pirotte [2001], and Bielecki and Rutkowski [2002]. We choose the structural approach because the classical approach is both too subjective and too backward looking and the reduced-form approach is atheoretical with respect to the determinants of default risk.

8
In particular, Shimko, Tejima, and Van Deventer [1993] find that the corporate default premium corpspread t or s is essentially a function of four determinants: (i) firm leverage (measured by the quasi-debt ratio d ); (ii) firm-value volatility Vσ ; (iii) remaining time to maturity of the bond τ ; and (iv) interest rate volatility rσ (extending the Merton-Black and Scholes framework)7
corpspread t = ( , , , )t V rs f d σ τ σ= . (2)
It can be shown that the spread s is a positive function of firm leverage d and firm-value volatility Vσ , but can be either an increasing or decreasing function of interest rate volatility rσ and remaining time to maturity τ , depending on the size of α (the speed of convergence of the risk-free rate r to its long-run mean γ), ,ρ (the correlation between shocks to the firm-value returns and risk-free interest rate shocks),
,τ ,rσ ,Vσ and d in a complex and non-linear fashion.8 The economic intuition of these effects is as follows: • Firm leverage: The higher a firm’s debt in relation to the value of its assets ( d ),
other things equal, the lower its net worth and, hence, the closer it is to default (i.e., bankruptcy) at any given moment in time. To be compensated against the higher probability of default (and, hence, expected loss), investors will ask a higher default premium (i.e., spread).
• Firm-value volatility: The higher the day-to-day fluctuations in the value of the firm’s assets ( Vσ ), other things equal, the higher the probability that—purely by chance—the asset value is smaller than the value of the debt on the day the debt is due, that is, that the firm defaults. To be compensated against the resulting higher default probability and expected loss, investors will ask for a higher spread.
• Interest rate volatility: The corporate spread can be an increasing or decreasing function of interest rate volatility rσ , depending on the firm’s leverage d , its asset volatility ,Vσ the correlation between asset return shocks and interest rate shocks ρ , and the term structure of interest rates. However, Shimko, Tejima, and Van Deventer [1993] note that “the credit spread is an increasing function of [interest rate volatility] for reasonable parameter values.” 9 Moreover, the stronger the impact of σr on s the higher leverage is. To control for this
7 Shimko et al. [1993] assume that the short-term risk-free interest rates follows a stationary
Ornstein-Uhlenbeck process of the form tr dZdtrdr ,2)( σγα +−= ,where γ is the long-run mean which
the short-term interest rate r is reverting to, α > 0 is the speed at which this convergence occurs, rσ is the instantaneous variance (volatility) of the interest rate, and dtdZ t 2,2 ε= is a second standard
Gauss-Wiener process, whose correlation with the stochastic firm value factor, tdZ ,1 , is equal to ρ , i.e., dtdZdZ tt ρ=⋅ ,2,1
8 Shimko, Tejima, and Van Deventer [1993] determine the signs of ds ∂∂ , Vs σ∂ ∂ , s τ∂ ∂ , and
rs σ∂ ∂ through simulations. 9 Shimko, Tejima, and Van Deventer (1993), p. 59.
9
dependence, we will also include the interaction term drσ in the (linearized) estimated equation in Section 3.2. We expect its coefficient to be positive.
• Time to maturity: The corporate default spread can also be an increasing or decreasing function of remaining time to maturity τ , depending on the same parameters as the impact of changes in interest rate volatility. on leverage d and Vσ : For small values of d or Vσ , the spread increases when time to maturity τ lengthens; for intermediate values of d or Vσ , the spread first increases sharply, then reaches a maximum and finally declines gradually as τ increases (producing a hump-shaped curve like in Sarig and Warga [1989]); for high d or Vσ , the spread declines as maturity increases. The economic intuition behind this theoretical result is as follows: If there is only a short time to go before maturity and leverage or firm-value volatility is high, the risk of default (and, hence, the spread) is high; the more time there is to go before maturity, the more opportunities the firm will have, with the same leverage (or asset return volatility), to increase earnings and reduce leverage and, hence, the lower its default risk and spread will be. To control for this dependence in the simplest possible way, we will also include the interaction term dτ in the linearized estimating equation, along with time to maturity τ . We expect the coefficient of maturity alone to be positive because our average leverage values are relatively low (0,11, see Exhibit 3) and the one on the interaction term to be negative.10 .
2-3 Other Potential Determinants These include liquidity, differential taxation of corporate and risk-free bonds, differences in liquidity of corporate and risk-free bonds, business cycle (macroeconomic) conditions, temporary bond market imbalances, and specific bond indenture provisions, such as when call options are embedded in corporate bonds or there is a presence of a sinking fund provision.11 Taxation differentials between corporate and government bonds shall be reflected in the fixed or random effect of our panel model as they have stayed constant over the period we analyze. For instance, interests on domestic government bonds, are exempt from income tax in Argentina, Brazil and Peru.. However, in Chile, they are subject to income tax.as well as corporate bonds. The latter are exempt from income tax in Argentina when publicly placed but are taxable in Brazil and Peru [Grosz [2009]). As we rule out corporate bonds including call options or sinking fund provisions and we are unable to estimate temporary bond market imbalances given the available information, only potential differences in liquidity are controlled for explicitly in the present study. Liquidity refers to the ease with which a bond (issue) can be sold without a significant price discount. One might expect the risk-free bond issues to be larger (and 10 Also see Helwege and Turner (1989) who demonstrate through an experiment the existence of a positively sloped credit spread-to-maturity curve for speculative grade borrowers. 11 These factors are dealt with in the literature on corporate default risk in mature markets, in particular the US corporate bond market. See for instance Athanassakos, George and Peter Carayannopoulos [2001].

10
more frequently traded) and thus more liquid than the corporate issues, such that the liquidity premium on corporate bonds will be larger than the one on comparable risk-free bonds. As a result, we would expect that the higher the liquidity, l, of a given corporate bond relative to that of a comparable risk-free bond, the lower the corporate spread would be. In sum, the corporate default premium is a function of (i) sovereign risk, (ii) leverage, (iii) firm-value volatility, (iv) interest rate volatility, (v) remaining time to maturity, and (vi) liquidity, that is,
Corpspread t =/ /
( , , , , , )sovt V rs f s d lσ σ τ+ + + + − + − −
= . (3)
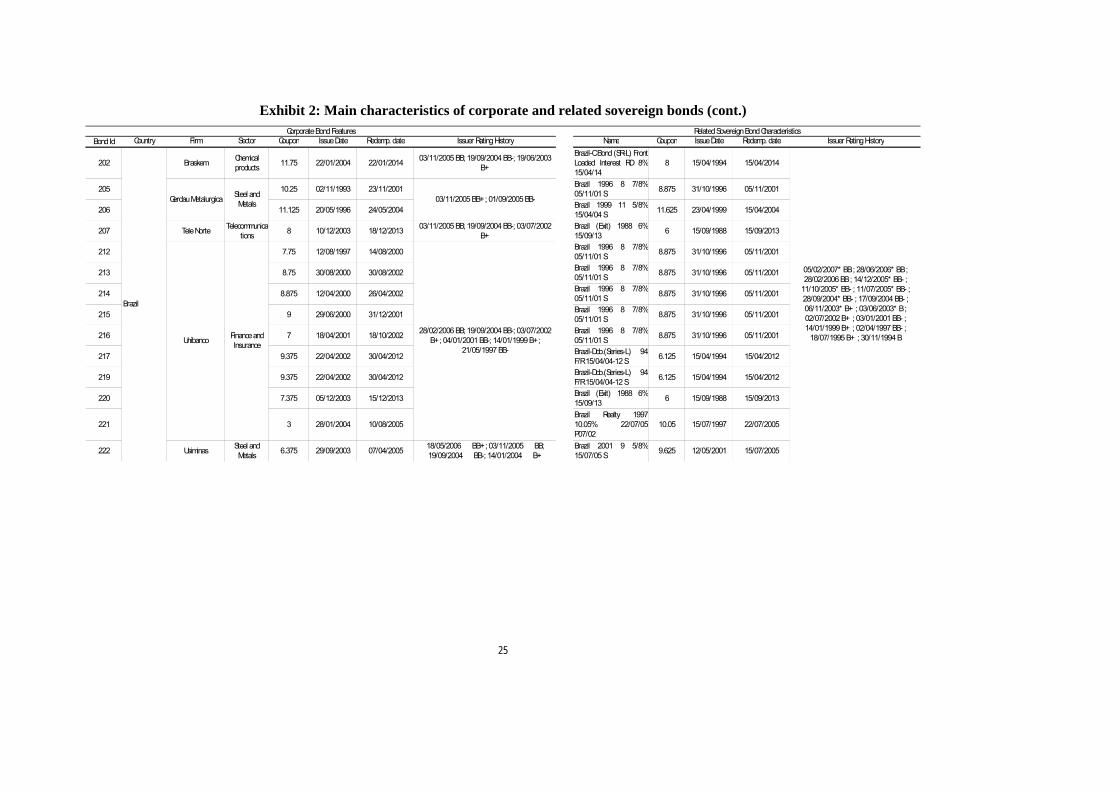
The plus- or minus-signs on top of each of the right-hand-side variables indicates how each of these determinants is expected to influence the corporate default premium (or spread) according to the theory. In Section 4.2, we estimate a linearized version of Equation (3). 3- Data and econometric framework 3-1 Data set, variable operationalization and measurement issues Matching bond market data extracted from Thomson Financial Datastream with balance-sheet data from Economatica we obtain an unbalanced panel of 667 quarterly observations for the period 1996-2004 containing information on corporate spreads, sovereign spreads, liquidity, leverage, time to maturity, firm-value volatility and risk-free interest rate volatility. The actual sample period is constrained by the intersection between the two datasets and other qualitative considerations: only those corporate bonds issued by firms with reliable balance sheet information were kept in the sample. This implies an important restriction on the number of available corporate bonds. The pre-requisite that a firm had to be listed on a stock market and post balance sheet data on a quarterly basis on the one hand, and that for reasons laid out above we choose to work with bonds denominated in US dollars on the other, led us to a database comprising 72 corporate bonds issued by 22 different firms from Argentina, Brazil, Chile and Mexico listed in at least one stock market12. Exhibit 1 summarizes our corporate bond database. It reports the number of issuers, splitting them into industrials and financials, and reports the number of corporate bonds for each country. Initially, we looked for corporate bonds from Argentina, Brazil, Chile, Colombia, Mexico, Peru and Venezuela. However, we were forced to drop Colombian, Peruvian and Venezuelian bonds because of inaccurate data and/or missing balance sheet information. Note that most issuers and bonds are from Mexico (roughly 50% of the sample), followed, in order, by Brazil, Chile and Argentina. 3-1-1 Dependent Variable: How Corporate Default Spreads are Measured
12 In Thomson Financial Datastream we found 171 firms having issued at least one bond. However, many of these bonds did not display yield to maturity and price data over the relevant period.

11
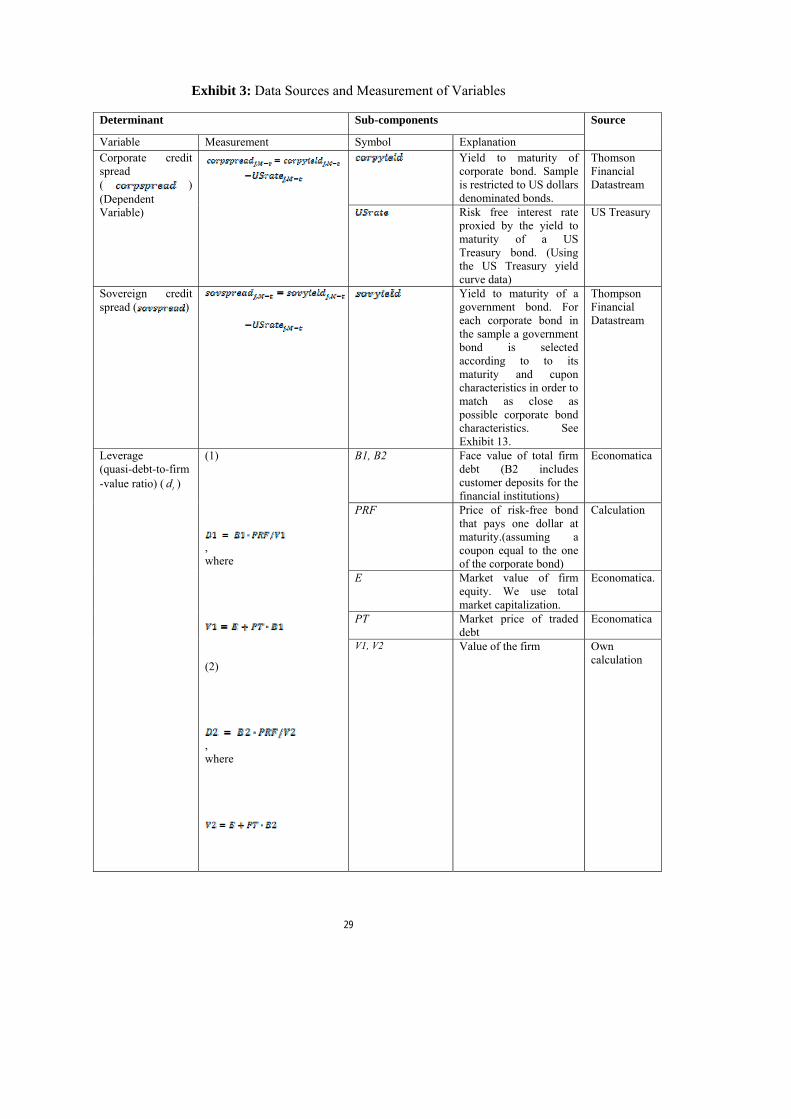
We first collect yield to maturity data for Latin American corporate bonds. Although it would be desirable to restrict the sample only to zero-coupon bonds, as theory prescribes, we mainly end up collecting yield to maturity observations on coupon-paying corporate bonds. 13 This is because there are a small number of zero-coupon bonds issued by Latin American firms precisely because some of the default risk is translated into a regular coupon payment. We attempt to circumvent the inexistence of firm zero-coupon bonds by finding the yield to maturity of the sovereign bond with the same coupon and the same maturity as the corporate borrower. Then, if there is coupon-specific risk in our dependent variable, it will also show up in our independent variable, namely sovereign risk. The problem is that such exactly corresponding sovereign bonds do not exist, except by chance. Therefore, we choose those liquid corporate bonds whose maturity dates and coupons are closest to the maturity dates of the sovereign bonds. As for the risk-free bond we need in order to compute the corporate yield spread, we use US Treasury bonds in US dollars. Finally, we proceed to clear out our database from potential anomalies or data that might bias the results of our econometric estimation. First, we drop out of the sample all public companies (e.g., Petrobras, Pemex), because they hold the same riskiness as the sovereign borrower. Second, for some corporations we eliminate outlier data due to inconsistent price quotes or yield to maturity at given points in time. The firm’s bonds, their main features, and the corresponding sovereign bonds used to calculate both corporate and sovereign default premia are summarized in Exhibit 2.14 Concerning corporate yield to maturity data, as mentioned before, we use daily observations from the period of August 1996 to December 2004. As for US Treasury yields, we work with the US Treasury historical matrix of yield curves.15. Since the matrix only reports the observations at 1, 3 and 6 months, and 1, 2, 3, 5, 7, 10, 20, and 30 years maturity, we run a regression on a daily frequency basis in order to get an approximation of the yield curve and extrapolate the exact yield corresponding to the maturity of interest at each day.16 The corporate spreads are computed as follows:
tMjtMjtMj USratecorpyieldcorpspread −−− −= ,,, (4) 13 Elton et al. [2001] argue that one should use spreads calculated as the difference between yield to maturity on a zero coupon corporate bond (called corporate spot rate) and the yield to maturity on a zero-coupon government bond of the same maturity (government spot rate) rather than as the difference between the yield to maturity on a coupon-paying corporate bond and the yield to maturity on a coupon-paying risk-free bonds. 14 We make an exception in the case of five Argentinean firms for which we choose sub-sovereign bonds instead of sovereign bonds as the corresponding sovereign instruments. We choose these bonds (issued by the City of Buenos Aires and Mendoza Province, see Exhibit 2) because they exhibited similar credit ratings to the Argentinean sovereign bonds over the period under analysis and because the corresponding maturities of those sub-sovereign bonds provided a much better match than sovereign bonds than we could have picked otherwise. 15 Available at http://www.treas.gov/offices/domestic-finance/debt-management/interest-rate/yield.shtml 16 The econometric specification we applied is iiii tty εβββ +++= 2
321 )log( where y denotes each bond yield and t denotes time to maturity. The specification fits well the US Treasury estimation.

12
where j indicates each bond and M-t indicates each bond’s remaining time to maturity expressed in years or fractions of years. Since we use quarterly data in our econometric exercise, we proceed to compute quarterly averages of these yield spreads. 3-1-2 Explanatory Variables
A. Sovereign Default Premium
For this variable we also collect daily yield to maturity for the period from August 1996 to December 2004. We proceed as in the case of corporate default spreads, this is:
tMjtMjtMj USratesovyieldsovspread −−− −= ,,, (5)
Note that the risk-free rate is the same in the calculation of both corporate and sovereign spreads. Again, as we use quarterly data in our econometric exercise, we proceed to compute quarterly averages of these yield spreads.
B -Other Determinants
Exhibit 3 sums up the operationalization, measurement, and subcomponents of
these firm- or bond-specific determinants.17
3-2 Econometric framework Using a linearized version of equation (3), we now examine the statistical and economic relevance of the main structural determinants of corporate bond spreads in our sample of Latin American bonds. Following Grandes and Peter [2005], the estimating equation can be written as:
, k, , j, N, , i
Xsovspreadcorpspread tiitj
k
jjtMiiitMi
…=…=
+++= ∑=
−−
21 ;21
;,,1
,, εγβα
(6)
where tMjcorpspread −, is the corporate spread of firm bond i at the end-month t;
tMjsovspread −, is the sovereign spread which best matches tMjcorpspread −, (see 3-1-1 and 3-1-2); itkit XX ,,1 ,..., is the following set of k = 7 firm or bond control variables (including their interaction terms) :
(1) Quasi-debt-to-firm-value (or leverage) ratio td * (2) 2-Year rolling firm value volatility Vσ (3) 2-Year rolling volatility of the 3-month US T-bond yield to maturity
(USTB-yield volatility) rσ 18
17 A methodological note discussing in detail the operationalization and measurement of these determinants can be obtained from the authors upon request.
13
(4) Years to maturity τ (5) Liquidity (% of day with transactions) l (6) Interaction 1: between years to maturity and leverage dτ (7) Interaction 2: between USTB-yield volatility and leverage; rdσ
iα denotes the (unobservable) firm-specific effect (not included in OLS pooled regressions); iβ (with ββ =i when specific sovereign spread coefficients are not allowed) and 721 ,...,, γγγ are regression coefficients to be estimated; and itε are the regression residuals. Ideally, we would want to estimate the coefficients iα and iβ as well as separate
jγ -coefficients (i.e., iii ,7,2,1 ,...,, γγγ for i = 1,..., N) in individual time-series regressions for each of the different N = 72 bonds. However, with 36>T>1 observations per bond (9 years times 4 observations per year), it would be difficult to obtain efficient and unbiased estimates. To reduce collinearity problems and increase the degrees of freedom and the efficiency of estimation, we pool the time series of our 72 bonds. However, pooling data amounts to imposing restrictions on the parameters. In a fully pooled model, for instance, we assume that the parameters iα , iβ , and iii ,7,2,1 ,...,, γγγ are the same across all bonds, i.e., that αα =i , ββ =i , and jij γγ =, for all
Ni ,...,1= bonds and kj ,...,1= control variables. However, we can also have less restrictive pool-specifications, like the one proposed in Equation (6), where the intercepts iα and the slope coefficients iβ of tMjsovspread −, are allowed to vary across the bonds. Letting iβ vary across bonds and firms enables us to give an answer to two of the three main questions we aim to answer in this study, namely: -Is sovereign default risk an economically relevant and statistically significant factor to account for the cross-country and time-series variation in the corporate spreads of the firms in our sample?, -If yes, do bond market participants apply the sovereign ceiling rule to Latin American firms’ bonds? Based on the “triangulation” or sensitiveness approach19, we regress Equation (6) resorting to 8 alternative estimators, namely ordinary least squares (OLS), random effects (RE), fixed effects (FE), fixed effects corrected for serial correlation (FE-AR), first difference (FD), random effects corrected for serial correlation (RE-AR) and generalized least squares (GLS-RE and GLS-FE) estimators -which remedy both serial correlation and heteroskedasticity. 18 We do not control for global risk aversion because the short term volatility in U.S. interest rates is highly correlated with the former. Moreover, global risk aversion as for instance measured by the VIX index and UST bond yiels at both ends of the curve have been found to be significant determinants of sovereign spreads. Therefore, their potential effect on corporate bond spreads should already be captured by those sovereign spreads. 19 Hammersley and Atkinson [1983] state that “what is involved in methodological triangulation is not the combination of different types of methodologies per se, but to correct the potential weaknesses that may limit the validity of the analysis.” For Fielding and Fielding [1986], the conventional idea of triangulation is that if diverse types of data or methods sustain the same conclusion, the trustworthiness of the results is increased.

14
The residual and specification tests we perform help pin down the “best” estimator although these tests do not come without shortcomings of diverse nature and extent. Indeed, 1) we test for both global significance (for all covariates) and potentially significant, unobserved individual heterogeneity (pooled vs. fixed effects), 2) we conduct the standard Hausman [1978] test to check whether the RE estimator is consistent or not, 3) we test for pooled and panel serial correlation applying the Breusch-Godfrey [1978] and the Wooldridge (2002) statistics, respectively, 4) we perform a modified Wald test for group-wise residual heteroskedasticity (see Green [2003]), 5) we test for independent specific slopes in sovereign spreads (a Wald-chi2 test after seemingly unrelated regressions (SUR)), and 6) we also test for the hypothesis of the existence of either a global or specific bond sovereign ceiling (using again a Wald-chi2 test with linear restrictions). 4-Empirical results 4-1 Data In Exhibit 4 we show the mean, standard deviation and the median of the corporate bond spread, the corresponding sovereign spread and its structural determinants by country and for the entire sample (pooled data). Note that the average, median and standard deviation values of the 2-Year rolling volatility of the 3-month UST-bond yield (USTB-yield vol) should be the same across countries but they differ slightly because the panel is unbalanced. Mean corporate bond spreads are slightly higher (and generally more volatile) than their corresponding sovereign spreads with the exception of Chile, where corporate spreads are more than two times higher than sovereign spreads, and Argentina, where corporate spreads are almost 400 basis points lower than sovereign spreads over the relevant period due to the sovereign debt default and later restructuration.. Corporate bonds are traded between 22% and 53% (Argentina) of the calendar working days and display a large standard deviation. The average time to maturity expressed in years is roughly 10. In Exhibit 4, we present further evidence on the term-structure distribution across countries. We observe an unconditional, unadjusted for credit-quality negative correlation between corporate spreads and time to maturity that can be fitted using all available observations in our sample. Exhibit 5 depicts the second order polynomial approximation of this relationship. Exhibit 6 displays the fitted curves by country and sub-periods. We can see there is a significantly negative (unconditional) correlation between corporate spreads and time to maturity but, 1) it is highly unstable over time and (Exhibit 6, Panel a), 2) it appears to be mainly driven by cross-country differences (Exhibit 6, panel b), and 3) in general these curves lend support to the standard hump-shaped credit spread-to-maturity curves predicted by Merton [1974] or Shimko et al [1993] and tested by Sarig and Warga [1989b] in the case of risky bonds. 4-2 Econometric Results

15
In this section we estimate Equation (6) over the full sample (667 observations in 1996-2004) using 8 different estimators, and we perform a number of specification and residual tests as said above (Exhibits 7 and 8). Then we present and discuss the econometric output of the multivariate analysis of the determinants of Latin American corporate spreads and the sovereign ceiling test, emphasizing their statistical and economic significance in that order. From Exhibits 7 and 8 (with and without allowing for specific sovereign spread coefficients, respectively) we can see that the relatively “best-performing” estimator is GLS-RE 20 As we are primarily interested in assessing the idiosyncratic effect of sovereign spreads on corporate spreads, we limit our results discussion to the regressions with bond-specific sovereign spread coefficients (Exhibit 8). 4-2-1 Statistical significance of sovereign spreads and the sovereign ceiling test
The coefficient associated with the sovereign spread becomes extremely
statistically significant when bond-idiosyncratic slopes are allowed, as Exhibit 8 shows (with each specific coefficient displayed in Exhibit 13). The use of different slopes for sovereign spreads is supported by the result of the joint-Wald test for different slopes across bonds. We strongly reject the null hypothesis of non-significant differences across slopes, i.e., we conclude the point estimates associated with sovereign spreads are significantly statistically different. In addition, we can see from Exhibits 7 and 8 that allowing for different slopes in sovereign spreads sizably increases the adjusted-R2.
Notwithstanding the statistically significant positive impact of sovereign risk on corporate bond spreads, Exhibit 10, Exhibit 11 and Exhibit 12 show that market participants seem not to be applying the sovereign ceiling rule for most Latin American bonds/firms included in our sample. The test is performed over the GLS-RE estimator. Exhibit 11 presents two alternative methodologies to test for the sovereign ceiling hypothesis. First, we use the approach followed by Durbin [2005] and Grandes and Peter [2005]: the null hypothesis of sovereign ceiling cannot be rejected when the sovereign spread coefficient (β1) is positive and Prob. (β1=1) >0.05 or Prob. (β1=1)<0.05 and β1>1. These results are presented in Column (b) of Exhibit 11. In Column (a) we introduce the additional (but reasonable) constraint that Prob. (β1=0) must be lower than 0.05 to avoid sovereign ceiling rejection when we shouldn’t reject it (otherwise, we would not only be able to reject that β1≥1, but it would also be impossible to reject that β1=0). When we follow the methodology adopted by Grandes and Peter [2005], rejection rates range from 0.38 in Chile to 0.8 in Argentina. However, when we introduce the “new” conditional approach, rejection rates fluctuate between 0.77 and 0.9, i.e., market participants do not assess transfer risk as binding in 77% to 90% of the bonds. Overall, our results are in line with Durbin and Ng [2005], who also use US dollar-denominated bonds issued in jurisdictions such as New York or London. The new sovereign ceiling test yields the following results when contrasted with the actual rating ceilings adopted by Standard and Poor’s. First, it is not surprising that the sovereign ceiling hypothesis is rejected most of the time because nearly all firms (21) in 20 We make this choice despite rejecting the null of the Hausman test, which favours the FE estimator to RE as the latter is inconsistent though efficient under the alternative hypothesis, The Hausman’s test may not be reliable under certain conditions. Given that RE-GLS remains efficient and unbiased and corrects for both serial correlation and heteroskedasticity we prefer to retain this estimator.

16
our sample are industrial, and most are multinational and tradable good producing corporations. This is a necessary, but not sufficient condition for firms to pierce the sovereign ceiling, as explained in Durbin and Ng [2005], Grandes and Peter [2005] or Moody’s [2006]. For seven of these firms (38 bonds) the market views appear consistent with the succesive relaxations of the rating ceiling policy for some sub-periods or over the full sample, namely YPF SA (Argentina) in 1997-2004, Telenorte (Brazil) from June 2003 until November 2003, Televisa Group (Mexico) from June 2004 until January 2005, Kimberley Clark (Mexico) from July 1999 until November 2005, America Movil (Mexico) from August 2002 until January 2005, Coca Cola Femsa (Mexico) from October 1996 to date, and CEMEX (Mexico) from November 1997 until January 2005. 21 Second, Unibanco, a Brazilian financial corporate, has bonds for which the sovereign ceiling hypothesis holds (2) and some (7) for which it does not. We would have expected the sovereign ceiling to be applied across all bonds issued by Unibanco, as banks and financial companies are typically more exposed to government risk, and generally to systemic risk. To our surprise, we realize that Unibanco pierced the rating ceiling for a short period of time, i.e., June 2003-November 2003. The bond market participants may regard Unibanco as unconstrained overall by the ceiling, despite viewing that the rule is applicable to two bonds around the period 2002-2004 which post the highest relative liquidity records (26% and 23.5% of days with transactions). This result may have to do with the shortness of the sample. Third, besides Unibanco, there are other firms for which there is mixed evidence regarding the rejection of the sovereign ceiling hypothesis: Comercial del Plata (an Argentinean industrial holding, the ceiling binds in one out of three bonds), Enersis (a private Chilean utility, the ceiling binds in one out of six bonds), Andina (a Chilean food and beverage producer, the ceiling binds in two out of three bonds) and Hylsamex (a Mexican steel and metal manufacturer, the ceiling binds in two out of three bonds). There are no episodes of actual piercing of the rating ceiling for any of these firms. Regarding Andina and Hylsamex, we think that these seemingly counterintuitive results may be explained by the different number of observations available for each bond, and sometimes by the corresponding sovereign bond with which the matching could be sub-optimal (different coupon size, diverging maturities, etc). Still, if we picked their most liquid bonds, the conclusion would be to accept the null of the applicability of the sovereign ceiling. The case of Enersis is different because the ceiling binds in one out of six bonds and because we reject the null of sovereign ceiling when we keep its most liquid bond (44% of days with transactions). Finally, we would –similarly to Andina and Hylsamex- conclude, should we choose the bond associated with the longest span (1996q3-2001q1) and the highest liquidity (20.55% of days with transactions), that the markets do apply the ceiling rule to Comercial del Plata Summing up, sovereign risk is a very statistically significant factor to explain corporate bond spreads (we will see later that indeed it is the single most important explanatory variable), but the sovereign ceiling hypothesis does not generally hold. 21 Note that among the industrials firms, Braskem (Brazil) appears as the only inconsistent case. Although its credit rating pierced the sovereign ceiling from June 2003 until November 2003, market views seem to reflect the opposite, as we accept the null hypothesis that market participants apply the sovereign ceiling rule to the Braskem´s bond.

17
4-2-2 Statistical significance of firm and bond-idiosyncratic determinants .Liquidity is the most statistically significant variable, with a negative impact on corporate spreads which significant at 5%. A 10 percentage point increase in the number of days with transactions reduces corporate bond spreads by 8 basis points. This result contrasts with Grandes and Peter [2005] who found that liquidity is not significantly correlated to South African corporate spreads in local currency. However, our result is in line with Longstaff, Mithal and Neis [2005] who find “… a significant non-default component in corporate spreads…[which] is strongly related to measures of bond-specific illiquidity”. The quasi-debt to firm-value (leverage) ratio is also very significantly statistically correlated to corporate spreads Its ultimate impact on corporate spreads depends on the interaction with the risk-free interest rate volatility and, mainly, with the remaining time to maturity. The stand alone effect is positive: one percentage point increase in our leverage ratio (d rises by 0,01) increases the dependent variable by 0,17 basis points. The interaction effect with the risk-free interest rate volatility is positive but insignificant while the interaction with time to maturity is negative and very statistically significant. The standalone effect of maturity on corporate spreads is positive and very significant but is unusually high and inconsistent across the estimators. When interacte with leverage, we notice however a consistently negative impact on corporate risk meaning that for increasingly leveraged firms (i.e., for a representative firm with a quasi-debt to firm ratio value equal to the whole sample average (0,11)), one year increase in time to maturity will reduce required corporate bond spreads by 80 basis points, that is the interaction term effect will counter the standalone positive (but not robust) effect.. The other structural determinants (risk-free interest rate volatility and firm-value volatility) are not statistically significant. 4-2-3 Economic significance Here we compute the part of the explained variance of corporate bond spreads that is accounted for by each determinant. Performing three alternative variance decomposition methods based on OLS and GLS-RE estimators, and the R-squared coefficient (see Wooldridge [2002]) we find that that the sovereign spread is the major determinant of corporate bond spreads in our sample (Exhibit 12) explaining on average 40% of the corporate spread fitted variance. This result is similar to that obtained by Grandes and Peter [2005] and (to some extent) Collin-Dufresne et al. [2001]. However, it disagrees with Cavallo and Valenzuela [2010] where firm-specific factors account for the largest share of corporate default risk, followed by industry and country fixed effects. . As for the control variables, we find that the quasi-debt to firm-value (leverage) ratio is the most economically significant structural determinant of corporate bond spreads. It accounts for 7 to 22% (adding up direct and interaction effects) of the corporate bond spread total variance, depending on the variance decomposition method and the econometric estimator. Among the other covariates, only time to maturity appears to have a significant (albeit indirectly through the interaction with the quasi-debt to
18
firm-value ratio) economic impact on corporate bond spreads. Liquidity only accounts for less than 2% of the total variance in corporate spreads. 5- Summary and conclusions Exploiting a sample of 72 US dollar-denominated corporate bonds issued by 22 Latin American firms –predominantly industrial- from Argentina, Brazil, Chile, and Mexico over the period 1996-2004, this paper aims to answer three questions: ) is sovereign risk an statistical and economically significant determinant of the corporate credit spread, controlling for firm and bond specific characteristics?, 2) If yes, do market participants apply the sovereign ceiling rule adopted by rating agencies in the pricing of our bond market data?, and 3) how do market views compare with the rating agencies ceiling policy for each corporate? Our main findings can be summarized as follows: 1.-Sovereign spreads -a proxy for systematic risk in our debt pricing context- are economically far more relevant than firm-specific or firm/bond idiosyncratic factors to explain the variation in corporate spreads (40% on average). Moreover, we find a very statistically significant impact of sovereign risk on corporate spreads when we allow for different impacts of the former on the latter across firms and bonds. This finding is in line with Grandes and Peter [2005]. By contrast, our results go counter to Cavallo and Valenzuela [2010], who, for a different sample of emerging-market corporations (including Latin America) and time span (1999-2006), find that firm and bond-specific variables explain the largest part of the corporate spreads variability. Recent rating upgrades and spreads compression in countries like Brazil and Mexico may explain part of these divergent findings. 2.- We find strong evidence against the application of the “sovereign ceiling rule” by market participants. In principle, this should not come as a surprise because 21 of the 22 sampled firms are industrial, multinational corporations, some of which have parent support and produce tradable goods. The percentage of rejection of the sovereign ceiling rule ranges from 77% (Chile) to 90% (Argentina) over the 72 bonds issued by the 22 firms we study. Moreover, for seven out of twenty two firms (representing 38 bonds) we checked that market views were consistent with the rating agencies’ policy of allowing these corporations to pierce the sovereign ceiling for at least a sub-period within our sample.22 As for the other firms, the only puzzling result is Unibanco. Rating agencies allowed this Brazilian bank to pierce the ceiling from June 2003 and until November 2003. Normally, banks are rated at or below the sovereign rating, yet we come up with mixed evidence from the market views pointing to the acceptance of the sovereign ceiling hypothesis in the case of the most liquid bonds (2 of 9) issued by Unibanco.
22 These firms are: YPF SA (Argentina) from 1997 to 2004, Telenorte (Brazil) from June 2003 until November 2003, Televisa Group (Mexico) from June 2004 until January 2005, Kimberley Clark (Mexico) from July 1999 until November 2005, America Movil (Mexico) from August 2002 until January 2005, Coca Cola Femsa (Mexico) from October 1996 to date, and CEMEX (Mexico) from November 1997 until January 2005.
19
We must stress that we reject the sovereign ceiling hypothesis even for most Chilean bonds/firms (Exhibit 14) where we observed the largest positive differential between corporate and sovereign bond spreads (Exhibit 3). This result is useful to recall that corporate bond spreads higher than sovereign spreads do not necessarily imply that bond market participants apply the sovereign ceiling rule. A firm may bear a relatively high stand-alone risk, which may be reflected in wider spreads and hence higher expected or unexpected losses in case of default. These relatively higher corporate spreads might be the consequence of poor management and weak firm performance, rather than the result of a 100% sovereign transfer risk (1% increase in sovereign increase corporate spreads by the same amount). 3.- Regarding the firm and bond-specific variables, liquidity is the most statistically significant, and enters the econometric estimations with the expected negative coefficient, i.e., more liquid corporate bonds command lower spreads, hence lower corporate cost of debt, all else equal. Nevertheless, its economic significance is less, as it accounts for about 2% of the total variation in corporate bond spreads. On the other hand, the financial leverage (quasi-debt to firm-value) ratio is slightly less statistically significant than liquidity, but it is quite relevant from an economic point of view, displaying a strong positive impact on corporate spreads, namely that increasingly leveraged firms will raise more expensive debt capital all else equal. Furthermore, when we take into account the interaction effects of leverage with the risk-free interest rate volatility and, mainly, with time to maturity, we find that leverage accounts for up to 22% of total variation in corporate bond spreads. Finally, time to maturity is also economically relevant-but only indirectly-through the above mentioned interaction effect with leverage, explaining between 5 to 11% of the corporate spreads’ total variation. When significant, its impact on corporate spreads is mostly negative, which validates our preliminary (unconditional) findings regarding a negatively sloped corporate spread to maturity curve. In other words, highly leveraged firms can also decrease their spreads and ultimately their cost of bond finance by lengthening the maturity of their bond liabilities.
References
1) Athanassakos, G. and P. Carayannopoulos, "An Empirical Analysis of the Relationships of Bond Yields and Macro-Economic Factors." Applied Financial Economics, 11:2 (2001), pp. 197-207.
2) Black, F., and M. Scholes, 1973, The Pricing of Options and Corporate Liabilities, Journal of Political Econom. 81:3, 637 - 659.
3) Borensztein , E., Cowan, K, and Valenzuela, P,. 2006 , Sovereign Ceilings “Lite? The Impact of Sovereign Ratings on Private Ratings in Emerging Market Economies”, Inter-American Development Bank, unpublished manuscript
4) Breusch, T. S., and L. G. Godfrey, 1978, Testing Against General Autorregresive and Moving Average Error Models when the Regressors Include Lagged Dependent Variables, Econometrica. 46, 1293-1302.
5) Briys, E., and De Varenne, F., 1997, Valuing Risky Fixed Rate Debt: An Extension, Journal of Financial and Quantitative Analysis, 32:2, 239-249.

20
6) Cavallo, E. And Valenzuela, P., 2010, The determinants of corporate risk in emerging markets: an option-adjusted spread analysis, International Journal of Finance & Economics, 15(1), 59-74.
7) Collin-Dufresne, P., and Solnik, B., 2001, On the Term Structure of Default Premia in the Swap and LIBOR Markets, Journal of Financ. 56 :3, 1095-1115.
8) Collin-Dufresne, P., Goldstein, R. S. and J. Spencer Martin, 2001, Determinants of Credit Spread Changes, Journal of Finance. 56:6, 2177-2208.
9) Cossin, D., and Pirotte, H., 2001, Advanced Credit Risk Analysis (Chichester: John Wiley & Sons).
10) Das, S., and P. Tufano, 1996, Pricing Credit Sensitive Debt when Interest Rates, Credit Ratings and Credit Spreads are Stochastic, Journal of Financial Engineering. 5:2,161-198.
11) Duffie, D., and Lando, D., 2001, Term Structures of Credit Spreads with Incomplete Accounting Information, Econometrica. 69:3, 633-664.
12) Duffie, D., and K. J. Singleton, 1999, Modeling Term Structures of Defaultable Bonds, Review of Financial Studies. 12:4, 687-720.
13) Durbin, E., and. Ng, D. T., 1999, Uncovering country risk in emerging market bond prices, International Finance Discussion Paper N°639, Board of Governors of the Federal Reserve System (U.S.).
14) Durbin, E., and Ng, D. T., 2005, The Sovereign Ceiling and Emerging Market Corporate Bond Spreads, Journal of International Money and Finance. 24:4,.631-649.
15) Elton, E. J., Gruber, M. J., Agrawal, D. and Mann, C., 2001, Explaining the Rate Spread on Corporate Bonds, Journal of Finance, 54:1,247-277.
16) Ferri, G.; Majnoni, G., and Chiuri, M.C, 2002, The Macroeconomic Impact of Bank Capital Requirements in Emerging Economies: Past Evidence to Assess the Future. Journal of Banking and Finance. 26:5, 881-904.
17) Fielding, N. G., and Fielding, J. L., 1986, Linking Data: the Articulation of Qualitative and Quantitative Methods in Social Research, Sage University Paper Series on Qualitative Research Methods, 4, (London: Stage).
18) Fitch Ratings, "Rating Above the Sovereign: An Update." (London: Fitch Ratings Ltd.), 2001.
19) Fons, J. S., 1994, Using Default Rates to Model the Term Structure of Credit Risk, Financial Analysts Journal. 50, 25-32.
20) Grandes, M., and Peter, M., 2005, How Important Is Sovereign Risk in Determining Corporate Default Premia? The Case of South Africa, International Monetary Fund Working Paper 05/217.
21) Grandes, M., and M. Peter, 2006, How Important Is Sovereign Risk in Determining Corporate Default Premia? The Case of South Africa, presentation made at the 11th Annual Meeting of the Latin American and Caribbean Economic Association, Mexico, November 3,.
22) Green, W., 2003, Econometrics, (New York: Prentice Hall).

21
23) Grosz, F., 2009, Taxation Structure for Financial Instruments in Argentina, Brazil, Chile and Peru, CEF Working Paper 30.
24) Hausman, J., 1978, Specification Tests in Econometrics, Econometrica. 46, 1251-1271.
25) Helwege, J., and Turner, C. M., 1999, The Slope of the Credit Yield Curve for Speculative-Grade Issuers, Journal of Finance. 54 :5,1869-1884.
26) International Monetary Fund, 2009, Global Financial Stability Report, “The Road to Recovery,” Chapter 1. World Economic and Financial Surveys (Washington, September).
27) Jarrow, R. and Turnbull, S., 1995, Pricing Derivatives on Financial Securities Subject to Credit Risk, Journal of Finance. 50:1, 53-85.
28) Jarrow, R., Lando, D., and Turnbull, S., 1997, A Markov Model of the Term Structure of Credit Spreads. Review of Financial Studies. 10:2, 481-523.
29) Lando, D., 1998, On Cox Processes and Credit Risky Bonds, Review of Derivatives Research. 2: 2/3, 99-120.
30) Litterman, R. and Iben, T., 1991, Corporate Bond Valuation and the Term Structure of Credit Spreads, Journal of Portfolio Management.17, 52-64.
31) Longstaff, F. A., Mithal, S. and Neis, E., 2005, Corporate Yield Spreads: Default Risk or Liquidity? New Evidence from the Credit Default Swap Market, Journal of Finance. 60:5, 2213-2256.
32) Longstaff, F. A. and Schwartz, E. S., 1995, A Simple Approach to Valuing Risky Fixed and Floating Rate Debt, Journal of Finance. 50:3, 789-819.
33) Madan, D. B. and Unal, H., 1998, Pricing the Risks of Default, Review of Derivative Research. 2, 121-160.
34) Merton, R. C., 1974, On the Pricing of Corporate Debt: The Risk Structure of Interest Rates, Journal of Finance. 29, 449-470.
35) Min, H. G., Lee, D.H., Nam, C., Park, M. C. and Nam, S. H., 2003, Determinants of emerging market bond spreads: cross country evidence, Global Finance Journal. 14, 271-286.
36) Moody's Investors Service, 2001a, Change in Country Ceiling Approach, Foreign Currency Bond Ratings of 38 Issuers Reviewed, press release, www.moodys.com .
37) Moody's Investors Service, 2001b, Revised Country Ceiling Policy, Rating Methodolgy , June (New York: Moody's Investors Service).
38) Moody's Investors Service, 2006, Revised Foreign-Currency Ceilings to Better Reflect Reduced Risk of a Payments Moratorium in Wake of Government Default, Rating Methodology, May (New York: Moody's Investors Service).
39) Pye, G., 1974, Gauging the Default Premium, Financial Analysts Journal. 30:1, 49-52.
40) Sarig, O., and Warga, A., 1989, Some Empirical Estimates of the Risk Structure of Interest Rates, Journal of Finance. 44:5,1351-1360.

22
41) Shimko, D., Tejima, N. and Van Deventer, D., 1993, The Pricing fo Risky Debt When Interest Rats are Stochastic, Journal of Fixed Income. September, 58-65.
42) Standard & Poor's, 1997, Less Credit Risk for Borrowers in Dollarized Economies, CreditWeek, April 30. (New York: Standard and Poor's),.
43) Standard & Poor's, 2001, Sovereign Risk and Ratings Above the Sovereign, Commentary, July 23 (New York: Standard and Poor's).
44) Vasicek, O., 1977, An Equilibrium Characterization of the Term Structure, Journal of Financial Economics. 5:2, pp. 177-88.
45) Wooldridge, J., 2002, Econometric Analysis of Cross Section and Panel Data. (Cambridge: Massachusets Institute of Technology).

23
Exhibit 1: Sample Issuers and Issues by Country
Country Number of Firms
Industrials or
Utilities
Financials Total number of Corp. Bonds
Argentina 3 3 0 10 Brazil 5 4 1 14 Chile 5 5 0 14 Mexico 9 9 0 34 Full sample 22 21 1 72

24
Exhibit 2: Main characteristics of corporate and related sovereign bonds
Bond Id Country Firm Sector Coupon Issue Date Redemp. date Issuer Rating History Name Coupon Issue Date Redemp. date Issuer Rating History
101 Alpargatas Textile 9 02/11/1993 26/11/1996 N/A Argentina (2) 1993 81/4% 02/08/00 S 8.25 07/07/1993 02/08/2000
105 Other sectors 8.75 01/12/1993 14/12/1998 Argentina (2) 1993 81/4% 02/08/00 S 8.25 07/07/1993 02/08/2000
106 Other sectors 10.75 29/02/1996 06/03/1998 Argentina (2) 1993 81/4% 02/08/00 S 8.25 07/07/1993 02/08/2000
107 Other sectors 11.5 01/05/1996 09/05/2000 Argentina (2) 1993 81/4% 02/08/00 S 8.25 07/07/1993 02/08/2000
108 Oil and Gas 7 26/03/1997 26/10/2002 Mendoza Province 199610% 25/07/02 Q 10 08/08/1996 25/07/2002
109 Oil and Gas 7.5 06/10/1995 26/10/2002 Mendoza Province 199610% 25/07/02 Q 10 08/08/1996 25/07/2002
110 Oil and Gas 7.75 25/08/1997 27/08/2007 Mendoza Province 199710% 04/09/07 10 02/09/1997 04/09/2007
111 Oil and Gas 9.125 20/02/1999 24/02/2009Buenos Aires 2000 131/4% 29/03/10Registered
13.25 16/03/2000 29/03/2010
24/03/2006 B; 01/06/2005 B-; 21/03/2003 CCC+; 13/07/2001 B-; 08/05/2001 B;
26/03/2001 B+; 14/11/2000 BB-; 14/03/2000 BB; 17/03/1997 BB-
112 Oil and Gas 8 02/02/1994 15/02/2004 Argentina1999 F/R04/04144a Q 8.25 15/03/1999 06/04/2004 See Above
113 Oil and Gas 7.25 04/03/1998 15/03/2003 Mendoza Province 199610% 25/07/02 Q 10 08/08/1996 25/07/2002 See Above
Corporate Bond Features Related Sovereign Bond Characteristics
Argentina
21/03/2003 CCC+; 03/12/2001* DDD; 06/11/2001* C; 02/11/2001* CC;
30/10/2001 CC; 09/10/2001 CCC+; 12/07/2001* B-; 12/07/2001 B-; 11/07/2001* B-; 08/05/2001 B;
28/03/2001* B+; 26/03/2001 B+; 20/03/2001* BB-; 14/11/2000 BB-; 21/09/2000* BB; 03/12/1997* BB; 28/05/1997* BB; 02/04/1997 BB;
Comercial del Plata N/A
YPF03/06/2003 BB; 23/01/2002 B+; 13/07/2001
BB-; 08/05/2001 BB; 26/03/2001 BB+; 22/04/1997 BBB-
02/10/2006 B+; 24/03/2006 B; 01/06/2005 B-; 29/10/2004 CCC+ ; 20/09/2004* NR;
10/04/2002* C; 02/11/2001* CC; 01/11/2001 CC; 10/10/2001 CCC+ ; 13/07/2001 B- ; 12/07/2001* B- ; 08/05/2001 B ; 28/03/2001* B+ ;
08/08/1997 BB-
25
Exhibit 2: Main characteristics of corporate and related sovereign bonds (cont.)
Bond Id Country Firm Sector Coupon Issue Date Redemp. date Issuer Rating History Name Coupon Issue Date Redemp. date Issuer Rating History
202 Braskem Chemical products 11.75 22/01/2004 22/01/2014 03/11/2005 BB; 19/09/2004 BB-; 19/06/2003
B+
Brazil-CBond (SR-L) FrontLoaded Interest RD 8%15/04/14
8 15/04/1994 15/04/2014
205 10.25 02/11/1993 23/11/2001 Brazil 1996 8 7/8%05/11/01 S 8.875 31/10/1996 05/11/2001
206 11.125 20/05/1996 24/05/2004 Brazil 1999 11 5/8%15/04/04 S 11.625 23/04/1999 15/04/2004
207 Tele Norte Telecommunications 8 10/12/2003 18/12/2013 03/11/2005 BB; 19/09/2004 BB-; 03/07/2002
B+Brazil (Exit) 1988 6%15/09/13 6 15/09/1988 15/09/2013
212 7.75 12/08/1997 14/08/2000 Brazil 1996 8 7/8%05/11/01 S 8.875 31/10/1996 05/11/2001
213 8.75 30/08/2000 30/08/2002 Brazil 1996 8 7/8%05/11/01 S 8.875 31/10/1996 05/11/2001
214 8.875 12/04/2000 26/04/2002 Brazil 1996 8 7/8%05/11/01 S 8.875 31/10/1996 05/11/2001
215 9 29/06/2000 31/12/2001 Brazil 1996 8 7/8%05/11/01 S 8.875 31/10/1996 05/11/2001
216 7 18/04/2001 18/10/2002 Brazil 1996 8 7/8%05/11/01 S 8.875 31/10/1996 05/11/2001
217 9.375 22/04/2002 30/04/2012 Brazil-Dcb.(Series-L) 94F/R 15/04/04-12 S 6.125 15/04/1994 15/04/2012
219 9.375 22/04/2002 30/04/2012 Brazil-Dcb.(Series-L) 94F/R 15/04/04-12 S 6.125 15/04/1994 15/04/2012
220 7.375 05/12/2003 15/12/2013 Brazil (Exit) 1988 6%15/09/13 6 15/09/1988 15/09/2013
221 3 28/01/2004 10/08/2005Brazil Realty 199710.05% 22/07/05P07/02
10.05 15/07/1997 22/07/2005
222 Usiminas Steel and Metals 6.375 29/09/2003 07/04/2005 18/05/2006 BB+; 03/11/2005 BB;
19/09/2004 BB-; 14/01/2004 B+Brazil 2001 9 5/8%15/07/05 S 9.625 12/05/2001 15/07/2005
Brazil
05/02/2007* BB ; 28/06/2006* BB ; 28/02/2006 BB ; 14/12/2005* BB- ;
11/10/2005* BB- ; 11/07/2005* BB- ; 28/09/2004* BB- ; 17/09/2004 BB- ; 06/11/2003* B+ ; 03/06/2003* B ; 02/07/2002 B+ ; 03/01/2001 BB- ; 14/01/1999 B+ ; 02/04/1997 BB- ;
18/07/1995 B+ ; 30/11/1994 B
Gerdau Metalurgica Steel and Metals 03/11/2005 BB+; 01/09/2005 BB-
Unibanco Finance and Insurance
28/02/2006 BB; 19/09/2004 BB-; 03/07/2002 B+; 04/01/2001 BB-; 14/01/1999 B+;
21/05/1997 BB-
Corporate Bond Features Related Sovereign Bond Characteristics

26
Exhibit 2: Main characteristics of corporate and related sovereign bonds (cont.)
Bond Id Country Firm Sector Coupon Issue Date Redemp. date Issuer Rating History Name Coupon Issue Date Redemp. date Issuer Rating History
301 6.9 26/11/1996 01/12/2006 Chile 2002 5 5/8%23/07/07 S 5.625 18/04/2002 23/07/2007
302 7.4 26/11/1996 01/12/2016 Chile 2003 5 1/2%15/01/13 S 5.5 09/01/2003 15/01/2013
303 6.6 26/11/1996 01/12/2026 Chile 2003 5 1/2%15/01/13 S 5.5 09/01/2003 15/01/2013
304 7.375 19/11/2003 15/01/2014 Chile 2003 5 1/2%15/01/13 S 5.5 09/01/2003 15/01/2013
305 7.375 19/11/2003 15/01/2014 Chile 2003 5 1/2%15/01/13 S 5.5 09/01/2003 15/01/2013
306 7.375 24/11/2003 15/01/2014 Chile 2003 5 1/2%15/01/13 S 5.5 09/01/2003 15/01/2013
307 Embonor Food and Beverages 9.875 15/09/1999 15/03/2006 09/06/2005 NR; 25/02/2004 BB+; 04/06/2003
BBB-; 11/03/1999 BBBChile 2002 5 5/8%23/07/07 S 5.625 18/04/2002 23/07/2007
308 7 01/10/1997 03/10/2007 Chile 2002 5 5/8%23/07/07 S 5.625 18/04/2002 23/07/2007
309 7.625 03/10/1997 01/10/2027 Chile 2003 5 1/2%15/01/13 S 5.5 09/01/2003 15/01/2013
310 7.875 03/10/1997 01/10/2097 Chile 2003 5 1/2%15/01/13 S 5.5 09/01/2003 15/01/2013
311 8.625 23/07/2003 01/08/2015 Chile 2003 5 1/2%15/01/13 S 5.5 09/01/2003 15/01/2013
312 8.35 23/07/2003 01/08/2013 Chile 2003 5 1/2%15/01/13 S 5.5 09/01/2003 15/01/2013
314 7.625 15/07/1996 15/07/2006 Chile 2002 5 5/8%23/07/07 S 5.625 18/04/2002 23/07/2007
315 8.375 09/01/1999 01/01/2006 Chile 2002 5 5/8%23/07/07 S 5.625 18/04/2002 23/07/2007
Telecommunications
01/09/2004 BBB+; 06/05/2004 BBB+; 10/03/2004 BBB+; 09/09/2003 BBB+;
27/11/2002 BBB+
Enersis Electricity 21/02/2003 BBB-; 11/12/2002 BBB; 31/05/2002 BBB+; 11/07/1995 A-; 09/11/1994 BBB+
Andina Food and Beverages
28/04/2006* A-; 24/04/2006* A-; 11/05/2005* A-; 21/04/2004* A-; 12/05/2003* A-; 29/10/2002* A-; 24/07/1995 BBB+
Endesa Electricity 09/02/2005* BBB-; 01/07/2004* BBB-; 14/05/2003* BBB-; 21/02/2003 BBB-
CTC
Chile
09/03/2006* A ; 14/12/2005* A ; 28/03/2005* A ; 02/02/2004* A- ; 14/01/2004 A ; 24/02/2003* A- ; 20/12/2001* A- ; 11/07/1995 A- ;
20/12/1993 BBB+ ; 17/08/1992 BBB
Corporate Bond Features Related Sovereign Bond Characteristics

27
Exhibit 2: Main characteristics of corporate and related sovereign bonds (cont.)
Bond Id Country Firm Sector Coupon Issue Date Redemp. date Issuer Rating History Name Coupon Issue Date Redemp. date Issuer Rating History
501 8.75 01/04/1993 21/04/1998 Mexico 1993 7 1/4%16/03/98 7.25 24/02/1993 16/03/1998
502 9.375 13/04/1998 14/04/2005 UnitedMexicoStates19999 3/4% 06/04/05 S 9.75 26/03/1999 06/04/2005
508 Posadas Grupo Other sectors 10.375 06/02/1997 13/02/2002 15/07/2004 BB- Mexico 1992 8 1/2%15/09/02 S 8.5 15/09/1992 15/09/2002
511 10 26/10/1992 09/11/1997 UnitedMexicoStates19728 1/8% 01/12/76-97 S 8.125 01/12/1972 01/12/1997
512 8.625 02/08/2000 08/08/2005 UnitedMexicoStates19999 3/4% 06/04/05 S 9.75 26/03/1999 06/04/2005
513 8.625 02/08/2000 08/08/2005 UnitedMexicoStates19999 3/4% 06/04/05 S 9.75 26/03/1999 06/04/2005
514 8 07/09/2001 13/09/2011 UnitedMexicoStates20027 1/2% 14/01/12 S 7.5 08/01/2002 14/01/2012
515 8 13/09/2001 13/09/2011 UnitedMexicoStates20027 1/2% 14/01/12 S 7.5 08/01/2002 14/01/2012
518 11 28/01/1993 23/02/1998 Mexico 1993 7 1/4%16/03/98 7.25 24/02/1993 16/03/1998
519 10.5 23/04/2002 15/12/2010 UnitedMexicoStates20018 3/8% 14/01/11 S 8.375 10/01/2001 14/01/2011
520 9.25 24/09/1997 15/09/2007 UnitedMexicoStates19988 5/8% 12/03/08 8.625 06/03/1998 12/03/2008
522 8.875 28/07/1999 01/08/2009 Mexico W/W 10 3/8%17/02/09 Early 10.375 10/02/1999 17/02/2009
523 8.875 03/08/1999 01/08/2009 Mexico W/W 10 3/8%17/02/09 Early 10.375 10/02/1999 17/02/2009
526 10.75 16/07/2004 23/07/2011 UnitedMexicoStates20027 1/2% 14/01/12 S 7.5 08/01/2002 14/01/2012
527 11.75 22/10/2003 01/11/2013 UnitedMexicoStates20035 7/8% 15/01/14 S 5.875 08/10/2003 15/01/2014
Comercial Mexicana Wholesale and retail trade
27/01/2005* BBB-; 15/04/2003* BBB-; 07/02/2002 BBB-; 13/03/2000 BB+;
31/03/1998 BB
17/11/2004 BB-; 09/06/2004 B; 02/01/2003 CCC+
Kimberly ClarkPaper and
pap. related products
03/11/2005 A-; 07/02/2002 BBB+; 14/03/2000 BBB; 20/07/1999 BBB-
Televisa Gpo Other sectors
17/06/2004* BBB ; 30/03/2004* BBB- ; 18/09/2003* BBB- ; 18/02/2003* BBB- ;
15/02/2002 BBB-; 06/04/2000 BB+; 26/04/1996 BB
Hylsamex
Corporate Bond Features Related Sovereign Bond Characteristics
Vitro Non-metallic minerals
; 23/03/2006 B-; 08/03/2005 B; 26/09/2003 B+; 19/05/2003 BB-; 22/04/1997 BB
Mexico (1)
14/12/2005* BBB; 07/12/2005* BBB; 31/01/2005 BBB ; 22/11/2004* BBB- ; 24/09/2003* BBB- ; 07/02/2002 BBB- ; 15/01/2002* BBB- ; 03/05/2000* BB+ ;
10/03/2000 BB+ ; 30/08/1995* BB ; 10/02/1995 BB ; 29/07/1992 BB+
Steel and Metals

28
Exhibit 2: Main characteristics of corporate and related sovereign bonds (cont.)
Bond Id Country Firm Sector Coupon Issue Date Redemp. date Issuer Rating History Name Coupon Issue Date Redemp. date Issuer Rating History
532 4.125 02/03/2004 01/03/2009 Mexico W/W 10 3/8%17/02/09 Early 10.375 10/02/1999 17/02/2009
533 5.5 02/03/2004 01/03/2014 UnitedMexicoStates20035 7/8% 15/01/14 S 5.875 08/10/2003 15/01/2014
539 5.7735 20/04/2004 27/04/2007 Mexico 1997 9 7/8%15/01/07 Early 9.875 14/01/1997 15/01/2007
542 8.95 01/11/1996 01/11/2006 Mexico 1997 9 7/8%15/01/07 Early 9.875 14/01/1997 15/01/2007
543 9.5 01/07/1992 22/07/1997 UnitedMexicoStates19728 1/8% 01/12/76-97 S 8.125 01/12/1972 01/12/1997
544 10 21/10/1992 05/11/1999 Mexico 1993 6.97%12/08/00 S 6.97 02/04/1993 12/08/2000
545 8.5 16/08/1993 31/08/2000 Mexico 1993 6.97%12/08/00 S 6.97 02/04/1993 12/08/2000
546 8.875 27/05/1993 10/06/1998 Mexico 1993 7 1/4%16/03/98 7.25 24/02/1993 16/03/1998
547 9.5 07/09/1994 20/09/2001 Mexico 1996 9 3/4%06/02/01 Registered S 9.75 06/02/1996 06/02/2001
548 10.75 17/07/1996 15/07/2000 Mexico 1993 6.97%12/08/00 S 6.97 02/04/1993 12/08/2000
549 12.75 16/07/1996 15/07/2006 UnitedMexicoStates20008 1/2% 01/02/06 S 8.5 25/07/2000 01/02/2006
550 12.75 17/07/1996 15/07/2006 UnitedMexicoStates20008 1/2% 01/02/06 S 8.5 25/07/2000 01/02/2006
551 9.25 10/06/1999 17/06/2002 Mexico 1992 8 1/2%15/09/02 S 8.5 15/09/1992 15/09/2002
552 9.625 01/10/1999 01/10/2009UnitedMexicoStates20009 7/8% 01/02/10Tranche 4
9.875 24/01/2000 01/02/2010
553 9.625 24/09/1999 01/10/2009UnitedMexicoStates20009 7/8% 01/02/10Tranche 4
9.875 24/01/2000 01/02/2010
554 9.625 25/09/1999 01/10/2009UnitedMexicoStates20009 7/8% 01/02/10Tranche 4
9.875 24/01/2000 01/02/2010
555 8.625 13/07/2000 18/07/2003 Mexico 1992 8 1/2%15/09/02 S 8.5 15/09/1992 15/09/2002
556 8.625 18/07/2000 18/07/2003 Mexico 1992 8 1/2%15/09/02 S 8.5 15/09/1992 15/09/2002
557 4.25 05/10/1994 01/11/1997 UnitedMexicoStates19728 1/8% 01/12/76-97 S 8.125 01/12/1972 01/12/1997
14/12/2005* BBB07/12/2005* BBB31/01/2005 BBB
22/11/2004* BBB- 24/09/2003* BBB- 07/02/2002 BBB- 15/01/2002* BBB- 03/05/2000* BB+ 10/03/2000 BB+ 30/08/1995* BB 10/02/1995 BB
29/07/1992 BB+
Coca Cola Femsa Food and Beverages
14/12/2004* BBB+; 07/02/2002 BBB; 13/03/2000 BBB-; 18/10/1996 BB+
Cemex S.A. Non-metallic minerals
22/02/2005* BBB; 27/09/2004* BBB; 29/01/2004* BBB; 12/08/2002* BBB; 26/05/2000 BBB-; 25/11/1997 BB+; 02/02/1995 BB; 22/10/1992 BB+
America Movil Telecommunications
03/11/2005 BBB+ ; 30/09/2005* BBB ; 22/02/2005* BBB ; 31/01/2005 BBB ; 28/10/2004* BBB ; 11/06/2004* BBB ; 21/10/2003* BBB ; 29/08/2002* BBB
Mexico (2)
Corporate Bond Features Related Sovereign Bond Characteristics
29
Exhibit 3: Data Sources and Measurement of Variables
Determinant Sub-components
Variable Measurement Symbol Explanation
Source
Yield to maturity of corporate bond. Sample is restricted to US dollars denominated bonds.
Thomson Financial Datastream
Corporate credit spread ( ) (Dependent Variable)
Risk free interest rate proxied by the yield to maturity of a US Treasury bond. (Using the US Treasury yield curve data)
US Treasury
Sovereign credit spread ( )
Yield to maturity of a government bond. For each corporate bond in the sample a government bond is selected according to to its maturity and cupon characteristics in order to match as close as possible corporate bond characteristics. See Exhibit 13.
Thompson Financial Datastream
B1, B2 Face value of total firm debt (B2 includes customer deposits for the financial institutions)
Economatica
PRF Price of risk-free bond that pays one dollar at maturity.(assuming a coupon equal to the one of the corporate bond)
Calculation
E Market value of firm equity. We use total market capitalization.
Economatica.
PT Market price of traded debt
Economatica
Leverage (quasi-debt-to-firm-value ratio) ( td )
(1)
, where
(2)
, where
V1, V2 Value of the firm Own calculation

30
Firm-value volatility ( Vσ )
(1)
over 8 quarters rolling window, .
Standard deviation of the log return of the firm value, calculated over 2-years rolling windows. V1 or V2 values of the firm are used respectively for each firm as explained above,
Own calculation
Interest rate volatility ( rσ )
over 8-quarter rolling window
r Instantaneous standard deviation of the risk-free rate. Calculation follows Shimko et al [1993], Where stands for the (absolute) quarterly change. We use the US yield curve with fixed maturity of 3 months.
US Treasury
Time to maturity (τ )
M Number of days from settlement date until maturity date (expressed in years)
Thompson Financial Datastream
Liquidity ( l ) This is the percentage of trading days with transactions (with reported price and volume)
Economatica
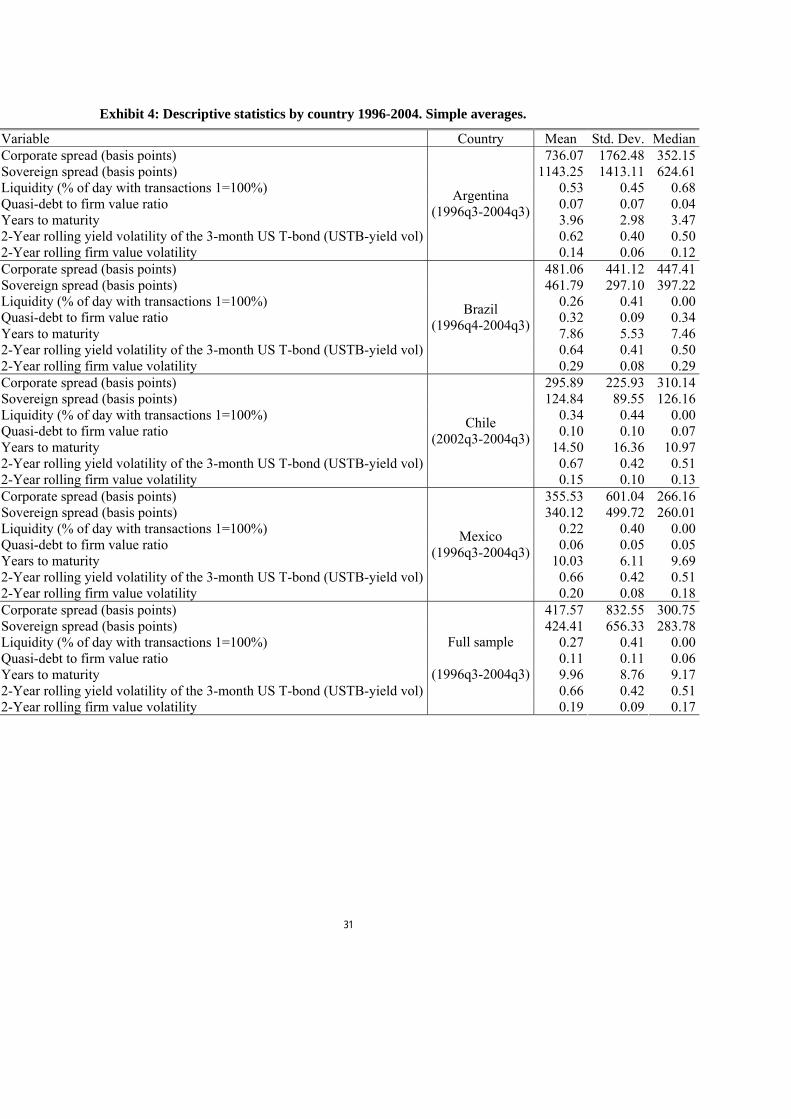
31
Exhibit 4: Descriptive statistics by country 1996-2004. Simple averages.
Variable Country Mean Std. Dev. MedianCorporate spread (basis points) 736.07 1762.48 352.15Sovereign spread (basis points) 1143.25 1413.11 624.61Liquidity (% of day with transactions 1=100%) 0.53 0.45 0.68Quasi-debt to firm value ratio 0.07 0.07 0.04Years to maturity 3.96 2.98 3.472-Year rolling yield volatility of the 3-month US T-bond (USTB-yield vol) 0.62 0.40 0.502-Year rolling firm value volatility
Argentina (1996q3-2004q3)
0.14 0.06 0.12Corporate spread (basis points) 481.06 441.12 447.41Sovereign spread (basis points) 461.79 297.10 397.22Liquidity (% of day with transactions 1=100%) 0.26 0.41 0.00Quasi-debt to firm value ratio 0.32 0.09 0.34Years to maturity 7.86 5.53 7.462-Year rolling yield volatility of the 3-month US T-bond (USTB-yield vol) 0.64 0.41 0.502-Year rolling firm value volatility
Brazil (1996q4-2004q3)
0.29 0.08 0.29Corporate spread (basis points) 295.89 225.93 310.14Sovereign spread (basis points) 124.84 89.55 126.16Liquidity (% of day with transactions 1=100%) 0.34 0.44 0.00Quasi-debt to firm value ratio 0.10 0.10 0.07Years to maturity 14.50 16.36 10.972-Year rolling yield volatility of the 3-month US T-bond (USTB-yield vol) 0.67 0.42 0.512-Year rolling firm value volatility
Chile (2002q3-2004q3)
0.15 0.10 0.13Corporate spread (basis points) 355.53 601.04 266.16Sovereign spread (basis points) 340.12 499.72 260.01Liquidity (% of day with transactions 1=100%) 0.22 0.40 0.00Quasi-debt to firm value ratio 0.06 0.05 0.05Years to maturity 10.03 6.11 9.692-Year rolling yield volatility of the 3-month US T-bond (USTB-yield vol) 0.66 0.42 0.512-Year rolling firm value volatility
Mexico (1996q3-2004q3)
0.20 0.08 0.18Corporate spread (basis points) 417.57 832.55 300.75Sovereign spread (basis points) 424.41 656.33 283.78Liquidity (% of day with transactions 1=100%) 0.27 0.41 0.00Quasi-debt to firm value ratio 0.11 0.11 0.06Years to maturity 9.96 8.76 9.172-Year rolling yield volatility of the 3-month US T-bond (USTB-yield vol) 0.66 0.42 0.512-Year rolling firm value volatility
Full sample
(1996q3-2004q3)
0.19 0.09 0.17

32
Exhibit 4: Years to maturity distribution across countries
Percentil Argentina Brazil Chile Mexico Full sample 1% 0.04 0.06 0.33 0.16 0.10 5% 0.23 0.39 1.83 1.17 0.83 10% 0.58 0.89 3.42 2.48 1.83 25% 1.55 2.90 6.75 5.27 4.59 50% 3.33 7.59 10.72 9.17 8.79 75% 5.52 12.35 16.43 12.72 12.84 90% 8.29 15.45 27.64 16.71 16.97 95% 10.04 16.60 92.94 18.76 22.14 99% 12.04 18.30 99.69 32.31 91.27
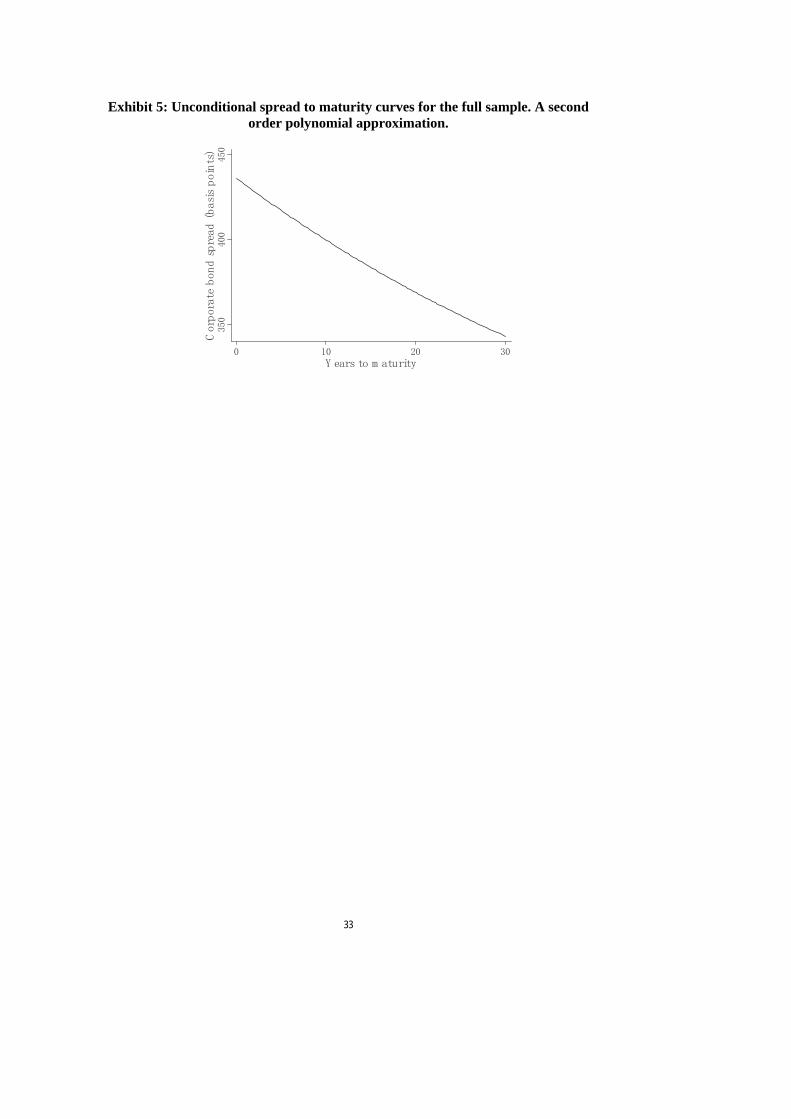
33
Exhibit 5: Unconditional spread to maturity curves for the full sample. A second
order polynomial approximation.
350
400
450
Corporate bond spread (basis points)
0 10 20 30Y ears to m aturity
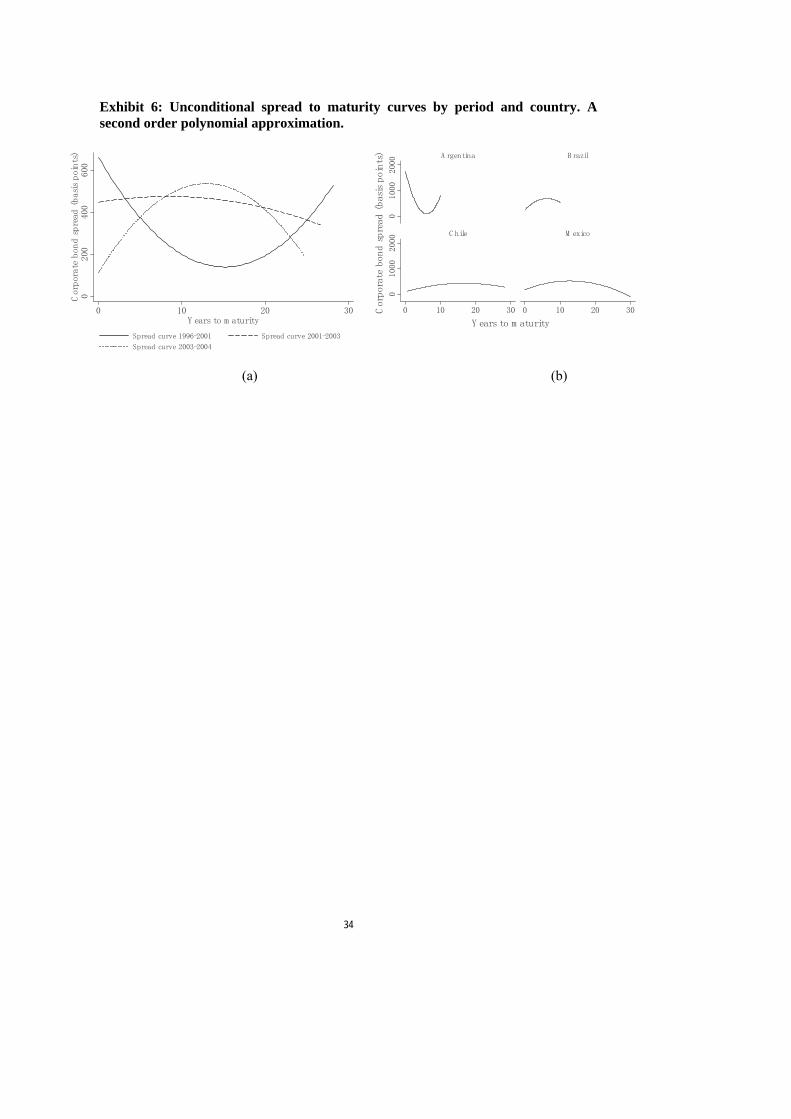
34
Exhibit 6: Unconditional spread to maturity curves by period and country. A second order polynomial approximation.
0200
400
600
Corporate bon
d spread
(basis points)
0 10 20 30Y ears to m aturity
Spread curve 1996-2001 Spread curve 2001-2003
Spread curve 2003-2004
01000
2000
01000
2000
0 10 20 30 0 10 20 30
A rgentina B razil
C hile M exico
Corporate bond spread (basis points)
Y ears to m aturity
(a) (b)

35
Exhibit 7: The Determinants of Corporate Bond Spreads in Latin America. Econometric Results-Full Sample Covariate [1]OLS [2]FE [3]RE [4]FD [5]FE-AR [6]RE-AR [7]GLS-RE [8]GLS-FE
0.079*** -0.043 0.059 0.06 0.069 0.055 0.122*** 0.082*** Sovereign spread (in basis points) [0.022] [0.070] [0.065] [0.062] [0.063] [0.063] [0.020] [0.026] -2.436 -7.876*** -5.060*** -2.624*** -1.940** -3.067*** -0.630*** -1.137*** Liquidity: % of day with transactions [4.504] [1.806] [1.822] [0.878] [0.944] [0.959] [0.220] [0.372] 48.068** 119.579*** 49.488*** -12.425 -3.632 6.105 6.029* 9.920* Quasi-debt to firm value ratio (as % of firm value) [21.354] [14.617] [9.957] [9.373] [9.772] [8.328] [3.128] [5.564] -27.853*** -91.894*** -21.749*** 4,832.983*** -301.808*** -32.983*** 2.155 -12.601 Years to maturity [5.001] [29.048] [8.008] [1,834.180] [113.559] [10.442] [6.736] [10.717] 280.146*** 199.171* 220.497* 49.297 39.405 32.541 28.872 46.539 2-Year rolling yield volatility of the 3-month US T-bond
(USTB-yield volatility) [78.227] [112.533] [113.657] [93.574] [98.042] [99.150] [20.879] [28.531] 42.673 -6.611 -160.124 436.624 281.142 283.617 205.738*** 173.671* 2-Year firm value volatility [464.939] [532.481] [474.326] [335.441] [362.819] [341.096] [75.628] [96.916] -0.943 -8.116*** -2.934*** 0.069 -1.173 -0.869 -0.253 -1.218*** Interaction 1: Quasi-debt to firm value - Years to maturity [1.189] [1.096] [0.809] [0.790] [1.039] [0.694] [0.229] [0.438] -24.444** 0.21 -9.669 7.689 14.389** 6.507 1.087 7.074** Interaction 2: Quasi-debt to firm value - USTB-yield volatility [11.126] [8.397] [7.939] [6.154] [6.779] [6.313] [2.187] [3.067] 318.328 604.406** 419.727* 1,248.939*** 1,962.393*** 709.469*** 226.829*** 3,109.61 Constant [313.339] [277.997] [214.823] [456.328] [51.964] [184.299] [57.455] [1,983.237]
Observations 667 667 667 574 591 667 662 662 Number of bonds 76 76 76 71 71 76 71 71 R-squared 0.17 0.203 0.16 0.09 0.05 0.14 Log likelihood -3993.95 -4206.66 Prob > F [GLOBAL SIGNIFICANCE] 0.00 Prob > chi2 - [SOV-CEILING] 0.00 0.00 0.00 0.00 0.00 0.00 0.00 0.00 Prob > F [POOLED SERIAL CORRELATION] 0.00 Prob > F - [POOLED OLS VS. FIXED EFFECTS] 0.00 Prob > chi2 - [HETEROSKEDASTICITY] 0.00 Prob > F - [SERIAL CORRELATION] 0.00 Prob > chi2 - [FIXED VS RANDOM EFFECTS] 0.00
Note: The dependent variable is the corporate bond spread. Standard errors in brackets. * significant at 10%; ** significant at 5%; *** significant at 1%. OLS, RE, FE, FD, FE-AR, RE-AR, GLS-RE and GLS-FE stand for ordinary least squares, random effects, fixed effects, first differences, fixed effects with serial correlation corrections, random effects with serial correlation corrections, generalized least squares with random effects, and generalized least squares with fixed effects estimators, respectively.

36
Exhibit 8: The Determinants of Corporate Bond Spreads in Latin America. Econometric Results-Full Sample- allowing for different slopes in sovereign spreads Covariate [1]OLS [2]FE [3]RE [4]FD [5]FE-AR [6]RE-AR [7]GLS-RE [8]GLS-FE
-5.889*** -9.220*** -5.889*** -2.565*** -2.114** -3.683*** -0.764** -149.21***Liquidity: % of day with transactions [1.920] [1.892] [1.920] [0.947] [1.061] [1.038] [0.353] [0.000] 29.489*** 108.782*** 29.489*** -15.299 -15.049 9.306 17.645*** Quasi-debt to firm value ratio (as % of firm value) [11.029] [16.332] [11.029] [10.499] [11.646] [9.906] [3.660] -7.124 -64.725* -7.124 -1,155.58 -441.749*** -10.715 6.499** Years to maturity [13.699] [35.991] [13.699] [2,038.226] [144.804] [14.199] [3.121] 73.758 70.167 73.758 7.92 3.513 -16.248 25.841 2-Year rolling yield volatility of the 3-month US T-bond
(USTB-yield volatility) [127.677] [131.924] [127.677] [95.273] [101.510] [107.560] [27.627] -252.972 -79.699 -252.972 341.223 161.506 115.549 85.928 2-Year rolling firm value volatility [534.130] [571.684] [534.130] [368.741] [410.613] [379.962] [94.792] -3.967*** -8.340*** -3.967*** -0.133 -0.92 -1.658** -1.501*** Interaction 1: Quasi-debt to firm value – Year s to maturity [0.929] [1.231] [0.929] [0.867] [1.138] [0.797] [0.378] 19.046* 16.418* 19.046* 10.966* 15.055** 10.479 2.545 Interaction 2: Quasi-debt to firm value - USTB-yield volatility [9.976] [9.958] [9.976] [6.372] [7.095] [7.119] [2.865] 682.568*** 836.002** 682.568*** -234.011 2,507.221*** 723.585*** 145.309*** Constant [224.571] [354.898] [224.571] [507.506] [50.226] [206.911] [46.552] 667 667 667 574 591 667 662 662 Observations
Number of bonds 76 76 76 71 71 76 71 71
R-squared 0.525 0.383 0.53 0.08 0.11 0.3 Log likelihood -4175.76 -80382.1 Prob > F [GLOBAL SIGNIFICANCE] 0.00 Prob > chi2 - [EQUAL SLOPES FOR SOV. SPREAD] 0.00 Prob > F [POOLED SERIAL CORRELATION] 0.00 Prob > F - [POOLED OLS VS. FIXED EFFECTS] 0.00 Prob > chi2 - [HETEROSKEDASTICITY] 0.00 Prob > F - [PANEL SERIAL CORRELATION] 0.00 Prob > chi2 - [FIXED VS. RANDOM EFFECTS] 0.00 Note: The dependent variable is the corporate bond spread. Standard errors in brackets. * significant at 10%; ** significant at 5%; *** significant at 1%. OLS, RE, FE, FD, FE-AR, RE-AR, GLS-RE and GLS-FE stand for ordinary least squares, random effects, fixed effects, first differences, fixed effects with serial correlation corrections, random effects with serial correlation corrections, generalized least squares with random effects, and generalized least squares with fixed effects estimators, respectively.
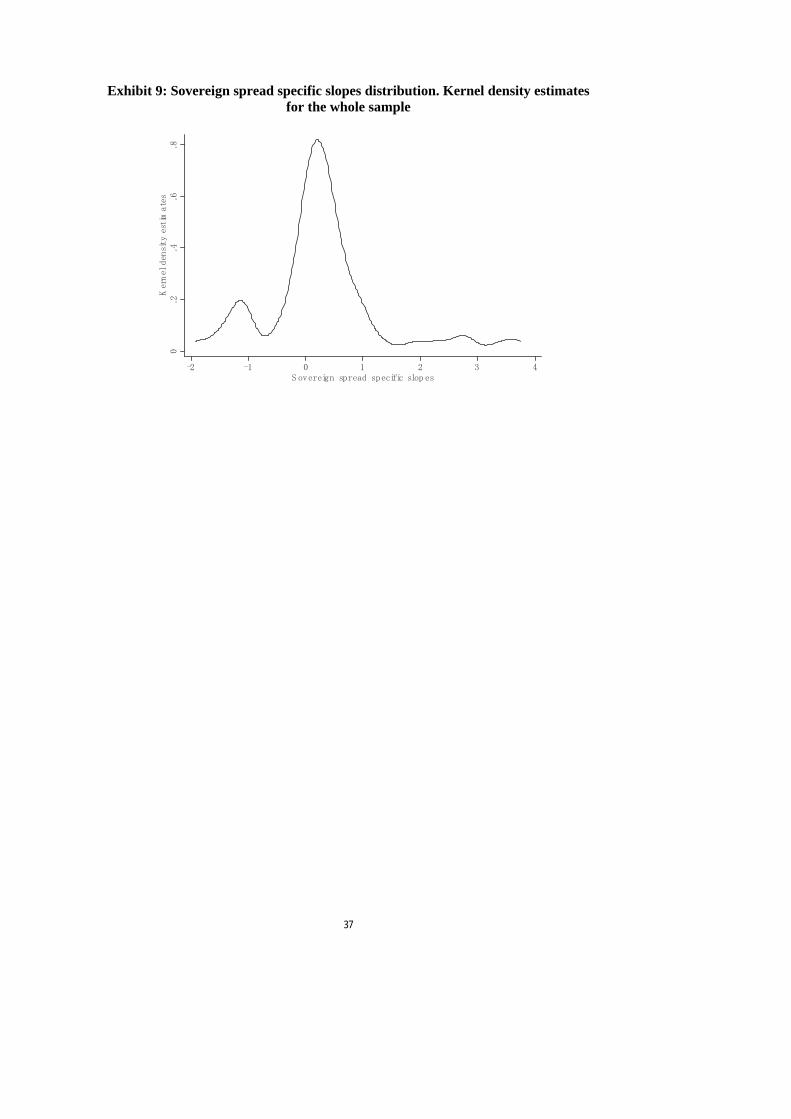
37
Exhibit 9: Sovereign spread specific slopes distribution. Kernel density estimates for the whole sample
0.2
.4.6
.8Kernel density estim
ates
-2 -1 0 1 2 3 4S overeign spread specific slop es

38
Exhibit 10: Sovereign ceiling probability distribution. Whole sample kernel density estimates for the probability of specific sovereign spread coefficients being equal to
1
01
23
45
Kernel density estim
ates
0 .2 .4 .6 .8 1Sovereign ceiling probabilities

39
Exhibit 11: Rejection rates of the sovereign ceiling hypothesis
Sov.
Ceiling (a)Sov. Ceiling
(b) Whole sample 0.83 0.62 Argentina 0.90 0.80 Brazil 0.79 0.64 Chile 0.77 0.38 Mexico 0.85 0.65 Note: Rejection rates in Column "Sov. Ceiling (a)" have been calculated assuming that the sovereign ceiling hypothesis cannot be rejected when the corporate spread coefficient (β1) is positive and Prob. (β1=0)<0.05 and Prob. (β1=1) >0.05 or Prob. (β1=1)<0.05 & β1>1. Rejection rates in column "Sov. Ceiling (b)" are calculated as in "Sov. Ceiling (a)" but without introducing the Prob. (β1=0)<0.05 constraint.
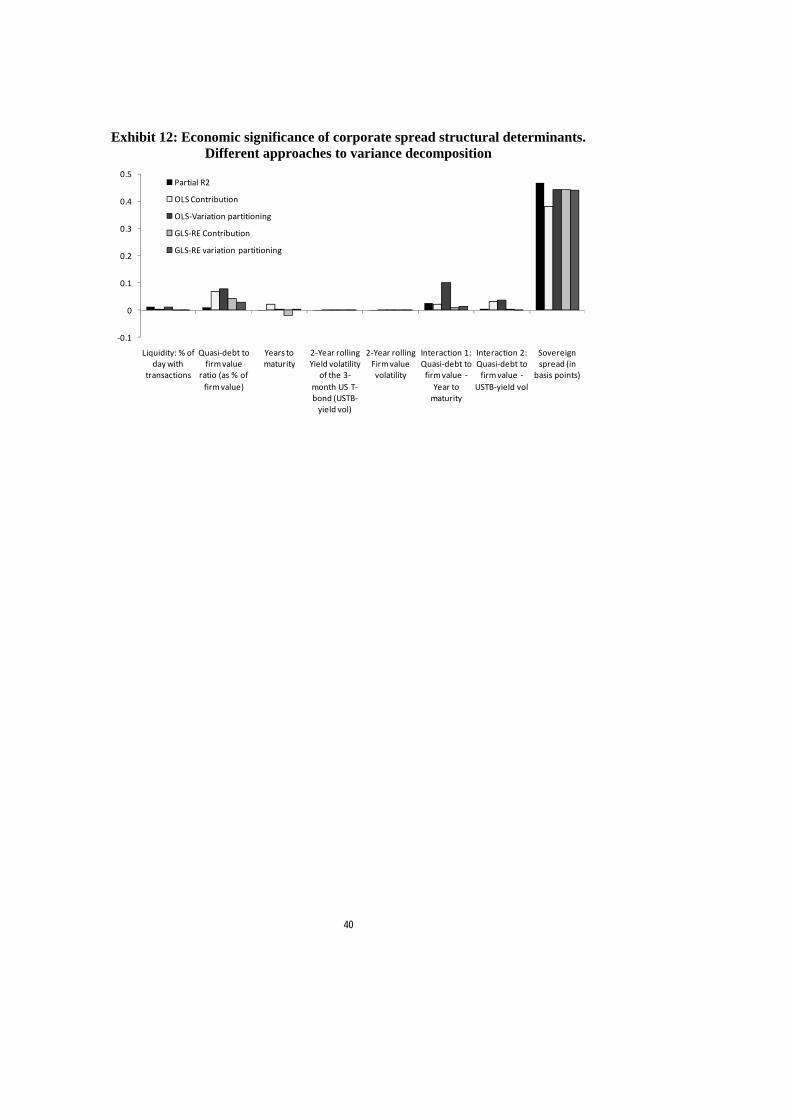
40
Exhibit 12: Economic significance of corporate spread structural determinants. Different approaches to variance decomposition
‐0.1
0
0.1
0.2
0.3
0.4
0.5
Liquidity: % of day with
transactions
Quasi‐debt to firm value
ratio (as % of firm value)
Years to maturity
2‐Year rolling Yield volatility
of the 3‐month US T‐bond (USTB‐yield vol)
2‐Year rolling Firm value volatility
Interaction 1: Quasi‐debt to firm value ‐Year to maturity
Interaction 2: Quasi‐debt to firm value ‐
USTB‐yield vol
Sovereign spread (in
basis points)
Partial R2
OLS Contribution
OLS‐Variation partitioning
GLS‐RE Contribution
GLS‐RE variation partitioning

41
Exhibit 13: Sovereign spread specific slopes and sovereign ceiling test results for the GLS-RE estimator
Bond Id Firm Sector Available obs.% of Days with Transactions Mean Corp. Spread
Mean Corresponding Sorp. Spread
Sov. Spread coeff. (β1) Prob. β1=0 Prob. β1=1 Sov. Ceiling (a) Sov. Ceiling (b)
101 Alpargatas Textile 1996q3-1996q4 2.20 3423.50 446.51 6.03 0.211 0.297 0 1
105 1996q3-1998q3 14.03 349.28 284.04 0.09 0.803 0.01 0 0
106 1996q3-1998q1 9.47 274.75 313.21 -0.28 0.293 0 0 0
107 1996q3-2000q1 20.55 922.00 289.60 10.37 0.024 0.041 1 1
108 2001q2-2002q1 8.69 438.70 511.20 0.18 0.114 0 0 0
109 2001q4-2002q1 5.77 147.69 511.20 0.13 0.653 0.002 0 0
110 1997q4-2004q3 52.18 256.73 1800.52 0.09 0 0 0 0
111 2000q2-2004q3 44.10 394.66 4107.73 0.09 0 0 0 0
112 1999q1-2003q3 43.87 304.29 697.01 0.06 0.333 0 0 0
113 1998q2-2002q1 28.65 330.64 512.40 0.46 0.044 0.02 0 0
202 Braskem Chemical products 2004q1-2004q3 15.76 654.01 627.91 0.97 0 0.896 1 1
205 1996q4-2001q2 30.52 951.37 287.81 0.72 0.283 0.671 0 1
206 2001q2-2003q4 45.46 691.77 621.45 0.07 0.641 0 0 0
207 Tele Norte Celular Telecommunication 2003q4-2004q3 16.26 449.77 483.61 0.45 0.139 0.067 0 1
ARGENTINA
BRAZIL
Comercial del Plata Others
YPF Oil & Gas
Gerdau Met Steel & Metals
Note. In Column "Sov. Ceiling (a)", the sovereign ceiling hypothesis cannot be rejected (1; while 0 stands for rejection) when β1>0 & Prob. (β1=0)<0.05 & (Prob. (β1=1) >0.05 or (Prob. (β1=1)<0.05 but β1>1)). In Column "Sov. Ceiling (b)", the Prob. β1=0<0.05 constraint is no
longer introduced. Detailed characteristics for each bond can be obtained from Exhibit 13.

42
Exhibit 14: Sovereign spread specific slopes and sovereign ceiling test results for the GLS-RE estimator (cont.)
Bond Id Firm Sector Available obs.% of Days with Transactions Mean Corp. Spread
Mean Corresponding Sorp. Spread
Sov. Spread coeff. (β1) Prob. β1=0 Prob. β1=1 Sov. Ceiling (a) Sov. Ceiling (b)
212 1999q3-2000q3 16.73 430.26 304.37 -1.1 0.187 0.011 0 0213 2000q3-2001q4 11.52 228.68 284.97 -1.08 0.162 0.007 0 0214 2000q2-2001q4 11.78 222.69 286.29 -1.4 0.041 0 0 0215 2000q3-2001q4 8.57 164.42 287.48 -1.09 0.116 0.003 0 0216 2001q2-2001q4 8.47 234.14 284.54 -1.22 0.249 0.036 0 0217 2002q2-2004q3 25.77 647.09 363.03 0.91 0 0.67 1 1219 2003q1-2004q3 23.57 618.04 363.03 0.95 0 0.8 1 1220 2004q1-2004q3 15.54 457.84 483.60 0.3 0.299 0.013 0 0221 2004q1-2004q3 8.66 50.52 725.43 -1.02 0.002 0 0 0222 Usiminas Steel & Metals 2003q4-2004q3 8.51 39.56 427.76 -1.16 0.332 0.071 0 0
301 2002q3-2002q4 44.44 327.84 203.37 -1.92 0.052 0.003 0 0302 2003q1-2004q3 32.01 639.78 97.93 3.41 0 0.003 1 1303 2003q1-2004q3 24.86 132.72 -40.79 -1.55 0.732 0.573 0 0304 2003q4-2004q3 16.67 304.43 136.78 0.32 0.793 0.579 0 1305 2003q4-2004q3 16.81 323.19 136.78 0.42 0.634 0.515 0 1307 Embonor Food & Beverages 2002q3-2004q3 29.82 379.15 127.85 0.17 0.733 0.089 0 1
CHILE
BRAZIL (cont.)
Unibanco Finance & Insurance
Enersis Electricity
Note. In Column "Sov. Ceiling (a)", the sovereign ceiling hypothesis cannot be rejected (1; while 0 stands for rejection) when β1>0 & Prob. β1=0<0.05 & (Prob. β1=1 >0.05 or (Prob. β1=1<0.05 but β1>1)). In Column "Sov. Ceiling (b)", the Prob. β1=0<0.05 constraint is no longer
introduced. Detailed characteristics for each bond can be obtained from Exhibit 13.

43
Exhibit 14. Sovereign spread specific slopes and sovereign ceiling test results for the GLS-RE estimator (cont.)
Bond Id Firm Sector Available obs.% of Days with Transactions Mean Corp. Spread
Mean Corresponding Sorp. Spread
Sov. Spread coeff. (β1) Prob. β1=0 Prob. β1=1 Sov. Ceiling (a) Sov. Ceiling (b)
308 2002q3-2004q3 44.12 474.95 87.91 1.88 0 0.008 1 1309 2003q1-2004q3 41.23 434.21 -56.29 -2.32 0.04 0.003 0 0310 2003q1-2004q3 34.91 -381.20 -2828.01 1.02 0 0.801 1 1311 2003q4-2004q3 17.44 275.86 116.03 0.83 0.502 0.891 0 1312 2003q4-2004q3 17.57 264.16 142.89 0.65 0.491 0.707 0 1314 2002q3-2004q3 38.29 279.31 116.76 0.36 0.265 0.046 0 0315 2002q3-2004q3 39.85 181.75 135.40 -0.37 0.66 0.104 0 0
501 1996q3-1997q2 10.29 271.25 152.43 0.59 0.314 0.486 0 1502 1999q3-2004q3 36.38 1352.52 197.75 2.28 0.181 0.452 0 1508 Posadas Gpo Others 1997q1-2001q3 28.71 556.88 216.45 1.33 0.005 0.477 1 1511 1996q3-1997q3 7.73 126.99 517.11 -0.22 0.045 0 0 0512 2001q3-2004q3 25.53 84.86 190.72 0.67 0.192 0.511 0 1513 2000q3-2004q2 28.68 256.84 190.72 0.59 0.244 0.425 0 1514 2002q1-2004q3 28.11 321.16 243.25 0.46 0.006 0.001 0 0515 2002q2-2004q3 25.93 297.69 243.25 0.49 0.009 0.007 0 0518 1997q1-1998q1 9.02 167.22 178.89 -2.43 0.001 0 0 0519 2003q2-2004q3 19.62 900.32 270.99 4.52 0 0 1 1520 1999q1-2004q3 43.18 1933.98 312.19 3.75 0 0.001 1 1522 2001q1-2004q3 33.35 283.60 595.53 0.1 0.268 0 0 0523 1999q3-2004q3 41.39 422.58 595.53 0.28 0.014 0 0 0
CHILE (cont.)
MEXICO
Whosale & retail tradeComercial Mexicana
Andina Food & Beverages
Endesa Electricity
CTC Telecommunication
Televisa Gpo Others
Hylsamex Steel & Metals
Kimberly Clark Mex Paper & pap. related prod.
Note. In Column "Sov. Ceiling (a)", the sovereign ceiling hypothesis cannot be rejected (1; while 0 stands for rejection) when β1>0 & Prob. β1=0<0.05 & (Prob. β1=1 >0.05 or (Prob. β1=1<0.05 but β1>1)). In Column "Sov. Ceiling (b)", the Prob. β1=0<0.05 constraint is no longer
introduced. Detailed characteristics of each bond can be obtained from Exhibit 13.

44
Exhibit 14. Sovereign spread specific slopes and sovereign ceiling test results for the GLS-RE estimator (cont.)
Bond Id Firm Sector Available obs.% of Days with Transactions Mean Corp. Spread
Mean Corresponding Sorp. Spread
Sov. Spread coeff. (β1) Prob. β1=0 Prob. β1=1 Sov. Ceiling (a) Sov. Ceiling (b)
526 2003q4-2004q3 17.25 893.63 180.69 2.67 0 0.001 1 1527 2003q4-2004q3 16.90 928.06 180.69 2.84 0 0 1 1532 2004q1-2004q3 14.55 184.88 177.66 0.01 0.994 0.126 0 1533 2004q2-2004q3 15.13 202.19 177.66 0.07 0.923 0.181 0 1539 2004q2-2004q3 13.00 -16.92 385.33 -0.56 0.184 0 0 0542 1997q3-2004q3 54.46 263.88 390.19 0.05 0.705 0 0 0543 1996q3-1997q2 5.88 144.51 551.36 -0.09 0.457 0 0 0544 1996q3-1999q4 18.78 258.82 282.70 0.17 0.393 0 0 0545 1996q3-2000q3 23.41 259.41 236.48 0.27 0.282 0.003 0 0546 1996q3-1998q1 10.81 196.18 170.73 -0.06 0.834 0 0 0547 1996q3-2001q1 29.64 253.27 215.29 0.19 0.388 0 0 0548 1996q3-2000q2 22.95 257.99 244.72 0.28 0.236 0.002 0 0549 2001q2-2004q3 31.70 216.35 84.31 0.21 0.567 0.035 0 0550 2001q1-2004q3 57.14 344.34 84.31 0.41 0.273 0.11 0 1551 1999q3-2002q2 17.42 185.70 210.79 -0.06 0.899 0.022 0 0552 2000q3-2004q3 35.53 306.44 295.38 0.35 0.117 0.003 0 0553 2001q1-2004q3 32.14 347.09 295.38 0.4 0.021 0.001 0 0554 2000q1-2004q3 39.38 320.52 295.38 0.43 0.001 0 0 0555 2001q1-2002q3 14.62 181.69 187.38 -0.21 0.81 0.157 0 0556 2000q3-2002q3 17.30 192.74 187.38 -0.05 0.95 0.184 0 0557 1996q3-1997q3 7.69 265.86 519.95 0.17 0.414 0 0 0
MEXICO (cont.)
Cemex S.A. Non-metallic minerals
America Movil Telecommunications
Coca Cola Femsa Food & Beverages
Vitro Non-metallic minerals
Note. In Column "Sov. Ceiling (a)", the sovereign ceiling hypothesis cannot be rejected (1; while 0 stands for rejection) when β1>0 & Prob. β1=0<0.05 & (Prob. β1=1 >0.05 or (Prob. β1=1<0.05 but β1>1)). In Column "Sov. Ceiling (b)", the Prob. β1=0<0.05 constraint is no longer
introduced. Detailed characteristics of each bond can be obtained from Exhibit 13.

45