
The determinants of euro area sovereign bond yield spreads ... · The determinants of euro area...
29
The determinants of euro area sovereign bond yield spreads An empirical analysis Dr. Platon Monokroussos Group Chief Economist Eurobank Ergasias S.A. July, 2017
Transcript of The determinants of euro area sovereign bond yield spreads ... · The determinants of euro area...

Page 0
The determinants of euro area sovereign bond yield spreads
An empirical analysis
Dr. Platon Monokroussos
Group Chief Economist
Eurobank Ergasias S.A.
July, 2017

Page 1
Summary of views & key findings
In this paper we present the results of an empirical study on the determinants of the sovereign bond yield spreads in the euro
area before and after the outbreak of the global financial crisis. As an additional step, we estimate a valuation model for the 10-
year Greek government bond yield differentials, with the aim to measure the degree of any over- or under-valuation of Greek
sovereign debt prices with respect to the macroeconomic- and market-related fundamentals.
Although the disaggregation of sovereign credit spreads into their constituent components is a rather difficult exercise, we follow
the relevant empirical literature and focus on three distinct classes of potential determinants; namely: credit risk; liquidity risk;
and global risk aversion.
Some of the main results of our study are highlighted below:
i. Our empirical results broadly indicate that the determinants of sovereign bond yield spreads in the euro area have changed
significantly across time, with the underlying fiscal-, liquidity- and global risk sentiment-related fundamentals playing a much
greater role in market pricing, especially at the height of the EMU crisis and for the so-called euro-area periphery economies.
ii. This compares with the period before the outbreak of the global crisis, which saw a significant disconnect between domestic
macro/fiscal fundaments and the pricing of sovereign debt markets in the euro area.
iii. The baseline specification of our fundamentals-based valuation model for Greek debt securities explains around 60% of the
volatility in the monthly series of Greek 10yr government bond yield spreads vs. Germany from January 2009 onwards.
iv. This implies that other factors (not accounted for in our empirical model) have been influencing the evolution of Greek
sovereign debt spreads over the aforementioned period. Arguably, such factors may include: market liquidity conditions,
increased political and macroeconomic uncertainty as well as periods of heightened investor fears over Greece’s euro
membership.
v. Taking these caveats and model limitations into account, our study provides an estimate of the (under-)valuation of the 10-
yeak Greek bond prices relative to the underlying fundamentals over the period January 2009 to April 2017.
vi. The degree of this undervaluation has exhibited a tendency to peak in periods of increased macroeconomic and political
uncertainty in Greece and the euro area, while, most recently, the market pricing of Greek government securities has broadly
aligned with the macroeconomic- and market-related fundamentals examined in our study.
vii. If this is so, then an additional significant compression of Greek bond spreads would require a further improvement of
domestic macro fundamentals and/or other, external developments, such as the provision of more clarity on the medium- and
long term EU debt relief framework for Greece and the prospect of including eligible Greek debt in the ECB’s QE programme.
viii. While the type of empirical models analyzed in the study may not be suitable for bond trading purposes, it nonetheless provides
some useful insights on the way various influences (fundamentals- and non-fundamentals-related) have affected the pricing of
Greek government bonds following the outbreak of the sovereign debt crisis.

Page 2
Part I
Related literature, data & econometric methodology

Page 3 Source: Eurobank Economic Research & related literature
The disaggregation of sovereign credit spreads into constituent components is generally a difficult exercise. Yet, recent
empirical studies document at least three distinct determinants; these include: credit risk; liquidity risk; and risk aversion.1
― Credit risk reflects a country’s creditworthiness i.e., its ability (and willingness) to make full (and timely) principal and
interest payments on its obligations to international creditors. Recent empirical studies find a close link between country-
specific fundamentals and variations in respective credit risk premia. In particular, lower levels of political risk are often
associated with tighter spreads. The same result applies for credible fiscal policies, especially in countries that experienced
prior defaults. Fiscal transparency and the quality of data reporting are also found to have a positive influence. Finally,
event studies show that macroeconomic data announcements may have a significant impact on government bond yield
differentials, especially in short-term horizons. On the latter point, some recent studies find that US macroeconomic
announcements not only affect US markets but also exert a significant effect on European bond markets.
― Liquidity risk relates to the notions of i. market depth, which indicates the existence of a sufficiently large number of buy
and sell orders for a particular asset and ii. market breadth, which reflects the degree to which market orders to buy or sell
a particular asset can move prices. Though many factors can affect market liquidity (which may itself be time-varying),
more liquid markets generally deserve a lower risk premium (and vice-versa). This is because in a relatively illiquid
market, big players run the risk of influencing the asset price against them when e.g. they execute consecutive market buy
or sell orders. A less liquid market may also be easier to manipulate by informed traders at times of increased uncertainty
and large information asymmetries.
― Risk aversion: more recently, there has been increased emphasis on global factors such as contagion from systemically-
important events, investor risk appetite, interest rate expectations and world market volatility.
1For a more comprehensive overview of the relevant literature on the determinants of sovereign bond spreads see e.g. Afonso et al. (2015)
Determinants of sovereign bond spreads
What the empirical literature says

Page 4 Source: Eurobank Economic Research & related literature
Model specification
Empirical framework for explaining sovereign bond spreads in the EMU
Empirical framework: dynamic panel model to explain 10-year euro area government bond yield spreads vs. Germany.
Estimation methodology: Two-Stage Least Squares with cross-section weights.
General specification form:
Spreadit = c + β1*Spreadit-1 + β2*Credit_Riskit + β3*Liquidity_Riskit + β4*Risk_Aversiont + γi + εit (1)
Where,
t is time subscript and i cross-section indicator
Spreadit denotes the 10-year government bond yield spread of country i vs. the German equivalent (in levels)
Spreadit-1 is the first lag of 10-year government bond yield spread (to capture any persistence in the dependent variable)
Credit_Riskit denotes a suitable credit risk indicator for country i at time t
Liquidity_Riskit denotes a suitable liquidity risk indicator for country i at time t
Risk_Aversiont denotes a suitable international risk sentiment indicator at time t (to capture potential contagion effects)
γi indicates county-specific fixed effects
εit is the error term
Data frequency & time span: monthly observations, mostly spanning the period January 1999 to June 2017
Cross sections:
Number of cross-sections: 10
The countries examined in the study include Greece, Portugal, Spain, Belgium, Netherlands, Austria, Italy, Ireland, France,
Finland and Germany. The rest of the euro area countries are excluded from the analysis, as they do not currently have
liquid 10-year government bond markets.

Page 5 Source: Eurobank Economic Research & indicated sources
Variables used in the empirical analysis
Definitions & acronyms
Acronym Description Source Frequency Time span
Depen
den
t
vari
able
10yr sovereign spread it
10-year government bond yield spread vs.
Germany (levels)Bloomberg monthly Jan 1999-Jun 2017
10yr sovereign spread it -1
1st lag of 10-year government bond yield
spread vs. GermanyBloomberg monthly Feb 1999-Jun 2017
budget_balance it
Forecasted (one-year-ahead) general
government budget balance as % of GDP of
country i minus corresponding metric for
Germany
European Commission
Forecasts
(released bi-annually)
monthly Jan 2002-Jun 2017
debt_ratio it
Forecasted (one-year-ahead) gross public
debt as % of GDP of country i minus
corresponding metric for Germany
European Commission
Forecasts
(released bi-annually)
monthly Jan 2002-Jun 2017
(debt_ratio it ) 2 difference between forecasted (one-year-
ahead) debt ratios squared
European Commission
Forecasts
(released bi-annually)
monthly Jan 2002-Jun 2017
log_reer it
Logarithmic difference of real effective
exchange rates (country i minus
Germany)
Eurostat monthly Jan 1999-Jun 2017
ip_yoy it
Difference of industrial production YoY
growth rates (country i minus Germany)Eurostat monthly Jan 2000-Aprl 2017
Fis
cal &
macro
Expla
nato
ry v
ari
able
s

Page 6 Source: Eurobank Economic Research & indicated sources
Variables used in the empirical analysis (continued)
Definitions & acronyms
Acronym Description Source Frequency Time span
log_iTraxx main t
log_vix t
Logarithms of the Itraxx Main index and the S&P 500
implied stock market index (VIX)Bloomberg monhtly
Jun 2004-Jun 2017 &
Jan 1999-Jun 2017,
respectively
Risk_aversion1 t ,
Risk_aversion2 t ,
Risk_aversion3 t
Each of these variables is extracted as the 1st principal
component of different combinations of the following
metrics: log_EURUSD_vol (logarithm of implied volatility
of the EUR/USD currency pair); log_vix ; log_Itraxx ;
Libor_OSI_Spread ; and USBBB_UST10YR_Spread (generic
yield spread between 10yr US BBB-rated corporate paper
and 10yr US Treasury security) – see Appendix
Bloomberg monhtly
Sept 2002-Jun 2017,
July 2004-Jun 2017 &
Sept 2002-Jun 2017,
respectively
Core
-peri
ph
ery
hete
rogen
eit
y v
ari
able
spreads_2pc t
Defined as minus the second principal component of the
euro area spreads examined in our study, to capture the
dichotomy observed between core and periphery EMU
countries at the height of the global financial crisis.
Increases in this variable indicate higher periphery
risk. See Appendix and Afonso et al. (2015).
Bloomberg monhtly Jan 1999-Jun 2017
Dummies
Dummy_Aug2007;
Dummy_Mar2009;
Dummy_Sept2009;
Dummy_Jul2012;
Dummy_Jan2015
Dummy variables taking the value of 1 from the
indicated date onwards and the value of 0 otherwise;
Dummy_Aug2007 to capture the point in time of the
outbreak of the global crisis; Dummy_Mar2009 to capture
the point in time when the global credit crisis started
being transformed into the euro area sovereign debt
crisis; Dummy_Sept2009 to capture the point in time of
the outbreak of the Greek crisis; Dummy_Jul2012 to
capture M. Draghi’s “Whatever it takes” ; and
Dummy_Jan2015 to capture the point in time of the
initiation of ECB’s extended asset purchase programme.
Eurobank
Research monhtly Jan 1999-Jun 2017
Expla
nato
ry v
ari
able
s
Ris
k a
vers
ion

Page 7
Part II
Empirical results & interpretation

Page 8 Source: Eurobank Economic Research
Empirical results (all countries)
Models 1-6 (dependent variable: 10yr sovereign spreadit)
Variable Model 1 Model 2 Model 3 Model 4 Model 5 Model 6
Constant 0.433 0.145 0.037** 0.058*** 0.050*** 0.049***
10yr sovereign spread it -1 0.980*** 0.971*** 0.968*** 0.966*** 0.965*** 0.965***
budget_balance it -0.013** -0.004* -0.004** -0.007** -0.006** -0.006**
debt_ratio it -0.094 -0.052 0.025
(debt_ratio it )2 2.05E-05
log_reer it 0.003 0.008*** 0.006*** 0.004* 0.004
ip_yoy it 0.003*** 0.003*** 0.003***
market liquidity it
log_iTraxx main t -0.062
log_vix t -0.036
Risk aversion 1 t 0.020*** 0.013***
Risk aversion 2 t 0.012***
Risk aversion 3 t 0.029*** 0.005*** 0.012***
spreads_2pc t 0.011**
Dummy_Aug2007 -0.009
Dummy_Mar2009 -0.174***
Dummy_Sep2009 0.021** 0.024** 0.017
Dummy_Jul2012 -0.061*** -0.045*** -0.061*** -0.057***
Dummy_Jan2015 0.008
N*T 1540 1700 1690 1480 1690 1690
Adj_R 298% 0.98 0.98 98% 98% 98%
SE or regression 37% 40% 38% 43% 41% 41%
Note: The regression models are estimated over the time period Jan 1999-Jun 2017 (number of observations ΤχΝ = 2,220). The panel
members include Greece, Portugal, Spain, Belgium, Netherlands, Austria, Italy, Ireland, France and Finland (number of cross-
sections=10). The models are estimated with Two-Stage Least Squares with cross-section weights. The instruments used are the second
and third lag of the dependent variable and the first and second lag of the independent variables. The asterisks ***, **, * indicate
significance at the 1, 5 and 10% confidence level, respectively.

Page 9 Source: Eurobank Economic Research
Empirical results (all countries)
Models 7-10 (dependent variable: 10yr sovereign spreadit)
Variable Model 7 Model 8 Model 9 Model 10
Constant -0.005 -0.006 0.015 -0.354*
10yr sovereign spread it -1 0.891*** 0.894*** 0.901*** 0.904***
budget_balance it 0.012
debt_ratio it 0.006*** 0.003*** 0.002** 0.002**
log_reer it 0.027* 0.019
log_vix t 0.001*
Risk aversion 3 t -0.011 -0.009 -0.009
spreads_2pc t -0.044 -0.038 -0.040 0.001
(budget_balance it )*Dummy_Sep2009 -0.001
(budget_balance it )*Dummy_July2012 0.043***
(debt_ratio it )*Dummy_Sep2009 0.012*** 0.013*** 0.016*** 0.016***
(debt_ratio it )*Dummy_Jul2012 -0.011*** -0.011*** -0.013*** -0.013***
(log_reer it )*Dummy_Sep2009 0.051*** 0.050***
(log_reer it )*Dummy_Jul2012 -0.060*** -0.064***
(Risk aversion 3 t )*Dummy_Sep2009 0.129*** 0.135*** 0.216***
(Risk aversion 3 t )*Dummy_Jul2012 -0.104** -0.083** -0.168***
(log_vix t )*Dummy_Sep2009 0.001***
(log_vix t )*Dummy_Jul2012 -0.001**
(spreads_2pc t )*Dummy_Sep2009 0.165*** 0.165*** 0.225*** 0.158**
(spreads_2pc t )*Dummy_July2012 -0.085 -0.133** -0.193*** -0.159***
N*T 1700 1700 1760 1840
Adj_R 20.98 0.98 0.98 0.98
SE or regression 0.44 0.44 0.44 0.44
Note: The regression models are estimated over the time period Jan 1999-Jun 2017 (number of observations ΤχΝ = 2,220). The panel
members include Greece, Portugal, Spain, Belgium, Netherlands, Austria, Italy, Ireland, France and Finland (number of cross-sections=10).
The models are estimated with Two-Stage Least Squares with cross-section weights. The instruments used are the second and third lag of
the dependent variable and the first and second lag of the independent variables. The asterisks ***, **, * indicate significance at the 1, 5
and 10% confidence level, respectively.

Page 10 Source: Eurobank Economic Research
Empirical results (selective EMU periphery countries)
Models A-C (dependent variable: 10yr sovereign spreadit)
Variable
Model A
(Greece, Portugal, Italy,
Spain & Ireland)
Model B
(Portugal, Italy, Spain &
Portugal)
Model C
(Greece & Portugal)
Constant 0.065 0.035** -0.041
10yr sovereign spread it -1 0.934*** 0.939*** 0.870
budget_balance it -0.004 -0.007 -0.043
debt_ratio it -0.001 -0.001 0.002
Risk aversion 3 t 0.021 0.025 0.045
spreads_2pc t 0.009 0.017 0.026
(budget_balance it )*Dummy_Sep2009 -0.038*** -0.029** 0.012
(budget_balance it )*Dummy_July2012 0.029* 0.024** 0.040
(debt_ratio it )*Dummy_Sep2009 0.005*** 0.002** 0.021**
(debt_ratio it )*Dummy_Jul2012 -0.003** -0.001 -0.014**
(Risk aversion 3 t )*Dummy_Sep2009 0.081** 0.077* 0.442***
(Risk aversion 3 t )*Dummy_Jul2012 -0.070 -0.073* -0.399**
(spreads_2pc t )*Dummy_Sep2009 0.187*** 0.171*** 0.384**
(spreads_2pc t )*Dummy_July2012 -0.230*** -0.221*** -0.422**
N*T 880 704 352
Adj_R 20.98 0.98 0.98
SE or regression 0.50 0.28 0.80
Note: The regression models are estimated over the time period Jan 1999-Jun 2017. The panel members include selective groups of the
following EMU periphery countries: Greece, Portugal, Spain, Italy, Ireland (number of cross-sections=5, 4 and 2, respectively). The models
are estimated with Two-Stage Least Squares with cross-section weights. The instruments used are the second and third lag of the
dependent variable and the first and second lag of the independent variables. The asterisks ***, **, * indicate significance at the 1, 5 and
10% confidence level, respectively.
Ireland)

Page 11 Source: Eurobank Economic Research
How Greece compares with the cross sectional means of Models A, B & C
(see empirical results in previous page)
-500
0
500
1,000
1,500
2,000
2,500
3,000
3,500
Nov-0
2
May-0
3
Nov-0
3
May-0
4
Nov-0
4
May-0
5
Nov-0
5
May-0
6
Nov-0
6
May-0
7
Nov-0
7
May-0
8
Nov-0
8
May-0
9
Nov-0
9
May-1
0
Nov-1
0
May-1
1
Nov-1
1
May-1
2
Nov-1
2
May-1
3
Nov-1
3
May-1
4
Nov-1
4
May-1
5
Nov-1
5
May-1
6
Nov-1
6
May-1
7
Greece (actual)
Cross sectional mean (model A: Greece, Portugal, Italy, Spain, Ireland)
Cross sectional mean (model B: Portugal, Italy, Spain, Ireland)
Cross sectional mean (Model C: Greece, Portugal)

Page 12 Source: Eurobank Economic Research
Empirical results: interpretation & policy implications
Models 1-6
Lagged dependent variable (10yr sovereign spreadit-1): The coefficient of the lagged dependent variable is positive and
highly significant in all specifications (models 1-6). This indicates a strong persistence of sovereign bond yield spreads in
monthly frequencies (similar results documented in other relevant studies see e.g. Afonso at al., 2015).
Fiscal variables (budget_balanceit & debt_ratioit): The coefficient of the expected (one-year-ahead) fiscal performance of
country i vs. that of Germany has the correct theoretical sign (negative) and is mostly significant. This confirms the
significance of expected fiscal fundamentals in the determination of sovereign debt yield spreads i.e., expectations for an
improvement in the general government fiscal balance tend to reduce bond yield spreads (and vice versa). On the other hand,
the coefficient of the expected debt ratio differential of country i relative to that of Germany is mostly insignificant and has
the wrong theoretical sign (negative). Same result applies to the square of the aforementioned variable (debt_ratioit)2.
Economic activity & competitiveness variables (ip_yoyit & log_reerit): The coefficient of the relative economic
performance variable, ip_yoyit (first difference of contemporaneous year-on-year industrial production growth of country i
relative to that in Germany), is strongly significant, but has the wrong expected sign in all estimated specifications (models
2-4). On the other hand, the relative price competitiveness variable,log_reerit, (logarithmic difference of the CPI-based REER
of country i relative to Germany) has the correct expected sign (positive) and is mostly significant (models 3-5). The expected
theoretical signs cited above align with the notion that improved competitiveness and macroeconomic conditions support
public finances and market perceptions for the outlook of a country (and thus, tend to reduce sovereign risk premia),
especially in periods of reduced investor appetite for risk.
Risk aversion variables (Risk_aversion1t, Risk_aversion2t, Risk_aversion3t): The coefficients of the risk aversion variables
(each one of them is extracted as the first principal component of different groups of risk-sentiment metrics) are all found to
be statistically significant and to have the correct theoretical sign (positive). The rationale of this relationship is based on a
standard “flight-to-quality” argument in periods of generalized risk-aversion by international investors (and vice-versa during
periods of increased investor appetite for risk). Similar results are documented in earlier empirical studies.1
1 Among others, Attinasi, Checherita and Nickel (2009) use a dynamic panel approach to explain the determinants of sovereign bond yield spreads in
a sample of selected euro area countries during the period July 2007-March 2009. They find that international risk aversion explains as much as
55.6% of the daily change in sovereign spreads over Germany. The study also shows that the remainder of the corresponding cumulative change in
spreads over the said period can be attributed to i. the expected fiscal balance and government debt over Germany (7.7% and 13.6%, respectively) ii.
bond market liquidity conditions relative to Germany (13.9%) and iii. the bank support packages announced by many Eurozone governments in the
months following the Lehman collapse (9.2%).

Page 13 Source: Eurobank Economic Research
Empirical results: interpretation & policy implications
Models 7-10
In order to examine whether and to what extent the determination of sovereign bond yield spreads has changed after the
outbreak of the global financial crisis (as well as during the different phases of the euro area sovereign debt crisis), we follow
Afonso et al. (2015) and others and introduce a number of slope dummies, which enter our model specifications (models 7-
10) in multiplicative form i.e., they are multiplied by the macro-fiscal, liquidity and risk aversion variables under
examination.
These dummy variables aim to capture different points in time corresponding to major events that may have caused
structural shifts in the bond yield spread series, such as the outbreak of the global financial crisis (August 2007); the
beginning of the transformation of the global credit crisis into the euro area sovereign debt crisis (March 2009); the outbreak
of the Greek crisis (September 2009); M. Draghi’s “Whatever it takes” verbal intervention (July 2012); and the inception of
the ECB’s extended asset purchase programme (January 2015).
Generally, the majority of credit risk, liquidity risk and risk aversion variables under examination are strongly significant and
have the correct theoretical/expected signs when multiplied by the slope variable Dummy_Sept2009, which captures the
point in time when the Greek crisis erupted. The same result applies for our core-periphery heterogeneity variable,
spreads_2pct (extracted as minus the 2nd principal component of the sovereign bond yield spreads under study), which aims
to capture the dichotomy observed between core and periphery EMU countries at the height of the global financial crisis.
Note that increases in this variable indicate higher periphery risk.
On the other hand, when most of the aforementioned credit risk, liquidity risk and risk aversion variables are multiplied by
the slope dummy, Dummy_Jul2012, which marks the point in time when Mario Draghi committed to do “whatever it takes” to
contain the deepening euro area sovereign debt crisis, the respective coefficients mostly reverse in sign and are strongly
significant. We interpret this result as providing empirical support to the effectiveness of the ECB’s “whatever it takes” verbal
intervention (as well the relevant policy measures taken afterwards) to contain and reduce the contagion effects of the crisis
in the euro area periphery.
All in all, our empirical results broadly indicate that the determinants of sovereign bond yield spreads in the euro area have
changed significantly across time, with the macroeconomic/fiscal, liquidity and global risk sentiment fundamentals playing a
much greater role in market pricing, especially at the height of the EMU crisis and for the so-called euro-area periphery
economies. This compares with the period before the outbreak of the global crisis, which saw a significant disconnect
between domestic macro/fiscal fundaments and the pricing of sovereign debt markets in the euro area (as suggested by our
empirical results as well as numerous earlier empirical studies).

Page 14
Part III
A fundamentals-based valuation framework for Greek sovereign
bond yield spreads

Page 15 Source: Eurobank Economic Research & relevant data sources
Fundamentals-based valuation model for Greek sovereign bond yield spreads
Baseline specification
Empirical framework: Time series analysis to explain the evolution of 10-year Greek government bond yield spreads vs.
Germany.
Estimation methodology: Least Squares (to control for potential endogeneity, the baseline model has also been estimated
with Two-Stage Least Squares with the first two lags of independent variables used as instruments – no serious endogeneity
problems have been detected and thus, the regression results shown on page 16 correspond to Least Squares estimation).
Model specification – general form:
Δ(Greek_Spreadt) = c + β1*Δ(Portuguese_Spreadt) + β2*Δ(Greek_macro/fiscalt)+ β3*(Global_Risk_Aversiont) + εt
Where,
t is time subscript & Δ is the first difference operator
Greek_Spread & Portuguese_Spread denote the respective 10-year government bond yield spreads to Germany
The Greek_macro/fiscal variables include:
― D(LOG(ESI_GR)): first logarithmic difference of the Economic Sentiment Index
― D(LOG(REER_GR)): first logarithmic difference of the CPI-based Real Effective Exchange Rate of Greece vs. 37 trade
partners
― D(DEBT_RATIO_GR): first difference of the public debt to GDP ratio
― D(LOG(RS_GR)): first logarithmic difference of the Retail Sales index (volume, seasonal & calendar days adjusted)
The Global_Risk_Aversion variable (acronym: INTRISK3(-1) ) represents the (first lag of) of the Risk_Aversion variable used
in the panel study (see page 6 & Appendix)
The slope dummy variables D_Sept2011 & D_Jun_2012 (=1.0 from Sep. 2011 and Jun. 2012 onwards and zero otherwise)
enter our regression in multiplicative form i.e., they are multiplied by the respective Greek macro/fiscal variables.
Data frequency & time span: monthly observations, mostly spanning the period January 2009 to June 2017
Regression outcome: see page 16
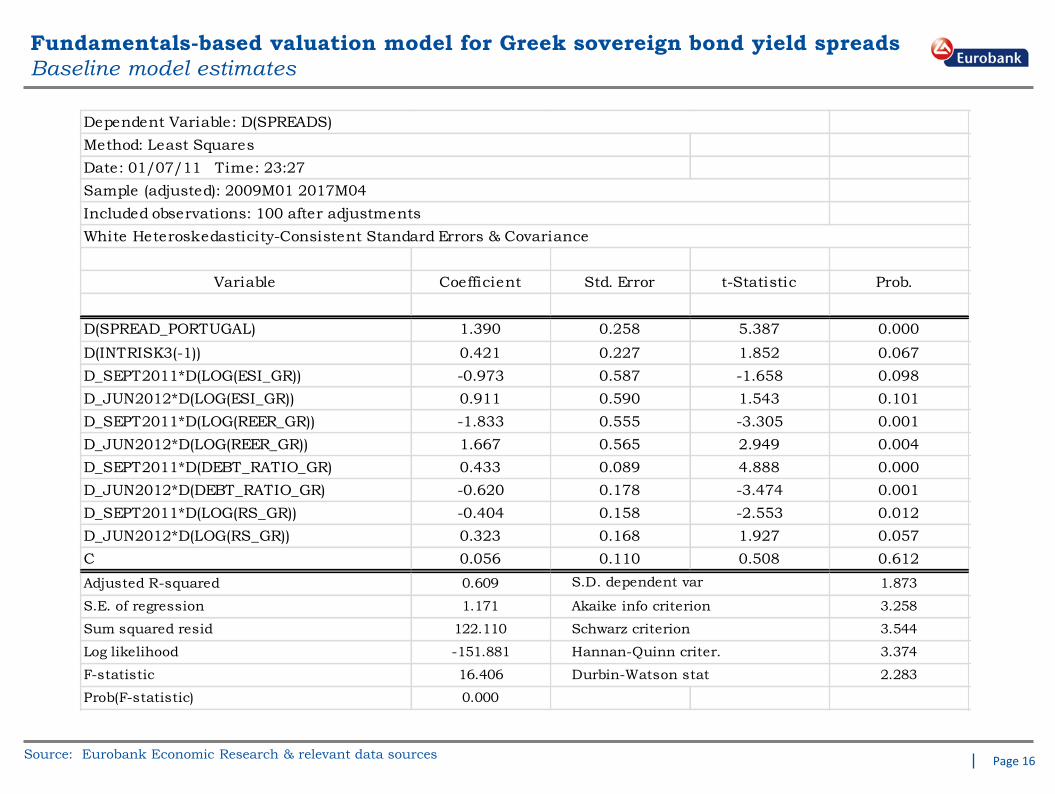
Page 16 Source: Eurobank Economic Research & relevant data sources
Fundamentals-based valuation model for Greek sovereign bond yield spreads
Baseline model estimates
Variable Coefficient Std. Error t-Statistic Prob.
D(SPREAD_PORTUGAL) 1.390 0.258 5.387 0.000
D(INTRISK3(-1)) 0.421 0.227 1.852 0.067
D_SEPT2011*D(LOG(ESI_GR)) -0.973 0.587 -1.658 0.098
D_JUN2012*D(LOG(ESI_GR)) 0.911 0.590 1.543 0.101
D_SEPT2011*D(LOG(REER_GR)) -1.833 0.555 -3.305 0.001
D_JUN2012*D(LOG(REER_GR)) 1.667 0.565 2.949 0.004
D_SEPT2011*D(DEBT_RATIO_GR) 0.433 0.089 4.888 0.000
D_JUN2012*D(DEBT_RATIO_GR) -0.620 0.178 -3.474 0.001
D_SEPT2011*D(LOG(RS_GR)) -0.404 0.158 -2.553 0.012
D_JUN2012*D(LOG(RS_GR)) 0.323 0.168 1.927 0.057
C 0.056 0.110 0.508 0.612
Adjusted R-squared 0.609 1.873
S.E. of regression 1.171 3.258
Sum squared resid 122.110 3.544
Log likelihood -151.881 3.374
F-statistic 16.406 2.283
Prob(F-statistic) 0.000
S.D. dependent var
Akaike info criterion
Schwarz criterion
Hannan-Quinn criter.
Durbin-Watson stat
Dependent Variable: D(SPREADS)
Method: Least Squares
Date: 01/07/11 Time: 23:27
Sample (adjusted): 2009M01 2017M04
Included observations: 100 after adjustments
White Heteroskedasticity-Consistent Standard Errors & Covariance

Page 17 Source: Eurobank Economic Research & relevant data sources
Fundamentals-based valuation model for Greek sovereign bond yield spreads
Actual & model-fitted spreads to Germany (in percentage points)

Page 18 Source: Eurobank Economic Research & relevant data sources
Model-based valuation of Greek 10yr sovereign bond yield spreads
Degree of undervaluation estimated as the difference between fitted and actual values
10-yr Greek bond yield spread over Germany:
degree of misalignment relative to fundamentals
Positive spread values indicate prices are undervalued
relative to fundamentals
(quarterly average in bps)
As indicated by the empirical results shown on page 16, our
fundamentals-based valuation model explains around 60% of the
volatility in the monthly series of Greek 10yr government bond
yield spreads over the period Jan. 2009 to Apr. 2017.
Apparently, other factors (not accounted for in our empirical
estimates) have been influencing the evolution of Greek sovereign
debt spreads over the aforementioned period.
Arguably, such factors may include: market liquidity conditions,
increased political and macroeconomic uncertainty as well as
periods of heightened investor fears over Greece’s euro
membership and the outlook of the agreed stabilization
programmes.
Taking these caveats and model limitations into account, the
charts presented herein show the time evolution of the degree of
misalignment of the Greek bond yield spreads (in our case,
undervaluation of respective prices) relative to the underlying
fundamentals analyzed in our study.
0
50
100
150
200
250
300
1Q
2016
2Q
2016
3Q
2016
4Q
2016
1Q
2017
10-yr Greek bond yield spread over Germany:
degree of misalignment relative to fundamentals
Positive spread values indicate prices are undervalued
relative to fundamentals
(monthly average in bps)
0
200
400
600
800
1,000
1,200
Jan
-10
Apr-
10
Ju
l-10
Oct-
10
Jan
-11
Apr-
11
Ju
l-11
Oct-
11
Jan
-12
Apr-
12
Ju
l-12
Oct-
12
Jan
-13
Apr-
13
Ju
l-13
Oct-
13
Jan
-14
Apr-
14
Ju
l-14
Oct-
14
Jan
-15
Apr-
15
Ju
l-15
Oct-
15
Jan
-16
Apr-
16
Ju
l-16
Oct-
16
Greek PSI Mar. 2012
Summer 2015 crisis
Agreement on 3rd bailout
programme Aug. 2015
Completion of 1st review 3rd
programme
May 2016
Deepening of euro area
crisis Sep.
2011
EU Parliament
election May
2014
2nd round of Greek elections
Jun. 2012

Page 19
Appendix
Descriptive statistics & principal components analysis

Page 20 Source: Eurobank Economic Research, Bloomberg
Evolution of 10-year government bond yield spreads, Jan 1999-Jun 2017
Graphical depiction

Page 21 Source: Eurobank Economic Research, Bloomberg
10-year government bond yield spreads, Jan 1999-Jun 2017 (in bps)
Descriptive statistics
AUSTRIA BELGIUM FINLAND FRANCE GREECE IRELAND ITALY NETHERL. PORTUGAL SPAIN
Mean 28.1 45.1 18.3 27.8 470.6 121.0 105.4 17.9 195.5 99.3
Median 23.8 31.3 19.5 18.4 150.0 36.8 46.5 15.2 42.2 33.1
Maximum 142.6 288.9 78.7 146.0 3,245.5 971.8 484.7 74.4 1,223.0 555.4
Minimum -3.6 -0.8 -7.5 -0.6 10.2 -4.5 9.8 -2.7 -2.1 -2.1
Std. Dev. 25.8 46.8 14.9 27.8 651.8 182.5 110.4 14.6 268.8 122.5
Skewness 1.7 2.2 1.1 1.7 2.1 2.1 1.6 1.2 1.9 1.6
Kurtosis 6.5 9.0 5.7 6.2 7.8 7.3 5.0 4.8 6.1 4.9
Observations 222 222 222 222 222 222 222 222 222 222

Page 22 Source: Eurobank Economic Research, Bloomberg
Increased heterogeneity between core and periphery sovereign debt markets
at the height of the euro area debt crisis
10yr Greek/German & Italian/German government bond yields
21-day rolling correlations

Page 23 Source: Eurobank Economic Research, Bloomberg
First & second principal component of government bond yield spreads
Graphical depiction
-4
-2
0
2
4
6
8
10
12
00 02 04 06 08 10 12 14 16
First principal component
Second principal component

Page 24 Source: Eurobank Economic Research, Bloomberg
Variable - Risk aversion 1
Extracted as1st principal component of the four (4) risk aversion metrics shown below
-4
-2
0
2
4
6
8
10
0
1
2
3
4
5
6
7
Jan
-99
Jan
-00
Jan
-01
Jan
-02
Jan
-03
Jan
-04
Jan
-05
Jan
-06
Jan
-07
Jan
-08
Jan
-09
Jan
-10
Jan
-11
Jan
-12
Jan
-13
Jan
-14
Jan
-15
Jan
-16
Jan
-17
LOG_EURUSD_VOL
LOG_VIX
USBBB_UST10YR_SPREAD
LIBOR_OSI_SPREAD
Risk aversion 1t (right axis)

Page 25 Source: Eurobank Economic Research, Bloomberg
Variable - Risk aversion 2
Extracted as1st principal component of the four (4) risk aversion metrics shown below

Page 26 Source: Eurobank Economic Research, Bloomberg
Variable - Risk aversion 3
Extracted as1st principal component of the three (3) risk aversion metrics shown below

Page 27 Source: Eurobank Economic Research, Bloomberg
Variables - Risk aversion 1, Risk aversion 2 & Risk aversion 3
Graphical depiction
-4
-2
0
2
4
6
8
10
Jan
-99
Jan
-00
Jan
-01
Jan
-02
Jan
-03
Jan
-04
Jan
-05
Jan
-06
Jan
-07
Jan
-08
Jan
-09
Jan
-10
Jan
-11
Jan
-12
Jan
-13
Jan
-14
Jan
-15
Jan
-16
Jan
-17
Risk aversion 1t Risk aversion 2t Risk aversion 3t

Page 28
This document has been issued by Eurobank Ergasias S.A. (Eurobank) and may not be reproduced in any manner. The information provided has been obtained from sources believed to be reliable but has not been verified by Eurobank and the opinions expressed are exclusively of their author. This information does not constitute an investment advice or any other advice or an offer to buy or sell or a solicitation of an offer to buy or sell or an offer or a solicitation to execute transactions on the financial instruments mentioned. The investments discussed may be unsuitable for investors, depending on their specific investment objectives, their needs, their investment experience and financial position. No representation or warranty (express or implied) is made as to the accuracy, completeness, correctness, timeliness or fairness of the information or opinions, all of which are subject to change without notice. No responsibility or liability, whatsoever or howsoever arising, is accepted in relation to the contents thereof by Eurobank or any of its directors, officers and employees.
Disclaimer