Corp Descriptions Of Financial Metrics - iLumen · and paid in capital but would exclude preference...
25
Name Description/Function How is this calculated or used? What does this tell me? Total Revenue Includes income from: sales less returns and allowances and discounts, revenue from affiliates, financial revenue, and other income (interest, dividents, etc.). Sum of all revenue and income items. Total Revenue is the total of all income sources for the company. It includes both operating revenue and other revenue sources such as interest income. Gross Profit Total Revenue net of the costs of producing that revenue. Total Revenue less Cost of Revenue. Gross Profit is the amount of profit made on the selling of a product or service before other operating expenses. Net Income (Loss) Income from operations less discontinued operations and extraordinary items. Continuing Operations less Discontinued Operations less Extraordinary Items from Income. Net income is the "bottom line" it is the amount of profit or loss that is generated for a specific period. Gross Margin % Ratio of Gross Profit to Revenue Gross Profit divided by Total Revenue. This ratio indicates how much profit is being made from the sale of product before other operating expenses. If this ratio was 35%, then for every dollar of sales the company makes 35 cents. A trend of this number getting smaller would signal lower profitability. As sales go up and down, this ratio would remain relatively constant. EBITDA Earnings Before Interest, Taxes, Depreciation and Amortization Income (loss) Before Taxes plus Interest Expense plus Depreciation Expense plus plus Amortization Expense This is a common cash flow/profitability measurement. Many industries focus on this figure more than profitability. The reason for this is one company can be compared to another eliminating the issues of how a company is financed (interest) what type of assets the company owns (depreciation/amortization) or how it is taxed (income taxes). Description Of Financial Metrics Company Dashboard
Transcript of Corp Descriptions Of Financial Metrics - iLumen · and paid in capital but would exclude preference...

Name Description/Function How is this calculated or used? What does this tell me?
Total Revenue Includes income from: sales less returns and allowances and discounts, revenue from affiliates, financial revenue, and other income (interest, dividents, etc.).
Sum of all revenue and income items. Total Revenue is the total of all income sources for the company. It includes both operating revenue and other revenue sources such as interest income.
Gross Profit Total Revenue net of the costs of producing that revenue.
Total Revenue less Cost of Revenue. Gross Profit is the amount of profit made on the selling of a product or service before other operating expenses.
Net Income (Loss) Income from operations less discontinued operations and extraordinary items.
Continuing Operations less Discontinued Operations less Extraordinary Items from Income.
Net income is the "bottom line" it is the amount of profit or loss that is generated for a specific period.
Gross Margin % Ratio of Gross Profit to Revenue Gross Profit divided by Total Revenue. This ratio indicates how much profit is being made from the sale of product before other operating expenses. If this ratio was 35%, then for every dollar of sales the company makes 35 cents. A trend of this number getting smaller would signal lower profitability. As sales go up and down, this ratio would remain relatively constant.
EBITDA Earnings Before Interest, Taxes, Depreciation and Amortization
Income (loss) Before Taxes plus Interest Expense plus Depreciation Expense plus plus Amortization Expense
This is a common cash flow/profitability measurement. Many industries focus on this figure more than profitability. The reason for this is one company can be compared to another eliminating the issues of how a company is financed (interest) what type of assets the company owns (depreciation/amortization) or how it is taxed (income taxes).
Description Of Financial Metrics
Company Dashboard

Name Description/Function How is this calculated or used? What does this tell me?
Days Sales Outstanding Ratio of sales to receivables converted to a number of days figure
365 days divided by the Receivable Turns ratio (Current period Sales (annualized for the period) divided by Accounts Receivable.)
This is the same tool as Receivable turns but converted to a day figure. The larger the number of days the longer it takes a company to collect its receivables. This ratio should be compared to the actual terms the company offers its customers to see how well those customers pay their invoices.
Days (on Hand) Inventory Inventory turnover expressed in a number of days.
365 days divided by Inventory Turnover ratio (Cost of Goods Sold (annualized for the period) divided by inventory.)
This ratio is similar to inventory turnover but the result is expressed in days as apposed to a number of times. A turnover ratio of 12 would equate to 30 days in inventory on hand. For some companies it is easier to evaluate their inventory efficiencies by thinking in days. They often know how long a manufacturing process takes or how long they want something to sit on a shelf.
Days Payable Payables Turnover ratio expressed in terms of days.
365 days times (Accounts Payable divided by Cost of Goods Solds (annualized for the period)).
This ratio is the same as payable turnover but the result is converted to days. It is helpful to compare this number of days to the actual terms that are offered to the company.
Company Dashboard (continued)

Name Description/Function How is this calculated or used? What does this tell me?
Total Debt / Equity Ratio of Total Debt to Total Equity. Total Debt divided by Total Equity. (Total Debt includes: LT and ST debt, current maturities, lines of credit, amounts due to stockholders and related parties. Total Equity includes: All equity items plus net income.)
Debt to Shareholders Equity is similar to Total liabilities to Net worth, but it excludes any equity that is not shareholder's equity. For Example shareholders equity would include Retained Earnings, common stock and paid in capital but would exclude preference shares and subordinated debt - equity. If this is number is increasing over time then the shareholders are becoming more leveraged and will have smaller claims to the company's assets. A larger number signals increased risk as the company has limited financial flexibility.
Funded Debt / EBITDA Ratio of Funded Debt to EBITDA (Earnings Before Interest, Taxes, Depreciation, & Amortization.
Funded Debt divided by EBITDA (annualized for the period). (Funded debt includes LT and ST debt, current maturities, and lines of credit. EBITDA is income calculated before interest, taxes, depreciation and amortization.)
This ratio tells one how many years it will take a company to repay its existing debt load at it current cash flow - as defined by EBITDA - level. The higher the number the more cash flow leveraged the company is. A number of 6.0 would highlight it would take six years at the current debt level to repay the debt. This ratio might be acceptable at the point a loan is originally made because the company can concentrate on debt repayment over the next six years. If this is a historical figure and the company is looking to borrow more funds, it would be more difficult to loan the money since the repayment would be so long.
Company Dashboard (continued)

Name Description/Function How is this calculated or used? What does this tell me?
Total Revenue Includes income from: sales less returns and allowances and discounts, revenue from affiliates, financial revenue, and other income (interest, dividents, etc.).
Sum of all revenue and income items. Total Revnue is the total of all income sources for the company. It includes both operating revenue and other revenue sources such as interst income.
Gross Profit Total Revenue net of the costs of producing that revenue.
Total Revenue less Cost of Revenue. Gross Profit is the amount of profit made on the selling of a product or service before other operating expenses.
Net Income (Loss) Income from operations less discontinued operations and extraordinary items.
Continuing Operations less Discontinued Operations less Extraordinary Items from Income.
Net income is the "bottom line" it is the amount of profit or loss that is generated for a specific period.
Gross Margin % Ratio of Gross Profit to Revenue Gross Profit divided by Total Revenue. This ratio indicates how much profit is being made from the sale of product before other operating expenses. If this ratio was 35%, then for every dollar of sales the company makes 35 cents. A trend of this number getting smaller would signal lower profitability. As sales go up and down, this ratio would remain relatively constant.
EBITDA Earnings Before Interest, Taxes, Depreciation and Amortization
Income (loss) Before Taxes plus Interest Expense plus Depreciation Expense plus plus Amortization Expense
This is a common cash flow/profitability measurement. Many industries focus on this figure more than profitability. The reason for this is one company can be compared to another eliminating the issues of how a company is financed (interest) what type of assets the company owns (depreciation/amortization) or how it is taxed (income taxes).
Annual Dashboard

Name Description/Function How is this calculated or used? What does this tell me?
Days Sales Outstanding Ratio of sales to receivables converted to a number of days figure
365 days divided by the Receivable Turns ratio (Current period Sales (annualized for the period) divided by Accounts Receivable.)
This is the same tool as Receivable turns but converted to a day figure. The larger the number of days the longer it takes a company to collect its receivables. This ratio should be compared to the actual terms the company offers its customers to see how well those customers pay their invoices.
Days (on Hand) Inventory Inventory turnover expressed in a number of days.
365 days divided by Inventory Turnover ratio (Cost of Goods Sold (annualized for the period) divided by inventory.)
This ratio is similar to inventory turnover but the result is expressed in days as apposed to a number of times. A turnover ratio of 12 would equate to 30 days in inventory on hand. For some companies it is easier to evaluate their inventory efficiencies by thinking in days. They often know how long a manufacturing process takes or how long they want something to sit on a shelf.
Days Payable Payables Turnover ratio expressed in terms of days.
365 days times (Accounts Payable divided by Cost of Goods Solds (annualized for the period)).
This ratio is the same as payable turnover but the result is converted to days. It is helpful to compare this number of days to the actual terms that are offered to the company.
Total Debt / Equity Ratio of Total Debt to Total Equity. Total Debt divided by Total Equity. (Total Debt includes: LT and ST debt, current maturities, lines of credit, amounts due to stockholders and related parties. Total Equity includes: All equity items plus net income.)
Debt to Shareholders Equity is similar to Total liabilities to Net worth, but it excludes any equity that is not shareholders's equity. For Example shareholders equity would include Retained Earnings, commonstock and paid in capital but would excludepreference shares and subordinated debt - equity. If this is number is increasing over time then the shareholders are becoming more leveraged and will have smaller claims to the company's assets. A larger number signals increased risk as the company has limited financial flexibility.
Annual Dashboard (continued)

Name Description/Function How is this calculated or used? What does this tell me?
Funded Debt / EBITDA Ratio of Funded Debt to EBITDA (Earnings Before Interest, Taxes, Depreciation, & Amortization.
Funded Debt divided by EBITDA (annualized for the period). (Funded debt includes LT and ST debt, current maturities, and lines of credit. EBITDA is income calculated before interest, taxes, depreciation and amortization.)
This ratio tells one how many years it will take a company to repay its existing debt load at it current cash flow - as defined by EBITDA - level. The higher the number the more cash flow leveraged the company is. A number of 6.0 would highlight it would take six years at the current debt level to repay the debt. This ratio might be acceptable at the point a loan is originally made because the company can concentrate on debt repayment over the next six years. If this is a historical figure and the company is looking to borrow more funds, it would be more difficult to loan the money since the repayment would be so long.\
Annual Dashboard (continued)
Name Description/Function How is this calculated or used? What does this tell me?
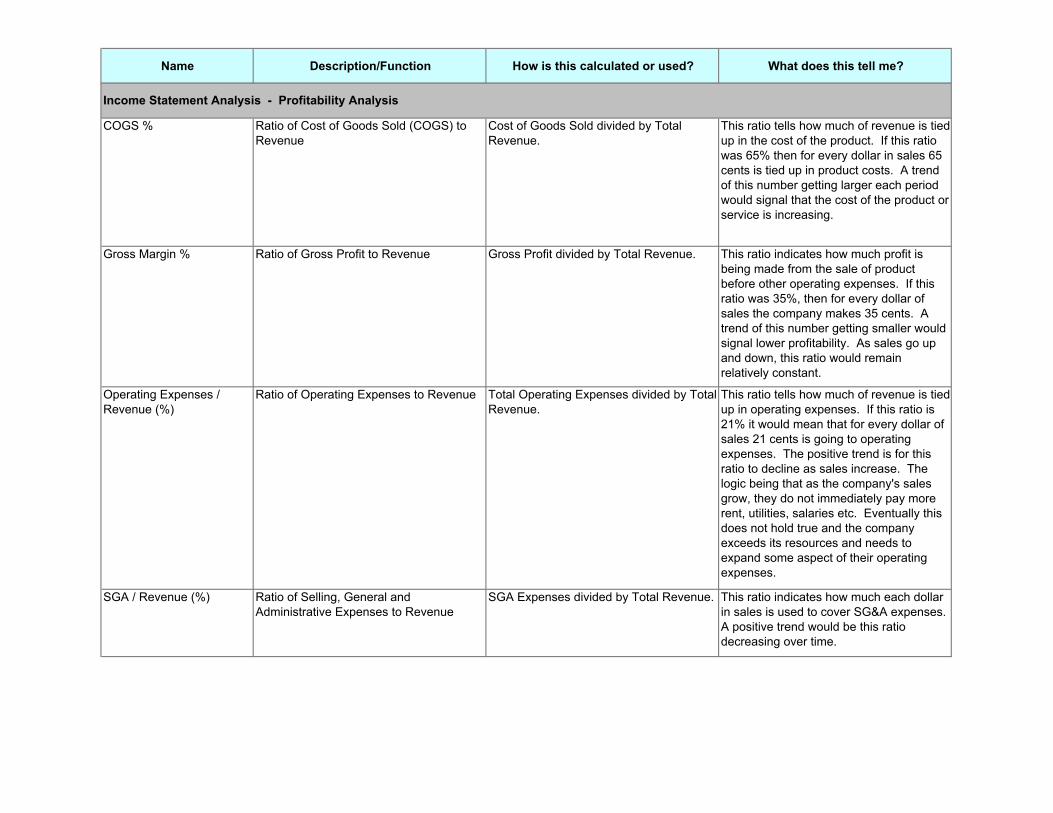
COGS % Ratio of Cost of Goods Sold (COGS) to Revenue
Cost of Goods Sold divided by Total Revenue.
This ratio tells how much of revenue is tied up in the cost of the product. If this ratio was 65% then for every dollar in sales 65 cents is tied up in product costs. A trend of this number getting larger each period would signal that the cost of the product or service is increasing.
Gross Margin % Ratio of Gross Profit to Revenue Gross Profit divided by Total Revenue. This ratio indicates how much profit is being made from the sale of product before other operating expenses. If this ratio was 35%, then for every dollar of sales the company makes 35 cents. A trend of this number getting smaller would signal lower profitability. As sales go up and down, this ratio would remain relatively constant.
Operating Expenses / Revenue (%)
Ratio of Operating Expenses to Revenue Total Operating Expenses divided by Total Revenue.
This ratio tells how much of revenue is tied up in operating expenses. If this ratio is 21% it would mean that for every dollar of sales 21 cents is going to operating expenses. The positive trend is for this ratio to decline as sales increase. The logic being that as the company's sales grow, they do not immediately pay more rent, utilities, salaries etc. Eventually this does not hold true and the company exceeds its resources and needs to expand some aspect of their operating expenses.
SGA / Revenue (%) Ratio of Selling, General and Administrative Expenses to Revenue
SGA Expenses divided by Total Revenue. This ratio indicates how much each dollar in sales is used to cover SG&A expenses. A positive trend would be this ratio decreasing over time.
Income Statement Analysis - Profitability Analysis

Name Description/Function How is this calculated or used? What does this tell me?
Operating Margin % Ratio of Operating Profit to Revenue Operating Income (loss) divided by Total Revenue.
This ratio indicates how much of each dollar in sales is converted to profitable operations. A positive ratio would be this ratio increasing over time. This is a profitability ratio for the core operations and does not include other income/expense, income taxes or extraordinary items.
Net Margin % (before tax) Ratio of Profit Before Tax to Revenue Income (loss) Before Taxes divided by Total Revenue.
This ratio indicates how much of each dollar in sales is profit after COGS, Operating expenses and other income/expense.
Net Margin % (after tax) Ratio of Profit After Tax to Revenue Net Income (loss) divided by Total Revenue.
This ratio indicates how much of each dollar in sales is profit after COGS, Operating expenses, other income/expense and extraordinary items. A positive trend would be this ratio increasing over time.
EBIT Earnings Before Interest and Taxes Income (loss) Before Taxes plus Interest Expense
This represents the dollar amount of earnings before interest and taxes.
EBITDA Earnings Before Interest, Taxes, Depreciation and Amortization
Income (loss) Before Taxes plus Interest Expense plus Depreciation Expense plus plus Amortization Expense
This is a common cash flow/profitability measurement. Many industries focus on this figure more than profitability. The reason for this is one company can be compared to another eliminating the issues of how a company is financed (interest) what type of assets the company owns (depreciation/amortization) or how it is taxed (income taxes).
EBITDA % Ratio of Earnings Before Interest, Taxes, Depreciation and Amortization percentage to Revenues
EBITDA divided by Total Revenue. This ratio allows one to see what percentage of sales is available to service debt, purchase assets and cover taxes. A positive trend would be an increasing percentage.
Income Statement Analysis - Profitability Analysis (continued)
Name Description/Function How is this calculated or used? What does this tell me?
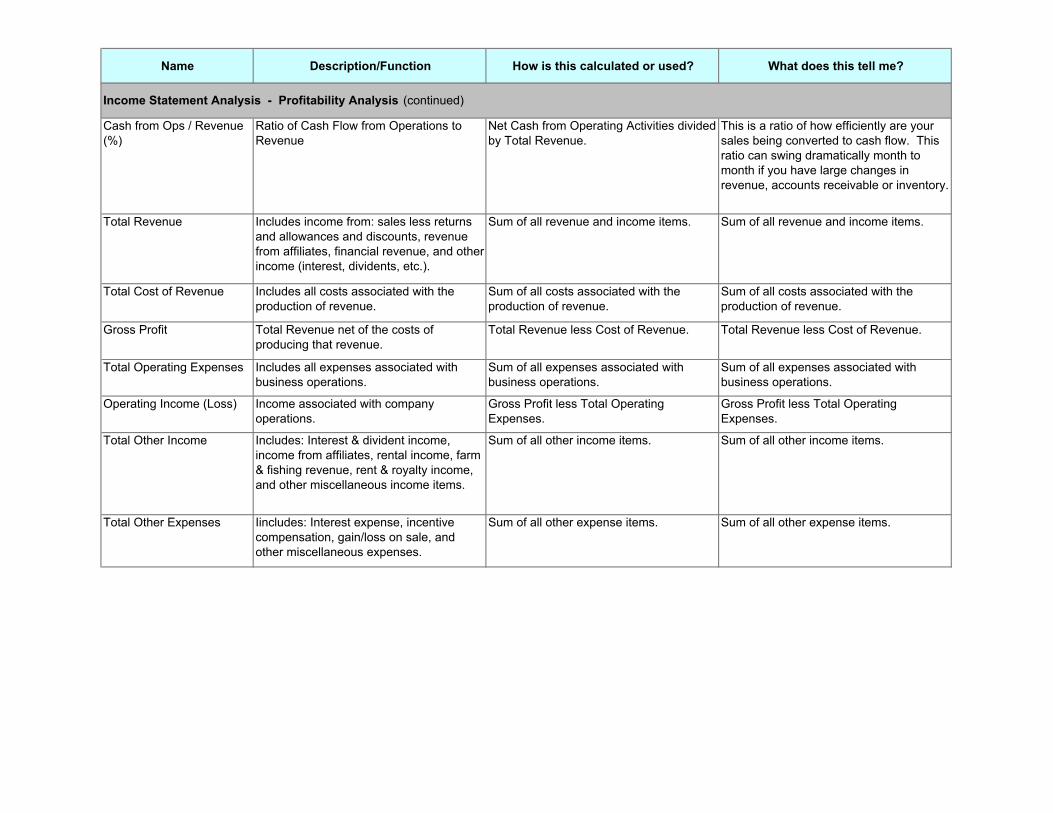
Cash from Ops / Revenue (%)
Ratio of Cash Flow from Operations to Revenue
Net Cash from Operating Activities divided by Total Revenue.
This is a ratio of how efficiently are your sales being converted to cash flow. This ratio can swing dramatically month to month if you have large changes in revenue, accounts receivable or inventory.
Total Revenue Includes income from: sales less returns and allowances and discounts, revenue from affiliates, financial revenue, and other income (interest, dividents, etc.).
Sum of all revenue and income items. Sum of all revenue and income items.
Total Cost of Revenue Includes all costs associated with the production of revenue.
Sum of all costs associated with the production of revenue.
Sum of all costs associated with the production of revenue.
Gross Profit Total Revenue net of the costs of producing that revenue.
Total Revenue less Cost of Revenue. Total Revenue less Cost of Revenue.
Total Operating Expenses Includes all expenses associated with business operations.
Sum of all expenses associated with business operations.
Sum of all expenses associated with business operations.
Operating Income (Loss) Income associated with company operations.
Gross Profit less Total Operating Expenses.
Gross Profit less Total Operating Expenses.
Total Other Income Includes: Interest & divident income, income from affiliates, rental income, farm & fishing revenue, rent & royalty income, and other miscellaneous income items.
Sum of all other income items. Sum of all other income items.
Total Other Expenses Iincludes: Interest expense, incentive compensation, gain/loss on sale, and other miscellaneous expenses.
Sum of all other expense items. Sum of all other expense items.
Income Statement Analysis - Profitability Analysis (continued)

Name Description/Function How is this calculated or used? What does this tell me?
Total Other Income/ Expense
Total Other Income net of other expense items.
Total Other Income less Total Other Expenses.
Total Other Income less Total Other Expenses.
Income (Loss) Before Taxes
Income calculated from tax expense. Operating Income (loss) plus Total Other Income/Expense
Operating Income (loss) plus Total Other Income/Expense
Income Tax Expense Income Tax Expense. Income Tax Expense includes: Current & deferred federal and state taxes & income tax credits.
Income Tax Expense includes: Current & deferred federal and state taxes & income tax credits.
Income from Continuing Operations
Income calculated after tax expenses. Income (loss) Before Taxes less Income Tax Expense.
Income (loss) Before Taxes less Income Tax Expense.
Net Income (Loss) Income from operations less discontinued operations and extraordinary items.
Continuing Operations less Discontinued Operations less Extraordinary Items from Income.
Continuing Operations less Discontinued Operations less Extraordinary Items from Income.
Income Statement Analysis - Profitability Analysis (continued)

Name Description/Function How is this calculated or used? What does this tell me?
Total Current Assets Total Current Assets Sum of all Current Assets. This it the total of all assets that are either cash or will convert to cash in the next 12 months. The logic here is that inventory will be sold and will become accounts receivable which will be collected for cash. This is often compared to current liabilities.
Total Fixed Assets Total Fixed Assets Net of fixed assets less accumulated depreciation.
This represents the estimated useful life of assets in use. It simply takes the initial cost of assets such as buildings, equipment etc. and subtracts the total accumulated depreciatioin for these itesms. It does not represent the market value of the assets.
Total Other Assets Total other long term assets includes: Investments from affiliates, amounts due from shareholders & related parties, intangible & depletable assets net of associated amortization & depletion, & other miscellaneous long term assets.
Sum of all Other Long Term Assets. Simply the sum of other long term assets
Total Assets Total Assets Sum of all Current and Long Term Assets. Simply the sum of all assets
Total Current Liabilities Total Current Liabilities Sum of all Current Liabilities. This is the total of all obligations that will become due and payable over the next 12 months. It will include accounts payable, short term debt and accrued current liabilty. This is usually compared to currrent assets.
Balance Sheet Analysis

Name Description/Function How is this calculated or used? What does this tell me?
Long Term Debt Total Long Term Debt includes: Long term bank debt, loans & notes payable, secured & unsecured debt, subordinated debt, mortgages, bonds & debentures, amounts due to shareholders, officers, & related parties, & captialized lease obligations, etc.
Sum of all Long Term Debt. Simply the sum of all long term interest bearing debt
Total Debt Total Debt includes: LT and ST debt, current maturities, lines of credit, amounts due to stockholders and related parties.
Sum of all short and long term debt. The sum of all interst bearing debt - including both short and long term debt
Total Other Liabilities Total Other Long Term Liabilities includes: Defered debt, interest & revenue, accrued items and other miscellaneous long term liabilities.
Sum of all Other Long Term Liabilities. Simply the sum of other liabilities.
Total Long Term Liabilities Includes: Total Debt and Other Long Term Liabilities.
Sum of Total Debt and Other Long Term Liabilities.
Simply the sum of all long term obligations
Total Liabilities Total Liabilities includes: All Current Liabilities, Long Term Debt, and Long Term Liabilities.
Sum of all Current and Long Term Debt and Liabilities.
Simply the sum of all obligations.
Ending Retained Earnings Retained Earnings for the end of a period. Beginning Retained Earnings net of Distributions & Dividends plus Net Income (Loss).
This is the cumulative sum of all earnings and losses of the company.
Total Equity Total Equity Sum of all Equity items plus Net Income (Loss).
Simply the totoal of all equity accounts
Total Liabilities & Equity Total Liabilities & Equity Sum of all Liabilities plus Total Equity. Simply a total of total equity and total liabilities
Balance Sheet Analysis (continued)
Name Description/Function How is this calculated or used? What does this tell me?
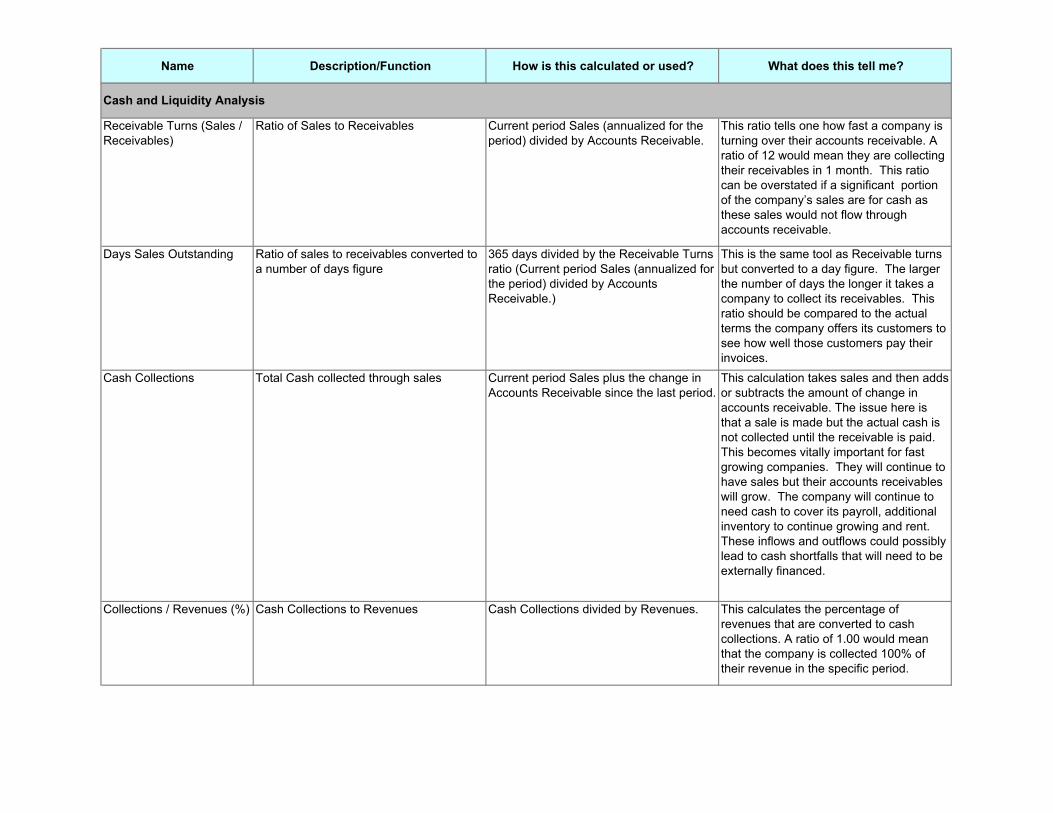
Receivable Turns (Sales / Receivables)
Ratio of Sales to Receivables Current period Sales (annualized for the period) divided by Accounts Receivable.
This ratio tells one how fast a company is turning over their accounts receivable. A ratio of 12 would mean they are collecting their receivables in 1 month. This ratio can be overstated if a significant portion of the company’s sales are for cash as these sales would not flow through accounts receivable.
Days Sales Outstanding Ratio of sales to receivables converted to a number of days figure
365 days divided by the Receivable Turns ratio (Current period Sales (annualized for the period) divided by Accounts Receivable.)
This is the same tool as Receivable turns but converted to a day figure. The larger the number of days the longer it takes a company to collect its receivables. This ratio should be compared to the actual terms the company offers its customers to see how well those customers pay their invoices.
Cash Collections Total Cash collected through sales Current period Sales plus the change in Accounts Receivable since the last period.
This calculation takes sales and then adds or subtracts the amount of change in accounts receivable. The issue here is that a sale is made but the actual cash is not collected until the receivable is paid. This becomes vitally important for fast growing companies. They will continue to have sales but their accounts receivables will grow. The company will continue to need cash to cover its payroll, additional inventory to continue growing and rent. These inflows and outflows could possibly lead to cash shortfalls that will need to be externally financed.
Collections / Revenues (%) Cash Collections to Revenues Cash Collections divided by Revenues. This calculates the percentage of revenues that are converted to cash collections. A ratio of 1.00 would mean that the company is collected 100% of their revenue in the specific period.
Cash and Liquidity Analysis

Name Description/Function How is this calculated or used? What does this tell me?
Inventory Turnover (COGS/Inventory)
Ratio of Cost of Goods Sales to Inventory Cost of Goods Sold (annualized for the period) divided by Inventory.
This ratio describes the number of times a year the company is turning over their inventory. The larger the ratio the more efficient the company is utilizing their inventory. The faster a company can turn over their inventory the less cash they have tied up in inventory.
Days (on Hand) Inventory Inventory turnover expressed in a number of days.
365 days divided by Inventory Turnover ratio (Cost of Goods Sold (annualized for the period) divided by inventory.)
This ratio is similar to inventory turnover but the result is expressed in days as apposed to a number of times. A turnover ratio of 12 would equate to 30 days in inventory on hand. For some companies it is easier to evaluate their inventory efficiencies by thinking in days. They often know how long a manufacturing process takes or how long they want something to sit on a shelf.
Inventory Purchases Total Cash utilized for Inventory during the period
Ending Inventory plus Cost of Goods Sold minus Beginning Inventory.
This calculation yields the total inventory purchased in the period. It takes the beginning inventory plus all of the inventory in COGS and then subtracts the ending inventory. This represents all of the inventory that flowed through the company during a certain period. When analyzing cash flow it helps identify what amount of cash went toward inventory.
Operating Expenses Paid on Terms
Operating Expenses Paid on Terms is selling, general & administrative expenses net of payroll and benefits expenses.
Selling, General & Administrative Expenses less Payroll & Benefits.
This calculation is the total of all SG&A expenses less payroll and benefits. It is used in cash flow to highlight the non-personal expenses for a period.
Total Purchases for A/P Total Purchases for Accounts Payable. Inventory Purchases plus Operating Expenses Paid on Terms (Selling, General & Administrative Expenses less Payroll & Benefits).
This calculation highlights the total of all purchases that flow through accounts payable including inventory and SG&A expenses.
Cash and Liquidity Analysis (continued)

Name Description/Function How is this calculated or used? What does this tell me?
Payables Turnover (COGS / Payables)
Ratio of Cost of Goods Sold to Accounts Payable.
Cost of Goods Solds (annualized for the period) divided by Accounts Payable.
This calculates the number of times accounts payable are turned over. It is useful to compare this number to the normal payment terms offered to this company. A turnover figure of 12 would mean a company is paying their payable inroughly a month.
Days Payable Payables Turnover ratio expressed in terms of days.
365 days times (Accounts Payable divided by Cost of Goods Solds (annualized for the period)).
This ratio is the same as payable turnover but the result is converted to days. It is helpful to compare this number of days to the actual terms that are offered to the company.
Cash Payments Total cash outflow for inventory and expenses.
Total Purchases for A/P plus change in Accounts Payable since the last period.
This calculation highlights the total cash paid out for Purchases for inventory & SG&A expenses. It is similar to invntory purchases but also includes the net change in accounts payable. By including the change in AP, any slowness or prepayment in AP is accounted for when evaluating cash flow.
Current Ratio Ratio of Current Assets to Current Liabilities.
Current Asset divided by Current Liabilities.
This is a liquidity ratio which shows the relationship of current assets (assets that will be converted to cash over the coming 12 months - Inventory, accounts receivable etc.) to Current Liabilities (liabilities which will need to be paid in the coming 12 months - accounts payable, accrued expenses, line of credit, etc.). A number less than one signals the company will have difficulty meeting its short term obligations.
Cash and Liquidity Analysis (continued)

Name Description/Function How is this calculated or used? What does this tell me?
Quick Ratio Ratio of Cash & Accounts Receivables to Current Liabilities.
(Cash plus Accounts Receivable) divided by Current Liabilities.
This ratio is similar to the current ratio but only utilizes the most liquid assets cash and accounts receivable. A ratio of over one is considered strong highlighting that cash and accounts receivable can cover all current liabilities. Another way to express this ratio is inventory reliance. A ratio of less than one illustrates the dependence on inventory conversion to cash to satisfy current liabilities.
Working Capital Balance of Current Assets less Current Liablities.
Current Assets minus Current Liabilities. This calculation shows how much in current assets are left after the subtraction of current liabilities. A larger number illustrates the company's ability to cover current liabilities and how much is available to cover other longer term liabilities. Now this calculation along with current and quick ratio need to be evaluated in the context of what makes up each of the company's current assets and current liabilities. If a company has long payment from its suppliers 120 days and turns its inventory over in 30 days then the company can use these payment terms to finance other assets such as building and equipment. (An example would be Wal-Mart).
AR / AP Ratio of Accounts Receivable to Accounts Payable.
Accounts Receivable divided by Accounts Receivable.
This ration highlights the relationship between accounts receivable and accounts payable. A ratio of less than one highlights that the company has more payables than receivables. This could be good or bad. If the company only sells for credit, then it will have to pay its bills before it receives the cash from receivables. If a company has some significant cash sales then this ratio is not comparing apples to apples.
Cash and Liquidity Analysis (continued)

Name Description/Function How is this calculated or used? What does this tell me?
Cash / Current Liabilities Ratio of Cash to Current Liabilities. Cash divided by Current Liabilities. This highlights the cash coverage of current liabilities. A higher number signifies a lower dependence on the conversion of accounts receivable and inventory to cash to cover current liabilities.
Cash / Assets Ratio of Cash to Total Assets. Cash divided by Total Assets. Simple a calculation to see how much of total assets are cash. This ratio allows an analyst to compare two companies of different sizes.
Cash and Liquidity Analysis (continued)

Name Description/Function How is this calculated or used? What does this tell me?
Depreciation & Amortization
Total Depreciation & Amortization Expense from sales and operations.
COGS Depreciation and Amortization plus SG&A Depreciation and Amortization Expense.
This is simple the total of all depreciation and amortization expense for the period
SGA - Depreciation & Amortization
Total Depreciation and Amortization Expense from Selling, General & Administrative.
Total Depreciation and Amortization Expense from SG&A.
This calculation allows one to compare two different size companies with respect to depreciation and saga.
(Increase) Decrease in Current Assets
Change in Current Assets minus Cash from prior year.
Change in Current Assets minus change in Cash from prior year.
This calculation is used in cash flow analysis. It analyzes the change in primarily inventory, accounts receivable and prepaid expenses. An increase in the value signals that more cash it tied up in those assets and the increase is considered a use of cash. Subsequently, a decrease would signal a source of cash flow. As an example, if accounts receivable increase then company's sales were not all converted to cash and some potential cash is tied up in accounts receivable.
(Increase) Decrease in Other Operating Assets
Change in Other Long Term Assets not including Accumulated Amortization from prior year.
Change in Other Long Term Assets minus the change in Accumulated Amortization minus the change in Accumulated Amortization of Deferred Charges.
This calculation is used to calculate the change in non-current and non-fixed assets. In cash flow analysis it highlights how much cash was utilized or created by a change in other operating assets.
Cash Flow Monthly

Name Description/Function How is this calculated or used? What does this tell me?
Increase (Decrease) in Current Operating Liabilities
The change in Current Liabilities from the prior year.
Current period [Ending Current Liabilities minus Short Term Debt minus Current Maturities of LT Debt minus Lines of Credit minus Dividends)] minus prior period [(Ending Current Liabilities minus Short Term Debt minus Current Maturities of LT Debt minus Lines of Credit minus Dividends)].
This calculation is used in cash flow analysis. It analyzes the change in current liabilities. An increase in current liabilities signals that cash was gained by not having to pay these liabilities. As an example if the company increased its accounts payable, then the company has received assets namely inventory but has not paid the invoice yet - therefore no use of cash. If this was the only transaction in the period, from a cash flow perspective inventory increased (a use of Cash in cash flow analysis) and accounts payable increased (a source of cash in cash flow analysis) the increase and decrease net to zero. In reality, the company bought some inventory but has not paid cash for it so their was -0- change in cash.
Increase (Decrease) in Other Operating Liabilities
The change in Other Operating Liabilities excluding Debt from the prior year.
Current period [(Beginning Other Current Liability minus Deferred Debt minus Deferred Interest)] minus prior period [(Beginning Other Current Liability minus Deferred Debt minus Deferred Interest)].
This calculation is used to calculate the change in non-current liabilities and non-interest bearing debt. In cash flow analysis it highlights how much cash was utilized or created.
Capital Expenditures Change in Gross Fixed Assets from the prior year.
Beginning Gross Fixed Assets minus ending Gross Fixed Assets.
This marks the change in gross fixed assets. It needs to be combined with the corresponding Depreciation and amortization adjustment to highlight the actual amount of cash utilized on capital expenditures. By combining this with the depreciation and amortization adjustment, and retirements in fixed assets are accounted for accurately in the cash flow.
Cash Flow Monthly (continued)

Name Description/Function How is this calculated or used? What does this tell me?
Net Financing Activities (debt)
Change in debt from the prior year. The change in Line of Credit, Short & Long Term, Amounts Due From Officers, Shareholders and Related Parties and Deferred Debt.
This tells one the amount of additional external financing that was taken on or paid of by the company. This includes interest bearing debt and excludes operating liabilities such as accounts payable and accrued expenses.
Net Capital Additions Change in Profits minus change in Dividends from the prior year.
Change in Equity minus change in Retained Earnings (Profits) minus change in Dividends/Distributions (Dividends).
This represents any additional equity financing over and above income/loss for the period and distributions for the period.
Net Cash from Operating Activities
Net cash flow generated by operating activities.
Subtotal of Cash from Operating Activities. This represents the amount of cash flow generated for a certain period by the operations of the company. This calculation can be both positive and negative and will be influenced by purchases in inventory and the collection of receivable. A negative number for the period means that the company is going to need cash to cover the shortfall. This could come from either cash in the bank or from some external source. In the long run, if a company does not have positive cash flow from operations it will continually need outside debt and/or equity to allow it to continue operations.
Net Cash from Investing Activities
Net cash flow generated or used by investing activities, usually fixed assets.
Subtotal of Cash from Investing Activities. This represents the amount of cash flow generated or consumed by investing activities. Usually this highlights the amount of fixed assets a company has acquired for a given period. If the company financed the acquisition then the increase in debt will appear in the Net Cash From Financing Activities.
Cash Flow Monthly (continued)

Name Description/Function How is this calculated or used? What does this tell me?
Net Cash from Financing Activities
Net cash flow from debt and equity financing.
Subtotal of Cash from Financing Activities. This represents the amount of cash flow generated or consumed by financing activities. If the company borrowed moneyor issued new debt, it would appear here as a positive or source of cash flow. If the company paid off some debt of issued dividends, it would appear here as a negative or use of cash.
Net Increase (Decrease) in Cash
Net increase or decrease in cash for the period.
Total of Cash from Operating, Investing, & Financing Activities.
This is the net change in cash for the period.
Beginning Cash Cash at the beginning of the period Beginning Cash value. Simply the beginning cash balance
Ending Cash Cash at the end of the period Ending Cash value. Simply the ending cash balance
Depreciation Adjustment Change in Accumulated Depreciation and Amortization outside of Depreciation Expense from the prior year.
The change in Accumulated Depreciation and Amortization for the period minus the amount of Depreciation and Amortization Expense for the same period.
In the cash flow statements this calculationcaptures any changes in the accumulated depreciation and amortization outside of depreciation and amortization expense. For example if a company retires a piece of equipment, they would reduce both fixed assets and depreciation. The change in fixed assets will be captured in capital expenditures and the change in depreciation would be captured in this account.
Distributions/dividends/adjustments
Amount of dividends distributed for the period.
Change in Retained Earnings less change in Dividends Payable.
This represents the amount of dividends or distributions for the period.
Cash Flow Monthly (continued)

Name Description/Function How is this calculated or used? What does this tell me?
Tangible Net Worth Tangible Net Worth minus Net Intangible Assets.
Total Equity minus Net Intangible Assets. This calculation takes total equity and subtracts the total amount of intangibles. The logic here is to look at the equity of only the tangible hard assets. This is primarily used in credit analysis to present a more conservative view of equity.
Liabilities / Tangible Net Worth
Ratio of Total Liabilities to Tangible Net Worth.
Total Liabilities divided by Total Equity This is a leverage ratio. This ratio calculates the relationship between debt and equity. A number of 2.5 means that for every dollar in equity there is 2.5 dollars in debt. A company with higher leverage has less financial flexibility meaning that for every dollar the owner has in the company, outside creditors (banks, suppliers etc) have $2.5.
Liabilities /Tangible Net Worth (Shareholder Loans as equity)
Ratio of Total Liabilities to Tangible Net Worth (Excluding Amounts Due to Shareholders)
Total Liabilities plus Amounts Due to Shareholders divided by Tangible Net Worth less Amounts Due to Shareholders.
Another leverage ratio like liabilities to worth but this treats shareholder loans as equity instead of debt. If the owners have put money into the company through loans instead of equity, this is a way to show this as equity from a leverage perspective.
Debt Ratio (Total Liabilities / Total Assets)
Ratio of Total Liabilities to Total Assets. Total Liabilities divided by Total Assets. This ratio highlights the amount of the asset that was financed by external sources.
Total Debt / Equity Ratio of Total Debt to Total Equity. Total Debt divided by Total Equity. (Total Debt includes: LT and ST debt, current maturities, lines of credit, amounts due to stockholders and related parties. Total Equity includes: All equity items plus net income.)
This is similar to the leverage ratio liabilities to equity but this ratio only includes interest bearing debt instead of total liabilities. This is a common way for banks to look at the leverage of a company since they are usually the debt holder.
Debt / Assets Ratio of Total Debt to Total Assets. Total Debt divided by Total Assets. (Total Debt includes: LT and ST debt, current maturities, lines of credit, amounts due to stockholders and related parties).
this is similar to liabilities to assets but answers the question - what percent of assets are financed by debt.
Leverage Ratios

Name Description/Function How is this calculated or used? What does this tell me?
Cash from Ops / Total Debt Ratio of Cash from Operations to Total Debt.
Total Cash from Operations (annualized) divided by Total Debt. Total Debt includes: LT and ST debt, current maturities, lines of credit, amounts due to stockholders and related parties.
this is a cash flow leverage ratio. It takes the annualized amount of cash flow the company is generating and compares this to the total interesting bearing debt. A number of .25 means that at the company's current cash flow level, it would only be able to cover 25% of the company's debt obligations. The larger the percentage the less leveraged the company's cash flow is.
Cash from Ops / Total Liabilities
Ratio of Cash from Operations to Total Liabilities.
Total Cash from Operations (annualized) divided by Total Liabilities.
similar to Cash from Ops/Total debt but total liabilities are used.
Leverage Ratios (continued)

Name Description/Function How is this calculated or used? What does this tell me?
Debt Coverage Ratio Ratio of annualized Net Income plus Depreciation & Amortization Current Portion of Long Term Debt.
(Net Income plus Depreciation & Amortization) (annualized for the period) divided by Current Portion of Long Term Debt.
this is a common bank coverage ratio. It takes a simplified cash flow calculation (NI + Depreciation) and compares it to the debt obligations due in the next 12 months. A number like 1.5 means that the company can cover its current debt obligations 1.5 times.
EBIT / Interest Coverage Ratio of EBIT (Earnings Before Interest & Taxes) to Interest Expense
EBIT (Earnings Before Interest & Taxes) divided by Interest Expense
This is another coverage ratio. It highlights the amount of cash flow is available to cover interest. A number less than one means the company cannot even cover interest and would be unable to repay any principal.
EBITDA / Interest Coverage
Ratio of EBITDA (Earnings Before Interest, Taxes, Depreciation, & Amortization) to Interest Expense
EBITDA (Earnings Before Interest, Taxes, Depreciation and Amortization) divided by Interest Expense.
Similar to EBIT/Interest but uses the EBITDA cash flow metric.
Funded Debt Interest Bearing Debt. Funded Debt includes: Lines of Credit plus Short Term Debt plus Current Portion of Long Term Debt plus Long Term Debt less Amounts Due to Shareholders & Related Parties.
The sum of all interest bearing debt.
Funded Debt / EBITDA Ratio of Funded Debt to EBITDA (Earnings Before Interest, Taxes, Depreciation, & Amortization.
Funded Debt divided by EBITDA (annualized for the period). (Funded debt includes LT and ST debt, current maturities, and lines of credit. EBITDA is income calculated before interest, taxes, depreciation and amortization.)
This is a ratio of debt to cash flow. A number of 3 would mean that at the company's current debt and cash flow level, it would take the company 3 years to repay it debt obligations. This calculations is used to make sure a company's debt level does not get too far ahead of it cash flow.
Coverage Ratios

Name Description/Function How is this calculated or used? What does this tell me?
Return on Assets ROA Ratio of Annualized Net Income to Total Assets.
Net Income (annualized for the period) divided by Total Assets.
The highlights the amount of profits the company's assets generated.
Return on Equity ROE Ratio of Annualized Net Income to Total Equity.
Net income (annualized for the period) divided by Total Equity.
This highlights the amount of profits the company's equity generated.
Asset Turnover (Sales / Assets)
Ratio of Annualized Total Revenue to Total Assets.
Total Revenue (annualized for the period) divided by Total Assets.
This highlights the amount of sales the company's assets generated. A number of 2 would mean for every dollar in assets the company generated $2 in sales. A rising trend show the company is more efficiently utilizing its assets.
Retained Earnings / Assets Ratio of Ending Retained Earnings to Total Assets.
Retained earnings divided by assets Simply Retained Earnings as a percentageof assets.
Financial Ratios