Copyright · Web viewDriven by significant energy cost savings, LED affordability and phase out of...
85
Modelling and analysis of Australia’s abatement opportunities Report to the Department of the Environment Meeting Australia’s 2030 emissions reduction target May 2016
-
Upload
vuonghuong -
Category
Documents
-
view
213 -
download
0
Transcript of Copyright · Web viewDriven by significant energy cost savings, LED affordability and phase out of...

Modelling and analysis of Australia’s abatement opportunitiesReport to the Department of the Environment
Meeting Australia’s 2030 emissions reduction targetMay 2016

Modelling and analysis of Australia’s abatement opportunities
Copyright
© 2016 Energetics. All rights reserved.
"Energetics" refers to Energetics Pty Ltd and any related entities.
This report is protected under the copyright laws of Australia and other countries as an unpublished work. This report contains information that is proprietary and confidential to Energetics and subject to applicable Federal or State Freedom of Information legislation, shall not be disclosed outside the recipient's company or duplicated, used or disclosed in whole or in part by the recipient for any purpose other than for which the report was commissioned. Any other use or disclosure in whole or in part of this information without the express written permission of Energetics is prohibited.
Disclaimer
The information contained in this document is of a general nature only and does not constitute personal financial product advice. In preparing the advice no account was taken of the objectives, financial situation or needs of any particular person. Energetics is authorised to provide financial product advice on derivatives to wholesale clients under the Corporations Act 2001 AFSL No: 329935. In providing information and advice to you, we rely on the accuracy of information provided by you and your company. Therefore, before making any decision, readers should seek professional advice from a professional adviser to help you consider the appropriateness of the advice with regard to your particular objectives, financial situation and needs.
Australian Financial Services License (AFSL # 329935).
ii © Energetics Pty Ltd 2023

Modelling and analysis of Australia’s abatement opportunities
Acknowledgements
Energetics would like to acknowledge the contribution of the following people and businesses to this report Telstra, GPT, Low Carbon Living CRC.
Executive summary
At the UNFCCC 21st Conference of Parties (COP21) in Paris, December 2015, Australia formalised our Intended Nationally Determined Contribution (INDC) for inclusion in the Paris Agreement. This contribution is a target to reduce Australia’s domestic emissions by 26 to 28 per cent below 2005 levels by 2030.
To help illustrate a pathway for the Government to achieve the 2030 target, the Department of the Environment (the Department) engaged Energetics to analyse and model the emissions reduction opportunity.
Energetics’ analysis shows there is potentially significant low-cost abatement available to meet the 2030 target.
Australia’s emissions reduction potentialTo assess the potential for Australia to meet this abatement target, Energetics considered over 70 abatement opportunities that could be implemented by policies existing or under consideration by the Government. Abatement opportunities were identified across all major sectors and categorised into a range of project types including land use change, fuel switching, energy productivity, renewable energy and waste management.
Energetics’ model identified an abatement potential of 154 Mt CO2-e in 2030 relative to emissions in 2020. The total cumulative abatement opportunity in the period from 2021 to 2030 was estimated to be around 960 Mt CO2-e. The scale of the potential identified abatement is consistent with Australia meeting its 2030 target.
iii © Energetics Pty Ltd 2023
Australia can reach its 2030 abatement target under the current policy framework. Large emitters must be effectively engaged and programs pursued without delay. Energetics’ modelling of over 70 emissions reduction measures has found that approximately 960 Mt CO2-e of abatement can be achieved by 2030.
Modelling over the period 1993 – 2015 shows the emissions intensity of the Australian economy fell on average by 2.3 percent each year, suggesting that national emissions are decoupling from economic growth.
Australia will achieve its 2020 cumulative abatement target under the Kyoto protocol, equivalent to 5 per cent below 2000 levels by 2020. Energetics has identified further abatement opportunities that can be pursued, to reach an absolute 2020 target.

Modelling and analysis of Australia’s abatement opportunities
Figure 1: Cumulative abatement potential categorised by abatement type
Energetics’ analysis of the total abatement potential by opportunity type indicates that energy productivity and land-use change can deliver a significant portion of Australia’s cumulative abatement requirement from 2021 to 2030 (as shown in Figure 1). Abatement opportunities identified for energy productivity accounts for 44 per cent of total abatement potential, while identified abatement from land-use change opportunities can contribute a further 38 per cent in total.
Renewable energy and management of industrial processes can each contribute a further five per cent of the identified abatement potential. The remaining abatement potential has been identified in abatement opportunities related to fuel switching, agriculture, fugitive emissions and waste.
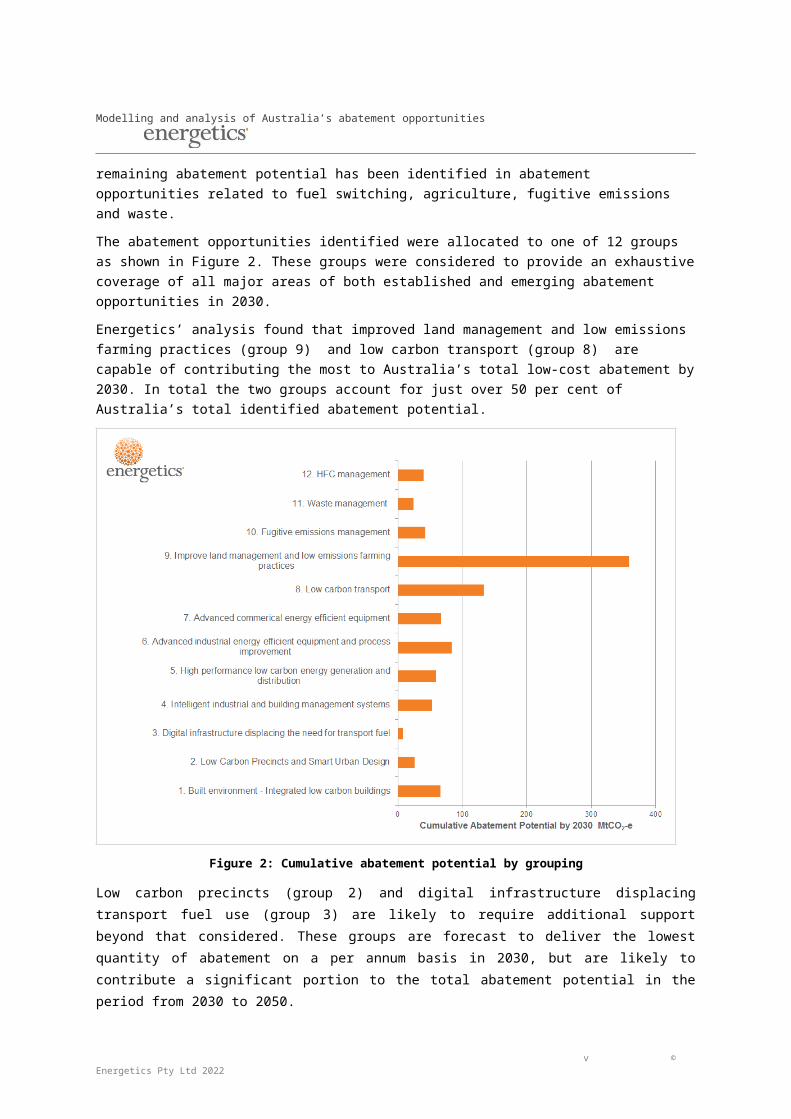
The abatement opportunities identified were allocated to one of 12 groups as shown in Figure 2. These groups were considered to provide an exhaustive coverage of all major areas of both established and emerging abatement opportunities in 2030.
Energetics’ analysis found that improved land management and low emissions farming practices (group 9) and low carbon transport (group 8) are capable of contributing the most to Australia’s total low-cost abatement by 2030. In total the two groups account for just over 50 per cent of Australia’s total identified abatement potential.
iv © Energetics Pty Ltd 2023
Modelling and analysis of Australia’s abatement opportunities
Figure 2: Cumulative abatement potential by grouping
Low carbon precincts (group 2) and digital infrastructure displacing transport fuel use (group 3) are likely to require additional support beyond that considered. These groups are forecast to deliver the lowest quantity of abatement on a per annum basis in 2030, but are likely to contribute a significant portion to the total abatement potential in the period from 2030 to 2050.
Emissions trajectory through to 2030Energetics’ analysis of the period 1993 to 2015 revealed a consistent reduction in the intensity of emissions per unit of GDP (excluding those from the LULUCF1 sector). The finding is robust despite the wide range of economic conditions, external shocks and climate change polices experienced over this period. The average year by year reduction in greenhouse gases per unit of GDP was 2.17 per cent2.
The abatement potential identified by Energetics assumes a continuation of this trend in emissions intensity improvements.
Based on Australia’s emissions in 2020 being five per cent lower than in the year 2000 and a continuation of the emissions intensity reductions, Energetics estimates Australia’s domestic emissions will be 568 Mt CO2-e in 2030. This compares to the minus 28 per cent emissions reduction target of 440 Mt CO2-e in 2030. Energetics considers the difference between the emissions pathway
1 Land use, land use change and forestry
2 This figure excluded the years 2013 and 2014 when the carbon tax was in operation.
v © Energetics Pty Ltd 2023

Modelling and analysis of Australia’s abatement opportunities
and trajectory to the 2030 target can be achieved from the total 960 Mt CO2-e cumulative abatement potential identified.
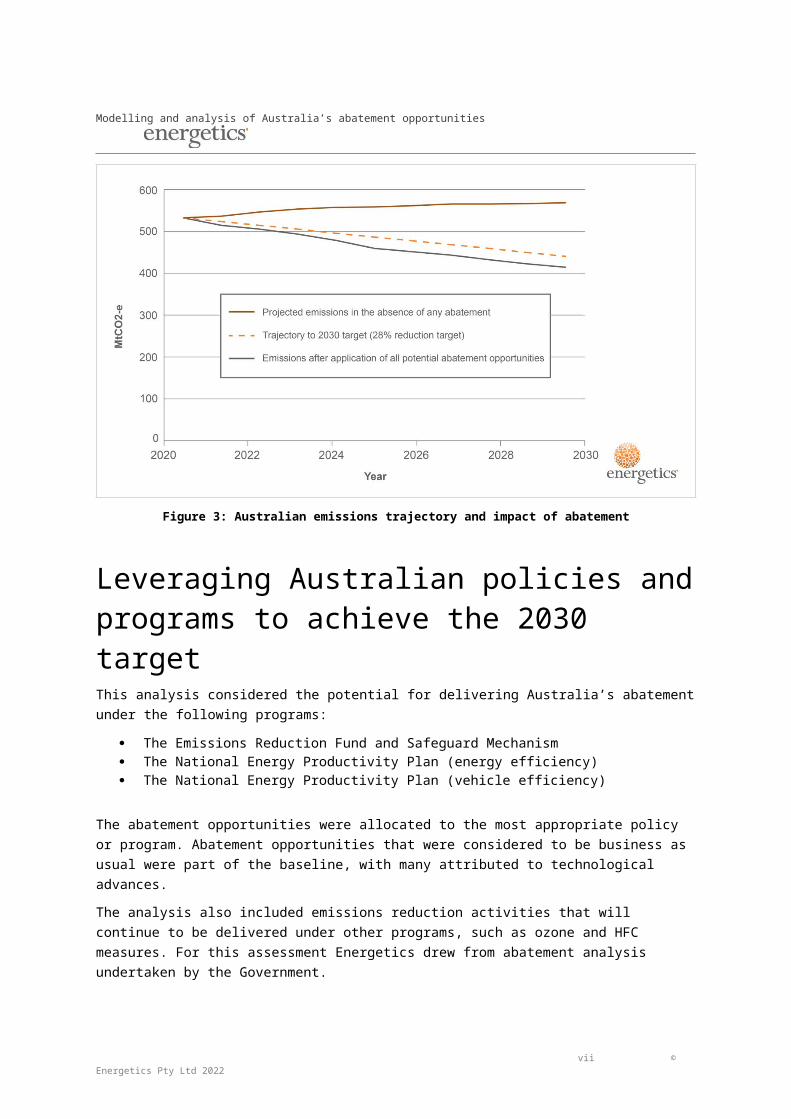
Starting from an emissions level of 532 Mt CO2-e in 2020, the figure below demonstrates how the abatement potential identified compares to Australia’s 2030 emissions reduction target as well as against Australia’s projected emissions in the absence of any abatement.
Figure 3: Australian emissions trajectory and impact of abatement
Leveraging Australian policies and programs to achieve the 2030 targetThis analysis considered the potential for delivering Australia’s abatement under the following programs:
The Emissions Reduction Fund and Safeguard Mechanism The National Energy Productivity Plan (energy efficiency) The National Energy Productivity Plan (vehicle efficiency)
The abatement opportunities were allocated to the most appropriate policy or program. Abatement opportunities that were considered to be business as usual were part of the baseline, with many attributed to technological advances.
The analysis also included emissions reduction activities that will continue to be delivered under other programs, such as ozone and HFC measures. For this assessment Energetics drew from abatement analysis undertaken by the Government.
Energetics also considered the impact of non-government movements that are capable of driving emissions reductions. For example, we see the impact of growing market and consumer pressure that influences business to reduce their carbon intensity.
vi © Energetics Pty Ltd 2023
Modelling and analysis of Australia’s abatement opportunities
Finally, where abatement opportunities achieved emissions abatement though improvements in energy productivity, they were generally allocated to the National Energy Productivity Plan (NEPP).
The contribution of potential abatement to meet the cumulative abatement potential is shown in Figure4. Technology improvements play a key role as does the Emissions Reduction Fund (ERF) and Safeguard Mechanism.
Figure 4: Cumulative abatement potential by 2030
Figure 4 above highlights the total domestic abatement opportunity identified by Energetics as can be delivered under existing policies or programs. This provides flexibility in the measures adopted, as well as room for future growth in Australia’s INDC.
Australia has world class policies and frameworks in place for calculating abatement from individual measures and for creating and managing Australian Carbon Credit Units (ACCUs). Supported by these robust frameworks, Energetics assumes that the ERF and Safeguard Mechanism are capable of generating the necessary cumulative abatement over the 2021 to 2030 period.
In addition, the NEPP is in the process of being formalised, and is expected to further drive a share of emissions reductions. Continued advances in technology and other, emerging market transformations to reduce greenhouse gases will deliver the remainder of Australia’s abatement.
Australia’s abatement cost curveTo assist with the ranking and prioritisation of more than 70 abatement opportunities identified and analysed, Energetics developed an Australian economy wide abatement cost curve. Abatement cost curves provide a useful tool, and visual guide, to demonstrate the total potential abatement for each sector, as well as the cost of the abatement in reducing Australia’s emissions.
The Australian domestic abatement cost curve for 2030 is shown in Figure 5 below – including each of the sectors considered capable of potentially contributing to Australia’s 2021 to 2030 abatement task. For each sector, Energetics considered the cost in projected 2030 AUD to the whole of Australia.
vii © Energetics Pty Ltd 2023

Modelling and analysis of Australia’s abatement opportunities
Based on this approach and due to the high net cost to Australia of imported transport fuels, the sectors that encourage improvements in the efficient use of those fuels have a high net benefit. Electricity savings have a lower net benefit to the Australian society, however many can still be achieved at a negative societal cost.
Figure 5: Australian 2030 abatement cost curve
Two examples of abatement opportunities considered in Energetics analysis are included below Section 5. The two case studies provide examples of the best practice energy management and emissions reduction currently being undertaken by leading Australian industry.
viii © Energetics Pty Ltd 2023

Modelling and analysis of Australia’s abatement opportunities
Table of contentsExecutive summary........................................................................................................................ iii
1. Background – Paris meeting of the Conference of Parties (COP21)....................................1
1.1. Working towards a new global agreement to limit warming to within 2oC...........................1
1.2. Australia’s domestic emissions trajectory...........................................................................1
1.3. Meeting the 2020 emissions reduction commitment..........................................................3
2. Australia’s 2030 emissions reduction task.............................................................................5
2.1. Australia’s abatement requirements to meet the 2030 emissions reduction target............5
2.2. Enabling Government policies and programs....................................................................6
3. Modelling Australia’s abatement potential.............................................................................8
3.1. Overview............................................................................................................................ 8
3.2. The key assumptions.........................................................................................................9
3.3. Constraints and limitations...............................................................................................10
3.4. Describing the abatement opportunities...........................................................................11
3.5. Categorisation of each abatement opportunity.................................................................12
3.6. Allocating measures to enabling policies and programs..................................................14
4. Results – Australia’s abatement potential............................................................................17
4.1. Output 1: Abatement opportunities...................................................................................17
4.2. Output 2: The abatement cost curve................................................................................20
4.3. Output 3: Stacked bar chart.............................................................................................21
5. Opportunity case studies.......................................................................................................23
6. Key insights............................................................................................................................. 27
6.1. Meeting Australia’s abatement requirement.....................................................................27
7. Recommendations.................................................................................................................. 29
Appendix A. Abatement and levelised cost..............................................................................30
Appendix B. Assumptions..........................................................................................................45
Appendix C. Australian 2030 abatement cost curve.................................................................49
About Energetics........................................................................................................................... 50
Contact details............................................................................................................................... 52
ix © Energetics Pty Ltd 2023

Modelling and analysis of Australia’s abatement opportunities
1. Background – Paris meeting of the Conference of Parties (COP21)
1.1. Working towards a new global agreement to limit warming to within 2oC
The Paris Conference of Parties (COP) was the 21st meeting of the United Nations Framework Convention on Climate Change (UNFCCC) member nations to discuss global action on climate change. The UNFCCC is a universal convention acknowledging the existence of human-induced climate change and providing pathways for limiting warming.
Australia is a signatory to the Kyoto Protocol, the current binding international agreement for emissions reduction. The Kyoto Protocol is in its second commitment period (CP2), which ends in 2020. Australia’s emissions reduction commitment during this period is 5 per cent below 2000 levels.
COP21 aimed to create a binding international consensus for post Kyoto emissions reduction. International consensus achieved during the COP21 was the culmination of a near-20 year review process following the original introduction of the Kyoto Protocol in 1997. Over 195 national participants signed the Paris Agreement – committing to a pathway limiting global warming to 2°C with an aspirational target of limiting warming to 1.5°C above pre-industrial levels.
Australia’s Intended Nationally Determined Contribution
Prior to COP21, individual member nations of the UNFCCC submitted Intended Nationally Determined Contributions (INDCs) that established national emissions reduction targets for the post 2020 period. In August 2015, Australia announced an INDC of 26-28 per cent below 2005 levels by 2030. These were formalised into INDCs within the Paris Agreement during the Paris COP.
1.2. Australia’s domestic emissions trajectoryThe development of the abatement task for the 2021-2030 period began with the estimation of the emissions baseline, which shows the greenhouse gas emissions that can be expected in the period to 2030 in the event that there were no abatement measures in place over that period.
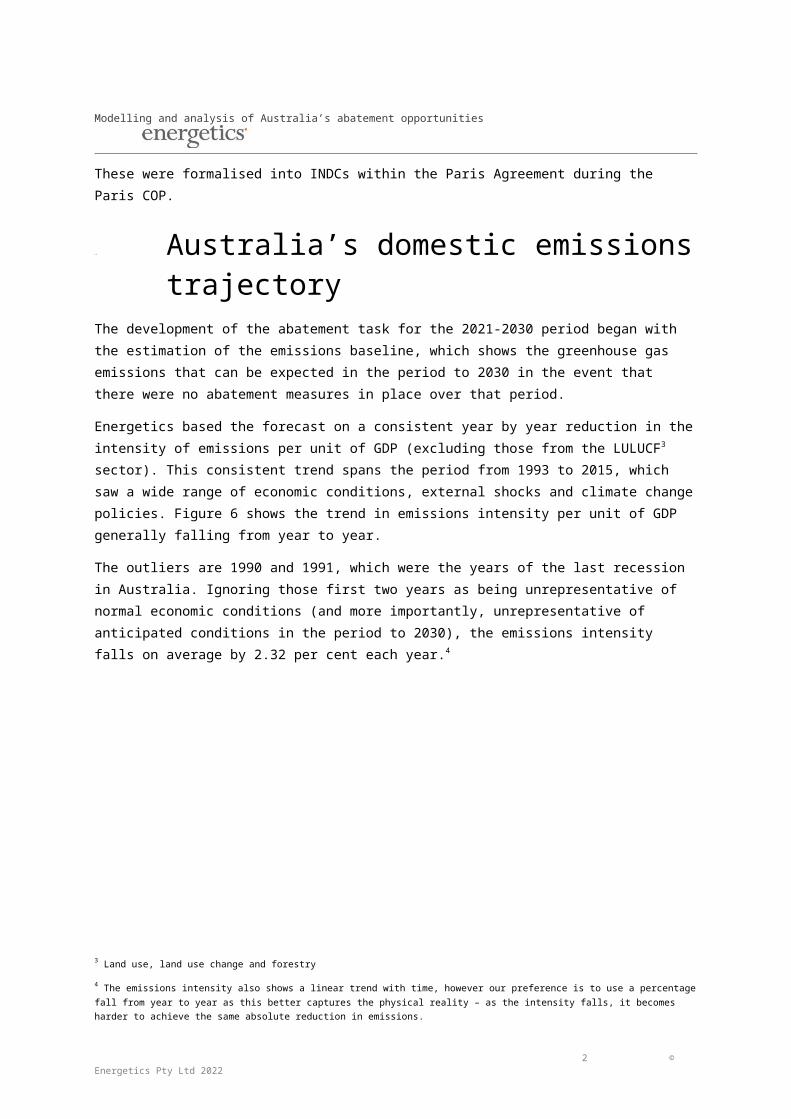
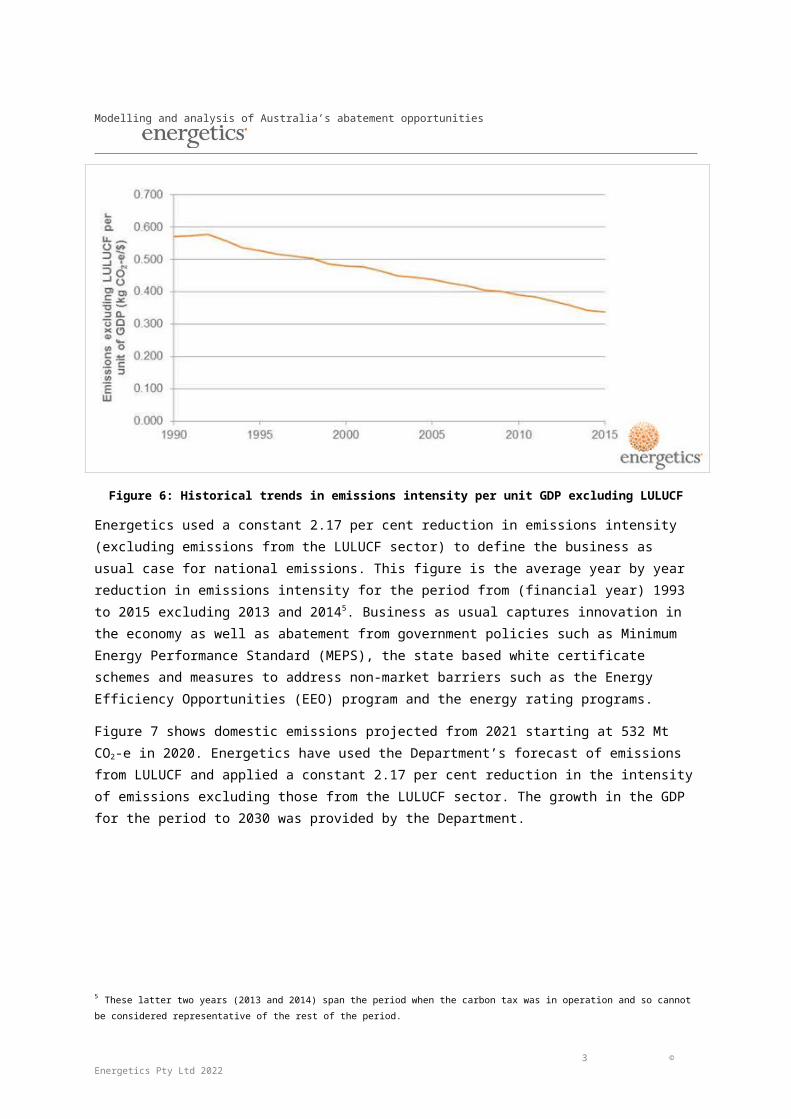
Energetics based the forecast on a consistent year by year reduction in the intensity of emissions per unit of GDP (excluding those from the LULUCF3 sector). This consistent trend spans the period from 1993 to 2015, which saw a wide range of economic conditions, external shocks and climate change policies. Figure 6 shows the trend in emissions intensity per unit of GDP generally falling from year to year.
The outliers are 1990 and 1991, which were the years of the last recession in Australia. Ignoring those first two years as being unrepresentative of normal economic conditions (and more importantly,
3 Land use, land use change and forestry
1 © Energetics Pty Ltd 2023
Modelling and analysis of Australia’s abatement opportunities
unrepresentative of anticipated conditions in the period to 2030), the emissions intensity falls on average by 2.32 per cent each year.4
Figure 6: Historical trends in emissions intensity per unit GDP excluding LULUCF
Energetics used a constant 2.17 per cent reduction in emissions intensity (excluding emissions from the LULUCF sector) to define the business as usual case for national emissions. This figure is the average year by year reduction in emissions intensity for the period from (financial year) 1993 to 2015 excluding 2013 and 20145. Business as usual captures innovation in the economy as well as abatement from government policies such as Minimum Energy Performance Standard (MEPS), the state based white certificate schemes and measures to address non-market barriers such as the Energy Efficiency Opportunities (EEO) program and the energy rating programs.
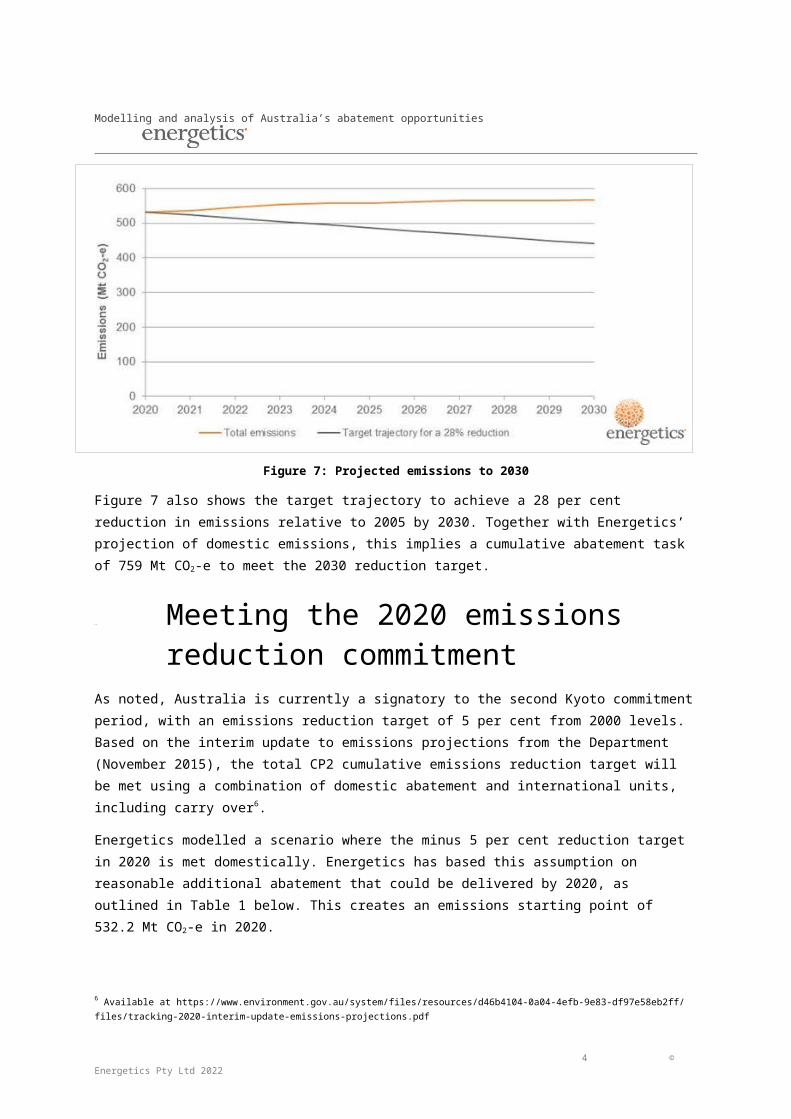
Figure 7 shows domestic emissions projected from 2021 starting at 532 Mt CO2-e in 2020. Energetics have used the Department’s forecast of emissions from LULUCF and applied a constant 2.17 per cent reduction in the intensity of emissions excluding those from the LULUCF sector. The growth in the GDP for the period to 2030 was provided by the Department.
4 The emissions intensity also shows a linear trend with time, however our preference is to use a percentage fall from year to year as this better captures the physical reality – as the intensity falls, it becomes harder to achieve the same absolute reduction in emissions.
5 These latter two years (2013 and 2014) span the period when the carbon tax was in operation and so cannot be considered representative of the rest of the period.
2 © Energetics Pty Ltd 2023

Modelling and analysis of Australia’s abatement opportunities
Figure 7: Projected emissions to 2030
Figure 7 also shows the target trajectory to achieve a 28 per cent reduction in emissions relative to 2005 by 2030. Together with Energetics’ projection of domestic emissions, this implies a cumulative abatement task of 759 Mt CO2-e to meet the 2030 reduction target.
1.3. Meeting the 2020 emissions reduction commitment
As noted, Australia is currently a signatory to the second Kyoto commitment period, with an emissions reduction target of 5 per cent from 2000 levels. Based on the interim update to emissions projections from the Department (November 2015), the total CP2 cumulative emissions reduction target will be met using a combination of domestic abatement and international units, including carry over6.
Energetics modelled a scenario where the minus 5 per cent reduction target in 2020 is met domestically. Energetics has based this assumption on reasonable additional abatement that could be delivered by 2020, as outlined in Table 1 below. This creates an emissions starting point of 532.2 Mt CO2-e in 2020.
6 Available at https://www.environment.gov.au/system/files/resources/d46b4104-0a04-4efb-9e83-df97e58eb2ff/files/tracking-2020-interim-update-emissions-projections.pdf
3 © Energetics Pty Ltd 2023

Modelling and analysis of Australia’s abatement opportunities
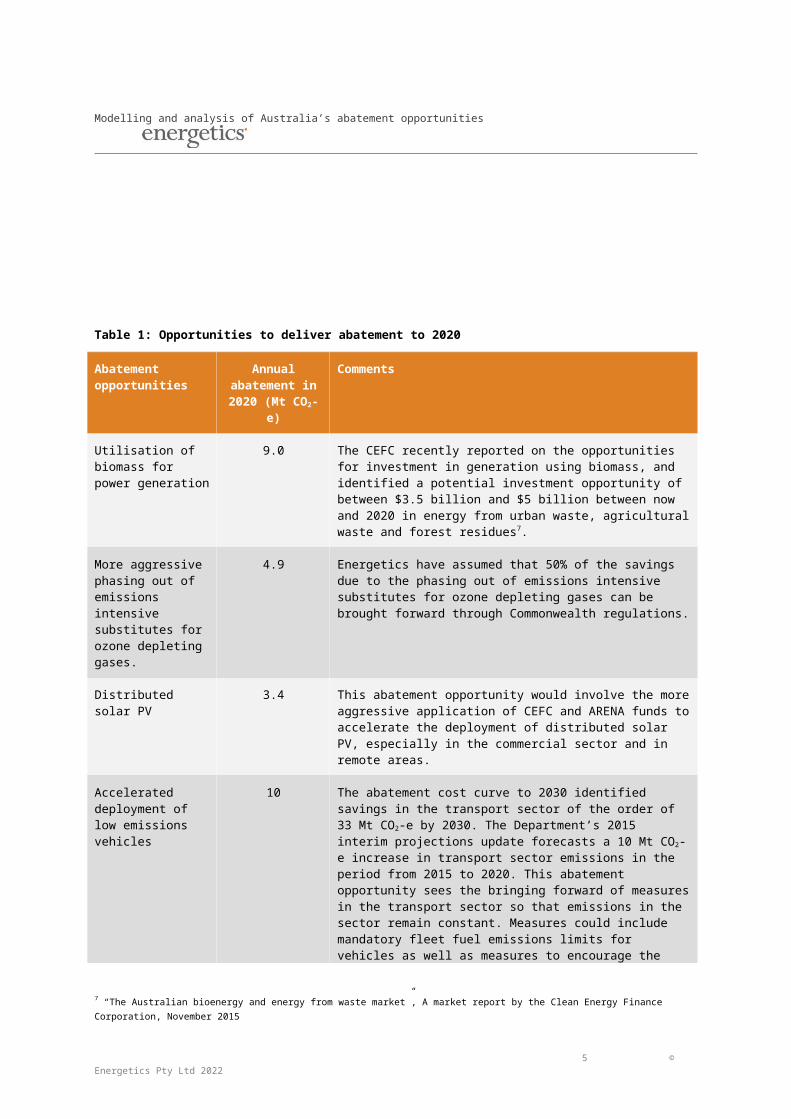
Table 1: Opportunities to deliver abatement to 2020
Abatement opportunities
Annual abatement in
2020 (Mt CO2-e)
Comments
Utilisation of biomass for power generation
9.0 The CEFC recently reported on the opportunities for investment in generation using biomass, and identified a potential investment opportunity of between $3.5 billion and $5 billion between now and 2020 in energy from urban waste, agricultural waste and forest residues7.
More aggressive phasing out of emissions intensive substitutes for ozone depleting gases.
4.9 Energetics have assumed that 50% of the savings due to the phasing out of emissions intensive substitutes for ozone depleting gases can be brought forward through Commonwealth regulations.
Distributed solar PV 3.4 This abatement opportunity would involve the more aggressive application of CEFC and ARENA funds to accelerate the deployment of distributed solar PV, especially in the commercial sector and in remote areas.
Accelerated deployment of low emissions vehicles
10 The abatement cost curve to 2030 identified savings in the transport sector of the order of 33 Mt CO2-e by 2030. The Department’s 2015 interim projections update forecasts a 10 Mt CO2-e increase in transport sector emissions in the period from 2015 to 2020. This abatement opportunity sees the bringing forward of measures in the transport sector so that emissions in the sector remain constant. Measures could include mandatory fleet fuel emissions limits for vehicles as well as measures to encourage the take-up of low emissions vehicles. For instance, the Commonwealth could work with the states to promote the introduction of lower fees, tolls and taxes on low emission vehicles.
Improving residential and commercial equipment efficiency
4.8 This abatement opportunity would involve the raising of the MEPS levels for key residential and commercial equipment and possibly the banning of certain classes of inefficient lights such a halogen downlights.
The Emissions Reduction Fund
21.1 Energetics has assumed, conservatively, that abatement purchased by the ERF in the first two auctions fits within the forecast based on data to 2015. The ERF was assumed to purchase seven years’ of abatement at the average price of the first two auctions. Energetics anticipates that the majority of the abatement delivered through the ERF will be from the land sector.
Other opportunities 13.7 These could include the more rapid introduction of the National Energy Productivity Plan, additional funding for the ERF; restrictions on land clearing; the introduction of additional state based white certificate schemes; marginal increase in the renewable energy; gas offsetting brown coal fired power generation. These measures will need to be driven by either the Commonwealth Government or state governments.
7 “The Australian bioenergy and energy from waste market”, A market report by the Clean Energy Finance Corporation, November 2015
4 © Energetics Pty Ltd 2023
Modelling and analysis of Australia’s abatement opportunities
2. Australia’s 2030 emissions reduction task
2.1. Australia’s abatement requirements to meet the 2030 emissions reduction target
Based on Australia meeting the 2020 emissions reduction target, Energetics have focused on what is needed for Australia to meet the 26-28 per cent 2030 emissions reduction target (referred to in this document as the 2030 target).
All analysis conducted within the scope of this report focuses on how abatement could be delivered within current and proposed Federal Government policies, as well as considering abatement that will be delivered through technological advances and through other programs.
Table 2 outlines the unadjusted 2021-2030 emissions abatement trajectory, total cumulative and 2030 per annum emissions reduction requirements under both the 26 and 28 per cent emissions reduction targets.
Table 2: Australia's 2030 emissions abatement requirement8
Cumulative emissions – 2021-2030 (Mt CO2-e)
2030 p.a emissions (Mt CO2-e)
Unadjusted 2030 emissions trajectory 5,575 568
26 per cent emissions reduction requirement 691 115
28 per cent emissions reduction requirement 759 127
Following the initial release of Australia’s INDC, the Department developed indicative estimates of abatement from possible policy options, referred to as the ‘abatement stacked chart’. The Department required modelling and analysis of abatement opportunities to augment its understanding of the types and scale of abatement opportunities included in Figure 8.
8 Based on the Department of the Environment, "Tracking to 2020 - an interim update of Australia's greenhouse gas projections", December 2015 projections.
5 © Energetics Pty Ltd 2023
Modelling and analysis of Australia’s abatement opportunities
Figure 8: Department of the Environment indicative stacked bar chart9
As shown in Figure 8, Australia’s cumulative emissions reduction requirement between 2021 and 2030 was previously estimated at around 900 Mt CO2-e. Energetics’ modelling projects that – from a starting point of 532 Mt CO2-e in 2020, and an assumption that emissions intensity will continue to decline in relation to GDP growth – the actual cumulative abatement required for this period will be lower.
2.2. Enabling Government policies and programs
There are a number of Federal Government policies and programs that will operate to enable Australia to meet a 26-28 per cent reduction target. Energetics’ analysis has predominantly focused on key Government programs and policies that are in existence or that have been foreshadowed. Specifically included within the analysis are:
The Emissions Reduction Fund (ERF) and the Safeguard Mechanism
The National Energy Productivity Plan (energy efficiency)
The National Energy Productivity Plan (vehicle efficiency).
Abatement opportunities that are not covered by one of the above Government programs were allocated to one of the following categories:
9 https://www.environment.gov.au/system/files/resources/f52d7587-8103-49a3-aeb6-651885fa6095/files/summary-australias-2030-emissions-reduction-target.pdf accessed November 2015.
6 © Energetics Pty Ltd 2023
Modelling and analysis of Australia’s abatement opportunities
Technological advances – which effectively incorporates projected adoption of low emission technologies and innovation as well as shifting market forces out to 2030, and alternative regulatory and non-government drivers which also result in the creation of abatement.10
Other programs – which includes the Ozone Protection and Synthetic Greenhouse Gas Management Programme
Further information on how abatement opportunities were allocated to each of the above categories is included in Section 3.6.
Expansion of the Renewable Energy Target (RET) was not considered in the analysis, however the RET has influenced both the anticipated emissions baseline, as well as the anticipated grid emissions factor out to 2030.
10 An example of this additional abatement would be abatement arising from reductions in energy use in the built environment that was driven by changes to state government planning laws.
7 © Energetics Pty Ltd 2023
Modelling and analysis of Australia’s abatement opportunities
3. Modelling Australia’s abatement potential
3.1. OverviewFollowing the announcement of Australia’s INDC, Energetics was engaged by the Department to review the types of measures that are likely to deliver the abatement necessary for Australia to achieve the 28 per cent emissions reduction target. This work involved the delivery of three key outputs:
1. An assessment of abatement that could be delivered by technology breakthroughs
2. Updated abatement cost curves for Australia for 2030
3. An updated stacked bar chart assigning effective abatement opportunities over the period 2021 to 2030 to achieve the emissions reduction target.
In assessing potential abatement opportunities for Output 1, Energetics considered the following types of measures:
Cumulative 2021-2030 abatement from commercially viable and commonly deployed measures that are currently not included in the Department’s emissions projections
Abatement and potential abatement opportunities from low emission technologies and measures that are currently available but not widely deployed
Low emissions technologies that are not yet commercial but on the horizon.
Energetics did not consider unforeseen technological advances that could occur over the 15 year period between 2015 and 2030. An historical example of unforeseen technological advances is the speed at which lighting technologies were upgraded in recent times. In the early 2000s halogen downlights were seen as the only option for replacing incandescent lamps. As a result, a 15 year abatement projection from the early 2000s would have failed to consider the impact of LEDs in total lighting upgrade abatement.
The abatement opportunities identified in Output 1 formed the basis of both Outputs 2 and 3. Full results for each of the outputs are available in section 4.
Energetics’ approach focuses on the total abatement potential and the associated levelised costs to society.
It is important to note that the work did not involve modelling an ‘abatement scheme’. Neither the abatement cost curve in Output 2, nor the stacked bar of Output 3, considered different Australian Carbon Credit Unit (ACCU) pricing scenarios or the potential market response to the uptake of different measures.
8 © Energetics Pty Ltd 2023

Modelling and analysis of Australia’s abatement opportunities
3.2. The key assumptions Calculation of total abatement potential
The following assumptions were made when calculating both the cumulative abatement potential and the 2030 per annum abatement potential:
All abatement potential was calculated based on projected 2030 annual abatement figures with deemed uptake rates to develop the cumulative abatement over the 2021 – 2030 period. Energetics focused on abatement opportunities most likely to generate meaningful abatement within this period.
Uptake rates were assumed for each abatement opportunity based on the varying technology maturity and applied using a linear or sigmoidal approach, based on Energetics’ expert judgement. The different uptake rate types are as included in Appendix B.
Unless otherwise specified, abatement driven by Federal Government policies as outlined in section 2.2 is considered to commence from 2021.
Abatement was estimated using a bottom-up approach for all sources. The exceptions were emissions from Land Use, Land Use Change and Forestry (LULUCF), waste management and fugitive emissions.
Abatement from direct combustion, electricity and transport were based on potential fuel savings, and assumed total uptake across the relevant sectors based on Energetics sectoral knowledge and estimates. All assumptions made were conservative.
Sectoral and end-use energy data was sourced from the Office of the Chief Economist, and projected out to 2030 using the sectoral annual increases in energy consumption estimates (total percentage increase).
The estimates for abatement associated with LULUCF were derived from work reported by ClimateWorks in 201011, which in turn was built on work undertaken by CSIRO. Energetics reviewed the ClimateWorks estimates against the most recent Queensland “Estimates of Queensland’s greenhouse gas emissions from land use, land use change and forestry 2015-2030”12 report.
Abatement opportunities in the waste and fugitives sectors were estimated using a top down approach based on potential emissions reduction opportunities in 2030 for the relevant Australian Greenhouse Emissions Information System (AGEIS) emissions sub-sectors.
Calculation of levelised cost of abatement
The following assumptions were made in calculating levelised costs:
11 Estimates of Queensland’s greenhouse gas emissions from land use, land use change and forestry 2015-2030 – produced for the Inter-departmental Committee on Climate Change - As provided to Energetics by the Department of Environment on 2 November 2015
12 Ibid
9 © Energetics Pty Ltd 2023

Modelling and analysis of Australia’s abatement opportunities
Energetics calculated the total levelised cost of abatement using a total societal resource cost approach. The levelised cost from the perspective of investors was not considered.
Where information was readily available, Energetics undertook a bottom up analysis of total implementation costs (capital, installation and operational costs) for each abatement opportunity.
Where bottom up modelling was not possible, Energetics undertook a literature review to identify likely levelised costs of abatement from the best available information. These figures were peer reviewed internally and externally.
Fuel savings associated with an abatement opportunity were calculated based on Energetics estimate of the fuel costs to society in 2030.
The implementation cost for abatement opportunities was taken to be the net cost to Australia of the capital and labour required to implement the abatement. This was modelled through the use of a factor that captured the fraction of the implementation cost to investors that is circulated back into the Australian economy. Energetics did not use a general equilibrium model to assess the economic impact of abatement opportunities.
Appendix A contains:
The outcomes of the assessment, including total cumulative abatement 2021-2030 and 2030 per annum for each abatement opportunity
The levelised cost of abatement in 2030 for each abatement opportunity.
The full set of assumptions for each measure can be found in Appendix B.
3.3. Constraints and limitationsThere were a number of constraints and limitations associated with the scope of work. These constraints are outlined below:
Broad consultation was not possible within the timeframe. Instead, where further information was required on abatement opportunities, Energetics consulted directly with a number of individual stakeholders including Telstra, GPT and the Low Carbon Living CRC.
For completeness, the levelised costs of potential abatement associated with power generation decarbonisation have been included in the abatement cost curve. However these have not been included in the stacked bar analysis as there is no post-2020 supporting government policy.
As highlighted above, in some instances commercial information was not available to develop bottom up implementation costs. Levelised costs of potential abatement were obtained from reputable sources and subject to both internal and external peer review processes.
10 © Energetics Pty Ltd 2023

Modelling and analysis of Australia’s abatement opportunities
The analysis did not make any assumptions regarding unforeseen13 technological advances that could occur over the 15 year period between 2015 and 2030. However, such advances will contribute additional abatement opportunities during this time.
The analysis did not undertake detailed policy modelling. Energetics considered only abatement opportunities that were feasibly able to be delivered within the 2021-2030 timeframe, and allocated each opportunity to the most appropriate policy or program. No modelling was undertaken of the appropriate policy mechanisms the Government could introduce to ensure these abatement opportunities are delivered under the relevant policy or program.
3.4. Describing the abatement opportunitiesEnergetics’ approach to developing a comprehensive list of abatement opportunities was to focus on those that met the following criteria:
They could feasibly generate meaningful abatement by 2030.
Delivery is possible under one of the above mentioned Federal Government programs, an alternative program, or in extrapolated business as usual circumstances.
The identified abatement opportunities were unlikely to face any economic or technological barriers to uptake prior to 2030.
Abatement opportunities explored fell under three categories:
Extrapolated abatement from commercially viable and commonly deployed opportunities.
Abatement and potential abatement from low emission technologies and activities that are currently available but not widely deployed.
Low emissions technologies that are not yet commercial but on the horizon (for example, electric vehicles).
As previously noted, Energetics did not make any assumptions as to the impact of unforeseen technological advances. This fourth category has the potential to deliver significant additional abatement to Australia’s cumulative target.
In total over 90 abatement opportunities were identified and refined to a final list of 76 abatement opportunities14.
Each of the abatement opportunities were allocated to one of 12 groups. Classifying potential abatement into groups enabled alignment with existing government programs, and served to highlight where additional policy support is needed over the 2021-2030 period.
1. Built environment and integrated low carbon buildings
2. Low carbon precincts and smart urban design
13 By “unforeseen” we are referring to technology advances that are beyond greenfield; with no peer reviewed supporting material indicating that they will deliver abatement by 2030.
14 Additional electricity decarbonisation measures were included within the abatement cost curve for completeness but did not factor into the total stacked bar abatement potential as they would require an expansion of the RET to be realised.
11 © Energetics Pty Ltd 2023

Modelling and analysis of Australia’s abatement opportunities
3. Digital infrastructure displacing transport fuel use
4. Intelligent industrial and building management systems
5. High performance, low carbon energy generation and distribution
6. Advanced industrial energy efficient equipment and process improvement (including agriculture)
7. Advanced commercial energy efficient equipment
8. Low carbon transport
9. Improved land management and low emissions farming practices
10. Fugitive emissions management
11. Waste management
12. Management of substitutes for ozone destroying substances (HFCs)
These groups were considered to provide an exhaustive coverage of all major areas of both established and emerging abatement opportunities in 2030.
Low carbon precincts (group 2) and digital infrastructure displacing transport fuel use (group 3) are likely to require additional support beyond that considered. These groups are forecast to deliver the lowest quantity of abatement on a per annum basis in 2030, but are likely to contribute a significant portion to the total abatement potential in the period from 2030 to 2050. An example of a measure that is likely to generate significant abatement in the period after 2030 is the roll out of personal autonomous vehicles. While Energetics’ analysis did not forecast any significant role for personal autonomous vehicles in the period to 2030, the analysis shows that the widespread deployment of plugin electric vehicles is likely to provide some abatement by 2030.
3.5. Categorisation of each abatement opportunity
Each abatement opportunity was subjected to a further categorisation. Specifically for each potential abatement opportunity, Energetics considered:
Sources of emissions that were abated
The type of abatement as detailed below
The enabling policy or program (based on the policies and programs outlined in section 2.2).
Sources of emissions abated
Each measure was allocated to a source of abatement, aligning with the Department’s definition15.
15 https://www.environment.gov.au/system/files/resources/51b72a94-7c7a-48c4-887a-02c7b7d2bd4c/files/abatement-task-summary-report_1.pdf accessed November 2015
12 © Energetics Pty Ltd 2023

Modelling and analysis of Australia’s abatement opportunities
Table 3: Breakdown by sources abated
Sources abated Source description
Electricity Emissions from the electricity sector are largely driven by changes in demand and emissions intensity. Electricity abatement measures considered were related to reducing electricity consumption or offsetting electricity to the grid through increased renewable distribution.
Direct combustion Direct combustion emissions occur when fuels are combusted for stationary energy purposes to generate heat, steam or pressure (excluding electricity generation). Direct combustion of fuels occurs across most sectors in the economy including mining, manufacturing, and construction, as well as domestically through heating and cooking. Energetics assessment of direct combustion measures related predominantly to mining and industrial measures, considering process changes within operations and the supply chain, and technological advances. Measures related to residential consumption of gas for heating and cooking were considered to be largely immaterial. The Department’s projections include emissions from mine and agricultural vehicles as direct combustion.
Transport The transport sector covers emissions from the direct combustion (or end-use emissions) of fuels by road, rail, domestic aviation and domestic shipping. Within this sector, Energetics focused on abatement opportunities based on both technological advances and operational change.
Fugitives The fugitives sector covers emissions associated with the production, processing, transport, storage, transmission and distribution of fossil fuels such as coal, oil and natural gas. Fugitive emissions assumptions were focused on technological advances in fugitive emissions management.
Industrial processes and product use
The industrial processes sector encompasses emissions generated from a range of production processes. This sector covers non-energy emissions arising from metal production, the chemical industry, mineral products, consumption of halo-fluoro-carbons and sulphur hexafluoride, and food and drink production.
Examples include nitrous oxide emissions during the manufacture of ammonium nitrate, carbon dioxide emissions from the decomposition of calcium carbonate during clinker production and carbon dioxide emissions from the reduction of metal oxides such as alumina and iron oxide.
Agriculture The agriculture sector includes emissions from enteric fermentation, manure management, rice cultivation, agricultural soils, prescribed burning of savanna and field burning of agricultural residues.
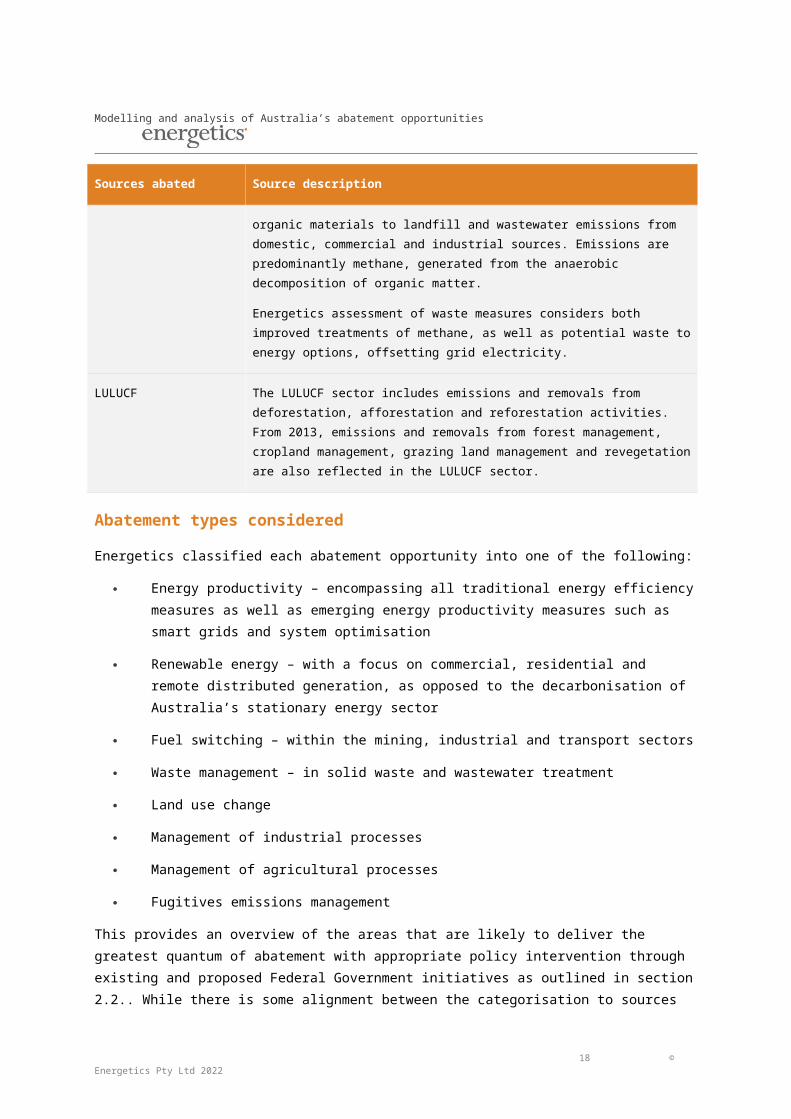
Waste The waste sector covers emissions from the disposal of organic materials to landfill and wastewater emissions from domestic, commercial and industrial sources. Emissions are predominantly methane, generated from the anaerobic decomposition of organic matter.
Energetics assessment of waste measures considers both improved treatments of
13 © Energetics Pty Ltd 2023

Modelling and analysis of Australia’s abatement opportunities
Sources abated Source description
methane, as well as potential waste to energy options, offsetting grid electricity.
LULUCF The LULUCF sector includes emissions and removals from deforestation, afforestation and reforestation activities. From 2013, emissions and removals from forest management, cropland management, grazing land management and revegetation are also reflected in the LULUCF sector.
Abatement types considered
Energetics classified each abatement opportunity into one of the following:
Energy productivity – encompassing all traditional energy efficiency measures as well as emerging energy productivity measures such as smart grids and system optimisation
Renewable energy – with a focus on commercial, residential and remote distributed generation, as opposed to the decarbonisation of Australia’s stationary energy sector
Fuel switching – within the mining, industrial and transport sectors
Waste management – in solid waste and wastewater treatment
Land use change
Management of industrial processes
Management of agricultural processes
Fugitives emissions management
This provides an overview of the areas that are likely to deliver the greatest quantum of abatement with appropriate policy intervention through existing and proposed Federal Government initiatives as outlined in section 2.2. While there is some alignment between the categorisation to sources abated and to abatement type, the abatement types provide additional granularity on the sorts of measures that can deliver abatement within the electricity, direct combustion and transport source categories.
3.6. Allocating measures to enabling policies and programs
Finally, each abatement opportunity considered was allocated to an enabling policy or program based on the following approach.
Technological advances and other sources of abatement
Commercial uptake of low emission technologies and abatement opportunities were incorporated into the projections based on Energetics’ experience and insights to business behaviour. Commercial adoption of these abatements are classified as “technological advances” within the final stacked bar.
14 © Energetics Pty Ltd 2023

Modelling and analysis of Australia’s abatement opportunities
Examples of technological advances, operational changes and process changes that are considered business as usual are provided below:
Technological advances – the upgrading of lighting to LEDs in the commercial building sector. Driven by significant energy cost savings, LED affordability and phase out of existing T8 fittings.
Operational changes – best practice energy data management with automated response systems in commercial buildings. This practice effectively results in avoiding excess electricity use through real-time alerts. Operationally, it delivers significant energy savings for a very low return on investment. Real time energy data management is currently undertaken by best practice property portfolios, such as GPT. Energetics expects that increased market competition together with the energy savings potential, will drive this practice across all premium, Class A and Class B property managers by 2030.
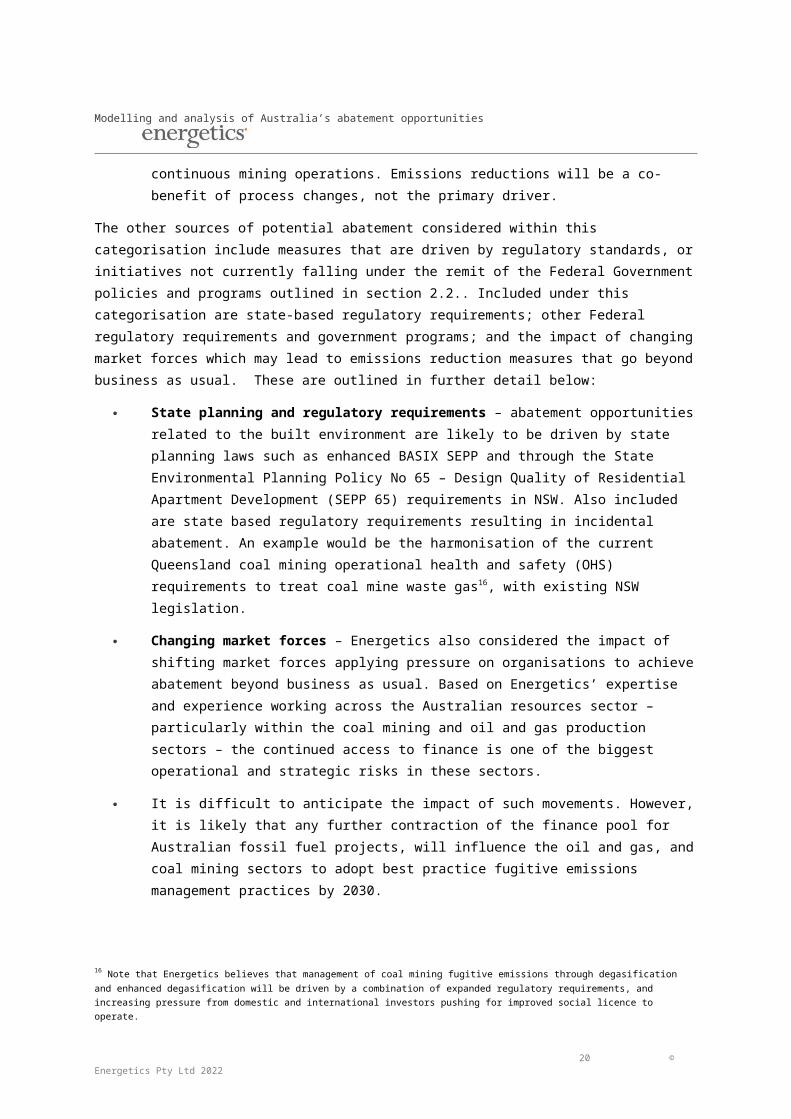
Process changes – autonomous mining results in significant emissions abatement through the controlled and optimised operation of mining equipment and plant. Energetics expects mines of the future to be autonomous, yet the business decision to develop autonomous mines will be underpinned by enhanced productivity, lower labour costs and continuous mining operations. Emissions reductions will be a co-benefit of process changes, not the primary driver.
The other sources of potential abatement considered within this categorisation include measures that are driven by regulatory standards, or initiatives not currently falling under the remit of the Federal Government policies and programs outlined in section 2.2. Included under this categorisation are state-based regulatory requirements; other Federal regulatory requirements and government programs; and the impact of changing market forces which may lead to emissions reduction measures that go beyond business as usual. These are outlined in further detail below:
State planning and regulatory requirements – abatement opportunities related to the built environment are likely to be driven by state planning laws such as enhanced BASIX SEPP and through the State Environmental Planning Policy No 65 – Design Quality of Residential Apartment Development (SEPP 65) requirements in NSW. Also included are state based regulatory requirements resulting in incidental abatement. An example would be the harmonisation of the current Queensland coal mining operational health and safety (OHS) requirements to treat coal mine waste gas16, with existing NSW legislation.
Changing market forces – Energetics also considered the impact of shifting market forces applying pressure on organisations to achieve abatement beyond business as usual. Based on Energetics’ expertise and experience working across the Australian resources sector – particularly within the coal mining and oil and gas production sectors – the continued access to finance is one of the biggest operational and strategic risks in these sectors.
It is difficult to anticipate the impact of such movements. However, it is likely that any further contraction of the finance pool for Australian fossil fuel projects, will influence the oil and gas, and coal mining sectors to adopt best practice fugitive emissions management practices by 2030.
16 Note that Energetics believes that management of coal mining fugitive emissions through degasification and enhanced degasification will be driven by a combination of expanded regulatory requirements, and increasing pressure from domestic and international investors pushing for improved social licence to operate.
15 © Energetics Pty Ltd 2023

Modelling and analysis of Australia’s abatement opportunities
Phase out of substitutes of ozone depleting substances
This categorisation is in line with the Department’s previously released stacked bar chart and captures abatement to be delivered under the Ozone Protection and Synthetic Greenhouse Gas Management Programme. This Programme seeks to reduce emissions arising from Ozone Depleting Substances (ODS) and Synthetic Greenhouse Gases (SGGs).
National Energy Productivity Plan
Energy and vehicle efficiency improvements that are likely to have a negative cost to society (and in many cases, a negative cost to participants) were placed in the National Energy Productivity Plan. Energetics assumed that programs will be required to address non-financial barriers through non-financial means.
Negative cost abatement opportunities relating to vehicle efficiency, better management of data in passenger transport and fuel efficiency standards were allocated to National Energy Productivity Plan as vehicle efficiency measures. Remaining abatement opportunities were captured under the broader National Energy Productivity Plan.
The ERF and the Safeguard Mechanism
The remaining abatement opportunities were allocated to the ERF and Safeguard Mechanism. The total abatement delivered under the ERF will vary depending on the future ACCU price. ACCU prices will be influenced by a number of factors, including:
The total implementation costs to the end-user for positive cost abatement on a $/tCO2e basis (noting that the ACCU will only need to cover the marginal cost to make the project return on investment attractive).
The existence and prominence of a secondary ACCU market resulting from the Safeguard Mechanism.
Energetics assumed that the Safeguard Mechanism will deliver the remainder of the abatement not purchased under the ERF. Energetics expects that there will be a significant intersection between the two programs in the post-2020 period. ERF projects could help to reduce emissions at safeguard facilities; and safeguard facilities can purchase ACCUs to offset their emissions and help them to meet their safeguard obligations.
16 © Energetics Pty Ltd 2023

Modelling and analysis of Australia’s abatement opportunities
4. Results – Australia’s abatement potential
The following section provides an overview of Energetics’ findings in respect of Australia’s total abatement potential for each of the three outputs.
4.1. Output 1: Abatement opportunitiesEnergetics identified the order of 962 Mt CO2-e of potential abatement in the period from 2021 to 203017 that could be applied to the task of meeting the 2030 reduction target. This is beyond the total abatement required to meet the 28 per cent emissions reduction target in 203018. Achieving the appropriate levels of abatement from within this pool of abatement options will be dependent on implementing the appropriate policy responses.
Figure 9 below demonstrates how the identified potential abatement compares with Energetics’ emissions projections, and the trajectory required to meet the 28 per cent reduction target.
Figure 9: Impact of the potential abatement opportunities
Additional abatement opportunities not currently modelled could come from areas such as decarbonisation of Australia’s electricity generation sector. All figures included below demonstrate total
17 A further 1125 Mt CO2-e of emissions reduction spanning the period from 2015 to 2030 was identified during the work. This abatement was considered to be part of the baseline, and so was not included in the analysis of measures to meet the 2030 abatement task. We also excluded the abatement potential from coal to gas shift (new build) and onshore wind which were included in the abatement cost curve but were considered to be infeasible to meeting the abatement challenge within the scope of current government policies.
18 From the assumed 532.2 Mt CO2-e in 2020 start point
17 © Energetics Pty Ltd 2023

Modelling and analysis of Australia’s abatement opportunities
possible abatement to illustrate the total abatement potential of sectors, as opposed to contribution required to achieve Australia’s emissions reduction targets.
Abatement by grouping
Energetics’ analysis has found that ‘improved land management and low emissions farming practices’ and ‘low carbon transport’ are capable of contributing the most to Australia’s total low-cost abatement by 2030. In total the two groups account for just over 50 per cent of Australia’s total identified abatement potential. A full list of the abatement opportunities included within each group is included in Appendix A.
Figure 10 below shows the breakdown of Australia’s abatement by group.
Figure 10: Cumulative abatement potential by grouping
Abatement by source
When considering abatement by source abated, the LULUCF sector is anticipated to deliver the most significant level of abatement. As demonstrated in Figure 11, the electricity sector will also potentially deliver significant abatement, followed by Transport, Fugitives and Direct Combustion.
18 © Energetics Pty Ltd 2023

Modelling and analysis of Australia’s abatement opportunities
Figure 11: Cumulative abatement potential by source
Abatement opportunities by abatement type
When considering total abatement potential by abatement type, energy productivity has the potential to deliver a significant portion of Australia’s annual emissions abatement in 2030 and cumulative 2021 to 2030 abatement needs. Of the identified abatement opportunities, energy productivity accounts for 44 per cent. As with the above, land use change follow closely behind with 37 per cent of the total identified abatement. Figure 12 below demonstrates the total abatement by abatement type.
Figure 12: Abatement opportunities by abatement type
19 © Energetics Pty Ltd 2023

Modelling and analysis of Australia’s abatement opportunities
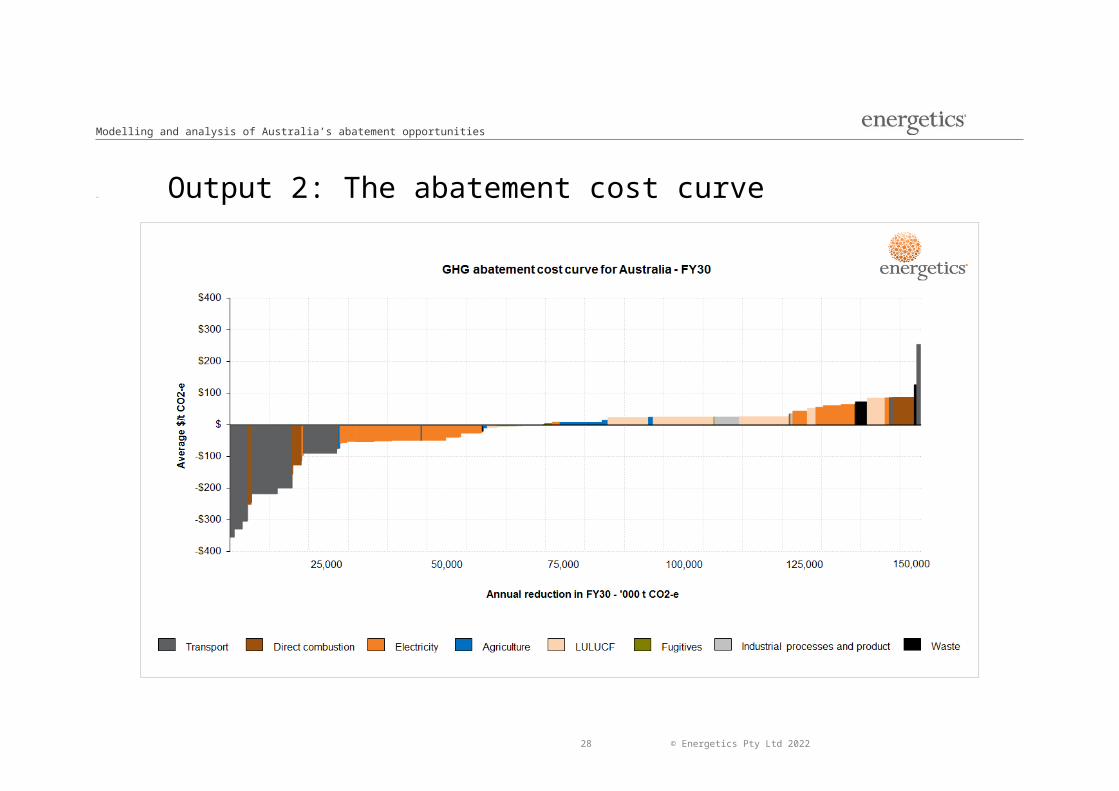
4.2. Output 2: The abatement cost curve
20 © Energetics Pty Ltd 2023
Modelling and analysis of Australia’s abatement opportunities
Figure 13: Australian 2030 abatement cost curve
21 © Energetics Pty Ltd 2023

Modelling and analysis of Australia’s abatement opportunities
Figure 13 above provides Australia’s 2030 per annum abatement cost curve for 2030. The levelised costs of abatement for each abatement type are based on the total societal resource cost. A full overview of each of the abatement opportunities is included in Appendix A; and a larger version of the 2030 abatement cost curve is included for reference in Appendix C. The following provides an overview of the key points associated with the potential abatement cost curve
The levelised costs of abatement in the Energetics abatement cost curve are lower than might otherwise be expected due to the total societal cost of abatement approach taken in calculating opportunity costs.
Transport abatement opportunities present some of the most cost effective within this societal approach based on associated fuel savings. The abatement curve considers the cost from the perspective of the whole of Australia and because the net cost to Australia of imported transport fuels is high, abatement opportunities that encourage improvements in the efficient use of those fuels have a high net benefit.
The cost benefit to Australia of reductions in electricity consumption is less than abatement opportunities within the transport sector, as it is calculated based on the opportunity cost of fuel (coal) burnt to generate electricity. As such, potential electricity savings have a lower net benefit to society.
Most electricity abatement opportunities still present significant potential negative societal cost abatement. Electricity abatement opportunities presenting a positive societal cost in Figure 13 relate to changes within the energy generation mix.
4.3. Output 3: Stacked bar chartFigure 14 shows the impact of enabling policies and programs on the total cumulative abatement task from 2021 to 2030. The approach for allocating abatement opportunities to individual policies and programs is outlined in section 3.6. This figure includes emissions reductions up to Australia’s reduction target as projected by Energetics.
As shown in Figure 14, the ERF and Safeguard Mechanism are expected to deliver just over 50 per cent of the total 960 Mt CO2-e identified abatement potential, in the period from 2021 to 2030. Technology improvements and other programs that deliver abatement as a co-benefit will contribute the order of 22 per cent, with the remaining volume being driven by the National Energy Productivity Plan (energy productivity and vehicle efficiency). The exact scope of the abatement task will depend upon a range of factors including the impact of abatement opportunities funded by the ERF in the second commitment period to 2020.
As noted in section 3.3 above, Energetics did not undertake policy modelling of the options for different mechanisms within each of the current policies and programs to deliver the abatement.
22 © Energetics Pty Ltd 2023
Modelling and analysis of Australia’s abatement opportunities
Figure 14: Cumulative abatement potential by 2030
23 © Energetics Pty Ltd 2023

Modelling and analysis of Australia’s abatement opportunities
5. Opportunity case studies
24 © Energetics Pty Ltd 2023

Modelling and analysis of Australia’s abatement opportunities
Case study 1: Advanced buildings management systems – Australian cities in 2030Of all the focus areas considered within the Paris Agreement, the built environment – and the impact that individual buildings and cities can play in disrupting locked-in energy and greenhouse gas (GHG) emissions patterns – is perhaps the most critical. Globally the commercial building sector alone contributes over 9% of human produced greenhouse gas19. In developing a strategic response to climate change, the design of our cities plays a vital role as ‘new roads, buildings and water systems built today are likely to influence living and consumption patterns for at least the next 50 to 100 years20 . In Australia, the Commercial Buildings sector alone was reported to have contributed over 27 MtCO2-e21 to Australia’s emissions total over the 2014/15 financial year.
Energetics’ modelling demonstrated that there is significant potential for emissions reduction across the built environment, with the role for emissions reduction from cities, infrastructure and building development playing a vital role in helping Australia meet the 26-28% 2030 emissions reduction target. Measures that Energetics considered for reducing the built environment emissions profile include building retrofits and new innovative design measures, as well as the impact of increased distributed commercial solar PV.
A crucial requirement that will drive a number of these measures is the understanding, management and optimisation of energy consumption at a building level. Energetics estimated that between now and 2030 a cumulative abatement potential of over 12 MtCO2-e can arise purely from optimising building performance using data management systems.
The GPT example
GPT Group (GPT) is a leading property group with broad access to capital invested in quality Australian property assets. GPT’s office, shopping centre and logistics properties are used by millions of Australians every week.
At a company level, GPT recognises that greenhouse gas emissions globally are at unsustainable levels and the property sector accounts for a significant proportion arising from energy consumed in developing and managing buildings.
From 2005 to 2014, GPT reduced the average energy intensity of its portfolio from 571 MJ/m2 to 369 MJ/m2.
In GHG emissions terms, this amounts to a reduction22 of over 46kgCO2-e/m2. Around half of this reduction can be attributed to better energy data information and the use of it to manage buildings without the need for investment in new systems or energy efficient appliances. The remaining half of the savings would be attributed to system or appliance upgrades, but it is important to note that energy data management is the critical tool in maintaining and identifying those savings.
Ongoing building energy performance optimisation is achieved through better energy information
19 IPCC AR5, “WGIII - Chapter 9 Buildings”, available at http://www.ipcc.ch/pdf/assessment-report/ar5/wg3/ipcc_wg3_ar5_chapter9.pdf
20 Overseas Development Institute (2015) ‘Climate Finance for Cities’ Working Paper 419’ available at http://www.odi.org/sites/odi.org.uk/files/odi-assets/publications-opinion-files/9660.pdf
21 Based on NGER reported data and Energetics classification of Industry classifications into the Commercial Buildings sector.
22 Calculated using the NEM emissions factor, refer National Greenhouse Accounts Factors – August 2015, table 5(b)
25 © Energetics Pty Ltd 2023

Modelling and analysis of Australia’s abatement opportunities
management and diagnostic systems, augmented by smarter control strategies and a rolling program of lighting and air conditioning system upgrades.
At GPT, it is standard practice to undertake efficiency upgrades alongside any lifecycle or maintenance works, thus leveraging already budgeted expenditure. In cases where there are additional efficiency upgrades or upgrades that are separate to lifecycle works, a target payback period on the additional expenditure is five years or less. Whereas many efficiency gains have also come from improved energy management practices that have required little or no extra investment, which is important in an environment where competition for capital is fierce.
Further to energy reductions, GPT reduces emissions by switching from high carbon energy supplies to low and no carbon energy from on-site and off-site sources. By the end of 2015 the emissions intensity of GPT’s operations reduced to 50% of the 2005 baseline.
Over the ten year journey of GPT’s energy and climate change response, a cumulative total of 0.63 MtCO2-e have been avoided. Compared to baseline energy intensity levels, GPT and its tenants have avoided energy costs of over $76 million. With improvements in energy efficiency in 2015 alone, GPT and its tenants avoided $24.3 million in energy costs
Improving the uptake of data management
A key facet of optimising building energy management systems is the analysis of energy consumption data. Smarter systems turn energy data into information and knowledge that property managers can use to benchmark building performance and identify anomalies. Continuous monitoring of data provides real-time insight to equipment performance, such as office lighting and heating, ventilation and air conditioning (HVAC), ensuring that required efficiency upgrades are identified early and addressed quickly.
The GPT example demonstrates that building managers and property owners can benefit significantly from better understanding of their building energy data. A focus on building comprehensive energy management systems can provide an easily implementable and scalable option for lowering energy consumption, reducing energy spend, and creating jobs across the Australian built environment.
26 © Energetics Pty Ltd 2023

Modelling and analysis of Australia’s abatement opportunities
Case study 2: Lower Emissions Aviation - Advanced transport to 2030An important contribution that could be made towards achieving the 26-28% national emissions reduction target lies in improving the performance of Australia’s aircraft fleet. In assessing domestic emissions from Australia’s civil aviation fleet, Energetics identified over 20 MtCO2-e in cumulative potential abatement from improved aircraft performance. Broadly speaking, improved aircraft performance measures include:
Fleet renewal and modernisation – including widespread adoption of the latest technology in jet engines; this drives a 1.5% efficiency year on year to 2020 and assumed beyond
Improved aircraft performance – including innovative route management and operational effectiveness to reduce fuel consumption.
While emissions from the two sources are traditionally accounted for and managed separately, realising the emissions reduction potential of the Australian aviation sector will require all fleet emissions to be addressed. Taking this responsibility would benefit the international community, as well as lower Australia’s domestic emissions profile.
Qantas partners with market leaders to drive performance improvements
An obvious major player in the Australian civil aviation space is Qantas. For the 2014/15 financial year, Qantas domestic operations reported 4.4 million tonnes23 in Scope 1 CO2-e emissions24. Emissions from flying, which includes the burning of aviation fuel, constitutes the lion’s share of Qantas’ Scope 1 – over 99% of the total emissions.25 To manage this, the Qantas Group has a strong focus on fuel efficiency and carbon emissions reduction is a cornerstone of its AU$2bn transformation strategy. This is supported by a 50% net Scope 1 emissions reduction target currently in place, based on 2005 levels, to be achieved by 205026.
In alignment with the International Air Transport Authority (IATA), Qantas has a vision to achieve carbon neutral growth by 2020.
To meet these targets, Qantas is exploring a number of innovative emissions reduction projects through partnerships with market leading companies and universities.
In 2012 Qantas entered into a four-year partnership with the University of Sydney to develop a flight planning system to allow the airline to fly optimised routes, reduce fuel consumption and improve operational effectiveness. The Qantas Future Flight Planning Project (QFFPP) included the integration of aerodynamics, flight mechanics, large-scale optimisation and machine-learning algorithms to design better flight planning routines and fuel prediction models27.
Following on from the partnership with the University of Sydney, Qantas have also partnered with GE Aviation to reduce emissions through industry leading navigational techniques and technologies. GE Aviation’s Flight
23 Clean Energy Regulator, ‘Greenhouse and energy information 2014-15’
24 Scope 1 emissions relate to emissions arising directly from sources that are controlled by a particular entity. In aviation, this includes the burning of aviation fuel for domestic and international flights.
25 Qantas 2015 CDP Climate Change Response, available at https://www.cdp.net/en-US/Pages/HomePage.aspx
26 Qantas, ‘Our commitment to environmental sustainability’, available at https://www.qantas.com.au/infodetail/about/environment/our-commitment-to-environmental-sustainability.pdf
27 University of Sydney, “New partnership with Qantas will mean smarter flying”, available at http://sydney.edu.au/news/84.html?newsstoryid=10122
27 © Energetics Pty Ltd 2023

Modelling and analysis of Australia’s abatement opportunities
Analytical System is currently leading the market in using a combination of flight data, with operational data, weather data, trajectory correction and the terrain of the flight region28.
The adoption of international industry leading technology has allowed Qantas to gain improved insight into its operations and more easily identify and track efficiency opportunities. Through the partnership, GE is providing access to its Fuel Management product offering, which includes world-class operational efficiency data analytics and process improvement capabilities.
Benefits are already being realised
Qantas is already recognising the benefits of these industry leading measures, such as improvements to advanced navigation techniques, including Required Navigation Performance and User Preferred Routing which continues to be rolled out across the Qantas network. Qantas has increased the utilisation of available procedures which has resulted in total emissions savings of over 13 ktCO2-e29 annually with a less than one year payback; making business sense to reduce emissions.
The partnership with the University of Sydney has also influenced improvements in the technical performance of aircraft. For example, improving engine performance by lowering Exhaust Gas Temperature (EGT) through engine compressor wash activities has led to an annual emissions reduction of 55.6 ktCO2-e30 solely from reduction in aviation fuel use, and once again, with less than one year payback.
How Australia can learn from this?
Civil aviation, as an industry, is projected to continue to grow strongly out to 2030, with 279 million passengers expected to pass through Australian airports in 203031. In the near term, fuel consumption will be dominated by traditional aviation fuel, as the biofuel market evolves – switching to lower emission fuel sources will be constrained by the advances made in the biofuel aviation market. In order to ensure that emissions do not grow comparatively with the projected increase in civil aviation, consistent innovation and improvements in aircraft performance and efficiency will be vital. Tailoring aviation fuel consumption at a flight specific level reduces fuel waste and emissions, while reducing operational costs.
28 Aviation Business, “Qantas takes more services from GE”, available at http://www.aviationbusiness.com.au/news/qantas-takes-more-services-from-ge
29 Qantas 2015 CDP Climate Change Response
30 ibid
31 BITRE, “Air passenger movements through capital and non-capital city airports to 2030–31” https://bitre.gov.au/publications/2012/files/report_133.pdf
28 © Energetics Pty Ltd 2023

Modelling and analysis of Australia’s abatement opportunities
6. Key insights
6.1. Meeting Australia’s abatement requirement
Australia’s 2030 emissions reduction target is significant and while there are abatement options to choose from to ensure the 28 per cent emissions reduction target is met, it will be important to have the appropriate policy levers in place to deliver abatement.
This requires an understanding of both the financial and non-financial barriers currently impacting the uptake of abatement measures.
Understanding the impact of technology change
This analysis has highlighted the impact of abatement opportunities that should become business as usual due to the impact of technology change on the cost effectiveness of abatement opportunities. This is particularly the case for potential abatement related to energy productivity.
The Government may wish to consider potential approaches to align policies to appropriate measures and remove overlap (for instance, the NEPP could deliver energy efficiency measures rather than the ERF). This would include reviewing technology advances that have become business as usual and no-longer require policy intervention.
The National Energy Productivity Plan
Energetics’ analysis has allocated the majority32 of potential abatement with a negative societal cost to the NEPP. This categorisation was based on two key considerations:
The ERF and the Safeguard Mechanism cannot alone deliver all of Australia’s abatement requirements without either significant additional funding, or significant amendment to the current proposed approach to establishing baselines.
Abatement opportunities with a negative societal cost often have non-market barriers preventing uptake that cannot be managed by only providing a financial incentive.
It was outside of the scope of this piece of work to undertake a detailed analysis of the non-market barriers impacting specific abatement opportunities. To ensure that the NEPP is developed in an appropriate manner to deliver the required levels of abatement, Energetics recommends that the Federal Government undertakes a consultation process to understand the non-market barriers associated with each of the abatement opportunities identified.
As the NEPP continues to develop, abatement opportunities considered can be refined to align with the appropriate work streams.
32 With the exception of LULUCF measures
29 © Energetics Pty Ltd 2023

Modelling and analysis of Australia’s abatement opportunities
Providing ERF funding to the appropriate measures
Consistent with the allocation of negative cost abatement to the NEPP, abatement opportunities with a positive societal cost have been allocated to the ERF. Analysis assumes that the ERF will continue to provide an incentive for abatement opportunities that need a financial incentive for uptake. As noted, Energetics believes that there will be a significant intersection between the role of the ERF and the Safeguard Mechanism between 2021 and 2030.
While Energetics has not modelled the projected ACCU price required to ensure uptake of the total required abatement, it is important to note that the future ACCU price range will be influenced by both direct ERF funding provided by the Federal Government and the secondary market price of ACCUs available to project proponents.
Other policy and program options
The scope of the work considering abatement opportunities for inclusion within the stacked bar chart focused solely on abatement that could be implemented under existing Government policies, both state and Federal. However, this is not an exhaustive list and the Federal Government does have alternative options available for generating additional abatement, if this is deemed necessary. Based on the scope of the work undertaken, Energetics did not consider the following measures that may generate significant additional abatement:
An increased Renewable Energy Target (RET)
Mandatory efficiency standards for fossil fuel fired generators
In addition, the Federal Government may be able to drive further abatement within the “Other Programs” wedge. Abatement opportunities such as “Precinct scale designs for new developments”, which will largely be driven by changes to state planning laws, would benefit from Federal Government promotion and support for standardised practices.
30 © Energetics Pty Ltd 2023
Modelling and analysis of Australia’s abatement opportunities
7. RecommendationsFurther development of Government policies to deliver sufficient abatement to meet the 2030 target will rely upon the robust modelling of abatement opportunities.
The above analysis provides a good starting point for the development of these polices. However there are areas of the abatement modelling that could be more robust. The following provides an overview of additional work that could be done to benefit the abatement model and influence any future policy decisions:
Critical review and refinement of the underlying principles of business as usual assumptions, and harmonisation with the Department’s emissions projections. The Department projections may incorporate ongoing reductions in the energy intensity of the economy which effectively captures many of the energy efficiency opportunities. Additional harmonisation may result in the Department’s projections being revised downwards or the removal of some abatement opportunities where overlap exists.
Further refinement of the rate that abatement opportunities are adopted. Uptake rates affect the cumulative abatement as well as the abatement in 2030. Energetics believes that greater consultation with stakeholders will deliver a more robust understanding of potential adoption rates. Understanding assumed uptake rates may also influence when policy levers are introduced to intervene.
Energetics necessarily applied a series of simplifications to deliver the abatement forecasts described in this report which leads to uncertainties in the estimates of abatement. Energetics recommends that the Department reassess the abatement opportunities that have the potential to deliver large volumes of abatement. These can include well understood measures such as reafforestation as well as the emerging measures such as changes to the built environment and zero emissions buildings.
This study largely excluded abatement opportunities that drive the decarbonisation of electricity as there are no existing policies to support this beyond the existing RET. We included the deployment of larger volumes of rooftop solar PV as we believe this to be cost effective to participants. Noting the current surplus of generation capacity in Australia, the importance of electricity decarbonisation as a means of achieving Australia’s abatement cannot be understated. The 2021 – 2030 abatement in this area may be driven by constraints on emissions imposed by the Safeguard Mechanism or any other future financial incentive introduced. This issue may be best addressed by modelling the interaction between abatement opportunities that reduce electricity demand and the national electricity market.
Energetics elected to use the levelised cost from the perspective of society in ranking abatement opportunities. The societal cost indicates whether an abatement opportunity is cost effective for society but not whether it is cost effective for an investor. The latter is needed in order to understand the policy measures needed to drive abatement. Energetics recommends that the study be extended to consider the interaction between the cost to society and the cost to investors.
31 © Energetics Pty Ltd 2023

Modelling and analysis of Australia’s abatement opportunities
32 © Energetics Pty Ltd 2023

Modelling and analysis of Australia’s abatement opportunities
Appendix A. Abatement and levelised cost
Group Abatement opportunities Abatement description Uptake rate
typeSource abated (segment)
Program33 Abatement Type
Levelised cost of
abatement in 2030 ($/t
CO2-e)
Annual abatement in 2030 - AGEIS sectors
(‘000 t CO2-e)
Cumulative abatement
potential by 2030 - AGEIS sectors
(Mt CO2-e)
1. Built environment - Integrated low carbon buildings
Commercial new builds
Improved electricity consumption in commercial new builds due to improved building design (for example passive heating and cooling, better insulation, more efficient base building energy consumption).
Linear 2016 to 2030 Electricity
National Energy Productivity Plan
Energy productivity -49.24 1186 6.6
Commercial retrofits
Improved electricity consumption in commercial full building retrofits due to improved building design (for example passive heating and cooling, better insulation, more efficient base building energy consumption).
Linear 2016 to 2030 Electricity
National Energy Productivity Plan
Energy productivity -49.24 1322 7.4
Solar PV (distributed - residential)
Differential between the projections included in the Department’s baseline, and the AEMO high solar PV projection with allowance made for WA.
Linear 2016 to 2025
Electricity Technology improvements
Renewable energy
-48.74 3084 25.4
Residential new builds
Differential between standard residential design and 8 star
Sigmoid 2021 to 2030
Electricity National Energy
Energy productivity
-49.24 3320 15.2
33 © Energetics Pty Ltd 2023
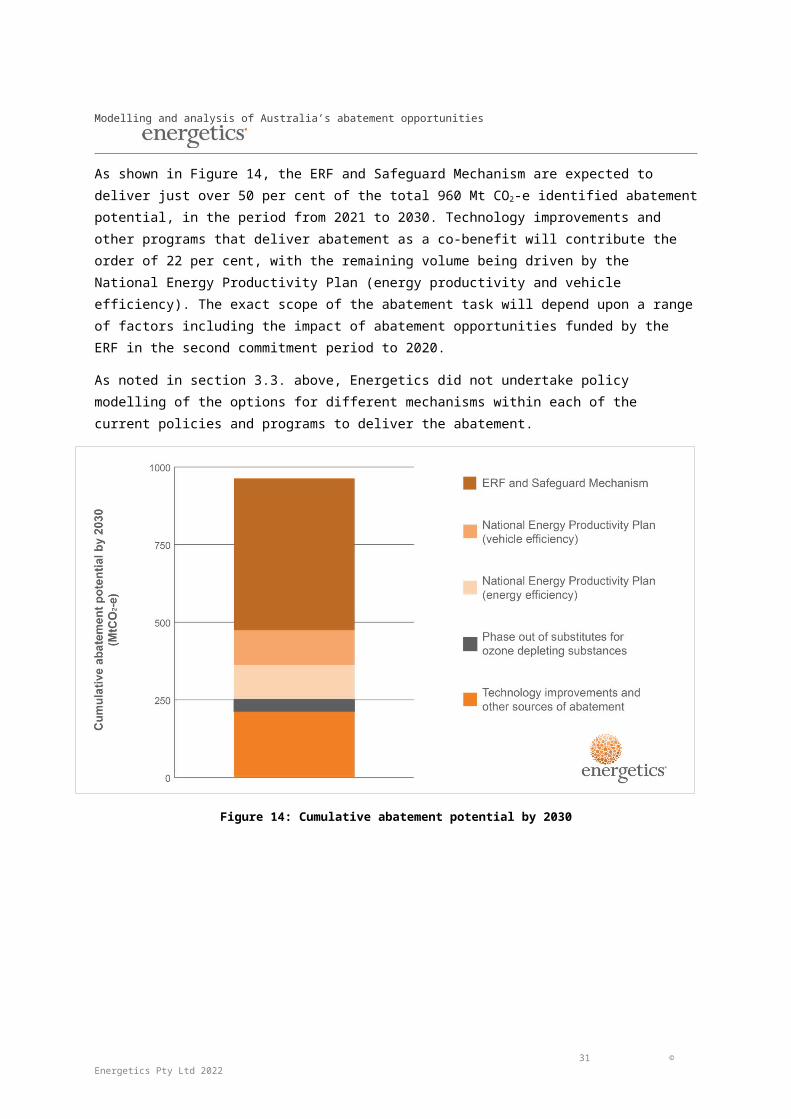
Modelling and analysis of Australia’s abatement opportunities
Group Abatement opportunities Abatement description Uptake rate
typeSource abated (segment)
Program Abatement Type
Levelised cost of
abatement in 2030 ($/t
CO2-e)
Annual abatement in 2030 - AGEIS sectors
(‘000 t CO2-e)
Cumulative abatement
potential by 2030 - AGEIS sectors
(Mt CO2-e)
efficiency residential new builds. Productivity Plan
Solar PV (distributed - commercial)
Differential between the projections included in the Department’s baseline, and the AEMO high solar PV projection with allowance made for WA.
Linear 2016 to 2025 Electricity Technology
improvementsRenewable energy -48.62 1373 11.3
2. Low Carbon Precincts and Smart Urban Design
Integrated urban transport system design
Abatement based on work undertaken by the Low Carbon Living CRC
Linear 2016 to 2030 Transport Technology
improvementsEnergy productivity -328.84 1846 10.2
Precinct scale designs for new developments
Abatement based on work undertaken by the Low Carbon Living CRC
Linear 2016 to 2030 Electricity Technology
improvementsEnergy productivity -49.24 2920 16.3
3. Digital infrastructure displacing the need for transport fuel
Smart hubs / teleworking
Abatement based on work undertaken by the Low Carbon Living CRC
Linear 2016 to 2030 Transport Technology
improvementsEnergy productivity -49.24 410 2.3
Intelligent traveller information systems
Automated traveller information systems on road conditions and environmentally friendly driving. Includes eco-cruise control and eco-navigation.
Linear 2026 to 2030 Transport Technology
improvementsEnergy productivity -304.24 1857 5.6
4. Intelligent industrial
Advanced building management
Improved management of energy data in the built environment. Time of use data monitoring with alerts/
Linear 2016 to 2030
Electricity Technology improvements
Energy productivity
-52.81 2177 12.1
34 © Energetics Pty Ltd 2023

Modelling and analysis of Australia’s abatement opportunities
Group Abatement opportunities Abatement description Uptake rate
typeSource abated (segment)
Program Abatement Type
Levelised cost of
abatement in 2030 ($/t
CO2-e)
Annual abatement in 2030 - AGEIS sectors
(‘000 t CO2-e)
Cumulative abatement
potential by 2030 - AGEIS sectors
(Mt CO2-e)
and building management systems
systems - Commercial
automated options for reducing energy. Future automation of energy reduction activities.
Advanced energy management systems - industrial and mining
Improved management and monitoring of electricity data in the mining/ resources and manufacturing sectors.
Linear 2016 to 2030 Electricity Technology
improvementsEnergy productivity -55.61 1470 8.2
Fuel management systems
Reduction of fuel use across the mining and resources sector through better data management and process improvements. Focus on improved driver behaviour and better data monitoring through telemetry equipment.
Linear 2016 to 2025
Direct combustion
National Energy Productivity Plan
Energy productivity -250.96 668 5.3
Industry value chain optimisation (agriculture)
Collaborations between farms and with up and downstream supply chain partners to provide economies of scale. Examples of regional collaboration include investment in shared infrastructure such as pumps, abattoirs and cool-room storage facilities, as well as energy infrastructure.
Linear 2016 to 2030
Direct combustion
ERF and Safeguard Mechanism
Energy productivity
0.05 4.8 0.0
Process and supply chain
Supply chain and process optimisation across all industries (ex
Linear 2016 to 2030
Direct combustion
National Energy
Energy productivity
-113.13 130 0.7
35 © Energetics Pty Ltd 2023

Modelling and analysis of Australia’s abatement opportunities
Group Abatement opportunities Abatement description Uptake rate
typeSource abated (segment)
Program Abatement Type
Levelised cost of
abatement in 2030 ($/t
CO2-e)
Annual abatement in 2030 - AGEIS sectors
(‘000 t CO2-e)
Cumulative abatement
potential by 2030 - AGEIS sectors
(Mt CO2-e)
optimisation - natural gas savings
agri). Natural gas savings across the Transport, Mining, and Commercial Building sectors.
Productivity Plan
Process and supply chain optimisation - electricity savings
Supply chain and process optimisation across all industries (ex agri). Electricity savings across the Transport, Mining, and Commercial Building sectors.
Linear 2016 to 2030 Electricity
National Energy Productivity Plan
Energy productivity -23.79 286 1.6
Process and supply chain optimisation - diesel savings
Supply chain and process optimisation across all industries (ex agri). Diesel savings across the Transport, Mining, and Commercial Building sectors.
Linear 2016 to 2030 Transport
National Energy Productivity Plan
Energy productivity -244.82 197 1.1
Process and supply chain optimisation - gasoline savings
Supply chain and process optimisation across all industries (ex agri). Gasoline savings across the Transport, Mining, and Commercial Building sectors.
Linear 2016 to 2030 Transport
National Energy Productivity Plan
Energy productivity -302.60 149 0.8
Autonomous mining
Control and management of a system using technology so that its operation can occur without direct human involvement.
Technologies to be implemented include: Driverless trucks, optimised underground ventilation, more
Sigmoid 2021 to 2030
Direct combustion
Technology improvements
Energy productivity
-155.57 281 2.0
36 © Energetics Pty Ltd 2023

Modelling and analysis of Australia’s abatement opportunities
Group Abatement opportunities Abatement description Uptake rate
typeSource abated (segment)
Program Abatement Type
Levelised cost of
abatement in 2030 ($/t
CO2-e)
Annual abatement in 2030 - AGEIS sectors
(‘000 t CO2-e)
Cumulative abatement
potential by 2030 - AGEIS sectors
(Mt CO2-e)
accurate targeting of ore bodies, more accurate drilling, improved communication between processes, mobile equipment monitoring
Passenger transport - data management improvements
Light vehicles efficiency gains through better data management and associated driver behaviour improvements. Focus on fuel savings through training programs and access to data.
Linear 2016 to 2030 Transport
National Vehicle Productivity Plan
Energy productivity -328.93 296 1.6
Fleet management systems
Improvement in road freight fuel efficiency through better use of data and telemetry systems resulting in improved route planning, load optimisation, and driver training.
Linear 2016 to 2030 Transport
National Vehicle Productivity Plan
Energy productivity -354.52 1157 6.4
Reduced T&D losses
Through grid modernisation, roll out of some smart features, improvements in computational modelling and simulation and next generation transformers.
Linear 2016 to 2030 Electricity Technology
improvementsEnergy productivity -25.83 2350 13.1
5. High performance low carbon energy generation and
Operational improvements to existing gas plant thermal efficiency
Reducing gas consumption through operational improvements that will increase plant efficiency
Linear 2016 to 2025 Electricity
ERF and Safeguard Mechanism
Energy productivity -97.36 301 2.4
Operational Reducing coal consumption through Linear 2016 Electricity ERF and Energy -25.88 2236 17.9
37 © Energetics Pty Ltd 2023
Modelling and analysis of Australia’s abatement opportunities
Group Abatement opportunities Abatement description Uptake rate
typeSource abated (segment)
Program Abatement Type
Levelised cost of
abatement in 2030 ($/t
CO2-e)
Annual abatement in 2030 - AGEIS sectors
(‘000 t CO2-e)
Cumulative abatement
potential by 2030 - AGEIS sectors
(Mt CO2-e)
distribution improvements to existing coal plant thermal efficiency
operational improvements that will increase plant efficiency to 2025 Safeguard
Mechanism productivity
Capital improvements to existing gas plant thermal efficiency
Reducing gas consumption through capital improvements that will increase plant efficiency
Linear 2016 to 2030 Electricity
ERF and Safeguard Mechanism
Energy productivity 64.41 118 0.6
Capital improvements to existing coal plant thermal efficiency
Reducing coal consumption through capital improvements that will increase plant efficiency
Linear 2016 to 2030 Electricity
ERF and Safeguard Mechanism
Energy productivity 64.71 3478 19.1
Biomass co-firing
Replacing a portion of coal consumption in coal power plants with biomass for electricity generation.
Aggressive to 2020 Electricity
ERF and Safeguard Mechanism
Renewable energy 56.15 0 0.0
Battery storage (demand management and grid stabilisation)
Contribution of battery storage to reduced grid use though residential, commercial and utility application. Includes remote application and increased residential solar uptake due to battery storage
Sigmoid 2021 to 2030 Electricity Technology
improvementsFuel switching -2.52 2243 10.2
Cogeneration and trigeneration
Increased uptake of cogeneration both in commercial and industrial applications
Linear 2016 to 2030
Electricity National Energy Productivity Plan
Fuel switching
-37.59 460 2.6
38 © Energetics Pty Ltd 2023

Modelling and analysis of Australia’s abatement opportunities
Group Abatement opportunities Abatement description Uptake rate
typeSource abated (segment)
Program Abatement Type
Levelised cost of
abatement in 2030 ($/t
CO2-e)
Annual abatement in 2030 - AGEIS sectors
(‘000 t CO2-e)
Cumulative abatement
potential by 2030 - AGEIS sectors
(Mt CO2-e)
Remote area power
Replacing fossil fuel remote generation (predominantly diesel) with renewable generation
Linear 2016 to 2025 Electricity Technology
improvementsRenewable energy 85.71 825 6.6
Coal to gas shift (gas new build)*
Assumed construction of two new CCGT plants to offset brown coal fired power generation.
Linear 2016 to 2030 Electricity
ERF and Safeguard Mechanism
Fuel switching 44.39 0 0.0
Coal to gas shift (increased gas utilisation)
Increased utilisation of existing CCGT plants to offset existing brown coal
Linear 2016 to 2030 Electricity
ERF and Safeguard Mechanism
Fuel switching 60.63 0 0.0
Onshore wind (best locations)*
Assumed construction of additional wind capacity to offset brown coal fired power generation.
Linear 2016 to 2030 Electricity
ERF and Safeguard Mechanism
Renewable energy -0.00 0 0.0
6. Advanced industrial energy efficient equipment and process improvement
Farm vehicle efficiency
Farm vehicle efficiency, primarily in diesel tractors and utes
Linear 2021 to 2027
Direct combustion
National Vehicle Productivity Plan
Management of agricultural practices
66.33 332 2.3
IrrigationOpportunities include VSDs, electric vs diesel pumps, solar pumps for diesel and electric irrigation systems.
Linear 2021 to 2027
Direct combustion
National Energy Productivity Plan
Management of agricultural practices
-75.47 457 3.2
Aluminium energy efficiency - coal
Abatement is calculated for alumina production and aluminium refining. Alumina is based on equipment process savings, Aluminium refining
Linear 2016 to 2025
Direct combustion
Technology improvements
Energy productivity
- 156 1.2
39 © Energetics Pty Ltd 2023
Modelling and analysis of Australia’s abatement opportunities
Group Abatement opportunities Abatement description Uptake rate
typeSource abated (segment)
Program Abatement Type
Levelised cost of
abatement in 2030 ($/t
CO2-e)
Annual abatement in 2030 - AGEIS sectors
(‘000 t CO2-e)
Cumulative abatement
potential by 2030 - AGEIS sectors
(Mt CO2-e)
abatement is predominantly in the electrolytic process
Aluminium energy efficiency - natural gas
Abatement is calculated for alumina production and aluminium refining. Alumina is based on equipment process savings, Aluminium refining abatement is predominantly in the electrolytic process
Linear 2016 to 2025
Direct combustion
Technology improvements
Energy productivity -0.27 361 2.9
Aluminium energy efficiency - electricity
Abatement is calculated for alumina production and aluminium refining. Alumina is based on equipment process savings, Aluminium refining abatement is predominantly in the electrolytic process
Linear 2016 to 2025 Electricity Technology
improvementsEnergy productivity 8.93 1413 11.7
Cement Clinker Substitution by Slag - CO2 from reaction
Savings from the use of supplementary cementitious materials (SCMs) instead of traditional ones at various stages of the cement-making process.
Linear 2016 to 2025
Industrial processes and product use
Technology improvements
Management of industrial processes
35.29 389 3.1
Cement Clinker Substitution by Slag - fuel combustion
Savings from the use of supplementary cementitious materials (SCMs) instead of traditional ones at various stages of the cement-making process.
Linear 2016 to 2025
Direct combustion
Technology improvements
Management of industrial processes
35.02 317 2.5
Manufacturing General equipment based efficiency Linear 2016 Direct National Energy -126.27 1675 13.4
40 © Energetics Pty Ltd 2023
Modelling and analysis of Australia’s abatement opportunities
Group Abatement opportunities Abatement description Uptake rate
typeSource abated (segment)
Program Abatement Type
Levelised cost of
abatement in 2030 ($/t
CO2-e)
Annual abatement in 2030 - AGEIS sectors
(‘000 t CO2-e)
Cumulative abatement
potential by 2030 - AGEIS sectors
(Mt CO2-e)
processes and fuel shift (General Efficiency) - fuel savings
savings in manufacturing excluding non-ferrous metals (i.e. aluminium) to 2025 combustion
Energy Productivity Plan
productivity
Manufacturing processes and fuel shift (General Efficiency) - electricity savings
General equipment based efficiency savings in manufacturing excluding non-ferrous metals (i.e. aluminium)
Linear 2016 to 2025 Electricity
National Energy Productivity Plan
Energy productivity -52.46 1243 10.2
Haul road optimisation and maintenance
Optimisation of mine site haul road design and conditions.
Linear 2016 to 2025
Direct combustion
ERF and Safeguard Mechanism
Energy productivity 86.92 719 5.8
Payload Management
Optimising mine site haulage payload and right sizing haul trucks for purpose.
Linear 2016 to 2030
Direct combustion
ERF and Safeguard Mechanism
Energy productivity 86.92 2344 12.9
Plant (and UG vent) optimisation including
Management of compressed air systems, high efficiency motor (HEM) motor replacements and variable speed drive (VSD) optimisation. Mine ventilation upgrades and optimisation with air quality sensors.
Linear 2016 to 2030 Electricity
ERF and Safeguard Mechanism
Energy productivity -58.00 347 1.9
Optimisation of haulage fuel use - including truck engine
Optimising fuel management systems and haul truck engine upgrades.
Linear 2016 to 2030
Direct combustion
ERF and Safeguard Mechanism
Energy productivity
86.92 2255 12.4
41 © Energetics Pty Ltd 2023

Modelling and analysis of Australia’s abatement opportunities
Group Abatement opportunities Abatement description Uptake rate
typeSource abated (segment)
Program Abatement Type
Levelised cost of
abatement in 2030 ($/t
CO2-e)
Annual abatement in 2030 - AGEIS sectors
(‘000 t CO2-e)
Cumulative abatement
potential by 2030 - AGEIS sectors
(Mt CO2-e)
technologies
Selective blastingUpgrading metal content through selective higher fragmentation of high grade material.
Linear 2016 to 2030
Direct combustion
ERF and Safeguard Mechanism
Energy productivity -58.00 43 0.2
7. Advanced commercial energy efficient equipment
Commercial lighting upgrades
Move from T8s and existing lighting fixtures in commercial buildings to high efficiency LEDs.
Linear 2016 to 2025 Electricity Technology
improvementsEnergy productivity -39.36 2532 20.9
Commercial HE appliances
Replacements and upgrades to commercial HVAC and refrigeration systems as the major energy consumers across the Australian commercial and retail sectors.
Linear 2016 to 2025 Electricity
National Energy Productivity Plan
Energy productivity -50.86 2859 23.6
HE residential appliances
Upgrades and efficiency improvements to residential appliances including:
Water heating
Cooking
Space heating
Air conditioning
Linear 2016 to 2025 Electricity
National Energy Productivity Plan
Energy productivity -52.46 2019 16.7
Residential lighting
Shifting the market from incandescent and halogen downlights to LEDs.
Linear 2016 to 2025 Electricity Technology
improvementsEnergy productivity -50.94 474 3.9
Phase out Fade out small inefficient data Linear 2016 Electricity National Energy -52.32 403 2.2
42 © Energetics Pty Ltd 2023

Modelling and analysis of Australia’s abatement opportunities
Group Abatement opportunities Abatement description Uptake rate
typeSource abated (segment)
Program Abatement Type
Levelised cost of
abatement in 2030 ($/t
CO2-e)
Annual abatement in 2030 - AGEIS sectors
(‘000 t CO2-e)
Cumulative abatement
potential by 2030 - AGEIS sectors
(Mt CO2-e)
inefficient data centres
centres with a push to move to larger more efficient centres. Energy efficiency improvements across centres - specifically in close control air conditioners.
to 2030Energy Productivity Plan
productivity
8. Low carbon transport
Mandatory fuel efficiency standards for light vehicles
Mandatory best practice light vehicle fleet standards in place by 2020 driving reduction in fuel consumption.
Linear 2016 to 2025 Transport
National Vehicle Productivity Plan
Energy productivity -89.43 6680 53.4
Improvements in aircraft performance
Fleet upgrades and logistical management improvements driving reduction in domestic aviation fuel consumption
Linear 2016 to 2025 Transport
ERF and Safeguard Mechanism
Energy productivity -199.51 2936 23.5
Optimising existing transport systems
Articulated truck road freight mode shifting to rail freight.
Linear 2016 to 2025 Transport
National Vehicle Productivity Plan
Energy productivity 86.13 799 6.4
Activities to improve HV efficiency
Mandatory best practice heavy vehicle fleet standards in place by 2020 driving reduction in fuel consumption.
Linear 2016 to 2025 Transport
National Vehicle Productivity Plan
Energy productivity -217.40 5102 40.8
Biofuels in aviation
Fuel switch from standard jet fuel to biofuels in domestic aviation.
Linear 2016 to 2025
Transport ERF and Safeguard Mechanism
Fuel switching
255.67 890 7.1
43 © Energetics Pty Ltd 2023

Modelling and analysis of Australia’s abatement opportunities
Group Abatement opportunities Abatement description Uptake rate
typeSource abated (segment)
Program Abatement Type
Levelised cost of
abatement in 2030 ($/t
CO2-e)
Annual abatement in 2030 - AGEIS sectors
(‘000 t CO2-e)
Cumulative abatement
potential by 2030 - AGEIS sectors
(Mt CO2-e)
Plug-in electric vehicles
Uptake of plug-in hybrid electric vehicle and battery electric vehicles, replacing conventional petrol passenger vehicles.
Linear 2016 to 2025 Transport Technology
improvementsFuel switching 3.93 209 1.7
9. Improve land management and low emissions farming practices
Reduced cropland soil emissions
Based on previously developed Climate Works numbers.
Linear 2016 to 2030 Agriculture
ERF and Safeguard Mechanism
Land use change -73.53 505 2.8
Pasture and grassland management
Based on previously developed Climate Works numbers.
Linear 2016 to 2030 Agriculture
ERF and Safeguard Mechanism
Land use change 9.12 11267 62.0
Cropland Carbon Sequestration34
Based on previously developed Climate Works numbers.
Linear 2016 to 2030 Agriculture
ERF and Safeguard Mechanism
Land use change 24.41 1260 6.9
Active livestock feeding
Based on previously developed Climate Works numbers.
Linear 2016 to 2030 Agriculture
ERF and Safeguard Mechanism
Land use change -9.71 1073 5.9
Anti-methanogenic treatments
Based on previously developed Climate Works numbers.
Linear 2016 to 2030
Agriculture ERF and Safeguard Mechanism
Land use change
14.71 1580 8.7
34 Note that this includes savannah burning management
44 © Energetics Pty Ltd 2023

Modelling and analysis of Australia’s abatement opportunities
Group Abatement opportunities Abatement description Uptake rate
typeSource abated (segment)
Program Abatement Type
Levelised cost of
abatement in 2030 ($/t
CO2-e)
Annual abatement in 2030 - AGEIS sectors
(‘000 t CO2-e)
Cumulative abatement
potential by 2030 - AGEIS sectors
(Mt CO2-e)
Degraded farmland restoration
Based on previously developed Climate Works numbers.
Linear 2016 to 2030 LULUCF
ERF and Safeguard Mechanism
Land use change 85.29 4733 26.0
Reforestation of marginal land with timber plantation
Based on previously developed Climate Works numbers.
Linear 2016 to 2030 LULUCF
ERF and Safeguard Mechanism
Land use change -8.82 2527 13.9
Reforestation of Marginal Land With Environmental Forest
Based on previously developed Climate Works numbers.
Linear 2016 to 2030 LULUCF
ERF and Safeguard Mechanism
Land use change 25.00 16067 88.4
Reduce Deforestation and Regrowth Clearing
Based on previously developed Climate Works numbers.
Linear 2016 to 2030 LULUCF
ERF and Safeguard Mechanism
Land use change 23.53 10733 59.0
Strategic Forestation of Non-Marginal Land With Environmental Forest
Based on previously developed Climate Works numbers.
Linear 2016 to 2030 LULUCF
ERF and Safeguard Mechanism
Land use change 26.47 13267 73.0
Improved forest management
Based on previously developed Climate Works numbers.
Linear 2016 to 2030 LULUCF
ERF and Safeguard Mechanism
Land use change 52.94 2273 12.5
45 © Energetics Pty Ltd 2023

Modelling and analysis of Australia’s abatement opportunities
Group Abatement opportunities Abatement description Uptake rate
typeSource abated (segment)
Program Abatement Type
Levelised cost of
abatement in 2030 ($/t
CO2-e)
Annual abatement in 2030 - AGEIS sectors
(‘000 t CO2-e)
Cumulative abatement
potential by 2030 - AGEIS sectors
(Mt CO2-e)
10. Fugitive emissions
Degasification
Recovery and destruction of coal mine waste gas – flaring, injection into natural gas pipelines for use, or use on site. 40% uptake assumed for degasification.
Linear 2016 to 2030 Fugitives Other
programs
Fugitive emissions management
-3.34 2707 14.9
Enhanced degasification
Enhanced recovery of coal mine waste gas through an additional enrichment process and tighter spacing increasing recovery efficiency. 30% uptake assumed for enhanced degasification.
Linear 2016 to 2030 Fugitives Other
programs
Fugitive emissions management
-2.74 2520 13.9
Oxidation of Ventilation Air Methane (VAM)
Oxidation of ventilation air methane to CO2. Most savings arise from the destruction of methane. Low probability of VAM oxidation being used for onsite power generation.
Linear 2016 to 2030 Fugitives Other
programs
Fugitive emissions management
25.00 267 1.5
Chronic leaks (pipelines, distribution facilities, other) - natural gas
Process and structural improvements to ensure more complete capture of natural gas.
Linear 2016 to 2030 Fugitives
ERF and Safeguard Mechanism
Fugitive emissions management
3.19 280 1.5
Reducing flaring emissions
Based on an assumed growing commitment to zero routine flaring by 2030 across the LNG/ natural gas and oil producing sectors.
Linear 2016 to 2030 Fugitives Technology
improvements
Fugitive emissions management
4.26 1987 10.9
46 © Energetics Pty Ltd 2023

Modelling and analysis of Australia’s abatement opportunities
Group Abatement opportunities Abatement description Uptake rate
typeSource abated (segment)
Program Abatement Type
Levelised cost of
abatement in 2030 ($/t
CO2-e)
Annual abatement in 2030 - AGEIS sectors
(‘000 t CO2-e)
Cumulative abatement
potential by 2030 - AGEIS sectors
(Mt CO2-e)
11. Waste management
Alternative Waste Treatment - waste to energy
Based on offsetting coal fired power generation, and avoided methane emissions from thermal treatment of landfill and livestock waste
Linear 2016 to 2025 Waste
ERF and Safeguard Mechanism
Waste management 73.00 2335 18.7
Alternative Waste Treatment - solid waste alternative treatments
Alternative waste treatments including increased biological treatment/ combustion and conditioning best practices, and includes anaerobic digestion
Linear 2016 to 2025 Waste
ERF and Safeguard Mechanism
Waste management 127.00 457 3.7
Solid waste - increased recycling
Increased recycling and management of source separated organic waste.
Linear 2016 to 2030 Waste
ERF and Safeguard Mechanism
Waste management -20.00 289 1.6
Alternative Waste Treatment - Domestic wastewater treatment
Process improvements in domestic wastewater handling facilities
Linear 2016 to 2030 Waste
ERF and Safeguard Mechanism
Waste management 42.00 41 0.2
12. Management of synthetic gases
Management of synthetic gases Based on assumptions provided by
the Department.Aggressive to 2020
Industrial processes and product use
Other programs
Management of industrial processes
25.00 4850 40.1
* Included in the MACC output for completeness but not included in stacked bar analysis as there are no policy mechanisms to support the switch from coal fired generation to gas or wind generation.
47 © Energetics Pty Ltd 2023
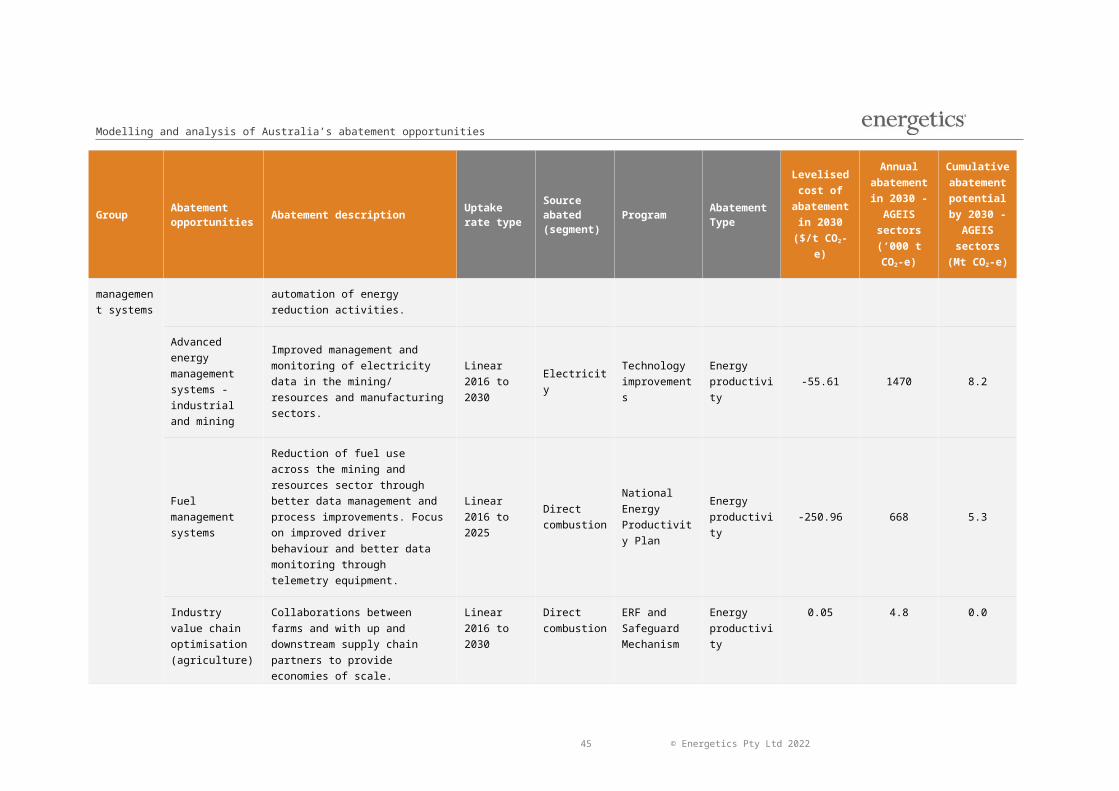
Modelling and analysis of Australia’s abatement opportunities
Note that some abatement opportunities that have zero annual and cumulative abatement are fully deployed by 2020 and are therefore not available to contribute to the 2030 abatement task.
48 © Energetics Pty Ltd 2023

Modelling and analysis of Australia’s abatement opportunities
Appendix B. Assumptions
Table 4: Energy content and emissions factors for energy types
Fuel type Units Energy conversion factor (GJ/unit)
Emissions factor (tonnes/unit)
Natural Gas GJ 1 0.0513
Compressed Natural Gas GJ 1 0.0513
Liquefied Natural Gas kL 25.3 1.36
LPG kL 26.2 1.59
Gasoline kL 34.2 2.31
Jet fuel kL 36.8 2.58
Diesel kL 38.6 2.72
Fuel Oil kL 39.7 2.92
Black coal tonnes 27.0 2.43
Brown coal tonnes 10.2 0.96
Electricity MWh 3.6 See Table 6
49 © Energetics Pty Ltd 2023

Modelling and analysis of Australia’s abatement opportunities
Table 5: Uptake rate approaches
Uptake rates used
Aggressive to 2020
Linear 2016 – 2025
Linear 2016 – 2030
Linear 2021 – 2027
Linear 2021 – 2030
Linear 2026 – 2030
Sigmoidal 2021 - 2030
50 © Energetics Pty Ltd 2023
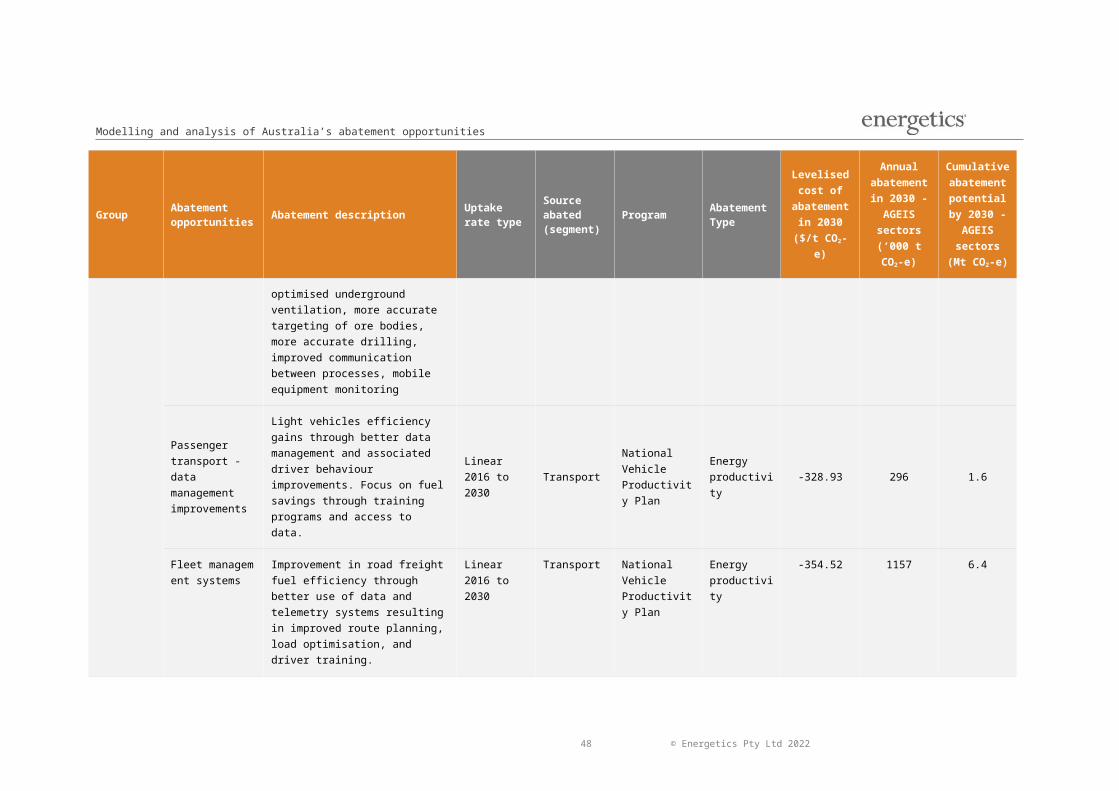
Modelling and analysis of Australia’s abatement opportunities
Table 6: Emissions factors for electricity (t CO2-e/MWh)
Year Emissions factor
2015 0.76
2016 0.76
2017 0.74
2018 0.7
2019 0.66
2020 0.65
2021 0.64
2022 0.64
2023 0.64
2024 0.64
2025 0.63
2026 0.63
2027 0.63
2028 0.62
2029 0.62
2030 0.62
51 © Energetics Pty Ltd 2023

Modelling and analysis of Australia’s abatement opportunities
Table 7: Societal energy prices
Fuel type 2015 2016 2017 2018 2019 2020 2021 2022 2023 2024 2025 2026 2027 2028 2029 2030
Natural Gas ($/GJ) $12.00 $14.00 $12.00 $10.00 $9.50 $9.50 $9.79 $10.08 $10.38
$10.69 $11.01 $11.34 $11.68 $12.03 $12.40 $12.77
CNG ($/GJ) $19.84 $20.00 $20.00 $20.00 $20.00 $20.00 $20.00 $20.00 $20.00
$20.00 $20.00 $20.00 $20.00 $20.00 $20.00 $20.00
LNG ($/kL) $506 $506 $506 $506 $506 $506 $506 $506 $506 $506 $506 $506 $506 $506 $506 $506
LPG ($/kL) $390 $415 $445 $470 $500 $525 $555 $580 $610 $635 $665 $665 $665 $665 $665 $665
Gasoline ($/kL) $850 $866 $882 $898 $915 $932 $949 $966 $984 $1,002 $1,021 $1,040 $1,059 $1,079 $1,099 $1,119
Jet fuel ($/kL) $655 $700 $745 $795 $840 $885 $930 $975 $1,020
$1,070 $1,115 $1,115 $1,115 $1,115 $1,115 $1,115
Diesel ($/kL) $800 $815 $830 $845 $861 $877 $893 $910 $926 $943 $961 $979 $997 $1,015 $1,034 $1,053
Fuel Oil ($/kL) $850 $910 $970 $1,025 $1,085 $1,145 $1,205 $1,265 $1,325
$1,385 $1,445 $1,445 $1,445 $1,445 $1,445 $1,445
Black coal ($/tonnes) $40.00 $39.00 $38.00 $37.00 $36.00 $35.00 $34.00 $33.00 $32.00
$31.00 $30.00 $29.00 $28.00 $27.00 $26.00 $25.00
Brown coal ($/tonnes) $15.00 $15.00 $15.00 $15.00 $16.00 $16.00 $16.00 $16.00 $16.00
$16.00 $16.00 $16.00 $17.00 $17.00 $17.00 $17.00
Electricity ($/MWh) $36.00 $38.00 $39.00 $40.00 $39.00 $40.00 $43.00 $43.00 $43.00
$43.00 $43.00 $44.00 $45.00 $45.00 $46.00 $47.00
52 © Energetics Pty Ltd 2023

Modelling and analysis of Australia’s abatement opportunities
Appendix C. Australian 2030 abatement cost curve
53 © Energetics Pty Ltd 2023

Modelling and analysis of Australia’s abatement opportunities
54 © Energetics Pty Ltd 2023

Modelling and analysis of Australia’s abatement opportunities
About Energetics
We’re more than carbon neutral. Sustainability is core to Energetics’ business.
In June 2008, Energetics became one of Australia’s first consulting firms to achieve carbon neutrality through the Australian Government’s Greenhouse Friendly Program. We offset 100% of the greenhouse gas emissions associated with the complete lifecycle of our services. We were one of the first signatories to join the CitySwitch program, winning Green Office awards in 2010 and 2011 for our Melbourne and Brisbane offices respectively.
In keeping with our Sustainability Policy, we drive continuous improvement by identifying and implementing internal carbon mitigation, sustainable procurement and behavioural change projects. Being an environmental role model is one of our core business values. Every employee is given two days personal development time to participate in environmental activities within their own community.
Report authorsThis report was prepared for the Department of the Environment by the following authors.
Name: Dr Gordon WeissTitle: AssociateEmail: [email protected]
Name: Emma FaganTitle: ManagerEmail: [email protected]
Name: Dr Peter HoltTitle: AssociateEmail: [email protected]
55© Energetics Pty Ltd 2023

Modelling and analysis of Australia’s abatement opportunities
Contact details
Energetics is a carbon neutral companywww.energetics.com.au
Brisbane
Level 12, 410 Queen St, Brisbane Qld 4000
Ph: +61 7 3230 8800
Fax: +61 2 9929 3922
Perth
Level 3, 182 St Georges Tce, Perth WA 6000
Ph: +61 8 9429 6400
Fax: +61 2 9929 3922
Melbourne
Level 6, 34 Queen St, Melbourne VIC 3000
PO Box 652, CSW Melbourne VIC 8007
Ph: +61 3 9691 5500
Fax: +61 2 9929 3922
Sydney
Level 7, 132 Arthur St, North Sydney NSW 2060
PO Box 294 North Sydney NSW 2059
Ph: +61 2 9929 3911
Fax: +61 2 9929 3922
abn 67 001 204 039
acn 001 204 039
afsl 329935
56© Energetics Pty Ltd 2023

Modelling and analysis of Australia’s abatement opportunities
57© Energetics Pty Ltd 2023