Creative Industries - worth £5.2 billion to Scottish Economy
the 2003 - 2007 report
Copyright industries
in the u.s. eConomy
By stephen e. siwek prepared for the
eConomists inCorporated international intelleCtual property allianCe
the international intellectual property alliance® (iipa®)
2101 l street nw, suite 1000
washington, dC 20037
united states of america
tel: 202.833.4198 fax: 202.331.3101
web: www.iipa.com email: [email protected]
Copyright industries in the u.s. eConomy:
the 2003-2007 report
ISBN 978-0-9634708-5-0 ®

the 2003 - 2007 report
Copyright industriesin the u.s. eConomy
By Stephen e. Siwek prepared for theeconomiStS incorporated international intellectual property alliance
Copyright Industries in the U.S. Economy: The 2003-2007 Report is the twelfth report on the u.S. copyright industries prepared for the international intellectual property alliance (iipa) since 1990.
citation format: Copyright Industries in the U.S. Economy: The 2003-2007 Report, by Stephen e. Siwek of econo-mists incorporated, prepared for the international intellectual property alliance (iipa), June 2009, available at www.iipa.com.
this latest report updates and supplements eleven previous reports produced by economists incorporated for the iipa:
• Stephen e. Siwek and harold furchgott-roth, Copyright Industries in the U.S. Economy (released in november 1990)
• Stephen e. Siwek and harold furchgott-roth, Copyright Industries in the U.S. Economy: 1977-1990 (released in Sep-tember 1992)
• Stephen e. Siwek Siwek and harold furchgott-roth, Copyright Industries in the U.S. Economy: 1993 Perspective (re-leased in october 1993)
• Stephen e. Siwek and harold furchgott-roth, Copyright Industries in the U.S. Economy: 1977-1993 (released in January 1995)
• Stephen e. Siwek and Gale mosteller, Copyright Industries in the U.S. Economy: The 1996 Report (released in october 1996)
• Stephen e. Siwek and Gale mosteller, Copyright Industries in the U.S. Economy: The 1998 Report (released in may 1998)
• Stephen e. Siwek, Copyright Industries in the U.S. Economy: The 1999 Report (released in december 1999)
• Stephen e. Siwek, Copyright Industries in the U.S. Economy: The 2000 Report (released in december 2000)
• Stephen e. Siwek, Copyright Industries in the U.S. Economy: The 2002 Report (released in april 2002)
• Stephen e. Siwek, Copyright Industries in the U.S. Economy: The 2004 Report (released in october 2004)
• Stephen e. Siwek, Copyright Industries in the U.S. Economy: The 2006 Report (released in January 2007)
copyright © 2009 economists incorporated
all rights reserved. material in this report is protected by copyright. it may, however, be reproduced for non-com-mercial purposes or quoted with appropriate attribution to Stephen e. Siwek of economists incorporated and the international intellectual property alliance.
international intellectual property alliance® is a registered service mark of the international intellectual property alliance. iipa® is a registered service mark of the international intellectual property alliance. the logo (three circles with a ‘c’ in the center and the globe design) also is a registered service mark of the international intellectual property alliance.
cover design and graphic layout by liz holland, Berkeley, california
iSBn 978-0-9634708-5-0 printed in the united States of america
the international intellectual property alliance (iipa)2101 l Street nw, Suite 1000, washington, dc 20037 u.S.a. tel: 202.833.4198 fax: 202.331.3101 web: [email protected] email: [email protected]
foreword 1
executive Summary 3
i. introduction 8
ii. the copyright industries: description 9
iii. Value added by the copyright industries 10
iV. employment in the copyright industries 13
V. u.S. copyrighted materials in world markets 16
Vi. conclusion 17
appendix a: table of Statistics 18
appendix B: current and constant dollar Value added by industry 20
appendix c: measuring contributions to real annual Growth in u.S. Gdp 22
appendix d: list of references 23
AboUT ThE AUThoR
Stephen e. Siwek is principal, economists incorporated, 1200 new hampshire avenue, n.w., washington, dc 20036, www.ei.com. he is co-author of International Trade in Computer Software (Quorum Books, 1993) and International Trade in Films and Television Programs (american enterprise institute/Ballinger publishing company, 1988) and has written and lectured on trade in media services in the United States and Europe. Mr. Siwek has served as an economic and financial consultant to numerous communications and media corporations and trade associations. he is the principal author of twelve reports on the economic contributions of the u.S. copyright industries to the u.S. economy. mr. Siwek has also served as an advisor to foreign governments seeking to develop economic measures of their own copyright industries.
ACknowlEdgEmEnTS
economists incorporated is grateful for the support and assistance of the international intellectual property alliance (iipa) and its seven member associations. in particular, we would like to thank eric h. Smith and maria Strong of the iipa for their contributions to this and prior reports.
the iipa is a private sector coalition formed in 1984 to represent the u.S. copyright-based industries in bilateral and multilateral efforts to improve international protection and enforcement of copyrighted materials. these seven member associations – the association of american publishers (aap), the Business Software alliance (BSa), the entertainment Software association (eSa), the independent film & television alliance (ifta), the motion picture association of america (mpaa), the national music publishers’ association (nmpa) and the recording industry association of america (riaa) – in turn represent over 1,900 u.S. companies producing and distributing materials protected by copyright laws throughout the world -- all types of computer software including business applications software and entertainment software (such as videogame CDs and cartridges, personal computer CD-ROMs and multimedia products); theatrical films, television programs, home videos and digital representations of audiovisual works; music, records, music cds, and audiocassettes; and textbooks, tradebooks, reference and professional publications and journals (in both electronic and print media). Visit iipa’s website at www.iipa.com for more information.
for the last 25 years, the international intellectual prop-erty alliance (iipa) and its association members have worked in partnership with the u.S. government to im-prove the ability of the now over 1,900 copyright-based companies that its members represent to do business successfully in foreign markets. these efforts have result-ed in very significant improvements in copyright laws in these countries, in the enforcement of those laws, and in the lowering of other market access barriers, all of which
have had a significant positive impact on revenue and employment in the u.S. creative industries and in help-ing these industries become one of the nation’s largest contributors to exports and foreign trade. as a direct result of these improvements in law and enforcement, the u.S. creative industries have also assisted the millions of creative individuals and enterprises in these countries to improve their own technological, cultural and economic climate.
ForeWord eric h. Smith international intellectual property alliance (iipa)
1
as the world economy has grown, as international trade has increased and globalized, governments have become acutely aware of the significant contributions that their copyright-based industries have made and will continue to their own economic growth, technological innovation and cultural diversity. with the strongest copyright in-dustries in the world, the U.S. was the first to demon-strate the importance of these industries to economic growth. In 1990 IIPA commissioned one of the first re-ports of its kind to measure the role of at the copyright industries as a distinct economic sector and to assess its revenue, employment, and growth impact on the u.S. economy. this 1990 report and the reports that followed demonstrated that the creation of knowledge-intensive intellectual property-based goods and services has be-come more and more critical to continued economic growth of this country.
this latest 2003-2007 Report, again prepared by Steve Siwek of economists incorporated for the iipa, demon-strates even more clearly that the copyright industries have become one of the most important contributors to u.S. economic growth.
other countries have discovered the value of preparing their own national studies to provide the political under-pinnings to copyright law and enforcement reform and to lowering the rates of piracy in their own countries. in this endeavor they have been assisted by the world intellec-tual property organization (wipo) which in 2003, build-ing upon the methodologies developed by Steve Siwek of economists inc, issued its guide on Surveying the Eco-nomic Contribution of the Copyright-based Industries, which describes methodoliogies for measuring the role of copy-right industries in domestic economies that can, in partic-ular, be adapted to developing countries. the iipa’s 2004 Report was the first to use this new WIPO methodology. Since then more and more countries have completed their own national reports using wipo’s methodologi-cal approach, which allows comparisons among coun-tries. Studies have been done by Singapore, australia, the philippines, canada, mexico, colombia, Jamaica, russia, latvia, hungary, Bulgaria, ukraine, romania, croatia, the netherlands and lebanon, and others are in preparation, such as in china, malaysia and peru. other countries are expected to join this effort as well.
this 2003-2007 Report is our third report that follows the wipo methodology, and it again shows that the u.S. copyright-based industries continue to be one of ameri-ca’s most vibrant economic sectors. included here is data covering the 2003-2007 time frame (with 2007 being the year with the most recent full-year available) on the val-ue-added contributions of the copyright sectors to the u.S. economy, these sectors’ rate of economic growth, the percentage contribution of the copyright sectors to the overall growth in the u.S. economy, their employment and the average compensation for workers in the copy-right sectors in comparison to other sectors.
as this report is released in mid-2009, we acknowledge that we cannot yet determine how much the various sec-tors that comprise the u.S. copyright-based industries have been affected by the current global financial crisis. certainly revenues in some of these industries have been hard hit and jobs have been lost. however, given the his-torical strength and resiliency of the copyright sectors, as demonstrated over 19 years -- and two recessions, we anticipate that any reduction in rates of growth, in revenue or employment will be significantly less than in other more vulnerable sectors of the economy and less than the economy as a whole. But it may be premature to make such predictions.
of one thing we are certain. the creative and knowledge-based industries, and our economy as a whole, will benefit significantly from continuing the fight against global copy-right piracy. a growing percentage of revenue is being generated by sales outside our own country, resulting in new and higher paying jobs. piracy inhibits growth in the u.S. and in any country that fails to promote strong pro-tection, strong enforcement and liberalized market access for these industries. the creativity, innovation, investment and cultural benefits that the copyright-based industries supply to national economies and cultural development can no longer be denied. widespread piracy of physical and now virtual products transmitted online undermine the vitality and vibrancy of these critical industries. eco-nomic reports such as this are but one piece of evidence that governments should use to justify far more effective legal and enforcement regimes to promote and foster the growth of the content-based industries in their national economies.
2
this report, Copyright Industries in the U.S. Economy: The 2003-2007 Report, completed by economists in-corporated, updates and supplements eleven earlier reports prepared for the international intellectual property alliance (“iipa”). this twelfth report pres-ents estimates of the copyright industries’ contribu-tion to the u.S. economy for the years 2003-2007, which reflects the most recent full-year data (2007) available at the time of the publication. this report demonstrates the continuing positive impact these industries have on the u.S. economy.
This study continues to reflect the use of industry data classifications adopted under the North Ameri-can Industry Classification System (“NAICS”) which has now been widely implemented by u.S. statisti-cal agencies. this report also continues to follow the international standards and recommendations propounded by the world intellectual property organization (“wipo”) in 2003 regarding the de-velopment of economic and statistical standards to measure the impact of domestic copyright indus-tries on domestic economies. 1
the data in this study quantify the size and critical importance of the copyright industries to the u.S. economy, using the most current data available. as in past studies, the u.S. copyright industries’ contribu-tion to the u.S. economy is measured by three eco-nomic indicators: value-added to the u.S. current dollar gross domestic product (“Gdp”); share of national employment; and revenues generated from foreign sales and exports. in addition, this study in-cludes two additional indicators of the importance of the copyright industries to the u.S. economy:
compensation per employee and the contribution of the copyright industries to the real annual growth of the u.S. economy.
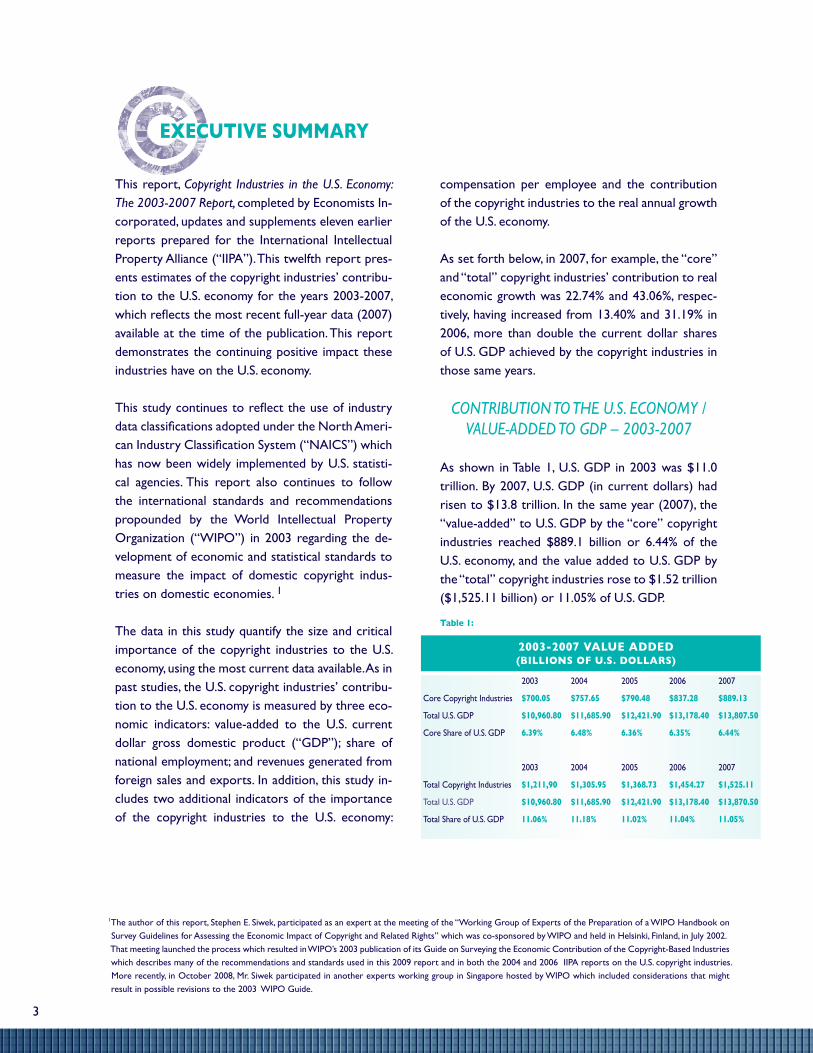
as set forth below, in 2007, for example, the “core” and “total” copyright industries’ contribution to real economic growth was 22.74% and 43.06%, respec-tively, having increased from 13.40% and 31.19% in 2006, more than double the current dollar shares of u.S. Gdp achieved by the copyright industries in those same years.
ConTRIbUTIon To ThE U.S. EConomy / VAlUE-AddEd To gdP – 2003-2007
as shown in table 1, u.S. Gdp in 2003 was $11.0 trillion. By 2007, u.S. Gdp (in current dollars) had risen to $13.8 trillion. in the same year (2007), the “value-added” to u.S. Gdp by the “core” copyright industries reached $889.1 billion or 6.44% of the u.S. economy, and the value added to u.S. Gdp by the “total” copyright industries rose to $1.52 trillion ($1,525.11 billion) or 11.05% of u.S. Gdp.
table 1:
1the author of this report, Stephen e. Siwek, participated as an expert at the meeting of the “working Group of experts of the preparation of a wipo handbook on Survey Guidelines for assessing the economic impact of copyright and related rights” which was co-sponsored by wipo and held in helsinki, finland, in July 2002. that meeting launched the process which resulted in wipo’s 2003 publication of its Guide on Surveying the economic contribution of the copyright-Based industries which describes many of the recommendations and standards used in this 2009 report and in both the 2004 and 2006 iipa reports on the u.S. copyright industries. more recently, in october 2008, mr. Siwek participated in another experts working group in Singapore hosted by wipo which included considerations that might result in possible revisions to the 2003 wipo Guide.
2003-2007 Value added (Billions oF u.s. dollars)
2003 2004 2005 2006 2007
core copyright industries $700.05 $757.65 $790.48 $837.28 $889.13
total u.S. Gdp $10,960.80 $11,685.90 $12,421.90 $13,178.40 $13,807.50
core Share of u.S. Gdp 6.39% 6.48% 6.36% 6.35% 6.44%
2003 2004 2005 2006 2007
total copyright industries $1,211,90 $1,305.95 $1,368.73 $1,454.27 $1,525.11
total u.S. Gdp $10,960.80 $11,685.90 $12,421.90 $13,178.40 $13,870.50
total Share of u.S. Gdp 11.06% 11.18% 11.02% 11.04% 11.05%
exeCutiVe summary
3

2 economic report of the president, January 2009, table B-20, page 308. 3 u.S. Bureau of economic analysis, industry economic accounts, “Value added By industry, december 15, 2008.4 economic report of the president, January 2009, table B-20, page 3085 Real growth rates measure changes in constant dollar value added over time. In these estimates, current dollar value added figures are converted to “chained” dollars
for the year 2000.
To put these figures in perspective, in 2007 the gross consumption expenditures and investments of the en-tire u.S. federal government (a much broader mea-sure than value added) were $979.3 billion. This figure is only 10% greater than the net value added to the u.S. economy by the core copyright industries.2 that same year, the actual value added to the u.S. economy by the federal government was only $554.0 billion.3
Similarly, in 2007, the gross consumption expenditures and investments of all state and local governments in the united States were $1.69 trillion ($1,695.5 bil-lion),4 an amount that is about 11% higher than the value added by the total copyright industries. mean-while, the net value added to the u.S. economy by all state and local governments was only $1.18 trillion ($1,188.9 billion) in 2007.
additional comparisons of the copyright industry’s value added in 2006 and 2007, and to other sectors of the u.S. economy are provided in table 2. these com-parisons clearly document the size and importance of the copyright industries today.
table 2:
2006 and 2007 Value added Comparisons to other seCtors
(Billions oF u.s. dollars)
2006 2007core copyright - Value added $837.28 $889.13total copyright - Value added $1,454.27 $1,525.11federal Government: Gross consumption and investment $932.2 $979.3 Value added $527.6 $554.0State and local Government: Gross consumption and investment $1,575.9 $1,695.5 Value added $1,121.5 $1,188.9construction - Value added $646.0 $610.8health care and Social assistance - Value added $904.8 $957.4finance and insurance - Value added $1,060.9 $1,091.4
the value added estimates for the copyright indus-tries that are contained in this report reflect underly-ing data that are obtained from the u.S. census Bu-reau and from other statistical agencies. the estimates of copyright industry value-added make direct use of the industry-specific estimates of U.S. value-added that are regularly published by the u.S. Bureau of eco-nomic Analysis (“BEA”). These industry-specific esti-mates (in both current dollar and real terms) are used as starting points to derive the contributions made by the core and total copyright industries to u.S. Gdp.
CoPyRIghT IndUSTRy gRowTh And ConTRIbUTIon To gRowTh
In ThE U.S. EConomy
in table 3, we report the real growth rates in value added achieved by the copyright industries and by the u.S. economy during the 2003-2007 time frame.5 as shown in table 3, for the periods 2003-2004, 2004-2005, 2005-2006 and 2006-2007, the core copyright industries achieved annual growth rates in excess of 5.8% per year. the total copyright industries achieved comparable or even higher real annual growth rates during the same periods.
these growth rates were considerably above the real annual growth rates achieved by the u.S. economy as a whole. real u.S. Gdp grew at an annual rate of 3.64% during the period 2003-2004 and less than 3.0% for the years 2004-2005, 2005-2006 and 2006-2007. in the same periods, the real growth rates achieved by both the core and total copyright industries were at least twice the real growth rates reported for the u.S. as a whole.
4
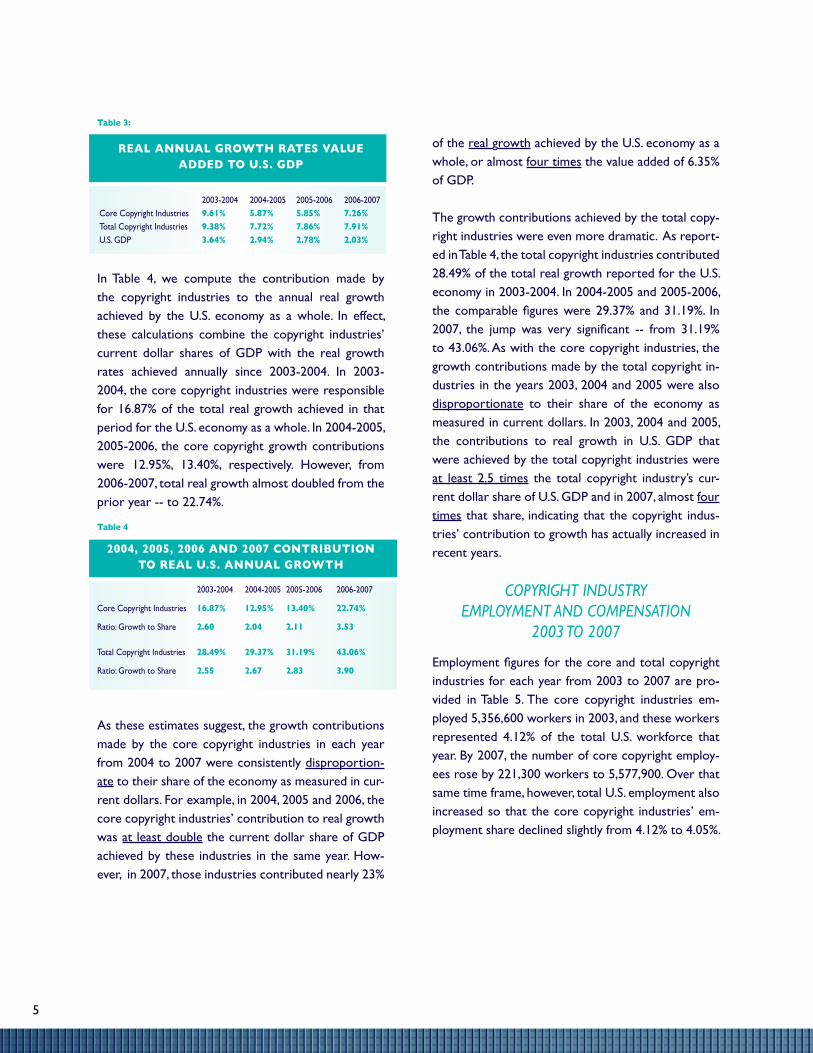
table 3:
real annual groWth rates Value added to u.s. gdp
in table 4, we compute the contribution made by the copyright industries to the annual real growth achieved by the u.S. economy as a whole. in effect, these calculations combine the copyright industries’ current dollar shares of Gdp with the real growth rates achieved annually since 2003-2004. in 2003-2004, the core copyright industries were responsible for 16.87% of the total real growth achieved in that period for the u.S. economy as a whole. in 2004-2005, 2005-2006, the core copyright growth contributions were 12.95%, 13.40%, respectively. however, from 2006-2007, total real growth almost doubled from the prior year -- to 22.74%.
table 4
2004, 2005, 2006 and 2007 ContriBution to real u.s. annual groWth
2003-2004 2004-2005 2005-2006 2006-2007
core copyright industries 16.87% 12.95% 13.40% 22.74%
ratio: Growth to Share 2.60 2.04 2.11 3.53
total copyright industries 28.49% 29.37% 31.19% 43.06%
ratio: Growth to Share 2.55 2.67 2.83 3.90
as these estimates suggest, the growth contributions made by the core copyright industries in each year from 2004 to 2007 were consistently disproportion-ate to their share of the economy as measured in cur-rent dollars. for example, in 2004, 2005 and 2006, the core copyright industries’ contribution to real growth was at least double the current dollar share of Gdp achieved by these industries in the same year. how-ever, in 2007, those industries contributed nearly 23%
of the real growth achieved by the u.S. economy as a whole, or almost four times the value added of 6.35% of Gdp.
the growth contributions achieved by the total copy-right industries were even more dramatic. as report-ed in table 4, the total copyright industries contributed 28.49% of the total real growth reported for the u.S. economy in 2003-2004. in 2004-2005 and 2005-2006, the comparable figures were 29.37% and 31.19%. In 2007, the jump was very significant -- from 31.19% to 43.06%. as with the core copyright industries, the growth contributions made by the total copyright in-dustries in the years 2003, 2004 and 2005 were also disproportionate to their share of the economy as measured in current dollars. in 2003, 2004 and 2005, the contributions to real growth in u.S. Gdp that were achieved by the total copyright industries were at least 2.5 times the total copyright industry’s cur-rent dollar share of u.S. Gdp and in 2007, almost four times that share, indicating that the copyright indus-tries’ contribution to growth has actually increased in recent years.
CoPyRIghT IndUSTRy EmPloymEnT And ComPEnSATIon
2003 To 2007
Employment figures for the core and total copyright industries for each year from 2003 to 2007 are pro-vided in table 5. the core copyright industries em-ployed 5,356,600 workers in 2003, and these workers represented 4.12% of the total u.S. workforce that year. By 2007, the number of core copyright employ-ees rose by 221,300 workers to 5,577,900. over that same time frame, however, total u.S. employment also increased so that the core copyright industries’ em-ployment share declined slightly from 4.12% to 4.05%.
2003-2004 2004-2005 2005-2006 2006-2007core copyright industries 9.61% 5.87% 5.85% 7.26%total copyright industries 9.38% 7.72% 7.86% 7.91%u.S. Gdp 3.64% 2.94% 2.78% 2.03%
5
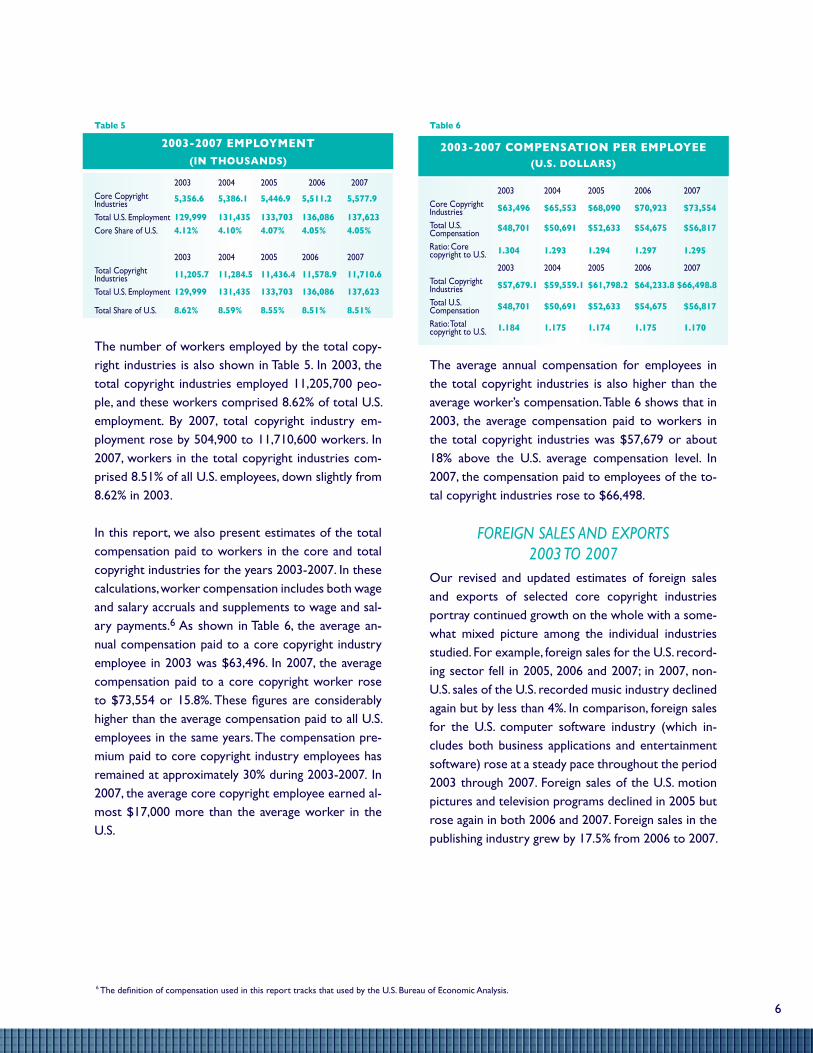
table 5
2003-2007 employment(in thousands)
2003 2004 2005 2006 2007core copyright 5,356.6 5,386.1 5,446.9 5,511.2 5,577.9industriestotal u.S. employment 129,999 131,435 133,703 136,086 137,623core Share of u.S. 4.12% 4.10% 4.07% 4.05% 4.05% 2003 2004 2005 2006 2007total copyright 11,205.7 11,284.5 11,436.4 11,578.9 11,710.6industriestotal u.S. employment 129,999 131,435 133,703 136,086 137,623
total Share of u.S. 8.62% 8.59% 8.55% 8.51% 8.51%
the number of workers employed by the total copy-right industries is also shown in table 5. in 2003, the total copyright industries employed 11,205,700 peo-ple, and these workers comprised 8.62% of total u.S. employment. By 2007, total copyright industry em-ployment rose by 504,900 to 11,710,600 workers. in 2007, workers in the total copyright industries com-prised 8.51% of all u.S. employees, down slightly from 8.62% in 2003.
in this report, we also present estimates of the total compensation paid to workers in the core and total copyright industries for the years 2003-2007. in these calculations, worker compensation includes both wage and salary accruals and supplements to wage and sal-ary payments.6 as shown in table 6, the average an-nual compensation paid to a core copyright industry employee in 2003 was $63,496. in 2007, the average compensation paid to a core copyright worker rose to $73,554 or 15.8%. These figures are considerably higher than the average compensation paid to all u.S. employees in the same years. the compensation pre-mium paid to core copyright industry employees has remained at approximately 30% during 2003-2007. in 2007, the average core copyright employee earned al-most $17,000 more than the average worker in the u.S.
table 6
2003-2007 Compensation per employee (u.s. dollars)
2003 2004 2005 2006 2007core copyright $63,496 $65,553 $68,090 $70,923 $73,554industriestotal u.S. $48,701 $50,691 $52,633 $54,675 $56,817compensation ratio: core 1.304 1.293 1.294 1.297 1.295copyright to u.S. 2003 2004 2005 2006 2007total copyright $57,679.1 $59,559.1 $61,798.2 $64,233.8 $66,498.8industriestotal u.S. $48,701 $50,691 $52,633 $54,675 $56,817compensationratio: total 1.184 1.175 1.174 1.175 1.170copyright to u.S.
the average annual compensation for employees in the total copyright industries is also higher than the average worker’s compensation. table 6 shows that in 2003, the average compensation paid to workers in the total copyright industries was $57,679 or about 18% above the u.S. average compensation level. in 2007, the compensation paid to employees of the to-tal copyright industries rose to $66,498.
FoREIgn SAlES And ExPoRTS2003 To 2007
our revised and updated estimates of foreign sales and exports of selected core copyright industries portray continued growth on the whole with a some-what mixed picture among the individual industries studied. for example, foreign sales for the u.S. record-ing sector fell in 2005, 2006 and 2007; in 2007, non-u.S. sales of the u.S. recorded music industry declined again but by less than 4%. in comparison, foreign sales for the u.S. computer software industry (which in-cludes both business applications and entertainment software) rose at a steady pace throughout the period 2003 through 2007. foreign sales of the u.S. motion pictures and television programs declined in 2005 but rose again in both 2006 and 2007. foreign sales in the publishing industry grew by 17.5% from 2006 to 2007.
6 The definition of compensation used in this report tracks that used by the U.S. Bureau of Economic Analysis.
6
1991 1996 2000 2001 2002 2003 2004 2005 2006 2007
Growth 6.4% 13.3% 8.3% 3.4% 1.1% 6.7% 10.3% 4.3% 5.8% 8.4%rate
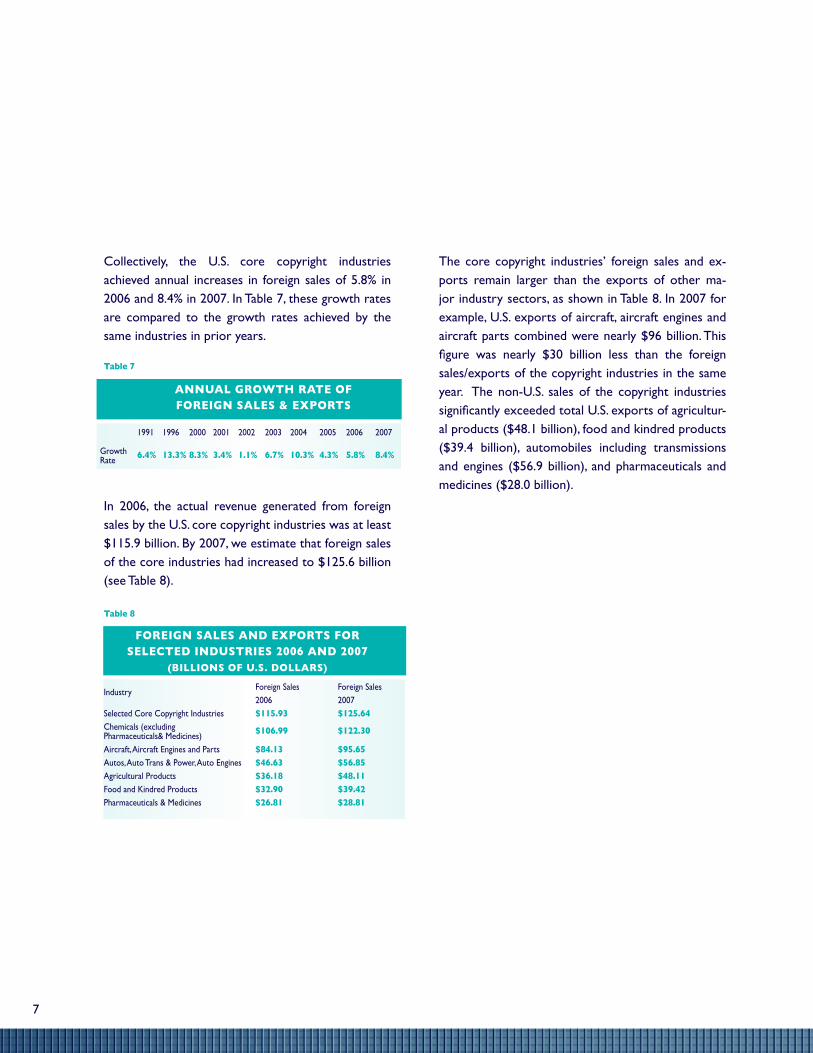
collectively, the u.S. core copyright industries achieved annual increases in foreign sales of 5.8% in 2006 and 8.4% in 2007. in table 7, these growth rates are compared to the growth rates achieved by the same industries in prior years.
table 7
annual groWth rate oF Foreign sales & exports
in 2006, the actual revenue generated from foreign sales by the u.S. core copyright industries was at least $115.9 billion. By 2007, we estimate that foreign sales of the core industries had increased to $125.6 billion (see table 8).
table 8
Foreign sales and exports For seleCted industries 2006 and 2007
(Billions oF u.s. dollars)
industry foreign Sales foreign Sales 2006 2007Selected core copyright industries $115.93 $125.64chemicals (excludingpharmaceuticals& medicines) $106.99 $122.30
aircraft, aircraft engines and parts $84.13 $95.65autos, auto trans & power, auto engines $46.63 $56.85agricultural products $36.18 $48.11food and kindred products $32.90 $39.42pharmaceuticals & medicines $26.81 $28.81
the core copyright industries’ foreign sales and ex-ports remain larger than the exports of other ma-jor industry sectors, as shown in table 8. in 2007 for example, u.S. exports of aircraft, aircraft engines and aircraft parts combined were nearly $96 billion. this figure was nearly $30 billion less than the foreign sales/exports of the copyright industries in the same year. the non-u.S. sales of the copyright industries significantly exceeded total U.S. exports of agricultur-al products ($48.1 billion), food and kindred products ($39.4 billion), automobiles including transmissions and engines ($56.9 billion), and pharmaceuticals and medicines ($28.0 billion).
7
this report, Copyright Industries in the U.S. Economy: The 2003-2007 Report, is the twelfth in a series issued over the last nineteen years by economists incorporated for the International Intellectual Property Alliance (IIPA). This latest report confirms once again that the u.S. copyright industries have outpaced the rest of the economy in real growth and in its contribution to the overall growth achieved by the u.S. economy as a whole. the copyright industries also continue to employ substantial numbers of workers whose compensation levels exceed the average level of compensation paid to all u.S. workers.
As in previous years, this study is presented in five sections:• the copyright industries• Value added by the copyright industries to the u.S. economy• employment in the copyright industries in the u.S. economy• u.S. copyrighted materials in the world market• conclusion
appendix a presents data tables used in this report. appendix B describes recent estimates of both current dollar and constant dollar value added by industry that are now produced by the u.S. Bureau of economic analysis. these estimates were used to revise the methodology used to estimate copyright industry value added and real growth through 2007. appendix c provides an example of how current dollar and constant dollar value added figures for the copyright industries were used to measure the copyright industries’ contribution to the annual rate growth rate achieved by the u.S. economy as whole. appendix d contains a list of references and source materials.
8
i. introduCtion

in nine of our eleven prior economic reports on the copyright industries, we divided the copyright indus-tries into four groups: core, partial, distribution, and copyright related; these were the sectors we devel-oped and defined in our first report issued in 1990. in our 2004 and 2006 reports, we still used four cat-egories, but in order to conform to the international standard, we relied upon the four copyright categories defined by WIPO: core, partial, non-dedicated sup-port, and interdependent.
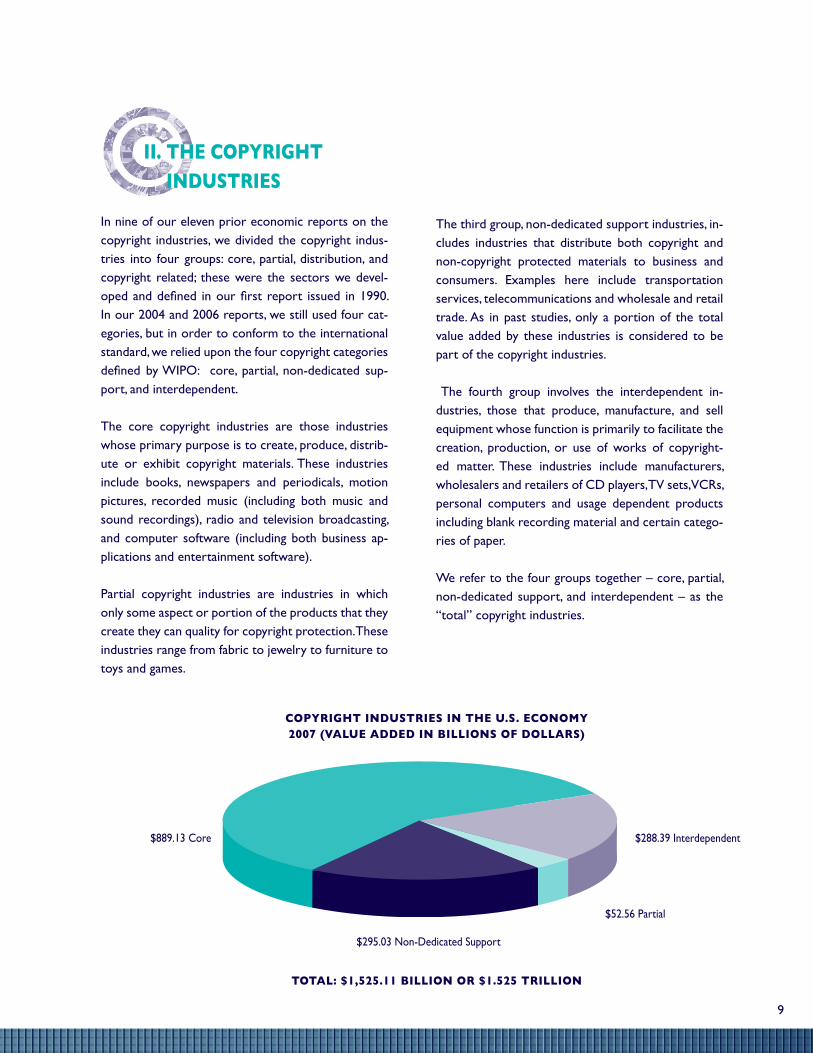
the core copyright industries are those industries whose primary purpose is to create, produce, distrib-ute or exhibit copyright materials. these industries include books, newspapers and periodicals, motion pictures, recorded music (including both music and sound recordings), radio and television broadcasting, and computer software (including both business ap-plications and entertainment software).
partial copyright industries are industries in which only some aspect or portion of the products that they create they can quality for copyright protection. these industries range from fabric to jewelry to furniture to toys and games.
the third group, non-dedicated support industries, in-cludes industries that distribute both copyright and non-copyright protected materials to business and consumers. examples here include transportation services, telecommunications and wholesale and retail trade. as in past studies, only a portion of the total value added by these industries is considered to be part of the copyright industries.
the fourth group involves the interdependent in-dustries, those that produce, manufacture, and sell equipment whose function is primarily to facilitate the creation, production, or use of works of copyright-ed matter. these industries include manufacturers, wholesalers and retailers of cd players, tV sets, Vcrs, personal computers and usage dependent products including blank recording material and certain catego-ries of paper.
we refer to the four groups together – core, partial, non-dedicated support, and interdependent – as the “total” copyright industries.
$288.39 interdependent
$52.56 partial
$295.03 non-dedicated Support
$889.13 core
Copyright industries in the u.s. eConomy 2007 (Value added in Billions oF dollars)
total: $1,525.11 Billion or $1.525 trillion
9
ii. the Copyright industries

Chart 1:
$0.00
$200.00
$400.00
$600.00
$800.00
$1000.00
$1200.00
$1400.00
$1600.00
$700.05
$511.85
2003
$757.65
$548.30
2004
$790.48
$578.25
2005
$837.28
$616.99
2006
$889.13
$635.98
2007
Core
Other Industries
Chart 1: Copyright industries Value added(in Billions oF Current dollars)
the most appropriate way to measure an industry’s contri-bution to the national economy is to measure the industry’s value added. Value added reflects the economic contribution of labor and capital of a particular industry. the sum of the value added of all industries in the united States is equal to gross domestic product (Gdp), a standard measure of the size of the u.S. economy. for this reason, value added calculations can be used to draw comparisons of the relative size and growth rates of different industries in a way that is consistent with the federal government’s national income and product accounting data.
in our past reports, we noted that timely estimates of the value added by individual industries were not generally avail-able from government sources for many of the industries considered in these studies. as a result, our prior estimates of copyright industry value added were derived by apply-ing historical input-output factors to more current data on industry sales from both government and non-government sources.
By contrast, in our most recent studies, we make direct use of the industry specific value added estimates produced by the u.S. Bureau of economic analysis (“Bea”) to derive the contributions made by the core and total copyright indus-tries to the U.S. economy. An additional benefit of using this
data is that the Bea calculates both current dollar and con-stant dollar value added for the industry classifications that it analyzes (see appendix B). in this report, the constant dol-lar value added figures are used to derive estimates of the real growth rates achieved by the core and total copyright industries on a year by year basis. these data are also used to measure the contribution made by the copyright industries to the real annual growth achieved by the u.S. economy as a whole (see appendix c).
as shown in chart 1, our current estimates of the value added for the core copyright industries in 2003, 2004, 2005, 2006 and 2007 increased from $700.05 billion in 2003 to $889.13 billion in 2007. the estimated value added for the other (non-core) copyright industries rose from $511.85 bil-lion in 2003 to $635.98 billion in 2007.
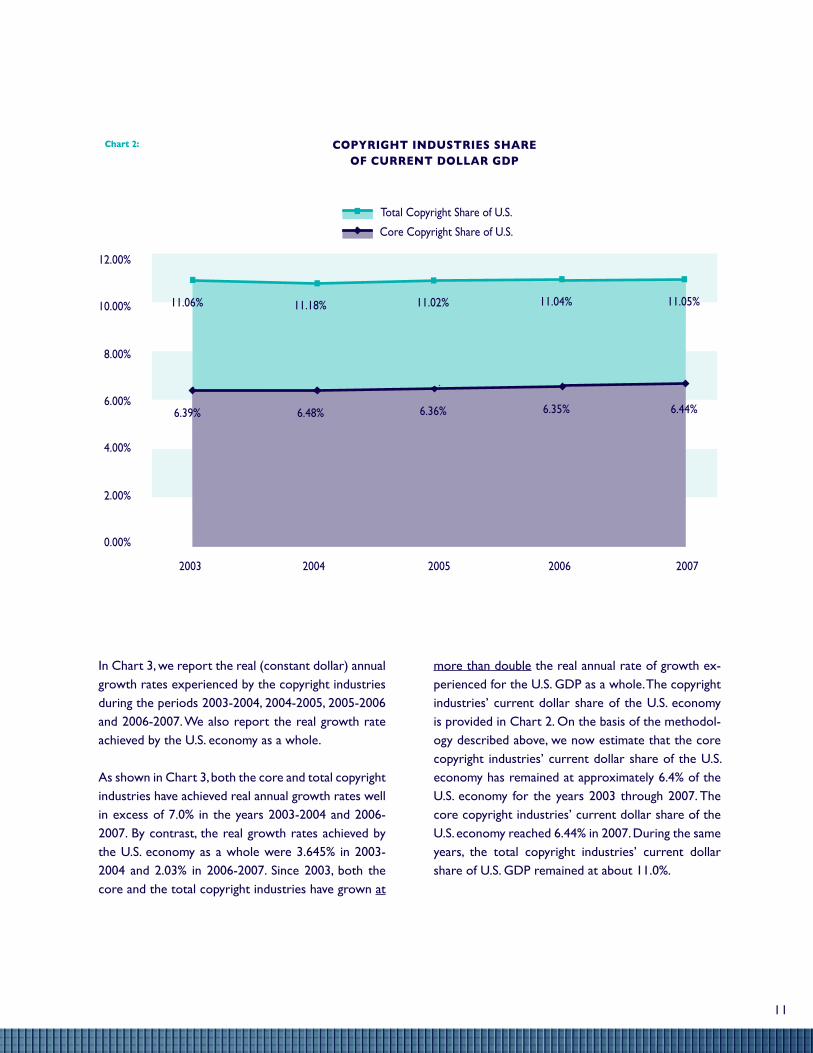
the copyright industries’ current dollar share of the u.S. economy is provided in chart 2. on the basis of the method-ology described above, we now estimate that the core copy-right industries’ current dollar share of the u.S. economy has remained at approximately 6.4% of the u.S. economy for the years 2003 through 2007. the core copyright industries’ cur-rent dollar share of the u.S. economy reached 6.44% in 2007. during the same years, the total copyright industries current dollar share of u.S. Gdp remained at about 11.0%.
iii. Value added By the Copyright industries
10
Copyright industries share oF Current dollar gdp
6.39% 6.48% 6.36% 6.35%
11.06% 11.18% 11.02% 11.04%
0.00%
2.00%
4.00%
6.00%
8.00%
10.00%
12.00%
2003 2004 2005 2006
6.44%
11.05%
2007
Core Copyright Share of U.S.
Total Copyright Share of U.S.
Chart 2:
in chart 3, we report the real (constant dollar) annual growth rates experienced by the copyright industries during the periods 2003-2004, 2004-2005, 2005-2006 and 2006-2007. we also report the real growth rate achieved by the u.S. economy as a whole.
as shown in chart 3, both the core and total copyright industries have achieved real annual growth rates well in excess of 7.0% in the years 2003-2004 and 2006-2007. By contrast, the real growth rates achieved by the u.S. economy as a whole were 3.645% in 2003-2004 and 2.03% in 2006-2007. Since 2003, both the core and the total copyright industries have grown at
more than double the real annual rate of growth ex-perienced for the u.S. Gdp as a whole. the copyright industries’ current dollar share of the u.S. economy is provided in chart 2. on the basis of the methodol-ogy described above, we now estimate that the core copyright industries’ current dollar share of the u.S. economy has remained at approximately 6.4% of the u.S. economy for the years 2003 through 2007. the core copyright industries’ current dollar share of the u.S. economy reached 6.44% in 2007. during the same years, the total copyright industries’ current dollar share of u.S. Gdp remained at about 11.0%.
11

Chart 3:
Chart 4:
real annual groWth rates Copyright industries and u.s. gdp
ContriButions to real u.s. annual groWth
16.87%
28.49%
12.95% 13.40%
22.74%
29.37% 31.19%
43.06%
0.00% 5.00%
10.00% 15.00% 20.00% 25.00% 30.00% 35.00% 40.00% 45.00% 50.00%
2003-2004 2004-2005 2005-2006 2006-2007
Core Copyright Industries
Total Copyright Industries
9.61% 9.38%
3.64%
5.87%
7.72%
2.94%
5.85%
7.86%
2.78%
7.26% 7.91%
2.03%
0.00%
2.00%
4.00%
6.00%
8.00%
10.00%
12.00%
Core Copyright Industries Total Copyright Industries U.S. GDP
2003-2004 2004-2005 2005-2006 2006-2007
7 See table a.2.
Because the copyright industries are growing at rates that are more than twice the growth rates achieved for the u.S. as a whole, their contribution to the over-all growth of the united States is substantial. indeed, the growth contributions made by the copyright in-dustries are much larger than these industries’ share of u.S. Gdp.
as shown in chart 4, the core copyright industries’ contributions to real annual growth in the u.S. econ-omy ranged from 16.87% in 2003-2004 to 22.74% in 2006-2007. for the total copyright industries, the an-nual contributions to real u.S. growth ranged from 28.49% in 2003 to 43.06% in 2007. to put these values in their proper context, consider that in 2007, real u.S. Gdp increased from $11.294 trillion to $11.524 trillion, an increase of nearly $230 billion.7
12
iV. employment in the Copyright industries
in this 2009 report, we again estimate the number of workers employed in the core and total copyright in-dustries for the years 2003-2007. the procedures used to derive our estimates of employment in this report were largely based on the formulas derived in the earlier reports. in those reports, employee counts were derived so that the counts would be consistent in both the na-ICS and ISIC classification systems. As in the past, the actual employee counts by naicS code were extracted from the Bureau of labor Statistics (“BlS”) data base.
the core copyright industries employed 5,357,000 workers in 2003, as shown in chart 5. the total number of workers in the core consistently increased from 2004 through 2007.8 in 2007, the total number of workers em-ployed in the core copyright industries was 5,578,000, an increase of 66,700 workers over 2006. in 2003, the to-tal copyright industries employed 11,206,000 workers. Similarly, employment in the total copyright industries increased in 2004 and in all subsequent years through 2007. By 2007, the total copyright industries employed 11,711,000 workers, an increase of 131,700 employees over the 2006 totals.
we also quantify the average compensation per employ-ee received by workers in the copyright industries and in the u.S. as a whole. in these calculations “compensation” means “wages and salary accruals and supplements to wages and salary accruals.”9 these supplements include “employer contributions for employee pensions and in-surance funds and employer contributions for govern-ment social insurance.”
as reported in chart 6, the average annual compensa-tion per worker in 2003 was $63,496 in the core copy-
right industries and $57,679 in the total copyright indus-tries. in that same year, the average annual compensation for all u.S. workers was only $48,701.10 this compensa-tion “premium” paid to workers in the copyright indus-tries continued through 2004, 2005, 2006 and 2007. in 2007, the average annual compensation per worker was $73,554 in the core copyright industries and $66,499 in the total copyright industries. By contrast, in 2007, the average annual compensation for all u.S. workers was only $56,817.
the compensation premium paid to copyright industry employees can also be illustrated by ratio. in chart 7a, the average compensation paid to employees in the core and total copyright industries is compared to the av-erage compensation paid to all workers in the united States. for core copyright employees, the compensation premium has generally been in the range of 30%. for to-tal copyright employees, the compensation premium has centered at about 17%. in other words, core copyright employees on average receive 30% more compensation than the average u.S. worker while total copyright indus-try employees receive about 17% more compensation.
copyright industry workers are also paid more than the average u.S. worker in private industry. as shown in chart 7b, the compensation paid to workers in the core copyright industries has generally been about 34% high-er than the average compensation paid to u.S. private industry employees. Similarly, the compensation paid to workers in the total copyright industries has generally been about 21% higher than the average compensation paid to u.S. private industry employees as a whole.
8 on a collective basis, the core copyright industries have consistently been able to add jobs to the u.S. economy, even if several sub-sectors experienced declines in employment. 9 See u.S. Bureau of economic analysis, Glossary index. 10 in our Copyright Industries in the U.S. Economy: The 2006 Report, we reported slightly lower figures for the average annual compensation paid to all U.S. workers in the years 2002
through 2005. Those calculations reflected the use of employment figures from the U.S. Bureau of Economic Analysis rather than the Bureau of Labor Statistics. In this current report, our calculations of the average compensation paid to all U.S. workers reflect employment data from the Bureau of Labor Statistics.
13

5,356
.6
5,386
.1
5,446
.9
5,511
.2
5,577
.9 11,20
5.7
11,28
4.5
11,43
6.4
11,57
8.9
11,71
0.6
0
2,000
4,000
6,000
8,000
10,000
12,000
14,000
2003 2004 2005 2006 2007
Core Copyright Industries Total Copyright Industries
Chart 5:
Chart 6:
$48,
701.
00
$50,
690.
80
$52,
633.
00
$54,
674.
50
$56,
817.
30
$63,
496.
00
$65,
553.
00
$68,
090.
00
$70,
923.
00
$73,
554.
00
$57,
679.
10
$59,
559.
10
$61,
798.
20
$64,
233.
80
$66,
498.
80
$0 $10,000 $20,000 $30,000 $40,000 $50,000 $60,000 $70,000 $80,000
2003 2004 2005 2006 2007
Total U.S. Compensation Core Copyright Industries Total Copyright Industries
u.s. Copyright industry Compensation per employee
u.s. Copyright industry employment (in thousands)
14

Chart 7a:
Chart 7b
1.10
1.15
1.20
1.25
1.30
1.35
2003 2004 2005 2006 2007
Ratio: Core Copyright Compensation to U.S. (private employees)
Ratio: Total Copyright Compensation to U.S. (private employees)
1.34 1.34 1.34 1.34 1.34
1.22 1.22 1.21 1.21 1.21
1.30 1.29 1.29 1.30 1.29
1.18 1.17 1.17 1.17 1.17
1.10
1.15
1.20
1.25
1.30
1.35
2003 2004 2005 2006 2007
Ratio: Core Copyright Compensation to U.S. (all employees)
Ratio: Total Copyright Compensation to U.S. (all employees)
u.s. Copyright industry ratios Compared to all u.s. employees
u.s. Copyright industry ratios Compared to priVate u.s. employees
15
V. u.s. Copyrighted materials in World markets
Chart 8: estimated reVenues generated By Foregin sales/exports oF seleCted u.s. Core Copyright industries
(in Billions oF Current dollars)
$0.00
$20.00
$40.00
$60.00
$80.00
$100.00
$120.00
$140.00
Pre Recorded Records, Tapes, Etc. Motion Pictures, TV, Video
Computer Software Newspapers, Books, Periodicals
2003 2004 2005 2006 2007
consumers in markets outside the u.S. continue to demand products that embody american creativity. copyright prod-ucts that are sold abroad may be manufactured in the u.S. or in foreign markets but, in either case, the creative com-ponents of those products are nurtured by the protection afforded under u.S. laws.
as noted in prior reports on these industries, we believe that the u.S. government’s statistics on “exports” of copy-right products generally fail to accurately measure the true value of american copyright works sold abroad. we recog-nize that, in recent years, efforts have been undertaken to improve the scope of the copyright product export statis-tics that are gathered in government surveys. for example, the u.S. census Bureau now reports “estimated export revenue for employer firms,” for a number of the copy-right industries, including the motion picture industry and the sound recording industry.11 however, these statistics are dwarfed by the actual foreign market sales figures that these industries themselves release. for example, the mo-tion picture association of america’s tabulation of the over-seas sales made by its member companies in 2007 exceeds motion picture “exports” by approximately 40%.12
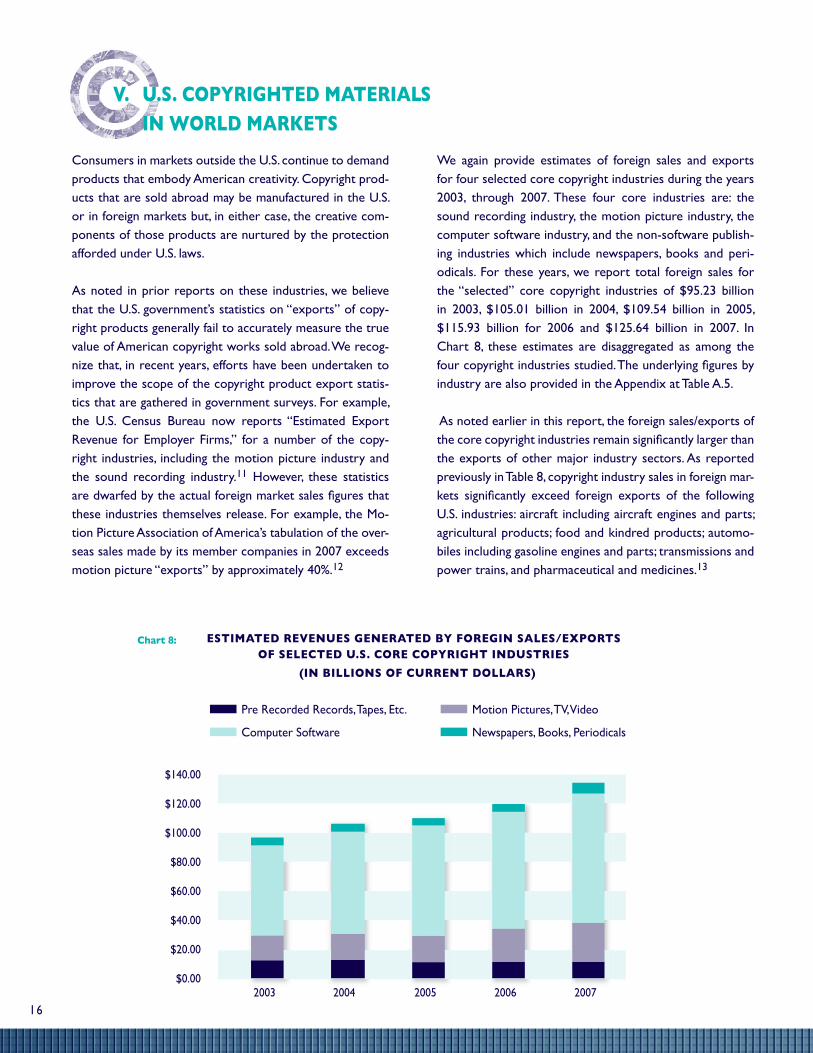
we again provide estimates of foreign sales and exports for four selected core copyright industries during the years 2003, through 2007. these four core industries are: the sound recording industry, the motion picture industry, the computer software industry, and the non-software publish-ing industries which include newspapers, books and peri-odicals. for these years, we report total foreign sales for the “selected” core copyright industries of $95.23 billion in 2003, $105.01 billion in 2004, $109.54 billion in 2005, $115.93 billion for 2006 and $125.64 billion in 2007. in chart 8, these estimates are disaggregated as among the four copyright industries studied. The underlying figures by industry are also provided in the appendix at table a.5.
as noted earlier in this report, the foreign sales/exports of the core copyright industries remain significantly larger than the exports of other major industry sectors. as reported previously in table 8, copyright industry sales in foreign mar-kets significantly exceed foreign exports of the following u.S. industries: aircraft including aircraft engines and parts; agricultural products; food and kindred products; automo-biles including gasoline engines and parts; transmissions and power trains, and pharmaceutical and medicines.13
16
Vi. ConClusion
11 See u.S. census Bureau, information Sector Services (naicS 51), estimated export revenue for employer firms: 1998 through 2004, table 3.0.3. 12 in 2007, the motion picture association reported that its all-media sales in non-u.S. markets reached $20.4 billion. in the same year, u.S. “exports” of motion pictures
and video productions were reported by the u.S. census Bureau as $14.6 billion. (see u.S. census Bureau, Services annual Survey, information industries, table 3.0.2.)13 in this report, u.S. exports by industry were taken from the international trade Statistics “censtats” data base at the u.S. census Bureau. export statistics by industry
were identified by NAICS code.
the u.S. copyright industries have consistently out-performed the rest of the u.S. economy, in terms of their real annual growth rates and their contributions to the overall growth of the u.S. economy as a whole. these industries also command large shares of u.S. gross domestic product and they employ millions of u.S. workers. in addition, the compensation paid to u.S. workers in the copyright industries consistently and substantially exceeds the average compensation level paid to u.S. workers as a whole. finally, the copy-right industries continue to play an increasingly promi-nent role in the growth of u.S. exports.
Value added in the copyright industries continues to grow. as of 2007, the value added by the core copy-right industries was $889.1 billion, approximately 6.44% of u.S. Gdp. in the same year, value added for the total copyright industries stood at $1.5 trillion ($1,525,110,000,000) or 11.05% of Gdp. in 2004, 2005, 2006 and 2007, the real annual growth rates achieved by both the core and total copyright industries were more than twice the real growth rates achieved by the u.S. economy as a whole. the copyright indus-tries have disproportionately contributed to real u.S. growth in a very positive way. in 2006-2007, the core copyright industries contributed 22.74% of the real growth achieved for the u.S. economy as a whole. in that same period, the total copyright industries contributed an astounding 43.06% of total real u.S. growth.
the u.S. core copyright industries now employ nearly 5.6 million workers while some 11.7 million people are employed by the total copyright industries. the annual compensation paid to core copyright workers exceeds the average annual compensation paid to all u.S. workers by 30%. the average compensation paid to employees of the total copyright industries ex-ceeds the u.S. average by 18%.
Sales of u.S. copyright products continue to expand in overseas markets. we estimate that total core copy-right sales in foreign markets exceeded $116 billion in 2006 and nearly $126 billion in 2007. the foreign sales of the copyright industries significantly exceed foreign sales of other u.S. industries including aircraft, automobiles, agricultural products, food and pharma-ceuticals.
these consistently positive trends solidify the status of the copyright industries as a key engine of growth for the u.S. economy as a whole. as new technolo-gies continue to support the development of new distribution methods for legitimate copyrighted prod-ucts, the u.S. copyright-based industries represented in the iipa remain optimistic that economic growth, combined with strong laws and effective enforcement, will continue to pave the way for economic growth in both the u.S. and global markets.
17

appendix a: taBles oF statistiCs
table a.1
table a.2
CORE COPYRIGHT VALUE ADDED AND CONTRIBUTION TO GROWTH IN U.S. GDP
(BILLIONS OF DOLLARS)
Nominal Value Added 2003 2004 2005 2006 2007Core $700.05 $757.65 $790.48 $837.28 $889.13U.S. GDP $10,960.80 $11,685.90 $12,421.90 $13,178.40 $13,807.50Share 6.39% 6.48% 6.36% 6.35% 6.44%
Real Value Added 2003 2004 2005 2006 2007Core $698.72 $765.88 $810.84 $858.28 $920.58U.S. GDP $10,301.00 $10,675.80 $10,989.50 $11,924.80 $11,523.90
Real Annual Growth Rate 2003-2004 2004-2005 2005-2006 2006-2007Core 9.61% 5.87% 5.85% 7.26%U.S. GDP 3.64% 2.94% 2.78% 2.03%
Contribution to Real U.S. Annual Growth 2003-2004 2004-2005 2005-2006 2006-2007Contribution 16.87% 12.95% 13.40% 22.74%Ratio to Share 2.60 2.04 2.11 3.53
Real Annual Growth by Period 2002-04 2002-05 2003-05Core 7.50% 7.31% 7.98%U.S. GDP 3.46% 3.48% 3.87%
TOTAL COPYRIGHT VALUE ADDED AND CONTRIBUTION TO GROWTH IN U.S. GDP
(BILLIONS OF DOLLARS)
Nominal Value Added 2003 2004 2005 2006 2007
Total Copyright $1,211.90 $1,305.95 $1,368.73 $1,454.27 $1,525.11U.S. GDP $10,960.80 $11,685.90 $12,421.90 $13,178.40 $13,807.50Share 11.06% 11.18% 11.02% 11.04% 11.05%
Real Value Added 2003 2004 2005 2006 2007
Total Copyright $1,272.79 $1,392.13 $1,499.63 $1,617.57 $1,745.58U.S. GDP $10,301.00 $10,675.80 $10,989.50 $11,924.80 $11,523.90
Real Annual Growth Rate 2003-2004 2004-2005 2005-2006 2006-2007
Total Copyright 9.38% 7.72% 7.86% 7.91%U.S. GDP 3.64% 2.94% 2.78% 2.03%
Contribution to Real U.S. Annual Growth 2003-2004 2004-2005 2005-2006 2006-2007
Contribution 28.49% 29.37% 31.19% 43.06%Ratio to Share 2.55 2.67 2.83 3.90
Real Annual Growth by Period 2002-04 2002-05 2003-05
Total Copyright 7.70% 7.66% 8.65%U.S. GDP 3.46% 3.48% 3.87%
18
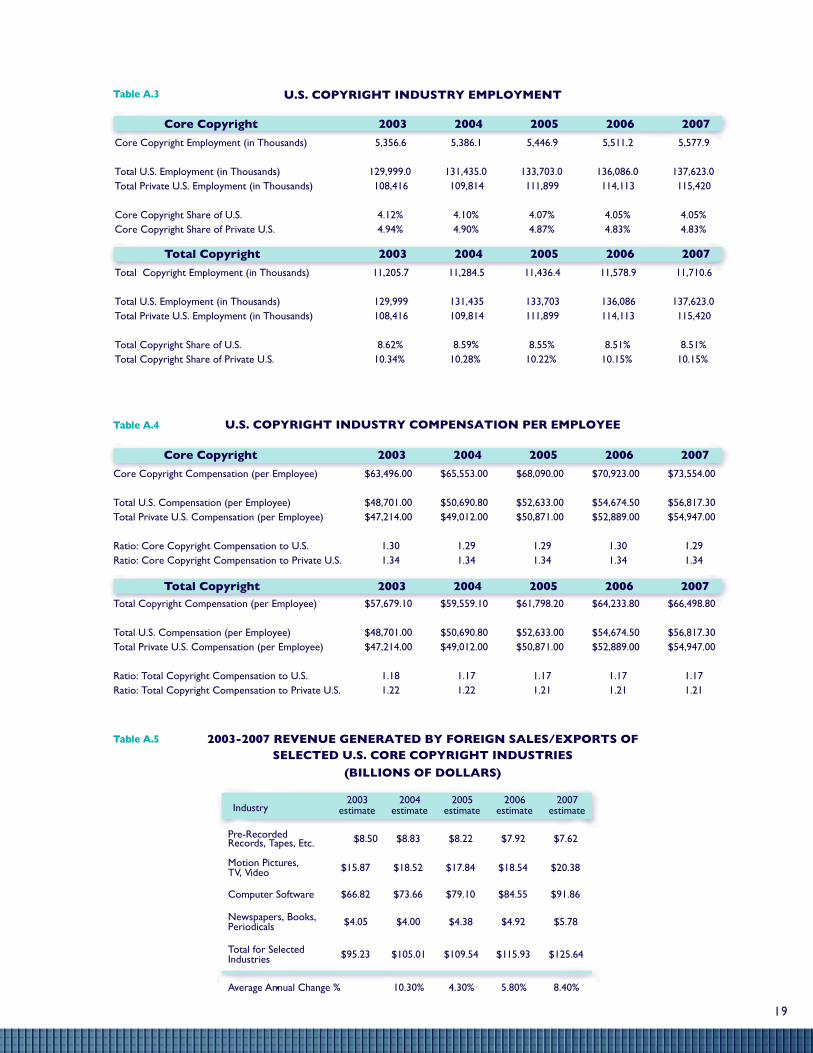
table a.3
table a.4
table a.5
19
2003 2004 2005 2006 2007Industry estimate estimate estimate estimate estimate
2003-2007 REVENUE GENERATED BY FOREIGN SALES/EXPORTS OFSELECTED U.S. CORE COPYRIGHT INDUSTRIES
(BILLIONS OF DOLLARS)
U.S. COPYRIGHT INDUSTRY COMPENSATION PER EMPLOYEE
Core Copyright 2003 2004 2005 2006 2007
Core Copyright Compensation (per Employee) $63,496.00 $65,553.00 $68,090.00 $70,923.00 $73,554.00
Total U.S. Compensation (per Employee) $48,701.00 $50,690.80 $52,633.00 $54,674.50 $56,817.30Total Private U.S. Compensation (per Employee) $47,214.00 $49,012.00 $50,871.00 $52,889.00 $54,947.00
Ratio: Core Copyright Compensation to U.S. 1.30 1.29 1.29 1.30 1.29Ratio: Core Copyright Compensation to Private U.S. 1.34 1.34 1.34 1.34 1.34
Total Copyright 2003 2004 2005 2006 2007Total Copyright Compensation (per Employee) $57,679.10 $59,559.10 $61,798.20 $64,233.80 $66,498.80
Total U.S. Compensation (per Employee) $48,701.00 $50,690.80 $52,633.00 $54,674.50 $56,817.30Total Private U.S. Compensation (per Employee) $47,214.00 $49,012.00 $50,871.00 $52,889.00 $54,947.00
Ratio: Total Copyright Compensation to U.S. 1.18 1.17 1.17 1.17 1.17Ratio: Total Copyright Compensation to Private U.S. 1.22 1.22 1.21 1.21 1.21
U.S. COPYRIGHT INDUSTRY EMPLOYMENT
Core Copyright 2003 2004 2005 2006 2007
Core Copyright Employment (in Thousands) 5,356.6 5,386.1 5,446.9 5,511.2 5,577.9
Total U.S. Employment (in Thousands) 129,999.0 131,435.0 133,703.0 136,086.0 137,623.0Total Private U.S. Employment (in Thousands) 108,416 109,814 111,899 114,113 115,420
Core Copyright Share of U.S. 4.12% 4.10% 4.07% 4.05% 4.05%Core Copyright Share of Private U.S. 4.94% 4.90% 4.87% 4.83% 4.83%
Total Copyright 2003 2004 2005 2006 2007
Total Copyright Employment (in Thousands) 11,205.7 11,284.5 11,436.4 11,578.9 11,710.6
Total U.S. Employment (in Thousands) 129,999 131,435 133,703 136,086 137,623.0Total Private U.S. Employment (in Thousands) 108,416 109,814 111,899 114,113 115,420
Total Copyright Share of U.S. 8.62% 8.59% 8.55% 8.51% 8.51%Total Copyright Share of Private U.S. 10.34% 10.28% 10.22% 10.15% 10.15%
$15.87 $18.52 $17.84 $18.54 $20.38
$66.82 $73.66 $79.10 $84.55 $91.86
$4.05 $4.00 $4.38 $4.92 $5.78
$95.23 $105.01 $109.54 $115.93 $125.64
10.30% 4.30% 5.80% 8.40%
PeriodicalsNewspapers, Books,
IndustriesTotal for Selected
Average Annual Change %
$8.50 $8.83 $8.22 $7.92 $7.62Pre-Recorded Records, Tapes, Etc.
TV, VideoMotion Pictures,
Computer Software
appendix B: Current and Constant dollar Value added By industry
as discussed in the body of this report, the u.S. Bu-reau of economic analysis (“Bea”) develops and pub-lishes annual statistics on current and constant dollar value added by industry. At this writing, these figures are available for two- and many three-digit naicS codes through 2007. these estimates of value added by industry sum to u.S. current dollar Gdp.
As defined in this report, the U.S. copyright industries are subsets of some (but not all) of the u.S. industry categories that are analyzed by the Bea. in table B.1, we report both the current and constant dollar value added estimates developed by Bea for selected u.S. industry categories in 2007. these industry categories represent the broad sectors from which the value added figures for the more narrowly defined copy-right industries are drawn.
in table B.1, both current dollar and constant dollar value added figures are presented. In many of these industry categories, the current dollar value is higher than the constant dollar value. for example, the cur-rent dollar value added to the u.S. economy by the miscellaneous manufacturing industry (naicS 339) in 2007 was $72.98 billion. once this value is converted to constant (2000) dollars however, the value added by the miscellaneous manufacturing industry falls to $70.82 billion. the real (constant dollar) value of this industry in 2007 was $2.16 billion lower than its cur-rent dollar value.
By contrast, other industries provide more value added in real terms than in current dollar terms. for example as shown in table B.1, the current dollar value added for the u.S. information sector (naicS 51) in 2007 was $586.27 billion. in the same year, the constant dollar value added for the same sector was $676.19 billion, or 15.3% higher.
for the u.S. industries in the information sector, the conversion from current dollar values to constant dollar values causes their measured value added to increase. assume for example, that in current dollars, the value added by a copyright industry had declined by 5% from $200 billion in 2006 to $190 billion in 2007. further assume that average prices for the products sold by this industry had also declined by 5% in the same period. dividing $190 billion by (1 - .05) or 0.95 yields $200 billion. This figure is the real value added by the industry in 2007. thus, in real terms, the industry’s value added did not decline from $200 bil-lion in 2006 to $190 billion in 2007. it actually stayed constant at $200 billion (zero % growth) in 2007.14
for a slightly more complicated example, assume that in current dollars, the value added by the copyright industry actually grew from $200 billion in 2006 to $209 billion in 2007. further assume, as before, that average prices for the products sold by this industry had declined by 5% in the same period. dividing $209 billion by (1-.05) yields $220 billion. As before, this fig-ure is the real value added by the industry in 2007. while the industry’s current dollar value added rose by 4.5% (from $200 to $209), its real value added in-creased by 10% (from $200 to $220).15
this increase may occur because these industries produce products for which prices are consistently falling. alternatively, the industries may be producing products for which nominal prices are not falling but in which quality and capabilities are increasing. in ei-ther case, society will be better off since either the quantity or the quality of the information services purchased by consumers has increased in “real” terms.
Because economists measure “real” economic growth using constant dollar estimates, these industry charac-teristics are quite significant. For industries, like those
14 if the industry had sold 100 units at $2.00 per unit in 2006 and 100 units at $1.90 per unit in 2007, its current dollar sales would decline from $200 in 2006 to $190 in 2007. nevertheless, the industry’s unit sales in 2007 did not decline in 2007 but remained constant at 100 units.
15 in this example, the industry’s unit sales would rise by 10% from 100 units in 2006 to 110 units in 2007.
20
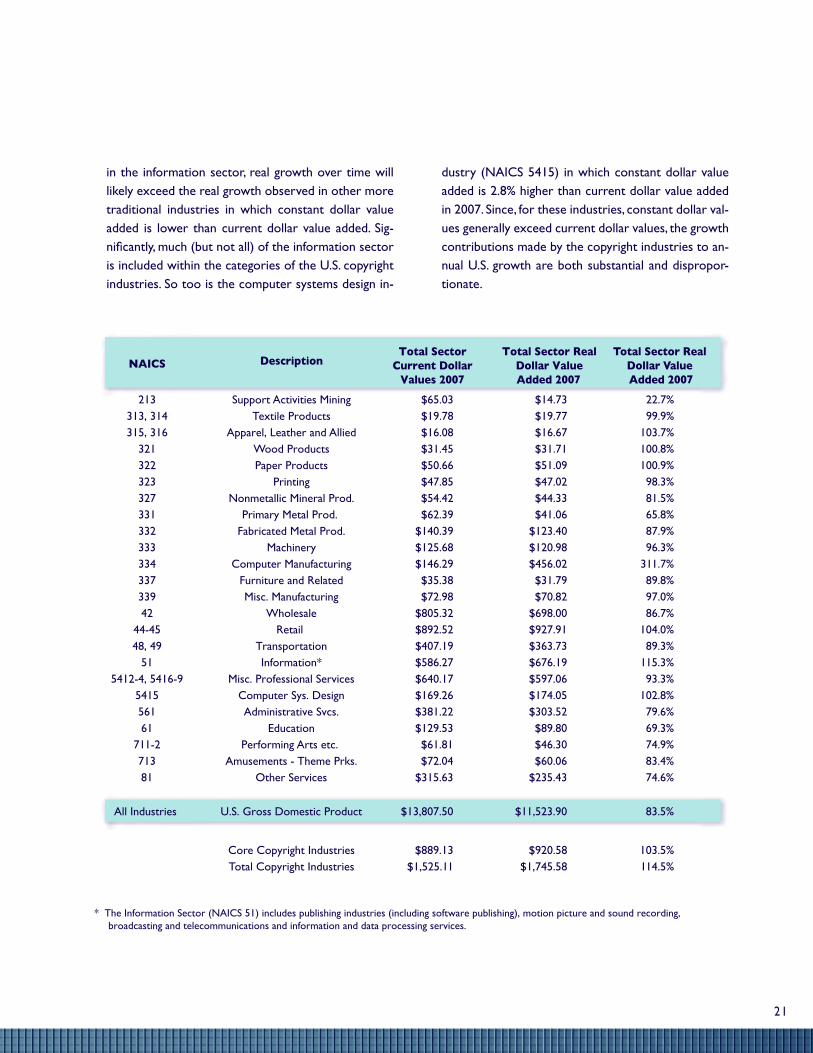
in the information sector, real growth over time will likely exceed the real growth observed in other more traditional industries in which constant dollar value added is lower than current dollar value added. Sig-nificantly, much (but not all) of the information sector is included within the categories of the u.S. copyright industries. So too is the computer systems design in-
dustry (naicS 5415) in which constant dollar value added is 2.8% higher than current dollar value added in 2007. Since, for these industries, constant dollar val-ues generally exceed current dollar values, the growth contributions made by the copyright industries to an-nual u.S. growth are both substantial and dispropor-tionate.
NAICS DescriptionTotal Sector
Current Dollar Values 2007
Total Sector Real Dollar Value Added 2007
Total Sector Real Dollar Value Added 2007
213 Support Activities Mining $65.03 $14.73 22.7%313, 314 Textile Products $19.78 $19.77 99.9%315, 316 Apparel, Leather and Allied $16.08 $16.67 103.7%
321 Wood Products $31.45 $31.71 100.8%322 Paper Products $50.66 $51.09 100.9%323 Printing $47.85 $47.02 98.3%327 Nonmetallic Mineral Prod. $54.42 $44.33 81.5%331 Primary Metal Prod. $62.39 $41.06 65.8%332 Fabricated Metal Prod. $140.39 $123.40 87.9%333 Machinery $125.68 $120.98 96.3%334 Computer Manufacturing $146.29 $456.02 311.7%337 Furniture and Related $35.38 $31.79 89.8%339 Misc. Manufacturing $72.98 $70.82 97.0%42 Wholesale $805.32 $698.00 86.7%
44-45 Retail $892.52 $927.91 104.0%48, 49 Transportation $407.19 $363.73 89.3%
51 Information* $586.27 $676.19 115.3%5412-4, 5416-9 Misc. Professional Services $640.17 $597.06 93.3%
5415 Computer Sys. Design $169.26 $174.05 102.8%561 Administrative Svcs. $381.22 $303.52 79.6%61 Education $129.53 $89.80 69.3%
711-2 Performing Arts etc. $61.81 $46.30 74.9%713 Amusements - Theme Prks. $72.04 $60.06 83.4%81 Other Services $315.63 $235.43 74.6%
All Industries U.S. Gross Domestic Product $13,807.50 $11,523.90 83.5%
Core Copyright Industries $889.13 $920.58 103.5%Total Copyright Industries $1,525.11 $1,745.58 114.5%
* The Information Sector (NAICS 51) includes publishing industries (including software publishing), motion picture and sound recording, broadcasting and telecommunications and information and data processing services.
21
appendix C: measuring ContriButions to real annual groWth in u.s. gdp
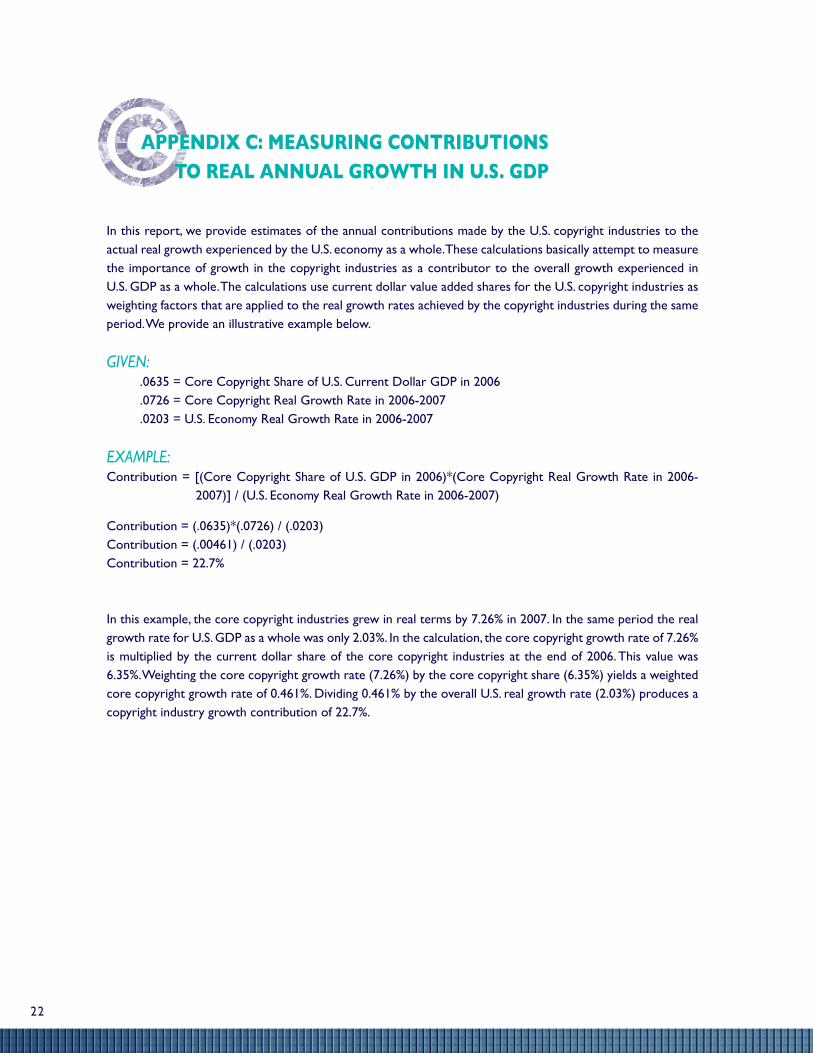
in this report, we provide estimates of the annual contributions made by the u.S. copyright industries to the actual real growth experienced by the u.S. economy as a whole. these calculations basically attempt to measure the importance of growth in the copyright industries as a contributor to the overall growth experienced in u.S. Gdp as a whole. the calculations use current dollar value added shares for the u.S. copyright industries as weighting factors that are applied to the real growth rates achieved by the copyright industries during the same period. we provide an illustrative example below.
gIVEn: .0635 = core copyright Share of u.S. current dollar Gdp in 2006 .0726 = core copyright real Growth rate in 2006-2007 .0203 = u.S. economy real Growth rate in 2006-2007
ExAmPlE:contribution = [(core copyright Share of u.S. Gdp in 2006)*(core copyright real Growth rate in 2006-
2007)] / (u.S. economy real Growth rate in 2006-2007)
contribution = (.0635)*(.0726) / (.0203)contribution = (.00461) / (.0203)contribution = 22.7%
in this example, the core copyright industries grew in real terms by 7.26% in 2007. in the same period the real growth rate for u.S. Gdp as a whole was only 2.03%. in the calculation, the core copyright growth rate of 7.26% is multiplied by the current dollar share of the core copyright industries at the end of 2006. this value was 6.35%. weighting the core copyright growth rate (7.26%) by the core copyright share (6.35%) yields a weighted core copyright growth rate of 0.461%. dividing 0.461% by the overall u.S. real growth rate (2.03%) produces a copyright industry growth contribution of 22.7%.
22
appendix d: list oF reFerenCes
u.S. department of commerce, u.S. census Bureau, “2007 Service Annual Survey,” 2004-2007.
u.S. department of commerce, u.S. census Bureau, “2003 Service Annual Survey,” 2003.
forrester research, inc., press release, “global IT Purchases will decline in 2009,” January 13, 2009.
Business Software alliance and idc Global Software, Fifth Annual bSA and IdC global Software Piracy Study, 2003-2007.
motion picture association, “Total International All media Revenue (mPA member Companies only),” 2003-2007.
international federation of the phonographic industry (ifpi), Recording Industry in numbers – 2007, 2002-2006.
international federation of the phonographic industry (ifpi), press release, “Recorded music Sales 2007,” 2007.
international federation of the phonographic industry (ifpi), digital music Report 2009, 2004-2008.
u.S. department of commerce, u.S. census Bureau, U.S. International Trade Statistics, 2006-2007.
lindberg, Brian m. and monaldo, Justin m., “Annual Industry Accounts: Advanced Statistics on gdP by Industry for 2007,” Survey of current Business, may 2008.
kim, Soo Jeong, davis, Vincent a., Jacobson, anna m. and lyndaker, amanda, “Annual Industry Accounts: Revised Statistics for 2005-2007,” Survey of current Business, december 2008.
u.S. department of commerce, Bureau of economic analysis. “gross domestic Product-by-Industry Accounts,” 2002-2007, www.bea.gov/bea/industry/gpotables.
u.S. department of labor, Bureau of labor Statistics, “Current Employment Statistics”, http://data.bls.gov/PdQ/servlet/Survey/outputServlet.
world intellectual property organization, guide on Surveying the Economic Contribution of the Copyright-based Industries, wipo publication no. 893(e), iSBn 92-805-1225-7.
23

the 2003 - 2007 report
Copyright industries
in the u.s. eConomy
By stephen e. siwek prepared for the
eConomists inCorporated international intelleCtual property allianCe
the international intellectual property alliance® (iipa®)
2101 l street nw, suite 1000
washington, dC 20037
united states of america
tel: 202.833.4198 fax: 202.331.3101
web: www.iipa.com email: [email protected]
Copyright industries in the u.s. eConomy:
the 2003-2007 report
ISBN 978-0-9634708-5-0 ®