The Economic Contribution of Copyright-Based Industries · PDF fileThe Economic Contribution...
78
The Economic Contribution of Copyright-Based Industries in South Africa The Economic Contribution of Copyright-Based Industries in South Africa
Transcript of The Economic Contribution of Copyright-Based Industries · PDF fileThe Economic Contribution...

The Economic Contribution of Copyright-Based Industries in
South Africa
The Economic Contribution of Copyright-Based Industries in South Africa

The E
cono
mic C
ontri
butio
n of
Copy
right
-Bas
ed In
dustr
ies i
n Sou
th A
frica
WORLD INTELLECTUAL PROPERTY ORGANIZATION (WIPO)IN COOPERATION WITH THE REPUBLIC OF SOUTH AFRICA
Prof. Anastassios Pouris andMrs Roula Inglesi-Lotz
2011
Institute for Technological InnovationUniversity of Pretoria
Department of Trade and
Industry Ministry

The Economic Contribution of Copyright-Based Industries in South Africa
1
Ta b l e o f C o n t e n t s
Foreword 4
Executive Summary 5
1. IntroductIon 10
2. copyrIght In South AFrIcA 12
2.1 TheSouthAfricanFilmandTelevisionIndustryReport 15
2.2 TheSouthAfricanPublishingIndustryReport 16
2.3 TheSouthAfricanMusicIndustry 16
3. IntErnAtIonAl StudIES: EStImAtIng thE EconomIc contrIbutIon oF copyrIght-bASEd InduStrIES 18
4. mEthodology 22
5. thE contrIbutIon oF copyrIght-bASEd InduStrIES to thE South AFrIcAn Economy 25
5.1 ThePerformanceofCopyright-BasedIndustries 25
5.2 ComparisonwithOtherEconomicSectors 30
5.3 CoreCopyright-BasedIndustries 32
5.4 InterdependentCopyright-BasedIndustries 36
5.5 PartialCopyright-BasedIndustries 40
5.6 Non-DedicatedCopyright-BasedIndustries 44
6. dIScuSSIon 47
6.1 CopyrightinTrade 48
6.2 Recommendations 52
AppEndIx 1 54
AppEndIx 2 IntErnAtIonAl StudIES dAtA 55
AppEndIx 3 clASSIFIcAtIon oF InduStrIES 61
AppEndIx 4 Input-output multIplIErS 66

The E
cono
mic C
ontri
butio
n of
Copy
right
-Bas
ed In
dustr
ies i
n Sou
th A
frica
2
Ta b l e s
table A: RealValue-Added,Employment,ExportsandImportsforallCopyright-BasedIndustriesfor2008 7
table b: Production-InducedEffectofCopyright-BasedIndustries(Input-Output2009) 8
table 1: Copyright-BasedIndustriesUsedintheSouthAfricanStudy 22
table 2: SouthAfricanCopyrightFactors 23
table 3: RealValue-Added,Employment,ExportsandImportsforallCopyright-BasedIndustriesfor2008 26
table 4A: Value-Added,Employment,ImportsandExportsGrowthofCopyright-BasedIndustriesin%1970to2008 27
table 4b: Copyright-BasedIndustriestoValue-Added,Employment,ImportsandExports:1970to2008 29
table 5: Value-Added,Employment,ImportsandExportsGrowthofCoreCopyright-BasedIndustriesin%1970to2008 32
table 6: Value-Added,Employment,ImportsandExportsGrowthofInterdependentCopyright-BasedIndustriesin%from1970to2008 36
table 7: Value-Added,Employment,ImportsandExportsGrowthofPartialCopyright-BasedIndustriesin%1970to2008 40
table 8: Value-Added,Employment,ImportsandExportsGrowthofNon-DedicatedSupportCopyright-BasedIndustriesin%1970to2008 44
table 9: Production-InducedEffectofCopyright-BasedIndustries(Input-Output2009) 47
table 10: TradeinCopyrightDependentGoods 50
table 11: PaymentsandReceiptsinCopyrightServices 52
table 12: HighestandLowerPiracyRatesInternationally 54
table 13: SummaryofSelectedStudies:ContributionoftheCoreCopyright-BasedIndustries 56
table 14: SummaryofSelectedStudies:ContributionofInterdependentCopyright-BasedIndustries 57
table 15: SummaryofSelectedStudies:ContributionofPartialCopyright-BasedIndustries 58
table 16: SummaryofSelectedStudies:ContributionofNon-DedicatedSupportCopyright-BasedIndustries 59
table 17: InternationalStudies:CopyrightFactors 59
table 18: CategoriesofCoreCopyright-BasedIndustries 61
table 19: CategoriesofInterdependentCopyright-BasedIndustries 62
table 20: CategoriesofPartialCopyright-BasedIndustries 63
table 21: CategoriesofNon-DedicatedCopyright-BasedIndustries 64
table 22: OutputMultipliers2009 68
table 23: IncomeMultipliers2009 70
table 24: EmploymentMultipliers2009 72
table 25: ImportMultipliers2009 74
The Economic Contribution of Copyright-Based Industries in South Africa
3
F i g u r e s
Figure A: ContributionofCopyright-BasedIndustriestotheSouthAfricanEconomyin2008 6
Figure b: EvolutionofContributionofCopyright-BasedIndustriestoTotalValue-Added,Employment,ImportsandExports 7
Figure 1: InternationalPropertyRightsIndex:RankingbyQuintiles2008 14
Figure 2: InternationalContributionofCopyright-BasedIndustries(GDPandEmployment)WIPOSupportedStudies 19
Figure 3: ContributionofCopyright-BasedIndustriesinEuropeanCountries 20
Figure 4: ContributionofCopyright-BasedIndustriesin2008 25
Figure 5: EvolutionofContributionofCopyright-BasedIndustriestoTotalValue-Added,Employment,ImportsandExports 28
Figure 6: Value-AddedContribution:ComparisonwithOtherSectors–2008 30
Figure 7: EmploymentContribution:ComparisonwithOtherSectors–2008 31
Figure 8: ImportsContribution:ComparisonwithOtherSectors–2008 31
Figure 9: ExportsContribution:ComparisonwithOtherSectors–2008 32
Figure 10: CoreCopyright-BasedIndustries:ContributiontoTotalValue-Added 34
Figure 11: TotalCoreCopyright-BasedIndustries:ContributiontoEmployment 35
Figure 12: CoreCopyright-BasedIndustries:ContributiontoImportsandExports 36
Figure 13: InterdependentCopyright-BasedIndustries:ContributiontoValue-Added 38
Figure 14: InterdependentCopyright-BasedIndustries:ContributiontoEmployment 39
Figure 15: InterdependentCopyright-BasedIndustries:ContributiontoImportsandExports 40
Figure 16: PartialCopyright-BasedIndustries:ContributiontoValue-Added 42
Figure 17: PartialCopyright-BasedIndustries:ContributiontoEmployment 43
Figure 18: PartialCopyright-BasedIndustries:ContributiontoImportsandExports 43
Figure 19: Non-DedicatedCopyright-BasedIndustries:ContributiontoValue-Added 45
Figure 20: Non-DedicatedCopyright-BasedIndustries:ContributiontoEmployment 46
Figure 21: Non-DedicatedCopyright-BasedIndustries:ContributiontoImportsandExports 46
Figure 22: SouthAfricaPrinting,PublishingandRecordedMediaExports:SharetoTotalExports 49
Figure 23: SouthAfricaPrinting,PublishingandRecordedMediaImports:SharetoTotalImports 50
Figure 24: TradeBalance:SouthAfricaPrinting,PublishingandRecordedMedia1970to2008 51

The E
cono
mic C
ontri
butio
n of
Copy
right
-Bas
ed In
dustr
ies i
n Sou
th A
frica
4
F o r e w o r d
by Dr. Rob Davies, Minister of Trade and Industry
In 2010 the Department of Trade and Industry (the DTI) commissioned a study through theWorld Intellectual Property Organization (WIPO). The research study would indicate whetherthereareanybenefitscomingfromcopyright-basedindustries inSouthAfrica.The reasonforcommissioning these studieswas solelybasedon the fact thatSouthAfricawants toaccedeto treaties in theareaofcopyrightandtheSouthAfricanParliament indicatedthatbeforeanytreaty couldbeacceded to thecountryneeds toknowwhatbenefits come from these treatiesasbecomingasignatorytoatreatyentailsattractingobligationsandamendingthelegislation.
WiththefinalreportofthestudiesbeingsubmittedbyWIPO,Iamoftheviewthat:
ThestudiesgiveaclearindicationonwhetherornotthereisanybenefitforSouthAfricainjoiningornotjoininginternationaltreaties.
• ItisclearthatSouthAfricashouldimproveitsinternalcopyrightlegislationasitisoverthreedecades-old.
• ThemethodologyusedinconductingthestudyisnotdisputedbytheDTI.• TheabsenceofdatafromStatisticsSouthAfricaisproblematicespeciallywiththereliance
ondata fromprivatelymanageddatabasesmaybemisleadingasthisdatahasnotbeenproventobereliable.
• The treatment of Intellectual Property (IP) as a non-sector renders the recognition ofcopyrightasasub-sectorofIPnon-existentorsterile.
Notwithstandingtheabove:
• Thereport isaneyeopener. Itwillassistthecountry intreating IPasasectorandthiswillbejudgedbyitscontributiontotheeconomyaslaidoutinthereport.
• This is an indictment to the state to put systems in place that will assist in improving thecontributionofcopyright/IPtotheGrossDomesticProduct.
• StatisticsSouthAfrica,theSouthAfricanRevenueServicesandprivatelyownedassociationsthatcollectdataonIPshouldstriveforperfect/properdatagatheringinthissector.
• The report enables the state toallow innovation in tradeandeducationaswell asprofitmakingandthedevelopmentofincentiveschemesintheareaofcopyrighte.g.filmandmusicandtoallowlimitationsandexceptions.
Itismyviewthatwhenallisdone,therewillbeeconomicgrowth,jobcreationandrespectforIPasitcontributestothesocialgood.InregardstotheaboveitisinthebestinterestoftheDTItonotethefindingsofthestudy.
ThepublicationofthefindingsofthisstudyrepresentsaveryimportantmilestoneforSouthAfricaas it clearly indicates theareasweneed to improveon in termsoflegislationontheprotectionandenforcementofcopyright.
It is with great pleasure therefore that I present to you the findings of the commissioned study on“Benefits coming from Copyright-Based Industries”. TheDTI and relevant stakeholders willengageinaconsultativeprocessthatwillconsidertherecommendations.
January4th,2012

The Economic Contribution of Copyright-Based Industries in South Africa
5
E x e c u t i v e S u m m a r y
The creation of new knowledge in a competitive economy is dependent to a significant extent on theprotectionoftheintellectualproperty(WIPO,20041).Copyrightlawshouldbeeffectiveinpromotingandencouragingthecreationofandinvestmentincreativeworks.
Copyrightlawprotectsspecificexpression,notgeneralideas,andappliestoliterary,artistic,dramaticandmusicalworks,soundrecordings,broadcastsandfilms.Copyrightlawprotectsthewayinwhichtheworkisexpressed,ratherthantheideabehindthework.DanBrown’sThe Da Vinci Code(2003)2wasrecentlyfoundnottohaveinfringedthecopyrightofanearlierbookwhichcontainedmanyofthetheoriesfoundinThe Da Vinci Code.Drawingonideasofothercopyrightedworksdoesnotinfringethosecopyrights.
Industriesbasedoncopyrightandrelatedrightsarebelievedtohaveconsiderableimpactonthenationaleconomies.However,measuringtheir relevantcontribution isonlya recentphenomenon.ThisdocumentreportsanefforttoestimatethecontributionofthecopyrightindustriesinSouthAfrica.TheinvestigationhasbeenrequestedbythegovernmentofSouthAfrica(DepartmentofTradeandIndustry(DTI))withfinancialandtechnicalsupportfromWIPOandinlightoftheincreasingimportanceofcopyrightgoodsandservicestothecountry’seconomy.ItisimportanttoemphasisethatthisinvestigationisthefirstusingWIPO-basedmethodologytobeconductedinSouthAfricaandthesecond,afterKenya,tobecompletedintheAfricaregion.
Itisexpectedthattheresultsoftheinvestigationwillproviderobustdataontheactualeconomiccontributionofthecopyright-basedactivities,whichcanserveasabasisforadjustingpoliciesandstrategiesaimedatpromotinggrowthanddevelopmentinthecountry’scopyright-basedsectors.
Similarinvestigationsquantifyingtheeconomiccontributionofthecopyright-basedindustriesofdevelopedanddevelopingeconomiesindicatetheimportanceoftheseindustries.Thetotaleconomiccontributionofcopyright-basedindustriesasapercentagetoGDPvariesfrom2.81%inBulgariato11.70%inPhilippines.Similarly the indicator ratio of persons employed in the copyright-based sector to the total number ofemployeesintheeconomyvariesfrom3.03%inJamaicato11.17%inLatvia.
TheresultsofthisinvestigationindicatethattheindicatorsfortheSouthAfricancopyright-basedindustriesfallwithintheoverallrangeoftheinternationalstudies,albeitinthelowrange.TheSouthAfricancopyright-basedindustriescontributiontoGDPis4.11%andtoemployment4.08%.Neverthelesstheresultsofthisstudyshowthattheoverallcontributionofthecopyright-basedindustriesissubstantialenoughtostipulateincreasedattentionbytheSouthAfricanpolicy-makers.FigureApresentstheoverallcontributionofcopyright-basedindustriesinSouthAfricain2008withregardtotheirvalue-added,employment,importsandexports.
1WorldIntellectualPropertyOrganization(WIPO),2006“National Studies on Assessing the Economic Contribution of the Copyright-Based Industries No1: the economic contribution of copyright-based industries.”WIPO:Switzerland.Countries:Latvia(2000),Singapore(2004),Canada(2004),Hungary(2005).
2BrownD.(2003)“The Da Vinci Code”,Doubleday,USA.

The E
cono
mic C
ontri
butio
n of
Copy
right
-Bas
ed In
dustr
ies i
n Sou
th A
frica
6
Figure A: Contribution of Copyright-Based Industries to the South African Economy in 2008
Source:Authors’calculationswithdatafromtheDepartmentofLabour(DoL),theDepartmentofArtsandCulture(DAC),Quantecdatabases,theSouthAfricanReserveBank(SARB)andtheSouthAfricanRevenueService(SARS).
In 2008, with regards to value-added, the copyright-based industries in total are responsible for almost4.11%ofthetotaleconomy,withthecorecopyright-basedindustriesbeingthehighestcontributor(2.05%)andthenon-dedicatedcopyright-basedfollowingwith1.29%.Asfarasemploymentisconcerned,4.08%oftheworkforceisemployedinthecopyright-basedindustries,themajorityofwhichisemployedinthecoreand non-dedicated copyright-based industries (2.31% and 1.03%). The interdependent copyright-basedindustriesshowahighcontributionintheexportsoftheeconomy(2.77%)andanevenhighercontributiontothetotalimports(7.85%).
Apart from the high growth of the specific industries’ value-added, their contribution also presented asignificantincreaseuntilthe1980s.Fromthatpointonwards,thetrendvariedlittlemovingintherangefrom4to4.5%(figureB).

The Economic Contribution of Copyright-Based Industries in South Africa
7
Figure B: Evolution of Contribution of Copyright-Based Industries to Total Value-Added, Employment, Imports and Exports
Source:Authors’calculationswithdatafromtheDepartmentofLabour(DoL),theDepartmentofArtsandCulture(DAC),Quantecdatabases,theSouthAfricanReserveBank(SARB)andtheSouthAfricanRevenueService(SARS).
Thepercentageofworkforceemployedinthecopyright-basedindustriestothetotalhasalmostdoubledintheperiodfrom1970to2008,fromlessthan2%atthebeginningoftheperiodtoalmost4%in2008(figureB).Thecopyright-based industrieswereresponsibleforaround8to10%ofthecountry’s imports(figureB),presentingaspikein1983butcomingbackintherangeafterwards.Thesector’sexportsshowedasignificantrisesincetheendofthe1980s.
TableApresents the valuesof all the copyright-based sectors examined in this study for four indicators:realvalue-added,employment,exportsand imports,after the implementationofcopyright factors in thecalculations.
Table A: Real Value-Added, Employment, Exports and Imports for all Copyright-Based Industries for 2008
Year 2008
Real value-added
Employment Exports Imports
R millions (2005=100)
Number of employees
R millions (2005=100)
R millions (2005=100)
TOTAL ECONOMY 1,620,139 10,376,881 495,382 572,354
Total CBI 66,101 422,974 20,168 48,051Core Copyright-Based Industries 32,670 239,959 1,954 2,359Printing, Publishing and Recorded Media 7,588 53,465 790 2,009Film and Television Industry 6,811 30,899 – –Photography, Software and Databases, Advertising 18,271 155,595 1,165 350Interdependent Copyright-Based Industries 9,091 52,620 13,745 43,324Photographic and Cinematographic Instruments 15 – – –

The E
cono
mic C
ontri
butio
n of
Copy
right
-Bas
ed In
dustr
ies i
n Sou
th A
frica
8
Table A: Real Value-Added, Employment, Exports and Imports for all Copyright-Based Industries for 2008 (Continued)
Television, Radio and Communication Equipment 944 2,632 994 9,557Computers and Equipment, Photocopiers 5,442 40342 11,138 33,767Paper and Paper Products 2705.55 9646 1,612 1,595Partial Copyright-Based Industries 3,426 23,879 1,767 1,321Apparel, Textiles and Footwear 45 472 8 72Furniture and Other Manufacturing 2,418 9,405 1,755 1,237Crafts 949 13,938 – –Glass and Glass Products 14 63 3 11Non-Dedicated Copyright-Based Industries 20,913 106,516 2,702 1,046General Wholesale and Retailing 11,685 85,796 1,049 5Transport, Storage and Communication 9,229 20,720 1,654 1,041
Source:Authors’calculationswithdatafromtheDepartmentofLabour(DoL),theDepartmentofArtsandCulture(DAC),Quantecdatabases,theSouthAfricanReserveBank(SARB)andtheSouthAfricanRevenueService(SARS).
ThisstudyusesacompleteInput-Output(I-O)analysiscalculatingmultiplierstoshownotonlythedirecteffectsofthecopyright-basedindustriesbutalsotheirindirecteffectstotheeconomy’soutput,income,employmentandimports.Theresults,aspresentedintableAandindetailinappendix4,depictsignificanteffectsofthecorecopyright-basedindustriestotheabove-mentionedindicatorswiththeexceptionofimports.Thetotaldirecteffect(contribution)ofthecopyright-basedindustries intermsofvalue-addedis4.11%whiletheirtotal3indirecteffect(contribution)intermsofoutputwouldbe5.49%(production-inducedeffect4).Ontheotherhand,withregardstoemployment,thetotaldirecteffectis4.08%,whileitsproduction-inducedeffect(contribution)wouldbe14.52%(sumofthefirst-roundandtheindustrialsupporteffects).5
Table B: Production-Induced Effect of Copyright-Based Industries (Input-Output 2009)
IndustryProduction-
induced effect
Adjusted for
copyright factors
Production-induced effect
Adjusted for
copyright factors
Outcome EmploymentCommunication 1.18% 1.18% 2.73% 2.73%
Crafts* 0.76% 0.04% 2.87% 0.16%
Film and television* 1.60% 0.67% 2.98% 1.25%
Footwear 2.08% 2.08% 6.23% 6.23%
Furniture 1.93% 0.01% 6.48% 0.03%
Glass and glass products 1.49% 0.15% 4.89% 0.49%
Computers and equipment/ photocopiers 1.70% 0.00% 4.93% 0.00%
Other manufacturing 1.23% 0.43% 3.65% 1.28%
Photography/ Software and Databases/ Advertising 1.13% 0.00% 2.97% 0.00%
Paper and paper products 2.02% 0.50% 5.77% 1.44%
Printing, publishing and recorded media 1.79% 1.79% 5.17% 5.17%
3Itshouldbenotedthattheanalysisoftheindirecteffectincludesallthecopyright-basedindustriesexceptfor‘filmandtelevision’and‘crafts’forwhichwemadeappropriateassumptions.
4Production-inducedeffectisthecombinationoffirst-roundandindustrialsupporteffects.First-roundeffectishowmuchanindustrymustincreaseitsinputsfromotherindustriesandfromitself,inordertoproduceanextraunitofoutputtomeetaZAR1.00increaseinfinaldemand.Industrialsupporteffectishowmuchotherindustrieswillneedtoincreasetheirpurchasestoexpandtheiroutputtomeetthefirst-roundrequirements.
5Input-Outputanalysisportraystheresultsofachangeinthewholeeconomyuntilequilibriumisrestoredagain.Thetimeperiodisnotdetermined.

The Economic Contribution of Copyright-Based Industries in South Africa
9
Table B: Production-Induced Effect of Copyright-Based Industries (Input-Output 2009) (Continued)
Television, radio and communication equipment 1.64% 0.57% 4.75% 1.66%
Textiles 1.81% 0.01% 6.05% 0.02%
Transport and storage 1.19% 0.07% 3.02% 0.17%
Wearing apparel 1.59% 0.01% 6.19% 0.02%
Wholesale and retail trade 1.00% 0.06% 2.63% 0.15%
Total 7.56% 20.81%
Where*denotesindustrieswithfiguresbyextrapolation.Source:Authors’calculationswithdatafromtheSupplyandUseTables(SUT)ofStatisticsSouthAfrica(StatsSA).
Anexampleisthe‘printing,publishingandrecordedmedia’–oneofthemostinfluentialcopyright-basedindustries:althoughitsdirecteffect(contribution)tototalvalue-addedwouldbe0.47%,itsindirecteffectwouldbe1.8%(production-inducedeffect).Thesameindustry’sdirecteffect(contribution)toemploymentis0.52%whileitsindirecteffectwouldbe5.17%.Themultiplierswillassistthepolicymakerstoevaluatetheimpactofpromotingcopyright-basedindustries.
Ifappropriatepoliciesareimplementedresultinginanincreaseofthedemandforproducts,forinstanceofthesamesectorasinthepreviousexample‘printing,publishedandrecordedmedia’,aseriesoflinkswilloccuraffecting,throughindividualsectors,theeconomyinitsentirety.Ifthedemandfor‘printing,publishedand recordedmedia’products increasesbyZAR100,000 the industrymust increase its inputs fromotherindustriesandfromitselfbyR69,000(first-roundeffectsmultiplier).
Anincreaseinthe‘printing,publishedandrecordedmedia’industrywillalsoinfluenceothersectorsintheeconomy.Amongthe inputsthat ‘printing,publishedandrecordedmedia’willneed inordertomeetanincreaseinthedemandisforexamplesomeformofenergy, i.e.electricity.Tocoverthenewdemandforitsproduct,thesector‘electricity,gasandsteam’willhavetoincreasetheir inputsbyZAR0.465foreveryZAR1.00ofdemand.Similareffectswillbeexperiencedwiththeemploymentandtradeofthesectorswhicharetryingtomeettheincreaseddemand,theywillaffectvariousotherindustriesbyaskingforinputs.
During the process of our investigation a number of questions were raised which lead to a number ofrecommendationsattheendofthestudy.Indicatively,itissuggestedthatWIPOshouldidentifyinternationalbestpractice inthepromotionofcopyright-based industriesanddisseminatethe informationtomemberstates.Also,itisproposedthattheDepartmentofTradeandIndustry(DTI)andtheDepartmentofArtsandCulture(DAC)requestfromStatisticsSAandtheReserveBanktoseparatethestatisticsrelatedtocopyright-based industriesandpublishthemregularly.Amongothers, it isalsoadvisablethatDTIshoulddeveloparesearchprogrammesupportingresearcher initiatedprojectsrelatedto IntellectualPropertyRights (IPR) ingeneralandcopyrightinparticular.

The E
cono
mic C
ontri
butio
n of
Copy
right
-Bas
ed In
dustr
ies i
n Sou
th A
frica
10
1 . I n t r o d u c t i o n
Copyrightexiststoencouragethecreationof,andinvestmentin,creativeworks.Itprotectsspecificexpression,notgeneralideas,andappliestoliterary,artistic,dramaticandmusicalworks,soundrecordings,broadcastsandfilms.Copyrightlawprotectsthewayinwhichtheworkisexpressed,ratherthantheideabehindthework,e.g.in2006acourtintheUnitedKingdomruledthatDanBrown’sThe Da Vinci Code(2003)6didnotinfringethecopyrightofanearlierbook,TheHolyBloodandtheHolyGrail,whichcontainedsomeofthetheoriesfoundinThe Da Vinci Code.Drawingonideasofothercopyrightedworksdoesnotinfringethosecopyrights.
Copyright rights are inextricably linked to limitations7, exceptions8 and “compulsory” or “obligatory”licences9.Limitations,exceptionsandlicencesexistinordertofacilitateconsumeraccess,theuseforsociallydesirablepurposesandtoencouragefurthercreativity.
TheWorldIntellectualPropertyOrganization10states“thejuridicalandpolicybasisforeachkindofprovisionisdifferent.The limitationsproceedontheassumptionthatthereareclearpublicpolicygroundsandthatcopyrightprotectionshouldnotexistintheworksinquestion,forexamplebecauseoftheimportanceoftheneedforreadyavailabilityofsuchworksfromthepointofviewofthegeneralpublic.Theexceptionsrepresentamorelimitedconcessionthatcertainkindsofusesofworksthatareotherwiseprotectedshouldbeallowed: there isapublic interestpresentherethat justifiesoverridingtheprivaterightsofauthors intheirworksintheseparticularcircumstances.Inthelicences theauthor’srightscontinuetobeprotectedbutaresignificantlyabridged:publicintereststilljustifiesthecontinuanceoftheuse,regardlessoftheauthor’sconsent,butsubjecttothepaymentofappropriateremuneration”.
Indeterminingwheretheappropriatebalanceliesbetweenrightsandexceptions,itisabasicprincipleoftheIntellectualPropertypolicythattheresultshouldbeinthepublicinterest.Indeterminingwhatisinthepublicinterestthegovernmentmustbalanceanumberofoftenoverlappingpolicygoalsincludingeconomic,social,politicalandlegalobjectivesandconstraints.
Exceptionsareofinterestbecauselikerightstheyhavethepotentialtocreatevalue,employmentandenhancetheeconomicwelfareofsociety.
Recently,theGowersReview(2006)11proposedanumberofrecommendationsfortheimprovementoftheIPsystem.Inthisreport,theUKarguedthatexceptions–amongothers–havethepotentialstocreatevalue.ThestudysuggeststhatthebroaderapproachappliedintheUSAtocopyrightexceptionshasopenedupacommercialspaceforotherstocreatevalue.Forinstance,itreferstoGoogle’sabilityto‘cache’websites,effectivelycopyingcontentwithouthavingtoseekpermissionfirst; formanythat isconsideredanunfairuseofotherpeople’scopyrightedmaterial.Inthisstudy,Google’sexplanationtotheCallofEvidencecanbefoundstating:“TheexistenceofageneralfairuseexceptionthatcanadapttonewtechnicalenvironmentsmayexplainwhythesearchenginesfirstdevelopedintheUSA,whereuserswereabletorelyonflexiblecopyrightexceptions,andnotintheUK,wheresuchuseswouldhavebeenconsideredinfringement”.
6BrownD.(2003)“The Da Vinci Code”,Doubleday,USA.7Provisionsthatexcludeorallowfortheexclusionofprotectionforparticularcategoriesofworksormaterialmaybedescribedas“limitations”onprotection,inthesensethatnoprotectionisrequiredfortheparticularkindofsubjectmatterinquestion.ThereareseveralinstancesofsuchprovisionsintheBerneConventionfortheprotectionofliteraryandartisticworks:forofficialtextsofalegislative,administrativeandlegalnature(Article2(4)),newsoftheday(Article2(8))andspeechesdeliveredinthecourseoflegalproceedings(Article2bis (1)).
8Provisionsthatallowforthegivingofimmunity(usuallyonapermissive,ratherthanmandatorybasis)frominfringementproceedingsforparticularkindsofuse,forexample,wherethisisforthepurposesofnewsreportingoreducation,whereparticularconditionsaresatisfiedcanbetermed“permitteduses”orexceptionstoprotection,inthattheyallowfortheremovalofliabilitythatwouldotherwisearise.
9“Compulsory”or“obligatory”licencesallowaparticularuseofcopyrightmaterial,subjecttothepaymentofcompensationtothecopyrightowner.PermissionsarefoundinArticles11bis(2)and13andtheAppendixoftheBerneConventionfortheProtectionofLiteraryandArtisticWorks.
10WIPO(2003)“WIPO Study on Limitations and Exceptions of Copyright and Related Rights in the Digital Environment”.StandingCommitteeonCopyrightandRelatedRights,NinthSession,Geneva,June23rd–27th,2003.
11GowersReview(2006)“Gowers Review of Intellectual Property”,HMSO,Norwich,NR31BQ.

The Economic Contribution of Copyright-Based Industries in South Africa
11
Anotherexampleof‘fairuses’ofcopyrightthatcancreateeconomicvaluewithoutdamagingtheinterestsofcopyrightowners is thefilmWest Side Story thatgrossed$43.7million ($39.9millionwhenadjustedforinflation).AlthoughthefilmmaybeconsideredareworkingofRomeo and Juliet, itssuccessindicatesthatworkswhichbuildonothers(andarenotnecessarilysubstitutesoftheoriginalwork)canbeextremelyvaluable. Indeed, it isnot thecase thatWest Side StoryhasmadeRomeo and Juliet lesspopularor lesscommerciallysuccessful”12.
The value of copyright has traditionally been observed both in social and cultural terms. Also, with thecontinuousrisingoftheservicessector,globalisationandthedevelopmentofknowledgeeconomy,theneedforacopyrightlawandinfrastructureunderpinninganumberofindustrieshasbeenmoreimperativethanever.
CopyrightinSouthAfricaislegislatedbytheCopyrightActNo.98of197813anditsamendments.
Furthermore, the need to protect, support and promote the copyright-based industries has been re-emphasisedinthestrategicplanfor“CulturalIndustries”14.
The“Cultural Industries” identifiedbytheDepartmentofArts,Culture,ScienceandTechnology(DACST)includesthemusicindustry,thecraftindustry,thepublishingindustryandthefilmandtelevisionindustry(themostessentialcorecopyright-basedindustries).“TheirselectionwasbasedonanumberofcriteriaincludingtherecognitionthatthesesectorswereidentifiableindustriesinSouthAfrica,arepotentiallyinternationallycompetitiveandhavethepotentialtocreateemploymentandofferopportunitiesforruralandurbanjobcreation”15.
DespitetheimportanceoftheculturalindustriesforSouthAfricatherehasbeenlittle,ifany,analysisoftheeconomiccontributionandvalueofthecountry’scopyrightindustriesasawhole.
Theobjectiveofthisstudyistoquantifytheimportanceofcopyright-basedindustriesinSouthAfricaandsettheminaninternationalcontext.Morespecificallythestudyaimstoestimatethe:
• contributionofthecopyright-basedindustriestoSouthAfrica’sGrossDomesticProduct,• share of national employment related to the country’s copyright-based industries, participation of
copyright-basedindustriesininternationaltrade.
Thereportisstructuredasfollows:thenextchapterprovidesanoverviewofthecopyrightactivitiesinSouth
Africa, thechapter“InternationalStudiesEstimating theEconomicContributionofCopyright Industries”
providesaliteraturereviewemphasisingthefindingsofWIPO’ssupportedstudies,thenextchapterdiscusses
the methodological as well as data selection and collection issues, while the chapter “The contribution
of Copyright-Based Industries to the South African Economy” presents the findings of our analysis. The
nextsectionfocusesontheInput–Outputmethodologyandtheresultsofsuchananalysis,whilethenext
chapterfocusesonthetradeofcopyright-basedindustriesinSouthAfrica.Finally,thelastchapterprovides
adiscussionandanumberofpolicyrecommendationsforthefutureoftheSouthAfricancopyright-based
industries.
12Ibid.13RepublicofSouthAfrica(1978)“Copyright Act of South Africa, No. 98, as amended through No.9 (2002)”,availableathttp://portal.
unesco.org/culture/en/ev.php-URL_ID=15486&URL_DO=DO_TOPIC&URL_SECTION=201.html14DACST(1998)“CulturalIndustriesGrowthStrategy”DepartmentofArtsCultureScienceandTechnology,Pretoria.15Ibid.

The E
cono
mic C
ontri
butio
n of
Copy
right
-Bas
ed In
dustr
ies i
n Sou
th A
frica
12
2 . C o p y r i g h t i n S o u t h A f r i c a
CopyrightinSouthAfricaislegislatedbytheCopyrightActNo.98of197816anditsamendments.
Section2oftheActidentifiesthatthefollowingworksareeligibleforcopyright:
(a) literaryworks,(b) musicalworks,(c) artisticworks;,(d) cinematographicfilms,(e) soundrecordings,(f) broadcasts,(g) programme-carryingsignals,(h) publishededitions,(i) computerprograms.
Morespecifically,forliterary,musicalandartisticworks,exceptforphotographs,thecopyrightterminSouthAfricaisoffiftyyearsfromtheendoftheyearoftheauthor’sdeath,orfiftyyearsfrompublicationifitisfirstpublishedaftertheauthor’sdeath.Forphotographs,filmsandcomputerprograms,thetermisfiftyyearsfromfirstpublication,orfiftyyearsfromcreationifnotpublishedwithinfiftyyears.Forsoundrecordings,broadcasts, programme-carrying signals and published editions, it is fifty years from first publication ortransmission.
Anonymousworksareprotectedforshorterthanfiftyyearsfromfirstpublicationandfiftyyearsfromtheyearwhenitisreasonabletopresumetheauthorisdead.Forworkswithmultipleauthors,thefiftyyearsfromdeatharecalculatedfromthedeathofthelastauthortodie.Finally,governmentworksareprotectedforfiftyyearsfromfirstpublication.
Section12“Generalexceptionsfromprotectionofliteraryandmusicalworks”(appendix2)providesforanumberofexceptions.
TheActhasbeencriticised(Nicholson et al.,2008)17inthat:
• It does not have any provisions for persons with visual, aural or learning disabilities, or for distancelearnersandliteracytrainingpurposes.
• ItdoesnotaddressdigitisationorpreservationandcurationinthedigitalenvironmenttoenablelibrariesandarchivestocarryouttheirmandatesintermsofotherActsofParliament.
• Ithasnoprovisionsforadaptations,translations,parodies,broadcastsorpublicperformancesfornon-commercialoreducationalpurposes.
TheauthorsexpressedtheirconcernsonseveralshortcomingsoftheCopyrightActwhichincludeitsconflictswithArticle32oftheConstitutionrelatingtorighttoaccessofstateheldinformation,absenceofprovisionscateringfortherightstoinformationofindividualswithsensory-disabilitiesandthelongandcumbersomeprocessthatanindividualwouldneedinordertoreproducemultiplecopiesofgovernmentdepartmentalpublicationswhichincludepublichealthrelated,publicsafetyandsecuritypublications18.
They suggest that “government departmental publications are subject to copyright, which means thatthe public would need copyright permission to reproduce multiple copies, beyond what is permitted insection13.Thismeansthatthecopyright lawwouldrequirethat importantdocumentsonhealth issues,suchasHIV/AIDS,tuberculosis,malaria,hepatitisandotherseriousdiseases,beclearedforcopyrightby,orthrough,relevantgovernmentdepartments,beforebeingabletobereproducedforusebyhealthworkersinruralareas.Inapandemic,suchasAIDS,thisinformationshouldbeinthepublicdomain.Similarly,inviewofthehighlevelsofcrimeinthiscountry,documentspublishedbytheDepartmentofSafetyandSecurity,
16CopyrightAct98of1978RegulationsasamendedbyNoticeGovernmentGazetteR.12119775,June,7th1985.17NicholsonR.D.andKawooyaD.(2008)“The Impact of Copyright on Access to Public Information in African Countries: a Perspective
from Uganda and South Africa”.WorldLibraryandInformationCongress:74thIFLAGeneralConferenceandCouncil,August10th–14th,2008,Québec,Canada,http://www.ifla.org/IV/ifla74/index.htm
18Ibid.

The Economic Contribution of Copyright-Based Industries in South Africa
13
theSouthAfricanPoliceServiceandothergovernmentsecurityenforcementagenciesshouldbeinthepublicdomain.”19Hence,itappearsthattheyarguethattheremayalsobediscriminationagainstothersectorsofsociety.
TheWIPOstudy20(2008)oncopyrightlimitationsandexceptionsforlibrariesandarchivessummarisedSouthAfrica’slimitationsandexceptions.
South Africa has introduced anti-circumvention provisions in its Electronic Communications andTransactionsActNo.25of2002(Chapterxiii:Cybercrime,Clause86).TheActismanagedbytheMinisterofCommunications. It isof importance,however,thattheActdoesnotprovideexceptionsforlegitimatepurposes.Unliketraditionalcopyrightlaw,whichlimitsthetermofprotection,thereisnolimittothetermofprotectionaccordedtoaTechnologicalProtectionMeasure(TPM),effectivelyextendingthetermofprotectionforworksprotectedbyaTPMindefinitely.
Inaninternationalcontext,SouthAfricaisapartytotheBerneConventionfortheProtectionofLiteraryandArtisticworksandtheTrade-Relatedaspectsof IntellectualPropertyRights (TRIPS).Also,SouthAfricahassignedtheWIPOCopyrightTreatybutnotratifiedityet.
SouthAfricaappearstohaveahighstandinginthefieldofprotectionofintellectualpropertyrightsingeneralandcopyrightinparticular.The2008InternationalPropertyRightsIndex(IPRI)isaninternationalcomparativeindicatorthatmeasuresthesignificanceofbothphysicalandintellectualpropertyrightsandtheirprotectionforeconomicwell-being.ThePropertyRightsAlliance21initiatedtheIPRIstudiesfortheHernandodeSotoFellowshipProgramtocontributetodevelopingaccurateandcomprehensivemeasuresregardingPropertyRights(PR)onaninternationalscale.TheIPRIprovidesatoolforcomparativeanalysisandresearchonglobalproperty rights. The Index focuses on three areas: Legal and Political Environment (LP), Physical PropertyRights(PPR)andIntellectualPropertyRights(IPR).
TheIPRcomponentconsidersfouraspectsofintellectualproperty:
• ProtectionofIPRaccordingtoopinionsofexpertparticipantsineachcountry.• Patent protection as is manifested in coverage, membership in international treaties, restrictions on
patentrights,enforcementanddurationofprotection.• Trademarkprotectioncoveringtheregistration,maintenanceandenforcementoftrademarkrights.• Copyrightpiracycoveringpiracylevelsmainlyinbusinesssoftware,recordsandmusic,motionpictures
andentertainmentsoftware.
ThePropertyRightsAlliance(PRA)studyanalysesdatafor115countriesaroundtheglobe,representing96%ofworldGDP.Ofgreat importance,the2008gaugeincorporatesdataofpropertyrightsprotectionfromvarioussources,oftendirectlyobtainedfromexpertsurveyswithintheevaluatedcountries.
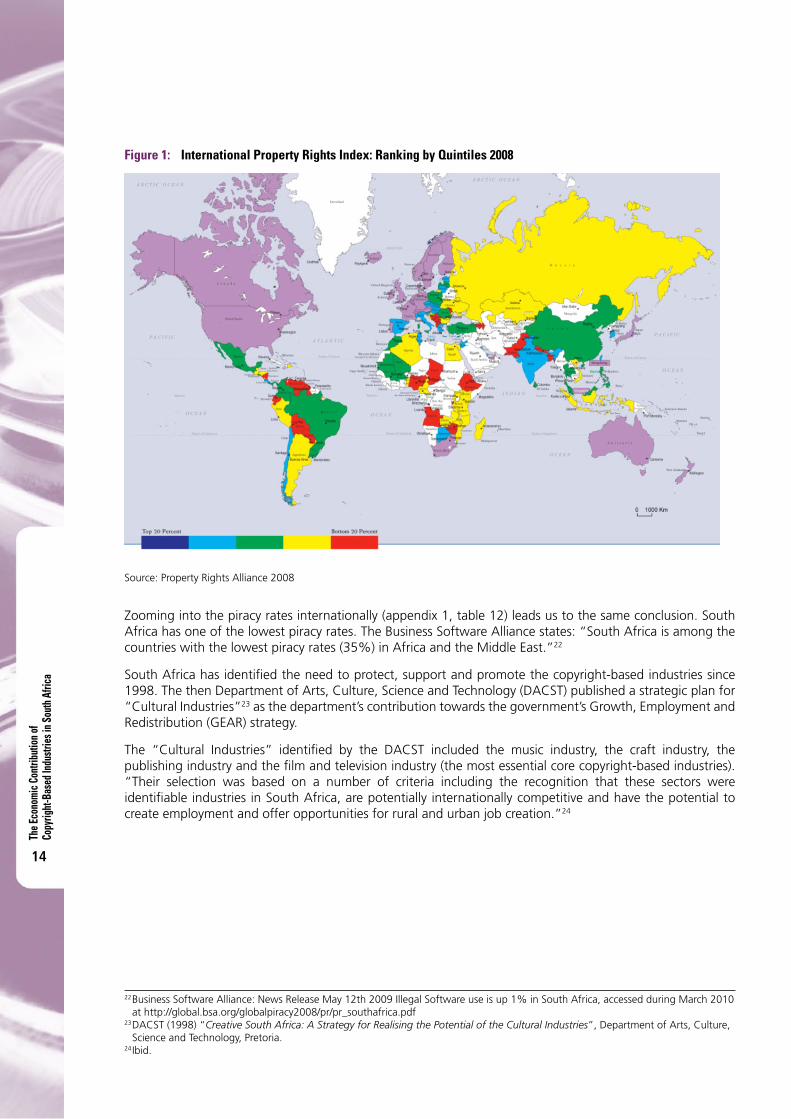
Figure1showsamapoftheworldwherecountrieswithsimilarpropertyrightsindicesarecolouredsimilarly.SouthAfricabelongstothesamegroupasNorthAmerica,EuropeandAustralia.
IntheIPR,SouthAfricascores7andisinthe12thposition(intermsofmarks).IntermsofcountriesSouthAfrica is ranked22ndoutof115countries.The topcountry in the index is Finlandwitha scoreof8.5.CountrieslikeSouthKorea(6.7),Italy(6.5),Israel(6.3),India(5.2),Brazil(5.1)andothersarebelowSouthAfrica.
SouthAfrica’sIPRscoreissubstantiallyhigherfromwhatisexpectedfromitsGDPpercapita(anindicatordiscussedinthePropertyRightsAlliance(2008)report).SouthAfrica’sscorewasexpectedtobearound5.
19Ibid.20KennethCrew,studycommissionedbyWIPO(2008)“Study on Copyright Limitations and Exceptions for Libraries and Archives”.
StandingCommitteeonCopyrightandRelatedRights,SeventeenthSession,Geneva,November3rd–7th,2008.21PropertyRightsAlliance(2008)“International Property Rights Index 2008 Report”,WashingtonDC.
The E
cono
mic C
ontri
butio
n of
Copy
right
-Bas
ed In
dustr
ies i
n Sou
th A
frica
14
Figure 1: International Property Rights Index: Ranking by Quintiles 2008
Source:PropertyRightsAlliance2008
Zoomingintothepiracyratesinternationally(appendix1,table12)leadsustothesameconclusion.SouthAfricahasoneofthelowestpiracyrates.TheBusinessSoftwareAlliancestates:“SouthAfricaisamongthecountrieswiththelowestpiracyrates(35%)inAfricaandtheMiddleEast.”22
SouthAfricahasidentifiedtheneedtoprotect,supportandpromotethecopyright-basedindustriessince1998.ThethenDepartmentofArts,Culture,ScienceandTechnology(DACST)publishedastrategicplanfor“CulturalIndustries”23asthedepartment’scontributiontowardsthegovernment’sGrowth,EmploymentandRedistribution(GEAR)strategy.
The “Cultural Industries” identified by the DACST included the music industry, the craft industry, thepublishingindustryandthefilmandtelevisionindustry(themostessentialcorecopyright-basedindustries).“Their selection was based on a number of criteria including the recognition that these sectors wereidentifiableindustriesinSouthAfrica,arepotentiallyinternationallycompetitiveandhavethepotentialtocreateemploymentandofferopportunitiesforruralandurbanjobcreation.”24
22BusinessSoftwareAlliance:NewsReleaseMay12th2009IllegalSoftwareuseisup1%inSouthAfrica,accessedduringMarch2010athttp://global.bsa.org/globalpiracy2008/pr/pr_southafrica.pdf
23DACST(1998)“Creative South Africa: A Strategy for Realising the Potential of the Cultural Industries”,DepartmentofArts,Culture,ScienceandTechnology,Pretoria.
24Ibid.

The Economic Contribution of Copyright-Based Industries in South Africa
15
Havinginvestigatedtheimportanceofthe“CulturalIndustries”,thereportmakessomekeyrecommendationsforthefutureoftheseindustries:
• designingandimplementingaCulturalIndustriesDevelopmentProgramme(CIDP),• settingupaCIDPregulatoryframework,• creatingaCulturalIndustriesDevelopmentFund,• promotingtheindustriesinternationallyandsettingupanexportprogramme,• co-ordinatingcopyrightlegislationtoprotectthelocalculturalproducts,• developinghumanresourcesandskillsappropriatetoculturalindustries,• adoptingandco-ordinatinggovernmentsupplysidemeasures,• designingandimplementinganawarenesscampaignfocusedonaudiencedevelopment,• collectingandmonitoringstatistics,• co-ordinatinginitiativesinotherdepartments,• establishingaCulturalIndustriesDevelopmentAgency.
The DACST report looked at the cultural industries not only holistically as an important sector of SouthAfricabutalsoperindividualindustry.Thefollowingreportsfocusedonthemainculturalindustries:filmandtelevision,publishingandthemusicindustry.
2.1 the South African Film and television Industry report25
TheSouthAfricanfilmandtelevisionindustryreportispartoftheCulturalIndustriesGrowthStrategy(CIGS)conductedbytheDACST,whosepurposewastodevelopastrategyofthefilm,craftandpublishingindustries.
Thereportsummarisesthesignificanceofthefilmandtelevisionindustryinthreemainpillars:
• Itisamediumofcommunicationofideas,informationandideology.• Itprovidesopportunityfordebateanddiscussionforparticipationinthesocialandpoliticallife.• Globally,theparticularindustrycreatesmillionsofjobsandcontributessignificantlytothetotaleconomy.
Past mismanagement of funding and lack of equity have been two of the main reasons that the SouthAfricanfilmandtelevisionindustrystrugglestoovercomeotherimportantpredicamentstothegrowthoftheindustrywhichhavebeenidentifiedbythereportasfollows:
• Limitedaccesstofinancingandfacilities,• Insufficientaudiencedevelopment,• Fewtrainingopportunities,onlydomesticinterestfortheindustrywithlimitedopportunitiesforexports
and• AlackofunderstandingoftheneedsofthemarketbySouthAfricanfilmmakers.
ThesepredicamentsremainedforthenextyearsasconfirmedbytheIndustrialPolicyActionPlan(IPAP)26.Thisreportconfirmedthatsomekeyconstraintstothesector’sgrowthare:
• Limitedaccesstofinance,• Limitedaccesstodistributionandexhibition,• Lackoftrainingopportunities,• Lackofopportunitiestoexportthesector’sproductsand• Insufficientcoordination.
25DACST(1998)“The South African Film and Television Industry Report”in“Cultural Industries Growth Strategy (CIGS)”,DepartmentofArts,Culture,ScienceandTechnology,Pretoria.
26DTI(2007)“Industrial Policy Action Plan”,DepartmentofTradeandIndustry,Pretoria.

The E
cono
mic C
ontri
butio
n of
Copy
right
-Bas
ed In
dustr
ies i
n Sou
th A
frica
16
Duringthelate1990s,importantdevelopmentspromisedabetterfutureforthefilmandtelevisionindustryinSouthAfrica:
• Formal acknowledgement of the significance of the industry by the South African government andimplementation of initiatives and developments such as establishing the National Film and VideoFoundatirealignmentofownershipstructures. ItbeganwithPrimedia’sacquisitionof theSter-KinekordistributionandexhibitionbusinessinJuly1997andthesubsequentestablishmentofanentertainmentdivision.
• RecommendationsbytheWhitePaperonBroadcastingwithregardstochangesinthebroadcastindustry,suchascommercialisationofvariousSABCoperationsandintroductionofsatelliteanddigitaltechnology,
• EstablishmentoftheInternationalSouthernAfricanFilmandTelevisionMarkettoprovideopportunitiesfornetworkinganddeal-makingbetweenkeyplayersoftheindustry.
2.2 the South African publishing Industry report27
TheSouthAfricanpublishingindustryreportwasalsopartofthebiggestinitiativebytheDACSTundertheCulturalIndustriesGrowthStrategy(CIGS)in1998.MainareasoftheSouthAfricansocietyarelinkedandsignifytheimportanceofthepublishingindustry:
• Educationandtraining,• Awarenessof,andparticipationincurrentaffairs,• Culturalexpressionandentertainment,• Researchandinnovation,• Critiqueandcommentaryand• Communications.
Thepublishingindustryalsoactsasthecentralcoreofanentirenetworkofrelatedindividualsandindustries,suchaspapermanufacturers,educationalinstitutions,inkproducers,authors,printers,designers,bookbinders,illustrators,booksellers,distributorsandCDmanufacturers.TheindustryisthereforeanimportantsourceofrevenueandemploymentinSouthAfrica.
However,variousproblemshavelimitedthegrowthoftheindustryasfollows:
• A limitedbuyingmarket forpublishedmaterial,governmentprioritisesbasicneedsbeforepublishingproducts,
• Lackoftrainingopportunities,advancesininformationtechnologyaffectingthemoretraditionalformsofpublishing,highlycompetitiveforeignpublishersimpactingonlocalindustryand
• Inadequatemotivationforlocalwriters.
2.3 the South African music Industry28
Thisreport,alsopartoftheCulturalIndustriesGrowthStrategy(CIGS)in1998,focusesonthemusicindustryofSouthAfricawhich isa complicatedcombinationofdifferent industriesproducinga rangeofmusicalproducts.Theindustry,accordingtothereport,includes:
• Creators:musiciansandcomposers,• Agents,• Recordcompaniesand• Retailoutlets.
ThemusicindustryisresponsibleforthecreationofjobsandincomeintheSouthAfricaneconomy.ASWOTanalysiswasconductedforthemusicindustrysummarisedasfollows.
27DACST(1998)“The South African Publishing Industry Report”in“Cultural Industries Growth Strategy (CIGS)”,DepartmentofArts,Culture,ScienceandTechnology,Pretoria.
28DACST(1998)“The South African Music Industry Report”in“Cultural Industries Growth Strategy (CIGS)”,DepartmentofArts,Culture,ScienceandTechnology,Pretoria.

The Economic Contribution of Copyright-Based Industries in South Africa
17
Strengths
• Multinationalrecordingcompaniesinvolvedinthedomesticmarket• Widespreadretailandbroadcastnetworkandagencies• Growthincommunityradiobroadcasting• Cooperationbothbetweenlocalmusiciansandbetweenlocalandinternationalmusicians• Growthintherecording,marketingandsalesofdomesticcollection
Weaknesses
• Limitedfinancing• Limitedinvestmentandpromotionoflocalartists• Highpiracylevelsinthemusicindustry• Lackofcoordinatedstrategy
Opportunities
• Growthofinternationalmusicindustry• Exposureofthelocalmusicindustry
Threats
• Lackofnecessarycommitment• Lackofresourcesfromseveralkeyplayers
Recently,morepublicationswerereleasedwithinformationoncreativeindustriesaswellasspecificsectors:
• TheIndustrial Policy Action Plan,bytheDepartmentofTradeandIndustry(Availableathttp://www.dti.gov.za/DownloadFileAction?id=561)
• TheAnnual Book Publishing Industry Survey Report 2008bytheDepartmentofArtsandCulturethroughtheSouthAfricanBookDevelopmentCouncil(SABDC)andthePublishers’AssociationofSouthAfrica(PASA).Availableat:http://www.publishsa.co.za/downloads/industry-statistics/2008_industry_survey.pdf.

The E
cono
mic C
ontri
butio
n of
Copy
right
-Bas
ed In
dustr
ies i
n Sou
th A
frica
18
3 . I n t e r n a t i o n a l S t u d i e s : E s t i m a t i n g t h e E c o n o m i c C o n t r i b u t i o n o f C o p y r i g h t - B a s e d I n d u s t r i e s
Aliteraturereviewwascarriedoutidentifyingtheresultsandthemethodologiesemployedbyotherstudiesinternationally. Compatibility with other investigations will provide the basis for comparisons and thedevelopmentofrelevantrecommendationsfortheSouthAfricancopyright-basedindustries.
The WIPO “Guide on Surveying the Economic Contribution of the Copyright-Based Industries”29 statesthattheeconomiccontributionofthecopyright-basedindustrieshasexceededexpectationsinthelasttwodecades.
Inordertofacilitatetheundertakingofacomparativeanalysis,WIPOdevelopeda“GuideonSurveyingtheEconomicContributionoftheCopyright-Basedindustries”.Theguideprovidesamethodologyandindicatorstobeemployed.TheexistingWIPOstudiesinothercountriesfollowtheguideinitsrecommendationofthemainindicatorstobeanalysed:thesectors’value-addedasa%ofGDP,thesectors’employmentas%oftotalemploymentinthecountryandtoalimitedextentthetradeperformanceofthesectors.
Asummaryofaselectionofstudies30,31dealingwiththesignificanceofthecopyrightindustriesinanumberofcountries ispresentedinfigure2.Thefigureshowsthatthetotaleconomiccontributionofcopyright-basedindustriesasa%toGDPvariesfrom2.81%inBulgariato11.70%inthePhilippines(figure2).Theaverageunweightedshareofthecopyright-basedindustriestoGDPintheseninecountriesis6.35%.
Similarly the indicator ratio of persons employed in the copyright-based sector to the total number ofemployees in the economy varies from 3.03% in Jamaica to 11.17% in Latvia. Latvia’s copyright-basedindustriesare responsible for theemploymentof11.17%ofthetotalemploymentof thecountry, this ismuchhigherthantheaverageoftheninecountries(7.21%).
Similarfindingsareidentifiedbyotherstudies.AccordingtoSiwek(2004)32,theUScopyright-basedindustriesaccountedfor7.75%totheUSGDPand5.9%ofthetotalworkforce,in2001.
29WorldIntellectualPropertyOrganization(WIPO),2003“Guide on surveying the economic contribution of the copyright-based industries”.WIPO:Geneva.
30WorldIntellectualPropertyOrganization(WIPO),2006“National Studies on Assessing the Economic Contribution of the Copyright-Based Industries No1: the economic contribution of copyright-based industries.”WIPO:Switzerland.Countries:Latvia(2000),Singapore(2004),Canada(2004),Hungary(2005).
31WorldIntellectualPropertyOrganization(WIPO),2008“National Studies on Assessing the Economic Contribution of the Copyright-Based Industries No2: the economic contribution of copyright-based industries”.WIPO:Switzerland.Countries:Philippines,Mexico(2006),Jamaica(2007),Bulgaria(2007),Lebanon(2007).
32Siwek,S.E.,2004“The measurement of “copyright” industries: the US experience”.ReviewofEconomicResearchonCopyrightIssues,1(1)pp.17-25.

The Economic Contribution of Copyright-Based Industries in South Africa
19
Figure 2: International Contribution of Copyright-Based Industries (GDP and Employment) WIPO Supported Studies
Source:DataderivedfromWorldIntellectualPropertyOrganization(WIPO)(2006and2008)33,34
A study conducted by the Media Group35 for the European countries showed that the copyright-basedindustrieshaveanimportantcontributingroleintheGDPandemploymentofEuropeaswell(figure3).
33Seefootnote25.34Seefootnote26.35MediaGroup,2003“The Contribution of Copyright and Related Rights to the European Economy”.BusinessResearchand
DevelopmentCentreTurkuSchoolofEconomicsandBusinessAdministration.Finland.

The E
cono
mic C
ontri
butio
n of
Copy
right
-Bas
ed In
dustr
ies i
n Sou
th A
frica
20
Figure 3: Contribution of Copyright-Based Industries in European Countries
Source:DataderivedfromMediaGroup(2003)36
Thecontributionofthecopyright-basedindustriestothecountries’GDPwasintherangeof1.5%to7%whilethecopyright-basedindustriesemploy2%to4.3%ofthetotalworkforce.
Basedon theguidanceofWIPO’sGuide, the studiesmentioned infigure2 classified the total copyrightindustryintofourcategories:core,interdependent,partialandnon-dedicatedsupportcopyrightindustries.
Itisshownintable13(appendix2)thatthecorecopyright-basedindustriesmadeasignificantcontributiontothetotaleconomy.IntermsoftheirshareintotalGDP,thecorecopyright-basedindustries’contributionvariesfrom1.57%inBulgariato8.59%inthePhilippines,thesearethecountrieswiththehighestandlowestshareoftotalcopyright-basedindustries’contribution.Withregardstoemployment,theaveragecontributionofthecorecopyright-basedindustriesinthecountriesinquestionis3.74%,halfofthecontributionofthetotalcopyright-basedindustries(7.21%).
Two sub-sectors play a significant role in the overall economic contribution of the core copyright-basedindustriestoGDP,namely‘pressandliterature’and‘softwareanddatabases’.Fromtheemployment’spointofview,however,‘pressandliterature’and‘radioandtelevision’providetoahighpercentageofcopyright-basedindustries’employees.
Comparedtothecorecopyright-basedIndustries,theinterdependentcopyright-basedindustriescontributelesstothetotaleconomicactivityandtotalemployment.Theaverageofthesummarisedstudies’sharetoGDPis1.42%,whiletheiraveragecontributiontothetotalemploymentis1.26%(table14,appendix2).Morethanhalfoftheinterdependentcopyright-basedindustries’contributionisderivedfromtwomainsub-sectors:‘TVsets,radios,VCRsandDVDplayers’and‘computersandequipment’.
Themajorityofthestudiessummarisedconcludesthatthepartialcopyright-basedindustriesdonotcontributemorethan1%ofthetotaleconomicactivitiesandemployment.TheexceptionsaretheMexicanandtheLatvianpartialcopyright-basedindustrieswhichcontribute1.11%and2.81%ofthetotalGDP,respectivelyand2.53%and5.29%ofthetotalemploymentrespectively(table15,appendix2).
36Ibid.
The Economic Contribution of Copyright-Based Industries in South Africa
21
Fiveoutofeightstudies’resultsshowedthatthenon-dedicatedsupportindustriesdonotcontributemorethan1%to the totaleconomy,while the rest (Hungary,Mexicoand Jamaica)presentacontributionnothigher than2%.Regardingemployment, thecontributionof thenon-dedicatedsupport industriesvariesfrom0.28%inBulgariato1.48%inLatvia(table16,appendix2).
Inconclusion,anumberofinternationalstudiesidentifythehighsignificanceofthecopyright-basedindustriestothecountries’totaleconomicactivities,asrepresentedbythevalue-addedoftheseindustriesandtheiremploymentlevels.Moreparticularly,thecorecopyright-basedindustriesarethemostimportantcategorybasedontheirlevelofcontribution.’Pressandliterature’,‘softwareanddatabases’,‘radioandtelevision’and‘computersandequipment’aswellasaninterdependentcopyright-basedindustrynamed,‘TVsets,radios,VCRsandDVDplayers’arenotablesourcesofeconomicactivityandjobpositions.

The E
cono
mic C
ontri
butio
n of
Copy
right
-Bas
ed In
dustr
ies i
n Sou
th A
frica
22
4 . M e t h o d o l o g y
In this report we follow the WIPO methodology for the estimation of the contribution of the copyrightindustriesintheSouthAfricaneconomy.AccordingtoWIPO,copyright-basedindustriesarethoseengagedin creation, production and manufacturing, performance, broadcast, communication and exhibition ordistributionandsalesofworksandotherprotectedsubjectmatter37.TheWIPOGuidealsorecognisesthattheeconomicimpactcanberelatedtoboth“core”copyright-basedindustriesand“non-core”industries.Thesedifferentcategoriesproposedaredependentoncopyrightatdifferentlevels,representedintheWIPOGuidebythecopyright factors.
In our study, we deal with “core” and “non-core” industries separately by measuring their value-addedcontributionaswellasemploymentandtradelevels.Inthissection,theoverallmethodology,datacollectionissuesandselectionofcopyrightfactorsaredescribedindepth.
TheWIPOGuidecategorisesthecopyright-basedindustriesintofourmaincategoriesbasedontheirtypeofassociationtocopyright.Theyare:
• core copyright industries: industries wholly engaged in creation, production and manufacturing ofperformance, broadcast, communication and exhibition or distribution and sales of works and otherprotectedsubjectmatter
• interdependent copyright industries:industriesengagedinproduction,manufactureandsaleofequipmentwhosefunction iswhollyorprimarily tofacilitatethecreation,productionoruseofworksandotherprotectedsubjectmatter
• partial copyright industries: industries in which a portion of the activities is related to works and otherprotected subject matter and may involve creation, production and manufacturing, performance,broadcast,communicationandexhibitionordistributionandsales
• non-dedicated support industries: industries in which a portion of the activities is related to facilitating,broadcast,communication,distributionorsalesofworksorotherprotectedsubjectmatterandwhoseactivitieshavenotbeenincludedinthecorecopyrightindustries.
ThespecificSouthAfricanindustriesforeachoftheabovecategoriesweredeterminedbasedontheWIPOGuide and the availability of data in the country, as presented in table 1. In appendix 3 (tables 18-21),weindicatethesub-categories inwhicheachofthemainindustries iscomprised, inaccordancewiththeclassificationbytheWIPOGuide.
Table 1: Copyright-Based Industries Used in the South African Study
Core Interdependent Partial Non-dedicatedPrinting, publishing and recorded media
Television, radio and communication equipment
Apparel, textiles and footwear
General wholesale and retailing
Film and television industry Computers and equipment, photocopiers
Furniture, jewellery, musical instruments, games and toys
Transport, storage and communication
Photography, software and databases, advertising
Paper and paper products Crafts
Copyright collecting societies Glass and glass products
Industrialsectorssuchas‘photography,softwareanddatabases,advertising’, ‘computersandequipment,photocopiers’,and‘furniture,jewellery,musicalinstruments,gamesandtoys’werederivedfromthefollowingsectors: ‘businessservices’, ‘machineryandequipment’and‘furnitureandothermanufacturing’. Inthesecases,weusedapercentage that represents theappropriate copyright industries. For instance, ‘businessandservices’includestwosignificantsub-sectors(‘advertising’and‘softwareanddatabases’)amongothersmaller copyright-based industries, suchas ‘photographicactivities’.Ouranalysisof theoutputsof these
37WorldIntellectualPropertyOrganization(WIPO),2003“Guide on surveying the economic contribution of the copyright-based industries”.WIPO:Geneva.
The Economic Contribution of Copyright-Based Industries in South Africa
23
twoindustriesindicatesthattheycontributealmost8.7%ofthe‘businessservices’sector’soutputfor2008[advertising R3 billion, software R38 billion]. Hence, 10% of the ‘business services’ sector statistics wasestimatedtorepresentallthecopyright-basedindustriesincludedinit.
Thebasicsourceswheredatawereobtainedfromarethefollowing:
• BusinessMonitorInternationalLtd,• theDepartmentofArts,Culture,ScienceandTechnology,• theDepartmentofLabour,• theEconomistIntelligenceUnit,• theNationalOrganisationforReproductionRightsinMusicinSouthernAfrica(NORM),• thePublishersAssociation,• Quantecdatabases,• SARecordingRightsAssociationLtd(SARRAL),• theSouthAfricanBookDevelopmentCouncil(SABDC),• theSouthAfricanReserveBank,• theSouthAfricanRevenueService(SARS),• theSouthernAfricanMusicRightsOrganisation(SAMRO)and• StatisticsSouthAfrica.
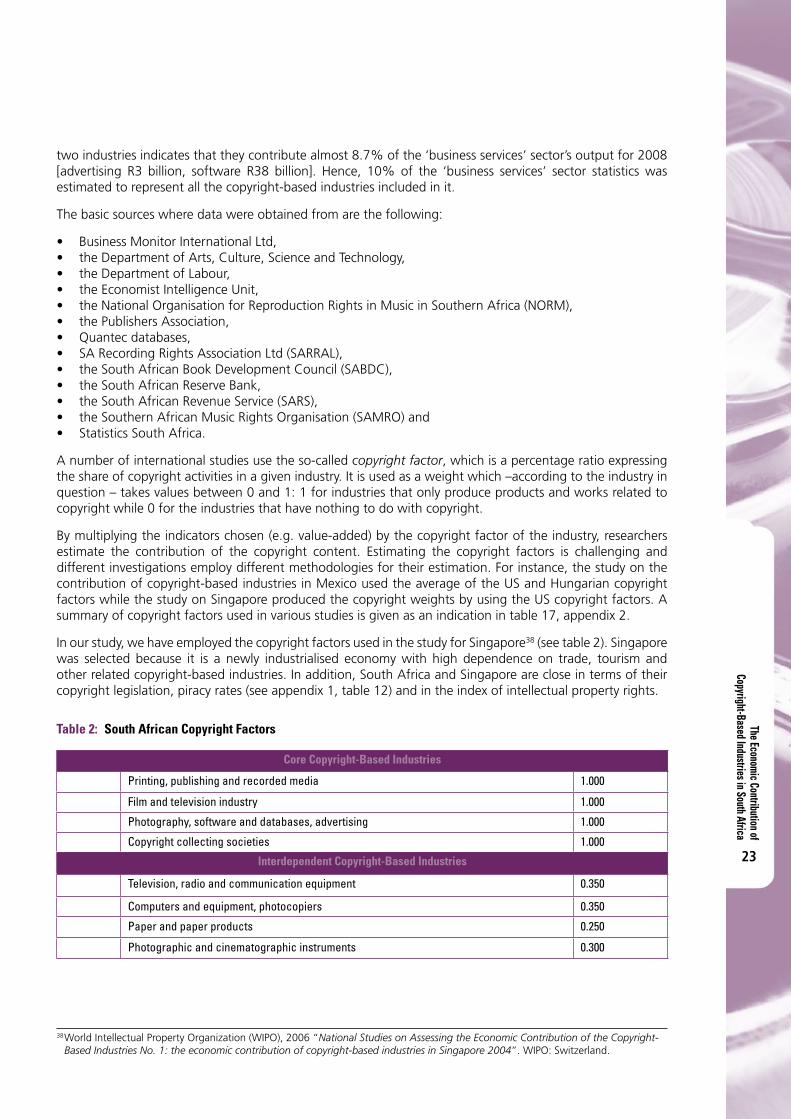
Anumberofinternationalstudiesusetheso-calledcopyright factor,whichisapercentageratioexpressingtheshareofcopyrightactivitiesinagivenindustry.Itisusedasaweightwhich–accordingtotheindustryinquestion–takesvaluesbetween0and1:1forindustriesthatonlyproduceproductsandworksrelatedtocopyrightwhile0fortheindustriesthathavenothingtodowithcopyright.
Bymultiplyingtheindicatorschosen(e.g.value-added)bythecopyrightfactoroftheindustry,researchersestimate the contribution of the copyright content. Estimating the copyright factors is challenging anddifferentinvestigationsemploydifferentmethodologiesfortheirestimation.Forinstance,thestudyonthecontributionofcopyright-basedindustriesinMexicousedtheaverageoftheUSandHungariancopyrightfactorswhilethestudyonSingaporeproducedthecopyrightweightsbyusingtheUScopyrightfactors.Asummaryofcopyrightfactorsusedinvariousstudiesisgivenasanindicationintable17,appendix2.
Inourstudy,wehaveemployedthecopyrightfactorsusedinthestudyforSingapore38(seetable2).Singaporewas selected because it is a newly industrialised economy with high dependence on trade, tourism andotherrelatedcopyright-basedindustries.Inaddition,SouthAfricaandSingaporearecloseintermsoftheircopyrightlegislation,piracyrates(seeappendix1,table12)andintheindexofintellectualpropertyrights.
Table 2: South African Copyright Factors
Core Copyright-Based Industries
Printing, publishing and recorded media 1.000
Film and television industry 1.000
Photography, software and databases, advertising 1.000
Copyright collecting societies 1.000
Interdependent Copyright-Based Industries
Television, radio and communication equipment 0.350
Computers and equipment, photocopiers 0.350
Paper and paper products 0.250
Photographic and cinematographic instruments 0.300
38WorldIntellectualPropertyOrganization(WIPO),2006“National Studies on Assessing the Economic Contribution of the Copyright-Based Industries No. 1: the economic contribution of copyright-based industries in Singapore 2004”.WIPO:Switzerland.

The E
cono
mic C
ontri
butio
n of
Copy
right
-Bas
ed In
dustr
ies i
n Sou
th A
frica
24
Table 2: South African Copyright Factors (Continued)
Partial Copyright-Based Industries
Apparel, textiles and footwear 0.004
Furniture, jewellery, musical instruments, games and toys 0.100
Crafts 0.420
Glass and glass products 0.006
Non-Dedicated Copyright-Based Industries
General wholesale and retailing 0.057
Transport, storage and communication 0.057
Source:WorldIntellectualPropertyOrganization(WIPO)39
39Ibid.

The Economic Contribution of Copyright-Based Industries in South Africa
25
5 . T h e C o n t r i b u t i o n o f C o p y r i g h t - B a s e d I n d u s t r i e s t o t h e S o u t h A f r i c a n E c o n o m y
This chapter presents the results of the quantitative analysis conducted aiming to estimate the totalcontributionof thecopyright-based industries,aswell as thecontributionof the individual categoriesofcopyright-basedindustries(i.e.core,interdependent,partial,non-dedicatedsupportindustries).Theanalysisfocusesontheestimationofvalue-added,employment,exportsandimports.
5.1 the performance of copyright-based Industries Theoverallcontributionofthecopyright-basedindustriesin2008ispresentedinfigure4.Thecopyright-basedindustriesareresponsibleforalmost4.11%ofthetotaleconomyintermsofvalue-added,withcorecopyright-basedindustriesbeingthehighestcontributor(2.05%)andthenon-dedicatedcopyrightindustriesfollowingwith1.29%.
Figure 4: Contribution of Copyright-Based Industries in 2008
Source:Authors’calculationswithdatafromtheDepartmentofLabour(DoL),theDepartmentofArtsandCulture(DAC),Quantecdatabases,theSouthAfricanReserveBank(SARB)andtheSouthAfricanRevenueService(SARS).
Asfarasemploymentisconcerned,4.08%oftheworkforceisemployedinthecopyright-basedindustries,themajorityofwhich isemployed in thecoreandnon-dedicatedcopyright-based industries (2.31%and1.03%,respectively).Theinterdependentcopyright-basedindustriesshowahighcontributiontotheexportsoftheeconomy(2.77%)andanevenhighercontributiontothetotalimports(7.85%).
Table3presents the valuesof all the copyrightbased sectors examined in this study for four indicators:realvalue-added,employment,exportsand imports,after the implementationofcopyright factors in thecalculations.

The E
cono
mic C
ontri
butio
n of
Copy
right
-Bas
ed In
dustr
ies i
n Sou
th A
frica
26
Table 3: Real Value-Added, Employment, Exports and Imports for all Copyright-Based Industries for 2008
Year 2008Real value-
addedEmployment Exports Imports
R millions (2005=100)
Number of employees
R millions (2005=100)
R millions (2005=100)
TOTAL ECONOMY 1,620,139 10,376,881 495,382 572,354
Total CBI 66,101 422,974 20,168 48,051
Core Copyright–Based Industries 32,670 239,959 1,954 2,359
Printing, publishing and recorded media 7,588 53,465 790 2,009
Film and television Industry 6,811 30,899 – –
Photography, software and databases, advertising 18,271 155,595 1,165 350
Interdependent Copyright–Based Industries 9,091 52,620 13,745 43,324
Photographic and cinematographic instruments 15 – – –
Television, radio and communication equipment 944 2,632 994 9,557
Computers and equipment, photocopiers 5,442 40342 11,138 33,767
Paper and paper products 2705.55 9646 1,612 1,595
Partial Copyright–Based Industries 3,426 23,879 1,767 1,321
Apparel, textiles and footwear 45 472 8 72
Furniture and other manufacturing 2,418 9,405 1,755 1,237
Crafts 949 13,938 – –
Glass and glass products 14 63 3 11
Non–Dedicated Copyright–Based Industries 20,913 106,516 2,702 1,046
General wholesale and retailing 11,685 85,796 1,049 5
Transport, storage and communication 9,229 20,720 1,654 1,041
Source:Authors’calculationswithdatafromtheDepartmentofLabour(DoL),theDepartmentofArtsandCulture(DAC),Quantecdatabases,theSouthAfricanReserveBank(SARB)andtheSouthAfricanRevenueService(SARS).
Intable4,weanalysethegrowthofcontributionofthefourmaincategoriesofcopyright-basedindustriestototalvalue-added,employment,importsandexports.Thefiguresarecalculatedasthepercentagechangebetween thefirst and last year for eachperiod. For example, after theuseof the copyright factors, thevalue-addedofthetotalcopyright-basedindustriesin2000wasZAR49,970.74millionwhilein2008,itwasR66,615.58million:achangeof33%.
Table 4 shows that all the different divisions of copyright-based industries have increased substantiallythrough the last fourdecades,with theoverall contributionof copyright-based industries to the totalofvalue-addedhavinggrownby33%inthelastdecade.Onlythepartialcopyright-basedindustriesshowedanegativegrowthoftheirvalue-addedinthe1990s.Thistrendincombinationwiththesharpincreaseofimports(165%)andslowerincreaseofexports(18%)inthesameperiodcanbeinterpretedasaresultofthelackofcomparativeadvantageoftheSouthAfricanpartialcopyright-basedindustries,incomparisonwiththerestoftheworld.Asaresultofthisdecrease,theemploymentgrowthofthenextperiod(2000to2008)wasaffected.

The Economic Contribution of Copyright-Based Industries in South Africa
27
Table 4a: Value-Added, Employment, Imports and Exports Growth of Copyright-Based Industries in % 1970 to 2008
Value-added
Core Interdependent Partial Non-dedicated Total
1970-1979 28% 63% 36% 44% 37%
1980-1989 3% 20% 94% 18% 8%
1990-1999 17% 15% -6% 31% 16%
2000-2008 24% 40% 24% 45% 33%
Employment
Core Interdependent Partial Non-dedicated Total
1970-1979 33% 23% 29% 21% 33%
1980-1989 36% 16% 30% 10% 23%
1990-1999 51% -5% 12% 4% 26%
2000-2008 30% -6% -13% 17% 21%
Imports
Core Interdependent Partial Non-dedicated Total
1970-1979 9% -28% -31% -20% -7%
1980-1989 -17% 5% -9% 49% -5%
1990-1999 21% 231% 175% 27% 104%
2000-2008 -29% 72% 160% 8% 46%
Exports
Core Interdependent Partial Non-dedicated Total
1970-1979 -55% 10% 93% 1% 15%
1980-1989 -14% 130% 101% 40% 84%
1990-1999 202% 97% 18% 100% 82%
2000-2008 108% 4% 23% 50% 31%
Source:Authors’calculationswithdatafromtheDepartmentofLabour(DoL),theDepartmentofArtsandCulture(DAC),Quantecdatabases,theSouthAfricanReserveBank(SARB)andtheSouthAfricanRevenueService(SARS).
Also,thegrowthofemploymentincopyright-basedindustriesispresented.Itisnoticedthattheemploymentin interdependent copyright-based industries has decreased in the last two decades and employment ofpartialcopyright-basedindustrieshasdecreasedintheperiod2000to2008.Thenumberofemployeesincopyright-based industries has increasedby21%during theperiod2000 to2008.Although, the value-added of the interdependent industries kept increasing through the years, their employment decreasedduringtheperiod1990to2008.Itcanbespeculatedthatthisdecreasingtrendcanbeattributedtothefactthattheproductionmighthavebecomemorecapitalintensive–hence,lesslabourintensive.40Thiscanbelinkedtotheopeningofthecountrytotheinternationalmarketsaswellasthephenomenonofglobalisationandtransferofknowledge.Therestoftheindustrieswerenotaffectedbecausetheyarelesstechnology-drivenindustries.Inaddition,thistrendcanbesupportedbythefactthatthesameperiodalsowitnessedasignificantdropinthegrowthofimportsoftheinterdependentindustries.
Thetradeofcopyright-basedindustrieshasfollowedtheoveralltrendoftheSouthAfricantrade,showinghighincreasesinthe1990saftertheendofsanctions.Thecorecopyright-basedindustries’importsshowedasignificantdecrease(-29%)whiletheirexportsshowedahighincreasebetween2000and2008(108%);anindicationthatthistypeofindustrieseitherhadthecomparativeadvantageandbenefitedfromtheendofsanctionsor/andtheSouthAfricanconsumershad little interest for internationalproductsof thecore
40Thejointlabourintensityof‘television,radioandcommunication’,‘computersandequipment/photocopiers’and‘paperandpaperproducts’(themaininterdependentcopyright-basedindustries)decreasedby20%from2000to2008whileitscapitalintensityincreasedby1%(QuantecStandardisedIndustryDatabase(www.quantec.co.za/data/easydata-rsa-standardised-industry)).

The E
cono
mic C
ontri
butio
n of
Copy
right
-Bas
ed In
dustr
ies i
n Sou
th A
frica
28
copyright-industries.Thetotalcopyright-basedindustries’importsandexportsroseinthelast8yearsofthesampleby46%and31%respectively.
Figure 5: Evolution of Contribution of Copyright-Based Industries to Total Value-Added, Employment, Imports and Exports
Source:Authors’calculationswithdatafromtheDepartmentofLabour,theDepartmentofArtsandCulture(DAC),Quantecdatabases,theSouthAfricanReserveBank(SARB)andtheSouthAfricanRevenueService(SARS).
Figure5 shows the evolutionof the contributionof the total copyright-based industries to value-added,employment,importsandexportsfortheperiod1970to2008,whiletable4presentstheexactfigures.Eventhoughthegrowthofvalue-addedofthespecificindustrieswashigh,theircontributiontototalvalue-addedpresentedanincreaseuntilthebeginningofthe1980s.Fromthatpointonwards,thetrendvariedlittleintherangefrom4%to4.5%.
Thepercentageofworkforceemployedincopyright-basedindustriestothetotalhasalmostdoubledintheperiod1970to2008(lessthan2.3%in1970andalmost4.1%in2008),asshowninfigure5.Thecopyright-basedindustrieswereresponsibleforbetween8%and10%ofthecountry’simports,rangethatremainedrelativelyconstantwithasignificantspikeinthemiddleofthe1980s.Ontheotherside,thesector’sexportsshowedanoteworthyriseattheendofthe1980s.

The Economic Contribution of Copyright-Based Industries in South Africa
29
Table 4b: Copyright-Based Industries to Value-Added, Employment, Imports and Exports: 1970 to 2008
Value-added Employment Imports Exports
Units Rand million (2005=100) Number of employees Rand million (2005=100) Rand millions (2005=100)
1970 26,017 158,957 16,370 1,886
1971 27,621 166,305 16,978 3,528
1972 28,848 173,118 14,843 4,233
1973 30,098 180,671 17,260 3,969
1974 31,583 189,801 16,087 3,527
1975 31,608 198,524 18,308 3,760
1976 32,593 204,593 15,592 3,173
1977 31,678 205,084 11,870 3,785
1978 33,016 206,606 12,561 3,398
1979 35,543 212,198 12,976 3,047
1980 38,241 224,266 14,477 3,380
1981 41,417 235,598 16,777 3,240
1982 40,403 240,443 15,378 3,043
1983 39,616 240,172 15,634 2,837
1984 41,629 243,993 17,665 2,864
1985 40,865 246,132 14,433 3,470
1986 40,194 247,512 11,463 3,422
1987 40,185 253,199 12,424 4,146
1988 40,695 262,870 15,339 5,350
1989 41,299 270,180 14,213 5,541
1990 41,075 274,187 12,971 5,475
1991 40,599 276,915 13,673 5,590
1992 40,319 279,997 14,119 6,233
1993 41,585 279,880 15,759 7,489
1994 42,612 283,109 19,790 7,461
1995 43,671 293,405 22,855 10,562
1996 44,422 307,175 28,515 11,533
1997 45,619 315,569 28,223 11,700
1998 46,305 321,466 32,242 13,038
1999 47,648 336,375 25,700 12,050
2000 49,971 347,906 26,060 13,093
2001 50,283 357,886 26,027 14,266
2002 53,427 371,428 27,514 13,705
2003 54,058 383,586 27,977 14,119
2004 56,430 389,654 31,762 13,708
2005 58,840 389,480 38,645 16,080
2006 61,688 404,635 47,281 19,346
2007 64,693 420,615 49,203 22,209
2008 66,616 422,974 49,646 20,168
Source:Authors’calculationswithdatafromtheDepartmentofLabour,theDepartmentofArtsandCulture(DAC),Quantecdatabases,theSouthAfricanReserveBank(SARB)andtheSouthAfricanRevenueService(SARS).

The E
cono
mic C
ontri
butio
n of
Copy
right
-Bas
ed In
dustr
ies i
n Sou
th A
frica
30
5.2 comparison with other Economic SectorsTo put in context the findings of the analysis on the contribution of the copyright-based industries, wecompare their contribution to the total economy with that of other major sectors of the South Africaneconomy.
With regards tovalue-added,figure6 shows that thecopyright sectorhas contributedmore (4.11%) tothetotaleconomyin2008than‘agriculture’ (2.51%)and‘food,beveragesandtobacco’(3.09%).SouthAfrica’seconomy,however,isbasedmainlyonits‘manufacturing’and‘mining’sectors.Hence,asexpected,thecopyrightsectorcontributedsignificantlylessthanthe‘manufacturing’(18.36%)and‘mining’(6.15%)sectors.
Figure 6: Value-Added Contribution: Comparison with Other Sectors – 2008
Source:Authors’calculationswithdatafromtheDepartmentofArtsandCulture(DAC),QuantecdatabasesandtheSouthAfricanReserveBank(SARB).
Incontrast,asshowninfigure7,thenumberofemployeesinthecopyrightsector(4.08%)incomparisonwiththetotaleconomyislowerthanintheminingsector(4.96%)andsignificantlylowerthaninthe‘agriculture’(7.27%)and‘manufacturing’(12.47%)sectors.However,thesectoremploysmorethandoublethenumberofpeoplethanthe‘food,beveragesandtobaccosector’(1.96%).

The Economic Contribution of Copyright-Based Industries in South Africa
31
Figure 7: Employment Contribution: Comparison with Other Sectors – 2008
Source:Authors’calculationswithdatafromtheDepartmentofLabour,theDepartmentofArtsandCulture(DAC),QuantecdatabasesandtheSouthAfricanReserveBank(SARB).
Regardingthetradeofthecopyrightsector,theimportscontributiontothetotaleconomyis8.67%–muchhigherthanthe‘agriculture’and‘food,beveragesandtobacco’industries(1.09%and3.31%).Butasseeninfigure8,the‘manufacturing’and‘mining’sectorswerethemainimportersoftheeconomyin2008.Thepictureisnotdissimilarintheanalysisoftheexportsoftheeconomy(figure9).Itshouldbenotedthatthecopyrightsectorcontributes4.07%ofthecountry’sexportactivity,while‘food,beveragesandtobacco’andthe‘agriculture’sectorsarebelowthe4%markand‘mining’and‘manufacturing’sectorswerethedominantexportersofthecountryin2008.
Figure 8: Imports Contribution: Comparison with Other Sectors – 2008
Source:Authors’calculationswithdatafromtheDepartmentofArtsandCulture(DAC),theSouthAfricanReserveBank(SARB),theSouthAfricanRevenueService(SARS)andQuantecdatabases.

The E
cono
mic C
ontri
butio
n of
Copy
right
-Bas
ed In
dustr
ies i
n Sou
th A
frica
32
Figure 9: Exports Contribution: Comparison with Other Sectors – 2008
Source:Authors’calculationswithdatafromtheDepartmentofArtsandCulture(DAC),theSouthAfricanReserveBank(SARB),theSouthAfricanRevenueService(SARS)andQuantecdatabases.
5.3 core copyright-based IndustriesCore copyright industries includeactivities/industries engaged in creation,productionandmanufacturingperformance,broadcast,communicationandexhibitionordistributionandsalesofworksandotherprotectedsubjectmatter. In2008,theeconomicperformanceofcorecopyright-basedindustrieswasapproximately2%oftheentirenationaleconomy.Theircontributiontoemploymentwas2.3%whiletheirexportsandimportswereresponsiblefornotmorethan0.5%ofthenationaleconomy.
Asshownintable5,thevalue-addedofthetwomajorindustriesthatareincludedinthecorecopyright-based industries (‘film and television’ and ‘photography, software and databases, advertising’) increaseddrasticallythelasteightyears,affectingtheoveralltrendofthecorecopyright-basedindustriesthatincreasedsubstantiallyduringthe1990sandthe2000s(17%and24%respectively).
Withregardstoemployment,corecopyright-basedindustrieshavekeptrisingsincethe1970swithahigherincrease in the1990s.Employmentof ‘Photography, softwareanddatabases,advertising’hasknownanimpressiveincreasethroughthelast40years,morethandoublingduringthe1980s(table5).
Table 5: Value-Added, Employment, Imports and Exports Growth of Core Copyright-Based Industries in % 1970 to 2008
Value-added
Printing, publishing and recorded media
Film and television
Photography, software and databases, advertising
Core
1970-1979 30% 33% 23% 28%1980-1989 -1% 2% 9% 3%1990-1999 -2% 7% 39% 17%2000-2008 -6% 30% 40% 24%

The Economic Contribution of Copyright-Based Industries in South Africa
33
Table 5: Value-Added, Employment, Imports and Exports Growth of Core Copyright-Based Industries in % 1970 to 2008 (Continued)
Employment
Printing, publishing and recorded media
Film and television
Photography, software and databases, advertising
Core
1970-1979 20% 21% 79% 33%
1980-1989 8% 9% 106% 36%
1990-1999 6% 32% 98% 51%
2000-2008 10% 10% 45% 30%
Imports
Printing, publishing and recorded media Photography, software and databases, advertising
Core
1970-1979 12% -13% 9%
1980-1989 -18% -12% -17%
1990-1999 24% -2% 21%
2000-2008 -31% -8% 29%
Exports Printing, publishing and recorded media Photography, software and
databases, advertisingCore
1970-1979 -56% -55% -55%
1980-1989 -59% 127% -14%
1990-1999 308% 116% 202%
2000-2008 36% 228% 108%
Source:Authors’calculationswithdatafromtheDepartmentofLabour,theDepartmentofArtsandCulture(DAC),Quantecdatabases,theSouthAfricanReserveBank(SARB)andtheSouthAfricanRevenueService(SARS).
Asfarastradeofcorecopyright-basedindustriesisconcerned,theyexperiencedanincreaseoftheirimportsduringthe1990sasaresultofthere-openingoftheeconomytotherestoftheworld,howevertheimportsdecreasedby29%inthe2000s(table5).Fromtheexportspointofview,thefactthatexportsofthetotalcorecopyright-basedindustrieshaveincreasedby202%and108%inthe1980sand1990s,respectively,isveryencouragingforthesectors.
Exceptforthesectors’growththroughouttheperiod,itisofhighimportancetoexaminetheevolutionoftheircontributiontothetotaleconomy.Althoughthegrowthofvalue-addedwassignificant,thecontributionofcorecopyright-basedindustriestototalvalue-addedoftheeconomyhasshownadecreasingtrendsince1970.Anaverageincreaseof2.74%ofthetotalvalued-addedfortheperiod1970to2008incombinationwithamuchloweraverageincreaseofthevalue-addedofthecorecopyright-basedindustries(1.99%),leadtoanoveralldecreaseofthecontributionofthecoreindustriesasdefinedbytheratiocore copyright-based industries’ value-added/total economy’s value-added.Amongthemainsub-categoriesonlythecontributionof‘Photography,softwareanddatabases,advertising’presentedaminorincreaseintheperiod1970to2008.
Onthecontrary,the‘printing,publishingandrecordedmedia’ industryhasexperiencedarisingdecreasesince1980.Thistrendcanbelinkedtotwomainfacts,asalsomentionedinthesectiondealingwithtradeofthecorecopyright-basedindustries.ItiseitherindicativeoflowinterestoftheSouthAfricanconsumersfortheproductsoftheseindustriesoralowercomparativeadvantagetotherestoftheworldleadingtolessdemandoftheproductsoftheparticularindustry.

The E
cono
mic C
ontri
butio
n of
Copy
right
-Bas
ed In
dustr
ies i
n Sou
th A
frica
34
Figure 10: Core Copyright-Based Industries: Contribution to Total Value-Added
Source:Authors’calculationswithdatafromtheDepartmentofArtsandCulture(DAC),QuantecdatabasesandtheSouthAfricanReserveBank(SARB).
Infigure10,itisshownthatthecontributionofcorecopyright-basedindustrieshasdecreasedinthestudiedperiodbuthasalwaysremainedwithintherangeof2to3%.Themainsectorsthatareincludedinthecorecopyright-basedindustriesshowedstabilitywithverysmallfluctuations,forinstance‘printing,publishingandrecordedmedia’presentedarelativedecreasefrom1970to2008.
Infigure11,it isshownthatthecontributionofcorecopyright-basedindustriestototalemploymenthasincreasedconsiderablyfrom0.81%in1970to2.31%in2008.Thisincreasecanbeattributedmainlytotherisingcontributionofthe‘Photography,softwareanddatabases,advertising’totheeconomyinitsentirety.

The Economic Contribution of Copyright-Based Industries in South Africa
35
Figure 11: Total Core Copyright-Based Industries: Contribution to Employment
Source:Authors’calculationswithdatafromtheDepartmentofLabour,theDepartmentofArtsandCulture(DAC),QuantecdatabasesandtheSouthAfricanReserveBank(SARB).
Infigure12,thecontributionofcorecopyright-basedindustriestothetotaltradeofSouthAfricaispresented.Thecontributiontoimportshasexperiencedanoveralldecreasingtrendwithabighikeinthemiddleofthe1980swhichlater,attheendofthe1980s,wasneutralisedbyahighdeclinewhileontheothersidethecontributiontoexportshasincreasedtoasmallextentremaininghowever,atlevelslowerthan0.5%.

The E
cono
mic C
ontri
butio
n of
Copy
right
-Bas
ed In
dustr
ies i
n Sou
th A
frica
36
Figure 12: Core Copyright-Based Industries: Contribution to Imports and Exports
Source:Authors’calculationswithdatafromtheDepartmentofArtsandCulture(DAC),theSouthAfricanReserveBank(SARB),theSouthAfricanRevenueService(SARS)andQuantecdatabases.
5.4 Interdependent copyright-based IndustriesInterdependentcopyrightindustriesincludethoseengagedinproduction,manufactureandsaleofequipmentwhosefunctioniswhollyorprimarilytofacilitatethecreation,productionoruseofworksandotherprotectedsubject matter. In 2008, the economic performance of interdependent copyright-based industries wasapproximately0.5%oftheentirenationaleconomy.Theircontributiontoemploymentwas0.5%whiletheirexportscontributionwasalmost7.9%ofthenationaleconomy.Theirimportswereresponsiblefor2.7%ofthetotalimportsinSouthAfrica.
Table 6: Value-Added, Employment, Imports and Exports Growth of Interdependent Copyright-Based Industries in % from 1970 to 2008
Value-added
Television, radio and
communication
Computers and equipment,
photocopiers
Photographic and cinematographic
instruments
Paper and paper products
Interdependent
1970-1979 125% 58% 75% 65% 63%
1980-1989 11% -17% 0% 35% 20%
1990-1999 8% -14% 0% 14% 15%
2000-2008 29% 70% 199% 33% 40%

The Economic Contribution of Copyright-Based Industries in South Africa
37
Table 6: Value-Added, Employment, Imports and Exports Growth of Interdependent Copyright-Based Industries in % from 1970 to 2008 (Continued)
Employment
Television, radio and
communication
Computers and equipment,
photocopiers
Paper and paper products Interdependent
1970-1979 110% 36% 2% 31%
1980-1989 -2% 3% 30% 8%
1990-1999 19% -6% -14% -5%
2000-2008 -46% 30% 2% 16%
Imports
Television, radio and
communication
Computers and equipment,
photocopiers
Paper and paper products Interdependent
1970-1979 -15% -35% -31% -33%
1980-1989 54% 2% -31% 3%
1990-1999 454% 92% 50% 128%
2000-2008 56% 136% 81% 111%
Exports
Television, radio and
communication
Computers and equipment,
photocopiers
Paper and paper products Interdependent
1970-1979 7% -44% -17% 133%
1980-1989 149% 31% 151% 70%
1990-1999 274% 219% 54% 155%
2000-2008 29% 88% -27% 54%
Source:Authors’calculationswithdatafromtheDepartmentofLabour,theDepartmentofArtsandCulture(DAC),Quantecdatabases,theSouthAfricanReserveBank(SARB)andtheSouthAfricanRevenueService(SARS).
All the sub-categories that are included in the interdependent copyright-based industries experienced asignificant increase in their value-added,especially in theperiod2000 to2008 (table6). In the1990s,adeceleration was experienced – presented either by a decrease (‘computers and equipment’) or a lowerincreasethanthepreviousyears(‘television,radioandcommunication’and‘paper’).However,theindustrieswiththenegativegrowthinvalue-addedduringthe1990salmostcaughtupwiththerestbyshowingahighincreaseinthe2000s(‘computersandequipment,photocopiers’=70%,’photographicandcinematographicinstruments’=199%).
Ascanbeseenintable6,thegrowthofemploymentofthetotalinterdependentcopyright-basedindustrieswasnegative in the1990sbut recovered in the2000s.Thisdecrease canbeattributed toadecrease in‘computersandequipment,photocopiers’and‘paperandpaperproducts’’employment,-6%and-14%,respectively, while the ‘television, radio and communication equipment’ enjoyed a 19% growth. On thecontrary, in the2000s ‘television, radio and communication equipment’ showedadifferent picturewitha decrease of 46% that was not however, able to influence the overall increase of the interdependentindustries’employment(16%).Thisdecreasingtrendcanbeattributedtothefactthattheproductionmighthaveturnedtomorecapitalintensive–hence,lesslabourintensive–methods.
Thegrowthoftheinterdependentcopyright-basedindustrieswithregardstotradehasbeensignificantfortheyearsaftertheendofsanctions.Bothimportsandexportsincreasedsubstantiallyinthe2000s(table6)withtheexceptionof‘paperandpaperproducts’whoseexportsdeclinedby27%duringtheperiod2000to2008.Asexpected,thehighestincreaseswereexperiencedinthe1990s.

The E
cono
mic C
ontri
butio
n of
Copy
right
-Bas
ed In
dustr
ies i
n Sou
th A
frica
38
Asfarastheevolutionoftheinterdependentcopyright-basedindustries’contributionisconcerned,figure13showsadecreaseinthecontributionofinterdependentcopyright-basedindustriestothetotalvalue-added.However, putting that into perspective, the total interdependent copyright-based industries have nevercontributedmore than0.9%to the totaleconomy.Therefore, thedecrease–althoughsignificant–wasnotmajor.Alltheindependentsub-categories,exceptfrom‘computersandequipment,photocopiers’,haveremainedconstantduringtheperiod1970to2008.
Figure 13: Interdependent Copyright-Based Industries: Contribution to Value-Added
Source:Authors’calculationswithdatafromQuantecdatabases,theDepartmentofArtsandCulture(DAC)andtheSouthAfricanReserveBank(SARB).

The Economic Contribution of Copyright-Based Industries in South Africa
39
Figure 14: Interdependent Copyright-Based Industries: Contribution to Employment
Source:Authors’calculationswithdatafromtheDepartmentofLabour,theDepartmentofArtsandCulture(DAC),QuantecdatabasesandtheSouthAfricanReserveBank(SARB).
Thecontributionoftheinterdependentcopyright-basedindustriestoemploymenthasremainedinverylowlevels–below0.6%.Thecontributionoftheinterdependentcopyright-basedindustriesseparatelyhasnotexceeded0.4%ofthetotalemploymentandremainedrelativelyconstantthroughtheyears(figure14).
The contribution of the interdependent copyright-based industries to the overall trade is presented infigure15.Bothcontributiontoexportsandimportsshowasimilarincreasingtrendduringthelast40years.

The E
cono
mic C
ontri
butio
n of
Copy
right
-Bas
ed In
dustr
ies i
n Sou
th A
frica
40
Figure 15: Interdependent Copyright-Based Industries: Contribution to Imports and Exports
Source:Authors’calculationswithdatafromtheDepartmentofArtsandCulture(DAC),theSouthAfricanReserveBank(SARB),theSouthAfricanRevenueService(SARS)andQuantecdatabases.
5.5 partial copyright-based IndustriesPartialcopyrightindustries includethoseinwhichaportionoftheactivities isrelatedtoworksandotherprotectedsubjectmatterandmayinvolvecreation,productionandmanufacturing,performance,broadcast,communicationandexhibitionordistributionandsales.In2008,theircontributiononallindicatorsanalysedwasapproximately0.2%withtheexceptionofimports(0.36%).
Table 7: Value-Added, Employment, Imports and Exports Growth of Partial Copyright-Based Industries in % 1970 to 2008
Value-added
Apparel, textiles and footwear
Furniture, jewellery, musical instruments, games
and toys
Crafts Glass and glass products
Partial
1970-1979 53% 28% 48% 38% 36%
1980-1989 2% 124% 60% 25% 94%
1990-1999 -13% -5% -8% 15% -6%
2000-2008 18% 25% 22% 71% 24%

The Economic Contribution of Copyright-Based Industries in South Africa
41
Table 7: Value-Added, Employment, Imports and Exports Growth of Partial Copyright-Based Industries in % 1970 to 2008 (Continued)
Employment
Apparel, textiles and footwear
Furniture, jewellery, musical instruments, games
and toys
Crafts Glass and glass products
Partial
1970-1979 20% 34% 28% -3% 29%
1980-1989 1% 47% 24% 20% 30%
1990-1999 -24% 5% 19% -11% 12%
2000-2008 -36% 0% -20% 11% -13%
Imports
Apparel, textiles and footwear
Furniture, jewellery, musical instruments, games
and toys
Glass and glass products Partial
1970-1979 -53% -27% -49% -31%
1980-1989 -22% -8% 1% -9%
1990-1999 109% 183% 85% 175%
2000-2008 114% 164% 111% 160%
Exports
Apparel, textiles and footwear
Furniture, jewellery, musical instruments, games
and toys
Glass and glass products Partial
1970-1979 15% 91% 174% 93%
1980-1989 -20% 108% 13% 101%
1990-1999 33% 18% 40% 18%
2000-2008 -72% 25% -22% 23%
Source:Authors’calculationswithdatafromtheDepartmentofLabour,theDepartmentofArtsandCulture(DAC),Quantecdatabases,theSouthAfricanReserveBank(SARB)andtheSouthAfricanRevenueService(SARS).
Thevalue-addedofthepartialcopyright-basedindustriesincreasedsignificantlyfrom1970to1989,declinedby6%inthe1990sandhasincreasedsince2000by24%(table7).Allthesub-categoriesshowedadeclinein theperiodfrom1990to1999,with theexceptionof ‘glassandglassproducts’.Thisdecreasecanbeattributedtothecomparativedisadvantageoftheparticularproducts,alsoexpressedinthehighincreaseof imports and lower increaseof exportsduring the1990sandafter theopeningof the country to theinternationalmarkets.
Theemploymentofthepartialcopyright-basedindustriesshowedadecliningtrendinthelastdecadewith‘apparel,textilesandfootwear’employing36%lessemployeesintheperiod2000to2008asaresultofthedeclineoftheproduction(value-added)inthe1980sand1990s(table7).
Contrarytoothercopyright-basedindustries,theimportsofthepartialcopyright-basedindustriesincreasedgreatlyinthelasttwodecades(table7).However,theexportsshowedasmallbutnotunimportantincrease(23%)duringthe2000s(table7)whilethe‘apparel,textilesandfootwear’exportedalmost72%lessin2008thanin2000.Thegrowthofexportsinthe1990swiththeopeningoftheeconomywasnotashighasinothersectorswith‘glassandglassproducts’increasingbyalmost40%and‘apparel,textilesandfootwear’by33%.
Theseresultsshowoncemorethecomparativedisadvantageofthepartialcopyright-basedindustriesintheperiodwhenthesanctionsendedandtheSouthAfricaneconomyopenedtotheworld.TheimportsoftheindividualindustriesweresubstantiallyhigherthantheirexportsshowingaclearinterestoftheSouthAfricanconsumersforinternationalproductsofthepartialcopyright-basedindustries.

The E
cono
mic C
ontri
butio
n of
Copy
right
-Bas
ed In
dustr
ies i
n Sou
th A
frica
42
Withregardstothepartialcopyright-basedindustries’contribution,eventhoughthegrowthof‘glassandglassproducts’value-addedwassubstantial, itscontributiontothetotalvalue-addedwasnegligible.Theminorriseofthecontributionofthetotalpartialcopyright-basedindustriesattheendof1980sdidnotlastlong.Itreturnedtoitsinitiallevelsof0.05%attheendof1990s.
Figure 16: Partial Copyright-Based Industries: Contribution to Value-Added
Source:Authors’calculationswithdatafromtheDepartmentofArtsandCulture(DAC),QuantecdatabasesandtheSouthAfricanReserveBank(SARB).
Theircontributiontothetotalworkforceofthecountrystarteddecliningin1996,afterasteepincreaseintheperiod1994to1996.Onlythe ‘crafts’ industryfollowstheoverall trend,showingthat it is themaincontributortopartialcopyright-basedindustries,withregardstoemployment.

The Economic Contribution of Copyright-Based Industries in South Africa
43
Figure 17: Partial Copyright-Based Industries: Contribution to Employment
Source:Authors’calculationswithdatafromtheDepartmentofLabour,theDepartmentofArtsandCulture(DAC),QuantecdatabasesandtheSouthAfricanReserveBank(SARB).
Asfaraspartialcopyright-basedindustriescontributiontotradeisconcerned,bothcontributiontoexportsandimportsshowedanincreasingtrend.Thenagain,thecontributiontotradewasneverhigherthan0.05%,nothavingasignificantimpactinthecountry’strade.
Figure 18: Partial Copyright-Based Industries: Contribution to Imports and Exports
Source:Authors’calculationswithdatafromtheDepartmentofArtsandCulture(DAC),theSouthAfricanReserveBank(SARB),theSouthAfricanRevenueService(SARS)andQuantecdatabases.

The E
cono
mic C
ontri
butio
n of
Copy
right
-Bas
ed In
dustr
ies i
n Sou
th A
frica
44
5.6 non-dedicated copyright-based IndustriesNon-dedicatedcopyrightindustriesincludethoseinwhichaportionoftheactivitiesisrelatedtofacilitating,broadcast, communication, distribution or sales of works or other protected subject matter and whoseactivitieshavenotbeen included inthecorecopyright industries. In2008, theeconomicperformanceofnon-dedicated copyright-based industrieswasapproximately1.3%of theentirenational economy. Theircontributiontoemploymentwas1.03%whiletheirexportscontributionwaslessthan0.2%ofthenationaleconomy.Theirimportswereresponsibleforonly0.55%ofthetotalimportsinSouthAfrica.
Table 8: Value-Added, Employment, Imports and Exports Growth of Non-Dedicated Support Copyright-Based Industries in % 1970 to 2008
Value-added
Wholesale and retail trade Transport, storage and communication
Non-dedicated support
1970-1979 35% 63% 44%
1980-1989 20% 15% 18%
1990-1999 21% 50% 31%
2000-2008 36% 57% 45%
Employment
Wholesale and retail trade Transport, storage and communication
Non-dedicated support
1970-1979 30% 48% 21%
1980-1989 18% -3% 10%
1990-1999 21% -28% 4%
2000-2008 21% 2% 17%
Imports
Wholesale and retail trade Transport, storage and communication
Non-dedicated support
1970-1979 52% -20% -20%
1980-1989 10% 49% 49%
1990-1999 17% 27% 27%
2000-2008 -11% 9% 8%
Exports
Wholesale and retail trade Transport, storage and communication
Non-dedicated support
1970-1979 -18% 13% 1%
1980-1989 105% 18% 40%
1990-1999 158% 70% 100%
2000-2008 34% 62% 50%
Source:Authors’calculationswithdatafromtheDepartmentofLabour,theDepartmentofArtsandCulture(DAC),Quantecdatabases,theSouthAfricanReserveBank(SARB)andtheSouthAfricanRevenueService(SARS).
Thevalue-addedofthenon-dedicatedcopyright-basedindustrieshasbeencontinuallyincreasingsince1970.Morespecifically,the‘transport,storageandcommunication’sector’svalue-addedincreasedby57%inthe2000sandthe‘wholesaleandretailtrade’by36%(table8).
With regards to employment, the non-dedicated copyright-based industries increased their number ofemployeesoverall(17%inthe2000s).However,theincreaseinthe‘transport,storageandcommunication’wasatthelowlevelof2%(table8).

The Economic Contribution of Copyright-Based Industries in South Africa
45
Thenon-dedicatedcopyright-basedindustriesimportshaveshownanincreaseinthe2000sof8%whiletheoneofthetwomainsub-categories’(‘wholesaleandretailtrade’) importshavedecreasedby11%inthesameperiod.Theexportsofthisgrouphaveincreasedsubstantiallythroughthelast30years(40%in1980s,100%in1990sandalmost50%in2000s)(table8).
Theircontributiontotheeconomy’svalue-addedhasshownarisingtrendfrom0.93%in1970to1.29%in2008(figure19).Thisincreasemaybeaccreditedtotheincreaseofthecontributionofthe‘transport,storageandcommunication’sector,whilethe‘wholesaleandretailtrade’contributionremainedmoreorlessstableintherangebetween0.6and0.8%.
Figure 19: Non-Dedicated Copyright-Based Industries: Contribution to Value-Added
Source:Authors’calculationswithdatafromtheDepartmentofArtsandCulture(DAC),QuantecdatabasesandtheSouthAfricanReserveBank(SARB).
Thenon-dedicatedcopyright-basedindustries’contributiontothetotallabourofthecountryhasincreasedfrom0.79%in1970to1.026%in2008,notadrasticincreasebutonethatshouldbetakenintoconsideration(figure20).However,the‘transport,storageandcommunication’sector’scontributiontothetotalworkforcehasexperiencedadecreasingtrendafter1984,from0.325%in1984to0.2%in2008.

The E
cono
mic C
ontri
butio
n of
Copy
right
-Bas
ed In
dustr
ies i
n Sou
th A
frica
46
Figure 20: Non-Dedicated Copyright-Based Industries: Contribution to Employment
Source:Authors’calculationswithdatafromtheDepartmentofLabour,theDepartmentofArtsandCulture(DAC),QuantecdatabasesandtheSouthAfricanReserveBank(SARB).
Infigure21,itcanbeseenthatthecontributiontoimportsofthenon-dedicatedcopyright-basedindustrieshasbeendecreasingsincethe1990swhileitscontributiontoexportshasshownanincreasingtrendsince1988.Althoughthetrendshavechangedincomparisonwiththe1970s,thecontributionofnon-dedicatedcopyright-basedindustriesinthetotaltradehasnotexceeded0.7%forexportsand0.5%forimports.
Figure 21: Non-Dedicated Copyright-Based Industries: Contribution to Imports and Exports
Source:Authors’calculationswithdatafromtheDepartmentofArtsandCulture(DAC),theSouthAfricanReserveBank(SARB),theSouthAfricanRevenueService(SARS)andQuantecdatabases.

The Economic Contribution of Copyright-Based Industries in South Africa
47
6 . D i s c u s s i o n
Thepurposeof this studywas to investigate thecontributionof copyright-based industries to theSouthAfricaneconomy.Theresultsoftheanalysisshowthatthecopyright-basedindustriescontributesignificantlyto the total value-added, employment and trade. The results show that the copyright-based industriescontributemorethantheagricultureandfoodandbeveragesectors,howevertheircontribution is lowerthantraditionallybigcontributorssuchas‘mining’and‘manufacturing’.
Thecopyright-based industriesareresponsibleforalmost4.11%ofthetotaleconomy intermsofvalue-added,withcorecopyright-basedindustriesbeingthehighestcontributor(2.05%)andthenon-dedicatedcopyrightindustriesfollowingwith1.29%.Asfarasemploymentisconcerned,4.08%oftheworkforceisemployedinthecopyright-basedindustries,themajorityofwhichisemployedinthecoreandnon-dedicatedcopyright-basedindustries(2.31%and1.03%).Theinterdependentcopyright-basedindustriesshowahighcontributionintheexportsoftheeconomy(2.77%)andanevenhighercontributiontothetotalimports(7.85%).
Thecontributionofthetotalcopyright-basedindustriesinSouthAfricaintermsofvalue-added(4.11%)issignificantlylowerthantheothercountries,whosestudieswerereviewed.OnlyBulgaria’soverallcontributionofcopyright-basedindustriestototalvalue-addedwaslowerthanSouthAfrica’s(2.38%).Therestofourresultsare inagreementwith international standards thatalso indicateahighercontributionof thecorecopyright-basedindustriesforall indicators.Followingthecomparison, inSouthAfricathenon-dedicatedsupport copyright-based industriespresentahigher contribution to the total economy than in theotherinternationalstudies.
ThisstudyusesacompleteInput-Outputanalysiscalculatingmultiplierstoshownotonlythedirecteffectsofthecopyright-basedindustriesbutalsotheindirecteffectstotheeconomy.Intable9,theproduction-inducedeffectofanumberofindustriesontotaloutputispresented.Thismultipliersumsupfirst-roundeffects(howmuchanindustrymustincreaseitsinputsfromotherindustriesandfromitself,inordertoproduceanextraunitofoutputtomeetaZAR1.00increaseinfinaldemand)andindustrialsupporteffects(howmuchotherindustrieswillneedtoincreasetheirpurchasestoexpandtheiroutputtomeetthefirst-roundrequirements).
TheonlyindustriesmissingfromtheInput-Outputanalysisare‘filmandtelevision’and‘crafts’.Inordertoestimatethetotalproduction-inducedeffectweassumethattheirindirecteffectswouldbeproportionatelydependentontheirdirectcontributionof2008andtherelativeindirecteffectsof‘printing,publishingandrecordedmedia’and‘furniture’industriesrespectively.Forexample,the‘filmandtelevision’directcontributionwas0.42%, the ‘printingpublishingand recordedmedia’was0.47%and the latestproduction-inducedeffectwas1.79%.Basedonthisweassumethat‘filmandtelevision’s’production-inducedeffectwas1.6%.
Table 9: Production-Induced Effect of Copyright-Based Industries (Input-Output 2009)
Production-induced effect
Adjusted for copyright
factors
Production-induced effect
Adjusted for copyright
factorsIndustry Outcome Employment
Photography, software and databases, advertising 1.13% 0.11% 2.97% 0.30%
Communication 1.18% 0.07% 2.73% 0.16%
Crafts* 0.76% 0.32% 2.87% 1.21%
Film and television* 1.60% 1.60% 2.98% 2.98%
Footwear 2.08% 0.01% 6.23% 0.02%
Furniture 1.93% 0.19% 6.48% 0.65%
Glass and glass products 1.49% 0.01% 4.89% 0.03%
Computers and equipment, photocopiers 1.70% 0.06% 4.93% 0.17%
Other manufacturing 1.23% 0.12% 3.65% 0.37%

The E
cono
mic C
ontri
butio
n of
Copy
right
-Bas
ed In
dustr
ies i
n Sou
th A
frica
48
Table 9: Production-Induced Effect of Copyright-Based Industries (Input-Output 2009) (Continued)
Paper and paper products 2.02% 0.50% 5.77% 1.44%
Printing, publishing and recorded media 1.79% 1.79% 5.17% 5.17%
Television, radio and communication equipment 1.64% 0.57% 4.75% 1.66%
Textiles 1.81% 0.01% 6.05% 0.02%
Transport and storage 1.19% 0.07% 3.02% 0.17%
Wearing apparel 1.59% 0.01% 6.19% 0.02%
Wholesale and retail trade 1.00% 0.06% 2.63% 0.15%
Total 5.49% 14.52%
Where*denotesindustrieswithfiguresbyextrapolationSource:Authors’calculationswithdatatheSupplyandUseTables(SUT)ofStatisticsSouthAfrica(StatsSA).
The resultspresented in table9 illustrate the importanceof thecopyright-based industries for theSouthAfrican economy. The overall production-induced effect in terms of value-added is 5.49% while theproduction-inducedeffecttototalemploymentis14.52%.
Ifappropriatepoliciesareimplementedresultinginanincreaseofthedemandforproductsforinstanceofthesector‘printing,publishingandrecordedmedia’aseriesoflinkswilloccuraffectingthroughindividualsectors theeconomy in itsentirety. If thedemand for ‘printing,publishedand recordedmedia’productsincreases by ZAR 100 000 the industry must increase its inputs from other industries and from itself byR69000(first-roundeffectsmultiplier).
Thisneedwillincreasethedemandofproductsofotherindustriessuchasforexampleanothercopyright-basedindustry:‘paperandpaperproducts’,amongothers.Now,the‘paperandpaperproducts’industryneeds to increase its supplyofproducts tocover theneedsof ‘printing,publishingand recordedmedia’industry.Todoso,itwillneedtoincreaseitsinputsbyZAR0.78foreveryZAR1.00ofdemand.
Butalsosuchanincreaseinthe‘printing,publishedandrecordedmedia’industrywillalsoinfluenceothersectorsintheeconomy.Amongtheinputsthat‘printing,publishedandrecordedmedia’willneedinordertomeetanincreaseinthedemandisforexamplesomeformofenergy,i.e.electricity.Tocoverthenewdemandforitsproduct,thesector‘electricity,gasandsteam’willhavetoincreasetheirinputsbyZAR0.465foreveryZAR1.00ofdemand.
Similareffectswillbeexperiencedwiththeemploymentandtradeofthesectorsthataretryingtomeettheincreaseddemand,theywillaffectvariousotherindustriesbyaskingforinputs.
Animportantissuenotcoveredontheaboveanalysisistheconcernsrelatedtothedeficitofcopyrightroyaltyflows.Wediscusstheissuebelow.
6.1 copyright in tradeAn important concern is related to theargument that copyrightbenefits exporting countries at the costofcountrieslikeSouthAfricawhicharenetimportersofcopyrightmaterial.Theissuehasbeenstudiedinthe“GowersReviewofIntellectualProperty(2006)41intheUK,bytheOfficeofRegulationReview(1995)in Australia and others. More recently, IPO (2009)42 took this study a step further and according to theAustraliangovernmentthemajorityoftherecommendationswillsoonbeimplemented.43
41GowersReview(2006).“Gowers Review of Intellectual Property”.HMSO,Norwich,NR31BQ42IntellectualPropertyOffice(IPO),2009,“Taking forward the Gowers Review of Intellectual Property: Second Stage Consultations on
Copyright Exceptions”.IPO,UnitedKingdom.Availableat:www.ipo.gov.uk/consult-gowers2.pdf43Ibid.

The Economic Contribution of Copyright-Based Industries in South Africa
49
TheargumentisthatsinceSouthAfricahasanetdeficitofcopyrightroyaltywhichflowsoutofthecountry,thecountrymaybenefitfromfreeridingontheinnovativeactivitiesoftherestoftheworld.Australiaforexamplehasarguedthatthecountryshouldnotextendcopyrightprotectionbeyondthelimitsdemandedbytheinternationaltreatiesobligationsbecauseofthenetcostsofsuchprotection44.
ThemaintenanceoftheexistingstandardswerebasedonthefactthatanyreductioninthescopebeyondtheminimumstandardsprovidedinBerneandTRIPswouldentailcoststoreciprocaltreatmentofAustraliancopyright producers under those conventions and the generally good reputation that Australia has as aresponsiblememberoftheinternationalcommunityofnations.
Itwasalsoarguedthatsuchchangesmayhavelabourmarketimplicationsforcopyrightindustriesastheycanmovetheiroperationsabroadwheretheconditionsmaybemorefavourable.
WhilewepresentevidenceoftheSouthAfricantrade incopyrightmaterialswewould liketoemphasisethattheargumentatstakeisthebenefitsandcostsofprotectionismversusfreetradewhichTRIPsandWIPOhavebeensoconcernedtopromote.Richardsonet al. (2000)45argue that theargument reflects theoldmercantilistfallacythatexportsaregoodandimportsarebad.TheargumenthasbeenattackedbyAdamSmith inhisWealthofNations46 (1776).“WhatSmithshowed is thatmercantilismprovidesavehicle forsubsidisingtheinefficienteffortsoflocalproducers,whoseektopreventcompetitionfromcheaperimportstotheultimatedetrimentofconsumers.Economistshaveacceptedforover200yearsthatmercantilismisafallacywhenappliedtoindustriessuchastextiles,shoesandmeat.Thelogicalandrationalpositionwithrespecttocopyrightindustriesisexactlythesame”(Richardsonet al.,2000)47.
Tradeincopyrightconsistsoftwocomponents.Thefirstcomponentispartofthemerchandisetradeandincludestradeincommoditiessuchasbooks,newspapers,periodicals,soundrecordingsandotherrecordedtapes and disks passing through merchandise trade. The second component is made up of licence feesandroyaltiespaidfortheuseofproductssuchascomputerandinformationservices,software,films,TVprogrammesandsoundrecordings.Theseroyaltiesareincludedintradeinservicesinthebalanceofpayments.
Figures22and23showthesharesofimportedandexportedtradedcopyrightmaterialinthetotalimportsandexportsofthecountryfortheperiod1970to2008.
Figure 22: South Africa Printing, Publishing and Recorded Media Exports: Share to Total Exports
Source:Authors’calculationswithdatafromtheSouthAfricanReserveBank(SARB),theSouthAfricanRevenueService(SARS)andQuantecdatabases.
44ORR(1995)“An Economic Analysis of Copyright Reform”(submissiontothecopyrightlawreviewcommittee’sreviewofthecopyrightact1968)OfficeofRegulationReview,Australia.
45RichardsonM.,GansJ.,HanksF.andWilliamsP.(2000)“The Benefi ts and Costs of Copyright: An Economic Perspective”CentreforCopyrightStudiesLtd,DiscussionPaper,Australia.
46SmithA.(1776)“An Inquiry into the Nature and Causes of the Wealth of Nations”,asquotedinRichardsonetal.(2000)47Seefootnote39.

The E
cono
mic C
ontri
butio
n of
Copy
right
-Bas
ed In
dustr
ies i
n Sou
th A
frica
50
Theshareof‘printing,publishingandrecordedmedia’exportswas0.158%during2008whiletheirshareofimportshasbeenreducedfrommorethan5%inthe1980sto0.351%in2008.
The SouthAfrican shareof ‘printing, publishing and recordedmedia’ exports (0.15%) is lower than theaverageinEurope(table10),whiletheshareofimports(0.35)isjustbelowthoseappearingintable10.
Figure 23: South Africa Printing, Publishing and Recorded Media Imports: Share to Total Imports
Source:Authors’calculationswithdatafromtheSouthAfricanReserveBank(SARB),theSouthAfricanRevenueService(SARS)andQuantecdatabases.
Table 10: Trade in Copyright Dependent Goods
Share of copyright material in merchandise exports (%)
Share of copyright material in merchandise imports (%)
Australia 1996 to 1997 0.5 2.2EU-12 0.8 0.7Belgium – Luxembourg 0.5 0.8Denmark 0.9 0.8Germany 0.8 0.7Greece 0.2 0.5Spain 0.6 0.6France 0.6 0.8Ireland 4.9 1.0Italy 0.4 0.5the Netherlands 1.0 0.9Portugal 0.2 0.6the UK 1.1 0.9the EFTA 0.4 1.1the USA 1.1 0.5Japan 0.8 0.4

The Economic Contribution of Copyright-Based Industries in South Africa
51
Table 10: Trade in Copyright Dependent Goods (Continued)
Korea (South) 1.3 0.2Brazil 0.1 0.7India 0.1 0.4
Source:Revesz(1999)48
Figure24showsthetradebalanceofthe‘printing,publishingandrecordedmedia’industryinSouthAfrica.ThetradebalancehasbeenreducedfromjustbelowZAR8billioninthe1980stojustaboveZAR1billionin2008,in2005values.
Figure 24: Trade Balance: South Africa Printing, Publishing and Recorded Media 1970 to 2008
Source:Authors’calculationswithdatafromtheSouthAfricanReserveBank(SARB),theSouthAfricanRevenueService(SARS)andQuantecdatabases.
Tradeincopyrightservicesstatistics(thesecondcomponentoftradeincopyright)isnotavailableinSouthAfrica.Inordertohaveanestimateweassumethat50%ofreceiptsandpaymentsregisteredunderroyaltiesandlicencefeesand10%ofthoseunder‘architectural,engineeringandothertechnicalservices’arecopyrightrelated.Table11showsthepaymentsandreceiptsincopyrightservices.
48ReveszJ.(1999)“Trade Related Aspects of Intellectual Property Rights”ProductivityCommissionStaffResearchPaper,AGPS,Canberra.

The E
cono
mic C
ontri
butio
n of
Copy
right
-Bas
ed In
dustr
ies i
n Sou
th A
frica
52
Table 11: Payments and Receipts in Copyright Services
Year Payments (ZAR million current)
Receipts (ZAR million current)
Balance (ZAR million current)
2000 115.70 75.80 -39.90
2001 138.00 80.00 -58.00
2002 184.40 88.20 -96.20
2003 180.00 90.80 -89.20
2004 202.00 98.40 -103.60
2005 293.80 115.60 -178.20
2006 604.10 104.30 -499.80
2007 688.00 186.70 -501.30
2008 815.10 271.35 -543.75
Source:TheReserveBank–personalcommunication.
Thesumofthebalancesincopyrightservicesandinmerchandisetradeshowsthetotaleffectofcopyrightinthecountry’simportsandexports.ItbecomesapparentthatthesizeofdeficitsbothinthetradeandthebalanceofpaymentsinSouthAfricaaremuchsmallerthanthoseinothercountriesandhencetheissueofdeficitsdoesnotwarrantfurtherdiscussion.
6.2 recommendationsDuring the process of our investigation a number of questions were raised which lead to a number ofrecommendations.
From a methodological prospective WIPO’s guidelines49 identify the industries affected by copyright andsuggestcertaincopyrightcoefficients.Thecoefficients reflect thecopyrightcomponentswithinparticularindustriesandhencethepercentageofvalue-addedthatshouldbeallocatedtocopyrightcontribution.Theguidestates:“Forarchitecture,forexample,variousstudiestakebetween65%and75%ofthearchitecturalindustry as having a copyright component”50. Further the guide suggests that “an approximate averageof the contribution of the non-core groups, based on the results from the past studies, would indicatethat this contribution is around 30% of the entire contribution of all copyright-based industries”51. Theguideconcludesthat“theprocedureofestablishingtheweightingswouldcombineseveralapproachesortechniques…”52.AsthecopyrightcoefficientsmaychangeovertimeandmaydifferfromcountrytocountrywesuggestthatWIPOconsidersdevelopingguidelinesfortheestimationofcopyrightcoefficients.
WIPO’sinterestinpromotingthecopyrightindustriesiscurrentlyfocusedinthemeasurementoftherelevantimpact on the economy. However, the impact of the copyright-based industries is dependent mainly onthestructureoftheeconomyandtheimportance/incentivesprovidedforthedevelopmentandgrowthoftherelevantclusters.WesuggestthatWIPOshouldidentifyinternationalbestpracticeinthepromotionofcopyright-basedindustriesanddisseminatetheinformationtomemberstates.
The South African authorities provide limited information related to copyright industries. As a result thecopyright-based industries are not in the radar of the policy-makers. Furthermore, the lack of relevantinformationimpedesthecountry’slimitedresearchexpertiseininvestigatingtherelevanteconomicclusters.WesuggestthattheDepartmentofTradeandIndustry(DTI)andtheDepartmentofArtsandCulture(DAC)requestfromStatisticsSAandtheReserveBanktoseparatethestatisticsrelatedtocopyright-basedindustriesandpublishthemregularly.
49WIPO(2003)“Guide on Surveying the Economic Contribution of the Copyright-Based Industry”.WorldIntellectualPropertyOrganization,Geneva.
50Ibid.p.34.51Ibid.p.59.52Ibid.p.59.

The Economic Contribution of Copyright-Based Industries in South Africa
53
TheSouthAfricancopyright regimedoesnot includeexceptionsand limitations for thevisually impairedorforthebenefitofpeoplewithanyotherdisability(e.g.dyslexics)aswellasfortechnologicalprotectionmeasures(suchasencryptionoftheprotectedmaterial)andelectronicrightsmanagementinformation(suchasdigitalidentifiers).Furthermore,despitetheexistenceofexceptionsforpurposesofillustration,forteachingandresearch,thelegaluncertaintysurroundingtheuseofworkshasledtotheconclusionofagreementsbetweenthecollectingsocietiesandeducationalestablishmentstothefinancialdetrimentofthelatter.Asexceptionshavethepotentialstocreatevalue(GowersReview,2006)53wesuggestthatDTIshouldreviewtheCopyrightActinordertointroducelimitationsinaccordancewiththeBerneConventionthreestepstest(article9(2))andwiththefairuseprovisionandtoclarifyclausesasnecessary.
TheDTIshoulddeveloparesearchprogrammesupportingresearcherinitiatedprojectsrelatedtoIPRingeneralandcopyright inparticular. Thisprogrammewillprovidecontinuous researchand intelligence supportingtheneedsoftheDTIrelatedtoIPRsandsimultaneouslywilldeveloprelevantexpertiseinthecountry.TheNationalResearchFoundationmayundertaketoimplementsuchaprogrammeontheinstructionsoftheDTI.
53GowersReview(2006).“Gowers Review of Intellectual Property”.HMSO,Norwich,NR31BQ.

The E
cono
mic C
ontri
butio
n of
Copy
right
-Bas
ed In
dustr
ies i
n Sou
th A
frica
54
A p p e n d i x 1
Table 12: Highest and Lower Piracy Rates Internationally
Highest Piracy Lowest PiracyGeorgia 95% United States 20%Bangladesh 92% Japan 21%Armenia 92% Luxembourg 21%Zimbabwe 92% New Zealand 22%Sri Lanka 90% Austria 24%Azerbaijan 90% Belgium 25%Moldova 90% Denmark 25%Yemen 89% Sweden 25%Libya 87% Switzerland 25%Pakistan 86% Australia 26%Venezuela 86% Finland 26%Indonesia 85% Germany 27%Vietnam 85% United Kingdom 27%Iraq 85% Netherlands 28%Ukraine 84% Norway 28%Algeria 84% Israel 32%Montenegro 83% Canada 32%Paraguay 83% Ireland 34%Cameroon 83% South Africa 35%Nigeria 83% Singapore 36%Zambia 82% UAE 36%Bolivia 81% Czech Republic 38%Guatemala 81% Taiwan 39%China 80% Réunion 40%El Salvador 80% France 41%
Source:BSA-IDC200954
54BSA-IDC2009“Sixth Annual BSA-IDC Global Software: 08 Piracy Study”BusinessSoftwareAlliancehttp://global.bsa.org/globalpiracy2008/studies/globalpiracy2008.pdf

The Economic Contribution of Copyright-Based Industries in South Africa
55
A p p e n d i x 2 I n t e r n a t i o n a l S t u d i e s D a t a
Thesourcesoftheinternationaldataarethefollowing:
• World Intellectual Property Organization (WIPO), 2006, National Studies on Assessing the Economic Contribution of the Copyright-Based Industries No. 1: The economic contribution of copyright-based industries in Singapore 2004.WIPO:Switzerland.
• World Intellectual Property Organization (WIPO), 2006, National Studies on Assessing the Economic Contribution of the Copyright-Based Industries No. 1: The economic contribution of copyright-based industries in Canada 2004.WIPO:Switzerland.
• World Intellectual Property Organization (WIPO), 2006, National Studies on Assessing the Economic Contribution of the Copyright-Based Industries No. 1: The economic contribution of copyright-based industries in Latvia 2000.WIPO:Switzerland.
• World Intellectual Property Organization (WIPO), 2006, National Studies on Assessing the Economic Contribution of the Copyright-Based Industries No. 1: The economic contribution of copyright-based industries in Hungary 2005.WIPO:Switzerland.
• World Intellectual Property Organization (WIPO), 2008, National Studies on Assessing the Economic Contribution of the Copyright-Based Industries No. 2: The economic contribution of copyright-based industries in the Philippines.WIPO:Switzerland.
• World Intellectual Property Organization (WIPO), 2008, National Studies on Assessing the Economic Contribution of the Copyright-Based Industries No. 2: The economic contribution of copyright-based industries in Mexico 2006.WIPO:Switzerland.
• World Intellectual Property Organization (WIPO), 2008, National Studies on Assessing the Economic Contribution of the Copyright-Based Industries No. 2: The economic contribution of copyright-based industries in Jamaica 2007. WIPO:Switzerland.
• World Intellectual Property Organization (WIPO), 2008, National Studies on Assessing the Economic Contribution of the Copyright-Based Industries No. 2: The economic contribution of copyright-based industries in Bulgaria 2007.WIPO:Switzerland.

The E
cono
mic C
ontri
butio
n of
Copy
right
-Bas
ed In
dustr
ies i
n Sou
th A
frica
56
Table 13: Summary of Selected Studies: Contribution of the Core Copyright-Based Industries
Country (Year) Singapore (2001) the Philippines (2003) Hungary (2002) Mexico (2003)
% of GDP
% of employment
% of GDP
% of employment
% of GDP
% of employment
% of GDP
% of employment
Press and Literature 0.94% 1.16% 5.17% 6.22% 1.45% 1.56% 0.86% 1.22%
Music Theatrical Productions Operas
0.20% 0.49% 0.96% 0.81% 0.42% 0.64% 0.26% 0.38%
Motion Picture and Video 0.05% 0.10% 0.18% 0.11% 0.19% 0.16% 0.12% 0.28%
Radio and Television 0.15% 0.27% 1.11% 0.45% 0.50% 0.23% 0.74% 0.33%
Photography 0.03% 0.08% 0.01% 0.04% 0.05% 0.09% 0.05% 0.17%
Software and Databases 1.22% 1.13% 0.93% 0.97% 0.98% 1.16% 0.26% 0.44%
Visual and Graphic Arts 0.06% 0.13% 0.00% 0.00% 0.08% 0.16%
Advertising Services Agencies, Buying Services
0.20% 0.27% 0.24% 0.23% 0.29% 0.31% 0.25% 0.41%
Copyright Collecting Societies
0.01% 0.01% 0.07% 0.00% 0.00% 0.00%
Core Copyright Industries 2.85% 3.64% 8.59% 8.81% 3.95% 4.15% 2.62% 3.40%
Country (Year) Jamaica (2005) Bulgaria (2005) Lebanon (2005) Latvia (2000)
Press and Literature 0.51% 0.61% 0.52% 1.03% 0.75% 0.83% 1.40% 1.70%
Music Theatrical Productions Operas
0.21% 0.27% 0.04% 0.05% 0.33% 0.22% 0.00% 0.10%
Motion Picture and Video 0.03% 0.05% 0.10% 0.09% 0.29% 0.25% 0.00% 0.30%
Radio and Television 0.59% 0.48% 0.19% 0.14% 0.34% 0.35% 0.10% 0.90%
Photography 0.09% 0.12% 0.02% 0.08% 0.04% 0.04%
Software and Databases 0.11% 0.12% 0.51% 0.49% 0.39% 0.22% 0.60% 0.40%
Visual and Graphic Arts 0.05% 0.05% 0.01% 0.04% 0.23% 0.13%
Advertising Services Agencies, Buying Services
0.12% 0.11% 0.16% 0.38% 0.15% 0.07% 0.80% 0.30%
Copyright Collecting Societies
0.00% 0.00% 0.01% 0.00% 0.00% 0.00%
Core Copyright Industries 1.71% 1.80% 1.57% 2.30% 2.52% 2.11% 2.90% 3.70%
Source:DataderivedfromtheWorldIntellectualPropertyOrganization(WIPO),2006and200855
55Seefootnotes25and26.

The Economic Contribution of Copyright-Based Industries in South Africa
57
Table 14: Summary of Selected Studies: Contribution of Interdependent Copyright-Based Industries
Country (Year) Singapore (2001) the Philippines (2003) Hungary (2002) Mexico (2003)
% of GDP
% of employment
% of GDP
% of employment
% of GDP
% of employment
% of GDP
% of employment
TV sets, Radios, VCRs and DVD Players
0.27% 0.26% 0.38% 0.20% 0.62% 0.67% 0.99% 1.09%
Computers and Equipment 1.32% 0.78% 0.52% 0.42% 0.20% 0.43% 0.90% 0.72%
Musical Instruments 0.01% 0.01% 0.00% 0.01% 0.01% 0.02% 0.03% 0.05%
Photographic and Cinematographic Instruments
0.07% 0.08% 0.05% 0.09% 0.02% 0.02% 0.17% 0.10%
Photocopiers 0.07% 0.06% 0.01% 0.01% 0.07% 0.31%
Blank Recording Material 0.01% 0.01% 0.01% 0.01% 0.06% 0.03%
Paper 0.03% 0.04% 0.11% 0.10% 0.64% 1.35%
Other 1.37% 0.72% 0.14%Interdependent Copyright industries
1.76% 1.24% 2.32% 1.44% 1.25% 1.25% 2.86% 3.65%
Country (Year) Jamaica (2005) Bulgaria (2005) Lebanon (2005) Latvia (2000)
TV sets, Radios, VCRs and DVD Players
0.00% 0.01% 0.11% 0.19% 0.01% 0.02% 0.00% 0.00%
Computers and Equipment 0.02% 0.19% 0.21% 0.01% 0.04% 0.20% 0.00%
Musical Instruments 0.31% 0.01% 0.01% 0.00% 0.00%
Photographic and Cinematographic Instruments
0.01% 0.02% 0.05% 0.00% 0.01% 0.50% 0.60%
Photocopiers
Blank Recording Material 0.05% 0.01%
Paper 0.02% 0.25% 0.27% 0.00% 0.01%
Other 0.70% 0.29% 0.67% 0.65% 0.40% 0.10%
Interdependent Copyright industries
0.74% 0.31% 0.63% 0.73% 0.71% 0.73% 1.10% 0.70%
Source:DataderivedfromtheWorldIntellectualPropertyOrganization(WIPO),2006and200856
56Seefootnotes25and26.
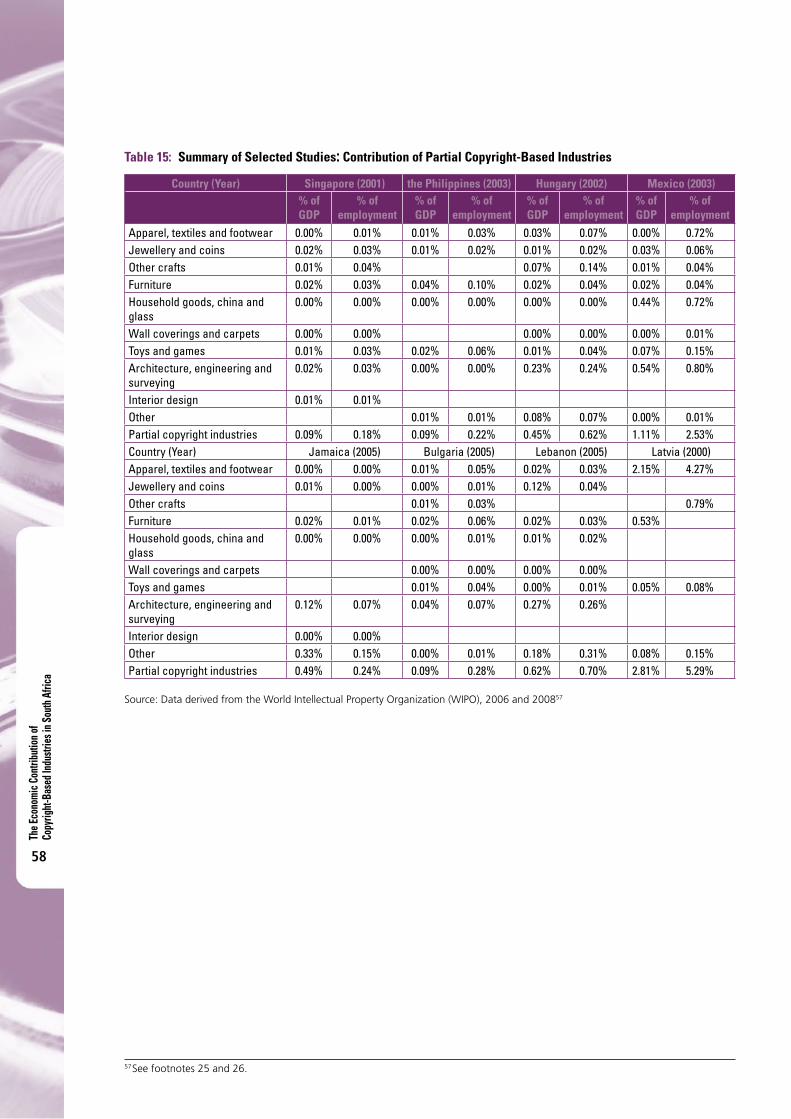
The E
cono
mic C
ontri
butio
n of
Copy
right
-Bas
ed In
dustr
ies i
n Sou
th A
frica
58
Table 15: Summary of Selected Studies: Contribution of Partial Copyright-Based Industries
Country (Year) Singapore (2001) the Philippines (2003) Hungary (2002) Mexico (2003)% of GDP
% of employment
% of GDP
% of employment
% of GDP
% of employment
% of GDP
% of employment
Apparel, textiles and footwear 0.00% 0.01% 0.01% 0.03% 0.03% 0.07% 0.00% 0.72%Jewellery and coins 0.02% 0.03% 0.01% 0.02% 0.01% 0.02% 0.03% 0.06%Other crafts 0.01% 0.04% 0.07% 0.14% 0.01% 0.04%Furniture 0.02% 0.03% 0.04% 0.10% 0.02% 0.04% 0.02% 0.04%Household goods, china and glass
0.00% 0.00% 0.00% 0.00% 0.00% 0.00% 0.44% 0.72%
Wall coverings and carpets 0.00% 0.00% 0.00% 0.00% 0.00% 0.01%Toys and games 0.01% 0.03% 0.02% 0.06% 0.01% 0.04% 0.07% 0.15%Architecture, engineering and surveying
0.02% 0.03% 0.00% 0.00% 0.23% 0.24% 0.54% 0.80%
Interior design 0.01% 0.01%Other 0.01% 0.01% 0.08% 0.07% 0.00% 0.01%Partial copyright industries 0.09% 0.18% 0.09% 0.22% 0.45% 0.62% 1.11% 2.53%Country (Year) Jamaica (2005) Bulgaria (2005) Lebanon (2005) Latvia (2000)Apparel, textiles and footwear 0.00% 0.00% 0.01% 0.05% 0.02% 0.03% 2.15% 4.27%Jewellery and coins 0.01% 0.00% 0.00% 0.01% 0.12% 0.04%Other crafts 0.01% 0.03% 0.79%Furniture 0.02% 0.01% 0.02% 0.06% 0.02% 0.03% 0.53%Household goods, china and glass
0.00% 0.00% 0.00% 0.01% 0.01% 0.02%
Wall coverings and carpets 0.00% 0.00% 0.00% 0.00%Toys and games 0.01% 0.04% 0.00% 0.01% 0.05% 0.08%Architecture, engineering and surveying
0.12% 0.07% 0.04% 0.07% 0.27% 0.26%
Interior design 0.00% 0.00%Other 0.33% 0.15% 0.00% 0.01% 0.18% 0.31% 0.08% 0.15%Partial copyright industries 0.49% 0.24% 0.09% 0.28% 0.62% 0.70% 2.81% 5.29%
Source:DataderivedfromtheWorldIntellectualPropertyOrganization(WIPO),2006and200857
57Seefootnotes25and26.

The Economic Contribution of Copyright-Based Industries in South Africa
59
Table 16: Summary of Selected Studies: Contribution of Non-Dedicated Support Copyright-Based Industries
Country (Year) Singapore (2001) the Philippines (2003) Hungary (2002) Mexico (2003)% of GDP
% of employment
% of GDP
% of employment
% of GDP
% of employment
% of GDP
% of employment
General wholesale and retail 0.34% 0.37% 0.18% 0.25% 0.56% 0.63% 0.50% 1.05%
General transportation 0.48% 0.33% 0.20% 0.29% 0.45% 0.45% 0.32% 0.31%
Telephony and internet 0.14% 0.04% 0.32% 0.09% 0.33% 0.05%
Non-dedicated support copyright industries
0.97% 0.74% 0.70% 0.63% 1.01% 1.08% 1.15% 1.41%
Country (Year) Jamaica (2005) Bulgaria (2005) Lebanon (2005) Latvia (2000)General wholesale and retail 1.20% 0.35% 0.07% 0.22% 0.60% 0.72% 0.41% 0.53%
General transportation 0.70% 0.34% 0.10% 0.16% 0.30% 0.22% 0.37% 0.23%
Telephony and internet 0.10% 0.01% 0.73%
Non-dedicated support copyright industries
1.90% 0.68% 0.09% 0.28% 0.90% 0.94% 0.77% 1.48%
Source:DataderivedfromtheWorldIntellectualPropertyOrganization(WIPO),2006and200858
Table 17: International Studies: Copyright Factors
Lebanon Jamaica the Philippines Singapore HungaryCore Press and Literature 1.000 1.000 1.000 1.000 1.000
Music Theatrical Productions Operas
1.000 1.000 1.000 1.000 1.000
Radio and Television 1.000 1.000 1.000 1.000 1.000
Photography 1.000 1.000 1.000 1.000 1.000
Software and Databases 1.000 1.000 1.000 1.000 1.000
Visual and Graphic Arts 1.000 1.000 1.000 1.000 1.000
Advertising Services 1.000 1.000 1.000 1.000 1.000
Copyright Collecting Societies 1.000 1.000 1.000 1.000 1.000
Motion Picture and Video 1.000 1.000 1.000 1.000 1.000
Interdependent TV sets, Radios, VCRs, CD Players, DVD Players, Cassette Players, Electronic Game Equipment, Other Similar Equipment
1.000 1.000 0.350 0.350 1.000
Computers and Equipment 1.000 1.000 0.350 0.350 1.000
Musical Instruments 1.000 1.000 0.200 0.200 1.000
Photographic and Cinematographic Instruments
1.000 1.000 0.300 0.300 1.000
Photocopiers 1.000 1.000 0.300 0.300 1.000
Blank Recording Material 1.000 1.000 0.250 0.250 1.000
Paper 1.000 1.000 0.250 0.250 1.000
58Seefootnotes25and26.

The E
cono
mic C
ontri
butio
n of
Copy
right
-Bas
ed In
dustr
ies i
n Sou
th A
frica
60
Table 17: International Studies: Copyright Factors (Continued)
Lebanon Jamaica the Philippines Singapore Hungary
Partial Apparel, textiles and footwear 0.020 0.005 0.004 0.000 0.005
Jewellery and coins 0.250 0.005 0.083/0.42 0.083/0.42 0.250
Other crafts 0.420 0.420 0.400
Furniture 0.050 0.050 0.002 0.083/0.017 0.050
Household goods, china and glass
0.025 0.005 0.006 0.001 0.005
Wall coverings and carpets 0.025 0.020 0.002 0.002 0.020
Toys and games 0.500 0.500 0.420 0.420 0.500
Architecture, engineering and surveying
0.100 0.008 0.100
Interior design 0.020 0.008
Museums 0.500 0.500 0.500
Non-dedicated support
General wholesale and retailing 0.038 0.057 0.057 0.057 0.057
General transportation 0.041 0.057 0.057 0.057 0.057
Telephony and internet 0.057 0.057 0.057
Source:DataderivedfromtheWorldIntellectualPropertyOrganization(WIPO),2006and2008

The Economic Contribution of Copyright-Based Industries in South Africa
61
A p p e n d i x 3 C l a s s i f i c a t i o n o f I n d u s t r i e s
The categories of the industries were provided by Statistics SA and the classification is according to theStandard Industrial Classification of all economic activities (SIC). The SIC is a classification of economicactivitiesofindustries.Anindustryconsistsofestablishmentsengagedinthesameoracloselyrelatedkindofeconomicactivitybasedmainlyontheprincipalclassofgoodsproducedorservicesrendered.Theterm“industry”isusedinthewidestsensetocoveralleconomicactivityfromtheprimaryindustriesofagriculture,forestry,fishingandminingtotherenderingofsocial,recreational,culturalandpersonalservices.
Table 18: Categories of Core Copyright-Based Industries
Core Copyright Industries
1 3 Manufacturing: Printing, Publishing and Recorded Media
324 Publishing
3241 Publishing of books, brochures, musical books and other publications
3242 Publishing of newspapers, journals and periodicals
3243 Publishing of recorded media
3249 Other publishing
3251 Printing
3252 Service activities related to printing
3260 Reproduction of recorded media
2 Film and Television Industry
3 8 Financial Intermediation, Insurance, Real Estate And Business Services: Photography/Software and Databases/Advertising
831 Activities auxiliary to financial intermediation, except insurance and pension funding
8311 Administration of financial markets
8312 Security dealing activities
8319 Activities auxiliary to financial intermediation n.e.c.59
8320 Activities auxiliary to insurance and pension funding
841 Real estate activities with own or rented property
842 Real estate activities on a fee or contract basis
8511 Renting of land transport equipment
8512 Renting of water transport equipment
8513 Renting of air transport equipment
8521 Renting of agricultural machinery and equipment
8522 Renting of construction and civil engineering machinery and equipment
8523 Renting of office machinery and equipment (including computers)
8529 Renting of other machinery and equipment n.e.c.36
8530 Renting of personal and household goods n.e.c. 36
8610 Hardware consultancy
8620 Software consultancy and supply
8630 Data processing
8640 Data base activities
8650 Maintenance and repair of office, accounting and computing machinery
8690 Other computer related activities
59n.e.c.=notelsewhereclassified.
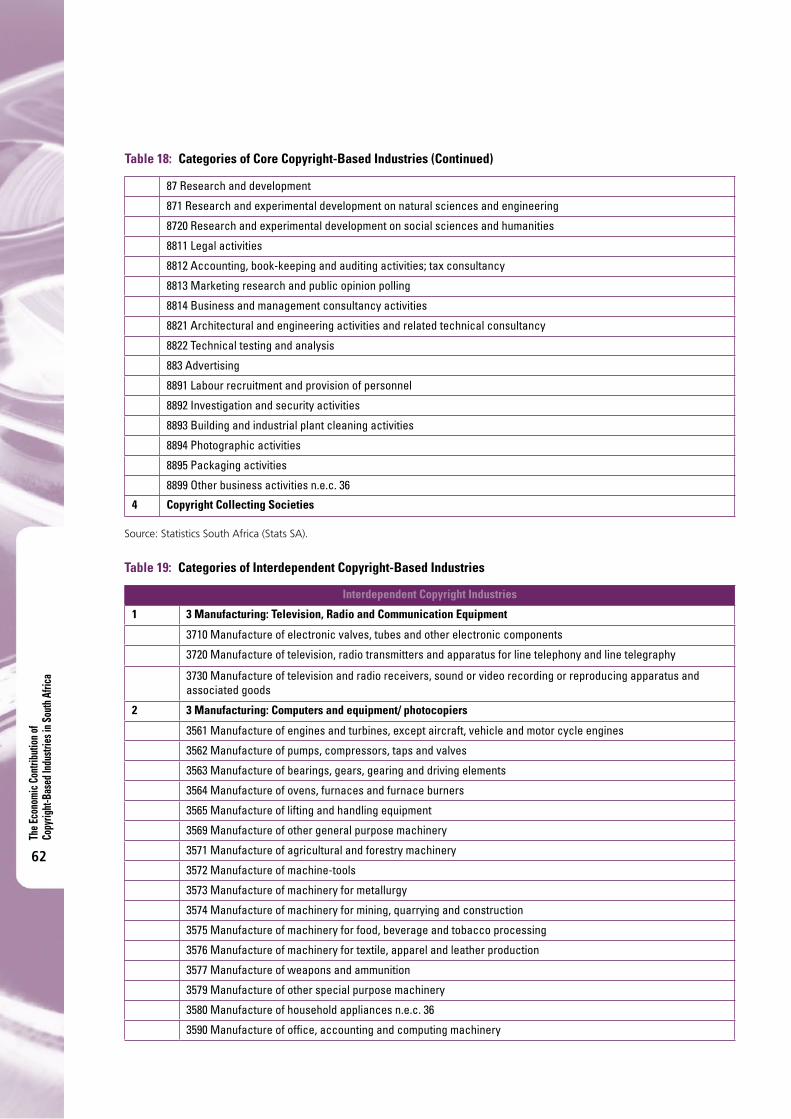
The E
cono
mic C
ontri
butio
n of
Copy
right
-Bas
ed In
dustr
ies i
n Sou
th A
frica
62
Table 18: Categories of Core Copyright-Based Industries (Continued)
87 Research and development
871 Research and experimental development on natural sciences and engineering
8720 Research and experimental development on social sciences and humanities
8811 Legal activities
8812 Accounting, book-keeping and auditing activities; tax consultancy
8813 Marketing research and public opinion polling
8814 Business and management consultancy activities
8821 Architectural and engineering activities and related technical consultancy
8822 Technical testing and analysis
883 Advertising
8891 Labour recruitment and provision of personnel
8892 Investigation and security activities
8893 Building and industrial plant cleaning activities
8894 Photographic activities
8895 Packaging activities
8899 Other business activities n.e.c. 36
4 Copyright Collecting Societies
Source:StatisticsSouthAfrica(StatsSA).
Table 19: Categories of Interdependent Copyright-Based Industries
Interdependent Copyright Industries
1 3 Manufacturing: Television, Radio and Communication Equipment
3710 Manufacture of electronic valves, tubes and other electronic components
3720 Manufacture of television, radio transmitters and apparatus for line telephony and line telegraphy
3730 Manufacture of television and radio receivers, sound or video recording or reproducing apparatus and associated goods
2 3 Manufacturing: Computers and equipment/ photocopiers
3561 Manufacture of engines and turbines, except aircraft, vehicle and motor cycle engines
3562 Manufacture of pumps, compressors, taps and valves
3563 Manufacture of bearings, gears, gearing and driving elements
3564 Manufacture of ovens, furnaces and furnace burners
3565 Manufacture of lifting and handling equipment
3569 Manufacture of other general purpose machinery
3571 Manufacture of agricultural and forestry machinery
3572 Manufacture of machine-tools
3573 Manufacture of machinery for metallurgy
3574 Manufacture of machinery for mining, quarrying and construction
3575 Manufacture of machinery for food, beverage and tobacco processing
3576 Manufacture of machinery for textile, apparel and leather production
3577 Manufacture of weapons and ammunition
3579 Manufacture of other special purpose machinery
3580 Manufacture of household appliances n.e.c. 36
3590 Manufacture of office, accounting and computing machinery

The Economic Contribution of Copyright-Based Industries in South Africa
63
Table 19: Categories of Interdependent Copyright-Based Industries (Continued)
3 3 Manufacturing: Paper and Paper Products
3231 Manufacture of pulp, paper and paper board
3232 Manufacture of corrugated paper and paper board and of containers of paper and paper board
3239 Manufacture of other articles of paper and paper board
Source:StatisticsSouthAfrica(StatsSA).
Table 20: Categories of Partial Copyright-Based Industries
Partial Copyright Industries1 3 Manufacturing: Apparel, textiles and footwear
Wearing apparel
3130 Manufacture of knitted and crocheted fabrics and articles
3140 Manufacture of wearing apparel, except fur apparel
3150 Dressing and dyeing of fur; manufacture of articles of fur
Textiles
3111 Preparation and spinning of textile fibres, weaving of textiles
3112 Finishing of textiles
3121 Manufacture of made-up textile articles, except apparel
3122 Manufacture of carpets, rugs and mats
3123 Manufacture of cordage, rope, twine and netting
3129 Manufacture of other textiles n.e.c. 36
Footwear
2 3 Manufacturing: Furniture and other manufacturing
3910 Manufacture of furniture
3921 Manufacture of jewellery and related articles
3922 Manufacture of musical instruments
3923 Manufacture of sports goods
3924 Manufacture of games and toys
3929 Other manufacturing n.e.c. 36
3951 Recycling of metal waste and scrap n.e.c. 36
3952 Recycling of non-metal waste and scrap n.e.c36.
3 Crafts
4 Glass and glass products
Source:StatisticsSouthAfrica(StatsSA).

The E
cono
mic C
ontri
butio
n of
Copy
right
-Bas
ed In
dustr
ies i
n Sou
th A
frica
64
Table 21: Categories of Non-Dedicated Copyright-Based Industries
Non-dedicated Copyright Industries
1 6 Wholesale and Retail Trade, Repair of Motor Vehicles, Motor Cycles and Personal and Household Goods, Hotels and Restaurants, General wholesale and retailing
61: Wholesale trade and commission trade, except of motor vehicles and motor cycles
6110 Wholesale trade on a fee or contract basis
6121 Wholesale trade in agricultural raw materials and livestock
6122 Wholesale trade in food, beverages and tobacco
61221 Wholesale trade in foodstuffs
61222 Wholesale trade in beverages
61223 Wholesale trade in tobacco products
6131 Wholesale trade in textiles, clothing and footwear
6139 Wholesale trade in other household goods
61391 Wholesale trade in household furniture, requisites and appliances
61392 Wholesale trade in books and stationery
61393 Wholesale trade in precious stones, jewellery and silverware
61394 Wholesale of pharmaceuticals and toiletries
61399 Wholesale trade in other household goods n.e.c. 36
6141 Wholesale trade in solid, liquid and gaseous fuels and related products
6142 Wholesale trade in metals and metal ores
6143 Wholesale trade in construction materials, hardware, plumbing and heating equipment and supplies
6149 Wholesale trade in other intermediate products, waste and scrap
61501 Office machinery and equipment, including computers
61509 Other machinery
61901 General wholesale trade
61909 Other wholesale trade n.e.c. 36
62: Retail trade, except of motor vehicles and motor cycles, repair of personal and household goods
6211 Retail trade in non-specialised stores with food, beverages and tobacco predominating
6219 Other retail trade in non-specialised stores
62201 Retail trade in fresh fruit and vegetables
62202 Retail trade in meat and meat products
62203 Retail trade in bakery products
62204 Retail trade in beverages (bottle stores)
62209 Other retail trade in food, beverage and tobacco n.e.c36
623 Other retail trade in new goods in specialised stores
6231 Retail trade in pharmaceutical and medical goods, cosmetic and toilet articles
6232 Retail trade in textiles, clothing, footwear and leather goods
62321 Retail trade in men’s and boys’ clothing
62322 Retail trade in ladies’ and girls’ clothing
62323 Retail trade by general outfitters and by dealers in piece goods, textiles, leather and travel accessories

The Economic Contribution of Copyright-Based Industries in South Africa
65
Table 21: Categories of Non-Dedicated Copyright-Based Industries (Continued)
Non-dedicated Copyright Industries (continued)
62324 Retail trade in shoes
6233 Retail trade in household furniture, appliances, articles and equipment
6234 Retail trade in hardware, paint and glass
62391 Retail trade of reading matter and stationery
62392 Retail trade in jewellery, watches and clocks
62393 Retail trade in sports goods and entertainment requisite
62399 Retail trade by other specialised stores
6240 Retail trade in second-hand goods in stores
6251 Retail trade via mail order houses
6252 Retail trade via stalls and markets
6259 Other retail trade not in store
6260 Repair of personal and household goods
63: Sale, maintenance and repair of motor vehicles and motor cycles, retail trade in automotive fuel
631 Sale of motor vehicles
6320 Maintenance and repair of motor vehicles
633 Sale of motor vehicle parts and accessories
6340 Sale, maintenance and repair of motor cycles and related parts and accessories
6350 Retail sale of automotive fuel
2 7: Transport, storage and communication
7111 Railway transport
712 Other land transport
7121 Other scheduled passenger land transport
7122 Other non-scheduled passenger land transport
7123 Freight transport by road
7130 Transport via pipelines
72 Water transport
7211 Sea and coastal water transport
7220 Inland water transport
7300 Air transport
7411 Cargo handling
7412 Storage and warehousing
7413 Other supporting transport activities
7414 Travel agency and related activities
7419 Activities of other transport agencies
7511 National postal activities
7512 Courier activities other than national postal activities
7520 Telecommunications
Source:StatisticsSouthAfrica(StatsSA).

The E
cono
mic C
ontri
butio
n of
Copy
right
-Bas
ed In
dustr
ies i
n Sou
th A
frica
66
A p p e n d i x 4 I n p u t - O u t p u t M u l t i p l i e r s
TheInput-OutputanalysisiscreditedtoW.Leontief(1905-1999)[NobelPrizelaureate1973]whodevelopedthefirstInput-Output(IO)table60.Intheliterature,thefirststudiesonapplicationsofLeontief’sanalysiswereconductedduringthe1950sand1960s61,62.However,theIOanalysishasbeenevennowpreferredintheinternationalliteratureinthe1980s,1990sand2000swithspecificinterestontheimpactofenvironmentalchangestotheeconomies63,64,65,66.
Input-Outputanalysisisawayofsystematicallyquantifyingthemutualinterrelationshipsamongthevarioussectorsoftheeconomicsystem.Theideaofthisanalysislieswiththefactthatitisimpossibletoanalysethesectoralcontributionofaspecificproductionsector(industry)tooverallaggregateproductionwithouttakingintoaccountitsconnectionwiththeothersectors.
TheIOtablesareusedforseveralanalyticalpurposessuchas:
• economicpolicy• forecasts• analysisoftheproductionstructure• productionfunctions
TheIOtablesareorganisedinabasicmatrixshowingtheinputsandoutputsofthevariouseconomicsectors.Thisrepresentationoftheeconomyisbasedonspecificassumptions.Forexampleallthetransactionsarereflectedinmonetarytermsandrecordedontheassumptionthatgeneralequilibriumexistsintheeconomy.Furthermore,onlycross-sectiondataareincludedinthetables,hence,IOtablesgiveusanopportunityfora static-dynamicanalysis. Eachyear recorded in the IO tablesgivesusa frozenpictureof theeconomy’sequilibriumatthatparticularyear(staticpartoftheanalysis).Theresearcher,however,canprogressfromoneequilibriumpositiontothenext(dynamicpartoftheanalysis).
ThemainapplicationofIOtablesisthederivationofmultipliersinordertoexaminetheeffectsonaneconomyofanexogenouschange infinaldemand.Thefourmostcommonlyusedmultipliersareoutput, income,employmentandimport.Theyprovide,respectively,ameasureoftheeffectsofanexogenouschangeinfinaldemandona)theoutputofindustriesintheeconomyb)incomeearnedbyhouseholdsc)employmenttobegeneratedandd)usageofimportsbyallindustries.
An IO model relates industry outputs to final demand. In matrix terminology, the model is expressed asX=(I-A)-1*Y,whereXisthecolumnvectorofindustryoutputs,Ythecolumnvectoroffinaldemand,ItheidentitymatrixandAthedirectrequirementscoefficientsmatrix.(I-A)-1isthe“open”(allfinaldemandsectorsareassumed tobeexogenous) Leontief inverse,usually referred toas the total requirements coefficientsmatrix.ThemultipliersderivedfromanopenIOmodelareknownassimplemultipliers.Thehouseholdsectorreceivesincomeforitsinvolvementintheproductionprocessandspendsitonproducts.Thiswillinfluencethedomesticconsumptionandconsequentlythelevelofoutputofeachdomesticindustry.Duetothis,thehouseholdsectorispreferredtobetreatedasendogenous.Therefore,withanexpansionofmatrixA,weclosethematrixwithrespecttohouseholds.Themultipliersderivedfromthisnewmatrixarecalledtotalmultipliers.
60LeontiefW.(1953)“Studies on the structure of the American economy”,NewYork:OxfordUniversityPress.61AdamsA.andStewartI.(1956)“Input-Output analysis: An application”,TheEconomicJournal,66(263),442-454.62ReyG.andTilanusC.(1963)“Input-Output Forecasts for the Netherlands, 1949-1958”,Econometrica,31(3),454-463.63DevisK.,deMeloJ.andRobinsonS.(1982)“General equilibrium models for development policy”,WashingtonD.C.:TheWorld
Bank.64DuchinF.andSteengeA.(1999)“Input-Output Analysis, technology and the environment”.InJ.vandenBergh,Handbookof
EnvironmentalandResourceeconomics.Northampton,USA:EdwardElgarPublishing.65HuppesG.,deKoningA.,SutiS.,HeijungsR.,vanOersL.,NielsenP.etal.(2008)“Environmental Impacts of Consumption in the
European Union: High-Resolution Input-Output Tables with Detailed Environmental Extensions”.JournalofIndustrialEcology,10(3),129-146.
66RichardsonH.(2006)“Input-Output and Economic Base Multipliers: Looking Backward and Forward”.JournalofRegionalScience,25(4),607-661.

The Economic Contribution of Copyright-Based Industries in South Africa
67
AnumberofothermultiplierscanalsobeestimatedfromtheI-Oanalysis:
• Initial effects: AZAR1.00changeinoutputtomeetthechangeofR1.00infinaldemand.• First-round effects:Anindustrymustincreaseitsinputsfromotherindustriesandfromitself,inorderto
produceanextraunitofoutputtomeetaZAR1.00increaseinfinaldemand.• Industrial support effects:Otherindustrieswillneedtoincreasetheirpurchasestoexpandtheiroutputto
meetthefirst-roundrequirements.• Production-induced effects:Thecombinationoffirst-roundeffectswiththeindustrial-supporteffects.• Consumption induced effects:Itisequaltoitstotalmultiplierlessitssimplemultiplier.• Type 1A and 1B:Theyexpressthesimplemultiplierasaratiooftheinitialeffect.• Type 2A and 2B: Theyexpressthetotalmultiplierasaratiooftheinitialeffect.
Associatedwiththis,therewillalsobesimilareffectsonhouseholdincome,employmentandimports.ThefollowingtablespresentthemultipliersforSouthAfricaderivedfromtheI-Otablesfor2009.
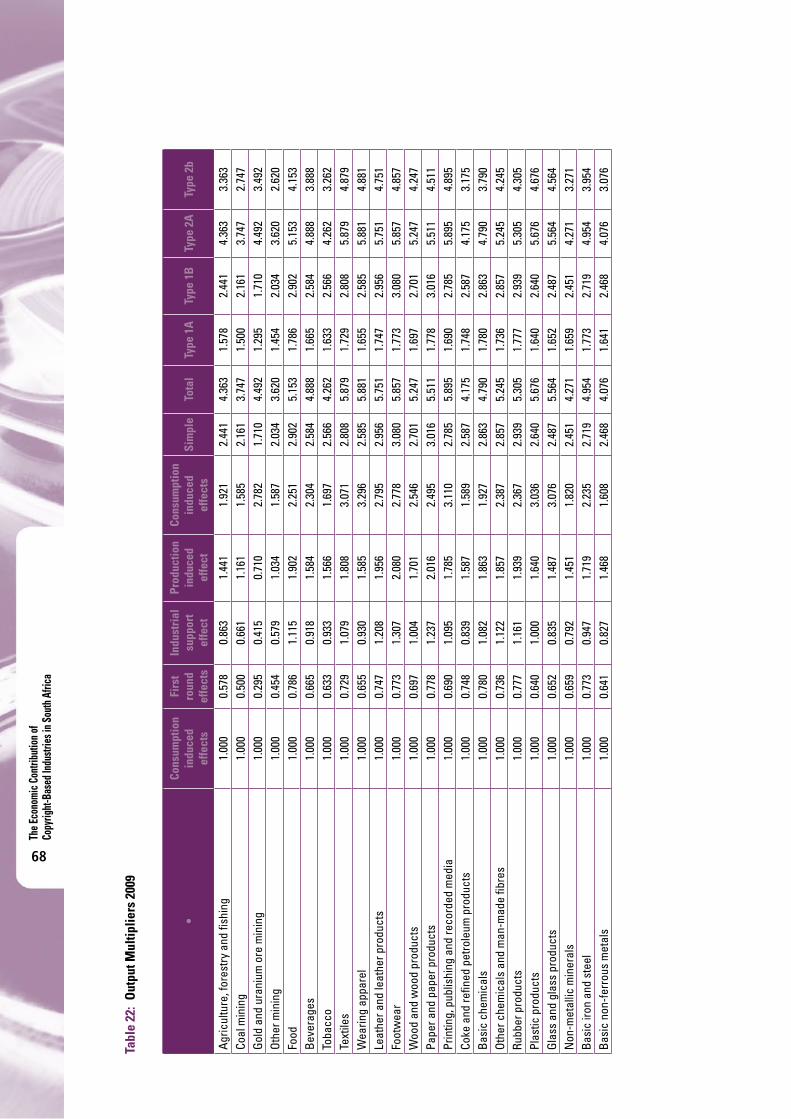
The E
cono
mic C
ontri
butio
n of
Copy
right
-Bas
ed In
dustr
ies i
n Sou
th A
frica
68
Tabl
e 22
: O
utpu
t Mul
tiplie
rs 2
009
•Co
nsum
ptio
n in
duce
d ef
fect
s
Firs
t ro
und
effe
cts
Indu
stri
al
supp
ort
effe
ct
Prod
uctio
n in
duce
d ef
fect
Cons
umpt
ion
indu
ced
effe
cts
Sim
ple
Tota
l Ty
pe 1
ATy
pe 1
B
Type
2A
Type
2b
Agr
icul
ture
, for
estr
y an
d fis
hing
1.00
00.
578
0.86
31.
441
1.92
12.
441
4.36
31.
578
2.44
14.
363
3.36
3Co
al m
inin
g1.
000
0.50
00.
661
1.16
11.
585
2.16
13.
747
1.50
02.
161
3.74
72.
747
Gol
d an
d ur
aniu
m o
re m
inin
g 1.
000
0.29
50.
415
0.71
02.
782
1.71
04.
492
1.29
51.
710
4.49
23.
492
Oth
er m
inin
g 1.
000
0.45
40.
579
1.03
41.
587
2.03
43.
620
1.45
42.
034
3.62
02.
620
Food
1.00
00.
786
1.11
51.
902
2.25
12.
902
5.15
31.
786
2.90
25.
153
4.15
3B
ever
ages
1.00
00.
665
0.91
81.
584
2.30
42.
584
4.88
81.
665
2.58
44.
888
3.88
8To
bacc
o1.
000
0.63
30.
933
1.56
61.
697
2.56
64.
262
1.63
32.
566
4.26
23.
262
Text
iles
1.00
00.
729
1.07
91.
808
3.07
12.
808
5.87
91.
729
2.80
85.
879
4.87
9W
earin
g ap
pare
l1.
000
0.65
50.
930
1.58
53.
296
2.58
55.
881
1.65
52.
585
5.88
14.
881
Leat
her a
nd le
athe
r pro
duct
s1.
000
0.74
71.
208
1.95
62.
795
2.95
65.
751
1.74
72.
956
5.75
14.
751
Foot
wea
r 1.
000
0.77
31.
307
2.08
02.
778
3.08
05.
857
1.77
33.
080
5.85
74.
857
Woo
d an
d w
ood
prod
ucts
1.
000
0.69
71.
004
1.70
12.
546
2.70
15.
247
1.69
72.
701
5.24
74.
247
Pape
r and
pap
er p
rodu
cts
1.00
00.
778
1.23
72.
016
2.49
53.
016
5.51
11.
778
3.01
65.
511
4.51
1Pr
intin
g, p
ublis
hing
and
reco
rded
med
ia
1.00
00.
690
1.09
51.
785
3.11
02.
785
5.89
51.
690
2.78
55.
895
4.89
5Co
ke a
nd re
fined
pet
role
um p
rodu
cts
1.00
00.
748
0.83
91.
587
1.58
92.
587
4.17
51.
748
2.58
74.
175
3.17
5B
asic
che
mic
als
1.00
00.
780
1.08
21.
863
1.92
72.
863
4.79
01.
780
2.86
34.
790
3.79
0O
ther
che
mic
als
and
man
-mad
e fib
res
1.00
00.
736
1.12
21.
857
2.38
72.
857
5.24
51.
736
2.85
75.
245
4.24
5Ru
bber
pro
duct
s1.
000
0.77
71.
161
1.93
92.
367
2.93
95.
305
1.77
72.
939
5.30
54.
305
Plas
tic p
rodu
cts
1.00
00.
640
1.00
01.
640
3.03
62.
640
5.67
61.
640
2.64
05.
676
4.67
6G
lass
and
gla
ss p
rodu
cts
1.00
00.
652
0.83
51.
487
3.07
62.
487
5.56
41.
652
2.48
75.
564
4.56
4N
on-m
etal
lic m
iner
als
1.00
00.
659
0.79
21.
451
1.82
02.
451
4.27
11.
659
2.45
14.
271
3.27
1B
asic
iron
and
ste
el
1.00
00.
773
0.94
71.
719
2.23
52.
719
4.95
41.
773
2.71
94.
954
3.95
4B
asic
non
-fer
rous
met
als
1.00
00.
641
0.82
71.
468
1.60
82.
468
4.07
61.
641
2.46
84.
076
3.07
6

The Economic Contribution of Copyright-Based Industries in South Africa
69
Tabl
e 22
: O
utpu
t Mul
tiplie
rs 2
009
(Con
tinue
d)
Indu
stry
Initi
al e
ffect
sFi
rst
roun
d ef
fect
s
Indu
stri
al
supp
ort
effe
ct
Prod
uctio
n in
duce
d ef
fect
Cons
umpt
ion
indu
ced
effe
cts
Sim
ple
Tota
l Ty
pe 1
ATy
pe 1
B
Type
2A
Type
2b
Met
al p
rodu
cts
excl
udin
g m
achi
nery
1.
000
0.69
61.
003
1.69
92.
644
2.69
95.
344
1.69
62.
699
5.34
44.
344
Mac
hine
ry a
nd e
quip
men
t 1.
000
0.69
31.
011
1.70
42.
797
2.70
45.
502
1.69
32.
704
5.50
24.
502
Elec
tric
al m
achi
nery
and
app
arat
us1.
000
0.73
31.
090
1.82
32.
684
2.82
35.
507
1.73
32.
823
5.50
74.
507
Tele
visi
on, r
adio
and
com
mun
icat
ion
equi
pmen
t 1.
000
0.67
00.
965
1.63
52.
992
2.63
55.
627
1.67
02.
635
5.62
74.
627
Prof
essi
onal
and
sci
entifi
c eq
uipm
ent
1.00
00.
717
0.98
81.
705
2.34
82.
705
5.05
31.
717
2.70
55.
053
4.05
3M
otor
veh
icle
s, p
arts
and
acc
esso
ries
1.00
00.
796
1.32
12.
117
2.91
73.
117
6.03
41.
796
3.11
76.
034
5.03
4O
ther
tran
spor
t equ
ipm
ent
1.00
00.
684
1.03
01.
714
3.20
32.
714
5.91
71.
684
2.71
45.
917
4.91
7Fu
rnitu
re
1.00
00.
764
1.16
51.
929
2.90
52.
929
5.83
41.
764
2.92
95.
834
4.83
4O
ther
man
ufac
turin
g 1.
000
0.56
00.
670
1.22
91.
729
2.22
93.
959
1.56
02.
229
3.95
92.
959
Elec
tric
ity, g
as a
nd s
team
1.
000
0.46
50.
587
1.05
11.
973
2.05
14.
024
1.46
52.
051
4.02
43.
024
Wat
er s
uppl
y 1.
000
0.62
70.
879
1.50
61.
631
2.50
64.
138
1.62
72.
506
4.13
83.
138
Bui
ldin
g co
nstr
uctio
n1.
000
0.68
71.
089
1.77
62.
023
2.77
64.
800
1.68
72.
776
4.80
03.
800
Civi
l eng
inee
ring
and
othe
r con
stru
ctio
n 1.
000
0.65
70.
923
1.58
01.
987
2.58
04.
567
1.65
72.
580
4.56
73.
567
Who
lesa
le a
nd re
tail
trad
e 1.
000
0.45
80.
545
1.00
32.
192
2.00
34.
195
1.45
82.
003
4.19
53.
195
Cate
ring
and
acco
mm
odat
ion
serv
ices
1.00
00.
604
0.83
11.
435
1.92
72.
435
4.36
21.
604
2.43
54.
362
3.36
2Tr
ansp
ort a
nd s
tora
ge
1.00
00.
510
0.67
51.
185
1.74
82.
185
3.93
31.
510
2.18
53.
933
2.93
3Co
mm
unic
atio
n1.
000
0.52
10.
656
1.17
71.
852
2.17
74.
029
1.52
12.
177
4.02
93.
029
Fina
nce
and
insu
ranc
e1.
000
0.40
00.
383
0.78
32.
293
1.78
34.
076
1.40
01.
783
4.07
63.
076
Bus
ines
s se
rvic
es
1.00
00.
518
0.60
81.
125
1.77
32.
125
3.89
81.
518
2.12
53.
898
2.89
8M
edic
al, d
enta
l and
vet
erin
ary
serv
ices
1.
000
0.58
80.
770
1.35
82.
279
2.35
84.
637
1.58
82.
358
4.63
73.
637
Excl
udin
g m
edic
al, d
enta
l and
vet
erin
ary
serv
ices
1.
000
0.60
40.
782
1.38
61.
993
2.38
64.
379
1.60
42.
386
4.37
93.
379
Oth
er p
rodu
cers
1.
000
0.21
50.
285
0.49
94.
442
1.49
95.
942
1.21
51.
499
5.94
24.
942
Gen
eral
gov
ernm
ent s
ervi
ces
1.00
00.
357
0.44
30.
800
3.58
91.
800
5.38
91.
357
1.80
05.
389
4.38
9
Sour
ce:A
utho
rs’c
alcu
latio
nsw
ithd
ata
from
the
Sup
ply
and
Use
Tab
les
(SU
T)o
fSt
atis
tics
Sout
hA
fric
a(S
tats
SA
).
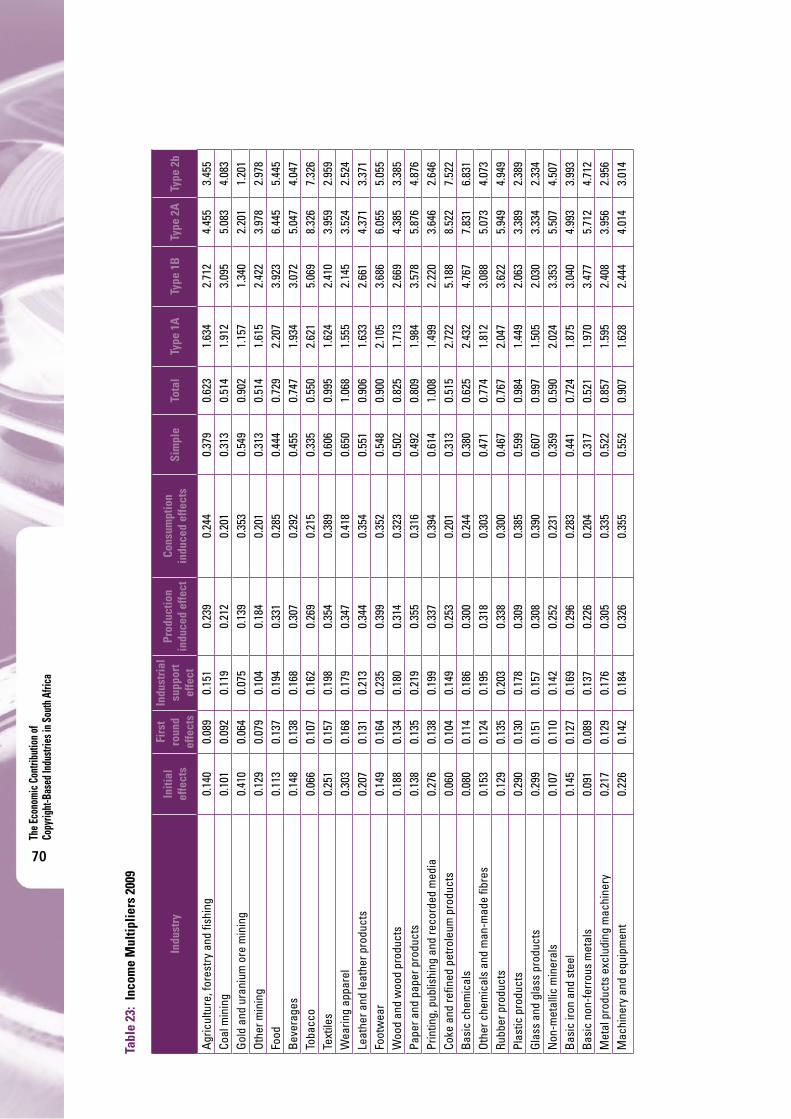
The E
cono
mic C
ontri
butio
n of
Copy
right
-Bas
ed In
dustr
ies i
n Sou
th A
frica
70
Tabl
e 23
: In
com
e M
ultip
liers
200
9
Indu
stry
Initi
al
effe
cts
Firs
t ro
und
effe
cts
Indu
stri
al
supp
ort
effe
ct
Prod
uctio
n in
duce
d ef
fect
Cons
umpt
ion
indu
ced
effe
cts
Sim
ple
Tota
l Ty
pe 1
A
Type
1B
Ty
pe 2
A
Type
2b
Agr
icul
ture
, for
estr
y an
d fis
hing
0.14
00.
089
0.15
10.
239
0.24
40.
379
0.62
31.
634
2.71
24.
455
3.45
5Co
al m
inin
g0.
101
0.09
20.
119
0.21
20.
201
0.31
30.
514
1.91
23.
095
5.08
34.
083
Gol
d an
d ur
aniu
m o
re m
inin
g 0.
410
0.06
40.
075
0.13
90.
353
0.54
90.
902
1.15
71.
340
2.20
11.
201
Oth
er m
inin
g 0.
129
0.07
90.
104
0.18
40.
201
0.31
30.
514
1.61
52.
422
3.97
82.
978
Food
0.11
30.
137
0.19
40.
331
0.28
50.
444
0.72
92.
207
3.92
36.
445
5.44
5B
ever
ages
0.14
80.
138
0.16
80.
307
0.29
20.
455
0.74
71.
934
3.07
25.
047
4.04
7To
bacc
o0.
066
0.10
70.
162
0.26
90.
215
0.33
50.
550
2.62
15.
069
8.32
67.
326
Text
iles
0.25
10.
157
0.19
80.
354
0.38
90.
606
0.99
51.
624
2.41
03.
959
2.95
9W
earin
g ap
pare
l0.
303
0.16
80.
179
0.34
70.
418
0.65
01.
068
1.55
52.
145
3.52
42.
524
Leat
her a
nd le
athe
r pro
duct
s0.
207
0.13
10.
213
0.34
40.
354
0.55
10.
906
1.63
32.
661
4.37
13.
371
Foot
wea
r 0.
149
0.16
40.
235
0.39
90.
352
0.54
80.
900
2.10
53.
686
6.05
55.
055
Woo
d an
d w
ood
prod
ucts
0.
188
0.13
40.
180
0.31
40.
323
0.50
20.
825
1.71
32.
669
4.38
53.
385
Pape
r and
pap
er p
rodu
cts
0.13
80.
135
0.21
90.
355
0.31
60.
492
0.80
91.
984
3.57
85.
876
4.87
6Pr
intin
g, p
ublis
hing
and
reco
rded
med
ia
0.27
60.
138
0.19
90.
337
0.39
40.
614
1.00
81.
499
2.22
03.
646
2.64
6Co
ke a
nd re
fined
pet
role
um p
rodu
cts
0.06
00.
104
0.14
90.
253
0.20
10.
313
0.51
52.
722
5.18
88.
522
7.52
2B
asic
che
mic
als
0.08
00.
114
0.18
60.
300
0.24
40.
380
0.62
52.
432
4.76
77.
831
6.83
1O
ther
che
mic
als
and
man
-mad
e fib
res
0.15
30.
124
0.19
50.
318
0.30
30.
471
0.77
41.
812
3.08
85.
073
4.07
3Ru
bber
pro
duct
s0.
129
0.13
50.
203
0.33
80.
300
0.46
70.
767
2.04
73.
622
5.94
94.
949
Plas
tic p
rodu
cts
0.29
00.
130
0.17
80.
309
0.38
50.
599
0.98
41.
449
2.06
33.
389
2.38
9G
lass
and
gla
ss p
rodu
cts
0.29
90.
151
0.15
70.
308
0.39
00.
607
0.99
71.
505
2.03
03.
334
2.33
4N
on-m
etal
lic m
iner
als
0.10
70.
110
0.14
20.
252
0.23
10.
359
0.59
02.
024
3.35
35.
507
4.50
7B
asic
iron
and
ste
el
0.14
50.
127
0.16
90.
296
0.28
30.
441
0.72
41.
875
3.04
04.
993
3.99
3B
asic
non
-fer
rous
met
als
0.09
10.
089
0.13
70.
226
0.20
40.
317
0.52
11.
970
3.47
75.
712
4.71
2M
etal
pro
duct
s ex
clud
ing
mac
hine
ry
0.21
70.
129
0.17
60.
305
0.33
50.
522
0.85
71.
595
2.40
83.
956
2.95
6M
achi
nery
and
equ
ipm
ent
0.22
60.
142
0.18
40.
326
0.35
50.
552
0.90
71.
628
2.44
44.
014
3.01
4

The Economic Contribution of Copyright-Based Industries in South Africa
71
Tabl
e 23
: In
com
e M
ultip
liers
200
9 (C
ontin
ued)
Indu
stry
Initi
al
effe
cts
Firs
t ro
und
effe
cts
Indu
stri
al
supp
ort
effe
ct
Prod
uctio
n in
duce
d ef
fect
Cons
umpt
ion
indu
ced
effe
cts
Sim
ple
Tota
l Ty
pe 1
ATy
pe 1
B
Type
2A
Type
2b
Elec
tric
al m
achi
nery
and
app
arat
us0.
200
0.13
80.
192
0.33
00.
340
0.52
90.
870
1.68
92.
650
4.35
33.
353
Tele
visi
on, r
adio
and
com
mun
icat
ion
equi
pmen
t 0.
240
0.16
00.
190
0.35
00.
379
0.59
00.
969
1.66
62.
459
4.03
83.
038
Prof
essi
onal
and
sci
entifi
c eq
uipm
ent
0.14
20.
141
0.18
10.
321
0.29
80.
463
0.76
11.
993
3.26
65.
366
4.36
6M
otor
veh
icle
s, p
arts
and
acc
esso
ries
0.17
30.
157
0.24
60.
403
0.37
00.
575
0.94
51.
908
3.33
25.
474
4.47
4O
ther
tran
spor
t equ
ipm
ent
0.27
40.
158
0.20
00.
358
0.40
60.
632
1.03
81.
579
2.31
03.
794
2.79
4Fu
rnitu
re
0.20
50.
155
0.21
30.
368
0.36
80.
573
0.94
11.
756
2.79
24.
586
3.58
6O
ther
man
ufac
turin
g 0.
118
0.10
30.
119
0.22
30.
219
0.34
10.
560
1.87
22.
881
4.73
23.
732
Elec
tric
ity, g
as a
nd s
team
0.
208
0.07
50.
106
0.18
10.
250
0.38
90.
639
1.36
11.
872
3.07
42.
074
Wat
er s
uppl
y 0.
095
0.08
40.
143
0.22
70.
207
0.32
20.
529
1.87
83.
380
5.55
24.
552
Bui
ldin
g co
nstr
uctio
n0.
108
0.10
30.
189
0.29
10.
257
0.39
90.
656
1.95
33.
705
6.08
55.
085
Civi
l eng
inee
ring
and
othe
r con
stru
ctio
n 0.
122
0.10
60.
164
0.27
00.
252
0.39
20.
644
1.86
63.
212
5.27
64.
276
Who
lesa
le a
nd re
tail
trad
e 0.
246
0.08
50.
102
0.18
70.
278
0.43
20.
710
1.34
51.
759
2.89
01.
890
Cate
ring
and
acco
mm
odat
ion
serv
ices
0.13
50.
096
0.15
00.
246
0.24
40.
380
0.62
41.
711
2.82
64.
642
3.64
2Tr
ansp
ort a
nd s
tora
ge
0.13
20.
090
0.12
20.
212
0.22
20.
345
0.56
61.
679
2.60
34.
276
3.27
6Co
mm
unic
atio
n0.
149
0.09
30.
123
0.21
60.
235
0.36
50.
600
1.62
72.
450
4.02
43.
024
Fina
nce
and
insu
ranc
e0.
279
0.09
60.
078
0.17
40.
291
0.45
20.
743
1.34
31.
624
2.66
81.
668
Bus
ines
s se
rvic
es
0.13
60.
100
0.11
40.
214
0.22
50.
350
0.57
41.
737
2.57
64.
231
3.23
1M
edic
al, d
enta
l and
vet
erin
ary
serv
ices
0.
209
0.10
00.
140
0.24
00.
289
0.45
00.
739
1.47
92.
148
3.52
92.
529
Excl
udin
g m
edic
al, d
enta
l and
vet
erin
ary
serv
ices
0.
154
0.09
50.
145
0.23
90.
253
0.39
30.
646
1.61
72.
557
4.20
03.
200
Oth
er p
rodu
cers
0.
781
0.04
30.
052
0.09
50.
563
0.87
61.
440
1.05
51.
122
1.84
30.
843
Gen
eral
gov
ernm
ent s
ervi
ces
0.53
30.
092
0.08
40.
175
0.45
50.
708
1.16
31.
172
1.32
92.
184
1.18
4
Sour
ce:A
utho
rs’c
alcu
latio
nsw
ithd
ata
from
the
Sup
ply
and
Use
Tab
les
(SU
T)o
fSt
atis
tics
Sout
hA
fric
a(S
tats
SA
).

The E
cono
mic C
ontri
butio
n of
Copy
right
-Bas
ed In
dustr
ies i
n Sou
th A
frica
72
Tabl
e 24
: Em
ploy
men
t Mul
tiplie
rs 2
009
Indu
stry
Initi
al
effe
cts
Firs
t ro
und
effe
cts
Indu
stri
al
supp
ort e
ffect
Prod
uctio
n in
duce
d ef
fect
Cons
umpt
ion
indu
ced
effe
cts
Sim
ple
Tota
l Ty
pe 1
ATy
pe 1
BTy
pe 2
ATy
pe 2
B
Agr
icul
ture
, for
estr
y an
d fis
hing
7.90
01.
346
2.48
33.
829
4.26
311
.729
15.9
931.
170
1.48
52.
024
1.02
4Co
al m
inin
g1.
367
1.71
71.
747
3.46
33.
518
4.83
08.
348
2.25
63.
534
6.10
85.
108
Gol
d an
d ur
aniu
m o
re m
inin
g 7.
631
1.15
41.
148
2.30
26.
175
9.93
316
.108
1.15
11.
302
2.11
11.
111
Oth
er m
inin
g 2.
466
1.46
91.
508
2.97
83.
521
5.44
38.
965
1.59
62.
207
3.63
52.
635
Food
1.15
64.
405
3.30
67.
711
4.99
58.
867
13.8
624.
809
7.66
811
.987
10.9
87B
ever
ages
1.42
33.
047
2.80
25.
849
5.11
37.
272
12.3
863.
140
5.10
98.
701
7.70
1To
bacc
o0.
198
3.67
62.
528
6.20
43.
765
6.40
210
.167
19.5
7832
.354
51.3
8350
.383
Text
iles
3.86
02.
998
3.05
56.
053
6.81
69.
913
16.7
291.
777
2.56
84.
334
3.33
4W
earin
g ap
pare
l6.
025
3.36
82.
820
6.18
87.
314
12.2
1319
.527
1.55
92.
027
3.24
12.
241
Leat
her a
nd le
athe
r pro
duct
s1.
807
2.20
34.
064
6.26
76.
204
8.07
414
.278
2.22
04.
469
7.90
26.
902
Foot
wea
r 1.
946
2.27
43.
955
6.22
96.
165
8.17
514
.340
2.16
84.
201
7.36
86.
368
Woo
d an
d w
ood
prod
ucts
3.
274
3.44
33.
098
6.54
15.
650
9.81
515
.465
2.05
22.
998
4.72
43.
724
Pape
r and
pap
er p
rodu
cts
0.92
42.
332
3.43
55.
766
5.53
76.
690
12.2
273.
524
7.24
213
.237
12.2
37Pr
intin
g, p
ublis
hing
and
reco
rded
med
ia
2.39
92.
118
3.05
45.
172
6.90
27.
571
14.4
731.
883
3.15
56.
032
5.03
2Co
ke a
nd re
fined
pet
role
um p
rodu
cts
0.21
51.
876
2.32
24.
198
3.52
64.
412
7.93
89.
745
20.5
6837
.004
36.0
04B
asic
che
mic
als
0.39
71.
956
2.87
04.
826
4.27
75.
223
9.50
15.
926
13.1
5523
.927
22.9
27O
ther
che
mic
als
and
man
-mad
e fib
res
0.61
21.
868
2.95
84.
827
5.29
85.
438
10.7
364.
054
8.89
017
.550
16.5
50Ru
bber
pro
duct
s1.
443
2.48
53.
082
5.56
75.
253
7.01
112
.263
2.72
24.
857
8.49
67.
496
Plas
tic p
rodu
cts
1.27
41.
525
2.62
44.
149
6.73
85.
423
12.1
622.
197
4.25
59.
543
8.54
3G
lass
and
gla
ss p
rodu
cts
1.46
62.
507
2.38
04.
888
6.82
76.
354
13.1
802.
710
4.33
48.
990
7.99
0N
on-m
etal
lic m
iner
als
2.54
62.
100
2.16
44.
265
4.03
96.
810
10.8
491.
825
2.67
54.
262
3.26
2B
asic
iron
and
ste
el
0.77
12.
251
2.58
84.
839
4.95
95.
609
10.5
683.
920
7.27
713
.710
12.7
10B
asic
non
-fer
rous
met
als
0.78
01.
173
2.02
23.
195
3.56
83.
975
7.54
32.
503
5.09
59.
669
8.66
9M
etal
pro
duct
s ex
clud
ing
mac
hine
ry
3.01
61.
921
2.67
94.
600
5.86
87.
615
13.4
841.
637
2.52
54.
471
3.47
1M
achi
nery
and
equ
ipm
ent
2.50
82.
175
2.75
04.
925
6.20
87.
433
13.6
411.
867
2.96
45.
440
4.44
0

The Economic Contribution of Copyright-Based Industries in South Africa
73
Tabl
e 24
: Em
ploy
men
t Mul
tiplie
rs 2
009
(Con
tinue
d)
Indu
stry
Initi
al
effe
cts
Firs
t rou
nd
effe
cts
Indu
stri
al
supp
ort e
ffect
Prod
uctio
n in
duce
d ef
fect
Cons
umpt
ion
indu
ced
effe
cts
Sim
ple
Tota
l Ty
pe 1
ATy
pe
1B
Type
2A
Type
2b
Elec
tric
al m
achi
nery
and
app
arat
us1.
205
1.83
92.
785
4.62
45.
956
5.82
811
.784
2.52
74.
838
9.78
28.
782
Tele
visi
on, r
adio
and
com
mun
icat
ion
equi
pmen
t 0.
963
2.12
72.
624
4.75
16.
639
5.71
512
.354
3.20
85.
932
12.8
2511
.825
Prof
essi
onal
and
sci
entifi
c eq
uipm
ent
1.63
62.
375
2.66
55.
040
5.21
16.
676
11.8
872.
452
4.08
17.
266
6.26
6M
otor
veh
icle
s, p
arts
and
acc
esso
ries
1.15
12.
240
3.61
65.
857
6.47
37.
008
13.4
812.
946
6.08
711
.711
10.7
11O
ther
tran
spor
t equ
ipm
ent
0.99
21.
600
2.67
04.
270
7.10
75.
263
12.3
702.
613
5.30
412
.467
11.4
67Fu
rnitu
re
2.92
32.
783
3.69
56.
478
6.44
69.
401
15.8
471.
952
3.21
65.
421
4.42
1O
ther
man
ufac
turin
g 2.
130
1.80
31.
850
3.65
43.
837
5.78
49.
621
1.84
62.
715
4.51
73.
517
Elec
tric
ity, g
as a
nd s
team
0.
825
0.83
61.
581
2.41
64.
378
3.24
17.
619
2.01
33.
930
9.23
98.
239
Wat
er s
uppl
y 0.
826
0.80
11.
796
2.59
73.
620
3.42
27.
042
1.97
04.
144
8.52
97.
529
Bui
ldin
g co
nstr
uctio
n3.
103
1.95
43.
067
5.02
14.
490
8.12
512
.615
1.63
02.
618
4.06
53.
065
Civi
l eng
inee
ring
and
othe
r con
stru
ctio
n 3.
733
1.85
52.
528
4.38
24.
409
8.11
512
.525
1.49
72.
174
3.35
52.
355
Who
lesa
le a
nd re
tail
trad
e 6.
438
1.23
31.
400
2.63
34.
865
9.07
113
.936
1.19
21.
409
2.16
41.
164
Cate
ring
and
acco
mm
odat
ion
serv
ices
7.46
21.
856
2.58
94.
445
4.27
611
.908
16.1
841.
249
1.59
62.
169
1.16
9Tr
ansp
ort a
nd s
tora
ge
2.26
51.
255
1.76
33.
018
3.87
95.
283
9.16
31.
554
2.33
34.
046
3.04
6Co
mm
unic
atio
n0.
565
1.05
31.
674
2.72
84.
110
3.29
27.
402
2.86
65.
831
13.1
1012
.110
Fina
nce
and
insu
ranc
e1.
002
0.70
30.
901
1.60
55.
088
2.60
77.
695
1.70
22.
601
7.67
86.
678
Bus
ines
s se
rvic
es
4.15
51.
401
1.56
62.
967
3.93
47.
122
11.0
561.
337
1.71
42.
661
1.66
1M
edic
al, d
enta
l and
vet
erin
ary
serv
ices
1.
959
1.81
62.
057
3.87
25.
057
5.83
110
.889
1.92
72.
977
5.55
84.
558
Excl
udin
g m
edic
al, d
enta
l and
vet
erin
ary
serv
ices
1.
393
2.08
02.
160
4.24
04.
422
5.63
310
.055
2.49
24.
043
7.21
66.
216
Oth
er p
rodu
cers
31
.002
0.70
20.
771
1.47
39.
858
32.4
7542
.333
1.02
31.
048
1.36
50.
365
Gen
eral
gov
ernm
ent s
ervi
ces
4.44
11.
014
1.18
92.
203
7.96
46.
644
14.6
081.
228
1.49
63.
290
2.29
0
Sour
ce:A
utho
rs’c
alcu
latio
nsw
ithd
ata
from
the
Sup
ply
and
Use
Tab
les
(SU
T)o
fSt
atis
tics
Sout
hA
fric
a(S
tats
SA
).

The E
cono
mic C
ontri
butio
n of
Copy
right
-Bas
ed In
dustr
ies i
n Sou
th A
frica
74
Tabl
e 25
: Im
port
Mul
tiplie
rs 2
009
Indu
stry
Initi
al
effe
cts
Firs
t ro
und
effe
cts
Indu
stri
al
supp
ort
effe
ct
Prod
uctio
n in
duce
d ef
fect
Cons
umpt
ion
indu
ced
effe
cts
Sim
ple
Tota
lTy
pe 1
A
Type
1B
Ty
pe 2
A
Type
2b
Agr
icul
ture
, for
estr
y an
d fis
hing
0.06
40.
125
0.19
40.
319
0.23
30.
382
0.61
62.
967
6.01
49.
678
8.67
8Co
al m
inin
g0.
021
0.13
50.
154
0.28
90.
192
0.31
10.
503
7.34
314
.599
23.6
3922
.639
Gol
d an
d ur
aniu
m o
re m
inin
g 0.
000
0.09
70.
094
0.19
10.
338
0.19
10.
528
--
--
Oth
er m
inin
g0.
564
0.09
70.
133
0.23
10.
192
0.79
50.
987
1.17
31.
410
1.75
10.
751
Food
0.09
90.
069
0.21
80.
287
0.27
30.
387
0.66
01.
696
3.90
16.
657
5.65
7B
ever
ages
0.08
90.
060
0.16
50.
225
0.28
00.
314
0.59
41.
678
3.52
56.
660
5.66
0To
bacc
o0.
032
0.05
60.
191
0.24
70.
206
0.27
90.
485
2.73
88.
698
15.1
1114
.111
Text
iles
0.38
20.
176
0.23
80.
414
0.37
30.
796
1.16
91.
461
2.08
53.
061
2.06
1W
earin
g ap
pare
l0.
566
0.14
10.
192
0.33
30.
400
0.90
01.
300
1.24
91.
589
2.29
41.
294
Leat
her a
nd le
athe
r pro
duct
s0.
327
0.12
00.
212
0.33
20.
339
0.65
90.
998
1.36
72.
015
3.05
32.
053
Foot
wea
r 0.
728
0.20
90.
242
0.45
10.
337
1.18
01.
517
1.28
71.
619
2.08
21.
082
Woo
d an
d w
ood
prod
ucts
0.
094
0.07
90.
193
0.27
20.
309
0.36
60.
675
1.83
43.
878
7.15
16.
151
Pape
r and
pap
er p
rodu
cts
0.12
70.
135
0.25
50.
391
0.30
30.
517
0.82
02.
067
4.07
96.
466
5.46
6Pr
intin
g, p
ublis
hing
and
reco
rded
med
ia
0.08
30.
131
0.22
40.
355
0.37
70.
438
0.81
52.
569
5.24
89.
768
8.76
8Co
ke a
nd re
fined
pet
role
um p
rodu
cts
0.23
20.
297
0.19
20.
489
0.19
30.
721
0.91
42.
281
3.10
63.
936
2.93
6B
asic
che
mic
als
0.37
60.
239
0.25
80.
497
0.23
40.
873
1.10
71.
636
2.32
02.
942
1.94
2O
ther
che
mic
als
and
man
-mad
e fib
res
0.38
40.
184
0.26
50.
449
0.29
00.
832
1.12
21.
479
2.16
92.
925
1.92
5Ru
bber
pro
duct
s0.
541
0.18
80.
270
0.45
80.
287
0.99
91.
286
1.34
81.
848
2.37
91.
379
Plas
tic p
rodu
cts
0.21
70.
161
0.22
80.
389
0.36
80.
607
0.97
51.
739
2.78
94.
483
3.48
3G
lass
and
gla
ss p
rodu
cts
0.20
30.
153
0.18
00.
333
0.37
30.
536
0.90
91.
754
2.63
84.
474
3.47
4N
on-m
etal
lic m
iner
als
0.19
50.
201
0.17
70.
377
0.22
10.
572
0.79
32.
030
2.93
74.
070
3.07
0B
asic
iron
and
ste
el
0.09
60.
245
0.21
30.
458
0.27
10.
554
0.82
53.
543
5.75
98.
577
7.57
7B
asic
non
-fer
rous
met
als
0.15
40.
157
0.19
00.
346
0.19
50.
500
0.69
52.
018
3.25
24.
520
3.52
0M
etal
pro
duct
s ex
clud
ing
mac
hine
ry
0.19
10.
093
0.23
50.
328
0.32
10.
519
0.84
01.
490
2.72
24.
405
3.40
5M
achi
nery
and
equ
ipm
ent
1.50
90.
319
0.25
80.
577
0.33
92.
086
2.42
51.
211
1.38
21.
607
0.60
7

The Economic Contribution of Copyright-Based Industries in South Africa
75
Tabl
e 25
: Im
port
Mul
tiplie
rs 2
009
(Con
tinue
d)
Indu
stry
Initi
al
effe
cts
Firs
t ro
und
effe
cts
Indu
stri
al
supp
ort
effe
ct
Prod
uctio
n in
duce
d ef
fect
Cons
umpt
ion
indu
ced
effe
cts
Sim
ple
Tota
lTy
pe 1
A
Type
1B
Ty
pe 2
A
Type
2b
Elec
tric
al m
achi
nery
and
app
arat
us0.
541
0.18
00.
252
0.43
20.
326
0.97
31.
299
1.33
31.
799
2.40
11.
401
Tele
visi
on, r
adio
and
com
mun
icat
ion
equi
pmen
t 2.
919
0.86
10.
463
1.32
40.
363
4.24
34.
606
1.29
51.
453
1.57
80.
578
Prof
essi
onal
and
sci
entifi
c eq
uipm
ent
2.64
70.
297
0.22
10.
518
0.28
53.
165
3.44
91.
112
1.19
61.
303
0.30
3M
otor
veh
icle
s, p
arts
and
acc
esso
ries
0.54
10.
261
0.32
20.
583
0.35
41.
124
1.47
81.
482
2.07
82.
732
1.73
2O
ther
tran
spor
t equ
ipm
ent
0.95
70.
359
0.31
00.
670
0.38
91.
627
2.01
51.
375
1.69
92.
105
1.10
5Fu
rnitu
re
0.25
20.
107
0.22
30.
330
0.35
20.
582
0.93
41.
425
2.31
03.
710
2.71
0O
ther
man
ufac
turin
g 0.
172
0.17
70.
151
0.32
90.
210
0.50
00.
710
2.03
22.
915
4.13
83.
138
Elec
tric
ity, g
as a
nd s
team
0.
000
0.04
70.
122
0.16
90.
239
0.16
90.
408
--
--
Wat
er s
uppl
y 0.
000
0.06
40.
148
0.21
20.
198
0.21
20.
410
--
--
Bui
ldin
g co
nstr
uctio
n0.
002
0.09
90.
222
0.32
10.
245
0.32
30.
569
57.0
0818
2.68
932
1.50
432
0.50
4Ci
vil e
ngin
eerin
g an
d ot
her c
onst
ruct
ion
0.00
50.
134
0.20
40.
339
0.24
10.
343
0.58
528
.232
69.5
5611
8.37
111
7.37
1W
hole
sale
and
reta
il tr
ade
0.00
00.
030
0.11
10.
141
0.26
60.
141
0.40
710
1.28
147
6.99
813
75.4
2313
74.4
23Ca
terin
g an
d ac
com
mod
atio
n se
rvic
es0.
184
0.04
30.
142
0.18
40.
234
0.36
90.
602
1.23
11.
999
3.26
82.
268
Tran
spor
t and
sto
rage
0.
084
0.09
90.
161
0.26
00.
212
0.34
30.
556
2.17
44.
093
6.62
05.
620
Com
mun
icat
ion
0.04
80.
208
0.23
40.
442
0.22
50.
489
0.71
45.
370
10.2
7414
.991
13.9
91Fi
nanc
e an
d in
sura
nce
0.00
90.
013
0.05
30.
065
0.27
80.
074
0.35
22.
423
8.41
139
.952
38.9
52B
usin
ess
serv
ices
0.
012
0.05
50.
119
0.17
40.
215
0.18
60.
401
5.75
616
.083
34.7
1333
.713
Med
ical
, den
tal a
nd v
eter
inar
y se
rvic
es
0.00
30.
135
0.16
30.
298
0.27
60.
301
0.57
752
.199
114.
389
219.
624
218.
624
Excl
udin
g m
edic
al, d
enta
l and
vet
erin
ary
serv
ices
0.
015
0.17
60.
177
0.35
30.
242
0.36
80.
610
12.5
2424
.109
39.9
5438
.954
Oth
er p
rodu
cers
0.
098
0.03
40.
062
0.09
60.
539
0.19
50.
733
1.34
41.
980
7.46
46.
464
Gen
eral
gov
ernm
ent s
ervi
ces
0.00
00.
060
0.10
20.
162
0.43
50.
162
0.59
8-
--
-
Sour
ce:A
utho
rs’c
alcu
latio
nsw
ithd
ata
from
the
Sup
ply
and
Use
Tab
les
(SU
T)o
fSt
atis
tics
Sout
hA
fric
a(S
tats
SA
).

The E
cono
mic C
ontri
butio
n of
Copy
right
-Bas
ed In
dustr
ies i
n Sou
th A
frica
76