Copyright © 2002 by author, Sankaran Radhakrishnan This is a

Copyright
by
Krishnaprabha Krishnanivas Radhakrishnan
2010

The Thesis committee for Krishnaprabha Krishnanivas Radhakrishnan
Certifies that this is the approved version of the following thesis :
Development of a decision-making procedure for outsourcing
engineering services in TxDOT
APPROVED BY
SUPERVISING COMMITTEE:
Supervisor:Khali R Persad
Supervisor:William J O’Brien

Development of a decision-making procedure for outsourcing
engineering services in TxDOT
by
Krishnaprabha Krishnanivas Radhakrishnan, B.Tech., MBA
THESIS
Presented to the Faculty of the Graduate School of
The University of Texas at Austin
in Partial Fulfillment
of the Requirements
for the Degree of
MASTER OF SCIENCE IN ENGINEERING
THE UNIVERSITY OF TEXAS AT AUSTIN
May 2010

Dedicated to my beloved husband and family.

Acknowledgments
I would like to thank Dr. Khali R Persad for his valuable direction, assis-
tance and guidance during the course of the graduate research and preparation of
the thesis. I wish to thank Dr. William J OBrien for his recommendations and
suggestions on the thesis.
I would like to thank all my teachers in school and college for their motivation
to pursue graduate studies. I wish to thank my student colleagues and friends who
helped me in many ways.
Financial support of the Texas Department of Transportation in the form of
research assistantship under the contract 0-6581 is gratefully acknowledged.
No words can express the thanks I owe to my dear husband Vimal for his
continuous support and inspiration. Lastly I wish to thank our families for their
love and encouragement.
v

Development of a decision-making procedure for outsourcing
engineering services in TxDOT
Krishnaprabha Krishnanivas Radhakrishnan, MSE
The University of Texas at Austin, 2010
Supervisors: Khali R PersadWilliam J O’Brien
The trend to outsource the engineering functions in state departments of
transportation (DOTs) to private consultants has increased in recent years. How-
ever, most DOTs do not have a strategic approach to the outsourcing of engineering
functions or projects. This thesis addresses that gap by examining outsourcing
decision-making in the Texas Department of Transportation (TxDOT) and devel-
oping a rationalized procedure.
TxDOT, the largest state DOT in terms of annual construction program,
expends about 65% of its engineering on consultants. Staff from 18 of TxDOTs 25
districts were interviewed for this research, and Strengths, Weaknesses, Opportuni-
ties, and Threats (SWOT) Analysis is used to identify improvements to the current
decision-making processes. A framework is presented for systematic assessment of
the outsourcing potential of engineering functions, which would enable TxDOT dis-
tricts to determine what engineering work to contract out cost-effectively without
sacrificing core competencies.
vi

Table of Contents
Acknowledgments v
Abstract vi
List of Tables xi
List of Figures xii
Chapter 1. Introduction 1
1.1 Background . . . . . . . . . . . . . . . . . . . . . . . . . . . . . . . . 1
1.2 Motivation . . . . . . . . . . . . . . . . . . . . . . . . . . . . . . . . . 2
1.3 Objectives . . . . . . . . . . . . . . . . . . . . . . . . . . . . . . . . . 3
1.4 Scope . . . . . . . . . . . . . . . . . . . . . . . . . . . . . . . . . . . 4
1.5 Limitations . . . . . . . . . . . . . . . . . . . . . . . . . . . . . . . . 4
1.6 Report Structure . . . . . . . . . . . . . . . . . . . . . . . . . . . . . 4
Chapter 2. Methodology and Data Collection 6
2.1 Overview . . . . . . . . . . . . . . . . . . . . . . . . . . . . . . . . . 6
2.2 Define Research Objectives, Scope and Limitations . . . . . . . . . . 6
2.3 Review of Existing Literature . . . . . . . . . . . . . . . . . . . . . . 8
2.3.1 Engineering outsourcing situation in DOTs . . . . . . . . . . . 8
2.3.2 Common outsourcing approaches in all sectors . . . . . . . . . 9
2.4 Study the Current Engineering Outsourcing Approach . . . . . . . . 9
2.5 Analyze the Current Outsourcing Approach . . . . . . . . . . . . . . 10
2.6 Develop an Outsourcing Decision Making Procedure . . . . . . . . . 10
2.7 Recommend Changes in the Current System . . . . . . . . . . . . . . 11
vii

Chapter 3. Outsourcing Trend 12
3.1 Chapter Objectives . . . . . . . . . . . . . . . . . . . . . . . . . . . . 12
3.2 Chapter Introduction . . . . . . . . . . . . . . . . . . . . . . . . . . . 12
3.3 History of Outsourcing in State DOTs . . . . . . . . . . . . . . . . . 13
3.4 Factors Necessitated Outsourcing . . . . . . . . . . . . . . . . . . . . 16
3.5 Outsourcing in TxDOT . . . . . . . . . . . . . . . . . . . . . . . . . 19
3.6 Significance of Decision Making Approach . . . . . . . . . . . . . . . 22
3.7 Chapter Summary . . . . . . . . . . . . . . . . . . . . . . . . . . . . 23
Chapter 4. Outsourcing Frameworks 25
4.1 Chapter Objectives . . . . . . . . . . . . . . . . . . . . . . . . . . . . 25
4.2 Chapter Introduction . . . . . . . . . . . . . . . . . . . . . . . . . . . 25
4.3 Private Sector Outsourcing Models . . . . . . . . . . . . . . . . . . . 26
4.3.1 US Ship building industry . . . . . . . . . . . . . . . . . . . . 31
4.4 Outsourcing Decision Making Models Developed by DOTs . . . . . . 34
4.4.1 Arizona: Quantitative and qualitative models . . . . . . . . . 34
4.4.2 Pennsylvania Contractibility Model . . . . . . . . . . . . . . . 36
4.4.3 Louisiana DOT . . . . . . . . . . . . . . . . . . . . . . . . . . 36
4.4.4 Oregon DOT . . . . . . . . . . . . . . . . . . . . . . . . . . . . 37
4.4.5 Wisconsin DOT study . . . . . . . . . . . . . . . . . . . . . . 41
4.5 Texas Outsourcing Assessment Instrument . . . . . . . . . . . . . . . 42
4.5.1 Functional Sourcing Decision Flowchart . . . . . . . . . . . . . 43
4.5.2 Functional Sourcing Decision Support Model (FSDSM) . . . . 44
4.6 Chapter Summary . . . . . . . . . . . . . . . . . . . . . . . . . . . . 47
Chapter 5. Analysis of the current engineering outsourcing approachof TxDOT districts 48
5.1 Chapter Objectives . . . . . . . . . . . . . . . . . . . . . . . . . . . . 48
5.2 Project Development Process of TxDOT . . . . . . . . . . . . . . . . 48
5.3 Current PE Outsourcing Situation in TxDOT . . . . . . . . . . . . . 50
5.3.1 Functions of CCO . . . . . . . . . . . . . . . . . . . . . . . . . 51
5.3.2 PE Outsourcing approaches of TxDOT districts . . . . . . . . 52
5.3.2.1 Assessment of project requirements and analysis of in-house staff availability . . . . . . . . . . . . . . . . . . 54
viii

5.3.2.2 Revising work plans as per CCO allocation . . . . . . 58
5.3.2.3 Factors affecting consultant selection . . . . . . . . . 58
5.3.2.4 Commonly outsourced PE functions . . . . . . . . . . 59
5.3.3 Contract Types . . . . . . . . . . . . . . . . . . . . . . . . . . 61
5.3.4 Cost Tracking . . . . . . . . . . . . . . . . . . . . . . . . . . . 63
5.4 SWOT Analysis of TxDOT Project Delivery Situation . . . . . . . . 63
5.4.1 Strengths . . . . . . . . . . . . . . . . . . . . . . . . . . . . . . 64
5.4.2 Weaknesses . . . . . . . . . . . . . . . . . . . . . . . . . . . . 65
5.4.3 Opportunities . . . . . . . . . . . . . . . . . . . . . . . . . . . 70
5.4.4 Threats . . . . . . . . . . . . . . . . . . . . . . . . . . . . . . . 71
5.5 Chapter Summary . . . . . . . . . . . . . . . . . . . . . . . . . . . . 74
Chapter 6. Development of a decision making procedure for out-sourcing engineering services 75
6.1 Chapter Objectives . . . . . . . . . . . . . . . . . . . . . . . . . . . . 75
6.2 Design Project Allocation Procedure . . . . . . . . . . . . . . . . . . 75
6.3 Chapter Summary . . . . . . . . . . . . . . . . . . . . . . . . . . . . 85
Chapter 7. Findings and Recommendations 86
7.1 Findings . . . . . . . . . . . . . . . . . . . . . . . . . . . . . . . . . . 86
7.2 Recommendations . . . . . . . . . . . . . . . . . . . . . . . . . . . . 87
7.2.1 Outsourcing approach . . . . . . . . . . . . . . . . . . . . . . . 87
7.2.2 Changes required in the current system . . . . . . . . . . . . . 88
7.2.2.1 Consultant selection process . . . . . . . . . . . . . . 88
7.2.2.2 Indefinite deliverable contracts . . . . . . . . . . . . . 88
7.2.2.3 Regionalization . . . . . . . . . . . . . . . . . . . . . . 89
7.2.2.4 Performance appraisal system . . . . . . . . . . . . . 89
7.2.2.5 Recruitment . . . . . . . . . . . . . . . . . . . . . . . 89
7.2.2.6 Training/Selection of people with management skills . 89
7.2.2.7 Attitudinal changes . . . . . . . . . . . . . . . . . . . 90
7.2.2.8 Systematic project tracking facilities . . . . . . . . . . 90
7.3 Minimum Consultant Work . . . . . . . . . . . . . . . . . . . . . . . 90
Appendices 92
ix

Appendix A. TxDOT Classification of PE Functions 93
Appendix B. Interview Questionnaire 94
Appendix C. Gain in Consultant Involvement 98
Appendix D. Percentage of Consultant Involvement in DOTs 99
Appendix E. Outsourcing Responsibilities Matrix 100
Appendix F. PDP Flow chart 101
Appendix G. Snapshot of HPTMS Output 104
Appendix H. Sample Suretrak Output 109
Appendix I. Table of Cost and Manhours 111
Appendix J. Functional Sourcing Assessment Checklist 114
Bibliography 117
Vita 121
x

List of Tables
3.1 DOT Outsourcing in 2000 . . . . . . . . . . . . . . . . . . . . . . . . 15
3.2 Number of State DOTs That Reported Factors as “Important” or“Very Important” in Decisions to Contract Out Activities . . . . . . 20
4.1 Six Balanced Score Card Perspectives . . . . . . . . . . . . . . . . . 39
5.1 Interviewees . . . . . . . . . . . . . . . . . . . . . . . . . . . . . . . . 53
5.2 Lack of skills . . . . . . . . . . . . . . . . . . . . . . . . . . . . . . . 60
5.3 Lack of staff . . . . . . . . . . . . . . . . . . . . . . . . . . . . . . . . 60
5.4 Enhance in-house capacity . . . . . . . . . . . . . . . . . . . . . . . . 61
5.5 Lack of resources/equipment . . . . . . . . . . . . . . . . . . . . . . 61
5.6 Application software used by districts . . . . . . . . . . . . . . . . . 66
5.7 Trend in employee turnover . . . . . . . . . . . . . . . . . . . . . . . 73
5.8 Percentage of Management Staff eligible to retire within the next fiveyears . . . . . . . . . . . . . . . . . . . . . . . . . . . . . . . . . . . . 74
6.1 Probable PE cost and manhours of in-house projects . . . . . . . . . 79
7.1 SWOT matrix . . . . . . . . . . . . . . . . . . . . . . . . . . . . . . . 86
7.2 Minimum PE work to be kept in-house . . . . . . . . . . . . . . . . . 91
xi

List of Figures
3.1 State-wide trend in outsourcing . . . . . . . . . . . . . . . . . . . . . 17
3.2 TxDOT Outsourcing During 1990-1995 . . . . . . . . . . . . . . . . 21
4.1 Practical framework for evaluating the outsourcing decision . . . . . 30
4.2 Decision making process diagram . . . . . . . . . . . . . . . . . . . . 31
4.3 Foundation Tasks Precede Applications of the decisions making process 32
4.4 Outsourcing decision making flow chart . . . . . . . . . . . . . . . . 40
4.5 Functional Sourcing Decision Flowchart . . . . . . . . . . . . . . . . 45
4.6 Functional Sourcing Decision Procedure . . . . . . . . . . . . . . . . 46
5.1 Retirement eligibility within five years . . . . . . . . . . . . . . . . . 74
6.1 Implementation Process-Design Project Allocation Procedure . . . . 77
6.2 Design project allocation procedure-Phase 1 (Foundation/Preliminarytasks) . . . . . . . . . . . . . . . . . . . . . . . . . . . . . . . . . . . 81
6.3 Design project allocation procedure-Phase 2 . . . . . . . . . . . . . . 82
6.4 Project allocation procedure-Phase 3 . . . . . . . . . . . . . . . . . . 83
xii

Chapter 1
Introduction
1.1 Background
The Texas Department of Transportation’s (TxDOT) mission is to work co-
operatively to provide safe, effective and efficient movement of people and goods.
TxDOT, in cooperation with local and regional officials, is responsible for planning,
designing, building, operating and maintaining the state’s transportation system
(Goals and strategies, TxDOT official website). Planning and design (Preliminary
Engineering) are critical phases of project delivery. Quality and timely completion
of PE are key factors in project success. Traditionally, TxDOT performed all pre-
liminary engineering activities in-house. However, due to change of internal and
external factors, consultants now account for a major portion of TxDOT PE. This
report presents an analysis of TxDOT proceedings for utilizing consultants for PE
work.
TxDOT has the largest highway system of 191,530 lane miles and manages
an average annual budget of $8.4 billion (FHWA report, 2007). Approximate staff
strength of TxDOT is 15,000. Among them, 4600 employees are working on PE
functions (TxDOT work force plan, 2009-13). According to Deloitte, approximately
65% (based on fees) of TxDOT’s entire project development process is performed
by the private sector due to lack of internal capacity to perform all of the required
engineering work (Deloitte report, 2007). Apart from this, the Texas Legislature
passed a law in 1997 requiring that at least 35% of TxDOT’s engineering work must
be contracted out to consultants.
1

Texas has decentralized the design and engineering services to a great extent
to district level and critical decisions regarding outsourcing of engineering services
are made by them. The project development process is spread among 135 locations,
including 119 area offices, and metropolitan and urban district headquarters. Each
of the 25 TxDOT districts has area engineer offices where the majority of roadway
engineering and design work is either developed or supervised. In addition, some
of the design services are being accomplished in the largest district headquarters
(TxDOT official website).
According to TxDOT’s project development process manual, Preliminary
design, Environmental studies, Planning, Specification and Estimates (PS&E) de-
velopment are considered as Pre-construction Engineering (PE) functions. Prelimi-
nary Engineering functions are crucial in the project development process. TxDOT
has a detailed classification regarding PE functions starting with function code 102
and it is given as Appendix A.
1.2 Motivation
Outsourcing of engineering work is a contentious issue within DOTs and
consultant community. Unfortunately in most cases, the debate centers on the cost
comparison. There are arguments in favor of both consultants and DOTs regarding
the cost effectiveness. It is a fact that outsourcing of engineering services is increas-
ing over the years. TxDOT tops the list of highway funding and approximately 65%
of the money is spent on consultant work annually.
Decisions regarding outsourcing of core functions such as engineering and
design need systematic analysis. PE services define the identity of a transportation
agency like TxDOT which is responsible for developing and constructing state’s
highway system. Losing control over core competencies will eventually make the
2

TxDOT “hollow”. All phases of the project development will be adversely affected
by the uncontrolled outsourcing. The gravity of this issue increases when considering
the fact that TxDOT is responsible for proper utilization of taxpayers’ money.
Most of the surveys conducted among DOT staff concluded that cost effec-
tiveness is not the only reason behind the decision to hire consultants. However,
there are numerous factors which would require DOTs to outsource engineering
work. The need is to identify those factors to evaluate their influence on the de-
cision to contract out services. Based on that, a proper strategy can be devised
giving due consideration to the in-house in the analysis. In other words, organize
the information in a way that guides DOTs in making the best decisions regarding
contracting out. The best decision results in the selection of right volume of right
services for contracting out.
An in depth study of the engineering approach of TxDOT is necessary to
understand the current situation. A modified method can be developed after identi-
fying the drawbacks of the current methods. Due to the decentralization of the en-
gineering and design functions, districts control the selection of consultant projects.
Usually the districts consider all projects in the future program of work together and
allocate projects to in-house and consultants. A systematic decision- making pro-
cedure which involves both subjective and analytical assessments before allocating
projects is needed at the district level to ensure diligent utilization of consultants.
1.3 Objectives
The primary objectives of this research are given below
1. To assess the engineering outsourcing practices of TxDOT districts
2. To develop a systematic decision making procedure for TxDOT districts re-
3

garding engineering projects.
3. To suggest improvements required in the entire system for effectively utilizing
consultants to deliver engineering services.
1.4 Scope
The research is an attempt to study the prevalent practices followed by
TxDOT districts to make decisions to hire consultants to perform engineering func-
tions for their future program of work. A suitable engineering outsourcing decision
making procedure is developed after identifying factors affecting the decisions. The
proposed framework considers all factors in the logical sequence. The style of func-
tioning and the engineering outsourcing scenario of all DOTs are similar in nature.
Any state transportation department can adopt this method for allocating projects
in their program of work.
1.5 Limitations
The research concentrates on outsourcing of engineering services at the dis-
trict level. Engineering done in specific divisions such as the Turnpike is not con-
sidered. Because of time constraints, the engineering outsourcing decision making
procedure developed in this research could not be field tested to identify the possible
implementation related issues.
1.6 Report Structure
The report is organized into seven chapters. Chapter 2 explains the investi-
gation methodology. The literature review performed for the research is explained in
Chapters 3 and 4. Chapter 5 explains the current engineering practices of TxDOT
4

districts. The analysis of the current practices is also explained in this chapter.
Chapter 6 presents the new project allocation method for districts. The findings
and other suggestions are included in Chapter 7.
5

Chapter 2
Methodology and Data Collection
2.1 Overview
The methodology followed to conduct this research is outlined in this chap-
ter. Development of the questionnaire and the data collection were the most time
consuming steps in the process. Various mile stones in the research are given below.
1. Define research objectives, scope and limitations
2. Review literature
3. Study current engineering outsourcing approach
4. Analyze the current outsourcing approach using SWOT (Strengths, Weak-
nesses, Opportunities and Threats) analysis
5. Develop an improved outsourcing decision making procedure for districts
6. Recommend changes needed for the effective implementation of the procedure
developed
Each step in the investigation methodology is explained in the following
sections.
2.2 Define Research Objectives, Scope and Limitations
The initial concept of this study was developed based on the TxDOT re-
search project 0-6581 whose objective was to analyze the current project delivery
6

practices of TxDOT. An in-depth study of the engineering services outsourcing ap-
proach of TxDOT was planned in order to find out the shortcomings of the current
system. The scope of this study was further narrowed down after meeting top offi-
cials from the Consultant Contract Office of the Central Design Division (Director,
Ms. Camille Thomason and Associate Director, Mr. Dan M Neal).
It was found that TxDOT districts have significant control over outsourc-
ing of engineering services and the researcher decided to concentrate more on the
outsourcing approaches at the district level. Unlike other DOTs, TxDOT has de-
centralized most of their functions. Districts are responsible for major part of the
design, supervision and letting. Engineering outsourcing decision making methods
of individual TxDOT districts were studied by conducting questionnaire surveys. A
SWOT analysis (Strengths, Weaknesses, Opportunities and Threats) of the current
project delivery practices was done as the next step. Drawbacks of the engineering
outsourcing approach prevalently followed by the districts were found out and a new
outsourcing decision making procedure was developed.
The fundamental objective was to develop an outsourcing strategy that en-
sures the long term operational success of TxDOT while hiring consultants to deliver
non-core competencies. It makes use of the in-house potential to the fullest extent
and gives prime importance to the in-house preferences.
It was planned to identify major in-house preferences and other relevant
factors to be considered in the project allocation through conducting questionnaire
survey among districts. Based on the analysis, it was planned to develop a common
systematic function-wise project allocation method regarding the future program of
work of districts.
Coordination with other internal agencies such as Head Quarters Design
division is unavoidable in making outsourcing decisions and a finalizing future pro-
7

gram of work. Some part of the design is done by central design team and Turnpike
authority. These constraints were not considered in the development of the design
project allocation procedure. Most of the state DOTs face a comparable engineer-
ing outsourcing situation and hence the suggested decision making method could be
useful for any DOT.
2.3 Review of Existing Literature
Two distinct phases planned in the literature review are given below.
• The extent of engineering outsourcing situation in DOTs
• Common outsourcing approaches used in all sectors
2.3.1 Engineering outsourcing situation in DOTs
Increasing consultant involvement in performing engineering functions in
DOTs and the major factors influencing outsourcing were investigated. Very little
information was available about the exact issues of PE outsourcing. The following
sources were used for most of the information.
• National Cooperative Highway Research Program
• National Association of State Highway and Transportation Unions
• Transportation Research Board
• Studies conducted by individual DOTs
• Federal Highway Administration
• Government Accountability Office
8

The objective of this phase was to assess the importance of a systematic decision
making approach for DOTs.
2.3.2 Common outsourcing approaches in all sectors
This part of the literature survey gathered information regarding the out-
sourcing approaches of private and public sectors. The literature review was ex-
tended to private sector since enough information could not be collected about pub-
lic sector outsourcing approaches. It was found that following DOTs have developed
specific outsourcing decision making methods
• Arizona
• Pennsylvania
• Texas
• Louisiana
• Oregon
• Wisconsin
Research done by the DOTs was the main sources of information. Many websites
dealing with outsourcing decision making methods used in the private sector were
accessed through an extensive World Wide Web search.
2.4 Study the Current Engineering Outsourcing Approach
Questionnaire surveys were conducted among TxDOT districts to study their
current engineering outsourcing approach. The survey population consisted of of-
ficials from district Transportation Planning and Development (TP&D) sections.
Objectives of the survey are given below.
9

1. To understand the engineering outsourcing decision making methods used by
the districts
2. To find out the factors affecting the decision to outsource a PE function
3. To know the preferences of the in-house staff
4. To collect suggestions for improvement from the in-house staff
The questionnaire is given as Appendix B. Various TxDOT publications and
research reports were reviewed to understand the working of the entire system.
2.5 Analyze the Current Outsourcing Approach
Responses collected from the districts were documented and the common en-
gineering decision making procedures were identified. The SWOT analysis identified
key strengths and serious pitfalls of the current project delivery. SWOT analysis
is a classic strategic planning tool. The analysis involves defining the objective of
the project and identifying the internal and external factors that are favorable and
unfavorable to achieving those objectives. The technique was developed by Albert
Humphrey. SWOT analysis could also be used in any decision-making situation
when a desired end-state (objective) has been defined (Wang, 2007).
It is found that current methods for selecting consultant projects are highly
qualitative in nature. Some of the constraints in the system such as consultant se-
lection procedure made the systematic allocation of projects impossible for districts.
2.6 Develop an Outsourcing Decision Making Procedure
The engineering outsourcing decision making process of districts is based on
the future program of work. They select projects to be outsourced from the program
10

of work using various methods. A suitable project allocation method was developed
which minimizes the weaknesses identified in SWOT analysis. The suggested method
considers all the relevant factors based on their relative impact on the decision. Key
factors considered are in-house skills, capacity and staff preferences. The decision
making methods examines the factors analytically. Suggested project allocation
procedure is a multi step process, ensuring the participation of the whole in-house
staff.
2.7 Recommend Changes in the Current System
The SWOT analysis identified serious weaknesses in the present system
which can cause threats to the systematic engineering outsourcing decision mak-
ing process. Necessary changes required in the current system are included as
recommendations. Flexible consultant selection process, removing constraints on
indefinite deliverable type contracts and systematic project tracking facilities are
the important changes needed.
11

Chapter 3
Outsourcing Trend
3.1 Chapter Objectives
Outsourcing trend in state DOTs is explained in this chapter. Various re-
search conducted by transportation agencies such as NCHRP, TRB etc. revealed
the factors that necessitated DOTs to outsource engineering functions. The magni-
tude, reasons and impact of outsourcing in TxDOT are also investigated. Necessity
of a systematic outsourcing approach for DOTs is explained in the last part.
3.2 Chapter Introduction
Outsourcing is a widely accepted practice in the business world. The global
outsourcing expenditure peaked at $1 trillion in 2000 according to a Dun & Brad-
street study, with the US contribution at $318 million (Chelikani and Polineni,
2001). Outsourcing is the practice of subcontracting a process to another organiza-
tion that might otherwise performed by in-house employees. “Outsource” is defined
as a service outside the company which acts as an extension of the organizations
business but responsible for its own management. Outsourcing is also considered
as employing an outside agency to manage a function formerly carried on inside a
company (Robertson and Rothery,1995).
The extent of private sector involvement in government organizations is
rapidly increasing as they consider it as a strategic tool to improve performance
delivery. A new era has begun in outsourcing when California voters passed propo-
12

sition 13 in 1978. Several states followed California, and President Reagan in 1980
brought in an administration which pressed hard for the increased outsourcing of
public services (Allen et al, 1989). State transportation departments also immedi-
ately got on the outsourcing band wagon.
3.3 History of Outsourcing in State DOTs
Historically, in DOTs most of the engineering and design were done by the in-
house staff even though contracting out construction work was very common. In fact,
outsourcing existed even in 1950s and it has been increasing steadily throughout the
years. States like Minnesota had contracted out pre-design activities as early as in
1960s. As the construction volume of DOTs has increased over the years, consultants
have played a larger role in DOT PE activities. Details of changes in construction
volume and consultant payments for the period 1988-1998 are given in Appendix
C. Data from 31 states showed the median construction program in the 1980s was
about $350 million and the median expenditure for consultants was $12 million.
With 28 states reporting in 1998, the median values were $400 million and $25
million, respectively. Thus, though the median increase in construction volume was
about 15%, the median outlay for consultants doubled (NCHRP Synthesis, 1999).
Wisconsin audit report of 1997 found out that consultant involvement increased up
to 36% within the period from 1987-1997 (NCHRP 277, 2003).
The consultant usage by DOTs for PE and CE work in 1998 is given in
Appendix D. Most of the states were contracting out more than 50% of their work,
with New Jersey at 85%. In the period 1992-2002, NJDOT saw an increase of 2650%
in the total cost of outsourced contracts, from $3.9 million to $105.4 million. Not
shown in that list is Indiana, which, as of 1998, had privatized virtually the entire
PE function, outsourcing 99.8% of its preliminary design work (NASHTU, 2007).
13

In 2000, the Federal Highway Administration (FHWA) surveyed DOTs re-
garding outsourcing. The response summary is given in Table 3.1. It shows that
most of the states contract out design work. Tennessee topped the list, contracting
out 100% of design work (NCHRP, 2001).
14

Table 3.1: DOT Outsourcing in 2000
State Outsourced Topic Percent Contracted Comment
AL Design MostConstruction Inspection Most
AK Construction Contract Admin. 10%Design 31%
CO Design & Construction Oversight 51%
CT Design 72%Construction Inspection 61%
DE Design 60%Construction Inspection 60%
GA Design 25%
ID Design 67%Construction Management 10%
IA Construction Inspection 25% ROW 0%Roadway Design 62%Bridge Design 41%Planning (Location & Environment) 18%
KS Design 70% In-house maintenance
KY Professional Services 80% Design, Environmental Studies,Planning,Construction Services 5% Underwater Bridge Inspection, Photogammetry
ME Highway Design 30%Bridge Design 20%Construction Engineering 13%
MD Plans,Surveys,Mapping 90%,33%,100%Design 60%
MO Highway Design 82% Construction Inspection 0%Bridge Design 16%
NE Design 35% Construction Engineering 0%
NV Design 99+%
NH Design 33%
NJ Design 95%Construction 30%
NM Design Services 40% Pavement Marking 100%, Signing 100%Logo 100%, CM Services
ND Construction Engineering Services 20%Design 50%
OK Design 70%Construction Inspection 10%Bridge Inspections 75%
PR Engineering Services 90%
TN Design 50%Construction Inspection 100%ROW Appraisals 60%Environmental Studies 60%
TX Preliminary Engineering Services 51%Design Construction Engineering 2%
UT Design 45% Construction Inspections
WA Design and Construction Services Most EIS, Design and Construction Inspections
WV Preliminary Engineering Services 75% Environmental documents, PlansConstruction and Bridge inspections
Material inspections and ROW
(Source: NCHRP, 2001)
15

In Florida DOT in 2001, consultants performed 76% of design work, includ-
ing project development and environmental studies, and all aspects of design and
post-design services such as shop drawing review. In addition most FLDOT districts
have General Engineering Consultants who perform the DOT’s role in managing and
reviewing other consultant’s work. The outsourcing figure for FLDOT in 2008 was
81%, and it is projected to grow to 84% in FLDOT plans for fiscal years 2009-2013
(FLDOT, 2008).
Over the past 5 years, more than half the states have increased the amount
of preliminary engineering, design, and right-of-way activities as well as construc-
tion engineering and inspection activities they have contracted out to third parties.
A fewer number of states have increased contracting out of maintenance and oper-
ations activities. GAO conducted a survey among states regarding the volume of
outsourcing in states. The survey included the PE activities (surveying and map-
ping, locations studies, traffic studies, planning, and environmental impact analy-
sis), design (preliminary and final design work), and construction engineering and
inspection (inspections, materials testing, construction management, and schedule
analysis) (GAO report, 2006).
Figure 3.1 explains the state-wide trend in outsourcing over the past five
years.
3.4 Factors Necessitated Outsourcing
As the construction volume of DOTs has increased over the years, level
of consultant involvement also began increasing in engineering activities. Once
the DOTs completed the charge of Interstate System, which dominated for forty
years, the focus has been shifted to re construction, operation and maintenance.
The transportation act for the 21st century of 1998 brought renewed impetus to
16

0
5
10
15
20
25
30
35
Number of states
Highway activities
Increased
Maintained same level
Decreased
Righ
t-of-w
ay
Ong
oing
op
erat
ions
Rout
ine
mai
nten
ance
Fede
ral-a
id e
ligib
le
pre
vent
ive
mai
nten
ance
Cons
truct
ion
engi
neer
ing
and
insp
ectio
n
Desi
gn
Prel
imin
ary
engi
neer
ing
Response
50 50 48 43 46 43 49Number of statesresponding
Figure 3.1: State-wide trend in outsourcing(Source: GAO report, 2006)
construction funding.
The GAO study referred to earlier found seven factors that influence recent
trends in outsourcing (GAO, 2006):
• Loss of in-house staff: Most of the DOTs have experienced a shortage of skilled
staff due to retirement and attrition of employees. Hiring and wage freezes
have affected employee morale and hurt recruiting. Moreover, it is very com-
mon for in-house engineers to join consultant organizations after gaining their
professional license through DOT training.
• Variations in workload: Louisiana DOT officials have noted out added flexi-
bility from using consultants helps them to respond more quickly to spikes in
17

work volume than if they had to bring new in-house staff on board. Once the
work slows, it is easy to draw down the workforce without laying-off staff. In
Indiana, when the I-69 project was cancelled, the project team consisting of
private sector employees was re-deployed on other projects. If the team had
been made up of in-house staff, the DOT would have struggled to find suitable
work for them (Warne et al., 2008).
• Specialized skills and equipment: In certain skill areas consultants have exper-
tise that is not available in-house. In-house personnel are familiar with typical
projects but may need consultant help on specialized work. Pre-construction
engineering now includes archaeological or environmental studies, or may re-
quire complex or unique structural designs. Limited frequency of these projects
may not warrant keeping the relevant skills in-house. According to Council
of State Governments (CSG) data, more than 32 percent of state agencies
reveal that lack of state personnel and expertise was an important reason for
outsourcing (Moore et al, 2000).
• Schedule constraints: Consultants may be able to “load up” a project and exe-
cute it very quickly, whereas in-house staff juggling a large number of projects
on a “first-in first-out” basis generally cannot. When speed is required, con-
sultants are the preferred choice. The “27 in 7” program of South Carolina
DOT started in 1999 is a good example. That seven-year program delivered
projects that would have taken 27 years otherwise (SCDOT, 2008).
• Legal and policy requirements: In some states legal restrictions prevent the
expansion of the state work force. Some states, like Illinois, Michigan, New
Hampshire and Texas, are required to outsource a certain fraction of their
work. For example, the South Carolina Legislature enacted a budget provision
18

in 1996, encouraging the DOT to use the private sector for certain work,
like bridge replacements, surface treatments, thermo-plastic striping, traffic
signals, fencing, and guardrails, whenever possible. Similarly, Alaska DOT has
to involve consultants in PE work due to state requirements. On the contrary,
some states may have legislative limitations on their ability to contract out
work. For instance, the California DOT, until recently, was in such a situation
because of limited authority to contract out engineering services under the
California constitution (GAO report, 2006)
• Innovations: The private sector is better at innovating, for a number of reasons
including less stringent rules than the public sector on equipment replacement
and authority to use experimental techniques. When untested or unique work
is required, consultants are a good choice.
• Cost savings: It is uneconomic for state DOTs to maintain a workforce large
enough for peak workload conditions. Instead, work beyond some volume can
be more cost-effectively done by consultants.
The GAO study asked states to rank the importance of each of these seven
factors in their decision to contract out specific activities. Details of the survey
results are given in the Table 3.2. It is seen that, of the seven factors, cost savings
rank lowest in the outsourcing decision.
3.5 Outsourcing in TxDOT
In 2007, TxDOT ranked highest in highway funding, but second in Full Time
Equivalents (FTE) staff. In the early 1990s the Department contracted for about
25% of is PE work, performing essentially all CE with its own employees. Overall,
in 1990, 15% of TxDOT’s engineering expenditures were for outside consultants.
19

Table 3.2: Number of State DOTs That Reported Factors as “Important” or “VeryImportant” in Decisions to Contract Out Activities
Number of state DOTs, by highway activity
Factor Preliminary engineering Design
Construction engineering and
inspection
Federal-aid eligible
preventive maintenance
Routine maintenance
Ongoing operations
Right-of-way
activities
Lack of in-house staff 45 44 39 34 35 31 44
To maintain flexibility or manage variations in department workload 36 36 32 19 25 17 38
To access specialized skills or equipment 31 30 19 27 23 25 26
To increase speed of completion or to meet specific time frames 35 32 12 21 19 14 39
To meet federal or state legislative mandates, legal requirements, or policy initiatives 20 18 20 17 9 13 15
To identify innovative approaches or new techniques 10 14 4 11 4 11 5
To obtain cost savings 3 3 1 10 9 3 3
(Source: GAO report, 2006)
In 1991, the Legislature required TxDOT to achieve a balance between the use of
department employees and private contractors for PE and CE (Sunset, 1996). In
1995, 26.8 percent of the agency’s PE expenditures were for outside engineers, but
only 1 percent of expenditures for CE were for outside consultants (Sunset, 1996).
Figure 3.2 shows TxDOT PE and CE outsourcing during 1990-1995.
In 1997, the Texas Legislature passed a law requiring that at least 35% of Tx-
DOT’s engineering work must be contracted out to consultants. From 1994 through
1999, TxDOT’s contracts to private firms for PE went from $15 million to $123
million, an increase of 720%. However, by 2007, approximately 65% (based on fees)
of TxDOT’s entire project development process, including design, was performed
20

10
20
30
40
50
60
70
80
90
Perc
ent
1990 1991 1992 1993 1994 1995Years
Preliminary Engineering
In-House PE
Consultant PE
0 10 20 30 40 50 60 70 80 90
100
Perc
ent
1990 1991 1992 1993 1994 1995Years
Construction Engineering
In-House PE
Consultant PE
Comparison of Expenditures for In-House and Contracted Engineering, 1990-1995
0
10
20
30
40
50
60
70
80
90
100
Perc
ent
1990 1991 1992 1993 1994 1995Years
Total PE & CE
Consultant PE
In-House PE
Figure 3.2: TxDOT Outsourcing During 1990-1995(Source: Sunset, 1996)
by outside consultants. This growth was due to the large and increasing size of the
construction and maintenance programs, and TxDOT’s lack of internal capacity to
perform all of the design work required.
TxDOT generally does not hire third parties to augment the inspection func-
tion, even though the inspection resources in some districts are stretched to capacity.
“TxDOT considers the construction inspection function to be representative of its
commitment to quality to the Texas traveling public and therefore generally uses
inspectors that are Full Time Equivalents (FTEs) of the organization to perform
the primary evaluations of its projects” (Deloitte, 2007). The situation is changing,
with TxDOTs decision to outsource certain inspection activities such as material
testing to help ease the workload of inspectors.
21

However, this trend toward outsourcing more work has placed an increasing
load on TxDOT to effectively manage and monitor the large volume of external
consultant work. It would require TxDOT to establish standards of risk, quality and
practices to ensure the consultants deliver services consistent with the organization’s
current business practices. TxDOT work force needs to be trained in managing and
overseeing consultant work such as monitoring work progress, evaluating invoice
payments, coordinating work tasks and ensuring compliance (Deloitte, 2007).
3.6 Significance of Decision Making Approach
Outsourcing is always a convenient option for all DOTs. But the difficulty
is deciding what and how much to outsource, and what to handle in-house. There
has been a never-ending debate over consultant involvement. Most of the studies
concluded that consultants are more expensive than in-house. At least 17 stud-
ies performed during the past two decades comparing the costs of conducting pre-
construction engineering design by in-house staff or private consultants and more
than 80% of these reports have found that regular public employees are less expen-
sive than private contractors, with the difference in costs ranging from 30% to 100%
(Highway Robbery II, NASHTU report 2007).
Quality of engineering services performed by consultants is also a concern.
The worst mishap happened in 2006 in Boston when serious structural failures hap-
pened to the eight-lane underground highway. Some studies done by state DOTs like
Alaska, Montana and Wisconsin concluded that there is no considerable difference in
the quality of insourced and outsourced works. Since the taxpayers’ money is being
spent, the fiscal responsibility should be considered while making any outsourcing
decision by the public sector.
22

Other main concerns of outsourcing are
• DOTs may lose the skills and expertise to conduct core functions in-house,
and also to effectively check, evaluate or approve the work of external sources.
• Conflict with DOT workforce and possible legal restrictions.
• Human resource mismatches and the need for training. DOTs would need
new employees with different expertise and management skills like negotiations
skills for managing consultants.
• Brain drain and the hollowing out of DOTs.
• Greater cost overruns; consultants are more expensive than government pro-
vision of services
• Loss of key skills and expertise to conduct or evaluate work; need for different
skill set; less capacity to serve traditional role of training entry-level engineers
• Decreased quality; less control on quality and timing of projects; discontinuity
of services
• Loss of accountability and commitments to equity
3.7 Chapter Summary
This chapter found outsourcing PE services is gaining momentum in all
DOTs and consultants have an irreplaceable role in the project delivery. TxDOT
also have to outsource a significant amount of engineering services due various rea-
sons. It is also found that that loss of in-house staff, variations in workload, schedule
constraints, legal and policy requirements, need for specialized skills and equipment,
23

innovations and cost savings are the major reasons behind the outsourcing trend.
Among them cost savings has the least influence in the outsourcing decisions.
Outsourcing core competencies such as design and engineering services to
a great extent raises several concerns regarding loss of in-house expertise. DOTs
staff have a responsibly to public since the taxpayer’ money is being spent. Hence
a proper engineering outsourcing framework is to needed to minimize the threats
from involving consultants in performing core competencies.
24

Chapter 4
Outsourcing Frameworks
4.1 Chapter Objectives
This chapter analyzes the outsourcing frameworks used by various business
sectors. Examples from private and public sector were included. Outsourcing deci-
sion making methods developed by various DOTs are also explained in detail.
4.2 Chapter Introduction
Cost effectiveness used to influence outsourcing decisions of the business
world in the past. But it has transformed into a strategy for the management of
service delivery as the decade of nineties progressed. As the father of management
Peter F Drucker says “Outsourcing is necessary not just because of the economics
involved. It is necessary because it provides opportunities, income, and dignity for
service workers.”
Outsourcing in the public sector is totally different from that in the pri-
vate sector. Cost effectiveness has given prime importance in private sector where
as public sector aims at maximizing service delivery. Apart from productivity im-
provement and economic concerns, external contracting out will spur innovation,
change, and technical expertise (Ashford et al). Moreover, outsourcing non-core
activities enables organizations to focus on key business areas.
Most of the time, organizations treat outsourcing as de facto solution and
seldom evaluate the true strategic rationale for pursuing it. Outsourcing brings in
25

significant structural changes only if there is a cohesive master plan, i.e, a strategic
outsourcing plan (Boguslauskas and Kvedaraviien, 2008). Another alarming issue
is outsourcing decisions are made with insufficient data to build a business case,
or in other words decisions are driven by assumptions rather than facts. Research
conducted by Lonsdale and Cox (1997) found that outsourcing decisions are rarely
taken within a thoroughly strategic perspective, with many firms adopting a short-
term perspective and being motivated primarily by the search for short-term cost
reductions.
It is a reality that several organizations fail to achieve the intended benefits
of outsourcing. For example, a survey carried out by PA Consulting Group (1996)
found that only 5 per cent of companies surveyed had achieved high levels of benefits
from outsourcing. Since outsourcing decisions can affect the flexibility, customer
service and the core competencies of the organization, the success of outsourcing
decisions rely on the proper analysis of the business situation (McIvor, 2000).
Compared to the public sector, the private sector is more business oriented
and hence they assess outsourcing situations in a structured way. Countless man-
agement systems and practices have been imported over the years from the private
sector into government to make everything “businesslike”. Therefore it is worthwhile
to consider private sector outsourcing models.
4.3 Private Sector Outsourcing Models
Outsourcing in the private sector is more like a strategic choice giving suffi-
cient attention to economics. The benefits of outsourcing are increasingly associated
not only with simple cost-cutting strategies, but also with the following value-adding
considerations
26

• Access to external know-how
• Technology and innovative capabilities
• Optimization and restructuring of business processes
• Organizational and production flexibility (Ponmariov et al, 2008)
Since the outsourcing strategy is streamlined with corporate strategy, the
private sector has a well defined frame work regarding contracting out functions.
Generally the following major steps are integral to any strategy.
1. Knowledge: This part tries to understand the general trends prevail in the
present market environment, industry and the company.
2. Planning: Planning decides the future of any strategy. Major activities in this
step are analysis of outsourcing goals and reconciling with business direction,
setting the strategy to establish reasons for outsourcing and what value is
expected to be received and determining the best business model.
3. Sourcing: deciding on vendors and locations and negotiating the outsourc-
ing contract that specifies the general, financial and legal framework of the
environment.
4. Execution: managing the transition and knowledge transfer, communicating
the right message, prioritizing relationship management to make link between
vendor and company friction free, implementing non-stop service quality mea-
surements and audits to show that customer needs are being met and steady
progress in terms of quality is being made. (Boguslauskas and Kvedaraviciene,
2008)
27

Since planning is the key step in the outsourcing strategy, it has to done dili-
gently. Numerous models are used to assess the outsourcing potential of functions.
Analyzing the factors influencing the decisions is the aim of these models. Various
tools are used available to analyze decisions. Essential steps in an outsourcing model
are shown below.
Stage 1: Defining the core activities of the business
Core activities are the functions central to successfully serving the potential
customers. Extreme care is needed to distinguish between core and no-core activi-
ties. Usually it is done by top management using techniques like decision analysis
or decision conferencing techniques.
Stage 2: Evaluate the relevant value chain activities
This step analyzes the competencies of the company in the core activities in
relation to potential external sources. This involves a two-stage analysis:
1. Evaluate the relevant value chain activities: Selected core activities are bench-
marked against the capabilities of all potential external providers of that ac-
tivity to enable the company to identify its relative performance for each core
activity along a number of selected measures.
2. Total cost analysis of the core activities: In this step, the costs associated
with either retaining the activity in-house or contracting out the activity is
identified and measured.
Stage 3: Total cost analysis of core activities
This stage measures all the actual and potential costs involved in sourcing
the activity internally or externally. All costs associated with the acquisition of
the activity throughout the entire supply chain are considered. For example, costs
28

right from idea conception, as in collaborating with a supplier in the design phase
of the component, through to any costs such as warranty claims associated with the
component once the completed product is being used by the final customer. The
main concern of this stage is identification of all the activities and costs associated
with the outsourcing decision (McIvor, 2000).
Usually two types of costs that are identified
1. Cost estimation of carrying out the activity in-house.
2. Cost estimations associated with potential suppliers identified from the Stage 2.
Stage 4: Relationship analysis
Outsourcing a core activity needs serious forethought. Organizations may
keep certain knowledge in-house (design skills, management skills, manufacturing,
etc.) that enable the technology of the activity to be exploited, even when it is
being provided by another partner.
Sometimes it is useful to establish a partnership relationship or strategic
alliance with a supplier in order to exploit their capabilities which need an intensive
collaborative working relationship with the prospective partner. NEC’s strategic
partnerships with companies like Honeywell and Bull helped them to gain more
by pursuing a relationship where it holds the balance of power than by pursuing
a relationship based on equality between partners and the mutual sharing of bene-
fits. Relationships of organizations involved in high technology industries, such as
telecommunications and electronics with their key suppliers usually last as long as
the suppliers maintained their leadership in technology and quality (McIvor, 2000).
Figure 4.1 explains the decision making procedure.
29

Stage 1Dene the �“Core�”
Activities of the Business
PERFORMINTERNALLYOUTSOURCE
Stage 2Evaluate Relevant
Value Chain Activities
Stage 3Total Cost Analysis of�“Core�” Activities
Stage 4RelationshipAnalysis
Perform Internally �“Non-Core�”Activities Due to Political
Considerations
Outsource �“Non-Core�”Activities
More Capable thanExternal Sources
Number of ComparableSupplier(s) And/Or With Little
Threat of Competition
No CompetentExternal Sources
No ComparableSupplier(s) And/Or With Little
Threat of Competition
PERFORMINTERNALLY
(Maintain Capability)
STRATEGICOUTSOURCE
INVEST TO�“PERFORMINTERNALLY�”
Go to an analysis of�“Core�” Activities
Identied
Number of CapableSupplier(s) Suitable
Benchmarking ofthe �“Core�” Activities
Phase
Figure 4.1: Practical framework for evaluating the outsourcing decision(Source: McIvor, 2000)
30

4.3.1 US Ship building industry
The Strategic Outsourcing Decision Guidebook prepared by NSRP (National
Shipbuilding Research Program) and Altarum Institute provides a template for an
analytically oriented outsourcing decision process and a detailed description of vari-
ous factors influencing the decision. Emotional issues of in-house employees, uncer-
tainty and reluctance to accept the change are the common factors that put decision
makers in a dilemma. Lack of sufficient information further intensifies the problems.
Pilot studies of the model were conducted in Northrop Grumman Newport News
where they did motor overhaul work internally fearing loss of skills. A second study
focused on the manufacture of low-voltage electrical switchboards and panels, a
shop being considered for closure. The entire decision making process is divided
into series of steps as shown in Figure 4.2.
Figure 4.2: Decision making process diagram(Source: Strategic Outsourcing Decision Guidebook, 2002)
Undertaking an outsourcing decision process requires considerable effort and
some foundation tasks are needed to be done by outsourcing steering committee.
31

That process is given as Figure 4.3.
Figure 4.3: Foundation Tasks Precede Applications of the decisions making process(Source: Strategic Outsourcing Decision Guidebook, 2002)
Foundations tasks precedes the formal outsourcing decision making process
since the decisions have long term impact on the gearing of the organization. It
involves the following steps
• Setting Strategic Direction and Funding: Decisions of strategic nature are to
be conducted within the organizations strategic framework. Tactical outsourc-
ing decisions (e.g., due to short term capacity problems) should be within the
context of the organization’s strategic goals. It is the responsibility of the top
management to set the strategic direction and provide the funding required to
properly undertaking the outsourcing decision process. They are also respon-
sible for allocating human resources. The Outsourcing Steering Committee
32

has to develop the candidate list and oversee the overall outsourcing decision
making process.
• Determine Core Competencies and Strategic Objectives: Decisions without
considering the core competency of the organization is risky since that defines
the organization.
• Develop List of Candidates for Consideration: Functions to be considered for
evaluating outsourcing potential are identified in this phase through techniques
like brain storming. Later they are prioritized based on the likelihood of
success and long term benefit by the judgement committee.
• Appoint Process Implementation Team: Outsourcing Steering Committee se-
lects the people who will execute the outsourcing decision process, the Pro-
cess Implementation Team (PIT). The PIT is a team of qualified personnel,
including core representatives from purchasing, engineering, manufacturing,
planning, and finance. This team will perform the item-specific outsourcing
analysis and report results to the Outsourcing Steering Committee that will
actually making and implementing the decision. They are also in charge of
training new team members and make recommendations for improvement to
the process.
In the real decision making process, the outsourcing analysis and recommen-
dations stage is the crucial one. Prediction of the likely program impact and final
cost analysis are done in this phase. A matrix containing the responsibilities and
various roles is given as Appendix E.
An outsourcing decision analysis assesses the costs and benefits of having
work performed by internal shops versus outside suppliers. There are two forms
these outsourcing decisions can take:
33

• Strategic Outsourcing where the shipyard decides whether it wants to make
or outsource a type of commodity, and
• Tactical Outsourcing where the shipyard decides whether it wants to make or
outsource a specific part or assembly for an individual ship or series of ships.
• The model identifies three factors that should be used as the basis for out-
sourcing decisions, namely:
1. Strategic concerns for core competence and employee and community
relations
2. Lowest total cost (or best value)
3. Impact on operations (Strategic Outsourcing Decision Guidebook, 2002)
4.4 Outsourcing Decision Making Models Developed by DOTs
Numerous studies have been done in the area of outsourcing in DOTs and
few outsourcing decision making models were developed. They are discussed below.
4.4.1 Arizona: Quantitative and qualitative models
In this model, the functions for outsourcing are selected based on a qualita-
tive judgement. Initial list is prepared based on the presence of any of five target
functions given below.
1. Not central to the agency mission
2. private sector provider interest exists
3. high level of customer dissatisfaction
4. history of successful privatization by other government entities
34

5. cost and/or quality problems
Qualitative analysis is done for the functions included in the initial list. The
following eight environmental profile factors that could affect the agency’s ability to
outsource are ranked in this analysis.
1. Strength of competitive market
2. Quality of service
3. Control
4. Risks of contracting out
5. Legal barriers
6. Political resistance
7. Impact on public employees
A profile summary matrix is also prepared by which shows the weights as-
signed to each factor. The evaluator provides two types of numerical scores for the
competition of the assessment.
After considering the qualitative questions associated with each profile, a
subjective rank is assigned for each of eight environmental profiles to indicate the
potential for outsourcing. The rankings range from minus 3 to plus 3 using a matrix.
Since some profiles may be more important than others, each profile has a weight
assigned to it. The rating given to each factor is multiplied by the factors weight to
create a weighted score for each profile (Wilmot et al, 2002).
35

4.4.2 Pennsylvania Contractibility Model
PennDOT uses contractibility ratings systems (CONTRAS) to use to rate
routine maintenance activities for contracting out potential. Weights ranging from
1 to 5 are given to various factors. The factors considered are given below.
1. Unit cost comparison
2. Degree of labor intensity
3. Existence of critical time constraints
4. Contractor availability
5. Work Volume
6. Planning difficulty levels
7. Requirements for special equipment or skills
8. Amount of inspection required.
The total CONTRAS score can range from a minimum of 17 to a maximum of 53,
with higher scores indicating more potential for contracting out than lower scores
(Wilmot et al, 2002).
4.4.3 Louisiana DOT
Louisiana DOT has a well structured computer model for outsourcing deci-
sion making with a qualitative and quantitative component. The qualitative model
is based on the Texas model. Visual Basic was used to write the model, which made
it more user-friendly. The first step in the model is the selection of functions for
outsourcing. A qualitative analysis is done by considering following factors.
36

1. External mandates and influences
2. Strategic & Organizational Effectiveness
3. Organizational Systems & Operations
4. Cost & Cost Efficiency
5. Human Resources & Organizational Culture
6. Vendors Market
Assessment statements are included for each factor. Factors are given weights and a
composite index is calculated. A composite index score around 3.0 is decision neu-
tral. Index scores progressively less than 3.0 indicate in-house provision is preferable.
The quantitative model compares the in-house and consultant costs. The
program used for this analysis automatically calculates the personnel cost using the
median salary rates and payroll additive rate. Similarly, after listing the new and
current equipment requirements, depreciation and expense amounts are calculated
by the program in light of the agency’s capitalization and depreciation policies. A
summary of the total in-house cost is provided at the end of the data entry. Besides
the contract cost to the outside contractor, revenues or losses generated by the
contract are also considered. Both the qualitative index (QI) and the cost index
(CI) are normalized so they each range between 0 and 1 (Wilmot et al, 2002).
4.4.4 Oregon DOT
Oregon’s model is similar to the one developed by Wilmot et. al. for
Louisiana and the only modification is the adoption of score card element for the
qualitative model. A Balanced Scorecard (BSC) approach developed by the Harvard
37

Business School (Kaplan and Norton, 1992) is used to assess non-cost factors. The
four factors in the original score card are the following
1. Financial
2. Customer
3. Internal business
4. Innovation and control
Two more elements were added to make suitable for public sector. They are em-
ployee and contractor market perspectives. Altogether these factors are called six
perspectives. Sample score card and explanation is given as Appendix. Qualitative
Index (QI) with a score between 0 and 1 is generated by the computer model. Val-
ues below 0.5 favor in-house provision while values over 0.5 favor outsourcing. Six
balanced score card perspectives are given as Table 4.1 (Rogge et al, 2003).
The second phase of the computer model is the cost analysis and is based on
the assumption that the program user is familiar with in-house and contractors’ costs
estimating. In-house costs were separated into direct and indirect costs categories.
Direct costs were further split into labor and non-labor categories. Indirect costs
include supervision, support services, and general overhead costs. The user answers
a series of questions relating to information on in-house costs such as: personnel
required, amount of time needed, equipment, supplies, materials and indirect costs
(insurance and supervision). Once the costs are sub-totaled, the user is asked to
input the estimated cost of contracting out. This includes the costs of letting the
contract, monitoring the contractor’s performance, and inspecting the work. The
computer model uses this information to produce a cost index (CI), with values
38

ranging from 0 to 1. Values below 0.5 favor in-house provision while values over 0.5
favor outsourcing (Rogge et al, 2003).
Another research done for Oregon DOT suggests a guideline for DOTs on
the project outsourcing decision, as shown in Figure 4.4 (Hallowell et al., 2006).
This flowchart helps make selection among three alternatives: design build, design-
bid-build (insourced), design-bid-build (outsourced).
Table 4.1: Six Balanced Score Card Perspectives
Perspective DescriptionCustomer Perspective Focus on the interests of citizens, legislators, pub-
lic officials, and special interest groups, and thecompliance with laws and regulations related tothe function or activity under consideration.
Internal Business Perspective Focus on agency core competencies, processes,technology capability, and technical expertise
Innovation and Control Perspective Focus on agency need to monitor and control thefunction, ability to outsource on a limited basis,and effects on other agencies should outsourcingoccur
Financial (Cost) Perspective Focus on cost aspects, capital investment issues,and timeliness of function or activity under consid-eration
Employee Perspective Focus on employee morale, retraining, and relo-cation
Contractor Market Perspective Focus on availability of qualified private sectorcontractors, potential of establishing a monopoly,and the degree of prior outsourcing experience inthe agency for the function or activity under con-sideration
(Source: Rogge et al, 2003)
39

Q1
Q2
Q3
Q4
IDBB Preferred
Contract only forneeded service
ODBB Preferred
IDBB Preferred
Evaluate based onindividual characteristics
Q5
Q6
Q7
Q8
Q9
Q10
Q11
IDBB Preferred
DB of ODBBPreferred
IDBB Preferred
IDBB Preferred
IDBB Preferred
IDBB Preferred
IDBB Preferred
Q12 ODBB Preferred
No
Yes
Yes
Yes
Yes
No
No
Yes
Yes
Yes
Yes
Yes
Yes
Yes
No
No
Yes
No
Q1 : Does project workload exceed internal capabilities?
Q2 : Can the project be delivered by augmenting resources with consulting engineers in speciality areas?
Q3 : Is the project large in scope and involve bridge work?
Q4 : Is the project a simple preservation project?
Q5 : Is retention of the project critical for maintaining ODOT expertise?
Q6 : Is completion of an aggressive schedule critical to project success?
Q7 : Is the scope of ROW acquisition poorly dened or likely to change?
Q8 : Is there uncertainty regarding the utility work?
Q9 : Is access management critical to project success?
Q10 : Is political sensitivity or community involvement a concern for this project?
Q11 : Is it difcult to form a well-dened work order with few alternatives?
Q12 : Does the project require the coordination of many design disciplines?
IDBB : Insource design-bid-build
ODBB : Outsource design-bid-build
DB : Design-build (outsourced)
Figure 4.4: Outsourcing decision making flow chart(Source: Hallowell et al., 2006)
40

4.4.5 Wisconsin DOT study
In 2002, Wisconsin DOT and Midwest Regional University Transportation
Center conducted a study to assess the outsourcing practices of the private sector
and the public sector. Based on the survey results, a balanced score card based
model is suggested as given below (Eger et al., 2002).
Sample Outsourcing Decision Making Scorecard
Service Considered for Outsourcing :
Institutional Setting1. Is this a functional part of our core competencies? ! Yes ! No2. Does this service need to be provided on a continual basis? ! Yes ! No3. Do we have in-house expertise to provide this service? ! Yes ! No4. Do we have available workload to provide this service? ! Yes ! No5. Can we legally outsource this service? ! Yes ! No
Risks6. Would loss of control of this service harm the organization? ! Yes ! No7. Would loss of expertise have a negative impact
on the department of transportation? ! Yes ! No8. Is quality of service delivery a concern? ! Yes ! No9. Would the response to situational problems be reduced? ! Yes ! No10. Would current contract performance be negatively impacted? ! Yes ! No
Goals and Objectives11. Can the goals for this service be clearly defined? ! Yes ! No12. Are the goals for this service long-term? ! Yes ! No13. Can the achievement of the goals be objectively measured? ! Yes ! No14. Are objective measures currently in place for this service? ! Yes ! No15. If the goals and objectives are not achieved, will this have
a negative impact upon the department of transportation? ! Yes ! No
Provider Evaluation16. Are there known external providers for this service? ! Yes ! No17. Do the mission and strategic goals of the providers align
with the department of transportation mission and strategic goals? ! Yes ! No18. Are the providers known to have the capability to provide
this service? ! Yes ! No19. Has the department of transportation had previous
relationships with providers of this service? ! Yes ! No20. Are the providers known to deliver high quality services? ! Yes ! No
(Source: Eger et al., 2002)
The basic purpose of the score card is to provide an indication of the in-
41

stitutional setting of the organization. The institutional setting is used to identify
whether the service to be outsourced is a core competency and has a long term
focus. Identification of core competencies helps the decision maker to evaluate non-
essential services that are currently provided but have the potential for outsourcing.
Non-core competencies are services the organization needs to provide on a continual
basis but do not necessarily need keep in-house. The questions assist the decision
maker in determining whether there is a potential for relationship building. Suc-
cessful outsourcing is a matter of relationship and beyond a specified contract.
4.5 Texas Outsourcing Assessment Instrument
TxDOT had done a study concerned with the determining and evaluating
the long-term impact and cost effectiveness of nine functions (maintenance) in 1999.
The functions considered are given below.
• Base-in-Place repair
• Paint-and-Bead Striping
• Information System/Resources
• Right-of-Way-Acquisition
• Facilities Management and Maintenance
• Training, Quality and Development
• Recruiting
• Benefits Processing
• Partnering/Quality Facilitation
42

Surveys regarding each of the above functions were conducted among all
TxDOT districts. The survey instrument focused on the following factors.
1. External Mandates and influences
2. Strategic and Organizational effectiveness
3. Organization Systems and Operations
4. Cost and Cost Efficiency
5. Human Resources and Organization Culture
6. Vendors
The survey found that Base-in-Place repair and Paint-and-Bead striping had
high outsourcing potential. As part of the study, the research team proposed two
methods to make effective outsourcing decisions. They are Functional Sourcing
Decision Flowchart and Functional Sourcing Decision Support Model (Johnson et
al, 1999).
4.5.1 Functional Sourcing Decision Flowchart
Using the flowchart, six evaluation factors are applied individually to each
function and a positive analysis response indicates propensity to outsource. Ac-
cording to this model, even if there is an external mandate, insourcing may still be
justified because of the negativity of the other factors. The flow chart is given as
Figure 4.5.
43

4.5.2 Functional Sourcing Decision Support Model (FSDSM)
This quantitative model is MS Excel based and uses evaluative input from
users to assess the outsourcing potential of a function. Three spreadsheets which
required inputs from evaluators are incorporated. Detailed description of the steps
is given below.
1. First step is the completion of the Evaluation factor weights (evaluation of the
six factors mentioned above). The evaluators are upper level managers/significant
strategists who can offset emotional or external influences that frequently oc-
cur in outsourcing decision making. Factors weights are in the range of 0-1.
2. Next step is the completion of Functional Sourcing Assessment (FSA-30 item
check list evaluates the various aspects of outsourcing). Assessments are rated
between 5 (strongly agree) to 1 (strongly disagree). FSA is given as Appendix
J.
The evaluation factor weights and the functional sourcing assessment results
are used to calculate Functional Sourcing Decision Index. If the result is 3.0 or
greater the result is favorable to insourcing. If the result is closer to 3.0, partial
outsourcing is recommended (Johnson et al, December 1999). A diagrammatic
representation of the procedure is given as Figure 4.6.
All of these models are generic in nature and can be used for assessing the
outsourcing potential of all kinds of functions. Researches done by TRB, FHWA
and NASHTU revealed that private sector involvement in preliminary engineering
functions are more important and the cost effectiveness of outsourcing is a debatable
issue. Hence a model that addresses the issues in PE outsourcing is more relevant
(Rogge et al, 2003).
44

Figure 4.5: Functional Sourcing Decision Flowchart(Source: Johnson et al, 1999)
45

Figure 4.6: Functional Sourcing Decision Procedure(Source: Johnson et al, 1999)
46

4.6 Chapter Summary
Common outsourcing decision making methods used by both private sector
and public sector were investigated in this chapter. It is found that private sector
has developed systematic outsourcing decision making models which evaluate the
impact of the decision on the organization. The Strategic Outsourcing Decision
Guidebook developed by the NSRP is a good example.
Some of the DOTs like Louisiana, Wisconsin and Pennsylvania have devel-
oped outsourcing decisions making models. None of them dealt with the outsourcing
of engineering functions. Most of the models are project specific and assess the out-
sourcing potential of projects individually. TxDOT also developed a decision making
procedure for outsourcing maintenance functions. Functional sourcing decision sup-
port model, functional sourcing decision flowchart and functional sourcing decision
procedure were the two methods suggested in the research. Neither of these methods
considers the project allocation of the entire program work and the specific reasons
are not evaluated.
47

Chapter 5
Analysis of the current engineering outsourcingapproach of TxDOT districts
5.1 Chapter Objectives
This chapter investigates the current engineering outsourcing approach of
TxDOT. Engineering outsourcing decision making methods used by TxDOT dis-
tricts were identified. A SWOT analysis of the current business delivery model was
also done.
5.2 Project Development Process of TxDOT
The Project Development Process (PDP) of TxDOT is a multi-step pro-
cess spanning several years. According to the TxDOT PDP manual 2009, major
milestones in the PDP are divided into eight as given below.
1. Planning and program
2. Preliminary Design
3. Environmental
4. ROW
5. PS&E Development
6. Letting
7. Construction
48

8. Commissioning
A diagrammatic representation of all the functions in the PDP is given as Appendix
F.
1. Planning and Programming
In this phase, preliminary steps such as needs identification and project autho-
rization are done. Determination of study requirements is another step. Need
for various studies such as feasibility study are evaluated in this step. The
staff requirements for the various functions in the project are also assessed in
this phase.
2. Preliminary Design
Preliminary design preparation/data collection, preliminary schematic and ge-
ometric schematic are the important steps in this phase. Traffic studies and
various surveys are done as part of preliminary design preparation. Prelim-
inary schematic is the step of developing engineering solutions to satisfy the
project need. Major engineering variables set forth are alternative alignments
and typical sections. Works related to schematic development are hydraulic
studies, determining right of way needs, and identifying utility conflicts.
3. Environmental
This phase identifies the environmental and public issues related with the
project development. Getting environmental permits is also associated with
this step.
4. ROW
This phase deals with the acquiring of ROW. Data regarding limits and own-
ership of the property are collected. Finally measures are taken to acquire the
land for the project.
49

5. PS&E Development
Most of the engineering functions are done in this phase. They are given
below.
• Begin Detailed Design
• Final Alignments/Profiles
• Roadway Design
• Operational Design
• Bridge Design
• Drainage Design
• Retaining/Noise Walls & Miscellaneous Structures
• Traffic Control Plan
• PS&E Assembly/Design Review
6. Final processing and letting
The process of reviewing the completed PS&E package, including supporting
documents in the final processing. For reviewing and processing the PS&E
up to letting, Design Division has primary responsibility. Traffic Operations,
Construction, and General Services have the secondary responsibility. Later
the letting is done according to TxDOT rules (PDP manual, 2009).
5.3 Current PE Outsourcing Situation in TxDOT
In the current project delivery, in-house as well as consultants have signifi-
cant roles. Key players in the project delivery process are the Consultant Contract
Office of Design Division (CCO), Transportation Planning and Development section
of districts and area/division offices.
50

5.3.1 Functions of CCO
A meeting with Director and Assistant director of CCO of the design division
was arranged to understand the role of CCO in outsourcing engineering functions.
The consultant contract office of the design division manages three types of pro-
fessional services contracts: Engineering, Surveys and Architecture. TxDOT uses
9 types of professional services contracts, the other six contract types being han-
dled by other departments. CCO is in charge of allocating the PE budget for each
district. The group also assists the districts with consultant selection, negotiation,
and execution of contracts. Since most (90-95%) of the funding for consultant work
comes from the state, all functions are done in compliance with state laws.
Before district PE budgets are allocated annually, the CCO typically requests
all districts to give projections about their consultant contract needs based on the
three year letting schedule. When this process is used, CCO prepares a detailed
spread sheet of the three year letting schedule and sends it to districts.
Districts forecast their contract needs for the future based on the expected
projects and resource availability. For example, they might project their need for
survey contracts as $5 million and it is the total amount of survey contracts needed
over the 3 years (not for one specific project).
After receiving the projections from districts, CCO assesses the need and
makes decision regarding the funding. The funding allocation decision mainly de-
pends on the projected needs identified in addition to the consideration of historical
spending of the district and total available funds.
Though CCO provides helps districts for conducting negotiations with con-
sultants, they never interfere with the selection of projects to be outsourced.
51

5.3.2 PE Outsourcing approaches of TxDOT districts
Data regarding PE outsourcing practices of districts were collected through
questionnaire surveys. With the help of Ms. Mary Meyland, TxDOT Director
of Strategic Policy and Performance Enhancement, survey questionnaires were dis-
tributed among all districts. The modes of data collection were of two types as given
below.
1. Telephone surveys
2. E-mail responses
District wise mode of response and interviewees are given in Table 5.1.
Twelve districts (Amarillo, Bryan, Brownwood, Childress, Odessa, Laredo,
San Angelo, Houston, Fort Worth, Paris, Tyler, and Pharr) scheduled telephone
interviews with TP&D directors as soon as they got the survey questionnaire. In-
terviewees from some districts included TP&D director and another key planning
official such as Assistant director of design or Director of Consultant Contracts. The
interviews took 30-45 minutes. Interviewees were again contacted through e-mail
after documenting the responses for follow up.
Rest (Beaumont, Lufkin, Lubbock, El Paso, San Antonio, and Atlanta) of
the districts preferred to send their responses by e-mail. Telephone interviews were
scheduled with San Antonio and El Paso for follow up. A total of eighteen responses
were collected. It was able to complete the survey within two months because of the
cooperation of districts planning officials. Eight districts (Abilene, Austin, Corpus
Christi, Dallas, Waco, Wichita Falls, and Yoakum) did not respond to the survey
request even after repeated calls. These districts have similar counterparts in the
group responded. It is assumed that these districts the engineering outsourcing
practices of these districts are similar to others.
52

Table 5.1: IntervieweesDistrict Mode of response Interviewees
Amarillo Phone interview Tracy D. Cain, District Design Engineer
Atlanta E-mail response Lance Simmons, District Bridge/Special Projects Engineer
Beaumont E-mail response Phillip Lujan, Director TP&D
Brownwood Phone interview Elias Rmeili, Director TP&D
Bryan Phone Interview Bob Appleton, Director TP&D
Childress Phone interview Martin R. Smith, P.E, Director, TP&D
El Paso E-mail response Charles H. Berry, District EngineerTelephone follow up
Fort Worth Phone interview William C. Riley, PE, Director TP&D
Houston Phone interview Gabe Y. Johnson. P.E, Director TP&DWilliam (Bill) Brudnick, P.E, Assistant Director of Design
Laredo Phone interview Alberto Ramirez, P.E. (Interim), TP&D Director
Lubbock E-mail response Jerry W. Cash, P.E, Advance Project Development Engineer
Lufkin E-mail response Cheryl P. Flood, P.E, Director TP&D
Odessa Phone interview Gary J. Law P.E., Director TP&DMatt Carr
Paris Phone interview Ricky Mackey, Director TP&D
Pharr Phone interview Jody Ellington, Director TP&D
San Angelo Phone interview George R. Herrmann, P.E., Advanced Project Development EngineerDistrict Hydraulic Engineer
San Antonio E-mail response, Lizette Colbert , Director TP&DTelephone follow up Gregg Granato, District Design Engineer
Tyler Phone interview Vemon Webb, Director TP&D
These interviews indicate that generally, a structured analytical decision making
procedure is not used in districts regarding outsourcing engineering and design ser-
vices. The districts usually analyze the future program of work and make project
allocation based on their experience. Important mile stones in the decision making
process are identified as project requirements analysis, estimation of in-house capa-
bilities and selection of projects to be outsourced. These steps are not distinct and
overlap most of the time. Each of these steps is explained in detail in the following
53

sections.
5.3.2.1 Assessment of project requirements and analysis of in-house staffavailability
The initial step in the outsourcing decision making process is the assessment
of skills and resources needed for the future program of work. A common trend in
all districts is to perform project requirements analysis and assessment of in-house
capabilities together. Project requirement analysis is the phase in which the staff
and related capabilities required to perform a project or function is estimated. The
simplest and common method used is the rule of thumb-5 or 6 million construction
dollar/designer annually. The total in-house design productivity is calculated by
multiplying the number of people by $5 million. Volume of projects that can be
done by in-house is also estimated like this.
The total dollar value of letting schedule, type of project, number of de-
signers, location of the project and experience of the in-house staff are the factors
considered in assessing the requirements for the program of work and the availability
of in-house staff. Using a fixed in-house productivity rule such as $x million/per
designer annually, the number of staff required to perform the work is calculated.
Most of the time 2 or 3 designers are working on a project and hence it is easy
to quantify the output. Larger districts have a design team of 10 people each
and 3-4 projects are assigned to each group. Another way is more detailed and,
involves comparison of past projects and discussion with various department per-
sonnel. Rarely computer programs developed by districts are used. Childress uses
software called HPTMS for tracking projects. Highway Performance Tracking and
Monitoring System (HPTMS) was developed by Corpus Christi and it gives infor-
mation like duration of all phases in the project development and the manpower
(designers) needed for all kinds of projects. The out put is in a graphical format
54

showing which designer is working on which project and when they will finish the
project. A screenshot of HPTMS output is given as Appendix G.
Districts like Childress, San Antonio, and Lufkin utilize PDMS to determine
availability of designers versus proposed letting date. Fort Worth uses primavera for
planning. Most of the districts anticipate that proposed PDMS can be used in these
steps. First-generation Project Development Management System (PDMS) was de-
veloped for internal use in tracking project development milestones on projects under
development in FY 2009 FY 2012. TxDOT is working on the second-generation of
PDMS that will utilize Primavera P6 software for managing highway design projects
throughout the department (TxDOT response to sunset report, 2008).
According to TxDOT, PDMS provides a consistent way to monitor de-
sign/construction projects and to track and manage work performed as it is being
developed by various offices. It can track both work performed within a district or
with outside staff. The primary users are project managers in districts to deliver de-
sign/construction projects on schedule. One FTE would be needed to track projects
in a district of 25 FTEs if the tracking was done manually (Quality Assurance Team
(QAT) Annual Report, 2008).
Few districts have a multi step approach regarding outsourcing decision mak-
ing. For example, in San Antonio, Preliminary Engineering work is performed out
of the District’s Advanced Planning group. The District Design Engineer takes
the time to determine the design team most qualified and available to complete a
project. The work is distributed to ensure that the in-house staff is maximized before
deciding to outsource any projects. It is also decided if there is enough consultant
budget to outsource that project. There are times that a project is determined to
be designed in-house and in order to meet letting goals a particular task/function
might be outsourced. Work can be accelerated by contracting out since consultants
55

can increase the resources quickly.
Odessa uses compensatory time to achieve the demand/target for a fiscal
year. The manhours are accumulated when there is a surge of projects and people
are allowed to have off during period of low work volume.
In Bryan, manhours required for a particular program are calculated consid-
ering the factors such as scope of the work, construction cost, past experience from
similar projects and time required to complete the work.
In Bryan, the decision making team consists of Director of TP&D, design
engineer, environmental, advanced planning engineer, ROW administrator, district
bridge engineer and district design team leaders. Allocation of staff is done based
on the knowledge of the decision making team. The plans and the decisions are
eventually approved by the district engineer. Similarly, in Lufkin, Central Design
Team supervisors, Director of Traffic Operations (when applicable) and Area En-
gineers with a team decision as follows: the available design capacity and abilities
are reviewed and a determination is made whether in-house design capabilities are
available to meet program deadlines. Final decision regarding outsourcing is typ-
ically done by Director of Transportation Planning and Development (TP&D). In
most of the districts, outsourcing decisions are made by TP&D directors.
El Paso has a different approach and projects are scoped at a scoping meeting
and then scheduled by availability of funding and then projects are assigned to
available design groups with skills and experience necessary to produce the type
of project, such as bridge replacement, Preventative Maintenance, rehabilitation,
widening, or new location. Projects are individually scheduled each quarter of the
FY. Active projects are scheduled to include durations for individual activities such
as environmental documents, ROW, design, and PS&E processing. Completion
56

dates and durations related with processing PS&E by district and Austin HQ are
included in project scheduling.
Analysis tools
Commonly, scheduling tools like calendars and spread sheets are used to assess the
staff availability. Laredo uses Suretrack to develop the schedule. Atlanta and Tyler
use design schedule to check the availability of designers. Tyler’s design schedule has
mile stones of 30%, 60% and 90% completion. In Beaumont, area office make deci-
sions and it is verified by district offices. The design work is distributed to the area
offices and annually, they are asked to review their projects, work load/resources
and projects outside their ability to develop. A sample Suretrack output is given as
appendix H. In very few districts, availability of individual designer is checked. For
example, in Paris, Design team leaders and the director of TP&D assess the forth-
coming program of work. They individually look at the calendar time of projects and
estimates the requirements based on their knowledge and experience from similar
projects.
Usually the districts never follow a step by step analytical process in the
outsourcing decision making. Experience and personal judgement are the common
tools for assessing the outsourcing potential of functions.
Similar methods are generally used to prepare spread sheets to CCO. But
El Paso uses district-prepared quarterly project development schedule that includes
tasks for schematic, environmental document, right of way acquisition, and PS&E.
Projects are placed for let date and design development schedule is backed in to
match let date. If in-house schedule can not meet let date, a consultant contract is
selected to meet let date.
57
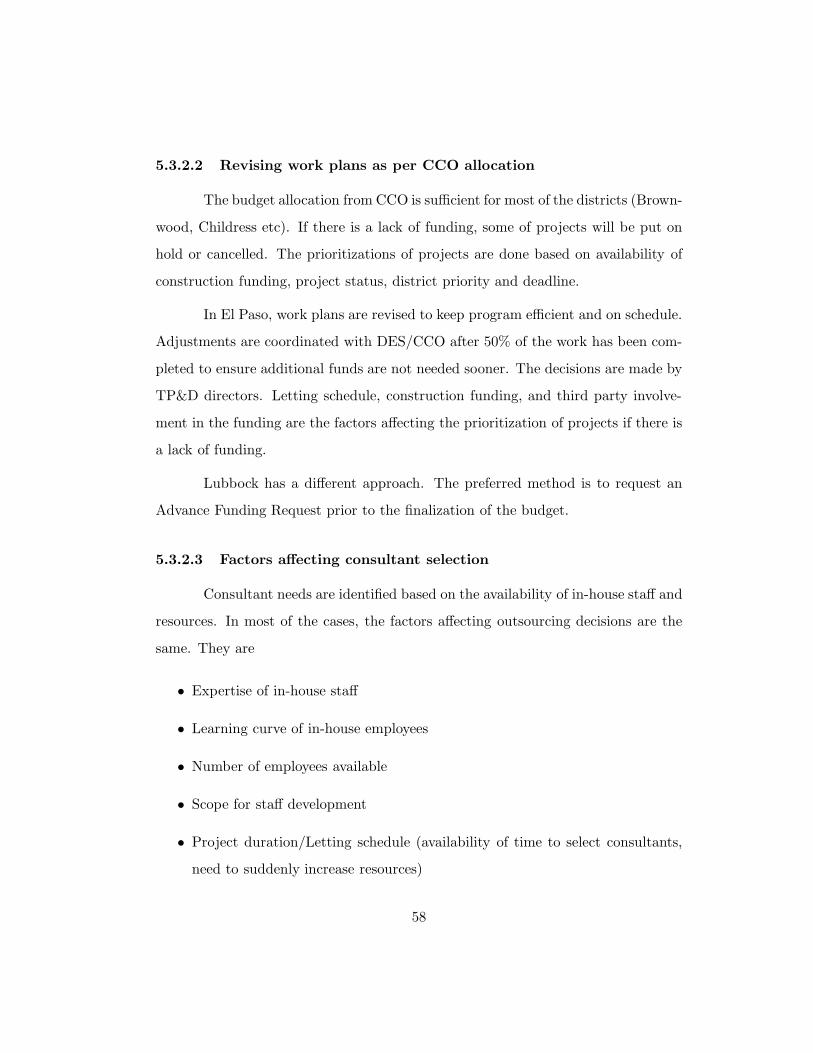
5.3.2.2 Revising work plans as per CCO allocation
The budget allocation from CCO is sufficient for most of the districts (Brown-
wood, Childress etc). If there is a lack of funding, some of projects will be put on
hold or cancelled. The prioritizations of projects are done based on availability of
construction funding, project status, district priority and deadline.
In El Paso, work plans are revised to keep program efficient and on schedule.
Adjustments are coordinated with DES/CCO after 50% of the work has been com-
pleted to ensure additional funds are not needed sooner. The decisions are made by
TP&D directors. Letting schedule, construction funding, and third party involve-
ment in the funding are the factors affecting the prioritization of projects if there is
a lack of funding.
Lubbock has a different approach. The preferred method is to request an
Advance Funding Request prior to the finalization of the budget.
5.3.2.3 Factors affecting consultant selection
Consultant needs are identified based on the availability of in-house staff and
resources. In most of the cases, the factors affecting outsourcing decisions are the
same. They are
• Expertise of in-house staff
• Learning curve of in-house employees
• Number of employees available
• Scope for staff development
• Project duration/Letting schedule (availability of time to select consultants,
need to suddenly increase resources)
58

• Availability of funds/ Funding allocation from CCO
• Complexity of the project
• In-house equipment
Larger districts like Houston have all the capability, but due to lack of sufficient peo-
ple they outsource functions like bridge design. Consultants can complete projects
faster since they can increase resources easily. On the contrary, small districts con-
tract out since they do not have enough skilled people.
All districts are mandated to outsource 35% of the annual PE expenditure
and the engineering outsourcing volume in all districts is above 35%. In big districts
like Houston and Fort Worth, it is up to 60%. Usually smaller districts like San
Angelo and Brownwood outsource PE since they are mandated to do so.
5.3.2.4 Commonly outsourced PE functions
From the surveys, the drivers behind contracting out of engineering functions
are identified as below.
1. Lack of expertise/skills/experience
2. Lack of enough staff
3. Lack of equipment
4. To enhance capacity
5. Other reasons such as long time required for completion and to get a different
perspective
59

Table 5.2: Lack of skillsFunction District
Bridge design Amarillo, Bryan, Laredo, Lufkin, Paris, TylerHydraulics Bryan, HoustonHydrology Bryan, HoustonGeo-technical HoustonLong term freeway type LubbockRoadway design LufkinTraffic engineering LufkinIllumination design LufkinInterchange projects Odessa, TylerSchematics and Advanced planning Pharr, TylerEnvironmental AmarilloBoundary surveying San AngeloUtility design and coordination Houston
Table 5.3: Lack of staffFunction Districts
Functions DistrictsSurveying Beaumont, Paris, AtlantaLarge mobility LaredoFeasibility studies LubbockSchematics (lack of staff to keep full time staff for longterm)
Lufkin
PS&E Production AtlantaROW Mapping Atlanta
The functions and the districts contracting out for each of the driver are
given in Tables 5.2 to 5.5.
Lubbock contracts out route studies and mobility studies to get a different
perspective. Odessa outsources planning projects (schematics, highway capacity
analysis and corridor planning) and hydraulics since there is enough lead time to go
through consultant selection process.
60

Table 5.4: Enhance in-house capacity
Function Districts
Bridge Design Houston, OdessaSurveying, Mapping Houston, OdessaFeasibility studies LubbockLong term freeway LubbockIllumination design OdessaHydraulics Odessa
Table 5.5: Lack of resources/equipment
Function Districts
Surveying Amarillo, Brownwood, Childress, El Paso,Laredo, Pharr, San Antonio
Feasibility study BrownwoodSchematic design El PasoTraffic Engineering HoustonGeotechnical Laredo, ParisEnvironmental San AntonioCPM Review San Antonio
5.3.3 Contract Types
Most of the districts interviewed prefer indefinite deliverable type contracts
due to their flexibility. The lengthy and tedious consultant selection process is
another reason which makes definite deliverable less preferred. On an average, 7
months are needed to finish the process of consultant selection. Hence indefinite
deliverable type contracts are preferred since it has the advantage of keeping con-
sultants on call. In case of such contracts, once a consultant is hired, the work
can be started within a month. The disadvantage is that they limit the size of the
contract. Most of the survey contracts are evergreen contracts for a period of 2
years. Sometimes consultants from the indefinite contracts already made by other
districts are hired. The districts have to negotiate on work authorizations again in
such occasions.
61

Districts like Childress and Houston prefer definite deliverable type for PS&E
since the district knows the requirements. Indefinite deliverable type contracts are
preferred for surveying because the deliverables are unknown. To do negotiations
for definite deliverable contracts, districts need to be knowledgeable about the final
product. Hence only specific projects are done using definite deliverable contracts.
Most of the PS&E, Feasibility studies and Route studies contracts are definite de-
liverables.
Paris is an exception and they prefer definite deliverable contracts since the
outcome is known in such cases. Indefinite deliverable type contracts are used for
survey contracts.
In selecting a contract type, size and complexity of project are the biggest
factors. The decision is made by the Consultant Administrator, Director Trans-
portation Planning and Development, and responsible Area Engineer.
According to current rules, indefinite delivery contract cannot exceed the
amount of $5,000,000 for border districts (El Paso, Laredo, or Pharr) and metropoli-
tan (Austin, Corpus Christi, Dallas, El Paso, Fort Worth, Houston, Lubbock, Pharr,
or San Antonio) districts. The maximum amount payable cannot exceed $2,000,000
for others. The memo issued by the Executive Director on May 5, 2005, the Ad-
ministration limited indefinite deliverable (evergreen) contracts to $2,000,000 for
all districts and divisions in order to increase contracting opportunities for more
firms, especially small business and minority firms. Under unique circumstances in
a metro/border district or division, request can be submitted for a limit greater than
$2,000,000 with the CCO-1, Request for Use of Provider’s Services form (MPO, El
Paso).
Consultant negotiation and performance evaluation are the succeeding steps.
But these are standardized in nature and beyond the scope of this research.
62

5.3.4 Cost Tracking
Usually direct expenses are tracked using spread sheets. All the invoices are
entered into spread sheets and matched against the budget. Sometimes, Financial
Information Management System (FIMS) and Budget Information System are used
for tracking consultant costs. The costs are charged to specific job function 164.
Indirect expenses are charged to overhead. Once the consultants are selected, ex-
penses are charged to that project number. For evergreen contracts, the expenses
are charged to the particular project number for which the work is done. Expenses
(like RFPs, pre-qualification etc.) before selecting the consultants are charged to
overhead. This is handled by the district’s Consultant Contract Administrator.
The overhead expenses are usually 6-7% and there are peaks of 21%. In
Brownwood, the ratio is 15% of an in-house employees’ time for each consultant
FTE on the project. Most of the other districts do not monitor the cost of overhead.
In Odessa, the cost tracking method mainly depends on the type of contract
signed with the consultants. In the case of cost plus fixed fee contracts, consul-
tants submit monthly reports of overhead and expenses. For lump sum contracts,
the district negotiates with consultants based on the products/project milestones,
payment schedule and rates. Consultants are paid after accepting the product (fin-
ishing project/milestones) by TxDOT. Lump sum contracts are preferred over cost
plus fixed fee contracts. The cost of oversight is charged to the project function
“Management of contracts”.
5.4 SWOT Analysis of TxDOT Project Delivery Situation
A Strength Weakness Opportunity and Threat (SWOT) analysis was done
to analyze the current project delivery model of TxDOT. The analysis is explained
below.
63

5.4.1 Strengths
• Staff
1. Skilled and experienced: In-house staff is experienced and can make good
assessments regarding project resource requirements. Qualitative judge-
ments are crucial in making outsourcing decisions and TxDOT staff (Dis-
trict engineers and TP&D directors) has clear understanding of capa-
bilities of in-house engineers. It helps the right selection of consultant
projects.
2. High Morale- In-house engineers are confident that they are as efficient
as consultants and can complete projects faster than consultants. Urban
districts like Houston admit that they have a competent design team
skilled enough to perform any kind of design tasks and they outsource
due to lack of staff.
3. Accountability: All the district authorities are aware that they should
utilize taxpayers’ money effectively. They have concerns over the quality
and cost-effectiveness of contracting out engineering projects. They insist
that only routine type projects should be given to consultants so that they
can concentrate more on complex jobs. The concept of contacting out
more than 35% is also strongly opposed as it results in losing in-house
competencies. Moreover, without having any participation in the project
development process of the projects, they will not be able to oversee
consultants properly.
• System
1. Conducive Attitude towards outsourcing- Districts welcome the idea of
using consultants to supplement in-house during peak work volume. Be-
64

cause keeping full time staff for rare/long term works (eg. Schematic
development) is not a feasible option. Districts have the opinion that a
certain amount of consultants are also needed to maintain negotiation
and consultant management skills of in-house. Likewise, consultant in-
dustry also needs to keep a base load so that they can familiarize with
TxDOT projects.
2. Keen on career development- Some district planning officials (eg. Odessa)
consider the career development of in-house engineers by keeping chal-
lenging projects in-house.
3. Initiatives to use software: Few districts started incorporating computer
programs like Primavera and other planning software for requirements
planning and resource availability analysis. A list of software programs
and the functions are given in Table 5.6. Most districts anticipate that
once implemented PDMS make the decision making easier.
5.4.2 Weaknesses
1. Lack of a systematic approach: Districts do not have a systematic approach
towards outsourcing preliminary engineering services. The decision to out-
source a process is not made based on a structured analysis. Most of the time,
personal judgement and previous experience guide the district engineers and
TP&D directors in selecting the project to outsource. The districts do not
realize the necessity of using computer programs or analytical procedures for
the analysis. On the contrary, in private sector, the outsourcing decisions are
driven by qualitative and quantitative estimations.
65

Table 5.6: Application software used by districts
District Analysis tools for Analysis tools forProject resource requirements In-house staff availability
Amarillo $5 million thumb rule $5 million thumb ruleAtlanta Personal judgement Bar charts for individual designerBeaumont Personal judgement Personal judgementBrownwood $5 million thumb rule $5 million thumb ruleBryan Personal judgement Scheduling tools like
calendars and spread sheetChildress Highway Performance Tracking $5 million thumb rule
and Monitoring System (HPTMS)El Paso Personal judgement Personal judgementFort Worth Primavera, $5 million thumb rule $5 million thumb rule,
schedules, P6Houston Personal judgement $5 million thumb ruleLaredo Suretrack for developing schedule $5 million thumb ruleLubbock Personal judgement Personal judgementLufkin PDMS PDMSOdessa Personal judgement, PDMS for scheduling Personal judgementParis Personal judgement, PDMS for scheduling $x million thumb rulePharr Personal judgement Personal judgementSan Angelo Personal judgement Past experienceSan Antonio Personal judgement $5 million thumb ruleTyler Personal judgement Design schedule
2. Vague methods for project requirement analysis: Assessment of the staff and
related capabilities for future program are not done in a professional manner.
Number of designers is decided based either on the thumb rule or assump-
tions. The rule of thumb for in-house productivity assumes that a designer
can finish projects for $5-$6 million annually. Usually, the level of engineering
effort is not proportional to the project cost. Sometimes less costly projects
need more work. Hence this thumb rule can not estimate resource require-
ments accurately. Number of manhours is not calculated to determine the
resource requirements even though it is calculated later to do negotiations
with consultants.
3. No analytical methods for estimating in-house staff availability: Availability
of in-house staff is determined based on rules of thumb or personal judgement.
Very few districts use software which actually could make the assessments
66

easier. The thumb rule of $5 million productivity per designer is not a realistic
estimation of in-house capacity.
4. No systematic outsourcing potential assessment: Decision makers do not un-
derstand the importance of a structured decision making methods. Districts
do not follow a uniform approach for selecting consultant projects. District
planning authorities overestimate their personal judgement. Private sector
gives a lot of importance to the assessment of outsourcing potential.
5. Mandatory outsourcing: As per state law, TxDOT districts are mandated to
outsource 35% of their PE expenditure. Due to this regulation, small districts
are compelled to outsource even though they have all the capacity. It results
in idling of in-house resources and wasting taxpayer’s money.
6. Lack of guidelines: Districts do not follow a common procedure regarding out-
sourcing. No guidelines are available from CCO about outsourcing potential
assessment or in-house staff availability analysis. It is true that mandatory
procedures will decelerate actions in public sector process but providing a gen-
eral check-list will reduce the ambiguities. Moreover, it will help achieve the
anticipated results from outsourcing. TxDOT mandated districts to outsource
35% of the PE expenditure in order to utilize the skills of consultants. It was
a strategic decision and this strategy should be streamlined with district level
plans. Even though contracting out has become unavoidable for districts later,
TxDOT should consider this option as a strategy to enhance organizational
efficiency.
7. Consultant selection process
(a) Tedious: Selection of consultants in TxDOT districts is a standardized
procedure and it takes 6-9 months to get a consultant on board. It can
67

be better explained by quoting a district official’s words: - “Our greatest
problem with our current system is the amount of time required to hire a
consultant to perform the work. In most cases, the selection process from
notice of intent to actual contract execution is between six months to a
rare example of over a year. Several checks and balances are included to
ensure a fair and equitable selection is ensured. The major problem is the
time for Division review of the process at each critical step”. All districts
pointed out consultant selection process as the major hindrance to devise
in-house strategy. This tedious process is a hindrance to keep challenging
projects in-house to maintain in-house skills and use consultants as a force
multiplier as and when needed. It also results in under-use of consultants
and in-house staff are forced to work on short lead time projects (PS&E,
routine works, and rehabilitation). Outsourcing planning projects affects
the quality of planning and is also a detriment to the development of in-
house staff. If in-house stops working on PS&E they will not have sufficient
knowledge to oversee those projects.
The first step in consultant selection process is a request for use of provider
services submitted to Division for approval to hire a consultant. Then,
a notice of intent is submitted and published to inform consultants of
need for services and consultants submit letters of interest. All interested
parties are provided with a request for proposal in providing the service.
A list of consultants is prepared after reviewing the proposals. During the
evaluation, the proposals are reviewed for pre-certification requirements,
scored for content and quality, and ranked. The consultants are short
listed based a clear break score required to perform interviews and formal
proposals. Interview and proposal packets are submitted to all short listed
consultants. The proposals are reviewed and scored and subsequently
68

interviews are conducted to select the most qualified consultant. After
the final selection of a consultant and their consent, negotiations of the
scope and fees for the services provided are done. If the negotiations
are not successful, the consultant with the next highest core will begin
new negotiations for scope and fee. All major steps of this process are
submitted to Division for review and approval.
(b) Restrictions over indefinite deliverable type contracts: Administration in-
sists that the length of the contract should not exceed 2 years and the
capacity is also restricted to $2 million. This makes indefinite contracts
not suitable for long term and costly projects. Indefinite deliverable type
contracts are preferred due to the tedious consultant selection process but
due to above stated restrictions, districts can not utilize them properly.
Other serious concern is they cannot keep good projects in-house to de-
velop in-house skills.
(c) Lack of system to check whether the objectives are met or not/periodic
in-house reviews: Performance appraisals done by the districts do not
include evaluations of productivity and job satisfaction of in-house staff.
The common method in all districts is the rule of thumb of $5 million
productivity per designer. Most of the districts never evaluate whether
this productivity is achieved or not at the individual level. Similarly,
outsourcing challenging projects is a detriment to in-house morale, but
TxDOT never tries to assess whether the staff is satisfied with the current
allocation of projects. The Deloitte report (2007) also points out the
weakness of the existing performance appraisal system.
(d) In-house employees spend a significant amount of time for overseeing con-
sultant work. Though the districts record the charges, it is never moni-
69

tored properly. Overheard charges are in the range of 6%-10%.
(e) Dissatisfied staff- Control and communication of consultants are trouble-
some for in-house staff. Moreover, in-house staff has to work more to make
sure that consultants are maintaining the desired quality. Some district
planning officials have the opinion that the needs of a district are not
clearly understood by the administration. They insist that administration
should consider the history of the projects done in the district to get a
clear understanding of the district’s needs.
5.4.3 Opportunities
1. Consultant market: Consultants are capable of performing engineering works
of any level of difficulty and they can also increase resources within a short
span of time. This makes them good companions of DOTs for enhancing the
capacity. Districts can use consultants to enhance in-house capacity as and
when required.
2. Pooling of resources from other districts: In the current system, districts de-
vised certain strategies to increase the availability of consultants. Some of
them are given below.
(a) Hiring the help from smaller districts. They can complete projects by
hiring in-house engineers from other districts, within the time required to
select a consultant. Most of the big districts use this strategy at the time
of peak work load.
(b) Indefinite deliverable contracts: Due to a cap of $2 million over indefinite
deliverable contracts, consultants selected by other districts are used in
some cases. In this case also, the hiring district has to negotiate on work
70

authorizations. It is useful for planning projects since location is not a
constraint in the case of planning projects.
3. Regionalization- The idea of regionalization is useful to make available full
time experienced people for consultant management. Specialization increases
the efficiency. Small districts’ staff cannot spend their entire work time on con-
sultant management and have very less opportunities to develop their skills
in that area. It can also reduce the disparity in workloads of districts. In
present situation, bigger districts do not have enough people and smaller dis-
tricts have sufficient manpower. Another important issue is smaller districts
outsource complex works since such works are rare and they cannot keep full-
time people for those works. By regionalizing certain functions, in-house can
handle all the works at a cheaper rate. Various researches done nationwide
concluded that, consultants are more expensive than in-house.
4. Governmental regulations: Legislature in Texas is favorable for outsourcing
in TxDOT unlike in states like California. Districts can increase the level of
outsourcing whenever required. Districts like Houston had outsourced up to
70% in the past.
5. Indefinite deliverable contracts: Indefinite deliverable contracts are always
preferred by districts due to their flexibility. It has the advantage of keeping a
consultant always on board and they do not need complete knowledge of the
work during negotiations.
5.4.4 Threats
1. Attitude: At least 50% of the responding districts do not understand the
necessity of a structured approach regarding outsourcing. They overestimate
71

their personal judgement skills and ignore factors like manhour estimation and
analytical resource requirements. Such an attitude will sabotage any initiative
to improve the decision making. In fact, they fear that guidelines or check-
lists will eventually become standardized procedures like consultant selection
process and delay the system further.
2. Inexperienced consultant management staff: In-house need to develop negoti-
ation and management skills for properly managing consultants. Even though
TxDOT staff has excellent technical skills they lack management skills.
3. Losing in-house skills, In-house morale: When districts are forced to outsource
challenging projects, they will lose the skills on those areas eventually. Hiring
consultants for challenging projects adversely affect the employee morale. The
fact that consultants are paid more for the same type of work makes the situ-
ation worse. Consultants managing consultants will lead to not only conflicts
of interest and a decrease in the quality of work, but also an increase in costs
and project delivery delays.
4. Communication and control of consultants: In-house staff have to work hard
to make sure that consultants are doing work correctly. This issue was raised
by many districts.
5. Expensive consultant work: In 2009 CTR conducted and analysis using data of
approximately 1795 projects. There were 623 fully in-house projects and 749
mixed projects. In mixed projects, some functions were done by consultants.
It is found that the median construction cost of a Fully In-house project is
$1.21 million, and the average Percentage PE (direct plus indirect costs) is
1.28%. The median construction cost of a Mixed (In-house plus Consultant)
72

project is $2.87 million, and the average Percentage PE (direct plus indirect
costs) is 6.32% (Persad and Singh,2009).
6. Attrition and reduction in the staff: TxDOT is losing staff due to higher
labor turnover of young engineers. They are attracted by the private sector
due to higher wages. The department employee exit survey response rate
averages about 24% with pay ranking as the number one motivating factor
for separation of employment. In FY2007, approximately 40% of the state
workforce turnover occurred in the 16 to 29 years age group, followed by the
30 to 39 age group at 18%. (TxDOT workforce plan 2009-13). The trend in
employee turnover for the five-year period is given below.
Table 5.7: Trend in employee turnover
Fiscal year 2003 2004 2005 2006 2007TxDOT 11% 8.0% 10% 9.7% 10.8%All 18% ∗42% 19% 18% 19%
∗ includes early retirement
• Retirement eligibility: Compounding the higher rate of attrition, about
70% of executive managers and about 27% of all current employees will
be eligible for retirement in a few years. Figure 5.1 shows the trend in
retirement of in-house staff in the coming years.
By FY2013 over 30% of department’s workforce will be eligible for retire-
ment. This projected retirement turnover will have enormous impact on the depart-
ment’s organizational structure and service delivery. Eligibility data forecasts the
department could experience a 34% turnover rate in all management levels between
now and FY2013. Table 5.8 explains the category wise retirement situation in detail.
73

FY08
FY09
FY10
FY11
FY12
FY13
0% 10% 20% 30% 40%
34%
29%
25%
20%
16%
12%
Retirement Eligibility
Figure 5.1: Retirement eligibility within five years(Image source: TxDOT workforce plan)
Table 5.8: Percentage of Management Staff eligible to retire within the next fiveyears
Manager/Work Level FY08 FY09 FY10 FY11 FY12 FY13Supervisor 21% 27% 33% 39% 44% 51%Branch 19% 23% 30% 41% 48% 56%Sec/Staff 22% 27% 33% 42% 51% 59%Exec Mgr 28% 37% 44% 69% 70% 81%Exec Dir 100.00% 100.00% 100.00% 100.00% 100% 100%Total 12% 16% 20% 25% 29% 34%
Source: TxDOT Employee workforce plan
5.5 Chapter Summary
An in-depth study of the current engineering outsourcing practices of Tx-
DOT was done. It is found that consultant contract office does not control the
selection of consultant projects by the districts. For selecting functions to be out-
sourced, districts follow different approaches and most of them are highly subjective
in nature. The SWOT analysis of the current engineering outsourcing model iden-
tified serious weaknesses of the model. A common and systematic procedure for
the allocation of functions is needed for the diligent utilization of consultants in the
project delivery.
74

Chapter 6
Development of a decision making procedure foroutsourcing engineering services
6.1 Chapter Objectives
Districts select PE projects to be outsourced when they allocate projects in
the future program of work. A procedure is developed for systematically allocat-
ing projects in the future program of work. Various steps in the design projects
allocation procedure explained in this section.
6.2 Design Project Allocation Procedure
TxDOT districts usually make decisions regarding projects to be outsourced
by analyzing the future program of work. The future program is the possible projects
for one/three year(s). Since they make decisions for the entire program of work,
a project/function wise outsourcing potential assessment is of no use in the case
of districts. The crucial step in outsourcing decision making is the selection of
consultant projects. Suggested distinct steps in the decision making process for
districts is given in Figure 6.1.
Since districts consider whole group of projects at a time, various functions
from each projects are to be listed first. Suppose a district has five upcoming
projects and bridge design is common in three of them. The decision should be
about which design is to be kept in-house. The design capacity of districts is fixed
in nature and it needs to be estimated more analytically. The present technique of
75

$5 million/designer/year as the productivity alone cannot assess the productivity
of in-house designers since the level of engineering effort does not depend on the
total cost of the project. Hence, the capacity estimation should be left to the design
groups. It should be given extreme attention since an inaccurate estimation will
lead to overuse of consultants or delays. If possible, the capacity can be expressed
in terms of manhours. Each designer can calculate the number of hours he/she can
work. It is more useful than estimating the total work time based on the working
days since some districts use compensatory time. Likewise the total capacity of each
design group needs to be calculated. The capacity of the group also includes their
areas of expertise. Diagrammatic representation of the entire procedure is given in
Figure 6.1.
Timing: Districts usually make decisions about consultant projects once a
year and this process is a modification to the existing process. This process should
be complete before sending the letting schedule to the CCO. All districts should
complete the process before a particular period so that they can pool the staffif
necessary. Finalize the list, after considering requests for pooling.
76

Phase 1
Preliminary
Screening
Step 1: Formation of project allocation committee
Step 2: Finalize future program of work and classification of functions by the committee
(according to functions codes)
Step 3: Design groups prepare resource requirements for each function
Step 4: Groups classify functions based on engineering skills required and preferences
Step 5: Project Allocation (Phases 2 and 3)
Step 7: Collection and evaluation of feedback
Step 8: Update database, Modify process
Step 6: Review Meetings of the Committee
Figure 6.1: Implementation Process-Design Project Allocation Procedure77

Step 1: Formation of the project allocation committee
Function: The project allocation committee will be responsible for the decisions
regarding outsourcing engineering services. They will monitor various steps and is
responsible for making the final selection.
Members: The champion will be the District Engineer or TP&D Director. Other
members will be representatives from design groups. The size of the team varies
with districts since large districts have advanced design groups such as hydraulics,
hydrology etc. Each group can select their representatives and it is recommended
to change one person after three years to avoid bias in opinions.
Role Descriptions: The champion will be in charge of coordinating the works of
team members and the final selection. The group representatives are the interfaces
between the groups and the team. It is their duty to make sure that preferences of
the group members will be taken care of during the decision making.
Step 2: Finalize future program of work and classification of functions
After finalizing the future program of work, the committee will list various PE
functions from the future program of work, which may include several projects.
The TxDOT classification of functions is given in Appendix A.
Step 3: Assessment of resource requirements
In this phase, all the resources required to perform each function will be assessed by
respective groups. The representatives will be preparing the list of resources required
by discussing with group members. Estimation of some resource requirements are
given below.
1. Manhours: The manhours needed to perform each task in the list are to be
calculated. It could be an approximate value based on the past projects. The
table attached as appendix contains information regarding projects of various
78

sizes. A portion of the table is given in Table 6.1.
Table 6.1: Probable PE cost and manhours of in-house projects
PE Cost Man-hours Project type
Function Code
Mean (50%
probability)
84% Probability
98% Probability
Mean(50% probability)
84% Probability
98% Probability
BR 102 1318 1907 2759 30 43 63 BR 110 1413 1932 2644 22 29 40 BR 120 5754 6576 7515 107 122 138 BR 130 741 1017 1396 17 22 30 BR 145 1660 1985 2374 28 34 40 BR 150 4571 6865 10311 100 150 226 BR 160 9120 11741 15114 186 241 311 BR 161 4786 6105 7787 87 113 146 BR 163 9550 12327 15912 191 248 324 BR 164 4169 5122 6294 72 89 109 BR 170 8511 11343 15117 186 249 334 BR 180 2344 2618 2924 46 51 56
(Source: Persad & Singh, 2009)
Probable number of manhours required to perform various PE functions are
given in the table. Groups can choose the duration based on their constraints.
Significance of the three probability estimates are given below.
It can be explained using an example of a particular function. Consider the
PE function 102 in a Bridge Replacement (BR) project. There is 84% proba-
bility that the manhours is below 43 and 98% probability that it is below 63.
Probable values for total PE cost are also given. This table gives a range of
the total PE cost and duration for PE functions in each project type. Based
on experience, design groups can assume realistic manhours.
2. Cost: The total cost including indirect and direct costs of performing each task.
The suggested table of information could be the primary source. It could be
modified accordingly based on past projects and initial cost estimates.
79

3. Skills and special equipment required: The skills and capabilities needed to
perform the task determines the in-house do-ability of a service.
4. Necessity: The team as a whole can determine the level of necessity of the
particular project and hence the function. It is based on the specified deadline
of completion of the task. The resulting classification will be tasks Can be
delayed, Could be delayed (Neutral), cannot be delayed.
5. Each design group will prepare a list of the manhours they can contribute for
the particular period and skills possessed.
Step 4: Groups classify functions based on engineering skills required and preferences
In this phase, the representatives will get the order of preference of tasks from their
group/division. In the case of group performing similar functions (in big districts),
the representatives can reach on a consensus after discussing with representatives
of other groups. The classification of function is Preferred, Neutral (Can be out-
sourced), Must be outsourced. The first phase of the design project allocation
procedure and it is explained later in detail as Figure 6.2.
Description of the steps (shown in Figure 6.2)
S1: The committee classifies various PE functions required to perform for various
projects in the future program of work. The classification is according to the TxDOT
function codes.
S2: Based on the function resource requirements list, in-house doability of a partic-
ular function is analyzed. If the group cannot perform that functions include in the
Must be outsourced list. If it can be done in-house, go to step 3.
S3: Check whether the group wants to do the function in-house. If yes, include in
the Preferred List. If no, include in the Neutral List.
80

Step 5: Project allocation
This phase is the most crucial in the entire decision making process. The committee
members sit together and analyze outsourcing potential of each work and allocate
projects to in-house and consultants using the information collected from previous
steps. It is a multi-step process and all the phases are explained in the following
section as Figures 6.3 and 6.4 respectively.
S1Committee classies
the functions
S2Do they haveenough skillsand experience?
S3Do they wantto keep itin-house?
Include in theMust be outsourced list
Include in the Neu-tral/Can be outsourced list
Include in the PreferredList in the ascending order
Yes No
Yes No
Figure 6.2: Design project allocation procedure-Phase 1 (Foundation/Preliminarytasks)
81

S1Committee veries resourcerequirements for each function
S2Get the report of in-house capacity analysis
S3Does the totalmanhoursexceed?
S4Can they meetschedule?
S5Can it bedelayed?
INSOURCE OUTSOURCE
YesNo
NoYes
Yes No
Figure 6.3: Design project allocation procedure-Phase 2
Description of the steps
Step 1: The project allocation committee finalizes the resource requirements for
each function in the list.
Step 2: Get the report of in-house capacity assessment report for each group. It
includes the details such as total slack manhours and future schedule of the group.
Step 3: Check whether the total manhours available for each group is exceeded if
the particular function is done in-house. If yes, outsource. If no, go to S4.
82

Step 4: Check whether the design group is available when the work starts. It checks
the staff availability to meet the schedule of the work. If no, go to S5. If yes, go to
S6.
Step 5: Check whether the work can be delayed so that in-house do it whether they
have time. If no, outsource. If yes insource.
After allocating in-house preferred tasks of all function types, start
allocation of the Neutral List .
S1Neutral List
S2Does the totalmanhoursfor (groupslack time)
S3Can they meetschedule?
INSOURCE OUTSOURCE
No
Yes
Yes No
Figure 6.4: Project allocation procedure-Phase 3
83

Allocation of Neutral List starts after allocating all the preferred function
types Otherwise, some of the preferred function types will have to be outsourced.
Procedure for the neutral list is same as that of the preferred list. After allocating
entire projects, check whether the volume of outsourced list is 35% of the total
expenditure. If not outsource some of the projects kept as in-house projects.
Step 6: Review meetings
The Committee should meet quarterly to evaluate the effectiveness of the decisions.
Group representatives should be given opportunity to express their opinion whether
their preferences are given proper attention. In the meeting, the status of the in-
house work should be analyzed against the schedules. It includes delays and cost
overrun. Similarly, the estimated consultant manhours and cost should be checked
against the actual values. This will help figure out error in estimations.
Step 7: collection and evaluation of feedback
The objective of the decision making process is to allocate tasks in a cost effective
manner while giving importance to in-house preferences. Feedback from in-house is
inevitable for the successful implementation of the new strategy. Feedback should
give importance to the following areas.
• Performance appraisal: Analyze the performance of groups and individuals by
checking whether they are able to meet the target. Any delay happened in
the in-house tasks should be investigated carefully. It could be an error in the
estimation of manhours.
• Employee satisfaction surveys: Opinion should be collected from each individ-
ual about the task allocation and whether their preferences are considered in
the project allocation process. This feedback should be used next time. Feed-
back from the individual should be collected and analyzed by the champion.
84

Step 8: Modify process
Based on the feedback and review meetings, the committee should update the pro-
cess periodically according to the in-house requirements.
6.3 Chapter Summary
A systematic procedure for making outsourcing decisions regarding engi-
neering functions for districts is developed in this chapter. The key phases in this
strategy are the assessment of resource requirements, in-house capacity analysis and
project allocation. Quantitative methods as well as qualitative judgement skills of
in-house engineers are used in the decision making.
85

Chapter 7
Findings and Recommendations
7.1 Findings
Findings from the SWOT analysis are summarized in Table 7.1.
Table 7.1: SWOT matrix
Helpful to achieving the object
Harmful to achieving the object
Inte
rnal
orig
in
(attr
ibut
es o
f the
sys
tem
)
Strengths
1. Staff: Skilled, Experienced, High morale, Accountable
2. Conducive attitude towards outsourcing
3. Initiatives to use software
Weaknesses
1. Lack of a systematic approach 2. Vague methods for Project requirement
analysis 3. No analytical methods for estimating in-
house staff availability 4. No powerful methods for estimating in-
house staff availability 5. No systematic outsourcing potential
assessment 6. Lack of guidelines from CCO regarding
engineering outsourcing 7. Complicated and time consuming
consultant selection process 8. Restrictions over indefinite deliverable type
contracts 9. Lack of in-house performance appraisals
and job satisfaction surveys
Exte
rnal
orig
in
(Attr
ibut
es o
f the
en
viro
nmen
t)
Opportunities
1. Flourishing Consultant Market 2. No Governmental regulation 3. Regionalization 4. Indefinite deliverable contracts
Threats
1. Expensive consultant work 2. Consultants lack knowledge about the region 3. Loss of staff: Attrition, Aging 4. Hire Freeze
86

7.2 Recommendations
From the SWOT analysis, it is clear that weaknesses dominate and reduc-
tion of them can improve the efficiency of the system to a great extent. Major
improvements are required in the following areas: outsourcing approach and consul-
tant selection process. These changes are inevitable for the success of the proposed
design project allocation procedure.
7.2.1 Outsourcing approach
The outsourcing of engineering functions should be considered as a strategy
and it should be aligned with the organizational strategy. State/Districts should
have a justification for the reliance on consultants based on the organizational ob-
jectives. Hence selection of consultant projects should be given utmost care.
1. Purpose: The benefits from outsourcing should be clearly stated from the
strategic level management. From the experience of other DOTs as well as
TxDOT it is evident that cost-effectiveness is not the sole objective of con-
sultant involvement in engineering functions. If TxDOT has a well defined
objectives, a suitable strategy can be devised and this will guide districts in
the developing an action plan. Consultant Contract Office should seriously
consider this aspect of outsourcing. They should monitor the decision making
regarding outsourcing of engineering functions as well. Guide lines regarding
selection of projects to be outsourced will help districts to make wise decisions.
It should contain all the factors to be considered while selecting projects.
2. Structured decision making: TxDOT districts directly deal with the imple-
mentation of the outsourcing strategy. Hence they should follow a procedure
which gives importance to analytical aspects rather than merely depending on
87

subjective judgements. Districts should follow a uniform approach for making
decisions.
7.2.2 Changes required in the current system
The suggested decision making procedure works best if certain changes are
made in the present system. Major changes required are discussed below.
7.2.2.1 Consultant selection process
The consultant selection process is the major factor sabotages any in-house
strategy that gives preference to in-house. Currently, the average time to get a
consultant on-board is 6-8 months. It is because of the tedious and complicated
procedure. Definite deliverable contracts are decreasing due to this system.
The present system should be restructured keeping the prime objective of
qualification based selection. It should be more flexible and quicker. In that way,
consultants can be used as a force multiplier.
The central office can suggest a pool of qualified consultants and districts can
be allowed to select form that list doing negotiations individually. Once the districts
are relieved from finding a consultant, they can save considerable amount of time.
The consultant pool can be formed for various regions since certain functions require
familiarity of the area.
7.2.2.2 Indefinite deliverable contracts
Evergreen contracts are preferred due to their flexibility. The $2 million cap
and the validity restriction of two years should be changed. It will help outsourcing
long-term projects for which it is not practical to keep full-time staff.
88

7.2.2.3 Regionalization
TxDOTs experienced staff are as competent as consultants. The statistical
analysis found that consultants are more expensive than in-house (Persad & Singh,
2009). Besides, small/rural districts mentioned that they are outsourcing since it
is mandatory to do so and only projects which require special expertise are to be
outsourced. Such projects are rare in small districts. At the same time big districts
do not have enough work-force and have really good design team. Creating regions
by combining small and big districts will balance the workforce and reduce the
consultant involvement and cost.
7.2.2.4 Performance appraisal system
The present performance appraisal system needs to be changed. The pro-
ductivity should be monitored at the design group level as well as at the individual
level. The morale/work satisfaction of the staff should be assessed periodically. It
will prevent people leaving because of dissatisfaction.
7.2.2.5 Recruitment
Studies forecast major shortage of workforce within few years. More people
should be recruited now so that they can get enough training before the current
workforce leave.
7.2.2.6 Training/Selection of people with management skills
Majority of the TxDOT workforce consists of engineers and the increase in
outsourcing requires management skills. Oversight of consultant work and negotia-
tions require such skills. The existing people should be given training in consultant
management and also more people skilled in management need to be recruited.
89

7.2.2.7 Attitudinal changes
Some of the districts surveyed seemed to overestimate the judgement skills
and are reluctant to use analytical procedures. It should be changed for a successful
implementation of the new outsourcing strategy.
7.2.2.8 Systematic project tracking facilities
Accurate estimation of project resource requirements is necessary for mak-
ing correct decisions. Information regarding cost and manhours should be tracked
correctly since it such information is later in to estimate resource requirements.
7.3 Minimum Consultant Work
The minimum amount of PE work to be kept in-house for maintaining in-
house expertise is a perennial debate topic. The work volume of each district varies
and fixing minimum like 65% is a threat to implement an outsourcing strategy.
District officials surveyed gave various percentages as the minimum work to be kept
in-house to maintain skills. Table 7.3 gives suggestions from various districts.
Hiring consultants will not negatively impact in-house morale, if there is
balance of in-house and consultant work volume. Just like in-house minimum PE, a
constant minimum amount of consultant PE work should also be required. In such a
steady state, in-house people have opportunities for developing their capabilities. A
certain amount of consultants are also needed to maintain negotiation and consultant
management skills of in-house. Likewise, consultant industry also needs to keep a
base load so that they can familiarize with TxDOT projects. Mutual dependency
of consultants and DOTs are crucial for the timely delivery of highway projects.
Conclusion
The in-depth study of the engineering outsourcing practices of TxDOT revealed
90

Table 7.2: Minimum PE work to be kept in-house
District Suggested minimum level of in-housework
Amarillo 65% state wideBryan At least 50%Childress 80%El Paso 2/3rdHouston 50%Laredo 85%Lubbock Should vary with no minimumParis As much as possiblePharr 70%San Angelo At lest 50%San Antonio 50%Tyler 65%
that a systematic and analytical project allocation is needed for diligent utilization
of consultants while maintaining in-house expertise. The suggested PE project al-
location method for districts is the core of the outsourcing strategy. For successful
implementation of the procedure, certain changes are needed in the current system.
91

Appendices
92

Appendix A
TxDOT Classification of PE Functions
Function Code Function Description
102 Feasibility Studies 110 Route and Design Studies 120 Social, Economic and Environmental Studies and Public Involvement 126 Donated Items or Services 130 Right �–of-Way Data (State or Contract Provided)
145 Managing Contracted or Donated Advance PE Services. Also includes all costs to acquire the consultant contract(s) and services Applicable to advance PE, Function Codes 102 -150. Advance PE are activities in Function Codes 102 through 150.
146 Rework by TxDOT of complete consultant plans on advance PE projects. Advance PE are activities in function codes 102 through 150.
150 Field Surveying and Photogrammetry 160 Roadway Design Controls (Computations and Drafting) 161 Drainage 162 Signing, Pavement Markings, Signalization (Permanent) 163 Miscellaneous (Roadway)
164 Managing Contracted or donated PS & E PE Services. Also includes all costs to acquire the Consultants Contract(s) and Services applicable to PS & E, Function Codes 160 - 190. PS & E PE are activities in function code 160 through 190.
165 Traffic Management Systems (Permanent)
166
Rework By TxDOT Of Completed Consultant Plans on PE & E projects. PS & E PE are activities in function codes 160 through 190. Rework Segment 76 FCs 160-190 for metric conversion. For reworking existing PS&E to metric units on projects already into plan preparation.
169 Donated Items or Services 170 Bridge Design 180 District Design Review and Processing 181 Austin Office Processing (State Prepared P.S. & E.) 182 Austin Office Processing (Consultant Prepared P.S. & E.) 190 Other Pre-letting date Charges, Not Otherwise Classified. 191 Toll Feasibility Studies 192 Comprehensive Development Agreement Procurement 193 Toll Collection Planning
93

Appendix B
Interview Questionnaire
“TxDOT Project Delivery Business Model” Interview
Guide/Questionnaire
Objective: The main objective of this interview is to collect information about how
TxDOT goes about deciding on what PE work is done in-house or contracted to
consultants. It aims to gather data regarding the tools/procedures used, factors
that are used in the decision process, PE programs/projects/functions most often
outsourced, and whether there is any follow-up or feedback on the final product.
Our request: Please email Krishnaprabha K R [[email protected]] with some
dates/times when you can fit us in for a telephone interview (and your preferred
phone number). We anticipate taking no more than 30 minutes of your time.
Alternatively, you can fill out whatever you can in this file and email it back to
[email protected] with some dates/times when we can call you to follow-up.
We would like to complete this data collection by the end of June.
94

Date of interview:
Name of the Interviewee:
Primary job function:
Experience in consultant management field:
Other information:
Phone and email:
1. How do you assess the staff and related requirements for a particular program
of work? (eg. 3 year letting schedule)
2. Can you give more information about the procedure used to estimate the In-
house staff availability? Do you have a formula or procedure for calculating
the manhours/time required for a particular project?
3. Please tell me all the steps you go through in making the decision on who
does some or most of the PE work in a program? (In-house or consultant)
Who makes that decision? Do you have some rules for deciding which jobs
can be done in-house and which must require consultants?
4. What are the factors you consider in the outsourcing decision making pro-
cess? (eg. In-house capabilities)
• Do you have a check-list of complexity factors or required skills that
you use to classify a job as ’doable in-house’ or ’requires a consultant’?
Would such a list be useful?
5. What PE functions/projects/program do you most often outsource, and what
are the reasons?
95
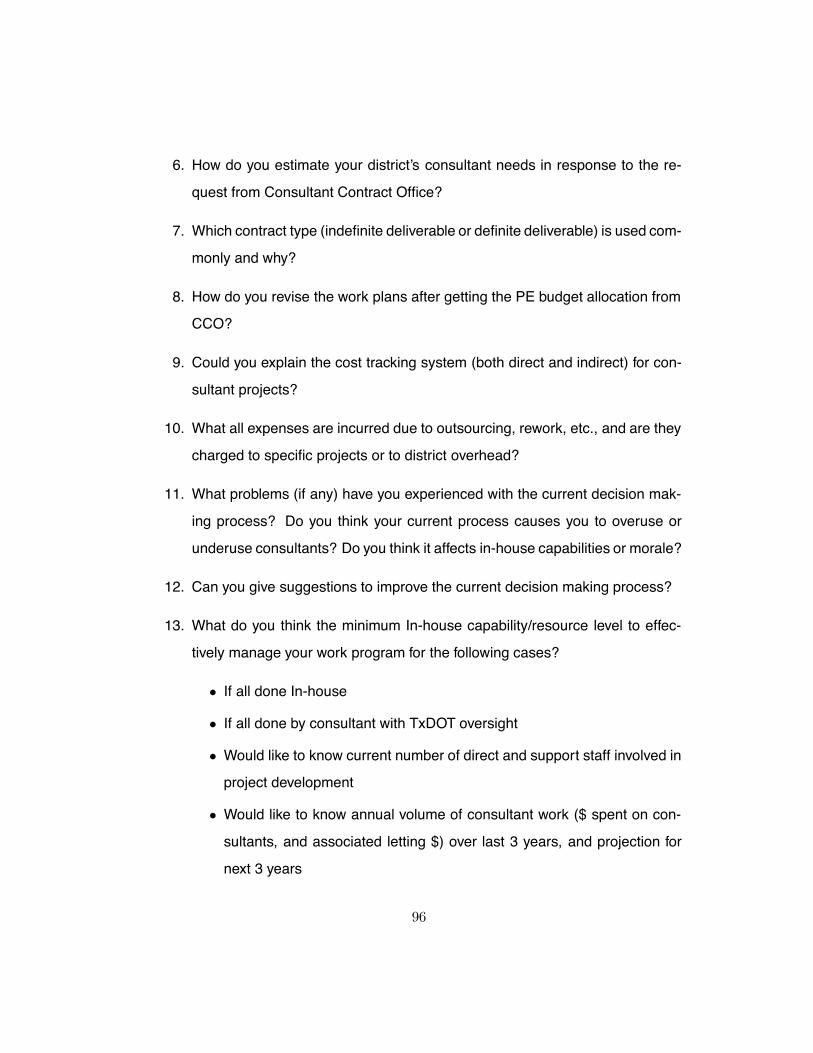
6. How do you estimate your district’s consultant needs in response to the re-
quest from Consultant Contract Office?
7. Which contract type (indefinite deliverable or definite deliverable) is used com-
monly and why?
8. How do you revise the work plans after getting the PE budget allocation from
CCO?
9. Could you explain the cost tracking system (both direct and indirect) for con-
sultant projects?
10. What all expenses are incurred due to outsourcing, rework, etc., and are they
charged to specific projects or to district overhead?
11. What problems (if any) have you experienced with the current decision mak-
ing process? Do you think your current process causes you to overuse or
underuse consultants? Do you think it affects in-house capabilities or morale?
12. Can you give suggestions to improve the current decision making process?
13. What do you think the minimum In-house capability/resource level to effec-
tively manage your work program for the following cases?
• If all done In-house
• If all done by consultant with TxDOT oversight
• Would like to know current number of direct and support staff involved in
project development
• Would like to know annual volume of consultant work ($ spent on con-
sultants, and associated letting $) over last 3 years, and projection for
next 3 years
96

• Would like to know annual letting volume for last three years and next
three years
• Please suggest an ideal mix of in-house and consultant works to main-
tain in-house capabilities? (A ratio like 70% in-house and 30% consul-
tants etc.)
14. What is your opinion about consultants managing consultant projects? (
quality of work, conflict of interest etc.)
Follow up
We will document what we have just discussed and email it to you one week
from today for verification/comments. Can we set up a time after that for me to
call you so we can discuss your comments?
97

Appendix C
Gain in Consultant Involvement
Annual construction Program
Annual consultant payments for PCE work
% Gain in payments 1980-1998
State 1988 1998 1988 1998 1988 1998 Arizona 850 - 51 Arkansas 200 380 1 18 90 1800 Colorado 144 300 43 45 108 - Connecticut 350 400 50 25 14 (-42) Florida 750 1300 21 190 73 280 Georgia 500 650 - 57 13 171 Hawaii 50 120 45 5 140 - Illinois 875 1337 4 47 53 4 Iowa 200 325 3 14 63 250 Kansas 260 550 18 20 112 567 Maryland 450 350 2 74 78 111 Michigan 400 151 0 30 (-62) 1500 Missouri 392 650 - 20 65 (infinite) New Hampshire 80 110 30 11 38 - New Jersey 430 437 56 53 2 77 New York 850 1200 3 150 41 168 North Carolina 350 1000 10 50 186 1567 South Carolina 280 350 8 25 25 150 Tennessee 450 680 36 - 42 - Texas 1900 2100 40 105 11 192 Virginia 900 2500 40 121 - 203 Washington 362 494 - 120 36 - Wisconsin 250 450 12 45 80 275
98

Appendix D
Percentage of Consultant Involvement in DOTs
State % of work by consultants State % of work by consultants
Arizona 70 Michigan 46 Arkansas 40-45 Minnesota 16 California 15 Missouri 40 Colorado 50 Nebraska 40 Connecticut 70 New Hampshire 35 Florida 80 New Jersey 85 Georgia 25-30 New York 50 Hawaii 60 North Carolina 35 Illinois 80 South Carolina 40 Iowa 40 Tennessee 54 Kansas 60 Texas 30 Kentucky 73 Virginia 65 Louisiana 50 Washington 15 Maryland 70 Wisconsin 37 Massachusetts 50 Wyoming 10-15
99

Appendix E
Outsourcing Responsibilities Matrix
100

Appendix F
PDP Flow chart
See following pages.
101

For n
ew lo
catio
n or
add
ed c
apac
ity p
roje
cts
Pro j
ects
requ
iring
con
trol
of a
cces
s or
an
EIS
O
ther
than
pro
ject
s re
quiri
ng c
ontro
l of a
cces
s or
an
EIS
Proj
ects
requ
iring
con
trol o
f acc
ess
or a
n EI
SNe
w lo
catio
n or
add
ed c
apac
ity p
roje
cts
(env
ironm
enta
l cle
aran
ce a
lread
y ob
tain
ed)
PLAN
NING
AND
PR
OG
RAM
MIN
G
PREL
IMIN
ARY
DESI
GN
PS&E
DE
VELO
PMEN
T
LETT
ING
RIG
HT O
F W
AY
AND
UTIL
ITIE
S
ENVI
RONM
ENTA
L
Need
s Id
entif
icat
ion
Com
plia
nce
with
Pla
nnin
g Re
quire
men
ts
Proj
ect
Auth
oriz
atio
n
Stud
y Re
quire
men
ts
Dete
rmin
atio
n
Cons
truct
ion
Fund
ing
Iden
tific
atio
n
Desi
gn
Conc
ept
Conf
eren
ce
Data
Col
lect
ion/
Pr
elim
inar
y De
sign
Pr
epar
atio
n
Geo
met
ric
Sche
mat
ic
Valu
e En
gine
erin
g
Geo
met
ric
Sche
mat
ic
Appr
oval
Prel
imin
ary
Envi
ronm
enta
l Is
sues
Inte
rage
ncy
Coor
dina
tion/
Pe
rmits
En
viro
nmen
tal
Docu
men
tatio
n Pu
blic
He
arin
g En
viro
nmen
tal
Clea
ranc
e
Publ
ic
Mee
ting(
s)
ROW
and
Util
ity
Data
Col
lect
ion
ROW
Map
an
d Pr
oper
ty
Desc
riptio
ns
ROW
Ap
prai
sals
and
Ac
quis
ition
Desi
gn
Conf
eren
ce
PRO
JECT
DEV
ELO
PMEN
T PR
OCE
SS
PLAN
PR
OJE
CT IN
ITIA
TIO
N
LEG
END
PRO
JECT
INIT
IATI
ON
PLA
N Le
vel o
f Aut
horit
y -
Sch
emat
ics
and
Envi
ronm
enta
l Im
pact
DEV
ELO
P Le
vel o
f Aut
horit
y -
PS&
E an
d RO
W C
lear
ance
CO
NSTR
UCT
Leve
l of A
utho
rity
- T
IP /
STIP
Proj
ect d
evel
opm
ent f
or m
ajor
cap
acity
impr
ovem
ent p
roje
cts
can
vary
from
3 to
20
year
s,
or m
ore,
dep
endi
ng o
n re
quire
d en
viro
nmen
tal a
nd R
OW
pro
cess
es; 6
to 1
0 ye
ars
is
cons
ider
ed ty
pica
l.
- A
ltern
ativ
e
Sel
ectio
n -
Geo
met
rics
- Up
date
Cos
t
Est
imat
es
Prel
imin
ary
Sche
mat
ic
Partn
ersh
ip P
lan
Revi
ew/
Coor
dina
tion
Com
mun
ity,
Loca
l Gov
't En
titie
s,
Priv
ate
Partn
ers
Fund
ing
Alte
rnat
ives
/Fea
sibi
lity
Econ
omic
s, V
alue
Cap
ture
, Sus
tain
abili
ty
Inst
itutio
naliz
ing
Coor
dina
tion/
Partn
ersh
ip in
Pro
ject
Dev
elop
men
t
Com
mun
ity Is
sues
and
Prio
ritie
s, E
stab
lishi
ng M
ultid
icip
lined
Tea
ms,
Fu
ture
Coo
rdin
atio
n, D
esig
n In
fluen
ce/S
ourc
es, E
nviro
nmen
tal I
nput
/Ana
lysi
s,
Cons
truct
ion
Impa
ct/P
hasi
ng
Corr
idor
Pla
n De
velo
pmen
t Ne
ed &
Iden
tific
atio
n Ar
ea/R
egio
nal
Goa
ls &
Pla
ns
102

Utili
ty
Adju
stm
ents
Fina
l Al
ignm
ents
/ Pr
ofile
s
PS&E
As
sem
bly/
De
sign
Re
view
Fina
l Pr
oces
sing
an
d Le
tting
S
Drai
nage
De
sign
- Hyd
raul
ic D
esig
n - D
rain
age
Deta
ils
- Sto
rm W
ater
Pol
lutio
n
Pre
vent
ion
Plan
Brid
ge
Desi
gn
- F
inal
Geo
tech
nica
l Sur
veys
- B
ridge
Lay
outs
- B
ridge
Des
ign
and
Deta
ils
Ope
ratio
nal
Desi
gn
- Illu
min
atio
n - I
ntel
ligen
t Tra
nspo
rtatio
n
Sys
tem
- S
igna
ls
- Sig
ning
and
Stri
ping
CONS
TRUC
T DE
VELO
P
REV
. Sep
tem
ber 2
008
Reta
inin
g/
Nois
e W
alls
an
d M
isc.
St
ruct
ures
- Fin
al G
eote
chni
cal S
urve
ys
- Ret
aini
ng/N
oise
Wal
l Lay
outs
- R
etai
ning
/Noi
se W
all D
esig
n
and
Det
ails
- M
isce
llane
ous
Stru
ctur
es
Traf
fic
Cont
rol
Plan
- Seq
uenc
e of
Wor
k - D
etou
r Pla
ns
- Tem
pora
ry S
igni
ng, S
tripi
ng,
a
nd P
avem
ent M
arki
ng
- Con
tract
Pro
visi
ons
- Rev
iew
- Ear
thw
ork
- Lan
dsca
pe a
nd A
esth
etic
s - P
lan/
Prof
ile a
nd R
oadw
ay
D
etai
ls
- Rai
lroad
Agr
eem
ents
Road
way
De
sign
- Tra
ffic
Cont
rol
- Per
mits
and
Agre
emen
ts
- Des
ign
Data
Colle
ctio
n - S
tream
Cro
ssin
g
Hydr
aulic
s - P
avem
ent D
esig
n
Begi
n De
taile
d De
sign
103

Appendix G
Snapshot of HPTMS Output
See following pages.
104

105

106

107

108

Appendix H
Sample Suretrak Output
See following page.
109

City
of S
cher
tz20
07 B
ond
Proj
ect -
Str
eet,
Dra
inag
e, a
nd P
avem
ent
Prel
imin
ary
Proj
ect S
ched
ule
Sum
mar
y
Act ID
Des
crip
tion
Orig Dur
Rem Dur
Early
Star
tEa
rlyFi
nish
Tota
lFl
oat
%R
espo
nsib
ility
2007
JUN
2008
JUL
200
AU
GSE
PO
CT
NO
VD
ECJA
NFE
BM
AR
APR
MA
YJU
NJU
LA
UG
SEP
OC
TN
OV
DEC
JAN
FEB
MA
RA
PRM
AY
JUN
J
Phas
e I
Doe
rr La
ne R
econ
stru
ctio
n - M
P R
R to
Tri-
Cou
nty
S110
10D
esig
n1d
87d
01JU
N07
02O
CT0
796
3d0
EDG
S110
20U
tility
Con
flict
s Id
entif
ied
1d1d
29AU
G07
*29
AUG
070
0ED
GS1
1025
Util
ity R
eloc
atio
n D
esig
n65
d65
d30
AUG
07 *
28N
OV0
70
0ED
GS1
1030
Util
ity R
eloc
atio
n C
onst
ruct
ion
90d
90d
29N
OV0
704
APR
0890
4d0
EDG
S110
50Pr
elim
inar
y C
onst
ruct
ion
Letti
ng0
031
JAN
0890
4d0
EDG
S110
60C
onst
ruct
ion
130d
130d
31JA
N08
31JU
L08
904d
0ED
GSc
hertz
Par
kway
Rec
on-D
ietz
Crk
to F
M 7
8S2
1050
Dry
Util
ity D
esig
n75
d82
d07
JUN
07 *
01O
CT0
70
0D
MC
S210
56Le
t Dry
Util
ites
00
15O
CT0
710
22d
0D
MC
S210
60D
ry U
tiliti
es C
onst
ruct
ion
87d
87d
16O
CT0
715
FEB0
810
22d
0D
MC
S210
65W
ater
and
Sew
er D
esig
n75
d82
d07
JUN
0701
OC
T07
882d
0D
MC
S210
70W
ater
and
Sew
er C
onst
ruct
ion
- Let
ting
00
15O
CT0
710
02d
0D
MC
S210
80W
ater
and
Sew
er C
onst
ruct
ion
107d
107d
16O
CT0
714
MAR
0810
02d
0D
MC
S210
85R
oadw
ay D
esig
n12
9d13
6d07
JUN
0714
DEC
0788
2d0
DM
C/E
DG
S210
90R
oadw
ay C
onst
ruct
ion
- Let
ting
00
31D
EC07
882d
0D
MC
/ED
GS2
1100
Roa
dway
Con
stru
ctio
n (in
clud
ing
Mai
n St
reet
)17
3d17
3d02
JAN
0801
SEP0
888
2d0
DM
C/E
DG
Dim
rock
& W
oodl
and
Oak
s D
r. R
esur
face
S4-5
1010
Engi
neer
ing
Des
ign
82d
82d
07JU
N07
A01
OC
T07
392d
0D
MC
S4-5
1015
Let P
avin
g C
onst
ruct
ion
00
15O
CT0
792
6d0
DM
CS4
-510
20St
reet
Res
urfa
ce -
Dim
rock
& W
oodl
and
Oak
s D
r18
0d18
3d16
OC
T07
30JU
N08
926d
0D
MC
Rur
al R
oads
S6AB
C10
20Ph
ase
I Rur
al R
oads
Des
ign
126d
126d
07JU
N07
30N
OV0
765
4d0
DM
CS6
ABC
1025
Let P
avin
g C
onst
ruct
ion
00
14D
EC07
654d
0D
MC
S6AB
C10
30W
are-
Sequ
in, P
feil,
Gra
ytow
n, S
ceni
c La
ke16
2d16
2d17
DEC
0701
AUG
0865
4d0
DM
CLo
w W
ater
Cro
ssin
g C
ibol
o C
reek
at A
viat
ion
D41
010
Engi
neer
ing
Des
ign
90d
90d
04SE
P07
*09
JAN
080
0ED
GD
4102
0R
oadw
ay C
onst
ruct
ion
Letti
ng0
009
JAN
0872
1d0
EDG
D41
030
Roa
dway
Con
stru
ctio
n13
0d13
0d21
FEB0
821
AUG
0872
1d0
EDG
Des
ign
Util
ity C
onfli
cts
Iden
tifie
dU
tility
Rel
ocat
ion
Des
ign
Util
ity R
eloc
atio
n C
onst
ruct
ion
Prel
imin
ary
Con
stru
ctio
n Le
tting C
onst
ruct
ion
Dry
Util
ity D
esig
nLe
t Dry
Util
ites
Dry
Util
ities
Con
stru
ctio
nW
ater
and
Sew
er D
esig
nW
ater
and
Sew
er C
onst
ruct
ion
- Let
ting
Wat
er a
nd S
ewer
Con
stru
ctio
nR
oadw
ay D
esig
nR
oadw
ay C
onst
ruct
ion
- Let
ting
Roa
dway
Con
stru
ctio
n (in
clud
ing
Mai
n St
reet
)
Engi
neer
ing
Des
ign
Let P
avin
g C
onst
ruct
ion
Stre
et R
esur
face
- D
imro
ck &
Woo
dlan
d O
aks
Dr
Phas
e I R
ural
Roa
ds D
esig
nLe
t Pav
ing
Con
stru
ctio
nW
are-
Sequ
in, P
feil,
Gra
ytow
n, S
ceni
c La
ke
Engi
neer
ing
Des
ign
Roa
dway
Con
stru
ctio
n Le
tting
Roa
dway
Con
stru
ctio
n
110

Appendix I
Table of Cost and Manhours
See following pages.
111

50% probability 84%probability 98% probability 50% probability 84% probability 98% probabilityBR 102 30 43 63 1318 1907 2759BR 110 22 29 40 1413 1932 2644BR 120 107 122 138 5754 6576 7515BR 130 17 22 30 741 1017 1396BR 145 28 34 40 1660 1985 2374BR 150 100 150 226 4571 6865 10311BR 160 186 241 311 9120 11741 15114BR 161 87 113 146 4786 6105 7787BR 163 191 248 324 9550 12327 15912BR 164 72 89 109 4169 5122 6294BR 170 186 249 334 8511 11343 15117BR 180 46 51 56 2344 2618 2924BR 181 26 28 31 1047 1139 1239BR 182 27 30 33 1096 1208 1331BR 190 9 11 13 1514 1678 1861BWR 110 24 39 63 1259 2149 3667BWR 120 87 103 121 5623 7018 8758BWR 145 43 57 77 2630 3406 4411BWR 160 240 434 787 12882 23035 41189BWR 163 331 548 908 15488 24272 38037BWR 164 55 82 123 3548 5104 7342BWR 170 182 369 749 9120 17727 34458BWR 180 55 67 82 3090 3740 4525BWR 181 40 46 53 1585 1830 2114BWR 182 25 30 35 1072 1284 1538CTM 181 23 31 40 912 1204 1589INC 145 93 140 211 5495 8392 12814INC 160 1202 1902 3009 54954 85684 133597INC 162 347 606 1059 18621 32115 55389INC 164 339 536 847 19953 31718 50421INC 165 151 253 421 7762 13211 22484INC 180 224 265 314 13490 15823 18559INC 181 49 60 74 1995 2432 2965INC 182 68 82 99 2884 3464 4161INC 190 42 63 94 5248 6635 8389LSE 120 16 22 29 891 1310 1927LSE 160 56 71 90 2570 3224 4043LSE 163 69 85 105 3715 4499 5449LSE 164 29 37 48 1479 1943 2553LSE 180 32 37 42 1660 1880 2130LSE 181 13 14 16 562 612 666MSC 102 8 13 21 372 604 982MSC 110 28 35 44 1514 1881 2338MSC 120 33 39 45 1995 2312 2678MSC 130 28 37 49 1349 1799 2398MSC 145 27 33 40 1698 2071 2525MSC 150 37 47 60 2089 2693 3472MSC 160 155 182 213 7586 8851 10328MSC 161 132 182 250 6457 8820 12049MSC 162 129 153 183 6026 7197 8596MSC 163 132 153 177 6026 6986 8101MSC 164 59 73 92 3467 4384 5544MSC 165 110 180 294 6310 10581 17745MSC 170 29 41 58 1514 2155 3067MSC 180 38 41 45 1995 2181 2384MSC 181 24 26 27 933 999 1069MSC 182 29 32 37 1175 1330 1506MSC 190 12 14 17 2239 2505 2803OV 110 30 42 59 1445 2026 2841OV 120 16 22 31 871 1245 1779OV 145 37 46 56 2344 2854 3473OV 150 27 34 43 1318 1656 2080OV 160 95 110 127 4677 5425 6291OV 162 48 61 78 2692 3393 4277OV 163 98 115 136 4677 5515 6502OV 164 15 21 29 955 1347 1899OV 180 40 44 48 2138 2344 2571OV 181 24 26 29 912 1008 1115OV 182 14 17 21 575 700 852OV 190 5 6 7 1380 1587 1825RER 102 9 12 16 490 653 871RER 110 28 36 45 1622 2071 2645RER 120 46 52 60 2692 3089 3546RER 130 19 26 36 832 1139 1559RER 145 40 49 60 2399 2967 3671RER 150 91 121 162 4266 5633 7437
Inhouse Function DCIS CodeTotal Manhours Total PE Cost
112

50% probability 84%probability 98% probability 50% probability 84% probability 98% probabilityInhouse Function DCIS CodeTotal Manhours Total PE Cost
RER 160 380 458 552 18197 21809 26138RER 161 110 139 176 5370 6745 8471RER 162 60 81 110 3236 4427 6057RER 163 302 357 422 15136 17848 21047RER 164 72 99 135 4677 6401 8761RER 170 29 48 79 1549 2512 4074RER 180 71 77 83 3802 4108 4439RER 181 38 41 44 1549 1665 1790RER 182 28 31 35 1122 1281 1462RER 190 12 14 18 2138 2440 2785RES 110 46 65 92 2692 3748 5219RES 120 40 48 57 2455 2984 3628RES 150 48 66 92 2188 2963 4012RES 160 170 213 267 7762 9772 12303RES 161 135 186 255 5623 8041 11498RES 162 25 38 58 933 1487 2370RES 163 355 451 574 16596 21024 26632RES 164 39 62 97 2884 4435 6821RES 180 68 73 79 4169 4571 5013RES 181 34 38 43 1318 1494 1692RES 190 13 20 32 1660 2286 3150SC 110 23 35 52 1585 2307 3358SC 120 11 18 29 646 1021 1616SC 150 35 50 70 1778 2489 3483SC 160 48 58 71 2399 2859 3408SC 162 47 74 117 2239 3440 5286SC 163 95 114 136 4677 5587 6672SC 180 45 50 56 2399 2697 3031SC 181 11 14 17 407 501 617SC 190 25 39 60 3548 4382 5413SFT 102 32 46 65 1585 2278 3273SFT 110 17 20 24 955 1130 1336SFT 120 55 60 65 3020 3288 3580SFT 130 17 21 26 832 1028 1271SFT 145 25 30 36 1549 1888 2302SFT 150 78 93 112 3715 4431 5284SFT 160 200 233 271 9772 11344 13169SFT 161 78 97 122 3802 4730 5885SFT 162 58 69 83 2754 3357 4091SFT 163 200 225 254 9333 10531 11883SFT 164 58 67 79 3236 3809 4483SFT 170 32 45 63 1660 2249 3048SFT 180 47 50 54 2512 2687 2874SFT 181 29 30 32 1122 1188 1258SFT 182 20 22 24 794 877 968SFT 190 8 9 10 1778 1987 2219TS 120 9 14 21 631 1026 1668TS 162 123 165 221 7943 10099 12839TS 163 34 49 71 1778 2563 3694TS 164 41 61 90 2692 4000 5945TS 180 26 31 37 1259 1525 1847TS 181 17 19 22 741 845 962TS 182 14 18 23 631 801 1017UPG 180 115 173 260 5495 8202 12242UPG 181 59 67 77 2570 2952 3390WF 145 195 334 573 12589 21266 35923WF 180 200 301 455 11220 17692 27896WF 181 44 65 97 1820 2765 4202WF 182 102 144 203 4571 6436 9063WNF 102 10 14 20 479 671 942WNF 110 129 188 275 6761 9612 13665WNF 120 100 153 233 6918 9650 13461WNF 145 89 119 160 5370 7107 9404WNF 146 37 48 61 1862 2374 3027WNF 160 575 912 1445 26915 41495 63973WNF 161 562 815 1180 24547 34481 48435WNF 162 170 239 336 9120 12581 17354WNF 163 468 699 1045 23988 35054 51224WNF 164 240 309 398 15136 19349 24736WNF 170 107 223 462 5370 10902 22131WNF 180 145 164 187 8511 9730 11122WNF 181 52 60 68 2344 2667 3034WNF 182 37 43 51 1514 1767 2062WNF 190 29 40 55 4266 5189 6313
113

Appendix J
Functional Sourcing Assessment Checklist
See following pages.
114

# Statement Factor1 This function is a core competency of TxDOT and should not be
contracted out.2
2 This function is of high strategic importance and its performancein-house is critical to accomplishing the mission.
2
3 This function deals with confidential information. Revealing suchinformation to outside vendors may have a detrimental effect.
2
4 There are regulations or laws that would prohibit TxDOT from out-sourcing this function.
1
5 There are arrangements or contractual agreements with suppliers,customers, or other parties that make it difficult to outsource thisfunction.
1
6 This function is interdependent with other functions. Outsourcingthis function negatively impacts effective interaction with TxDOT.
3
7 Outsourcing this function negatively impacts the culture or organi-zational values of TxDOT.
5
8 Outsourcing this function negatively impacts the organization strat-egy, systems, and/or administrative procedures of TxDOT.
3
9 Outsourcing this function results in employee losing loyalty andfaith in TxDOT.
5
10 Outsourcing this function results a negative reaction from the gen-eral public, customers, or other stakeholders.
2
11 Most of the employees who currently perform this function in-househave been retrained and relocated to other areas of TxDOT underconditions of outsourcing this function.
5
12 Contracting out this function negatively impacts the productivity orquantity of output of this function.
3
13 Contracting out this function negatively impacts the quality of out-put of this function.
2
14 Contracting out this function would result in significant capacity,volume, or scheduling problems.
3
15 Contracting out this function has a negative economic or socialimpact on our current employees.
5
115

# Statement Factor16 All costs considered, insourcing this function costs less than out-
sourcing it.4
17 This function should be performed in-house because the criticalhuman resource skills in this activity cannot be matched by ven-dors.
2
18 Contracting out this function results in greater cost efficiencies tothe company than does in-house performance of this activity.
4
19 The seasonal fluctuation of activity in this fluctuation makes it diffi-cult to outsource this function.
3
20 There is a sufficient number of available, quality, and reliable pri-vate vendors of this function.
6
21 We anticipate no significant contract administration difficulties ifthis function is contracted out.
3
22 There are significant liability problems in contracting out this func-tion.
1
23 Outsourcing this function results in inventory and procurementproblems for the company.
3
24 Contracting out this function results in significant vendor relationproblems.
6
25 Outside vendors can provide this activity at significant cost savingsto TxDOT.
4
26 Outside vendors may raise their prices without cause after the ini-tial contract period under conditions of outsourcing this function.
6
27 This function should not be outsourced because of the sizeablecapital investment we have in equipment and/or facilities allocatedto this function.
4
28 Contracting out this function results in significant new tasks andresponsibilities for TxDOT.
3
29 This function should be performed in-house because of criticaltechnology we have in this activity that cannot be matched by ven-dors.
2
30 Contracting out this function makes it difficult to maintain control ofthis activity.
3
116

Bibliography
1. Goals & Strategies. TxDOT official website.
2. FHWA, Highway Statistics, State Highway Agency-Owned Public Roads-2006,
http://www.fhwa.dot.gov/policy/ohim/hs06/pdf/hm81.pdf
3. TxDOT work force plan, 2009-13
4. Independent Assessments of Contracting, Project Delivery, and Field Opera-
tions. Deloitte Consulting. 2007
5. Wang, Kuang-cheng. A process view of SWOT analysis. Proceedings of the
51st Annual Meeting of the ISSS, Papers: 51st Annual Meeting, 2007
6. Boguslauskas, Vytautas and Kvedaraviien, Goda. Strategic Outsourcing Plan
and the Structure of Outsourcing Process. 2008
7. Chelikani S and Polineni V.K. The 3 R’s of Offshore Outsourcing. 2001
8. Robertson, Ian and Rothery, Brian. The Truth About Outsourcing. Gower
Publishing Limited. 1995
9. Allen, Joan W. Fall, Mark. Chi. S Keon. Harry, Hatry P. Delvin, Kelvin A.
Materman, Wayne. The Private Sector in State Service Delivery-Examples of
innovative practices. The Urban Institute Press Washington D.C. 1989
10. NCHRP synthesis 277. National Cooperative Highway Research Program.
April 1999. Highway Robbery II. National Association of State Highway and
Transportation Unions report (NASHTU). 2007. NCHRP web document 39,
Innovations in Private Involvement in Project Delivery. National Cooperative
Highway Research Program (NCHRP). 2001.
117

11. FLDOT adopted work program FY2009-2011& FY 2004/05-2008/09. Florida
Department of Transportation. Increased Reliance on Contractors Can Pose
Oversight Challenges for Federal and State Officials, U.S. General Accounting
Office (GAO). 2006.
http://www.gao.gov/new.items/d08198.pdf Accessed 7th January 2009.
12. A National Assessment of Transportation Strategies and Practices: Lessons
for California, Tom Warne and Associates report.2008.
http://www.celsoc.org/userdocuments/File/warne-report.pdf, accessed
on 23rd January 2009.
13. Moore, Adrian T., Geoffrey Segal, and John McCormally. Infrastructure Out-
sourcing: Leveraging Concrete, Steel, and Asphalt with Public-Private Part-
nerships. Policy Study 272. Reason Public Policy Institute. September 2000.
14. A report on 27 in 7 peak performance, How South Carolina is Building 27
Years of Road and Bridge Projects in Just 7 Years. 2008.
http://www.scdot.org/inside/financing.shtml, accessed 20th December
2008.
15. Texas Sunset Advisory Commission report. Texas Turnpike Authority Auto-
mobile Theft prevention Authority. 1996.
16. Prior, John and Ashford, Robert.Outsourcing: A Strategy for the Nineties.
17. McIvor, Ronan. A practical framework for understanding the outsourcing
process. Journal of Supply Chain Management, Vol. 5, Issue 1. 2000.
18. Ponomariov, Branco & Kingsley, Gordon. Applicability of the Normative
Model of Outsourcing in the Public Sector: The Case of a State Transportation
Agency. Public Organizational Review. July, 2008. Strategic Outsourcing
118

Decision Guidebook. NSRP (Advanced Technology Institute as agent for)
and the Altarum Institute. March 29,2002.
19. Wilmot et al. Designing a Comprehensive Model to Evaluate Outsourcing of
Louisiana DOTD Functions and Activities. 2002
20. Rogge et al. Evaluation of Oregon Department of Transportation Project De-
livery. Outsourcing Project Delivery in State Departments of Transportation,
2003.
21. Eger III, Robert J., Deborah A. Knudson, Justin Marlowe, and Libby Og-
ard. Report on Evaluation of Transportation Organization Outsourcing: Deci-
sion Making Criteria for Outsourcing Opportunities. University of Wisconsin.
2002.
22. Johnson et al. Long-term impact and cost-effectiveness of outsourcing, Tx-
DOT report. 1999
23. TxDOT Project Development Manual. 2009
24. TxDOT. Response to sunset advisory commission report. 2008.
http://www.sunset.state.tx.us/81streports/txdot/responses/101.pdf
25. Quality Assurance Team (QAT) Annual Report. 2008.
http://qat.state.tx.us/forms/QualityAssurance_Team\%20Report-FY2008.
26. El Paso MPO. 2007.
http://www.elpasompo.org/TPB_Items/2007/3-23-07/Item\%203c-Attachment.
htm
119

27. Persad, Khali R. and Singh, Prakash.An Analysis of TxDOT’s In-house and
Consultant Preliminary Engineering (PE) and Construction Engineering (CE)
Costs. TxDOT Admin Research Project 0-6581-CT, Task 2. September 2009.
120

Vita
Krishnaprabha Krishnanivas Radhakrishnan was born in Perumbavoor, Ker-
ala, India on 18 May 1983, the daughter of Mr. M. Radhakrishnan and Mrs. K.
Rajamma. She received the Bachelor of Technology degree in Engineering from the
Cochin University of Science and Technology in 2004. She also received a Master
of Business Administration degree from the University of Kerala in 2006. She was
accepted and started graduate studies in the Construction Engineering and Project
Management program at the University of Texas at Austin in August, 2008.
Permanent address: Krishna NivasPulluvazhy, Kerala 683541, India
This thesis was typeset with LATEX† by the author.
†LATEX is a document preparation system developed by Leslie Lamport as a special version ofDonald Knuth’s TEX Program.
121