Copyright 2000 Addison-Wesley Longman CHAPTER 2 The Measurement of Income, Prices, and Unemployment...
29
opyright 2000 Addison-Wesley Longman CHAPTER 2 The Measurement of Income, Prices, and Unemployment It has been said that figures rule the world; m I am quite sure that it is figures which show u whether it is being ruled well of badly -Johann Wolfgang Goethe, 1830
-
date post
21-Dec-2015 -
Category
Documents
-
view
214 -
download
1
Transcript of Copyright 2000 Addison-Wesley Longman CHAPTER 2 The Measurement of Income, Prices, and Unemployment...
Copyright 2000 Addison-Wesley Longman
CHAPTER 2The Measurement of Income,Prices, and Unemployment
It has been said that figures rule the world; maybe.I am quite sure that it is figures which show us whether it is being ruled well of badly
-Johann Wolfgang Goethe, 1830
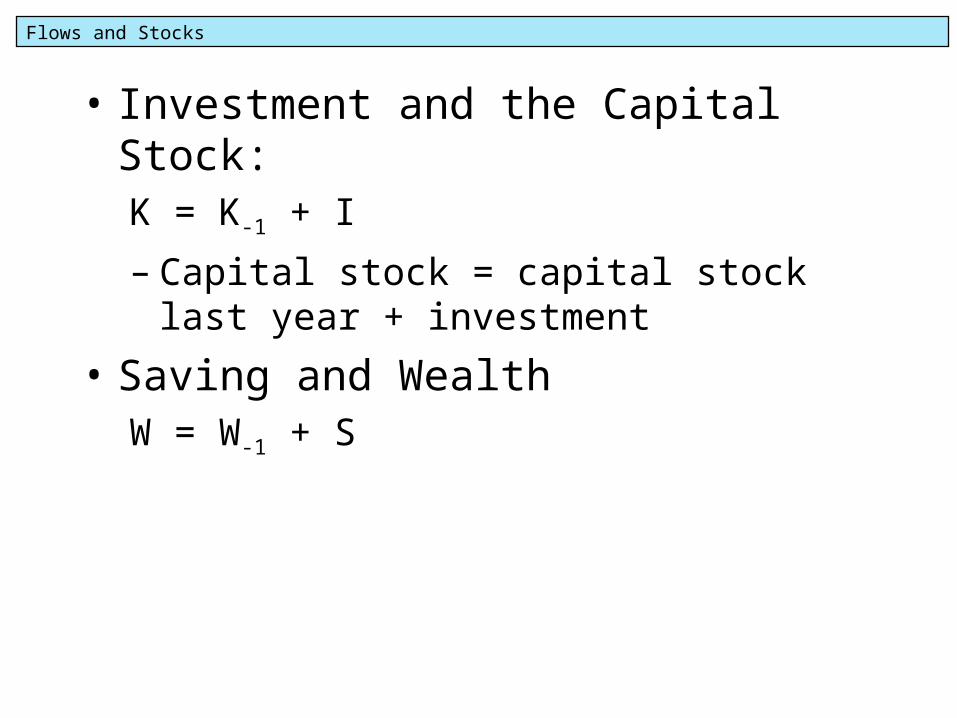
Flows and Stocks
• Investment and the Capital Stock:K = K-1 + I
– Capital stock = capital stock last year + investment
• Saving and WealthW = W-1 + S
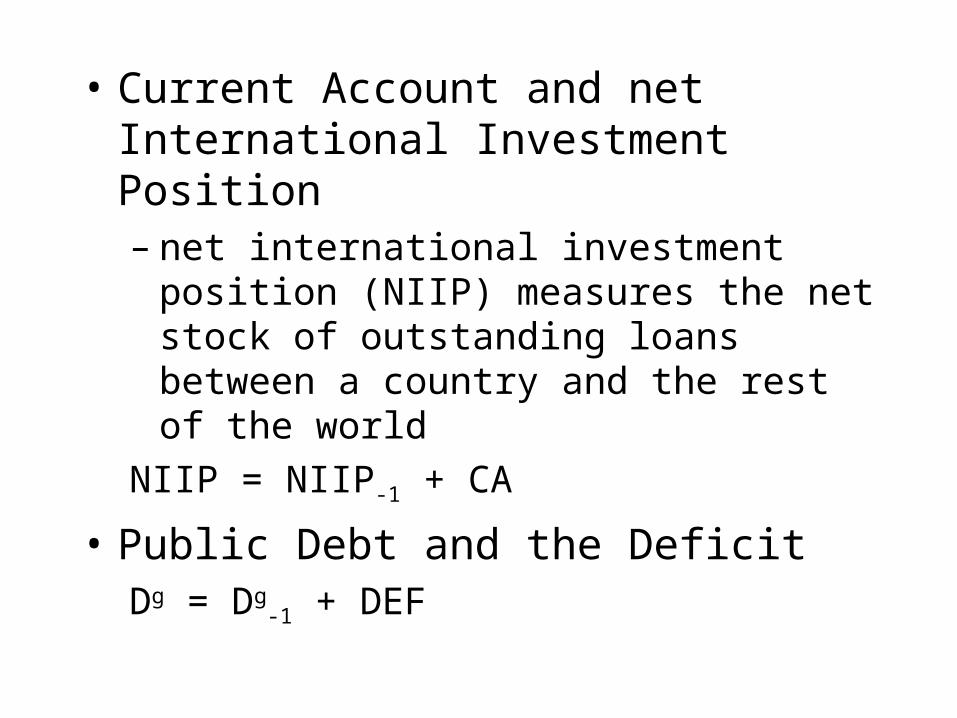
• Current Account and net International Investment Position– net international investment position (NIIP)
measures the net stock of outstanding loans between a country and the rest of the world
NIIP = NIIP-1 + CA
• Public Debt and the DeficitDg = Dg
-1 + DEF

Copyright 2000 Addison-Wesley Longman

National Income Accounting
• Purpose: measure the flow of output; it measures the performance of the economy for purposes of public policy
• Created in the aftermath of the Great Depression, during WWII to determine the capacity of US industry to help fight the war
Copyright 2000 Addison-Wesley Longman
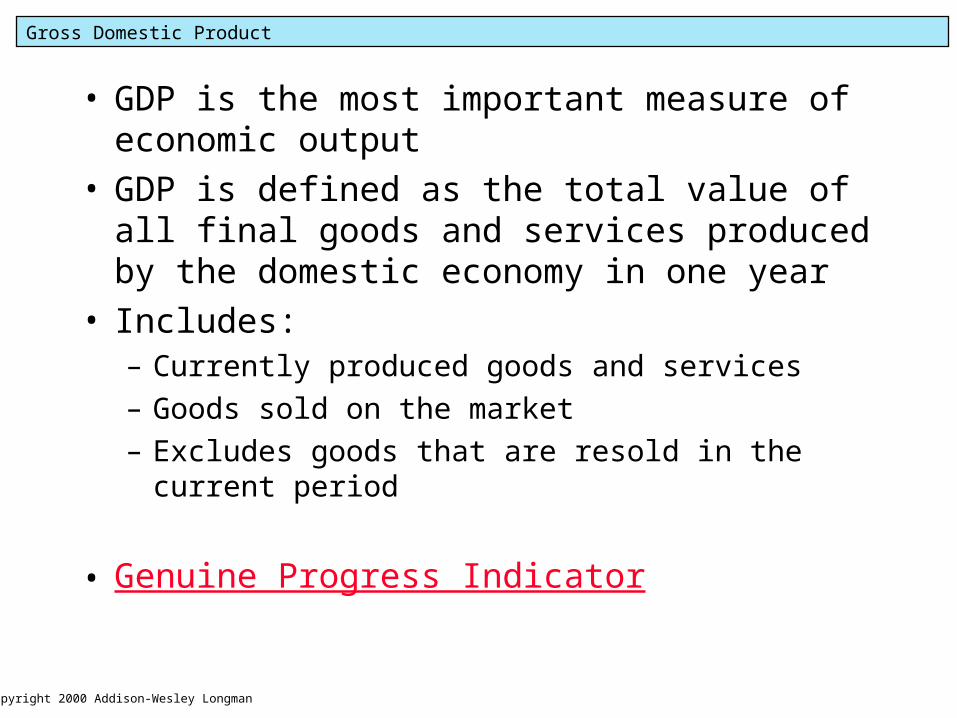
Gross Domestic Product
• GDP is the most important measure of economic output
• GDP is defined as the total value of all final goods and services produced by the domestic economy in one year
• Includes:– Currently produced goods and services
– Goods sold on the market
– Excludes goods that are resold in the current period
• Genuine Progress Indicator

GDP and GNP
• GNP=total value of all goods and services produced by the nation’s citizens
• GNP = GDP + NFP
• NFP (Net Foreign Product) = factor payments to domestic residents abroad minus factor payments to foreigners earned domestically
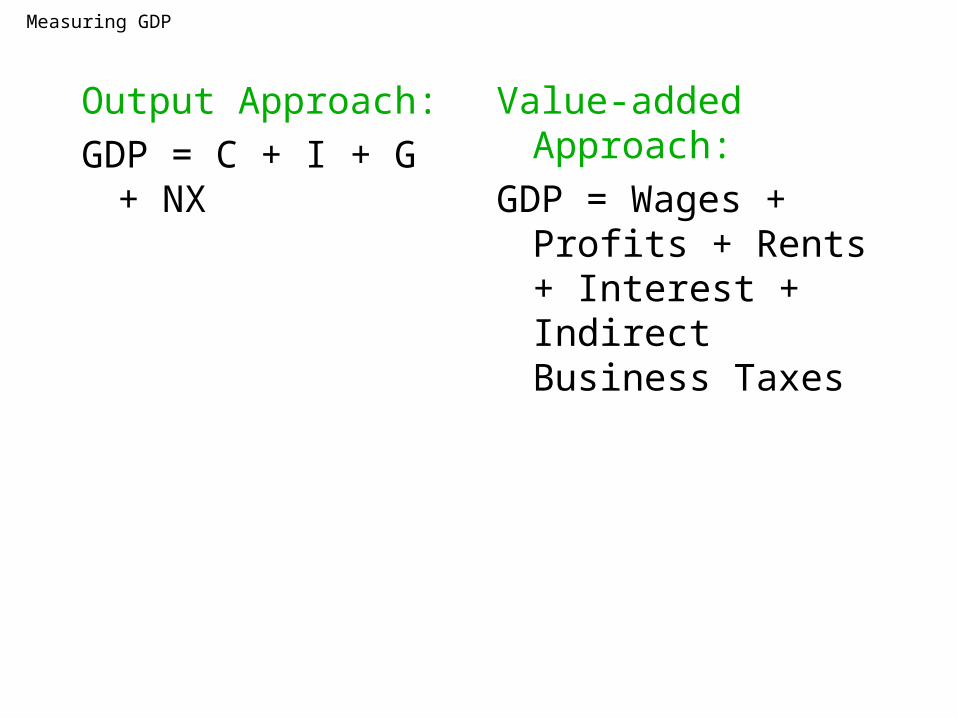
Measuring GDP
Output Approach:
GDP = C + I + G + NX
Value-added Approach:
GDP = Wages + Profits + Rents + Interest + Indirect Business Taxes

Copyright 2000 Addison-Wesley Longman
Figure 2-2 The Contribution of One Loaf of Bread to Consumption Expenditures and Income Created
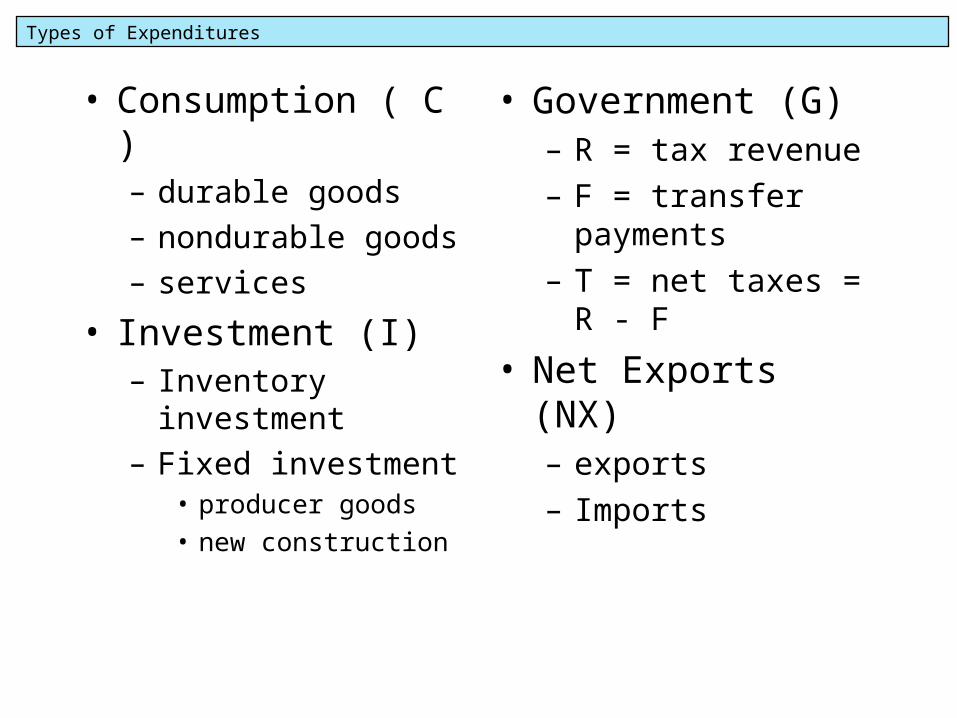
Types of Expenditures
• Consumption ( C )– durable goods
– nondurable goods
– services
• Investment (I)– Inventory investment
– Fixed investment• producer goods
• new construction
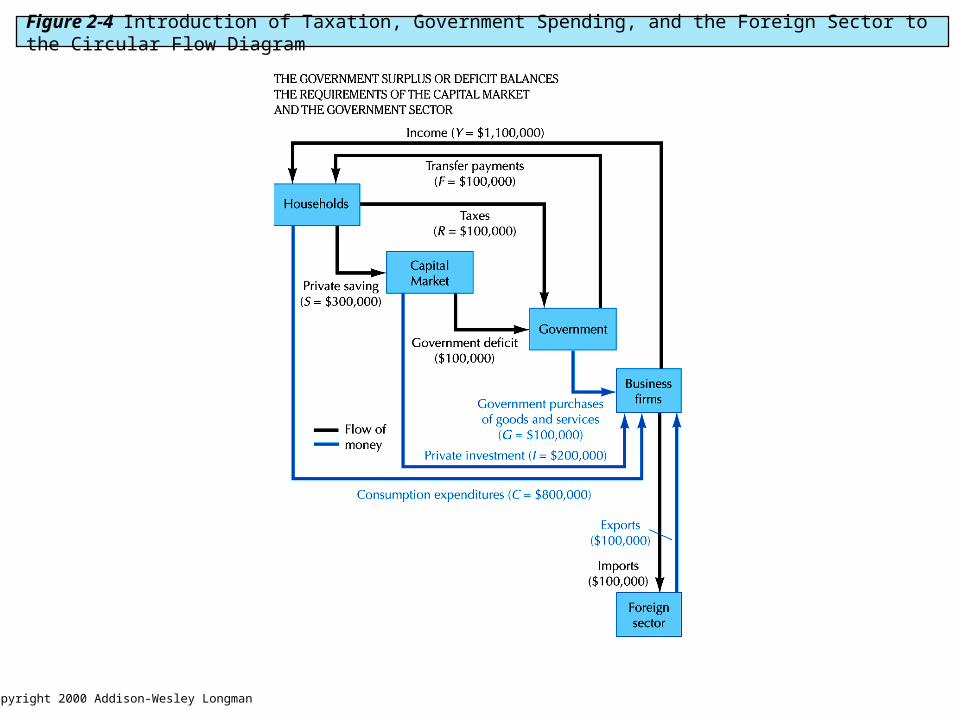
• Government (G)– R = tax revenue
– F = transfer payments
– T = net taxes = R - F
• Net Exports (NX)– exports
– Imports

Copyright 2000 Addison-Wesley Longman
Flow in equations
• Y = C+S+T• E= C+I+G+(NX)• Y=E• C+S+T= C+I+G+
(NX)• S+T= I+G+(NX)
• Saving and taxes (income not consumed equals that part of expenditures that is not consumed
• Leakages=withdrawals from expenditures (income not consumed) S,T, IM
• Injections=expenditures not consumed) I,G, EX
Copyright 2000 Addison-Wesley Longman
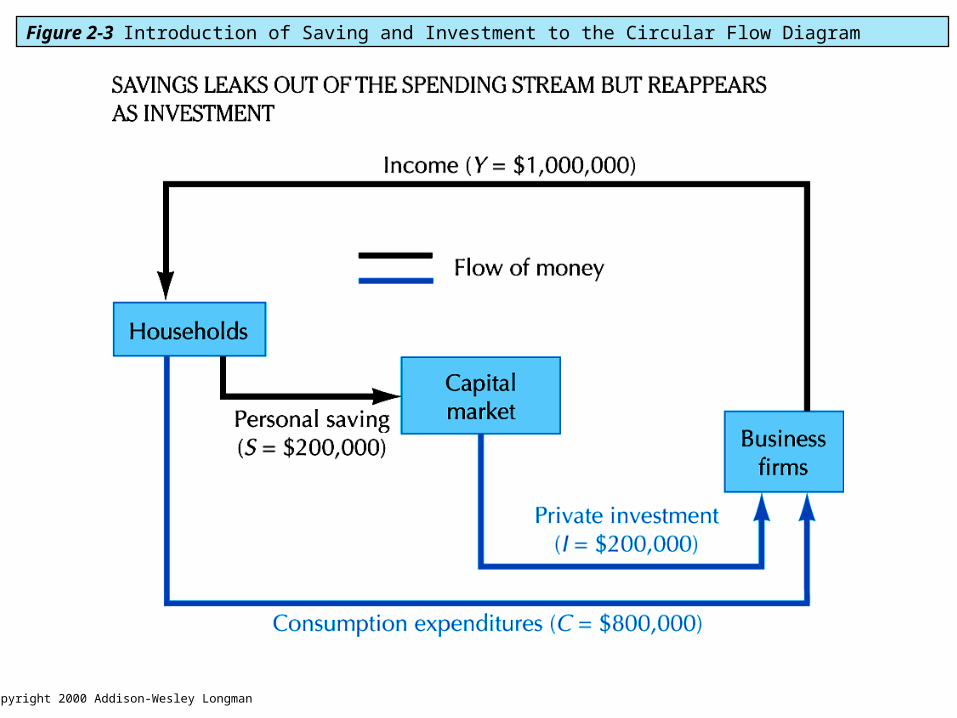
Figure 2-3 Introduction of Saving and Investment to the Circular Flow Diagram
Copyright 2000 Addison-Wesley Longman
Figure 2-4 Introduction of Taxation, Government Spending, and the Foreign Sector to the Circular Flow Diagram
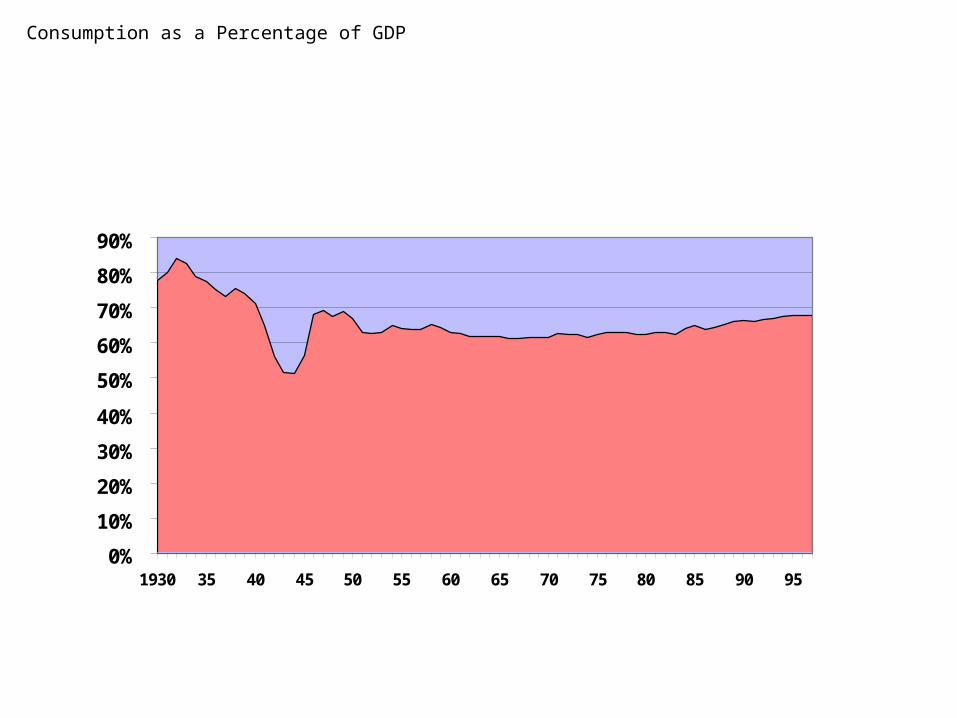
Consumption as a Percentage of GDP
0%
10%
20%
30%
40%
50%
60%
70%
80%
90%
1930 35 40 45 50 55 60 65 70 75 80 85 90 95
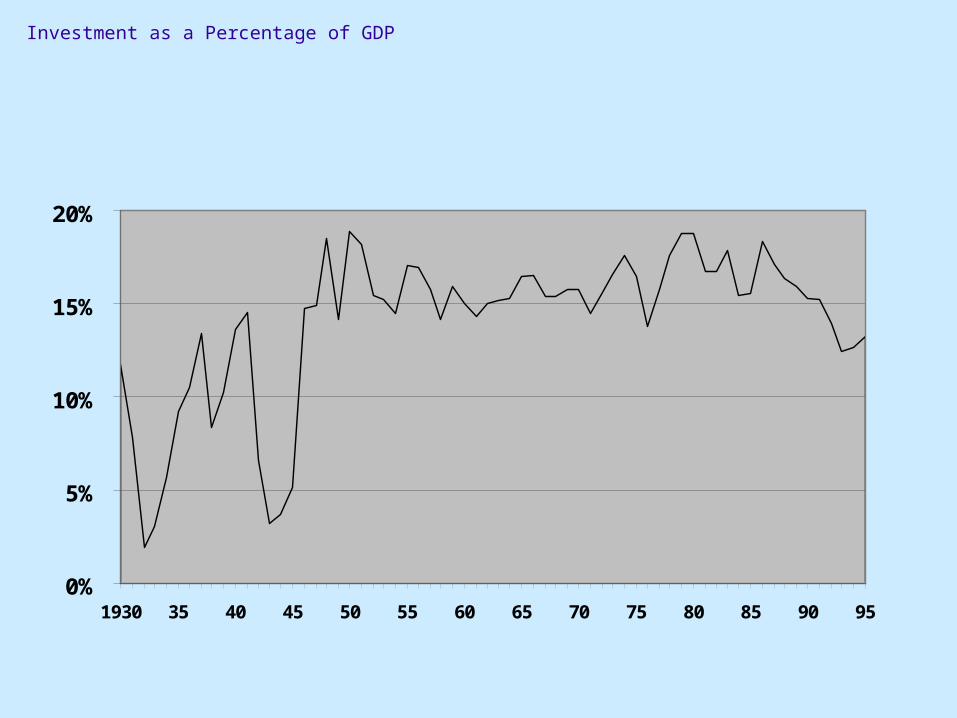
Investment as a Percentage of GDP
0%
5%
10%
15%
20%
1930 35 40 45 50 55 60 65 70 75 80 85 90 95
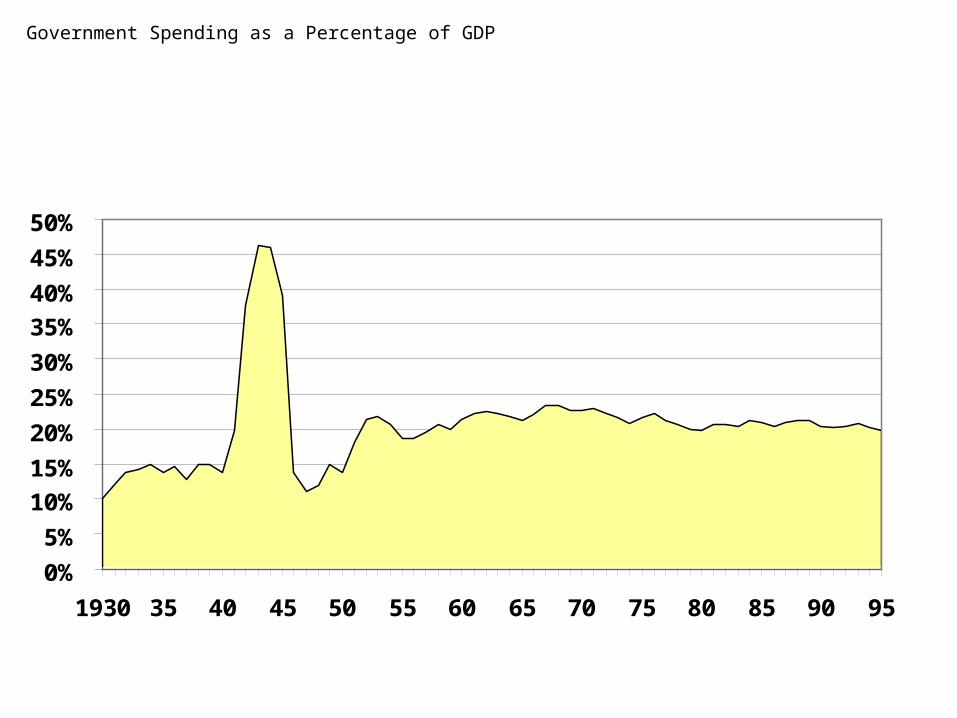
Government Spending as a Percentage of GDP
0%
5%
10%
15%
20%
25%
30%
35%
40%
45%
50%
1930 35 40 45 50 55 60 65 70 75 80 85 90 95
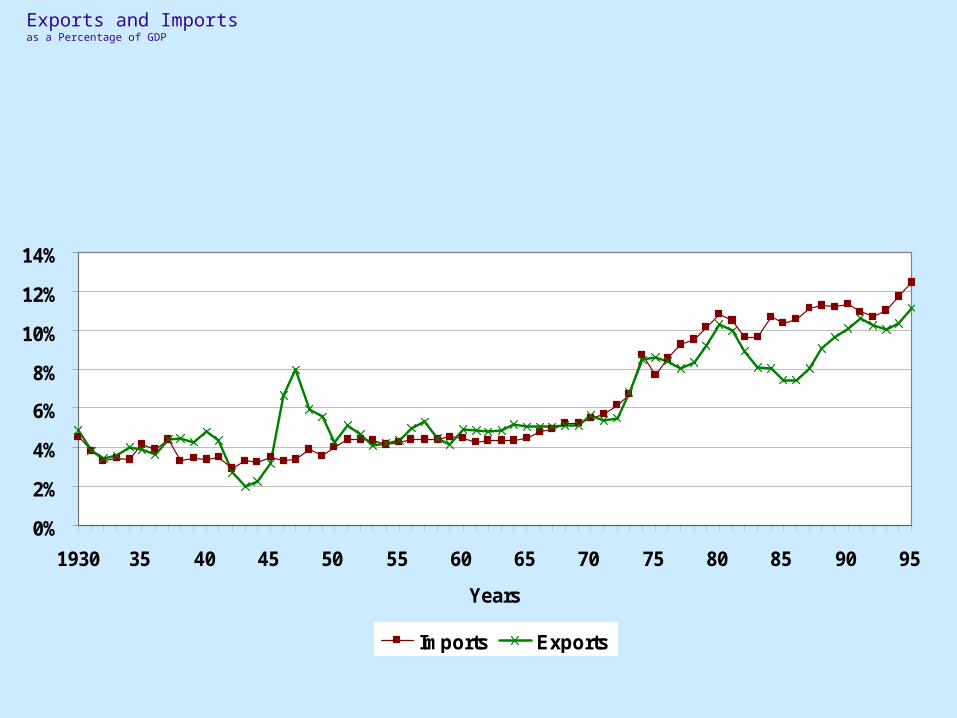
Exports and Importsas a Percentage of GDP
0%
2%
4%
6%
8%
10%
12%
14%
1930 35 40 45 50 55 60 65 70 75 80 85 90 95
Years
Imports Exports
Types of Income
• Compensation
• Corporate Profits
• Proprietor Profits
• Interest
• Rents

Employee Compensation as a Percentage of National Income
0
0.1
0.2
0.3
0.4
0.5
0.6
0.7
0.8
0.9
1
30 35 40 45 50 55 60 65 70 75 80 85 90 95
Years
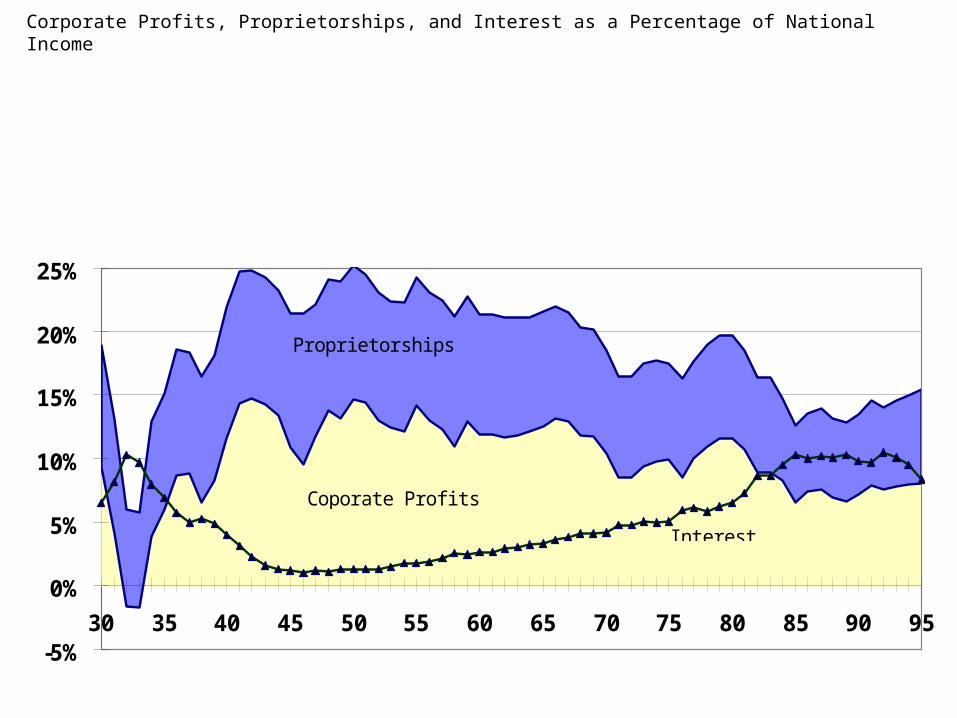
Corporate Profits, Proprietorships, and Interest as a Percentage of National Income
-5%
0%
5%
10%
15%
20%
25%
30 35 40 45 50 55 60 65 70 75 80 85 90 95
Coporate Profits
Interest
Proprietorships

Other Measures of Economic Output
• Net national product (NNP) = GNP - depreciation
• National Income (NI) = NNP - indirect taxes + business transfer payments (gifts, etc)
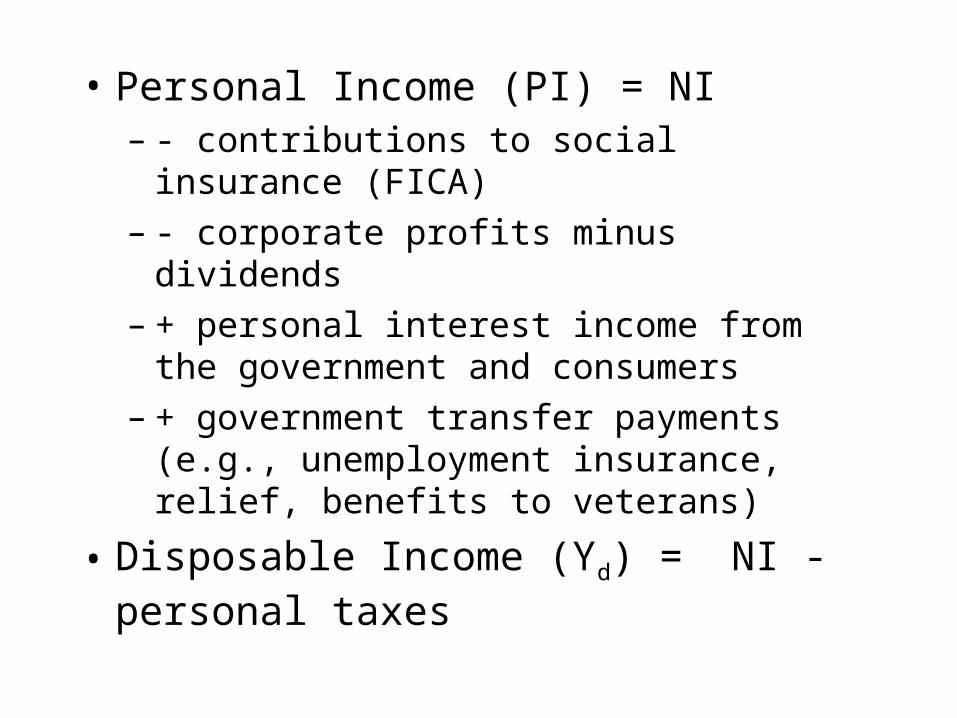
• Personal Income (PI) = NI – - contributions to social insurance (FICA)– - corporate profits minus dividends– + personal interest income from the
government and consumers– + government transfer payments (e.g.,
unemployment insurance, relief, benefits to veterans)
• Disposable Income (Yd) = NI - personal taxes

GDP over time

Copyright 2000 Addison-Wesley Longman
Figure 2-5 Nominal GDP, Real GDP, and the Implicit GDP Deflactor, 1900-98
Copyright 2000 Addison-Wesley Longman
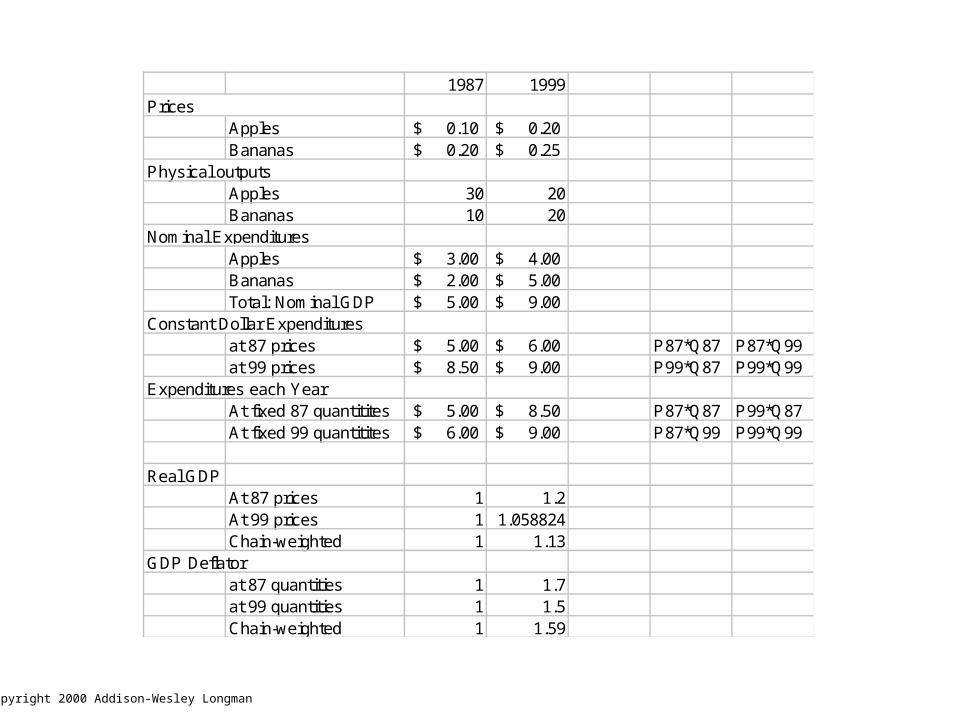
1987 1999
Apples 0.10$ 0.20$ Bananas 0.20$ 0.25$
Physical outputsApples 30 20Bananas 10 20
Apples 3.00$ 4.00$ Bananas 2.00$ 5.00$ Total: Nominal GDP 5.00$ 9.00$
Constant Dollar Expendituresat 87 prices 5.00$ 6.00$ P87*Q87 P87*Q99at 99 prices 8.50$ 9.00$ P99*Q87 P99*Q99
Expenditures each YearAt fixed 87 quantitites 5.00$ 8.50$ P87*Q87 P99*Q87At fixed 99 quantitites 6.00$ 9.00$ P87*Q99 P99*Q99
Real GDPAt 87 prices 1 1.2At 99 prices 1 1.058824Chain-weighted 1 1.13
GDP Deflatorat 87 quantities 1 1.7at 99 quantities 1 1.5
Chain-weighted 1 1.59
Prices
Nominal Expenditures

Copyright 2000 Addison-Wesley Longman
Figure 2-6 The U.S. Ratio of Actual to Natural Real GDP (Y/YN) and the Unemployment Rate, 1956-98
Copyright 2000 Addison-Wesley Longman
Relation Between Unemployment and the Business Cycle
• Okun’s law: for every 2 percent increase in GDP, unemployment falls by 1 percent
Copyright 2000 Addison-Wesley Longman
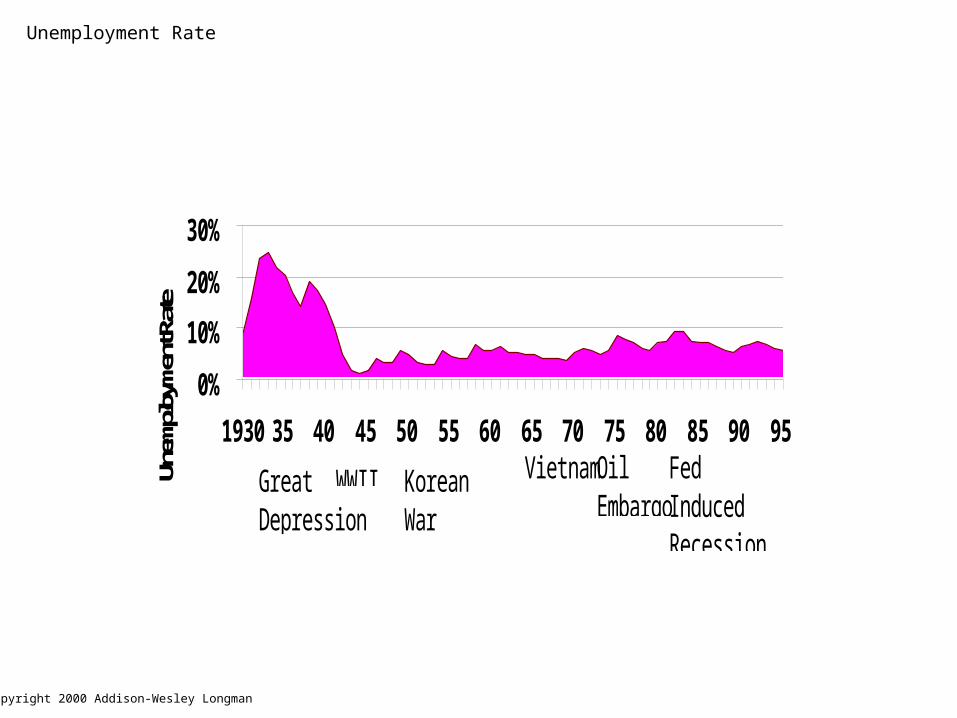
Unemployment Rate
0%
10%
20%
30%
1930 35 40 45 50 55 60 65 70 75 80 85 90 95
Unem
ploym
ent R
ate
Great Depression
WWII VietnamKorean War
Oil Embargo
Fed Induced Recession
Copyright 2000 Addison-Wesley Longman
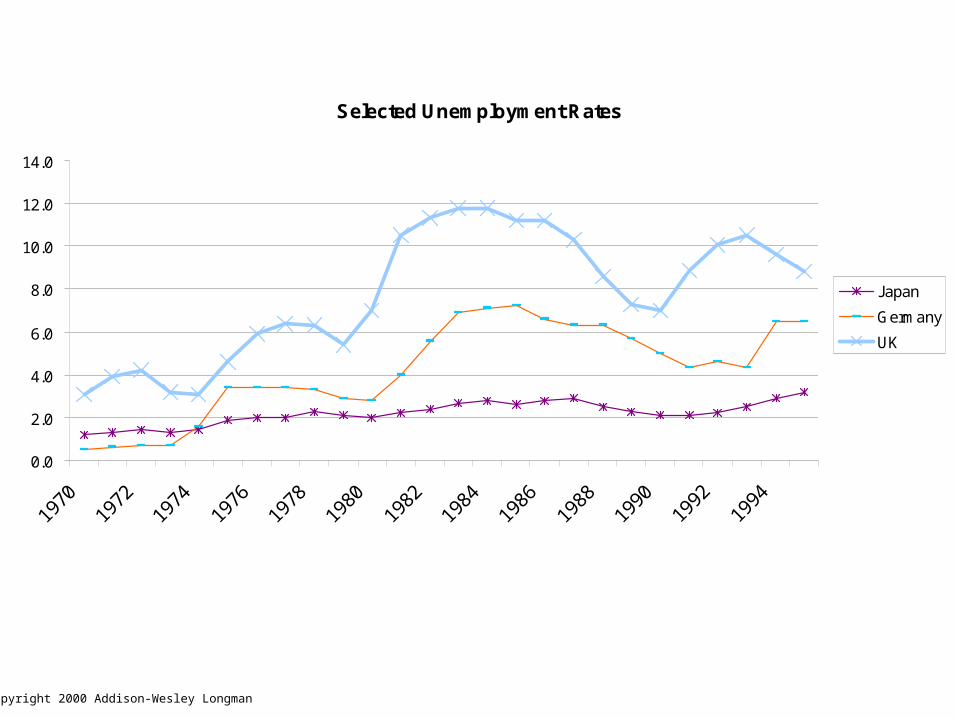
Selected Unemployment Rates
0.0
2.0
4.0
6.0
8.0
10.0
12.0
14.0
197
0
197
2
197
4
197
6
197
8
198
0
198
2
198
4
198
6
198
8
199
019
9219
94
Japan
Germany
UK