Controlled cavitation design and investigation of its ...
88
Graduate Theses and Dissertations Iowa State University Capstones, Theses and Dissertations 2019 Controlled cavitation design and investigation of its effect in Controlled cavitation design and investigation of its effect in traumatic-brain injuries traumatic-brain injuries Alex Wrede Iowa State University Follow this and additional works at: https://lib.dr.iastate.edu/etd Part of the Acoustics, Dynamics, and Controls Commons, and the Biomedical Commons Recommended Citation Recommended Citation Wrede, Alex, "Controlled cavitation design and investigation of its effect in traumatic-brain injuries" (2019). Graduate Theses and Dissertations. 17615. https://lib.dr.iastate.edu/etd/17615 This Dissertation is brought to you for free and open access by the Iowa State University Capstones, Theses and Dissertations at Iowa State University Digital Repository. It has been accepted for inclusion in Graduate Theses and Dissertations by an authorized administrator of Iowa State University Digital Repository. For more information, please contact [email protected].
Transcript of Controlled cavitation design and investigation of its ...

Graduate Theses and Dissertations Iowa State University Capstones, Theses and Dissertations
2019
Controlled cavitation design and investigation of its effect in Controlled cavitation design and investigation of its effect in
traumatic-brain injuries traumatic-brain injuries
Alex Wrede Iowa State University
Follow this and additional works at: https://lib.dr.iastate.edu/etd
Part of the Acoustics, Dynamics, and Controls Commons, and the Biomedical Commons
Recommended Citation Recommended Citation Wrede, Alex, "Controlled cavitation design and investigation of its effect in traumatic-brain injuries" (2019). Graduate Theses and Dissertations. 17615. https://lib.dr.iastate.edu/etd/17615
This Dissertation is brought to you for free and open access by the Iowa State University Capstones, Theses and Dissertations at Iowa State University Digital Repository. It has been accepted for inclusion in Graduate Theses and Dissertations by an authorized administrator of Iowa State University Digital Repository. For more information, please contact [email protected].

Controlled cavitation design and investigation of its effect in traumatic-brain injuries
by
Alex Wrede
A dissertation submitted to the graduate faculty
in partial fulfillment of the requirements for the degree of
DOCTOR OF PHILOSOPHY
Major: Mechanical Engineering
Program of Study Committee:
Nicole Hashemi, Major Professor
Reza Montazami
Travis Sippel
Timothy Bigelow
Donald Sakaguchi
The student author, whose presentation of the scholarship herein was approved by the program
of study committee, is solely responsible for the content of this dissertation. The Graduate
College will ensure this dissertation is globally accessible and will not permit alterations after a
degree is conferred.
Iowa State University
Ames, Iowa
2019
Copyright © Alex Wrede, 2019. All rights reserved.

ii
DEDICATION
This dissertation is dedicated to my cherished family:
My Wife:
Josie Wrede
My parents:
Dan & Jane Wrede
All immediate and extended family and friends
for their relentless love, support, and encouragement.

iii
TABLE OF CONTENTS
Page
LIST OF FIGURES ___________________________________________________________ vi
NOMENCLATURE ___________________________________________________________ ix
ACKNOWLEDGMENTS ______________________________________________________ x
ABSTRACT _________________________________________________________________ xi
CHAPTER 1. INTRODUCTION: CAVITATION PRODUCTION METHODS AND
NEURONAL RESPONSE TO TBI _______________________________________________ 1
1.1 Cavitation Terminology and Applications _____________________________________ 1
1.2 Cavitation Creation and Methodology ________________________________________ 1
1.2.1 Propeller Rotation and Volumetric Flow Methods ___________________________ 2
1.2.2 Controlled Cavitation Methods for Biomedical Applications ___________________ 3
1.3 Known Cellular/Tissue Response to Cavitation _________________________________ 5
1.4 Motivation and Conclusion _________________________________________________ 7
References _________________________________________________________________ 8
CHAPTER 2. CONTROLLED POSITIONING OF MICROBUBBLES AND INDUCED
CAVITATION USING A DUAL-FREQUENCY TRANSDUCER AND MICROFIBER
ADHESION TECHNIQUES ___________________________________________________ 10
Abstract __________________________________________________________________ 10
2.1 Introduction ____________________________________________________________ 11
2.2 Materials and Methods ___________________________________________________ 13
2.2.1 MB Production ______________________________________________________ 13
2.2.2 Controlled MB Positioning Through a Dual-frequency Transducer _____________ 13
2.2.3 Controlled MB Positioning and Collapse Through Adhesion and Resonant
Frequency ______________________________________________________________ 16
2.3 Results ________________________________________________________________ 16
2.3.1 MBs Released from Capillary Tubing ____________________________________ 16
2.3.2 MB Positioning Using Dual-frequency Method ____________________________ 17
2.3.3 MB Positioning and Collapse Using Microfiber Adhesion and Resonant Frequency 19
2.4 Discussion _____________________________________________________________ 20
2.4.1 MB Production ______________________________________________________ 21
2.4.2 MB Positioning Using Dual-frequency Method ____________________________ 22
2.4.3 MB Positioning and Collapse Using Microfiber Adhesion and Resonant Frequency 23
2.5 Conclusions ____________________________________________________________ 23
References ________________________________________________________________ 24

iv
CHAPTER 3. SEEKING INSIGHT ON TBIS BY ANALYZING CAVITATION-INDUCED
DAMAGE OF SOFT POLYMER FILMS _________________________________________ 27
Abstract __________________________________________________________________ 27
3.1 Introduction ____________________________________________________________ 28
3.2 Materials and Methods ___________________________________________________ 29
3.2.1 PDMS Fabrication & Cavitation Apparatus _______________________________ 29
3.2.2 Topography Analytics ________________________________________________ 30
3.3 Results and Discussion ___________________________________________________ 31
3.3.1 3D Confocal Microscopy ______________________________________________ 31
3.3.2 Interferometry ______________________________________________________ 35
3.4 Conclusion ____________________________________________________________ 38
References ________________________________________________________________ 39
CHAPTER 4. CHARACTERIZATION OF ASTROCYTIC RESPONSE AFTER
EXPERIENCING ACOUSTICALLY-INDUCED CAVITATION IN VITRO ____________ 41
Abstract __________________________________________________________________ 41
4.1 Introduction ____________________________________________________________ 42
4.2 Materials and Methods ___________________________________________________ 45
4.2.1 Biocompatibility and Sterilization _______________________________________ 45
4.2.2 Fibrous Frame Fabrication _____________________________________________ 46
4.2.3 Cell Model _________________________________________________________ 47
4.2.4 Visual Morphology Analysis ___________________________________________ 47
4.2.5 Gene Expression Analysis via qPCR _____________________________________ 48
4.3 Results and Discussion ___________________________________________________ 50
4.3.1 Visual Morphology Analysis ___________________________________________ 50
4.3.2 Genetic Analysis via qPCR ____________________________________________ 54
4.4 Conclusion ____________________________________________________________ 57
References ________________________________________________________________ 58
CHAPTER 5. LONGITUDINAL GENETIC STUDY OF REACTIVE ASTROCYTES
INDUCED BY NEARBY CAVITATION _________________________________________ 62
Abstract __________________________________________________________________ 62
5.1 Introduction ____________________________________________________________ 63
5.2 Materials and Methods ___________________________________________________ 65
5.2.1 Cell Model _________________________________________________________ 65
5.2.2 Apparatus Configuration and Methodology _______________________________ 65
5.2.3 Gene Expression Analysis via qPCR _____________________________________ 67
5.3 Results and Discussion ___________________________________________________ 67
5.4 Conclusion ____________________________________________________________ 71
References ________________________________________________________________ 72

v
CHAPTER 6. FUTURE WORK ________________________________________________ 74
References ________________________________________________________________ 75

vi
LIST OF FIGURES
Page
Figure 1.1: Cavitation apparatus schematic and illustration yielding chaotic cavitation in
hydropump applications [10]. ..................................................................................... 2
Figure 1.2: Controlled cavitation via optics, acoustics, and electrophysiological techniques
[3]. .............................................................................................................................. 3
Figure 1.3: (A) Illustration of the complete analytic chamber mounted on the inverted
microscope for live imaging. (B) A zoomed in schematic of the discharge
chamber with neuronal cells seeded symmetrically above and below the
electrodes [13]. ........................................................................................................... 4
Figure 1.4: Cell membrane pore created from nearby cavitation of a single MB [3]. .................... 5
Figure 1.5: Frames A, C, E are experimental samples experiencing both the electronic
shock wave and resulting cavitation. Frames B, D, F highlight the response that
control astrocytes have after experiencing only shock wave exposure, not
cavitation. The samples were exposed to one (A&B), three (C&D), and five
(E&F) shock waves from the electronic circuit [13]. ................................................. 6
Figure 1.6: Microscale tears observed in slices of a rat brain due to cavitation exposure [9]. ....... 7
Figure 2.1: (A) Apparatus for controlled MB positioning and collapse through using a dual-
frequency transducer. The gap between the tip of the capillary tubing and the
ultrasonic transducer was 70mm. The gap between the PCL fibers and the
ultrasonic transducer is 48mm. The MBs are trapped at the focus of the 1.6
MHz outer-transducer (lowermost tip of the dotted lines). The 100 kHz central
transducer is unfocused and is emitting sinusoidal waves. (B) Apparatus of
controlled MB positioning and cavitation through adhesion and resonant
frequency. The gap between the tip of the capillary tubing and the ultrasonic
transducer is 70mm. The gap between the PCL fibers and the transducer is
22.5mm. The MBs are trapped through adhesion to the surface of the PCL
microfibers. ............................................................................................................... 14
Figure 2.2: (A) Air MBs releasing from capillary tubing. (B) Relationship between MB
diameter and corresponding peak-to-peak voltage through the 100 kHz
transducer that is necessary to collapse bubbles. ...................................................... 17
Figure 2.3: Lateral MB positioning using the 1.6 MHz point-focused transducer. ...................... 18
Figure 2.4: Vertical MB positioning using the 1.6 MHz point-focused transducer. The final
image is zoomed upon to show that the MB is clearly within one MB diameter

vii
length (D) from the PCL microfiber. It is estimated that at 4.375 seconds, the
distance between the MB and the PCL microfiber is ~8 µm. .................................. 19
Figure 2.5: Induced cavitation from the resonant frequency that the 100 kHz transducer
provides. The images are captured at 62 f/sec. ......................................................... 20
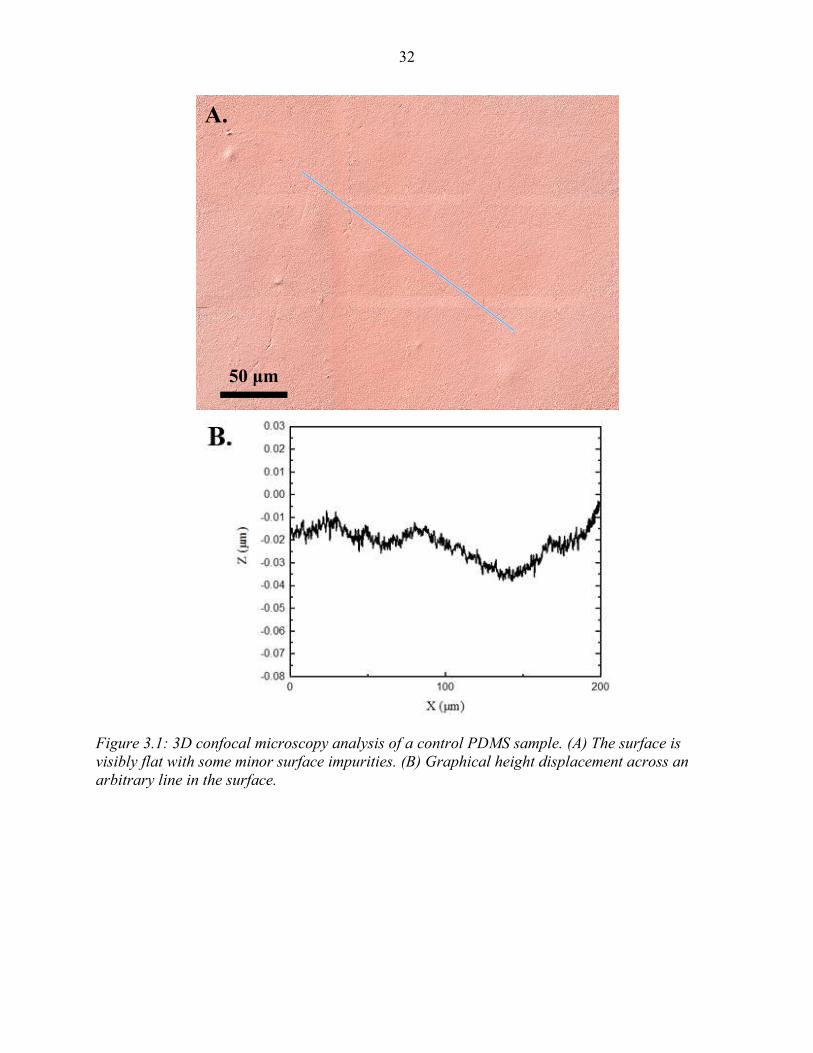
Figure 3.1: 3D confocal microscopy analysis of a control PDMS sample. (A) The surface is
visibly flat with some minor surface impurities. (B) Graphical height
displacement across an arbitrary line in the surface. ................................................ 32
Figure 3.2: 3D confocal microscopy analysis of a typical experimental PDMS sample. (A)
The surface shows patterns of wear that are distinct from the control visual.
There appears to be some minor surface impurities. (B) Graphical height
displacement across an arbitrary line in the surface. ................................................ 33
Figure 3.3: Summary of (A) average Sa, and (B) average Ssk roughness parameters of
control and experimental samples via 3D confocal microscopy techniques.
Error bars represent the standard error of the mean. ................................................ 34
Figure 3.4: Interferometry analysis of a control PDMS sample. (A) The surface is visibly
flat with some minor surface impurities. (B) Graphical height displacement
across an arbitrary line in the surface. Any abrupt spikes in the z direction
appear to be above the surface. ................................................................................. 36
Figure 3.5: Interferometry analysis of an experimental PDMS sample. (A) The surface has a
roughness texture that is visually different that the control images. (B) The
graphical height displacement across an arbitrary line in the surface shows
abrupt spikes in the z direction below the surface, points to signs of cavitation
damage. ..................................................................................................................... 37
Figure 3.6: Summary of (A) average Sa, and (B) average Ssk roughness parameters of
control and experimental samples via interferometry techniques. Error bars
represent the standard error of the mean. ................................................................. 38
Figure 4.1: Apparatus configuration for genetic analysis. Coverslips are suspended using a
mechanical arm that is stationed on a 3-axis stage, allowing for capture of MBs
at arbitrary positions on the coverslip. When the coverslip has an optimal
amount of adhered MBs on its underside, it is rotated 180° so the MBs and
cells are exposed to the ultrasound. .......................................................................... 49
Figure 4.2 (A-C): Illustration of some different arrangements of MBs adhered to healthy
clusters of astrocyte cells during experimentation. Dotted lines are shown to
help outline clusters of cells. Higher magnification of cell morphology via an
inverted microscope is shown in Figure 4.4. These images are taken with the
samples inside the PBS tank. .................................................................................... 51
viii
Figure 4.3: Longitudinal collage showing cavitation on cell-laden microfibers. The samples
are in the PBS tank and pictures are taken with high-speed camera and
telescopic lens. At t=0 the ultrasonic transducer is activated. The later frames
show the dramatic oscillation and collapse of MBs in response to ultrasound
exposure. ................................................................................................................... 51
Figure 4.4: Visual analysis of mouse astrocyte response the cavitation. These images are
captured via an inverted microscope outside of the PBS tank and the sample is
in a cell culture plate. (A) Astrocyte sample before experiencing PBS,
ultrasound, and cavitation exposure. After they are exposed, we visualize their
response immediately after treatment (B), 22 hours after treatment (C), and 48
hours after treatment (D). ......................................................................................... 52
Figure 4.5: Visual analysis of astrocytic response to PBS and ultrasound exposure, but no
exposure to cavitation. This sample is used as a control. (A) Represents the
sample immediately after exposure, (B) represents the sample 22 hours after
exposure, and (C) represents the sample 48 after exposure. .................................... 53
Figure 4.6: Growth analysis 48 hours after control and experimental exposures. Magnitudes
are percentages relative to the area measured immediately after experiencing
control or experimental conditions. Error bars represent ± 1 Standard
Deviation. ................................................................................................................. 53
Figure 4.7: Gene expression analysis of mouse astrocytes immediately after exposure to
surrounding cavitation in the PBS tank. Expressions are represented as a fold
change between the control sample and treatment sample of each targeted
gene. Genes labeled with red bars designate A1 specific genes and genes
labeled with green bars designate A2 specific genes. .............................................. 54
Figure 5.1: Apparatus layout of MB capturing and induced cavitation on cell-laden 6-well
plates. (A) 350-400 MBs are captured and adhered to the bottom of all the cell-
laden culture wells. (B) The 6-well plate is rotated 180° and exposed to the 100
kHz transducer. The transducer is centered above each well individually. When
the transducer is turned on the astrocytes are introduced to surrounding
cavitation. ................................................................................................................. 66
Figure 5.2: Longitudinal gene expression summaries of A1 genes. Error bars represent
standard error of the mean. ....................................................................................... 68
Figure 5.3: Longitudinal gene expression summaries of A2 genes. Error bars represent
standard error of mean. ............................................................................................. 70
Figure 6.1: Microfluidic mold of a size sorting cellular device [2]. ............................................. 74

ix
NOMENCLATURE
CSF Cerebrospinal Fluid
MB Microbubble
PBS Phosphate-Buffered Saline
PCL Polycaprolactone
PDMS Polydimethylsiloxane
qPCR Quantitative Polymerase Chain Reaction
TBI Traumatic Brain Injury

x
ACKNOWLEDGMENTS
I would like to thank my major professor, Dr. Nicole Hashemi, and my committee
members, Dr. Reza Montazami, Dr. Travis Sippel, Dr. Timothy Bigelow, and Dr. Donald
Sakaguchi, for their guidance through the duration of this research.
In addition, I would also like to thank all my current and former lab mates, department
faculty and staff, and mentee students for their time and help on various parts of this research.
Thank you to Marilyn McNamara and Rajeendra Pemathilaka, who have helped me
tremendously throughout multiple facets of this project. I want to also offer my appreciation to
Curtis Mosher for assistance and training with 3D Confocal Microscopy techniques. I thank Dan
Barnard for his help with ultrasonics, Bhavika Patel for her assistance with cell culture
techniques, Stuart Barkley for his help with optics, Jie Luo for his help with biology and qPCR
techniques, and RITEC, Inc. for lending a RAM-5000 power amplification system.
This work was partially supported by the Office of Naval Research (ONR) Grant
N000141612246, ONR Grant N000141712620, and Iowa State University.

xi
ABSTRACT
Traumatic brain injuries (TBIs) are a highly complex injury that is heavily studied in
modern research. An aspect of TBIs that has been almost entirely overlooked is the existence of
cavitation in the brain during a high impact injury. The presence of cavitation in the brain is a
recent theory and is feared to cause detrimental damages on brain tissue. The following chapters
aim to investigate this phenomena by first engineering an apparats that simulates controlled
cavitation for TBI applications. The apparatus that is used in this study involves acoustical
techniques to cause microbubbles (MBs) to oscillate and fragment under resonant conditions,
detailed in Chapter 2. MBs are created by using a syringe to push air through capillary tubing,
resulting in MBs ranging from 50-100 μm. The MBs exit at a consistent rate and arbitrary
amounts are adhered to an analyt sample prior to inducing acoustical cavitation. This method is
advantageous and novel because it allows for arbitrary amounts of cavitation, the size of the
created MBs is similar to that of what is thought to exist in vivo, and it is cost-effective.
Using this developed apparatus, there are a variety of studies that have novel potential.
Chapter 3 highlights the response the soft polymers have to surrounding cavitation. Using 3D
confocal microscopy and interferometry techniques, it is apparent that the soft polymer surface is
visually damaged after cavitation exposure. Further roughness calculations demonstrate distinct
alterations in the overall roughness and skewness of the surface for experimental samples.
Although these soft polymers do not entirely replicate the response to cavitation of the human
brain, they provide insight on how alarming inter-cranial actually is and motivate future studies.
Reactive astrocytes are known to have a large role in the response of the brain after a
TBI. Introducing astrocytes in the developed apparatus is made possible by sterilizing all the
components and using phosphate buffered saline (PBS) as the cavitation medium. Culturing

xii
astrocytes on biocompatible microfibers allows for the investigation of a finite amount of cells.
Chapter 4 illustrates a distinct morphological change that the astrocytes undergo after
experiencing cavitation. Over 48 hours different stages of morphology are represented. Chapter 4
also elucidates genetic changes that astrocytes undergo immediately after cavitation, via
quantitative polymerase chain reaction (qPCR) techniques. Results show alarming upregulation
in various genes that are known to be upregulated in other neurodegenerative diseases. These
findings add additional concern for the damages that cavitation causes on nearby cranial
anatomy. These results also inspired an additional genetic study to characterize the longitudinal
gene expression trend from 0-48 hours post-cavitation, summarized in Chapter 5. This was
primarily an exploratory study to help further investigate the morphological changes that were
found in Chapter 4. In the ten genes that were studied, there was no consistent trend in gene
expression from multiple genes to the next. Future studies aim to include RNA sequencing to
obtain a complete summary on the expression changes in the entire genome.
Taken together, the following chapters summarize the engineering of an applied
apparatus that simulates controlled cavitation in vitro. Introducing soft polymers in this apparatus
yields distinct surface alterations. This apparatus is biocompatible and used to study
morphological and genetic changes in astrocytes. These results are novel and help legitimize the
concerning detriments that cavitation has inside the human skull. Future studies aim to build on
this foundation and continue to bolster the current understanding, therapeutics, and preventative
techniques in TBIs.
1
CHAPTER 1. INTRODUCTION: CAVITATION PRODUCTION METHODS AND
NEURONAL RESPONSE TO TBI
1.1 Cavitation Terminology and Applications
Cavitation is defined as the rapid growth and collapse of MBs in low pressure regions.
Cavitation has been studied for many decades and has been documented to exist in numerous
applications. First, in watercraft propulsion systems cavitation has been proven to exist in the
low pressure regions of a spinning propeller [1]. Second, cavitation has been proven to exist in
hydrodynamic pumping applications. When there is a change of piping diameter there is a low
pressure region downstream of the diameter change for cavitation to form when flow is
introduced [2]. Also, MBs have been used to carry drugs to different areas of the body and when
they arrive to an arbitrary destination they are fragmented, releasing the particular drugs and
creating cavitation [3, 4]. Recent studies have concluded the existence of cavitation in the skull
during a TBI [5-7]. During a TBI, the initial compressive wave travels through the skull from an
outside source and reflects off of the opposite boundary of the skull. This reflection creates
tensile wave that travels in the direction that the initial force came from and creates a low
pressure region in the CSF for cavitation to exist [8]. There is little research that has been done
on in vitro models of cavitation response, hence providing a compelling motivation for future
studies [9].
1.2 Cavitation Creation and Methodology
Several approaches exist on experimentally studying the detriments that cavitation
induces on nearby surfaces.
2
1.2.1 Propeller Rotation and Volumetric Flow Methods
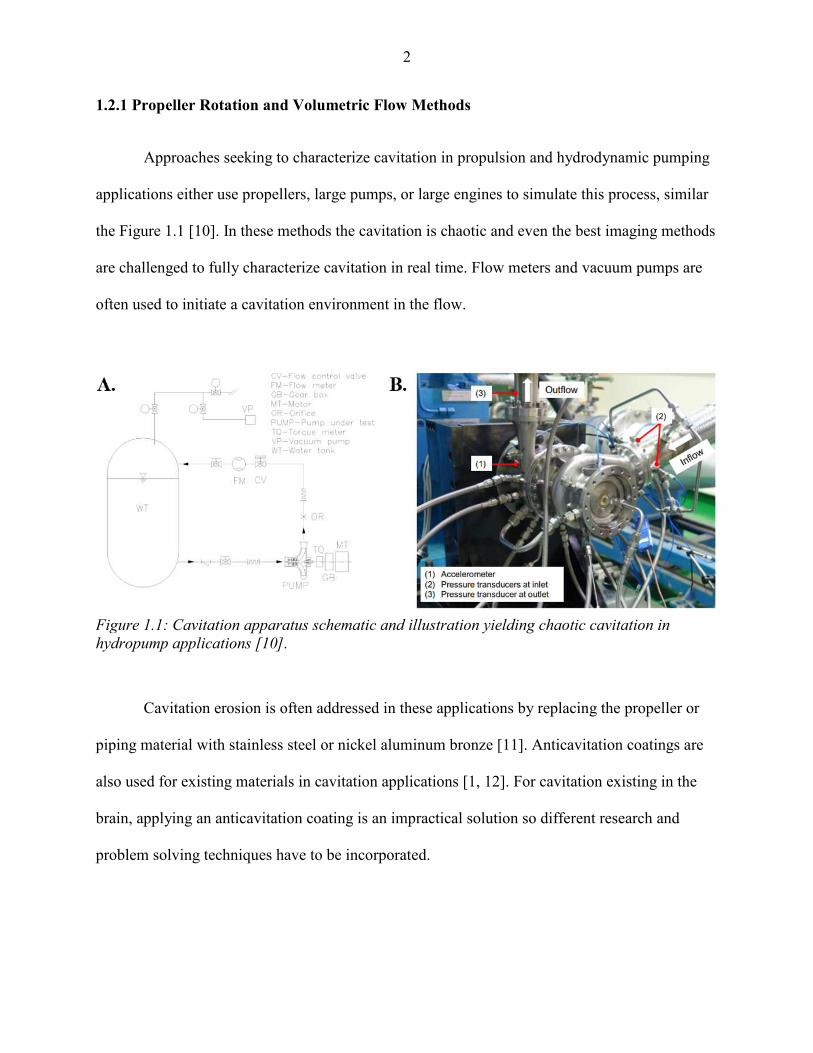
Approaches seeking to characterize cavitation in propulsion and hydrodynamic pumping
applications either use propellers, large pumps, or large engines to simulate this process, similar
the Figure 1.1 [10]. In these methods the cavitation is chaotic and even the best imaging methods
are challenged to fully characterize cavitation in real time. Flow meters and vacuum pumps are
often used to initiate a cavitation environment in the flow.
Cavitation erosion is often addressed in these applications by replacing the propeller or
piping material with stainless steel or nickel aluminum bronze [11]. Anticavitation coatings are
also used for existing materials in cavitation applications [1, 12]. For cavitation existing in the
brain, applying an anticavitation coating is an impractical solution so different research and
problem solving techniques have to be incorporated.
Figure 1.1: Cavitation apparatus schematic and illustration yielding chaotic cavitation in
hydropump applications [10].

3
1.2.2 Controlled Cavitation Methods for Biomedical Applications
Sonoporation is known as the disruption of a membrane via ultrasound. This technique
has been implemented in drug delivery applications by loading a MB with therapeutics and using
acoustical cavitation to fragment and release the treatment once it has reached the desired
location. The damage that this cavitation induces on surrounding cells has been studied using a
dual-frequency transducer, shown in Figure 1.2.
Figure 1.2: Controlled cavitation via optics, acoustics, and electrophysiological techniques [3].
MB generation is conducted using laser induced optical breakdown methods. After MB
create they remained trapped and stable in the fs later beam. A dual-frequency transducer is used
to position and collapse the MBs after they are isolated. The center transducer is used to help
position and direct the MBs to target cells. After the MB position is optimized the outer (donut-
shaped) transducer is used to induce resonant frequency conditions, which ultimately leads to

4
cavitation as the MB oscillates at maximum amplitude. A high speed camera is used in unison
with a long distance microscope to visualize this phenomenon in real time. Voltage clamp
electrodes are used to fix the spheroid cells of interest and monitor the transmembrane-current.
This was ultimately a test to confirm cell viability throughout cavitation and ultrasound exposure
[3]. This method offers a wide range of novelty in the realm of applied cavitation in biomedical
applications. This technique is primarily advantageous at studying cavitation from a small
number of MBs. This technique is also limited to laboratories that have access to the necessary
optical, acoustical, and electrical components. Implementing this novel dual-frequency approach
in a system that is able to produce arbitrary amounts of MBs would be advantageous for future
cavitation studies.
Another cavitation creation approach involves designing an electrical circuit that
generates shock wave bursts, resulting in the formation of MBs that collapse on nearby neuronal
cells [13]. Figure 1.3 illustrates the specific electronic discharge apparatus that is implemented in
this technique.
Figure 1.3: (A) Illustration of the complete analytic chamber mounted on the inverted
microscope for live imaging. (B) A zoomed in schematic of the discharge chamber with neuronal
cells seeded symmetrically above and below the electrodes [13].

5
As the two electrodes discharge they create MBs that rise and collapse on the surface of
astrocytes seeded above. The astrocytes below the electrodes are used as a control, experiencing
the shock wave from the electrical discharge but not experiencing exposure to cavitation. This is
a novel apparatus that simulates cavitation damage on nearby brain cells. The biggest limiting
factor in the application of this apparatus in future TBI studies is the limitation of produced MBs.
Every discharge from the electrodes will produce a set range of MBs that rise to the surface. The
presence of cavitation in the brain is confirmed in literature but the degree to which cavitation
exists is still not fully characterized. Designing a system that allows for arbitrary amounts of
MBs and cavitation exposure would yield additional novelty to this system.
1.3 Known Cellular/Tissue Response to Cavitation
The theory of cavitation being present in skull during a TBI is a modern theology.
Because of this there is limited research characterizing cellular response to cavitation. Previous
studies have looked at ovarian cells and found distinct pores left in the membrane because of
nearby cavitation, illustrated in Figure 1.4 [3]. This is novel research and speaks to the damage
that cavitation has on ovarian cells in therapeutic transport applications. Analyzing the damage
from cavitation of a single MB also gives this study distinct novelty.
Figure 1.4: Cell membrane pore created from nearby cavitation of a single MB [3].
6
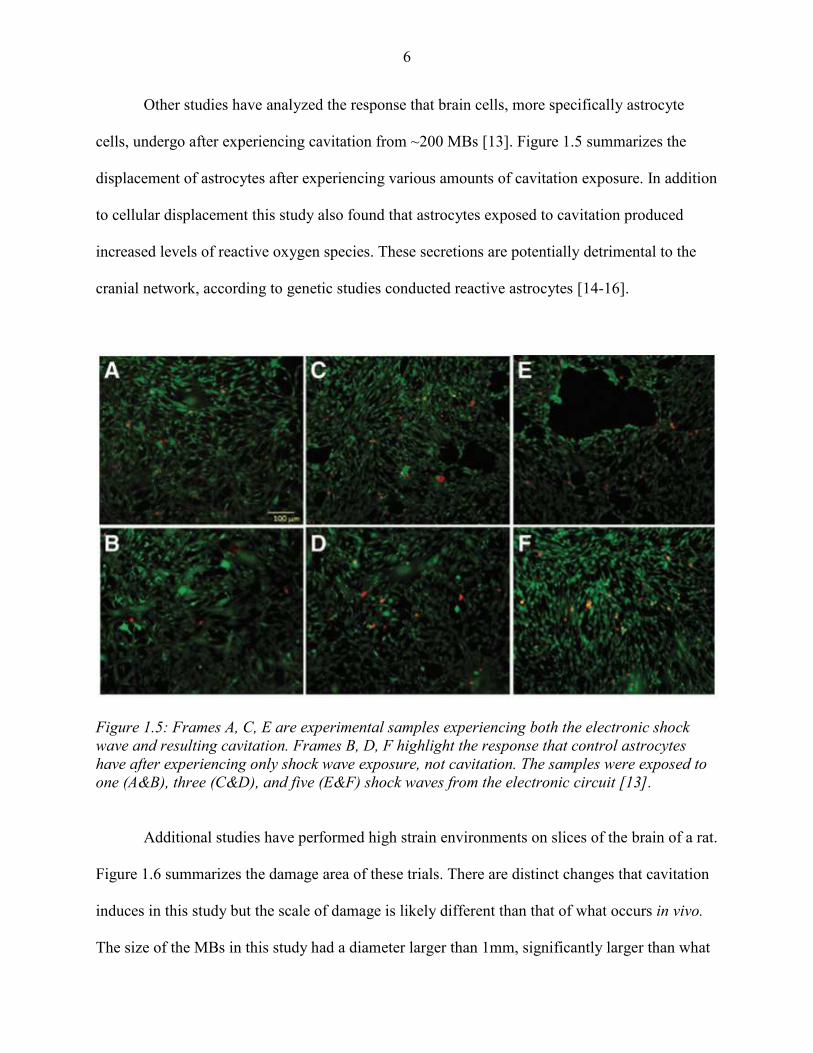
Other studies have analyzed the response that brain cells, more specifically astrocyte
cells, undergo after experiencing cavitation from ~200 MBs [13]. Figure 1.5 summarizes the
displacement of astrocytes after experiencing various amounts of cavitation exposure. In addition
to cellular displacement this study also found that astrocytes exposed to cavitation produced
increased levels of reactive oxygen species. These secretions are potentially detrimental to the
cranial network, according to genetic studies conducted reactive astrocytes [14-16].
Figure 1.5: Frames A, C, E are experimental samples experiencing both the electronic shock
wave and resulting cavitation. Frames B, D, F highlight the response that control astrocytes
have after experiencing only shock wave exposure, not cavitation. The samples were exposed to
one (A&B), three (C&D), and five (E&F) shock waves from the electronic circuit [13].
Additional studies have performed high strain environments on slices of the brain of a rat.
Figure 1.6 summarizes the damage area of these trials. There are distinct changes that cavitation
induces in this study but the scale of damage is likely different than that of what occurs in vivo.
The size of the MBs in this study had a diameter larger than 1mm, significantly larger than what

7
likely happens in vivo. All in all, this study is novel by showing clear damage on cranial anatomy
from cavitation. The damage is noticeable on the microscale for this amplified system. A future
system that expands on this methodology but scales down the pressure magnitude and bubble
size would add additional novelty.
Figure 1.6: Microscale tears observed in slices of a rat brain due to cavitation exposure [9].
1.4 Motivation and Conclusion
Cavitation is known to exist in a wide variety of applications. Apparatus design
considerations for studying cavitation effects in biomedical applications are significantly
different compared to propulsion and hydropump applications. Due to the fact that cavitation
existence in the skull during a TBI is a modern theory, there are limited studies on characterizing
the response of cranial anatomy to this situation. Documented apparatus configurations that
study this interaction introduce novel engineering that helps aid the knowledge of cavitation
existence in the skull, but there are limitations and drawbacks to these methods as well. An
apparatus that builds toward addressing these drawbacks is highlighted in chapter 2.

8
Studies have shown the cell membrane damage in ovarian cells, along with the cell
displacement in astrocyte cells from cavitation. Additional studies have found distinct cavitation
damage in various brain slices of a rat. These are novel studies that help raise awareness and
motivation for further studies to investigate the response that neuronal cells undergo after
exposure to cavitation. The force of cavitation has been consistently measured above the
threshold pressures for brain damage to occur [5]. Because cavitation occurs for such a short
duration, the significance of the damages that it induces on cranial anatomy is nearly entirely
uncharacterized. Genetic and morphological changes of neuronal cells are sought to be
investigated in the next chapters. These studies aim to further elucidate the nature of neuronal
response to cavitation and help answer the various unknowns in this TBI realm.
References
[1] X. Qiao et al., "Outstanding cavitation erosion resistance of hydrophobic
polydimethylsiloxane‐based polyurethane coatings," vol. 136, ed: Journal of Applied
Polymer Science, 2019, p. 47668.
[2] D. Kang and K. Yokota, "Analytical Study of Cavitation Surge in a Hydraulic System,"
vol. 136, ed: Journal of Fluids Engineering-Transactions of the ASME, 2014, p. 101103.
[3] Y. Zhou, K. Yang, J. Cui, J. Y. Ye, and C. X. Deng, "Controlled permeation of cell
membrane by single bubble acoustic cavitation," Journal of Controlled Release, vol. 157,
no. 1, pp. 103-111, 2012.
[4] M. Wang, Y. Zhang, C. Cai, J. Tu, X. Guo, and D. Zhang, "Sonoporation-induced
cell membrane permeabilization and cytoskeleton disassembly at varied acoustic and
microbubble-cell parameters " vol. 8, ed: Scientific Reports, 2018, p. 3885.
[5] J. Goeller, A. Wardlaw, D. Treichler, J. O'Bruda, and G. Weiss, "Investigation of
cavitation as a possible damage mechanism in blast-induced traumatic brain injury," vol.
29, ed: Journal of Neurotrauma, 2012, pp. 1970-1981.
[6] M. B. Panzer, B. S. Myers, B. P. Capehart, and C. R. Bass, "Development of a finite
element model for blast brain injury and the effects of CSF cavitation," vol. 40, ed:
Annals of Biomedical Engineering, 2012, pp. 1530-1544.

9
[7] A. Nakagawa et al., "Shock wave-induced brain injury in rat: Novel traumatic brain
injury animal model," vol. 102, ed: Acta Neurochirurgica Supplements, 2008, pp. 421-
424.
[8] S. Haniff and P. A. Taylor, "In silico investigation of blast-induced intracranial fluid
cavitation as it potentially leads to traumatic brain injury," vol. 27, ed: Shock Waves,
2017, pp. 929-945.
[9] S. Canchi, K. Kelly, Y. Hong, M. A. King, G. Subhash, and M. Sarntinoranont,
"Controlled single bubble cavitation collapse results in jet-induced injury in brain tissue,"
vol. 74, ed: Journal of the Mechanical Behavior of Biomedical Materials, 2017, pp. 261-
273.
[10] S. Hong and C. Choi, "Experimental Study on Cavitation Instabilities of Small
Turbopump for Rocket Engine," vol. 60, ed: The Japan Society for Aeronautical and
Space Sciences, 2017, pp. 230-234.
[11] H. Hiraga, T. Inoue, S. Hirofumi, and A. Matsumawa, "Cavitation erosion mechanism of
NiTi coatings made by laser plasma hybrid spraying," vol. 231, ed: Wear, 1999, pp. 272-
278.
[12] Y. Liu, Z. Hang, N. Xi, H. Chen, C. Ma, and X. Wu, "Erosion-Corrosion Behavior of
HVOF WC-Co Coating in Cl− and SO42− Containing Solutions," vol. 431, ed: Applied
Surface Science, 2018, pp. 55-59.
[13] S. Sun, J. Kanagaraj, L. Cho, D. Kang, S. Xiao, and M. Cho, "Characterization of
Subcellular Responses Induced by Exposure of Microbubbles to Astrocytes," vol. 38, ed:
Journal of Neurotrauma, 2015, pp. 1-8.
[14] S. A. Liddelow et al., "Neurotoxic reactive astrocytes are induced by activated
microglia," vol. 541, ed: Nature, 2017, pp. 481-487.
[15] S. A. Liddelow and B. A. Barres, "Reactive Astrocytes: Production, Function, and
Therapeutic Potential," vol. 46, ed: Immunity, 2017, pp. 957-967.
[16] J. L. Zamanian et al., "Genomic Analysis of Reactive Astrogliosis," vol. 32, ed: Journal
of Neuroscience, 2012, pp. 6391-6410.

10
CHAPTER 2. CONTROLLED POSITIONING OF MICROBUBBLES AND INDUCED
CAVITATION USING A DUAL-FREQUENCY TRANSDUCER AND MICROFIBER
ADHESION TECHNIQUES
Modified from a manuscript published in Ultrasonics Sonochemistry
Alex H. Wrede1, Aarthy Shah1, Marilyn C. McNamara1, Reza Montazami1,2, and Nicole N.
Hashemi1,2*
1 Department of Mechanical Engineering, Iowa State University, Ames, Iowa 50011, USA
2 Center for Advanced Host Defense Immunobiotics and Translational Comparative Medicine,
Iowa State University, Ames, IA 50011, USA
Abstract
We report a study on two methods that enable spatial control and induced cavitation on
targeted microbubbles (MBs). Cavitation is known to be present in many situations throughout
nature. This phenomena has been proven to have the energy to erode alloys, like steel, in
propellers and turbines. It is recently theorized that cavitation occurs inside the skull during a
traumatic-brain injury (TBI) situation. Controlled cavitation methods could help better
understand TBIs and explain how neurons respond at moments of trauma. Both of our
approaches involve an ultrasonic transducer and bio-compatible polycaprolactone (PCL)
microfibers. These methods are reproducible as well as affordable, providing more control and
efficiency compared to previous techniques found in literature. We specifically model three-
dimensional spatial control of individual MBs using a 1.6 MHz transducer. Using a 100 kHz

11
transducer, we also illustrate induced cavitation on an individual MB that is adhered to the
surface of a PCL microfiber. The goal of future studies will involve characterization of neuronal
response to cavitation and seek to unmask its linkage with TBIs.
2.1 Introduction
Cavitation refers to the spontaneous growth and collapse of MBs in low pressure regions.
This process is currently used in a variety of areas, to mix fluids and eliminate impurities [1], as
well as in specific drug delivery[2], gene therapy[3], and thrombolysis [4]. Previous research has
also linked cavitation as a contributing factor in the exfoliation of graphene [5, 6]. Additionally,
cavitation has been shown to produce shock waves that have erosive effects on objects such as
turbines and propellers [7-9]. Cavitation has also shown to produce a wide range of bioeffects.
Previous studies sought out to identify cell damage that occurs in the midst of ultrasound therapy
via calcium signaling processes [10]. On top of this, interested parties suspect that cavitation
occurs inside the skull of TBI victims and its aftermath is leaving a profound impact [11-14].
Generation and characterization of controlled cavitation is critical to understand the cellular
mechanisms of TBIs. These understandings can lead to better treatment that improves the quality
of life for TBI victims, or it can even help launch preventative techniques that reduce the chance
of a TBI altogether. In this study we use capillary tubing and an ultrasonic transducer to create
two cost-effective methods for controlled cavitation. Our expectation is that these methods will
be advantageous and applicable in future studies that focus on studying and understanding on the
effects that cavitation has on nearby surfaces, like neurons in a TBI situation.
Acoustic cavitation occurs when the instantaneous pressure is negative, and a process of
nucleation takes place [15]. Upon collapse of these MBs, micro jets form, localizing impact and

12
force, causing damage to nearby surfaces[16]. This phenomenon is most visible in propellers,
where the turbulent force of moving water creates areas of extreme low pressure, and over a
period of time the blades experience significant erosion due to the repetitive impact of the
cavitation shock waves [17]. There has been various techniques used in previous studies to study
cavitation.
Acoustic, hydrodynamic, and optical methods have been implemented in previous studies
to generate cavitation. In acoustic cavitation, ultrasonic waves are used to create cavitation,
however previous methods do not have arbitrary control in the quantity of produced MBs and the
specific location of their collapse is variant [18]. In hydrodynamic cavitation, fluid flows through
an orifice, which increases the velocity and subsequently lowers threshold pressure so that
nucleation occurs at the point of entry. With this method, vast amounts of MBs are generated,
preventing the ability to analyze the effects of finite cavitation [19]. In optical induced
cavitation, an intense energy is introduced to the system (laser), creating a stream of MBs in the
beam of the laser. While this method is practical in creating controlled amounts of MBs, lasers
are expensive and not accessible for a lot of research groups. Our approach is economical and
offers a modification to the acoustic method to ultimately create a controlled environment to
observe the effects of cavitation.
We introduced MBs into a water tank at a controlled size by pushing air through capillary
tubing. We implemented two separate techniques to arbitrarily trap and position the MBs before
induced cavitation. Our first method involves the use of a dual-frequency transducer [20]. The
second method involves the MBs adhering to the surface of finely positioned PCL microfibers as
they rise in solution. Using these techniques we were able to create, position, and collapse a
finite number of MBs, as well as successfully illustrate live cavitation. These approaches are

13
reproducible as well as affordable, providing more controlled and efficient techniques for
cavitation studies.
2.2 Materials and Methods
2.2.1 MB Production
Capillary tubing with an inner diameter of 5 µm and an outer diameter of 360 µm
(Molex, Lisle, IL), was used to produce the MBs. The tubing was attached to a 3 mL luer-lock
syringe filled with air using a tubing adapter (Idex, Lake Forest, IL). A syringe pump
(GenieTouch, Kent Scientific, Austin, TX) was used to plunge the syringe at a constant rate,
allowing for the constant release of consistent sized MBs. The accuracy of all measurements
were within ~2.7 µm due to the resolution of our imaging techniques. Sections 2.2.2 and 2.2.3
overview controlled cavitation via the dual-frequency method and via adhesion and resonant
frequency, respectively. This orientation is followed throughout the Materials and Methods,
Results, and Discussion sections.
2.2.2 Controlled MB Positioning Through a Dual-frequency Transducer
Figure 2.1A represents the experimental setup for controlled MB positioning through the
incorporation of a dual-frequency transducer. A 1.5 gallon tank filled with deionized water was
used to house the existing components. This method was established through a developed study
[20] which involves a point-focused, donut-shaped, (inner diameter of 14 mm and outer diameter
of 30 mm, focal distance of 48mm) ultrasound transducer with a center frequency of 1.6 MHz
(ndtXducer, LLC, Northborough, MA). The transducer emitted brief ultrasound pulses to trap the
MBs at the focus without collapsing them. The dual-frequency transducer is suspended in mid-

14
solution through the attachment with a 3-axis adjustable stage (MT1, Thor Labs, Newton, New
Jersey). This stage allows 3D arbitrary movement of the transducers, which ultimately leads to
3D spatial control over MBs after they are trapped. PCL microfibers (Hashemi Lab, Iowa State
University, Ames, IA) were placed above the capillary tubing and at the focal point of the
transducer. There are three main reasons that the PCL microfibers were chosen to be used for
this method. First, they have a delicate nature[21], allowing minimal disruption to the MBs and
pressure field induced by the transducer upon entrapment. Second, they are used as a point of
reference during the characterization of MB positioning. Lastly, these microfibers are known for
their biocompatibility and potential in many future studies[22]. When not in simulation, the
microfibers were preserved in ethanol to prevent infection and swelling. With the transducer
focused at the level of the PCL microfibers and in line with the rising MBs, we were able to
consistently trap and isolate individual MBs next to the PCL microfibers.
Figure 2.1: (A) Apparatus for controlled MB positioning and collapse through using a dual-
frequency transducer. The gap between the tip of the capillary tubing and the ultrasonic
transducer was 70mm. The gap between the PCL fibers and the ultrasonic transducer is 48mm.
The MBs are trapped at the focus of the 1.6 MHz outer-transducer (lowermost tip of the dotted
lines). The 100 kHz central transducer is unfocused and is emitting sinusoidal waves. (B)
Apparatus of controlled MB positioning and cavitation through adhesion and resonant
frequency. The gap between the tip of the capillary tubing and the ultrasonic transducer is
70mm. The gap between the PCL fibers and the transducer is 22.5mm.

15
The central transducer induces oscillation on the MBs which ultimately leads to their
collapse. The resonant frequency of a MB refers to the frequency at which it oscillates at a
relative maximum amplitude[23]. When a MB oscillates with enough magnitude, it begins to
fragment into smaller MBs, creating cavitation[24]. Equation 1 represents the necessary
calculation to find the resonant frequency of a MB with a known radius:
�� = 2π�3γ� + 2σ � − 2σ �ρ ��
In this calculation, f0 represents the first resonant frequency, R0 designates the nominal
bubble radius, ρ is the suspending mass density, γ denotes the gas phase polytropic constant, P0
is the ambient pressure, and σ symbolizes the surface tension [25]. The size of the MBs
generated through the capillary tubing ranged from 50-100 µm in diameter throughout our study.
Plugging in the necessary parameters for Equation 1, a MB with a 60 µm diameter will oscillate
at a resonant frequency of ~100 kHz. We decided to use a 100 kHz transducer (diameter of
45mm, unfocused) (Olympus, Waltham, MA) to achieve dramatic oscillation near the resonant
frequency for 50-100 µm MBs. Since prior studies have shown the effectiveness of simultaneous
dual-frequency functionality [20], it was ignored in this study. Our motivation is to demonstrate
that a dual-frequency transducer would be effective through the combination of our positioning
and cavitation results. The transducers were driven by a power amplifier (RAM-5000, Ritec,
Warwick, RI). The magnified high-speed analysis was achieved by using a long distance
microscope (Model K2, Infinity Photo-Optical Company) in unison with a high speed camera for
imaging (BlackFly, FLIR).
(1)

16
2.2.3 Controlled MB Positioning and Collapse Through Adhesion and Resonant Frequency
The second method of controlled MB positioning and collapse is represented in Figure
2.1B. PCL microfibers are also used in this approach and they are advantageous due to their
ability to be adhesive to rising air bubbles. As the rising MBs came in contact with the PCL
microfibers, they adhered to its surface. The PCL microfiber scaffold is suspended in mid-
solution through the attachment with a 3-axis adjustable stage (MT1, Thor Labs, Newton, New
Jersey). Three-dimensional control over the position of the scaffold allows for arbitrary control
over the magnitude and position of trapped MBs. The transducer used in this approach is
primarily to induce cavitation and has no influence on trapping and positioning of MBs. A 100
kHz transducer is also used in this method to accommodate resonant frequency conditions. The
100 kHz transducer is placed 22.5mm (1/2 transducer diameter) above the PCL microfibers to
maximize oscillation. The ultrasonic transducer was driven by a power amplifier (RAM-5000,
Ritec, Warwick, RI). The high-speed analysis was achieved by using a long distance microscope
(Model K2, Infinity Photo-Optical Company) in unison with a high speed camera for imaging
(BlackFly, FLIR).
2.3 Results
2.3.1 MBs Released from Capillary Tubing
Using different flow rates on the syringe pump, different sized bubbles can be generated.
The rate at which MBs exit the capillary tubing can also vary. Figure 2.2A shows MBs releasing
from the capillary tubing at ~50 µm in diameter. This particular trial was operating with a flow

17
rate of 100 µL/min on the syringe pump and they released from the capillary tubing at a rate of
50 MB/min. As the MBs increased in size, they required a greater pressure to collapse them. To
create a greater pressure, the amplification of voltage to the transducer must also increase.
Figure 2.2B represents the necessary peak-to-peak voltage to fragment MBs with varying sizes.
In other words, 100 kHz is approximately the resonant frequency of a 60 µm MB but it can
induce cavitation on similar sized MBs if the operating voltage is varied. Varying the operating
voltage also varies the acoustical pressure that is induced on the MBs.
Figure 2.2: (A) Air MBs releasing from capillary tubing. (B) Relationship between MB diameter
and corresponding peak-to-peak voltage through the 100 kHz transducer that is necessary to
collapse bubbles.
2.3.2 MB Positioning Using Dual-frequency Method
Previous studies have shown that the impact of cavitation is most significant when the
space between the MB and target material (D) is less than the diameter of the MB (d). The
cavitation effects are greatly reduced when this ratio (D/d) increases [20]. Figure 2.3
demonstrates the ability of the point-focused transducer to trap and suspend a MB in mid-

18
solution through a pulsed signal (central frequency 1.6 MHz, 20 cycles, pulse repetition
frequency 238 Hz, 250Vpp). Arbitrarily adjusting the 3-axis stage allowed for MB positioning
toward the PCL microfiber. The MBs in Figure 2.3 are moving at approximately 30 µm/sec until
they are held stationary when D<d. This was a typical speed for our trials because the MBs
would often escape the focal region of the transducer if the adjustable stage was moved at a
faster rate.
Figure 2.3: Lateral MB positioning using the 1.6 MHz point-focused transducer.
After the MBs were directed D<d away from the target material, our apparatus also had
arbitrary control over the vertical depth that the MBs resided in mid-solution. Figure 2.4 shows
the vertical dimension of the MB being adjusted as it remains D<d away from the PCL
microfiber (central frequency 1.6 MHz, 20 cycles, pulse repetition frequency 238 Hz, 250 Vpp).
The MBs are less resistive to ascent in solution compared to movement in any other direction
because of their buoyancy. The MBs represent this tendency in Figure 2.4 as they rise around 75
µm/sec.

19
Figure 2.4: Vertical MB positioning using the 1.6 MHz point-focused transducer. The final
image is zoomed upon to show that the MB is clearly within one MB diameter length (D) from
the PCL microfiber. It is estimated that at 4.375 seconds, the distance between the MB and the
PCL microfiber is ~8 µm.
2.3.3 MB Positioning and Collapse Using Microfiber Adhesion and Resonant Frequency
Having complete control over the position of the PCL microfiber scaffold allowed for
arbitrary control over the magnitude and position of trapped MBs. The scaffold is placed directly
above the path of rising MBs and “catches” any MBs that come in contact with the PCL
microfiber surface. After the MBs are trapped at desired locations, the scaffold is moved away
from the rising MBs to eliminate any disturbance on the controlled environment. The 100 kHz
transducer is then centered above the scaffold and used to induce cavitation (4 cycles, pulse
repetition frequency 59 Hz, 100 Vpp). Figure 2.5 captures this phenomena at high speed. After
16 ms the original MB is shown to fragment into three smaller MBs, illustrating cavitation.

20
Figure 2.5: Induced cavitation from the resonant frequency that the 100 kHz transducer
provides. The images are captured at 62 f/sec.
2.4 Discussion
Although it is suspected that MBs form and collapse to create cavitation inside the skull
during TBI situations [11], there is no direct research to understand the neuronal response to this
phenomena. This research could be the underlying building block that is used to answer
questions about the nature of TBIs and the symptoms that they endow. Generating controlled
cavitation is the first step to simulating these responses. Previous methods for the creation of
cavitation are uncontrolled, and/or uneconomical. In this study, we developed a novel approach
combining microfluidic and acoustical methods to create economical controlled cavitation. This
approach offers intriguing potential for future studies to analyze the effects that cavitation has on
surrounding materials. The PCL microfibers used in this study have been shown to successfully

21
sustain living cells in previous research[22], which provides direct opportunity for bio-medical
applications in future research.
2.4.1 MB Production
We were able to generate MBs at a consistent rate, with the size of 50-100 µm. The
generated MBs released from the tubing at a constant size throughout each trial but a given set of
experimental parameters did not always produce the same size MBs from one trial to the next.
This was not critical, though, because the size of the MBs remained within 50-100 µm, the range
at which we hoped to produce for applications previously listed. Also, for our study it was more
important to get constant release of MBs with similar sizes than to have a narrow tolerance on
the size variance from one trial to the next. A possible reason for the variability in size might be
due to the erosion on the capillary tubing inside the luer-lock adapter. The pressure built up at
this point is immense due to the difference in cross sectional area between the syringe and
capillary tubing. We would occasionally recut the tubing to get rid of eroded material but the
difference from one cut to the next is difficult to replicate on tubing with a 5 µm inner diameter
and an outer diameter of 360 µm. A difference in the pattern of this cut likely changes the
airflow inside the tubing and could be the underlying reason for variability in MB size. The rate
at which the MBs exited the capillary tubing was also variant, likely due to similar reasons. This
was not a critical issue in our study, as the 1.6 MHz was able to trap and isolate individual MBs
regardless of their repetition rate. The rate at which they exited was also at a slow enough rate to
“catch” arbitrary amounts of MBs with the PCL microfibers.
Using air as the gas that make up the MBs is advantageous when applying our project to
a TBI situation. During a blast-induced TBI, MBs are expected to form inside the extracellular
22
matrix which is concentrated with cerebrospinal fluid (CSF) that is primarily made up of water
vapor, oxygen, and nitrogen [26]. Due to the similar chemical makeup of air, we decided its
substitution in this project to realistically resemble a cavitation bubble from a blast-induced TBI
is reliable.
2.4.2 MB Positioning Using Dual-frequency Method
An acoustical method for MB positioning was used in previous studies, which
incorporated a dual-frequency transducer [20]. We extended on this approach by making future
studies more advantageous for TBI studies. Previous research used optical methods to produce
MBs which is often times uneconomical. We combined our MB production method (Section
2.2.1) with their acoustical methods to demonstrate 3D control over cavitation in a more
economical manner. Using microfibers in our apparatus also allows for the study of a wide
variety of cells in future studies. Previous methods have used voltage clamp electrodes to
constrain cells but this is not feasible to maintain cell-viability for all types of cells. Our methods
are advantageous to produce and have 3D control over MBs that are 50-100 µm, but if future
works requires smaller MB size (~10 µm) then optical methods, similar to that of Zhou et al.,
would be more advantageous.
We ignored simultaneous positioning and cavitation through dual-frequency capability in
this study but our combined results (Sections 2.3.2 & 2.3.3) demonstrate that a dual-frequency
transducer with an outer frequency of 1.6 MHz and a central frequency of 100 kHz would be
successful in doing so for future studies. This proven functionality provides direct opportunity to
study the controlled effects that cavitation has on surrounding materials. Having the ability to

23
arbitrarily control the spatial displacement between the MBs and target material (D) also
provides opportunity to study the relationship between D and the target material response.
2.4.3 MB Positioning and Collapse Using Microfiber Adhesion and Resonant Frequency
The methods and results shown in Sections 2.2.3 & 2.3.3 demonstrate encouraging
capability that has potential to propel future studies. Due to the delicate nature of the PCL
microfibers [27], future studies on cavitation characterization can be done. Our novel approach
allows for the MBs to be trapped as they adhere to the surface of the microfibers. As cavitation
occurs, the microfibers will have minimal disruption on its pattern, allowing for a detailed
analysis on the stages of cavitation and its aftermath. The biocompatibility of the PCL
microfibers will allow for the introduction of cell-laden microfibers[22], and ultimately will
provide opportunity for future research on the effects of surface-cavitation and its consequences
on surrounding cells. In regards to a TBI situation, using neuron-laden microfibers in our
apparatus offers a realistic model that will mimic the consequences that surface-cavitation has on
surrounding neurons. 3D control over the scaffold will allow for MB positioning and cavitation
on arbitrary neurons.
2.5 Conclusions
In this study we have shown the success of MB production with a corresponding size of
50-100 µm. We have also demonstrated the success of two methods of controlled cavitation. .
These methods are cost-effective and provide arbitrary control on the position and magnitude of
cavitation. These methods provide intriguing potential for future studies focused on the effects of
cavitation on variable surfaces. In response to TBIs specifically, the two methods of controlled

24
cavitation presented in this study provide an excellent opportunity to gather a detailed study on
the neuronal response to cavitation. Future research that builds off of the techniques in
this study involves using the biocompatibility of the PCL microfibers to seed neurons on its
surface [22]. Using these neuron-laden microfibers in both of these methods will allow for
characterization of neuronal response to cavitation and seek to unmask the unanswered questions
in TBIs.
References
[1] P. R. Gogate and A. M. Kabadi, "A review of applications of cavitation in biochemical
engineering/biotechnology," vol. 44, ed: Biochemical Engineering Journal, 2009, pp. 60-
72.
[2] C. M. Schoellhammer and G. Traverso, "Low-frequency ultrasound
for drug delivery in the gastrointestinal tract," vol. 13, ed: Expert Opinion on Drug
Delivery, 2016, pp. 1045-1048.
[3] C. M. H. Newman and T. Bettinger, "Gene therapy progress and prospects:
Ultrasound for gene transfer," vol. 14, ed: Gene Therapy, 2007, pp. 465-475.
[4] E. P. Stride and C. C. Coussios, "Cavitation and contrast: the use of bubbles in
ultrasound imaging and therapy," in Institution of Mechanical Engineering, 2009, vol.
224, no. 2, pp. 171-191.
[5] Y. Gai, W. Wang, D. Xiao, and Z. Yaping, "Ultrasound coupled with supercritical carbon
dioxide for exfoliation of graphene: Simulation and experiment," vol. 41, ed: Ultrasonics
Sonochemistry, 2018, pp. 181-188.
[6] R. K. L. Tan et al., "Graphene as a flexible electrode: review of fabrication approaches,"
vol. 5 ed: Journal of Materials Chemistry A, 2017, pp. 17777-17803.
[7] A. Philipp and W. Lauterborn, "Cavitation erosion by single laser-produced bubbles,"
vol. 361, ed: Journal of Fluid Mechanics, 1998, pp. 75-116.
[8] L. Chernin and D. V. Val, "Probabilistic prediction of cavitation on rotor blades of
tidal stream turbines," vol. 113, ed: Renewable Energy, 2017, pp. 688-696.
[9] J. Bin, L. Xianwu, and Y. Wu, "Unsteady cavitation characteristics and alleviation of
pressure fluctuations around marine propellers with different skew angles," vol. 28, ed:
Journal of Mechanical Science and Technology, 2014, pp. 1339-1348.

25
[10] F. Li et al., "Dynamics and mechanisms of intracellular calcium waves elicited by
tandem bubble-induced jetting flow," ed: PNAS, 2017.
[11] J. Goeller, A. Wardlaw, D. Treichler, J. O'Bruba, and G. Weiss, "Investigation of
Cavitation as a Possible Damage Mechanism in Blast-Induced Traumatic Brain Injury,"
vol. 29, ed: Journal of Neurotrauma, 2012, pp. 1970-1981.
[12] S. Canchi, K. Kelly, Y. Hong, M. A. King, G. Subhash, and M. Sarntinoranont,
"Controlled single bubble cavitation collapse results in jet-induced injury in brain tissue,"
vol. 74, ed: Journal of the Mechanical Behavior of Biomedical Materials, 2017, pp. 261-
273.
[13] R. S. Salzar, D. Treichler, A. Wardlaw, G. Weiss, and J. Goeller, "Experimental
Investigation of Cavitation as a Possible Damage Mechanism in Blast-Induced
Traumatic Brain Injury in Post-Mortem Human Subject Heads," vol. 34, ed: Journal
of Neurotrauma, 2017, pp. 1589-1602.
[14] C. M. Cartagena et al., "Subacute Changes in Cleavage Processing of Amyloid
Precursor Protein and Tau following Penetrating Traumatic Brain Injury," vol. 11,
ed: PLOS ONE, 2016.
[15] C. E. Brennen, Cavitation and Bubble Dynamics. Cambridge: Cambridge University
Press, 2013.
[16] W. Lauterborn and C.-D. Ohl, "Cavitation bubble dynamics," Ultrasonics Sonochemistry,
vol. 4, no. 2, pp. 65-75, 1997.
[17] G. Kuiper, "Cavitation Research and Ship Propeller Design," Applied Scientific Research,
vol. 58, pp. 33-50, 1998.
[18] M. Ashokkumar, "The characterization of acoustic cavitation bubbles – An overview,"
Ultrasonics Sonochemistry, vol. 18, no. 4, pp. 864-872, 2011.
[19] P. R. Gogate and A. B. Pandit, "A review and assessment of hydrodynamic cavitation as
a technology for the future," Ultrasonics Sonochemistry, vol. 12, no. 1, pp. 21-27,
2005/01/01/ 2005.
[20] Y. Zhou, K. Yang, J. Cui, J. Y. Ye, and C. X. Deng, "Controlled permeation of cell
membrane by single bubble acoustic cavitation," Journal of Controlled Release, vol. 157,
no. 1, pp. 103-111, 2012.
[21] Z. Bai, J. M. M. Reyes, R. Montazami, and N. Hashemi, "On-chip development of
hydrogel microfibers from round to square/ribbon shape," vol. 2, ed: Journal of Material
Chemistry A, 2014, pp. 4878-4884.
[22] F. Sharifi, B. B. Patel, A. K. Dzuilko, R. Montazami, D. S. Sakaguchi, and N. Hashemi,
"Polycaprolactone Microfibrous Scaffolds to Navigate Neural Stem Cells,"
Biomacromolecules, vol. 17, pp. 3287-3297, 2016, doi: 10.1021/acs.biomac.6b01028.

26
[23] D. B. Khismatullin, "Resonance frequency of microbubbles: Effect of viscosity," vol.
116, ed: Journal of Acoustical Society of America, 2004, pp. 1463-1473.
[24] M. Postema, A. Van Wamel, C. Lancee, and N. De Jong, "Ultrasound-induced
encapsulated microbubble phenomena," vol. 30, ed: Ultrasound in Medicine and
Biology, 2004, pp. 827-840.
[25] J. C. Buckey, D. A. Knaus, D. L. Alvarenga, M. A. Kenton, and P. J. Magari, "Dual-
frequency ultrasound for detecting and sizing bubbles," Acta Astronautica, vol. 56, no. 9,
pp. 1041-1047, 2005.
[26] S. Haniff and P. A. Taylor, "In silico investigation of blast-induced intracranial fluid
cavitation as it potentially leads to traumatic brain injury," vol. 27, ed: Shock Waves,
2017, pp. 929-945.
[27] F. Sharifi, B. Patel, A. Dzuilko, R. Montazami, D. S. Sakaguchi, and N. Hashemi,
"Polycaprolactone Microfibrous Scaffolds to Navigate Neural Stem Cells," vol. 17, ed:
Biomacromolecules, 2016, pp. 3287-3297.
27
CHAPTER 3. SEEKING INSIGHT ON TBIS BY ANALYZING CAVITATION-
INDUCED DAMAGE OF SOFT POLYMER FILMS
Modified from a manuscript submitted in Ultrasonics Sonochemistry
Alex H. Wrede1, Faisal Al-Masri1, Reza Montazami1, and Nicole N. Hashemi1,2*
1 Department of Mechanical Engineering, Iowa State University, Ames, Iowa 50011, USA
2 Department of Biomedical Sciences, Iowa State University, Ames, IA 50011, USA
Abstract
Traumatic brain injuries (TBIs) are complex phenomena that create epidemic healthcare and
financial concerns. Recent studies have theorized that cavitation exists during a TBI, which has
potential to induce significant damages to surrounding anatomy. This study seeks to implement
polydimethylsiloxane (PDMS) films as a placeholder of the brain to elucidate the damage that
surrounding brain tissue would experience from nearby cavitation. The apparatus includes an
existing methodology that implements controlled cavitation. 3D confocal microscopy and
interferometry techniques are used to characterize the surface damage on the PDMS films.
Visual representation and roughness parameters on the nanoscale help elucidate a distinct
difference between control and experimental samples. These results help legitimize the concern
of cavitation in the skull and also help motivate future studies to analysis the cellular response to
surrounding cavitation.

28
3.1 Introduction
Despite decades of research, the brain continues to be one of the most obscure parts of
the human body. TBI is the damaging aftermath to the brain due to a mechanical force, leading
to functionality impairment. Exposure to blasts has led to a TBI in over 60% of soldiers serving
in Iraq and Afghanistan[1]. Everyone in society is susceptible to a TBI, this diagnosis is typical
in falls and automobile collisions. TBIs are also prevalent in contact sports where athletes are
often exposed to cranial impacts[2]. There are many different leading causes and brain response
mechanisms to TBI damage[3, 4]. Recent studies suggest the presence of cavitation in the human
skull as a results of a TBI, which can arise due to the presence of small pockets of vapor in the
cerebral spinal fluid (CSF) [5-7]. Upon impact these vapor contents expand and collapse due to a
low pressure wave that reflects off the skull boundary after the initial compressive wave travels
through the skull[8]. Cavitation has been proven to lead to significant erosion in alloys and hard
plastics, applying a force that has been broadly characterized to a broad magnitude of 0.1-20
MPa [9-13]. If cavitation has the ability to erode steel, its potential to cause damage to much
softer brain tissue is alarming.
In this study, we investigate the topographical changes that cavitation induces to PDMS
films to help illustrate the damage that cavitation has on brain tissue. Soft materials have been
consistently used to model organs in vitro as well as in tissue engineering[14]. Soft polymers
have been a common candidate for this as they are easy and affordable to manufacture, and their
elastic properties can be easily altered and studied[15]. Adjusting the base to curing agent ratio in
the PDMS fabrication process allows for arbitrary selection to the mechanical properties of the
PDMS.

29
The apparatus used to create cavitation on the PDMS films is similar to that used in
previous studies[16]. This method is advantageous because it allows for controlled cavitation,
enabling similar cavitation exposure from one sample to the next. Characterization of cavitation
aftermath is characterized using 3D confocal microscopy and interferometry methods. This
analysis yields novelty in multiple research disciplines, like propulsion and hydrodynamic
pumping, but in the TBI realm it helps unmask the physical detriments that cavitation has on
nearby neuronal anatomy. Understanding this aftermath is a vital piece to advance TBI recovery,
prevention, and care.
3.2 Materials and Methods
3.2.1 PDMS Fabrication & Cavitation Apparatus
The PDMS samples were made by mixing the base and curing agent (Sylgard 184, Dow
Corning, Midland, MI) at a 32:1 ratio and allowing them to cure at room temperature for 48
hours. Controlling the mass ratio of base to curing agent affects the hardness of the PDMS with
higher ratios producing softer PDMS. The hardness of the PDMS samples are ~50 shore (PHT-
960, Phase II, Upper Saddle River, NJ), which is slightly harder than that of the human brain
which has been measured at 10-30 shore in previous studies[1]. Each PDMS sample was collect
and cured in a petri dish with a diameter of 36 mm.
The complete apparatus configuration was followed closely to the adhesion technique
outlined in previous studies[16]. The PDMS-filled petri dishes were suspended mid-solution
using a 3-axis stage, and oriented in line of the stream of rising microbubbles (MBs). MBs exited
the capillary tubing at a rate of ~75 MB/min. For each trial 450-500 MBs were collected across
the exposed PDMS surface. After MB collection the sample was displaced out of plane with the

30
rising MBs and rotated 180° so it was exposed to a ultrasonic transducer, similar to the
orientation in previous research[16]. The activation of the transducer creates resonant conditions
for the collected MBs and ultimately induces cavitation (100 kHz center frequency, 5 cycles,
pulse repetition frequency 59 Hz, 260 Vpp). The process of collecting MBs, rotating the PDMS
substrate, and inducing cavitation was done ten times for each sample. Control samples were
submerged in the tank and exposed to the transducer signal but they did not have any adhered
MBs, eliminating the occurrence of cavitation. The control samples experienced ultrasound
exposure to ensure that any observed topographical differences were solely due to cavitation
forces.
3.2.2 Topography Analytics
The topographical analysis was conducted using 3D confocal microscopy and
interferometry techniques (S neox, Sensofar, Barcelona, Spain). The compatible software
(SensoSCAN v6.3) calculates roughness parameters that provide detailed characteristics of the
sample topography. These parameters are useful when deciphering the difference between
surface impurities, noise, and cavitation damage. All 3D confocal microscopy trials were
conducted using a 150X objective lens, red light, and 60% lighting. Interferometry methods
implement a 50XDi objective lens, green light, and 15% lighting. Both of these methods are used
to legitimize topographical summaries of the PDMS surfaces on the nanoscale.

31
3.3 Results and Discussion
3.3.1 3D Confocal Microscopy
The 3D confocal microscopy system has an assortment of capabilities and objective options.
Figure 3.1 represents a typical illustration of the surface of a control sample. Using a 150X
objective lens condenses the dimensions of the field of view significantly. A stitched 3X3 field
scan is implemented to collect data across a larger area and eliminate any bias from one
particular region. Figure 3.2 illustrates the typical topography of an experimental sample after
experiencing surrounding cavitation. A visual comparison yields distinct differences in the nature
of the surface between the two samples. It appears that the cavitation has a created wear and
erosion-like effects as small tears are visible on the surface of the PDMS. These damages are
consistently visually present in the experimental samples and absent in the control samples. The
damage from cavitation is further elucidated through roughness parameters that are internally
calculated in the software. The roughness parameter ‘Sa’ is used to portray the overall roughness
of the surface by calculating the magnitude of the difference in height from the mean height. The
Sa calculation gives an optimal description of the surface roughness due to the fact that in the
derivation, impurities or foreign objects adhered to the surface have a minimal effect on the final
value[17]. The average Sa value for all the control surfaces was calculated at 22.0 nm. This value
is noticeably different than the experimental samples, which had an average Sa value of 28.8 nm.
This increase in roughness is expected due to the cavitation damage that is introduced.
32
Figure 3.1: 3D confocal microscopy analysis of a control PDMS sample. (A) The surface is
visibly flat with some minor surface impurities. (B) Graphical height displacement across an
arbitrary line in the surface.
50 μm
A.

33
Figure 3.2: 3D confocal microscopy analysis of a typical experimental PDMS sample. (A) The
surface shows patterns of wear that are distinct from the control visual. There appears to be
some minor surface impurities. (B) Graphical height displacement across an arbitrary line in the
surface.
The skewness (Ssk) is a dimensionless roughness parameter which also helps characterize
the topography changes. A positive value of Ssk describes a height distribution that is below the
mean plane, that is, the valleys create more of a bias than the peaks. A negative Ssk value
50 μm
A.

34
resembles a bias toward the peaks in the sample. Our hypothesis was that cavitation would create
cavities in the surface, yielding a positive Ssk value. Hypothetically the control samples would
ideally have an Ssk value at or around zero. The results align with our hypothesis with a control
and experimental average Ssk value of 1.1 and 11.3, respectively. The positive Ssk value for the
control sample is likely due to impurities that exist on the nanoscale during the curing process of
PDMS[18]. The large Ssk value from the experimental samples points directly at an outside force
creating erosion of the surface, similar to our anticipated hypothesis. This large Ssk also points to
apparent cavitation damage because any debris or added noise that adheres to the surface by
introducing the samples to the 1.5 gallon tank should cause a negative Ssk trend because they
create peaks in the topography, but the cavitation erosion overrides this noise and remains biased
below the mean height plane. Figure 3.3 highlights the collected Sa and Ssk values from the
control and experimental samples using 3D confocal microscopy.
Figure 3.3: Summary of (A) average Sa, and (B) average Ssk roughness parameters of control
and experimental samples via 3D confocal microscopy techniques. Error bars represent the
standard error of the mean.
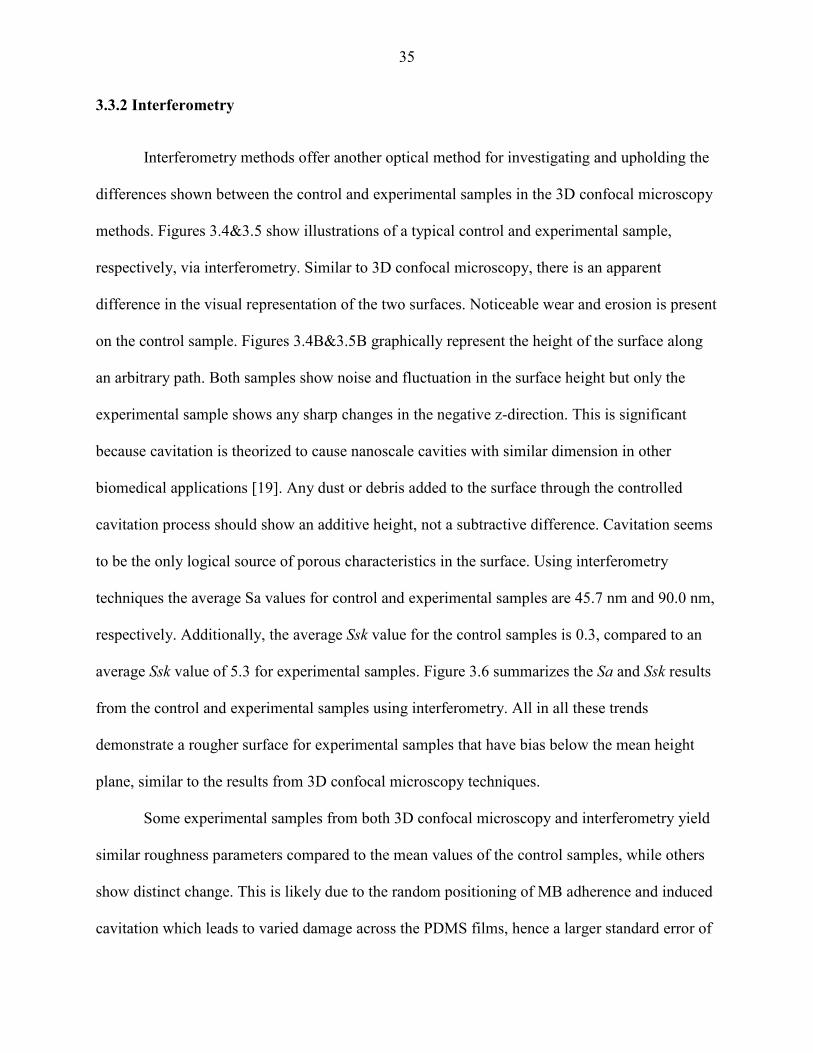
35
3.3.2 Interferometry
Interferometry methods offer another optical method for investigating and upholding the
differences shown between the control and experimental samples in the 3D confocal microscopy
methods. Figures 3.4&3.5 show illustrations of a typical control and experimental sample,
respectively, via interferometry. Similar to 3D confocal microscopy, there is an apparent
difference in the visual representation of the two surfaces. Noticeable wear and erosion is present
on the control sample. Figures 3.4B&3.5B graphically represent the height of the surface along
an arbitrary path. Both samples show noise and fluctuation in the surface height but only the
experimental sample shows any sharp changes in the negative z-direction. This is significant
because cavitation is theorized to cause nanoscale cavities with similar dimension in other
biomedical applications [19]. Any dust or debris added to the surface through the controlled
cavitation process should show an additive height, not a subtractive difference. Cavitation seems
to be the only logical source of porous characteristics in the surface. Using interferometry
techniques the average Sa values for control and experimental samples are 45.7 nm and 90.0 nm,
respectively. Additionally, the average Ssk value for the control samples is 0.3, compared to an
average Ssk value of 5.3 for experimental samples. Figure 3.6 summarizes the Sa and Ssk results
from the control and experimental samples using interferometry. All in all these trends
demonstrate a rougher surface for experimental samples that have bias below the mean height
plane, similar to the results from 3D confocal microscopy techniques.
Some experimental samples from both 3D confocal microscopy and interferometry yield
similar roughness parameters compared to the mean values of the control samples, while others
show distinct change. This is likely due to the random positioning of MB adherence and induced
cavitation which leads to varied damage across the PDMS films, hence a larger standard error of

36
the mean for experimental samples. Topographical analytics were collected randomly across the
samples in order to eliminate visual bias. Overall trends point to clear topographical differences
between the control and experimental samples using both 3D confocal microscopy and
interferometry. This proven surface damage to a soft polymer with a slightly larger hardness of
the human brain brings alarming awareness to the application of TBIs.
Figure 3.4: Interferometry analysis of a control PDMS sample. (A) The surface is visibly flat
with some minor surface impurities. (B) Graphical height displacement across an arbitrary line
in the surface. Any abrupt spikes in the z direction appear to be above the surface.
100 μm
A.

37
Figure 3.5: Interferometry analysis of an experimental PDMS sample. (A) The surface has a
roughness texture that is visually different that the control images. (B) The graphical height
displacement across an arbitrary line in the surface shows abrupt spikes in the z direction below
the surface, points to signs of cavitation damage.
Characterizing the response of cranial anatomy to surrounding cavitation is the next step
for future studies. Pharmacists can only provide the best treatment if cellular response to this TBI
100 μm
A.

38
phenomena is known. On top of this, if cellular damage shows catastrophic trends from
cavitation exposure then engineers now realize the importance of eliminating or minimizing the
possibility of cavitation existence in helmet design. All in all, this study has demonstrated the
detriments that cavitation has on soft surfaces and helped motivate the progression of TBI
knowledge.
Figure 3.6: Summary of (A) average Sa, and (B) average Ssk roughness parameters of control
and experimental samples via interferometry techniques. Error bars represent the standard error
of the mean.
3.4 Conclusion
Cavitation is commonly known to exist and erode away nearby surfaces in a variety of
applications, like propulsion and hydrodynamic pumping[9, 10, 13]. Recent theories have
concluded that cavitation exists in the brain during a TBI and has the potential to leave behind
detrimental effects[5, 6]. This study uses an existing apparatus that simulates controlled
cavitation and analyzes the damages that soft polymers undergo after exposure to surrounding
cavitation. Methods of 3D confocal microscopy and interferometry are used to study the surface
topography of control and experimental samples. Comparative results conclude that induced
39
cavitation leads to clear damage and erosion to a PDMS surface. Although the PDMS samples do
not exactly replicate the damage that the human brain might experience, it is clear that damage
occurs in our simulations and this raises concern for how detrimental cavitation is on vulnerable
cranial anatomy. Future studies seek to focus on the response that neuronal cells have to similar
simulations of controlled cavitation. Taken together, this study has clear novelty that helps
unmask the highly unknown characteristics of TBIs, allowing for advancements in providing
better care and treatment to its victims.
References
[1] A. Chanda, C. Callaway, C. Clifton, and V. Unnikrishnan, "Biofidelic human brain tissue
surrogates," vol. 25, ed: Mechanics of Advanced Materials and Structures, 2018, pp.
1335-1341.
[2] S. T. DeKosky, M. D. Ikonomovic, and S. Gandy, "Traumatic Brain Injury — Football,
Warfare, and Long-Term Effects," vol. 363 ed: The New England Journal of Medicine,
2010, pp. 1293-1296.
[3] J. L. Zamanian et al., "Genomic Analysis of Reactive Astrogliosis," vol. 32, ed: Journal
of Neuroscience, 2012, pp. 6391-6410.
[4] S. Bartyczak and W. Mock, "Characterization of viscoelastic materials for low-magnitude
blast mitigation," vol. 500, ed: Journal of Physics: Conference Series, 2014.
[5] J. Goeller, A. Wardlaw, D. Treichler, J. O'Bruda, and G. Weiss, "Investigation of
cavitation as a possible damage mechanism in blast-induced traumatic brain injury," vol.
29, ed: Journal of Neurotrauma, 2012, pp. 1970-1981.
[6] M. B. Panzer, B. S. Myers, B. P. Capehart, and C. R. Bass, "Development of a finite
element model for blast brain injury and the effects of CSF cavitation," vol. 40, ed:
Annals of Biomedical Engineering, 2012, pp. 1530-1544.
[7] S. Haniff and P. A. Taylor, "In silico investigation of blast-induced intracranial fluid
cavitation as it potentially leads to traumatic brain injury," vol. 27, ed: Shock Waves,
2017, pp. 929-945.
[8] P. A. Taylor, J. S. Ludwigsen, and C. C. Ford, "Investigation of blast-induced traumatic
brain injury," vol. 28, ed: Brain Injury, 2014, pp. 879-895.

40
[9] J. Bin, L. Xianwu, and Y. Wu, "Unsteady cavitation characteristics and alleviation of
pressure fluctuations around marine propellers with different skew angles," vol. 28, ed:
Journal of Mechanical Science and Technology, 2014, pp. 1339-1348.
[10] B. K. Sreedhar, S. K. Albert, and A. B. Pandit, "Cavitation damage: Theory and
measurements – A review," vol. 372-373, ed: Wear, 2017, pp. 177-196.
[11] M. Petkovsek and M. Dular, "Simultaneous observation of cavitation structures and
cavitation erosion," vol. 300, ed: Wear, 2013, pp. 55-64.
[12] E. Herbert, S. Baliber, and F. Caupin, "Cavitation pressure in water," vol. 74, ed:
Physical Review. E. Statistical, Nonlinear, and Soft Matter Physics, 2006, p. 041603.
[13] L. Chernin and D. V. Val, "Probabilistic prediction of cavitation on rotor blades of tidal
stream turbines," vol. 113, ed: Renewable Energy, 2017, pp. 688-696.
[14] K. Y. Lee and D. J. Mooney, "Hydrogels for Tissue Engineering," vol. 101, ed:
Chemical Reviews, 2001, pp. 1869-1879.
[15] M. Cabello et al., "Electrostimulation in an autonomous culture lab-on-chip provides
neuroprotection of a retinal explant from a retinitis pigmentosa mouse-model," vol. 288,
ed: Sensors and Actuators B-Chemical, 2019, pp. 337-346.
[16] A. H. Wrede, A. Shah, M. C. McNamara, R. Montazami, and N. N. Hashemi, "Controlled
positioning of microbubbles and induced cavitation using a dualfrequency transducer and
microfiber adhesion techniques," vol. 43, ed: Ultrasonics Sonochemistry, 2018, pp. 114-
119.
[17] E. S. Gadelmawla, M. M. Koura, T. M. A. Maksoud, I. M. Elewa, and H. H. Soliman,
"Roughness Parameters," vol. 123, ed. Journal of Materials Processing Technology,
2002, pp. 133-145.
[18] C. Con and B. Cui, "Effect of mold treatment by solvent on PDMS molding into
nanoholes," vol. 8, ed: Nanoscale Research Letters, 2013.
[19] Y. Zhou, K. Yang, J. Cui, J. Y. Ye, and C. X. Deng, "Controlled permeation of cell
membrane by single bubble acoustic cavitation," Journal of Controlled Release, vol. 157,
no. 1, pp. 103-111, 2012.

41
CHAPTER 4. CHARACTERIZATION OF ASTROCYTIC RESPONSE AFTER
EXPERIENCING ACOUSTICALLY-INDUCED CAVITATION IN VITRO
Modified from a manuscript submitted in Global Challenges
Alex H. Wrede1, Marilyn C. McNamara1, Rodger Baldwin1, Jie Luo2, Reza Montazami1,
Anumantha Kanthasamy2, and Nicole N. Hashemi1,2*
1 Department of Mechanical Engineering, Iowa State University, Ames, Iowa 50011, USA
2 Department of Biomedical Sciences, Iowa State University, Ames, IA 50011, USA
Abstract
When a traumatic brain injury (TBI) occurs, low-pressure regions inside the skull can
cause vapor contents in the cerebral spinal fluid (CSF) to expand and collapse, a phenomenon
known as cavitation. During cavitation, emitted shock waves are theorized to have alarming
adverse effects on surrounding anatomy. We create cavitation via acoustics by making
advancements on a previously engineered system. Using cell-laden microfibers we visually
analyze the longitudinal morphological response that mouse astrocytes portray after cavitation
exposure. Morphological damage was evident immediately after cavitation when compared to a
control sample, as cellular processes retracted. Forty-eight hours later the astrocytes appeared
cultured across the fibers, as normal. Gene expression changes that occur post-cavitation are also
analyzed via quantitative polymerase chain reaction (qPCR) methods. After cavitation a number
of pro-inflammatory genes were upregulated, including, TNFα, IL-1β, C1q, Serping1, NOS1, IL-
42
6, and JMJD3. Taken together these results characterize the detrimental effects that surrounding
cavitation has on astrocytic function, and yield advancements for TBI care and prevention
practices.
4.1 Introduction
Traumatic brain injuries (TBIs) are a large problem in modern society. Estimates show
that by the year 2020, TBIs will become the third most prevalent cause of death worldwide.[1]
TBIs have two different stages of injury: primary and secondary. A primary injury occurs at the
time of the injury, which might be a skull fracture, force-related stress from the brain shifting
within the skull boundary, or cavitation, which is the formation and dramatic collapse of MBs. A
secondary injury occurs sometime after the injury, such as intracranial inflammation or blood-
brain barrier damage.[2, 3] This study aims to specifically focus on the damages that the primary
injury of cavitation has on surrounding neuronal cells and seeks to elucidate the unknown nature
and unpredictability of TBIs.
The existence of cavitation inside the skull during a TBI situation is a modern hypothesis
in research. Goeller et al. used a brain-like ellipsoid model in a shock tube to confirm the
existence of cavitation in a TBI environment.[4] During a blast-TBI, the initial compressive
wave travels through the skull and a fraction of this wave reflects off impedance boundaries,
resulting in a negative pressure reflection wave.[5] It is in these low pressure regions where
intracranial cavitation exists.[6, 7] The CSF has minute pockets of vapor because of its primary
components, which are oxygen, nitrogen, and water vapor.[8] When these vapor pockets are
exposed to low pressure conditions they dramatically expand and collapse when the bubble
radius exits the stability region.[9] This expansion and collapse creates an intense localized force
43
measured anywhere from 0.1-20 MPa.[10] Cavitation damage has been heavily investigated in
mechanical pump and watercraft propulsion applications.[11-13] Characterization of the impact
that cavitation has inside the skull during a TBI remains to be fully explored and thus is the
ultimate novelty of this study. [14]
On top of TBIs, there are other profound neurological disorders, such as, Alzheimer’s
disease, Parkinson’s disease, and psychiatric diseases, affecting large portions of the population.
Research has shown a pro-inflammatory response in the pathogenesis during these situations.[15,
16] Astrocyte activation plays a vital role in initiating neuroinflammation.[17, 18] Astrocytes are
bountiful in the CNS and provide a variety of functions in the neuronal network, such as,
supplying support and structure to neurons, and enhancing synapse formation and function.[19]
Upon insult, though, the full functionality of astrocytes may be lost. Previous research has
categorized astrocyte reactivity into two groupings, called A1 and A2 astrocytes.[18] A1
astrocytes are the result of an inflammatory response similar to what is observed during a blast-
TBI, and are known to be harmful because they lose regular astrocytic functionality and instead
provide a neurotoxic function that kills neurons. A1 astrocytes upregulate many genes that are
known to be damaging to synapses. However, A2 astrocytes, which are activated through
ischemia, are shown to be protective by further promoting CNS repair and recovery.[20-22] We
postulate that cavitation will induce astrocytes to represent the A1 astrocyte phenotype and
upregulate mostly A1 specific genes. Because of the large role that astrocyte cells play in TBI
response, this study is solely focused on the investigation of astrocyte activation in response to
surrounding cavitation. Future studies involving co-cultures of multiple types of neuronal cells
will further elucidate this phenomenon by lending further physiological relevancy.
Neuronal cells are also known to retract their processes during a blast-TBI.[23] The

44
model analyzed in our study demonstrates this retraction function in astrocytes by conducting a
time-dependent visual study of cells at different stages post cavitation. We compare this collage
with a control sample to demonstrate that cavitation is a primary inducer for astrocytes to portray
an amoeboid morphology. These results motivated a genetic study to further investigate the A1
vs A2 expressions in astrocytes post-cavitation. Our hypothesis is that the astrocytes that
experience damage from surrounding cavitation will represent the phenotype of A1 astrocytes
because this is an inflammatory insult. Some classic genes that show upregulation in pro-
inflammatory astrocytes include, Tumor Necrosis Factor alpha (TNF�), Interleukin 1-beta (IL-
1�), C1q, Serping1, and other reactive oxygen species.[24-27] Related studies conclude that
unknown oxygen species are secreted by astrocytes and in turn, act as neurotoxins.[28] Nitric
oxide (NO), more specifically neuronal nitric oxide synthase (NOS1), plays a vital role in the
overall function of the CNS.[29] In neurodegenerative diseases like Parkinson’s disease[30],
stroke[31], Alzheimer’s disease[32], and amyotrophic lateral sclerosis[33], there has been
evidence of increased NOS1 expression.[29] It has been proven that increasing concentrations of
TNF� and IL-1� also increases the presence of interleukin 6 (IL-6) in mouse astrocytes.[23]
This trend is magnified in human astrocytes.[34] IL-6 has also been associated with multiple
sclerosis (MS).[35] An increased concentration of jumonji domain containing 3 (JMJD3) also
has been proven to lead to upregulation in IL-6.[36] On top of this, increasing levels of JMJD3
has been shown to activate the expression of a variety of pro-inflammatory genes in neuronal
cultures.[17, 36] This study focuses on characterizing the expression of TNF�, IL-1�, C1q,
Serping1, NOS1, IL-6, and JMJD3 in mouse astrocytes cells after experiencing surrounding
cavitation. We also wanted to analyze some anti-inflammatory (A2 phenotype) genes to see if
cavitation solely had influence on A1 specific genes. The well-known anti-inflammatory genes

45
that we test are tm4sf1, sphk1, CD14, IL13, and Arginase1.[18, 25, 27, 37] For all of our gene
expression studies we used qPCR methods. A detailed summary of these gene expression
changes has the potential to unmask important specifics about the nature of TBI at the cellular
level.
Previous studies have designed an apparatus that creates controlled cavitation. This
process produces, traps, positions, and collapses MBs arbitrarily in a tank using microfiber
adhesion and an ultrasound transducer. This apparatus was also designed to realistically mimic
the cavitation phenomena that exists during a TBI.[38] Our study seeks to advance this design by
making it bio-compatible and sterile for cell incorporation. Introducing astrocytes in this
apparatus and performing visual and gene expression analytic techniques, we demonstrate that
cavitation has an adverse effect on astrocytic morphology and genetics.
4.2 Materials and Methods
4.2.1 Biocompatibility and Sterilization
Previous studies describe the apparatus we use to create controlled cavitation by having
the ability to arbitrarily produce, trap, position, and collapse MBs.[38] In order to make this
apparatus sterile and stable for live cellular testing there are multiple advancements that were
implemented. Traditionally cellular testing is done underneath a sterilized fume hood but with
the necessary components for MB creation, positioning, and collapse, conducting experiments
under a fume hood for this project is impractical. The 3-axis stages and high-speed camera are
mounted onto an optics table in order to remain stationary, which a biological fume hood
environment is unable to provide. In order to obtain sterility and stability for cellular analysis we

46
made a number of advancements. The 1.5 gallon tank was filled with 3.5 liters of phosphate
buffered saline (PBS) instead of deionized water to account for cell compatibility. Before the
PBS was put into the tank, the tank was first sprayed down with 70% ethanol and put in a
sterilized fume hood until dry under UV. Then the PBS was poured into the tank under the fume
hood and exposed to 45 minutes of UV light for further sterilization. Also, the pieces of the
mechanical arm that was submerged in the PBS and used to hold the polycaprolactone (PCL)
frame stationary between the capillary tubing and transducer were also sterilized with 70%
ethanol and exposed to UV light for 45 minutes. The surrounding shelves and walls were also
draped with sterilized plastic to eliminate any dust or debris falling into the tank during
experimentation. Additionally, all other surrounding components (capillary tubing, 3-axis stage,
transducer and the mechanical arm that held it stationary, and the transducer cords) were sprayed
and wiped with 70% ethanol continuously prior to the introduction of cells. After the PBS filled
tank was sterilized, it was then covered with a sterile sheet and placed in an oven to heat at 70 °C
for 1 hour. This allowed for the PBS to warm to about body temperature so the cells would not
experience a temperature shock when being introduced in the tank. The cell-laden fiber frames
were kept in a sterile and stable incubator before and after trials. Using these advancements, we
were able to eliminate any signs of infection or contamination in all of our samples.
4.2.2 Fibrous Frame Fabrication
We fabricated frames by encapsulating copper within Polydimethylsiloxane (PDMS)
(1:10 Base:Elastomer) in a ‘U’ shape, since exposed copper caused cell death and PDMS floated
within the media and exposed fibers to the air. Fibers were fabricated using a well-documented
protocol involving a microfluidic device.[39, 40] Specifically, 5% PCL (Mn = 80,000, Sigma-

47
Aldrich, St. Louis, MO) was dissolved into 2,2,2-Trifluoroethanol (TFE, Oakwood Chemical,
West Columbia, SC) to form the core solution, while 5% Poly-ethylene glycol (Mn = 20,000,
Sigma-Aldrich, St. Louis, MO) was dissolved into a 1:1 solution of DI water and ethanol for a
sheath fluid. Fibers were the result of a 5:75 µL/min: µL/min flow rate ratio. Fibers were wrapped
around the aforementioned frames in a ratio of 10 fibers per frame.
4.2.3 Cell Model
The mouse astrocytes (CRL-2541) used in this project were purchased from American
Type Culture Collection (ATCC, Manassas, VA) because of their known utility in TBI
studies.[41] The cells were grown according to company protocol in growth media (ATCC, 30-
2002). The culture media was also supplemented with 10% FBS and 1% penicillin (10,000
U/mL)- streptomycin (10,000 μg/mL), both of which were purchased from Gibco (Waltham,
MA). The cells in all of our data collection consist of culture passage numbers 3-7. The
astrocytes were housed in an incubator set at 37 °C with 5% CO2.
4.2.4 Visual Morphology Analysis
We seeded cells onto biocompatible PCL microfibers (Hashemi Lab, Iowa State
University, Ames, IA) to promote cell adhesion and allow for groupings of finite amounts of
cells.[42, 43] The cells were suspended at a density of 1.06 ∗ 10� cells/mL before 0.25 mL of
cells were introduced to the fibers and cultured overnight prior to running experiments. A large
fraction of the seeded cells settled on the bottom of the culture flask but some adhered to the
microfibers. The apparatus layout for our technique was similar to that of the microfiber
adhesion technique documented in previous studies.[38] The function generator input settings for

48
the ultrasonic cavitation induction were: center frequency 100 kHz, 5 cycles, pulse repetition
frequency 59 Hz, 130 Vpp. The culture tank is filled with PBS and has a measured pH value of
7.35. Using the microfiber adhesion method we have arbitrary control over the number of MBs
that are captured on the cell-laden microfibers. All images of MBs adhered to cell-laden
microfibers are captured using a long-distance microscope (Model K2, Infinity Photo-Optical
Company) in unison with a high speed camera for imaging (BlackFly, FLIR) while the samples
are in the 1.5 gallon tank. After cavitation, the samples were placed in 12-well plates and all
images are captured using an inverted microscope (Zeiss, Germany). A growth analysis was
conducted in order to quantify the changes that are observed between the experimental and
control samples. The total area of growth in the plane of the inverted microscope was quantified
and measured using imageJ software (Wayne Rasband, NIH).
4.2.5 Gene Expression Analysis via qPCR
The apparatus configuration of this experiment is similar to that of the visual morphology
analysis, but with one slight modification, the cells are seeded onto sterilized 12 mm coverslips
instead of using microfiber scaffolds, shown in Figure 4.1.

49
Figure 4.1: Apparatus configuration for genetic analysis. Coverslips are suspended using a
mechanical arm that is stationed on a 3-axis stage, allowing for capture of MBs at arbitrary
positions on the coverslip. When the coverslip has an optimal amount of adhered MBs on its
underside, it is rotated 180° so the MBs and cells are exposed to the ultrasound.
The mouse astrocytes were seeded onto the coverslips at 1.17 ∗ 10� cells per coverslip
and cultured overnight in the incubator prior to experimentation. There were 40 total seeded
coverslips, 20 designated for a control sample and 20 designated for experimental sample. The
cell-laden coverslips were suspended mid-solution with a tweezers clamped in a mechanical arm.
Control samples were submerged in the PBS tank and exposed to ultrasound (center frequency
100 kHz, 5 cycles, pulse repetition frequency 59 Hz, 130 Vpp), but there were not any MBs
present to produce cavitation. The experimental samples experienced an identical environment
with the addition of 30-40 MBs adhered on each coverslip prior to activating the ultrasound.
After the MBs are collected along the cell-seeded surface, the coverslips are then manually
rotated 180° so the cells and MBs are aligned with beam of the transducer and cavitation is able
to occur. After treatments the cell-laden coverslips were trypsinized, collected, combined to
50
create one control and one treatment sample, pelleted, and frozen at -80 °C until homogenization.
Samples were homogenized in TRIzol reagent (Invitrogen Cat number: 15596026). RNA
isolation was done following the TRIzol reagent manufacturer’s protocol. Next, a cDNA
synthesis system, High Capacity cDNA Reverse Transcription Kit, was used to complete a
reverse transcription and convert the RNA to cDNA (Applied Biosystems, Foster City, CA). The
relative magnitude of gene expression was measured using real-time PCR with Qiagen RT2
SYBR Green master mix and validated Quantitect qPCR mouse primers from Qiagen (Frederick,
MD). Mouse gene 18S rRNA (Qiagen Cat. No. PPM57735E) was used as the housekeeping
gene, and used in the normalization of each sample. In order to ensure that florescence data from
amplicon peaks were not from of any nonspecific amplicons, dissociation and melting curves
were ran, according to the protocol from the manufacturer. The final results were calculated
using the ΔΔCt method and implementing the threshold cycle (Ct) value for the housekeeping
gene and for the respective gene of interest in each sample. The reported expression changes are
represented as fold changes between the control sample and treatment sample of each targeted
gene.[44]
4.3 Results and Discussion
4.3.1 Visual Morphology Analysis
With our advanced apparatus, it is possible to achieve a wide range of control over the
configuration of the microfiber-cell-MB complex. Figure 4.2 illustrates typical arrangements of
trapped MBs next to clusters of cells in the apparatus. We have arbitrary control where the MBs
adhere, the number of MBs that adhere, and the size of the MBs, because the microfiber scaffold
is attached to a 3-axis stage and easily adjusted to enter the plane of the rising MBs, allowing for
MBs to coalesce allows for varying MB sizes. In Figure 4.2C, a 60 µm bubble is adhered to the

51
cells on the top of the cell group and a larger MB around 100 microns is placed on the bottom of
the grouping. The 100 µm bubble was created by allowing two 60 µm bubbles to coalesce.
Figure 4.2 (A-C): Illustration of some different arrangements of MBs adhered to healthy clusters
of astrocyte cells during experimentation. Dotted lines are shown to help outline clusters of cells.
Higher magnification of cell morphology via an inverted microscope is shown in Figure 4.4.
These images are taken with the samples inside the PBS tank.
After an arbitrary amount of MBs are collected on the cell-laden microfibers, the
ultrasonic transducer is activated, resulting in cavitation. Figure 4.3 shows a collage that
illustrates live cavitation on cell-laden microfibers.
Figure 4.3: Longitudinal collage showing cavitation on cell-laden microfibers. The samples are
in the PBS tank and pictures are taken with high-speed camera and telescopic lens. At t=0 the
ultrasonic transducer is activated. The later frames show the dramatic oscillation and collapse
of MBs in response to ultrasound exposure.
100 μm
t=0 t=0.017 t=0.033
t=0.050 t=0.067 t=0.083
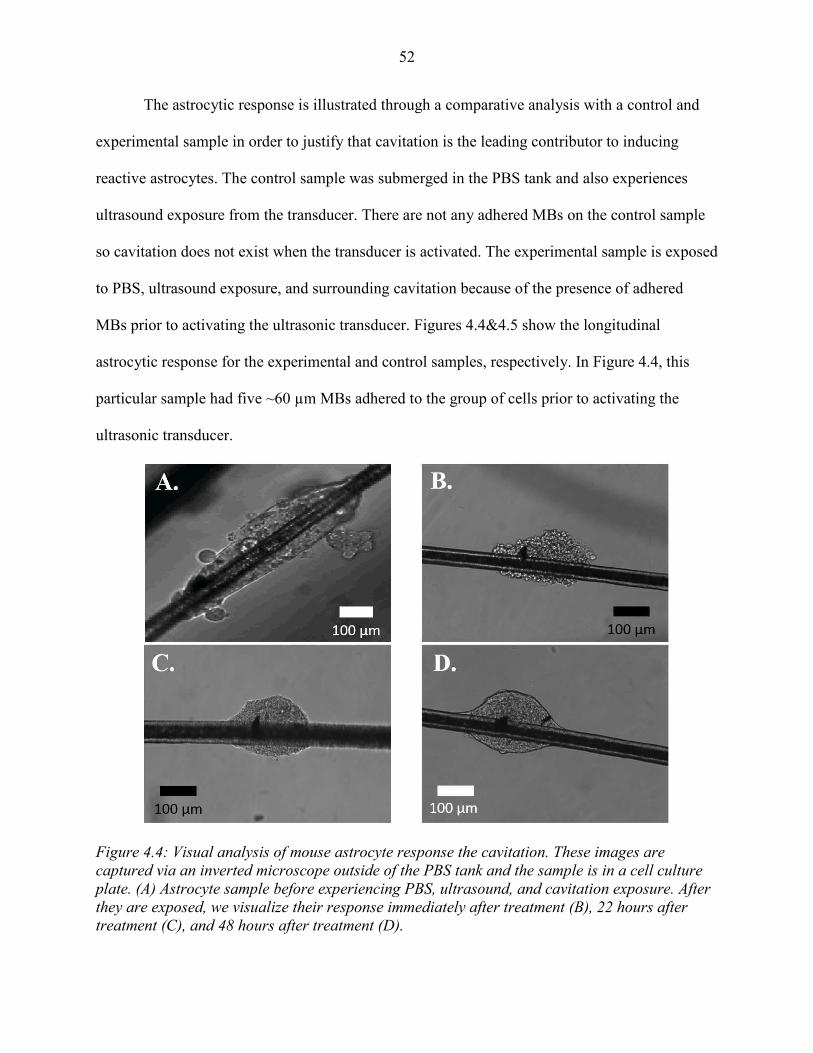
52
The astrocytic response is illustrated through a comparative analysis with a control and
experimental sample in order to justify that cavitation is the leading contributor to inducing
reactive astrocytes. The control sample was submerged in the PBS tank and also experiences
ultrasound exposure from the transducer. There are not any adhered MBs on the control sample
so cavitation does not exist when the transducer is activated. The experimental sample is exposed
to PBS, ultrasound exposure, and surrounding cavitation because of the presence of adhered
MBs prior to activating the ultrasonic transducer. Figures 4.4&4.5 show the longitudinal
astrocytic response for the experimental and control samples, respectively. In Figure 4.4, this
particular sample had five ~60 µm MBs adhered to the group of cells prior to activating the
ultrasonic transducer.
Figure 4.4: Visual analysis of mouse astrocyte response the cavitation. These images are
captured via an inverted microscope outside of the PBS tank and the sample is in a cell culture
plate. (A) Astrocyte sample before experiencing PBS, ultrasound, and cavitation exposure. After
they are exposed, we visualize their response immediately after treatment (B), 22 hours after
treatment (C), and 48 hours after treatment (D).

53
A growth analysis was done to quantify the retraction of processes and total surface area
in both experimental and control samples. The results concluded that both samples increased in
surface area 48 hours after control and experimental exposures, but the magnitude of growth was
significantly different. The control sample (Figure 4.5) grew at a rate of 200% and the
experimental sample (Figure 4.4) grew 109%, both over 48 hours. Figure 4.6 illustrates the
astrocytic surface area growth in all of our trials.
Figure 4.6: Growth analysis 48 hours after control and experimental exposures. Magnitudes are
percentages relative to the area measured immediately after experiencing control or
experimental conditions. Error bars represent ± 1 Standard Deviation.
50 μm
A. B. C.
Figure 4.5: Visual analysis of astrocytic response to PBS and ultrasound exposure, but no
exposure to cavitation. This sample is used as a control. (A) Represents the sample immediately
after exposure, (B) represents the sample 22 hours after exposure, and (C) represents the sample
48 after exposure.

54
4.3.2 Genetic Analysis via qPCR
Through our visual analysis studies we were able to see that astrocytes retract their
processes immediately after exposure to cavitation and they begin to elongate overtime. We
further investigate this response by studying the A1 and A2 genetic phenotype immediately after
cavitation. This is done via qPCR methods and using the cDNA from the separated control and
experimental samples. Figure 4.7 outlines the astrocyte phenotype represented by astrocytes that
have been activated via cavitation. The A1 specific genes that we test are: TNF�, IL-1�, C1q,
Serping1, NOS1, IL-6, and JMJD3. The A2 specific genes that we test are: tm4sf1, sphk1, CD14,
IL13, and Arginase1. Expression values are represented as normalized fold changes from the
control and treatment samples from each of these genes.
Figure 4.7: Gene expression analysis of mouse astrocytes immediately after exposure to
surrounding cavitation in the PBS tank. Expressions are represented as a fold change between
the control sample and treatment sample of each targeted gene. Genes labeled with red bars
designate A1 specific genes and genes labeled with green bars designate A2 specific genes.

55
The presence of cavitation inside the skull during a TBI is a modern hypothesis. Some
studies have recently proven the existence of this phenomenon[4, 45], but there is limited
knowledge on the characterization of cellular response in this scenario. This study used
controlled cavitation techniques from previous studies and made modifications and
advancements in order to obtain biocompatibility and sterility, allowing for the incorporation of
mouse astrocytes.[38] We used astrocytes in this study because of their documented role in TBI
response and recovery.[18, 28] Future studies aim to incorporate multiple types of neuronal cells
in order to further characterize the damages that cranial cavitation has on surrounding anatomy.
One of the novelties of this study is ability to visualize the cellular response of a finite
amount of cells by using cell-laden microfibers. In the visual analysis we were able to see
morphology differences between control and experimental samples. In the experimental sample
the astrocytes clearly retract their processes and represent an amoeboid morphology. This is
shown in Figure 4.4B where the cell grouping has a very rough surface. In the control sample
there is also some evident cellular disruption (Figure 4.5A) but the cells appear displaced, instead
of damaged. The outer boundaries of the cell groupings do not have this rough nature, like the
experimental sample. The displacement of cells in the control sample is likely due to the
transportation of the sample from the PBS tank to cell culture plate. After 22 and 48 hours both
samples appear to expand their processes and spread across the fibers. For both experimental and
control samples the total measured surface area increases 48 hours after relative exposures,
however, the control samples grow significantly faster compared to the experimental samples.
This dramatic increase in surface area for the control samples is likely due to the astrocytic
function of forming protective scar tissue when entering the PBS tank.[46] A1 astrocytes lose
this functionality and no longer protect surrounding neurons.[18]

56
Given the difference in morphology immediately after experimental and control
exposures, we sought to investigate the genetic differences at this time point. Future studies aim
to characterize the genetic tendencies longitudinally, for it is known that genetic phenotypes
change overtime.[46] Current technology is limited in offering analytic techniques to gather
genetic phenotypes of small amounts of cells, like the cell groupings on microfibers. Techniques
like qPCR require large amounts of cells due to sensitivity constraints. Single-cell RNA
sequencing is an evolving method that offers this ability but we have limited access and
resources to pursue this technique. We instead engineered our apparatus to allow for greater
amounts of cells and the incorporation of qPCR. We did this by replacing the cell-laden
microfiber scaffold with sterilized cell-seeded coverslips. Due to the increase in cell amount and
sample area, we also increased the number of adhered MBs to 30-40 per sample instead of 5-10,
like what was adhered to the cell-laden microfibers. The gene expression results show a clear
difference between experimental and control phenotypes. All selected A1 markers were
unregulated after cavitation. The following genes also had at least +2 fold change: IL-1�, C1q,
Serping1, and NOS1, analogous to literature.[18, 28, 29] Of the A2 markers that were tested, the
only A2 gene that was unregulated with a fold change of 2+ was CD14. These A1 and A2
genetic findings lead us to conclude that surrounding cavitation induces A1 reactive astrocytes
and in turn, can be detrimental to the neuronal network. It is aforementioned that NOS1
expression is directly correlated to the presence of neurodegenerative diseases.[29-33] Increased
levels TNF�, IL-1�, and JMJD3 spike the levels of IL-6 and, in turn, has been directly
associated with MS.[23, 35, 36] Our genetic findings are significant because if cavitation is
proven to be a leading contributor in A1 induction then this provides another avenue in
preventative care. The pharmaceutical attention goes toward curing the damage that A1

57
astrocytes endow, but the engineering attention can now have a focus in studying where
cavitation specifically occurs in the brain. A location map of cavitation occurrence can be
directly used to design a helmet that dampens force and reduces the possibility of cavitation,
which in turn, reduces neurotoxicity in astrocytic response and minimizes TBI detriments.
4.4 Conclusion
TBIs are complex injuries that often times lead to unpredictable symptoms for its victims.
There are primary and secondary injuries that occur during a TBI. Breaking down these injuries
and studying the effects that they endow on the cellular levels is important in order to gain
knowledge on the topic. An example of a primary injury is cavitation that exists in low pressure
regions of the brain. We made advancements to an apparatus designed in previous studies that
creates, traps, positions, and collapses MBs that realistically resemble those in a blast-TBI
event.[38] Our study uses PCL microfibers to mimic a biocompatible and sterile neuronal
environment for mouse astrocyte cells in-vitro. We document a visual study that demonstrates
surrounding cavitation has a profound effect on astrocytic activation. We also use qPCR
techniques to investigate the effects that surrounding cavitation has on the genetic phenotype of
astrocytes. This study has proven that astrocytic function drastically changes upon exposure to
surrounding cavitation. A1 genetic tendencies are consistently represented and known to be
neurotoxic. This study can be used as a platform in efforts to eliminate cavitation in the brain
through advanced helmet design. Further research focusing on the response of multiple types of
neuronal cells after experiencing surrounding cavitation will be vital in continuing the
advancement to TBI prevention and care.

58
References
[1] D. F. Meaney, B. Morrison, and C. D. Bass, "The Mechanics of Traumatic Brain Injury:
A Review of What We Know and What We Need to Know for Reducing Its Societal
Burden," vol. 136, ed: Journal of Biomechanical Engineering, 2014, 021008.
[2] H. L. Tian et al., "Risk factors for posttraumatic cerebral infarction in patients with
moderate or severe head trauma," vol. 31, ed: Neurosurgical Review, 2008, pp. 431-437.
[3] N. B. Topal et al., "MR imaging in the detection of diffuse axonal injury with mild
traumatic brain injury," vol. 30, ed: Neurological Research, 2008, pp. 974-978.
[4] J. Goeller, A. Wardlaw, D. Treichler, J. O'Bruda, and G. Weiss, "Investigation of
cavitation as a possible damage mechanism in blast-induced traumatic brain injury," vol.
29, ed: Journal of Neurotrauma, 2012, pp. 1970-1981.
[5] J. D. Achenbach, Wave Propagation in Elastic Solids. NY, USA: North Holland
Publishing Company; American Elsevier Publishing Company, 1973.
[6] R. S. Salzar, D. Treichler, A. Wardlaw, G. Weiss, and J. Goeller, "Experimental
Investigation of Cavitation as a Possible Damage Mechanism in Blast-Induced
Traumatic Brain Injury in Post-Mortem Human Subject Heads," vol. 34, ed: Journal
of Neurotrauma, 2017, pp. 1589-1602.
[7] S. Canchi, K. Kelly, Y. Hong, M. A. King, G. Subhash, and M. Sarntinoranont,
"Controlled single bubble cavitation collapse results in jet-induced injury in brain tissue,"
vol. 74, ed: Journal of the Mechanical Behavior of Biomedical Materials, 2017, pp. 261-
273.
[8] S. Haniff and P. A. Taylor, "In silico investigation of blast-induced intracranial fluid
cavitation as it potentially leads to traumatic brain injury," vol. 27, ed: Shock Waves,
2017, pp. 929-945.
[9] A. Shima, "Studies on bubble dynamics," vol. 7, ed: Shock Waves, 1997, pp. 33-42.
[10] E. Herbert, S. Baliber, and F. Caupin, "Cavitation pressure in water," vol. 74, ed:
Physical Review. E. Statistical, Nonlinear, and Soft Matter Physics, 2006, 041603.
[11] A. Philipp and W. Lauterborn, "Cavitation erosion by single laser-produced bubbles,"
vol. 361, ed: Journal of Fluid Mechanics, 1998, pp. 75-116.
[12] L. Chernin and D. V. Val, "Probabilistic prediction of cavitation on rotor blades of
tidal stream turbines," vol. 113, ed: Renewable Energy, 2017, pp. 688-696.
[13] J. Bin, L. Xianwu, and Y. Wu, "Unsteady cavitation characteristics and alleviation of
pressure fluctuations around marine propellers with different skew angles," vol. 28, ed:
Journal of Mechanical Science and Technology, 2014, pp. 1339-1348.

59
[14] C. Franck, "Microcavitation: the key to modeling blast traumatic brain injury?," vol. 2,
ed: Concussion, 2017, p. 3.
[15] R. M. Ransohoff and J. E. Khoury, "Microglia in Health and Disease," vol. 8, ed: Cold
Spring Harbor Perspectives in Biology, 2015, p. 1.
[16] A. Bhattacharya, N. C. Derecki, T. W. Lovenberg, and W. C. Drevets, "Role of neuro-
immunological factors in the pathophysiology of mood disorders," vol. 233, ed:
Psychopharmacology, 2016, pp. 1623-1636.
[17] P. Przanowski et al., "The signal transducers Stat1 and Stat3 and their novel target Jmjd3
drive the expression of inflammatory genes in microglia " vol. 92, ed: Journal of
Molecular Medicine, 2014, pp. 239-254.
[18] S. A. Liddelow et al., "Neurotoxic reactive astrocytes are induced by activated
microglia," vol. 541, ed: Nature, 2017, pp. 481-487.
[19] L. E. Clarke and B. A. Barres, "Emerging roles of astrocytes in neural circuit
development," vol. 14, ed: Nature Reviews. Neuroscience., 2013, pp. 311-321.
[20] M. V. Sofroniew and H. V. Vinters, "Astrocytes: biology and pathology," vol. 119, ed:
Acta Neuropathology, 2010, pp. 7-35.
[21] T. G. Bush et al., "Leukocyte infiltration, neuronal degeneration, and neurite outgrowth
after ablation of scar-forming, reactive astrocytes in adult transgenic mice," vol. 23, ed:
Neuron, 1999, pp. 297-308.
[22] Z. Zador, S. Stiver, V. Wang, and G. Manley, "Role of aquaporin-4 in cerebral edema
and stroke," vol. 190, ed: Handbook of Experimental Pharmacology, 2009, pp. 159-170.
[23] K. I. Mosher and T. Wyss-Coray, "Microglial dysfunction in brain aging and Alzheimer’s
disease," vol. 88, ed: Biochemical Pharmacology, 2014, pp. 594-604.
[24] M. L. Block, L. Zecca, and J. S. Hong, "Microglia-mediated neurotoxicity: uncovering
the molecular mechanisms," vol. 8, ed. Nature Review Neuroscience: Nature Review.
Neuroscience., 2007, pp. 57-69.
[25] M. Neal et al., "Prokineticin-2 promotes chemotaxis and alternative A2 reactivity of
astrocytes," vol. 66, ed: GLIA, 2018, pp. 2137-2157.
[26] R. P. Weinberg et al., "Palm Fruit Bioactives modulate human astrocyte activity in vitro
altering the cytokine secretome reducing levels of TNFα, RANTES and IP-10," vol. 8,
ed: Scientific Reports, 2018, 16423.
[27] C. Xing, W. Li, W. Deng, M. Ning, and E. H. Lo, "A potential gliovascular mechanism
for microglial activation: differential phenotypic switching of microglia by endothelium
versus astrocytes," vol. 15, ed: Journal of Neuroinflamation, 2018, 143.
60
[28] S. A. Liddelow and B. A. Barres, "Reactive Astrocytes: Production, Function, and
Therapeutic Potential," vol. 46, ed: Immunity, 2017, pp. 957-967.
[29] M. Bros, J. Boissel, U. Godtel-Armbrust, and U. Forstermann, "The untranslated region
of exon 2 of the human neuronal nitric oxide synthase (NOS1) gene exerts regulatory
activity," vol. 405, ed: Gene, 2007, pp. 36-46.
[30] S. Hunot et al., "Nitric oxide synthase and neuronal vulnerability in Parkinson's disease,"
vol. 72, ed: Neuroscience, 1996, pp. 355-363.
[31] S. Love, "Oxidative stress in brain ischemia," vol. 9, ed: Brain Pathology, 1999, pp. 119-
131.
[32] G. Simic et al., "nNOS expression in reactive astrocytes correlates with increased cell
death related DNA damage in the hippocampus and entorhinal cortex in Alzheimer's
disease," vol. 165, ed: Experimental Neurology, 2000, pp. 12-26.
[33] M. V. Catania, E. Aronica, B. Yankaya, and D. Troost, "Increased expression of neuronal
nitric oxide synthase spliced variants in reactive astrocytes of amyotrophic lateral
sclerosis human spinal cord," vol. 21, ed: Journal of Neuroscience, 2001, RC148.
[34] G. Elain, K. Jeanneau, A. Rutkowska, A. K. Mir, and K. K. Dev, "The Selective Anti-
IL17A Monoclonal Antibody Secukinumab (AIN457) Attenuates IL17A-Induced Levels
of IL6 in Human Astrocytes," vol. 62, ed: GLIA, 2014, pp. 725-735.
[35] T. B. Martins et al., "Analysis of Proinflammatory and Anti-Inflammatory Cytokine
Serum Concentrations in Patients With Multiple Sclerosis by Using a Multiplexed
Immunoassay," vol. 136, ed: American Journal of Clinical Pathology, 2011, pp. 696-704.
[36] H. T. Lee et al., "Transcription-related element gene expression pattern differs between
microglia and macrophages during inflammation," vol. 63, ed: Inflammation Research,
2014, pp. 389-397.
[37] Y. He, N. Taylor, L. Fourgeaud, and A. Bhattacharya, "The role of microglial P2X7:
modulation of cell death and cytokine release " vol. 14, ed: Journal of
Neuroinflammation, 2017, 135.
[38] A. H. Wrede, A. Shah, M. C. McNamara, R. Montazami, and N. N. Hashemi, "Controlled
positioning of microbubbles and induced cavitation using a dualfrequency transducer and
microfiber adhesion techniques," vol. 43, ed: Ultrasonics Sonochemistry, 2018, pp. 114-
119.
[39] F. Sharifi, D. Kurteshi, and N. Hashemi, "Designing Highly Structured Polycaprolactone
Fibers using Microfluidics," vol. 61, ed: Journal of the Mechanical Behavior of
Biomedical Materials, 2016, pp. 530-540.
61
[40] Z. Bai, J. M. Mendoza Reyes, R. Montazami, and N. Hashemi, "On-Chip Development
of Hydrogel Microfibers from Round to Square/Ribbon Shape," vol. 2, ed: Journal of
Materials Chemistry A, 2014, pp. 4878-4884.
[41] S. Sun, J. Kanagaraj, L. Cho, D. Kang, S. Xiao, and M. Cho, "Characterization of
Subcellular Responses Induced by Exposure of Microbubbles to Astrocytes," vol. 38, ed:
Journal of Neurotrauma, 2015, pp. 1-8.
[42] F. Sharifi, B. B. Patel, A. K. Dzuilko, R. Montazami, D. S. Sakaguchi, and N. Hashemi,
"Polycaprolactone Microfibrous Scaffolds to Navigate Neural Stem Cells,"
Biomacromolecules, vol. 17, 2016, pp. 3287-3297.
[43] B. B. Patel, F. Sharifi, D. P. Stroud, R. Montazami, N. N. Hashemi, and D. S. Sakaguchi,
"3D Microfibrous Scaffolds Selectively Promotes Proliferation and Glial Differentiation
of Adult Neural Stem Cells: A Platform to Tune Cellular Behavior in Neural Tissue
Engineering," vol. 18, ed: Macromolecular Bioscience, 2018, 1800236.
[44] K. J. Livak and T. D. Schmittgen, "Analysis of relative gene expression data using real-
time quantitative PCR and the 2(-Delta Delta C(T)) Method," vol. 25, ed: Methods,
2001, pp. 402-408.
[45] M. B. Panzer, B. S. Myers, B. P. Capehart, and C. R. Bass, "Development of a finite
element model for blast brain injury and the effects of CSF cavitation," vol. 40, ed:
Annals of Biomedical Engineering, 2012, pp. 1530-1544.
[46] J. L. Zamanian et al., "Genomic Analysis of Reactive Astrogliosis," vol. 32, ed: Journal
of Neuroscience, 2012, pp. 6391-6410.

62
CHAPTER 5. LONGITUDINAL GENETIC STUDY OF REACTIVE ASTROCYTES
INDUCED BY NEARBY CAVITATION
Modified from a manuscript submitted in ACS Nano
Alex H. Wrede1, Jie Luo2, Reza Montazami1, Anumantha Kanthasamy2, and Nicole N.
Hashemi1,2*
1 Department of Mechanical Engineering, Iowa State University, Ames, Iowa 50011, USA
2 Department of Biomedical Sciences, Iowa State University, Ames, IA 50011, USA
Abstract
Reactive astrocytes are known to play a vital role in the overall response of the brain during a
traumatic brain injury (TBI). Modern studies have speculated the existence of cavitation in the
skull during a TBI, which has alarming potential to cause detrimental damages. Previous studies
have confirmed the upregulation of various harmful genes in neurodegenerative diseases.
Studying the longitudinal presence of these harmful genes in response to cavitation allows for
optimized understanding and treatment methods in cavitation exposure. We seek to characterize
the longitudinal genetic expression levels that astrocytes exhibit after exposure to cavitation and
further elucidate the startling presence of cranial cavitation. Astrocytic expression levels of
various common genes that have been documented in TBI research are our target of interest, like,
TNFα, IL-1β, and NOS1. Results summarize specific gene trends from 1-48 hours after
cavitation. Our data concludes that maximum expression is not consistently exhibited

63
immediately after cavitation exposure, and most genes have individualized genetic trends. IL-1β
shows a decreasing expression over 48 hours, and TNFα shows upregulation until the 6 hour
time point but then begins to decrease in expression. The upregulation of NOS1 has been
documented in neurodegenerative diseases, like Alzheimer’s and Parkinson’s disease. This study
has shown a consistent upregulation in NOS1 expression from 0-48 hours. These results
postulate a possible linkage between cavitation damage and neurodegenerative diseases. This
analysis also provides novelty in optimizing treatments for astrocytic function post-TBI and
legitimizing the concern of cranial cavitation existence. These results add motivation for future
studies of cavitation elimination or minimization via advanced helmet and airbag engineering.
5.1 Introduction
Despite an abundance of recent efforts in TBI research, there are still undiscovered
attributes in the neuronal response to these situations. Reactive astrocytes play a vital role in a
variety of neurodegenerative diseases, including Alzheimer’s disease and Parkinson’s disease[1-
3]. Previous studies have shown that the effects from altered astrocytic gene expression is
dependent on the specific inducer of the trauma, adding an increased level of complexity in TBI
response characterization. For example, ischemia induced astrocytic change represents a genetic
phenotype that is beneficial and sustaining to surrounding neuronal anatomy. On the contrary, an
inflammatory exposure, like lipopolysaccharide (LPS), induced astrocytes that cause detrimental
gene alterations[4].
For simplicity, scientists have categorized detrimental reactive astrocytes as ‘A1’
astrocytes and protective reactive astrocytes as ‘A2’ astrocytes[3]. Ischemia and LPS are two
possible exposures that will induce reactive astrocytes, but it remains a question as to how

64
reactive astrocytes respond differently to other types of TBI exposures. A modern theory
postulates that a likely inducer of reactive astrocytes following a blast-TBI is the presence of
cavitation[5].
Cavitation is a byproduct of low pressure regions in the brain, which are a result from an
initial compressive wave reflecting off the opposite side of the skull[6, 7]. The localized force
from cavitation leaves behind profound damages in other applications, like boat propeller and
hydrodynamic pump erosion[8, 9]. Understanding whether surrounding cavitation exposure
produces A1s, A2s, or a combination of each, is critical in order to further unmask the
complexity of TBIs. Previous research has analyzed the specific astrocytic gene expression
alterations immediately after experiencing surrounding cavitation. These results showed an
upregulation in a number of classic A1 specific genes, including TNFα, IL-1β, C1q, Serping1,
NOS1, and IL-6. Results showed minimal changes in classic A2 specific genes with the
exception of CD14[10].
In this study, we expand on previous methods to conduct a longitudinal study that
specifically elucidates astrocytic gene expression abnormalities over time, after experiencing
exposure to surrounding cavitation. It is known that gene expressions can change over time and
further characterizing this trend in reactive astrocytes has great potential[4], like leading to
advanced pharmaceutical techniques to restore altered cellular function. This study analyzes the
astrocytic gene expressions up to 48 hours post-cavitation exposure via quantitative polyermase
chain reaction methods (qPCR) methods. These genetic analytics yield insight on the behaviors
that reactive astrocytes exhibit after exposure to nearby cavitation and provide a foundation of
knowledge that helps further characterize reactive astrocytic nature in TBIs.

65
5.2 Materials and Methods
5.2.1 Cell Model
Mouse astrocytes (CRL-2541, ATCC, Manassas, VA) are solely used in this project
because of their documented utility in TBI studies[11, 12]. The astrocytes were cultured
according to company protocol in base media (ATCC, 30-2002). The growth media was also
composed of 10% FBS and 1% penicillin (10,000 U/mL)- streptomycin (10,000 μg/mL) (Gibco,
Waltham, MA). All cells in this study were from culture passage numbers 5-7. The astrocytes
were stored in an incubator set with constant parameters of 37 °C and 5% CO2. The mouse
astrocytes were seeded into the 6-plates at a concentration of 9.04 ∗ 10� cells per well and stored
for 24 hours in the incubator prior to experimentation.
5.2.2 Apparatus Configuration and Methodology
The method of creating controlled cavitation is similar to that of previous studies[13].
The main difference in the apparatus configuration of this experiment is the cells are seeded onto
sterilized 6-well culture plates instead of using microfiber scaffolds, shown in Figure 5.1. All
components are housed in a 1.5 gallon tank filled with phosphate buffered saline (PBS). During
trials, the experimental samples are directed downward toward capillary tubing (Polymicro
Technologies, 1068150003) that is continuously releasing microbubbles (MBs) ~60μm in
diameter at a rate of ~150 MBs/min. The 6-well plate is mounted on a 3-axis adjustable stage
(MT1, Thor Labs, Newton, New Jersey) allowing for MBs to adhere arbitrarily across the cell-
seeded surface. After a 350-400 MBs are adhered to each well the culture plate is then rotated
180°, exposing the astrocyte-MB complex to a 100 kHz transducer positioned overhead in the
tank. The transducer induces resonant conditions causing the MBs to oscillate and fragment, also

66
known as induced cavitation (center frequency 100 kHz, 5 cycles, pulse repetition frequency 59
Hz, 260 Vpp). The frequency signal is amplified using a broadband power amplifier (E&I,
1140LA). The control samples were introduced to an interchangeable environment, but they did
not experience nearby cavitation because there were not any MBs arbitrarily captured in these
wells.
Figure 5.1: Apparatus layout of MB capturing and induced cavitation on cell-laden 6-well
plates. (A) 350-400 MBs are captured and adhered to the bottom of all the cell-laden culture
wells. (B) The 6-well plate is rotated 180° and exposed to the 100 kHz transducer. The
transducer is centered above each well individually. When the transducer is turned on the
astrocytes are introduced to surrounding cavitation.
A full 6-well plate was designated for a specific time point, three wells for experimental
samples and 3 wells for control samples. Designating one plate for each time point was
advantageous because the experimental and control samples experienced exact amounts of PBS
and ultrasound exposure with this orientation. Another advantage of this setup is the ability to
retain cells that detached from the well due to the cavitation force. When the cells detach they
drift within the boundaries of each specific well, allowing them to be part of the post-cavitation
analysis. Previous methods use cell-laden coverslips without ridges so the detached cells are
unable to be collected[10]. After the plate was pulled from the tank, the remaining PBS solution
67
was pipetted out and replaced with fresh growth media. The pipetted PBS was centrifuged at 1500
rpm for five minutes to collect all the detached cells. The pelleted cells were put back in the
original wells and placed in the incubator until its specific designated time point after exposure.
Astrocyte response was studied 1 hour, 3 hours, 6 hours, 12 hours, 24 hours, and 48 hours after
cavitation exposure.
5.2.3 Gene Expression Analysis via qPCR
The cell-laden 6-well plates were trypsinized and combined to create one control and one
experimental sample at each designated time point. Each sample was then centrifuged at 1500
rpm for 5 minutes to pellet the cells. The cell pellet was broken with TRIzol reagent (Invitrogen
Cat number: 15596026) and frozen at -80 °C until all time points were resuspended.
Homogenization was done in TRIzol RNA isolation and specifically conducted following the
TRIzol reagent protocol from the manufacturer. The entirety of the qPCR process in obtaining
relative gene expression values is consistent with that of previous studies[10, 14].
5.3 Results and Discussion
Longitudinal gene expression analysis has been done on both A1 and A2 genes from 1-48
hours. Figure 5.2 highlights the expression trends for A1 genes, including, Serping1, C1q, TNFα,
NOS1, IL-6, and IL-1β. All data is represented as a fold change that is normalized to a control
sample that was absent of cavitation damage. This data collection is an exploratory approach to
elucidate any noticeable trends in expression values. Combining these trends with previous data
that quantitates the expressions immediately after cavitation allows for a full 48 hour
timeline[10].

68
Figure 5.2: Longitudinal gene expression summaries of A1 genes. Error bars represent standard
error of the mean.
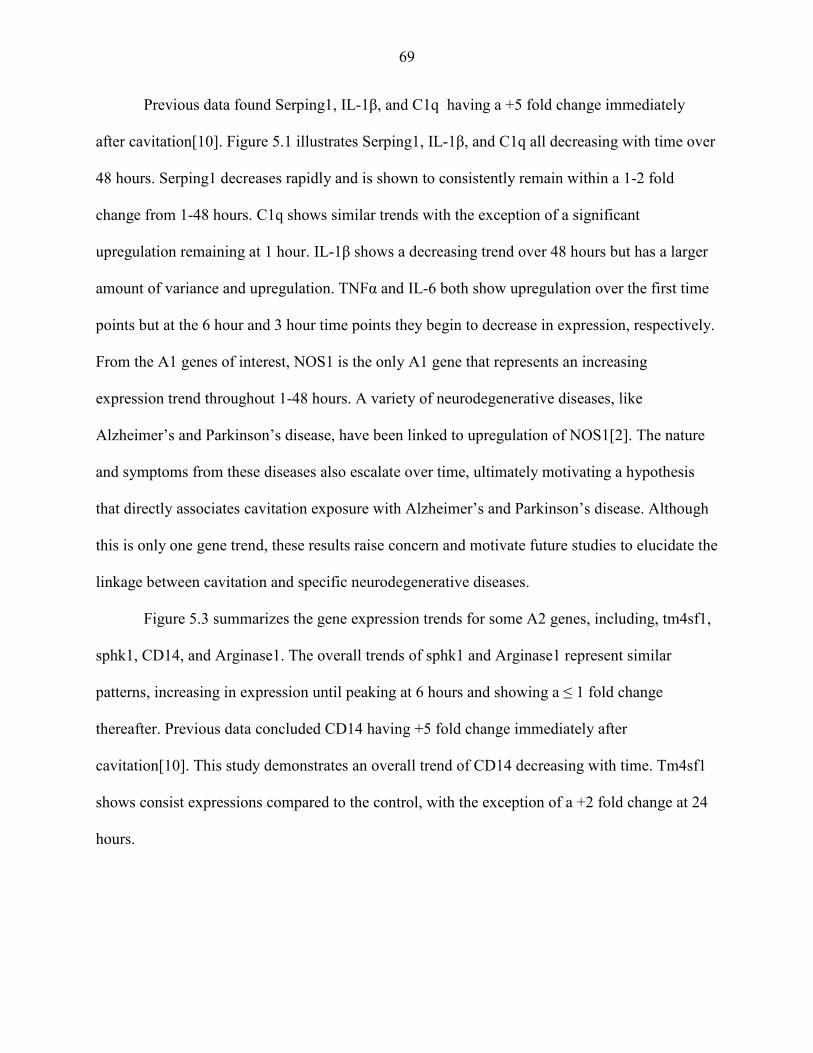
69
Previous data found Serping1, IL-1β, and C1q having a +5 fold change immediately
after cavitation[10]. Figure 5.1 illustrates Serping1, IL-1β, and C1q all decreasing with time over
48 hours. Serping1 decreases rapidly and is shown to consistently remain within a 1-2 fold
change from 1-48 hours. C1q shows similar trends with the exception of a significant
upregulation remaining at 1 hour. IL-1β shows a decreasing trend over 48 hours but has a larger
amount of variance and upregulation. TNFα and IL-6 both show upregulation over the first time
points but at the 6 hour and 3 hour time points they begin to decrease in expression, respectively.
From the A1 genes of interest, NOS1 is the only A1 gene that represents an increasing
expression trend throughout 1-48 hours. A variety of neurodegenerative diseases, like
Alzheimer’s and Parkinson’s disease, have been linked to upregulation of NOS1[2]. The nature
and symptoms from these diseases also escalate over time, ultimately motivating a hypothesis
that directly associates cavitation exposure with Alzheimer’s and Parkinson’s disease. Although
this is only one gene trend, these results raise concern and motivate future studies to elucidate the
linkage between cavitation and specific neurodegenerative diseases.
Figure 5.3 summarizes the gene expression trends for some A2 genes, including, tm4sf1,
sphk1, CD14, and Arginase1. The overall trends of sphk1 and Arginase1 represent similar
patterns, increasing in expression until peaking at 6 hours and showing a ≤ 1 fold change
thereafter. Previous data concluded CD14 having +5 fold change immediately after
cavitation[10]. This study demonstrates an overall trend of CD14 decreasing with time. Tm4sf1
shows consist expressions compared to the control, with the exception of a +2 fold change at 24
hours.

70
Figure 5.3: Longitudinal gene expression summaries of A2 genes. Error bars represent standard
error of mean.
This exploratory study has illustrated the unique response that cavitation induces on
various A1 and A2 genes. These are the beginning trials of this investigation and future research
aims to conduct RNA sequencing analytics to highlight larger groupings in the entire genome
that experience expression alterations. The selected genes of this study were chosen based off of
significance in existing literature. RNA sequencing will expose additional groups of genes that
are of interest. Postulating a method of treatment has some value with the collected data of this

71
study, but it is important to remember that cavitation is one of multiple injuries that occur during
a TBI. Studying the genetic trends from overall TBI exposure has been heavily researched and
treatment techniques have been proposed[15]. The genetic responses gathered in this study help
raise awareness of the distinct changes that astrocytes undergo from solely cavitation exposure.
The conditions in which cavitation likely exists in the human skull is, for the most part, unknown
so we are proposing further studies that focus on characterizing the parameters that allow
cavitation to exist in a TBI situation. The ultimate goal would be to take the parameter limits and
engineer helmets and automotive airbags to keep the conditions within the skull from reaching
these thresholds. Using these proposed parameter limits in conjunction with the longitudinal
results from this study, treatments can be given at the optimized time point to assist in cranial
recovery if the skull was simulated through a cavitation-inducing environment. All in all,
cavitation existing in the skull urges the motivation for many future studies. The longitudinal
genetic trends in this study are novel in helping piece together the complexity of the unique
response that the brain has to cavitation.
5.4 Conclusion
Optimizing the specific diagnosis and care for TBIs is currently a major challenge. This
is due to the fact that TBIs are a complex injury that have a variety of parameters to account for.
Recent studies have added an additional layer to this puzzle with the idea that cavitation exists
inside the skull during a TBI. Studying the response that neuronal anatomy has to this event is
vital in optimizing TBI diagnosis and care. This study has documented the longitudinal gene
expression trends that exist in a number of common A1 and A2 genes. Results have shown that
each A1 and A2 gene of interest has a unique expression response and peaks at varying time

72
points. Treatments should be optimally given prior to the discovered peaks of the A1 genes to
reduce damages that are known to be present in neurodegenerative diseases. These findings are
novel in the progression of TBI knowledge and help illustrate more of the nature in the response
of the brain in TBI situations. Future studies aim to expand on these results and gather complete
genome trends.
References
[1] R. M. Ransohoff and J. E. Khoury, "Microglia in Health and Disease," vol. 8, ed: Cold
Spring Harbor Perspectives in Biology, 2015, p. 1.
[2] A. Bhattacharya, N. C. Derecki, T. W. Lovenberg, and W. C. Drevets, "Role of neuro-
immunological factors in the pathophysiology of mood disorders," vol. 233, ed:
Psychopharmacology, 2016, pp. 1623-1636.
[3] S. A. Liddelow et al., "Neurotoxic reactive astrocytes are induced by activated
microglia," vol. 541, ed: Nature, 2017, pp. 481-487.
[4] J. L. Zamanian et al., "Genomic Analysis of Reactive Astrogliosis," vol. 32, ed: Journal
of Neuroscience, 2012, pp. 6391-6410.
[5] C. Franck, "Microcavitation: the key to modeling blast traumatic brain injury?," vol. 2,
ed: Concussion, 2017, p. 3.
[6] R. S. Salzar, D. Treichler, A. Wardlaw, G. Weiss, and J. Goeller, "Experimental
Investigation of Cavitation as a Possible Damage Mechanism in Blast-Induced
Traumatic Brain Injury in Post-Mortem Human Subject Heads," vol. 34, ed: Journal
of Neurotrauma, 2017, pp. 1589-1602.
[7] S. Canchi, K. Kelly, Y. Hong, M. A. King, G. Subhash, and M. Sarntinoranont,
"Controlled single bubble cavitation collapse results in jet-induced injury in brain tissue,"
vol. 74, ed: Journal of the Mechanical Behavior of Biomedical Materials, 2017, pp. 261-
273.
[8] Z.-f. Zhu and S.-l. Fang, "Numerical investigation of cavitation performance of ship
propellers," vol. 24, ed: Journal of Hydrodynamics, 2012, pp. 347-353.
[9] L. Chernin and D. V. Val, "Probabilistic prediction of cavitation on rotor blades of tidal
stream turbines," vol. 113, ed: Renewable Energy, 2017, pp. 688-696.
73
[10] A. H. Wrede, M. C. McNamara, J. Luo, R. Montazami, A. Kanthasamy, and N. N.
Hashemi, "Characterization of Astrocytic Response after Experiencing Cavitation In
vitro," ed: Global Challenges, 2019.
[11] S. Sun, J. Kanagaraj, L. Cho, D. Kang, S. Xiao, and M. Cho, "Characterization of
Subcellular Responses Induced by Exposure of Microbubbles to Astrocytes," vol. 38, ed:
Journal of Neurotrauma, 2015, pp. 1-8.
[12] H. Jang et al., "Hydrogen Sulfide Treatment Induces Angiogenesis After Cerebral
Ischemia," vol. 92, ed: Journal of Neuroscience Research, 2014, pp. 1520-1528.
[13] A. H. Wrede, A. Shah, M. C. McNamara, R. Montazami, and N. N. Hashemi, "Controlled
positioning of microbubbles and induced cavitation using a dualfrequency transducer and
microfiber adhesion techniques," vol. 43, ed: Ultrasonics Sonochemistry, 2018, pp. 114-
119.
[14] K. J. Livak and T. D. Schmittgen, "Analysis of relative gene expression data using real-
time quantitative PCR and the 2(-Delta Delta C(T)) Method," vol. 25, ed: Methods,
2001, pp. 402-408.
[15] Y. H. Chen et al., "Rapamycin improves the neuroprotection effect of inhibition of
NLRP3 inflammasome activation after TBI," vol. 1710, ed: Brain Research, 2019, pp.
163-172.

74
CHAPTER 6. FUTURE WORK
It is known that when astrocytes enter a reactive state they change morphologically [1].
Morphological studies have been conducted in previous chapters to visually analyze the
longitudinal structural changes of the astrocytes over time. Additional future studies seek to use
microfluidic chips to sort cells based on their size. These microfluidic chips have optimized
dimensions and groove patterns to deflect cells differently based on their morphological size.
Theoretically cells that experience cavitation likely represent a smaller size because they show
an amoeboid morphology when they are stunned or damaged. These cells will likely deflect in
the microfluidic channels more than undamaged cells and collect in wells 4&5 shown in Figure
6.1. Comparative analysis on the percent volume of sorted control and experimental samples
would help elucidate distinct morphology change as a result of nearby cavitation. These
microfluidic chips are also used to sort cells based on other biomechanical properties that has
potential to provide additional novelty [2].
Figure 6.1: Microfluidic mold of a size sorting cellular device [2].

75
In our genetic studies we selected genes of interest based on a literature review of gene
that are present in reactive astrocytes as a result of TBIs. Using qPCR methods we were able to
characterize the genetic trends in these genes after experiencing cavitation exposure.
Implementing RNA sequencing on the astrocyte samples would yield additional novelty and
allow for genetic insight on the complete genome. We did not have the resources to conduct
these tests and we took more of an exploratory approach to see immediate expression trends in
our genes of interest. Additionally, single cell RNA sequencing is a technique used to gather
genomic data on small amounts of cells. This testing would be very novel to implement and use
to characterize the genomic representation of the astrocytes that are seeded on PCL microfibers
in chapter 4, and specifically illustrated in Figure 4.4. Because we did not have access to this
type of analysis we increased the scale of cell count and implemented qPCR methods to conduct
genetic analysis.
References
[1] U. Wilhelmsson et al., "Redefining the concept of reactive astrocytes as cells that remain
within their unique domains upon reaction to injury," vol. 103, ed: PNAS, 2006, pp.
17513-17518.
[2] G. Wang, C. Turbyfield, K. Crawford, A. Alexeev, and T. Sulchek, "Cellular enrichment
through microfluidic fractionation based on cell biomechanical properties " vol. 19, ed:
Microfluid Nanofluid, 2015, pp. 987-993.