Contribution to the Analysis of Depopulation in Rural ...
23
sustainability Article Contribution to the Analysis of Depopulation in Rural Areas of the Balkans: Case Study of the Municipality of Niksic, Montenegro Biljana Mickovic 1 , Dragica Mijanovic 1 , Velibor Spalevic 1, * , Goran Skataric 2,3 and Branislav Dudic 3,4, * 1 Department of Geography, Faculty of Philosophy, University of Montenegro, D. Bojovica bb, 81400 Niksic, Montenegro; [email protected] (B.M.); [email protected] (D.M.) 2 National parks of Montenegro, 16, Vojvode Becir-bega Osmanagica, 81000 Podgorica, Montenegro; [email protected] 3 Faculty of Economics and Engineering Management, University Business Academy, 400107 Novi Sad, Serbia 4 Faculty of Management, Comenius University in Bratislava, 811 02 Bratislava, Slovakia * Correspondence: [email protected] (V.S.); [email protected] (B.D.); Tel.: +382-67-201-222 (V.S.); +421-250-117-403 (B.D.) Received: 10 March 2020; Accepted: 13 April 2020; Published: 20 April 2020 Abstract: This paper analyses demographic trends and population decline of the rural area surrounding Niksic, Montenegro, from the second half of the 20th century to the first two decades of the 21st century. After World War II, industry in Niksic began to develop strongly. A large number of state enterprises started to operate, and the consequent industrialisation and improved living conditions triggered a wave of migration from the surrounding rural areas to Niksic. The paper describes the depopulation of rural areas and the causes and consequences of migration within the Municipality of Niksic based on an analysis of population movement and density, the rural and urban populations, and the age structure of the population. Transformations of the economy after 1990 indicate that the neglect of agriculture and the destruction of agricultural land are mistakes that will prove difficult to correct. The results of our research reveal that, today, revitalisation of the countryside is only possible if non-agricultural activities are brought to the area centres and the quality of life is improved in the villages, which would reduce unemployment in the city. A solid traffic infrastructure between individual settlements and their connection with the city is also necessary. Between 2003 and 2011, the agricultural population increased by 1.2%, which gives hope because agriculture is now being recognised as significant, and a movement for changing the inherited negative perception of it is being created. This research is addressed to the state and municipal administrations of the region with the message to implement responsible and timely measures to revitalise the countryside and stop the extinction of the villages. Keywords: depopulation; migration processes; demographic factors; rural development 1. Introduction Rural migration, which may be from rural to urban areas, be permanent or temporary, as well as be internal or international, constitutes a key component of human population movement. Rural areas contain most of the world’s natural resources, such as water, land, and forests, and rural migration and its relationship to the rural environment should attract increasing interest in research on depopulation in rural areas, its eco–socio–economic damages, and population–environment linkages [1]. A rapidly developing economy and growing urbanisation have resulted in the largest rural-to-urban migration in human history [2]. This is a widespread phenomenon in developing countries [3], but has also occurred Sustainability 2020, 12, 3328; doi:10.3390/su12083328 www.mdpi.com/journal/sustainability
Transcript of Contribution to the Analysis of Depopulation in Rural ...

sustainability
Article
Contribution to the Analysis of Depopulation inRural Areas of the Balkans: Case Study of theMunicipality of Niksic, Montenegro
Biljana Mickovic 1, Dragica Mijanovic 1, Velibor Spalevic 1,* , Goran Skataric 2,3 andBranislav Dudic 3,4,*
1 Department of Geography, Faculty of Philosophy, University of Montenegro, D. Bojovica bb, 81400 Niksic,Montenegro; [email protected] (B.M.); [email protected] (D.M.)
2 National parks of Montenegro, 16, Vojvode Becir-bega Osmanagica, 81000 Podgorica, Montenegro;[email protected]
3 Faculty of Economics and Engineering Management, University Business Academy, 400107 Novi Sad, Serbia4 Faculty of Management, Comenius University in Bratislava, 811 02 Bratislava, Slovakia* Correspondence: [email protected] (V.S.); [email protected] (B.D.);
Tel.: +382-67-201-222 (V.S.); +421-250-117-403 (B.D.)
Received: 10 March 2020; Accepted: 13 April 2020; Published: 20 April 2020�����������������
Abstract: This paper analyses demographic trends and population decline of the rural areasurrounding Niksic, Montenegro, from the second half of the 20th century to the first two decades ofthe 21st century. After World War II, industry in Niksic began to develop strongly. A large numberof state enterprises started to operate, and the consequent industrialisation and improved livingconditions triggered a wave of migration from the surrounding rural areas to Niksic. The paperdescribes the depopulation of rural areas and the causes and consequences of migration within theMunicipality of Niksic based on an analysis of population movement and density, the rural and urbanpopulations, and the age structure of the population. Transformations of the economy after 1990indicate that the neglect of agriculture and the destruction of agricultural land are mistakes that willprove difficult to correct. The results of our research reveal that, today, revitalisation of the countrysideis only possible if non-agricultural activities are brought to the area centres and the quality of life isimproved in the villages, which would reduce unemployment in the city. A solid traffic infrastructurebetween individual settlements and their connection with the city is also necessary. Between 2003and 2011, the agricultural population increased by 1.2%, which gives hope because agriculture is nowbeing recognised as significant, and a movement for changing the inherited negative perception of itis being created. This research is addressed to the state and municipal administrations of the regionwith the message to implement responsible and timely measures to revitalise the countryside andstop the extinction of the villages.
Keywords: depopulation; migration processes; demographic factors; rural development
1. Introduction
Rural migration, which may be from rural to urban areas, be permanent or temporary, as well asbe internal or international, constitutes a key component of human population movement. Rural areascontain most of the world’s natural resources, such as water, land, and forests, and rural migration andits relationship to the rural environment should attract increasing interest in research on depopulationin rural areas, its eco–socio–economic damages, and population–environment linkages [1]. A rapidlydeveloping economy and growing urbanisation have resulted in the largest rural-to-urban migration inhuman history [2]. This is a widespread phenomenon in developing countries [3], but has also occurred
Sustainability 2020, 12, 3328; doi:10.3390/su12083328 www.mdpi.com/journal/sustainability

Sustainability 2020, 12, 3328 2 of 23
in most industrialised countries and has contributed significantly to a reduction in agro-ecologicalproductivity [4]. Therefore, a comprehensive understanding of its prevalence and magnitude over theterritory is increasingly important for sociological and political reasons [5–7]. This paper specificallyexamines the case of Niksic, Montenegro. Because of the limited availability of internal migration datafor Montenegro, which was previously derived from the decennial population census and a small-scalehousehold survey, we could not obtain suitable observations for rural depopulation dynamics acrossthe country.
The methodology of the Organisation for Economic Co-operation and Development (OECD)defines that a community is considered rural if the population density is less than 150 people persquare kilometre [8–11]. Taking this into account, almost all of Montenegro can be considered rural.Looking at the three regions of Montenegro (northern, central, and southern), and according to theOECD methodology, the northern region covers 13 municipalities and is predominantly rural (in ruralareas lives 59.7% of the population), while the southern coastal and central regions (41.7% and 20.4%,respectively) are considered transitional [12–14].
Rural areas are characterised by three interrelated trends: economic diversification,deagrarianisation, and depopulation [15]. Montenegro, and particularly the municipality of Niksic,exemplifies these trends. Until the second half of the 20th century, the countryside in Montenegro hada healthy population pyramid; it was a source of population renewal, had a young labour force ofconsiderable size, and had great potential in terms of population reconstruction and strengthening ofthe urban settlements [12,13].
The objective of this paper is to contribute to the analyses of the depopulation processes of ruralareas of Montenegro, providing some specific views from studying the area of the Municipality ofNiksic for the period from the second half of the 20th century to the first two decades of the 21stcentury. In addition to the causes, the spatial and temporal movement of the population of Niksic andthe physical and cultural consequences will be discussed.
2. Materials and Methods
2.1. Montenegro
The study area of the Niksic Municipality is located in Montenegro, which is part of the BalkanPeninsula. It is situated in south-eastern Europe (Figure 1) between the Adriatic Sea (coastal line of293.5 km) and Croatia (to the southwest), Bosnia and Herzegovina (northwest), Serbia (northeast),and Albania (southeast), with a total border line of 680 km [16].
Sustainability 2020, 12, x FOR PEER REVIEW 2 of 23
countries [3], but has also occurred in most industrialised countries and has contributed significantly to a reduction in agro-ecological productivity [4]. Therefore, a comprehensive understanding of its prevalence and magnitude over the territory is increasingly important for sociological and political reasons [5–7]. This paper specifically examines the case of Niksic, Montenegro. Because of the limited availability of internal migration data for Montenegro, which was previously derived from the decennial population census and a small-scale household survey, we could not obtain suitable observations for rural depopulation dynamics across the country.
The methodology of the Organisation for Economic Co-operation and Development (OECD) defines that a community is considered rural if the population density is less than 150 people per square kilometre [8–11]. Taking this into account, almost all of Montenegro can be considered rural. Looking at the three regions of Montenegro (northern, central, and southern), and according to the OECD methodology, the northern region covers 13 municipalities and is predominantly rural (in rural areas lives 59.7% of the population), while the southern coastal and central regions (41.7% and 20.4%, respectively) are considered transitional [12–14].
Rural areas are characterised by three interrelated trends: economic diversification, deagrarianisation, and depopulation [15]. Montenegro, and particularly the municipality of Niksic, exemplifies these trends. Until the second half of the 20th century, the countryside in Montenegro had a healthy population pyramid; it was a source of population renewal, had a young labour force of considerable size, and had great potential in terms of population reconstruction and strengthening of the urban settlements [12,13].
The objective of this paper is to contribute to the analyses of the depopulation processes of rural areas of Montenegro, providing some specific views from studying the area of the Municipality of Niksic for the period from the second half of the 20th century to the first two decades of the 21st century. In addition to the causes, the spatial and temporal movement of the population of Niksic and the physical and cultural consequences will be discussed.
2. Materials and Methods
2.1. Montenegro
The study area of the Niksic Municipality is located in Montenegro, which is part of the Balkan Peninsula. It is situated in south-eastern Europe (Figure 1) between the Adriatic Sea (coastal line of 293.5 km) and Croatia (to the southwest), Bosnia and Herzegovina (northwest), Serbia (northeast), and Albania (southeast), with a total border line of 680 km [16].
Figure 1. Position of Montenegro in Europe [16] and the municipality of Niksic in Montenegro. Figure 1. Position of Montenegro in Europe [16] and the municipality of Niksic in Montenegro.
Sustainability 2020, 12, 3328 3 of 23
The terrain has a highly indented coastline, with a narrow coastal plain on the backdrop of rugged,high limestone mountains and plateaus, with a mean elevation of 1086 m. The Dinaric Alps area western Balkan mountain range comprising mainly NW–SE-oriented ridges [17,18], with severalgeomorphological regions (Figure 2).
Sustainability 2020, 12, x FOR PEER REVIEW 3 of 23
The terrain has a highly indented coastline, with a narrow coastal plain on the backdrop of rugged, high limestone mountains and plateaus, with a mean elevation of 1086 m. The Dinaric Alps are a western Balkan mountain range comprising mainly NW–SE-oriented ridges [17,18], with several geomorphological regions (Figure 2).
Figure 2. Geomorphologic regions of Montenegro with a range of altitudes and distances [18–20].
The coastal zone has small, sandy beaches with limestone rocks behind them (heights of 800 a ria coast centred on Boka Kotorska, and a large debris cone on which sandy beaches have developed in the river basin of Bojana in the southeast [21]. The central and northwest zone has Quaternary materials and comprises Niksic Polje, Zeta-Bjelopavlici Valley, with the capital of Podgorica centrally located in this plain, and Skadar Lake south of Podgorica. To the north-northwest is the region of Durmitor Flysch, with a relatively soft lithology dominated by sandstones, siltstones, marls, and conglomerates. To the east-northeast is the Polimlje region and Prokletije Mountains, with Zla Kolata (2535 m), the highest peak of Montenegro. This part consists a varied geology (schists, sand- and limestone, volcanic outcrops, and dolomites) and glacial
Figure 2. Geomorphologic regions of Montenegro with a range of altitudes and distances [18–20].
The coastal zone has small, sandy beaches with limestone rocks behind them (heights of 800 m),a ria coast centred on Boka Kotorska, and a large debris cone on which sandy beaches have developed inthe river basin of Bojana in the southeast [21]. The central and northwest zone has Quaternary materialsand comprises Niksic Polje, Zeta-Bjelopavlici Valley, with the capital of Podgorica centrally locatedin this plain, and Skadar Lake south of Podgorica. To the north-northwest is the region of DurmitorFlysch, with a relatively soft lithology dominated by sandstones, siltstones, marls, and conglomerates.To the east-northeast is the Polimlje region and Prokletije Mountains, with Zla Kolata (2535 m),

Sustainability 2020, 12, 3328 4 of 23
the highest peak of Montenegro. This part consists of a varied geology (schists, sand- and limestone,volcanic outcrops, and dolomites) and glacial geomorphic features. The canyon of the Tara Riverrepresents the border with the northern crystalline hills and covers a large part of the country alongthe northeast border. This part mainly has sandstone sediments, flysch, and softer materials, formingan undulating landscape.
The percentage shares for the three different types of land use are as follows: agriculturalland—38.2% (arable land: 12.9%; permanent crops: 1.2%; permanent pasture: 24.1%); forest—40.4%;and other—21.4%. Plant Production is characterized by a large number of small agricultural holdings,all of which grow different crops. Favourable natural conditions enable the growing of citrus andcontinental fruits, as well as almost all types of vegetables. According to the Sectoral Study for Fruitsand Vegetables (2014), citrus production represented the largest amount (24.4%) closely followed byplums (24.2%), mostly used for making brandy, while a small percentage is processed into jams andpreserves, dried, or consumed fresh. The production of apples represents 15.8% and figs 11.1%; both ofthese are also significant. The most dominant crops in Montenegro are maize, wheat, barley, alfalfa,and clover. Within the scope of vegetable production, potatoes represent half of the produce; this cropis mostly grown in the Northern Region.
Uncultivated, natural meadows make up the majority of the total meadow area. They haverelatively low yields (1.5–18 tons of hay/ha), because no agro-technical measures of any kind are appliedto large parts of this land. Natural meadows and pastures, which have the greatest potential for theproduction of forage plants, are increasingly exposed to degradation; this is reflected in unfavourablechanges to the botanic composition, in increased levels of worthless and harmful plant varieties, etc.
Livestock breeding allows Montenegro to exploit less productive areas (pastures and meadows).Cattle breeding is the most important sector of livestock production with approximately 89,058 heads,of which 65,691 are breeding heads (cows and breeding heifers). Sheep breeding represents animportant branch of livestock breeding, with 6088 holdings that rear sheep (190,843 heads). Goatbreeding is very important in the karst areas of Montenegro, especially for the studied area of Niksic,because natural conditions are considerably less favourable for rearing other types of ruminants(bovine or ovine). The total number of goats reared on agricultural holdings in Montenegro amountedto 29,657.
Organic production is a key development opportunity for Montenegrin agriculture, especiallytaking into account the availability of very favourable natural conditions that are reflected in thecountry’s uncontaminated soil, water, and air.
2.2. Recent History
Montenegro is a Mediterranean country with a turbulent history. After World War II, from theKingdom of Yugoslavia (1918–1945), post-war Yugoslavia (1945–1990) was reorganised as a federationof six socialist republics, including the following: Bosnia and Herzegovina, Croatia, Macedonia,Montenegro, Serbia, and Slovenia [22]. At that time, industrialisation was causing migration fromrural areas to towns, which caused the intensification of urbanisation processes and the abandonmentof farming practices [23]. After 1950, agricultural collectivisation faded away and farmers shifted fromsubsistence- to market-based production in the next decade (1960s). Then, the steel and aluminiumindustries, as well as the energy sector, became extremely important as the State forced the developmentof the transport infrastructure [24]. The end of the 20th century was characterised by the failure of theeconomic reformation in relation to the open market, and a large decline in the economy took place inall the socialist republics of Yugoslavia [25]. Then, the State disintegrated, ending the last decade of the20th century with the Yugoslav wars. Although Montenegro was outside of the war zone, the economicsystem of this small Balkan country suffered extensively. The decision to dissolve Yugoslavia (of whichSerbia and Montenegro were then part) was concluded in 2006 after a referendum, when Montenegroand Serbia became independent states.

Sustainability 2020, 12, 3328 5 of 23
2.3. Population
According to the data received from MONSTAT, but also from the latest information receivedfrom the US Bureau of the Census (2020) and based on vital statistics registration systems, statisticsof population censuses, sample surveys pertaining to the recent past, and assumptions about futuretrends, the population of Montenegro is expected to be about 609,859 by July 2020 (MONSTAT, 2011Census: 620,029). In terms of a world country comparison of populations, it is in 171st positionout of 238 countries [16,26–30]. Population pyramid for Montenegro compared with Serbia, Croatia,and Albania presented at the Figure 3.
Sustainability 2020, 12, x FOR PEER REVIEW 5 of 23
of population censuses, sample surveys pertaining to the recent past, and assumptions about future trends, the population of Montenegro is expected to be about 609,859 by July 2020 (MONSTAT, Census: 620,029). In terms of a world country comparison of populations, it is in 171st position out 238 countries [16,26–30]. Population pyramid for Montenegro compared with Serbia, Croatia, and Albania presented at the Figure 3.
Age structure: The distribution of the population according to age (classified by sex and age group) is as follows: children (0–14 years), 18.14% (male, 57,402; female, 53,217); early working age (15–24 years), 12.78% (male 40,220; female, 37,720); prime working age (25–54 years), 39.65% (male 120,374; female, 121,461); mature working age (55–64 years), 13.41% (male, 40,099; female, 41,670); and elderly (65 years and over), 16.02% (male, 42,345; female, 55,351). These estimations are for July 2020 [12,13,16,26–30].
Figure 3. Population pyramid for Montenegro compared with Serbia, Croatia, and Albania.
Dependency ratios: With the dependency ratios, we measured the population age structure, which relates to the number of individuals who are economically “dependent” on the support of others. Dependency ratios contrast the ratio of the elderly (ages 65+ years) and youths (ages 0–14 years) with the number of those in the working-age group (ages 15–64 years). The dependency ratios were as follows: total dependency ratio, 51.1; youth dependency ratio, 27.3; and elderly dependency ratio, 23.8. According to the latest statistical data and surveys, the potential support ratio for Montenegro is 4.2 for July 2020.
Median age: The population is divided into two numerically equal groups: half are older and half are younger than this age. This single index summarises the age distribution of the population in Montenegro. The median age for the total population is 39.6 years; for males, it has been calculated as 38.1 years, and for females, it is 41.1 years. All these statistics are estimated for July 2020. A country comparison for Montenegro for this factor places it at 54th in the world [12].
Figure 3. Population pyramid for Montenegro compared with Serbia, Croatia, and Albania.
Age structure: The distribution of the population according to age (classified by sex and agegroup) is as follows: children (0–14 years), 18.14% (male, 57,402; female, 53,217); early working age(15–24 years), 12.78% (male 40,220; female, 37,720); prime working age (25–54 years), 39.65% (male120,374; female, 121,461); mature working age (55–64 years), 13.41% (male, 40,099; female, 41,670);and elderly (65 years and over), 16.02% (male, 42,345; female, 55,351). These estimations are for July2020 [12,13,16,26–30].
Dependency ratios: With the dependency ratios, we measured the population age structure,which relates to the number of individuals who are economically “dependent” on the support of others.Dependency ratios contrast the ratio of the elderly (ages 65+ years) and youths (ages 0–14 years) withthe number of those in the working-age group (ages 15–64 years). The dependency ratios were asfollows: total dependency ratio, 51.1; youth dependency ratio, 27.3; and elderly dependency ratio, 23.8.According to the latest statistical data and surveys, the potential support ratio for Montenegro is 4.2 forJuly 2020.

Sustainability 2020, 12, 3328 6 of 23
Median age: The population is divided into two numerically equal groups: half are older andhalf are younger than this age. This single index summarises the age distribution of the population inMontenegro. The median age for the total population is 39.6 years; for males, it has been calculated as38.1 years, and for females, it is 41.1 years. All these statistics are estimated for July 2020. A countrycomparison for Montenegro for this factor places it at 54th in the world [12].
Population growth: The population growth rate is −0.37% (2020 estimation), and Montenegro isin the 221st position compared with the other countries. The birth rate is 11.5 births per 1000 people(2020 estimation), putting Montenegro 171st on the list of the world countries. The death rate is10.4 deaths per 1000 people, putting it in 30th position on the world country comparison list. The netmigration rate is −4.9 migrants per 1000 people (2020 estimation).
2.4. The Municipality of Niksic
The Studied area is covering the surface of 2065 km2, and this is the largest municipality inMontenegro (previously in Yugoslavia), and it accounts for 15.0% of the territory of Montenegro(13,812 km2). Niksic, with a total population of 56,970, is also the second largest city in Montenegroafter Podgorica. The complex relief basis, climatic conditions, favourable geographical position,and transport links with the rest of Yugoslavia all affect the socio-economic development of theMunicipality of Niksic [31,32].
The territory of the studied area lies within a karst area where there is little arable land and littlewater. Therefore, except for extensive livestock farming, agriculture is very limited. In addition to theNiksic Field, in the centre of which the town of Niksic has developed, there is a significant amount ofagricultural land in the Zupa of Niksic and in the Grahovo Field. However, because Niksic has becomean important industrial centre, agricultural land has been lost to industrial and residential buildings,roads, landfills, etc. Therefore, the Niksic Field has lost its agrarian significance.
Since the 1950s, the construction of large industrial facilities has transformed Niksic into the mainindustrial centre of Montenegro. In 1948, bauxite mines began to operate, employing approximately1200 workers. In 1955, the Boris Kidric ironworks was established, employing approximately7460 workers. The Trebjesa Brewery was renovated in 1946, and its extension was completed in 1962.The Montenegro construction company was founded in Niksic in 1947 and employed approximately3000 workers. The mill, metalwork, and textile industries began to develop from 1948, employingapproximately 1500 workers. This industrial development triggered massive migration from ruralareas to the urban area of the municipality, with many migrants finding employment in the variousindustries. The massive abandonment of the countryside, especially by those of working age, led to asharp decline in agriculture and the devastation of many areas, which had serious consequences forthe Municipality of Niksic.
Due to the large number of settlements and different degrees of depopulation, we employed theconcept of demographic regionalisation in this paper. Rural settlements were divided into three zonesaccording to the distance from town, following the rule that the intensity of depopulation increaseswith greater distance from the town centre. The zones are named based on their proximity to town andthe relief characteristics of the terrain. In the first zone (Predominantly Urban—the Suburban zone),there are 13 settlements in the immediate vicinity of the town. In the second zone (Intermediate—theGreater Suburban zone) that borders the first zone, there are 20 settlements at a greater distance fromtown. Some of these are in poor terrain; others are on flat land, and therefore the depopulation is lesssevere. In the third zone (Predominantly Rural—the Mountainous zone), which includes 76 settlementsmainly located in the mountainous area of town (except for a few settlements in the Zupa of Niksic thathave less pronounced depopulation), depopulation is most evident. Indeed, there are three settlementswithout any residents.
Standard demographic methods, such as analyses and syntheses, have been employed to determinethe socio-economic characteristics of the rural area of the Municipality of Niksic and to detail thenatural, economic, social, and historical conditions of the observed rural area. Mathematical and

Sustainability 2020, 12, 3328 7 of 23
statistical methods for working with statistical material, tables, and graphs, including Microsoft Excel,and an analysis of available international and national sources on rural prosperity and depopulation,have also been employed.
2.5. Selection of Local-Scale Study Sites
A variety of settlements in terms of demographic and physical characteristics have been selectedto investigate the causes and consequences of depopulation in rural areas in the Municipality of Niksicand its residents in relation to their lifestyles and environment. Therefore, data about housing typesper settlement were used from the statistics office of Montenegro—MONSTAT; all dwellings have beencategorised as permanently/seasonally occupied or abandoned. Ultimately, nine settlements werechosen as study sites, representing all settlement types of three regions in the Municipality of Niksic.The quotes were marked with codes of themes related to the causes and consequences of depopulationin rural areas. Afterwards, relations between coded quotes were explored by bringing them togetherper category and village to study the indicators of causes and consequences of depopulation in ruralareas. The shortest distance to the city by road was measured on Google Earth.
2.6. Accessibility Analysis
The accessibility analysis used to build the typology was carried using the OECD methodologyto build the typology [7–11]. In a first step regions were classified as Predominantly Urban (PU),Intermediate (IN), or Predominantly Rural (PR). In order to identify a region as remote it was neededto perform an accessibility analysis. This type of analysis quantifies the driving time needed for acertain percentage of the population of a region to reach a populated centre. In our study, a regionis considered to be remote if at least 50% of its population needs to drive 30 min or more to reach apopulated centre. The main output of our accessibility analysis is a road network for the service areaswith 30-min time frames for the studied Municipality of Niksic.
The driving time to reach a populated centre can be influenced by several factors, in particular,the driving speeds, the traffic around urban areas and the slope of the roads. To take into accountthese three factors, a slope and a density index were computed. The slope index is a proxy for theinfluence of the terrain. The slope of the terrain was calculated using a digital elevation terrain model.The resulting slope values were reclassified in three intervals: 0%–5%, 6%–11%, and more than 11%.For the first interval, the slope index takes a value equal to 1, while for the second and third intervals ittakes the values of 1.2 and 1.5, respectively. To simplify the analysis, it was assumed that no trafficis found outside urban area of Niksic, while the traffic in urban areas has a bigger effect on minorarterials than on the principal ones. A weight equal to 1 was given to all road segments outside anurban area, while the principal arterials within an urban area, respectively, received weights equal to1.5 and 2. Finally, the road network was intersected with the slope and urban polygons layers to createa road network where every segment has a specific value assigned for the slope of the terrain and avalue to indicate if the segment belongs to an urban polygon. From this layer, the crossing time ofevery segment in the network can be calculated as follows:
CTi = (Distance o f the segment× slope index× densty index)/(speed limit× 1000/60)
We calculated the density of the road network, G, using the Surface and Distance [33] and theIntErO models of Spalevic [34–37]. We based the calculation on the following formula:
G = ΣL/F
where sum (Σ) L is the total length of the road network in km, and F is the surface of the studied area.We did the analysis of both internal areas: the studied areas for the 30-min time frame and the densityof the road network for all the studied area of the Municipality of Niksic. The surface of the 30-min
Sustainability 2020, 12, 3328 8 of 23
time frame area in the total area of the Municipality was calculated using the Surface and Distancemodel [33]. The result of the analysis is a map of the service area for a 30-min time frame.
2.7. Conducting and Processing Interviews
Semi-structured interviews were conducted to gather first-hand information about depopulationin rural areas in this municipality and, thus, the causes and consequences of depopulation overtime. The questionnaires that were used comprised of the following main subjects: the basic dataabout interviewees, the situation related to the past and current agricultural production and naturalresources management, land-use aspects, information on landscape and infrastructure, some physicalgeographical processes, personal views, and migration.
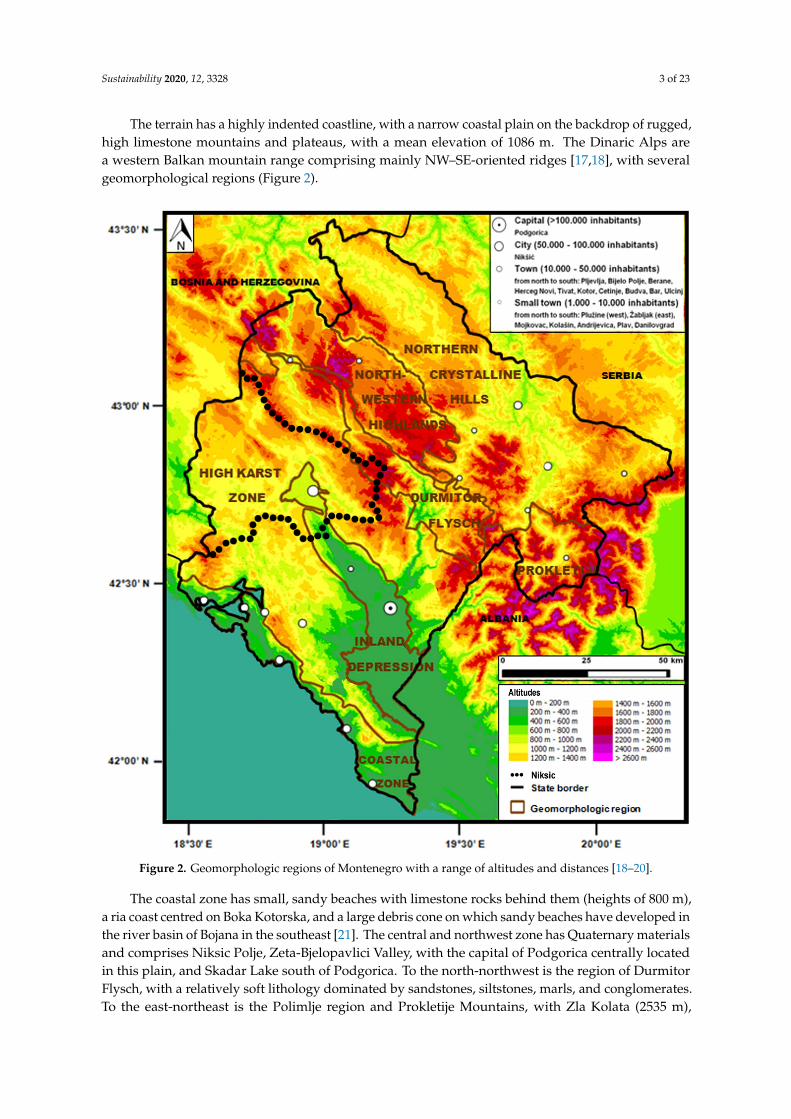
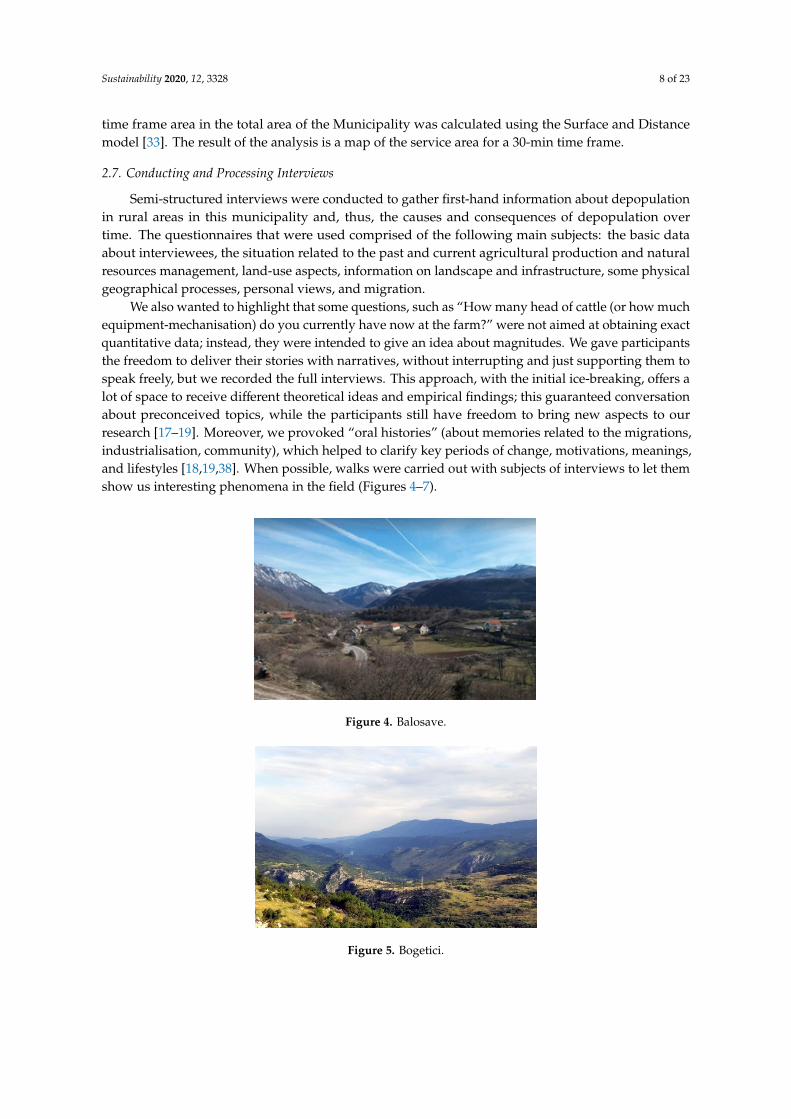
We also wanted to highlight that some questions, such as “How many head of cattle (or how muchequipment-mechanisation) do you currently have now at the farm?” were not aimed at obtaining exactquantitative data; instead, they were intended to give an idea about magnitudes. We gave participantsthe freedom to deliver their stories with narratives, without interrupting and just supporting them tospeak freely, but we recorded the full interviews. This approach, with the initial ice-breaking, offers alot of space to receive different theoretical ideas and empirical findings; this guaranteed conversationabout preconceived topics, while the participants still have freedom to bring new aspects to ourresearch [17–19]. Moreover, we provoked “oral histories” (about memories related to the migrations,industrialisation, community), which helped to clarify key periods of change, motivations, meanings,and lifestyles [18,19,38]. When possible, walks were carried out with subjects of interviews to let themshow us interesting phenomena in the field (Figures 4–7).
Sustainability 2020, 12, x FOR PEER REVIEW 8 of 23
model. The resulting slope values were reclassified in three intervals: 0%–5%, 6%–11%, and more than 11%. For the first interval, the slope index takes a value equal to 1, while for the second and third intervals it takes the values of 1.2 and 1.5, respectively. To simplify the analysis, it was assumed that no traffic is found outside urban area of Niksic, while the traffic in urban areas has a bigger effect on minor arterials than on the principal ones. A weight equal to 1 was given to all road segments outside an urban area, while the principal arterials within an urban area, respectively, received weights equal to 1.5 and 2. Finally, the road network was intersected with the slope and urban polygons layers to create a road network where every segment has a specific value assigned for the slope of the terrain and a value to indicate if the segment belongs to an urban polygon. From this layer, the crossing time of every segment in the network can be calculated as follows:
CTi= (𝐷𝑖𝑠𝑡𝑎𝑛𝑐𝑒 𝑜𝑓 𝑡ℎ𝑒 𝑠𝑒𝑔𝑚𝑒𝑛𝑡 × 𝑠𝑙𝑜𝑝𝑒 𝑖𝑛𝑑𝑒𝑥 × 𝑑𝑒𝑛𝑠𝑡𝑦 𝑖𝑛𝑑𝑒𝑥)/(𝑠𝑝𝑒𝑒𝑑 𝑙𝑖𝑚𝑖𝑡 × 1000/60)
We calculated the density of the road network, G, using the Surface and Distance [33] and the IntErO models of Spalevic [34–37]. We based the calculation on the following formula:
G = Σ 𝐿 𝐹⁄
where sum (Σ) L is the total length of the road network in km, and F is the surface of the studied area. We did the analysis of both internal areas: the studied areas for the 30-min time frame and the density of the road network for all the studied area of the Municipality of Niksic. The surface of the 30-min time frame area in the total area of the Municipality was calculated using the Surface and Distance model [33]. The result of the analysis is a map of the service area for a 30-min time frame.
2.7. Conducting and Processing Interviews
Semi-structured interviews were conducted to gather first-hand information about depopulation in rural areas in this municipality and, thus, the causes and consequences of depopulation over time. The questionnaires that were used comprised of the following main subjects: the basic data about interviewees, the situation related to the past and current agricultural production and natural resources management, land-use aspects, information on landscape and infrastructure, some physical geographical processes, personal views, and migration.
We also wanted to highlight that some questions, such as “How many head of cattle (or how much equipment-mechanisation) do you currently have now at the farm?” were not aimed at obtaining exact quantitative data; instead, they were intended to give an idea about magnitudes. We gave participants the freedom to deliver their stories with narratives, without interrupting and just supporting them to speak freely, but we recorded the full interviews. This approach, with the initial ice-breaking, offers a lot of space to receive different theoretical ideas and empirical findings; this guaranteed conversation about preconceived topics, while the participants still have freedom to bring new aspects to our research [17–19]. Moreover, we provoked “oral histories” (about memories related to the migrations, industrialisation, community), which helped to clarify key periods of change, motivations, meanings, and lifestyles [18,19,38]. When possible, walks were carried out with subjects of interviews to let them show us interesting phenomena in the field (Figures 4–7).
Figure 4. Balosave. Figure 4. Balosave.Sustainability 2020, 12, x FOR PEER REVIEW 9 of 23
Figure 5. Bogetici.
Figure 6. Dragovoljici.
Figure 7. Grahovo.
We started with the idea of having two interviews for each of the 11 settlements, but ultimately, one, two, or three interviews have been executed in each settlement until the key study questions were answered [38–40]. In total, 22 different (group) interviews were undertaken. As knowledge about depopulation in rural areas through recent history was required, elderly people were mainly interviewed; approximately 70% of the interviewees were older than 60 years. In contrast, we also interviewed the youth with the idea of receiving information on their needs and expectations. All the interviews were recorded (audio recording, notes, photographs, and video recording), transcribed, and loaded into the qualitative data analysis to structure all data and implement a constant comparison (using an open coding approach [41]). The examples of the interviews at Musikic’s family from Zupa Niksic, Bastaji Village, and from the visit to the Bosko Draskovic’s family from Grahovo held on February 2020; but also the Summary of the Interviews with youth living in the rural areas of Niksic are presented at the Supplementary material.
Figure 5. Bogetici.

Sustainability 2020, 12, 3328 9 of 23
Sustainability 2020, 12, x FOR PEER REVIEW 9 of 23
Figure 5. Bogetici.
Figure 6. Dragovoljici.
Figure 7. Grahovo.
We started with the idea of having two interviews for each of the 11 settlements, but ultimately, one, two, or three interviews have been executed in each settlement until the key study questions were answered [38–40]. In total, 22 different (group) interviews were undertaken. As knowledge about depopulation in rural areas through recent history was required, elderly people were mainly interviewed; approximately 70% of the interviewees were older than 60 years. In contrast, we also interviewed the youth with the idea of receiving information on their needs and expectations. All the interviews were recorded (audio recording, notes, photographs, and video recording), transcribed, and loaded into the qualitative data analysis to structure all data and implement a constant comparison (using an open coding approach [41]). The examples of the interviews at Musikic’s family from Zupa Niksic, Bastaji Village, and from the visit to the Bosko Draskovic’s family from Grahovo held on February 2020; but also the Summary of the Interviews with youth living in the rural areas of Niksic are presented at the Supplementary material.
Figure 6. Dragovoljici.
Sustainability 2020, 12, x FOR PEER REVIEW 9 of 23
Figure 5. Bogetici.
Figure 6. Dragovoljici.
Figure 7. Grahovo.
We started with the idea of having two interviews for each of the 11 settlements, but ultimately, one, two, or three interviews have been executed in each settlement until the key study questions were answered [38–40]. In total, 22 different (group) interviews were undertaken. As knowledge about depopulation in rural areas through recent history was required, elderly people were mainly interviewed; approximately 70% of the interviewees were older than 60 years. In contrast, we also interviewed the youth with the idea of receiving information on their needs and expectations. All the interviews were recorded (audio recording, notes, photographs, and video recording), transcribed, and loaded into the qualitative data analysis to structure all data and implement a constant comparison (using an open coding approach [41]). The examples of the interviews at Musikic’s family from Zupa Niksic, Bastaji Village, and from the visit to the Bosko Draskovic’s family from Grahovo held on February 2020; but also the Summary of the Interviews with youth living in the rural areas of Niksic are presented at the Supplementary material.
Figure 7. Grahovo.
We started with the idea of having two interviews for each of the 11 settlements, but ultimately,one, two, or three interviews have been executed in each settlement until the key study questionswere answered [38–40]. In total, 22 different (group) interviews were undertaken. As knowledgeabout depopulation in rural areas through recent history was required, elderly people were mainlyinterviewed; approximately 70% of the interviewees were older than 60 years. In contrast, we alsointerviewed the youth with the idea of receiving information on their needs and expectations. All theinterviews were recorded (audio recording, notes, photographs, and video recording), transcribed,and loaded into the qualitative data analysis to structure all data and implement a constant comparison(using an open coding approach [41]). The examples of the interviews at Musikic’s family from ZupaNiksic, Bastaji Village, and from the visit to the Bosko Draskovic’s family from Grahovo held onFebruary 2020; but also the Summary of the Interviews with youth living in the rural areas of Niksicare presented at the Supplementary Materials.
3. Results and Discussion
3.1. Accessibility Analysis
It is a well-known fact that well-established infrastructure contributes to a better quality of life,and reduces depopulation process of the rural areas. A good road infrastructure is a key prerequisitefor the development. It enables better communication with markets and enables product placement,increases competition, and provides opportunities for additional income. Some rural areas of the studiedregion are with poorly developed transport, and with little or no social or economic infrastructure.The distance to the food shops and elementary schools is, on average, 3 to 4 km, and to the high schoolsand bank it is 10 km or more. In addition, the physical condition of the water supply network is poor;not all villages on the remote area have an electricity supply and the telecommunication network isundeveloped and more often does not offer the possibility of the Internet. In order to identify a region
Sustainability 2020, 12, 3328 10 of 23
as remote we performed an accessibility analysis using the driving time needed for the population of aregion to reach a city center.
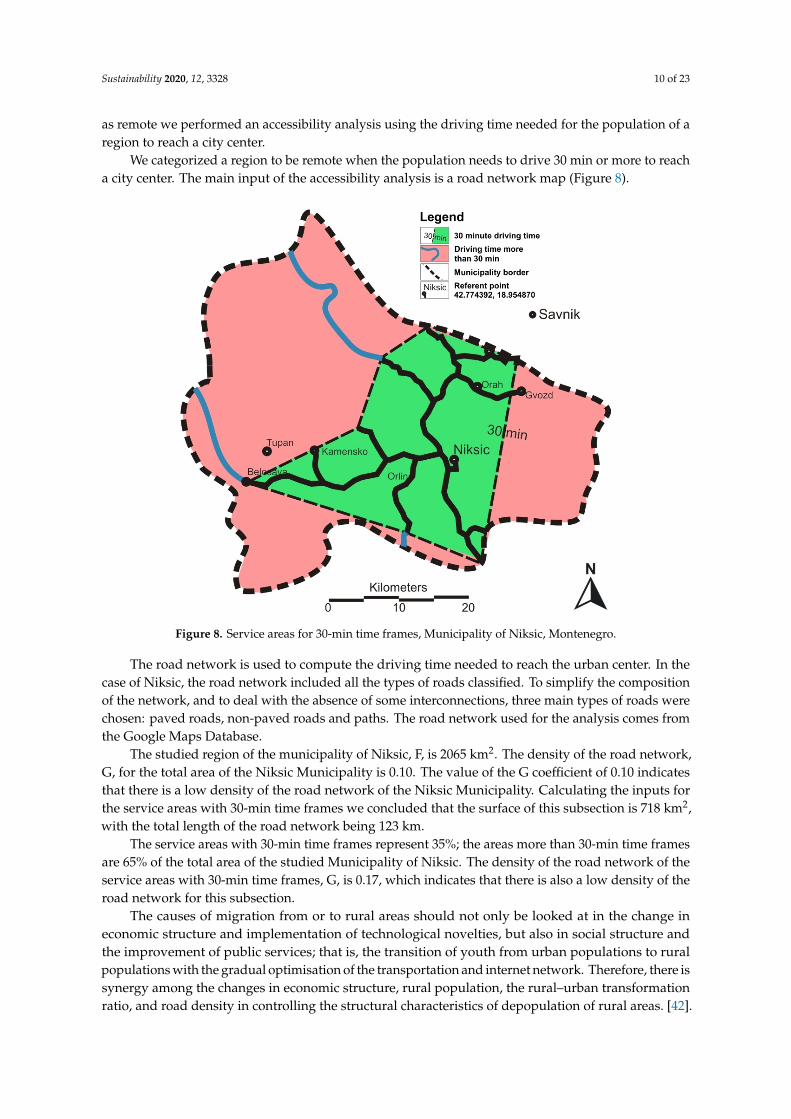
We categorized a region to be remote when the population needs to drive 30 min or more to reacha city center. The main input of the accessibility analysis is a road network map (Figure 8).
Sustainability 2020, 12, x FOR PEER REVIEW 10 of 23
3. Results and Discussion
3.1. Accessibility Analysis
It is a well-known fact that well-established infrastructure contributes to a better quality of life, and reduces depopulation process of the rural areas. A good road infrastructure is a key prerequisite for the development. It enables better communication with markets and enables product placement, increases competition, and provides opportunities for additional income. Some rural areas of the studied region are with poorly developed transport, and with little or no social or economic infrastructure. The distance to the food shops and elementary schools is, on average, 3 to 4 km, and to the high schools and bank it is 10 km or more. In addition, the physical condition of the water supply network is poor; not all villages on the remote area have an electricity supply and the telecommunication network is undeveloped and more often does not offer the possibility of the Internet. In order to identify a region as remote we performed an accessibility analysis using the driving time needed for the population of a region to reach a city center.
We categorized a region to be remote when the population needs to drive 30 min or more to reach a city center. The main input of the accessibility analysis is a road network map (Figure 8).
Figure 8. Service areas for 30-min time frames, Municipality of Niksic, Montenegro.
The road network is used to compute the driving time needed to reach the urban center. In the case of Niksic, the road network included all the types of roads classified. To simplify the composition of the network, and to deal with the absence of some interconnections, three main types of roads were chosen: paved roads, non-paved roads and paths. The road network used for the analysis comes from the Google Maps Database.
The studied region of the municipality of Niksic, F, is 2065 km2. The density of the road network, G, for the total area of the Niksic Municipality is 0.10. The value of the G coefficient of 0.10 indicates that there is a low density of the road network of the Niksic Municipality. Calculating the inputs for the service areas with 30-min time frames we concluded that the surface of this subsection is 718 km2, with the total length of the road network being 123 km.
Figure 8. Service areas for 30-min time frames, Municipality of Niksic, Montenegro.
The road network is used to compute the driving time needed to reach the urban center. In thecase of Niksic, the road network included all the types of roads classified. To simplify the compositionof the network, and to deal with the absence of some interconnections, three main types of roads werechosen: paved roads, non-paved roads and paths. The road network used for the analysis comes fromthe Google Maps Database.
The studied region of the municipality of Niksic, F, is 2065 km2. The density of the road network,G, for the total area of the Niksic Municipality is 0.10. The value of the G coefficient of 0.10 indicatesthat there is a low density of the road network of the Niksic Municipality. Calculating the inputs forthe service areas with 30-min time frames we concluded that the surface of this subsection is 718 km2,with the total length of the road network being 123 km.
The service areas with 30-min time frames represent 35%; the areas more than 30-min time framesare 65% of the total area of the studied Municipality of Niksic. The density of the road network of theservice areas with 30-min time frames, G, is 0.17, which indicates that there is also a low density of theroad network for this subsection.
The causes of migration from or to rural areas should not only be looked at in the change ineconomic structure and implementation of technological novelties, but also in social structure andthe improvement of public services; that is, the transition of youth from urban populations to ruralpopulations with the gradual optimisation of the transportation and internet network. Therefore, there issynergy among the changes in economic structure, rural population, the rural–urban transformationratio, and road density in controlling the structural characteristics of depopulation of rural areas. [42].

Sustainability 2020, 12, 3328 11 of 23
3.2. Results of the Interviews
While comparing all 22 interview transcripts and one additional qualitative research with thefocus group of young people, but also using all the notes from the field visits, numerous aspectswere discovered. About 70% of the interviewed farmers indicated that work on the farms is theirsecondary job, mainly being carried out on the weekends, while about 30% stated that it was theirmain employment. All the farmers cultivated vegetables and fruits, and some of them also kept beesfor personal use. Overall, the number of livestock has strongly decreased in all the farms (for almosteveryone) in the last five decades; nowadays, most farmers have zero to three cows, some have about15–30 sheep and no one owns an ox, horse, or donkey.
Findings based on the rural household survey data and key informant interviews confirm theresearch hypothesis that the strengths of the studied region are high quality, well-preserved andfertile soil, and that there are good conditions for organic production. The farmers stated that thearea has favourable climate for many types of agricultural production. Farmers have tradition inagricultural production practices and a sufficient work force would provide additional opportunities foremployment. We recorded positive changes in production processes, e.g., adoption of new technologiesand introduction of new international standards.
During the interviews, farmers stated that a large part of the agricultural products are from seasonalproduction and are non-competitive in price. This production is characterised by relatively high inputprices that influence the final price of the products, with low levels of market sales. We noticed a lackof organization and cooperation in the production chain. Holdings are small and fragmented, with lowlevels of production per household unit. The farmers are with poor mechanization, but also withlow levels of technology and specialization applied in production. Poor infrastructure (road network,water supply, and internet) characterised major parts of the rural areas of the studied region and thereis a lack of storage capacity. We recorded an unfavourable age and social structure in the rural areas,with low levels of education and a lack of knowledge in farmers. In relation to the gender analysis,we concluded that male migration is an important factor that determines a women’s role on farms.A significant weakness is poor connections of the farmers with the tourism sector.
From the communication with the interviewed farmers, and through further analysis, we concludedthat there is an opportunity for increasing of the markets of organic production, with possible initiationof exports of competitive products (goat milk and cheese, lamb, and vegetables) as there is in generalgrowing demand for high-quality products. Since local non-agricultural employment does not resultin the prolonged absence of key household labours, we should achieve a better combination ofresource-based and non-resource-based activities in rural household livelihood portfolios. Therefore,creating more non-agricultural employment opportunities within commuting distance from ruralcommunities without causing environmental degradation can enhance the sustainability of agriculturalproduction and natural resource use. Farmers are facing periodic risks due to fluctuations in economicconditions, but the responses to these risks are poorly understood. In particular, there is a need tobetter understand the management of risk in the farming systems [43]. Proposed non-agriculturalemployment opportunities could be a measure of diversification given the risks of traditional farming.
There is a space for strengthening agriculture activities through tourism and additional fooddemand. In this specific moment Montenegro is in the process of accession to the European Union,with the availability of state and EU support, particularly for rural development. That may increasetechnological development, as well as strengthening of the professional skills and institutions supportingagricultural development, which may end up involving the young work force in agricultural activity.
On the other hand, opening of the market will increase competitiveness, which may endangermajor parts of commercial production that we have in the studied region only in traces. Another risk isthe fact that while rural-to-urban labour migration and abandonment of farmland may facilitate foresttransition and ecological recovery, abandoned lands may fail to rehabilitate naturally because they havebeen irreversibly transformed [34,44,45]. It is worth mentioning that few of the interviewed farmersmentioned land consolidation as an effective technique in land management [46]. This initiative

Sustainability 2020, 12, 3328 12 of 23
should be supported from the state level as that contributes to sustainable rural development. Policiesencouraging ecosystem recovery on abandoned land can promote sustainable land use and reducewater, landslides, and soil erosion [47–51]. Meanwhile, it is of great importance to develop holisticpolicies and programs to enhance both rural people’s socioeconomic welfare and rural environmentalsustainability. Development interventions need to work with farmers to provide further options.
Agricultural productivity, the high urbanisation rate, the weakening status of the agriculturalindustry, and the low population in rural areas show that agricultural production is no longer themain way for farmers to earn a living. The “part-time farming” and “non-agricultural” productionof farmers’ livelihoods lead to their reduced dependence on agricultural production. Farmers aremore inclined to “edge and corner land” and agricultural production-related land used for agriculturalproduction within and around places where they live [45,52–54].
Working with the youth focus group we repeatedly came to a similar position as presented incommunication with the farmers. A summary of the interviews with the youth living in the rural areasof Niksic is presented in the paper. Here we would like to highlight that young people are aware aboutthe picturesque villages of their area and pointed out that the food they are producing is of exceptionalquality and that the region is rich with medicinal herbs (teas, various medicinal herbs, forest fruits,blueberries, mushrooms, rosehip, and the like).
In their opinion the potential is in agro-eco tourism and health tourism development, but alsoin engaging in organic production. All young people unanimously highlighted the importance ofthe state investments in transport infrastructure (complained about gravel roads and poor-qualityinfrastructure), but also in water supply and telecommunications.
They are of the opinion that more young people are returning to the countryside now than before.They complain that there is a lack of playgrounds and sports field, but also about the problem of theirmobility and poor internet coverage. All interviewed young people pointed out that the villages areempty as far as they are concerned. They highlighted the special threat of the loss of a young generationfrom the rural areas, after the disappearance of their fathers’ generation. Few young respondentsstated that climate changes may be a problem for this area in the future. We concluded together thatyoung people have more difficulties to get married and to form a family in these rural areas. It isdifficult for them to make a career since it often requires presence in large urban centres.
From the beginning of this century, a few farmers from the studied area have been providinggood examples of the business initiatives in the rural areas of this part of the Balkans. RadivojeMiljanic from Podbozur, Javorka and Sreten Batricevic from Trubjela, as well as Boris Cipranic fromNiksicka Zupa, all from Niksic Municipality, have initiated small family businesses with goat farming(see Figures 9–14).Sustainability 2020, 12, x FOR PEER REVIEW 13 of 23
Figure 9. Details from the Batricevic Farm.
Figure 10. Batricevic farm products on the market.
Figure 11. Details from the Miljanic Farm.
Figure 12. Miljanic farm products on the market.
Figure 9. Details from the Batricevic Farm.

Sustainability 2020, 12, 3328 13 of 23
Sustainability 2020, 12, x FOR PEER REVIEW 13 of 23
Figure 9. Details from the Batricevic Farm.
Figure 10. Batricevic farm products on the market.
Figure 11. Details from the Miljanic Farm.
Figure 12. Miljanic farm products on the market.
Figure 10. Batricevic farm products on the market.
Sustainability 2020, 12, x FOR PEER REVIEW 13 of 23
Figure 9. Details from the Batricevic Farm.
Figure 10. Batricevic farm products on the market.
Figure 11. Details from the Miljanic Farm.
Figure 12. Miljanic farm products on the market.
Figure 11. Details from the Miljanic Farm.
Sustainability 2020, 12, x FOR PEER REVIEW 13 of 23
Figure 9. Details from the Batricevic Farm.
Figure 10. Batricevic farm products on the market.
Figure 11. Details from the Miljanic Farm.
Figure 12. Miljanic farm products on the market. Figure 12. Miljanic farm products on the market.Sustainability 2020, 12, x FOR PEER REVIEW 14 of 23
Figure 13. Final Products (cheese, yogurt and “kajmak”—cream) from the Miljanic Farm, Podbozur, Niksic.
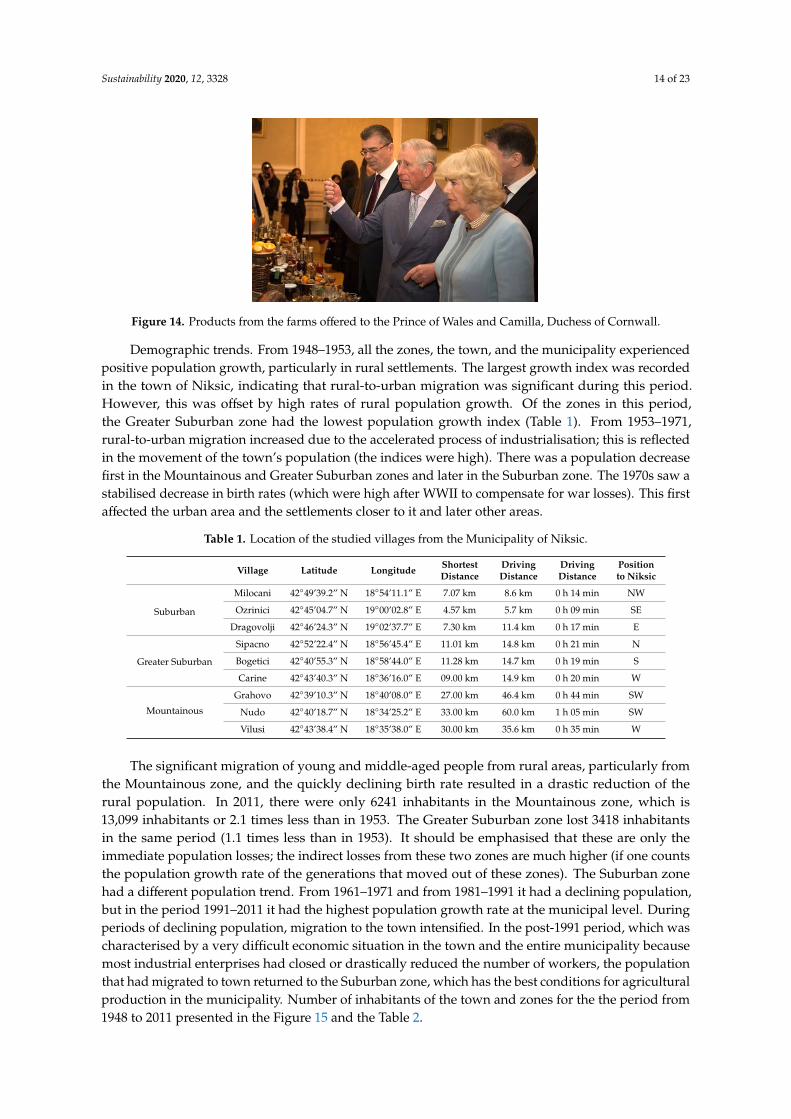
Figure 14. Products from the farms offered to the Prince of Wales and Camilla, Duchess of Cornwall.
Demographic trends. From 1948–1953, all the zones, the town, and the municipality experienced positive population growth, particularly in rural settlements. The largest growth index was recorded in the town of Niksic, indicating that rural-to-urban migration was significant during this period. However, this was offset by high rates of rural population growth. Of the zones in this period, the Greater Suburban zone had the lowest population growth index (Table 1). From 1953–1971, rural-to-urban migration increased due to the accelerated process of industrialisation; this is reflected in the movement of the town’s population (the indices were high). There was a population decrease first in the Mountainous and Greater Suburban zones and later in the Suburban zone. The 1970s saw a stabilised decrease in birth rates (which were high after WWII to compensate for war losses). This first affected the urban area and the settlements closer to it and later other areas.
The significant migration of young and middle-aged people from rural areas, particularly from the Mountainous zone, and the quickly declining birth rate resulted in a drastic reduction of the rural population. In 2011, there were only 6241 inhabitants in the Mountainous zone, which is 13,099 inhabitants or 2.1 times less than in 1953. The Greater Suburban zone lost 3418 inhabitants in the same period (1.1 times less than in 1953). It should be emphasised that these are only the immediate population losses; the indirect losses from these two zones are much higher (if one counts the population growth rate of the generations that moved out of these zones). The Suburban zone had a different population trend. From 1961–1971 and from 1981–1991 it had a declining population, but in the period 1991–2011 it had the highest population growth rate at the municipal level. During periods of declining population, migration to the town intensified. In the post-1991 period, which was characterised by a very difficult economic situation in the town and the entire municipality because most industrial enterprises had closed or drastically reduced the number of workers, the population that had migrated to town returned to the Suburban zone, which has the best conditions for agricultural production in the municipality. Number of inhabitants of the town and zones for the the period from 1948 to 2011 presented in the Figure 15 and the Table 2.
Figure 13. Final Products (cheese, yogurt and “kajmak”—cream) from the Miljanic Farm,Podbozur, Niksic.
Sustainability 2020, 12, 3328 14 of 23
Sustainability 2020, 12, x FOR PEER REVIEW 14 of 23
Figure 13. Final Products (cheese, yogurt and “kajmak”—cream) from the Miljanic Farm, Podbozur, Niksic.
Figure 14. Products from the farms offered to the Prince of Wales and Camilla, Duchess of Cornwall.
Demographic trends. From 1948–1953, all the zones, the town, and the municipality experienced positive population growth, particularly in rural settlements. The largest growth index was recorded in the town of Niksic, indicating that rural-to-urban migration was significant during this period. However, this was offset by high rates of rural population growth. Of the zones in this period, the Greater Suburban zone had the lowest population growth index (Table 1). From 1953–1971, rural-to-urban migration increased due to the accelerated process of industrialisation; this is reflected in the movement of the town’s population (the indices were high). There was a population decrease first in the Mountainous and Greater Suburban zones and later in the Suburban zone. The 1970s saw a stabilised decrease in birth rates (which were high after WWII to compensate for war losses). This first affected the urban area and the settlements closer to it and later other areas.
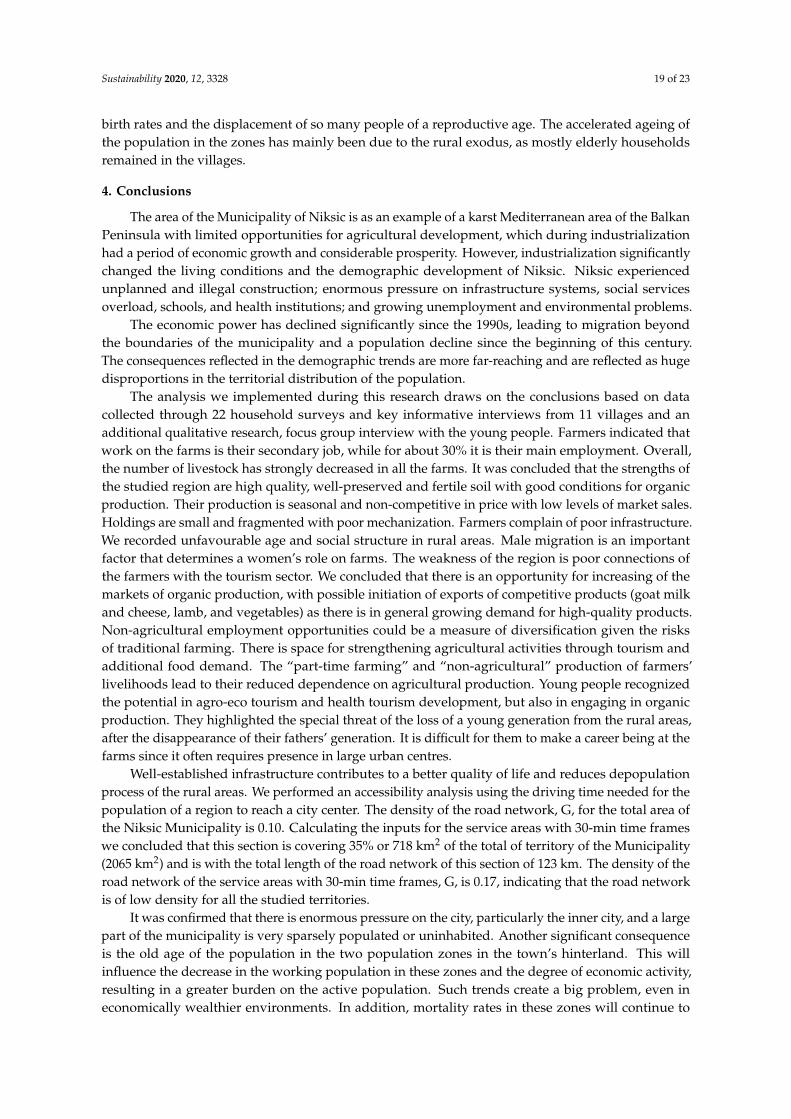
The significant migration of young and middle-aged people from rural areas, particularly from the Mountainous zone, and the quickly declining birth rate resulted in a drastic reduction of the rural population. In 2011, there were only 6241 inhabitants in the Mountainous zone, which is 13,099 inhabitants or 2.1 times less than in 1953. The Greater Suburban zone lost 3418 inhabitants in the same period (1.1 times less than in 1953). It should be emphasised that these are only the immediate population losses; the indirect losses from these two zones are much higher (if one counts the population growth rate of the generations that moved out of these zones). The Suburban zone had a different population trend. From 1961–1971 and from 1981–1991 it had a declining population, but in the period 1991–2011 it had the highest population growth rate at the municipal level. During periods of declining population, migration to the town intensified. In the post-1991 period, which was characterised by a very difficult economic situation in the town and the entire municipality because most industrial enterprises had closed or drastically reduced the number of workers, the population that had migrated to town returned to the Suburban zone, which has the best conditions for agricultural production in the municipality. Number of inhabitants of the town and zones for the the period from 1948 to 2011 presented in the Figure 15 and the Table 2.
Figure 14. Products from the farms offered to the Prince of Wales and Camilla, Duchess of Cornwall.
Demographic trends. From 1948–1953, all the zones, the town, and the municipality experiencedpositive population growth, particularly in rural settlements. The largest growth index was recordedin the town of Niksic, indicating that rural-to-urban migration was significant during this period.However, this was offset by high rates of rural population growth. Of the zones in this period,the Greater Suburban zone had the lowest population growth index (Table 1). From 1953–1971,rural-to-urban migration increased due to the accelerated process of industrialisation; this is reflectedin the movement of the town’s population (the indices were high). There was a population decreasefirst in the Mountainous and Greater Suburban zones and later in the Suburban zone. The 1970s saw astabilised decrease in birth rates (which were high after WWII to compensate for war losses). This firstaffected the urban area and the settlements closer to it and later other areas.
Table 1. Location of the studied villages from the Municipality of Niksic.
Village Latitude Longitude ShortestDistance
DrivingDistance
DrivingDistance
Positionto Niksic
Suburban
Milocani 42◦49’39.2” N 18◦54’11.1” E 7.07 km 8.6 km 0 h 14 min NW
Ozrinici 42◦45’04.7” N 19◦00’02.8” E 4.57 km 5.7 km 0 h 09 min SE
Dragovolji 42◦46’24.3” N 19◦02’37.7” E 7.30 km 11.4 km 0 h 17 min E
Greater Suburban
Sipacno 42◦52’22.4” N 18◦56’45.4” E 11.01 km 14.8 km 0 h 21 min N
Bogetici 42◦40’55.3” N 18◦58’44.0” E 11.28 km 14.7 km 0 h 19 min S
Carine 42◦43’40.3” N 18◦36’16.0” E 09.00 km 14.9 km 0 h 20 min W
Mountainous
Grahovo 42◦39’10.3” N 18◦40’08.0” E 27.00 km 46.4 km 0 h 44 min SW
Nudo 42◦40’18.7” N 18◦34’25.2” E 33.00 km 60.0 km 1 h 05 min SW
Vilusi 42◦43’38.4” N 18◦35’38.0” E 30.00 km 35.6 km 0 h 35 min W
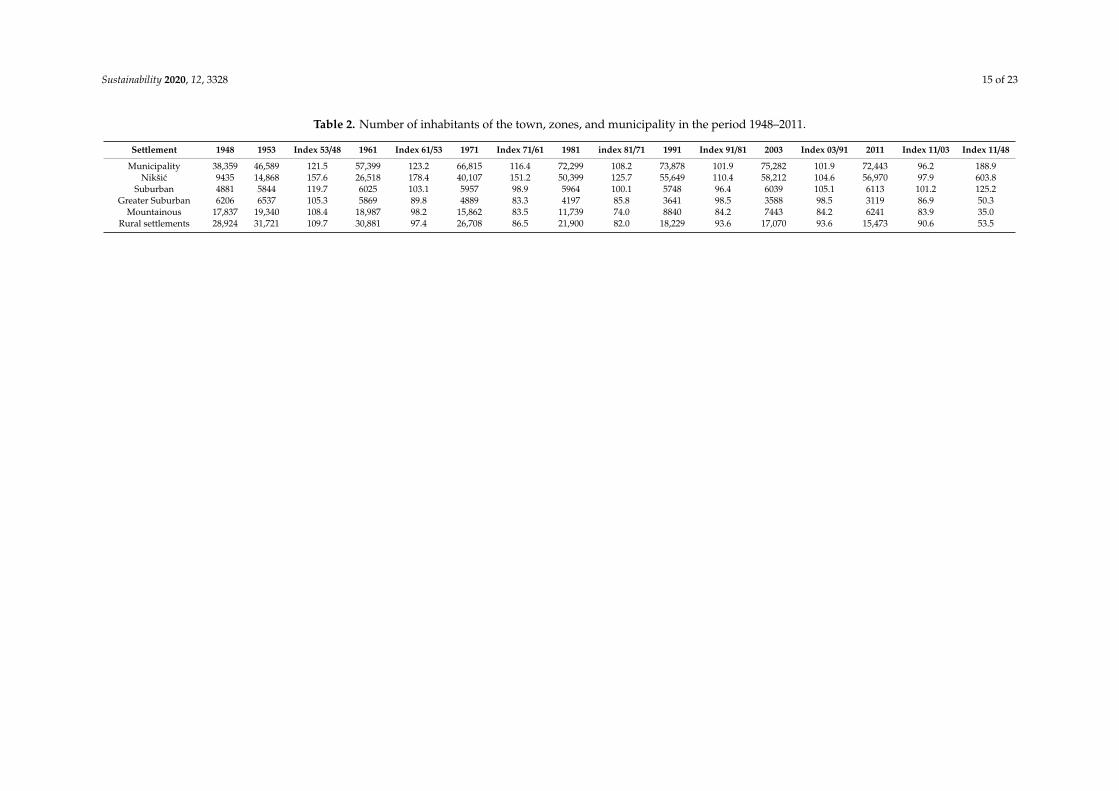
The significant migration of young and middle-aged people from rural areas, particularly fromthe Mountainous zone, and the quickly declining birth rate resulted in a drastic reduction of therural population. In 2011, there were only 6241 inhabitants in the Mountainous zone, which is13,099 inhabitants or 2.1 times less than in 1953. The Greater Suburban zone lost 3418 inhabitantsin the same period (1.1 times less than in 1953). It should be emphasised that these are only theimmediate population losses; the indirect losses from these two zones are much higher (if one countsthe population growth rate of the generations that moved out of these zones). The Suburban zonehad a different population trend. From 1961–1971 and from 1981–1991 it had a declining population,but in the period 1991–2011 it had the highest population growth rate at the municipal level. Duringperiods of declining population, migration to the town intensified. In the post-1991 period, which wascharacterised by a very difficult economic situation in the town and the entire municipality becausemost industrial enterprises had closed or drastically reduced the number of workers, the populationthat had migrated to town returned to the Suburban zone, which has the best conditions for agriculturalproduction in the municipality. Number of inhabitants of the town and zones for the the period from1948 to 2011 presented in the Figure 15 and the Table 2.
Sustainability 2020, 12, 3328 15 of 23
Table 2. Number of inhabitants of the town, zones, and municipality in the period 1948–2011.
Settlement 1948 1953 Index 53/48 1961 Index 61/53 1971 Index 71/61 1981 index 81/71 1991 Index 91/81 2003 Index 03/91 2011 Index 11/03 Index 11/48
Municipality 38,359 46,589 121.5 57,399 123.2 66,815 116.4 72,299 108.2 73,878 101.9 75,282 101.9 72,443 96.2 188.9Nikšic 9435 14,868 157.6 26,518 178.4 40,107 151.2 50,399 125.7 55,649 110.4 58,212 104.6 56,970 97.9 603.8
Suburban 4881 5844 119.7 6025 103.1 5957 98.9 5964 100.1 5748 96.4 6039 105.1 6113 101.2 125.2Greater Suburban 6206 6537 105.3 5869 89.8 4889 83.3 4197 85.8 3641 98.5 3588 98.5 3119 86.9 50.3
Mountainous 17,837 19,340 108.4 18,987 98.2 15,862 83.5 11,739 74.0 8840 84.2 7443 84.2 6241 83.9 35.0Rural settlements 28,924 31,721 109.7 30,881 97.4 26,708 86.5 21,900 82.0 18,229 93.6 17,070 93.6 15,473 90.6 53.5

Sustainability 2020, 12, 3328 16 of 23Sustainability 2020, 12, x FOR PEER REVIEW 15 of 23
Figure 15. Number of inhabitants of the town and zones in the period 1948–2011.
Population movement affects population density, which increased in the municipality in the period 1948–2003 but decreased in the last inter-census period in the town as well. After the initial increase in population density, the Suburban zone basically retained the same density (with small fluctuations) of 39 people per km², which is the highest at the zone level. Since the 1960s, the Greater Suburban zone has been experiencing a constant decline in population density and is still halved today (Tables 2 and 3). In terms of surface area and number of settlements, the Mountain zone has always been characterised by low population density. Population density today is only four people per km².
The processes of industrialisation and urbanisation when there were poor traffic connections between the countryside and the town led to pronounced deagrarianisation and then to deruralisation. Bad roads and the poor quality of housing and communal facilities in the countryside also contributed to this. The old housing stock in the countryside was inadequate and had not been modernised. Investment was directed towards industry, and there was no investment in agriculture and rural municipalities. Deagrarianisation took place faster than the various industries could disperse some of their technologies into final production in the municipality, and the technological development of agriculture was even slower due to the karst characteristics of the terrain. Therefore, it was not possible to stop the outflow of young people from the countryside to the town, resulting in the depopulation of many villages in the municipality. Population density of the Niksic municipality (2011) and population indices relative to 1948 are presented on the Figure 16; and presentation of percentage of zones in the municipality’s population in the period 1948–2011 on Figure 17.
Figure 15. Number of inhabitants of the town and zones in the period 1948–2011.
Population movement affects population density, which increased in the municipality in theperiod 1948–2003 but decreased in the last inter-census period in the town as well. After the initialincrease in population density, the Suburban zone basically retained the same density (with smallfluctuations) of 39 people per km2, which is the highest at the zone level. Since the 1960s, the GreaterSuburban zone has been experiencing a constant decline in population density and is still halved today(Tables 2 and 3). In terms of surface area and number of settlements, the Mountain zone has alwaysbeen characterised by low population density. Population density today is only four people per km2.
Table 3. Population density trends of cities, zones, and municipalities in the period 1948–2011.
Settlement 1948 1953 1961 1971 1981 1991 2003 2011
Municipality 18.6 22.6 27.8 32.4 35.0 35.8 36.5 35.1Nikšic 148.8 234.5 418.3 632.6 794.9 877.7 918.2 898.6
Suburban 32 38 39 39 39 37 39 40.8Greater Suburban 17 19 20 17 15 13 13 10.5
Mountainous 11.5 12.4 12.2 10.2 7.6 5.7 4.8 4.0Rural settlements 14.5 15.8 15.4 13.3 10.9 9.1 8.5 7.7
Source: MONSTAT—Directorate for Statistics [27–32].
The processes of industrialisation and urbanisation when there were poor traffic connectionsbetween the countryside and the town led to pronounced deagrarianisation and then to deruralisation.Bad roads and the poor quality of housing and communal facilities in the countryside also contributedto this. The old housing stock in the countryside was inadequate and had not been modernised.Investment was directed towards industry, and there was no investment in agriculture and ruralmunicipalities. Deagrarianisation took place faster than the various industries could disperse someof their technologies into final production in the municipality, and the technological development ofagriculture was even slower due to the karst characteristics of the terrain. Therefore, it was not possibleto stop the outflow of young people from the countryside to the town, resulting in the depopulation ofmany villages in the municipality. Population density of the Niksic municipality (2011) and populationindices relative to 1948 are presented on the Figure 16; and presentation of percentage of zones in themunicipality’s population in the period 1948–2011 on Figure 17.
In fact, with only a small elderly population remaining, some villages faced demographic extinction.In the period 1961–1981, the agricultural population decreased from 18,686 to 4338. This negative trendcontinued, and according to the 2003 census there were only 963 people registered as being activelyengaged in agriculture.
The intensity of the rural exodus is best illustrated by the fact that in the period 1953–1981,the town of Niksic grew in population at such a rate that it was used as an example in demographicstudies of Yugoslavia [31].

Sustainability 2020, 12, 3328 17 of 23Sustainability 2020, 12, x FOR PEER REVIEW 21 of 23
Figure 16. Population density of the Niksic municipality (2011), population indices relative to 1948.
Figure 17. Percentage of zones in the municipality’s population in the period 1948–2011.
Figure 16. Population density of the Niksic municipality (2011), population indices relative to 1948.
Sustainability 2020, 12, x FOR PEER REVIEW 21 of 23
Figure 16. Population density of the Niksic municipality (2011), population indices relative to 1948.
Figure 17. Percentage of zones in the municipality’s population in the period 1948–2011. Figure 17. Percentage of zones in the municipality’s population in the period 1948–2011.

Sustainability 2020, 12, 3328 18 of 23
The intensity of deagrarianisation and depopulation best illustrates the share of the rural populationin the municipality’s population at the beginning and end of the observed period. In 1948, 75.4% of themunicipality’s population was rural, and in 2011 the figure was only 21.3%. The highest depopulationwas recorded in the Mountainous zone, which at the beginning of the observed period had 41.5% ofthe municipality’s population compared to only 8.6% in 2011 (Figure 17).
Changes in the age structure of the zones’ populations reflect the intensity of migration from thevillages of the municipality. At the beginning of the observed period in 1961, all zones had a highproportion of young people (43.4%–45%), indicating high birth rates and positive population growthrates in rural settlements. The elderly population rate was significantly higher in all zones than in thetown, indicating intense migration from the villages to the town (Table 4). The age indices rangedfrom 0.27 to 0.32 in the zones and were significantly higher in relation to the urban population (0.14).During this period, all zones were at the stage of demographic maturity; the Mountainous zone hadthe oldest population, which was about to enter demographic old age.
Table 4. Stages of demographic age of the zones, municipality, and town in 1961 and 2011.
Year Settlement Zone Younger than20 (%)
Younger than40 (%)
Up to 60 andOlder (%) Age 1 Index
1961
Suburban 45 74 12.4 0.27Greater
Suburban 43.4 69.8 13 0.3
Mountainous 43.7 69.9 13.9 0.32Town-Niksic 42 82.1 6.1 0.14Municipality 43.1 76 10.2 0.23
2011
Suburban 27.4 54.5 19.0 0.69Greater
Suburban 24.7 50.4 24.8 1.01
Mountainous 21.1 43.9 28.8 1.37Town-Niksic 26.1 54.8 17.8 0.68Municipality 25.7 53.6 19.1 0.74
1 The age index represents the relationship between the old and young population. It is obtained by the formulaSs/Ms (old/young population). If the amount is greater than 0.40, then it is the category of the old population.
Due to the constant migration, the constant decline in birth rates and ultimately the negativepopulation growth, 50 years later there was a significant change in the age structure of the populationin the zones. The Suburban zone, which has the most favourable age structure, is in the demographicold age stage and is about to transition into deep demographic old age; it has the highest proportionof young people (27.4%) at the municipal level, 19% of the elderly population, and an age index of0.69. The Greater Suburban zone is at the stage of deepest demographic old age, with an age index of1.01, an elderly population of 24.8%, and a young population of 24.7%. The Mountainous zone, whichhas the worst age structure, has a young population of 21.1%, an elderly population of 28.8%, and anage index of 1.37. This zone has not only been in the stage of deepest demographic old age for a longtime but is also threatened by demographic extinction in the coming period. The problem is moredistinct if we consider the fact that this zone includes 76 of the municipality’s 109 rural settlements andcomprises 1554.8 km2 of the total area of rural settlements of 2001.6 km2). Therefore, unless urgent andextensive demographic and repopulation measures are implemented, a large part of the Municipalityof Niksic will become uninhabited in the near future. Such measures would primarily be redistributivein nature, as there is almost no potential for population reproduction in the Mountainous zone.
The ageing process as a result of the declining birth rates peaked in the town in the 1970s. However,due to the large influx of younger middle-aged people from the surrounding areas in the productive1970s and 1980s, it was not until the 1990s that this significantly affected the age structure of the town’spopulation. This is the main reason that the town’s population has the most favourable age structurein the municipality. In rural areas, birth rates have been falling for two reasons—the trend of declining
Sustainability 2020, 12, 3328 19 of 23
birth rates and the displacement of so many people of a reproductive age. The accelerated ageing ofthe population in the zones has mainly been due to the rural exodus, as mostly elderly householdsremained in the villages.
4. Conclusions
The area of the Municipality of Niksic is as an example of a karst Mediterranean area of the BalkanPeninsula with limited opportunities for agricultural development, which during industrializationhad a period of economic growth and considerable prosperity. However, industrialization significantlychanged the living conditions and the demographic development of Niksic. Niksic experiencedunplanned and illegal construction; enormous pressure on infrastructure systems, social servicesoverload, schools, and health institutions; and growing unemployment and environmental problems.
The economic power has declined significantly since the 1990s, leading to migration beyondthe boundaries of the municipality and a population decline since the beginning of this century.The consequences reflected in the demographic trends are more far-reaching and are reflected as hugedisproportions in the territorial distribution of the population.
The analysis we implemented during this research draws on the conclusions based on datacollected through 22 household surveys and key informative interviews from 11 villages and anadditional qualitative research, focus group interview with the young people. Farmers indicated thatwork on the farms is their secondary job, while for about 30% it is their main employment. Overall,the number of livestock has strongly decreased in all the farms. It was concluded that the strengths ofthe studied region are high quality, well-preserved and fertile soil with good conditions for organicproduction. Their production is seasonal and non-competitive in price with low levels of market sales.Holdings are small and fragmented with poor mechanization. Farmers complain of poor infrastructure.We recorded unfavourable age and social structure in rural areas. Male migration is an importantfactor that determines a women’s role on farms. The weakness of the region is poor connections ofthe farmers with the tourism sector. We concluded that there is an opportunity for increasing of themarkets of organic production, with possible initiation of exports of competitive products (goat milkand cheese, lamb, and vegetables) as there is in general growing demand for high-quality products.Non-agricultural employment opportunities could be a measure of diversification given the risksof traditional farming. There is space for strengthening agricultural activities through tourism andadditional food demand. The “part-time farming” and “non-agricultural” production of farmers’livelihoods lead to their reduced dependence on agricultural production. Young people recognizedthe potential in agro-eco tourism and health tourism development, but also in engaging in organicproduction. They highlighted the special threat of the loss of a young generation from the rural areas,after the disappearance of their fathers’ generation. It is difficult for them to make a career being at thefarms since it often requires presence in large urban centres.
Well-established infrastructure contributes to a better quality of life and reduces depopulationprocess of the rural areas. We performed an accessibility analysis using the driving time needed for thepopulation of a region to reach a city center. The density of the road network, G, for the total area ofthe Niksic Municipality is 0.10. Calculating the inputs for the service areas with 30-min time frameswe concluded that this section is covering 35% or 718 km2 of the total of territory of the Municipality(2065 km2) and is with the total length of the road network of this section of 123 km. The density of theroad network of the service areas with 30-min time frames, G, is 0.17, indicating that the road networkis of low density for all the studied territories.
It was confirmed that there is enormous pressure on the city, particularly the inner city, and a largepart of the municipality is very sparsely populated or uninhabited. Another significant consequenceis the old age of the population in the two population zones in the town’s hinterland. This willinfluence the decrease in the working population in these zones and the degree of economic activity,resulting in a greater burden on the active population. Such trends create a big problem, even ineconomically wealthier environments. In addition, mortality rates in these zones will continue to

Sustainability 2020, 12, 3328 20 of 23
grow at an accelerated pace, while population reproduction will be minimal, ultimately leading tocomplete depopulation.
Based on the analysed population characteristics of the rural area of the Municipality of Niksic,we proved the hypotheses that migration from the countryside to town has considerably affectedthe demographic development of the rural area; that intense migration from rural areas has ledto changes in the population structure within those areas, especially in terms of age and gender;that depopulation in the rural areas has led to agricultural and economic decline; and that because ofmigration, an increasing number of villages have very few residents, most of whom are elderly.
The latest transformations of the economy after 1990 (when industry in the city was almostextinguished) indicate that the neglect of agriculture and the destruction of agricultural parcels aremistakes that will prove difficult to correct. The relationships among rural migration processes,household livelihoods, and rural environmental changes are influenced by the broader social andeconomic contexts at the national and regional levels.
Around the developed world, state authorities bear responsibilities to implement dependableand timely measures to revitalize the countryside; so, in the case of the Municipality of Niksic, it isthe responsibility of state of Montenegro to stop the extinction of the villages. Today, revitalizationof the countryside is only possible by bringing non-agricultural activities into the area centres andimproving the quality of life in the villages, which would reduce unemployment in the city. Solid trafficinfrastructure between individual settlements and their connection with the city is also necessary.
Between 2003 and 2011, the agricultural population increased by 1.2%. This gives hope becauseagriculture is now being recognized as a significant branch of the economy, and an ambience forchanging the inherited negative perception of it is being created. Delivering agricultural products tothe market and public goods for the society requires a better understanding of the socio-economicand policy factors that hinder or enhance the development of such systems by identifying the trendsand drivers encouraging the involvement of farmers, actors in the value chain, consumers, educators,and policy makers. The positive effect of socio-economic factors in rural areas may gradually increasewith societal and economic development. Social transformation, location conditions, traffic conditions,industrial income, and other socio-economic factors at the moment are affecting improvement in ruralareas of the studied region. Farmers should now use the comparative advantage of unpolluted landand natural resources of rural settlements from this area. This resource can directly provide manyecosystem services for rural residents that are related to their well-being. Meanwhile, it is of greatimportance to develop holistic policies and programs to enhance both rural people’s socioeconomicwelfare and rural environmental sustainability.
It should be noted that the process of depopulation analysed here reveals a significant deficit interritorial cohesion that has wrought serious damage on mountain areas, true “loser areas”, and victimsof a genuine territorial crisis that includes and is evident in a demographic problem and territorialimbalance that has generated a process of population redistribution initiated in the middle of thetwentieth century. Consequently, state authorities have to implement innovative and integrated actionsin Strategic Territorial Planning that encompass multiple and diverse measures, as well as sectoralinitiatives in order to advance towards the sustainable development of mountain rural spaces similarto the Niksic region, all over the country.
Depopulation of rural areas is a complex process that is causing serious eco–socio–economicdamages, bringing dramatic losses to the long-term conservation of the local natural resources.These messages should be addressed to those governing rural environmental management anddevelopment policymaking, as well as aiding future research in the region.
Further similar research still needs to be implemented in depth to provide better data support forthe large-scale regionalization related to the environmental renovation of rural human settlements,using the opportunity of the environmental performance of rural human settlements. For the upcomingstudies it will be important to increase the understanding of the impacts of rural migration on household
Sustainability 2020, 12, 3328 21 of 23
livelihoods and consequent environmental changes, with special attention to the impacts of climatechange on the studied area.
Supplementary Materials: The following are available online at http://www.mdpi.com/2071-1050/12/8/3328/s1.In this section authors presented as followings: 1—The interview at Milomir Musikic’s family, Zupa Niksic, BastajiVillage, February 2020; 2—The interview at Bosko Draskovic’s family, Grahovo, February 2020; 3—Summary ofthe Interviews with youth living in the rural areas of Niksic (2020)
Author Contributions: Conceptualization, B.M., D.M., V.S., G.S., B.D.; methodology, B.M., D.M., V.S., G.S., B.D.;formal analysis, B.M., D.M., V.S., G.S., B.D.; investigation, B.M., D.M., V.S., G.S., B.D.; data curation, B.M., D.M.,V.S., G.S.; writing—Original draft preparation, B.M., D.M., V.S., G.S., B.D.; writing—Review and editing, B.M.,D.M., V.S., G.S., B.D.; supervision, D.M., V.S.; project administration, V.S., G.S., B.D.; funding acquisition, V.S., G.S.,B.D. All authors have read and agreed to the published version of the manuscript.
Funding: This research received no external funding.
Conflicts of Interest: The authors declare no conflict of interest.
References
1. Qin, H. Rural-to-Urban Labor Migration, Household Livelihoods, and the Rural Environment in ChongqingMunicipality, Southwest China. Hum. Ecol. 2010, 38, 675–690. [CrossRef] [PubMed]
2. Ma, T.; Lu, R.; Zhao, N.; Shaw, S.L. An estimate of rural exodus in China using location-aware data. PLoS ONE2018, 13, e0201458. [CrossRef] [PubMed]
3. Farrell, K. The rapid urban growth triad: A new conceptual framework for examining the urban transition indeveloping countries. Sustainability 2017, 9, 1407. [CrossRef]
4. Spalevic, V.; Lakicevic, M.; Radanovic, D.; Billi, P.; Barovic, G.; Vujacic, D.; Sestras, P.; Khaledi Darvishan, A.Ecological-Economic (Eco-Eco) Modelling in the River Basins of Mountainous Regions: Impact of LandCover Changes on Sediment Yield in the Velicka Rijeka, Montenegro. Not. Bot. Horti Agrobot. Cluj-Napoca2017, 45, 602–610. [CrossRef]
5. Mukhtar, U.; Zhong, Z.; Tian, B.; Razzaq, A.; Naseer, M.A.R.; Hina, T. Does Rural–Urban Migration ImproveEmployment Quality and Household Welfare? Evidence from Pakistan. Sustainability 2018, 10, 4281.[CrossRef]
6. Tianming, G.; Ivolga, A.; Erokhin, V. Sustainable Rural Development in Northern China: Caught in a Vicebetween Poverty, Urban Attractions, and Migration. Sustainability 2018, 10, 1467. [CrossRef]
7. Alados, C.; Errea, P.; Gartzia, M.; Saiz, H.; Escos, J. Positive and negative feedbacks and free-scale patterndistribution in rural-population dynamics. PLoS ONE 2014, 9, e114561. [CrossRef]
8. Dijkstra, L.; Poelman, H. Remote Rural Regions: How the Proximity to a City Influences the Performances of RuralRegions, Regional Focus No 1; European Commission: Paris, France, 2008.
9. OECD. Regional typology: Updated statistics. 2009. Available online: www.oecd.org/gov/regional/statisticsindicators (accessed on 31 January 2020).
10. Dijkstra, L.; Ruiz, V. Refinement of the OECD Regional Typology: Economic Performance of Remote Rural Regions;Regio, D.G., Ed.; European Commission; OECD: Paris, France, 2010.
11. Scardoni, M.; Valentin, M.; Lurye, A. Methodological Manual on Territorial Typologies 2018 edition. In Theme:General and Regional Statistics, Collection: Manuals and Guidelines; Valeriya Angelova-Tosheva, V., Müller, O.,Eds.; Eurostat, Unit E4, Regional statistics and geographical informationEurostat; European Union: Brussels,Belgium, 2019.
12. Brajuskovic, M.; Brajuskovic, D.; Mijanovic, D.; Spalevic, V. Indicators of the Regional Differences in theAgeing Population of Montenegro. J. Environ. Prot. Ecol. 2018, 19, 309–318.
13. Mijanovic, D.; Brajuskovic, M.; Vujacic, D.; Spalevic, V. Causes and Effects of Aging of MontenegrinPopulation. J. Environ. Prot. Ecol. 2017, 18, 1249–1259.
14. Despotovic, A.; Joksimovic, M.; Svrznjak, K.; Jovanovic, M. Rural areas sustainability: Agriculturaldiversification and opportunities for agri-tourism development. Agric. For. 2017, 63, 47–62. [CrossRef]
15. Delgado Viñas, C. Depopulation processes in European Rural Areas: A case study of Cantabria (Spain).Eur. Countrys. 2019, 11, 341–369. [CrossRef]

Sustainability 2020, 12, 3328 22 of 23
16. Central Intelligence Agency. The World Factbook; Central Intelligence Agency: Washington, DC, USA,2020. Available online: https://www.cia.gov/library/publications/resources/the-world-factbook/index.html(accessed on 31 January 2020).
17. Kranjc, A. History of deforestation and reforestation in the Dinaric Karst. Geogrl Res. 2008, 47, 15–23.[CrossRef]
18. Frankl., A.; Lenaerts, T.; Radusinovic, S.; Spalevic, V.; Nyssen, J. The regional geomorphology of Montenegromapped using land surface parameters. Z. Für Geomorphol. 2016, 60, 21–34. [CrossRef]
19. Kerckhof, A.; Spalevic, V.; Eetvelde, V.V.; Nyssen, J. Factors of land abandonment in mountainousMediterranean areas: The case of Montenegrin settlements. SpringerPlus 2016, 5, 1–15. [CrossRef] [PubMed]
20. Nyssen, J.; Van den Branden, J.; Spalevic, V.; Frankl, A.; Van de Velde, L.; Curovic, M.; Billi, P. Twentiethcentury land resilience in Montenegro and consequent hydrological response. Land Degrad. Dev. 2014, 25,336–349. [CrossRef]
21. Pittaway, M. Eastern Europe 1939–2000; Arnold: London, UK, 2004.22. Perosevic, N. Agriculture development in the Municipality of Niksic (1945-1991). Agric. For. 2020, 66, 87–98.
[CrossRef]23. MacDonald, D.; Crabtree, J.R.; Wiesinger, G.; Dax, T.; Stamou, T.; Fleury, P.; Gutierrez Lazpita, J.; Gibon, A.
Agricultural abandonment in mountain areas of Europe: Environmental consequences and policy response.J. Environ. Manag. 2000, 59, 47–69. [CrossRef]
24. Miller, N.J. Serbia and Montenegro. In Eastern Europe. An introduction to the People, Lands, and Culture;Frucht, R., Ed.; ABC-CLIO: Santa Barbara, CA, USA, 2005; pp. 529–581.
25. Lazic, M.; Sekelj, L. Privatisation in Yugoslavia (Serbia and Montenegro). Eur.-Asia Stud. 1997, 49, 1057–1070.[CrossRef]
26. MONSTAT—Statistics Office. Statistical Yearbook for 2018; MONSTAT: Podgorica, Montenegro, 2018.27. MONSTAT—Statistical Office. First Results—Census of Population, Households and Apartments in Montenegro;
MONSTAT: Podgorica, Montenegro, 2011.28. MONSTAT—Statistics Office. Census tables: Table O4 Age and Gender; MONSTAT: Podgorica, Montenegro,
2011.29. MONSTAT—Statistical Office. Comparative Population Survey 1948, 1953, 1961, 1971, 1981, 1991 and
2003—Settlement Data; MONSTAT: Podgorica, Montenegro, 2005.30. MONSTAT—Statistical Office. MONSTAT—Statistics Directorate: Monthly Review, Bulletins for 2011, 2012,
2013, 2014, 2015, 2016, 2017 and 2018; MONSTAT: Podgorica, Montenegro, 2018.31. Radojicic, B. Niksic Municipality, Nature and Social Development; Faculty of Philosophy in Niksic and Niksic
Municipality: Niksic, Montenegro, 2010.32. Mijanovic, D. Changes of population density in the municipality of Niksic as a result of migration. J. Geogr.
Inst. Cvijic 2014, 64, 51–63. [CrossRef]33. Spalevic, V.; Dlabac, A.; Jovovic, Z.; Rakocevic, J.; Radunovic, M.; Spalevic, B.; Fuštic, B. The Surface and
distance Measuring Program. Acta Agric. Serbica. 1999, 4, 63–71.34. Spalevic, V. Impact of Land Use on Runoff and Soil Erosion in Polimlje. Ph.D. Thesis, Faculty of Agriculture
of the University of Belgrade, Belgrade, Serbia, 2011.35. Spalevic, V. Assessment of Soil Erosion Processes by Using the ‘IntErO’ Model: Case Study of the Duboki
Potok, Montenegro. J. Environ. Prot. Ecol. 2019, 20, 657–665.36. Chalise, D.; Kumar, L.; Spalevic, V.; Skataric, G. Estimation of Sediment Yield and Maximum Outflow Using
the IntErO Model in the Sarada River Basin of Nepal. Water 2019, 11, 952. [CrossRef]37. Vujacic, D.; Barovic, G.; Djekovic, V.; Andjelkovic, A.; Khaledi Darvishan, A.; Gholami, L.; Jovanovic, M.;
Spalevic, V. Calculation of Sediment Yield using the River Basin and Surface and Distance Models: A CaseStudy of the Sheremetski Potok Watershed, Montenegro. J. Environ. Prot. Ecol. 2017, 18, 1193–1202.
38. Galletta, A. Mastering the Semi-structured Interview and beyond: From Research Design to Analysis and Publication;New York University Press: New York, NY, USA, 2013.
39. Fagerholm, N.; Kayhko, N.; Ndumbaro, F.; Khamis, M. Community stakeholders’ knowledge in landscapeassessments-mapping indicators for landscape services. Ecol. Ind. 2012, 18, 421–433. [CrossRef]
40. Neuman, W.L. Social Research Methods: Qualitative and Quantitative Approaches; Allyn and Bacon: Boston, MA,USA, 2003.

Sustainability 2020, 12, 3328 23 of 23
41. Strauss, A.; Corbin, J. Basics of Qualitative Research: Grounded theory Procedures and Techniques; Sage: ThousandOaks, CA, USA, 1998.
42. Hawbaker, T.J.; Radeloff, V.C.; Hammer, R.B.; Clayton, M.K. Road density and landscape pattern in relationto housing density, land ownership, land cover, and soils. Landsc. Ecol. 2004, 20, 609–625. [CrossRef]
43. Kabir, J.; Cramb, R.; Alauddin, M.; Gaydon, D.; Roth, C. Farmers’ perceptions and management of risk inrice/shrimp farming systems in South-West Coastal Bangladesh. Land Use Policy 2020, 95, 104577. [CrossRef]
44. Fang, C.; Cui, X.; Li, G.; Bao, C.; Wang, Z.; Ma, H.; Sun, S.; Liu, H.; Luo, K.; Ren, Y. Modelling regionalsustainable development scenarios using the Urbanization and Eco-environment Coupler: Case study ofBeijing-Tianjin-Hebei urban agglomeration, China. Sci. Total Environ. 2019, 689, 820–830. [CrossRef]
45. Jiang, C.; Li, G.; Du, J.; Jia, Y.; Bai, J. Spatial differentiation characteristics of internal ecological land structurein rural settlements and its response to natural and socio-economic conditions in the Central Plains, China.Sci. Total Environ. 2019, 709, 135932. [CrossRef]
46. Tezcana, A.; Buyuktas, K.; Tulin, S.; Aslanb, A. A multi-criteria model for land valuation in the landconsolidation. Land Use Policy 2020, 95, 104572. [CrossRef]
47. Kiss, E. Rural restructuring in Hungary in the period of socio-economic transition. GeoJournal 2000, 51,221–233. [CrossRef]
48. Ihlanfeldt, K.R. The effect of land use regulation on housing and land prices. J. Urban Econ. 2007, 61, 420–435.[CrossRef]
49. Ayer, B.E.J.; Mincato, L.R.; Lammle, L.; Silva, M.P.F.L.; Garofalo, T.F.D.; Servidoni, E.L.; Spalevic, V.;Pereira, Y.S. Hydrosedimentological dynamics in the Guarani Aquifer System, Ribeirão Preto, State of SãoPaulo, Brazil. Agric. For. 2020, 66, 215–232.
50. Tavares, A.S.; Spalevic, V.; Avanzi, J.C.; Nogueira, D.A.; Silva, M.L.N.; Mincato, R.L. Modelling of watererosion by the erosion potential method in a pilot subbasin in southern Minas Gerais. Semin.: Ciências Agrárias2019, 40, 555–572. [CrossRef]
51. Sestras, , P.; Bilas, co, S, .; Ros, ca, S.; Nas, , S.; Bondrea, M.V.; Gâlgău, R.; Veres, , I.; Sălăgean, T.; Spalevic, V.;Cîmpeanu, S.M. Landslides Susceptibility Assessment Based on GIS Statistical Bivariate Analysis in the HillsSurrounding a Metropolitan Area. Sustainability 2019, 11, 1362. [CrossRef]
52. Palevic, M.; Spalevic, V.; Skataric, G.; Milisavljevic, B.; Spalevic, Z.; Rapajic, B. Environmental responsibilityof member states of the European Union. J. Environ. Prot. Ecol. 2019, 20, 886–895.
53. El Mouatassime, S.; Boukdir, A.; Karaoui, I.; Skataric, G.; Nacka, M.; Khaledi Darvishan, A.; Sestras, P.;Spalevic, V. Modelling of soil erosion processes and runoff for sustainable watershed management: Casestudy Oued el Abid Watershed, Morocco. Agric. For. 2019, 65, 241–250. [CrossRef]
54. Ma, W.Q.; Jiang, G.H.; Zhang, R.J.; Li, Y.L.; Jiang, X.G. Achieving rural spatial restructuring in China:A suitable framework to understand how structural transitions in rural residential land differ acrossperi-urban interface? Land Use Policy 2018, 75, 583–593. [CrossRef]
© 2020 by the authors. Licensee MDPI, Basel, Switzerland. This article is an open accessarticle distributed under the terms and conditions of the Creative Commons Attribution(CC BY) license (http://creativecommons.org/licenses/by/4.0/).