Continuous Improvement Coaching Facilitators' Workbook
84
Continuous Improvement Coaching Facilitators’ Workbook Regional Educational Laboratory Appalachia at SRI International December 2020
Transcript of Continuous Improvement Coaching Facilitators' Workbook

Continuous Improvement Coaching
Facilitators’ Workbook
Regional Educational Laboratory Appalachia at SRI International
December 2020

REL Appalachia at SRI International
Continuous Improvement Coaching: Facilitators’ Workbook i
This page intentionally left blank

REL Appalachia at SRI International
Continuous Improvement Coaching: Facilitators’ Workbook ii
These coaching materials were prepared for the Institute of Education Sciences (IES) under
Contract ED-IES-17-C-0004 by Regional Educational Laboratory Appalachia administered by
SRI International. The content does not necessarily reflect the views or policies of IES or the
U.S. Department of Education, nor does mention of trade names, commercial products, or
organizations imply endorsement by the U.S. Government.
These materials are in the public domain. While permission to reprint this document is not
necessary, it should be cited as:
Yamaguchi, R., Dempsey, K., Suarez, S., Campbell, A., Park, CJ, & Schaefer, V. (2020). Regional Educational Laboratory Appalachia: Facilitators’ Workbook for Continuous Improvement Coaching. Arlington, VA: SRI International. https://ies.ed.gov/ncee/edlabs/regions/appalachia/resources/pdfs/continuous-improvement-coaching_facilitator-workbook_Acc.pdf

REL Appalachia at SRI International
Continuous Improvement Coaching: Facilitators’ Workbook iii
REL Appalachia at SRI International
Continuous Improvement Coaching: Facilitators’ Workbook iv
Acknowledgments
The Regional Educational Laboratory (REL) Appalachia team acknowledges and thanks the
organizations, schools, and districts in Kentucky that took part in this collaborative coaching.
Their voices and rural experiences were essential to the development of this workbook. The
partners included:
Kentucky Valley Educational Cooperative (KVEC)
Jennifer Carroll, Activating Catalytic Transformation
Jackson Independent School District
Paul Green, Superintendent Melissa Roark, Principal Jeffrey Coots, STEM teacher Dixie Combs, Family Resources Youth Coordinator Victoria Howard, Science and Language Arts
Teacher
Johnson Central High School
Noel Crum, Principal Monica Daniel, Assistant Principal Justin Arms, Assistant Principal Misty Delong, Assistant Principal Marc Shepherd, Engineering Teacher
Magoffin County High School
Chris Meadows, Principal Brian Conley, Assistant Principal Jennifer Howard, Math Teacher/ Instructional Coach
Perry County Central High School Michelle Ritchie, Principal Kevin Campbell, Assistant Principal

REL Appalachia at SRI International
Continuous Improvement Coaching: Facilitators’ Workbook v
Contents
Introduction ..................................................................................... 1
Defining continuous improvement ................................................................. 2
Why is continuous improvement important? ................................................... 2
How to use this workbook ............................................................................ 3
Phase 1: Set the Foundation ............................................................... 5
What to do in this phase .............................................................................. 6
Step 1: Define the problem ............................................................................... 6 Step 2: Create your theory of action ................................................................... 8
Step 3: Select an evidence-based practice ........................................................... 9
Facilitator tips .......................................................................................... 13
Additional resources ................................................................................. 14
Phase 2: Plan ................................................................................. 15
What to do in this phase ............................................................................ 16
Step 1: List the action steps ............................................................................ 16
Step 2: Identify data to monitor ....................................................................... 17 Step 3: Make predictions ................................................................................ 18
Facilitator tips .......................................................................................... 20
Additional resources ................................................................................. 21
Phase 3: Do ................................................................................... 22
What to do in this phase ............................................................................ 23
Step 1: Implement the action steps .................................................................. 23
Step 2: Monitor your data ............................................................................... 24
Facilitator tips .......................................................................................... 27
Additional resources ................................................................................. 27
Phase 4: Study ............................................................................... 28
What to do in this phase ............................................................................ 29
Step 1: Compare initial predictions with actual occurrences ................................... 29 Step 2: Identify patterns and trends to inform next steps ..................................... 31
Facilitator tips .......................................................................................... 33
Additional resources ................................................................................. 33
Phase 5: Act ................................................................................... 34
What to do in this phase ............................................................................ 35

REL Appalachia at SRI International
Continuous Improvement Coaching: Facilitators’ Workbook vi
Step 1: Identify new learnings ......................................................................... 35 Step 2: Think about next steps, adjustments, and improvements ........................... 37
Facilitator tips .......................................................................................... 40
Additional resources ................................................................................. 40
Final Thoughts ................................................................................ 41
Appendix A: Forming a Continuous Improvement Team ........................ A-1
Why form a continuous improvement team? ...............................................A-1
Who should be on the team? .....................................................................A-1
Tips for forming a team ............................................................................A-3
Additional resources ................................................................................A-3
Appendix B: Facilitating Your Meetings ............................................... B-1
Facilitator tips .........................................................................................B-2
Additional resources ................................................................................B-2
Appendix C: Tools and Templates...................................................... C-1
Phase 1: “Set the foundation” — Five Whys tool ......................................... C-2
Phase 1: “Set the foundation” — Hexagon exploration tool scoring template ... C-3
Phase 1: ”Set the foundation” — theory of action template .......................... C-4
Phase 2: “Plan” — action plan template .................................................... C-55
Phase 3: “Do” — data organizer template ................................................. C-61
Phase 4: “Study” — data organizer template ............................................. C-71
Phase 5: "Act” — data organizer template ................................................. C-81
Phase 5: “Act” — reflection template ........................................................ C-99
Appendix D: Case Study Scenario .................................................... D-1
Deer View High School ............................................................................ D-1
Phase 1: Set the Foundation .................................................................... D-2
Phase 2: Plan ......................................................................................... D-7
Phase 3: Do ..........................................................................................D-10
Phase 4: Study .....................................................................................D-12
Phase 5: Act .........................................................................................D-15
Final thoughts .......................................................................................D-20
References .................................................................................... R-1

REL Appalachia at SRI International
Continuous Improvement Coaching: Facilitators’ Workbook 1
Introduction
In this Facilitators’ Workbook for Continuous
Improvement Coaching, the Regional Educational
Laboratory (REL) Appalachia team has compiled
resources and strategies to support schools and districts
as they strengthen implementation of evidence-based
practices to improve student outcomes. Education
leaders and stakeholders can use this workbook and the
accompanying slide deck to facilitate continuous improvement teams in their efforts to identify
evidence-based practices, implement the evidence-based practices with a data-driven approach,
and use the process to improve student outcomes.
REL Appalachia developed the process described in this workbook and the accompanying
slides during a set of coaching activities with educators in Kentucky who are members of the
Improving Postsecondary Transitions partnership. Through ongoing meetings, the REL
Appalachia staff coached and collaborated with education leaders who led continuous
improvement initiatives in four rural Kentucky school districts and one regional cooperative.
This workbook and the accompanying slides are designed to support school leaders in eastern
Kentucky, or other school-improvement facilitators in the region, who are engaged in
improvement efforts such as launching a new school/district program, refining an existing
program or practice, or studying their contexts to help identify next steps. For the purpose of
these materials, we define a facilitator as an educator who guides an improvement team through
the continuous improvement process, supports data collection and analysis, and facilitates team
meetings. A facilitator can be an instructional coach or school improvement specialist at a
district, a district administrator, school principal, or lead teacher. These materials offer
recommendations, tips, examples, and resources to help facilitators support their improvement
team.

REL Appalachia at SRI International
Continuous Improvement Coaching: Facilitators’ Workbook 2
Defining continuous improvement
A continuous improvement process seeks to increase the effectiveness or efficiency of a
system by making small-scale changes that are repeatedly evaluated by a series of tests.1,2,3 This
process often incorporates Plan-Do-Study-Act (PDSA) cycles, which offer a systematic way to
collect and analyze data to determine whether a small change led to actual improvement.4 In
education, the continuous improvement process is generally used as a part of an effort to improve
student outcomes. This disciplined approach to improvement helps educators select an evidence-
based practice to address the school’s problem; plan, enact, and monitor action steps; and then
determine next steps based on data.5 The process increases the likelihood that the selected
evidence-based practice will lead to the intended outcomes.
Why is continuous improvement important?
Teachers and school leaders in every classroom, school, and district aim to support student
learning. To do so, many implement evidence-based practices (e.g., policies, programs,
curricula) designed to increase positive outcomes for students. However, educators often realize
little improvement in student outcomes.6,7 The new practice may not work in their particular
circumstances, or educators may not have fully implemented the new practice as intended.
Carefully monitoring action steps and outcomes throughout implementation gives educators
information to understand how implementation is going and may lead to adjustments in
implementation to tailor for local circumstances that, ultimately, yield the intended results.
workbook and the accompanying slides will support your school or district’s improvement
process and implementation of an evidence-based practice to improve outcomes for students and
teachers.8
Note: These materials are focused on strengthening implementation. This process can
help improve, but does not guarantee, outcomes. Rather, once you are implementing a
new program as intended, it is important to evaluate whether the program is leading to
the intended outcomes and, at that point, determine whether to continue it or try
something different.

REL Appalachia at SRI International
Continuous Improvement Coaching: Facilitators’ Workbook 3
How to use this workbook
This Facilitators’ Workbook outlines the five phases of the continuous improvement process
and can be used along with the accompanying slides to lead a team through the key steps of that
process. This workbook is adaptable to your local context and needs and can be used by schools
or districts to guide improvement in any practice. Each phase represents an important component
of the overall process and should be fully implemented to maximize outcomes. The process
begins with Phase 1, setting the foundation, and continues through each part of a PDSA cycle:
• Phase 1: Set the foundation
• Phase 2: Plan
• Phase 3: Do
• Phase 4: Study
• Phase 5: Act
These five phases represent one full cycle of the continuous improvement process;
completing the first cycle usually requires between six weeks to a whole school semester,
depending on the complexity of the evidence-based practice being implemented. Once a full
cycle has been completed, the team should adjust the action steps in response to the feedback
data and then initiate a second PDSA cycle. Typically, the team would not return to Phase 1: Set
the Foundation during the second PDSA cycle, unless the team decides to choose a different
evidence-based practice. Expect to complete at least two cycles within one school year to
maintain momentum for improvement.

REL Appalachia at SRI International
Continuous Improvement Coaching: Facilitators’ Workbook 4
This workbook presents each phase in a separate section, providing facilitators with the
guidance, tips, examples, and resources necessary for executing a continuous improvement
cycle. Each section includes the following details:
• What to do in this phase
- Presents a general overview of what to do in this phase and introduces templates to
use with the improvement team.
• Facilitator tips
- Provides tips from the field.
• Additional resources
- Offers additional resources for in-depth information on each step, supports in the
accompanying facilitator slides, and additional templates that can be used in each
step.
As you work through each phase, you will guide your team through discussions and action
steps. The success of your continuous improvement process relies on the input and support of a
team and should not be enacted alone or through a siloed approach. To support your leadership
of the team, we provide information and tips on how to form a continuous improvement team
(appendix A) and how to facilitate meetings (appendix B), as well as a set of customizable
templates and tools (appendix C). Appendix D is a case scenario about fictional, rural Deer View
High School, which offers concrete examples of how to implement each phase of one full cycle
of the continuous improvement process.

REL Appalachia at SRI International
Continuous Improvement Coaching: Facilitators’ Workbook 5
Phase 1: Set the Foundation

REL Appalachia at SRI International
Continuous Improvement Coaching: Facilitators’ Workbook 6
Setting a strong foundation is essential to continuous improvement work. Consider drawing
an analogy between the construction industry and education: both fields require methodical
procedures that build upon one another, and a weak foundation leads to failure of one or more
critical components. This section discusses three steps to help build a strong foundation:
• Define the problem.
• Create your theory of action.
• Select an evidence-based practice.
What to do in this phase
In setting the foundation for the continuous improvement process, you will work with your
improvement team1 to gather multiple data sources to define a problem of practice, create a
theory of action, and select an evidence-based practice to implement. Expect to schedule
between two and five meetings to complete the steps in this phase. A fictional scenario of how
one school set its foundation is provided in appendix D.
Step 1: Define the problem
The facilitator should help the improvement team analyze multiple data points to identify a
problem area and uncover its root cause. This step is typically conducted during the team’s initial
meeting, either virtually or face to face. The goal is for the team to clearly articulate the issues so
that specific action steps through a continuous improvement cycle can be formulated, enacted,
and monitored. To facilitate this analysis process:
• Compile data for the team to analyze. Identify and compile information that illustrates
a problem or challenge from multiple sources. Organize it for easy access and make it
available to your team members before meeting with them. Relying solely on student
achievement scores or accountability data may limit your view of the problem and its
1 The members of your improvement team may vary depending on the focus of your project. See appendix A for a description of team roles.

REL Appalachia at SRI International
Continuous Improvement Coaching: Facilitators’ Workbook 7
context, so when possible, include information from students, teachers, and/or families to
capture the learning environment of the school. Data sources might include:
- Attendance, absenteeism, dropout rates
- State assessments and proficiency scores
- School grades and courses
- Student social-emotional learning or school climate surveys.
• Review the data with your team. When first looking at the data with your team, ask
team members to simply describe what they see. Descriptions might include learning or
attendance gaps between students of different backgrounds or other patterns such as
inequitable student enrollment in advanced courses or low participation rates by certain
student groups in available postsecondary planning activities. Make a list of observations
for all to reference. Prompt team members to pose questions that come to mind as they
review the data. Keep the initial focus of the discussion on the data, not solutions.
• Engage the team in root-cause analysis. After the team describes the data, help them
identify additional patterns in the data and guide them in uncovering the reason(s) these
patterns occur. The Five Whys process helps improvement teams dig into these patterns
and consider why the current system incurs patterns (see appendix C for the Five Whys
template and directions). For example, the data might reveal gaps in proficiency between
students from economically disadvantaged backgrounds and non-economically
disadvantaged backgrounds, leading the improvement team to reflect on possible
differences in their learning environments. Help team members focus on reasons within a
school’s control (e.g., school policies, procedures, instructional practices, etc.) rather than
reasons beyond the school’s purview (e.g., student characteristics, family background,
etc.). The Five Whys template helps the improvement team think about why some
students may experience the learning environment differently, which may lead to insights
about which school or district practices to modify.
• Develop the problem statement. Use the results of the root-cause analysis to develop a
specific problem statement, one that articulates the challenge a school or district is facing
in student outcomes as well as its root cause. Your problem statement should be specific
so that clear action steps can be developed to reach desired outcomes (see page 11 or
REL Appalachia at SRI International
Continuous Improvement Coaching: Facilitators’ Workbook 8
appendix D for an example problem statement from the fictional Deer View High
School).
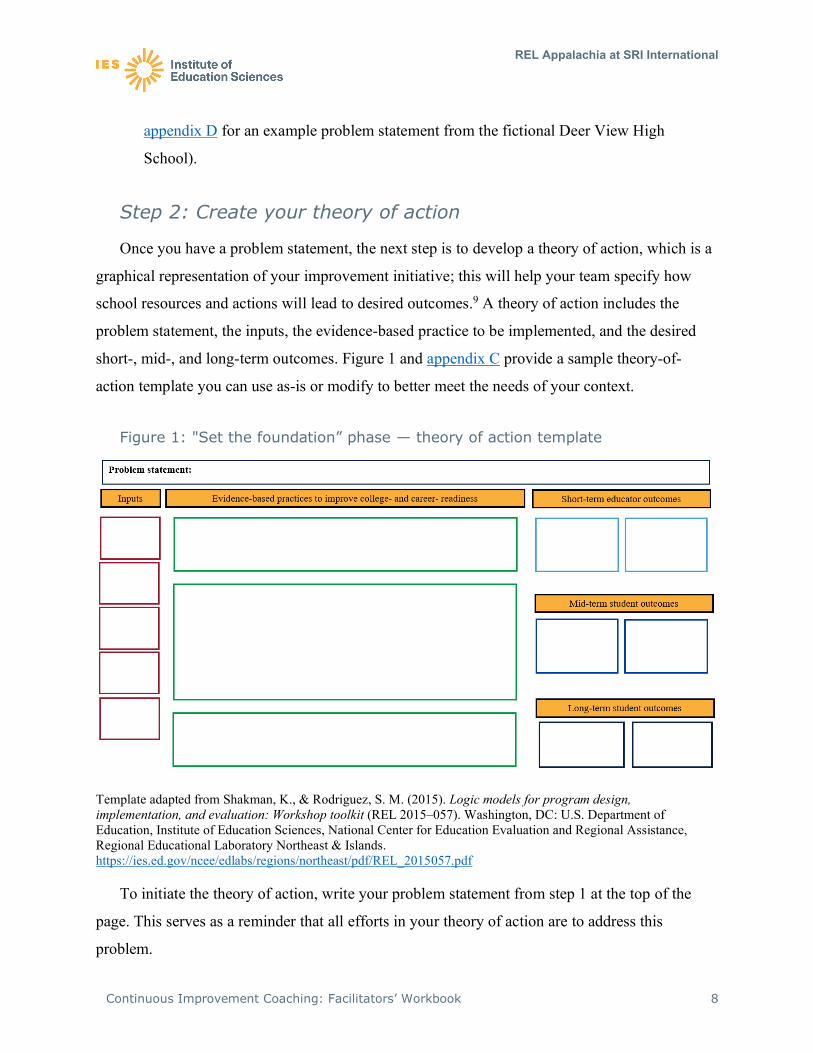
Step 2: Create your theory of action
Once you have a problem statement, the next step is to develop a theory of action, which is a
graphical representation of your improvement initiative; this will help your team specify how
school resources and actions will lead to desired outcomes.9 A theory of action includes the
problem statement, the inputs, the evidence-based practice to be implemented, and the desired
short-, mid-, and long-term outcomes. Figure 1 and appendix C provide a sample theory-of-
action template you can use as-is or modify to better meet the needs of your context.
Figure 1: "Set the foundation” phase — theory of action template
Template adapted from Shakman, K., & Rodriguez, S. M. (2015). Logic models for program design, implementation, and evaluation: Workshop toolkit (REL 2015–057). Washington, DC: U.S. Department of Education, Institute of Education Sciences, National Center for Education Evaluation and Regional Assistance, Regional Educational Laboratory Northeast & Islands. https://ies.ed.gov/ncee/edlabs/regions/northeast/pdf/REL_2015057.pdf
To initiate the theory of action, write your problem statement from step 1 at the top of the
page. This serves as a reminder that all efforts in your theory of action are to address this
problem.

REL Appalachia at SRI International
Continuous Improvement Coaching: Facilitators’ Workbook 9
Once the problem statement is recorded, begin the process of identifying your long-, mid-,
and short-term outcomes. The facilitator should organize outcome development using a
backward-design process, by starting with the long-term outcomes and working backwards to
identify the intermediate outcomes you expect will precede them. Using a backward-design
process can help you identify relevant short- and mid-term outcomes that can increase the
likelihood that you will be able to monitor progress towards and ultimately achieve your desired
long-term outcomes.
• Define long-term outcomes. Begin by articulating the desired long-term outcomes of
your improvement initiative. Focus on student learning and performance outcomes you
can quantify.
• Identify the mid-term outcomes. Mid-term outcomes are typically the desired actions
that lead to long-term goals. For these, focus on student cognitive, academic, and social
and emotional behaviors that lead to student learning and performance.
• Identify the short-term outcomes. Adult behaviors and actions prompt changes in
student outcomes, so short-term outcomes typically focus on teacher or school leader
behaviors and instructional outcomes.10,11 To formulate the short-term outcomes, the
improvement team should first determine who within the school (e.g., administrator,
teacher, counselor, etc.) has the greatest opportunity to influence the desired student
outcomes. These individuals are recognized as change agents who will enact the selected
evidence-based practice. Short-term outcomes are affiliated with each change agent.
• Identify inputs. Inputs typically include the individuals, material resources, external
supports, and the time required to execute your improvement initiative.
The theory of action is now anchored by inputs and outcomes. The next step will identify
activities to place in the center of the theory of action: the key components of the evidence-based
practice.
Step 3: Select an evidence-based practice
At this point, you have a problem statement, a list of inputs, and a list of outcomes. Step 3
fills in the “black box” of the teaching and learning process—the evidence-based practice(s) that

REL Appalachia at SRI International
Continuous Improvement Coaching: Facilitators’ Workbook 10
will contribute to your desired outcomes. For this, select practice(s) that meet one of the four
tiers of evidence in the Every Student Succeeds Act (ESSA). ESSA evidence tiers include:
• Tier 1 – Strong Evidence: supported by one or more well-designed and well-
implemented randomized controlled experimental studies.
• Tier 2 – Moderate Evidence: supported by one or more well-designed and well-
implemented quasi-experimental studies.
• Tier 3 – Promising Evidence: supported by one or more well-designed and well-
implemented correlational studies (with statistical controls for selection bias).
• Tier 4 – Demonstrates a Rationale: practices that have a well-defined logic model or
theory of action, are supported by research, and have some effort under way by a state
education agency, local education agency, or outside research organization to determine
their effectiveness.
The facilitator’s role during this step is to help the improvement team identify the best-
aligned evidence-based practice for the school’s problem statement, local context, and resources.
It helps to propose practices with strong evidence of improving outcomes for students like yours,
that are affordable, and that have been tested in communities like yours. When an evidence
based-based practice cannot be identified, the facilitator should help the team choose a practice
or strategy that is best aligned with the problem statement. A useful approach to selecting an
evidence-based practice includes:
• Compile evidence-based practices for the team’s consideration. This step will likely
require research, so allot sufficient time between team meetings. Depending on the scope
of the topic, research may take a few hours or may occur across a few days. Encourage
team members to take part in compiling a list of potential evidence-based practices and
supporting documentation describing their usability, effectiveness, and suitability for
your context. Reach out to trusted sources for help, such as the Regional Educational
Laboratories, the What Works Clearinghouse website (which provides practice guides,
intervention reports, and other resources for educators), and other organizations listed at
the end of this section, on page 14.

REL Appalachia at SRI International
Continuous Improvement Coaching: Facilitators’ Workbook 11
• Discuss and assess options and alternatives. Convene the improvement team to review
each evidence-based practice. Each member should show supporting evidence for each
potential practice, such as studies finding a positive impact on similar students.
Evaluating practices by reviewing studies may be time-consuming and difficult.
However, trusted sources such as the Regional Educational Laboratories and the What
Works Clearinghouse websites may be of assistance. The goal is to reduce selections to
three or fewer viable options.
Consider using the Hexagon exploration tool from the National Implementation Research
Network (appendix C) to evaluate practices, which provides a systematic approach to
examining and selecting an evidence-based practice.12 This tool uses three indicators to
assess the efficacy of the program or practice (evidence, usability, and supports) and
three indicators to assess site fit (capacity to implement, fit with current initiatives, and
need).
• Select the evidence-based practice for implementation. Based on the team’s
assessment of viable alternatives, reach consensus on which evidence-based practice to
implement for your improvement initiative. Reaching consensus is critical, as successful
execution relies on support from all team members. Continue your discussion and vetting
process until all members agree to support the selected practice.
Once the evidence-based practice(s) are selected, update your theory of action to include the
key components of the evidence-based practice.
Phase 1 at Deer View High School (DVHS)
The DVHS principal was concerned that 82.5 percent of seniors graduated last year,
but among students who qualify for free or reduced-price meals, only 70 percent
graduated. The principal created an improvement team that included the department
chairs in math and English, the director of counseling, the assistant principal, and a
district school improvement specialist to identify the school’s problem of practice and
set the foundation for improvement.

REL Appalachia at SRI International
Continuous Improvement Coaching: Facilitators’ Workbook 12
Step 1: Define the problem
Problem statement: Students are not prepared for postsecondary transition due to
inadequate development of academic and nonacademic competencies.
Step 2: Create your theory of action
Long-term student outcome: By 2025, all students at DVHS demonstrate preparedness
for the rigors of postsecondary education by earning a college preparatory diploma.
Mid-term student outcome: Students increase attendance in school and academic
engagement in classrooms.
Short-term teacher outcome: Teachers improve student academic engagement and
attendance by linking clearly stated learning objectives to career options, which helps
students understand the relevance of learning.
Inputs: Common vision of improvement, school leadership, improvement teams, time
invested in teacher professional learning, improvement specialist
Step 3: Select an evidence-based practice
The improvement team identified three evidence-based practices to vet: multi-tiered
system of support, formative assessment, and social-emotional student learning
blocks.
The team selected to implement formative assessment practices.
REL Appalachia at SRI International
Continuous Improvement Coaching: Facilitators’ Workbook 13
Facilitator tips
Think about the timing of steps. When
scheduling meetings for data analysis and
decisionmaking, steps one and two may be
combined (define the problem and create a
theory of action) into a single meeting of two
hours. Schedule enough time between steps
two and three (create a theory of action and
select an evidence-based strategy) for team
members to research improvement options.
Remember: Use multiple data sources
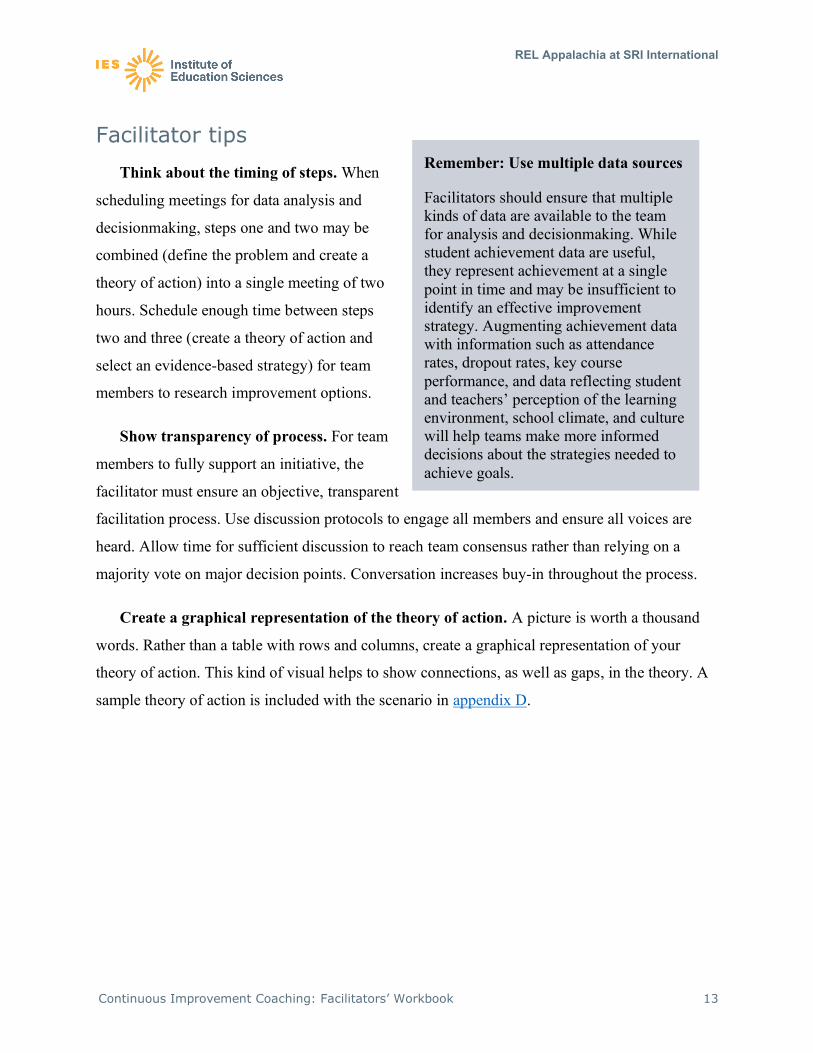
Facilitators should ensure that multiple kinds of data are available to the team for analysis and decisionmaking. While student achievement data are useful, they represent achievement at a single point in time and may be insufficient to identify an effective improvement strategy. Augmenting achievement data with information such as attendance rates, dropout rates, key course performance, and data reflecting student and teachers’ perception of the learning environment, school climate, and culture will help teams make more informed decisions about the strategies needed to achieve goals.
Show transparency of process. For team
members to fully support an initiative, the
facilitator must ensure an objective, transparent
facilitation process. Use discussion protocols to engage all members and ensure all voices are
heard. Allow time for sufficient discussion to reach team consensus rather than relying on a
majority vote on major decision points. Conversation increases buy-in throughout the process.
Create a graphical representation of the theory of action. A picture is worth a thousand
words. Rather than a table with rows and columns, create a graphical representation of your
theory of action. This kind of visual helps to show connections, as well as gaps, in the theory. A
sample theory of action is included with the scenario in appendix D.

REL Appalachia at SRI International
Continuous Improvement Coaching: Facilitators’ Workbook 14
Additional resources
For more information on the setting the foundation, see the following resources.
• The accompanying Continuous Improvement Coaching presentation slides: Slides 8–20.
• Appendix C for tools and templates that include an editable document for the Five Whys
process and the theory of action.
• Continuous Improvement Through Networked Improvement Communities: Root Cause
Analysis and Theory of Action Facilitator’s Guide. This REL Midwest facilitator’s guide
supports users engaged in the early steps of a continuous improvement process. Section 4
demonstrates how to guide a discussion on creating a theory of action.
• Elevating Evidence: Frequently Asked Questions. This Kentucky Department of
Education Frequently Asked Questions (FAQs) memo gives an overview of ESSA
evidence levels, why they matter, and how to identify evidence-based practices that fit
into school improvement plans.
• Using What Works Clearinghouse to Find Evidence-Based Interventions. This Kentucky
Department of Education Office of Continuous Improvement and Support user manual
provides a step-by-step process for navigating the What Works Clearinghouse website to
identify evidence-based interventions.
• Elevating Evidence: Clearinghouses and Databases. This Kentucky Department of
Education document lists recommended clearinghouses and databases that can be
consulted to locate evidence-based interventions.
• Applicability of Evidence-Based Interventions. This infographic from REL West
highlights seven contextual factors with related questions school leaders can consider
when assessing whether an evidence-based practice will be a good fit for their local
context.
• Core Principles of Improvement Science. The Carnegie Foundation has a number of
resources on improvement science, including the six core principles underlying
improvement.

REL Appalachia at SRI International
Continuous Improvement Coaching: Facilitators’ Workbook 15
Phase 2: Plan

REL Appalachia at SRI International
Continuous Improvement Coaching: Facilitators’ Workbook 16
As with any construction project, you need a blueprint for what you plan to build. In our
PDSA cycle, the Plan phase represents the blueprint.
The PDSA cycle begins once the foundation has been laid in Phase 1. The Plan phase
outlines the process of hypothesizing what will happen in the context of your school or district
community, collecting data, testing your hypotheses, and studying the results to build your
evidence base. The heart of the PDSA cycle—repeatedly learning what worked, what did not
work, and responding to feedback—can support positively changing student outcomes. This
section describes three steps:
• List the action steps.
• Identify data to monitor.
• Make predictions.
What to do in this phase
By systematically planning for implementation of the evidence-based practice, you are
developing evidence for whether this practice should be continued, modified, or abandoned. This
phase will require between two and three meetings to draft and finalize the plan in preparation
for implementation.
Step 1: List the action steps
The Plan phase of a PDSA cycle results in an action plan for implementing your evidence-
based practice and measuring progress toward desired outcomes. Your action plan is like a
classroom lesson plan and includes the goal or objective of the plan, the steps and activities of
the plan, the timeline for each step, and how to monitor implementation and outcomes. Consider
the following key questions when constructing your action plan:
• What are you trying to accomplish or improve?
• What change (e.g., modification to an instructional practice, new program) might you
make and why?

REL Appalachia at SRI International
Continuous Improvement Coaching: Facilitators’ Workbook 17
• How will you know that a change is an improvement?
You can use the action plan template in figure 2 and appendix C to help your team create a
plan to implement and test your evidence-based practice. The template includes sections in
which to describe the who, what, where, and when of each activity so that all team members
know their roles and responsibilities.
• Specify who will implement each planned activity. Identifying a specific person for
each action step helps distribute responsibility among team members and encourages
each member to take ownership for a component of the plan.
• Identify each action step to implement the evidence-based practice. Describe the
specific steps, both small and large, that will be required for successful implementation.
• Specify where and when each action step will occur. Although the location and
timeline for tasks may change due to unforeseen circumstances, begin with clear
directions for the team.
Step 2: Identify data to monitor
Determine how to assess your improvement effort. Identifying data to monitor contributes to
the foundation for the Do, Study, and Act phases that follow. Rather than create or collect new
data, such as new surveys or extra tests, think about data you already have. For example, if
teachers at your school use self-reflection logs, these logs could document implementation
activities. Likewise, data might be collected through classroom attendance or teacher lesson
plans. If you do collect new data, follow a systematic data collection process so data can be
collected in the same way to limit bias without overburdening the team. Part of the data
collection process plan should be to identify data collectors. The data collectors may be teachers
or other team members who have access to the data and should be specified in the plan.
Discuss data with your team at this planning phase to specify what behaviors or learning to
monitor for each of your action steps. There are two types of data to identify, and you will want
both in your plan:

REL Appalachia at SRI International
Continuous Improvement Coaching: Facilitators’ Workbook 18
• Implementation checkpoints. These data help you determine if you are implementing
the action steps as planned (e.g., the number of teachers who completed a professional
development course or the number of times a teacher used a formative assessment in
class). Your team will use the implementation checkpoints to answer, “Did we follow our
plan to enact our evidence-based practice?”
• Outcome data. These data help you determine whether your evidence-based practice is
yielding the expected changes (e.g., increased student engagement, increased attendance,
etc.) and is aligned to the short-, mid-, and long-term outcomes outlined in your theory of
action. Your team will use the outcome data to answer, “Did teachers and school leaders
improve their instruction and behavior?” and “Did student learning and performance
improve?”
Step 3: Make predictions
Once you have identified your action steps and the data you will monitor, you are ready to
predict how your action steps will actually play out. Make predictions for both the
implementation and outcome data identified above. To build these predictions, the team should
envision what changes they expect will occur because of the action steps. The team will return to
these predictions in the Study phase to assess which held true and which did not. Learning
whether your plan yielded the predicted change or an unexpected change can lead to new
hypotheses and new actions during the Act phase. Teams should make predictions for each action
step (if appropriate).
When school leaders and teachers implement new programs and policies, the implicit
assumption or hypothesis is that these new programs and policies will improve teacher and
student outcomes. Step 3 asks you to make your assumptions explicit by writing out the changes
you anticipate from each action step. For example, if one action step is that four teachers will
learn to clarify and communicate learning expectations during professional development
sessions, you should predict what teachers will take away from this training and ensure you will
have sufficient data to confirm or reject your prediction. Prediction is critical because it allows
the team to quickly determine what worked well and what did not.

REL Appalachia at SRI International
Continuous Improvement Coaching: Facilitators’ Workbook 19
Figure 2 presents the action plan template (see appendix C for an editable document). The
template includes a Notes section for additional information that would be useful to the
improvement team.
Figure 2: "Plan" phase— action plan template
List the action steps: Identify data to monitor: Make predictions:
Target person
Action steps Start/end Location Implementation Outcomes Predict change, where applicable
1.
2.
3.
4.
5.
6.
Notes:
Template adapted from Collis, S., & Foster, K. (2018, March 7). TIME for Care: Quality improvement for practice managers [PowerPoint slides]. SlideShare. https://www.slideshare.net/NHSEngland/improving-services-leading-change-implementing-change-in-rapid-cycles
Phase 2 at Deer View High School (DVHS)
DVHS is planning how to implement formative assessment as an evidence-based
practice to improve student engagement. The DVHS improvement team will test their
plan by implementing it with their grade 10 geometry teachers.
Step 1: List the action steps
Teachers will learn how to clarify and communicate learning expectations to students.
Teachers will learn how to gather evidence of student thinking.

REL Appalachia at SRI International
Continuous Improvement Coaching: Facilitators’ Workbook 20
Teachers will learn how to use formative assessment feedback to adjust their next
day’s lesson plan and instructional approach.
Step 2: Identify data to monitor
Implementation data collected through teacher interviews:
Teachers describe how they clarify and communicate student learning expectations.
Teachers describe ways to gather evidence of student learning.
Teachers describe how they use evidence of student learning to adjust their lesson
plans.
Outcome data collected by review of teacher lesson plans:
Teacher lesson plan shows clarity in learning expectations.
Teacher lesson plan incorporates evidence gathering.
Teacher lesson plan shows options for responsive action.
Step 3: Make predictions
The improvement team predicts:
All teachers will clearly communicate to students the learning targets and expectations
at the beginning of the class.
Teachers used to use quizzes to assess student thinking but will use exit tickets more
often after attending the PLC (professional learning community) meetings.
All teachers will adjust their next day’s lesson plan based on exit ticket responses.
Facilitator tips
Take the time needed to plan for successful implementation. Planning is critical for
effectively building and testing evidence-based practices in your setting or context. Be sure you
invest the time to do this phase thoroughly, and do not skip parts of developing your plan or
completing the full template. The planning process will take a minimum of 2–3 meetings over

REL Appalachia at SRI International
Continuous Improvement Coaching: Facilitators’ Workbook 21
multiple weeks to draft and finalize the plan. Consider developing a timeline and agendas for a
series of meetings aimed at leading your team through all of the plan steps.
Include enough detail. You should
provide enough step-by-step detail for
someone else to implement the plan as well
as provide enough context for the new
practice so that the people implementing it
understand why the details are important
and how the details fit into the broader plan you and your team created. Think of this step as
similar to writing a detailed lesson plan. Your action plan should resemble a lesson plan written
for a substitute teacher, a teacher who implements your intended lesson based only on your
written plans.
Remember: Write down predictions
This process of clearly articulating your prediction is a key part of the process of continuous improvement. Do not skip this step. Write down what you think will happen.
Set realistic expectations for improvement. Align your expectations for improvement with
the short-, mid-, and long-term outcomes from your theory of action. The short- and mid-term
outcomes are different from school accountability measures, which often focus only on long-
term student achievement outcomes. Continuous improvement entails completing each part of
the continuous improvement cycle and repeatedly, systematically measuring short-term
outcomes in teacher or school leader instruction and behaviors, outcomes that then lead to mid-
and long-term changes in student outcomes.
Additional resources
For more information on this phase, see the following resources.
• The accompanying Continuous Improvement Coaching presentation slides: Slides 21–26.
• Appendix C for tools and templates that include an editable document for the action plan.
• Introduction to Improvement Science. This REL West blog post provides an overview of
improvement science and highlights a project from Nevada that implements the Being a
Writer curriculum.

REL Appalachia at SRI International
Continuous Improvement Coaching: Facilitators’ Workbook 22
Phase 3: Do

REL Appalachia at SRI International
Continuous Improvement Coaching: Facilitators’ Workbook 23
As with any construction project, you will follow the approved blueprint to build a structure.
In the PDSA cycle, the Do phase represents building the house. This section describes two steps:
• Implement the action steps.
• Monitor your data.
What to do in this phase
In this phase, you will enact the action steps identified during the Plan phase and monitor the
data for use during the Study phase. Timing of the Do phase is dependent on the complexity of
the evidence-based practice(s) selected for implementation and may be as short as a few weeks
or as long as a few months. Teams should implement their selected practice(s) long enough to
collect sufficient data for decisionmaking.
Step 1: Implement the action steps
For the Do phase, you will execute the action steps and monitor the data you identified in
Phase 2, Plan. Be sure your team adheres to the agreed-upon action steps, carefully document
any deviations, and archive tools and artifacts as evidence of your progress. Key questions to ask
during the Do phase:
• Are the action steps executed as written in the plan?
• Where and how is our evidence documented?
The Do phase might seem straightforward, but implementing a new strategy or practice
coupled with a data-monitoring process can be challenging. To keep these processes manageable,
your improvement team should meet regularly to review the action plan. Check with
implementers to determine whether they need additional supports. You might consider meeting
every two weeks or set meetings that align with expected implementation timelines (e.g., if
teachers are using a new lesson every two weeks, you might meet every two weeks).

REL Appalachia at SRI International
Continuous Improvement Coaching: Facilitators’ Workbook 24
Step 2: Monitor your data
Establish a manageable and efficient protocol to help data collectors stick with the process.
Your data-collection process should include:
• Data-collection assignments. Make explicit who is responsible for collecting the data
and when it will be collected to ensure the team is clear on responsibilities and timelines.
A data-organizer template is shown in figure 3, and an editable document is available in
appendix C.
• Shared space for uploading artifacts and notes. Use a collaborative digital space (e.g.,
Google Drive, Dropbox, or SharePoint) to upload relevant implementation artifacts. Be
sure to use your district’s supported platform(s) and comply with any and all data privacy
laws and regulations as you store and share data.
• Forms, tables, or other templates for recording data. Your data collectors will need a
document to record data as it is collected. For example, if you are reviewing teacher
lesson plan objectives for alignment with standards, you might create a table listing each
teacher, the date of the lesson plan, and space to check “yes” if the lesson plan aligned
with standards. This document will vary depending on the type of data you are collecting,
so no specific template will work for every team.
• Separate folders for implementation checkpoints and outcome data. Implementation
checkpoints and outcome data serve different purposes. Implementation checkpoints are
used to determine whether actions were taken to put the activity into practice. Outcome
data are used to determine whether the expected change happened due to the actions.
Keeping these data in separate folders will help you easily access and assess how well
you implemented the evidence-based practice during the Study phase and identify
improvements during the Act phase.
• Figure 3 presents a communication template that will help organize the data identified
during the Plan phase and produced by implementing the action steps (13see appendix C
for an editable document). The first column is from the action plan template in the Plan
phase, with a list of data to collect and a description of each. In the second column,

REL Appalachia at SRI International
Continuous Improvement Coaching: Facilitators’ Workbook 25
specify who will collect the data. In the third column, the person responsible will specify
the date the data were collected.
Figure 3: “Do” phase — data organizer template
Identify data to monitor: [From Plan phase] Monitor your data:
Description of data [List implementation and outcome data from action plan template]
Who will collect data? [Name of person responsible for collecting and storing data]
Date of data collection [The date the data were collected, including multiple time points]
Implementation checkpoints
1.
2.
3.
Outcome data 1.
2.
3.
Notes:
Template adapted from Collis, S., & Foster, K. (2018, March 7). TIME for Care: Quality improvement for practice managers [PowerPoint slides]. SlideShare. https://www.slideshare.net/NHSEngland/improving-services-leading-change-implementing-change-in-rapid-cycles

REL Appalachia at SRI International
Continuous Improvement Coaching: Facilitators’ Workbook 26
Phase 3 at Deer View High School (DVHS)
During the Do phase, three DVHS geometry teachers implemented formative
assessment as planned. The teachers engaged in professional learning during PLC
meetings to clarify their understanding of formative assessment practices and then
implemented those practices in class. The improvement team documented the
teachers’ activities by collecting data on implementation checkpoints and outcomes.
Step 1: Implement the action steps
Geometry teachers participated in three PLC meetings to clarify their understanding of
formative assessment practices.
Geometry teachers implemented the formative assessment action steps for three
weeks.
Step 2: Monitor your data
The improvement team set up folders on the school’s Google Drive to compile the
implementation checkpoints and outcome data.
The improvement team gathered notes from each PLC meeting and uploaded them to
the implementation checkpoints folder.
An external partner interviewed each teacher to assess his or her understanding of
formative assessment practices and uploaded the notes to the outcome data folder.
The math lead teacher collected teacher lesson plans for evidence that formative
assessment practices were implemented and uploaded the data to the implementation
checkpoints folder.

REL Appalachia at SRI International
Continuous Improvement Coaching: Facilitators’ Workbook 27
Facilitator tips
• Establish clear roles and timelines. Make sure every team member understands his or
her role in implementing the plan and collecting data. Everyone on the team should have
access to the shared plan and timeline.
• Share updates on progress and
reminders. At team meetings or
through regular emails, provide updates
about implementation progress and data
collection; include weekly reminders
for tasks as necessary.
• Be flexible and adjust timelines as needed. Ideally, you’ll follow your plans as written.
However, to maintain support and buy-in from the team, be ready to adjust timelines.
Remember: Support the team!
Ensure staff have sufficient time and resources to plan for implementing the new strategy and collecting data. Team members and school leaders can support implementers by securing meeting or release time and helping with data documentation or aggregation.
Additional resources
For more information on this phase, see the following resources.
• The accompanying Continuous Improvement Coaching presentation slides: Slides 27–31.
• Appendix C for tools and templates that include an editable document for the data-
monitoring template.
• An Educator’s Guide to Questionnaire Development. This REL Central guide describes a
five-step process for designing effective questionnaires using research-based guidelines.
This guide can help improvement teams gather actionable data on which to base next
steps.

REL Appalachia at SRI International
Continuous Improvement Coaching: Facilitators’ Workbook 28
Phase 4: Study

REL Appalachia at SRI International
Continuous Improvement Coaching: Facilitators’ Workbook 29
Let’s refer again to the construction analogy. You built your house, and now you need to
examine whether the construction followed your blueprint or deviations occurred. In
construction, a county official may review the blueprint and inspect the house for safety and
compliance. In the PDSA process, this inspection process is called the Study phase.
The Study phase helps you to learn whether implementation progressed as planned and to
identify patterns or trends that might inform your next steps. Review the predictions noted in the
action plan template during the Plan phase and investigate whether there are any surprises in
your implementation checkpoints and/or outcome data. Two steps provide the evidence on which
improvements will be based in the Act phase:
• Compare initial predictions with actual occurrences.
• Identify patterns or trends to inform next steps.
What to do in this phase
In the Study phase, the improvement team analyzes the implementation and outcome data
collected during the Do phase and compares the actual occurrences to the predictions made
during the Plan phase. The team will also identify patterns or trends to inform next steps. This
phase typically requires one team meeting.
Step 1: Compare initial predictions with actual occurrences
In the Study phase, the team analyzes the initial action steps to improve implementation.
Facilitators should allocate at least one hour of meeting time to review the data. If there are
multiple data files from the Do phase, the facilitator should summarize these for the team before
initiating the meeting. Summaries might take the form of simple tables or graphs to facilitate
analysis and team discussion.
For quantifiable data (e.g., student attendance, PLC participation, lesson plan submissions),
you can provide simple descriptive statistics and counts, and then graphically present the data as
bar graphs or scatter plots. For qualitative data, you can review interview data and artifacts to
identify common themes. All data should be aggregated to focus on studying the implementation
REL Appalachia at SRI International
Continuous Improvement Coaching: Facilitators’ Workbook 30
process, rather than discussing individual anomalies. Two important components of analyzing
data are transparency and replicability of methods. Transparency helps others have confidence in
the quality of your data, and replicability ensures your processes can be duplicated if you scale or
want to repeat data collection. Be sure to document the processes you used to analyze the data.
Ideally, have another member of the improvement team, such as the improvement specialist,
support you in the analysis and provide a second set of eyes to confirm the compilation and
aggregation of the data. See appendix A for a description of improvement team members,
including the improvement specialist.
For the data review team meeting, present the compiled, aggregated data (not individual raw
data), as this phase is focused on improving implementation rather than highlighting the actions
of an individual team member. You are not yet making decisions, so as you discuss the compiled
data, describe the facts you see. Key questions to ask during the Study phase are:
• Did our predictions match our results for our implementation checkpoints? For our
outcomes?
• What patterns do you see?
• What actions/events might have influenced implementation of the evidence-based
practice?
Figure 4 builds on the action plan template from the Plan phase to include a new column for
documenting actual occurrences (shown in green for easy reference). Please note that figure 4
shows only some of the columns from the action plan template in order to increase readability
here. The extended action plan template is available in appendix C.

REL Appalachia at SRI International
Continuous Improvement Coaching: Facilitators’ Workbook 31
Figure 4: “Study” phase — data organizer template
List the action steps: [From Plan phase]
Make predictions: [From Plan phase] Study actual occurrences:
Target person Action steps Predict change Report results from data
1.
2.
3.
4.
5.
6.
Notes:
Template adapted from Cherasaro, T. L., Reale, M. L., Haystead, M., & Marzano, R. J. (2015). Instructional improvement cycle: A teacher’s toolkit for collecting and analyzing data on instructional strategies (REL 2015–080). Washington, DC: U.S. Department of Education, Institute of Education Sciences, National Center for Education Evaluation and Regional Assistance, Regional Educational Laboratory Central. https://ies.ed.gov/ncee/edlabs/regions/central/pdf/REL_2015080.pdf
Step 2: Identify patterns and trends to inform next steps
The data collected during the Do phase helps you identify the broader patterns and trends of
implementation. Using the template in figure 4, describe how your predictions align with the
collected data and note any actions or events that may have influenced implementation, such as
inclement weather days or other events, and summarize your findings for use in the Act phase.

REL Appalachia at SRI International
Continuous Improvement Coaching: Facilitators’ Workbook 32
Phase 4 at Deer View High School (DVHS)
During the Study phase, the facilitator aggregated and summarized the data collected
during the Do phase for analysis by the improvement team. The team compared their
initial predictions with actual occurences and discussed the patterns and trends that
occurred during implementation. This analysis formed the basis for next-step
decisionmaking.
Step 1: Compare initial predictions with actual occurrences
Two out of three teachers reviewed and identified clarifying questions.
100 percent of teachers included exit tickets in early lesson plans, but not in lesson
plans throughout the unit.
Teachers reported they needed more time to revise their lesson plans every day.
One teacher consistently identified concepts/skills daily and adjusted lesson plans
based on exit tickets.
Two teachers identified concepts/skills at the beginning of the unit and the end of the
unit.
Teachers were not consistent with identifying and including concepts/skills in
formative assessment every day.
Step 2: Identify patterns and trends to inform next steps.
The action steps were not fully implemented as planned, and therefore the predicted
changes for each action step were not fully realized.
Specifically, not all teachers reviewed and identified clarifying questions, used exit
tickets throughout the a unit, or consistently adjusted lesson plans based on formative
assessment.
All teachers included exit tickets at the beginning of the unit.
REL Appalachia at SRI International
Continuous Improvement Coaching: Facilitators’ Workbook 33
Facilitator tips
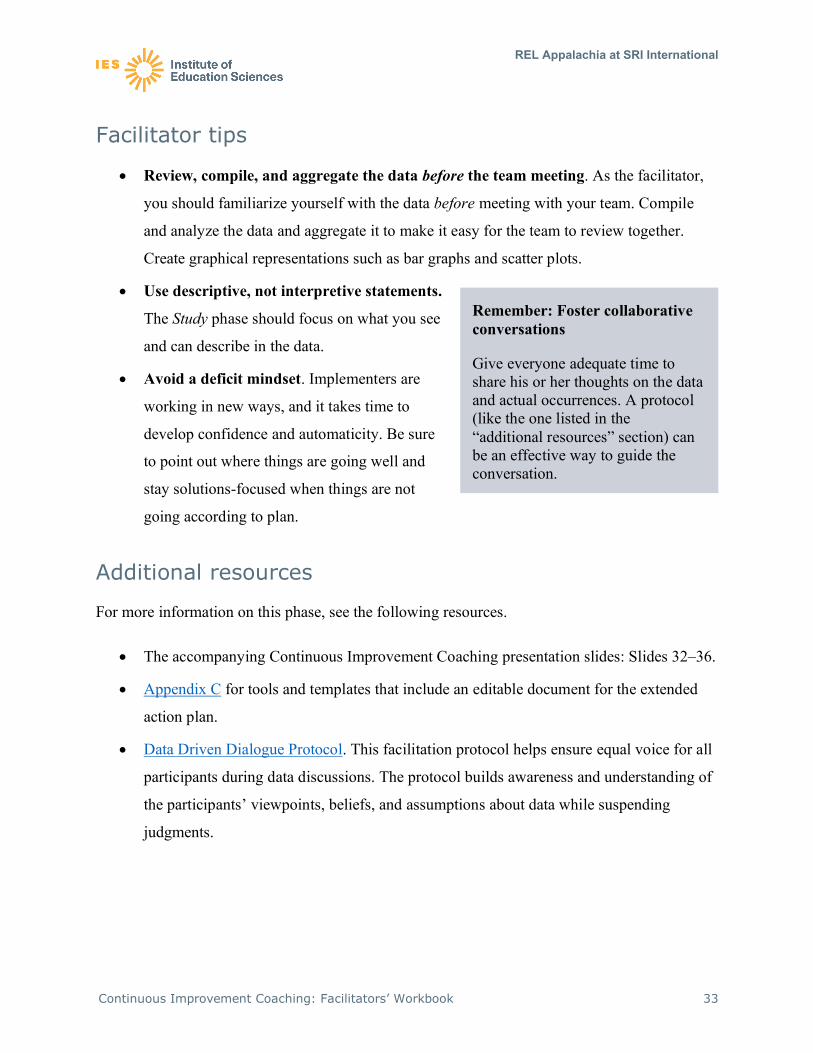
• Review, compile, and aggregate the data before the team meeting. As the facilitator,
you should familiarize yourself with the data before meeting with your team. Compile
and analyze the data and aggregate it to make it easy for the team to review together.
Create graphical representations such as bar graphs and scatter plots.
• Use descriptive, not interpretive statements.
The Study phase should focus on what you see
and can describe in the data.
• Avoid a deficit mindset. Implementers are
working in new ways, and it takes time to
develop confidence and automaticity. Be sure
to point out where things are going well and
stay solutions-focused when things are not
going according to plan.
Remember: Foster collaborative conversations
Give everyone adequate time to share his or her thoughts on the data and actual occurrences. A protocol (like the one listed in the “additional resources” section) can be an effective way to guide the conversation.
Additional resources
For more information on this phase, see the following resources.
• The accompanying Continuous Improvement Coaching presentation slides: Slides 32–36.
• Appendix C for tools and templates that include an editable document for the extended
action plan.
• Data Driven Dialogue Protocol. This facilitation protocol helps ensure equal voice for all
participants during data discussions. The protocol builds awareness and understanding of
the participants’ viewpoints, beliefs, and assumptions about data while suspending
judgments.

REL Appalachia at SRI International
Continuous Improvement Coaching: Facilitators’ Workbook 34
Phase 5: Act

REL Appalachia at SRI International
Continuous Improvement Coaching: Facilitators’ Workbook 35
After a newly-built house undergoes an inspection process, and a county official reviews the
blueprint and inspects the house for safety and compliance, you receive a report on the soundness
of your house. Upon finding something amiss, the official does not demand that the house be
demolished and rebuilt, but instead identifies items to fix. This process resembles the PDSA Act
phase, during which school teams decide to make adjustments.
As mentioned earlier, the improvement process—learning what worked versus what did not
work and refining and improving implementation through an iterative process to impact student
outcomes—is the heart of the PDSA cycle. The fifth and final phase of the continuous
improvement process is Act. Here, you and your team will make decisions about what actions to
take next based on findings from the Study phase:
• Identify new learnings.
• Think about next steps, adjustments, and improvements.
What to do in this phase
After the first four PDSA phases, you and your team now understand how your evidence-
based practice was implemented. In this final phase, you and your improvement team will
identify new learnings and determine next steps, such as what to adjust, refine, and improve.
This phase typically requires one or two team meetings.
Step 1: Identify new learnings
Now you will use your findings from the Study phase to refine your process for the next
cycle. Systematically discuss each question in this step, allowing each team member to make
comments. Keep in mind that all decisions (e.g., process adjustments, adaptations) for the next
cycle should be based on the findings from the Study phase. Consider the prompts for each
question, as explained below, as you complete the Identify new learnings column of the extended
action plan template shown in figure 5.

REL Appalachia at SRI International
Continuous Improvement Coaching: Facilitators’ Workbook 36
• What did we learn when we studied the data and information? The Study phase
concludes with a summary of findings, based on patterns and trends that emerged in the
data. Each team member should review the summary and identify the most important
finding to guide the next cycle.
• What revisions should we make to our action steps? Based on the findings from the
Study phase, team members should determine what to improve during the next
implementation cycle.
Figure 5 builds on the action plan template from the Plan and Study phases to include an
additional column to identify new learnings. Figure 5 includes the new columns and omits some
columns from the Plan and Study phase templates. The extended action plan template is
available in appendix C.
Figure 5: “Act” phase— data organizer template
List the action steps: [From Plan phase]
Make prediction: [From Plan phase]
Study actual occurrence: [From Study phase]
Identify new learnings:
Target person
Action steps
Predict change Report results from data Revise and improve action steps
1.
2.
3.
4.
5.
6.
Notes:
Template adapted from Cherasaro, T. L., Reale, M. L., Haystead, M., & Marzano, R. J. (2015). Instructional improvement cycle: A teacher’s toolkit for collecting and analyzing data on instructional strategies (REL 2015–080). Washington, DC: U.S. Department of Education, Institute of Education Sciences, National Center for
REL Appalachia at SRI International
Continuous Improvement Coaching: Facilitators’ Workbook 37
Education Evaluation and Regional Assistance, Regional Educational Laboratory Central. https://ies.ed.gov/ncee/edlabs/regions/central/pdf/REL_2015080.pdf
Step 2: Think about next steps, adjustments, and improvements
If data show the evidence-based practice is being implemented and resulting in the predicted
outcomes, keep that evidence-based practice in place. You might also consider scaling or
spreading the practice to other students, teachers, content areas, or grade levels. If data show the
evidence-based practice is not being implemented properly or not resulting in the predicted
outcomes, consider identifying no more than three of the suggested revisions to your action step
to try in the next cycle. Avoid changing too much at once: too many changes will burden
implementers and obstruct your efforts to discover which change is effective.
• What are our immediate next steps? Identify the actions the team needs to take
immediately. Here, focus on one or two priorities. Keep in mind, the Act phase sets up the
next Plan phase, when the team will update the full action plan (or template) with the
revised activities (if any) and predictions. Your top priority, or the most feasible need,
should be addressed in your immediate next step.
• What are our long-term next steps? If you identified more than one change, outline a
process for addressing other changes over time.
Figure 6 is a discussion template with key questions to help facilitate conversations around
next steps, adjustments, and improvements to the next round of the PDSA cycle.13 Use this
template in conjunction with the fully completed action plan template. The full discussion
template is available in appendix C.

REL Appalachia at SRI International
Continuous Improvement Coaching: Facilitators’ Workbook 38
Figure 6: “Act” phase — reflection template
What did we learn when we studied the data and information?
What revisions should we make to our activities and/or predictions?
What are our immediate next steps?
What are our long-term next steps?
Template adapted from Cherasaro, T. L., Reale, M. L., Haystead, M., & Marzano, R. J. (2015). Instructional improvement cycle: A teacher’s toolkit for collecting and analyzing data on instructional strategies (REL 2015–080). Washington, DC: U.S. Department of Education, Institute of Education Sciences, National Center for Education Evaluation and Regional Assistance, Regional Educational Laboratory Central. https://ies.ed.gov/ncee/edlabs/regions/central/pdf/REL_2015080.pdf

REL Appalachia at SRI International
Continuous Improvement Coaching: Facilitators’ Workbook 39
Phase 5 at Deer View High School (DVHS)
During the Act phase, the DVHS improvement team used the data analysis from the
Study phase to identify new learnings and determine next steps. They decided to adjust
their implementation plan and conduct one more PDSA test cycle with geometry
teachers prior to implementing formative assessment practices with other teachers and
students.
Step 1: Identify new learnings
Learning: Teachers seem overwhelmed. Recommendation: Host a meeting with the
geometry teachers to discuss challenges with implementation and brainstorm
solutions. Additional time for team planning may be needed.
Learning: All teachers are not clear on how to implement formative assessment
practices. Recommendation: Teachers may need additional professional development.
Using “lesson plan study” during PLC meetings may help teachers better implement
the formative assessment practices.
Learning: Updating lesson plans on a daily basis may be an unrealistic expectation.
Recommendation: Asking teachers to update lesson plans weekly may be more
feasible.
Step 2: Think about next steps, adjustments, and improvements
The DVHS geometry teachers and improvement team realized they needed another
PDSA cycle to implement the recommended adjustments and to refine their
knowledge and skill of formative assessment practices prior to implementing this
evidence-based practice with other DVHS teachers. The improvement team decided to
prioritize using a “lesson plan study” approach to help teachers effectively
operationalize formative assessment practices.

REL Appalachia at SRI International
Continuous Improvement Coaching: Facilitators’ Workbook 40
Facilitator tips
• Avoid changing too much at one time. Be gentle with yourselves as you decide which
changes to make. Limit the number of changes to keep the process manageable for the
next cycle. Instead of trying to change everything at once, focus on improving one aspect
of the theory of action at a time.
• Resist the urge to implement a complete
do-over after one PDSA cycle. Although
your initial test may not have gone as
planned, look for ways to adjust
implementation rather than abandon your
theory of action for a new idea. Adjusting
your implementation plan and engaging
with a second PDSA cycle will help you decide whether to continue this improvement
initiative or abandon the practice completely.
Remember: Aim for consensus
The team should aim for consensus! Take the time to reflect on the data and new learnings, to pave the way to shared understanding of the most appropriate action(s). Having consensus improves the likelihood of success because everyone will be working toward a common aim.
Additional resources
As you and your team work on the Act phase, you may find one or more of the resources
listed below helpful.
• The accompanying Continuous Improvement Coaching presentation slides: Slides 37–42.
• Appendix C for tools and templates that include an editable document for the extended
action plan.

REL Appalachia at SRI International
Continuous Improvement Coaching: Facilitators’ Workbook 41
Final Thoughts
To sum up, continuous improvement seeks to increase the effectiveness or efficiency of a
system by making small-scale changes that are repeatedly evaluated by a series of tests (see
Endnote 3). This Facilitators’ Workbook details the improvement process through one test cycle,
during which your improvement team addresses your school’s concern, selects an evidence-
based practice to implement, and engages in the PDSA process to test your theory of action.
Once your team completes the initial cycle, you repeat the cycle, updating your action steps in
the Plan phase and detailing how adjustments will be enacted. This process continues until your
team is confident its evidence-based practice is leading to desired outcomes. At this point, the
team might consider scaling-up the evidence-based practice across their school or district. This
iterative process can help improvement teams work through the complexities of change prior to
implementing a schoolwide initiative.
Once your evidence-based practice is fully implemented, you will test its impact on long-
term student outcomes such as student performance metrics. Starting with a strong foundation
and guided by your theory of action, you will be able to document how your improvement steps
led to short-term outcomes for educators, mid-term student learning outcomes, and finally long-
term student performance outcomes.

REL Appalachia at SRI International
Continuous Improvement Coaching: Facilitators’ Workbook Appendix A: A-1
Appendix A: Forming a Continuous
Improvement Team
A continuous improvement team comprises staff members who will support a school site’s
continuous improvement process. This appendix gives a general overview of how to form such a
team as well as recommendations for team membership. REL Appalachia encourage facilitators
to form this team before beginning Phase 1 of the continuous improvement process.
Why form a continuous improvement team?
Change in any school or district is driven by school staff members. PDSA cycles in
educational settings require school or district staff members to execute an action plan, and this
will not happen if they are not invested in the process. Sharing responsibility for the process can
increase the likelihood for success. Identifying the right team members and sustaining their
participation are key to conducting a successful PDSA cycle.
Who should be on the team?
A continuous improvement team comprises a facilitator/coach, team members, a content
expert, and change agents. Table A1 provides a general overview of possible continuous
improvement team members, but it is not intended to be prescriptive.14 Content experts and
implementers can be identified once the team has selected the program, policy, or practice to test.
Involving parents, community members, and students at various stages of the continuous
improvement cycle may be useful to build buy-in for proposed changes.
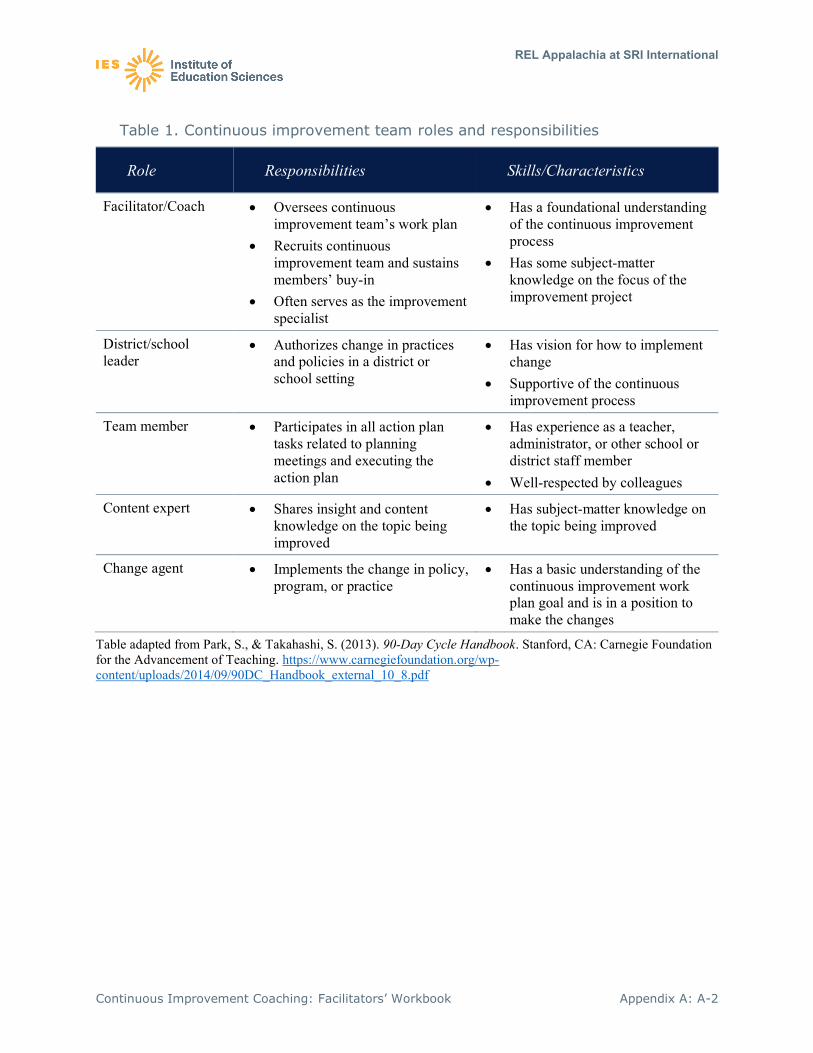
REL Appalachia at SRI International
Continuous Improvement Coaching: Facilitators’ Workbook Appendix A: A-2
Table 1. Continuous improvement team roles and responsibilities
Role Responsibilities Skills/Characteristics
Facilitator/Coach • Oversees continuous improvement team’s work plan
• Recruits continuous improvement team and sustains members’ buy-in
• Often serves as the improvement specialist
• Has a foundational understanding of the continuous improvement process
• Has some subject-matter knowledge on the focus of the improvement project
District/school leader
• Authorizes change in practices and policies in a district or school setting
• Has vision for how to implement change
• Supportive of the continuous improvement process
Team member • Participates in all action plan tasks related to planning meetings and executing the action plan
• Has experience as a teacher, administrator, or other school or district staff member
• Well-respected by colleagues
Content expert • Shares insight and content knowledge on the topic being improved
• Has subject-matter knowledge on the topic being improved
Change agent • Implements the change in policy, program, or practice
• Has a basic understanding of the continuous improvement work plan goal and is in a position to make the changes
Table adapted from Park, S., & Takahashi, S. (2013). 90-Day Cycle Handbook. Stanford, CA: Carnegie Foundation for the Advancement of Teaching. https://www.carnegiefoundation.org/wp-content/uploads/2014/09/90DC_Handbook_external_10_8.pdf

REL Appalachia at SRI International
Continuous Improvement Coaching: Facilitators’ Workbook Appendix A: A-3
Tips for forming a team
• Recruit team members before an action plan is designed—they will help drive the action
plan from the beginning.
• Encourage team members to be actively involved in planning, implementation, and
reflection of the action plan to build ownership. This will build each member’s capacity
in PDSA cycles and keep them invested in the plan.
Additional resources
• Role and Responsibilities of Implementation Team Members. This infographic from REL
Southeast presents an overview of system-level leadership roles and responsibilities at the
school, district, and state level that can be established to support the implementation of an
intervention.
REL Appalachia at SRI International
Continuous Improvement Coaching: Facilitators’ Workbook Appendix B: B-1
Appendix B: Facilitating Your Meetings
Educators are incredibly busy individuals, whose top priority is working with students. Given
this priority, scheduling improvement team meetings at convenient moments and facilitating
them effectively are critical to sustaining improvement initiatives over time. Effective meetings
depend on developing objectives and agendas before convening the team as well as formulating a
list of “to-dos” at the end of each meeting. Establishing processes for team discussion and
decisionmaking upfront will also help keep meetings on track and ensure that all voices are
heard. Finding the best day/time to schedule meetings may be a challenge, so it is important to
plan ahead and take advantage of days when school is not in session. Teacher planning times
should be used sparingly so that teachers can attend to the needs of their students.
As a facilitator, your task is supporting educators in learning to improve. Think of this role as
similar to a general contractor at a construction site managing electricians, plumbers, HVAC
specialists, and so forth. The general contractor need not be an expert in every area, but their
work is critical in making sure a house is well built and passes inspection. A continuous
improvement process facilitator relies on educator expertise and helps improvement team
members adhere to a structured process for devising a theory of action, implementing and
monitoring the improvement process, and determining next steps for continuous improvment.
Facilitators must be well organized and prepared to help the team make important decisions.
A PDSA meeting agenda template is available in appendix C to help you organize meetings.
It can be used to share progress made by implementing the change idea (Do phase), discuss
questions and concerns (Study phase), review the data the team has collected (Study phase), and
identify next steps for using the change idea in the coming week (Plan and Act phases).
Below are facilitator tips to help all members of the improvement team feel like part of the
process, see value in the process, and continue to improve and reflect on their own practice.

REL Appalachia at SRI International
Continuous Improvement Coaching: Facilitators’ Workbook Appendix B: B-2
Facilitator tips
• Schedule a series of meetings that accommodate team members’ schedules.
• Rotate which team members take responsibility for moderating meetings to build and
sustain buy-in.
• Ensure that the meeting location and room configuration offer a setting that encourages
participation of all team members. For example, gathering the team around a table in a
conference room or library might facilitate conversation more readily than meeting in a
classroom, an auditorium, or the principal’s office.
• Balance your content and improvement expertise. Your role as facilitator is to support
your team in the improvement process and to demonstrate how or if a strategy can work
in your context.
Additional resources
• Using Inquiry Cycles in PLCs to Improve Instruction. This infographic from REL West
illustrates how inquiry cycles can improve teacher collaboration and student outcomes by
focusing on instructional practice. An inquiry cycle is a type of continuous improvement
process. Continuous improvement teams can apply this model to test a change if they are
working in a professional learning community (PLC), such as a grade-level team.
• Transforming Educational Systems Toward Continuous Improvement: A Reflection
Guide for K–12 Executive Leaders. This reflection guide from the Carnegie Foundation
for the Advancement of Teaching helps school leaders and facilitators use continuous
improvement by suggesting key dispositions staff need to lead a continuous improvement
cycle. These dispositions include a growth mindset, scientific reasoning, and systems
thinking. The reflection guide provides a series of questions that facilitators can ask their
improvement team during the Plan phase to create the action plan.

REL Appalachia at SRI International
Continuous Improvement Coaching: Facilitators’ Workbook Appendix C: C-1
Appendix C: Tools and Templates
This appendix contains tools and templates to facilitate the continuous improvement planning
process; they can be modified to meet your needs.

REL Appalachia at SRI International
Continuous Improvement Coaching: Facilitators’ Workbook Appendix C: C-2
Phase 1: “Set the foundation” — Five Whys tool
Directions: Review various data from your school or district. Start by looking at an outcome that is important to the success of your school. For example, in high schools, the outcome of concern is often the high school graduation rate and the number of students who graduate college- and career-ready. Reflect on those data and ask, “Why am I seeing these results?” Write in your response, then ask yourself “Why” for that response. For example, if graduation rates are low and your response is that students aren’t passing mathematics, then ask yourself “Why aren’t students passing mathematics?” Continue asking yourself “Why” to narrow your understanding of the problem.
Why• Why [Reflect on data]:• Response #1:
Why• Why [Reflect on response #1]:• Response #2:
Why• Why [Reflect on response #2]:• Response #3:
Why• Why [Reflect on response #3]:• Response #4:
Why• Why [Reflect on response #4]:• Response #5:
Template adapted from Institute of Education Sciences. (2015, February 11). Root cause analysis: How adaptive leaders use root cause analysis to collaboratively solve student achievement needs. [video]. Youtube. https://www.youtube.com/watch?v=81iB75kjag8

REL Appalachia at SRI International
Continuous Improvement Coaching: Facilitators’ Workbook Appendix C: C-3
Phase 1: “Set the foundation” — Hexagon exploration tool scoring template
The Hexagon Exploration Tool: Discussion and Analysis Guide can be accessed from the National Implementation Research Network, Frank Porter Graham Child Development Institute, at the link below. This guide describes each indicator and includes rubrics to help improvement team members assess proposed evidence-based practices. The scoring template below can be duplicated for team members to use as they rate each indicator of a given practice.
Practice #1 Practice #2 Practice #3
Indicators
Evidence
Practice Supports
Usability
Need
Implementing site Fit
Capacity
Template adapted from Metz, A., & Louison, L. (2019). The hexagon tool: Exploring context. Chapel Hill, NC: National Implementation Research Network, Frank Porter Graham Child Development Institute, University of North Carolina at Chapel Hill. Based on Kiser, Zabel, Zachik, & Smith (2007) and Blase, Kiser, & Van Dyke (2013). https://nirn.fpg.unc.edu/sites/nirn.fpg.unc.edu/files/imce/documents/NIRN%20Hexagon%20Discussion%20Analysis%20Tool%20v2.2.pdf

REL Appalachia at SRI International
Continuous Improvement Coaching: Facilitators’ Workbook Appendix C: C-4
Phase 1: ”Set the foundation” — theory of action template
Problem Statement:
Inputs Evidence-based practices to improve college- and career-readiness Short-term outcomes
Mid-term outcomes
Long-term outcomes
Template adapted from Shakman, K., & Rodriguez, S. M. (2015). Logic models for program design, implementation, and evaluation: Workshop toolkit (REL 2015–057). Washington, DC: U.S. Department of Education, Institute of Education Sciences, National Center for Education Evaluation and Regional Assistance, Regional Educational Laboratory Northeast & Islands. https://ies.ed.gov/ncee/edlabs/regions/northeast/pdf/REL_2015057.pdf

REL Appalachia at SRI International
Continuous Improvement Coaching: Facilitators’ Workbook Appendix C: C-5
Phase 2: “Plan” — action plan template
List the action steps: Identify data to monitor: Make predictions:
Target person
Action steps Start/end Location Implementation Outcomes Predict change
1.
2.
3.
4.
5.
6.
Notes:
Template adapted from Collis, S., & Foster, K. (2018, March 7). TIME for Care: Quality improvement for practice managers [PowerPoint slides]. SlideShare. https://www.slideshare.net/NHSEngland/improving-services-leading-change-implementing-change-in-rapid-cycles

REL Appalachia at SRI International
Continuous Improvement Coaching: Facilitators’ Workbook Appendix C: C-6
Phase 3: “Do” — data organizer template
Identify data to monitor: [From Plan phase] Monitor your data:
Description of data [List implementation checkpoints and outcome data from action plan template]
Who will collect data? [Name of person responsible for collecting and storing data]
Date of data collected [The date the data were collected, including multiple time points]
Implementation checkpoints
1.
2.
3.
Outcome data
1.
2.
3.
Notes:
Template adapted from Collis, S., & Foster, K. (2018, March 7). TIME for Care: Quality improvement for practice managers [PowerPoint slides]. SlideShare. https://www.slideshare.net/NHSEngland/improving-services-leading-change-implementing-change-in-rapid-cycles

REL Appalachia at SRI International
Continuous Improvement Coaching: Facilitators’ Workbook Appendix C: C-7
Phase 4: “Study” — data organizer template
List the action steps: [From Plan phase] Make predictions: [From Plan phase] Study actual occurrences:
Target person Action steps Predict change Report results from data
1.
2.
3.
4.
5.
6.
Notes:
Template adapted from Cherasaro, T. L., Reale, M. L., Haystead, M., & Marzano, R. J. (2015). Instructional improvement cycle: A teacher’s toolkit for collecting and analyzing data on instructional strategies (REL 2015–080). Washington, DC: U.S. Department of Education, Institute of Education Sciences, National Center for Education Evaluation and Regional Assistance, Regional Educational Laboratory Central. https://ies.ed.gov/ncee/edlabs/regions/central/pdf/REL_2015080.pdf
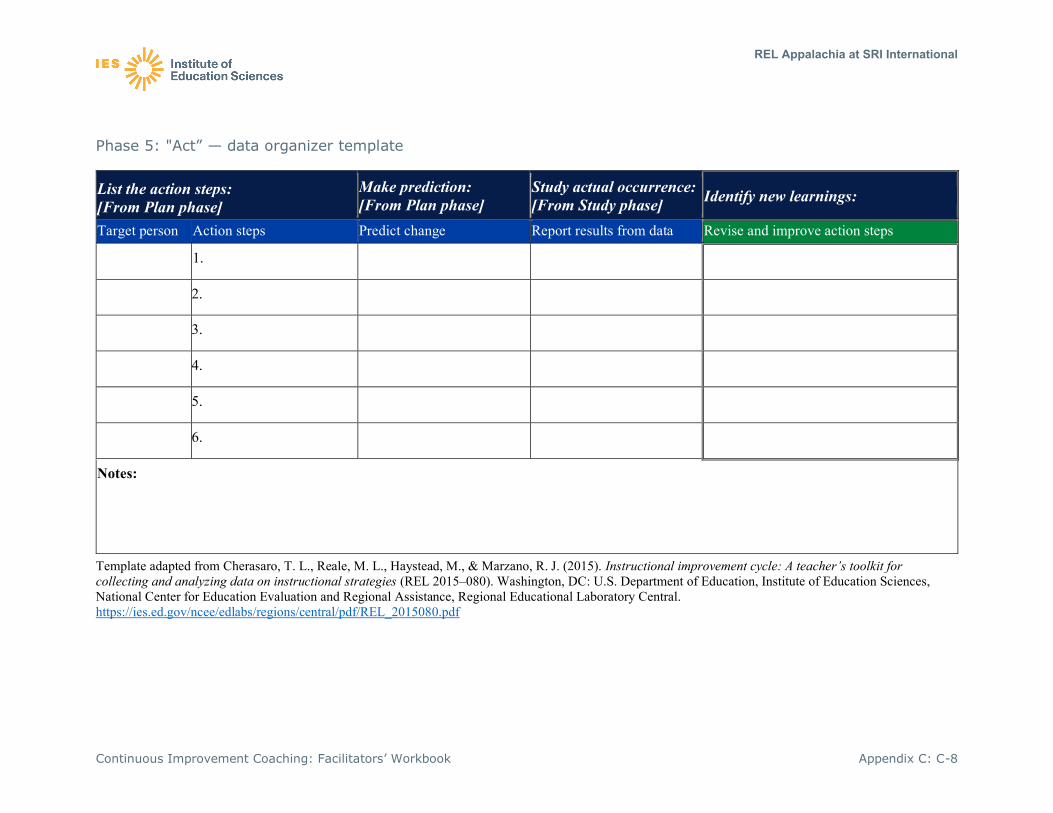
REL Appalachia at SRI International
Continuous Improvement Coaching: Facilitators’ Workbook Appendix C: C-8
Phase 5: "Act” — data organizer template
List the action steps: [From Plan phase]
Make prediction: [From Plan phase]
Study actual occurrence: [From Study phase] Identify new learnings:
Target person Action steps Predict change Report results from data Revise and improve action steps
1.
2.
3.
4.
5.
6.
Notes:
Template adapted from Cherasaro, T. L., Reale, M. L., Haystead, M., & Marzano, R. J. (2015). Instructional improvement cycle: A teacher’s toolkit for collecting and analyzing data on instructional strategies (REL 2015–080). Washington, DC: U.S. Department of Education, Institute of Education Sciences, National Center for Education Evaluation and Regional Assistance, Regional Educational Laboratory Central. https://ies.ed.gov/ncee/edlabs/regions/central/pdf/REL_2015080.pdf

REL Appalachia at SRI International
Continuous Improvement Coaching: Facilitators’ Workbook Appendix C: C-9
Phase 5: “Act” — reflection template
What did we learn when we studied the data and information?
What revisions should we make to our activities and/or predictions?
What are our immediate next steps?
What are our long-term next steps?
Template adapted from Cherasaro, T. L., Reale, M. L., Haystead, M., & Marzano, R. J. (2015). Instructional improvement cycle: A teacher’s toolkit for collecting and analyzing data on instructional strategies (REL 2015–080). Washington, DC: U.S. Department of Education, Institute of Education Sciences, National Center for Education Evaluation and Regional Assistance, Regional Educational Laboratory Central. https://ies.ed.gov/ncee/edlabs/regions/central/pdf/REL_2015080.pdf

REL Appalachia at SRI International
Continuous Improvement Coaching: Facilitators’ Workbook Appendix C: C-10

REL Appalachia at SRI International
Continuous Improvement Coaching: Facilitators’ Workbook Appendix D: D-1
Appendix D: Case Study Scenario
Deer View High School
Deer View School District is a fictional, small rural school district with one comprehensive
high school, a separate technical school, one middle school, and four elementary schools.
The Deer View High School (DVHS) profile:
• 575 students across grades 9–12.
• 67 percent of students qualify for the free/reduced-price meal program.
• Offers a few Advanced Placement courses, extracurricular clubs, and sports.
• 82.5 percent high school graduation rate.
• Students who are not economically disadvantaged (do not qualify for the free/reduced-
price meal program) have a 95 percent high school graduation rate.
• Students who are economically disadvantaged (qualify for the free/reduced-price meal
program) have a 70 percent high school graduation rate.
The principal realized that many DVHS graduates were unprepared to enroll in credit-bearing
postsecondary courses, which would diminish their likelihood of completing a postsecondary
degree or certification program.
The principal formed a school improvement team with the department chairs in math and
English, the director of counseling, and the assistant principal. Later, the principal invited the
district improvement specialist to join the team to provide coaching and additional supports. In
total, the school improvement team had six members (five school-level staff members and one
district-level staff member).

REL Appalachia at SRI International
Continuous Improvement Coaching: Facilitators’ Workbook Appendix D: D-2
Phase 1: Set the Foundation
The principal told the improvement team that many DVHS students were graduating
unprepared to enroll in credit-bearing postsecondary courses, which negatively impacts students’
ability to complete a postsecondary program or certificate. The improvement team’s goal was to
improve students’ postsecondary readiness by following the continuous improvement process.
They would start this process by defining the problem and creating a theory of action.
Step 1: Define the problem
The principal set out to clearly articulate the problem and uncover root causes with his
improvement team. The improvement team compiled school accountability data: attendance,
absenteeism, dropout rates, and student proficiency scores in math and English. The team also
examined grades in specific courses such as Algebra I and II as well as reports on school climate
from students, parents, and staff.
The improvement team used the Five Whys process to define the problem, starting with a
comparison of the graduation rate of economically disadvantaged versus non-economically
disadvantaged students in the school (see figure D1). As the team responded to each “why,” the
district improvement specialist facilitated the discussion to move away from reasons outside the
school’s locus of control and focus on what could be improved inside the school.
Based on their review of data and their reflections in the Five Whys tool, the improvement
team developed the problem statement: Students are not prepared for postsecondary transition
due to inadequate development of academic and nonacademic competencies.

REL Appalachia at SRI International
Continuous Improvement Coaching: Facilitators’ Workbook Appendix D: D-3
Figure D1: “Set the foundation” phase — Five Whys tool, Deer View High School
(DVHS)
Why•Why is the graduation rate for economically disadvantaged students 15 percentage points lower than for non-economically disadvantaged students?
•Response: Because they have a lower attendance rate than other students.
Why•Why do economically disadvantaged students have a lower attendance rate than other students?•Response: Because they’re not as engaged in school-related activities or their own learning.
Why
•Why are economically disadvantaged students not as engaged in school-related activities or their own learning?
•Response: Because they don’t see relevance in their coursework to their own lives. They are not aware of postsecondary options for college and careers.
Why•Why don’t economically disadvantaged students see relevance in their coursework to their own lives?•Response: Because staff are not explicit about coursework goals, why coursework is useful, and how it connects to postsecondary education, training or careers.
Why
•Why are staff not explicit about coursework goals, why coursework is useful, and how it connects to postsecondary education, training, or careers?
•Response: Because teachers tend to focus more on the academic content than its relevance to postsecondary education, training or careers. Teachers also need to teach nonacademic skills.
Template adapted from Institute of Education Sciences. (2015, February 11). Root cause analysis: How adaptive leaders use root cause analysis to collaboratively solve student achievement needs. [video]. Youtube. https://www.youtube.com/watch?v=81iB75kjag8
Step 2: Create your theory of action
After developing the problem statement, the improvement team proceeded to create a theory
of action (see figure D2). Using a backward-design process, the team first decided their ultimate
goal was for all students to be ready for college and careers upon graduation. The team then
brainstormed the long-term and mid-term outcomes they hoped to achieve. Working backwards,
the team noted that students need access and opportunities to be prepared for college and careers,
such as access to rigorous courses and opportunities for internships. The team also noted that
students need to demonstrate high performance in their courses and on state assessments.

REL Appalachia at SRI International
Continuous Improvement Coaching: Facilitators’ Workbook Appendix D: D-4
During a team meeting, the math and English teachers said they noticed students often give
up on learning when things get hard. The school counselor shared that she often saw students
only when they are about to drop out of school, rather than when they are proactively thinking
about college and careers. These observations led the improvement team to think that students
need to develop additional academic, cognitive, social, and emotional competencies. That is, the
goal of the continuous improvement process would be for students to develop a strong sense of
belonging and to increase attendance in school, and for students to increase their academic
engagement and ability to monitor their own learning.
The principal led the team in a discussion to identify the change agents and define short-term
outcomes. The principal asked, “Who is going to help students develop ownership of their
learning?” At first, the math and English teachers answered, “That is the job of the students.
Students must own their own learning.” The school counselor insisted that her counseling team
did not have time to meet regularly with all 575 students in the school to support their sense of
belonging. The assistant principal commented that he meets only with students who are in
trouble, such as those who are chronically absent. The principal facilitated the discussion toward
the idea that that all school staff should increase connections with students, and classroom
teachers should explicitly discuss the relevance of their subject’s content and processes to careers
and adult life. The improvement team ultimately agreed that these explicit changes to adult
behavior would improve students’ academic engagement as students would find more relevance
in what they were learning. The principal noted that these two staff and teacher actions could be
their short-term outcomes.
The improvement team listed inputs necessary to achieve these short-term outcomes. Inputs
included a common vision for improvement, strong school leadership, dedicated time for teacher
professional development, the improvement team, and an improvement specialist from the
district. The improvement specialist, a member of the district’s department of professional
learning, would focus on professional development and training and has no associations with any
performance reviews of the principal or teachers.

REL Appalachia at SRI International
Continuous Improvement Coaching: Facilitators’ Workbook Appendix D: D-5
Figure D2: “Set the foundation” phase — theory of action (draft), DVHS
Template adapted from Shakman, K., & Rodriguez, S. M. (2015). Logic models for program design, implementation, and evaluation: Workshop toolkit (REL 2015–057). Washington, DC: U.S. Department of Education, Institute of Education Sciences, National Center for Education Evaluation and Regional Assistance, Regional Educational Laboratory Northeast & Islands. https://ies.ed.gov/ncee/edlabs/regions/northeast/pdf/REL_2015057.pdf
Step 3: Select an evidence-based practice
After drafting the theory of action, the improvement team met to brainstorm evidence-based
practices that would help school staff increase their connections with students and teachers
improve academic engagement and instructional rigor. The improvement specialist conducted
research to identify the following potential options:
• Multi-tiered support system (MTSS)
• Formative assessment
• Social-emotional learning (SEL) blocks of time

REL Appalachia at SRI International
Continuous Improvement Coaching: Facilitators’ Workbook Appendix D: D-6
Led by the improvement specialist, the improvement team used the Hexagon exploration tool
to review the three options. Each team member rated each option on a scale from 1 to 5 on the
six Hexagon exploration tool indicators. The improvement specialist aggregated the ratings
across the team members, with a higher score representing best alignment to the indicators (see
table D1).
Table D1: Hexagon exploration scoring tool — aggregate rating, DVHS
Practice #1 Practice #2 Practice #3
Indicators MTSS Formative Assessment SEL Blocks
Evidence 3.8 4.7 4.3
Practice Supports 3.2 4 4.2
Usability 3.5 4 4
Need 4 4 4
Implementing site Fit 3.2 4.5 3.8
Capacity 3.8 4.5 4 Note: Improvement team’s aggregated rating based on a 5-point Likert scale, with 5 representing best alignment. Template adapted from Metz, A., & Louison, L. (2019). The hexagon tool: Exploring context. Chapel Hill, NC: National Implementation Research Network, Frank Porter Graham Child Development Institute, University of North Carolina at Chapel Hill. Based on Kiser, Zabel, Zachik, & Smith (2007) and Blase, Kiser, & Van Dyke (2013). https://nirn.fpg.unc.edu/sites/nirn.fpg.unc.edu/files/imce/documents/NIRN%20Hexagon%20Discussion%20Analysis%20Tool%20v2.2.pdf
The results from the Hexagon exploration scoring tool revealed that formative assessment
had the highest alignment score overall. The improvement team selected formative assessment as
the evidence-based practice to implement.

REL Appalachia at SRI International
Continuous Improvement Coaching: Facilitators’ Workbook Appendix D: D-7
Figure D3: “Set the foundation” phase— theory of action (final), DVHS
Template adapted from Shakman, K., & Rodriguez, S. M. (2015). Logic models for program design, implementation, and evaluation: Workshop toolkit (REL 2015–057). Washington, DC: U.S. Department of Education, Institute of Education Sciences, National Center for Education Evaluation and Regional Assistance, Regional Educational Laboratory Northeast & Islands. https://ies.ed.gov/ncee/edlabs/regions/northeast/pdf/REL_2015057.pdf
Phase 2: Plan
The improvement team identified two key components of their formative assessment strategy
to address academic challenges and engagement: (1) Formative Assessment Professional
Development, and (2) Formative Assessment Enacted Practice in Class. The team added these
components to the center of the theory of action (table D1).

REL Appalachia at SRI International
Continuous Improvement Coaching: Facilitators’ Workbook Appendix D: D-8
Table D1: “Plan” phase — action plan, DVHS
List the action steps: Identify data to monitor: Make predictions: Target person Action steps Start/end Location Implementation Outcomes Predict change Geometry teachers Mr. Knowles Ms. Riddell Ms. Neal
[PD Focus: Where am I going?] 1. Teachers will learn how to clarify
and communicate learning expectations to students.
2. Teachers will learn how to motivate students to understand why unit content is important to learn.
9/3/20 – 9/21/20
Meet in room 202 for PD
Interview: Teachers state understanding of learning expectations
Lesson plan: Teacher lesson plan shows clarity in learning expectations (Yes/ No)
Teachers will easily learn how to clarify and communicate learning expectations. All teachers’ (3 out of 3) lesson plans should reflect this at the start of the lesson. This should not be new content for teachers.
Geometry teachers Mr. Knowles Ms. Riddell Ms. Neal
[PD Focus: Where am I now?] 3. Teachers will learn how to gather
evidence of student thinking. 4. Teachers will learn how to probe
student thinking.
10/1/20 – 10/19/20
Meet in room 202 for PD
Interview: Teachers state understanding of ways to gather evidence of student meta-cognition.
Lesson plan: Teacher lesson plan incorporates evidence gathering (Yes/ No)
Teachers will first use student quizzes as evidence of student learning. Teachers will be able to use daily exit tickets to address student meta-cognition.
Geometry teachers Mr. Knowles Ms. Riddell Ms. Neal
[PD Focus: Where to next?] 5. Teachers will learn how to use
formative assessment feedback to adjust lesson plan and instructional approach the next day.
10/30/20 – 11/15/20
Meet in room 202 for PD
Interview: Teachers state how they used evidence of student learning to adjust lesson plan.
Lesson plan: Teacher lesson plan shows options for responsive action (Yes/No)
Teachers will be able to adjust their lesson plan daily by using the evidence (exit tickets).
Notes: School improvement specialist coach (Ms. Hale) will conduct interviews with teachers and collect their lesson plans. Math department chair (Ms. Neal) will facilitate weekly PLC meetings with PD focus. The principal will have weekly check-ins with Ms. Hale and Ms. Neal for improvement leadership meetings.
Template adapted from Collis, S., & Foster, K. (2018, March 7). TIME for Care: Quality improvement for practice managers [PowerPoint slides]. SlideShare. https://www.slideshare.net/NHSEngland/improving-services-leading-change-implementing-change-in-rapid-cycles

REL Appalachia at SRI International
Continuous Improvement Coaching: Facilitators’ Workbook Appendix D: D-9
Step 1: List the action steps
First, the improvement team wanted to implement formative assessment professional
development (PD) to train teachers on how to incorporate formative assessment in their lesson
plans. Rather than train all the DVHS teachers, the team decided to target a few teachers to test
out the use of formative assessment.
The team decided to focus on teachers who were highly motivated to improve their
instruction, had good relationships with their students, and had bought into the idea of formative
assessment. The team decided to select the three geometry teachers to pilot formative
assessment: Mr. Knowles, Ms. Riddell, and Ms. Neal (who is also the chair of the school’s math
department and the content expert on the improvement team). The team identified all the
geometry teachers as change agents since they will participate in the initiative.
The principal and improvement team next examined the action plan together (table D1). The
DVHS action plan shows that the improvement team selected formative assessment as its
evidence-based practice, and that the team uses teacher professional development to support
teachers in using formative assessment in their classrooms. The plan also shows who will
participate in the teacher professional development, what the professional development will
entail, the timeline for the professional development, and the location of the professional
development.
Step 2: Identify data to monitor
How would the team know whether the professional development was effective? In
identifying what evidence would be persuasive, the principal and improvement team considered
what types of data they already have, what data would be easy to collect, and what data could be
studied quickly. The implementation data focus on whether the action steps were completed. For
these data, the principal and the team decided to collect teacher interviews. The outcome data
focus on whether the action steps yielded the intended result. For these data, the team decided to
review the teachers’ lesson plans.

REL Appalachia at SRI International
Continuous Improvement Coaching: Facilitators’ Workbook Appendix D: D-10
Step 3: Make predictions
For the action plan template, the principal and the improvement team reviewed each
professional development focus to predict the changes in teacher instructional behavior they
expected as a result of the action steps.
Phase 3: Do
During the Do phase, the DVHS improvement team laid out an action plan for implementing
formative assessment and identified implementation checkpoints and outcome measures to
monitor. In this phase, Ms. Neal led her geometry teachers in a series of formative assessment
professional learning community (PLC) meetings.
Step 1: Implement the action steps
Ms. Neal, who serves as the chair of the mathematics department, met with the geometry
teachers in their weekly PLC meetings as planned. The district improvement specialist,
Ms. Hale, attended these PLC meetings to support Ms. Neal, help facilitate discussion, and take
notes. The professional development at the PLC meetings focused on how to operationalize the
three questions related to formative assessment:
The first PLC meeting focused on planning lessons, specifying learning targets, and
communicating learning expectations to students (Where am I going?). The second PLC meeting
addressed how to gather evidence of student progress toward learning targets, with a focus on
using student exit tickets (Where am I now?). The teachers discussed the possibility of using
Google Sheets to track exit tickets, but decided to use simple Post-it notes for each student
instead. The third PLC meeting focused on learning to adjust instruction based on the analysis of
student exit ticket responses (Where to next?). Teachers also discussed how they would share
what they learned from the exit tickets with students so that students would understand that their
teachers were responding to their learning needs.

REL Appalachia at SRI International
Continuous Improvement Coaching: Facilitators’ Workbook Appendix D: D-11
Step 2: Monitor your data
The improvement team completed the data organizer in table D2, specifying who would
collect the data identified in the action plan and the date the data were collected. The team
decided that to achieve the most objective input, Ms. Hale, the district improvement specialist,
should interview the teachers. The team also decided the teachers should be interviewed at the
end of each of the three main components of the formative assessment PLC (Where are we
going? Where am I now? Where to next?).
As chair of the math department, Ms. Neal was assigned to collect and document three weeks
of geometry lessons (or 15 lesson plans from each teacher for a total of 45 lesson plans). The
improvement team recognized that this task would require a great deal of time from Ms. Neal, so
the principal relieved her from afternoon bus duty.
Table D2: “Do” phase — data organizer, DVHS
Identify data to monitor: [From Plan phase] Monitor your data:
Description of data [List implementation checkpoints and outcome data from action plan template]
Who will collect data? [Name of person responsible for collecting and storing data]
Date of data collected [The date the data were collected, including multiple time points]
Implementation checkpoints 1. Interview of Ms. Neal, Mr.
Knowles, and Ms. Riddell School improvement specialist (Ms. Hale)
- 10/1/20 - 10/30/20 - 11/29/20
Outcome data 2. Lesson plans for week of 10/1/20
from Neal, Knowles, Riddell Math chair (Ms. Neal) - 10/5/20
3. Lesson plan for week of 10/25/20 from Neal, Knowles, Riddell
Math chair (Ms. Neal) - 10/30/20
4. Lesson plan for week of 11/15/20 from Neal, Knowles, Riddell
Math chair (Ms. Neal) - 11/20/20
Notes: Ms. Neal took meeting notes for each PLC meeting. Attendance at PLC meetings = 100%. Template adapted from Collis, S., & Foster, K. (2018, March 7). TIME for Care: Quality improvement for practice managers [PowerPoint slides]. SlideShare. https://www.slideshare.net/NHSEngland/improving-services-leading-change-implementing-change-in-rapid-cycles
The improvement team created a folder on Google Drive so the data collectors could upload
information and share all the information collected with the rest of the improvement team. Ms.

REL Appalachia at SRI International
Continuous Improvement Coaching: Facilitators’ Workbook Appendix D: D-12
Hale uploaded her meeting notes to Google Drive. Ms. Neal collected the lesson plans, scanned
them, and uploaded the digital copies to Google Drive.
Phase 4: Study
During the Do phase, Ms. Neal led a series of PLC professional development sessions on
formative assessment with the geometry teachers. Ms. Hale interviewed the teachers to collect
data on implementation and Ms. Neal collected lesson plans from teachers to get feedback on
outcomes. In the Study phase, the improvement team will analyze the data collected during the
Do phase to compare their initial predictions with actual occurrences and compile the evidence
for next-step decisionmaking.
Step 1: Compare initial predictions with actual occurrences
After implementing of the formative assessment professional development and collecting the
first round of data, Ms. Hale, the district specialist, reviewed the implementation checkpoints and
outcome data. For the implementation checkpoints, she conducted an initial review of interview
data to identify themes and highlights. For short-term teacher outcomes, she collected lesson
plans and summarized key teacher behavior changes (identified in the action plan from the Plan
phase) into a spreadsheet. This summary table can be found in table D3.
The improvement team then met to review the summary data. Ms. Hale facilitated the
meeting and reminded the team to keep their review descriptive and that they are all learning
together through the PDSA process.
The improvement team analyzed the interview and lesson plan data by reviewing Ms. Hale’s
summary notes and observations to collectively determine if each action step had been
implemented as planned, and whether the action steps had resulted in a teacher behavioral
change. Ms. Hale, the meeting notetaker, added the collective analysis to the action plan in table
D4.

REL Appalachia at SRI International
Continuous Improvement Coaching: Facilitators’ Workbook Appendix D: D-13
Table D3: Ms. Neal’s summary table of results: Did teacher lesson plans show options for responsive action?
Week 1 Week 2 Week 3 Summary 10/1 10/2 10/3 10/4 10/5 10/25 10/26 10/27 10/29 10/30 11/15 11/16 11/17 11/18 11/19
Neal Yes Yes Yes Yes Yes Yes Yes Yes Yes Yes Yes Yes Yes Yes Yes 100% of the time (15 out of 15)
Knowles Yes Yes No No Yes No No No No No No No No No No 20% of the time (3 out of 15)
Riddell Yes Yes Yes No No Yes Yes Yes No No Yes Yes Yes No No 60% of the time (9 out of 15)
Table notes: Ms. Neal collected and read all 15 lesson plans per teacher (for a total of 45 lesson plans). She used a spreadsheet to code whether the teacher lesson plans show options for responsive action based on student exit tickets the day before with a Yes = Lesson plan showed options for responsive action, or No = Lesson plans did not show options for responsive action.

REL Appalachia at SRI International
Continuous Improvement Coaching: Facilitators’ Workbook Appendix D: D-14
Table D4: “Study” phase — data organizer, DVHS
List the action steps: [From Plan phase] Make predictions: [From Plan phase] Study actual occurrences:
Target person Action steps Predict change Report results from data
Geometry teachers: Mr. Knowles Ms. Riddell Ms. Neal
[PD Focus: Where am I going?] 1. Teachers will learn how to clarify
and communicate learning expectations to students.
2. Teachers will learn how to motivate students to understand why unit content is important to learn.
Teachers will easily learn how to clarify and communicate learning expectations. All teachers’ (3 out of 3) lesson plans should reflect this at the start of their lesson. This should be review for teachers.
Two out of three teachers reviewed and identified clarifying questions [Data source: Meeting notes and teacher interviews]
Geometry teachers: Mr. Knowles Ms. Riddell Ms. Neal
[PD Focus: Where am I now?] 3. Teachers will learn how to gather
evidence of student thinking. 4. Teachers will learn how to probe
student thinking.
Teachers will first use student quizzes as evidence of student learning. After the PD, teachers will be able to use daily exit tickets to understand student metacognition.
100% of teachers included exit tickets in early lesson plans but not throughout the unit. Teachers reported more time needed to revise their lesson plans every day. [Data source: Review of teacher lesson plans]
Geometry teachers: Mr. Knowles Ms. Riddell Ms. Neal
[PD Focus: Where to next?] 5. Teachers will learn how to use
formative assessment feedback to adjust lesson plans and instructional approaches the next day.
Teachers will be able to adjust their lesson plan daily by using the evidence (exit tickets).
Oneteacher consistently identified concepts/skills daily and adjusted lesson plans based on exit tickets. Two teachers identified concepts/skills at the beginning of the unit and the end of the unit. Teachers were not consistent with identifying and including concepts/skills in formative assessment every day. [Data source: Review of teacher lesson plans]
Notes: All data in Google Drive with subfolders for teacher interviews, meeting notes, and lesson plans. Spreadsheet used to organize themes from the interviews and lesson plans. The team has now bolded the significant patterns and trends in the data that are to be considered in the next phase.
Template adapted from Cherasaro, T. L., Reale, M. L., Haystead, M., & Marzano, R. J. (2015). Instructional improvement cycle: A teacher’s toolkit for collecting and analyzing data on instructional strategies (REL 2015–080). Washington, DC: U.S. Department of Education, Institute of Education Sciences, National Center for Education Evaluation and Regional Assistance, Regional Educational Laboratory Central. https://ies.ed.gov/ncee/edlabs/regions/central/pdf/REL_2015080.pdf

REL Appalachia at SRI International
Continuous Improvement Coaching: Facilitators’ Workbook Appendix D: D-15
Step 2: Identify patterns and trends to inform next steps
After completing the action plan, the team stepped back to identify patterns or trends in the
implementation or outcome of the formative assessment professional development. Each team
member responded to the following questions:
• Were the action steps implemented as planned?
• How did our predictions align with our results?
• Did anything happen that may have affected implementation or outcomes?
During this discussion, the team went back to the action plan to highlight the key patterns
and trends in the data that would now be important to consider during the final phase, the Act
phase.
Phase 5: Act
During this phase, the team reflected on the cycle thus far. Although the action steps focused
on only three geometry teachers trying out formative assessment, the team had learned a lot
about what works and what can be challenging. This final phase of the PDSA cycle began by
identifying new learnings.
Step 1: Identify new learnings
By comparing predicted changes to what actually happened, the improvement team learned a
great deal. First, they discussed a renewed appreciation for the hard work and craftsmanship
involved in quality teaching. Second, they started thinking about how to revise and improve the
action steps for the next round of formative assessment professional development as well as how
to fully use formative assessment in the geometry classroom.

REL Appalachia at SRI International
Continuous Improvement Coaching: Facilitators’ Workbook Appendix D: D-16
Table D5: “Act” phase — data organizer, DVHS
List the action steps: [From Plan phase]
Make prediction: [From Plan phase]
Study actual occurrence: [From study phase]
Identify new learnings:
Target person Action steps Predict change Report results from data Revise and improve action steps
Geometry teachers: Mr. Knowles Ms. Riddell Ms. Neal
[PD Focus: Where am I going?] 1. Teachers will learn how
to clarify and communicate learning expectations to students.
2. Teachers will learn how to motivate students to understand why unit content is important to learn.
Teachers will easily learn how to clarify and communicate learning expectations. All teachers’ (3 out of 3) lesson plans should reflect this at the start of their lesson. This should be review for teachers.
Two out of three teachers reviewed and identified clarifying questions [Data source: Meeting notes and teacher interviews)
Try out group discussion and “lesson plan study” during PLC meeting to get 100% teachers to understand how to communicate and clarify learning expectations.
Geometry teachers: Mr. Knowles Ms. Riddell Ms. Neal
[PD Focus: Where am I now?] 3. Teachers will learn how to
gather evidence of student thinking.
4. Teachers will learn how to probe student thinking.
Teachers will first use student quizzes as evidence of student learning. Through the PD, teachers will be able to use daily exit tickets to understand student metacognition.
100% of teachers included exit tickets in lesson plan at the beginning but not throughout the course of the unit. Teachers reported more time needed to revise their lesson plans every day. [Data source: Review of teacher lesson plans]
We need to identify ways to find time for our geometry teachers to work on lesson plans. The implementation team should host a meeting with the geometry teachers to discuss this, hearing their ideas for ways to find more time, as any solutions need their support. ** Consider sustainability and burnout.
Geometry teachers: Mr. Knowles Ms. Riddell
[PD Focus: Where to next?] 5. Teachers will learn how
to use formative assessment feedback to
Teachers will be able to adjust their lesson plan daily by using the evidence (exit tickets).
One teacher consistently identified concepts/skills daily. Two teachers identified concepts/skills at the beginning of the unit and
We need to identify appropriate professional development to build teachers’ skills related to learning goals including concepts and skills related to formative assessment. Then,

REL Appalachia at SRI International
Continuous Improvement Coaching: Facilitators’ Workbook Appendix D: D-17
List the action steps: [From Plan phase]
Make prediction: [From Plan phase]
Study actual occurrence: [From study phase]
Identify new learnings:
Target person Action steps Predict change Report results from data Revise and improve action steps Ms. Neal adjust lesson plans and
instructional approaches the next day.
the end of the unit. Teachers not consistent with identifying and including concepts/ skills in formative assessment every day. [Data source: Review of teacher lesson plans]
we need to offer our geometry teachers the professional development as soon as possible. ** Consider and discuss more professional development or trying out formative assessment in one classroom at a time. Teachers seem overwhelmed and need more small-scale practice.
Notes: The chair of the English department wanted to start sitting in on some of the formative assessment PLC meetings to see if there are useful takeaways to bring back to the English department.
Template adapted from Cherasaro, T. L., Reale, M. L., Haystead, M., & Marzano, R. J. (2015). Instructional improvement cycle: A teacher’s toolkit for collecting and analyzing data on instructional strategies (REL 2015–080). Washington, DC: U.S. Department of Education, Institute of Education Sciences, National Center for Education Evaluation and Regional Assistance, Regional Educational Laboratory Central. https://ies.ed.gov/ncee/edlabs/regions/central/pdf/REL_2015080.pdf

REL Appalachia at SRI International
Continuous Improvement Coaching: Facilitators’ Workbook Appendix D: D-18
Step 2: Think about next steps, adjustments, and improvements
The team used the four questions from the reflection template (table D6) to guide discussion
and decisionmaking about next steps.
• What did we learn when we studied the data and information?
• What revisions should we make to our hypotheses or predictions?
• What are our immediate next steps?
• What are our longer-term next steps?
Table D6 summarizes the implementation team’s responses to each question.
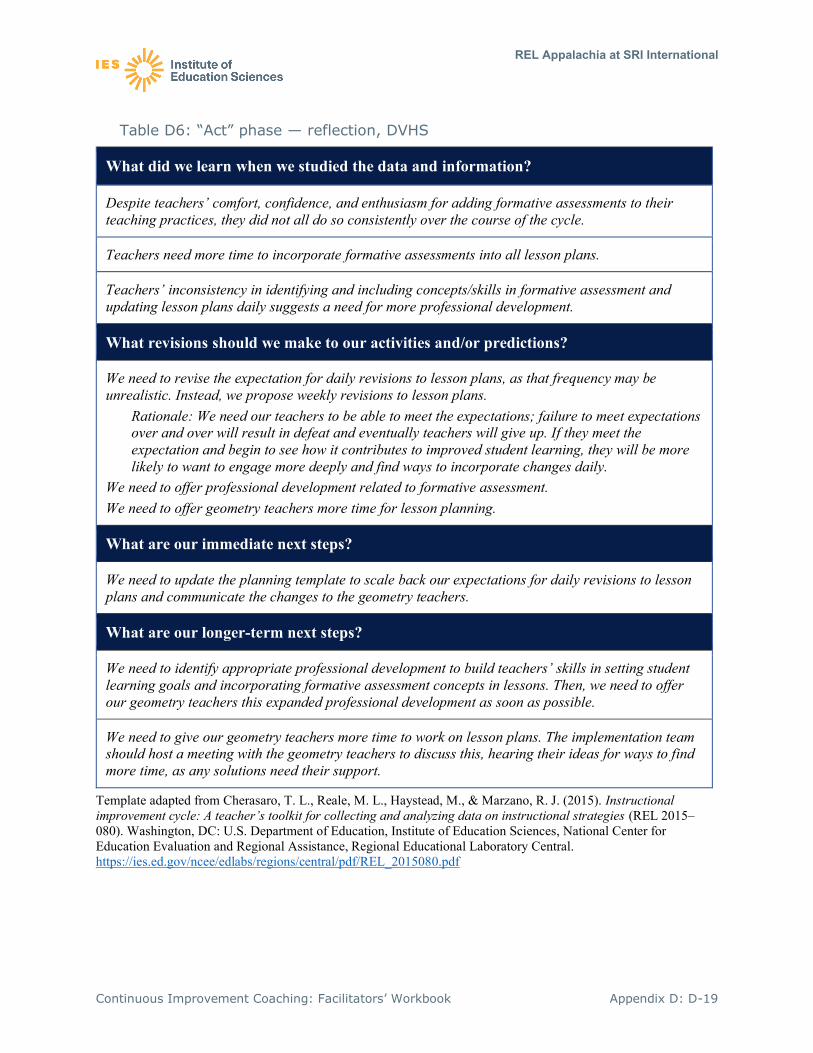
REL Appalachia at SRI International
Continuous Improvement Coaching: Facilitators’ Workbook Appendix D: D-19
Table D6: “Act” phase — reflection, DVHS
What did we learn when we studied the data and information?
Despite teachers’ comfort, confidence, and enthusiasm for adding formative assessments to their teaching practices, they did not all do so consistently over the course of the cycle.
Teachers need more time to incorporate formative assessments into all lesson plans.
Teachers’ inconsistency in identifying and including concepts/skills in formative assessment and updating lesson plans daily suggests a need for more professional development.
What revisions should we make to our activities and/or predictions?
We need to revise the expectation for daily revisions to lesson plans, as that frequency may be unrealistic. Instead, we propose weekly revisions to lesson plans.
Rationale: We need our teachers to be able to meet the expectations; failure to meet expectations over and over will result in defeat and eventually teachers will give up. If they meet the expectation and begin to see how it contributes to improved student learning, they will be more likely to want to engage more deeply and find ways to incorporate changes daily.
We need to offer professional development related to formative assessment. We need to offer geometry teachers more time for lesson planning.
What are our immediate next steps?
We need to update the planning template to scale back our expectations for daily revisions to lesson plans and communicate the changes to the geometry teachers.
What are our longer-term next steps?
We need to identify appropriate professional development to build teachers’ skills in setting student learning goals and incorporating formative assessment concepts in lessons. Then, we need to offer our geometry teachers this expanded professional development as soon as possible.
We need to give our geometry teachers more time to work on lesson plans. The implementation team should host a meeting with the geometry teachers to discuss this, hearing their ideas for ways to find more time, as any solutions need their support.
Template adapted from Cherasaro, T. L., Reale, M. L., Haystead, M., & Marzano, R. J. (2015). Instructional improvement cycle: A teacher’s toolkit for collecting and analyzing data on instructional strategies (REL 2015–080). Washington, DC: U.S. Department of Education, Institute of Education Sciences, National Center for Education Evaluation and Regional Assistance, Regional Educational Laboratory Central. https://ies.ed.gov/ncee/edlabs/regions/central/pdf/REL_2015080.pdf

REL Appalachia at SRI International
Continuous Improvement Coaching: Facilitators’ Workbook Appendix D: D-20
Final thoughts
Any significant change requires strategic leadership and patience, since professionals need
time to develop expertise with a new practice and to incorporate that practice into daily routines.
The DVHS geometry teachers and improvement team recognized they would need another
PDSA cycle to implement the recommended adjustments identified in the next steps in table D6.
The team plans to enact these recommended adjustments during quarter two of the school
year, study the data from their second PDSA cycle, and then decide whether to expand the use of
formative assessment with more teachers in quarter three. The team members are committed to
learning as much as possible about how to effectively implement formative assessment practices
before training the entire teaching staff to use formative assessment.

REL Appalachia at SRI International
Continuous Improvement Coaching: Facilitators’ Workbook Endnotes: R-1
References
1 Bryk, A. S. (2009). Support a science of performance improvement. Phi Delta Kappan, 90(8), 597–600. https://doi.org/10.1177/003172170909000815 2 Bryk, A. S., Gomez, L. M., Grunow, A., & LeMahieu, P. G. (2015). Learning to improve: How America's schools can get better at getting better. Cambridge, MA: Harvard Education Press. 3 Morris, A. K., & Hiebert, J. (2011). Creating shared instructional products: An alternative approach to improving teaching. Educational Researcher, 40(1), 5–14. https://journals.sagepub.com/doi/10.3102/0013189X10393501 4 Tichnor-Wagner, A., Wachen, J., Cannata, M., & Cohen-Vogel, L. (2017). Continuous improvement in the public school context: Understanding how educators respond to plan-do-study-act cycles. Journal of Educational Change, 18(4), 465–494. https://doi.org/10.1007/s10833-017-9301-4 5 Langley, G. J., Nolan, K. M., Norman, C. L., & Provost, L. P. (2009). The improvement guide: Practical approach to enhancing organizational performance (2nd ed.). San Francisco: Jossey Bass. 6 Coalition for Evidence-Based Policy. (2013). Randomized controlled trials commissioned by the Institute of Education Sciences since 2002: How many found positive versus weak or no effects. Washington, DC: Coalition for Evidence-Based Policy. http://coalition4evidence.org/wp-content/uploads/2013/06/IES-Commissioned-RCTs-positive-vs-weak-or-null-findings-7-2013.pdf 7 Seftor, N. (2016). What does it mean when a study finds no effects? (REL 2017-265). Washington, DC: U.S. Department of Education, Institute of Education Sciences, National Center for Education Evaluation and Regional Assistance. https://files.eric.ed.gov/fulltext/ED569996.pdf 8 Russell, J. L., Correnti, R., Stein, M. K., Thomas, A., Bill, V., & Speranzo, L. (2020). Mathematics coaching for conceptual understanding: Promising evidence regarding the Tennessee Math Coaching Model. Educational Evaluation and Policy Analysis, 42(3), 439–466. https://journals.sagepub.com/doi/abs/10.3102/0162373720940699 9 Shakman, K., & Rodriguez, S. M. (2015). Logic models for program design, implementation, and evaluation: Workshop toolkit (REL 2015-057). Washington DC: U.S. Department of Education National Center for Education Evaluation and Regional Assistance, Regional Educational Laboratory Northeast & Islands. https://ies.ed.gov/ncee/edlabs/regions/northeast/pdf/REL_2015057.pdf 10 What Works Clearinghouse. (2019). What Works Clearinghouse review protocol for teacher excellence (version 4.0). Washington DC: U.S. Department of Education, Institute of Education Sciences, National Center for Education Evaluation and Regional Assistance. https://ies.ed.gov/ncee/wwc/Docs/ReferenceResources/Wwc_te_protocol_v4.0_508.pdf 11 What Works Clearinghouse. (2019). What Works Clearinghouse review protocol for school leadership (version 4.0). Washington DC: U.S. Department of Education, Institute of Education Sciences, National Center for Education Evaluation and Regional Assistance. https://ies.ed.gov/ncee/wwc/Docs/ReferenceResources/Wwc_sl_protocol_v4.0_508.pdf 12 What Works Clearinghouse (n.d.). Using the WWC to find ESSA tiers of evidence. Washington DC: U.S. Department of Education, Institute of Education Sciences, National Center for Education Evaluation and Regional Assistance. https://ies.ed.gov/ncee/wwc/essa 13 Collis, S., & Foster, K. (2018, March 7). TIME for Care: Quality improvement for practice managers [PowerPoint slides]. SlideShare. https://www.slideshare.net/NHSEngland/improving-services-leading-change-implementing-change-in-rapid-cycles 14 Cherasaro, T. L., Reale, M. L., Haystead, M., & Marzano, R. J. (2015). Instructional improvement cycle: A teacher's toolkit for collecting and analyzing data on instructional strategies (REL 2015-080). Washington DC: U.S. Department of Education, Institute of Education Sciences, National Center for Education Evaluation and Regional Assistance, Regional Educational Laboratory Central. https://ies.ed.gov/ncee/edlabs/regions/central/pdf/REL_2015080.pdf