Continuous Analytics & Optimisation using Apache Spark (Big Data Analytics, London 2015-01-29)
27
Continuous Analytics & Optimisation Use cases and examples using Apache Spark Michael Cutler @ TUMRA – January 2015
-
Upload
tumra-big-data-science-gain-a-competitive-advantage-through-big-data-data-science -
Category
Technology
-
view
725 -
download
0
Transcript of Continuous Analytics & Optimisation using Apache Spark (Big Data Analytics, London 2015-01-29)

Continuous Analytics & Optimisation Use cases and examples using Apache Spark
Michael Cutler @ TUMRA – January 2015

Hello
• Early adopter of Hadoop
• Spoke at Hadoop World on
machine learning
• Twitter: @cotdp
About Me We use Data Science and Big Data
technology to help ecommerce
companies understand their
customers and increase sales.
TUMRA • Slide are on Slideshare
• Code example on Github
• Twitter: @tumra
This Talk

Example Use Case 3
Introducing Apache Spark 2
Background 1

Background 1

Clickstream & Social Media Analysis A generalised approach
Mobile/Tablet App
Data Collection
Data Processing
Reporting & Analysis
Web Site
You People
Social Network
Events Files Tables

Basic Architecture Three things we want to do
• Collect data continuously
• Various input sources
• Lots of “unstructured” data
Data Collection • Summarise the data, counts
and distributions
• Alerting on outliers
Data Processing • Time-series
• Trends over time
• Filtering/segmenting
Reporting

How has this approach evolved? Rapidly reducing the ‘time to insight’
• Proprietary & Expensive
• Slow Constrained
Time to Insight
48+ hours
pre-Historic Hadoop • Open-source & Inexpensive
• Flexible but complex to use
Time to Insight
hours
2008 - Hadoop • Batch, Streaming & Interactive
• Fast & Easy to use
Time to Insight
minutes
2014 - Spark

Weaving a story from a string of activities Understanding the shoppers journey
Day #0
PPC long-tail
keyword
Day #7 Day #10 Day #13 Day #17
PPC brand keyword &
signed up email
Opened Email
Newsletter on iPad PPC brand
keyword
Add To Cart
Order
Placed

It’s all about People & Products Not just boring log files!
Turn low-level events like “Page Views” into something meaningful
e.g. <Person1234> <viewed-a> <Product:Camera>
Bought a …
Activity & Interactions
Measuring the degree of interest a Person has about a Product
e.g. are 10 views for a certain Product a good or bad thing?
Gauging Interest
Either inferred from other Peoples activities, or Product similarity
Affinities
Both people and products have properties,
e.g. <Person1234> <is:gender> <Female>
Properties

People & Product Interactions
e.g. “Michael” “bought a” “Americano” “Starbucks, Shoreditch”
Source: Snowplow Analytics

That sounds like a Graph … Use graphs to understand user intent
Interest Graph Visualisation
• Collect user activity data in real-time, not just
clicks but mouse-overs, images, video, social.
• Algorithms identify products, categories and
brands a particular person is interested in.
• Cluster users into ‘neighborhoods’ to infer what to
show to existing and future visitors.
This visualization illustrates just 1% of 6 weeks visitor
activity data. Blue data points are People, Orange
data points are Products.

Introducing Apache Spark 2

Revisiting the requirements Three things we want to do
• Apache Kafka
• Apache Flume
• Files/Sockets
Data Collection • Apache Spark
• Apache Hadoop
• Storm
Data Processing • Apache Cassandra
• RDBMS
• MongoDB, etc. etc.
Reporting & Analytics

Why … ? There are lots of ways to solve it, but here is the best way
• Distributed
• Fault-tolerant
• Scalable
• Streaming
• Machine-learning
• Java/Scala/Python bindings
etc. etc.
• Fast random-access to any Row
• Range-scanning through millions
of columns on a single row
Data Collection Data Processing Reporting & Analytics

Three reasons Apache Spark is awesome! Apart from “no more Java Map/Reduce code!!!”
• In-memory Caching
• DAG execution optimisation
• Easy to use in Scala, Java, Python
Fast • Machine Learning baked in
• Graph algorithms
• Interactive Shell
Smart • Query from Spark SQL
• Streaming
• Batch (file based)
Flexible

Apache Spark Architecture Overview
Apache ZooKeeper Hadoop Filesystem (HDFS)
Yarn / Mesos (optional)
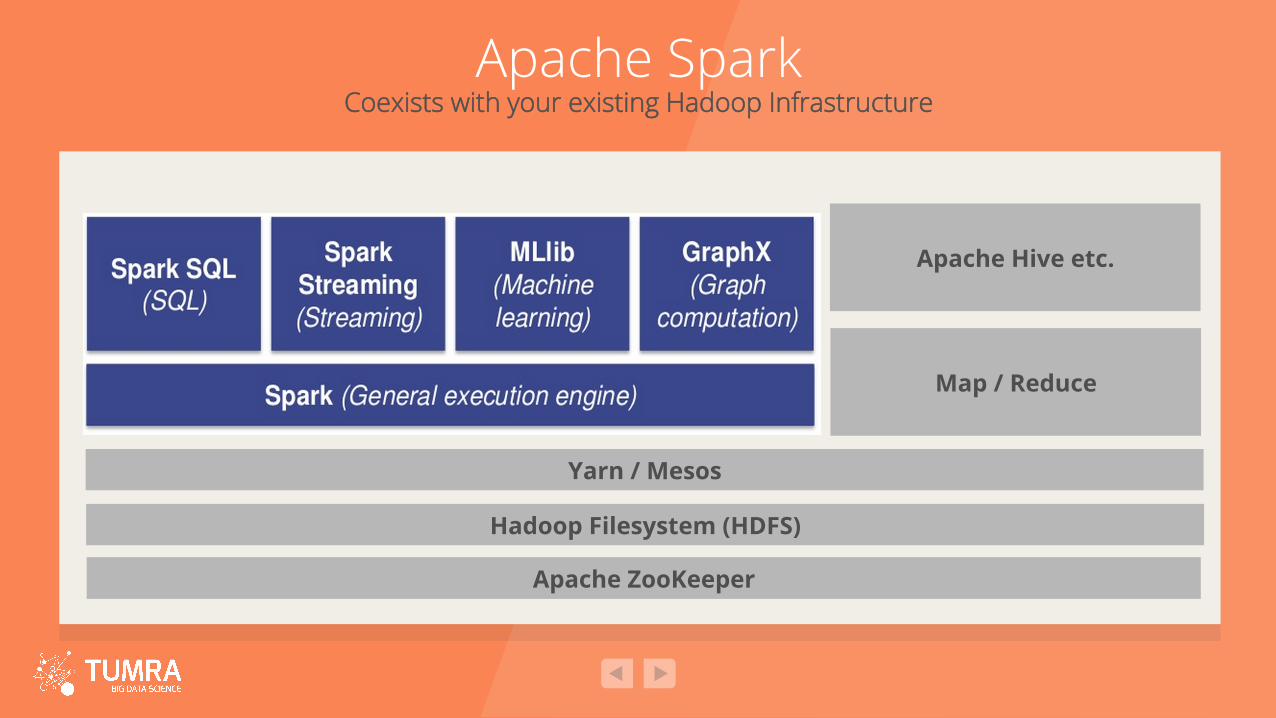
Apache Spark Coexists with your existing Hadoop Infrastructure
Apache ZooKeeper
Hadoop Filesystem (HDFS)
Map / Reduce
Apache Hive etc.
Yarn / Mesos

Apache Spark can … Simple example of Spark SQL used from Scala
Source: Databricks
Go from a SQL query… … to a trained machine learning model in three lines of code.

Example Use Case 3

Example Architecture Coexists with your existing Hadoop Infrastructure
Apache ZooKeeper
Hadoop Filesystem (HDFS) NoSQL Store (Cassandra)
Reporting Dashboard
Apache Kafka
Analytics Jobs

Spark Streaming Processing DStreams

Cassandra Schema For storing time-series data
Use a Compound Key: • metric name e.g. “Clicks” • metric grain e.g. “M” – minutely • metric dimensions e.g. “device=mobile&gender=male” • timestamp e.g. “2015-01-29 14:30:00.000” (bucketed) Storing the value: • counters – work well in some cases, have limitations (no reset) • integers – if in doubt, just use integers (bigint)

How Cassandra Stores the Data For storing time-series data
• Uses one row per ‘compound key’ (name,grain,dimension,time_bucket) • Time-series data is stored in the columns of this row • Use TTL support to expire old fine-grained data e.g. “minutely expires
after 30 days”, “hourly expires after 90 days”, “daily kept forever”
Source: planetcassandra.org

Social Media Analysis Converting a low-level event into a meaningful high-level interaction
• A user-interaction from the Facebook firehose, received as a real-time stream of JSON
• Streamed into Apache Kafka, also stored in SequenceFiles
• Modeled into Scala Case Class:

Example - Spark SQL Using the Spark SQL interface to analyze the data
• Parse JSON
• Extract interesting attributes, transform into Case Classes
• ‘Register as table’
• Execute SQL, print results
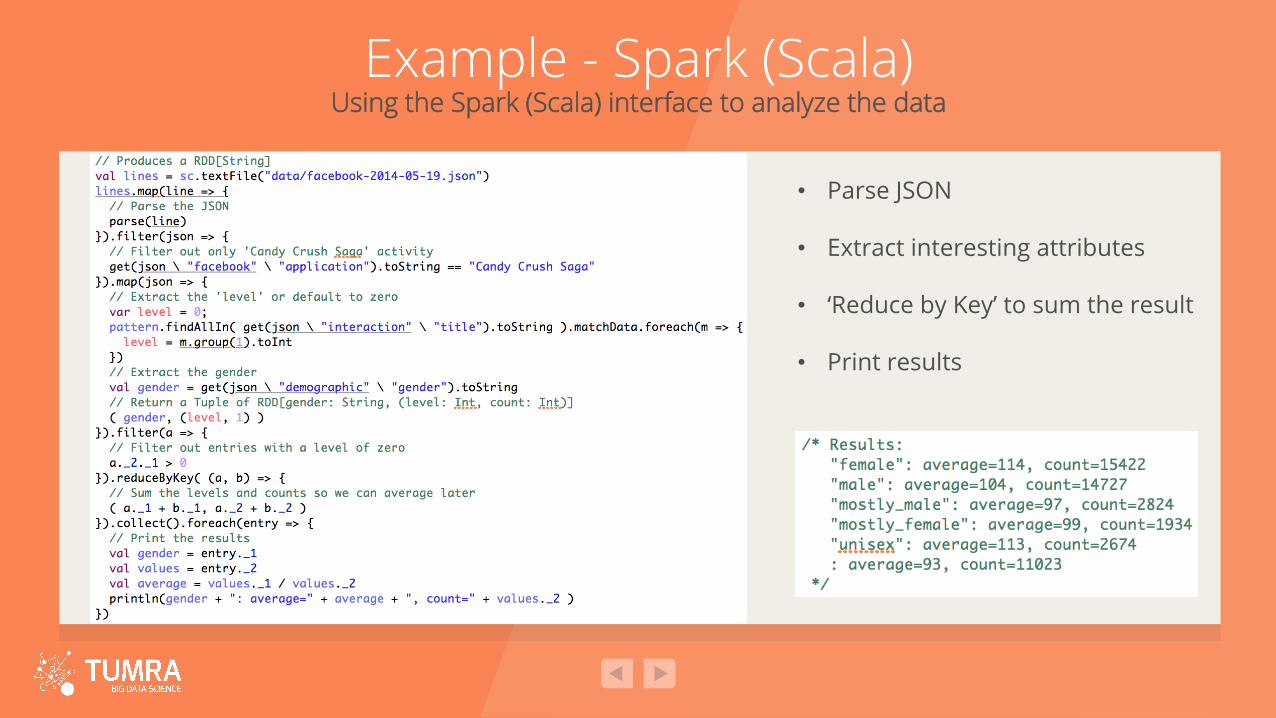
Example - Spark (Scala) Using the Spark (Scala) interface to analyze the data
• Parse JSON
• Extract interesting attributes • ‘Reduce by Key’ to sum the result
• Print results

Thank you!
Any questions?