
Consumer Analyst Group of New...
50
live. learn. work. play. Consumer Analyst Group of New York February 24, 2017 Michael B. Polk - Chief Executive Officer
-
Upload
truongkhanh -
Category
Documents
-
view
214 -
download
1
Transcript of Consumer Analyst Group of New...

1live. learn. work. play.
Consumer Analyst Group of New York
February 24, 2017
Michael B. Polk - Chief Executive Officer

2
Forward-looking StatementsForward-looking statements in this presentation are made in reliance upon the safe harbor provisions of the Private Securities Litigation Reform Act of 1995. Such forward-looking statements may relate to, butare not limited to, information or assumptions about the effects of sales (including pricing), income/(loss), earnings per share, return on equity, return on invested capital, operating income, operating margin orgross margin improvements or declines, Project Renewal, capital and other expenditures, working capital, cash flow, dividends, capital structure, debt to capitalization ratios, debt ratings, availability of financing,interest rates, restructuring and other project costs, impairment and other charges, potential losses on divestitures, impacts of changes in accounting standards, pending legal proceedings and claims (includingenvironmental matters), future economic performance, costs and cost savings, inflation or deflation with respect to raw materials and sourced products, productivity and streamlining, changes in foreignexchange rates, product recalls, expected benefits and synergies and financial results from recently completed acquisitions and planned acquisitions and divestitures and management’s plans, goals andobjectives for future operations, performance and growth or the assumptions relating to any of the forward-looking statements. These statements generally are accompanied by words such as “intend,”“anticipate,” “believe,” “estimate,” “project,” “target,” “plan,” “expect,” “will,” “should,” “would” or similar statements. The Company cautions that forward-looking statements are not guarantees because there areinherent difficulties in predicting future results. Actual results could differ materially from those expressed or implied in the forward-looking statements. Important factors that could cause actual results to differmaterially from those suggested by the forward-looking statements include, but are not limited to, the Company’s dependence on the strength of retail, commercial and industrial sectors of the economy in light ofthe continuation of challenging economic conditions, particularly outside of the United States; competition with other manufacturers and distributors of consumer products; major retailers’ strong bargainingpower and consolidation of the Company’s customers; the Company’s ability to improve productivity, reduce complexity and streamline operations; the Company’s ability to develop innovative new products andto develop, maintain and strengthen its end-user brands, including the ability to realize anticipated benefits of increased advertising and promotion spend; risks related to the substantial indebtedness that theCompany incurred in connection with the Jarden Acquisition; risks related to a potential increase in interest rates; the Company’s ability to complete planned acquisitions and divestitures; difficulties integratingJarden and other acquisitions and unexpected costs or expenses associated with acquisitions; changes in the prices of raw materials and sourced products and the Company’s ability to obtain raw materials andsourced products in a timely manner from suppliers; the risks inherent in the Company’s foreign operations, including currency fluctuations, exchange controls and pricing restrictions; a failure of one of theCompany’s key information technology systems or related controls; future events that could adversely affect the value of the Company’s assets and require impairment charges; United States and foreignregulatory impact on the Company’s operations including environmental remediation costs; the potential inability to attract, retain and motivate key employees; the imposition of tax liabilities greater than theCompany’s provisions for such matters; product liability, product recalls or regulatory actions; the Company’s ability to protect its intellectual property rights; changes to the Company’s credit ratings; significantincreases in the funding obligations related to the Company’s pension plans due to declining asset values, declining interest rates or otherwise; and those factors listed in our filings with the Securities andExchange Commission (including the information set forth under the caption “Risk Factors” in the Company’s and Jarden Corporation’s Annual Report on Form 10-K). Changes in such assumptions or factorscould produce significantly different results. The information contained in this news release is as of the date indicated. The Company assumes no obligation to update any forward-looking statements containedin this presentation as a result of new information or future events or developments. In addition, there can be no assurance that the Company has correctly identified and assessed all of the factors affecting theCompany or that the publicly available and other information the Company receives with respect to these factors is complete or correct. This presentation contains non-GAAP financial measures within themeaning of Regulation G promulgated by the Securities and Exchange Commission and includes a reconciliation of these non-GAAP financial measures to the most directly comparable financial measurescalculated in accordance with GAAP. While the Company believes that these non-GAAP financial measures are useful in evaluating the Company’s performance, this information should be considered assupplemental in nature and not as a substitute for or superior to the related financial information prepared in accordance with GAAP. Additionally, these non-GAAP financial measures may differ from similarmeasures presented by other companies.

3
Newell Brands investment case
Leading brands that compete in large, growing, unconsolidated markets
Reapplying a proven growth model across a new broader portfolio
Scale and capabilities to outgrow, out spend and out execute the competition
$1.3 billion synergies and savings fuel growth and expand margins
Double digit normalized EPS CAGR through 2021
Cash and borrowing capacity to complement organic agenda with M&A in the core
4
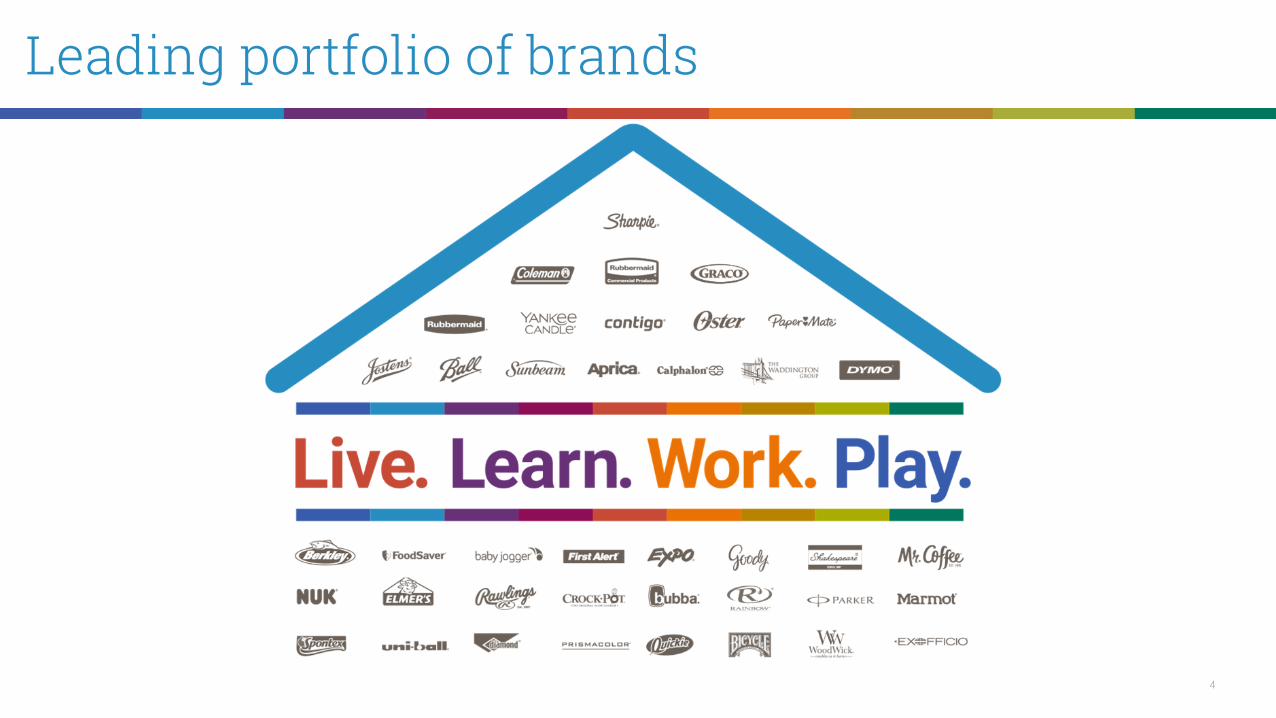
Leading portfolio of brands
5
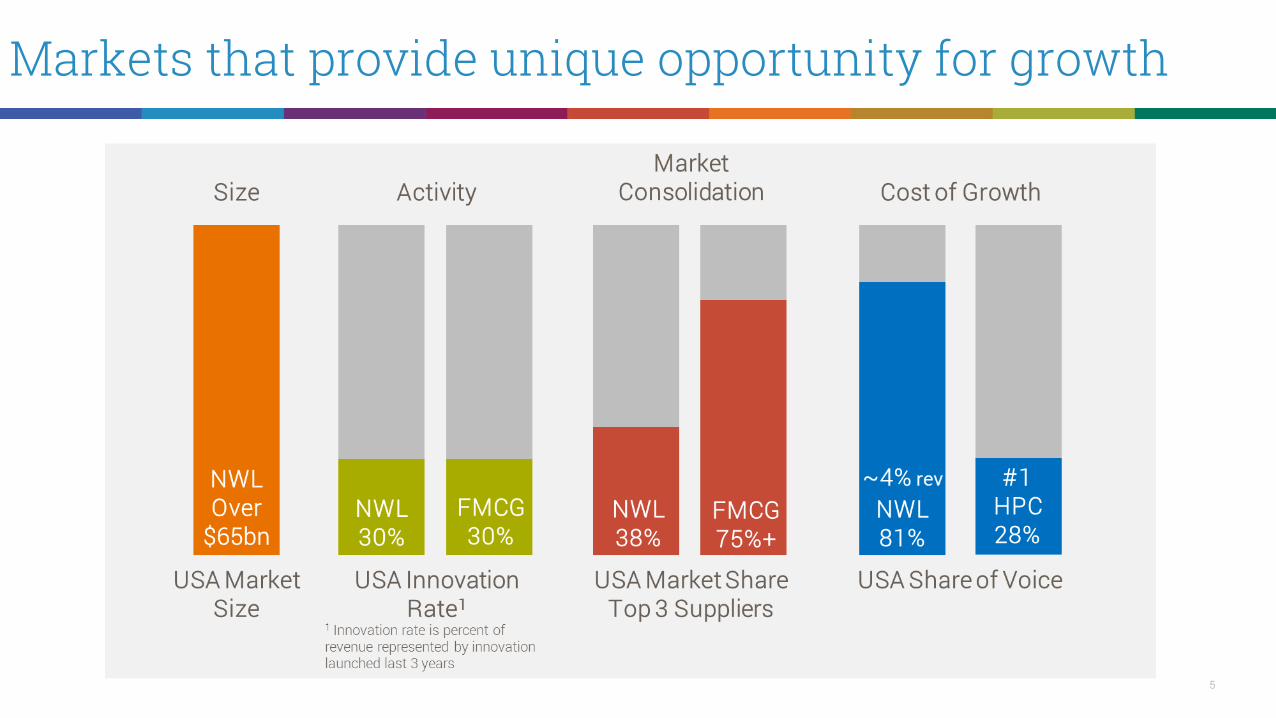
Markets that provide unique opportunity for growth

6
Strategic clarity drives choices
Build meaningful relative market share advantage and become a truly international
company.
Ambition
Money flows to growth, we drive choices into action, we constantly increase ambition since good enough never is.
How we work
Leverage leading brands in large and fragmented
markets, responsive to activity and with low cost of growth.
Business model
We are transformative leaders that embrace a dynamic and bold agenda. When we grow,
the team grows.
Building our team
We put the consumer at the heart of all that we do.
Growth is the engine that powers us.
What we believe
Big brand activity, big impact with big customers, reach the consumer where they
want to buy.
How we win

7
Proven playbook gives confidence

8
Confidence grounded in results delivered
0.8%
8.0%
17.6%
25.1%
2011 2016
-5.5%
8.5%7.6%
13.3%
2011 2016
Core Sales Growth and Normalized Operating Income Margin
Writing Baby
Core sales growth Normalized operating margin
1.8%
3.7%
12.5%
15.6%
2011 2016
Newell Brands
Note: 2011 represents Newell Rubbermaid results; 2016 Newell Brands results; Newell Rubbermaid core sales growth for 2016 4.7%.
9
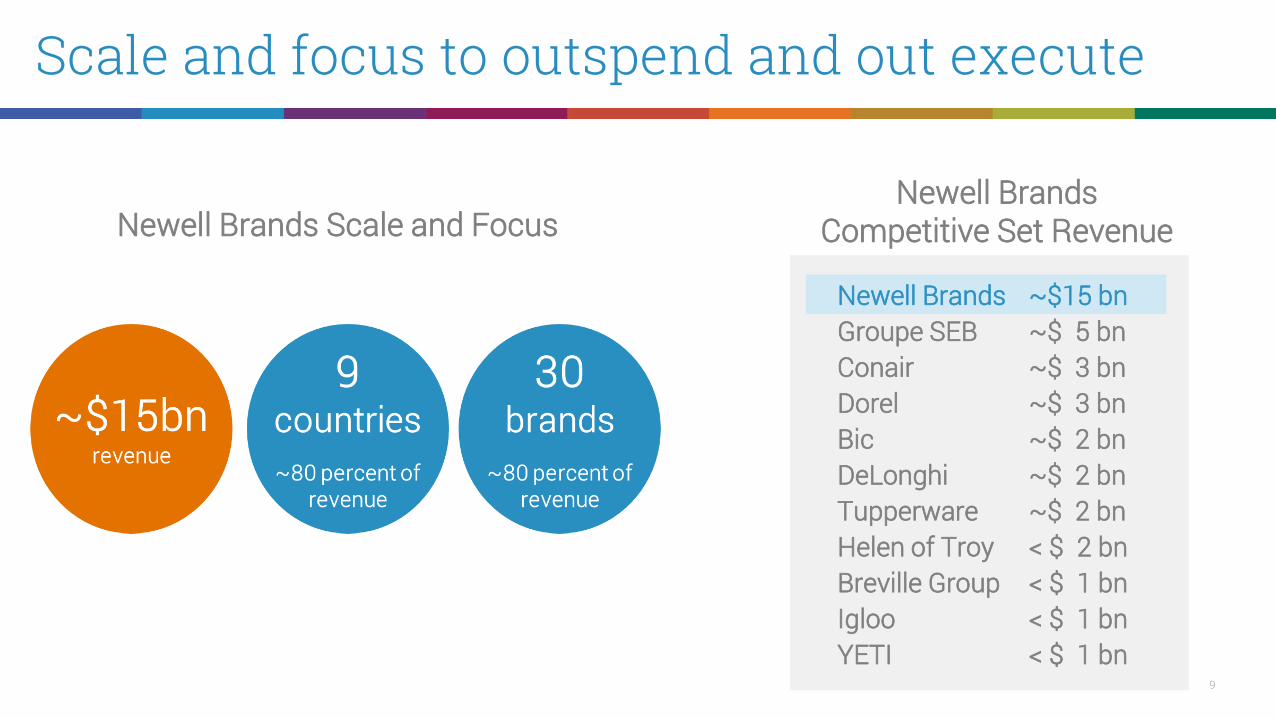
Scale and focus to outspend and out execute
Newell Brands Scale and Focus Newell Brands
Competitive Set Revenue
Newell Brands ~$15 bnGroupe SEB ~$ 5 bnConair ~$ 3 bnDorel ~$ 3 bnBic ~$ 2 bnDeLonghi ~$ 2 bnTupperware ~$ 2 bnHelen of Troy < $ 2 bnBreville Group < $ 1 bnIgloo < $ 1 bnYETI < $ 1 bn

10
Opportunity to accelerate portfolio deployment

11
Advantaged capabilities to out grow

12
Differentiation through function, form, fit, and finish
Paper Mate®Color Leads
Mechanical Pencil
EXPO®Dry Erase Markerwith Ink Indicator
Elmer’s®Re-Stick
Glue Stick

13
Rubbermaid® FreshWorks™Preserves Fresh
Berries 80% longer
Rubbermaid®Brilliance™
100% Leak Proof
Ball® CollectionElite® Easy Grip
Spiral Jars
Differentiation through function, form, fit, and finish

14
Innovative marketing . . . Elmer’s Slime!

15
Innovative marketing . . . adult coloring

16
Future pipeline on new businesses
71concepts
~83%cleared action
standard
~72%high
relevance
~56%high
differentiation
New Concept Tests - 2018 to 2020

17
Scaled selling that reaches consumers where they shop
Enterprise-wide US Selling Teams Global e-Commerce Division

18
Strong track record sets the stage
Legacy Newell Rubbermaid Legacy Jarden2014 2015 2016
44% CAGR 35%
CAGR
eCom POS – leading retailer
Source: Newell Brands POS tracker based on customer transaction database; growth for e-tail portion of leading retailer POS 2014 to 2016; bar size represents actual POS value

19
Expect eCommerce to drive 50% NWL growth

20
New commercial innovations will be key
First-ever corporate takeover on Amazon’s Today’s Deals page by Newell Brands offering
over 500 exclusive deals from 28 brands

21
Enabled by $1.3 billion in savings by 2021
22
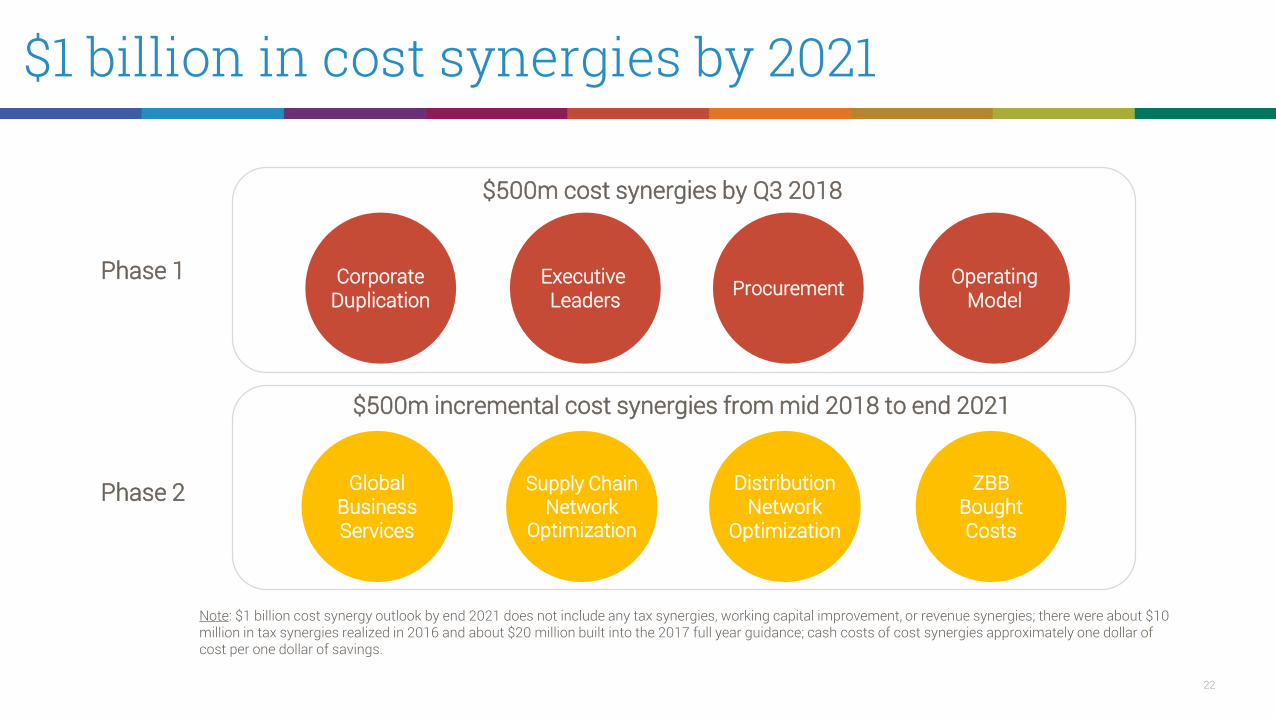
$1 billion in cost synergies by 2021
$500m incremental cost synergies from mid 2018 to end 2021
Executive Leaders Procurement Operating
ModelCorporate
Duplication
$500m cost synergies by Q3 2018
Note: $1 billion cost synergy outlook by end 2021 does not include any tax synergies, working capital improvement, or revenue synergies; there were about $10 million in tax synergies realized in 2016 and about $20 million built into the 2017 full year guidance; cash costs of cost synergies approximately one dollar of cost per one dollar of savings.
GlobalBusinessServices
Supply ChainNetwork
Optimization
DistributionNetwork
Optimization
ZBBBoughtCosts
Phase 1
Phase 2
23
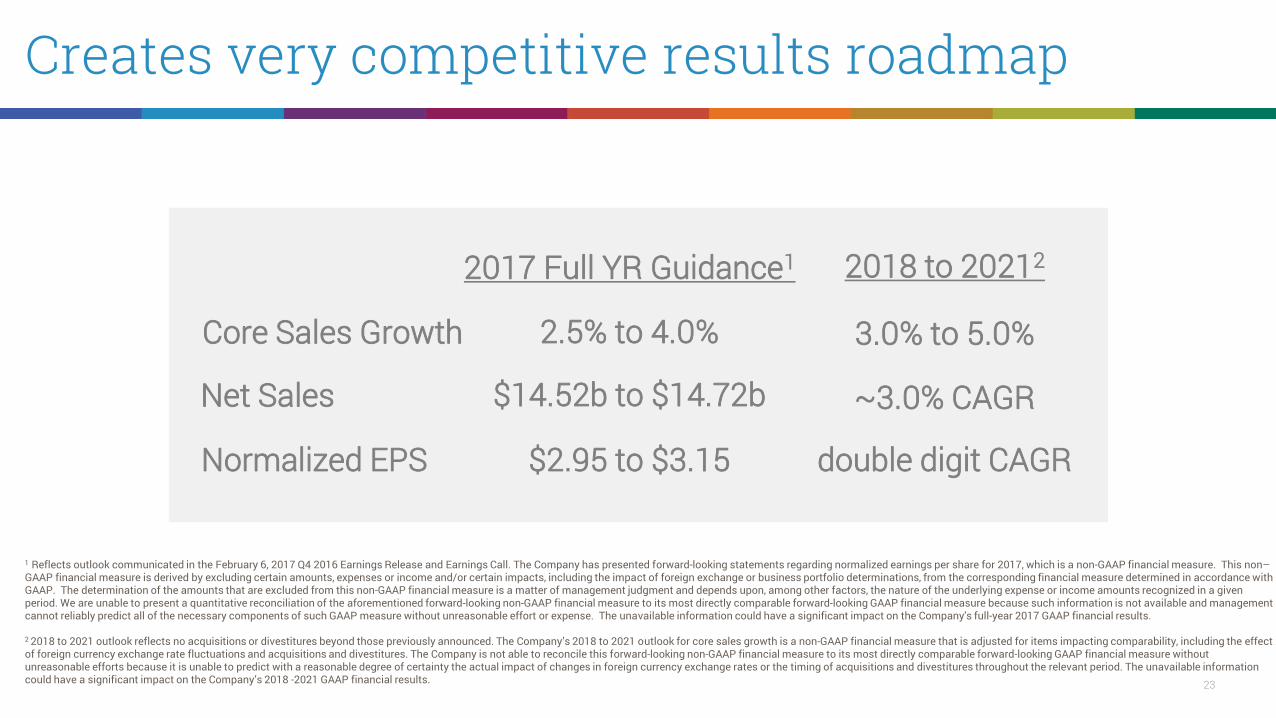
Creates very competitive results roadmap
2017 Full YR Guidance1 2018 to 20212
Core Sales Growth 2.5% to 4.0% 3.0% to 5.0%
Normalized EPS $2.95 to $3.15 double digit CAGR
Net Sales $14.52b to $14.72b ~3.0% CAGR
1 Reflects outlook communicated in the February 6, 2017 Q4 2016 Earnings Release and Earnings Call. The Company has presented forward-looking statements regarding normalized earnings per share for 2017, which is a non-GAAP financial measure. This non–GAAP financial measure is derived by excluding certain amounts, expenses or income and/or certain impacts, including the impact of foreign exchange or business portfolio determinations, from the corresponding financial measure determined in accordance withGAAP. The determination of the amounts that are excluded from this non-GAAP financial measure is a matter of management judgment and depends upon, among other factors, the nature of the underlying expense or income amounts recognized in a given period. We are unable to present a quantitative reconciliation of the aforementioned forward-looking non-GAAP financial measure to its most directly comparable forward-looking GAAP financial measure because such information is not available and management cannot reliably predict all of the necessary components of such GAAP measure without unreasonable effort or expense. The unavailable information could have a significant impact on the Company's full-year 2017 GAAP financial results.
2 2018 to 2021 outlook reflects no acquisitions or divestitures beyond those previously announced. The Company’s 2018 to 2021 outlook for core sales growth is a non-GAAP financial measure that is adjusted for items impacting comparability, including the effect of foreign currency exchange rate fluctuations and acquisitions and divestitures. The Company is not able to reconcile this forward-looking non-GAAP financial measure to its most directly comparable forward-looking GAAP financial measure without unreasonable efforts because it is unable to predict with a reasonable degree of certainty the actual impact of changes in foreign currency exchange rates or the timing of acquisitions and divestitures throughout the relevant period. The unavailable information could have a significant impact on the Company’s 2018 -2021 GAAP financial results.

24
Strong cash flow and divestitures . . . rapid deleveraging
2016/2017debt repayment
~$3.8 bn1
1 Assumes about $1bn of US-based net proceeds from divestitures, including Tools, used to re-pay gross debt in 2017; assumes Tools divestiture closes in March 2017; debt pay down since closing of the Jarden transaction.
Expect to achieve leverage ratio target by Q2 2018
2017 exitleverage ratio
~3.6x
2018+leverage ratio target
3.0 to 3.5x

25
Cash generation creates unique opportunity
Source: Newell Brands Financial Model 2017 through 2021; assumes no M&A beyond the divestitures and acquisitions already announced; dividend increased steadily to stated pay out ratio range of 30 to 35%; share repurchase from 2018 to 2021 to offset equity dilution associated with annual share grants; standalone debt capacity excludes incremental acquisition borrowing capacity associated with acquisition EBITDA and synergies calculated at 3.25x leverage ratio
Newell Brands2017 to 2019
Capital Allocation Priorities
Dividend increases to 30 to 35% pay out ratio
Capex for growth and productivity
Active M&A in our core categories
Capex ~$1.4bn
Dividends ~$1.5bn
2019 available cash and standalone debt capacity
@ 3.25x ~ $3bn
Debt repayment ~$2.6bn (~$1bn from divestiture proceeds)
Newell Brands2017 to 2021
Capex ~$2.4bn
Dividends ~$2.6bn
2021 available cash and standalone debt capacity
@ 3.25x ~$7.5bn
Debt repayment ~$4.0bn(leverage well below 3x to 3.5x target)
Share Repurchase ~$0.2bn Share Repurchase ~$0.5bn
Modest repurchase to manage equity dilution

26
Value creating M&A in our core categories
Base Year Year 1 Year 2 Year 3
Revenue
Base Year Year 1 Year 2 Year 3
Adjusted EBITDA+41%
Sales+69%AdjustedEBITDA
Note: Blend of actual and expected results built into latest 2017 guidance and 2017 through 2021 financial model. Information reconciling forward-looking, or Year 3, adjusted EBITDA to GAAP financial measures isunavailable to the Company without unreasonable effort. The unavailable information could have a significant impact on the Company’s GAAP financial results. The Company is not able to provide reconciliations ofadjusted EBITDA to GAAP financial measures because certain items required for such reconciliations are outside of the Company’s control and/or cannot be reasonably predicted, such as the provision for incometaxes. Preparation of such reconciliations would require a forward-looking balance sheet, statement of income and statement of cash flow, prepared in accordance with GAAP, and such forward-looking financialstatements are unavailable to the Company without unreasonable effort. The Company provides a combined target for its Year 3 adjusted EBITDA for the identified businesses that it believes will be achieved,however it cannot accurately predict all the components of the adjusted EBITDA calculation.

27
Expect big things from newest additions

28
Recognize we must perform while we transform
Build
Build and develop an industry leadingteam
Grow
Grow brands through innovation and investment
Partner
Partner with our customers in category development
Strengthen
Strengthen breadth and depth of availability
Lead
Leade-Commercegrowth
Unlock
Unlock trapped capacity forgrowth
Deliver
Deliver growth and efficiency benefitsof scale
Choices
Activelymanage theportfolio

29
Newell Brands did what we said in 2016
Core sales growth +3.0% to +4.0% +3.7%
Normalized EPS $2.75 to $2.90 $2.89
Savings$50m to $80m Synergies>$100m Project Renewal
$210m(and $10m tax)
Debt Repayment ~$2.4bn by 2018 ~$2.1bn1
1 Debt pay down since closing of the Jarden transaction.

30
Core sales growth balanced across businesses
NA+6.7%
APAC-7.7%
Consumer Solutions$1,766.3M Net Sales
+5.2%Core SalesGrowth
Writing
$1,941.9MNet Sales
+8.0%Core SalesGrowth
Home Solutions$1,568.4M Net Sales
+2.6%Core SalesGrowth
Commercial Products$776.6MNet Sales
-0.4%Core SalesGrowth
Baby & Parenting$919.5M Net Sales
+8.5%Core SalesGrowth
Tools
$760.7MNet Sales
+0.2%Core SalesGrowth
Branded Consumable$2,839.2MNet Sales
+2.9%Core SalesGrowth
OutdoorSolutions$2,415.9MNet Sales
+0.1%Core SalesGrowth
ProcessSolutions$275.5MNet Sales
+4.7%Core SalesGrowth
2016 Results

31
Core sales growth balanced by geography
NA+3.7.%
EMEA+4.0%
LATAM+10.2%
APAC-4.4%

32
Competitive results: core sales growth
Source: Public press releases of the respective companies. Please note data represents 2016 calendar results; core sales are calculated differently among the companies and may be referred to as a metric other than core sales. In some cases the calculation methods used by the various companies may vary substantially from those used by the Company. Therefore the presentation is not necessarily reflective of core sales growth as calculated on a consistent basis among the companies identified above.

33
Competitive results: normalized op margin change
Source: Public press releases of the respective companies. Please note data represents 2016 calendar results; normalized operating income margin is calculated differently among the companies and may be referred to as a metric other than normalized OI margin. In some cases the calculation methods used by the various companies may vary substantially from those used by the Company. Therefore the presentation is not necessarily reflective of change in normalized operating income margin as calculated on a consistent basis among the companies identified above.

34
Competitive results: normalized EPS growth
Source: Public press releases of the respective companies. Please note data represents 2016 calendar results; normalized EPS is calculated differently among the companies and may be referred to as a metric other normalized EPS. In some cases the calculation methods used by the various companies may vary substantially from those used by the Company. Therefore the presentation is not necessarily reflective of normalized EPS growth as calculated on a consistent basis among the companies identified above.

35
Big USA changes completed in Q4 2016
Rapid Organization Design
• 3,500 roles in scope; 17% net reduction• $125m net annualized savings• Re-shaped organization cost pyramid
• ~40% reduction in $350K+ FTE’s• >200 new entry level roles created in
trade marketing, brand development, eCom, and sales
• Shifted people to growth priorities• >$100m in people costs to eCom and
Win Bigger Divisions
Consolidated from 32 to 16 DivisionsDesigned and populated Divisions, Brand
Development, and USA selling top to bottom in 70 days

36
Reaffirm 2017 guidance
Net Sales $14.52bn to $14.72bn
Core Sales Growth +2.5 to +4.0 percent
Normalized EPS $2.95 to $3.15
Reflects outlook communicated in the February 6, 2017 Q4 2016 Earnings Release and Earnings Call. The Company has presented forward-looking statements regarding normalized earnings per share for 2017, which is a non-GAAP financial measure. Thisnon–GAAP financial measure is derived by excluding certain amounts, expenses or income from the corresponding financial measure determined in accordance with GAAP. The determination of the amounts that are excluded from this non-GAAP financialmeasure is a matter of management judgment and depends upon, among other factors, the nature of the underlying expense or income amounts recognized in a given period. We are unable to present a quantitative reconciliation of the aforementionedforward-looking non-GAAP financial measure to its most directly comparable forward-looking GAAP financial measure because such information is not available and management cannot reliably predict all of the necessary components of such GAAP measurewithout unreasonable effort or expense. The unavailable information could have a significant impact on the Company's full-year 2017 GAAP financial results.
First half 2017 core sales growth in lower half of range with Q1 17 about the same as Q4 16as we start up the new organization in the USA
37
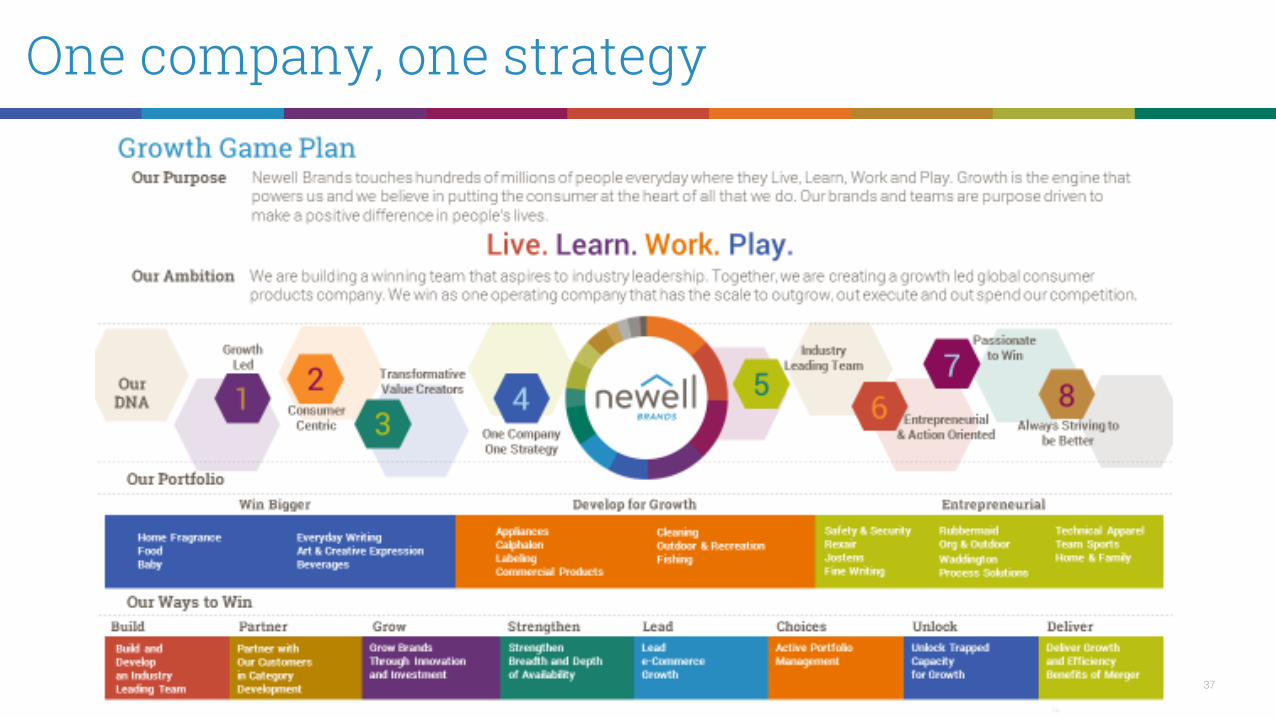
One company, one strategy
38
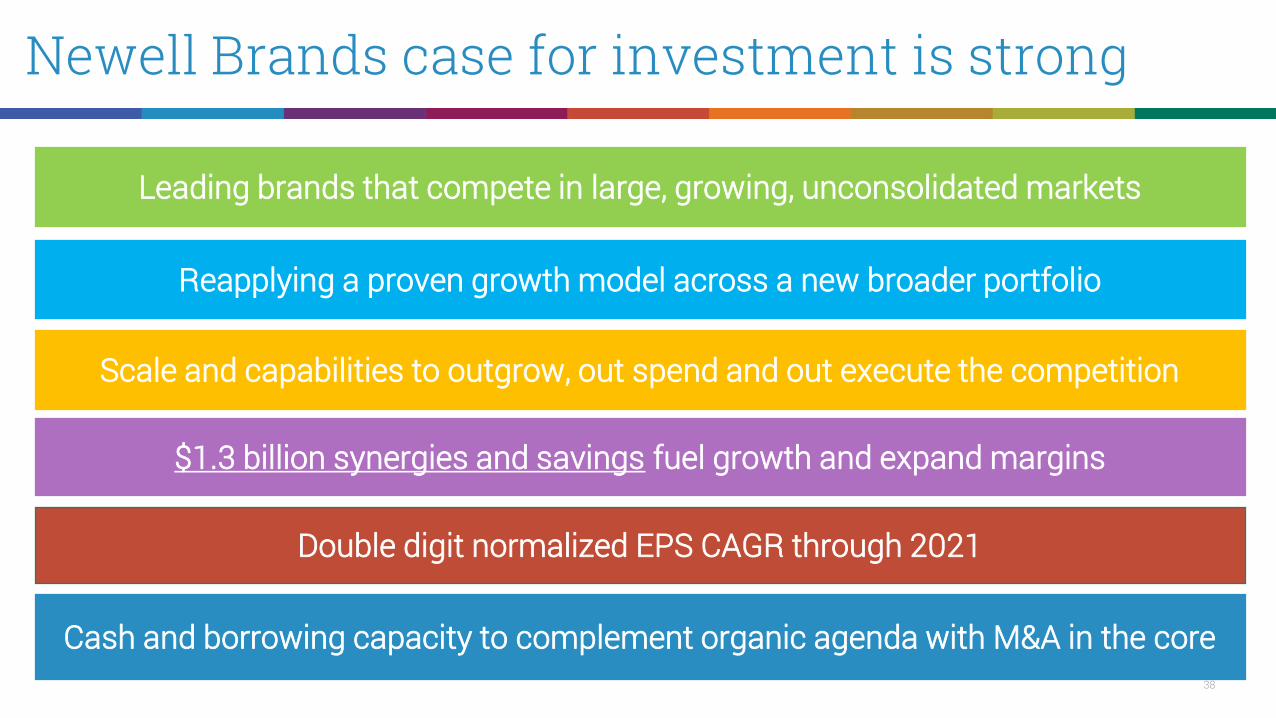
Newell Brands case for investment is strong
Leading brands that compete in large, growing, unconsolidated markets
Reapplying a proven growth model across a new broader portfolio
Scale and capabilities to outgrow, out spend and out execute the competition
$1.3 billion synergies and savings fuel growth and expand margins
Double digit normalized EPS CAGR through 2021
Cash and borrowing capacity to complement organic agenda with M&A in the core

39live. learn. work. play.
Consumer Analyst Group of New York
February 24, 2017
Michael B. Polk - Chief Executive Officer

40
FY 2011 Core Sales Growth ReconciliationNewell Brands Inc.
Non-GAAP ReconciliationCore Sales Growth for Legacy Newell Rubbermaid by Segment
Year Ended December 31, 2011
Net Sales
Growth
(GAAP)
Foreign
Currency
Core Sales
Growth
WRITING 3.2 % (2.4)% 0.8 %HOME SOLUTIONS 1.9 % (0.7)% 1.2 %TOOLS 13.4 % (3.1)% 10.3 %COMMERCIAL PRODUCTS 8.5 % (1.1)% 7.4 %BABY AND PARENTING (2.8)% (2.7)% (5.5)%SPECIALTY BUSINESS ─ (2.1)% (2.1)%
LEGACY NEWELL RUBBERMAID 3.6 % (1.8)% 1.8 %
The above amounts represent the amounts reported and have not been restated for any discontinued operations that occurred subsequent to the year ended December 31, 2011.

41
FY 2011 Normalized Operating Margin ReconciliationNewell Brands Inc.
Non-GAAP ReconciliationNormalized Operating Margin by Segment for Legacy Newell Rubbermaid
Year Ended December 31, 2011($ Amounts in millions)
Reported Excluded Normalized Operating
Net Sales Operating Income Items OI Margin
HOME SOLUTIONS 1,710.2$ 228.9$ -$ 228.9$ 13.4%WRITING 1,399.3 246.9 - 246.9 17.6%TOOLS 779.6 119.1 - 119.1 15.3%COMMERCIAL PRODUCTS 741.5 108.3 - 108.3 14.6%BABY & PARENTING 680.4 51.6 - 51.6 7.6%SPECIALTY 553.6 60.2 - 60.2 10.9%IMPAIRMENT CHARGES - (382.6) 382.6 - ─ RESTRUCTURING COSTS - (50.1) 50.1 - ─ CORPORATE - (125.1) 43.7 (81.4) ─ TOTAL 5,864.6$ 257.2$ 476.4$ 733.6$ 12.5%
(1) Excluded items consist of restructuring-related and restructuring costs of $37.4 million and $50.1 million, respectively, related to the European Transformation Plan and Project Renewal. Additionally, normalized operating income for the twelve months ended December 31, 2011 excludes incremental SG&A costs of $6.3 million resulting from the CEO transition during 2011.
(2) Normalized operating income for twelve months ended December 31, 2011 exclude impairment charges of $382.6 million relating primarily to the impairment of goodwill for the Baby & Parenting and Hardware businesses.
Reconciliation (1,2)

42
FY 2016 Core Sales Reconciliation For Legacy Newell Rubbermaid
Newell Brands Inc.Non-GAAP Reconciliation
Core Sales for Legacy Newell RubbermaidYears Ended December 31, 2015 and 2016
($ Amounts in millions)
Increase/(Decrease)
2016
Net Sales
(Reported) (1)
Acquisitions/
Divestitures (3)
Net Sales
Base Business
Currency
Impact
2016
Core Sales (2)
2015
Net Sales
(Reported)
Divestitures
(3)
Net Sales
Base Business
Currency
Impact
2015
Core Sales (2)
Core Sales (2)
$ %
WRITING 1,941.9 (204.9) 1,737.0 32.9 1,769.9 1,763.5 (128.6) 1,634.9 4.2 1,639.1 130.8 8.0 %HOME SOLUTIONS 1,568.4 (181.6) 1,386.8 8.4 1,395.2 1,704.2 (344.7) 1,359.5 0.7 1,360.2 35.0 2.6 %TOOLS 760.7 (372.2) 388.5 8.4 396.9 790.0 (397.4) 392.6 3.6 396.2 0.7 0.2 %COMMERCIAL PRODUCTS 776.6 ─ 776.6 4.0 780.6 809.7 (26.4) 783.3 0.4 783.7 (3.1) (0.4)%BABY AND PARENTING 919.5 0.7 920.2 (8.3) 911.9 848.3 (8.3) 840.0 0.6 840.6 71.3 8.5 %
LEGACY NEWELL RUBBERMAID 5,967.1$ (758.0)$ 5,209.1$ 45.4$ 5,254.5$ 5,915.7$ (905.4)$ 5,010.3$ 9.5$ 5,019.8$ 234.7$ 4.7 %
BRANDED CONSUMABLES 2,839.2CONSUMER SOLUTIONS 1,766.3OUTDOOR SOLUTIONS 2,415.9PROCESS SOLUTIONS 275.5
2016 AS REPORTED 13,264.0$
(1) Includes Jarden segment and consolidated sales from April 16, 2016 and 2015, respectively.
(2) "Core Sales" is determined by applying a fixed exchange rate, calculated as the 12-month average in 2015, to the current and prior year local currency sales amounts, with the difference between the change in "As Reported" sales and the change in "Core Sales" reported in the table as "Currency Impact". Core Sales Growth excludes the impact of currency, acquisitions and divestitures.
(3) Actual and planned divestitures represent the Rubbermaid medical cart business, which the Company divested in August 2015; the Levolor and Kirsch window coverings brands ("Décor"), which the Company divested in June 2016; and, the Company's Venezuela operations, which the Company deconsolidated as of December 31, 2015, as well as the planned divestituresof businesses held for sale commencing in the third quarter including its Tools business (excluding Dymo® industrial labeling), the Rubbermaid® Consumer Storage business within the Home Solutions segment,Teutonia and the working capital impact of sales returns associated with exiting a distributor-led model to a direct selling model in Canada in the Baby and Parenting segment,

43
FY 2016 Core Sales Reconciliation by SegmentNewell Brands Inc.
Non-GAAP ReconciliationCore Sales by Segment
Years Ended December 31, 2015 and 2016($ Amounts in millions)
2016
Net Sales
(Reported) (1)
Acquisitions/
Divestitures (3)
Net Sales
Base Business
Currency
Impact
2016
Core Sales (2)
2015
Net Sales
(Pro forma) (1)
Divestitures
(3)
Net Sales
Base Business
WRITING 1,941.9 (204.9) 1,737.0 32.9 1,769.9 1,763.5 (128.6) 1,634.9HOME SOLUTIONS 1,568.4 (181.6) 1,386.8 8.4 1,395.2 1,704.2 (344.7) 1,359.5TOOLS 760.7 (372.2) 388.5 8.4 396.9 790.0 (397.4) 392.6COMMERCIAL PRODUCTS 776.6 ─ 776.6 4.0 780.6 809.7 (26.4) 783.3BABY AND PARENTING 919.5 0.7 920.2 (8.3) 911.9 848.3 (8.3) 840.0BRANDED CONSUMABLES 2,839.2 (306.5) 2,532.7 67.8 2,600.5 2,583.6 (65.5) 2,518.1CONSUMER SOLUTIONS 1,766.3 (149.7) 1,616.6 48.7 1,665.3 1,701.9 (132.6) 1,569.3OUTDOOR SOLUTIONS 2,415.9 (732.4) 1,683.5 (2.6) 1,680.9 1,977.3 (305.2) 1,672.1PROCESS SOLUTIONS 275.5 ─ 275.5 2.3 277.8 265.4 ─ 265.4
TOTAL COMPANY PRO FORMA 13,264.0$ (1,946.6)$ 11,317.4$ 161.6$ 11,479.0$ 12,443.9$ (1,408.7)$ 11,035.2$
LESS: JARDEN ACQUISITION (6,528.2)
2015 AS REPORTED 5,915.7$
(1) Includes Jarden segment and consolidated sales from April 16, 2016 and 2015, respectively.
(2) "Core Sales" is determined by applying a fixed exchange rate, calculated as the 12-month average in 2015, to the current and prior year local currency sales amounts, with the difference between the change in "As Reported" sales and the change in "Core Sales" reported in the table as "Currency Impact". Core Sales Growth excludes the impact of currency, acquisitions and divestitures.
(3) Actual and planned divestitures represent the Rubbermaid medical cart business, which the Company divested in August 2015; the Levolor and Kirsch window coverings brands ("Décor"), which the Company divested in June 2016; and, the Company's Venezuela operations, which the Company deconsolidated as of December 31, 2015, as well as the planned divestituresof businesses held for sale commencing in the third quarter including its Tools business (excluding Dymo® industrial labeling), the Rubbermaid® Consumer Storage business within the Home Solutions segment,Teutonia in the Baby and Parenting segment, two winter sports units, Völkl® and K2®, within the Outdoor Solutions segment, its Heaters, Humidifiers, Fans business within the Consumer Solutions segment and Lehigh in the Branded Consumables segment. During the fourth quarter, planned divestitures includes the Firebuilding business in Branded Consumables segment and the working capital impact of sales returns associated with exiting a distributor-led model to a direct selling model in Canada in the Baby and Parenting segment.

44
FY 2016 Core Sales Reconciliation by GeographyNewell Brands Inc.
Non-GAAP ReconciliationCore Sales by Geography
Years Ended December 31, 2015 and 2016($ Amounts in millions)
Increase/(Decrease)
2016
Net Sales
(Reported) (1)
Acquisitions/
Divestitures (3)
Net Sales
Base Business
Currency
Impact
2016
Core Sales (2)
2015
Net Sales
(Pro forma) (1)
Divestitures
(3)
Net Sales
Base Business
Currency
Impact
2015
Core Sales (2)
Core Sales (2)
$ %
UNITED STATES 9,518.4 (1,384.5) 8,133.9 ─ 8,133.9 8,734.1 (862.6) 7,871.5 ─ 7,871.5 262.4 3.3 %CANADA 720.1 (168.2) 551.9 27.5 579.4 591.8 (73.8) 518.0 11.3 529.3 50.1 9.5 %
NORTH AMERICA 10,238.5 (1,552.7) 8,685.8 27.5 8,713.3 9,325.9 (936.4) 8,389.5 11.3 8,400.8 312.5 3.7 %
EUROPE, MIDDLE EAST, AFRICA 1,659.0 (228.9) 1,430.1 73.0 1,503.1 1,646.8 (203.7) 1,443.1 2.2 1,445.3 57.8 4.0 %
LATIN AMERICA 643.6 (55.5) 588.1 83.4 671.5 787.8 (199.0) 588.8 20.7 609.5 62.0 10.2 %
ASIA PACIFIC 722.9 (109.5) 613.4 (22.3) 591.1 683.4 (69.6) 613.8 4.2 618.0 (26.9) (4.4)%TOTAL INTERNATIONAL 3,025.5 (393.9) 2,631.6 134.1 2,765.7 3,118.0 (472.3) 2,645.7 27.1 2,672.8 92.9 3.5 %
TOTAL COMPANY 13,264.0$ (1,946.6)$ 11,317.4$ 161.6$ 11,479.0$ 12,443.9$ (1,408.7)$ 11,035.2$ 38.4$ 11,073.6$ 405.4$ 3.7 %
LESS: JARDEN ACQUISITION (6,528.2)
2015 AS REPORTED 5,915.7$
(1) Includes Jarden segment and consolidated sales from April 16, 2016 and 2015, respectively.
(2) "Core Sales" is determined by applying a fixed exchange rate, calculated as the 12-month average in 2015, to the current and prior year local currency sales amounts, with the difference between the change in "As Reported" sales and the change in "Core Sales" reported in the table as "Currency Impact". Core Sales Growth excludes the impact of currency, acquisitions and divestitures.
(3) Actual and planned divestitures represent the Rubbermaid medical cart business, which the Company divested in August 2015; the Levolor and Kirsch window coverings brands ("Décor"), which the Company divested in June 2016; and, the Company's Venezuela operations, which the Company deconsolidated as of December 31, 2015, as well as the planned divestituresof businesses held for sale commencing in the third quarter including its Tools business (excluding Dymo® industrial labeling), the Rubbermaid® Consumer Storage business within the Home Solutions segment,Teutonia in the Baby and Parenting segment, two winter sports units, Völkl® and K2®, within the Outdoor Solutions segment, its Heaters, Humidifiers, Fans business within the Consumer Solutions segment and Lehigh in the Branded Consumables segment. During the fourth quarter, planned divestitures includes the Firebuilding business in Branded Consumables segment and the working capital impact of sales returns associated with exiting a distributor-led model to a direct selling model in Canada in the Baby and Parenting segment.

45
FY 2016 Normalized Operating Margin Reconciliation By Segment
Newell Brands Inc.Non-GAAP Reconciliation
Normalized Operating Margin by SegmentYear Ended December 31, 2016
($ Amounts in millions)Reconciliation (1)
Reported Excluded Normalized Normalized
Net Sales Operating Income Items Operating Income Operating Margin
WRITING 1,941.9$ 462.7$ 24.2$ 486.9$ 25.1 %
HOME SOLUTIONS 1,568.4 179.2 22.3 201.5 12.8 %
TOOLS 760.7 85.4 6.0 91.4 12.0 %
COMMERCIAL PRODUCTS 776.6 113.1 5.7 118.8 15.3 %
BABY AND PARENTING 919.5 114.4 7.6 122.0 13.3 %
BRANDED CONSUMABLES 2,839.2 330.5 197.7 528.2 18.6 %
CONSUMER SOLUTIONS 1,766.3 147.1 127.1 274.2 15.5 %
OUTDOOR SOLUTIONS 2,415.9 90.1 281.8 371.9 15.4 %
PROCESS SOLUTIONS 275.5 14.8 22.3 37.1 13.5 %
RESTRUCTURING COSTS ─ (74.9) 74.9 ─ ─
CORPORATE ─ (362.3) 195.0 (167.3) ─
TOTAL 13,264.0$ 1,100.1$ 964.6$ 2,064.7$ 15.6 %
(1) Excludes costs associated with Project Renewal ($60.0 million); Graco product recall costs ($0.7 million); amortization of acquired intangible assets ($154.7 million); divestiture costs ($8.4 million), primarily associated with the Décor business and the planned divestiture of Tools (excluding Dymo Industrial); Jarden integration costs ($199.6 million), primarily related to personnel and advisory services; Jarden transaction costs ($61.7 million); and costs related to the fair value step-up of Jarden inventory ($479.5 million).

46
FY 2016 Reconciliation of Normalized EPS
Twelve Months Ended December 31, 2016
GAAP Measure Project Renewal Costs (1) Acquisition Jarden Jarden
transaction Décor Loss on Non-GAAP Measure Advisory Personnel Other Restructuring Product Integration amortization inventory and Interest costs gain Divestiture extinguishment Discontinued Non-recurring Percentage
Reported costs costs costs costs recall costs (2) costs (3) costs (4) step-up (5) related costs (6) Jarden-related
(7) on sale (8) costs (9) of debt (10) operations (11) tax items (12) Normalized* of Sales
Cost of products sold $ 8,865.2 $ (0.2) $ (6.3) $ (7.1) $ - $ - $ (5.1) $ (8.9) $ (479.5) $ - $ - $ - $ - $ - $ - $ - $ 8,358.1 63.0%
Gross profit 4,398.8 0.2 6.3 7.1 - - 5.1 8.9 479.5 - - - - - - - 4,905.9 37.0%
Selling, general & administrative expenses 3,223.8 (9.3) (20.0) (7.2) - (0.7) (129.5) (145.8) - (61.7) - - (8.4) - - - 2,841.2 21.4%
Operating income 1,100.1 9.5 26.3 14.3 9.9 0.7 199.6 154.7 479.5 61.7 - - 8.4 - - - 2,064.7 15.6%
Non-operating expenses 285.6 - - - - - - - - - (16.8) 160.2 - (47.6) - - 381.4
Income before income taxes 814.5 9.5 26.3 14.3 9.9 0.7 199.6 154.7 479.5 61.7 16.8 (160.2) 8.4 47.6 - - 1,683.3
Income taxes (13) 286.0 3.6 10.0 5.4 3.8 0.3 75.6 52.6 168.1 32.9 6.7 (59.3) 3.2 13.9 - (143.2) 459.6
Net income from continuing operations 528.5 5.9 16.3 8.9 6.1 0.4 124.0 102.1 311.4 28.8 10.1 (100.9) 5.2 33.7 - 143.2 1,223.7
Net income 527.8 5.9 16.3 8.9 6.1 0.4 124.0 102.1 311.4 28.8 10.1 (100.9) 5.2 33.7 0.7 143.2 1,223.7
Diluted earnings per share** $ 1.25 $ 0.01 $ 0.04 $ 0.02 $ 0.01 $ - $ 0.29 $ 0.24 $ 0.74 $ 0.07 $ 0.02 $ (0.24) $ 0.01 $ 0.08 $ - $ 0.34 $ 2.89
Newell Brands Inc.
Non-GAAP Reconciliation
Normalized Earnings Per Share
Year Ended December 31, 2016
(Amounts in millions, except per share data)

47
FY 2016 Reconciliation of Normalized EPS (Continued) * Normalized results are financial measures that are not in accordance with GAAP and exclude the above normalized adjustments. See below for a discussion of each of these adjustments.
**Totals may not add due to rounding.
(1) Costs associated with Project Renewal during the year ended December 31, 2016 include $50.1 million of project-related costs and $9.9 million of restructuring costs. Project-related costs include advisory and consultancy costs, compensation and related costs of personnel dedicated to transformation projects, and other project-related costs.
(2) During the year ended December 31, 2016, the Company recognized $0.7 million of charges associated with the Graco product recall.
(3) During the year ended December 31, 2016, the Company incurred $199.6 million of costs (including $65.0 million of restructuring costs) associated with the integration of Jarden and Elmer's, which primarily represents personnel and advisory costs associated with the integration of Jarden. During the year ended December 31, 2015, the Company recognized $18.2 million of costs (including $3.2 million of restructuring costs) associated with the acquisition and integration of Ignite Holdings, LLC, bubba brands, Baby Jogger, Elmer's and the pending Jarden transaction.
(4) During the year ended December 31, 2016, the Company incurred acquisition amortization costs of $154.7 million.
(5) During the year ended December 31, 2016, the Company incurred $479.5 million of costs related to the fair-value step-up of Jarden inventory.
(6) During the year ended December 31, 2016, the Company recognized $61.7 million of costs associated with the Jarden transaction.
(7) During the year ended December 31, 2016, the Company incurred $16.8 million of interest costs associated with borrowings to finance the Jarden transaction that were incurred prior to the closing of the transaction.
(8) During the year ended December 31, 2016, the Company recognized a gain of $160.2 million related to the divestiture of Décor.
(9) During the year ended December 31, 2016, the Company recognized $8.4 million of costs primarily associated with the divestiture of Décor and planned divestiture of Tools (excluding Dymo Industrial).
(10) During the year ended December 31, 2016, the Company incurred a $1.7 million loss related to the extinguishment of debt and a $45.9 million loss associated with the termination of the Jarden Bridge Facility.
(11) During the year ended December 31, 2016, the Company recognized a net loss of $0.7 million in discontinued operations.
(12) During the year ended December 31, 2016, the Company recognized $164.2 million of deferred tax expense related to the difference between the book and tax basis in the Tools business and ($21.0) million of deferred tax benefit related to statutory tax rate changes in France affecting Jarden acquired intangibles.
(13) The Company determined the tax effect of the items excluded from normalized results by applying the estimated effective rate for the applicable jurisdiction in which the pre-tax items were incurred, and for which realization of the resulting tax benefit, if any, is expected. In certain situations in which an item excluded from normalized results impacts income tax expense, the Company uses a "with" and "without" approach to determine normalized income tax expense.
48
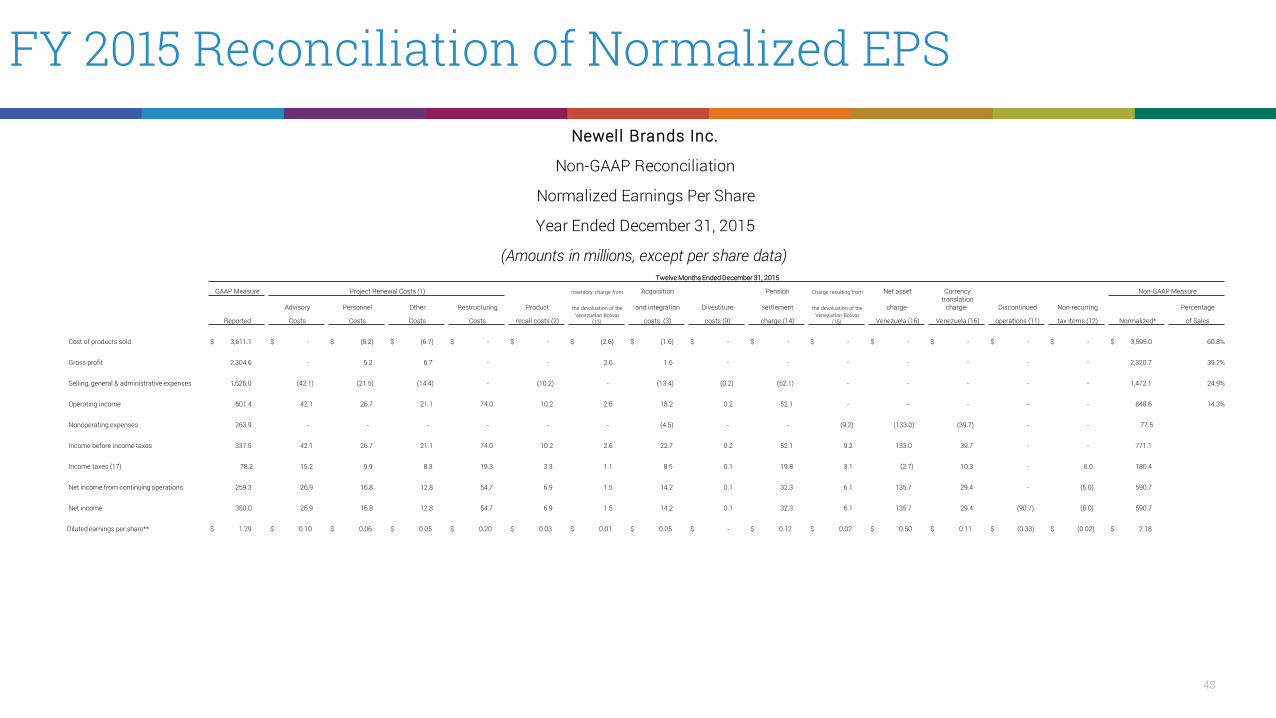
FY 2015 Reconciliation of Normalized EPS
Twelve Months Ended December 31, 2015
GAAP Measure Project Renewal Costs (1) Inventory charge from Acquisition Pension Charge resulting from Net asset Currency Non-GAAP Measure
Advisory Personnel Other Restructuring Product the devaluation of the and integration Divestiture settlement the devaluation of the charge-translation
charge- Discontinued Non-recurring Percentage
Reported Costs Costs Costs Costs recall costs (2) Venezuelan Bolivar
(13) costs (3) costs (9) charge (14) Venezuelan Bolivar
(15) Venezuela (16) Venezuela (16) operations (11) tax items (12) Normalized* of Sales
Cost of products sold $ 3,611.1 $ - $ (5.2) $ (6.7) $ - $ - $ (2.6) $ (1.6) $ - $ - $ - $ - $ - $ - $ - $ 3,595.0 60.8%
Gross profit 2,304.6 - 5.2 6.7 - - 2.6 1.6 - - - - - - - 2,320.7 39.2%
Selling, general & administrative expenses 1,626.0 (42.1) (21.5) (14.4) - (10.2) - (13.4) (0.2) (52.1) - - - - - 1,472.1 24.9%
Operating income 601.4 42.1 26.7 21.1 74.0 10.2 2.6 18.2 0.2 52.1 - - - - - 848.6 14.3%
Nonoperating expenses 263.9 - - - - - - (4.5) - - (9.2) (133.0) (39.7) - - 77.5
Income before income taxes 337.5 42.1 26.7 21.1 74.0 10.2 2.6 22.7 0.2 52.1 9.2 133.0 39.7 - - 771.1
Income taxes (17) 78.2 15.2 9.9 8.3 19.3 3.3 1.1 8.5 0.1 19.8 3.1 (2.7) 10.3 - 6.0 180.4
Net income from continuing operations 259.3 26.9 16.8 12.8 54.7 6.9 1.5 14.2 0.1 32.3 6.1 135.7 29.4 - (6.0) 590.7
Net income 350.0 26.9 16.8 12.8 54.7 6.9 1.5 14.2 0.1 32.3 6.1 135.7 29.4 (90.7) (6.0) 590.7
Diluted earnings per share** $ 1.29 $ 0.10 $ 0.06 $ 0.05 $ 0.20 $ 0.03 $ 0.01 $ 0.05 $ - $ 0.12 $ 0.02 $ 0.50 $ 0.11 $ (0.33) $ (0.02) $ 2.18
Newell Brands Inc.
Non-GAAP Reconciliation
Normalized Earnings Per Share
Year Ended December 31, 2015
(Amounts in millions, except per share data)
49
FY 2015 Reconciliation of Normalized EPS (Continued) * Normalized results are financial measures that are not in accordance with GAAP and exclude the above normalized adjustments. See below for a discussion of each of these adjustments.
**Totals may not add due to rounding.
(1) Costs associated with Project Renewal during the year ended December 31, 2016 include $50.1 million of project-related costs and $9.9 million of restructuring costs. Project-related costs include advisory and consultancy costs, compensation and related costs of personnel dedicated to transformation projects, and other project-related costs. Costs associated with Project Renewal during the year ended December 31, 2015 include $89.9 million of project-related costs and $74.0 million of restructuring costs. Project-related costs include advisory and consultancy costs, compensation and related costs of personnel dedicated to transformation projects, and other project-related costs.
(2) During the year ended December 31, 2016 and 2015, the Company recognized $0.7 million and $10.2 million, respectively, of charges associated with the Graco product recall.
(3) During the year ended December 31, 2016, the Company incurred $199.6 million of costs (including $65.0 million of restructuring costs) associated with the integration of Jarden and Elmer's, which primarily represents personnel and advisory costs associated with the integration of Jarden. During the year ended December 31, 2015, the Company recognized $18.2 million of costs (including $3.2 million of restructuring costs) associated with the acquisition and integration of Ignite Holdings, LLC, bubba brands, Baby Jogger, Elmer's and the pending Jarden transaction. During the year ended December 31, 2015, the Company recognized $4.5 million of interest expense in connection with bridge loans related to the acquisition of Elmer's and the pending Jarden transaction.
(4) During the year ended December 31, 2016, the Company incurred acquisition amortization costs of $154.7 million.
(5) During the year ended December 31, 2016, the Company incurred $479.5 million of costs related to the fair-value step-up of Jarden inventory.
(6) During the year ended December 31, 2016, the Company recognized $61.7 million of costs associated with the Jarden transaction.
(7) During the year ended December 31, 2016, the Company incurred $16.8 million of interest costs associated with borrowings to finance the Jarden transaction that were incurred prior to the closing of the transaction.
(8) During the year ended December 31, 2016, the Company recognized a gain of $160.2 million related to the divestiture of Décor.
(9) During the year ended December 31, 2016, the Company recognized $8.4 million of costs primarily associated with the divestiture of Décor and planned divestiture of Tools (excluding Dymo Industrial). During the year ended December 31, 2015, the Company recognized $0.2 million of costs associated with the planned divestiture of Décor.
(10) During the year ended December 31, 2016, the Company incurred a $1.7 million loss related to the extinguishment of debt and a $45.9 million loss associated with the termination of the Jarden Bridge Facility.
(11) During the year ended December 31, 2016, the Company recognized a net loss of $0.7 million in discontinued operations. During the year ended December 31, 2015, the Company recognized a net loss of $4.9 million in discontinued operations primarily associated with Endicia and certain Culinary businesses and a $95.6 million net gain from the sale of Endicia.
(12) During the year ended December 31, 2016, the Company recognized $164.2 million of deferred tax expense related to the difference between the book and tax basis in the Tools business and ($21.0) million of deferred tax benefit related to statutory tax rate changes in France affecting Jarden acquired intangibles. During the year ended December 31, 2015, the Company recognized $6.0 million of non-recurring income tax benefits resulting from the resolution of income tax contingencies.
(13) During the year ended December 31, 2015, the Company recognized an increase of $2.6 million in cost of products sold resulting from increased costs of inventory due to changes in the exchange rate for the Venezuelan Bolivar.
(14) During the year ended December 31, 2015, the Company settled U.S. pension liabilities for certain participants with plan assets which resulted in $52.1 million of non-cash settlement charges.
(15) During the year ended December 31, 2015, the Company recognized foreign exchange losses of $9.2 million resulting from the devaluation of and subsequent changes in the exchange rate for the Venezuelan Bolivar, which under hyperinflationary accounting is recorded in the Statement of Operations.
(16) During the year ended December 31, 2015, the Company recognized charges resulting from the deconsolidation of its Venezuela operations, including $133.0 million of charges associated with the write-off of Venezuela net assets and $39.7 million of charges associated with the write-off of currency translation adjustments included in equity that arose before the application of hyperinflationary accounting for Venezuela in 2010.
(17) The Company determined the tax effect of the items excluded from normalized results by applying the estimated effective rate for the applicable jurisdiction in which the pre-tax items were incurred, and for which realization of the resulting tax benefit, if any, is expected. In certain situations in which an item excluded from normalized results impacts income tax expense, the Company uses a "with" and "without" approach to determine normalized income tax expense.

50
FY 2017 Core Sales Growth Guidance Reconciliation
Newell Brands Inc.Reconciliation of Core Sales GrowthYear Ending December 31, 2017
Estimated net sales growth (GAAP) 9.5% to 11.0%Foreign currency 1.5% to 2.5%Acquisitions, net of divestitures (1) -7.5% to -10.5%
Core Sales Growth, Adjusted Pro Forma 2.5% to 4.0%
Year EndingDecember 31, 2017
(1) Acquisitions, net of divestitures represents estimated sales until the one year anniversary of their respective dates of acquisition, net of the impacts of actual divestitures and the planned divestitures of assets held for sale businesses.


