
China Consumer - · PDF fileChina | Consumer China Consumer 10 July 2014 China Consumer Hard...
78
China | Consumer China Consumer 10 July 2014 China Consumer Hard Choices: The Impact of E-commerce EQUITY RESEARCH CHINA Jessie Guo, PhD * Equity Analyst +852 3743 8036 [email protected] Edwin Fan, CFA * Equity Analyst +852 3743 8037 [email protected] Kevin Chee, CFA * Equity Analyst 852 3743 8022 [email protected] Jeffrey Zeng * Equity Associate +852 3743 8009 [email protected] * Jefferies Hong Kong Limited Key Takeaway This research unveils the business model evolution of a consumer sector facing an E-commerce boom. We find that E-commerce poses a serious threat to most traditional retailers but benefits certain sectors/brands: dept. stores and domestic apparel/footwear get hit most; leading global apparel brands seem to leverage it to enhance branding; sportswear uses it as an effective tool for cleaning out inventory; restaurants and jewelers have held up relatively well. What makes this research different? We conducted large-scale data-mining to unveil the business model evolution and key characteristics of traditional retailing in the era of E-commerce. We studied more than 100,000 items sold online, covering almost all major consumer subsectors. Our research studies not only the competitive landscape change caused by E-commerce and brands’ marketing strategy but also makes thorough comparisons amongst E-tailers and traditional retailers covering a wide range of areas such as ASPs, profitability, consumer feedback, etc. We also refer to a survey led by Southwestern University of Finance and Economics, studying households' online spending behaviour through in-depth face-to-face interviews with more than 22,000 Chinese households. We expect our study from a supply perspective and CHFS’s survey from a demand perspective to provide investors with a comprehensive angle to understand E-commerce’s impact on consumer sectors. Key findings. Online shopping is fast changing people’s daily purchasing behaviour and the competitive landscape of consumer sectors: 1) Online cosmetics retailing gains momentum and poses a serious challenge to traditional cosmetics retailing and even cosmetics brands with self-owned stores. 2) Restaurants could benefit since online group- purchasing moderately stimulates traffic and does not hurt margins. 3) Jewelers could boost their branding through online channels which also enjoys higher margins than retail stores. 4) Mass-market department stores are heavily losing customers to online retail and face structural issues and a dilemma: aggressive participation in E-commerce will cause price cannibalization and lower margins; not doing so means worse market share-loss. 5) Traditional supermarkets are losing consumers as well but those with a larger proportion of fresh products and with large numbers of CVS are relatively less impacted. 6) We think a solution for electronics retailers lies in the integration of logistics management and after-sales service into online platforms. 7) We observe that apparel and footwear brands get hurt most. Online sales will further gain market share and offline stores have to lower ASPs and face decelerating margins in the future. In contrast, international brands take market share from local brands and gain popularity through online platforms. 8) Local sportswear is better off than local apparel and footwear brands due to relatively higher entry barriers. We believe this sector has troughed as indicated by lower inventory days and reduced promotions. Sector and stock implications. We maintain a positive view on sportswear; a neutral view on staples, jewellery and electronics distributors; and a negative view on apparel, footwear, department stores, supermarkets and traditional cosmetics distributors. Staples trade at 21x 12-month forward PE vs. a historical median of 24x. Retailers trade at 13.5x 12- month forward PE vs. a historical median of 17x, whereas apparel trades at 13x 12-month forward PE vs. a historical median of 18-20x. Staples underperformed HSCEI by 2% in the past month, while retailers and apparel outperformed by 2% and 1% , respectively. Top Buys: Anta (2020 HK), CTF (1929 HK), CMD (1117 HK), Biostime (1112 HK) and Tingyi (322 HK). Top Sells: Belle (1880 HK), Sasa (178 HK), Tsingtao (168 HK, 600600 CH), Vinda (3331 HK), Parkson (3368 HK) and Giordano (709 HK). Jefferies does and seeks to do business with companies covered in its research reports. As a result, investors should be aware that Jefferies may have a conflict of interest that could affect the objectivity of this report. Investors should consider this report as only a single factor in making their investment decision. Please see analyst certifications, important disclosure information, and information regarding the status of non-US analysts on pages 74 to 78 of this report.
Transcript of China Consumer - · PDF fileChina | Consumer China Consumer 10 July 2014 China Consumer Hard...

China | Consumer
China Consumer 10 July 2014
China ConsumerHard Choices: The Impact of E-commerce
EQU
ITY R
ESEARC
H C
HIN
A
Jessie Guo, PhD *Equity Analyst
+852 3743 8036 [email protected] Fan, CFA *
Equity Analyst+852 3743 8037 [email protected]
Kevin Chee, CFA *Equity Analyst
852 3743 8022 [email protected] Zeng *Equity Associate
+852 3743 8009 [email protected]
* Jefferies Hong Kong Limited
Key Takeaway
This research unveils the business model evolution of a consumer sector facingan E-commerce boom. We find that E-commerce poses a serious threat tomost traditional retailers but benefits certain sectors/brands: dept. stores anddomestic apparel/footwear get hit most; leading global apparel brands seemto leverage it to enhance branding; sportswear uses it as an effective tool forcleaning out inventory; restaurants and jewelers have held up relatively well.
What makes this research different? We conducted large-scale data-mining to unveilthe business model evolution and key characteristics of traditional retailing in the eraof E-commerce. We studied more than 100,000 items sold online, covering almost allmajor consumer subsectors. Our research studies not only the competitive landscapechange caused by E-commerce and brands’ marketing strategy but also makes thoroughcomparisons amongst E-tailers and traditional retailers covering a wide range of areas suchas ASPs, profitability, consumer feedback, etc. We also refer to a survey led by SouthwesternUniversity of Finance and Economics, studying households' online spending behaviourthrough in-depth face-to-face interviews with more than 22,000 Chinese households. Weexpect our study from a supply perspective and CHFS’s survey from a demand perspectiveto provide investors with a comprehensive angle to understand E-commerce’s impact onconsumer sectors.
Key findings. Online shopping is fast changing people’s daily purchasing behaviourand the competitive landscape of consumer sectors: 1) Online cosmetics retailing gainsmomentum and poses a serious challenge to traditional cosmetics retailing and evencosmetics brands with self-owned stores. 2) Restaurants could benefit since online group-purchasing moderately stimulates traffic and does not hurt margins. 3) Jewelers couldboost their branding through online channels which also enjoys higher margins than retailstores. 4) Mass-market department stores are heavily losing customers to online retailand face structural issues and a dilemma: aggressive participation in E-commerce will causeprice cannibalization and lower margins; not doing so means worse market share-loss. 5)Traditional supermarkets are losing consumers as well but those with a larger proportionof fresh products and with large numbers of CVS are relatively less impacted. 6) We thinka solution for electronics retailers lies in the integration of logistics management andafter-sales service into online platforms. 7) We observe that apparel and footwear brandsget hurt most. Online sales will further gain market share and offline stores have to lowerASPs and face decelerating margins in the future. In contrast, international brands takemarket share from local brands and gain popularity through online platforms. 8) Localsportswear is better off than local apparel and footwear brands due to relatively higherentry barriers. We believe this sector has troughed as indicated by lower inventory days andreduced promotions.
Sector and stock implications. We maintain a positive view on sportswear; a neutralview on staples, jewellery and electronics distributors; and a negative view on apparel,footwear, department stores, supermarkets and traditional cosmetics distributors. Staplestrade at 21x 12-month forward PE vs. a historical median of 24x. Retailers trade at 13.5x 12-month forward PE vs. a historical median of 17x, whereas apparel trades at 13x 12-monthforward PE vs. a historical median of 18-20x. Staples underperformed HSCEI by 2% in thepast month, while retailers and apparel outperformed by 2% and 1% , respectively. TopBuys: Anta (2020 HK), CTF (1929 HK), CMD (1117 HK), Biostime (1112 HK) and Tingyi (322HK). Top Sells: Belle (1880 HK), Sasa (178 HK), Tsingtao (168 HK, 600600 CH), Vinda (3331HK), Parkson (3368 HK) and Giordano (709 HK).
Jefferies does and seeks to do business with companies covered in its research reports. As a result, investors should be aware that Jefferies may have aconflict of interest that could affect the objectivity of this report. Investors should consider this report as only a single factor in making their investmentdecision. Please see analyst certifications, important disclosure information, and information regarding the status of non-US analysts on pages 74 to 78 ofthis report.

Table of contents
Executive summary: Methodology and key findings 3
The era of E-commerce 15
The impact of E-commerce
Cosmetics 19
Restaurants 29
Jewellery 34
Electronic goods 42
Apparel, footwear and sportswear 50
Sector performance and valuation 67
Consumer
China Consumer
10 July 2014
page 2 of 78 , Equity Analyst, +852 3743 8036, [email protected] Guo, PhD
Please see important disclosure information on pages 74 - 78 of this report.

Executive summary Key takeaway
Through large-scale data-mining, this study seeks to unveil the business model evolution
of the consumer sector in the face of the E-commerce boom. We find that E-commerce
poses a serious threat to most traditional retailers but benefits certain sectors/brands:
department stores and domestic apparel/footwear get hit most; leading global apparel
brands seem to leverage it to enhance branding recognition; sportswear uses it as an
effective tool for cleaning up inventory; and restaurants and jewellers have held up
relatively well.
We maintain a positive view on sportswear; a neutral view on staples, jewellery and
electronics retailers; and a negative view on apparel, footwear, department stores,
supermarkets and traditional cosmetics retailers. Top Buys: CTF (1929 HK), Anta (2020
HK), Biostime (1112 HK), CMD (1117 HK), Tingyi (322 HK). Top Sells: Belle (1880 HK),
Sasa (178 HK), Tsingtao (168 HK, 600600 CH), Vinda (3331 HK), Parkson (3368 HK), and
Giordano (709 HK).
Research Methodology We studied all major online retail platforms with a wide array of coverage: from
household products, apparel, footwear, sportswear and jewellery to cosmetics and
restaurants. Our samples exceed 100,000 items and cover almost all major brands in each
consumer subsector. Through large-scale data-mining we try to compare the different
performance and business model evolution of both E-tailers and traditional retailers and
consumer brands covering a wide array of areas such as ASP, profitability, consumer
feedback, etc. We also take a qualitative approach to explain the current competitive
landscape and predict its future trajectory. Last but not least, we draw conclusions on
sector preferences and stock recommendations.
In this research, we also refer to databases from iResearch and the US Department of
Commerce, as well as research led by Southwestern University of Finance and Economics.
The 2nd round of the China Household Finance Survey (CHFS) 2013 studies households’
online spending behaviour through in-depth face-to-face interviews with more than
22,000 households. In order to reduce sample bias, this study considers a sound mixture
of survey participants including rural vs. urban households, communities with different
wealth status and professional backgrounds; geographical selections and educational
background.
We expect our large-scale online data-mining from a supply perspective and studies by
other authorities from a demand perspective to provide investors with a comprehensive
understanding of the penetration of E-commerce in the consumer sector.
Key findings E-commerce is coming, at a pace faster than expected
China has become the largest online retail market and its penetration grows at a much
faster pace than other developed economies. We observe the following key features: 1) as
consumers become more sophisticated and counterfeit products become a concern, the
B2C format is quickly overriding the C2C format; 2) the B2C market is set to undergo
consolidation; thus, building up a successful and sustainable platform requires a wide
range of strategies and strong execution; 3) O2O integration provides better consumer
satisfaction and can be a meaningful competitive advantage for both retailers and E-
tailers; 4) mobile/Wechat-made retail gains stronger momentum from PC-made retail.
Online cosmetics retailing gains momentum
Online distribution of cosmetic products is becoming a strong competitive force to
traditional retail channels. Penetration of online sales of cosmetics (out of total retail sales
of cosmetics) increased from 3.8% in 2011 to 6.6% in 2012 and 10.2% in 2013. It is
expected to reach 21.9% in 2018e. This will increasingly pose challenges to traditional
Consumer
China Consumer
10 July 2014
page 3 of 78 , Equity Analyst, +852 3743 8036, [email protected] Guo, PhD
Please see important disclosure information on pages 74 - 78 of this report.

department stores and offline cosmetics retailers such as Sasa (178 HK, Underperform),
Bonjour (653 HK, NC), Colourmix (owned by Veeko Holdings; 1173 HK, NC), Sephora
(owned by LVMH group; MC FP, NC), and even brands with self-owned stores such as
L’Occitaine (973 HK, Hold), Body Shop (owned by L’Oreal; OR FP, Hold), etc.
We believe Sasa is less competitive compared with Jumei (JMEI US, NC) and Vipshop (VIPS
US, Buy). The fundamentals and growth potential of Jumei in particular are likely to
outstrip Vipshop and Sasa due to its wide product range and relatively low pricing that
meets the needs of a stable/rising consumer base with monthly income of RMB5,000-
8,000.
Vipshop (VIPS, Buy) has its niche serving sophisticated consumers with higher purchasing
power. In contrast, Sasa’s business model is facing a serious challenge: its online channel
is much less competitive than close rivals. It can hardly help to offset headwinds that its
retail stores face: a slowdown in the number of mainland travellers, a weak Hong Kong
retail environment and difficulty in raising ASP.
Restaurants could benefit from online platforms
We believe online group-purchasing moderately stimulates traffic of conventional
restaurants, in particular those with mass market positioning. It does not pose a challenge
to overall margins of participating restaurants due to its small portion of sales
contribution (0.7% in 2013), albeit with heavy discounts for those items.
Online offerings are smartly used by restaurants; in particular those newly opened, as an
effective marketing tool to enhance brand awareness. It is also used to encourage visits in
non-peak hours and to specific locations. (74% and 90% of the deals on Dianping and
Meituan are restricted to certain hours or locations).
However, the online channel does not seem to be an effective tool for mainstream chain
stores such as KFC (owned by YUM! Brands YUM US, Hold), McDonald’s (MCD US, Hold),
Ajisen (538 HK, NC), Starbucks (SBUX US, Buy), Café De Coral (341 HK, NC), Tsui Wah
(1314 HK, NC), and Fairwood (52 HK, NC). This is because 1) They already have a wide
range of retail store coverage while online consumers are more inclined to try new
restaurants/cuisine types; 2) They already have strong brand awareness.
E-commerce boosts jewellery branding
The penetration of e-commerce sales in jewellery in China is as low as c1-2% of total
jewellery sales but we expect E-commerce to become a platform to boost sales and
enhance brand image. Gold products sold better than gem-set jewellery due to the
homogeneity of gold products vs gem-set jewellery. In addition, gold products sold on
line are at a lower ASP vs gem-set jewellery.
The EBIT margin from online sold gold/jewellery products is higher than those sold offline.
This phenomenon is different from the apparel, footwear and sportswear brands, mainly
because jewellery brands are reluctant to offer significant price discounts for an identical
product sold online, while offline stores have to bear heavy fixed costs.
We prefer the business model of self-operated stores which has the potential to leverage
online channels to enhance its branding image to stimulate both online and offline sales.
In contrast, brands adopting a franchisee model are conservative in online expansion
since they try to protect licensees from potential cannibalization of online sales.
We favour CTF (1929 HK, Buy, PT HKD13) and CSS (116 HK, Hold, PT HKD21.3) to Luk
Fook (590 HK, Hold, PT HKD23.1). We believe CTF and Chow Sang Sang are well-
positioned for online expansion due to their business model of self-operated stores.
According to CTF, e-commerce retail sales rose 91% YoY in FY14 while the company had
an overall 122,000 online visitors in FY14 (+51% YoY). Luk Fook (590 HK, Hold) is much
more conservative with online expansion in order to protect franchisees’ business.
Consumer
China Consumer
10 July 2014
page 4 of 78 , Equity Analyst, +852 3743 8036, [email protected] Guo, PhD
Please see important disclosure information on pages 74 - 78 of this report.

A mixed picture for supermarkets
It was rather surprising to see as high as c30% of people surveyed by CHFS did online
shopping for daily FMCG products such as toothpaste, tissue paper and shampoo, which
are a significant proportion of supermarkets’ turnover. However, online shopping for
finished F&B goods is high- single digit to low-teens; and fruits and vegetables are only
low single digit. The implication is that traditional supermarkets with a larger proportion
of fresh products and supermarket operators with a large number of CVS’ won’t be
impacted meaningfully in the future. We expect Sunart (6808 HK, NC), Lianhua (980 HK,
NC), and Wumart (1025 HK, NC) to face rising competition from online. In contrast, CRE
(291 HK) is relatively better off due to its multi-format strategies (with CVS, high-end
supermarkets, beer businesses).
A serious threat to mass-market department stores
Shopping malls and department stores with mass-market positioning are losing
customers to E-shops. We found that 75% of items sold online are priced below RMB300
and online shoppers are highly price sensitive. In addition, the aggressive expansion that
the sector experienced in the past few years (at >20% CAGR for GFA increase) as well as
the government’s anti-waste/corruption policy put pressure on sales growth. We believe
this sector is facing structural headwinds with high-end department stores and beauty
salons being exceptions.
We believe Intime (1833 HK, Hold) and Lifestyle (1212 HK, Buy) are relatively better
positioned than other department stores such as Parkson (3368 HK, Underperform).
On/offline integration is key to electronics retailers
Standardized products are at the forefront of the competition. We think the solution lies in
online/offline integration. Challenges to traditional electronic goods retailers such as
Gome (493 HK, Buy) and Suning (002024 CH, Hold) have existed for a few years.
However, we think they have advantages of inventory and logistics management and
after-sales service, which are not easy to replace.
Local apparel/footwear brands get hit most
We believe online sales of apparel and footwear will further gain share from retail stores
due to cheaper prices offered by online channels, convenience for consumers, and easier
logistics arrangement. Local brands face a structural challenge due to the large price gap
between online and offline. Local brands’ ASP in traditional retail stores are 30-40%
higher than e-retailers. As a result, retail stores generate higher EBIT margins at 13-14%
compared with 9-10% from online. We believe this trend is unsustainable and expect
offline channels to cut price so as to narrow gaps with online channels. This will
unavoidably lower their margins (given constant other factors). Such a structural
headwind has no ready-made prescription, unfortunately.
This situation applies to almost all major local brands: Belle (1880 HK, Underperform),
Giordano (709 HK, Underperform), Daphne (210 HK, Hold), Trinity (891 HK, Hold), China
Lilang (1234 HK, Hold), Metersbonwe (002269 CH, NC), Semir (002563 CH, NC) and
Septwolves (002029 CH, NC).
….yet international apparel/footwear brands reap the harvest
International apparel and footwear brands take market share from local brands and gain
rising popularity from Chinese consumers in 1st and 2nd tier cities; in particular, brands
like Zara (Inditex, ITX SM, Hold), H&M (HMB SS, Underperform) and Uniqlo (Fast Retailing,
9983 JP, NC). This is due to better product offering, stronger marketing and better
consumer services. We expect online channels to become important channels for
international brands to further enhance their presence.
Sportswear troughed and held up relatively well
Local sportswear held up relatively well compared with local apparel and footwear brands
in the face of E-commerce penetration. The entry barrier to this industry is higher than
apparel. Large brands make serious efforts in brand-enhancement. We believe the sector
Consumer
China Consumer
10 July 2014
page 5 of 78 , Equity Analyst, +852 3743 8036, [email protected] Guo, PhD
Please see important disclosure information on pages 74 - 78 of this report.

has troughed as indicated by lower inventory days and reduced promotions. Thus we take
a positive view on sportswear.
We have Buy ratings on Anta (2020 HK, Buy, PT HKD13.5), Li Ning (2331 HK, Buy, PT
HKD7.5) and Xtep (1368 HK, Buy, PT HKD4.5). We have an Underperform rating on Belle
(1880 HK, PT HKD6.8) and Giordano (709 HK, PT HKD3.9), and Hold ratings on Daphne
(210 HK, Hold, PT HKD3.2), Trinity (891 HK, Hold, PT HKD1.9) and China Lilang (1234 HK,
Hold, PT HKD4.6). The following sessions introduce our research methodology and data
analysis.
Sector valuation and stock picks We maintain a positive view on sportswear; a neutral view on staples, jewellery and
electronics retailers; and a negative view on apparel, footwear, department stores,
supermarkets and traditional cosmetics retailers.
Staples trade at 21x 12-month forward PE vs. a historical median of 24x. Retailers trade at
13.5x 12-month forward PE vs. a historical median of 17x, whereas apparels trade at 13x
12-month forward PE vs. a historical median of 18-20x. Staples underperformed the HSCEI
by 2% in the past one month, retailers outperformed by 2% and apparels outperformed
by 1%.
Top Picks: Anta (2020 HK), CTF (1929 HK), Biostime (1112 HK), CMD (1117 HK), Tingyi
(322 HK).
Top Sells: Belle (1880 HK), Sasa (178 HK), Tsingtao (168 HK, 600600 CH), Vinda (3331
HK), Parkson (3368 HK) and Giordano (709 HK).
Chart 1: E-commerce impact and investment view on sub-sectors
Source: Jefferies
Consumer Subsector Impact from e-commerce
Mass-market department stores Heavily negative
Traditional electronics retailers Moderately negative K
Traditional supermarkets Negative
Consumer staples Neutral K
Domestic apparel and footwear Heavily negative
Global apparel and footwear Moderately positive
Domestic sportswear Netural to moderately positive
Traditional cosmetics retailers Negative
Global cosmetics brands Positive
Jewellers Positive K
Restaurants Positive
Our investment
view
Consumer
China Consumer
10 July 2014
page 6 of 78 , Equity Analyst, +852 3743 8036, [email protected] Guo, PhD
Please see important disclosure information on pages 74 - 78 of this report.
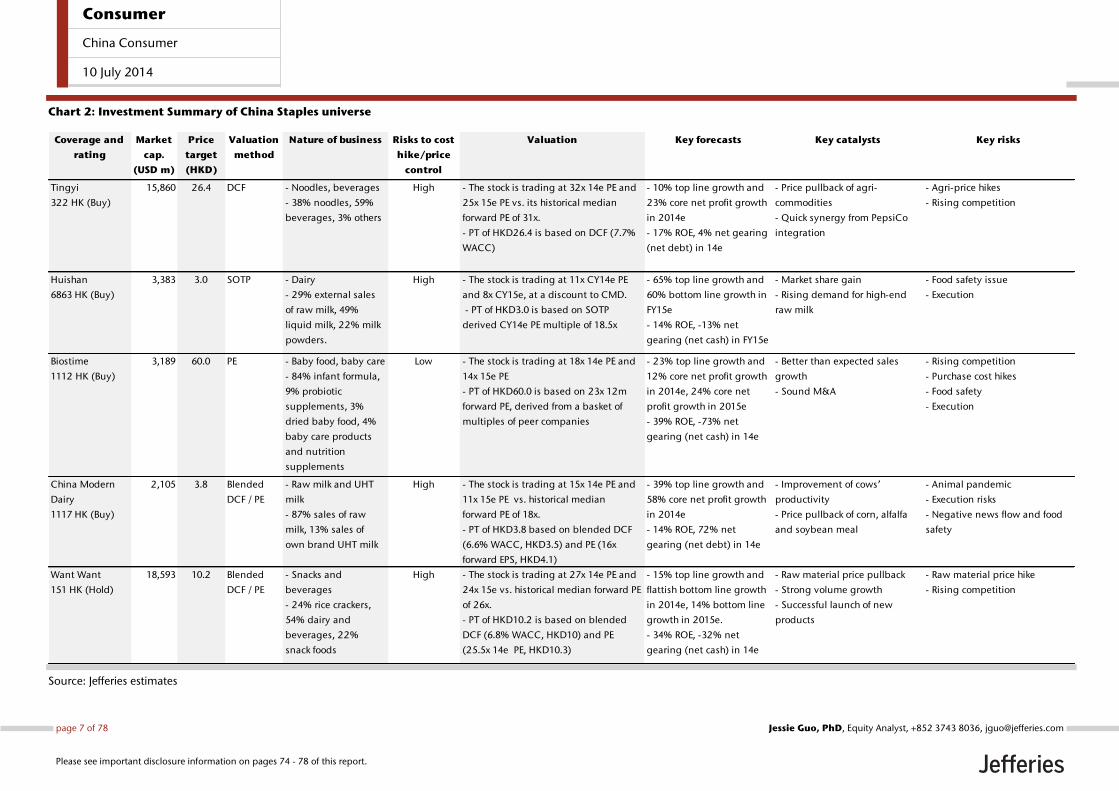
Chart 2: Investment Summary of China Staples universe
Source: Jefferies estimates
Coverage and
rating
Market
cap.
(USD m)
Price
target
(HKD)
Valuation
method
Nature of business Risks to cost
hike/price
control
Valuation Key forecasts Key catalysts Key risks
Tingyi
322 HK (Buy)
15,860 26.4 DCF - Noodles, beverages
- 38% noodles, 59%
beverages, 3% others
High - The stock is trading at 32x 14e PE and
25x 15e PE vs. its historical median
forward PE of 31x.
- PT of HKD26.4 is based on DCF (7.7%
WACC)
- 10% top line growth and
23% core net profit growth
in 2014e
- 17% ROE, 4% net gearing
(net debt) in 14e
- Price pullback of agri-
commodities
- Quick synergy from PepsiCo
integration
- Agri-price hikes
- Rising competition
Huishan
6863 HK (Buy)
3,383 3.0 SOTP - Dairy
- 29% external sales
of raw milk, 49%
liquid milk, 22% milk
powders.
High - The stock is trading at 11x CY14e PE
and 8x CY15e, at a discount to CMD.
- PT of HKD3.0 is based on SOTP
derived CY14e PE multiple of 18.5x
- 65% top line growth and
60% bottom line growth in
FY15e
- 14% ROE, -13% net
gearing (net cash) in FY15e
- Market share gain
- Rising demand for high-end
raw milk
- Food safety issue
- Execution
Biostime
1112 HK (Buy)
3,189 60.0 PE - Baby food, baby care
- 84% infant formula,
9% probiotic
supplements, 3%
dried baby food, 4%
baby care products
and nutrition
supplements
Low - The stock is trading at 18x 14e PE and
14x 15e PE
- PT of HKD60.0 is based on 23x 12m
forward PE, derived from a basket of
multiples of peer companies
- 23% top line growth and
12% core net profit growth
in 2014e, 24% core net
profit growth in 2015e
- 39% ROE, -73% net
gearing (net cash) in 14e
- Better than expected sales
growth
- Sound M&A
- Rising competition
- Purchase cost hikes
- Food safety
- Execution
China Modern
Dairy
1117 HK (Buy)
2,105 3.8 Blended
DCF / PE
- Raw milk and UHT
milk
- 87% sales of raw
milk, 13% sales of
own brand UHT milk
High - The stock is trading at 15x 14e PE and
11x 15e PE vs. historical median
forward PE of 18x.
- PT of HKD3.8 based on blended DCF
(6.6% WACC, HKD3.5) and PE (16x
forward EPS, HKD4.1)
- 39% top line growth and
58% core net profit growth
in 2014e
- 14% ROE, 72% net
gearing (net debt) in 14e
- Improvement of cows’
productivity
- Price pullback of corn, alfalfa
and soybean meal
- Animal pandemic
- Execution risks
- Negative news flow and food
safety
Want Want
151 HK (Hold)
18,593 10.2 Blended
DCF / PE
- Snacks and
beverages
- 24% rice crackers,
54% dairy and
beverages, 22%
snack foods
High - The stock is trading at 27x 14e PE and
24x 15e vs. historical median forward PE
of 26x.
- PT of HKD10.2 is based on blended
DCF (6.8% WACC, HKD10) and PE
(25.5x 14e PE, HKD10.3)
- 15% top line growth and
flattish bottom line growth
in 2014e, 14% bottom line
growth in 2015e.
- 34% ROE, -32% net
gearing (net cash) in 14e
- Raw material price pullback
- Strong volume growth
- Successful launch of new
products
- Raw material price hike
- Rising competition
Consumer
China Consumer
10 July 2014
page 7 of 78 , Equity Analyst, +852 3743 8036, [email protected] Guo, PhD
Please see important disclosure information on pages 74 - 78 of this report.
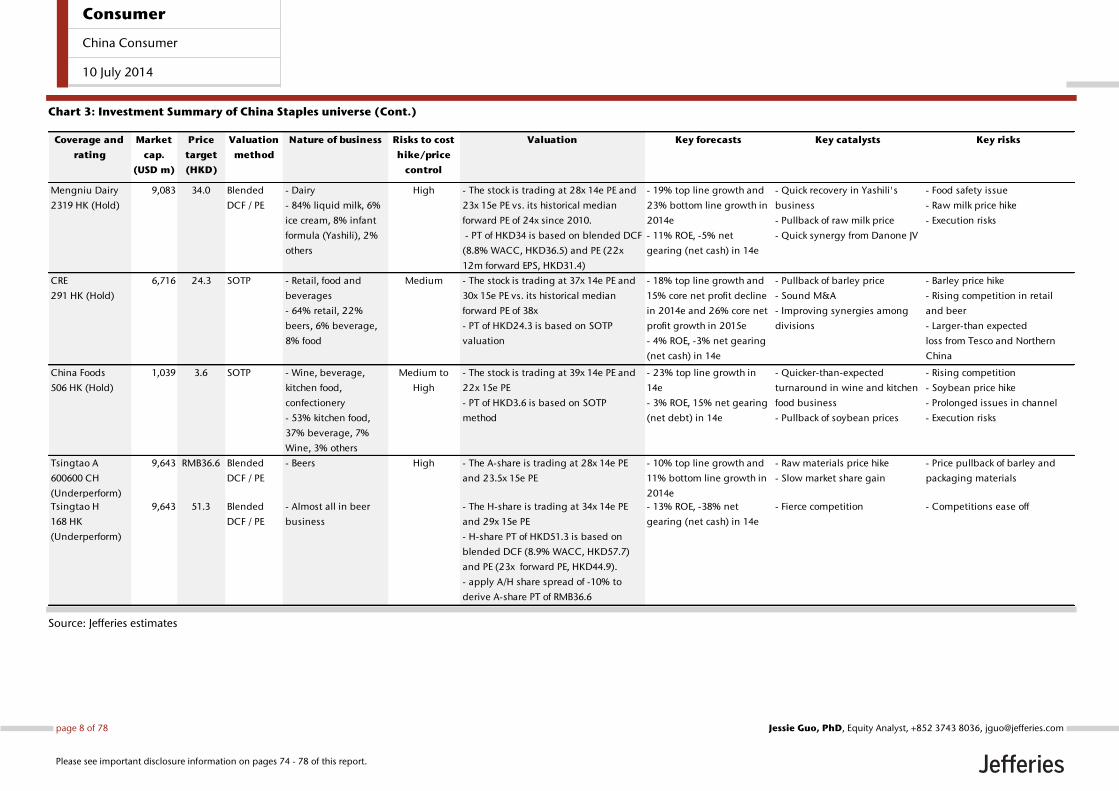
Chart 3: Investment Summary of China Staples universe (Cont.)
Source: Jefferies estimates
Coverage and
rating
Market
cap.
(USD m)
Price
target
(HKD)
Valuation
method
Nature of business Risks to cost
hike/price
control
Valuation Key forecasts Key catalysts Key risks
Mengniu Dairy
2319 HK (Hold)
9,083 34.0 Blended
DCF / PE
- Dairy
- 84% liquid milk, 6%
ice cream, 8% infant
formula (Yashili), 2%
others
High - The stock is trading at 28x 14e PE and
23x 15e PE vs. its historical median
forward PE of 24x since 2010.
- PT of HKD34 is based on blended DCF
(8.8% WACC, HKD36.5) and PE (22x
12m forward EPS, HKD31.4)
- 19% top line growth and
23% bottom line growth in
2014e
- 11% ROE, -5% net
gearing (net cash) in 14e
- Quick recovery in Yashili's
business
- Pullback of raw milk price
- Quick synergy from Danone JV
- Food safety issue
- Raw milk price hike
- Execution risks
CRE
291 HK (Hold)
6,716 24.3 SOTP - Retail, food and
beverages
- 64% retail, 22%
beers, 6% beverage,
8% food
Medium - The stock is trading at 37x 14e PE and
30x 15e PE vs. its historical median
forward PE of 38x
- PT of HKD24.3 is based on SOTP
valuation
- 18% top line growth and
15% core net profit decline
in 2014e and 26% core net
profit growth in 2015e
- 4% ROE, -3% net gearing
(net cash) in 14e
- Pullback of barley price
- Sound M&A
- Improving synergies among
divisions
- Barley price hike
- Rising competition in retail
and beer
- Larger-than expected
loss from Tesco and Northern
China
China Foods
506 HK (Hold)
1,039 3.6 SOTP - Wine, beverage,
kitchen food,
confectionery
- 53% kitchen food,
37% beverage, 7%
Wine, 3% others
Medium to
High
- The stock is trading at 39x 14e PE and
22x 15e PE
- PT of HKD3.6 is based on SOTP
method
- 23% top line growth in
14e
- 3% ROE, 15% net gearing
(net debt) in 14e
- Quicker-than-expected
turnaround in wine and kitchen
food business
- Pullback of soybean prices
- Rising competition
- Soybean price hike
- Prolonged issues in channel
- Execution risks
Tsingtao A
600600 CH
(Underperform)
9,643 RMB36.6 Blended
DCF / PE
- Beers High - The A-share is trading at 28x 14e PE
and 23.5x 15e PE
- 10% top line growth and
11% bottom line growth in
2014e
- Raw materials price hike
- Slow market share gain
- Price pullback of barley and
packaging materials
Tsingtao H
168 HK
(Underperform)
9,643 51.3 Blended
DCF / PE
- Almost all in beer
business
- The H-share is trading at 34x 14e PE
and 29x 15e PE
- H-share PT of HKD51.3 is based on
blended DCF (8.9% WACC, HKD57.7)
and PE (23x forward PE, HKD44.9).
- apply A/H share spread of -10% to
derive A-share PT of RMB36.6
- 13% ROE, -38% net
gearing (net cash) in 14e
- Fierce competition - Competitions ease off
Consumer
China Consumer
10 July 2014
page 8 of 78 , Equity Analyst, +852 3743 8036, [email protected] Guo, PhD
Please see important disclosure information on pages 74 - 78 of this report.

Chart 4: Investment Summary of China Staples universe (Cont.)
Source: Jefferies estimates
Coverage and
rating
Market
cap.
(USD m)
Price
target
(HKD)
Valuation
method
Nature of business Risks to cost
hike/price
control
Valuation Key forecasts Key catalysts Key risks
Hengan
1044 HK (Hold)
13,122 84.6 Blended
DCF and PE
Tissue, disposable
diapers and sanitary
napkins
- 47% tissue products,
30% sanitary napkins,
13% disposable
diapers, 16% others
High - The stock is trading at 26x 14e PE and
22x 15e PE, vs. its historical median
forward PE of 26x (3 years average).
- PT of HKD84.6 is based on blended
DCF (6.6% WACC, HKD100.4) and PE
(20x 12m forward PE, HKD68.8)
- 14% sales growth and 5%
net profit growth in 2014e
- 23% ROE, -5% net
gearing (net cash)
- Wood pulp and petro-chemical
cost pullback
- Pricing pressure eases on
rational competition
- Better-than-expected 1H14
results
- Wood pulp cost hike
- Intensifying competition
- Price competition in mid-low
end diapers market
- Worse-than-expected 1H14
results
Vinda
3331 HK
(Underperform)
1,463 9.6 Blended
DCF and PE
Tissue High - The stock is trading at 23x 14e PE and
19x 15e PE, vs. historical median
forward PE of 20x (3 years average)
- PT of HKD9.6 is based on blended DCF
(7.3% WACC, HKD10.1) and PE (17x
12m forward PE, HKD9.2)
- 10% sales growth and 8%
net profit decline in 2014e
- 10% ROE, 50% net
gearing (net debt) for
2014e
- Wood pulp cost hike
- Intensifying competition
- ASP pressure due to industry
overcapacity issue
- Worse-than-expected result in
1H14
- Wood pulp cost pullback
- Quick ramp up in the sanitary
napkin and baby diapers
business under associate
company
- Large synergy from potential
cooperation with SCA
- Better-than-expected 1H14
results
Consumer
China Consumer
10 July 2014
page 9 of 78 , Equity Analyst, +852 3743 8036, [email protected] Guo, PhD
Please see important disclosure information on pages 74 - 78 of this report.
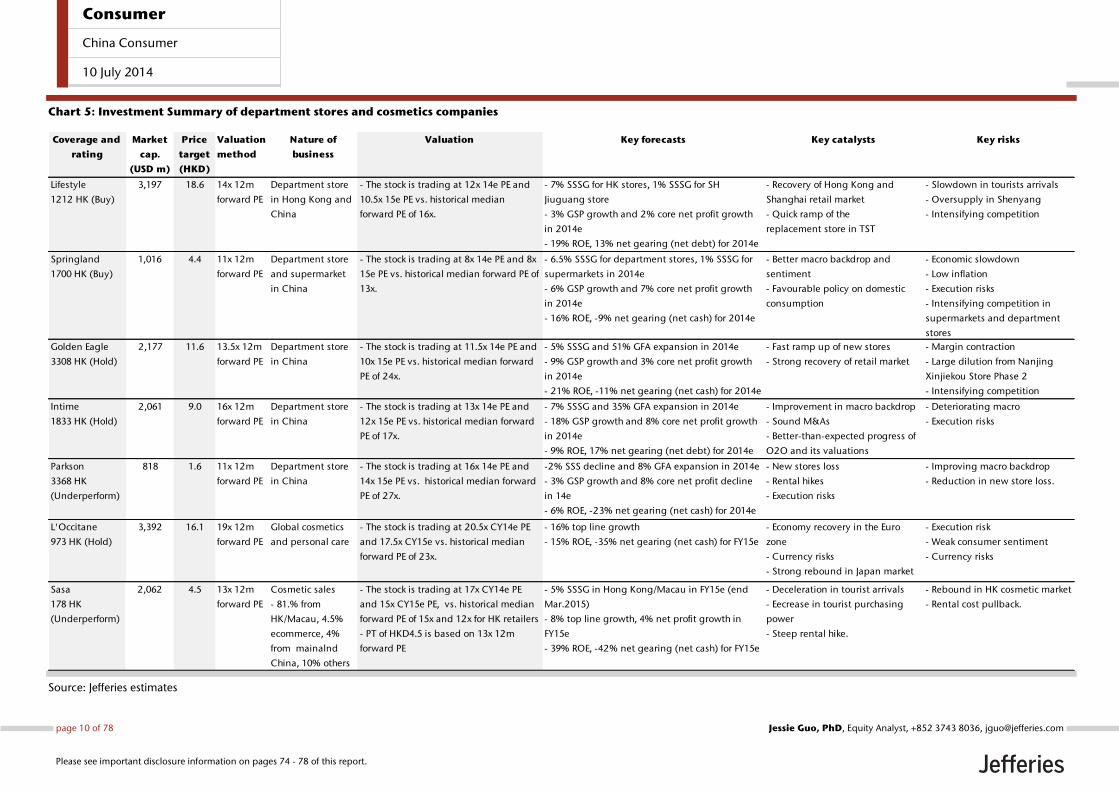
Chart 5: Investment Summary of department stores and cosmetics companies
Source: Jefferies estimates
Coverage and
rating
Market
cap.
(USD m)
Price
target
(HKD)
Valuation
method
Nature of
business
Valuation Key forecasts Key catalysts Key risks
Lifestyle
1212 HK (Buy)
3,197 18.6 14x 12m
forward PE
Department store
in Hong Kong and
China
- The stock is trading at 12x 14e PE and
10.5x 15e PE vs. historical median
forward PE of 16x.
- 7% SSSG for HK stores, 1% SSSG for SH
Jiuguang store
- 3% GSP growth and 2% core net profit growth
in 2014e
- 19% ROE, 13% net gearing (net debt) for 2014e
- Recovery of Hong Kong and
Shanghai retail market
- Quick ramp of the
replacement store in TST
- Slowdown in tourists arrivals
- Oversupply in Shenyang
- Intensifying competition
Springland
1700 HK (Buy)
1,016 4.4 11x 12m
forward PE
Department store
and supermarket
in China
- The stock is trading at 8x 14e PE and 8x
15e PE vs. historical median forward PE of
13x.
- 6.5% SSSG for department stores, 1% SSSG for
supermarkets in 2014e
- 6% GSP growth and 7% core net profit growth
in 2014e
- 16% ROE, -9% net gearing (net cash) for 2014e
- Better macro backdrop and
sentiment
- Favourable policy on domestic
consumption
- Economic slowdown
- Low inflation
- Execution risks
- Intensifying competition in
supermarkets and department
stores
Golden Eagle
3308 HK (Hold)
2,177 11.6 13.5x 12m
forward PE
Department store
in China
- The stock is trading at 11.5x 14e PE and
10x 15e PE vs. historical median forward
PE of 24x.
- 5% SSSG and 51% GFA expansion in 2014e
- 9% GSP growth and 3% core net profit growth
in 2014e
- 21% ROE, -11% net gearing (net cash) for 2014e
- Fast ramp up of new stores
- Strong recovery of retail market
- Margin contraction
- Large dilution from Nanjing
Xinjiekou Store Phase 2
- Intensifying competition
Intime
1833 HK (Hold)
2,061 9.0 16x 12m
forward PE
Department store
in China
- The stock is trading at 13x 14e PE and
12x 15e PE vs. historical median forward
PE of 17x.
- 7% SSSG and 35% GFA expansion in 2014e
- 18% GSP growth and 8% core net profit growth
in 2014e
- 9% ROE, 17% net gearing (net debt) for 2014e
- Improvement in macro backdrop
- Sound M&As
- Better-than-expected progress of
O2O and its valuations
- Deteriorating macro
- Execution risks
Parkson
3368 HK
(Underperform)
818 1.6 11x 12m
forward PE
Department store
in China
- The stock is trading at 16x 14e PE and
14x 15e PE vs. historical median forward
PE of 27x.
-2% SSS decline and 8% GFA expansion in 2014e
- 3% GSP growth and 8% core net profit decline
in 14e
- 6% ROE, -23% net gearing (net cash) for 2014e
- New stores loss
- Rental hikes
- Execution risks
- Improving macro backdrop
- Reduction in new store loss.
L'Occitane
973 HK (Hold)
3,392 16.1 19x 12m
forward PE
Global cosmetics
and personal care
- The stock is trading at 20.5x CY14e PE
and 17.5x CY15e vs. historical median
forward PE of 23x.
- 16% top line growth
- 15% ROE, -35% net gearing (net cash) for FY15e
- Economy recovery in the Euro
zone
- Currency risks
- Strong rebound in Japan market
- Execution risk
- Weak consumer sentiment
- Currency risks
Sasa
178 HK
(Underperform)
2,062 4.5 13x 12m
forward PE
Cosmetic sales
- 81.% from
HK/Macau, 4.5%
ecommerce, 4%
from mainalnd
China, 10% others
- The stock is trading at 17x CY14e PE
and 15x CY15e PE, vs. historical median
forward PE of 15x and 12x for HK retailers
- PT of HKD4.5 is based on 13x 12m
forward PE
- 5% SSSG in Hong Kong/Macau in FY15e (end
Mar.2015)
- 8% top line growth, 4% net profit growth in
FY15e
- 39% ROE, -42% net gearing (net cash) for FY15e
- Deceleration in tourist arrivals
- Eecrease in tourist purchasing
power
- Steep rental hike.
- Rebound in HK cosmetic market
- Rental cost pullback.
Consumer
China Consumer
10 July 2014
page 10 of 78 , Equity Analyst, +852 3743 8036, [email protected] Guo, PhD
Please see important disclosure information on pages 74 - 78 of this report.

Chart 6: Investment Summary of jewellery and watch retailers
Source: Jefferies estimates
Coverage and
rating
Market
cap
(USD m)
Price
target
(HKD)
Valuation
method
Nature of business Risk to gold
price
fluctuation
Valuation Key forecasts Key catalysts Key risks
Chow Tai Fook
1929 HK (Buy)
15,380 13.0 1-year
forward PE
- Sells gold, gem-set jewellery and
watches in HK, Macau and China
through self-operated shops and
franchisee stores.
- Revenue contribution: China 55%,
HK/Macau and others 45%
Low: Company
hedges 70% of
gold inventory
- The stock is trading at
17x CY14e and 15x
CY15e PE, vs historical 1-
year forward PE of 16x.
- PT of HKD13.0 is based
on 18x 1-year forward PE
- 7% revenue drop and 4% net
profit drop for FY15e, but 11%
revenue growth and 16% net profit
growth in FY16e (end March).
- 18% ROE and 11% gearing for
FY15e; 19% ROE and 12% gearing
for FY16e
1QFY15e
operational
updates in Jul14
- Downside risks: Gold price
drop may cause valuations
to de-rate, despite CTF
hedges 70% of gold.
- Sales may further drop in
HK on lower tourist
spending.
Luk Fook
590 HK (Hold)
1,832 23.1 1-year
forward PE
- Sells gold, gem-set jewellery and
watches in HK, Macau and China
through self-operated and licensee
shops.
- Revenue contribution: China self-
operated shops: 9%, HK/Macau 76%,
licensing fees: 3%, wholesaling 12%
High: Company
hedges 20% of
gold inventory
- The stock is trading at
9x CY14e and 8x CY15e
PE, vs 3-year average 1-
year forward PE at 10x.
- PT of HKD23.1 is based
on 8.5x 1-year forward PE
- 13% revenue drop and 17% net
profit drop for FY15e, but 7%
revenue growth and 16% net profit
growth in FY16e (end March).
- 19% ROE and -24% gearing (net
cash) for FY15e; 20% ROE and -28%
gearing for FY16e
1QFY15e
operational
updates in Jul14
- Upside risk: jewellery
sales to recover in HK, Luk
Fook benefits the most
- Downside risk: Gold price
drop may cause valuations
to de-rate.
Chow Sang Sang
116 HK (Hold)
1,777 21.3 1-year
forward PE
- Sells gold, gem-set jewellery and
watches in HK, Macau and China
through self-operated shops only. Also
wholesales precious metals to smaller
scale HK-based jewellery retailers.
- Revenue contribution: HK/Macau
49%, China 30%, Taiwan 2%,
wholesale and others 25%
Medium:
Company hedges
40% of gold
inventory
- The stock is trading at
11x CY14e and 10x
CY15e PE, vs 3-year
average 1-year forward
PE at 12x.
- PT of HKD21.3 is based
on 11x 1-year forward PE
- 6% revenue drop and 5% net
profit growth for 2014e, and 7%
revenue growth and 11% net profit
growth in 2015e (end Dec).
- 15% ROE and 4% gearing for
2014e; 15% ROE and 1% gearing
for 2015e
1H14 results
announcement in
Aug14
- Upside risk: jewellery
sales to recover in HK
- Downside risk: Gold price
drop may cause valuations
to de-rate.
Hengdeli
3389 HK (Hold)
855 1.5 1-year
forward PE
- Sells luxury and mass market Swiss
watches in Greater China
- Revenue contribution: China 40%,
HK/Macau: 33%, Taiwan 2%,
wholesale and customer services: 25%
Low: according to
the Federation of
Swiss Watch
Industry, less
than 2% of Swiss
watches' raw
material are from
gold
- The stock is trading at
10x CY14e and 10x
CY15e PE, vs 3-year
average 1-year forward
PE at 14x.
- PT of HKD1.5 is based
on 11x 1-year forward PE
- 3% revenue growth and 29% net
profit growth for 2014e, and 4%
revenue growth and 6% net profit
growth in 2015e (end Dec).
- 9% ROE and 28% gearing for
2014e; 9% ROE and 23% gearing
for 2015e
1H14 results
announcement in
Aug14
- Upside risk: Relief in anti-
corruption measures which
may result in rebound of
Swiss watch sales.
- Downside risk:
Continuous slowdown in
demand for luxury watches;
Consumer
China Consumer
10 July 2014
page 11 of 78 , Equity Analyst, +852 3743 8036, [email protected] Guo, PhD
Please see important disclosure information on pages 74 - 78 of this report.

Chart 7: Investment Summary of sportswear companies
Source: Jefferies estimates
Coverage
and rating
Market
cap
(USD m)
Price
target
(HKD)
Valuation
methodNature of business Risk to cost hike Valuation Key forecasts Key catalysts Key risks
Anta Sports
2020 HK
(Buy)
4,193 13.5 Blended
DCF/ PE
- Manufactures and wholesales
domestic sportswear products under
Anta Brand and Fila in China
- Revenue contribution: 47% from
footwear, 49% from apparel, 4% from
accessories, c95% of revenue are
generated from wholesaling
Medium: Company can
improve product mix to
mitigate labour cost
growth
- The stock is trading at 18x
CY14e PE and 15x CY15e PE
vs. 3-year average 1-year
forward PE of 13x.
- Based on blended DCF/14x
1-year forward ex-cash PE,
we derive PT of HKD13.5 for
Anta, equivalent to 16.5x 1-
year forward PE
- 11% revenue growth and 15% net
profit decline for 2014e, and 8%
revenue growth and 15% net profit
growth in 2015e (end Dec).
- 20% ROE and -70% gearing (net
cash) for 2014e
1H14 financial
results and 1Q15e
trade fair orders in
Aug14
- E-retailing cannibalizes
traditional channels;
- Competition from
international and local
sportswear brands;
- Growing rental and retail
staff costs.
Li Ning
2331 HK
(Buy)
976 7.5 DCF - Manufactures and wholesales
domestic sportswear products under Li
Ning Brand in China
- Company plans to focus on self-
operated shops and close down
unprofitable franchisee shops in China
- Revenue contribution: 67% from
wholesaling to distributors and
franchisees, 33% from self-operated
shops
Medium: Company can
improve product mix to
mitigate labour cost
growth
- The stock is trading at 2.8x
CY14e PB and 2.4x CY15e PB
vs. 3-year average 1-year
forward PB of 2.7x.
- Based on DCF (WACC
9.7%, terminal growth rate
2%), we derive PT of
HKD7.5, which is equivalent
to 3.7x 14e PB and 3.2x 15e
PB
- 13-14% revenue growth for 2014e-
15e, while Li Ning to deliver a net
profit of RMB192mn in 14e and
RMB525 in 15e vs a loss of
RMB392mn in 13 (end Dec).
- 7% ROE and -7% gearing (net cash)
for 2014e
1H14 financial
results in Aug14
- Failure of new product
sales in lower tier cities;
- Growing rental and retail
staff costs;
- Competition from
international and local
sportswear brands;
- Relationship with
distributors and franchisees
may deteriorate.
Xtep
1368 HK
(Buy)
924 4.5 DCF - Manufactures and wholesales
domestic sportswear products under
Xtep Brand in China
- Revenue contribution: 52% from
footwear, 46% from apparel, 2% from
accessories, c99% of revenue are
generated from wholesaling,
remaining c1% is from self-owned e-
commerce stores
Medium-to-high:
Company may improve
product mix to mitigate
labour cost growth,
however it has less room
to pass through cost hike
due to mass market
positioning
- The stock is trading at 10x
CY14e PE and 9x CY15e PE
vs. 3-year average 1-year
forward PE of 9x.
- Based on DCF (WACC
11.5%, terminal growth rate
2%), we derive PT of
HKD4.5, which is equivalent
to 13x 1-year forward PE.
- 1% revenue drop and 1% net profit
decline for 2014e, but 7% revenue
growth and 7% net profit growth in
2015e (end Dec).
- 13% ROE and -59% gearing (net
cash) for 2014e;
1H14 financial
results and 1Q15e
trade fair orders in
Aug14
- E-retailing cannibalizes
traditional channels;
- Competition from
international and local
sportswear brands;
- Growing rental and retail
staff costs.
Consumer
China Consumer
10 July 2014
page 12 of 78 , Equity Analyst, +852 3743 8036, [email protected] Guo, PhD
Please see important disclosure information on pages 74 - 78 of this report.

Chart 8: Investment Summary of apparel and footwear companies
Source: Jefferies estimates
Coverage and
rating
Market
cap
(USD m)
Price
target
(HKD)
Valuation
methodNature of business Risk to cost hike Valuation Key forecasts Key catalysts Key risks
China Lilang
1234 HK
(Hold)
820 4.6 1-year
forward PE
- Wholesales menswear and lifestyle
products in China
- Revenue contribution: 90% from Lilanz
(menswear brand), 10% from L2
(lifestyle apparel brand)
Medium to high:
Lilang's product ASP is
on a declining trend in
CY14-15e
- The stock is trading at 10x CY14e
PE and 9x CY15e PE, vs 3-year
average forward PE of 13x.
- PT at HKD4.6 is based on 8.5x 1-
year forward PE
- 6% revenue growth and
flattish net profit growth in
14e
- 20% ROE and -41% gearing
(net cash) in 14e
1H14 results and 4Q14
(winter 2014) trade
fair announcement in
Jul-Aug14
- Upside risk: apparel
sector to recover from
2Q14 on better demand.
- Downside risk: retail
inventory may
accumulate as peers
offer serious discounts.
Daphne
210 HK
(Hold)
658 3.2 1-year
forward PE
- Retails mass market footwear products
under brands Daphne and Shoebox,
and retails licensed brands (such as
Aldo and Aee) in department stores.
- Revenue contribution: 93% from core
brands, 6% from licensed brands, 1%
from OEM and other income
High: In CY14-15e,
footwear products' ASP
may decline by 2-3%
while manufacturing
labour and retail staff
cost continue to
increase by 10-15%
- The stock is trading at 10x CY14e
PE and 8x CY15e PE vs 3-year
average forward PE of 18x.
- PT at HKD3.2 is based on 11x 1-
year forward PE
- 2% revenue growth and
59% net profit growth in 14e,
and 4% revenue growth and
16% net profit growth in 15e
(end Dec).
- 10% ROE and -20% gearing
(net cash) in 14e
2Q14 operational
updates in Jul14
- Upside risk: Better than
expected business
performance from 2Q14
onwards.
- Downside risk: Further
cannibalization by e-
commerce.
Trinity
891 HK
(Hold)
425 1.9 1-year
forward PE
- Retails luxuxy menswear brands
- Core brands include Kent & Curwen,
Gieves and Hawkes, Cerruti
- Revenue contribution: China 50%,
HK/Macau 32%, Taiwan 7%, others
(including retailing in Europe and UK)
11%
Low to medium: 10-15%
retail staff cost inflation
may put margin
pressure on Trinity
- The stock is trading at 11x CY14e
PE and 10x CY15e PE vs 3-year
average forward PE of 19x.
- PT at HKD1.9 is based on 11x 1-
year forward PE
- 2% revenue growth but 5%
net profit decline in 14e, and
3% revenue growth and 10%
net profit growth in 15e (end
Dec).
- 8% ROE and -0.3% gearing
(net cash) in 14e
Potential acquisitions
of menswear brands;
1H14 results
announcement in
Aug14
- Upside risk: Loosening
of anti-corruption
measures in China
- Downside risk:
Declining brand equity
of Trinity’s core brands
Belle
1880 HK
(Underperform)
9,533 6.8 1-year
forward PE
- Manufactures and retails mid-high
end footwear products under various
brands (Belle, Teenmix, Staccato, etc);
and distributes and retails international
sportswear (mainly Nike and Adidas)
- Revenue contribution: 61% from
footwear, 39% from sportswear
High: In 14e, footwear
products' ASP may
decline by 1-2% while
manufacturing labour
and retail staff cost
continue to increase by
10-15%
- The stock is trading at 15x CY14e
PE and 15x CY15e PE vs 3-year
average forward PE of 21x.
- PT at HKD6.8 is based on 11.5x 1-
year forward PE
- 6% revenue growth but a
10% net profit drop for FY15e,
and 7% revenue growth and
2% net profit growth in FY16e
(end Feb).
- 14.5% ROE and -32.4%
gearing (net cash) for FY15e
Jun-Aug14 operational
statistics in Sep14,
1HFY15e results
announcement in
Oct14; potential
acquisition of apparel
and footwear brands
Upside risk: SSSG may
rebound, which results
in operating leverage,
and valuation re-rating
Giordano
709 HK
(Underperform)
944 3.9 DCF - Wholesales and retails lifestyle apparel
products
- Revenue contribution: China 30%,
HK/Taiwan 29%, Rest of Asia Pacific
25%, Middle East 11%, Manufacturing
and others: 15%
Medium: manufacturing
cost in China will
continue to increase; it
may face currency risk
as SE Asian currency
may depreciate
- The stock is trading at 15x CY14e
PE and 14.5x CY15e PE vs. 3-year
average forward PE of 15x.
- PT at HKD3.9 is based on DCF,
(9.4% WACC, 2% terminal growth);
equivalent to 12x forward PE.
- 5% revenue drop and 26%
net profit decline in 14e, and
2% revenue growth and 2%
net profit growth in 15e
- 16% ROE and -31% gearing
(net cash) in 14e
1H14 results in Aug14 - Upside risks. Improving
apparel sales in HK, TW,
China and SE Asia; SE
Asian currency
appreciation to create
operating leverage.
Consumer
China Consumer
10 July 2014
page 13 of 78 , Equity Analyst, +852 3743 8036, [email protected] Guo, PhD
Please see important disclosure information on pages 74 - 78 of this report.

Chart 9: Investment Summary of electrical appliances retailers
Source: Jefferies estimates
Coverage
and rating
Market
cap
(USD m)
Price
target
(HKD)
Valuation
methodNature of business
Risk to cost
hikeValuation Key forecasts Key catalysts Key risks
Gome
493 HK
(Buy)
2,845 1.8 DCF - Retails household appliances and
consumer electronic products across
different tiers of cities in China
- Revenue contribution: 91% from
offline channels vs 9% from online
channels in 2014e
Medium to
high, as GPM is
thin for home
appliance and
consumer
electronics
retailing
- The stock is trading at 14x
14e PE and 12x 15e PE vs. 1-
year average forward PE of
13x.
- Based on DCF (13.3%
WACC, 2% terminal growth
rate), we derive PT of
HKD1.8 for Gome,
equivalent to 19x 1- year
forward PE
- 12% revenue growth and 43% net
profit increase for 2014e
- 8% ROE and -31% gearing (net
cash) for 2014e
- 1H14e results
announcement in
Aug14
- additional shares
buyback
Downside risks:
- Slowdown in demand for
electrical appliances
- Cannibalization between
online and offline channel
results in product price cuts
and lower profit margin
- Less than expected cost
saving through the
enhancement of supply chain
Suning
002024 CH
(Hold)
7,785 RMB7.0 DCF - Retail chain stores to sell household
appliances, electronic products,
office equipment, and
communication products across
China.
- Revenue contribution: 80% from
offline channels and services vs 20%
from online channels in 2014e
Medium to
high, as GPM is
thin for home
appliance and
consumer
electronics
retailing
- The stock is trading at 1.8x
CY14e PB and 1.8x CY15e PB
vs. 3-year average forward
PB of 2.2x.
- Based on DCF (13.3%
WACC, 2% terminal growth
rate), we derive PT of
RMB7.0, which is equivalent
to 1.9x 1-year forward PB
- 3% revenue decline in 14e.
Company is expected to turn from
NP RMB372mn in 13 to net loss of
RMB1.2bn on declining GPM and
inflating operating costs.
- -4% ROE and -47% gearing (net
cash) for 2014e;
- 1H14e results
announcement in
Aug14
Downside risks
- further market share loss on e-
retailing
Upside risks:
- strong recovery in the
demand for home appliances
- Cost synergy between online
and offline as revenue resumes
growth in both channels
Consumer
China Consumer
10 July 2014
page 14 of 78 , Equity Analyst, +852 3743 8036, [email protected] Guo, PhD
Please see important disclosure information on pages 74 - 78 of this report.

The era of E-commerce China has become the largest online retail market and its penetration grows at a much
faster pace than other developed economies. We observe the following key features: 1) as
consumers become more sophisticated and counterfeit products become a concern, B2C
format is quickly overriding C2C format; 2) The B2C market is set to undergo
consolidation; thus, building up a successful and sustainable platform requires a wide
range of strategies and strong execution; 3) O2O integration provides better consumer
satisfaction and can be a meaningful competitive advantage for both retailers and E-
tailers; 4) mobile/Wechat-made retail gains stronger momentum from PC-made retail.
China as the largest online retail market According to iResearch, China’s overall e-commerce market is expected to reach RMB4.5
trillion in 2017e. This implies 24.7% 13-17e CAGR, much higher than the 9.8% CAGR
generated by traditional offline retail for the same period of time. However, traditional
retail’s overall market size (RMB21.6trn in 13 to RMB31.4trn in 17e) is/will still be much
bigger than that of online retail. China’s online retail penetration rate reached 6.4% in
2012, surpassing the US market, and is expected to further go up to 12.4% in 2017e.
Chart 10: China retail sales from online and offline
Source: iResearch, Jefferies
Chart 11: Online retail penetration comparison: China vs US
Source: comScore, US Department of Commerce, iResearch, Jefferies
Year Online
retail sales
(RMBbn)
YoY % of total
retail
sales
Offline
retail sales
(RMBbn)
YoY % of total
retail
sales
Total
retail sales
(RMBbn)
YoY
2009 263 105.5% 2.1% 12,271 14.5% 97.9% 12,534 15.5%
2010 461 75.3% 3.0% 14,994 22.2% 97.0% 15,455 23.3%
2011 785 70.2% 4.3% 17,306 15.4% 95.7% 18,091 17.1%
2012 1,320 68.3% 6.4% 19,396 12.1% 93.6% 20,717 14.5%
2013 1,841 39.4% 7.9% 21,597 11.3% 92.1% 23,438 13.1%
2014e 2,420 31.5% 9.1% 24,173 11.9% 90.9% 26,593 13.5%
2015e 3,119 28.9% 10.4% 26,871 11.2% 89.6% 29,990 12.8%
2016e 3,790 21.5% 11.5% 29,167 8.5% 88.5% 32,957 9.9%
2017e 4,450 17.4% 12.4% 31,437 7.8% 87.6% 35,887 8.9%
13-17e CAGR 24.7% 9.8% 11.2%
Consumer
China Consumer
10 July 2014
page 15 of 78 , Equity Analyst, +852 3743 8036, [email protected] Guo, PhD
Please see important disclosure information on pages 74 - 78 of this report.

Massive online shopping pool According to iResearch, the number of internet users in China is expected to increase from
230mn in 12 to 400mn in 16e, at 14.8% CAGR. In contrast, a similar figure in the US will
only increase from 150m in 12 to 175m to 16e, at 4.0% CAGR. Online shoppers’
penetration in China (as a % of total population) is expected to grow from 16.7% in 12 to
28.4% in 16e, while the same figure in US will only grow from 47.2% in 12 to 53.4% in
16e.
Chart 12: Online Shoppers’ comparison: China vs US (mn)
Source: iResearch, United Nations Department of Economics and Social Affairs, Jefferies
Household behaviour According to the China Household Finance Survey (CHFS), online shopping per domestic
household crossed RMB5,200 in 2013; in cities it was RMB5,600 and in rural areas
RMB2,600. This survey was conducted exclusively with Jefferies’ research team. About
20% of households surveyed purchased products online and the E-shopping ratio for
apparel products was as high as 80%. Although there is a large gap between rural and
urban areas, we expect rural areas to catch up in e-commerce with the help of improving
logistics facilities and accelerated urbanization.
We were surprised to see as many as c30% of the people surveyed had shopped online
for daily FMCG products such as toothpaste, tissue paper and shampoo, which are a
significant proportion of supermarkets’ turnover. In Eastern China, the ratio rose as high
as 37%. However, while online shopping for finished F&B goods ranges from single digits
to low teens, that for fruits and vegetables is only in the low single digits.
Chart 13: Domestic household online shopping, 2013
Source: Jefferies, China Household Finance Survey 2013
US China US China US China
2010 140 150 202 456 44.8% 11.0%
2011 143 190 204 469 45.5% 13.9%
2012 150 230 209 505 47.2% 16.7%
2013 156 270 214 542 48.8% 19.5%
2014e 163 310 219 583 50.4% 22.2%
2015e 169 360 223 636 51.9% 25.7%
2016e 175 400 229 687 53.4% 28.4%
12-16e CAGR 4.0% 14.8% 2.3% 8.0% 3.1% 14.2%
Number of e-shoppers Online population Penetration (%)
China
overall
Urban Rural
Per household online spending in 2013 (RMB) 5,237 5,606 2,584
% of household with online shopping
experience in 2013
22.6% 35.1% 6.4%
Footwear, apparel, sportswear 80.2% 80.0% 81.0%
Daily articles (Shampoo, paper, detergent, etc.) 33.1% 34.7% 21.9%
Consumer electronics (incl. 3C) 22.7% 23.6% 16.5%
Books and videos 20.5% 22.1% 9.5%
Home appliances 15.5% 16.6% 7.8%
Mother and baby items 13.0% 13.9% 7.0%
F&B, tobacco 12.5% 13.5% 5.7%
Furniture and cooking utensils 10.3% 11.3% 3.8%
Autos and parts 6.9% 7.3% 3.8%
Fruits and vegetables 1.9% 2.0% 0.7%
Consumer
China Consumer
10 July 2014
page 16 of 78 , Equity Analyst, +852 3743 8036, [email protected] Guo, PhD
Please see important disclosure information on pages 74 - 78 of this report.

Trajectory of E-commerce From C2C (consumer to consumer) to B2C (business to consumer)
As consumers become more sophisticated and counterfeit products become a concern,
the B2C format is quickly overriding the C2C format. Contribution to online retail revenue
from B2C format increased from 7.8% in 2009 to 36.2% in 2013 and this figure is further
expected to reach 52.7% by 17e. In contrast, contribution from C2C will reduce to 47.3%
in 2017e from 63.8% in 2013, as illustrated in the table below.
Chart 14: Online sales from B2C and C2C
Source: iResearch, Jefferies
B2C market consolidation
The B2C market is set to undergo consolidation. Building up a successful and sustainable
platform requires the following criteria, in our view: 1) a rich collection of brands and
large number of SKUs with Tmall (Alibaba) as the best example; 2) strong specialization
in certain products with Suning as the most well-known electrical appliances retailer; 3)
User-friendly websites or and mobile phone apps attracting visiting volume, with Alibaba
and Tencent as the best examples; and 4) integration of rich experience in
logistics/inventory management into online platform. We believe all retailers are making
serious efforts towards this direction but none including Suning, Gome, Alibaba, Tecent,
has made a successful integration. Our study suggests that certain B2C platforms such as
Newegg China (新蛋网), Vincl (凡客诚品), etc. face challenges to keep their market shares.
We expect this industry to consolidate and weaker players will be phased out.
Chart 15: B2C market share breakdown in 2013
Source: i-Research, Jefferies
B2C sales
(RMBbn)
YoY % of total
online
sales
C2C sales
(RMBbn)
YoY % of total
online
sales
Online
retail sales
(RMBbn)
YoY
2009 21 102.9% 7.8% 243 105.7% 92.2% 263 105.5%
2010 63 207.8% 13.7% 398 64.0% 86.3% 461 75.3%
2011 198 214.3% 25.3% 586 47.3% 74.7% 785 70.2%
2012 403 102.9% 30.5% 918 56.6% 69.5% 1,320 68.3%
2013 666 65.5% 36.2% 1,175 28.0% 63.8% 1,841 39.4%
2014e 980 47.1% 40.5% 1,440 22.6% 59.5% 2,420 31.5%
2015e 1,410 43.8% 45.2% 1,709 18.7% 54.8% 3,119 28.9%
2016e 1,880 33.3% 49.6% 1,910 11.8% 50.4% 3,790 21.5%
2017e 2,345 24.8% 52.7% 2,105 10.2% 47.3% 4,450 17.4%
13-17e CAGR 37.0% 15.7% 24.7%
Consumer
China Consumer
10 July 2014
page 17 of 78 , Equity Analyst, +852 3743 8036, [email protected] Guo, PhD
Please see important disclosure information on pages 74 - 78 of this report.

Chart 16: Background of major E-tailers
Source: Company, Jefferies
O2O (offline/online) integration
According to a survey conducted by Bain & Company in 2013, Chinese shoppers prefer
retailers to have both an e-commerce platform and brick-and-mortar retail stores (such as
Suning) over pure platforms with no retail stores (such as Tmall and JD360). The reasons
are as follows: 1) many consumers prefer the ‚touch and feel‛ at a brick-and-mortar store,
in particular for expansive goods. 2) Consumers have concerns about quality issues of
products bought online.
Mobile/Wechat-made retail gains momentum from PC-made retail
With the increasing popularity of smartphones and digital notepads, mobile online
shopping is expected to enjoy a significantly faster growth rate than PC platform.
According to iResearch, mobile-made retail sales reached RMB170bn in 13, which is a
much smaller size than PC-made retail sales at RMB1,671bn. However, mobile-made retail
sales CAGR for 13-17e period could reach 59%, whereas that for PC is much lower at
19.2%. Mobile-made retail sales proportion in total online sales is estimated to rise to
24.2% in 2017e from 9.2% in 2013.
Chart 17: Mobile e-commerce (B2C & C2C) vs PC e-commerce
Source: iResearch, Jefferies
The following part studies the impact of E-commerce on consumer subsectors.
Name Est. Year Major products offering Largest shareholders
Tmall 2008 All products, largest in apparel Softbank: 36.7%, Yahoo: 24%, Jack Ma and partners: 13%
JD360 2007 All products, largest in electronic goods Liu Qiangdong: 20.2%, Tencent: 17.8%, Tiger Funds: 15.6%
Tencent 2006 All products Nasper: 34%, Ma Huateng 10%
Suning 2005 All products, 3rd largest in electronic goods Zhang Jindong: 34%
Amazon China 1999 All products Amazon US: 100%
Dangdang 1999 All products, largest in books Yu Yu & Guoqing Li 82.9%
Gome 2011 All products Wong Kwong Yu: 32.1%, Bain Capital 9.9%
VIP shop 2008 Discount items Eric Shen 16%, Arthur Hong 12.3%, Sequoia 16.8%, US DCM 14.4%
Yihaodian 2008 Supermarket items Walmart: 51%, Gang Yu and Junling Liu: 49%
Vancl 2007 Apparel Chen Nian: 23%
Yixun (by Tencent) 2006 Electronic goods Nasper: 34%, Ma Huateng 10%
Newegg China 2001 All products Newegg US: 100%
M18 1996 Apparel Mecox Lane: 50%, Giosis: 50%
Mobile-
made sales
(RMBbn)
YoY % of total
online
sales
PC/tablets-
made sales
(RMBbn)
YoY % of total
online
sales
Online
retail sales
(RMBbn)
YoY
2011 11 397.6% 1.5% 773 68.5% 98.5% 785 70.2%
2012 63 450.7% 4.8% 1,257 62.6% 95.2% 1,320 68.3%
2013 170 168.5% 9.2% 1,671 32.9% 90.8% 1,841 39.4%
2014e 324 91.2% 13.4% 2,096 25.4% 86.6% 2,420 31.5%
2015e 524 61.6% 16.8% 2,595 23.8% 83.2% 3,119 28.9%
2016e 777 48.3% 20.5% 3,013 16.1% 79.5% 3,790 21.5%
2017e 1,077 38.6% 24.2% 3,373 11.9% 75.8% 4,450 17.4%
13-17e CAGR 58.7% 19.2% 24.7%
Consumer
China Consumer
10 July 2014
page 18 of 78 , Equity Analyst, +852 3743 8036, [email protected] Guo, PhD
Please see important disclosure information on pages 74 - 78 of this report.

The impact of E-commerce Through large-scale data-mining, this study seeks to unveil the business model evolution
of the consumer sector in the face of the E-commerce boom. We find that E-commerce
poses a serious threat to most traditional retailers but benefits certain sectors/brands:
department stores and domestic apparel/footwear get hit most; leading global apparel
brands seem to leverage it to enhance branding recognition; sportswear uses it as an
effective tool for cleaning up inventory; and restaurants and jewellers have held up
relatively well.
Cosmetic Goods Through large-scale data-mining and in-depth study of business models of online and
offline cosmetics retailers, we draw the following conclusions:
Online distribution of cosmetic products is becoming a strong competitive force
to traditional retail channels. Penetration of online sales of cosmetics (out of
total retail sales of cosmetics) increased from 3.8% in 2011 to 6.6% in 2012 and
10.2% in 2013. It is expected to reach 21.9% in 2018e. This will increasingly
pose a challenge to traditional department stores and offline cosmetics retailers
such as Sasa (178 HK, Underperform), Bonjour (653 HK, NC), Colourmix (owned
by Veeko Holdings; 1173 HK, NC), Sephora (owned by LVMH group; MC FP,
NC), and even brands with self-owned stores such as L’Occitaine (973 HK,
Hold), The Body Shop (owned by L’Oreal; OR FP, Hold), etc.
The online distribution channel is not a fatal challenge to high-end department
stores and beauty salons. We found that 76% of items are sold online are priced
below RMB300 and online shoppers are highly price sensitive. For expensive
items, consumers are more sophisticated and prefer trials and even beauty
consultancy in retail stores.
We believe Sasa is less competitive compared with Jumei (JMEI US, NC) and
Vipshop (VIPS US, Buy). The fundamentals and growth potential of Jumei in
particular is likely to outstrip Vipshop and Sasa due to its wide product range
and relatively low pricing that meets the needs of a stable/rising consumer base
with monthly income of RMB5,000-8,000. Vipshop has its niche serving
sophisticated consumers with higher purchasing power. In contrast, Sasa’s
business model is facing a serious challenge: its online channel is much less
competitive than close rivals, and can hardly help to offset headwinds that its
retail stores face: a slowdown in the number of mainland travelers, a weak Hong
Kong retail environment and difficulty in raising ASP.
The following sessions introduce our research methodology and data analysis.
Overview of cosmetics industry Cosmetic products have enjoyed stronger growth than the overall retail market in the past
few years due to further penetration of cosmetic products and product mix upgrade
driven by rising disposable income. The overall retail sales of cosmetic products grew at a
CAGR of 17.5% in 2010-13 to reach RMB221bn in 2013, according to Frost and Sullivan.
It is expected to grow at a CAGR of 14.3% in 2013-18e to reach RMB432bn in 2018e.
Online sales of cosmetic product have been growing rapidly in the past few years, thanks
to the further penetration of internet and fast growing online retailers that provide
attractive prices for cosmetic goods. It is the third largest product category in ecommerce
after apparel and home appliance & consumer electronics, according to iResearch. Online
sales of cosmetics grew from RMB1.7bn in 2010 to RMB22.6bn in 2013, at a CAGR of
137%. Online sales accounted for 10.2% of total retail sales of cosmetics in 2013, up from
6.6% in 2012 and 1.2% in 2010. Frost and Sullivan expects the Online cosmetic market to
Consumer
China Consumer
10 July 2014
page 19 of 78 , Equity Analyst, +852 3743 8036, [email protected] Guo, PhD
Please see important disclosure information on pages 74 - 78 of this report.

grow at a CAGR of 33% in 2013-18e to reach RMB94.6bn in 2018e, and account for
21.9% of the overall cosmetic market in 2018e.
According to research from AC Nielsen on consumers who purchased cosmetics on 11
November 2013 (‚Single’s Day‛ Promotion), 83% of the cosmetic e-shoppers are aged
between 20-39 years old, while unsurprisingly 93% of them are female. In terms of the
income distribution of cosmetic e-shoppers, 53% of them have a monthly salary of
RMB5,000-8,000, 30% have a monthly income exceeding RMB8,000, while the remaining
17% e-shoppers have income lower than RMB5,000 per month.
Chart 18: Overall retail sales of cosmetic products in China
Source: Frost and Sullivan
Chart 19: Online B2C sales of cosmetic products in China
Source: Frost and Sullivan
Chart 20: Penetration of online cosmetic sales
Source: Frost and Sullivan
Chart 21: Income distribution of cosmetic consumers
purchasing on 11November 2013
Source: AC Nielsen
Online cosmetic distribution Methodology
We compiled and analyzed information on prices, discounts, volumes, number of SKUs
and quantity sold from four online cosmetic sales platforms:
Vipshop: online discount outlet
Jumei: specialty cosmetic online retailer
Sasa.com: e-commerce platform of traditional cosmetic retailer, and
Official flagship stores operated by various cosmetic brands in Tmall
We looked at similar brands across different platforms, which helped to provide useful
comparison and analysis on the positioning, characteristics and potential of these
platforms.
Monthly salary % of e-shoppers
RMB5,000-8,000 53%
>RMB8,000 30%
Others 17%
Total 100%
Consumer
China Consumer
10 July 2014
page 20 of 78 , Equity Analyst, +852 3743 8036, [email protected] Guo, PhD
Please see important disclosure information on pages 74 - 78 of this report.

Vipshop
We analyzed the product offerings on Vipshop’s Shanghai regional site. Our analysis of 11
skincare brands shows that Vipshop on average provided 21% discounts on these skincare
products. Its average selling price (ASP) after discount is RMB465, with an average of 51
SKU offerings per brand.
In the analysis of 5 key brands for makeup products, they have an average discount of
21%, similar to that of skincare products. The ASP (after discount) of makeup is RMB238,
with an average of 66 SKUs available per brand.
Vipshop provided a high discount of 33% on average for perfumes on 6 brands surveyed.
Its perfume offerings have an ASP of RMB476 with an average volume of 58ml and 8 SKUs
per brand.
Chart 22: Skincare products on Vipshop
Source: Vipshop, Jefferies
Chart 23: Makeup products on Vipshop
Source: Vipshop, Jefferies
Chart 24: Perfumes on Vipshop
Source: Vipshop, Jefferies
Brand ASP before
discount
(RMB)
ASP after
discount
(RMB)
Average
discount
%
Average
volume
(ml)
# of SKUs
available
Dior 1,485 1,188 -19.9% 90 24
Lancome 1,292 987 -22.1% 89 23
SK II 1,231 902 -24.7% 97 45
Clarins 572 441 -23.5% 90 25
Shu Uemura 454 354 -22.8% 169 43
Biotherm 401 314 -21.6% 106 61
L'Occitane 360 286 -20.9% 142 44
Kiehl's 305 269 -11.7% 137 47
Olay 214 159 -25.0% 72 98
L'Oreal 174 143 -17.6% 85 100
Maybelline 86 69 -19.8% 64 47
Average 598 465 -20.9% 100 51
Brand ASP before
discount (RMB)
ASP after
discount (RMB)
Average
discount %
# of SKUs
available
Dior 520 383 -24.9% 3
Lancome 481 379 -21.2% 8
Shu Uemura 332 255 -22.6% 53
L'Oreal 133 109 -18.0% 68
Maybelline 77 62 -18.9% 196
Average 309 238 -21.1% 66
Brand ASP before
discount
(RMB)
ASP after
discount
(RMB)
Average
discount
%
Average
volume
(ml)
# of SKUs
available
Dior 1,103 855 -22.6% 73 6
Lancome 800 634 -20.7% 51 4
Marc Jacobs 639 386 -38.9% 51 16
Elizabeth Arden 551 240 -56.3% 68 6
L'Occitane 538 438 -18.6% 85 5
Anna Sui 525 306 -41.5% 45 13
Average 693 476 -33.1% 58 8
Consumer
China Consumer
10 July 2014
page 21 of 78 , Equity Analyst, +852 3743 8036, [email protected] Guo, PhD
Please see important disclosure information on pages 74 - 78 of this report.

Jumei
Jumei is the largest specialty online cosmetic retailer in China with market share of 22% in
2012 according to Frost and Sullivan. Jumei provides free delivery for orders of >RMB159
per ticket to attract customers.
Jumei has large product offerings. Among the 17 skincare brands that we analyzed, Jumei
provided an average of 49 SKUs per brand with an average discount of 18%. The ASP after
discount is RMB374.
In term of makeup, the 7 brands we analyzed in Jumei have an average discount of 17%
and ASP of RMB278 after discount. Similar to skincare, Jumei provides a wide variety of
choices with an average of 59 SKUs per brand.
Similar to Vipshop, perfume in Jumei has the largest discount compared with skincare and
makeup at 33% discount. Jumei offers an average of 24 SKUs per brand with ASP of
RMB342 for the 6 brands analyzed.
Chart 25: Skincare products on Jumei
Source: Jumei.com, Jefferies
Chart 26: Makeup products on Jumei
Source: Jumei.com, Jefferies
Brand ASP before
discount
(RMB)
ASP after
discount
(RMB)
Average
discount
%
Average
volume
(ml)
# of SKUs
available
Dior 1,015 857 -15.2% 87 39
SK II 994 669 -32.8% 87 30
Estee lauder 780 639 -18.7% 96 52
Shiseido 776 599 -22.0% 83 52
Lancome 690 547 -23.6% 95 70
Clarins 508 378 -25.8% 71 86
Shu Uemura 494 370 -22.5% 161 22
L'Occitane 434 362 -16.0% 90 28
Jurlique 528 338 -31.2% 95 19
Biotherm 432 329 -24.5% 80 36
Clinique 349 287 -17.2% 107 40
Kiehl's 295 268 -8.6% 129 33
Herborist 佰草集 284 242 -11.2% 109 95
L'Oreal 195 174 -8.8% 82 86
Olay 160 147 -7.1% 80 68
Maybelline 91 82 -10.1% 45 8
Inoherb 相宜本草 87 71 -15.0% 99 72
Average 477 374 -18.3% 93 49
Brand ASP before
discount (RMB)
ASP after
discount (RMB)
Average
discount %
# of SKUs
available
Dior 528 450 -14.0% 30
Estee lauder 502 411 -17.5% 25
Lancome 484 364 -27.1% 30
Shu Uemura 398 301 -22.4% 154
Shiseido 269 196 -25.0% 28
L'Oreal 172 157 -7.8% 44
Maybelline 75 68 -6.5% 104
Average 347 278 -17.2% 59
Consumer
China Consumer
10 July 2014
page 22 of 78 , Equity Analyst, +852 3743 8036, [email protected] Guo, PhD
Please see important disclosure information on pages 74 - 78 of this report.

Chart 27: Perfumes on Jumei
Source: Jumei.com, Jefferies
Sasa.com
Sasa.com is the e-commerce platform for Sasa (178 HK, Underperform) with annual sales
of HKD394m (equivalent to RMB315m) in FY14 (end Mar. 2014). Online sales from China
accounted for c60% of Sasa’s e-commerce sales and c2.7% of group sales in FY14. Sasa
sends the ordered goods from Hong Kong to the customers once an order is placed. It
charges a delivery fee of RMB90 for orders below RMB180, and provides free delivery for
orders >RMB180. Importantly, the customers are responsible for paying the import tariff
of 50% for mailing the cosmetic products from Hong Kong to China. This has put Sasa in
a much less advantaged position.
After considering tariffs, our study shows that most goods sold by Sasa.com become more
expensive than those sold from Sasa retail stores and from other online competitors. The
reason is because Sasa products are posted from its warehouse in Hong Kong whereas
other competitors such as Jumei.com and/or vip.com posted products from mainland
China and thus are not subject to the same level of tariff levy. However, we observe that
many consumers do not pay the tariff voluntarily until their purchased goods are kept at
Customs. Given this, we believe it is a regulatory risk for Sasa.com.
Sasa has an average 46 SKUs per brand for the 14 skincare brands we analyzed. It
provides an average discount of 25.9% (vs. the recommended retail price in China) on
skincare products with ASP (after discount, before tariff) of RMB261. There is no discount
for Maybelline and L’Oreal. However, after accounting for the 50% import tariff which
customers need to pay, the final prices are on average 11.2% above the recommended
retail price.
On makeup products, we analyzed 6 brands and found that Sasa offers an average of 26
SKUs per brand. It has an ASP of RMB180 (before tariff) after an average discount of
21.7%. After accounting for the 50% import tariff, the final prices are on average 17.5%
above the recommended retail price in mainland China.
Perfumes in Sasa.com offer an average discount of 22.2% among the 6 brands analyzed.
Sasa.com offers an average of 14 SKUs for these brands, with an ASP (after discount,
before tariff) of RMB306. After accounting for the 50% import tariff, the final prices are on
average 16.7% above the recommended retail price in mainland China.
Brand ASP before
discount
(RMB)
ASP after
discount
(RMB)
Average
discount
%
Average
volume
(ml)
# of SKUs
available
Dior 725 602 -18.0% 38 27
Lancome 723 563 -22.3% 52 21
Anna Sui 535 298 -43.7% 45 32
Versace 459 293 -35.6% 43 41
Elizabeth Arden 456 160 -64.4% 64 12
L'Occitane 158 134 -15.0% 23 9
Average 509 342 -33.2% 44 24
Consumer
China Consumer
10 July 2014
page 23 of 78 , Equity Analyst, +852 3743 8036, [email protected] Guo, PhD
Please see important disclosure information on pages 74 - 78 of this report.

Chart 28: Skincare products on Sasa.com
Source: Sasa.com, Jefferies
Note: Products from sasa.com are shipped from Hong Kong; customers are responsible for
paying a 50% import tariff, causing online purchases to be more expensive than purchasing
from a retail store in China, unless customers can escape from paying the tariff.
Chart 29: Makeup products on Sasa.com
Source: Sasa.com, Jefferies
Note: refer to the note for Chart 28 on tariff for products purchased from sasa.com
Chart 30: Perfumes on Sasa.com
Source: Sasa.com, Jefferies
Note: refer to the note for Chart 28 on tariff for products purchased from sasa.com
Brand Average
recommended
retail price
(RMB)
ASP after
discount
(RMB)
Average
discount
%
Average
price after
import tariff
(RMB)
After tariff
price vs.
recommended
retail price
# of SKUs
available
SK II 866 508 -40.7% 761 -11.0% 50
Estee lauder 732 500 -33.2% 751 0.3% 73
Lancome 664 398 -40.2% 598 -10.3% 114
Shu Uemura 540 335 -37.0% 503 -5.5% 12
Dior 447 333 -25.8% 500 11.3% 61
Clarins 386 277 -28.9% 416 6.7% 7
Shiseido 375 262 -26.6% 392 10.2% 123
Herborist 佰草集 299 259 -13.4% 389 29.9% 11
Biotherm 356 228 -35.2% 342 -2.9% 37
Kiehl's 217 166 -23.9% 248 14.1% 24
L'Oreal 140 140 0.0% 211 50.0% 49
L'Occitane 179 125 -28.9% 188 6.6% 14
Olay 127 91 -28.8% 136 6.9% 53
Maybelline 32 32 0.0% 49 50.0% 10
Average 383 261 -25.9% 392 11.2% 46
Brand Average
recommended
retail price
(RMB)
ASP after
discount
(RMB)
Average
discount
%
Average
price after
import tariff
(RMB)
After tariff
price vs.
recommended
retail price
# of SKUs
available
Lancome 410 238 -42.0% 357 -12.9% 34
Dior 364 268 -21.6% 401 17.6% 26
Shu Uemura 344 218 -31.5% 327 2.7% 15
Estee lauder 310 192 -33.8% 289 -0.6% 9
L'Oreal 92 90 -1.1% 135 48.3% 32
Maybelline 74 74 -0.1% 111 49.9% 38
Average 266 180 -21.7% 270 17.5% 26
Brand Average
recommended
retail price
(RMB)
ASP after
discount
(RMB)
Average
discount
%
Average
price after
import tariff
(RMB)
After tariff
price vs.
recommended
retail price
# of SKUs
available
Dior 675 513 -23.2% 769 15.2% 23
Lancome 478 303 -31.0% 455 3.6% 16
Marc Jacobs 471 328 -24.7% 491 12.9% 9
Anna Sui 341 257 -19.1% 385 21.4% 11
Versace 283 218 -16.1% 326 25.9% 14
Elizabeth Arden 270 216 -19.0% 324 21.5% 11
Average 420 306 -22.2% 431 16.7% 14
Consumer
China Consumer
10 July 2014
page 24 of 78 , Equity Analyst, +852 3743 8036, [email protected] Guo, PhD
Please see important disclosure information on pages 74 - 78 of this report.

Tmall
Tmall is a B2C platform operated by Alibaba. We analyzed the sales, price and discount
data from the official flagship stores operated by 15 brands (Charts 31-32).
These brands on average generated daily sales of RMB2.2m with an ASP of RMB306. They
offer an average of 98 SKUs and sold an average of 5,775 pieces of goods per SKU in the
29 days that we analyzed.
We generally do not see much discounts being offered from these brands in their official
Tmall flagship stores. Also worth noting is that the monthly revenue of Inoherb (相宜本草
), a domestic brand focused on herb-based skincare products, is close to the annual sales
of Sasa.com (equivalent to RMB315m in FY14E, including online sales to Australia, US,
Canada customers).
We also analyze the price range distribution of goods sold by these brands, and found
that products priced at <RMB100 accounted for 35.7% of the sales, while those priced at
RMB100-200 accounted for 30% of sales (refer to Chart 32). In general our analysis shows
that online transactions for cosmetic products is mainly focused on the lower priced
items, while consumers prefer to purchase in store for higher priced items after
experimenting with the products and consulting sales.
Chart 31: Analysis of cosmetic products on Tmall – by brands
Source: Tmall, Jefferies
Note: Estee Lauder just opened its official flagship store in Tmall on 23 May 2014.
Brand Total # of
product sold
# of SKUs Avg # of product
sold per SKU
Total MTD
revenue (RMB)
ASP
(RMB)
Avg daily
sales (RMB)
1 Inoherb 相宜本草 5,256,063 108 48,667 308,825,297 59 10,649,148
2 L'Oreal 1,363,728 216 6,314 172,253,554 126 5,939,778
3 Olay 676,281 264 2,562 144,711,514 214 4,990,052
4 Maybelline 1,470,528 77 19,098 98,021,848 67 3,380,064
5 Herborist 佰草集 289,722 87 3,330 80,012,400 276 2,759,048
6 Clinique 119,426 128 933 38,967,215 326 1,343,697
7 SK II 31,930 62 515 25,034,300 784 863,252
8 Estee lauder 11,105 89 125 6,068,045 546 866,864
9 Yue Sai 73,457 70 1,049 21,714,356 296 748,771
10 My Beauty Dairy 我的美丽日志 209,084 69 3,030 21,300,033 102 734,484
11 Clarins 21,721 71 306 11,052,020 509 381,104
12 Elizabeth Arden 20,930 42 498 4,440,521 212 153,121
13 Jurlique 7,767 68 114 3,280,391 422 113,117
14 Biotherm 4,374 71 62 1,499,780 343 51,717
15 Anna Sui 1,415 48 29 445,712 315 15,369
Average 637,169 98 5,775 62,508,466 306 2,199,306
Consumer
China Consumer
10 July 2014
page 25 of 78 , Equity Analyst, +852 3743 8036, [email protected] Guo, PhD
Please see important disclosure information on pages 74 - 78 of this report.

Chart 32: Analysis of cosmetic products on Tmall – by price range
Source: Tmall, Jefferies
Learning from comparison
From the above mentioned comparison of key online cosmetic retailers, we generate the
following findings:
1) Jumei and Vipshop are more attractive to price-sensitive online shoppers since they
offer much better discounts than rivals such as Sasa.com (after tariff basis). Vipshop and
Jumei both have an average discount of 33% for perfume, while that for Sasa.com is only
22% before tariff (16.7% higher than original prices including tariff). For skincare and
makeup products, discounts from Jumei and Vipshop are 17-21%; whereas that for
Sasa.com is 22-26% before tariff (11-18% higher than original prices after tariff).
2) Jumei and Vipshop offer more products categories than Sasa.com. Jumei and Vipshop
offer an average of 49-51 skincare products per brand, vs. 46 for Sasa.com; Jumei offers
59 makeup products; Vipshop offers 66 but Sasa only offers 26. A similar trend applies to
perfume products as well.
3) Vipshop has the highest ASP for skincare and perfume; Jumei’s makeup products are
the highest. In contrast, Sasa.com has the lowest price for almost all products, which
partly is caused by a larger proportion of small sized products designed for trial.
4) Sasa.com could face regulatory risks since some customers tend to escape from
paying tariffs.
Price range # of
SKUs
Quantity
sold
% of total
volume
Sales (RMB
'000)
% of total
sales
Avg quantity
sold per SKU
0-100 364 6,807,901 71.2% 334,669 35.7% 18,703
100-200 294 1,895,029 19.8% 282,616 30.1% 6,446
200-300 239 407,641 4.3% 97,832 10.4% 1,706
300-400 194 209,867 2.2% 73,765 7.9% 1,082
400-500 100 72,867 0.8% 32,056 3.4% 729
500-600 88 49,960 0.5% 27,216 2.9% 568
600-700 53 55,049 0.6% 35,869 3.8% 1,039
700-800 43 27,923 0.3% 20,754 2.2% 649
800-900 22 10,328 0.1% 8,976 1.0% 469
900-1000 18 6,303 0.1% 6,045 0.6% 350
1000-1100 21 7,722 0.1% 8,172 0.9% 368
1100-1200 5 801 0.0% 916 0.1% 160
1200-1300 11 3,937 0.0% 4,910 0.5% 358
1300-1400 3 510 0.0% 670 0.1% 170
1400-1500 0 0 0.0% 0 0.0%
1500-1600 3 355 0.0% 540 0.1% 118
1600-1700 0 0 0.0% 0 0.0%
1700-1800 1 226 0.0% 403 0.0% 226
1800-1900 1 650 0.0% 1,170 0.1% 650
1900-2000 0 0 0.0% 0 0.0%
2000-2100 0 0 0.0% 0 0.0%
2100-2200 1 14 0.0% 30 0.0% 14
2200-2300 2 441 0.0% 1,000 0.1% 221
2300-2400 0 0 0.0% 0 0.0%
2400-2500 0 0 0.0% 0 0.0%
2500-2600 1 1 0.0% 3 0.0% 1
2600-2700 0 0 0.0% 0 0.0%
2700-2800 1 6 0.0% 17 0.0% 6
2800-2900 0 0 0.0% 0 0.0%
2900-3000 0 0 0.0% 0 0.0%
Total 1,465 9,557,531 100.0% 937,627 100.0% 6,524
Consumer
China Consumer
10 July 2014
page 26 of 78 , Equity Analyst, +852 3743 8036, [email protected] Guo, PhD
Please see important disclosure information on pages 74 - 78 of this report.

Chart 33: Comparison of Sasa.com, Jumei and Vipshop - skincare products
Source: Sasa.com, Jumei, Vipshop, Jefferies
Note: Products from sasa.com are shipped from Hong Kong; customers are responsible for paying a 50% import tariff, causing online
purchases to be even more expensive than purchasing from retail stores in China, unless customers escape from paying tariffs.
Chart 34: Comparison of Sasa.com, Jumei and Vipshop - makeup products
Source: Sasa.com, Jumei, Vipshop, Jefferies
Note: refer to the note for Chart 33 on tariff for products purchased from sasa.com
Chart 35: Comparison of Sasa.com, Jumei and Vipshop - perfumes
Source: Sasa.com, Jumei, Vipshop, Jefferies
Note: refer to the note for Chart 33 on tariff for products purchased from sasa.com
Conclusions and stock implications Online distribution of cosmetic products is becoming a strong competitive
force to traditional retail channels. Penetration of online sales of cosmetics (out of
total retail sales of cosmetics) increased from 3.8% in 2011 to 6.6% in 2012 and 10.2% in
2013. It is expected to reach 21.9% in 2018e. This will increasingly pose a challenge to
traditional department stores and offline cosmetics retailers such as Sasa (178 HK,
Underperform), Bonjour (653 HK, NC), Colourmix (owned by Veeko Holdings; 1173 HK,
NC), Sephora (owned by LVMH group; MC FP, NC), and even brands with self-owned
stores such as L’Occitaine (973 HK, Hold), Body Shop (owned by L’Oreal; OR FP, Hold),
etc.
The online distribution channel is not a fatal challenge to high-end
department stores and beauty salons. We found that 76% of items sold online are
priced below RMB300 and online shoppers are highly price sensitive. For expensive items,
consumers are more sophisticated and prefer trials and even beauty consultancy in retail
stores.
No. of
brands
ASP before
discount
(RMB)
ASP after
discount
(RMB)
Average
discount
(%)
ASP after
tariff
(RMB)
After tariff
price vs.
original price
Average #
of SKUs
per brand
Average
volume
(ml)
Sasa.com 14 383 261 -25.9% 392 11.2% 46 -
Jumei 17 477 374 -18.3% 374 -18.3% 49 93
Vipshop 11 598 465 -20.9% 465 -20.9% 51 100
No. of
brands
ASP before
discount
(RMB)
ASP after
discount
(RMB)
Average
discount
(%)
ASP after
tariff
(RMB)
After tariff
price vs.
original price
Average #
of SKUs
per brand
Sasa.com 6 266 180 -21.7% 270 17.5% 26
Jumei 7 347 278 -17.2% 278 -17.2% 59
Vipshop 5 309 238 -21.1% 238 -21.1% 66
No. of
brands
ASP before
discount
(RMB)
ASP after
discount
(RMB)
Average
discount
(%)
ASP after
tariff
(RMB)
After tariff
price vs.
original price
Average #
of SKUs
per brand
Average
volume
(ml)
Sasa.com 6 420 306 -22.2% 431 16.7% 14 -
Jumei 6 509 342 -33.2% 342 -33.2% 24 44
Vipshop 6 693 476 -33.1% 476 -33.1% 8 58
Consumer
China Consumer
10 July 2014
page 27 of 78 , Equity Analyst, +852 3743 8036, [email protected] Guo, PhD
Please see important disclosure information on pages 74 - 78 of this report.

We believe Sasa is less competitive compared with Jumei and Vipshop. The
fundamentals and growth potential of Jumei in particular are likely to outstrip Vipshop
and Sasa due to its wide products range and relatively low pricing that meets the needs of
a stable/rising consumer base with monthly income of RMB5,000-8,000. Vipshop has its
niche serving sophisticated consumers with higher purchasing power. In contrast, Sasa’s
business model is facing a serious challenge: its online channel is much less competitive
than close rivals’; and can hardly help to offset headwinds that its retail stores face: a
slowdown in the number of mainland travelers, a weak Hong Kong retail environment
and difficulty in raising ASP.
Consumer
China Consumer
10 July 2014
page 28 of 78 , Equity Analyst, +852 3743 8036, [email protected] Guo, PhD
Please see important disclosure information on pages 74 - 78 of this report.

Restaurants Through large-scale data-mining and in-depth study of E-commerce business models, we
draw the following conclusions:
We believe online group-purchasing moderately stimulates traffic of
conventional restaurants, in particular those with mass market positioning. It
does not pose a challenge to overall margins of participating restaurants due to
its small portion of sales contribution (0.7% in 2013), albeit with heavy
discounts for those items.
Online offerings are smartly used by restaurants, in particular those newly
opened, as an effective marketing tool to enhance brand awareness. It is also
used to encourage visits in non-peak hours and to specific locations. (74% and
90% of the deals on Dianping and Meituan, respectively, are restricted to certain
hours or locations).
We believe the online channel is not an effective tool for mainstream chain
stores such as KFC (owned by YUM! Brands YUM US, Hold), McDonald’s (MCD
US, Hold), Ajisen (538 HK, NC), Starbucks (SBUX US, Buy), Café De Coral (341
HK, NC), Tsui Wah (1314 HK, NC), and Fairwood (52 HK, NC). This is because 1)
they already have a wide range of retail store coverage while online consumers
are more inclined to try new restaurants/cuisine types; 2) they already have
strong brand awareness.
Overview of Restaurant industry In the past 10 years restaurants have enjoyed double-digit growth due to the income and
expenditure increase per capita in China. However, the growth has slowed down from
24.7% in 2008 to 9.0% in 2013. Especially for high-end restaurants, revenue has actually
declined 1.8% in 2013 vs. 12.9% growth in 2012, partially impacted by the anti-
corruption campaign.
Online promotion of restaurant dining is developing very rapidly. Websites offering e-
coupon/membership, online reservations and group purchasing quickly gain popularity
due to attractive prices and convenience.
In 2013, the total number of online reservation orders increased to 1.2m in Dianping (大
众点评), 30 times of that in 2012. For group purchasing, its gross merchandising volume
(GMV) on restaurants has increased 98% to RMB19bn (0.7% of total restaurant revenue).
By far group-purchasing is the most attractive online format for consumers to enjoy large
discounts. Service providers are in favor of this commission-based (10-15% of transaction)
business model. High-end restaurants increasingly offer group-purchasing packages in the
face of macro-headwinds. The total number of participating restaurants has tripled in
2013 in major cities like Beijing and Shanghai according to the latest data released by
Dianping.com.
Consumer
China Consumer
10 July 2014
page 29 of 78 , Equity Analyst, +852 3743 8036, [email protected] Guo, PhD
Please see important disclosure information on pages 74 - 78 of this report.

Chart 36: Restaurant revenue growth in China
Source: NBS
Online group-purchasing Methodology
We compiled and analyzed information on prices, discounts, number of listed items and
volume sold from two major online group-purchasing platforms:
Dianping ( 大众点评 ): e-commerce platform that specializes in providing
comments and group-purchasing deals for restaurants. It has c25% of market
share according to Tuan800 statistics.
Meituan (美团): largest online group-purchasing platform in China.
We looked at the similar type of restaurants and price range across different platforms to
study core characteristics of online distribution of restaurants.
Dianping
Our samples are group-purchasing deals on Beijing regional site. There are a total of
6,489 items listed on the site and the overall discount is 39% with ASP of RMB86 per
ticket. Out of the total 4.2m deals sold, 86% had a ticket size of < RMB120 and only 1.5%
came from a ticket size of ASP > RMB300.
The top 3 most popular types of restaurants are spicy cuisine, hotpot and buffet. They
have 2,384 items listed with an average discount of 37% and ASP of RMB92. Their
combined revenue is RMB160mn, 44% of total sales. The most expensive food type is
Seafood with ASP of RMB249, three times more expensive than the above mentioned
average but only contributes 1% of total volume and 3% of total sales.
Chart 37: Group-purchasing sales by price range in Dianping.com
Source: Dianping.com, Jefferies
Price range
(RMB)
Quantity
sold
% of quantity
sold
Sales
(RMB '000)
% of
sales
Average
discount
0-20 487,297 11.5% 6,856 1.9% 44.3%
20-50 668,293 15.8% 27,022 7.5% 30.9%
50-80 1,187,513 28.0% 84,966 23.4% 36.5%
80-120 1,309,501 30.9% 114,007 31.4% 38.2%
120-300 516,663 12.2% 92,477 25.5% 42.2%
300+ 65,050 1.5% 37,257 10.3% 45.6%
Total 4,234,317 100% 362,585 100% 39.5%
Consumer
China Consumer
10 July 2014
page 30 of 78 , Equity Analyst, +852 3743 8036, [email protected] Guo, PhD
Please see important disclosure information on pages 74 - 78 of this report.

Chart 38: Group-purchasing sales by food type in Dianping.com
Source: Dianping.com, Jefferies
Meituan
Our samples are taken from Beijing, Shanghai and Guangzhou regional sites. There are
30,327 items in total listed on the site and the overall discount is 41% with ASP of RMB88
per ticket. Out of the total 2.9m deals sold, 81% had a ticket size of less than RMB120 and
only 2% came from deals with ASP of more than RMB300.
The top 3 most popular types of restaurants are hotpot, buffet and Guangdong cuisine.
They have 9434 items listed with an average discount of 39% and after-discount ASP of
RMB94. Their combined revenue is RMB120mn contributing 47% of total sales. The most
expensive food type is Jiangzhe cuisine with ASP of RMB308, 2.5 times of the above
mentioned average but only contributes 2% of total volume and 8% of total sales.
Chart 39: Group-purchasing sales by price range in Meituan.com
Source: Meituan.com, Jefferies
Food type Number
of items
Quantity
sold
% of
total
ASP
(RMB)
Sales
(RMB'000)
% of total
sales
Average
discount
Spicy Cuisine 1,094 534,029 12.6% 102 54,605 15.1% 42.6%
Hot Pot 987 645,644 15.2% 82 53,038 14.6% 38.1%
Buffet 303 567,539 13.4% 93 52,637 14.5% 30.4%
Korean/Japanese 555 524,087 12.4% 100 52,347 14.4% 36.6%
Beijing Cuisine 597 447,352 10.6% 94 42,052 11.6% 39.4%
Jiangzhe Cuisine 187 233,950 5.5% 110 25,809 7.1% 44.3%
Special dishes(小吃) 672 407,724 9.6% 45 18,328 5.1% 29.7%
BBQ 321 174,137 4.1% 104 18,086 5.0% 36.5%
Western food 291 230,455 5.4% 58 13,324 3.7% 39.2%
Guangdong Cuisine 289 131,465 3.1% 101 13,247 3.7% 45.7%
Seafood 219 37,341 0.9% 249 9,290 2.6% 49.8%
Bakery 672 280,150 6.6% 30 8,342 2.3% 45.8%
Café 302 20,444 0.5% 72 1,481 0.4% 42.7%
Total 6,489 4,234,317 100% 86 362,585 100% 39.5%
Price range
(RMB)
Quantity
sold
% of quantity
sold
Sales
(RMB '000)
% of
sales
Average
discount
0-20 449,048 15.4% 6,378 2.5% 40.1%
20-50 660,069 22.6% 25,460 10.0% 38.1%
50-80 756,129 25.9% 48,944 19.2% 39.1%
80-120 506,277 17.4% 47,284 18.5% 41.8%
120-300 474,739 16.3% 82,920 32.5% 43.4%
300+ 68,602 2.4% 44,193 17.3% 43.8%
Total 2,914,864 100% 255,178 100% 41.0%
Consumer
China Consumer
10 July 2014
page 31 of 78 , Equity Analyst, +852 3743 8036, [email protected] Guo, PhD
Please see important disclosure information on pages 74 - 78 of this report.

Chart 40: Group-purchasing sales by food type in Meituan.com
Source: Meituan.com, Jefferies
Learning from comparison
1) Discounts are the key attraction for online purchasing. Deals on both websites offer
attractive discounts of c40% and expensive items (e.g. ASP>RMB300) enjoy deeper
discounts.
2) Cheaper items take the lead. Both data sets show that 81-86% of volume are coming
from items with ASP<RMB120 while high-end items with ASP>RMB300) are only
generating 1.5% and 2.1% of total volume.
3) Buffet and hotpot are the most popular cuisine categories. We believe this is because
of low restriction on food choices specified on the coupon compared to other cuisine
categories requesting specific menus items.
Chart 41: Discount levels on both websites
Source: Dianping.com, Meituan.com, Jefferies
Food type Number
of items
Quantity
sold
% of
total
ASP
(RMB)
Sales
(RMB'000)
% of total
sales
Average
discount
Buffet 1,611 664,400 22.8% 69 45,835 18.0% 33.2%
Guangdong Cuisine 3,305 300,101 10.3% 113 33,828 13.3% 42.8%
Korean/Japanese 2,671 343,180 11.8% 95 32,438 12.7% 42.9%
Hot Pot 3,753 405,252 13.9% 101 40,907 16.0% 40.3%
Jiangzhe Cuisine 2,562 68,856 2.4% 308 21,189 8.3% 44.2%
Western food 2,092 176,526 6.1% 85 15,054 5.9% 45.9%
Bakery 2,085 204,726 7.0% 88 18,076 7.1% 42.7%
Spicy Cuisine 2,731 152,249 5.2% 144 21,904 8.6% 38.2%
BBQ 1,348 148,020 5.1% 57 8,412 3.3% 35.2%
Special dishes(小吃) 4,751 361,146 12.4% 20 7,083 2.8% 38.2%
Seafood 769 24,232 0.8% 186 4,505 1.8% 39.6%
Beijing Cuisine 636 25,537 0.9% 159 4,055 1.6% 41.9%
Café 2,013 40,639 1.4% 47 1,892 0.7% 46.8%
Total 30,327 2,914,864 100% 88 255,178 100% 41.0%
Price range
(RMB)
Dianping
average discount
Meituan
average discount
0-20 44.3% 40.1%
20-50 30.9% 38.1%
50-80 36.5% 39.1%
80-120 38.2% 41.8%
120-300 42.2% 43.4%
300+ 45.6% 43.8%
Total 39.5% 41.0%
Consumer
China Consumer
10 July 2014
page 32 of 78 , Equity Analyst, +852 3743 8036, [email protected] Guo, PhD
Please see important disclosure information on pages 74 - 78 of this report.

Chart 42: Distribution of quantity sold on both websites
Source: Dianping.com, Meituan.com, Jefferies
Conclusions and stock implications We believe online group-purchasing moderately stimulates traffic of
conventional restaurants, in particular those with mass market positioning. It
does not pose a challenge to overall margins of participating restaurants due to its small
portion of sales contribution (0.7% in 2013), albeit with heavy discounts for those items.
Online offerings are smartly used by restaurants, in particular those newly
opened, as an effective marketing tool to enhance brand awareness. It is also
used to encourage visits in non-peak hours and to specific locations (74% and 90% of the
deals on Dianping and Meituan, respectively, are restricted to certain hours or locations).
We believe the online channel is not an effective tool for mainstream chain
stores such as KFC (owned by YUM! Brands YUM US, Hold), McDonald’s (MCD US,
Hold), Ajisen (538 HK, NC), Starbucks (SBUX US, Buy), Café De Coral (341 HK, NC), Tsui
Wah (1314 HK, NC), and Fairwood (52 HK, NC). This is because 1) they already have a
wide range of retail store coverage while online consumers are more inclined to try new
restaurants/cuisine types; 2) they already have strong brand awareness.
Price range
(RMB)
Dianping
% of quantity sold
Meituan
% of quantity sold
0-20 11.5% 15.4%
20-50 15.8% 22.6%
50-80 28.0% 25.9%
80-120 30.9% 17.4%
120-300 12.2% 16.3%
300+ 1.5% 2.4%
Total 100% 100%
Consumer
China Consumer
10 July 2014
page 33 of 78 , Equity Analyst, +852 3743 8036, [email protected] Guo, PhD
Please see important disclosure information on pages 74 - 78 of this report.

Jewellery Through large-scale data-mining and in-depth study of business models of online and
offline jewelry retailers, we draw the following conclusions:
Fast growing sales from B2C e-commerce, yet penetration is low. Penetration of
e-commerce sales in jewellery in China is as low as c1-2% of total jewelry sales.
Gold products sold better than gem-set jewellery. The sales contribution from
gold for CTF, CSS and Luk Fook is at 83%, 85% and 81%, respectively. This is
higher than traditional store formats at 60-70%. We believe it’s due to the
homogeneity of gold products vs gem-set jewellery. Also, gold products sold on
line are at lower ASPs vs gem-set jewellery.
Online retail generates higher margins. The EBIT margin from online sold
products is higher than those sold offline. This phenomenon is different from the
apparel, footwear and sportswear brands, mainly because jewellery brands are
reluctant to offer significant price discounts for an identical product sold online,
while offline stores have to bear heavy fixed costs.
Online channels could help to boost brand awareness. We also checked on
customers’ comments on Tmall and noticed that both CTF and CSS received
positive comments from online shoppers. Both companies have built up
respective online consumer service teams and recognize the positive impact on
offline sales from online sales. CTF is even operating its first experimental store
in Wuhan to enhance customers’ O2O shopping experience.
Prefer business model of self-operated stores. Brands with self-operated stores
tend to leverage online channels to enhance its branding image to enhance
both online and offline sales. In contrast, brands adopting the franchisee model
are conservative in online expansion as they try to protect licensees from
potential cannibalization of online sales.
Prefer CTF (1929 HK, Buy, PT HKD13) and CSS (116 HK, Hold, PT HKD21.3) to
Luk Fook (590 HK, Hold, PT HKD23.1). We believe Chow Tai Fook (CTF, 1929
HK, Buy) and Chow Sang Sang (CSS, 116 HK, Hold) are well-positioned for
online expansion due to their business model of self-operated stores. According
to CTF, e-commerce retail sales rose 91% YoY in FY14 (end Mar) while the
company had an overall 122,000 online visitors in FY14 (+51% YoY). Luk Fook
(590 HK, Hold) is conservative on online expansion in order to protect
franchisees’ business.
The following sessions introduce our research methodology and data analysis.
Overview of Jewelry Industry Jewellery retail sales growth in China had significantly outpaced the overall retail market
during 2008-13, thanks to consumer and investment demand for gold, and the rise of the
middle class who has strong interest in mass-end gold and gem-set jewellery products.
The anti-corruption campaign in China affected the demand for high-end gem-set
jewellery items but had minimal effect on mass-end gem-set jewellery and gold products.
China retail sales of gold, silver and jewellery grew at CAGR of 35.9% during 2008-13 to
reach RMB295bn in 2013, according to NBS, as compared to overall retail sales which
demonstrated a 16.7% 2008-13 CAGR. We expect China jewellery sales to demonstrate
0% growth in 2014 and 15% growth in 2015.
The impact of e-commerce on the jewellery sector, in terms of channel cannibalization, is
significantly lower than apparel and consumer electronics retailing. Online penetration of
jewellery in China only reached c1-2% in 2013 vs apparel at 25%. According to a survey
conducted by CNNIC, only 6.7% of Chinese consumers purchased jewellery products in
2012. The popularity is significantly lower than apparel at 81.8% and consumer
electronics at 29.6%. We believe this is mainly due to 1) jewellery products’
Consumer
China Consumer
10 July 2014
page 34 of 78 , Equity Analyst, +852 3743 8036, [email protected] Guo, PhD
Please see important disclosure information on pages 74 - 78 of this report.
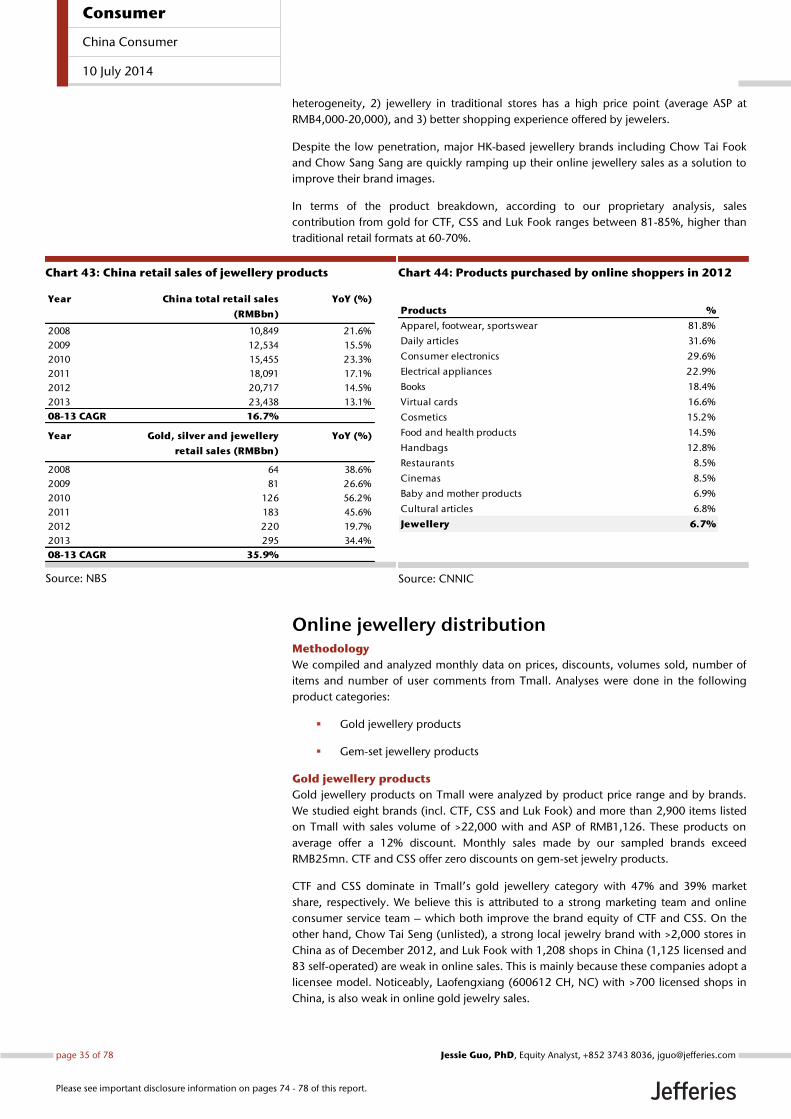
heterogeneity, 2) jewellery in traditional stores has a high price point (average ASP at
RMB4,000-20,000), and 3) better shopping experience offered by jewelers.
Despite the low penetration, major HK-based jewellery brands including Chow Tai Fook
and Chow Sang Sang are quickly ramping up their online jewellery sales as a solution to
improve their brand images.
In terms of the product breakdown, according to our proprietary analysis, sales
contribution from gold for CTF, CSS and Luk Fook ranges between 81-85%, higher than
traditional retail formats at 60-70%.
Chart 43: China retail sales of jewellery products
Source: NBS
Chart 44: Products purchased by online shoppers in 2012
Source: CNNIC
Online jewellery distribution Methodology
We compiled and analyzed monthly data on prices, discounts, volumes sold, number of
items and number of user comments from Tmall. Analyses were done in the following
product categories:
Gold jewellery products
Gem-set jewellery products
Gold jewellery products
Gold jewellery products on Tmall were analyzed by product price range and by brands.
We studied eight brands (incl. CTF, CSS and Luk Fook) and more than 2,900 items listed
on Tmall with sales volume of >22,000 with and ASP of RMB1,126. These products on
average offer a 12% discount. Monthly sales made by our sampled brands exceed
RMB25mn. CTF and CSS offer zero discounts on gem-set jewelry products.
CTF and CSS dominate in Tmall’s gold jewellery category with 47% and 39% market
share, respectively. We believe this is attributed to a strong marketing team and online
consumer service team – which both improve the brand equity of CTF and CSS. On the
other hand, Chow Tai Seng (unlisted), a strong local jewelry brand with >2,000 stores in
China as of December 2012, and Luk Fook with 1,208 shops in China (1,125 licensed and
83 self-operated) are weak in online sales. This is mainly because these companies adopt a
licensee model. Noticeably, Laofengxiang (600612 CH, NC) with >700 licensed shops in
China, is also weak in online gold jewelry sales.
Year China total retail sales
(RMBbn)
YoY (%)
2008 10,849 21.6%
2009 12,534 15.5%
2010 15,455 23.3%
2011 18,091 17.1%
2012 20,717 14.5%
2013 23,438 13.1%
08-13 CAGR 16.7%
Year Gold, silver and jewellery
retail sales (RMBbn)
YoY (%)
2008 64 38.6%
2009 81 26.6%
2010 126 56.2%
2011 183 45.6%
2012 220 19.7%
2013 295 34.4%
08-13 CAGR 35.9%
Products %
Apparel, footwear, sportswear 81.8%
Daily articles 31.6%
Consumer electronics 29.6%
Electrical appliances 22.9%
Books 18.4%
Virtual cards 16.6%
Cosmetics 15.2%
Food and health products 14.5%
Handbags 12.8%
Restaurants 8.5%
Cinemas 8.5%
Baby and mother products 6.9%
Cultural articles 6.8%
Jewellery 6.7%
Consumer
China Consumer
10 July 2014
page 35 of 78 , Equity Analyst, +852 3743 8036, [email protected] Guo, PhD
Please see important disclosure information on pages 74 - 78 of this report.

The ASP of CTF, CSS and Luk Fook's gold jewellery sold through online channels is about
RMB1,126, far below that sold in retail stores which is priced between RMB3,000-3,500.
Out of all products sold online, 72% of volume sold is mass-end jewelry with ASP of
RMB500-1,500 and they contributed to 58% of monthly sales revenue and invited much
more consumers comments than other cheaper or more expansive categories.
Chart 45: Analysis on monthly gold jewellery sales from Tmall – by brands
Source: Tmall, Jefferies. Sales samples are based on flagship stores in Tmall.
Chart 46: Analysis on monthly gold jewellery sales from Tmall – by price range
Source: Tmall, Jefferies. Sales samples are based on flagship stores in Tmall
BrandsNumber of
itemsVolume ASP (RMB)
Sales
(RMB'000)
% of sales
contribution
% of
discount
items
Average
discount
# of user
comments
Avg volume
sold per
item
# of
comments
per item
Chow Tai Fook 1,107 11,586 1,016 11,774 47.0% 0.0% 0.0% 52,734 10.5 47.6
Chow Sang Sang 568 8,109 1,201 9,742 38.9% 0.0% 0.0% 25,752 14.3 45.3
Luk Fook 343 822 668 549 2.2% 96.8% 9.2% 3,582 2.4 10.4
Laofengxiang 7 11 1,015 11 0.0% 100.0% 19.2% 25 1.6 3.6
China Gold 225 310 3,131 971 3.9% 0.0% 0.0% 1,478 1.4 6.6
Chow Tai Seng (周大生) 98 149 697 104 0.4% 0.0% 0.0% 402 1.5 4.1
Laomiao (老庙黄金) 267 140 1,288 180 0.7% 59.9% 11.3% 589 0.5 2.2
CHJ (潮宏基) 310 1,127 1,541 1,736 6.9% 44.8% 17.3% 5,485 3.6 17.7
Total 2,925 22,254 1,126 25,067 100.0% 21.8% 11.6% 90,047 7.6 30.8
ASP (RMB)Number of
itemsVolume
% of
quantity
sold
Sales
(RMB'000)
% of sales
contribution
% of
discount
items
Average
discount
# of user
comments
Avg volume
sold per
item
# of
comments
per item
0-100 0 0 0.0% 0 0.0% 0.0% 0.0% 0 0.0 0.0
100-200 7 26 0.1% 4 0.0% 57.1% 15.0% 35 3.7 5.0
200-300 32 413 1.9% 108 0.4% 59.4% 13.5% 1,304 12.9 40.8
300-400 108 1,389 6.2% 466 1.9% 30.6% 14.4% 8,825 12.9 81.7
400-500 119 626 2.8% 273 1.1% 38.7% 15.8% 2,807 5.3 23.6
500-600 112 1,555 7.0% 859 3.4% 46.4% 14.0% 6,460 13.9 57.7
600-700 109 1,690 7.6% 1,099 4.4% 8.3% 14.6% 6,806 15.5 62.4
700-800 156 3,360 15.1% 2,511 10.0% 9.6% 16.1% 13,124 21.5 84.1
800-900 158 1,845 8.3% 1,550 6.2% 13.9% 14.7% 6,043 11.7 38.2
900-1000 187 1,487 6.7% 1,442 5.8% 18.7% 10.9% 5,567 8.0 29.8
1000-1100 139 1,970 8.9% 2,099 8.4% 28.1% 10.6% 8,290 14.2 59.6
1100-1200 158 1,517 6.8% 1,750 7.0% 25.9% 9.2% 5,110 9.6 32.3
1200-1300 131 1,169 5.3% 1,478 5.9% 16.8% 13.0% 3,722 8.9 28.4
1300-1400 139 680 3.1% 919 3.7% 25.2% 9.7% 2,394 4.9 17.2
1400-1500 105 650 2.9% 945 3.8% 17.1% 10.6% 2,501 6.2 23.8
1500-1600 109 624 2.8% 962 3.8% 24.8% 11.3% 2,785 5.7 25.6
1600-1700 107 671 3.0% 1,098 4.4% 24.3% 18.0% 1,832 6.3 17.1
1700-1800 82 317 1.4% 562 2.2% 23.2% 10.2% 1,174 3.9 14.3
1800-1900 88 222 1.0% 412 1.6% 15.9% 11.4% 1,180 2.5 13.4
1900-2000 81 115 0.5% 224 0.9% 24.7% 10.3% 514 1.4 6.3
2000-3000 344 1,274 5.7% 2,994 11.9% 22.1% 8.3% 6,233 3.7 18.1
3000-4000 161 392 1.8% 1,423 5.7% 15.5% 8.8% 1,074 2.4 6.7
4000-5000 75 75 0.3% 332 1.3% 21.3% 6.7% 487 1.0 6.5
5000-6000 53 94 0.4% 523 2.1% 20.8% 7.8% 1,094 1.8 20.6
6000-7000 38 17 0.1% 111 0.4% 7.9% 9.7% 94 0.4 2.5
7000-8000 19 8 0.0% 60 0.2% 10.5% 9.5% 85 0.4 4.5
8000-9000 20 12 0.1% 101 0.4% 5.0% 3.0% 109 0.6 5.5
9000-10000 13 2 0.0% 19 0.1% 15.4% 2.5% 14 0.2 1.1
10000-20000 51 49 0.2% 604 2.4% 11.8% 8.5% 321 1.0 6.3
>20000 24 5 0.0% 141 0.6% 0.0% 0.0% 63 0.2 2.6
Total 2,925 22,254 100.0% 25,067 100.0% 21.8% 11.6% 90,047 7.6 30.8
Consumer
China Consumer
10 July 2014
page 36 of 78 , Equity Analyst, +852 3743 8036, [email protected] Guo, PhD
Please see important disclosure information on pages 74 - 78 of this report.

Gem-set jewellery products
We analyzed seven brands and more than 3,600 products sold on Tmall. They generated
monthly sales volume of >5,800 with ASP of RMB1,567. In our samples, 20% of the items
offer discounts with average discounts level of 30%. Monthly total sales of our samples
reached RMB9.2mn. Key brands including CTF and CSS offer zero discounts on gem-set
jewellery products. Zocai, Zbird and Luk Fook offer the highest discounts. CTF, CSS and
Zbird attract more customer comments than other brands.
Similar to gold jewellery, CTF and CSS have a high market share on gem-set jewellery
with 27% and 18% respectively, while Luk Fook is weak at 1.4% and Chow Tai Seng offers
few products on gem-set jewellery. Zocai (unlisted), a Shenzhen-based online diamond
jewellery retailer with offline experimental shops across China, has a market share of 36%
on Tmall. Zbird (unlisted), another online gem-set jewellery brand, has a market share of
9.5%.
Online jewellery sales are at a low ASP at RMB1,570, while Offline ASP of gem-set
jewellery ASP range covers a much wider range, with CSS at RMB10,000, Luk Fook at
RMB3,800, CTF at RMB10,000.
49% of the volume sold in Tmall has an ASP between RMB500-1500 and contributed to
30% of monthly sales revenue. 36% of the volume sold in Tmall has an ASP >RMB1,500
and contributed to 67% of monthly sales revenue.
Chart 47: Analysis on monthly gem-set jewellery sales from Tmall – by brands
Source: Tmall, Jefferies. Sales samples are based on flagship stores in Tmall
BrandsNumber of
itemsVolume ASP (RMB)
Sales
(RMB'000)
% of sales
contribution
% of
discount
items
Average
discount
# of user
comments
Avg volume
sold per
item
# of
comments
per item
Chow Tai Fook 458 2,393 1,035 2,477 26.9% 0.0% 0.0% 6,987 5.2 15.3
Chow Sang Sang 346 1,002 1,650 1,653 18.0% 0.0% 0.0% 3,521 2.9 10.2
Luk Fook 299 80 1,591 127 1.4% 96.3% 13.0% 302 0.3 1.0
Zocai 佐卡伊 1,242 1,322 2,494 3,298 35.9% 22.9% 49.8% 6,606 1.1 5.3
Zbird 钻石小鸟 265 763 1,145 873 9.5% 28.3% 18.1% 2,701 2.9 10.2
MaBelle 玛贝尔 231 23 768 18 0.2% 1.7% 34.3% 59 0.1 0.3
SHWA 诗华珠宝 799 285 2,631 750 8.2% 9.9% 33.8% 1,267 0.4 1.6
Total 3,640 5,868 1,567 9,197 100.0% 20.1% 30.2% 21,443 1.6 5.9
Consumer
China Consumer
10 July 2014
page 37 of 78 , Equity Analyst, +852 3743 8036, [email protected] Guo, PhD
Please see important disclosure information on pages 74 - 78 of this report.

Chart 48: Analysis on monthly gem-set jewellery sales from Tmall – by price range
Source: Tmall, Jefferies. Sales samples are based on flagship stores in Tmall
Learning from comparison
We compared our analysis on gold and gem-set jewelry sales in Tmall with the below key
findings:
1) Online gold and gem-set jewelry retailers generally offer low discounts on both gem-
set and gold jewelry in order to enhance brand equity. CSS and CTF (who operates self-
operated shops) offer no discount; whereas brands adopting the licensee model including
Luk Fook, Chow Tai Seng, and Laofengxiang are more willing to offer discounts, in order
to distinguish the product diversity between online and offline. 97% of Luk Fook’s gold
products and 96% of the company’s gem-set items offer discounts at a range of 9-13%.
2) Gold enjoys higher sales volume than gem-set jewelry due to gold’s standardized
nature as a commodity. We believe customers are more inclined to purchase gem-set
jewelry products in traditional stores for large varieties of designs and gem-stones, quality
issues and shopping experience.
3) Online sold gold products have an ASP of RMB1,126 vs gem-set jewelry at RMB1,567.
The ASP of gold items sold in retail stores of CTF, CSS and Luk Fook is much higher at
RMB3,000-3,500. Gem-set jewelry’s ASP sold in traditional stores by the above mentioned
brands range between RMB3,800-10,000, much higher than average online ASP at
RMB1,567.
4) Online success could boost offline branding. Online gem-set jewellery brands such as
Zocai and Zbird, have opened stores in Beijing, Shanghai, Hangzhou, Nanjing, etc. and
the retail stores’ branding image is supported by online popularity.
ASP (RMB)Number of
itemsVolume
% of
quantity
sold
Sales
(RMB'000)
% of sales
contribution
% of
discount
items
Average
discount
# of user
comments
Avg volume
sold per
item
# of
comments
per item
0-100 3 14 0.2% 0 0.0% 66.7% 96.0% 0 4.7 0.0
100-200 0 0 0.0% 0 0.0% 0.0% 0.0% 0 0.0 0.0
200-300 12 175 3.0% 43 0.5% 8.3% 25.0% 289 14.6 24.1
300-400 34 412 7.0% 138 1.5% 17.6% 30.0% 1,271 12.1 37.4
400-500 26 291 5.0% 130 1.4% 15.4% 40.3% 874 11.2 33.6
500-600 25 667 11.4% 347 3.8% 24.0% 43.8% 2,908 26.7 116.3
600-700 32 128 2.2% 85 0.9% 21.9% 27.0% 479 4.0 15.0
700-800 29 286 4.9% 205 2.2% 20.7% 17.2% 697 9.9 24.0
800-900 47 215 3.7% 185 2.0% 29.8% 17.5% 897 4.6 19.1
900-1000 73 243 4.1% 235 2.6% 32.9% 32.6% 890 3.3 12.2
1000-1100 52 104 1.8% 109 1.2% 25.0% 18.4% 380 2.0 7.3
1100-1200 88 363 6.2% 413 4.5% 22.7% 26.8% 1,343 4.1 15.3
1200-1300 71 403 6.9% 498 5.4% 23.9% 33.9% 1,353 5.7 19.1
1300-1400 83 219 3.7% 288 3.1% 18.1% 18.1% 715 2.6 8.6
1400-1500 65 256 4.4% 365 4.0% 24.6% 23.3% 749 3.9 11.5
1500-1600 67 210 3.6% 324 3.5% 20.9% 33.1% 773 3.1 11.5
1600-1700 77 193 3.3% 320 3.5% 29.9% 25.5% 1,008 2.5 13.1
1700-1800 57 111 1.9% 193 2.1% 26.3% 30.9% 442 1.9 7.8
1800-1900 71 87 1.5% 160 1.7% 11.3% 23.1% 391 1.2 5.5
1900-2000 117 523 8.9% 1,039 11.3% 30.8% 35.1% 2,254 4.5 19.3
2000-3000 672 528 9.0% 1,373 14.9% 23.2% 27.9% 1,899 0.8 2.8
3000-4000 480 167 2.8% 603 6.6% 20.6% 31.5% 533 0.3 1.1
4000-5000 336 136 2.3% 619 6.7% 21.4% 32.6% 861 0.4 2.6
5000-6000 230 43 0.7% 245 2.7% 23.5% 32.9% 241 0.2 1.0
6000-7000 142 9 0.2% 59 0.6% 15.5% 25.7% 34 0.1 0.2
7000-8000 83 3 0.1% 24 0.3% 13.3% 29.5% 16 0.0 0.2
8000-9000 71 46 0.8% 414 4.5% 25.4% 41.3% 21 0.6 0.3
9000-10000 64 6 0.1% 57 0.6% 17.2% 36.5% 16 0.1 0.3
10000-20000 252 18 0.3% 248 2.7% 10.7% 33.2% 89 0.1 0.4
>20000 281 12 0.2% 480 5.2% 5.0% 34.0% 20 0.0 0.1
Total 3,640 5,868 100.0% 9,197 100.0% 20.1% 30.2% 21,443 1.6 5.9
Consumer
China Consumer
10 July 2014
page 38 of 78 , Equity Analyst, +852 3743 8036, [email protected] Guo, PhD
Please see important disclosure information on pages 74 - 78 of this report.

Chart 49: Comparison between gold and gem-set jewellery
Source: Tmall, Jefferies
Chart 50: Comparison between Luk Fook, CTF and CSS
Source: Tmall, Jefferies
5) We also compare the margins for identical items sold in the online and offline channels
by the jewellery brands. The EBIT margin from online is higher than offline. This
phenomenon is different from the apparel, footwear and sportswear brands, mainly
because jewellery brands are reluctant to offer significant price discounts for an identical
product sold online and offline stores bear heavy fixed costs.
According to the margin analysis in Chart 51 and 52, gold products earn an EBIT margin
of 4.7% offline but 10.8% online; while gem-set jewellery earns an EBIT margin of 18.9%
offline vs 32.5% online. However, as offline and online product mix is different, with
offline ASP being 3-6x more expensive than online, offline profit is still the major earnings
driver for jewellery retailers.
CategoryNumber of
items
Volume
sold
ASP after
discount
Sales
(RMB'000)
% of
discount
items
Average
discount
Gold products 2,925 22,254 1,126 25,067 21.8% 11.6%
Gem-set jewellery 3,640 5,868 1,567 9,197 20.1% 30.2%
CategoryNumber of
items
Volume
sold
ASP after
discount
Sales
(RMB'000)
% of
discount
items
Average
discount
Chow Tai Fook
- Gold products 1,107 11,586 1,016 11,774 0.0% 0.0%
- Gem-set jewellery 458 2,393 1,035 2,477 0.0% 0.0%
Gold & gem-set 1,565 13,979 1,020 14,252 0.0% 0.0%
% of sales contribution from gold 82.6%
Chow Sang Sang
- Gold products 568 8,109 1,201 9,742 0.0% 0.0%
- Gem-set jewellery 346 1,002 1,650 1,653 0.0% 0.0%
Gold & gem-set 914 9,111 1,251 11,395 0.0% 0.0%
% of sales contribution from gold 85.5%
Luk Fook
- Gold products 343 822 668 549 96.8% 9.2%
- Gem-set jewellery 299 80 1,591 127 96.3% 13.0%
Gold & gem-set 642 902 749 676 96.8% 9.6%
% of sales contribution from gold 81.2%
Consumer
China Consumer
10 July 2014
page 39 of 78 , Equity Analyst, +852 3743 8036, [email protected] Guo, PhD
Please see important disclosure information on pages 74 - 78 of this report.

Chart 51: Margin analysis of identical gold items
Source: Tmall, Jefferies
Note: (1) Assume offline shops are self-operated, e-shop is Tmall; (2) Same price for
identical products. Jewellers offer 0% retail discount online vs offline
Chart 52: Margin analysis of identical gem-set products
Source: Tmall, Jefferies
Note: (1) Assume offline shops are self-operated, e-shop is Tmall; (2) Same price for
identical products. Jewellers offer 0% retail discount online vs offline
Offline Online
Retail ASP (RMB) (1, 2, 3) 1,150 1,150
Cost of production -978 -978
Gross Profit 173 173
GPM (%) 15% 15%
Rental cost (offline) / commission (online) -58 -6
% of retail ASP 5.0% 0.5%
Retail staff cost (offline) / consumer service (online) -29 -17
% of retail ASP 2.5% 1.5%
Marketing -6 -6
% of retail ASP 0.5% 0.5%
Transportation -8 -8
% of retail ASP 0.7% 0.7%
Admin + Other retail costs -12 -12
% of retail ASP 1.0% 1.0%
Depreciation/Amortization of retail shops -7 0
% of retail ASP 0.6% 0.0%
Operating Profit 54 124
OPM (%) 4.7% 10.8%
Offline Online
Retail ASP (RMB) (1, 2, 3) 1,600 1,600
Cost of production -848 -848
Gross Profit 752 752
GPM (%) 47% 47%
Rental cost (offline) / commission (online) -240 -80
% of retail ASP 15.0% 5.0%
Retail staff cost (offline) / consumer service (online) -128 -80
% of retail ASP 8.0% 5.0%
Marketing -16 -16
% of retail ASP 1.0% 1.0%
Transportation -8 -8
% of retail ASP 0.5% 0.5%
Admin + Other retail costs -48 -48
% of retail ASP 3.0% 3.0%
Depreciation/Amortization of retail shops -10 0
% of retail ASP 0.6% 0.0%
Operating Profit 302 520
OPM (%) 18.9% 32.5%
Consumer
China Consumer
10 July 2014
page 40 of 78 , Equity Analyst, +852 3743 8036, [email protected] Guo, PhD
Please see important disclosure information on pages 74 - 78 of this report.

Conclusions and stock implications Fast growing sales from B2C e-commerce, yet penetration is low. Although the
impact on the jewellery sector from e-commerce is less than the apparel and consumer
electronics retailing sector, HK-based jewellery brands including CTF (1929 HK, Buy) and
Chow Sang Sang (116 HK, Hold) are proactively ramping up their online jewellery sales.
Penetration of e-commerce sales on jewellery in China is as low as c1-2% of the total
jewellery sales.
Gold products sold better than gem-set jewellery. The sales contribution from
gold for CTF, CSS and Luk Fook is at 83%, 85% and 81%, respectively. This is higher than
the traditional stores at 60-70%. We believe it’s due to the homogeneity of gold products
vs gem-set jewellery. Also, gold products sold on line are at a lower ASP vs gem-set
jewellery.
Online retail generates higher margins. The EBIT margin from online sold products
is higher than those sold offline. This phenomenon is different from the apparel, footwear
and sportswear brands, mainly because jewellery brands are reluctant to offer significant
price discounts for an identical product sold online, whereas offline stores have to bear
heavy fixed costs.
Online channels could help to boost brand. We also checked on the customers’
comments on Tmall and notice that both CTF and CSS received positive comments from
online shoppers. Both companies have built up respective online consumer service teams
and recognize the positive impact on offline sales from online sales. CTF is even operating
its first experimental store in Wuhan to enhance customers’ O2O shopping experience.
Prefer business model of self-operated stores. Brands with self-operated stores
tend to leverage online channels to enhance its branding image to enhance both online
and offline sales. In contrast, brands adopting a franchisee model are conservative in
online expansion as they try to protect licensees from potential cannibalization of online
sales.
Prefer CTF (1929 HK, Buy, PT HKD13) and CSS (116 HK, Hold, PT HKD21.3) to
Luk Fook (590 HK, Hold, PT HKD23.1). We believe Chow Tai Fook (CTF, 1929 HK,
Buy) and Chow Sang Sang (CSS, 116 HK, Hold) are well-positioned for online expansion
due to their business model of self-operated stores. According to CTF, e-commerce retail
sales rose 91% YoY in FY14 while the company had an overall 122,000 online visitors in
FY14 (+51% YoY). Luk Fook (590 HK, Hold) is conservative on online expansion in order to
protect franchisees’ business.
Consumer
China Consumer
10 July 2014
page 41 of 78 , Equity Analyst, +852 3743 8036, [email protected] Guo, PhD
Please see important disclosure information on pages 74 - 78 of this report.

Electronic Goods Through large-scale data-mining and in-depth study of business models of online and
offline electronic goods retailers, we draw the following conclusions:
We believe the electronics goods sector has passed its heyday, in particular in
higher tier cities. We expect low-teen CAGR growth in ‘12-16e and industry
consolidation. Fast penetration of E-commerce has become a serious threat to
traditional electronic goods retailers. They have to integrate from offline to
online, while E-tailers gain market share aggressively. The flip side is that
traditional retailers are in a better position to leverage strong logistics and
inventory management.
Gome and Suning both face price cannibalization from E-commerce but each
implements a different strategy. Gome endeavors to build up stronger
connections with suppliers and expand with more exposure in lower tier cities,
whereas Suning is more aggressive in building up an online platform.
Gome and Suning offer cheaper prices for major items than pure E-tailers, albeit
by a small magnitude (on average 1-2% cheaper than Tmall and JD360). This
can be explained by synergy from logistics and warehousing facilities.
Online retail lowers industry margins. Home appliances earn EBIT margin of
2.3% from offline but -1.1% from online; while consumer electronics earn EBIT
margin of 0.5% from offline vs -2.5% from online. Gome and Suning are
subsidizing their online retailing through profitable traditional retailing. Pure E-
tailers are at a stage of a massive loss, in our view. We question how could such
a trend be sustainable in the long run?
We are Neutral on consumer electronics retailers; we prefer Gome (493 HK, Buy,
PT HKD1.8) to Suning (002024 CH, Hold, PT RMB7.0). We expect Gome to
generate c2% net margin while Suning makes a loss with net margin of -1.2% to
-0.5% during 14-15e.
The following sessions introduce our research methodology and data analysis.
Overview of electronics retail industry Home appliances and consumer electronics retailers suffered from a huge slowdown after
the Chinese government withdrew the ‚Change of Old for New Program‛ and ‚Rural
Appliance Rebate Program‛ in Dec ‘11-12, but resumed growth in 2013 after improving
the sales channels. Independent consultancy firms, including Euromonitor, GFK and
McKinsey, expect the home appliances and consumer electronics market to grow from
RMB1,194bn in 2011 and RMB1,306bn in 2012 to RMB2,023bn by 2016e, representing
11.6% ‘12-16e CAGR.
Key online and offline retailers include: Suning with 6.5% market share in 2013; Gome
with 7.2% market share in ‘13; and JD360 with 6% market share in ‘13. In terms of home
appliances and consumer electronics sales breakdown by channels during 2013,
supermarkets, department stores and home appliances’ self-developed channels are the
key sales channels with 25%, 15% and 18% respectively. E-commerce is a rising channel
for consumer electronics distribution. According to Jefferies TMT team estimations,
JD360’s electronics and home appliances revenue is expected to increase from
RMB79.8bn in 13 to RMB258.5bn in 16, representing a 48% ‘13-16 CAGR, significantly
faster than the market average at 11.6% ‘13-16 CAGR.
Consumer
China Consumer
10 July 2014
page 42 of 78 , Equity Analyst, +852 3743 8036, [email protected] Guo, PhD
Please see important disclosure information on pages 74 - 78 of this report.

Chart 53: Electronics goods and home appliances market
(RMBbn)
Source: Euromonitor, GFK, McKinsey, Gome, Jefferies estimates
Chart 54: JD360’s electronics & home appliance retail
revenue (RMBbn)
Source: Company data, Jefferies estimates
Chart 55: Home appliance & electronics sales by channels in 2013
Source: Gome, Suning, Eurmonitor, Jefferies
According to Analysys International, JD360 and Tmall are the largest B2C e-retailers on
electronics products and home appliances products. JD360 had a market share of 42.6%
in 1Q14 in electronics products and 36.7% in home appliances, while Tmall has 28.4% in
electronics and 19% in home appliances, in the B2C e-retailing category.
Chart 56: B2C market share: consumer electronics (1Q14)
Source: Analysys International
Chart 57: B2C market share: Home appliances (1Q14)
Source: Analysys International
Channel Categories RMBbn %
Home appliance specialty: Gome 95 6.5%
Home appliance specialty: Suning 105 7.2%
Local home appliance specialty stores 73 5.0%
Department stores 218 15.0%
Supermarket 364 25.0%
Home appliance brands self-operated channels 262 18.0%
B2C + C2C E-commerce (JD, Tmall, Taobao, etc) 233 16.0%
Others 106 7.3%
Total 1,455 100%
Consumer
China Consumer
10 July 2014
page 43 of 78 , Equity Analyst, +852 3743 8036, [email protected] Guo, PhD
Please see important disclosure information on pages 74 - 78 of this report.

We expect the overall growth of the home appliances and consumer electronics retailing
sector (at 11.6% ‘13-‘16e CAGR) is driven by: 1) ASP growing at 3% CAGR on change in
product mix, manufacturing cost inflation and improvement in product technology, 2)
4% CAGR in demand generated from completion of residential units and increase in
demand from new households, and 3) 4.6% volume CAGR per household – due to faster
replacement and product upgrade cycles.
Online electronics goods distribution Methodology
We compiled and analyzed data on penetration of electronics goods, prices of different
products and margins of different online channels including Gome.com, Suning.com,
Tmall and JD360 and the business strategies of Gome and Suning:
Gome
Suning
Major online electronics goods retailers
Gome
Gome’s online revenue was only 6% of its total revenue in ‘13 but it is expected to
contribute 9-12% revenue in ‘14-‘15e. The company has implemented the following
strategies to boost online channels.
1) Closer relationship with home appliance suppliers. From Jan14, Gome has had
closer alliances with key home appliance suppliers, including Haier (1169 HK, NC), TCL
Multimedia (1070 HK, NC), Midea (000333 CH, NC) and Gree Electric (000651 CH, NC). It
is signing exclusive contracts with the following terms: 1) supply of specific models solely
to Gome, helping Gome to improve margins; 2) development of new products, supply
chain and sales channels between suppliers and Gome; and 3) sharing data between
Gome and suppliers on consumption behavior. We believe suppliers benefit from the
above terms as well: 1) compared to Suning, Gome is less likely to experience
online/offline price cannibalization thus could assist suppliers to improve brand image
and protect their margins; 2) Gome has a more established supply chain on home
appliances vs B2C e-retailers.
2) Develop multi-channels. From 2Q14e, Gome cooperates with Wumart (1025 HK,
NC) to sell products in more than 100 Wumart supermarkets and hypermarkets in Beijing
and Tianjin. Gome pays c4% of revenue to Wumart as concessionaire fees and targets to
generate RMBc1bn of revenue and RMBc20mn of net profits (2% NPM) in ‘14e from this
effort. Additionally, Gome is negotiating with more supermarket chains for similar deals.
Gome’s management is expecting 11% revenue contribution from multi channels
(supermarkets, department stores and local chain stores) by 2017.
Chart 58: Gome’s revenue breakdown 2011-16e
Source: Company data, Jefferies
Suning
Suning’s online sales accounted for 21% of its total sales in ‘13, which is much higher
than Gome’s 6%. Suning expects online sales to contribute 20-26% of total sales in ‘14-
(RMB mn) 2011 2012 2013 2014e 2015e 2016e 13-16e CAGR
Brick and mortar stores 59,294 49,613 52,983 57,209 61,158 65,159 7.1%
E-commerce 527 1,484 3,418 5,730 8,272 11,125 48.2%
Total 59,821 51,097 56,401 62,939 69,430 76,285 10.6%
As a % of sales
Brick and mortar stores 99.1% 97.1% 93.9% 90.9% 88.1% 85.4%
E-commerce 0.9% 2.9% 6.1% 9.1% 11.9% 14.6%
Total 100.0% 100.0% 100.0% 100.0% 100.0% 100.0%
Consumer
China Consumer
10 July 2014
page 44 of 78 , Equity Analyst, +852 3743 8036, [email protected] Guo, PhD
Please see important disclosure information on pages 74 - 78 of this report.

‘15e. The company is suffering a slowdown in online sales due to a management reshuffle
and it has implemented the following strategies.
1) Transfer from a traditional retailer to a consolidated O2O platform. Suning
performs acquisitions and aggressive marketing to become a consolidated O2O platform:
1) it acquired Redbaby in 2012 to diversify from home appliances to babycare products;
2) it bought 44% of PPTV to obtain online traffic and online advertising capability during
4Q13; 3) it acquired Manzuo.com (满座网) in Jan14 for its expertise in managing a wide
scope of e-retailing merchants and brands; 4) it became a regional sponsor of FC
Barcelona starting from 2Q14 and performed aggressive marketing activities to boost TV
and air conditioner sales. Furthermore, Suning is trying to expand into financial services in
1Q14 and provides investment services (such as investment linked deposits with c7%
annual return) and insurance products to consumers. We believe its O2O consolidation is
at an early stage and its endeavors into the financial industry bear significant risks and are
unlikely to bear fruit in the medium term.
2) Enhance large-scale self-owned logistics network. Suning has been adopting a
self-owned logistics assets strategy in order to improve the fulfillment rate. The company
plans to spend RMB11bn rolling out the logistics development. In terms of the number of
major warehouses, 35 of 70 of them have been completed and it plans to build another
10-15 in ‘14e, with an aggregate GFA for 1.9sqm for warehousing facilities. In terms of
the distribution centers, the company has 1,585 brick-and-mortar shops; they have the
capacity for development as distribution centres, delivery stations and pickup stations.
Suning plans to increase the number of distribution centers to 5,000 by ‘15e.
Chart 59: Suning’s revenue 2011-16e
Source: Company data, Jefferies
RMBmn 2011 2012 2013 2014e 2015e 2016e 13-16e CAGR
Brick and mortar stores 86,482 80,776 81,139 79,019 82,415 88,522 2.9%
Installation and others 1,219 1,015 1,066 1,045 1,154 1,313 7.2%
Services 1,423 1,350 1,339 1,345 1,422 1,527 4.5%
E-commerce 4,764 15,216 21,890 20,736 29,328 40,814 23.1%
Total 93,889 98,357 105,434 102,144 114,319 132,176 7.8%
% of revenue breakdown
Brick and mortar stores 92.1% 82.1% 77.0% 77.4% 72.1% 67.0%
Installation and others 1.3% 1.0% 1.0% 1.0% 1.0% 1.0%
Services 1.5% 1.4% 1.3% 1.3% 1.2% 1.2%
E-commerce 5.1% 15.5% 20.8% 20.3% 25.7% 30.9%
Total 100.0% 100.0% 100.0% 100.0% 100.0% 100.0%
Consumer
China Consumer
10 July 2014
page 45 of 78 , Equity Analyst, +852 3743 8036, [email protected] Guo, PhD
Please see important disclosure information on pages 74 - 78 of this report.

Chart 60: Logistics capacity comparison amongst Gome, Suning, JD360 and Tmall
Source: Company, Jefferies
*Note: The logistics network data includes listed and unlisted Gome
Learning from comparison
We conducted our analysis on electronics goods retailers with the below key findings:
1) Gome and Suning are aggressive on adjusting business models. Gome develops closer
relationships with home appliance suppliers, and at the same time develops multi-
channels (online, supermarkets, self-operated stores). In contrast, Suning aggressively
translates to an O2O platform and enhances logistics.
2) We expect retail shop closures in higher tier cities but expansion in lower tier cities.
Due to the high penetration in urban areas and rising rental costs, we expect Gome and
Suning to reduce the number of shops in tier 1 and 2 cities. We expect Gome to reduce
the number of shops by an average 5%, while that of Suning to decrease by 3% during
14-15e. The relatively low penetration of online sales in home appliances in lower tier
cities suggests an opportunity for electronics retailers to expand their exposure in lower
tier cities. Gome plans to increase the number of stores by 15% during 14-15e while
Suning plans to increase by 10% in lower tier cities.
3) Gome and Suning’s pricing remains competitive with pure E-tailers. Pricing is key for
Gome and Suning to remain competitive. According to our pricing study of different
channels (incl. Tmall, JD360 and Tencent, Gome and Suning.com), we notice that Gome
and Suning’s consumer electronics and home appliances ASP are relatively competitive.
They charge a lower price on home appliances vs. major e-retailers (Tmall and JD360). For
example, a Lenovo 14-inch notebook is sold at 5% discount on Gome and Suning vs
Tmall and JD360. Gome’s and Suning’s online ASP on home appliances and consumer
electronics items are 2% cheaper than its e-retailing peers.
Gome* Suning JD360 Tmall (Alibaba)
1) Number of major
warehouses
As of Dec13, Gome had 428 large
and small warehouses. Company
is planning to build 20 major
warehouses and close down
some city-base warehouses in
2014. According to Gome, 20% of
logistics asset is self-owned, 80%
is 3rd party operated.
Suning has 35 major
warehouses as of Dec13.
Company will have 70
major warehouses by
2015. The 70
warehouses will incur a
capex of RMB11bn in
total.
JD360 has 82 major
warehouses; 49 self-
owned, 33 is leased
as of Feb14
Alibaba is an logistics
information provider.
Warehouses are 100%
3rd party owned,
Alibaba does not
disclose number of
warehouses.
2) Aggregate gross floor
area of warehouses
1.95mn sqm 1.9mn sqm 1.3mn sqm 3rd party owned, not
disclosed
3) How many cities do
warehouses penetrate
to?
428 430 476 600
4) Number of
distribution centre,
delivery stations and
pickup stations
As of Dec13, Gome had 1,585
shops with capacity for
distribution centre, delivery
station and pickup station.
In Dec13, company had
1,585 shop with
capacity for distribution
centre, delivery station
and pickup station;
plans to increase to
5,000 by 2015.
1,620 delivery
stations, 214
pickup stations as
of Mar14.
1,712 distribution
centres; 100,532
delivery stations as of
Mar14.
Consumer
China Consumer
10 July 2014
page 46 of 78 , Equity Analyst, +852 3743 8036, [email protected] Guo, PhD
Please see important disclosure information on pages 74 - 78 of this report.

Chart 61: Price comparison: Gome and Suning vs. Tmall and JD360
Source: Jefferies
4) We also compare the margins for identical items sold in the online and offline channels
conducted by Gome and Suning. Margins of items sold online are lower than margins of
identical items sold in retail channels, mainly due to lower ASP and rebates from
suppliers. ASP of items sold online is generally 4-9% lower than an identical item sold in
brick-to-mortar stores. Home appliances earn EBIT margin of 2.3% offline but -1.1%
online; while consumer electronics earn EBIT margin of 0.5% offline vs -2.5% online. As
both Gome and Suning intend to expand online business aggressively, we expect both
companies to face a gross margin compression, when sales contribution from online
channel continues to increase in the medium term. However, both companies could
benefit from operating (mainly rental, salary and delivery) cost savings in the medium
term if both online and offline traffic improve.
Retail price (RMB) GOME Suning Tmall JD360 Gome vs
pure
e-tailers
retail price
Suning vs
pure
e-tailers
retail price
TV: Skyworth 50-inch (50E790U) 5,199 5,399 5,499 5,139 -2% 2%
Fridge: Siemens 3-door 218
litres (KK22F57TI)4,198 4,399 4,199 4,690 -6% -1%
Fridge: Haier 5-door 339 litres
(BCD-339WBA)4,888 4,699 4,688 4,899 2% -2%
Washing Machine: Siemens
6.2kg (XQG62-WS12M3600W)3,999 4,399 3,869 4,699 -7% 3%
Air conditioner: Haier
(KFR-35GW/05KBP22A)3,299 3,099 3,299 2,899 6% 0%
Smartphone: Apple iPhone 5S
Gold Colour4,728 4,949 4,948 4,898 -4% 1%
Smartphone: Samsung Galaxy
S5 G9009D3,996 4,023 4,199 3,999 -3% -2%
PC: Lenovo Thinkpad 14 inch
E540 (20C60017CD)3,275 3,260 3,399 3,499 -5% -5%
Average discount of Gome and Suning vs e-tailers -2.2% -0.7%
Consumer
China Consumer
10 July 2014
page 47 of 78 , Equity Analyst, +852 3743 8036, [email protected] Guo, PhD
Please see important disclosure information on pages 74 - 78 of this report.

Chart 62: Margin analysis of identical home appliance items
Source: Gome, Suning, Jefferies
Chart 63: Margin analysis of identical consumer electronics items
Source: Gome, Suning, Jefferies
Offline Online
Retail ASP (RMB) 6,000 5,465 Cost of sales (5,028) (5,028)
Gross Profit 972 437
GPM (%) 16.2% 8.0%
Add: rebates from suppliers 90 -
GPM (%) 1.5% 0.0%
Add: installation costs 90 82
GPM (%) 1.5% 1.5%
Consolidated GP 1,152 519
Consolidated GPM (%) 19.2% 9.5%
Rental cost (offline) / platform maintenance (online) -342 -219
% of retail ASP 5.7% 4.0%
Retail staff (offline) / consumer service (online) -150 -66
% of retail ASP 2.5% 1.2%
Utilities (offline) -54 0
% of retail ASP 0.9% 0.0%
Advertising -96 -87
% of retail ASP 1.6% 1.6%
Delivery -42 -42
% of retail ASP 0.7% 0.8%
Admin + Other retail costs -270 -164
% of retail ASP 4.5% 3.0%
Depreciation/Amortization of retail shops -60 0
% of retail ASP 1.0% 0.0%
Operating Profit 138 -58
OPM (%) 2.3% -1.1%
Offline Online
Retail ASP (RMB) 3,000 2,871 Cost of sales (2,670) (2,670)
Gross Profit 330 201
GPM (%) 11.0% 7.0%
Add: rebates from suppliers 45 -
GPM (%) 1.5% 0.0%
Add: consumer service income 30 30
GPM (%) 1.0% 1.1%
Consolidated GP 405 231
Consolidated GPM (%) 13.5% 8.1%
Rental cost (offline) / platform maintenance (online) -90 -115
% of retail ASP 3.0% 4.0%
Retail staff (offline) / consumer service (online) -75 -34
% of retail ASP 2.5% 1.2%
Utilities (offline) -21 0
% of retail ASP 0.7% 0.0%
Advertising -48 -46
% of retail ASP 1.6% 1.6%
Delivery -21 -22
% of retail ASP 0.7% 0.8%
Admin + Other retail costs -105 -86
% of retail ASP 3.5% 3.0%
Depreciation/Amortization of retail shops -30 0
% of retail ASP 1.0% 0.0%
Operating Profit 15 -72
OPM (%) 0.5% -2.5%
Consumer
China Consumer
10 July 2014
page 48 of 78 , Equity Analyst, +852 3743 8036, [email protected] Guo, PhD
Please see important disclosure information on pages 74 - 78 of this report.

Conclusions and stock implications Electronics goods sector has passed its heyday, in particular in higher tier cities. We
expect low-teen CAGR growth in 12-16e and industry consolidation. Fast penetration of E-
commerce has become a serious threat to traditional electronic goods retailers. They have
to integrate from offline to online, while E-tailers gain market share aggressively. The flip
side is that traditional retailers are in a better position to leverage strong logistics and
inventory management.
Gome and Suning both face price cannibalization from E-commerce but each
implements a different strategy. Gome endeavors to build up stronger connections with
suppliers and expand with more exposure in lower tier cities; whereas Suning is more
aggressive in building up an online platform.
Gome and Suning offer cheaper prices and benefits from logistics
management. For major items, their prices are on average 1-2% cheaper than those
offered by pure E-tailers, which can be explained by synergy from stronger logistics
management and warehousing facilities.
Online retail lowers industry margins. Home appliances earn EBIT margin of 2.3%
from offline but -1.1% from online; while consumer electronics earn EBIT margin of 0.5%
from offline vs -2.5% from online. Gome and Suning are subsidizing their online retailing
through profitable traditional retailing. Pure E-tailers are at a stage of a massive loss, in our
view. We question how could such a trend be sustainable in the long run?
We are Neutral on consumer electronics retailers; we prefer Gome (493 HK, Buy,
PT HKD1.8) to Suning (002024 CH, Hold, PT RMB7.0). We believe valuation does not look
demanding. We expect Gome to generate c2% net margin while Suning makes a loss
with net margin of -1.2% to -0.5% during 14-15e.
Consumer
China Consumer
10 July 2014
page 49 of 78 , Equity Analyst, +852 3743 8036, [email protected] Guo, PhD
Please see important disclosure information on pages 74 - 78 of this report.

Apparel, footwear and sportswear Through large-scale data-mining and in-depth study of business models of online and
offline apparel, footwear and sportswear retailers, we draw the following conclusions:
We expect further penetration from online retail. We believe online sales of
apparel and footwear will further gain share from retail stores due to cheaper
price offered by online channels, convenience for consumers, and easier logistics
arrangement. According to iResearch, Apparel sales from e-commerce are
expected to grow at 28.9% 13-16e CAGR, outpacing overall apparel sales at
13% 13-16e CAGR.
Local brands face a structural challenge due to the large price gap between
online and offline. Local brands’ ASP in traditional retail channels are 30-40%
higher than e-retailers. This phenomenon applies to almost all major local
brands: Belle (1880 HK, Underperform), Giordano (709 HK, Underperform),
Daphne (210 HK, Hold), Trinity (891 HK, Hold), China Lilang (1234 HK, Hold),
Metersbonwe (002269 CH, NC), Semir (002563 CH, NC) and Septwolves
(002029 CH, NC). We believe this trend is unsustainable and expect offline
channels to cut price so as to narrow gaps with online channels. This will
unavoidably lower their margins (given constant other factors). Such a structural
headwind has no ready-made prescription, unfortunately.
International apparel brands take market share from local brands in higher tier
cities. International brands gain rising popularity from Chinese consumers in 1st
and 2nd tier cities, in particular, brands like Zara (Inditex, ITX SM, Hold), H&M
(HMB SS, Underperform) and Uniqlo (Fast Retailing, 9983 JP, NC) due to better
product offering, stronger marketing and better consumer services. We expect
online channels to become important channels for international brands to
further enhance their presence.
Local sportswear has held up relatively well compared with local apparel and
footwear brands in the face of E-commerce penetration. The local sportswear
industry is consolidated within a few well-known brands such as Anta (2020 HK,
Buy), Li Ning (2331 HK, Buy) and Xtep (1368 HK, Buy). The entry barrier to this
industry is higher than apparel. Large brands make serious efforts in brand-
enhancement.
Online retail generates lower margins. EBIT margins for apparel, footwear and
sportswear e-retailing are lower than those in traditional stores. ASP of items
sold online is generally 40-45% lower than an identical item sold in brick-to-
mortar stores. Apparel and sportswear brands generate 13-14% EBIT margin
from retail stores compared with 9-10% from online; whereas footwear
generates 20% EBIT margin from retail stores compared with c15% from online.
We take a positive view on sportswear but negative view on apparel and
footwear. We believe sportswear is more defensive in the face of e-commerce
penetration and the sector has troughed as indicated by lower inventory days
and reduced promotions. All these factors, together with compelling valuation,
make us prefer sportswear to apparel and footwear.
We have Buy ratings on Anta (2020 HK, Buy, PT HKD13.5), Li Ning (2331 HK,
Buy, PT HKD7.5) and Xtep (1368 HK, Buy, PT HKD4.5). We have an
Underperform rating on Belle (1880 HK, PT HKD6.8) and Giordano (709 HK, PT
HKD3.9), and Hold ratings on Daphne (210 HK, Hold, PT HKD3.2), Trinity (891
HK, Hold, PT HKD1.9) and China Lilang (1234 HK, Hold, PT HKD4.6). The
following sessions introduce our research methodology and data analysis.
The following sessions introduce our research methodology and data analysis.
Consumer
China Consumer
10 July 2014
page 50 of 78 , Equity Analyst, +852 3743 8036, [email protected] Guo, PhD
Please see important disclosure information on pages 74 - 78 of this report.

Overview of the apparel, footwear and sportswear industry The apparel, footwear & sportswear sector demonstrated stronger growth than the
overall retail market during 08-13 due to urbanization, penetration of sales channels from
tier 1-2 to tier 3-5 cities, as well as rising disposable income in China. Overall retail sales of
apparel, footwear & sportswear grew at a CAGR of 24.7% during 2008-13 to reach
RMB1,137bn in 2013, according to NBS, vs overall retail sales which demonstrated a
16.7% 2008-13 CAGR. We expect China apparel sales to demonstrate 13% YoY growth in
2014-15.
According to iResearch, online apparel sales significantly outpaced overall apparel sales in
China with 88.4% 08-13 CAGR. Online apparel sales, including those from B2C (Business
to Consumer) and C2C (Consumer to Consumer) is expected to grow at 28.9% 13-16e
CAGR, from RMB429bn in 13 to RMB920bn in 16e. The contribution from online apparel
sales to total e-commerce sales is expected to increase from 23.3% in 13 to 24.3% in 16e.
In terms of the product breakdown in 2012, 41% of e-commerce sales are from
ladieswear and 18% is from menswear, while the remaining is from footwear, sportswear
and other products, according to iResearch. And in the footwear category, 47.9% of
online sales were generated from ladies footwear in 2012.
Chart 64: Apparel retail sales in China
Source: NBS
Chart 65: Online apparel sales (B2C and C2C)
Source: iResearch.
Chart 66: Apparel/footwear/sportswear breakdown, 2012
Source: iResearch.
Chart 67: Footwear breakdown, 2012
Source: iResearch.
10,84912,534
15,45518,091
20,71723,438
378 461 586 794 974 1,137
0%
10%
20%
30%
40%
50%
0
5,000
10,000
15,000
20,000
25,000
2008 2009 2010 2011 2012 2013China total retail sales (RMBbn) Apparel retail sales (RMBbn)
Total retail sales YoY (%) Apparel retail sales YoY (%)
08-13 CAGR
- Total retail sales: 16.7%
- Apparel retail sales: 24.7%
18 48 105
205
319
429
568
727
920
0%
40%
80%
120%
160%
200%
-
200
400
600
800
1,000
2008 2009 2010 2011 2012 2013 2014E 2015E 2016E
Online apparel sales (RMBbn)
% YoY
Apparel as a % of total online sales
08-13 CAGR: 88.4%
13-16e CAGR: 28.9%
Consumer
China Consumer
10 July 2014
page 51 of 78 , Equity Analyst, +852 3743 8036, [email protected] Guo, PhD
Please see important disclosure information on pages 74 - 78 of this report.
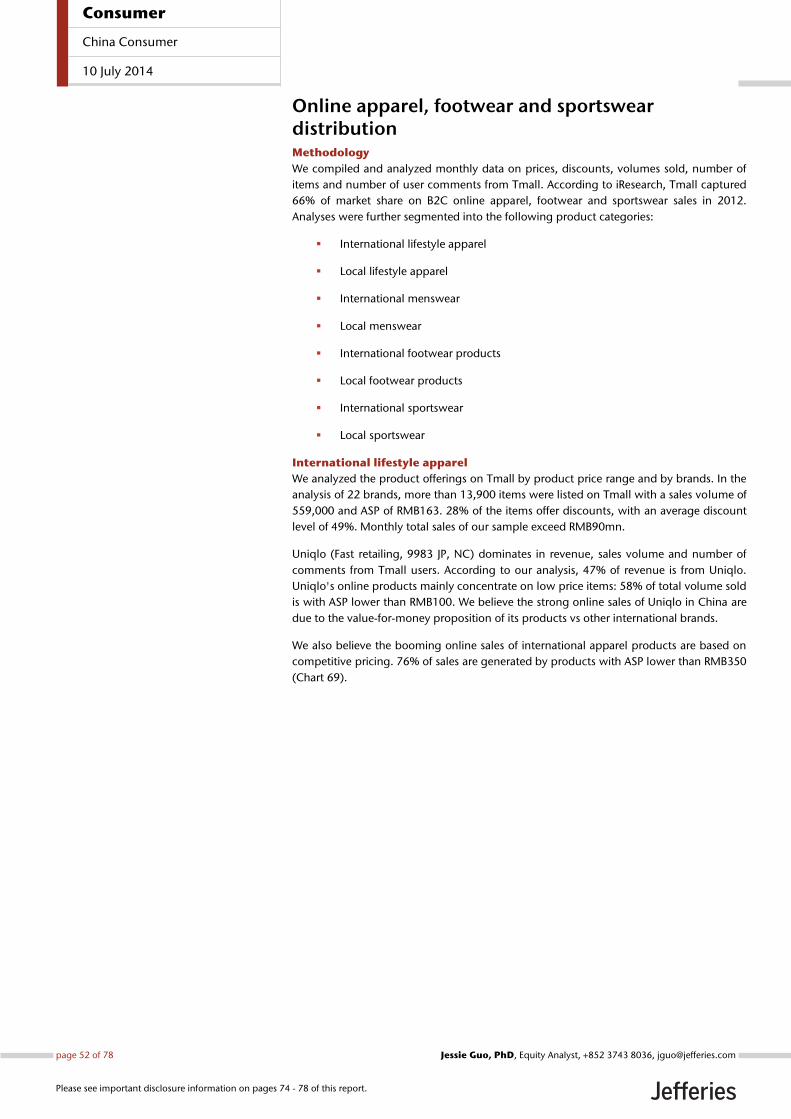
Online apparel, footwear and sportswear distribution Methodology
We compiled and analyzed monthly data on prices, discounts, volumes sold, number of
items and number of user comments from Tmall. According to iResearch, Tmall captured
66% of market share on B2C online apparel, footwear and sportswear sales in 2012.
Analyses were further segmented into the following product categories:
International lifestyle apparel
Local lifestyle apparel
International menswear
Local menswear
International footwear products
Local footwear products
International sportswear
Local sportswear
International lifestyle apparel
We analyzed the product offerings on Tmall by product price range and by brands. In the
analysis of 22 brands, more than 13,900 items were listed on Tmall with a sales volume of
559,000 and ASP of RMB163. 28% of the items offer discounts, with an average discount
level of 49%. Monthly total sales of our sample exceed RMB90mn.
Uniqlo (Fast retailing, 9983 JP, NC) dominates in revenue, sales volume and number of
comments from Tmall users. According to our analysis, 47% of revenue is from Uniqlo.
Uniqlo's online products mainly concentrate on low price items: 58% of total volume sold
is with ASP lower than RMB100. We believe the strong online sales of Uniqlo in China are
due to the value-for-money proposition of its products vs other international brands.
We also believe the booming online sales of international apparel products are based on
competitive pricing. 76% of sales are generated by products with ASP lower than RMB350
(Chart 69).
Consumer
China Consumer
10 July 2014
page 52 of 78 , Equity Analyst, +852 3743 8036, [email protected] Guo, PhD
Please see important disclosure information on pages 74 - 78 of this report.

Chart 68: Analysis on monthly international lifestyle apparel sales from Tmall – by brands
Source: Tmall, Jefferies. Sales samples are based on flagship stores in Tmall. Note: Zara only includes sub-brands Bershka and Pull&Bear.
Zara brand is excluded because it only opened its flagship store in Tmall on 11 Jun 2014
Chart 69: Analysis on monthly international lifestyle apparel sales from Tmall – by price range
Source: Tmall, Jefferies. Sales samples are based on flagship stores in Tmall
BrandsNumber of
itemsVolume sold
ASP
(RMB)
Sales
(RMB '000)
% of sales
contribution
% of
discount
items
Average
discount
# of user
comments
Avg volume
sold per
item
# of
comments
per item
Uniqlo 1,290 364,495 118 42,971 47.2% 0.2% 73.2% 239,789 282.6 185.9
Dickies 191 10,591 235 2,487 2.7% 62.3% 49.1% 9,570 55.5 50.1
C&A 127 6,319 114 722 0.8% 0.0% 0.0% 3,715 49.8 29.3
Plory 121 8,304 255 2,121 2.3% 94.2% 42.9% 3,194 68.6 26.4
Esprit 320 7,753 229 1,774 2.0% 68.1% 39.4% 6,876 24.2 21.5
Gap 602 18,086 199 3,603 4.0% 12.0% 24.4% 24,151 30.0 40.1
Nautica 253 1,791 417 748 0.8% 86.2% 40.6% 3,523 7.1 13.9
Elle 430 2,763 270 745 0.8% 97.2% 68.0% 4,070 6.4 9.5
American Eagle Outfitters 116 964 273 263 0.3% 31.9% 25.3% 240 8.3 2.1
Forever 21 1,174 15,176 82 1,249 1.4% 17.0% 33.5% 7,383 12.9 6.3
ASOS 1,756 17,113 151 2,580 2.8% 45.6% 56.2% 1,831 9.7 1.0
Old Navy 1,269 6,584 97 641 0.7% 12.8% 26.2% 2,589 5.2 2.0
Prich (E-Land Korea) 152 3,899 433 1,687 1.9% 91.4% 53.3% 779 25.7 5.1
Eland (E-Land Korea) 393 16,318 370 6,037 6.6% 71.5% 44.8% 10,411 41.5 26.5
Teenie Weenie (E-Land Korea) 521 19,912 305 6,075 6.7% 79.3% 50.2% 7,544 38.2 14.5
Scofield (E-Land Korea) 248 4,892 453 2,214 2.4% 92.3% 52.4% 2,500 19.7 10.1
Roem (E-Land Korea) 393 7,721 434 3,350 3.7% 90.3% 46.5% 6,769 19.6 17.2
Mango 1,320 8,819 219 1,931 2.1% 0.0% 0.0% 10,113 6.7 7.7
Zara 2,715 16,252 155 2,523 2.8% 0.0% 0.0% 16,214 6.0 6.0
H&M 89 2,424 98 238 0.3% 100.0% 52.6% 1,628 27.2 18.3
A&F 21 19 226 4 0.0% 81.0% 41.5% 34 0.9 1.6
Levi's 467 19,276 363 6,999 7.7% 16.1% 41.1% 12,725 41.3 27.2
Total 13,968 559,471 163 90,963 100.0% 28.4% 48.8% 375,648 40.1 26.9
ASP (RMB)Number of
itemsVolume sold
% of
quantity
sold
Sales
(RMB '000)
% of sales
contribution
% of
discount
items
Average
discount
# of user
comments
Avg volume
sold per
item
# of
comments
per item
0-50 679 56,327 10.1% 2,195 2.4% 0.2% 47.7% 39,970 83.0 58.9
50-100 2,851 200,177 35.8% 16,662 18.3% 15.9% 46.1% 127,661 70.2 44.8
100-150 2,103 114,418 20.5% 16,175 17.8% 17.1% 48.7% 62,998 54.4 30.0
150-200 1,873 64,954 11.6% 12,444 13.7% 22.1% 54.9% 44,008 34.7 23.5
200-250 1,017 36,279 6.5% 8,701 9.6% 34.6% 55.8% 23,724 35.7 23.3
250-300 1,624 32,789 5.9% 9,350 10.3% 31.5% 48.9% 34,758 20.2 21.4
300-350 563 11,302 2.0% 3,767 4.1% 58.4% 46.9% 7,120 20.1 12.6
350-400 760 15,412 2.8% 5,880 6.5% 37.8% 49.0% 10,273 20.3 13.5
400-450 473 6,426 1.1% 2,767 3.0% 46.3% 43.8% 4,278 13.6 9.0
450-500 618 7,681 1.4% 3,767 4.1% 37.1% 45.0% 4,982 12.4 8.1
500-550 173 1,921 0.3% 1,032 1.1% 52.6% 48.2% 1,923 11.1 11.1
550-600 311 4,369 0.8% 2,494 2.7% 36.0% 46.6% 3,569 14.0 11.5
600-650 115 1,786 0.3% 1,134 1.2% 68.7% 43.0% 1,682 15.5 14.6
650-700 194 2,569 0.5% 1,775 2.0% 41.8% 40.8% 1,851 13.2 9.5
700-750 30 166 0.0% 120 0.1% 80.0% 54.0% 551 5.5 18.4
750-800 147 799 0.1% 630 0.7% 29.3% 51.9% 1,096 5.4 7.5
800-850 51 437 0.1% 362 0.4% 66.7% 44.5% 317 8.6 6.2
850-900 96 505 0.1% 450 0.5% 19.8% 52.3% 1,239 5.3 12.9
900-950 28 319 0.1% 290 0.3% 71.4% 40.9% 422 11.4 15.1
950-1000 84 329 0.1% 326 0.4% 25.0% 40.5% 869 3.9 10.3
1000-1100 26 162 0.0% 176 0.2% 30.8% 51.9% 287 6.2 11.0
1100-1200 42 141 0.0% 164 0.2% 59.5% 53.5% 776 3.4 18.5
1200-1300 27 51 0.0% 65 0.1% 55.6% 61.7% 123 1.9 4.6
1300-1400 26 28 0.0% 38 0.0% 73.1% 45.3% 250 1.1 9.6
1400-1500 11 39 0.0% 57 0.1% 54.5% 59.0% 149 3.5 13.5
1500-1600 9 46 0.0% 72 0.1% 66.7% 57.3% 46 5.1 5.1
1600-1700 10 33 0.0% 54 0.1% 70.0% 45.2% 91 3.3 9.1
1700-1800 3 0 0.0% 0 0.0% 33.3% 60.0% 2 0.0 0.7
1800-1900 5 0 0.0% 0 0.0% 100.0% 38.0% 181 0.0 36.2
1900-2000 3 1 0.0% 2 0.0% 66.7% 45.0% 16 0.3 5.3
>2000 16 5 0.0% 13 0.0% 43.8% 57.4% 436 0.3 27.3
Total 13,968 559,471 100.0% 90,963 100.0% 28.4% 48.8% 375,648 40.1 26.9
Consumer
China Consumer
10 July 2014
page 53 of 78 , Equity Analyst, +852 3743 8036, [email protected] Guo, PhD
Please see important disclosure information on pages 74 - 78 of this report.

Local lifestyle apparel
We analyzed 10 brands, including 4 from Bestseller (unlisted, 绫致时装), the largest
apparel company in China. More than 12,800 items listed on Tmall generated sales
volume of >1mn and ASP of RMB135. Out of our samples, 31% of the items offer
discounts, with an average discount level of 43%. Monthly total sales in our analysis
sample reached RMB136mn. Some local brands including Metersbonwe (002268 CH,
NC) and Semir (002563 CH, NC), facing tough competition from international brands,
offer low ASP at RMB68 and RMB88, respectively.
Similar to international lifestyle apparel, online apparel sales is driven by low ASP. 84% of
sales contribution is from products with ASP lower than RMB350. However, cheap price is
not the sole differentiating factor; we believe a successful brand image may mitigate the
risk of price competition with local rivals. For instance, Bestsellers’ brands popularity is
not driven by cheap price (the 4 brands from Bestseller have ASP higher than RMB190 vs
sector average RMB135) and its overall discount on Tmall is only 5%. Bestseller has
coordinated with Tencent as another online channel to promote sales.
Chart 70: Analysis on monthly local lifestyle apparel sales from Tmall – by brands
Source: Tmall, Jefferies. Sales samples are based on flagship stores in Tmall. Note: Although Bestseller China is owned by Danish-based
Bestseller Fashion Group, Tmall classifies Bestseller China’s brands (Jack Jones, Only, Selected, Vero Moda) as local brands.
BrandsNumber of
itemsVolume sold
ASP
(RMB)
Sales
(RMB '000)
% of sales
contribution
% of
discount
items
Average
discount
# of user
comments
Avg volume
sold per
item
# of
comments
per item
Jack Jones (Bestseller) 1,008 124,066 196 24,328 17.9% 5.2% 50.1% 115,609 123.1 114.7
ONLY (Bestseller) 1,663 61,804 232 14,338 10.5% 11.7% 49.6% 66,582 37.2 40.0
Selected (Bestseller) 925 28,301 236 6,668 4.9% 0.0% 0.0% 35,450 30.6 38.3
Vero Moda (Bestseller) 1,949 67,513 263 17,733 13.0% 0.4% 0.1% 83,272 34.6 42.7
GXG 980 67,820 249 16,869 12.4% 85.1% 41.1% 71,032 69.2 72.5
Jeanwest 1,100 170,152 67 11,424 8.4% 48.8% 40.3% 102,567 154.7 93.2
Semir 1,565 303,347 68 20,637 15.2% 83.6% 45.8% 351,626 193.8 224.7
Peace Bird 778 39,049 240 9,354 6.9% 72.6% 42.1% 54,323 50.2 69.8
Giordano 549 64,162 120 7,725 5.7% 83.2% 33.4% 88,499 116.9 161.2
Metersbonwe 2,324 79,845 88 7,039 5.2% 2.1% 58.9% 94,172 34.4 40.5
Total 12,841 1,006,059 135 136,116 100.0% 31.2% 42.5% 1,063,132 78.3 82.8
Consumer
China Consumer
10 July 2014
page 54 of 78 , Equity Analyst, +852 3743 8036, [email protected] Guo, PhD
Please see important disclosure information on pages 74 - 78 of this report.

Chart 71: Analysis on monthly local lifestyle apparel sales from Tmall – by price range
Source: Tmall, Jefferies. Sales samples are based on flagship stores in Tmall
International menswear
We analyzed 6 brands in total with 1,899 items sold on Tmall. Sales volume reached more
than 22,000 with ASP of RMB342. Out of these items, 65% offered an average discount of
39%. Menswear apparel retail inventory level remains high. Brands' flagship stores are
responsible for inventory clearing; 68% of sales contribution comes from products with
ASP lower than RMB300. CK (Calvin Klein, owned by Philips-Van-Hausen, PVH, NC)
dominates in Tmall in the international menswear category.
We believe international menswear sales are heavily driven by brick-and-mortar stores
rather than e-retailing platforms, mainly due to the high ASP of products. Our analysis
suggests that low ASP items sell much better than high ASP items. Only 2.5% of sales is
driven by items with ASP higher than RMB2,000. Less than 2 pieces sold in a month for
items exceeding RMB10,000.
Chart 72: Analysis on monthly international menswear sales from Tmall – by brands
Source: Tmall, Jefferies. Sales samples are based on flagship stores and authorized retailers in Tmall
ASP (RMB)Number of
itemsVolume sold
% of
quantity
sold
Sales
(RMB '000)
% of sales
contribution
% of
discount
items
Average
discount
# of user
comments
Avg volume
sold per
item
# of
comments
per item
0-50 746 187,950 18.7% 8,078 5.9% 0.3% 45.6% 88,312 251.9 118.4
50-100 2,251 362,108 36.0% 27,544 20.2% 45.8% 46.0% 312,539 160.9 138.8
100-150 1,614 149,598 14.9% 19,371 14.2% 42.3% 40.8% 164,550 92.7 102.0
150-200 1,761 114,858 11.4% 21,285 15.6% 35.8% 43.5% 173,362 65.2 98.4
200-250 1,179 93,084 9.3% 22,348 16.4% 37.7% 43.6% 111,206 79.0 94.3
250-300 1,002 37,947 3.8% 10,834 8.0% 34.3% 41.1% 75,323 37.9 75.2
300-350 649 16,199 1.6% 5,468 4.0% 30.8% 37.3% 34,617 25.0 53.3
350-400 1,047 19,903 2.0% 7,723 5.7% 18.9% 32.6% 45,036 19.0 43.0
400-450 448 4,638 0.5% 2,048 1.5% 8.7% 42.0% 11,787 10.4 26.3
450-500 843 8,298 0.8% 4,114 3.0% 6.9% 38.8% 16,952 9.8 20.1
500-550 307 3,211 0.3% 1,758 1.3% 3.3% 49.1% 6,018 10.5 19.6
550-600 346 4,071 0.4% 2,432 1.8% 8.7% 41.2% 7,496 11.8 21.7
600-650 94 1,056 0.1% 683 0.5% 11.7% 26.7% 2,589 11.2 27.5
650-700 192 1,839 0.2% 1,282 0.9% 6.8% 30.7% 6,710 9.6 34.9
700-750 28 263 0.0% 197 0.1% 21.4% 13.3% 839 9.4 30.0
750-800 105 558 0.1% 445 0.3% 8.6% 31.6% 2,387 5.3 22.7
800-850 11 30 0.0% 25 0.0% 63.6% 34.3% 84 2.7 7.6
850-900 47 129 0.0% 116 0.1% 2.1% 19.9% 659 2.7 14.0
900-950 6 19 0.0% 17 0.0% 50.0% 37.4% 194 3.2 32.3
950-1000 100 150 0.0% 149 0.1% 7.0% 32.3% 1,444 1.5 14.4
1000-1100 8 42 0.0% 46 0.0% 37.5% 20.0% 174 5.3 21.8
1100-1200 15 18 0.0% 21 0.0% 13.3% 25.9% 172 1.2 11.5
1200-1300 10 35 0.0% 45 0.0% 0.0% 0.0% 184 3.5 18.4
1300-1400 2 1 0.0% 1 0.0% 100.0% 30.1% 8 0.5 4.0
1400-1500 5 2 0.0% 3 0.0% 0.0% 0.0% 33 0.4 6.6
1500-1600 5 45 0.0% 69 0.1% 60.0% 30.0% 323 9.0 64.6
1600-1700 1 0 0.0% 0 0.0% 0.0% 0.0% 5 0.0 5.0
1700-1800 2 5 0.0% 9 0.0% 0.0% 0.0% 22 2.5 11.0
1800-1900 0 0 0.0% 0 0.0% 0.0% 0.0% 0 0.0 0.0
1900-2000 3 0 0.0% 0 0.0% 0.0% 0.0% 8 0.0 2.7
>2000 14 2 0.0% 5 0.0% 0.0% 0.0% 99 0.1 7.1
Total 12,841 1,006,059 100.0% 136,116 100.0% 31.2% 42.5% 1,063,132 78.3 82.8
BrandsNumber of
itemsVolume sold
ASP
(RMB)
Sales
(RMB '000)
% of sales
contribution
% of
discount
items
Average
discounts
# of user
comments
Avg volume
sold per
item
# of
comments
per item
Ralph Lauren 75 211 741 156 2.1% 41.3% 39.6% 90 2.8 1.2
CK 535 19,039 284 5,398 70.8% 81.1% 52.7% 11,664 35.6 21.8
Hugo Boss 120 175 958 168 2.2% 46.7% 43.3% 136 1.5 1.1
Zegna 60 102 1,591 162 2.1% 70.0% 41.7% 81 1.7 1.4
YSL 58 8 2,166 17 0.2% 13.8% 24.5% 63 0.1 1.1
Armani 1,044 2,757 626 1,727 22.6% 64.3% 29.9% 1,735 2.6 1.7
Total 1,892 22,292 342 7,628 100.0% 65.6% 39.1% 13,769 11.8 7.3
Consumer
China Consumer
10 July 2014
page 55 of 78 , Equity Analyst, +852 3743 8036, [email protected] Guo, PhD
Please see important disclosure information on pages 74 - 78 of this report.

Chart 73: Analysis on monthly international menswear sales from Tmall – by price range
Source: Tmall, Jefferies. Sales samples are based on flagship stores and authorized retailers in Tmall
Local menswear
We analyzed 8 brands in total with > 4,300 items sold on Tmall in the local menswear
category. Sales volume exceeded 250,000 with an ASP of RMB238, which is 30% cheaper
than international menswear brands. 78% of the items offer discounts, with an average
discount level of 49%. We believe the local menswear sold on Tmall is still driven by deep
discounts.
China Lilang (1234 HK, Hold) is relatively weak in e-commerce sales as the company
believes the online channel is mainly for inventory clearing only. With a smaller presence
in e-commerce, we believe Lilang is unlikely to adopt an O2O sales and marketing
strategy, which could improve its brand image in medium term.
ASP (RMB)Number of
itemsVolume sold
% of
quantity
sold
Sales
(RMB '000)
% of sales
contribution
% of
discount
items
Average
discount
# of user
comments
Avg volume
sold per
item
# of
comments
per item
0-50 0 0 0.0% 0 0.0% 0.0% 0.0% 0 0.0 0.0
50-100 1 2 0.0% 0 0.0% 100.0% 82.1% 0 2.0 0.0
100-150 4 114 0.5% 17 0.2% 75.0% 59.5% 12 28.5 3.0
150-200 31 8,059 36.2% 1,420 18.6% 96.8% 54.4% 1,751 260.0 56.5
200-250 164 6,265 28.1% 1,402 18.4% 99.4% 58.9% 4,843 38.2 29.5
250-300 93 1,429 6.4% 386 5.1% 88.2% 46.9% 1,324 15.4 14.2
300-350 47 808 3.6% 268 3.5% 91.5% 68.8% 644 17.2 13.7
350-400 42 1,044 4.7% 400 5.3% 88.1% 49.4% 685 24.9 16.3
400-450 20 555 2.5% 231 3.0% 70.0% 42.8% 1,110 27.8 55.5
450-500 43 466 2.1% 223 2.9% 74.4% 47.3% 233 10.8 5.4
500-550 31 298 1.3% 159 2.1% 64.5% 40.6% 182 9.6 5.9
550-600 94 739 3.3% 432 5.7% 80.9% 33.7% 742 7.9 7.9
600-650 39 607 2.7% 381 5.0% 84.6% 24.7% 267 15.6 6.8
650-700 85 242 1.1% 165 2.2% 64.7% 34.9% 377 2.8 4.4
700-750 29 59 0.3% 43 0.6% 86.2% 23.4% 16 2.0 0.6
750-800 46 75 0.3% 58 0.8% 56.5% 28.4% 138 1.6 3.0
800-850 26 64 0.3% 52 0.7% 57.7% 37.1% 29 2.5 1.1
850-900 58 117 0.5% 101 1.3% 27.6% 28.2% 74 2.0 1.3
900-950 21 51 0.2% 46 0.6% 81.0% 32.7% 18 2.4 0.9
950-1000 99 108 0.5% 105 1.4% 33.3% 38.2% 127 1.1 1.3
1000-1100 66 87 0.4% 91 1.2% 56.1% 27.1% 59 1.3 0.9
1100-1200 74 75 0.3% 87 1.1% 37.8% 32.1% 270 1.0 3.6
1200-1300 89 63 0.3% 80 1.0% 50.6% 34.8% 112 0.7 1.3
1300-1400 54 718 3.2% 996 13.1% 44.4% 26.1% 445 13.3 8.2
1400-1500 58 25 0.1% 36 0.5% 69.0% 30.7% 18 0.4 0.3
1500-1600 70 55 0.2% 86 1.1% 52.9% 26.9% 33 0.8 0.5
1600-1700 45 50 0.2% 83 1.1% 62.2% 32.5% 65 1.1 1.4
1700-1800 43 14 0.1% 25 0.3% 65.1% 29.7% 26 0.3 0.6
1800-1900 35 7 0.0% 13 0.2% 51.4% 23.7% 45 0.2 1.3
1900-2000 52 25 0.1% 49 0.6% 63.5% 34.4% 24 0.5 0.5
>2000 333 71 0.3% 194 2.5% 61.0% 31.6% 100 0.2 0.3
Total 1,892 22,292 100.0% 7,628 100.0% 65.6% 39.1% 13,769 11.8 7.3
Consumer
China Consumer
10 July 2014
page 56 of 78 , Equity Analyst, +852 3743 8036, [email protected] Guo, PhD
Please see important disclosure information on pages 74 - 78 of this report.

Chart 74: Analysis on monthly local menswear sales from Tmall – by brands
Source: Tmall, Jefferies. Sales samples are based on flagship stores in Tmall
Chart 75: Analysis on monthly local menswear sales from Tmall – by price range
Source: Tmall, Jefferies. Sales samples are based on flagship stores in Tmall
International footwear
We analyzed 8 international footwear brands with more than 1,700 items sold on Tmall.
Sales volume exceeded 19,000 with an ASP of RMB706, which is 1.8x more expensive
than local footwear due to strong branding. Only 40% of the items offer an average
discount level of 34%, vs local footwear with 80% of items offering an average discount
level of 47% (See Chart 76, 78).
The international online footwear market generates monthly sales of RMB13mn,
significantly smaller than the local online footwear market with monthly sales of
BrandsNumber of
itemsVolume sold
ASP
(RMB)
Sales
(RMB '000)
% of sales
contribution
% of
discount
items
Average
discount
# of user
comments
Avg volume
sold per
item
# of
comments
per item
Camel 598 71,594 201 14,384 23.9% 99.2% 49.5% 176,074 119.7 294.4
K-Boxing 679 37,760 328 12,369 20.5% 62.0% 43.0% 60,703 55.6 89.4
Joeone 776 33,665 291 9,784 16.2% 92.0% 47.7% 59,784 43.4 77.0
Septwolves 828 32,445 232 7,537 12.5% 97.5% 54.2% 52,908 39.2 63.9
Hodo (红豆) 333 32,171 178 5,721 9.5% 81.7% 60.8% 79,648 96.6 239.2
Romon (罗蒙) 528 27,555 183 5,052 8.4% 0.0% 0.0% 270,849 52.2 513.0
Youngor 421 11,009 351 3,859 6.4% 95.2% 43.1% 23,539 26.1 55.9
Lilang 155 7,224 218 1,578 2.6% 100.0% 41.7% 2,390 46.6 15.4
Total 4,318 253,423 238 60,282 100.0% 77.9% 49.2% 725,895 58.7 168.1
ASP (RMB)Number of
itemsVolume sold
% of
quantity
sold
Sales
(RMB '000)
% of sales
contribution
% of
discount
items
Average
discount
# of user
comments
Avg volume
sold per
item
# of
comments
per item
0-50 7 137 0.1% 6 0.0% 0.0% 41.5% 303 19.6 43.3
50-100 35 6,547 2.6% 624 1.0% 77.1% 46.5% 4,233 187.1 120.9
100-150 180 42,168 16.6% 5,848 9.7% 66.1% 55.4% 102,414 234.3 569.0
150-200 705 71,203 28.1% 12,875 21.4% 76.0% 53.5% 159,636 101.0 226.4
200-250 615 46,321 18.3% 10,736 17.8% 88.3% 51.0% 127,358 75.3 207.1
250-300 730 39,184 15.5% 11,068 18.4% 91.9% 49.5% 94,168 53.7 129.0
300-350 351 17,935 7.1% 5,923 9.8% 93.7% 47.9% 34,487 51.1 98.3
350-400 370 16,472 6.5% 6,214 10.3% 89.7% 48.7% 43,740 44.5 118.2
400-450 224 4,890 1.9% 2,116 3.5% 79.5% 47.2% 26,905 21.8 120.1
450-500 237 3,080 1.2% 1,482 2.5% 67.9% 47.5% 54,688 13.0 230.8
500-550 159 2,151 0.8% 1,141 1.9% 46.5% 39.3% 29,220 13.5 183.8
550-600 195 1,816 0.7% 1,076 1.8% 53.8% 44.4% 18,475 9.3 94.7
600-650 86 538 0.2% 345 0.6% 58.1% 43.6% 7,900 6.3 91.9
650-700 100 355 0.1% 244 0.4% 47.0% 49.2% 8,064 3.6 80.6
700-750 30 28 0.0% 21 0.0% 83.3% 42.5% 2,622 0.9 87.4
750-800 50 351 0.1% 276 0.5% 54.0% 42.2% 4,145 7.0 82.9
800-850 25 3 0.0% 2 0.0% 76.0% 51.3% 425 0.1 17.0
850-900 42 42 0.0% 38 0.1% 54.8% 45.2% 2,712 1.0 64.6
900-950 18 51 0.0% 47 0.1% 94.4% 49.1% 985 2.8 54.7
950-1000 35 28 0.0% 28 0.0% 42.9% 39.4% 1,327 0.8 37.9
1000-1100 16 16 0.0% 16 0.0% 81.3% 42.3% 422 1.0 26.4
1100-1200 23 23 0.0% 27 0.0% 52.2% 30.3% 322 1.0 14.0
1200-1300 17 4 0.0% 5 0.0% 58.8% 46.1% 702 0.2 41.3
1300-1400 21 36 0.0% 49 0.1% 33.3% 36.9% 97 1.7 4.6
1400-1500 11 20 0.0% 30 0.0% 45.5% 26.3% 41 1.8 3.7
1500-1600 7 1 0.0% 2 0.0% 42.9% 39.3% 403 0.1 57.6
1600-1700 3 0 0.0% 0 0.0% 33.3% 58.1% 4 0.0 1.3
1700-1800 0 0 0.0% 0 0.0% 0.0% 0.0% 0 0.0 0.0
1800-1900 9 14 0.0% 25 0.0% 44.4% 22.7% 11 1.6 1.2
1900-2000 6 2 0.0% 4 0.0% 33.3% 58.2% 64 0.3 10.7
>2000 11 7 0.0% 16 0.0% 54.5% 35.8% 22 0.6 2.0
Total 4,318 253,423 100.0% 60,282 100.0% 77.9% 49.2% 725,895 58.7 168.1
Consumer
China Consumer
10 July 2014
page 57 of 78 , Equity Analyst, +852 3743 8036, [email protected] Guo, PhD
Please see important disclosure information on pages 74 - 78 of this report.

RMB81mn. Out of all international brands, 53% of sales volume is generated from
products with ASP of RMB250-600.
Amongst the international footwear sales on Tmall, Clarks, Nine West and Skechers are
the major brands, with 33%, 22% and 24% of sales contribution in Tmall’s international
footwear space, respectively. However, Skechers receives 88 comments per item listed on
Tmall vs sector average at 18. We believe Skechers has put a higher marketing effort on
the brand for e-commerce sales. This is a fast rising brand competing with Nike and
Adidas.
Chart 76: Analysis on monthly international footwear sales from Tmall – by brands
Source: Tmall, Jefferies. Sales samples are based on flagship stores and authorized retailers in Tmall
Chart 77: Analysis on monthly international footwear sales from Tmall – by price range
Source: Tmall, Jefferies. Sales samples are based on flagship stores and authorized retailers in Tmall
BrandsNumber of
itemsVolume sold
ASP
(RMB)
Sales
(RMB '000)
% of sales
contribution
% of
discount
items
Average
discount
# of user
comments
Avg volume
sold per
item
# of
comments
per item
Nine West 214 7,096 633 4,490 33.2% 87.4% 46.0% 3,799 33.2 17.8
UGG 245 668 780 521 3.9% 34.7% 27.7% 3,846 2.7 15.7
Yellow Earth 179 79 603 48 0.4% 14.0% 44.2% 3,546 0.4 19.8
Steve Madden 137 711 684 486 3.6% 52.6% 44.1% 1,348 5.2 9.8
Skechers 134 6,718 474 3,187 23.6% 65.7% 31.2% 11,824 50.1 88.2
Ecco 149 533 1,845 983 7.3% 0.0% 0.0% 834 3.6 5.6
Clarks 370 2,664 1,106 2,947 21.8% 62.4% 22.6% 5,936 7.2 16.0
Skap 353 698 1,237 864 6.4% 10.2% 29.4% 1,390 2.0 3.9
Total 1,781 19,167 706 13,526 100.0% 40.7% 33.5% 32,523 10.8 18.3
ASP (RMB)Number of
itemsVolume sold
% of
quantity
sold
Sales
(RMB '000)
% of sales
contribution
% of
discount
items
Average
discount
# of user
comments
Avg volume
sold per
item
# of
comments
per item
0-50 1 0 0.0% 0 0.0% 0.0% 0.0% 1 0.0 1.0
50-100 1 4 0.0% 0 0.0% 100.0% 20.4% 186 4.0 186.0
100-150 5 39 0.2% 5 0.0% 40.0% 50.2% 144 7.8 28.8
150-200 9 126 0.7% 23 0.2% 55.6% 50.4% 243 14.0 27.0
200-250 5 32 0.2% 8 0.1% 40.0% 32.9% 21 6.4 4.2
250-300 11 293 1.5% 87 0.6% 27.3% 67.2% 130 26.6 11.8
300-350 21 565 2.9% 192 1.4% 61.9% 43.6% 489 26.9 23.3
350-400 32 1,247 6.5% 486 3.6% 90.6% 45.5% 2,016 39.0 63.0
400-450 27 842 4.4% 371 2.7% 81.5% 49.1% 2,478 31.2 91.8
450-500 49 4,390 22.9% 2,184 16.1% 95.9% 39.9% 7,986 89.6 163.0
500-550 35 2,371 12.4% 1,261 9.3% 82.9% 50.5% 594 67.7 17.0
550-600 35 366 1.9% 215 1.6% 91.4% 43.9% 847 10.5 24.2
600-650 32 356 1.9% 228 1.7% 84.4% 38.5% 506 11.1 15.8
650-700 78 2,646 13.8% 1,803 13.3% 75.6% 41.4% 1,367 33.9 17.5
700-750 40 426 2.2% 311 2.3% 77.5% 35.3% 515 10.7 12.9
750-800 48 842 4.4% 648 4.8% 83.3% 34.5% 863 17.5 18.0
800-850 72 516 2.7% 428 3.2% 91.7% 35.3% 1,064 7.2 14.8
850-900 69 458 2.4% 408 3.0% 71.0% 27.0% 803 6.6 11.6
900-950 36 135 0.7% 125 0.9% 77.8% 32.3% 192 3.8 5.3
950-1000 91 457 2.4% 448 3.3% 57.1% 27.3% 866 5.0 9.5
1000-1100 103 690 3.6% 740 5.5% 57.3% 24.6% 1,295 6.7 12.6
1100-1200 94 681 3.6% 792 5.9% 58.5% 22.8% 898 7.2 9.6
1200-1300 61 211 1.1% 270 2.0% 37.7% 18.0% 393 3.5 6.4
1300-1400 71 255 1.3% 353 2.6% 21.1% 17.0% 637 3.6 9.0
1400-1500 74 382 2.0% 563 4.2% 14.9% 24.1% 880 5.2 11.9
1500-1600 49 121 0.6% 193 1.4% 10.2% 23.3% 462 2.5 9.4
1600-1700 73 137 0.7% 232 1.7% 6.8% 9.0% 1,329 1.9 18.2
1700-1800 85 174 0.9% 312 2.3% 5.9% 13.0% 1,354 2.0 15.9
1800-1900 83 206 1.1% 391 2.9% 3.6% 13.4% 1,184 2.5 14.3
1900-2000 73 109 0.6% 218 1.6% 8.2% 13.4% 713 1.5 9.8
>2000 318 90 0.5% 234 1.7% 0.0% 0.0% 2,067 0.3 6.5
Total 1,781 19,167 100.0% 13,526 100.0% 40.7% 33.5% 32,523 10.8 18.3
Consumer
China Consumer
10 July 2014
page 58 of 78 , Equity Analyst, +852 3743 8036, [email protected] Guo, PhD
Please see important disclosure information on pages 74 - 78 of this report.

Local footwear
We analyzed 9 local footwear brands with more than 6,900 items sold on Tmall. Sales
volume exceeded 315,000 (vs international footwear at 19,000) with an ASP of RMB256.
More than 80% of items offer discounts at an average discount rate of 47%, i.e. local
footwear brands sales are still driven by low price. 75% of volume sold with ASP smaller
than RMB300.
Camel and Belle (1880 HK, Underperform) are the two major brands in local footwear
space with 22% and 19% sales contribution to Tmall’s local footwear category,
respectively, in our analysis. Belle has a lower average volume sold per item listed on
Tmall (20) vs local footwear peers average (46), In addition, Belle only received 23
comments per item Tmall, vs peers average at 78. Both factors suggest Belle’s weak
presence on e-retailing. According to Belle’s management, 2% of company’s footwear
revenue is generated from online; remaining 98% is from traditional channels.
Chart 78: Analysis on monthly local footwear sales from Tmall – by brands
Source: Tmall, Jefferies. Sales samples are based on flagship stores in Tmall
BrandsNumber of
itemsVolume sold
ASP
(RMB)
Sales
(RMB '000)
% of sales
contribution
% of
discount
items
Average
discount
# of user
comments
Avg volume
sold per
item
# of
comments
per item
Camel 1,092 59,853 297 17,777 22.0% 99.1% 46.9% 164,028 54.8 150.2
Aokang 500 57,597 224 12,928 16.0% 96.4% 41.4% 74,807 115.2 149.6
Yearcon 意尔康 805 37,444 203 7,604 9.4% 94.4% 52.5% 81,331 46.5 101.0
Red Dragonfly 红蜻蜓 318 51,836 193 10,022 12.4% 100.0% 50.1% 76,944 163.0 242.0
Harson 440 10,720 333 3,567 4.4% 92.0% 62.2% 7,908 24.4 18.0
Foshan Saturday 637 10,643 316 3,365 4.2% 89.5% 53.8% 14,618 16.7 22.9
C Banner 184 9,484 379 3,596 4.5% 95.1% 54.1% 4,835 51.5 26.3
Belle 2,279 45,417 338 15,334 19.0% 52.7% 29.5% 53,421 19.9 23.4
Daphne 666 32,308 205 6,610 8.2% 100.0% 55.5% 58,630 48.5 88.0
Total 6,921 315,302 256 80,802 100.0% 81.8% 46.7% 536,522 45.6 77.5
Consumer
China Consumer
10 July 2014
page 59 of 78 , Equity Analyst, +852 3743 8036, [email protected] Guo, PhD
Please see important disclosure information on pages 74 - 78 of this report.

Chart 79: Analysis on monthly local footwear sales from Tmall – by price range
Source: Tmall, Jefferies. Sales samples are based on flagship stores in Tmall
International sportswear
We analyzed 8 major international sportswear brands with more than 6,200 items listed
on Tmall. Sales volume exceeded 173,000 with an ASP of RMB383. Monthly total sales of
international sportswear reached RMB67mn, higher than local sportswear at RMB37mn.
21% of items offer discounts at an average level of 31%.
Nike, Adidas and New Balance are the key international sportswear players in China with
22%, 20% and 33% sales contribution in Tmall’s international sportswear category.
International sportswear’s inventory level in brick-and-mortar stores is normalized to 4.5
months in 2H13 from 6-7 months in 1H12. We expect the brands to further leverage the
B2C e-commerce network for brand promotions and inventory clearance.
ASP (RMB)Number of
itemsVolume sold
% of
quantity
sold
Sales
(RMB '000)
% of sales
contribution
% of
discount
items
Average
discount
# of user
comments
Avg volume
sold per
item
# of
comments
per item
0-50 0 0 0.0% 0 0.0% 0.0% 0.0% 0 0.0 0.0
50-100 58 1,405 0.4% 125 0.2% 91.4% 74.0% 1,925 24.2 33.2
100-150 132 24,970 7.9% 3,192 4.0% 100.0% 62.4% 26,165 189.2 198.2
150-200 692 83,314 26.4% 15,279 18.9% 100.0% 55.2% 96,022 120.4 138.8
200-250 725 59,879 19.0% 13,735 17.0% 98.2% 51.6% 109,220 82.6 150.6
250-300 1,233 67,895 21.5% 19,109 23.6% 95.1% 47.7% 117,888 55.1 95.6
300-350 842 32,587 10.3% 10,745 13.3% 90.0% 46.3% 81,960 38.7 97.3
350-400 1,181 28,724 9.1% 10,892 13.5% 92.0% 41.9% 70,884 24.3 60.0
400-450 523 10,669 3.4% 4,596 5.7% 83.4% 42.1% 12,150 20.4 23.2
450-500 360 2,915 0.9% 1,400 1.7% 70.6% 35.3% 7,737 8.1 21.5
500-550 235 1,693 0.5% 890 1.1% 60.4% 36.5% 2,686 7.2 11.4
550-600 178 650 0.2% 375 0.5% 57.9% 35.0% 1,712 3.7 9.6
600-650 111 214 0.1% 135 0.2% 37.8% 31.9% 664 1.9 6.0
650-700 115 88 0.0% 60 0.1% 21.7% 33.2% 1,096 0.8 9.5
700-750 65 65 0.0% 47 0.1% 16.9% 43.0% 453 1.0 7.0
750-800 120 66 0.0% 52 0.1% 14.2% 46.1% 1,290 0.6 10.8
800-850 32 12 0.0% 10 0.0% 0.0% 0.0% 965 0.4 30.2
850-900 103 21 0.0% 19 0.0% 5.8% 46.6% 344 0.2 3.3
900-950 46 11 0.0% 10 0.0% 4.3% 18.0% 223 0.2 4.8
950-1000 65 35 0.0% 35 0.0% 7.7% 44.9% 1,319 0.5 20.3
1000-1100 44 60 0.0% 65 0.1% 0.0% 0.0% 1,241 1.4 28.2
1100-1200 31 27 0.0% 31 0.0% 9.7% 36.9% 470 0.9 15.2
1200-1300 12 2 0.0% 3 0.0% 25.0% 36.6% 35 0.2 2.9
1300-1400 8 0 0.0% 0 0.0% 0.0% 0.0% 54 0.0 6.8
1400-1500 2 0 0.0% 0 0.0% 0.0% 0.0% 1 0.0 0.5
1500-1600 1 0 0.0% 0 0.0% 0.0% 0.0% 5 0.0 5.0
1600-1700 2 0 0.0% 0 0.0% 50.0% 41.8% 2 0.0 1.0
1700-1800 1 0 0.0% 0 0.0% 0.0% 0.0% 0 0.0 0.0
1800-1900 1 0 0.0% 0 0.0% 0.0% 0.0% 10 0.0 10.0
1900-2000 0 0 0.0% 0 0.0% 0.0% 0.0% 0 0.0 0.0
>2000 3 0 0.0% 0 0.0% 66.7% 19.9% 1 0.0 0.3
Total 6,921 315,302 100.0% 80,802 100.0% 81.8% 46.7% 536,522 45.6 77.5
Consumer
China Consumer
10 July 2014
page 60 of 78 , Equity Analyst, +852 3743 8036, [email protected] Guo, PhD
Please see important disclosure information on pages 74 - 78 of this report.

Chart 80: Analysis on monthly international sportswear sales from Tmall – by brands
Source: Tmall, Jefferies. Sales samples are based on flagship stores in Tmall
Chart 81: Analysis on monthly international sportswear sales from Tmall – by price range
Source: Tmall, Jefferies. Sales samples are based on flagship stores in Tmall
Local sportswear
We analyzed 7 major local sportswear brands with more than 4,200 items listed in Tmall.
Sales volume exceeded 250,000 with an ASP of RMB147 (61% lower than international
sportswear brands). Monthly total sales on local sportswear is at RMB37mn vs
international sportswear at RMB67mn. 53% of items offer discounts at an average level of
42%.
Anta (2020 HK, Buy), Li Ning (2331 HK, Buy), Xtep (1368 HK, Buy) and 361 Degrees
(1361 HK, NC) are the key domestic sportswear brands in China with 21%, 26%, 15%
BrandsNumber of
itemsVolume
ASP
(RMB)
Sales
(RMB'000)
% of sales
contribution
% of
discount
items
Average
discount
# of user
comments
Avg volume
sold per
item
# of
comments
per item
Nike 847 42,581 348 14,809 22.2% 9.7% 31.9% 43,659 50.3 51.5
Adidas 2,940 34,493 394 13,579 20.4% 0.1% 9.3% 32,409 11.7 11.0
New Balance 247 45,326 477 21,639 32.5% 31.2% 33.3% 44,181 183.5 178.9
Converse 422 29,310 270 7,917 11.9% 42.4% 25.6% 27,157 69.5 64.4
Under Armour 215 1,927 363 700 1.1% 0.0% 0.0% 915 9.0 4.3
Asics 284 8,985 467 4,192 6.3% 62.3% 16.6% 18,303 31.6 64.4
Reebok 292 2,890 320 924 1.4% 57.2% 43.7% 4,983 9.9 17.1
Mizuno 1,030 8,087 347 2,810 4.2% 58.8% 33.5% 10,926 7.9 10.6
Total 6,277 173,599 383 66,569 100.0% 20.6% 31.2% 182,533 27.7 29.1
ASP (RMB)Number of
itemsVolume
% of
quantity
sold
Sales
(RMB'000)
% of sales
contribution
% of
discount
items
Average
discount
# of user
comments
Avg volume
sold per
item
# of
comments
per item
0-50 75 1,352 0.8% 54 0.1% 25.3% 30.5% 1,211 18.0 16.1
50-100 215 5,999 3.5% 489 0.7% 24.7% 39.5% 5,508 27.9 25.6
100-150 251 12,284 7.1% 1,650 2.5% 47.0% 45.7% 10,499 48.9 41.8
150-200 490 17,169 9.9% 3,183 4.8% 18.2% 41.6% 13,886 35.0 28.3
200-250 594 14,680 8.5% 3,434 5.2% 18.5% 38.4% 11,979 24.7 20.2
250-300 643 21,702 12.5% 6,260 9.4% 26.1% 36.3% 27,523 33.8 42.8
300-350 578 24,347 14.0% 8,131 12.2% 27.7% 30.7% 27,907 42.1 48.3
350-400 658 21,320 12.3% 8,169 12.3% 19.8% 29.2% 18,323 32.4 27.8
400-450 287 6,402 3.7% 2,758 4.1% 22.6% 28.0% 8,546 22.3 29.8
450-500 445 8,698 5.0% 4,189 6.3% 20.9% 24.8% 9,310 19.5 20.9
500-550 203 2,658 1.5% 1,409 2.1% 8.4% 21.1% 4,743 13.1 23.4
550-600 439 6,743 3.9% 3,930 5.9% 11.2% 22.9% 6,540 15.4 14.9
600-650 180 9,142 5.3% 5,686 8.5% 12.2% 23.4% 11,030 50.8 61.3
650-700 243 9,473 5.5% 6,418 9.6% 18.5% 26.3% 10,284 39.0 42.3
700-750 98 1,142 0.7% 833 1.3% 25.5% 19.9% 2,008 11.7 20.5
750-800 206 2,604 1.5% 2,056 3.1% 15.5% 14.8% 4,039 12.6 19.6
800-850 73 3,428 2.0% 2,817 4.2% 8.2% 6.5% 3,282 47.0 45.0
850-900 152 1,573 0.9% 1,390 2.1% 12.5% 10.5% 2,229 10.3 14.7
900-950 29 65 0.0% 61 0.1% 13.8% 16.7% 72 2.2 2.5
950-1000 92 1,059 0.6% 1,053 1.6% 19.6% 11.0% 1,368 11.5 14.9
1000-1100 79 417 0.2% 452 0.7% 19.0% 14.6% 504 5.3 6.4
1100-1200 50 111 0.1% 131 0.2% 22.0% 11.3% 288 2.2 5.8
1200-1300 47 226 0.1% 293 0.4% 12.8% 2.4% 300 4.8 6.4
1300-1400 35 363 0.2% 506 0.8% 2.9% 30.0% 484 10.4 13.8
1400-1500 15 349 0.2% 514 0.8% 6.7% 1.0% 378 23.3 25.2
1500-1600 10 14 0.0% 22 0.0% 0.0% 0.0% 30 1.4 3.0
1600-1700 16 117 0.1% 198 0.3% 12.5% 0.1% 53 7.3 3.3
1700-1800 2 0 0.0% 0 0.0% 0.0% 0.0% 1 0.0 0.5
1800-1900 6 51 0.0% 97 0.1% 0.0% 0.0% 73 8.5 12.2
1900-2000 6 27 0.0% 54 0.1% 0.0% 0.0% 9 4.5 1.5
>2000 60 84 0.0% 333 0.5% 21.7% 25.7% 126 1.4 2.1
Total 6,277 173,599 100.0% 66,569 100.0% 20.6% 31.2% 182,533 27.7 29.1
Consumer
China Consumer
10 July 2014
page 61 of 78 , Equity Analyst, +852 3743 8036, [email protected] Guo, PhD
Please see important disclosure information on pages 74 - 78 of this report.

and 19% sales contribution in Tmall’s local sportswear category. In particular, Anta and
Xtep earn a higher user comments per item listed on Tmall (Anta 207, Xtep 258) vs Li
Ning (118) and 361 Degrees (86).
The local sportswear companies’ inventory level in traditional stores is normalized from
the highest level of 6-7 months to the current 4.5 months. According to Anta, Li Ning and
Xtep’s management, they are strengthening promotional efforts and expect B2C e-
commerce to account for 5-10% of the companies’ total sales by 15-16e.
Chart 82: Analysis on monthly local sportswear sales from Tmall – by brands
Source: Tmall, Jefferies. Sales samples are based on flagship stores in Tmall
Chart 83: Analysis on monthly local sportswear sales from Tmall – by price range
Source: Tmall, Jefferies. Sales samples are based on flagship stores in Tmall
BrandsNumber of
itemsVolume
ASP
(RMB)
Sales
(RMB'000)
% of sales
contribution
% of
discount
items
Average
discount
# of user
comments
Avg volume
sold per
item
# of
comments
per item
Li Ning 840 66,066 145 9,596 25.8% 6.1% 1.5% 99,173 78.7 118.1
Anta 394 51,765 152 7,884 21.2% 38.3% 30.2% 81,402 131.4 206.6
Xtep 354 40,024 140 5,607 15.1% 85.0% 45.9% 91,290 113.1 257.9
361 Degrees 1,446 57,493 120 6,872 18.5% 98.7% 44.1% 123,881 39.8 85.7
Kappa (dongxiang) 782 24,781 171 4,228 11.4% 21.7% 52.3% 27,443 31.7 35.1
Peak Sports 259 6,533 157 1,025 2.8% 0.0% 0.0% 10,944 25.2 42.3
Fila (Anta's high-end brand) 183 5,539 347 1,923 5.2% 85.8% 22.7% 4,656 30.3 25.4
Total 4,258 252,201 147 37,134 100.0% 53.0% 41.6% 438,789 59.2 103.1
ASP (RMB)Number of
itemsVolume
% of
quantity
sold
Sales
(RMB'000)
% of sales
contribution
% of
discount
items
Average
discount
# of user
comments
Avg volume
sold per
item
# of
comments
per item
0-50 71 4,597 1.8% 212 0.6% 39.4% 53.8% 4,411 64.7 62.1
50-100 707 60,291 23.9% 4,776 12.9% 60.0% 46.2% 61,155 85.3 86.5
100-150 1,071 88,513 35.1% 11,664 31.4% 63.4% 46.3% 156,273 82.6 145.9
150-200 1,078 71,760 28.5% 12,518 33.7% 62.8% 41.0% 162,232 66.6 150.5
200-250 391 11,559 4.6% 2,559 6.9% 38.6% 38.2% 26,522 29.6 67.8
250-300 313 6,202 2.5% 1,725 4.6% 33.2% 29.7% 13,563 19.8 43.3
300-350 162 4,314 1.7% 1,405 3.8% 37.0% 30.3% 6,373 26.6 39.3
350-400 162 2,261 0.9% 854 2.3% 32.7% 25.4% 3,956 14.0 24.4
400-450 51 952 0.4% 413 1.1% 35.3% 30.7% 1,938 18.7 38.0
450-500 89 902 0.4% 436 1.2% 24.7% 18.2% 1,034 10.1 11.6
500-550 33 220 0.1% 116 0.3% 42.4% 15.1% 156 6.7 4.7
550-600 51 200 0.1% 116 0.3% 25.5% 10.3% 459 3.9 9.0
600-650 11 68 0.0% 43 0.1% 27.3% 25.1% 78 6.2 7.1
650-700 13 213 0.1% 144 0.4% 38.5% 10.3% 222 16.4 17.1
700-750 3 0 0.0% 0 0.0% 0.0% 0.0% 103 0.0 34.3
750-800 12 47 0.0% 36 0.1% 16.7% 12.6% 55 3.9 4.6
800-850 1 0 0.0% 0 0.0% 0.0% 0.0% 14 0.0 14.0
850-900 8 35 0.0% 31 0.1% 12.5% 30.8% 97 4.4 12.1
900-950 1 0 0.0% 0 0.0% 100.0% 24.0% 6 0.0 6.0
950-1000 6 9 0.0% 9 0.0% 16.7% 15.3% 12 1.5 2.0
1000-1100 2 0 0.0% 0 0.0% 0.0% 0.0% 14 0.0 7.0
1100-1200 8 1 0.0% 1 0.0% 0.0% 0.0% 35 0.1 4.4
1200-1300 4 0 0.0% 0 0.0% 0.0% 0.0% 7 0.0 1.8
1300-1400 7 52 0.0% 68 0.2% 14.3% 30.4% 72 7.4 10.3
1400-1500 0 0 0.0% 0 0.0% 0.0% 0.0% 0 0.0 0.0
1500-1600 1 5 0.0% 8 0.0% 0.0% 0.0% 2 5.0 2.0
1600-1700 0 0 0.0% 0 0.0% 0.0% 0.0% 0 0.0 0.0
1700-1800 1 0 0.0% 0 0.0% 0.0% 0.0% 0 0.0 0.0
1800-1900 0 0 0.0% 0 0.0% 0.0% 0.0% 0 0.0 0.0
1900-2000 0 0 0.0% 0 0.0% 0.0% 0.0% 0 0.0 0.0
>2000 1 0 0.0% 0 0.0% 0.0% 0.0% 0 0.0 0.0
Total 4,258 252,201 100.0% 37,134 100.0% 53.0% 41.6% 438,789 59.2 103.1
Consumer
China Consumer
10 July 2014
page 62 of 78 , Equity Analyst, +852 3743 8036, [email protected] Guo, PhD
Please see important disclosure information on pages 74 - 78 of this report.

Learning from comparison
We compared our analysis on apparel, footwear and sportswear sales in Tmall, with the
below key findings:
1) International brands generally offer a lower discount level than local brands and a
lower percentage of international brands offer discounts. Local menswear’s average
discount is at 49% vs international brands at 39%; local sportswear offers discounts of
42% on average vs international brands at 31%; local footwear brands offer an average
discount of 47% vs international brands at 34% (on Tmall). Local lifestyle apparel brands
have 28% of the items offering retail discount whereas the similar ratio for international
brands is 31%.
2) Local products tend to have a larger monthly sales volume and value than
international brands, with the sportswear category being an exception. This is largely due
to the popularity of the local brands and lower price. However, we noticed that
international brands are gaining recognition with rising sales in tier 1 and 2 cities and pay
attention to their presence through online channels.
3) Local brands tend to have significantly lower ASP than international peers. Local
brands’ ASP after discount is 17% to 64% cheaper than international brands’.
4) Margins of items sold online are lower than margins of identical items sold in retail
channels, mainly due to heavy online promotion. ASP of items sold online is generally 40-
45% lower than an identical item sold in brick-and-mortar stores. Apparel and sportswear
brands generate 13-14% EBIT margin from retail stores compared with 9-10% from
online; whereas footwear generates 20% EBIT margin from retail stores compared with
c15% from online.
Chart 84: Comparison between international and local footwear
Source: Tmall, Jefferies
Chart 85: Comparison between international and local menswear
Source: Tmall, Jefferies
Chart 86: Comparison between international and local lifestyle apparel
Source: Tmall, Jefferies
CategoryNumber of
itemsVolume sold
ASP after
discountSales ('000)
% of
discount
items
Average
discount
Local footwear 6,921 315,302 256 80,802 81.8% 46.7%
International footwear 1,781 19,167 706 13,526 40.7% 33.5%
Local vs International 289% 15.5x -64% 5x 41.1% 13.2%
CategoryNumber of
itemsVolume sold
ASP after
discountSales ('000)
% of
discount
items
Average
discount
Local menswear 4,318 253,423 238 60,282 77.9% 49.2%
International menswear 1,892 22,292 342 7,628 65.6% 39.1%
Local vs International 128% 10.4x -30% 6.9x 12.2% 10.1%
CategoryNumber of
itemsVolume sold
ASP after
discountSales ('000)
% of
discount
items
Average
discount
Local lifestyle apparel 12,841 1,006,059 135 136,116 31.2% 42.5%
Interational lifestyle apparel 13,968 559,471 163 90,963 28.4% 48.8%
Local vs International -8.1% 79.8% -17% 49.6% 2.8% -6.3%
Consumer
China Consumer
10 July 2014
page 63 of 78 , Equity Analyst, +852 3743 8036, [email protected] Guo, PhD
Please see important disclosure information on pages 74 - 78 of this report.
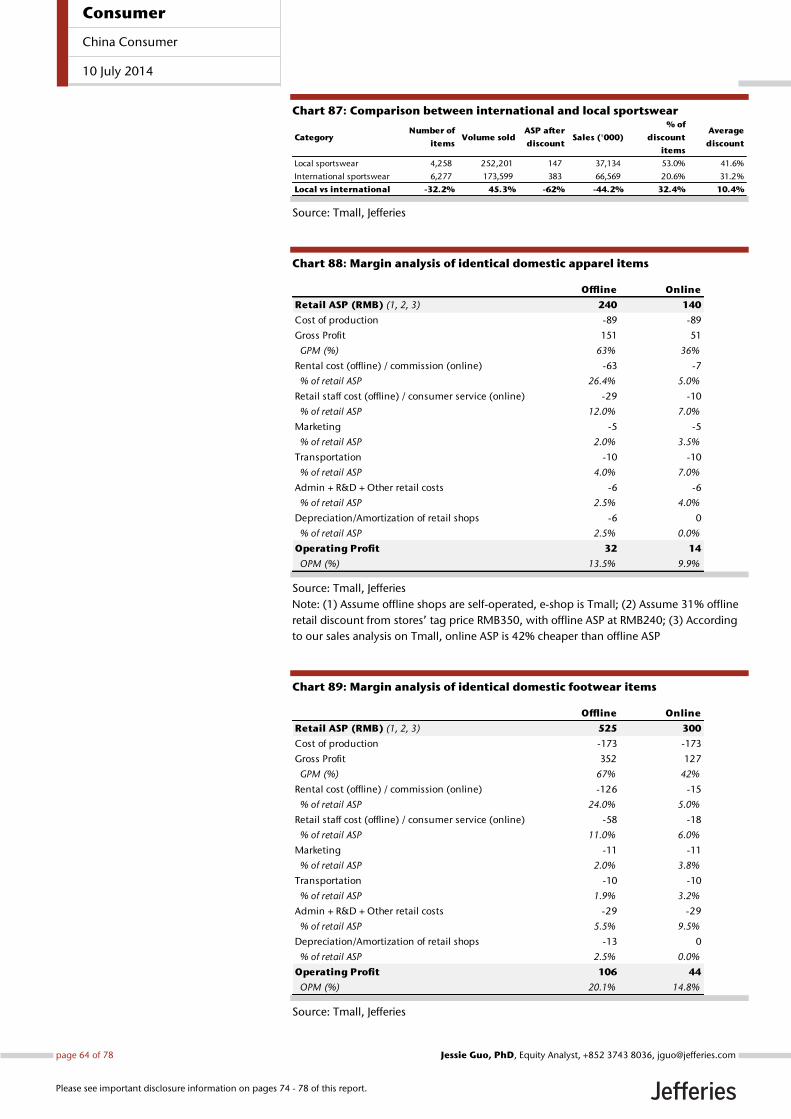
Chart 87: Comparison between international and local sportswear
Source: Tmall, Jefferies
Chart 88: Margin analysis of identical domestic apparel items
Source: Tmall, Jefferies
Note: (1) Assume offline shops are self-operated, e-shop is Tmall; (2) Assume 31% offline
retail discount from stores’ tag price RMB350, with offline ASP at RMB240; (3) According
to our sales analysis on Tmall, online ASP is 42% cheaper than offline ASP
Chart 89: Margin analysis of identical domestic footwear items
Source: Tmall, Jefferies
CategoryNumber of
itemsVolume sold
ASP after
discountSales ('000)
% of
discount
items
Average
discount
Local sportswear 4,258 252,201 147 37,134 53.0% 41.6%
International sportswear 6,277 173,599 383 66,569 20.6% 31.2%
Local vs international -32.2% 45.3% -62% -44.2% 32.4% 10.4%
Offline Online
Retail ASP (RMB) (1, 2, 3) 240 140
Cost of production -89 -89
Gross Profit 151 51
GPM (%) 63% 36%
Rental cost (offline) / commission (online) -63 -7
% of retail ASP 26.4% 5.0%
Retail staff cost (offline) / consumer service (online) -29 -10
% of retail ASP 12.0% 7.0%
Marketing -5 -5
% of retail ASP 2.0% 3.5%
Transportation -10 -10
% of retail ASP 4.0% 7.0%
Admin + R&D + Other retail costs -6 -6
% of retail ASP 2.5% 4.0%
Depreciation/Amortization of retail shops -6 0
% of retail ASP 2.5% 0.0%
Operating Profit 32 14
OPM (%) 13.5% 9.9%
Offline Online
Retail ASP (RMB) (1, 2, 3) 525 300
Cost of production -173 -173
Gross Profit 352 127
GPM (%) 67% 42%
Rental cost (offline) / commission (online) -126 -15
% of retail ASP 24.0% 5.0%
Retail staff cost (offline) / consumer service (online) -58 -18
% of retail ASP 11.0% 6.0%
Marketing -11 -11
% of retail ASP 2.0% 3.8%
Transportation -10 -10
% of retail ASP 1.9% 3.2%
Admin + R&D + Other retail costs -29 -29
% of retail ASP 5.5% 9.5%
Depreciation/Amortization of retail shops -13 0
% of retail ASP 2.5% 0.0%
Operating Profit 106 44
OPM (%) 20.1% 14.8%
Consumer
China Consumer
10 July 2014
page 64 of 78 , Equity Analyst, +852 3743 8036, [email protected] Guo, PhD
Please see important disclosure information on pages 74 - 78 of this report.

Note: (1) assume offline shops are self-operated, e-shop is Tmall; (2) assume 30% offline
retail discount from stores’ tag price RMB750, with offline ASP at RMB525; (3) According
to our sales analysis on Tmall, online ASP is 43% cheaper than offline ASP
Chart 90: Margin analysis of identical domestic sportswear items
Source: Tmall, Jefferies
Note: (1) Assume offline shops are self-operated, e-shop is Tmall; (2) Assume 24% offline
retail discount from stores’ tag price RMB330, with offline ASP at RMB250; (3) According
to our sales analysis on Tmall, online ASP is 40% cheaper than offline ASP
Conclusions and stock implications We expect further penetration from online retail. We believe online sales of
apparel and footwear will further gain share from retail stores due to cheaper prices
offered by online channels, convenience for consumers, and easier logistics arrangement.
According to iResearch, Apparel sales from e-commerce are expected to grow at 28.9%
‘13-16e CAGR, outpacing overall apparel sales at 13% ‘13-16e CAGR.
Local brands face structural challenges due to large price gap between online
and offline. Local brands’ ASP in traditional retail channels are 30-40% higher than e-
retailers. This phenomenon applies to almost all major locals brands: Belle (1880 HK,
Underperform), Giordano (709 HK, Underperform), Daphne (210 HK, Hold), Trinity (891
HK, Hold), China Lilang (1234 HK, Hold), Metersbonwe (002269 CH, NC), Semir (002563
CH, NC) and Septwolves (002029 CH, NC). We believe this trend is unsustainable and
expect offline channels to cut price so as to narrow gaps with online channels. This will
unavoidably lower their margins (given constant other factors). Such a structural
headwind has no ready-made prescription, unfortunately.
International apparel brands take market share from local brands in higher
tier cities. International brands gain rising popularity from Chinese consumers in 1st and
2nd tier cities, in particular, brands like Zara (Inditex, ITX SM, Hold), H&M (HMB SS,
Underperform) and Uniqlo (Fast Retailing, 9983 JP, NC) due to better product offering,
stronger marketing and better consumer services. We expect online channels to become
important channels for international brands to further enhance their presence.
Local sportswear has held up relatively well compared with local apparel and
footwear brands in the face of E-commerce penetration. Local sportswear
Offline Online
Retail ASP (RMB) (1, 2, 3) 250 150
Cost of production -78 -78
Gross Profit 172 72
GPM (%) 69% 48%
Rental cost (offline) / commission (online) -63 -8
% of retail ASP 25.0% 5.0%
Retail staff cost (offline) / consumer service (online) -30 -11
% of retail ASP 12.0% 7.0%
Marketing -18 -18
% of retail ASP 7.0% 12.0%
Transportation -10 -10
% of retail ASP 4.0% 6.5%
Admin + R&D + Other retail costs -13 -13
% of retail ASP 5.0% 8.5%
Depreciation/Amortization of retail shops -6 0
% of retail ASP 2.5% 0.0%
Operating Profit 33 14
OPM (%) 13.3% 9.0%
Consumer
China Consumer
10 July 2014
page 65 of 78 , Equity Analyst, +852 3743 8036, [email protected] Guo, PhD
Please see important disclosure information on pages 74 - 78 of this report.

industry is consolidated within a few well-known brands such as Anta (2020 HK, Buy), Li
Ning (2331 HK, Buy) and Xtep (1368 HK, Buy). The entry barrier to this industry is higher
than apparel. Large brands make serious efforts in brand-enhancement. For instance, Li
Ning, Anta and Xtep’s marketing expenses/sales for sportswear are on average 12-20% vs
2% for apparel and footwear.
Online retail generates lower margins. EBIT margins for apparel, footwear and
sportswear e-retailing are lower than those in traditional stores. ASP of items sold online is
generally 40-45% lower than an identical item sold in brick-and-mortar stores. Apparel
and sportswear brands generate 13-14% EBIT margin from retail stores compared with 9-
10% from online; whereas footwear generates 20% EBIT margin from retail stores
compared with c15% from online.
We take a positive view on sportswear but negative view on apparel and
footwear. We believe sportswear is more defensive in the face of e-commerce
penetration and the sector has troughed as indicated by lower inventory days and
reduced promotions. All these factors, together with compelling valuation, make us prefer
sportswear to apparel and footwear.
We have Buy ratings on Anta (2020 HK, Buy, PT HKD13.5), Li Ning (2331 HK, Buy, PT
HKD7.5) and Xtep (1368 HK, Buy, PT HKD4.5). We have an Underperform rating on Belle
(1880 HK, PT HKD6.8) and Giordano (709 HK, PT HKD3.9), and Hold ratings on Daphne
(210 HK, PT HKD3.2), Trinity (891 HK, PT HKD1.9) and China Lilang (1234 HK, PT
HKD4.6).
.
Consumer
China Consumer
10 July 2014
page 66 of 78 , Equity Analyst, +852 3743 8036, [email protected] Guo, PhD
Please see important disclosure information on pages 74 - 78 of this report.

Sector performance and valuation Jefferies China/HK Staples Index
We compiled 17 staples stocks listed on HKSE to track the sector’s performance. Our key
findings are:
In the March 06 to Oct 07 up cycle, staples underperformed HSCEI by 40%.
In the Nov 07 to Feb 09 down cycle, staples outperformed HSCEI by 18%.
In the March 09 to May 2011 up cycle, staples outperformed HSCEI by 51%.
From June 2011 to now, staples sector outperformed HSCEI by 14%.
The staples sector underperformed HSCEI by 15% in the past six month.
In each cycle, the sector performance was mainly driven by multiple
expansion/contraction, i.e. investor perception, instead of actual EPS growth
which ranged between 5-25%.
The staples sector trades at 21x forward PE.
Chart 91: Jefferies China/HK Staples Index
Source: Bloomberg, Jefferies
Chart 92: 1-yr forward PE band – Jefferies China/HK Staples Index
Source: Bloomberg, Jefferies
Consumer
China Consumer
10 July 2014
page 67 of 78 , Equity Analyst, +852 3743 8036, [email protected] Guo, PhD
Please see important disclosure information on pages 74 - 78 of this report.

Key catalysts and risks
Key catalysts: 1) Pullback of global and domestic agri-commodities prices. 2) Aggressive
ASP rise, led by downstream F&B plays. 3) Favorable weather conditions in China and
major export countries. 4) CPI stays at a low level.
Key risks: 1) Rally in global and domestic agri-commodities prices. 2) Unfavorable
weather conditions in China and major export countries. 3) Food safety issues.
Consumer
China Consumer
10 July 2014
page 68 of 78 , Equity Analyst, +852 3743 8036, [email protected] Guo, PhD
Please see important disclosure information on pages 74 - 78 of this report.

Chart 93: Valuation comparison of consumer staples
Source: Bloomberg, Jefferies estimates; Note: Estimates for NC companies from Bloomberg
Bloomberg Pricing JEF Price JEF Mcap EV/EBITDA (x) P/B (x) P/E (x) ROA (%) ROE (%) CAGR2013-15e Dividend yield Net debt/Equity
Companies Ticker ccy Rating Jul 08 PT (USDm) 2014e 2015e 2014e 2015e 2014e 2015e 2014e 2015e 2014e 2015e 2014e 2015e EPS EBITDA 2014e 2015e 2013 2014e
Beverages
CRE 291 HK HKD Hold 21.7 24.3 6,716 7.3 5.1 1.2 1.1 37.4 29.7 NA 1.1 1.6 1.7 3.7 4.4 3.3 10.6 1.3 1.5 2.0 -3.4Tsingtao 'A' shares 600600 CH CNY Unpf 40.0 36.6 9,643 19.0 15.3 3.6 3.2 27.8 23.5 2.5 1.3 7.2 7.9 13.3 14.3 14.4 11.8 1.2 1.5 -47.8 -37.9Tsingtao 'H' shares 168 HK HKD Unpf 61.0 51.3 9,643 19.0 15.3 4.4 4.0 33.9 28.7 3.1 1.6 7.2 7.9 13.3 14.3 14.4 11.8 1.0 1.2 -47.8 -37.9Beijing Yanjing Breweries 000729 CH CNY NC 6.4 NA 2,903 NA NA 1.5 1.4 20.5 18.7 0.8 1.9 4.6 4.8 6.9 7.4 17.1 NA 2.2 2.7 -0.5 -Huiyuan Juice 1886 HK HKD NC 3.8 NA 970 6.9 5.1 0.6 0.7 17.7 12.8 0.7 0.3 2.6 3.5 4.4 5.5 31.9 NA 0.6 1.3 34.4 -Mean 13.1 10.2 2.2 2.1 27.4 22.7 1.8 1.3 4.6 5.2 8.3 9.2 16.2 11.4 1.3 1.6 -11.9 -26.4
Wines
Kweichow Moutai 600519 CH CNY NC 142.2 NA 26,178 5.8 4.9 3.1 2.5 10.2 9.2 2.0 0.8 24.8 23.1 30.8 28.2 8.3 7.5 3.7 4.6 -50.8 -Wuliangye 000858 CH CNY NC 17.7 NA 10,851 3.4 2.7 1.6 1.4 9.2 9.1 NA 7.6 14.5 13.8 17.5 16.3 -3.7 -5.5 3.3 3.5 -69.5 -Mean 4.6 3.8 2.3 2.0 9.7 9.1 2.0 4.2 19.7 18.5 24.1 22.2 2.3 1.0 3.5 4.0 -60.1 -
Dairy
Huishan 6863 HK HKD Buy 1.8 3.0 3,383 8.9 7.1 1.4 1.3 11.4 8.3 0.3 0.2 10.4 12.2 14.0 16.2 36.5 38.8 0.0 1.9 -6.7 -15.4Biostime 1112 HK HKD Buy 40.9 60.0 3,189 11.9 9.4 6.4 5.4 17.8 14.4 1.5 0.6 21.3 22.5 39.3 40.4 17.7 20.4 3.9 4.8 -70.2 -73.2China Modern Dairy 1117 HK HKD Buy 3.4 3.8 2,105 12.5 10.2 1.9 1.6 14.6 11.1 0.3 0.3 8.8 9.8 14.4 16.4 44.4 38.7 0.0 0.9 70.8 72.3Mengniu 2319 HK HKD Hold 36.0 34.0 9,083 14.1 12.2 2.6 2.5 27.6 23.1 1.8 1.2 7.0 6.5 11.1 11.1 17.4 22.8 0.8 1.0 13.6 -5.4Yili Dairy 600887 CH CNY NC 33.9 NA 11,152 11.4 8.9 3.7 3.1 18.3 14.9 1.5 0.7 11.4 12.0 20.2 20.7 17.3 32.7 1.9 2.2 -24.0 -Bright Dairy 600597 CH CNY NC 15.7 NA 3,105 NA NA 4.1 3.6 30.8 21.4 0.6 0.5 5.4 6.7 12.5 15.7 49.3 25.8 1.5 2.0 -20.9 -Yashili 1230 HK HKD NC 3.0 NA 1,382 14.4 11.2 2.6 2.4 22.3 18.7 NA 1.0 8.4 9.7 11.1 12.7 2.4 24.9 2.0 2.5 -32.9 -Mean 12.2 9.8 3.1 2.7 18.7 15.1 1.1 0.7 11.2 12.1 18.3 19.6 22.6 29.7 1.4 2.2 -8.3 -4.4
Food Processing
Tingyi 322 HK HKD Buy 22.0 26.4 15,860 11.7 9.6 5.0 4.4 31.6 24.9 1.4 0.9 7.8 9.1 16.6 18.9 24.8 17.4 1.6 2.0 14.6 4.0Want Want 151 HK HKD Hold 10.9 10.2 18,593 17.9 15.6 8.6 7.6 27.0 23.7 NA 1.7 16.2 17.7 33.6 34.0 6.9 7.3 2.6 3.0 -41.1 -32.3China Foods 506 HK HKD Hold 2.9 3.6 1,039 10.6 8.7 1.3 1.2 38.9 22.2 NA 0.3 2.5 3.1 3.4 5.7 NA NA 0.5 0.9 19.9 15.5Shuanghui 000895 CH CNY NC 33.6 NA 11,921 9.7 7.7 4.5 3.6 15.3 12.8 0.6 0.7 20.3 20.0 29.8 29.4 22.4 23.3 3.4 4.0 -24.3 -Uni-President Ents 1216 TT TWD NC 56.4 NA 9,720 9.1 8.0 3.2 3.0 21.4 19.3 3.5 1.8 3.4 3.5 12.4 12.4 8.5 NA 2.7 2.9 29.6 -Uni-President China 220 HK HKD NC 5.9 NA 3,277 12.9 11.1 2.0 1.8 28.5 23.0 NA 1.0 2.9 3.2 7.1 7.6 -8.5 23.4 0.7 0.9 56.4 -China Agri 606 HK HKD NC 3.1 NA 2,093 12.9 10.3 0.6 0.5 15.7 10.6 NA 0.2 1.9 2.4 2.4 4.7 0.2 NA 1.2 2.0 54.9 -China Corn Oil 1006 HK HKD NC 7.4 NA 550 5.8 4.2 1.5 1.3 10.4 8.1 0.6 0.3 13.8 15.1 15.7 17.4 22.0 24.0 2.2 2.8 -26.6 -Mean 11.7 9.8 3.5 3.1 22.4 18.3 1.8 1.0 7.7 8.5 14.6 15.8 9.0 18.0 1.8 2.3 14.6 -14.1
Mean (Food Processing + Dairy) 12.3 10.1 3.3 3.0 22.5 18.5 1.8 1.0 8.1 8.8 14.5 15.5 10.1 21.8 1.8 2.1 4.9 -8.4
Staples
Hengan 1044 HK HKD Hold 82.8 84.6 13,122 16.6 14.1 5.6 5.0 26.0 21.8 5.0 1.1 9.4 10.5 22.6 24.4 12.2 13.2 2.3 2.8 -5.7 -4.7Vinda 3331 HK HKD Unpf 11.4 9.6 1,463 13.1 11.6 2.3 2.1 22.8 19.1 NA 1.0 4.8 5.3 10.0 10.9 4.6 10.3 1.3 1.5 44.0 50.2Mean 14.8 12.9 3.9 3.6 24.4 20.4 5.0 1.0 7.1 7.9 16.3 17.7 8.4 11.7 1.8 2.1 19.2 22.8
Mean all (only HK listed) 12.4 10.1 3.1 2.8 23.0 18.5 1.6 0.8 8.3 9.1 14.6 15.9 15.3 20.3 1.4 2.0 4.0 -4.6
PEG (x)
Consumer
China Consumer
10 July 2014
page 69 of 78 , Equity Analyst, +852 3743 8036, [email protected] Guo, PhD
Please see important disclosure information on pages 74 - 78 of this report.
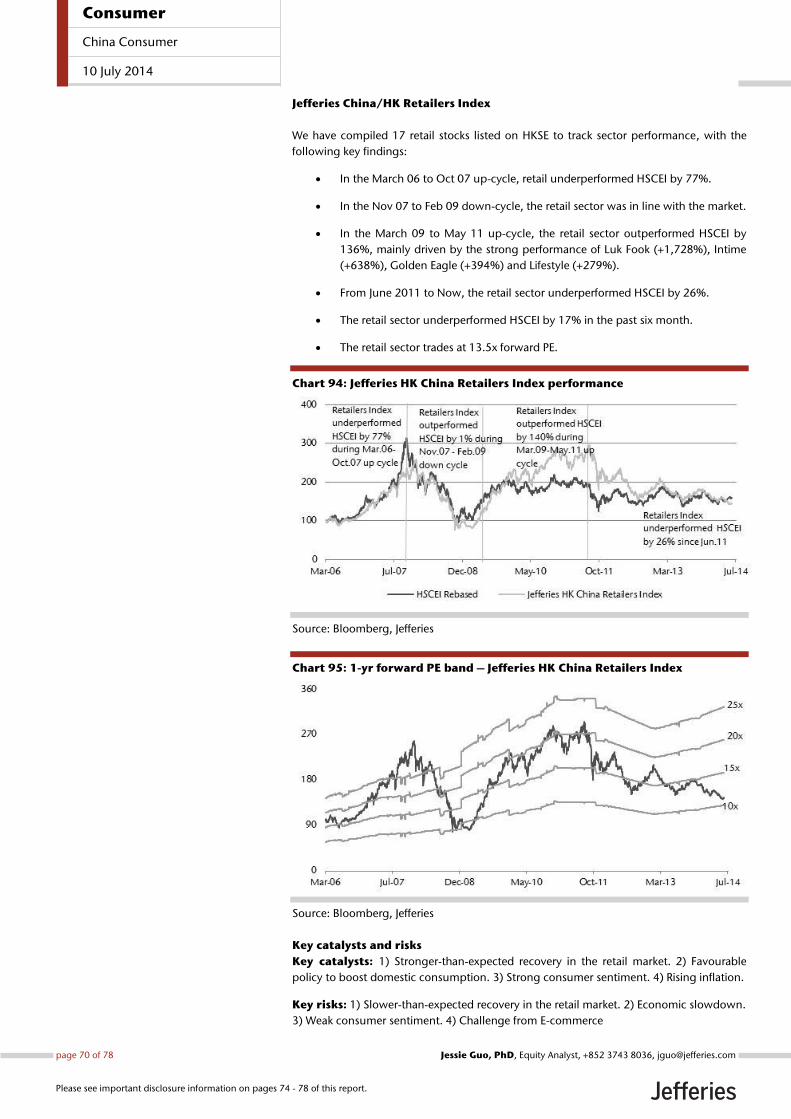
Jefferies China/HK Retailers Index
We have compiled 17 retail stocks listed on HKSE to track sector performance, with the
following key findings:
In the March 06 to Oct 07 up-cycle, retail underperformed HSCEI by 77%.
In the Nov 07 to Feb 09 down-cycle, the retail sector was in line with the market.
In the March 09 to May 11 up-cycle, the retail sector outperformed HSCEI by
136%, mainly driven by the strong performance of Luk Fook (+1,728%), Intime
(+638%), Golden Eagle (+394%) and Lifestyle (+279%).
From June 2011 to Now, the retail sector underperformed HSCEI by 26%.
The retail sector underperformed HSCEI by 17% in the past six month.
The retail sector trades at 13.5x forward PE.
Chart 94: Jefferies HK China Retailers Index performance
Source: Bloomberg, Jefferies
Chart 95: 1-yr forward PE band – Jefferies HK China Retailers Index
Source: Bloomberg, Jefferies
Key catalysts and risks
Key catalysts: 1) Stronger-than-expected recovery in the retail market. 2) Favourable
policy to boost domestic consumption. 3) Strong consumer sentiment. 4) Rising inflation.
Key risks: 1) Slower-than-expected recovery in the retail market. 2) Economic slowdown.
3) Weak consumer sentiment. 4) Challenge from E-commerce
Consumer
China Consumer
10 July 2014
page 70 of 78 , Equity Analyst, +852 3743 8036, [email protected] Guo, PhD
Please see important disclosure information on pages 74 - 78 of this report.

Chart 96: Valuation comparison of retailers
Source: Bloomberg, Jefferies estimates; Note: Estimates for NC companies from Bloomberg
Bloomberg Pricing JEF Price JEF Mcap EV/EBITDA (x) P/B (x) P/E (x) ROA (%) ROE (%) CAGR2013-15e Dividend yield Net debt/Equity
Companies Ticker currency Rating Jul 08 PT (USDm) 2014e 2015e 2014e 2015e 2014e 2015e 2014e 2015e 2014e 2015e 2014e 2015e EPS EBITDA 2014e 2015e 2013 2014e
Department stores
Lifestyle 1212 HK HKD Buy 15.2 18.6 3,197 9.6 8.5 2.1 1.9 11.8 10.5 5.7 0.9 8.0 8.7 19.3 19.2 6.8 7.6 3.4 3.8 19.2 13.3Springland 1700 HK HKD Buy 3.2 4.4 1,016 4.3 4.0 1.3 1.2 8.2 7.6 1.3 1.1 6.3 6.4 16.4 16.1 6.8 7.8 6.1 6.6 -5.2 -6.4Golden Eagle 3308 HK HKD Hold 9.4 11.6 2,177 7.1 6.2 2.3 1.9 11.5 10.0 2.1 0.7 7.6 7.9 21.2 20.9 10.1 10.8 2.6 3.0 -27.9 -11.3Intime 1833 HK HKD Hold 7.2 9.0 2,061 9.3 7.3 1.3 1.2 13.4 11.6 NA 0.8 3.9 4.2 9.2 9.5 7.3 11.1 3.7 4.6 41.7 17.1Parkson 3368 HK HKD Unpf 2.3 1.6 818 4.6 4.6 0.9 0.9 15.8 15.4 NA 5.5 2.4 2.4 5.7 5.7 -3.0 -5.1 2.8 2.9 -28.5 -23.4Maoye 848 HK HKD NC 1.4 NA 930 7.7 6.9 0.9 0.8 7.4 6.7 NA 0.7 4.2 4.3 13.0 12.9 2.9 -2.7 4.0 4.1 79.0 -New World 825 HK HKD NC 3.2 NA 690 3.3 3.0 0.7 0.7 7.6 6.9 1.1 0.6 5.3 5.7 10.2 10.8 8.7 11.7 6.1 6.6 -34.7 -Mean 6.5 5.8 1.4 1.2 10.8 9.8 2.5 1.5 5.4 5.6 13.6 11.9 5.6 5.9 4.1 4.5 -8.7 -1.2
Weighted avg mean 6.8 5.9 1.5 1.3 10.2 9.1 2.0 1.0 5.4 5.8 13.8 13.8 5.9 6.6 3.4 3.8 6.9 2.3
Supermarket
CRE 291 HK HKD Hold 21.7 24.3 6,716 7.7 6.8 1.2 1.1 37.4 29.7 NA 1.1 1.6 1.7 3.7 4.4 3.3 10.6 1.3 1.5 2.0 -3.4Sun Art 6808 HK HKD NC 8.8 NA 10,832 9.1 7.8 3.3 3.0 22.1 19.4 2.2 1.4 5.9 6.2 15.7 16.4 11.9 13.9 2.3 2.6 -36.1 -Wumart 1025 HK HKD NC 6.7 NA 1,114 4.1 3.4 1.7 1.6 12.7 11.4 0.7 1.0 5.2 5.4 14.2 14.7 14.6 66.2 4.0 4.4 -43.2 -Lianhua 980 HK HKD NC 4.4 NA 634 NA NA 1.2 1.1 25.5 19.8 0.1 0.7 0.9 1.0 4.6 6.3 88.1 28.9 1.9 2.6 - -Jingkelong 814 HK HKD NC 1.9 NA 101 NA NA 0.4 0.4 10.5 8.9 2.9 0.5 0.9 0.9 3.6 4.1 10.2 8.7 6.6 7.2 - -Mean 7.0 6.0 1.5 1.4 21.6 17.9 1.5 1.0 2.9 3.1 8.3 9.2 25.6 25.6 3.2 3.7 -25.8 -3.4
Weighted avg 8.0 6.9 2.4 2.2 26.9 22.5 1.3 1.3 4.2 4.4 11.0 11.8 11.6 16.2 2.0 2.4 -22.0 -1.2
Specialty stores
Chow Tai Fook 1929 HK HKD Buy 11.9 13.0 15,380 13.0 11.8 34.3 31.0 17.0 15.3 5.8 1.4 12.3 12.3 18.5 18.5 6.7 6.0 2.9 3.2 27.4 28.8Gome 493 HK HKD Buy 1.3 1.8 2,845 6.0 4.7 1.1 1.0 13.8 11.8 0.3 0.7 3.2 3.5 7.8 8.7 29.1 23.5 2.9 3.4 -39.8 -31.1Suning 002024 CH CNY Hold 6.5 7.0 7,785 NA 65.9 1.8 1.8 NA NA NA NA NA NA NA NA NA -23.1 0.0 0.0 -55.3 -46.8L'Occitane 973 HK HKD Hold 17.8 16.1 3,392 10.3 8.7 2.9 2.6 20.5 17.5 1.7 1.0 10.8 11.7 14.7 15.5 14.8 12.4 1.7 2.0 -31.8 -34.3Luk Fook 590 HK HKD Hold 24.1 23.1 1,832 5.7 5.0 1.7 1.5 8.8 8.2 NA 1.3 16.3 15.6 21.0 19.6 0.4 2.5 4.6 4.9 -16.6 -21.7Chow Sang Sang 116 HK HKD Hold 20.4 21.3 1,777 8.0 7.2 1.6 1.4 10.8 9.7 2.2 0.9 11.1 11.5 15.3 15.4 7.9 7.1 3.5 3.9 10.2 4.2Hengdeli 3389 HK HKD Hold 1.4 1.5 855 6.3 5.9 0.8 0.8 10.3 9.7 0.3 1.7 5.4 5.5 8.9 8.9 17.0 6.7 3.4 3.5 30.2 28.2Sa Sa 178 HK HKD Unpf 5.6 4.5 2,062 11.1 10.2 6.3 5.6 16.6 15.3 2.9 1.9 29.0 28.0 40.4 38.6 6.9 7.0 4.2 4.6 -38.8 -41.1Bonjour 653 HK HKD NC 1.3 NA 550 8.6 7.5 7.1 6.1 12.1 11.1 0.5 1.1 25.6 24.4 69.0 63.0 16.9 19.2 6.0 7.0 - -Emperor Watch 887 HK HKD NC 0.5 NA 462 6.5 5.2 0.8 0.7 11.3 9.3 1.2 0.4 6.0 7.1 7.1 8.3 15.5 13.7 2.5 2.9 -14.9 -Mean (only HK listed) 8.4 7.3 6.3 5.6 13.5 12.0 1.9 1.2 13.3 13.3 22.5 21.8 12.8 10.9 3.5 3.9 -9.3 -9.6
Weighted avg mean 10.7 9.5 19.3 17.5 15.8 14.1 3.7 1.3 12.5 12.6 19.0 18.9 10.2 8.7 3.1 3.4 4.3 5.0
Mean all (only HK listed) 7.5 6.6 3.5 3.2 14.5 12.7 1.9 1.2 8.2 8.3 16.2 15.3 13.5 12.7 3.6 4.1 -11.5 -4.8
Weighted avg mean all 9.1 8.0 10.3 9.4 18.2 15.8 2.6 1.2 8.4 8.6 15.4 15.6 9.8 10.7 2.8 3.1 -3.6 2.5
PEG (x)
Consumer
China Consumer
10 July 2014
page 71 of 78 , Equity Analyst, +852 3743 8036, [email protected] Guo, PhD
Please see important disclosure information on pages 74 - 78 of this report.
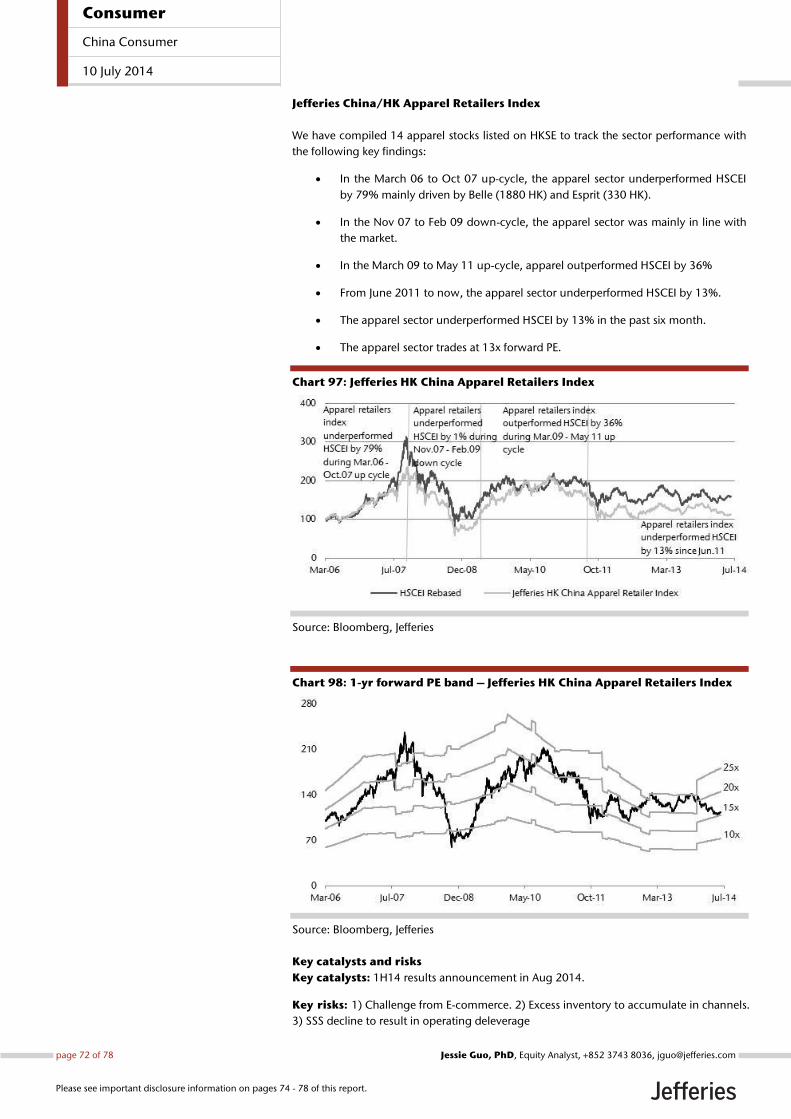
Jefferies China/HK Apparel Retailers Index
We have compiled 14 apparel stocks listed on HKSE to track the sector performance with
the following key findings:
In the March 06 to Oct 07 up-cycle, the apparel sector underperformed HSCEI
by 79% mainly driven by Belle (1880 HK) and Esprit (330 HK).
In the Nov 07 to Feb 09 down-cycle, the apparel sector was mainly in line with
the market.
In the March 09 to May 11 up-cycle, apparel outperformed HSCEI by 36%
From June 2011 to now, the apparel sector underperformed HSCEI by 13%.
The apparel sector underperformed HSCEI by 13% in the past six month.
The apparel sector trades at 13x forward PE.
Chart 97: Jefferies HK China Apparel Retailers Index
Source: Bloomberg, Jefferies
Chart 98: 1-yr forward PE band – Jefferies HK China Apparel Retailers Index
Source: Bloomberg, Jefferies
Key catalysts and risks
Key catalysts: 1H14 results announcement in Aug 2014.
Key risks: 1) Challenge from E-commerce. 2) Excess inventory to accumulate in channels.
3) SSS decline to result in operating deleverage
Consumer
China Consumer
10 July 2014
page 72 of 78 , Equity Analyst, +852 3743 8036, [email protected] Guo, PhD
Please see important disclosure information on pages 74 - 78 of this report.

Chart 99: Valuation comparison of apparel and sportswear
Source: Bloomberg, Jefferies estimates; Note: Estimates for NC companies from Bloomberg
Bloomberg Pricing JEF Price JEF Mcap EV/EBITDA (x) P/B (x) P/E (x) ROA (%) ROE (%) CAGR2013-15e Dividend yield Net debt/Equity (%)
Companies Ticker currency Rating Jul 08 PT (USDm) 2014e 2015e 2014e 2015e 2014e 2015e 2014e 2015e 2014e 2015e 2014e 2015e EPS EBITDA 2014e 2015e 2013 2014e
Apparel retailers
China Lilang 1234 HK HKD Hold 5.3 4.6 820 6.4 5.8 1.9 1.8 9.8 9.1 2.3 1.2 15.2 15.5 19.7 19.8 5.9 5.2 6.8 7.3 -38.8 -41.1
Daphne 210 HK HKD Hold 3.1 3.2 658 3.5 2.7 0.9 0.9 9.8 8.4 0.1 0.5 8.2 8.9 11.5 12.3 41.8 23.6 3.7 4.3 -14.0 -22.9
Trinity 891 HK HKD Hold 1.9 1.9 425 6.3 6.1 0.9 0.9 11.1 10.1 NA 1.0 5.3 5.7 8.4 9.1 2.3 -0.1 6.3 7.4 2.6 -0.3
Belle 1880 HK HKD Unpf 8.8 6.8 9,533 8.1 7.9 2.1 1.9 14.6 14.7 NA NA 12.1 11.2 14.9 13.7 -5.3 -3.8 2.2 2.3 -0.3 -31.9
Giordano 709 HK HKD Unpf 4.7 3.9 944 8.2 7.9 2.4 2.3 14.7 14.5 NA 7.1 11.0 11.1 15.9 16.0 -13.3 -10.9 5.4 5.5 -30.9 -30.6
Prada 1913 HK HKD NC 55.0 NA 18,159 10.7 9.2 4.4 3.8 20.3 18.0 3.9 1.4 16.6 17.0 22.6 22.2 8.8 9.7 2.1 2.5 -13.6 -
Li & Fung 494 HK HKD NC 10.3 NA 11,154 11.1 9.9 2.5 2.3 18.0 15.7 NA 1.1 5.9 6.4 13.6 16.1 -1.0 5.6 4.5 5.0 27.8 -
Samsonite 1910 HK HKD NC 25.4 NA 4,614 11.2 9.4 3.5 3.1 20.4 17.7 0.7 1.2 11.3 12.1 17.3 17.9 21.7 16.2 2.0 2.3 -17.2 -
Espirit 330 HK HKD NC 11.5 NA 2,876 12.2 8.4 1.3 1.2 NA 23.1 NA 0.2 2.6 5.4 3.2 6.5 NA NA 1.1 2.6 -28.0 -
Ports Design 589 HK HKD NC 3.6 NA 258 NA NA NA NA 5.1 4.6 0.9 0.4 NA NA NA NA 9.0 NA 9.7 10.8 -6.2 -
IT 999 HK HKD NC 2.7 NA 432 N.A 3.3 NA 1.0 10.7 8.4 2.2 0.3 NA 6.8 NA 12.7 15.9 NA NA 5.2 2.9 -
Mean 8.2 6.9 2.3 2.0 13.5 12.1 1.7 1.6 10.7 10.5 15.5 15.5 8.6 5.7 4.8 5.3 -8.8 -25.4
Weighted avg mean 9.9 8.8 3.1 2.8 17.9 16.2 1.6 1.1 12.0 12.3 17.6 18.0 4.8 6.1 2.9 3.3 -1.9 -8.1
Sportswear retailers
Anta 2020 HK HKD Buy 13.0 13.5 4,193 10.9 9.3 3.4 3.2 17.6 15.4 1.4 1.1 14.3 15.5 19.9 21.2 13.3 13.0 4.1 4.7 -63.3 -63.1
Li Ning 2331 HK HKD Buy 5.5 7.5 976 9.9 5.5 2.8 2.4 41.2 15.1 NA 0.1 4.3 8.9 6.9 16.9 NA NA 0.8 2.3 26.8 25.4
Xtep 1368 HK HKD Buy 3.3 4.5 924 3.3 2.9 1.2 1.1 9.6 8.9 NA 1.2 8.1 8.3 12.9 13.0 3.1 2.6 5.4 5.8 -58.6 -56.4
361 Degree 1361 HK HKD NC 1.8 NA 470 2.3 1.5 0.6 0.6 10.1 8.5 0.3 0.5 4.5 5.5 6.8 8.2 27.2 26.7 4.3 5.7 -38.4 -
Dongxiang 3818 HK HKD NC 1.5 NA 1,064 28.5 20.9 0.8 0.8 28.4 24.8 2.9 1.7 2.5 2.8 2.7 2.9 12.1 NA 2.3 2.7 -53.3 -
Peak 1968 HK HKD NC 1.9 NA 517 3.1 2.5 0.8 0.7 10.4 9.0 0.4 0.6 5.3 6.2 7.2 8.4 20.9 18.6 5.5 6.8 -52.0 -
Mean 9.6 7.1 1.3 1.4 15.2 13.6 1.2 1.0 6.9 7.7 9.9 10.7 15.3 15.2 4.3 5.1 -53.1 -59.7
Weighted avg 11.4 8.8 2.3 2.2 17.2 15.1 1.5 1.1 10.4 11.3 14.7 15.7 13.2 11.0 4.1 4.7 NA NA
Mean all 8.7 7.1 1.9 1.7 14.0 12.7 1.5 1.4 9.2 9.5 13.4 13.8 10.8 8.9 4.6 5.2 -23.5 -35.2
Weighted avg mean all 10.1 8.9 3.0 2.7 17.8 16.0 1.6 1.1 11.8 12.2 17.2 17.7 6.0 6.7 3.1 3.5 NA NA
PEG (x)
Consumer
China Consumer
10 July 2014
page 73 of 78 , Equity Analyst, +852 3743 8036, [email protected] Guo, PhD
Please see important disclosure information on pages 74 - 78 of this report.

Analyst CertificationI, Jessie Guo, PhD, certify that all of the views expressed in this research report accurately reflect my personal views about the subject security(ies) andsubject company(ies). I also certify that no part of my compensation was, is, or will be, directly or indirectly, related to the specific recommendationsor views expressed in this research report.I, Edwin Fan, CFA, certify that all of the views expressed in this research report accurately reflect my personal views about the subject security(ies) andsubject company(ies). I also certify that no part of my compensation was, is, or will be, directly or indirectly, related to the specific recommendationsor views expressed in this research report.I, Kevin Chee, CFA, certify that all of the views expressed in this research report accurately reflect my personal views about the subject security(ies) andsubject company(ies). I also certify that no part of my compensation was, is, or will be, directly or indirectly, related to the specific recommendationsor views expressed in this research report.I, Jeffrey Zeng, certify that all of the views expressed in this research report accurately reflect my personal views about the subject security(ies) andsubject company(ies). I also certify that no part of my compensation was, is, or will be, directly or indirectly, related to the specific recommendationsor views expressed in this research report.Registration of non-US analysts: Jessie Guo, PhD is employed by Jefferies Hong Kong Limited, a non-US affiliate of Jefferies LLC and is not registered/qualified as a research analyst with FINRA. This analyst(s) may not be an associated person of Jefferies LLC, a FINRA member firm, and therefore maynot be subject to the NASD Rule 2711 and Incorporated NYSE Rule 472 restrictions on communications with a subject company, public appearancesand trading securities held by a research analyst.
Registration of non-US analysts: Edwin Fan, CFA is employed by Jefferies Hong Kong Limited, a non-US affiliate of Jefferies LLC and is not registered/qualified as a research analyst with FINRA. This analyst(s) may not be an associated person of Jefferies LLC, a FINRA member firm, and therefore maynot be subject to the NASD Rule 2711 and Incorporated NYSE Rule 472 restrictions on communications with a subject company, public appearancesand trading securities held by a research analyst.
Registration of non-US analysts: Kevin Chee, CFA is employed by Jefferies Hong Kong Limited, a non-US affiliate of Jefferies LLC and is notregistered/qualified as a research analyst with FINRA. This analyst(s) may not be an associated person of Jefferies LLC, a FINRA member firm, andtherefore may not be subject to the NASD Rule 2711 and Incorporated NYSE Rule 472 restrictions on communications with a subject company, publicappearances and trading securities held by a research analyst.
Registration of non-US analysts: Jeffrey Zeng is employed by Jefferies Hong Kong Limited, a non-US affiliate of Jefferies LLC and is not registered/qualified as a research analyst with FINRA. This analyst(s) may not be an associated person of Jefferies LLC, a FINRA member firm, and therefore maynot be subject to the NASD Rule 2711 and Incorporated NYSE Rule 472 restrictions on communications with a subject company, public appearancesand trading securities held by a research analyst.
As is the case with all Jefferies employees, the analyst(s) responsible for the coverage of the financial instruments discussed in this report receivescompensation based in part on the overall performance of the firm, including investment banking income. We seek to update our research asappropriate, but various regulations may prevent us from doing so. Aside from certain industry reports published on a periodic basis, the large majorityof reports are published at irregular intervals as appropriate in the analyst's judgement.
Company Specific DisclosuresFor Important Disclosure information on companies recommended in this report, please visit our website at https://javatar.bluematrix.com/sellside/Disclosures.action or call 212.284.2300.
Meanings of Jefferies RatingsBuy - Describes stocks that we expect to provide a total return (price appreciation plus yield) of 15% or more within a 12-month period.Hold - Describes stocks that we expect to provide a total return (price appreciation plus yield) of plus 15% or minus 10% within a 12-month period.Underperform - Describes stocks that we expect to provide a total negative return (price appreciation plus yield) of 10% or more within a 12-monthperiod.The expected total return (price appreciation plus yield) for Buy rated stocks with an average stock price consistently below $10 is 20% or more withina 12-month period as these companies are typically more volatile than the overall stock market. For Hold rated stocks with an average stock priceconsistently below $10, the expected total return (price appreciation plus yield) is plus or minus 20% within a 12-month period. For Underperformrated stocks with an average stock price consistently below $10, the expected total return (price appreciation plus yield) is minus 20% within a 12-month period.NR - The investment rating and price target have been temporarily suspended. Such suspensions are in compliance with applicable regulations and/or Jefferies policies.CS - Coverage Suspended. Jefferies has suspended coverage of this company.NC - Not covered. Jefferies does not cover this company.Restricted - Describes issuers where, in conjunction with Jefferies engagement in certain transactions, company policy or applicable securitiesregulations prohibit certain types of communications, including investment recommendations.Monitor - Describes stocks whose company fundamentals and financials are being monitored, and for which no financial projections or opinions onthe investment merits of the company are provided.
Valuation MethodologyJefferies' methodology for assigning ratings may include the following: market capitalization, maturity, growth/value, volatility and expected totalreturn over the next 12 months. The price targets are based on several methodologies, which may include, but are not restricted to, analyses of marketrisk, growth rate, revenue stream, discounted cash flow (DCF), EBITDA, EPS, cash flow (CF), free cash flow (FCF), EV/EBITDA, P/E, PE/growth, P/CF,P/FCF, premium (discount)/average group EV/EBITDA, premium (discount)/average group P/E, sum of the parts, net asset value, dividend returns,and return on equity (ROE) over the next 12 months.
Consumer
China Consumer
10 July 2014
page 74 of 78 , Equity Analyst, +852 3743 8036, [email protected] Guo, PhD
Please see important disclosure information on pages 74 - 78 of this report.
Jefferies Franchise PicksJefferies Franchise Picks include stock selections from among the best stock ideas from our equity analysts over a 12 month period. Stock selectionis based on fundamental analysis and may take into account other factors such as analyst conviction, differentiated analysis, a favorable risk/rewardratio and investment themes that Jefferies analysts are recommending. Jefferies Franchise Picks will include only Buy rated stocks and the numbercan vary depending on analyst recommendations for inclusion. Stocks will be added as new opportunities arise and removed when the reason forinclusion changes, the stock has met its desired return, if it is no longer rated Buy and/or if it underperforms the S&P by 15% or more since inclusion.Franchise Picks are not intended to represent a recommended portfolio of stocks and is not sector based, but we may note where we believe a Pickfalls within an investment style such as growth or value.
Risk which may impede the achievement of our Price TargetThis report was prepared for general circulation and does not provide investment recommendations specific to individual investors. As such, thefinancial instruments discussed in this report may not be suitable for all investors and investors must make their own investment decisions basedupon their specific investment objectives and financial situation utilizing their own financial advisors as they deem necessary. Past performance ofthe financial instruments recommended in this report should not be taken as an indication or guarantee of future results. The price, value of, andincome from, any of the financial instruments mentioned in this report can rise as well as fall and may be affected by changes in economic, financialand political factors. If a financial instrument is denominated in a currency other than the investor's home currency, a change in exchange rates mayadversely affect the price of, value of, or income derived from the financial instrument described in this report. In addition, investors in securities suchas ADRs, whose values are affected by the currency of the underlying security, effectively assume currency risk.
Other Companies Mentioned in This Report• Anta Sports (2020 HK: HK$12.92, BUY)• Belle International (1880 HK: HK$8.79, UNDERPERFORM)• Biostime International Holdings (1112 HK: HK$40.05, BUY)• China Foods Ltd. (506 HK: HK$2.82, HOLD)• China Huishan Dairy (6863 HK: HK$1.80, BUY)• China Lilang (1234 HK: CNY5.17, HOLD)• China Mengniu Dairy Co. Ltd. (2319 HK: HK$36.05, HOLD)• China Modern Dairy Holdings Ltd. (1117 HK: HK$3.38, BUY)• China Resources Enterprise, Limited (291 HK: HK$21.35, HOLD)• Chow Sang Sang Holdings Intl Ltd (116 HK: HK$19.70, HOLD)• Chow Tai Fook Jewellery Co. Ltd (1929 HK: HK$11.84, BUY)• Daphne International (210 HK: HK$3.11, HOLD)• Giordano (709 HK: HK$4.56, UNDERPERFORM)• Golden Eagle Retail Group Ltd. (3308 HK: HK$9.31, HOLD)• Gome Electrical Appliances (493 HK: HK$1.29, BUY)• H&M (HMB SS: SEK286.60, UNDERPERFORM)• Hengan (1044 HK: HK$81.95, HOLD)• Hengdeli Holdings (3389 HK: CNY1.37, HOLD)• Inditex SA (ITX SM: €111.75, HOLD)• Intime Department Store (Group) Co. Ltd. (1833 HK: HK$7.09, HOLD)• JD.com, Inc. (JD: $26.47, BUY)• L'Occitane International S.A. (973 HK: HK$17.78, HOLD)• L'Oreal (OR FP: €124.65, HOLD)• Lifestyle International Holdings Ltd. (1212 HK: HK$15.16, BUY)• Li Ning Co Ltd (2331 HK: CNY5.43, BUY)• Luk Fook Holdings (Intl) Ltd (590 HK: HK$23.65, HOLD)• McDonald's Corp (MCD: $100.09, HOLD)• Parkson Retail Group Ltd. (3368 HK: HK$2.27, UNDERPERFORM)• Sa Sa International Holdings Limited (178 HK: HK$5.74, UNDERPERFORM)• Springland International Holdings Ltd. (1700 HK: HK$3.29, BUY)• Starbucks Corp. (SBUX: $78.56, BUY)• Suning Commerce Group (002024 CH: CNY6.42, HOLD)• Tingyi Holdings Corp. (322 HK: HK$21.75, BUY)• Trinity (891 HK: HK$1.87, HOLD)• Tsingtao Brewery Co. Ltd. (168 HK: HK$60.30, UNDERPERFORM)• Tsingtao Brewery Co. Ltd. (600600 CH: CNY39.00, UNDERPERFORM)• Vinda (3331 HK: HK$11.48, UNDERPERFORM)• Vipshop Holdings Limited (VIPS: $182.14, BUY)• Want Want China Holdings Ltd. (151 HK: HK$10.62, HOLD)• Xtep International (1368 HK: HK$3.34, BUY)• YUM! Brands Inc. (YUM: $82.30, HOLD)
Distribution of RatingsIB Serv./Past 12 Mos.
Rating Count Percent Count Percent
BUY 955 51.76% 246 25.76%HOLD 742 40.22% 119 16.04%UNDERPERFORM 148 8.02% 8 5.41%
Consumer
China Consumer
10 July 2014
page 75 of 78 , Equity Analyst, +852 3743 8036, [email protected] Guo, PhD
Please see important disclosure information on pages 74 - 78 of this report.

Consumer
China Consumer
10 July 2014
page 76 of 78 , Equity Analyst, +852 3743 8036, [email protected] Guo, PhD
Please see important disclosure information on pages 74 - 78 of this report.

Other Important Disclosures
Jefferies Equity Research refers to research reports produced by analysts employed by one of the following Jefferies Group LLC (“Jefferies”) groupcompanies:
United States: Jefferies LLC which is an SEC registered firm and a member of FINRA.
United Kingdom: Jefferies International Limited, which is authorized and regulated by the Financial Conduct Authority; registered in England andWales No. 1978621; registered office: Vintners Place, 68 Upper Thames Street, London EC4V 3BJ; telephone +44 (0)20 7029 8000; facsimile +44 (0)207029 8010.
Hong Kong: Jefferies Hong Kong Limited, which is licensed by the Securities and Futures Commission of Hong Kong with CE number ATS546; locatedat Suite 2201, 22nd Floor, Cheung Kong Center, 2 Queen’s Road Central, Hong Kong.
Singapore: Jefferies Singapore Limited, which is licensed by the Monetary Authority of Singapore; located at 80 Raffles Place #15-20, UOB Plaza 2,Singapore 048624, telephone: +65 6551 3950.
Japan: Jefferies (Japan) Limited, Tokyo Branch, which is a securities company registered by the Financial Services Agency of Japan and is a memberof the Japan Securities Dealers Association; located at Hibiya Marine Bldg, 3F, 1-5-1 Yuraku-cho, Chiyoda-ku, Tokyo 100-0006; telephone +813 52516100; facsimile +813 5251 6101.
India: Jefferies India Private Limited (CIN - U74140MH2007PTC200509), which is licensed by the Securities and Exchange Board of India as a MerchantBanker (INM000011443) and a Stock Broker with Bombay Stock Exchange Limited (INB011491033) and National Stock Exchange of India Limited(INB231491037) in the Capital Market Segment; located at 42/43, 2 North Avenue, Maker Maxity, Bandra-Kurla Complex, Bandra (East) Mumbai 400051, India; Tel +91 22 4356 6000.
This material has been prepared by Jefferies employing appropriate expertise, and in the belief that it is fair and not misleading. The information setforth herein was obtained from sources believed to be reliable, but has not been independently verified by Jefferies. Therefore, except for any obligationunder applicable rules we do not guarantee its accuracy. Additional and supporting information is available upon request. Unless prohibited by theprovisions of Regulation S of the U.S. Securities Act of 1933, this material is distributed in the United States ("US"), by Jefferies LLC, a US-registeredbroker-dealer, which accepts responsibility for its contents in accordance with the provisions of Rule 15a-6, under the US Securities Exchange Act of1934. Transactions by or on behalf of any US person may only be effected through Jefferies LLC. In the United Kingdom and European EconomicArea this report is issued and/or approved for distribution by Jefferies International Limited and is intended for use only by persons who have, or havebeen assessed as having, suitable professional experience and expertise, or by persons to whom it can be otherwise lawfully distributed. JefferiesInternational Limited has adopted a conflicts management policy in connection with the preparation and publication of research, the details of whichare available upon request in writing to the Compliance Officer. Jefferies International Limited may allow its analysts to undertake private consultancywork. Jefferies International Limited’s conflicts management policy sets out the arrangements Jefferies International Limited employs to manage anypotential conflicts of interest that may arise as a result of such consultancy work. For Canadian investors, this material is intended for use only byprofessional or institutional investors. None of the investments or investment services mentioned or described herein is available to other personsor to anyone in Canada who is not a "Designated Institution" as defined by the Securities Act (Ontario). In Singapore, Jefferies Singapore Limited isregulated by the Monetary Authority of Singapore. For investors in the Republic of Singapore, this material is provided by Jefferies Singapore Limitedpursuant to Regulation 32C of the Financial Advisers Regulations. The material contained in this document is intended solely for accredited, expert orinstitutional investors, as defined under the Securities and Futures Act (Cap. 289 of Singapore). If there are any matters arising from, or in connectionwith this material, please contact Jefferies Singapore Limited, located at 80 Raffles Place #15-20, UOB Plaza 2, Singapore 048624, telephone: +656551 3950. In Japan this material is issued and distributed by Jefferies (Japan) Limited to institutional investors only. In Hong Kong, this report isissued and approved by Jefferies Hong Kong Limited and is intended for use only by professional investors as defined in the Hong Kong Securities andFutures Ordinance and its subsidiary legislation. In the Republic of China (Taiwan), this report should not be distributed. The research in relation tothis report is conducted outside the PRC. This report does not constitute an offer to sell or the solicitation of an offer to buy any securities in the PRC.PRC investors shall have the relevant qualifications to invest in such securities and shall be responsible for obtaining all relevant approvals, licenses,verifications and/or registrations from the relevant governmental authorities themselves. In India this report is made available by Jefferies India PrivateLimited. In Australia this information is issued solely by Jefferies International Limited and is directed solely at wholesale clients within the meaning ofthe Corporations Act 2001 of Australia (the "Act") in connection with their consideration of any investment or investment service that is the subject ofthis document. Any offer or issue that is the subject of this document does not require, and this document is not, a disclosure document or productdisclosure statement within the meaning of the Act. Jefferies International Limited is authorised and regulated by the Financial Conduct Authorityunder the laws of the United Kingdom, which differ from Australian laws. Jefferies International Limited has obtained relief under Australian Securitiesand Investments Commission Class Order 03/1099, which conditionally exempts it from holding an Australian financial services licence under theAct in respect of the provision of certain financial services to wholesale clients. Recipients of this document in any other jurisdictions should informthemselves about and observe any applicable legal requirements in relation to the receipt of this document.
This report is not an offer or solicitation of an offer to buy or sell any security or derivative instrument, or to make any investment. Any opinion orestimate constitutes the preparer's best judgment as of the date of preparation, and is subject to change without notice. Jefferies assumes no obligationto maintain or update this report based on subsequent information and events. Jefferies, its associates or affiliates, and its respective officers, directors,and employees may have long or short positions in, or may buy or sell any of the securities, derivative instruments or other investments mentioned ordescribed herein, either as agent or as principal for their own account. Upon request Jefferies may provide specialized research products or servicesto certain customers focusing on the prospects for individual covered stocks as compared to other covered stocks over varying time horizons orunder differing market conditions. While the views expressed in these situations may not always be directionally consistent with the long-term viewsexpressed in the analyst's published research, the analyst has a reasonable basis and any inconsistencies can be reasonably explained. This materialdoes not constitute a personal recommendation or take into account the particular investment objectives, financial situations, or needs of individualclients. Clients should consider whether any advice or recommendation in this report is suitable for their particular circumstances and, if appropriate,seek professional advice, including tax advice. The price and value of the investments referred to herein and the income from them may fluctuate. Pastperformance is not a guide to future performance, future returns are not guaranteed, and a loss of original capital may occur. Fluctuations in exchangerates could have adverse effects on the value or price of, or income derived from, certain investments. This report has been prepared independently ofany issuer of securities mentioned herein and not in connection with any proposed offering of securities or as agent of any issuer of securities. Noneof Jefferies, any of its affiliates or its research analysts has any authority whatsoever to make any representations or warranty on behalf of the issuer(s).Jefferies policy prohibits research personnel from disclosing a recommendation, investment rating, or investment thesis for review by an issuer prior
Consumer
China Consumer
10 July 2014
page 77 of 78 , Equity Analyst, +852 3743 8036, [email protected] Guo, PhD
Please see important disclosure information on pages 74 - 78 of this report.

to the publication of a research report containing such rating, recommendation or investment thesis. Any comments or statements made herein arethose of the author(s) and may differ from the views of Jefferies.
This report may contain information obtained from third parties, including ratings from credit ratings agencies such as Standard & Poor’s. Reproductionand distribution of third party content in any form is prohibited except with the prior written permission of the related third party. Third party contentproviders do not guarantee the accuracy, completeness, timeliness or availability of any information, including ratings, and are not responsible forany errors or omissions (negligent or otherwise), regardless of the cause, or for the results obtained from the use of such content. Third party contentproviders give no express or implied warranties, including, but not limited to, any warranties of merchantability or fitness for a particular purpose oruse. Third party content providers shall not be liable for any direct, indirect, incidental, exemplary, compensatory, punitive, special or consequentialdamages, costs, expenses, legal fees, or losses (including lost income or profits and opportunity costs) in connection with any use of their content,including ratings. Credit ratings are statements of opinions and are not statements of fact or recommendations to purchase, hold or sell securities. Theydo not address the suitability of securities or the suitability of securities for investment purposes, and should not be relied on as investment advice.
Jefferies research reports are disseminated and available primarily electronically, and, in some cases, in printed form. Electronic research issimultaneously available to all clients. This report or any portion hereof may not be reprinted, sold or redistributed without the written consent ofJefferies. Neither Jefferies nor any officer nor employee of Jefferies accepts any liability whatsoever for any direct, indirect or consequential damagesor losses arising from any use of this report or its contents.
For Important Disclosure information, please visit our website at https://javatar.bluematrix.com/sellside/Disclosures.action or call 1.888.JEFFERIES
© 2014 Jefferies Group LLC
Consumer
China Consumer
10 July 2014
page 78 of 78 , Equity Analyst, +852 3743 8036, [email protected] Guo, PhD
Please see important disclosure information on pages 74 - 78 of this report.