
Constitutive Modeling and Experiments for the Micro and ...
108
Louisiana State University LSU Digital Commons LSU Doctoral Dissertations Graduate School 2015 Constitutive Modeling and Experiments for the Micro and Nano Behaviors in Metals Cheng Zhang Louisiana State University and Agricultural and Mechanical College, [email protected] Follow this and additional works at: hps://digitalcommons.lsu.edu/gradschool_dissertations Part of the Engineering Science and Materials Commons is Dissertation is brought to you for free and open access by the Graduate School at LSU Digital Commons. It has been accepted for inclusion in LSU Doctoral Dissertations by an authorized graduate school editor of LSU Digital Commons. For more information, please contact[email protected]. Recommended Citation Zhang, Cheng, "Constitutive Modeling and Experiments for the Micro and Nano Behaviors in Metals" (2015). LSU Doctoral Dissertations. 2422. hps://digitalcommons.lsu.edu/gradschool_dissertations/2422
Transcript of Constitutive Modeling and Experiments for the Micro and ...

Louisiana State UniversityLSU Digital Commons
LSU Doctoral Dissertations Graduate School
2015
Constitutive Modeling and Experiments for theMicro and Nano Behaviors in MetalsCheng ZhangLouisiana State University and Agricultural and Mechanical College, [email protected]
Follow this and additional works at: https://digitalcommons.lsu.edu/gradschool_dissertations
Part of the Engineering Science and Materials Commons
This Dissertation is brought to you for free and open access by the Graduate School at LSU Digital Commons. It has been accepted for inclusion inLSU Doctoral Dissertations by an authorized graduate school editor of LSU Digital Commons. For more information, please [email protected].
Recommended CitationZhang, Cheng, "Constitutive Modeling and Experiments for the Micro and Nano Behaviors in Metals" (2015). LSU DoctoralDissertations. 2422.https://digitalcommons.lsu.edu/gradschool_dissertations/2422

CONSTITUTIVE MODELING AND EXPERIMENTS FOR THE MICRO AND NANO
BEHAVIORS IN METALS
A Dissertation
Submitted to the Graduate Faculty of the
Louisiana State University and
Agricultural and Mechanical College
in partial fulfillment of the
requirements for the degree of
Doctor of Philosophy
in
The Interdisciplinary Program
in Engineering Science
by
Cheng Zhang
B.E., University of Science and Technology of China, 2008
May 2016

ii
TO MY BELOVED PARENTS
WHO NEVER END PATIENCE AND CONTINUOUS ENCOURAGEMENT

iii
ACKNOWLEDGEMENTS
Firstly, I would like to thank my advisor Boyd Professor George Z. Voyiadjis for his patient
guidance and solid support. Professor Voyiadjis introduced me into the world of scientific
research. His mentorship was paramount in providing me with a well-round experience
throughout my doctoral program. Without him, this work would never have started and not to
mention the completion.
Secondly, I would like to thank my doctoral committee members: Dr. Wen Jin Meng, Dr.
Dorel Moldovan, Dr. Guoxiang Gu and Dr. Kemin Zhu for their support and patience in reading
this dissertation and supervising my general exam and final exam. Thank my committee for their
pertinent comments and valuable advice.
I would also like to thank all the members of the advanced Computational Solid Mechanics
(CSM) Laboratory: Dr. Babur Deliktas, Dr. Adam Lodygowaski, Dr. Danial Faghihi, Dr. Navid
Mozaffari, Mohammed Yousef, Mohammadreza Yaghoobi, Aref Samadi-Dooki, Leila
Malekmotiei, Yooseob Song and Reza Namakian for their companionship in providing an
excellent working environment.
Last but certainly not least, I would like to thank my parents for their great support and love.
They helped me through all the hard times. I am very grateful for the birth of my daughter Jessie
on my way to my PhD. With my wife and Jessie, it feels like home when I spent time with them.

iv
TABLE OF CONTENTS
ACKNOWLEDGEMENTS ........................................................................................................... iii
ABSTRACT ................................................................................................................................... vi
CHAPTER 1: INTRODUCTION ................................................................................................... 1
1.1 Problem Statement ................................................................................................................ 1
1.2 Objectives and Fundamental Concepts ................................................................................. 2
1.3 Outline ................................................................................................................................... 3
CHAPTER 2: NANOINDENTATION TESTING AND SAMPLE PREPARATION .................. 6
2.1 Determination of mechanical properties from basic IIT data ............................................... 6
2.2 Continuous Stiffness Measurement (CSM)........................................................................... 8
2.3 Tip Calibration ...................................................................................................................... 9
2.4 Sample Preparation ............................................................................................................. 10
CHAPTER 3: MECHANICAL CHARACTERIZATION DURING NANOINDENTATION IN
POLYCRYSTALLINE METALS* .............................................................................................. 13
3.1 Introduction ......................................................................................................................... 13
3.2 Strain Gradient Theory and Material Intrinsic Length Scale .............................................. 18
3.3 Determination of the Material Length Scale and the Hardening-Softening Effect ............. 22
3.3.1 Derivation of the hardness expression based on the model of the temperature and rate
indentation size effect (TRISE) ............................................................................................. 22
3.3.2 Derivation of the macro-hardness ................................................................................. 27
3.3.3 Determination of the equivalent plastic strain .............................................................. 28
3.4 Nanoindentation Experiments and Sample Preparation ...................................................... 35
3.5 Applications of the TRISE Model on Metals ...................................................................... 37
3.5.1 The strain rate dependency during nanoindentations in metals .................................... 37
3.5.2 Grain boundary effect during nanoindentations ........................................................... 39
3.6 Conclusion ........................................................................................................................... 41
CHAPTER 4: MECHANICAL CHARACTERIZATION DURING NANOINDENTATION
NEAR THE GRAIN GOUNDARY IN FCC METALS*............................................................. 43
4.1 Introduction ......................................................................................................................... 43
4.2 Determination of the Length Scales using Modified TRISE Model ................................... 45
4.3 Sample Preparation ............................................................................................................. 47
4.4 Nanoindentation Experiments near the Grain Noundary .................................................... 48
4.5 Finite Element Simulation ................................................................................................... 54
4.6 Comparison between the Model and the Experiments ........................................................ 55

v
4.7 Rate Dependency of the Length Scale ................................................................................ 57
4.8 Conclusion ........................................................................................................................... 60
CHAPTER 5: NONLOCAL GRADIENT PLASTICITY THEORY ........................................... 61
5.1 Introduction ......................................................................................................................... 61
5.2 Weak Form of the Nonlocal Formulation ........................................................................... 63
5.3 Thermodynamically Consistent Gradient Formulation ....................................................... 65
5.4 Nonlocal Theory in the Microstructural Basis .................................................................... 70
5.5 Shear Band Problem ............................................................................................................ 75
5.6 Conclusion ........................................................................................................................... 79
CHAPTER 6: SUMMARY, CONCLUSION AND FUTURE PERSPECTIVE ......................... 81
6.1 Summary ............................................................................................................................. 81
6.2 Conclusions ......................................................................................................................... 82
6.3 Suggestions and future perspectives ................................................................................... 83
BIBLIOGRAPHY ......................................................................................................................... 84
Part I: by the Author .................................................................................................................. 84
Part II: by Other Authors ........................................................................................................... 85
APPENDIX: ELSEVIER LICENSES .......................................................................................... 97
1. Elsevier License Number One............................................................................................... 97
1.1 Confirmation Letter ......................................................................................................... 97
1.2 Order Details.................................................................................................................... 98
2. Elsevier License Number Two .............................................................................................. 99
2.1 Confirmation Letter ......................................................................................................... 99
2.2 Order Details.................................................................................................................. 100
VITA ........................................................................................................................................... 101

vi
ABSTRACT
This work addresses the micro- and nano-behaviors in metals through constitutive modeling
and experiments. The size effect encountered during nanoindentation experiments, which is
known as indentation size effect (ISE), is investigated for metal materials. The ISE is believed to
be related with the strain gradient at small indentation depths. Geometrically necessary
dislocations (GNDs) are formed in order to accommodate the strain gradient, which results in the
increase in the material hardness. The grain boundaries in polycrystalline materials play an
important role on the material hardness during nanoindentation experiments as there is a soften-
hardening segment in the curve of hardness as a function of the indentation depth. The grain
boundaries act as barriers of the movement of dislocations that leads to an increase of the
dislocation density. The increasing dislocation density gives the additional increase in material
hardness, resulting in the hardening phenomenon.
The classical continuum mechanics has to be enhanced with the strain gradient plasticity
theory in order to address the ISE. Using the strain gradient plasticity theory, a material intrinsic
length scale parameter is incorporated. The length scale bridges the gap between the behaviors in
macro-scale and the micro-/nano-scale. The ISE of different materials can be characterized using
this length scale parameter. The length scale parameter is determined through the strain plasticity
model, the nanoindetation experiments using continuous stiffness measurement (CSM) mode in
determining the fitting parameters and the finite element method (FEM) in determining the
equivalent plasticity strain in the expression of the length scale.
The rate dependency of ISE is investigated and it shows that the hardness increases with the
increasing strain rate. The length scales at different strain rates are determined and they decrease
with the increasing strain rate, leading to the increase in the hardness. The grain boundary effect
on the hardness is verified as there is no hardening-softening phenomenon in single crystalline
materials as there is no grain boundary in them. The grain boundary effect is further isolated by
using bicrystalline materials. The single grain boundary is investigated through nanoindentation
experiments from different distances to the grain boundary. The results show that the hardness
increase as the distance decreases, providing a new type of size effect.

1
CHAPTER 1
INTRODUCTION
The goal of the current research is to address the mechanical behaviors in metals during
nanoindentation experiments through the constitutive modeling and experimental results. This
introduction chapter presents the motivation and the importance of this work, while the details
are presented in the following chapters.
1.1 Problem Statement
The scientific research on the mechanical behaviors in the micro- and nano-scale has shown
its great importance over the past two decades in microelectronics, nanotechnology and micro-
electro-mechanical systems (MEMS). It has a significant impact on the markets such as home
appliances, transportation, aerospace, defense, etc. Moreover, addressing the mechanical
behaviors in metals in small scales provides the opportunity to investigate the fundamental
problems in micro- and nano-mechanics and material science.
Size effect has been found in metals in small scales such as micro-bending, micro-torsion and
bulge test, etc (Fleck and Hutchinson, 1997; Stolken and Evans, 1998; Chen et al., 2007; Xiang
and Vlassak, 2005). The classical continuum mechanics is not able to predict the size effect
encountered in the above experiments. In order to address the size effect, the classical theory
needs to be enhanced with the strain gradient plasticity theory. It is known that the size effect is
mainly attributed to the geometrically necessary dislocations (GNDs) and the interaction
between the statistically stored dislocations (SSDs) and the GNDs. It is also known that the grain
boundaries play an important role in the size effect as the mechanical behaviors in metals depend
on the grain size and position of the grain boundary.
In nanoindetation experiments, it shows that the hardness is greater at smaller indentation
depth. This type of size effect encountered in nanoindentaion experiments is termed as
indentation size effect (ISE). It has been found that in nanoindentation experiments for
polycrystalline metals, there is a harden-softening segment in the curve of hardness as a function
of the indentation depth instead of the solely decreasing hardness curve. It is attributed to the
interactions between the dislocations and the grain boundaries. In order to address the ISE using
strain gradient plasticity, a material intrinsic length scale parameter needs to be incorporated in
order to bridge the gap between the macro-scale and the micro-/nano-scale, since the classical
continuum mechanics is only capable to predict the hardness in the macro-scale. In addition, in
order to address the hardening-softening phenomenon, the grain boundary effect must be
considered in the modeling and the experiments. It also shows in nanoindentation experiments
that the hardness is temperature and rate dependent. Therefore, the temperature and rate
dependency of the length scale parameter needs to be investigated. The mechanical behaviors in
different metals can then be characterized by the length scale parameter.

2
1.2 Objectives and Fundamental Concepts
The main objective of this research is to address the mechanical behaviors in metals during
nanoindentation experiments. The strain gradient plasticity theory enhanced continuum
mechanics is applied in order to predict the indentation size effect, incorporating a material
intrinsic length scale parameter. The determination of the length scale parameter requires the
modeling from the strain gradient plasticity theory and the nanoindentation experimental results.
With the material intrinsic length scale parameter, ISE in different metals can be characterized.
Moreover, the grain boundary effect is considered in order to predict the hardening-softening
phenomenon. The grain boundary effect and the rate dependency are also investigated in this
work. The framework of this dissertation is summarized as follows:
1. Developing the constitutive relations for modeling the flow stress of metals from micro-
scale and macro-scales in order to derive the expression the length scale parameter. Strain
gradient plasticity theory is enhanced in the continuum mechanics in order to connect the
constitutive relations between the micro-scale and the macro-scale. In the micro-scale view, the
dislocations play an important role in determining the inelastic behaviors of metals and the flow
stresses. According to Taylor’s hardening law, the shear flow stress is related to the dislocation
density. In nanoindentation experiments in the submicron level, there are statistically stored
dislocations (SSDs) generated from the plastic deformation. There are also geometrically
necessary dislocations (GNDs) due to the inhomogeneous plastic flow from the strain gradient.
Therefore, the flow stress in the micro-scale view is related to the coupling the GND density and
the SSD density. In the macro-scale view, according to the strain gradient plasticity theory, the
plastic strain at a point is not only dependent on the local counterpart at this point but also
dependent on the strain gradient in the neighboring space. This means the total plastic strain is a
coupling between the strain at the local point and the strain gradient. Because of the presence of
the strain gradient, a length scale parameter is required in order to characterize the effect of the
strain gradient and to maintain the dimension consistency at the same time. The flow stress can
be derived in the macro-scale from the plastic strain, which means the flow stress in the macro-
scale level is related with material length scale. Combining the flow stresses from the macro- and
the micro-scales yields the expression of the length scale that is able to predict the behaviors in
both micro-scale and the macro-scale.
2. Determining the length scale parameter through the nanoindentation experiments. The
expression of the length scale has several material parameters that need to be determined through
nanoindentation experiments. A computational model of the material hardness is proposed as a
function of the indentation depth through the length scale parameter. By comparing the
computational model and the hardness curve from the experiments, the material parameters can
be determined. The model for hardness is derived through the GND and SSD densities. In
macro-scale, the hardness is only related to the SSDs as there are no GNDs in large scales.
However, in micro-scale, the hardness is dependent on both GNDs and SSDs. Combining the
expression of hardness at different scales gives the hardness as a function of the macro-hardness

3
and the densities of GNDs and SSDs. The GND density can be calculated by the total dislocation
length and the plastic volume under the indenter as a function of the indentation depth. The SSD
density can be expressed through the strain gradient plastic theory with the length scale
parameter incorporated. Therefore, the model for hardness is a function of the indentation depth
as it is presented from the experiments and the length scale parameter is included in the
expression so as the material parameters in the length scale expression.
3. Considering the grain boundary effect in order to capture the hardening-softening
phenomenon in the hardness-indentation depth curve. The interaction between the moving
dislocations and the grain boundaries is believed to cause the hardening-softening phenomenon
in the nanoindentation experiments. Due to the difficulty of dislocations in transferring the grain
boundary, the dislocations accumulate near the grain boundary, which leads to the increase of the
dislocation density so as the material hardness. A grain size parameter is included in the
expression of the length scale and the model of hardness. The hardness and the length scale
varies with different grain sizes, providing another type of size effect as the smaller the grain, the
greater the material hardness. In order to isolate the grain boundary effect, bicrystalline metals
are chosen as the experimental specimens. As there is only one grain boundary in the specimen,
the parameter of the grain size is replaced with the distance between the indenter and the grain
boundary. The accumulation of the dislocations varies with the different distances. The
nanoindentation experiments show that the smaller the distance, the greater the material
hardness, providing a size effect about the distance between the indenter and the grain boundary.
By determining the length scale parameter, the behaviors for various grain boundary conditions
can be characterized.
4. Determining the parameter of the equivalent plastic strain during nanoindentation using
finite element method (FEM). In the expression of the length scale, there is a parameter about the
equivalent plastic strain. It is difficult to determine this parameter through the experiments.
Therefore, numerical simulations using FEM for the indentation problem are used in order to
determine the equivalent plastic strain as a function of the indentation depth. In addition, in order
to characterize the difference between crystalline structures, such as face-centered cubic (FCC)
and body-centered cubic (BCC), a user-subroutine VUMAT in numerical analysis software
ABAQUS is implemented in the simulation. The VUMAT provides the constitutive relations for
the simulation based on a framework of a thermodynamically consistent mathematical
formulation for the condition of small deformations. Using a radial-mapping algorithm, the
stress-strain relations can be provided for FCC and BCC metals. From the simulation with
ABAQUS with VUMAT, the expression of the equivalent plastic strain can be obtained as a
function of the indentation depth.
1.3 Outline
This dissertation presents the work in the 4 following chapters with the details of
development of the models, the preparation of the testing samples and the nanoindentation
experimental steps and results.

4
In Chapter 2, it presents the details in the work of the sample preparation and the
nanoindentation technology. In order to prepare the sample appropriate for the nanoindentation
experiments, it requires a flat and smooth surface of the sample without the plastic deformation
and the contamination. Therefore, several grinding and polishing steps are needed. Mechanical
grinding is required first in order to level the surface in order to obtain a flat surface. The
following mechanical polishing steps are performed in order to decrease the surface roughness in
order to obtain a smooth surface. In order to remove the plastic deformation layer from the
previous mechanical polishing steps, chemical-mechanical polishing steps are performed in order
to remove the strain hardening effect. Finally, the vibratory polishing is required in order to
remove the contamination from the previous polishing steps.
The hardness during nanoindentation experiments is determined through the Oliver-Pharr
method. The hardness value is determined through the contact stiffness in the initial unloading
curve. Each loading-unloading cycle gives a single value of hardness. In order to obtain a curve
of the hardness versus the indentation depth, the continuous stiffness measurement (CSM) mode
is required as it provides the measurement of the hardness as a function of the indentation depth
at a single indenting point. The Berkovich indenter tip needs to be calibrated in order to
determine the accurate values for the hardness.
In Chapter 3, the modeling and experiments of the mechanical behaviors are presented for
polycrystalline and single crystalline metals. Strain gradient plasticity theory enhanced
continuum mechanics is applied in order to predict the indentation size effect (ISE) encountered
during the nanoindenation experiments, which incorporates a material intrinsic length scale
parameter. Grain boundary effect is considered in order to predict the hardening-softening
segment in the hardness curve by adding a grain size parameter in the expression of the length
scale and the computational model for the hardness. Nanoindentation experiments are performed
on polycrystalline and single crystalline metals. The equivalent plastic strain as a function of the
indentation depth is obtained through the finite element method (FEM) using numerical software
ABAQUS with the user material subroutine VUMAT implemented. By comparing the hardness
as a function of the indentation depth from the computational model and the nanoindentation
experiments, the material length scale parameter for each material is determined.
The rate dependency of the length scale parameter is investigated by altering the strain rate
parameter in the expression of the length scale and the computational expression of the hardness.
Nanoindentation experiments with different strain rates are performed on polycrystalline metals.
The length scales at different strain rates are determined from the model and the experiments.
In Chapter 4, the investigation of the ISE focuses on the bicrystalline metals to isolate the
grain boundary effect in order to verify the contribution of the grain boundary on the hardening-
softening phenomenon. Based on the modeling for polycrystalline metals, the model is modified
in order to be compatible with bicrystalline metals. The grain size parameter in the
polycrystalline metals is replaced with the distance between the indenter and the grain boundary
in nanoindentation experiments. Nanoindentation experiments are performed on bicrystalline
metals near the grain boundary with different distances to the grain boundary. By comparing the

5
modified model and the experiments on the bicrystalline sample, the new type of size effect
about the distance between the indented position and the grain boundary is introduced. The
length scale parameter that characterizes this type of size effect is determined.
The rate dependency of the bicrystalline metal sample is investigated by performing
nanoindentation experiments at different strain rates with the same distance to the grain
boundary. The length scales at different strain rates are determined from the model and the
experiments.
In Chapter 5, the nonlocal theory is given beginning with the integral format. The
formulations are provided in both macro-scale through the thermodynamic consistent framework
and micro-scale through the dislocation theory. The starting equation in determining the length
scale presented in Chapter 3 is derived in this chapter. Shear band problem is taken as an
example of the use of nonlocal theory in solving the numerical simulation problems.
In Chapter 6, this work is summarized and future suggestions are given.
6
CHAPTER 2
NANOINDENTATION TESTING AND SAMPLE PREPARATION
Instrumented-indentation testing (IIT) has been developed over the last two decades for the
purpose of determining the mechanical properties of small volumes of materials. IIT employs a
high-resolution actuator to push the indenter into a sample surface and a high-resolution sensor
to measure the penetration results continuously. One of the great advantages of this technique is
that the contact area can be obtained from the testing data alone. It is not necessary to directly
image the indentation. IIT is widely applied in order to measure the properties such as the
hardness and the elastic modulus.
2.1 Determination of mechanical properties from basic IIT data
As the indenter is pushed in to the material, both elastic and plastic deformation takes place,
causing the formation of an impression conforming to the shape of the indenter at certain contact
depth ℎ𝑐. As the indenter is withdrawn, only the elastic deformation recovers, which allows one
to determine the elastic properties of a material. The hardness of the testing sample is determined
using the equation
𝐻 =𝑃
𝐴
(2.1)
where P is the load applied to the testing sample an A is the projected contact area at that load.
The elastic modulus of the testing sample, E, is determined through the reduced modulus, 𝐸𝑟,
given by:
𝐸𝑟 =√𝜋 ∙ 𝑆
2𝛽√𝐴
(2.2)
where 𝛽 is a constant that depends only on the geometry of the indenter; S is the elastic stiffness
of the contact that can be determined from the slope of the initial portion of the unloading curve.
The elastic modulus of the testing material, E, is calculated from the reduced modulus and the
elastic modulus of the indenter in the following expression:
1
𝐸𝑟=
1 − 𝜐2
𝐸+
1 − 𝜐𝑖2
𝐸𝑖
(2.3)
where 𝜐 is the Poisson’s ratio for the testing material and 𝐸𝑖 and 𝜐𝑖 are the elastic modulus and
Poisson’s ratio of the indenter, respectively. For a diamond indenter, the elastic modulus is
𝐸𝑖 = 1141 𝐺𝑃𝑎 and 𝜐𝑖 = 0.07. As the Equation (2.2) is founded through the elastic contact
theory that holds for any indenter that can be expressed as a body of revolution of a smooth

7
function, it is derived for an axisymmetric indenter and only applies to the circular contacts with
𝛽 = 1. However, if different values of 𝛽 are used, it has been shown that Equation (2.2) works
well even when the indenter is not axisymmetric. For instance, the Vickers pyramidal indenters
with square cross sections can be used with 𝛽 = 1.012; the Berkovich and the cube-corner
indenters that have triangular cross sections can be used with 𝛽 = 1.034.
From Equations (2.1) and (2.2), it is clear that the accurate measurement of the elastic contact
stiffness S and the projected contact area under the load A must be obtained in order to calculate
the hardness and the elastic modulus. One of the primary distinctions between IIT and the
traditional hardness testing is that the area is established from the analysis of the indentation load
versus indentation depth data, rather than by imaging. The most famous method for calculating
the contact area was developed by Oliver and Pharr (1992). The analytical procedure starts by
fitting the unloading curve into a power-law relation as:
𝑃 = 𝐵(ℎ − ℎ𝑓)𝑚
(2.4)
where P is the load applied to the testing sample, h is the resulting penetration depth, B and m are
fitting parameters determined empirically, and ℎ𝑓 is the final indentation depth after the
unloading is complete determined by curve fitting. As the unloading stiffness is equal to the
slope of the unloading curve, S is determined by analytically differentiating Equation (2.4) at the
maximum depth of penetration ℎ𝑚𝑎𝑥 such as
𝑆 =𝑑𝑃
𝑑ℎ= 𝐵𝑚 (ℎ − ℎ𝑓)
𝑚−1|
ℎ=ℎ𝑚𝑎𝑥
(2.5)
It shows from experiments that Equation (2.4) does not provide an adequate description of
the entire unloading curve. It is thus prudent practice to determine the contact stiffness by fitting
only the initial 25% to 50% of the unloading data.
The contact depth over which the testing material makes contact with the indenter is
generally different from the total indentation depth. Therefore, the contact depth, ℎ𝑐 is estimated
using
ℎ𝑐 = ℎ −휀𝑃
𝑆
(2.6)
where 휀 is a constant which depends on the geometry of the indenter. For spherical indenters,
휀 = 0.75 and for conical indenters, 휀 = 0.72. There is empirical justification for using 휀 = 0.75
for Berkovich and Vickers indenters as well. Although Equation (2.6) is established based on the
elastic contact theory, it works well even when the contact causes significant plastic deformation.
As stated in Equation (2.6), one can note that the contact depth is always less than the total
indentation depth. Thus it cannot account for the plastic phenomenon of pile-up.

8
The projected contact area, A, is calculated by evaluating an empirically determined area
function at the contact depth, ℎ𝑐, that is
𝐴 = 𝑓(ℎ𝑐) = 24.56ℎ𝑐2 + 𝐶1ℎ𝑐 + 𝐶2ℎ𝑐
1/2+ 𝐶3ℎ𝑐
1/4+ ⋯ + 𝐶8ℎ𝑐
1/128 (2.7)
Equation (2.7) is the area function for the Berkovich indenters. The lead term is the projected
area of a perfect Berkovich indenter. The rest terms describe the deviations from the geometry of
the Berkovich indenter due to blunting at the tip. 𝐶1 through 𝐶8 are constants determined from
the tip calibration.
2.2 Continuous Stiffness Measurement (CSM)
From the previous section, one can note that the hardness of a material is determined through
the beginning portion of the unloading curve which means each loading-unloading cycle can
only provide one value for the calculated hardness at the maximum indentation depth. In order to
investigate the relation between the hardness and the indentation depth, one must perform
nanoindentation experiments at different indentation depths on different points. The hardness
values are determined as discrete points and one needs to connect those points into a hardness
curve. There are some limitations on this method. Firstly, in order to increase the efficiency, one
can only perform experiments for a certain indentation depth interval, which may cause the miss
capture of the material property between each two indentation depths. Secondly, for the
experiments in each indentation depth, multiple indentations must be made for statistical
consideration, which increases the total number of indentations greatly. Moreover, the surface
conditions must be consistent for a large area in order to be capable for the large number of
indentations, which increases the difficulty for the sample preparation.
The “Continuous Stiffness Measurement (CSM)” option allows the continuous measurement
of the contact stiffness during the entire loading procedure, and not just the initial unload. This is
accomplished by superimposing a small oscillation on the primary loading signal and analyzing
the resulting response of the system by means of a frequency-specific amplifier. CSM relies on
an accurate dynamic model of the indentation machine to allow the isolation of the material
response from the total dynamic response and determine the material parameters from that. From
the dynamic response, the elastic contact stiffness S is determined continuously. Therefore, with
the CSM option, one can dynamically obtain the hardness and the elastic modulus as a
continuous function of the indentation depth.
The CSM option in the nanoindenter allows one to perform the experiments at various
constant strain rates. Unlike the tension or compression tests, the strain field underneath the
indenter tip is not homogeneous but is a complex strain field does not have a single value. So the
strain field in IIT experiments is characterized with a single quantity, often referred to as the
characteristic strain. Empirical studies in metals (Tabor, 1951) have shown that the characteristic
strain can be used to correlate the hardness determined with the indentation tests to the flow

9
stress in uniaxial tests. For spherical indenters, the characteristic strain changes continuously
with the indentation depth as
휀 = 0.2𝑎/𝑅 (2.8)
where a is the radius of the residual impression and R is the radius of the indenter. The factor 0.2
in Equation (2.8) is a fitting parameter, which is used for other indenter geometries as well.
For sharp self-similar indenters (Vickers, Berkovich), the derivative of the indenter profile
function is constant no matter what the load or the indentation depth is. The characteristic strain
is therefore independent of the indentation depth as:
휀 = 0.2 cot 𝜓 (2.9)
where 𝜓 is the half-included angle of the indenter for cones. For pyramidal indenters, 𝜓 is the
half-included angle of the cone that has the same area-to-depth relationship. The shape of the
indentation maed from a sharp indenter is therefore the same at all indentation depths and the
characteristic strain is constant. The strain rate in the experiments with a sharp indenter is
therefore a measure of the velocity of the penetration of the indenter but not exactly a measure of
the rate of change in the characteristic strain. The strain rate, 휀̇, in nanoindentation experiments
is then defined as
휀̇ =ℎ�̇�
ℎ𝑐 𝑜𝑟 휀̇ =
�̇�
𝑃
(2.10)
Therefore, a constant strain rate in nanoindentation experiments with CSM option implies an
increasing indentation tip velocity.
2.3 Tip Calibration
The accuracy of the determined hardness and the elastic modulus of the testing material relies
on the accuracy of the tip area function presented in Equation (2.7). Due to the shape change on
the indenter tip from blunting after prolonged use, the projected contact area varies and the area
function gives various constants. In order to determine the accurate constants for the area
function, tip calibration needs be performed on the standard material, fused silica. Fused silica
has a well-known elastic modulus 𝐸 = 72 𝐺𝑃𝑎 and its property is stable and does not change
along with time.
In a nanoindentation experiments, the load and the indentation depth are the quantities
measured direct from the sensor of the machine and they are not dependent on the tip geometry.
In addition, at small indentation depth for the self-similar indenters, the material hardness
exhibits an indentation size effect. However, the elastic modulus does not have an indentation
size effect. Therefore, as long as the testing results provide a correct and constant value of the

10
elastic modulus over the whole range of the indentation depth, the constants in the area function
can be determined. Using the calibrated constants, one can determine the testing hardness
accurately.
The tip calibration starts with performing nanoindentation experiments on the fused silica
sample at a certain indentation depth that is needed. It should be noted that the calibration
procedures for the basic option and the CSM option in the nanoindenter are not the same. For the
CSM option, as the elastic modulus can be determined as a continuous function of the
indentation depth at a single point, it requires to perform 20 to 25 indentations on the fused silica
sample at the certain indentation depth. For the basic option, as each indentation only yields one
value of the hardness at its maximum indentation depth, experiments must be performed on
different points with different indentation depths. For each depth, multiple tests are
recommended for the statistical consideration. Once the tests are complete, check the results of
the load versus indentation depth curves and delete the curves with significant deviations from
the most curves as this kind of deviations may be due to the different surface conditions at
different indenting points. The Analyst software is applied in order to collect the load and
indentation depth data in order to determine the constants in the area function. After loading the
data into the Analyst software, lead term of the area function needs to be input. For a Berkovich
tip, the manufacturer provides the data sheet for each tip and the lead term may be slightly
different. Since the fused silica always has the constant elastic modulus about 72 𝐺𝑃𝑎, one needs
to input this value into the software. Then the software applies the testing data to calculate the
elastic modulus to be 72 𝐺𝑃𝑎. During the calculation, the constants in the area function can be
determined through the curve fitting inside the software. The constants determined from the
calibration need to be input into the nanoindenter software in the tip information option. With the
new constants, there should be a constant value of the elastic modulus with 72 ± 2 𝐺𝑃𝑎 over the
entire range of the indentation depth after recalculating the tests. The calibration results show
that the nanoindentation experiments can determine the correct value of the elastic modulus. The
elastic modulus is related with the projected area which is described as an area function with
several constants. With the correct elastic modulus determined, it means that the hardness
determined through the tests is the accurate value as the accuracy of the hardness calculation
depends on the projected area.
2.4 Sample Preparation
In order to accurately determine the material parameters using IIT, it is imperative that the
surface must be smooth with a low surface roughness. The mechanical properties are determined
from the contact area and in the governing equations, it is assumed that the surface is flat. The
allowable surface roughness in IIT depends on the anticipated indentation depth of the indenter.
It should be noted that the greatest problem arise when the wavelength of the surface roughness
is comparable to the contact diameter. Therefore, a surface roughness is desired to be less than
10% of the indentation depth (Samuels, 2003). Since the indentation size effect is always

11
observed in the submicron scale and the hardening-softening in the hardness curve begins at
50 𝜇𝑚, it is crucial to create a surface with the roughness less than 5 nm. The roughness is also
important in the surface detection and the artifacts in the hardness curves. Peaks in the rough
surface could result in an erroneous surface detection during nanoindentations, leading to a
horizontal shift of the hardness curve giving rise to inconsistent occurrence of the anticipated
hardening-softening phenomenon. This would make it impossible to conclude whether the
indentation depth at which the hardening-softening phenomenon occurs is actually different
between experiments or if the differences are caused by errors in the measurement.
In order to make sure the mechanical properties of the base material are measured instead of
the properties of a work hardened material, the sample surface should be free of plastic
deformation. The work hardening could result in the increase in the material hardness, which is
difficult to be separated from the increase in hardness of the size effect and the grain boundary
effect. In order to obtain a flat surface, mechanical polishing steps are applied, which leads to the
plastic deformation in the new surface. This will locally change the mechanical properties at the
surface thereby affecting the IIT measurement (Wang et al. 2011; Miyahara et al., 1998). The
thickness of the plastic deformation layer depends on the size of the polishing abrasives and
particles, the smaller the abrasives and the particles, the less thickness of the plastic deformation
layer.
A preferred surface treatment starts with mechanical polishing with abrasive polishing papers
with silicon carbide particles. The initial size of the particles in the polishing paper depends on
the initial surface condition of the sample. The larger particles are chosen for the surface with
higher roughness. The polishing using the polishing paper with a certain particle size is complete
by observing the surface under the optical microscope. If the scratches are uniformly created by
the current polishing step, the polishing can move to the next step with the polishing paper with a
smaller particle size. Repeat the polishing in the initial step and then use smaller particle
polishing paper in the next few steps. With decreasing polishing particles, the scratches become
smaller. After changing to the next polishing paper, one needs to make sure that the scratches
created from the previous steps are fully overridden. If there are scratches from the previous
steps cannot be fully overridden using the current polishing particles, one needs to go back and
use larger particles in order to override the previous scratches. The polishing paper in the first
step could be the paper with 240 grits to the one with 800 grits depending on the initial surface
condition. After the polishing using the paper with 1200 grits, the next step is an increasingly
finer mechanical polishing with a suspension with various sizes of diamond particles. It usually
starts with the suspension with 3 𝜇𝑚 diamond particles. The diamond particles are usually
applied on a polishing cloth in a suspension with water and alcohol. Each polishing step should
remove the deformed layer caused by the previous steps, leaving the deformation layer with the
minimum thickness. The smaller the polishing particles chosen, the long the polishing time
should be applied in order to remove the residual surface deformation from the steps with larger
polishing particles. This is because the larger polishing particles induce a deformation layer with
a greater thickness. The speed of removing a layer slows down as the particles become smaller.

12
After the final mechanical polishing step, a chemical-mechanical polishing step is required.
During this step, a colloidal silica suspension with 0.05 𝜇𝑚 sized particles is used. The chemical
reaction between the suspension and the surface layer in the sample makes the sample more
brittle, allowing the extremely small particles to remove the material without causing significant
deformation. Small amounts of reagents may be added to the suspension in order to increase the
polishing rate, without causing a significant etching effect. The chemical-mechanical should
continue until the deformation layer from the mechanical polishing steps is fully removed,
resulting in an almost deformation and scratch free surface.
Electro-polishing should be applied in order to obtain a truly deformation-free surface. The
material removal in electro-polishing is based on oxidizing and subsequently dissolving material
in an electrolyte. Therefore, it does not cause any deformation of the surface. The small
deformation layer in the chemical-mechanical polishing step is completely removed, providing a
surface with the same properties with the base material. As the electrical current density is
greater at the surface peaks, electro-polishing has a higher removal rate at the surface peaks and
smoothens the surface even further by reducing sharp surface asperities to more blunt wavelike
asperities. The quality of the surface after the electro-polishing is therefore dependent on the
quality of the previous polishing steps. Relatively large features such as scratches cannot be
removed by the electro-polishing. The theory behind the electro-polishing is rather
straightforward. However, the actual process is very sensitive to process parameters such as
voltage, current, types of electrolytes and the material to be polished.
If the chemical-mechanical polishing step is performed in the vibratory polisher, the minor
deformation remaining after the mechanical polishing can be removed, revealing a deformation-
free surface without the need of the hazardous electrolytes required by electro-polishing (Dayton,
1963). The specimen finished using a vibratory is suitable for electron-backscatter diffraction
(EBSD) or atomic force microscopy (AFM).

*This chapter previously appeared as [Voyiadjis, George Z., and Cheng Zhang. "The mechanical
behavior during nanoindentation near the grain boundary in a bicrystal FCC metal." Materials Science
and Engineering: A 621 (2015): 218-228.] and as [Zhang, Cheng, and George Z. Voyiadjis. "Rate-
dependent size effects and material length scales in nanoindentation near the grain boundary for a
bicrystal FCC metal." Materials Science and Engineering: A 659 (2016): 55-62.]. It is partially reprinted
by permission of Elsevier.
13
CHAPTER 3
MECHANICAL CHARACTERIZATION DURING NANOINDENTATION IN
POLYCRYSTALLINE METALS*
3.1 Introduction
The size effects of the mechanical properties in metals such as the flow stress or the hardness
have been widely investigated in the literature (Voyiadjis and Abu Al-Rub, 2004; Abu Al-Rub
and Voyiadjis, 2004). The introduction of the material length scale shows its great importance in
characterizing the size effects (Fleck and Hutchinson, 1993, 1997). The classical continuum
mechanics (Hill, 1950) is not able to predict the size effects as it does not incorporate the
material length scales.
As pointed out in many researches, the size effects of the mechanical properties are due to an
increase in the strain gradient in the small deformation volume, which leads to the geometrically
necessary dislocations (GNDs) (Nye, 1953). The GNDs are generated in order to accommodate
the inhomogeneous plastic deformation, causing the additional strengthening (De Guzman et al.,
1993; Stelmashenko et al., 1993; Fleck et al., 1994; Ma and Clark, 1995; Arsenlis and Parks,
1999; Busso et al., 2000; Gao and Huang, 2003). In order to address the size effects, the strain
gradient plasticity theory are proposed by introducing the strain gradient in the constitutive
relationships in order to account for the microstructural interaction (Aifantis, 1992; Zbib and
Aifantis, 1992; Fleck and Hutchinson, 1997; Bammann et al., 1999; Voyiadjis and Deliktas,
2000, 2001; Voyiadjis and Dorgan, 2001; Voyiadjis et al., 2001; Wang et al., 2003). The plastic
strain at a local point is assumed to be dependent not only on the strain at that point but also on
the strain gradient in the neighboring volume. The representative length scale of the strain field is
proposed in order to set the qualitative and quantitative behavior of the size effect. In this
manner, the strain gradient plasticity enhanced continuum mechanics bridges the gap between
the macro- and micro-/nano-scale by describing the behavior in small scales using the continuum
theory in the large scale. This theory shows reasonable agreements with the size effects
encountered at small scales through several applications such as the strengthening of twist wires
with reducing diameters (Fleck et al., 1994), the strengthening in the micro-bending of beams
with reducing thicknesses (Stolken and Evans, 1998; Gao and Huang, 2001; Wang et al., 2003),
particle-reinforced composites (Begley and Hutchinson, 1998; Saha et al., 2001; Xue et al.,
2002a), micro-electro-mechanical systems (MEMS) (Xue et al. 2002c) and indentations (Gao et
al. 1999a,b; Huang et al., 2000; Guo et al., 2001; Xue et al., 2002b). The major issue in strain
gradient plasticity theory is the determination of the material intrinsic length scale that scales
with the strain gradient through the constitutive relations from the information of macroscopic
tests as well as micro-mechanical tests. It is shown that the indentation tests may be the most

14
effective tests in order to measure the length scale parameter (Begley and Hutchinson, 1998).
The indentation test is able to measure the hardness of metals by pushing a hard indenter into a
relatively softer material. The load to push the indenter is measured as a function of the
indentation depth. Micro- and nanoindentation experiments have shown that the hardness
increase with the decreasing indentation depth at small depths (McElhaney et al., 1998;
Voyiadjis and Abu Al-Rub, 2004, 2005; Ma and Clarke, 1995; Voyiadjis and Peters, 2010). This
phenomenon is termed as the indentation size effect (ISE) as shown in Figure 3.1. Since the ISE
cannot captured by the classic continuum theory, it has been one of the motivations underlying
the development of the plasticity theory in the micro-scale. The understanding of size effects and
their relation with the mechanical properties of a material is desired in the applications such as
thin film and multilayers, as nano- and micro-indentations are the important way in order to
measure the mechanical properties (Voyiadjis and Almasri, 2009).
Figure 3.1 Indentation size effect (ISE) and the prediction of the hardness from the classical
theory (dashed line) and the strain gradient plasticity with the length scale parameter.
The classical nanoindentation experiments show that the hardness decreases with the
increasing indentation depth and approaches to the macro-hardness that can be predicted by the
classical continuum theory (Figure 3.1). The increase of the hardness at small indentation depths
is believed to be attributed with the GNDs and the interaction between the statistically stored
dislocations (SSDs) and the GNDs. In the microscopic scale, the flow stress so as the hardness is
related to the dislocation density. SSDs are generated along with the plastic deformation caused
by the penetration of the indenter. However, in the small indentation depth, strain gradient is
present due to the inhomogeneous deformation during the indentation, the smaller the
indentation depth, the higher the strain gradient. GNDs are generated in order to accommodate
this deformation, resulting in the increase of the dislocation density in the small volume. The
increase of the dislocation density causes the increase in the hardness at small indentation depth.

15
In order to address the ISE, the classical theory needs to be enhanced with the strain gradient
plasticity theory in order to include the strain gradient in the small volume. A material intrinsic
length scale parameter is required in order to characterize the effects of the strain gradient and to
keep the dimensions consistent. It is of great importance to determine the length scale parameter
because it characterizes the size effect encountered during nanoindentations for different
materials. Each material has its own intrinsic length scale.
In order to determine the material length scale through the strain gradient plasticity theory, an
expression that describes the hardness as a function of the indentation depth is required because
there are material parameters in the expression of the length scale and the parameters need to be
determined by comparing the hardness expression and the nanoindentation results. Nix and Gao
(1998) introduced the concept of the strain gradient plasticity theory on the basis of the
dislocation density. They related the GND density with the indentation depth and therefore, the
hardness as a function of the indentation depth can be expressed using GND density and SSD
density. Voyiadjis and Abu Al-Rub (Voyiadjis and Abu Al-Rub, 2004, 2005; Abu Al-Rub and
Voyiadjis, 2004) developed the method of Nix and Gao (1998) and obtained a correlation
between the hardness for the spherical and conical indenters. The above studies were successful
in predicting the ISE and in determining the indentation depth.
However, recent nanoindentation experiments have shown that, instead of the solely
decreasing hardness with the increasing indentation depth, there is a hardening-softening
segment in the hardness-indentation depth curve (Yang and Vehoff, 2007) as shown in Figure
3.2. Voyiadjis and Almasri (2008) addressed the hardening-softening phenomenon using a
Figure 3.2 Schematic H-h curve from the experiments of Yang and Vehoff (2007).

16
framework of the empirical expressions for the hardness as a function of the indentation depth
based on a power law relation (Almasri and Voyiadjis, 2007; Voyiadjis and Almasri, 2008, 2009;
Almasri and Voyiadjis, 2010). The hardness curve was divided into three regions as the initial
softening region, the following hardening region and the final softening region. Nanoindentation
experiments were performed on several metals with a high surface roughness. The hardening-
softening phenomenon was observed during nanoindentation experiments. This empirical
framework showed a good agreement with the experimental results. However, it lacks the
physical basis for the justification of these relations that describe the hardening-softening
phenomenon. Voyiadjis and Peters (2010) provided the physical justification by attributing the
hardening-softening phenomenon to the interaction between the dislocations and the grain
boundary as shown in Figure 3.3. They indicated that the grain boundaries in polycrystalline
metals act as barriers for the movement of the dislocations as there is difficulty for dislocations
in transferring across the grain boundary. At very small indentation depth, there is no grain
boundary effect as the plastic zone of dislocations is small (Figure 3.3, a). At this stage, the
hardness curve follows the classical nanoindentations, giving a decreasing hardness as the
increasing indentation depth as shown in Region III, Figure 3.2. With the increase of the
indentation depth, the plastic zone expands due to the movement of dislocations and when it
reaches the grain boundary, the dislocations accumulate near the grain boundaries (Figure 3.3,
b), resulting in the increase in the dislocation density as well as the material hardness (Region II,
Figure 3.2). Once the dislocations start to transfer across the grain boundary (Figure 3.3, c), the
dislocation density decreases, leading to a decrease in hardness (Region I, Figure 3.2). They
developed the expression for hardness based on a solid physical background and added the grain
size parameter into the expression.
(a) (b) (c)
Figure 3.3 Interactions of the dislocations and the grain boundary.
By incorporating the expression of the hardness as a function of the indentation depth, the
material length scales with constant values were obtained by several researchers using micro-
and nanoindentation experiments (Begley and Hutchinson, 1998; Nix and Gao, 1998’ Yuan and
Chen, 2001). Voyiadjis and Abu Al-Rub (2005) observed that the material length scale is
proportional with the mean free path. This observation suggests that the material length scale is
not a constant material parameter but varies with the deformation of the microstructures. The

17
change in the length scale is also physically consistent because of the continuous modification of
the material characteristics with deformation. Voyiadjis and Abu Al-Rub (2005) suggested a
semi-empirical expression for the length scale as a function of the accumulated plastic strain, the
grain size and the hardening exponent.
In the indentation tests, the hardness of a material depends on the indentation depth, which
can be related to the equivalent plastic strain. Hardness in metals is also sensitive to the strain
rate and the temperature. Koeppel and Subhash (1999) applied the elastic stress-wave
propagation in a slender rod and then correlated the yield stress with the hardness in order to
determine the Vickers indentation hardness. It showed that the size of the plastic zone under the
indenter highly depended on yield. Anton and Subhash (2000) studied the rate effects in hardness
and fracture toughness by using the same hardness tester. Lu et al. (2003) introduced a new way
to deduce the dynamic rate sensitivity of materials using the measured time-resolved depth and
load responses during indentation. Andrews et al. (2002) investigated the impact of a sharp
indenter at low-impact velocities for elastoplastic materials. It showed that the rate dependency
of a material can be involved by directly incorporating the relationship between the motion of the
indenter and the flow properties of the material into the equation of motion for the indenter.
In the macroscopic scale, strain rate is known to be related to the dislocation density and the
average dislocation velocity through the Orowan equation (Orowan, 1934). In addition, flow
stress can be related to the dislocation density using Taylor hardening law. Staker and Holt
(1972) developed a dislocation cell structure in polycrystalline oxygen-free high-conductivity
(OFHC) copper by deforming tensile specimens by 10%. It has been found that the flow stress is
related to the square root of the dislocation density. Senseny et al. (1978) performed
experimental tests and showed that the flow stress can be influenced not only by the strain rate
but also the strain rate history. Kumar and Kumble (1969) investigated the mechanical of OFHC
copper at a wide range of strain rates through the dislocation mechanism. The strain rate
behavior can be divided into two types: 1) if the strain rate is less than 10 𝑠−1, the dislocation
motion is thermally activated over forest dislocation barriers; 2) if the strain rate is greater than
103 𝑠−1, a viscous-damping mechanism dominates. During the viscous damping, the relationship
between the stress and the strain rate is linear and the mobile dislocation density is independent
on both strain and strain rate. Voyiadjis and Almasri (2007) proposed two models in order to
capture the strain rate sensitivity in material hardness. One of the model is a phenomenological
power law model that uses the material constants related to the dependence of the flow stress of
the material on the strain rate. The other model is a physically based one that is established on
the dislocation behavior. In this model, when the strain rate is low (less than the order of
103 𝑠−1), the flow stress as well as the hardness is governed by the thermally activated
mechanism. At high strain rates, the viscous-drag mechanism dominates and the hardness
increases rapidly with the increasing strain rate. This micromechanical model shows a better
agreement with the experimental results for both OFHC copper and 1018 steel at high strain rates
than the power law model.

18
In this chapter, the mechanical behaviors in polycrystalline metals during nanoindentation
experiments are investigated. The indentation size effect is captured through a material length
scale parameter determined from the strain gradient plasticity theory and the nanoindentation
experiments. The grain boundary effect is considered by performing experiments on
polycrystalline metals and incorporating the grain size parameter into the expression of the
length scale. The temperature and rate indentation size effect (TRISE) is investigated by
developing a physically based TRISE model. The nanoindentaiton experiments are performed at
different strain rates. In order to validate the grain boundary effect, research is made on single
crystalline metals. Numerical analysis is applied with a rate dependent constitutive model in
order to determine the equivalent plastic strain parameter required in determining the length
scale. The material length scales are determined for different materials and at different strain
rates.
3.2 Strain Gradient Theory and Material Intrinsic Length Scale
In order to address the indentation size effect using continuum theory, the classical
continuum mechanics must be enhanced with the strain gradient plasticity theory, which
incorporates a material length scale parameter that characterizes the size effect encountered
during nanoindentations for different materials. With the length scale parameter incorporated in
the constitutive equations, the enhanced continuum theory is able to predict the mechanical
properties in both micro-/nano- and macro-scales.
The indentation size effect in metals can be characterized through the SSDs and GNDs and
their interactions. The increase in hardness at small indentation depth is caused by the dislocation
storage, which leads to an increase in the dislocation density. It is generally believed that the
hardening is due to the increase in the strain gradient in small localized volumes. The presence of
the strain gradient generates the formation of GNDs, which increases the dislocation density in
the small volumes. The GNDs can also act as obstacles for the movement of SSDs, resulting in
the additional increase in material hardness.
The SSDs are dislocations that move through the material during plastic deformation. They
trap with each other in a random way and are related to the equivalent plastic strain. The GNDs
are dislocations that are required for a compatible deformation in crystalline materials. They are
required to accommodate the crystal lattice curvature arising from the inhomogeneous plastic
deformation. In general, the GNDs are related to the strain gradients. In the indentation tests, the
GNDs are generated as the indenter is pushed into the underlying substrate of the material. They
are generated from the non-uniform deformation and thus give rise to an extra storage of
materials defects compared with the uniform deformation at the same strain level. The storage of
GNDs occurs when the characteristic length scale of the deformation is sufficiently small.
In this work, the gradient plasticity theory developed by Voyiadjis and Abu Al-Rub (2004)
will be used. It is introduced by many authors (Fleck and Hutchinsion, 1993; Fleck et al., 1994;
Flection and Hutchinson, 1997; Begley and Hutchinson, 1998) through the non-local weak

19
formulation of the conventional effective plastic strain. In general, the non-local form of strain �̂�
can be written in terms of its local counterpart p and high-order gradient terms:
�̂� = [𝑝𝛾 + (𝑙𝜂)𝛾]1/𝛾 (3.1)
where l is the length-scale parameter to ensure dimensional consistency, p is the effective plastic
strain, 𝜂 is the effective plastic strain gradient of any order and 𝛾 is a material parameter.
The Taylor flow stress is used to define the shear stress that is required to untangle the
interactive dislocations and to introduce a significant plastic deformation:
𝜏 = [𝜏𝑆𝛽
+ 𝜏𝐺𝛽
]1/𝛽
(3.2)
where 𝛽 is a constant fitting parameter, 𝜏𝑆 and 𝜏𝐺 are given by Taylor’s hardening laws related
to the density of SSDs (𝜌𝑆) and GNDs (𝜌𝐺) respectively:
𝜏𝑆 = 𝛼𝑆𝐺𝑏𝑠√𝜌𝑆 (3.3)
𝜏𝐺 = 𝛼𝐺𝐺𝑏𝐺√𝜌𝐺 (3.4)
The parameters 𝑏𝑆 and 𝑏𝐺 are the magnitudes of the Burgers vectors for SSDs and GNDs
respectively, G is the shear modulus and 𝛼𝑆 and 𝛼𝐺 are statistical coefficients which account for
the deviation from regular spatial arrangements of SSDs and GNDs populations respectively.
Substituting Equations (3.3) and (3.4) into Equation (3.2) yields a general expression for the
overall flow stress in terms of an equivalent total dislocation density, 𝜌𝑇:
𝜏 = 𝛼𝑆𝐺𝑏𝑆√𝜌𝑇 (3.5)
where
𝜌𝑇 = [𝜌𝑆𝛽/2
+ (𝛼𝐺2𝑏𝐺
2𝜌𝐺/𝛼𝑆2𝑏𝑆
2)𝛽/2]2/𝛽
. (3.6)
The above equations are set at the micro-scale, but continuum plasticity is the macroscopic
outcome from the combination of many dislocation properties at the micro- and meso-scopic
scales. The flow stress can be written at the macroscopic level using a power law (𝜎 = 𝑘�̂�1/𝑚).
Combining this expression with Equation (3.1) yields:
𝜎 = 𝑘[𝑝𝛾 + 𝑙𝛾𝜂𝛾]1/𝑚𝛾 (3.7)
where 𝛾, k and m are material constants.
The non-local effects associated with the presence of local deformation gradients at a given
point are incorporated into Equation (3.6) through the GND density 𝜌𝐺 and into Equation (3.7)

20
through the strain gradient 𝜂. The gradient in the plastic strain field is accommodated by the
GND density 𝜌𝐺 so that the effective strain gradient 𝜂 in Equation (3.1) is defined by Arsenlis
and Parks (1999) as follows:
𝜂 =𝜌𝐺𝑏𝐺
�̅� (3.8)
where �̅� is the Nye factor that is defined as (Arsenlis and Parks, 1999):
�̅� =1
𝑛𝑏∑|𝜌𝐺(𝛼𝑖𝑗; 𝜙, 𝜃, 𝜔)|
𝑖𝑛
𝑖=1
(3.9)
where b is the magnitude of the Burgers vector; 𝛼𝑖𝑗 is Nye’s tensor; 𝜙, 𝜃 and 𝜔 are the Euler
angles defining the orientation of the crystal i and n is the number of grains in the sample. Nye’s
factor is used to reflect the scalar measure of the GND density from the macroscopic plastic
strain gradient. The plastic shear strain 𝛾𝑝 can be defined as a function of SSD density 𝜌𝑆 as
follows (Voyiadjis and Abu Al-Rub, 2004; Abu Al-Rub and Voyiadjis, 2005; Bamman and
Aifantis, 1982):
𝛾𝑝 = 𝑏𝑆𝐿𝑆𝜌𝑆 (3.10)
where 𝐿𝑆 is the mean spacing between SSDs which is usually at the submicron order. Using the
Schmid orientation tensor 𝑀𝑖𝑗 (Schmid and Boas, 1950), the plastic strain in the macroscopic
plasticity theory can be defined in terms of the plastic shear strain 𝛾𝑝 as follows:
휀𝑖𝑗𝑝 = 𝛾𝑝𝑀𝑖𝑗. (3.11)
In relating the plastic strain at the macro-scale to the plastic shear strain at the micro-scale, an
average form of the Schmid tensor is used since plasticity at the macro-scale incorporates a
number of differently oriented grains into each continuum point (Aifantis, 1987; Bammann and
Aifantis, 1987; Dorgan and Voyiadjis, 2003).
For proportional, monotonically increasing plasticity, the equivalent plastic strain variable p is
defined as:
𝑝 = √2휀𝑖𝑗𝑝 휀𝑖𝑗
𝑝 /3. (3.12)
Combining Equations (3.10) and (3.11) and substituting the result into Equation (3.12)
expresses p as a function of the SSD density as follows:
𝑝 = 𝑏𝑆𝐿𝑆𝜌𝑆𝑀 (3.13)

21
with
𝑀 = √2𝑀𝑖𝑗𝑀𝑖𝑗/3 (3.14)
where M is the Schmid orientation factor that is usually taken to be 0.5 (Bammann and Aifantis,
1982).
Rewriting Equations (3.8) and (3.13) for 𝜌𝐺 and 𝜌𝑆 respectively, and substituting them into
Equations (3.5) and (3.6) yields an expression for 𝜏. Using Taylor’s hardening law (𝜎 = 𝑍𝜏), the
flow stress can be obtained as follows:
𝜎 = 𝛼𝑆𝐺𝑍√𝑏𝑆𝐿𝑆𝑀[𝑝𝛽/2 + (𝛼𝐺2𝑏𝐺𝐿𝑆�̅��̅�𝛼𝑆
2𝑏𝑆)𝛽/2𝜂𝛽/2]1/𝛽
(3.15)
Comparing Equations (3.7) and (3.15) yields the following expressions:
𝛾 = 𝛽/2 (3.16)
𝑚 = 2 (3.17)
𝑘 = 𝛼𝐺𝐺𝑍√𝑏𝑆/𝐿𝑆𝑀 (3.18)
𝑙 = (𝛼𝐺/𝛼𝑆)2(𝑏𝐺/𝑏𝑆)𝐿𝑆𝑀�̅� (3.19)
Furthermore, Gracio (1994) indicated that in polycrystalline materials, 𝐿𝑆 decreases when the
plastic strain increases. It is equal to the grain size at the beginning of the deformation and
saturates toward values in the order of micrometer in large strains. Voyiadjis and Abu Al-Rub
(2005) proposed the following equation for 𝐿𝑆 based on the work of Gracio (1994) as follows:
𝐿𝑆 =𝐷𝑑
𝐷 + 𝑑𝑝1/𝑚
(3.20)
where d is the average grain size in polycrystalline materials; D is the macroscopic characteristic
size of the specimen; m is the hardening exponent and p is the equivalent plastic strain. Gracio
(1994) also pointed out that 𝐿𝑆 varies as the inverse of strain for single crystalline materials. He
incorporated a material constant in his equation for 𝐿𝑆. However, the origins of nucleation of
SSDs differ between single crystalline and polycrystalline materials. A dislocation structure is
not formed in grains in polycrystalline materials, for instance.
On the basis of the expressions proposed by Gracio (1994) and Voyiadjis and Abu Al-Rub
(2005), the equation for 𝐿𝑆 is modified in order to account for the rate and temperature
dependency (Faghihi and Voyiadjis, 2010, 2012; Voyiadjis et al., 2011). 𝐿𝑆 is expressed as a
function of temperature and the strain rate as follows:
𝐿𝑆 =𝑔(𝑇)
(1 + 𝐶𝑝1/𝑚)(1 + 𝑓(�̇�)) (3.21)

22
𝐿𝑆 =𝑔(𝑇)𝑑
(1 + 𝐶𝑑𝑝(1/𝑚))(1 + 𝑓(�̇�)) (3.22)
where T is the temperature and �̇� is the equivalent plastic strain rate. In these equations, the
function 𝑓(�̇�) is defined as a power law 𝐵(�̇�)𝑞, where q is the hardening exponent and B and C
are constants added to calibrate the influence of the strain rate. The temperature dependency
𝑔(𝑇) is expressed through the Arrhenius equation as 𝐴𝑒(−𝐸𝑟/𝑅𝑇), where A is a pre-exponential
factor, R is the gas constant, 𝐸𝑟 is the activation energy and T is the temperature in Kelvin. Only
the latter formulation given by Equation (3.22) for polycrystalline materials includes the grain
size d. Substituting these expressions for 𝐿𝑆 into Equation (3.19) results in the following
physically based description of the length scale l in terms of the equivalent plastic strain,
equivalent plastic strain rate and temperature for single crystalline materials and polycrystalline
materials, respectively (Voyiadjis et al., 2011):
𝑙 = (𝛼𝐺/𝛼𝑆)2(𝑏𝐺/𝑏𝑆)𝑀�̅� (𝛿1𝑒(−𝐸𝑟/𝑅𝑇)
(1 + 𝛿2𝑝(1/𝑚))(1 + 𝛿3(�̇�)𝑞)) (3.23)
𝑙 = (𝛼𝐺/𝛼𝑆)2(𝑏𝐺/𝑏𝑆)𝑀�̅� (𝛿1𝑑𝑒(−𝐸𝑟/𝑅𝑇)
(1 + 𝛿2𝑑𝑝(1/𝑚))(1 + 𝛿3(�̇�)𝑞)) (3.24)
However, it is noted in Equation (3.24) that for polycrystalline materials, the length scale is
also a fution of the grain size d. the parameters 𝛿1, 𝛿2, 𝛿3 are material constants that have to be
determined from the results of the nanoindentation experiments. It can also be inferred from
Equations (3.23) and (3.24) that the proposed physically based relations for single crystalline and
polycrystalline materials show the agreement with the suggestions made by other researchers on
the length scale parameter decreases with the hardening exponent m (Begley and Hutchinson,
1998) and increases with the grain size d (Haque and Saif, 2003) for single crystalline materials.
3.3 Determination of the Material Length Scale and the Hardening-Softening Effect
3.3.1 Derivation of the hardness expression based on the model of the temperature and rate
indentation size effect (TRISE)
In order to determine the material intrinsic length scale from the experimental data, Abu Al-
Rub and Voyiadjis (2004) derived the GND density and SSD density in the experiments for a
conical/pyramidal indenter as follows.
The indentation profile shown in Figure 3.4 in the unloaded situation can be described as
follows:
𝜔(𝑟) = 𝑟 tan 𝜃 − ℎ 𝑓𝑜𝑟 0 < 𝑟 < 𝑎 (3.25)

23
where h is the indentation depth and 𝜃 is the angle between the indenter face and the sample
surface. It is now assumed that the dislocation loops (GNDs) are equally spaced along the
surface of the indentation and have a Burgers vector normal to the sample surface. One can then
write the following expressions
|𝑑𝜔
𝑑𝑟| = tan 𝜃 =
𝑏𝐺
𝑠=
ℎ
𝑎 (3.26)
𝑠 =𝑏𝐺𝑎
ℎ (3.27)
where s is the mean spacing between the individual slip steps on the indentation surface. If 𝜆 is
the total length of the injected loops between r and r+dr, one has
𝑑𝜆 = 2𝜋𝑟𝑑𝑟
𝑠= 2𝜋𝑟
ℎ
𝑏𝐺𝑎𝑑𝑟 (3.28)
Figure 3.4 Specimen being indented by a rigid conical indenter. GNDs created during the
indentation process and the relevant geometrical parameters are indicated.
Integrating from 0 to a gives the total dislocation length 𝜆 as follows:
𝜆 = ∫ 2𝜋𝑟ℎ
𝑏𝐺𝑎𝑑𝑟
𝑎
0
=𝜋𝑎ℎ
𝑏𝐺=
𝜋 tan 𝜃
𝑏𝐺𝑎2 =
𝜋
𝑏𝐺
ℎ2
tan 𝜃 (3.29)
Furthermore, it is assumed that the GNDs are contained within a hemispherical volume V
that scales with the contact radius of the indentation profile a such that

24
𝑉 =2
3𝜋𝑎3
(3.30)
The equivalent plastic strain p can, in the case of a self-similar indenter, be expressed as
follows:
𝑝 = 𝑐ℎ
𝑎= 𝑐 tan 𝜃 (3.31)
where c is a material constant of order 1. Substituting Equations (3.19) and (3.31) in Equation
(3.3), the expression for 𝜌𝑆 is obtained as follows:
𝜌𝑆 =𝑐�̅�𝛼𝐺
2𝑏𝐺 tan 𝜃
𝑙𝑏𝑆2𝛼𝑆
2 (3.32)
Based on the work of Nix and Gao (1998) in considering the generation of GNDs under the
indenter during hardness experiments, Voyiadjis and Abu Al-Rub (Voyiadjis and Abu Al-Rub,
2004; Abu Al-Rub and Voyiadjis, 2005) derived a more general framework of expressions that
can be used to determine the material intrinsic length scale from micro-hardness results of
spherical and pyramidal indenters. They proposed the expression for micro-hardness as follows:
𝐻 = 𝑍𝜅𝛼𝑆𝐺𝑏𝑆[𝜌𝑆𝛽/2 + (𝛼𝐺𝑏𝐺/𝛼𝑆𝑏𝑆)𝛽𝜌𝐺
𝛽/2]1/𝛽
(3.33)
For the hardness at greater indentation depths where there is no size effect due to the absence
of strain gradients and GNDs, the micro-hardness 𝐻0 is defined as:
𝐻0 = 𝑍𝜅𝜏𝑆 = 𝑍𝜅𝛼𝑆𝐺𝑏𝑆√𝜌𝑆 (3.34)
Using Equations (3.33) and (3.34) and simplifying the results by assuming that 𝛼𝐺 = 𝛼𝑆
and 𝑏𝐺 = 𝑏𝑆, the ratio (𝐻/𝐻0)𝛽 can be derived as follows:
(𝐻
𝐻0)
𝛽
= 1 + (𝜌𝐺
𝜌𝑆)
𝛽/2
(3.35)
By substituting the relations of dislocation density for conical or pyramidal indenters into
Equation (3.35), the following equation can be obtained as:

25
(𝐻
𝐻0)
𝛽
= 1 + (ℎ∗
ℎ)
𝛽/2
(3.36)
with
ℎ∗ = 𝜍𝑙 (3.37)
and
𝜍 =3 tan 𝜃
2𝑐�̅� (3.38)
where ℎ∗ is the material specific parameter that characterizes the depth dependence of the
hardness and depends on the indenter geometry as well as the plastic flow.
Equation (3.36) implies that when the indentation data is plotted as (𝐻/𝐻0)𝛽 versus ℎ−𝛽/2, it
should give a straight line with a slope of ℎ∗𝛽/2. From this, the intrinsic length scale l can be
determined through Equation (3.37) as 𝑙 = ℎ∗/𝜍
For single crystalline materials, the expression for the GND density can be derived from the
approach of Nix and Gao (1998) in the generation of GNDs under the indenter as follows:
𝜌𝐺 =3 tan2 𝜃
2𝑏𝐺ℎ (3.39)
Substituting the above equation into Equation (3.38) with the assumption of 𝛼𝐺 = 𝛼𝑆
and 𝑏𝐺 = 𝑏𝑆 yields the expression for hardness H as a function of the indentation depth h as
follows:
𝐻 = 𝐻0 {1 + [3𝑀 tan 𝜃
2𝑐ℎ×
𝛿1𝑒−𝐸𝑟/𝑅𝑇
(1 + 𝛿2𝑝1/𝑚)(1 + 𝛿3�̇�𝑞)]
𝛽/2
}
1/𝛽
(3.40)
where 𝛿1, 𝛿2, 𝛿3 and 𝛿4 are material parameters that can be obtained from the experiments.
For polycrystalline materials, the equation for hardness is obtained from a different
expression for the GND density 𝜌𝐺 . Voyiadjis and Peters (2010) included the hardening-
softening effect in the expression for H as a function of indentation depth h. They attributed the
hardening effect to the obstruction of dislocation propagation by the grain boundary due to a
mismatch in the lattice and the disordered structure of the grain boundary. This causes a pile-up
of dislocations at the grain boundary such that the GND density is increased. With ongoing
indentation however, the increased stress at the grain boundary causes the resolved shear stress

26
in the adjacent grain to reach a critical value and dislocations start moving in the adjacent grain
and softening occurs as shown in Figure 3.3.
On the basis of the works of Yang and Vehoff (2007), the volume of the plastic zone at the
onset of hardening is defined by Voyiadjis and Peters (2010) as the volume of the semi-spherical
plastic zone minus the volume taken up by the Berkovich indenter such that
𝑉𝑝𝑙𝑎𝑠𝑡𝑖𝑐 = 𝑉 − 𝑉𝑖𝑛𝑑𝑒𝑛𝑡 =𝜋
12𝑑3 − 8.19ℎ3 (3.41)
where d is the grain size and h is the indentation depth. With this new definition for the volume
of the plastic zone, the expression for GND density 𝜌𝐺 for a polycrystalline material can be
derived as follows:
𝜌𝐺 =𝜆
𝑉𝑝𝑙𝑎𝑠𝑡𝑖𝑐=
𝜋𝑏𝐺
ℎ2
tan 𝜃𝜋
12 𝑑3 − 8.19ℎ3 (3.42)
Making use of this new GND density, the expression for the hardness H is a function of the
indentation depth h of the polycrystalline material and can be derived as follows:
𝐻 = 𝐻0 {1 + [𝑀𝜋(ℎ − ℎ1)2
(𝜋
12 𝑑3 − 8.19ℎ3) 𝑐 tan2 𝜃×
𝛿1𝑑𝑒−𝐸𝑟/𝑅𝑇
(1 + 𝛿2𝑑𝑝1/𝑚)(1 + 𝛿3�̇�𝑞)]
𝛽/2
}
1/𝛽
(3.43)
In this relation, 𝛿1, 𝛿2, 𝛿3 and ℎ1 are material parameters that have to be determined by fitting this
expression for the hardness to the data from nanoindentation experiments after the equivalent
plastic strain p has been determined numerically (Voyiadjis and Peters, 2010; Voyiadjis et al.,
2011).
Furthermore, the cyclic plasticity model (Voyiadjis and Abu Al-Rub, 2003; Voyiadjis and
Basuroychowdhury, 1998) is applied in order to obtain a more accurate hardness expression. The
cyclic model is applied as follows:
𝐻𝑛𝑒𝑤 = 𝐻𝑝𝑟𝑒𝑣𝑖𝑜𝑢𝑠 + 𝐶(ℎ)𝐻𝑝𝑟𝑒𝑣𝑖𝑜𝑢𝑠 (3.44)
with
𝐶(ℎ) = √1
ℎ (3.45)

27
where 𝐻𝑝𝑟𝑒𝑣𝑖𝑜𝑢𝑠 is the hardness expressions from Equations (3.40) and (3.43) for single
crystalline and polycrystalline materials, respectively.
3.3.2 Derivation of the macro-hardness
In order to compare Equations (3.40), (3.43) and (3.44) with nanoindentation experiment
results, the macro-hardness 𝐻0 is required as well as its rate and temperature dependency. In
order to determine 𝐻0, the physically based model was developed based on dislocation
mechanism (Almasri and Voyiadjis, 2007). This model is based on the approach that is widely
applied in the literatures (Shioiri and Satoh, 1985; Kumar and Kumble, 1969; Follansbee et al.,
1984).
The intrinsic drag against the dislocation motion in FCC metals is given by the following
equation through the linear viscous form (Moon and Vreeland, 1968):
𝜏𝑏 = 𝐵𝜐 (3.46)
where 𝜏 is the applied shear stress; b is Burgers vector; B is the damping constant or dislocation
drag and 𝜐 is the dislocation velocity. However, this intrinsic drag is usually very small and is
expected at very high strain rates. The dominant rate-controlling mechanism of the dislocation
motion is the point obstacles that can be overcome with the aid of thermal activation. The forest
dislocations are the dominant point obstacles in pure metals. The mobile dislocation segments
move by repeating the thermally assisted cutting of the forest dislocation, whereas the jump
motion is controlled by the viscous drag.
Since the thermal cutting requires a waiting time, the motion of the mobile segments in the
previously described progress is “jerky” (Shioiri and Satoh, 1985). By simplifying the unit
motion of the segment, the rate of the shear strain attributable to this jerky motion of the
dislocation segments is given by
�̇� =𝑁𝑙2𝑏
𝑡𝑡 + 𝑡𝜈=
𝑁𝑙2𝑏
𝜈−1𝑒(𝑈0−𝑙𝑏2𝜏𝑓)/𝐾𝑇 + 𝑡𝜈
𝜐 (3.46)
where 𝑡𝑡 is the waiting time for thermally assisted cutting; 𝑡𝜈 is the time required by one jump
motion under the control of viscous drag; N is the number of mobile segments per unit volume; l
is the mean distance between the forest dislocations; 𝑈0 is the energy required to form a jog; 𝜈 is
a frequency factor; K is the Boltzmann constant; B is the dislocation drag coefficient and T is the
absolute temperature. Nl also characterizes the total length of the moving segments per unit
volume or density of the moving dislocations (Almasri and Voyiadjis, 2007).
At lower stresses, Equation (3.46) can be approximated by the same expression given by
Gilman and Johnston (1957) for the thermal activation flow, in which the flow is linear on a
logarithmic scale of the strain rate. At higher stresses, Equation (3.46) is approximated as the

28
viscous drag flow, in which the flow stress depends linearly upon the strain rate itself. In this
flow range, the motion of dislocations should be continuous. By relating the shear strain rate to
the total strain rate using the Schmid factor (Schmid and Boas, 1950), the Taylor equation to
transmit the tensile flow stress to the shear flow stress and the Tabor (1951) equation, one can
derive the hardness for the two low and high stresses as follows:
𝐻0 = {
𝜅𝑍
𝑙𝑏2[𝑈0 + 𝐾𝑇 ln (
휀̇
𝑀𝑁𝑙𝑏2𝜈)] ,
𝐻0𝑏
𝜈𝜅𝑍𝑙𝑏𝑒{(𝑈0/𝐾𝑇)−[(𝑙𝑏2𝐻0)/𝜅𝑍𝐾𝑇]} ≫ 1
𝜅𝑍𝐵
𝑀𝑁𝑙𝑏2휀̇ ,
𝐻0𝑏
𝜈𝜅𝑍𝑙𝑏𝑒{(𝑈0/𝐾𝑇)−[(𝑙𝑏2𝐻0)/𝜅𝑍𝐾𝑇]} ≪ 1
(3.47)
where 휀̇ is the strain rate, T is the temperature and the rest parameters are material constants.
3.3.3 Determination of the equivalent plastic strain
In Equations (3.40) and (3.43), there is a parameter of the equivalent plastic strain p that
needs to be determined in order to express the hardness as function of the indentation depth. The
equivalent plastic strain in the indented volume is a complicated value and the nanoindentation
experiments are not able to determine such a value. Numerical analysis using finite element
method (FEM) can be applied in order to obtain the relationship between the equivalent plastic
strain and the indentation depth. Initially, the axisymmetric contact problem for the elastoplastic
behavior of materials subjected to spherical static indentation was studied using the FEM with
mixed boundary conditions (Voyiadjis and Buckner, 1983; Voyiadjis et al., 1986). Furthermore,
the nanoindentation experiments were simulated using the indentation problem using ABAQUS
software (Almasri and Voyiadjis, 2007; Voyiadjis and Peters, 2010). One of the most important
parts of the finite element analysis is the choice of the constitutive relation. The rate and
temperature dependency can be captured through a constitutive relation that depends on the
strain rate and the temperature. The physically based viscoplastic constitutive relations were
developed in order to capture the rate and temperature dependent (Abed and Voyiadjis, 2005,
2007a, 2007b; Voyiadjis and Abed, 2005a, 2005b, 2006). The relations also distinct the
behaviors between the FCC and BCC metals in a thermodynamic basis.
The constitutive equations are introduced based on a framework of a thermodynamically
consistent mathematical formulation for the condition of small deformations (Abed and
Voyiadjis, 2005; Voyiadjis and Abed, 2005a, 2005b). The formal potential is described through
the Helmholtz free energy
𝛹 = 𝑒 − 𝑠𝑇 (3.48)
where 𝑠 is the specific entropy, 𝑒 is the internal energy and 𝑇 is the absolute temperature. The
Helmholtz potential in terms of observable and internal state variables is given as

29
𝛹 = (휀𝑖𝑗𝑒 , 𝑇, 𝑝, 𝛼𝑖𝑗) (3.49)
where 𝑝 and 𝛼𝑖𝑗 characterize the isotropic and kinematic hardening in plasticity/viscoplasticity
respectively. For small deformation, the total strain tensor can be decomposed into the elastic
component 휀�̇�𝑗𝑒 and the viscoplastic component 휀�̇�𝑗
𝑣𝑝 such that
휀�̇�𝑗 = 휀�̇�𝑗𝑒 + 휀�̇�𝑗
𝑣𝑝 (3.50)
Taking the time derivative of Equation (3.50) with respect to its internal variables defined in
Equation (3.49) gives
�̇� =𝜕𝛹
𝜕휀𝑖𝑗𝑒 휀�̇�𝑗
𝑒 +𝜕𝛹
𝜕𝑇�̇� +
𝜕𝛹
𝜕𝑝�̇� +
𝜕𝛹
𝜕𝛼𝑖𝑗�̇�𝑖𝑗 (3.51)
The internal variables are determined through several fundamental laws such as the
conservation of mass, balance of linear momentum, balance of moment of momentum, the first
law of thermodynamics for the conservation of energy and the second law of thermodynamics
which reduces to the Clausius-Duhem inequality. The Clausius-Duhem inequality is defined as
𝜎𝑖𝑗휀�̇�𝑗 − 𝜌(�̇� + 𝑠�̇�) − 𝑞𝑖
𝑇,𝑖
𝑇≥ 0 (3.52)
where 𝜌 is the mass density and 𝑞𝑖 is the heat flux vector. Substituting Equation (3.51) into
Equation (3.52) using the decomposition in Equation (3.50), gives the following thermodynamic
constraint
(𝜎𝑖𝑗 − 𝜌𝜕Ψ
𝜕휀𝑖𝑗𝑒 ) 휀�̇�𝑗
𝑒 − 𝜌 (𝑠 +𝜕Ψ
𝜕𝑇) �̇� + 𝜎𝑖𝑗휀�̇�𝑗
𝑣𝑝 − 𝜌𝜕Ψ
𝜕𝑝�̇� − 𝑝
𝜕Ψ
𝜕𝛼𝑖𝑗�̇�𝑖𝑗 − 𝑞𝑖
𝑇,𝑖
𝑇≥ 0 (3.53)
For arbitrary reversible changes in the observable variables, the first two terms must vanish
independently. Therefore, the following thermodynamic state functions are obtained as
𝜎𝑖𝑗 = 𝜌𝜕Ψ
𝜕휀𝑖𝑗𝑒 , 𝑠 = −
𝜕𝛹
𝜕𝑇 (3.54)
The remaining terms in Equation (3.54) correspond to the dissipation energy. In the case of
dissipative processes, the viscoplastic potential is represented as a continuous and convex scalar
function of the flux variables as

30
𝛩𝑣𝑝 = 𝛩𝑣𝑝(휀�̇�𝑗𝑣𝑝
, �̇�, �̇�𝑖𝑗) (3.55)
Using the Legender-Frenchel transformation of the above potential, one is able to obtain the
complementary laws in the form of the evolution laws of flux variables as
𝐹 = 𝐹(𝜎𝑖𝑗, 𝑅, 𝑋𝑖𝑗) (3.56)
where 𝑅 and 𝑋𝑖𝑗 represent the isotropic and kinematic hardening parameters. As the above
potential is only attributed to the viscoplastic mechanical process, the evolution laws of the
internal state variables can be obtained using the maximum dissipation principle with the
Lagrange multiplier �̇�𝑣𝑝 as
𝛺 = 𝛱 − �̇�𝑣𝑝𝐹 (3.57)
where Π is the dissipation energy which is the remaining terms in Equation (3.54) when the first
two terms varnish. The objective function Ω is maximized using the following conditions as
follows
𝜕𝛺
𝜕𝜎𝑖𝑗= 0,
𝜕𝛺
𝜕𝑅= 0,
𝜕𝛺
𝜕𝑋𝑖𝑗− 0 (3.58)
The corresponding thermodynamic flow laws are obtained by substituting Equation (3.58)
into Equation (3.57) as follows
휀�̇�𝑗𝑣𝑝 = �̇�𝑣𝑝
𝜕𝐹
𝜕𝜎𝑖𝑗, �̇� = −�̇�𝑣𝑝
𝜕𝐹
𝜕𝑅, �̇�𝑖𝑗 = −�̇�𝑣𝑝
𝜕𝐹
𝜕𝑋𝑖𝑗 (3.59)
A proper definition for the viscoplastic potential as well as the Helmholtz free energy is
required in order to represent the thermodynamic consistent constitutive relations that can
describe the thermodynamic behaviors of the material. A general definition of the elastic-
thermoviscoplastic energy for FCC metals is given as
𝜌𝛹 =1
2휀𝑖𝑗
𝑒 𝐸𝑖𝑗𝑘𝑙휀𝑘𝑙𝑒 +
1
3𝐶𝛼𝑖𝑗𝛼𝑖𝑗 + 𝜌𝜓(𝑝) (3.60)
where 𝐸𝑖𝑗𝑘𝑙 is the fourth order elastic tensor and both the coefficient 𝐶 and function 𝛹(𝑝) may
depend on the strain rate.
The yield function is defined based on that the thermal activation depends strongly on the
plastic strain. Therefore, using the concept of additive decomposition of the flow stress, the
general form of the yield function 𝑓 for FCC metals is given as follows:

31
𝑓 = 𝜎𝑒𝑞 − 𝑌𝑎 − 𝑅𝑡ℎ(𝑝, �̇�, 𝑇) (3.61)
In the above equation, the thermal part of the flow stress is mainly related to the hardening
parameter 𝑅𝑡ℎ and the athermal part is dependent on the athermal yield stress 𝑌𝑎 and the
equivalent stress 𝜎𝑒𝑞 that is defined as follows
𝜎𝑒𝑞 = √3
2 (𝜏𝑖𝑗 − 𝑋𝑖𝑗)(𝜏𝑖𝑗 − 𝑋𝑖𝑗) (3.62)
The deviatoric part of the normal stress in the above equation is defined as
𝜏𝑖𝑗 = 𝜎𝑖𝑗 −1
3𝜎𝑚𝑚𝛿𝑖𝑗 (3.63)
where 𝜎𝑚𝑚 is the hydrostatic part of stress and 𝛿𝑖𝑗 is the Kronecker delta. The back stress 𝑋𝑖𝑗 is
assumed to be independent on the strain rates.
𝑅𝑡ℎ is affected by a coupled temperature and strain rate relation. Therefore, the dynamic rate-
dependent yield surface for FCC metals is written such that it is valid for any value of the strain
rate as follows:
𝑓𝑑 = 𝜎𝑒𝑞 − 𝑌𝑎 − 𝑅 (1 − (−𝛽2𝑇 ln(𝜂0𝑣𝑝�̇�)
1/𝑞1))
1/𝑞2
(3.64)
where 𝛽2 is a material parameter defined in terms of the Boltzmann’s constant and the Gibbs free
energy at zero Kelvin temperature as 𝛽2 = 𝑘𝐵/𝐺0; 𝜂0𝑣𝑝
denotes the reference viscosity parameter
which is the minimum value when 𝑇 → ∞; 𝑞1 and 𝑞2 are constants that define the shape of the
short-range barriers with 1.0 < 𝑞1 < 2.0 and 0 < 𝑞2 < 1.0. The threshold strain hardening can
be defined as
𝑅 = 𝐵(1 − 𝑒−𝑘𝑝)1/2 (3.65)
where 𝐵 is the hardening parameter and 𝑘 is the annihilation factor.
If 𝜓(𝑝) in Equation (3.60) is written in a form that is able to restitute adequately the relation
between 𝑅 and 𝑝, the rate dependent definition is given as follows:
𝜌𝜓(𝑝) = 𝜗�̅�𝑝(1 − exp(−𝑘𝑝))1/2 (3.66)
where the rate-dependent coefficient 𝜗 is defined as follows:
𝜗 = (1 − (−𝛽2𝑇 ln(𝜂0𝑣𝑝�̇�)
1/𝑞1))
1/𝑞2
(3.67)

32
The constitutive equations for the stress and the back stress can be written based on the
potential given in Equation (3.60) as follows:
𝜎𝑖𝑗 = 𝐸𝑖𝑗𝑘𝑙휀𝑘𝑙𝑒 = 𝐸𝑖𝑗𝑘𝑙(휀𝑘𝑙 − 휀𝑘𝑙
𝑣𝑝) (3.68)
𝑋𝑖𝑗 =2
3𝐶𝛼𝑖𝑗 (3.69)
The total strain tensor 휀𝑖𝑗 is additively decomposed into the elastic component 휀𝑖𝑗𝑒 and
viscoplastic component 휀𝑖𝑗𝑣𝑝
.
In order to obtain the non-linear evolution rules for the viscoplasticity hardening variables, it
is essential to obtain the non-linear kinematic hardening rules that give a more realistic
characterization of the material behaviors during deformation. A viscoplastic potential that is not
equal to the yield surface is proposed as follows
𝐹 = 𝑓 +3𝛾
4𝐶𝑋𝑖𝑗𝑋𝑖𝑗 (3.70)
where 𝛾 and 𝐶 are material constants for the unit consistency. In the case of dynamic yielding
for FCC metals given in Equation 3.64, the variables defined in Equation (3.59) can be rewritten
as follows:
휀�̇�𝑗𝑣𝑝 = �̇�𝑣𝑝
3(𝜏𝑖𝑗 − 𝑋𝑖𝑗)
2𝜎𝑒𝑞= �̇�𝑣𝑝𝑁𝑖𝑗 (3.71)
�̇�𝑖𝑗 = �̇�𝑣𝑝𝑁𝑖𝑗 −3𝛾
2𝐶�̇�𝑣𝑝𝑋𝑖𝑗 (3.72)
�̇� = �̇�𝑣𝑝 (3.73)
with the normal to the yield surface that defines the direction of the viscoplastic strain given by:
𝑁𝑖𝑗 =𝜕𝑓𝑑
𝜕𝜎𝑖𝑗= −
𝜕𝑓𝑑
𝜕𝑋𝑖𝑗 (3.78)
Finally, the evolution equation of the stress tensor in terms of the incremental evolution of
the total and the viscoplastic strain tensor is determined by taking time derivative of Equation
(3.68) as follows:
�̇�𝑖𝑗 = 𝐸𝑖𝑗𝑘𝑙(휀�̇�𝑙 − 휀�̇�𝑙𝑣𝑝) = 𝐸𝑖𝑗𝑘𝑙(휀�̇�𝑙 − �̇�𝑣𝑝𝑁𝑖𝑗) (3.79)
The evolution of the back stress in Equation (3.69) is given by:

33
�̇�𝑖𝑗 =2𝐶휀�̇�𝑗
𝑣𝑝
3− 𝛾�̇�𝑣𝑝𝑋𝑖𝑗 (3.80)
A numerical algorithm for the integration of the rate-dependent constitutive equations is
required in order to update the stress and internal variables at each time step. A robust and
accurate algorithm, radial-mapping algorithm, is used (Simo and Hughes, 1986; Krieg and Krieg,
1977; Ortiz and Simo, 1986). A fully implicit method based on the backward Euler scheme is
used. The scheme is given, using the parameters defined above, as follows:
휀𝑛+1 = 휀𝑛 + Δ휀
휀𝑛+1𝑣𝑝 = 휀𝑛
𝑣𝑝 + Δ𝜆𝑣𝑝𝑁𝑛+1
𝑁𝑛+1 =3(𝜏𝑛+1 − 𝑋𝑛+1)
2𝜎𝑛+1𝑒𝑞
𝑋𝑛+1 = 𝑋𝑛 +2𝐶Δ𝜆𝑣𝑝𝑁𝑛+1
3− 𝛾Δ𝜆𝑣𝑝𝑋𝑛+1
𝑅𝑛+1 = 𝑅𝑛 +Δ𝜆𝑣𝑝𝜗𝑘 (𝐵
2− 2𝑅𝑛+1
2 )
2𝑅𝑛+1
𝜎𝑛+1 = 𝜎𝑛 + Δ𝜎 = 𝐸: (휀𝑛+1 − 휀𝑛+1𝑣𝑝 )
(3.81)
In the above scheme, 𝑛 represents the number of the current time step and 𝑛 + 1 represents the
next time step to step 𝑛.
By implementing the above constitutive relations into the ABAQUS simulation for the
indentation problem, the equivalent plastic strain can be determined as a function of the
indentation depth. Finite element simulations are performed by implementing the proposed
viscoplasticity constitutive model in the commercial finite element program ABAQUS/Explicit
through a user material subroutine coded as VUMAT including the radial return algorithm
(Krieg and Krieg, 1997; Ortiz and Simo, 1986). In ABAQUS with VUMAT, the constitutive
model is defined in a co-rotational coordinate system, in which the basis system rotates with the
material. All stress and strain tensor quantities are defined with respect to the co-rotational basis
system. This allows one to extend the standard finite element code with small strain to the
analysis of the finite strain. Determining the material parameters of the proposed constitutive
model is the important part in capturing the actual behavior of the material. As the constitutive
model is dependent on both temperature and the strain rate, the stress-strain relations of the
materials for different strain rates and various temperatures are required to obtain more accurate
parameters. The parameters of different materials were obtained (Voyiadjis and Abed, 2006)
through various experiments at different strain rates and temperatures (Tanner et al. 1999;
Nemat-Nasser and Li, 1998; Voyiadjis and Abed, 2005a, 2005b, 2006; Barlat et al. 1997a,
1997b).
A cube with dimensions of 50 𝜇𝑚 is modeled to represent the testing sample. The Berkovich
is simulated on top of the cube and is modeled as a blunt pyramid (Figure 3.5). The tip of the

34
indenter is an equilateral triangle with 20-nm sides. The ABAQUS interaction module is used in
order to model the contact between the indenter and the sample. Assigning a specific velocity to
the indenter causes it to penetrate into the sample to a desired indentation depth. After the plastic
deformation takes place, the indent can be viewed on the sample surface as shown in Figure 3.6.
The pile-ups can be clearly visible at the sides of the indenter. This is attributable to high
indentation occurrence in a small vicinity that allows the material to pile up at the periphery of
the indenter. From the simulation, the equivalent plastic strain can be obtained as a function of
the indentation depth.
Figure 3.6. Equivalent plastic strain in contour plot after the indentation.
Figure 3.5 Modeled indenter and sample using the ABAQUS software before the simulation.

35
3.4 Nanoindentation Experiments and Sample Preparation
By comparing the hardness expression from the TRISE model and the results of the
nanoindentation results, the material parameters can be determined and thus the expression of the
length scale as a function of the equivalent plastic strain can be determined. In order to obtain
better results through the nanoindentation experiments, especially on the purpose to capture the
hardening-softening phenomenon, the surface of the testing sample must be smooth with a low
roughness. Voyiadjis and Almasri (2010) performed nanoindentation experiments using the
CSM option on samples that were not polished. Although it showed the hardening-softening
effect in the hardness curve as a function of the indentation depth, there is a huge difference
among different tests. Therefore, a hardness range was set in order to include all the testing
curves. In order to obtain the hardness curves that are consistent with each other, the sample
needs to be polished. For the samples used in this chapter, mechanical polishing using carbide
polishing papers and the suspension with diamond particles of the 3 𝜇𝑚 size. It shows that after
the mechanical polishing, the roughness decreases greatly before the polishing is applied as
shown in Figure 3.7. Nanovision option in the testing machine is applied in order to obtain the
surface profile in the indented area as shown in Figure 3.8. It shows that the indented surface is
smooth as the color representing the height of the surface is uniform. The pile-ups are also
observed as shown in the simulations.
(a)
(b)
Figure 3.7. Surface of the sample (a) without polishing and (b) with mechanical polishing.
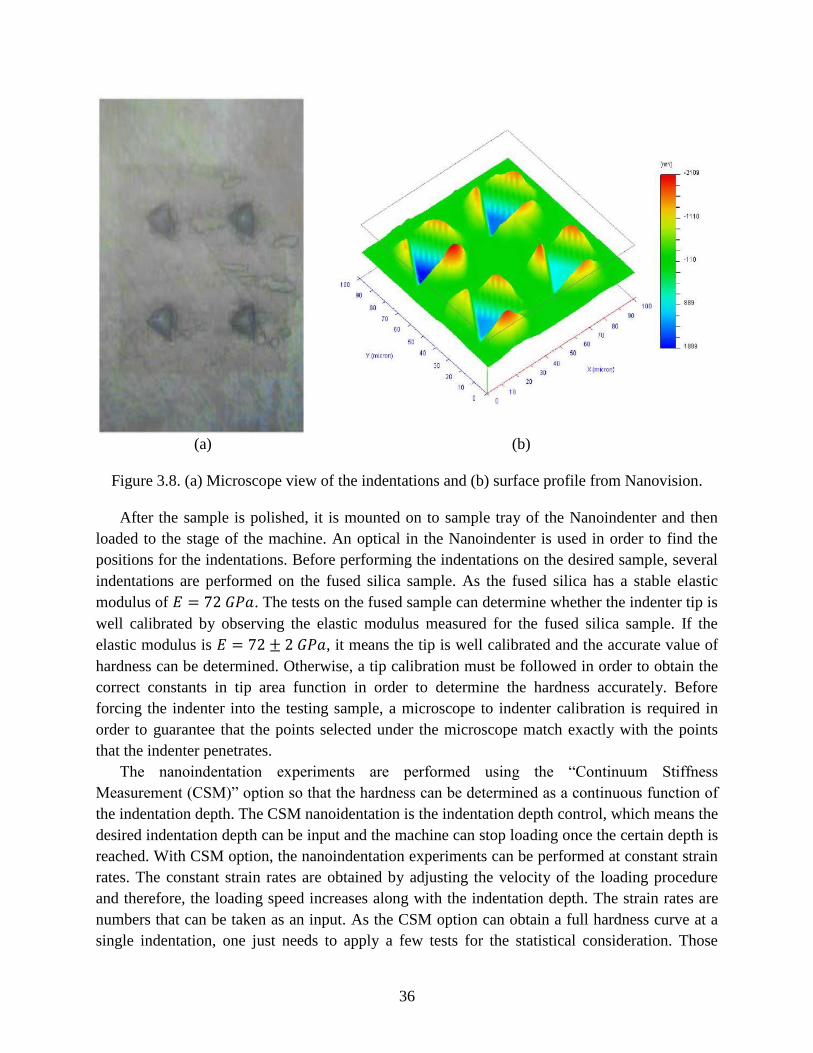
36
(a) (b)
Figure 3.8. (a) Microscope view of the indentations and (b) surface profile from Nanovision.
After the sample is polished, it is mounted on to sample tray of the Nanoindenter and then
loaded to the stage of the machine. An optical in the Nanoindenter is used in order to find the
positions for the indentations. Before performing the indentations on the desired sample, several
indentations are performed on the fused silica sample. As the fused silica has a stable elastic
modulus of 𝐸 = 72 𝐺𝑃𝑎. The tests on the fused sample can determine whether the indenter tip is
well calibrated by observing the elastic modulus measured for the fused silica sample. If the
elastic modulus is 𝐸 = 72 ± 2 𝐺𝑃𝑎, it means the tip is well calibrated and the accurate value of
hardness can be determined. Otherwise, a tip calibration must be followed in order to obtain the
correct constants in tip area function in order to determine the hardness accurately. Before
forcing the indenter into the testing sample, a microscope to indenter calibration is required in
order to guarantee that the points selected under the microscope match exactly with the points
that the indenter penetrates.
The nanoindentation experiments are performed using the “Continuum Stiffness
Measurement (CSM)” option so that the hardness can be determined as a continuous function of
the indentation depth. The CSM nanoidentation is the indentation depth control, which means the
desired indentation depth can be input and the machine can stop loading once the certain depth is
reached. With CSM option, the nanoindentation experiments can be performed at constant strain
rates. The constant strain rates are obtained by adjusting the velocity of the loading procedure
and therefore, the loading speed increases along with the indentation depth. The strain rates are
numbers that can be taken as an input. As the CSM option can obtain a full hardness curve at a
single indentation, one just needs to apply a few tests for the statistical consideration. Those

37
indentations should be spaced depending on the maximum indentation depth. In general, the
spacing between two indentations should be about 20 to 30 times of the maximum indentation
depth. The indentations, however, should not be made too far from each other. The surface
condition changes in large areas, which may cause the inconsistent testing results.
In order to perform nanoindentation experiments at elevated temperatures, the hot stage is
used and the hot stage mode of the machine is applied in order to obtain proper results. When
performing tests at any temperature other than room temperature, the stage where the sample is
mounted is heated so the sample is also heated. However, the indenter is still in room
temperature before the penetration, resulting in the difference in temperature from the sample
and the indenter. This causes the high thermal drift that cannot be corrected by the thermal drift
correction segment of the testing procedure. Therefore, the CSM option cannot be used in the hot
stage mode as it takes time to complete the whole procedure. In the hot stage mode, it applies the
basic mode of the indentation in a short period. The basic mode is load control so the loading
rate is high in order to avoid the thermal drift. Therefore, in order to obtain the hardness curve at
other temperatures than the room temperature, the indentations must be made at different depths
at different positions. Also for statistical consideration, at each depth, there must be multiple
indentations on various positions.
3.5 Applications of the TRISE Model on Metals
3.5.1 The strain rate dependency during nanoindentations in metals
In order to investigate the rate dependency during the nanoindentation experiments, a strain
rate parameter is incorporated in the expression of the length scale parameter. As the hardness
expression derived from the TRISE model is a function of the length scale parameter, the
hardness is also dependent on the strain rate. The hardness expression from the TRISE model
needs to be compared with the results from nanoindentation experiments in order to determine
the material parameters in the hardness expression and the length scale expression. Therefore,
nanoindentation experiments are performed on polycrystalline copper and aluminum at different
strain rates of 0.05 𝑠1−, 0.08 𝑠−1 and 0.10 𝑠−1. In order to isolate the strain rate effect, the
temperature is set to be room temperature in the model and the grain size is presented in the
model as an average grain size. The nanoindentation experiments are also performed in the room
temperature. The hardness as a function of the indentation is also obtained by using the three
strain rate values above. It shows that as the strain rate increases, there is an increase in the
material hardness from both experiments and the model. Comparing the hardness curve from the
model and the one from experiments, the material constants can be determined through curve
fitting. Figure 3.9 and Figure 3.10 show that the hardness curve from the TRISE model shows a
good agreement with the experimental results for both copper and aluminum.
From the comparison shown in Figures 3.9 and 3.10, the material parameters in the
expression can be determined as shown in Table 3.1.

38
Figure 3.10 Hardness as a function of the indentation depth from TRISE model (solid lines) and
nanoindentation experiments (dashed lines) for polycrystalline aluminum at different strain rates
(Voyiadjis et al., 2011).
Table 3.1 Material parameters used in Equation (3.43)
Model parameters ℎ1 (nm) 𝛿1 𝛿2 𝛿3
Polycrystalline copper 26 2.1 1 0.01
Polycrystalline aluminum 41 1.9 1 0.01
Figure 3.9 Hardness as a function of the indentation depth from TRISE model (solid lines) and
nanoindentation experiments (dashed lines) for polycrystalline copper at different strain rates.

39
Once the material parameters are determined, the expression of the material intrinsic length
scale can be obtained. The rate dependency of the length scale is shown in Figure 3.11 by
presenting the length scale as a function of the equivalent plastic strain at different strain rates
(Faghihi and Voyiadjis, 2011). The length scales decrease with the increase of the equivalent
plastic strain and approach to zero, as there is no strain gradient in large strains, providing the
length scales should be equal to zero when the stain is large. It also shows that the length scale
decreases with the increasing strain rate, leading to an increase in the hardness.
(a) (b)
Figure 3.11 Length scale as a function of the equivalent plastic strain at different strain rates for
(a) polycrystalline copper and (b) polycrystalline aluminum (Faghihi and Voyiadjis, 2011).
3.5.2 Grain boundary effect during nanoindentations
The nanoindentation experiments on polycrystalline metals show the hardening-softening
phenomenon from the hardness curves in Figures 3.9 and 3.10. The hardness expression from the
TRISE model is capable in order to capture this phenomenon by incorporating a grain size
parameter. The hardening-softening phenomenon in this research is believed to be mainly related
to the interaction between the dislocations and the grain boundaries. In order to verify the
attribution of the grain boundaries to the hardening-softening phenomenon, results from
nanoindentation experiments of single crystalline samples are used. As there is no grain
boundary in single crystalline materials, the dislocations do not accumulate during the entire
indentation procedure. Therefore, there should be no hardening effect observed in
nanoindentation experiments. The hardness expression from the TRISE model for single
crystalline materials is used. Comparing the modeled hardness in Equation (3.40) and the results
from the nanoindentations on single crystalline copper and aluminum as shown in Figure 3.12
(Voyiadjis et al., 2011), the material parameters are determined, which allows the determinations
of the length scale for single crystalline materials. The fitting parameters for single crystalline
models are determined from the comparison as shown in Table 3.2.

40
(a)
(b)
Figure 3.12 Hardness as a function of the indentation depth from TRISE model (solid lines) and
nanoindentation experiments (dashed lines) for (a) copper single crystal and (b) aluminum single
crystal at different strain rates (Voyiadjis et al., 2011).
With the material parameters determined, the length scale for single crystalline materials can
be determined using Equation (3.23). The length scales as a function of the equivalent plastic
strain for single crystal copper and aluminum are determined at different strain rates as shown in
Figure 3.13 (Faghihi and Voyiadjis, 2011). The length scales in single crystalline materials
Table 3.2 Material parameters used in Equation 3.40
Model parameters ℎ1 (nm) 𝛿1 𝛿2 𝛿3
Single crystal copper 32 7050 50 0.01
Single crystal aluminum 56 4000 48 0.01

41
decrease with the increasing equivalent plastic strain and approach to zero when the strain is
large.
The initial softening phenomenon is due to the GNDs generated due to the strain gradients in
small deformation and the interaction between GNDs and SSDs. It is not dependent on the grain
boundary effect. Therefore, there is indentation size effect in single crystals. However, as there is
no grain boundary, the major obstacles of the moving dislocations, the dislocations do not
accumulate during the indentation procedure. There is no increase in the dislocation density and
thus the hardness solely decreases with the increasing indentation depth. By comparing the
length scales from single crystalline and polycrystalline materials, it shows that the length scales
of polycrystalline materials decreases faster with the increasing equivalent plastic strain than the
ones of single crystalline materials. The values of the length scales in single crystals are much
greater than the ones of polycrystallines.
(a) (b)
Figure 3.13. Length scale as a function of the equivalent plastic strain at different strain rates for
(a) single crystal copper and (b) single crystal aluminum (Faghihi and Voyiadjis, 2011).
3.6 Conclusion
The indentation size effect is captured through the strain plasticity theory enhanced
continuum mechanics. The material length scale parameter is incorporated into the enhanced
theory in order to characterize the indentation size effect for different materials. Physically based
model is established in order to address the size effect and to determine the material intrinsic
length scale. The use of the length scale allows the continuum theory to describe the mechanical
behaviors in both macro- and micro-/nano-scales. The temperature and rate dependent
indentation size effect (TRISE) is considered and a model for the hardness as a function of the
indentation depth is derived through the length scale parameter. The material parameters in the
expressions of hardness and length scale can be determine using the results from nanoindentation

42
experiments by curve fitting. The hardening-softening phenomenon during nanoindentations is
investigated both theoretically and experimentally. In order to prove that this phenomenon is due
to the interaction between the grain boundary and the dislocations, nanoindentation experiments
are performed on polycrystalline and single crystalline metals. The hardness as a function of the
indentation depth is also derived for polycrystalline and single crystalline materials, respectively,
from the TRISE model. In order to determine the parameter of the equivalent plastic strain in the
expressions of hardness and length scale, numerical simulation is applied through finite element
method (FEM) using ABAQUS/Explicit software with a user material subroutine VUMAT. The
VUMAT provides the temperature and rate dependent constitutive equations for FCC and BCC
materials during the simulation of nanoindentation experiments for the indentation problem. By
comparing the hardness curves from the TRISE model and the results of nanoindentation
experiments, the material parameters are determined, allowing the length scale to be determined
as a function of the equivalent plastic strain.
The research shows that the TRISE model is able to predict the indentation size effect. In
addition, it is also capable in capturing the hardening-softening phenomenon. Nanoindentation
experiments are performed on polycrystalline copper and aluminum. The material length scales
are determined from the model and the experimental results. It shows that the length scale
decreases with the increasing equivalent plastic strain. It approaches to zero when the strain
value is large as there is no strain gradient in large deformation and thus the length scale is equal
to zero. The material parameters from different materials differ, so the length scale can be used
to characterize the mechanical behavior during nanoindentations.
The rate dependency of the length scale and the hardness is addressed both theoretically and
experimentally. Nanoindentation experiments are performed on copper and aluminum at
different strain rates. The parameter of the strain rate in the TRISE model can be input for
different values. The experimental results and the TRISE model both show that as the strain rate
increases, the hardness of materials increases. The length scales at different strain rates are
determined from the model and experimental results. It shows that the length scale decreases
with the increasing strain rate, leading to the increasing in hardness.
The grain boundary effect on the hardening-softening phenomenon is verified by
investigating single crystal copper and aluminum. It shows in both the model and the
experiments that there is no hardening-softening phenomenon in single crystalline materials as
there is no grain boundary. The dislocations move without obstacles during the indentation
procedure.

*This chapter previously appeared as [Voyiadjis, George Z., and Cheng Zhang. "The mechanical
behavior during nanoindentation near the grain boundary in a bicrystal FCC metal." Materials Science
and Engineering: A 621 (2015): 218-228.] and as [Zhang, Cheng, and George Z. Voyiadjis. "Rate-
dependent size effects and material length scales in nanoindentation near the grain boundary for a
bicrystal FCC metal." Materials Science and Engineering: A 659 (2016): 55-62.]. It is partially reprinted
by permission of Elsevier.
43
CHAPTER 4
MECHANICAL CHARACTERIZATION DURING NANOINDENTATION NEAR THE
GRAIN GOUNDARY IN FCC METALS*
4.1 Introduction
Micro-hardness tests have been used for a long time to investigate the hardening effects due
to the grain boundaries in polycrystalline materials (Westbrook and Aust, 1963; Aust et al.,
1968). These tests showed that hardening effects are typically observed up to tens of
micrometers from the grain boundary. No hardening can be observed in the absence of the grain
boundary or other defects at this scale. The measurement of the hardening due to the grain
boundary is under investigation through the nanoindentation technique. Significant hardening
effects have been observed within a distance of the order of 1𝜇𝑚 from the grain boundary under
the low-load indentation experiments (Soifer et al., 2002; Soer and De Hossan, 2005).
Nanoindentation is widely employed in order to explore the mechanical properties in the
submicron scales (Arzt, 1998). The hardness of the testing material decreases with the increasing
indentation depth at small depths, which can be termed as indentation size effect (ISE). Recent
experiments have shown that the hardness does not solely decrease with the increasing
indentation but there is hardening-softening phenomenon (Yang and Vehoff, 2007). The
experiments showed that the hardening-softening changed with various grain sizes. When the
grain size is as much as 80𝜇𝑚, there is no hardening effect observed. The influence of the grain
boundaries in those polycrystalline samples are believed to contribute to the hardening during the
experiments. The hardening effects are believed to be due to the interaction between the
dislocations and the grain boundaries. The distance between the indenter tip and the grain
boundary changes with different grain sizes. The experiments show that the hardness increases
when the grain size decreases. Voyiadjis and Peters (2010) physically addressed the hardening-
softening phenomenon encountered in nanoindentation experiments. They proposed that due to
the difficulty for dislocations to transfer across the grain boundary, the dislocations accumulate
near the grain boundary. The accumulated dislocation causes the increase in dislocation density,
resulting in the hardening phenomenon. When the dislocations start to cross the grain boundary,
the dislocation density decreases, which causes the softening phenomenon. The influence of the
grain boundary on the hardening-softening phenomenon was verified by comparing
nanoindentation experiment results from polycrystalline material and single crystalline material
(Voyiadjis, et al., 2011). As there is no grain boundary in single crystals, no hardening-softening
phenomenon is observed. The temperature and rate dependency of indentation size effect was
investigated and a model based on the temperature and rate indentation size effect (TRISE) was
established. The TRISE model incorporates the grain size as one of the variables in the

44
expressions of hardness and length scales. The TRISE model predicted that as the grain size
decreases, the hardening effect during nanoindentations is greater as shown in Figure 4.1
(Voyiadjis and Faghihi, 2010; Faghihi and Voyiadjis, 2010, 2012). The predicted hardness from
TRISE model is compared with nanoindentation results for iron (Aifantis et al., 2006) and
niobium (Wang and Ngan, 2004). The material length scales for the two metals are determined
as shown in Figure 4.2. The length scales decrease with the decrease in the grain size.
(a) (b)
Figure 4.1 Predicted hardness as a function of the indentation depth from the TRISE model for
(a) niobium and (b) iron (Voyiadjis and Faghihi, 2010; Faghihi and Voyiadjis, 2010, 2012).
(a) (b)
Figure 4.2 Length scales for different grain sizes for (a) niobium and (b) iron (Voyiadjis and
Faghihi, 2010; Faghihi and Voyiadjis, 2010, 2012).

45
However, in polycrystalline materials, besides the grain boundaries, there are other factors
that may cause the hardening, triple junctions and the non-uniform grain size for instance. In
order to investigate the influence of just the grain boundary, bicrystalline metals should be
chosen. As there is only one grain boundary in a bicrystal sample, the hardening-soften
phenomenon observed is attributed to the grain boundary effect. It has been shown in recent
studies that typical yield excursions were observed when nanoindentation experiments were
performed in the direct proximity of grain boundaries in body-centered cubic (BCC) metals
(Wang and Ngan, 2004; Soer and De Hossan, 2005). It was proposed that the excursions are
strain bursts due to dislocation pile-up and subsequent transmission across the grain boundary
based on the load versus indentation depth curve. Nanoindentation experiments on several BCC
bicrystals were performed in the close proximity of the single grain boundary at different
distances from the grain boundary (Soer et al. 2005). The hardness at the maximum indentation
depth increases with the decreasing distance between the indenter tip and the grain boundary,
providing a new type of size effect that can be obtained through nanoindentation. The size effect
related to the grain boundary can be captured. However, typical indentation size effect cannot be
capture by Soer et al. (2005) as there is no information about the relationship between the
hardness and the indentation depth. Voyiadjis and Zhang (2015) modified the TRISE model in
order to address the size effect encountered in bicrystalline aluminum. Zhang and Voyiadjis
(2016) verified the model through nanoindentation experiments on copper bicrystal and
addressed the rate dependency during nanoindentation tests.
In this research, the grain boundary effect on the material hardness during nanoindentation
experiments are investigated through bicrystal metals in order to isolate the influence of the grain
boundary. Nanoindentation experiments are performed on bicrystal samples near the grain
boundary at different distances to the grain boundary. The TRISE model is developed in order to
be able to capture the size effect related to the grain boundary. As the TRISE model is able to
predict the classical indentation size effect, with the modified model, the classical size effect and
the size effect related to the grain boundary can be addressed in one model. By comparing the
predicted hardness with the experimental results, the length scales that characterize the size
effects are determined. The rate dependency is investigated from the TRISE model with different
strain rate parameters and nanoindentation experiments at different strain rates. The material
length scales are determined at different strain rates as well.
4.2 Determination of the Length Scales using Modified TRISE Model
In order to determine the length scales to characterize the size effects during nanoindentation,
continuum mechanics enhanced with strain gradient plasticity theory in Chapter 3 is used. From
the constitutive modeling, the length scale can be determined as follows:
𝑙 = (𝛼𝐺/𝛼𝑆)2(𝑏𝐺/𝑏𝑆)𝐿𝑆𝑀�̅� (4.1)

46
The parameter 𝐿𝑆 is defined as a function of the temperature, strain rate, equivalent plastic
strain and the grain size for polycrystalline materials as follows:
𝐿𝑆 =𝑔(𝑇)𝑑
(1 + 𝐶𝑑𝑝(1/𝑚))(1 + 𝑓(�̇�))
(4.2)
In nanoindentaion experiments on bicrystal samples, the size effect related to the grain
boundary is addressed by the distance between the indenter tip and the grain boundary.
Moreover, in bicrystal samples, the grain size is in the macroscopic scale. Therefore, the grain
size cannot be used to capture the size effect related grain boundaries. In order to characterize the
grain boundary effect, the grain size d is replaced with the distance r between the indenter tip and
the grain boundary as follows
𝑙 = (𝛼𝐺/𝛼𝑆)2(𝑏𝐺/𝑏𝑆)𝑀�̅� (𝛿1𝑑𝑒(−𝐸𝑟/𝑅𝑇)
(1 + 𝛿2𝑟𝑝(1/𝑚))(1 + 𝛿3(�̇�)𝑞))
(4.3)
The hardness as a function of the indentation depth is derived from the TRISE model for
bicrystals. For polycrystalline materials in Chapter 3, the GND density is calculated from the
total dislocation length divided by the plastic deformation volume as follows:
𝜌𝐺 =𝜆
𝑉𝑝𝑙𝑎𝑠𝑡𝑖𝑐=
𝜋𝑏𝐺
ℎ2
tan 𝜃𝜋
12 𝑑3 − 8.19ℎ3 (4.4)
The volume of the plastic deformation is the volume of the semi-sphere with a diameter
equal to the grain size minus the volume taken by the indenter in polycrystalline materials when
the plastic zone expands and reaches the grain boundaries. For bicrystal samples, the interaction
of the plastic zone with the grain boundary is shown in Figure 4.3 (Voyiadjis and Zhang, 2015).
Figure 4.3 The interaction between the plastic zone and the grain boundary for a bicrystalline
material.
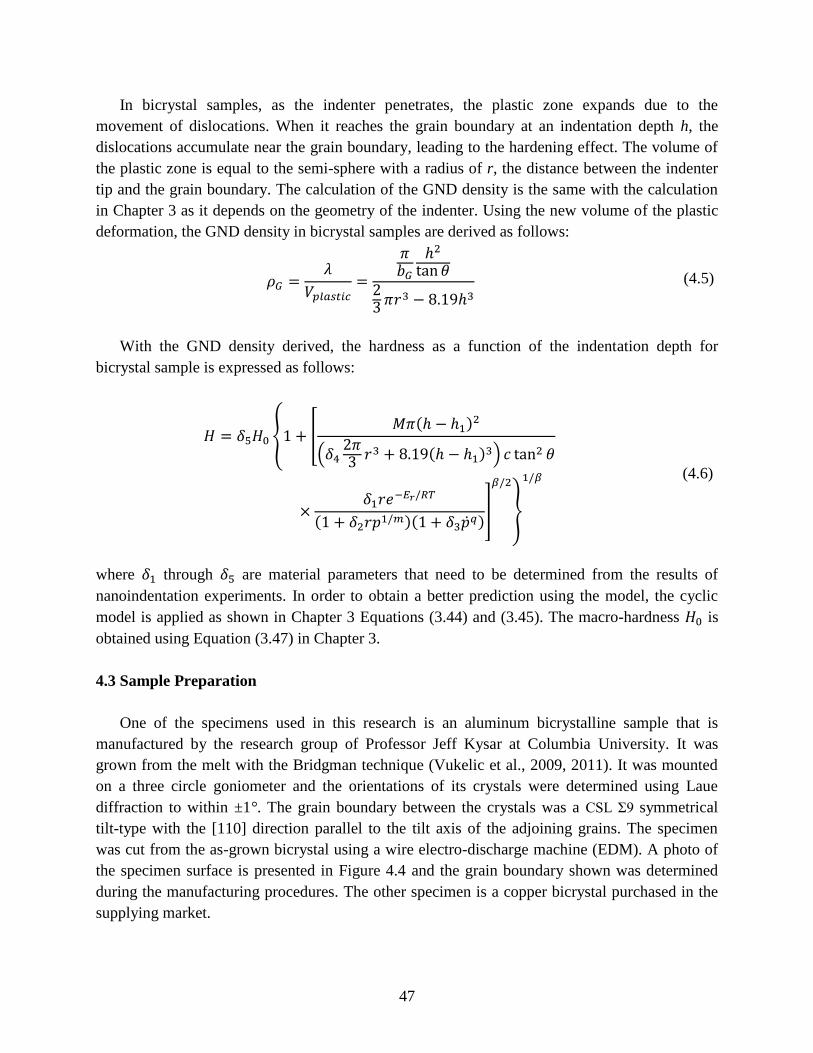
47
In bicrystal samples, as the indenter penetrates, the plastic zone expands due to the
movement of dislocations. When it reaches the grain boundary at an indentation depth h, the
dislocations accumulate near the grain boundary, leading to the hardening effect. The volume of
the plastic zone is equal to the semi-sphere with a radius of r, the distance between the indenter
tip and the grain boundary. The calculation of the GND density is the same with the calculation
in Chapter 3 as it depends on the geometry of the indenter. Using the new volume of the plastic
deformation, the GND density in bicrystal samples are derived as follows:
𝜌𝐺 =𝜆
𝑉𝑝𝑙𝑎𝑠𝑡𝑖𝑐=
𝜋𝑏𝐺
ℎ2
tan 𝜃23 𝜋𝑟3 − 8.19ℎ3
(4.5)
With the GND density derived, the hardness as a function of the indentation depth for
bicrystal sample is expressed as follows:
𝐻 = 𝛿5𝐻0 {1 + [𝑀𝜋(ℎ − ℎ1)2
(𝛿42𝜋3 𝑟3 + 8.19(ℎ − ℎ1)3) 𝑐 tan2 𝜃
×𝛿1𝑟𝑒−𝐸𝑟/𝑅𝑇
(1 + 𝛿2𝑟𝑝1/𝑚)(1 + 𝛿3�̇�𝑞)]
𝛽/2
}
1/𝛽
(4.6)
where 𝛿1 through 𝛿5 are material parameters that need to be determined from the results of
nanoindentation experiments. In order to obtain a better prediction using the model, the cyclic
model is applied as shown in Chapter 3 Equations (3.44) and (3.45). The macro-hardness 𝐻0 is
obtained using Equation (3.47) in Chapter 3.
4.3 Sample Preparation
One of the specimens used in this research is an aluminum bicrystalline sample that is
manufactured by the research group of Professor Jeff Kysar at Columbia University. It was
grown from the melt with the Bridgman technique (Vukelic et al., 2009, 2011). It was mounted
on a three circle goniometer and the orientations of its crystals were determined using Laue
diffraction to within ±1°. The grain boundary between the crystals was a CSL Σ9 symmetrical
tilt-type with the [110] direction parallel to the tilt axis of the adjoining grains. The specimen
was cut from the as-grown bicrystal using a wire electro-discharge machine (EDM). A photo of
the specimen surface is presented in Figure 4.4 and the grain boundary shown was determined
during the manufacturing procedures. The other specimen is a copper bicrystal purchased in the
supplying market.

48
Figure 4.4 The photo of the bicrystalline specimen surface with grain boundary position shown.
To capture the ISE, one needs to verify the quality of the specimen, especially the surface
roughness and oxidation layer. The oxidation layer is an unavoidable phenomenon caused by the
chemical reaction between the surface of the specimen and the oxygen in the air. To limit the
influence of the oxidation layer, one needs to perform the indentation tests as soon as possible
after polishing the specimen. Moreover, the first 10 nm of indentation depth is not considered in
the results because of the oxidation layer. In order to make the experimental results reliable,
several mechanical and chemical-mechanical polishing steps were used to obtain a smooth and
deformation-free surface. The specimen was firstly mechanically polished using increasingly
finer polishing papers with silicon carbide abrasive particles to level the surface. Following that
the mechanical polishing was performed using a polishing cloth with the suspension of 15 𝜇𝑚, 9
𝜇𝑚, 6 𝜇𝑚, 3 𝜇𝑚 and 1 𝜇𝑚 diamond particles. After each step, the state of surface was checked
by visual inspection under a light microscope. Once no change of the state of the surface was
observed, the polishing procedure moved to the next step. After the mechanical polishing steps
residual plastic deformations remained on the surface, which would affect the results of
nanoindentation experiments. Therefore, chemical-mechanical polishing was conducted with a
water-based suspension containing 0.05 𝜇𝑚 colloidal silica particles, which can remove the
residual plastic deformation on the specimen surface. The chemical-mechanical polishing was
performed in a vibratory polisher for 15 hours in order to make the grain boundary visible.
4.4 Nanoindentation Experiments near the Grain Noundary
After performing the mechanical and mechanical-chemical polishing steps, the grain
boundary of each specimen was visibly observed as a straight line at the same position
determined during manufacturing procedures. A pen mark was made on the grain boundary of
the aluminum bicrystal sample and when the sample was moved under the microscope of the
nanoindenter at a small magnification 10X, the grain boundary was still visible as shown in

49
Figure 4.5, a. However, under a 10X microscope, the distance between the indentation and the
grain boundary cannot be captured. Two indentations were firstly made on two separate points
on the grain boundary in order to identify the boundary. The grain boundary was then identified
by a straight line connecting the two indentations as marks. After identifying the location of the
grain boundary, a microscope of 40X was used and 15 indentations were performed in a straight
line with 5 𝜇𝑚 spacing at a constant strain rate of 0.05 s−1 as shown in Figure 4.5, b. Although
plastic deformed zones of consecutive indentations are likely to overlap at such close spacing, no
significant effect of interactions on the hardness measurements was found by comparing to the
tests of a line of indentations with 20 𝜇𝑚 spacing. In order to avoid the interactions among the
indentations, the maximum depth of each of them was made at 500 nm. It is shown that the line
of indentations crossed the grain boundary and the angle between the line of indentations and the
grain boundary is 20°.
(a) (b)
Figure 4.5 (a) Visualization of the grain boundary under a 10X microscope. (b) Indentations and
the grain boundary under 40X microscope. The grain boundary is represented by a straight line
connecting the two indentations as marks.
Five indentations are made in the same grain to the left of the grain boundary. The crystalline
structure at the positions of those five indentations is identical and the only difference is the
distance r between the indentation and the grain boundary. These distances are shown in Figure
4.6. The corresponding experimental results for the five tests are shown in Figure 4.7. For tests 1
and 2, the hardness continuously decreases with the increasing indentation depth, showing that
the material behaves as a single crystalline material and there is no grain boundary effect as the
indentations are made too far from the grain boundary. For tests 3, 4 and 5, one observes both
hardening and softening zones in the experimental results. It is observed that the hardening effect
increases as the distance from the indentations to the grain boundary becomes smaller. This is
due to the interaction between the GNDs created by the indenter and the grain boundary. At

50
closer distances from the grain boundary, the GNDs start to accumulate near the grain boundary
for smaller indentation depths. As the indenter penetrates, there are more GNDs accumulated
near the grain boundary than for indentations with higher distances from the grain boundary.
Therefore, it is clear from the experimental results that the indentations at a closer distance
from the grain boundary have higher values of hardness in the hardening zone and it starts to
harden at smaller indentation depths.
Figure 4.6 Distances from the indentations to the grain boundary.
Figure 4.7 Hardness versus indentation depth curves for five indentations with different distances
between the indenter and the grain boundary. The two solid curves represent the two indentations
without hardening-softening effect as the two indentations were made far from the grain
boundary. It shows from the three dashed curves that, as the distance of an indentation to the
grain boundary becomes smaller, there is stronger hardening effect and the hardening effect
starts earlier.
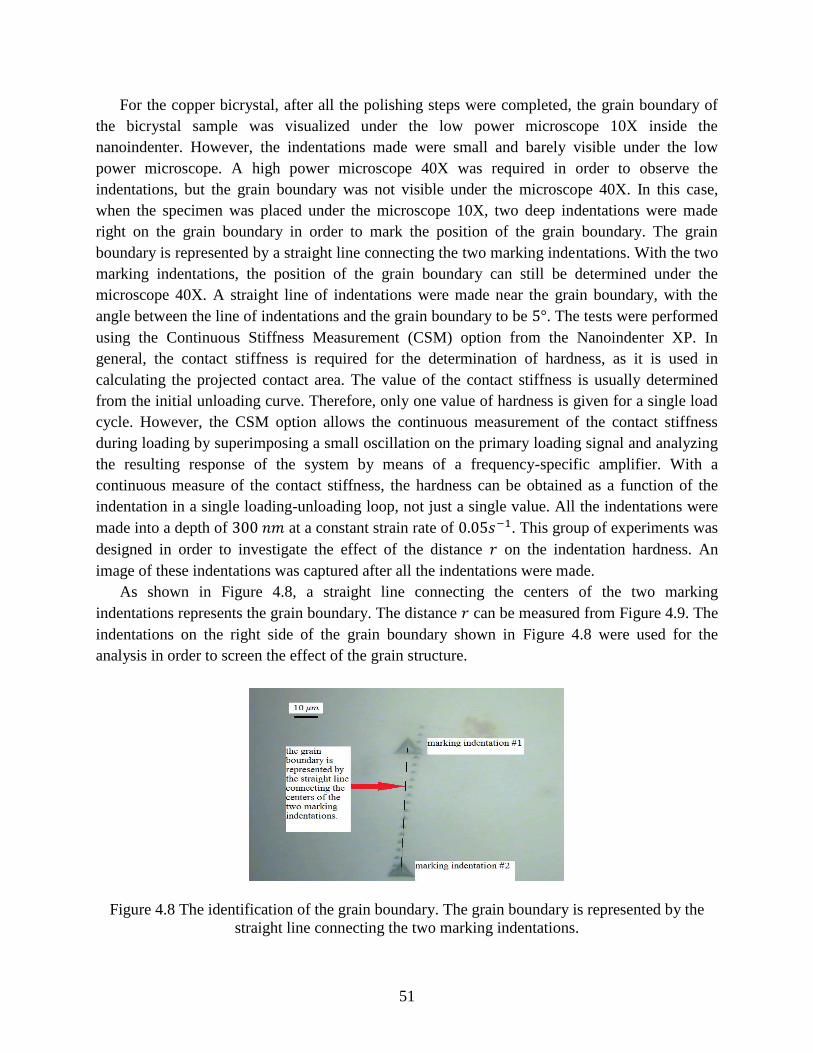
51
For the copper bicrystal, after all the polishing steps were completed, the grain boundary of
the bicrystal sample was visualized under the low power microscope 10X inside the
nanoindenter. However, the indentations made were small and barely visible under the low
power microscope. A high power microscope 40X was required in order to observe the
indentations, but the grain boundary was not visible under the microscope 40X. In this case,
when the specimen was placed under the microscope 10X, two deep indentations were made
right on the grain boundary in order to mark the position of the grain boundary. The grain
boundary is represented by a straight line connecting the two marking indentations. With the two
marking indentations, the position of the grain boundary can still be determined under the
microscope 40X. A straight line of indentations were made near the grain boundary, with the
angle between the line of indentations and the grain boundary to be 5°. The tests were performed
using the Continuous Stiffness Measurement (CSM) option from the Nanoindenter XP. In
general, the contact stiffness is required for the determination of hardness, as it is used in
calculating the projected contact area. The value of the contact stiffness is usually determined
from the initial unloading curve. Therefore, only one value of hardness is given for a single load
cycle. However, the CSM option allows the continuous measurement of the contact stiffness
during loading by superimposing a small oscillation on the primary loading signal and analyzing
the resulting response of the system by means of a frequency-specific amplifier. With a
continuous measure of the contact stiffness, the hardness can be obtained as a function of the
indentation in a single loading-unloading loop, not just a single value. All the indentations were
made into a depth of 300 𝑛𝑚 at a constant strain rate of 0.05𝑠−1. This group of experiments was
designed in order to investigate the effect of the distance 𝑟 on the indentation hardness. An
image of these indentations was captured after all the indentations were made.
As shown in Figure 4.8, a straight line connecting the centers of the two marking
indentations represents the grain boundary. The distance 𝑟 can be measured from Figure 4.9. The
indentations on the right side of the grain boundary shown in Figure 4.8 were used for the
analysis in order to screen the effect of the grain structure.
Figure 4.8 The identification of the grain boundary. The grain boundary is represented by the
straight line connecting the two marking indentations.

52
Figure 4.9 Distances between the indentations and the grain boundary. Three indentations with
hardening-softening segments are marked and the corresponding distances to the grain boundary
are given.
Three indentations in this group of experiments showed hardening-softening as shown in
Figure 4.9. Others did not show such a phenomenon due to the large distances of those
indentations from the grain boundary. Figure 4.10 shows clearly that as the distance 𝑟 decreases,
the hardness increases in the hardening-softening portion. The indentation right on the grain
boundary is also presented in Figure 4.10 and it shows that no hardening-softening phenomenon
is observed as there is no accumulation of dislocations since the dislocations are initiated and
propagated from the grain boundary. When the distance 𝑟 is smaller, the density of GNDs 𝜌𝐺 is
higher which causes the interactions between the dislocations and the grain boundary to become
stronger. Therefore, there is an increase in the hardness in the hardening-softening portion of the
hardness curve. The size effect of 𝑟 is thus verified for the copper bicrystal. As the indentation
depth keeps increasing, the hardness of the three indentations converges to the same value. This
phenomenon can be predicted because after the hardening and softening, the effect of the grain
boundary vanishes and the material hardness should approach the macrohardness. The three
indentations were made at the same strain rate, so they must have the same value of the
macrohardness. In order to prove that the increase in hardening is from the interaction between
the dislocations and the grain boundary but not from the strain hardening due to the spherical tip
in the Berkovich indenter, the elastic modulus as a function of the indentation depth is presented
in Figure 4.11. It shows that when the indentation depth is greater than 20 nm, the elastic moduli
for the three indentations with different values of r are close with each other around a constant
value. This means that there is no strain hardening effect when the indentation depth is greater
than 20 nm. Moreover, since the elastic modulus is not size-dependent, the three indentations
should determine the same elastic modulus. It shows in Figure 4.10 that the hardening begins at

53
the depth of 50 nm, proving that the hardening is caused by the accumulation of dislocations near
the grain boundary as no strain hardening is observed in the depth greater than 50 nm.
Figure 4.10 Hardness versus indentation depth curves from nanoindentation experiments for
indentations with different values of r at the same strain rate of 0.05 𝑠−1. The solid (green) curve
indicates the indentation made on the grain boundary. No hardening-softening is observed since
the dislocations are initiated and propagated from the grain boundary without accumulation.
Figure 4.11 Elastic modulus as a function of the indentation depth for three indentations at
different distances from the grain boundary. It shows that the moduli of the three indentations are
close to each other when the indentation depth is greater than 20 nm.

54
4.5 Finite Element Simulation
In order to obtain the equivalent plastic strain as a function of the indentation depth, finite-
element simulation is performed for the indentation problem using ABAQUS software. A cube
with 50-𝜇𝑚 sides is modeled to represent the tested sample. The Berkovich indenter is modeled
on top of the cube as a blunt pyramid. The tip of the indenter is an equilateral triangle with 20-
nm sides.
The ABAQUS interaction module is used to model the contact between the indenter and the
sample. A special velocity is assigned to the indenter so that the indenter penetrates the sample to
a depth of approximately 500 nm. After plastic deformation takes place, the indent can be
observed at the sample surface as shown in Figure 4.12.
(a)
(b)
Figure 4.12 ABAQUS simulation results. (a) A contour plot of indentation depth, (b) A contour
plot of the equivalent plastic strain.

55
4.6 Comparison between the Model and the Experiments
The hardness expressions from the TRISE model for bicrystals are compared with the
hardness curves from the nanoindentation experiments for bicrystal aluminum as shown in
Figure 4.13 and bicrystal copper as shown in Figure 4.14.
Figure 4.13. Comparison of TRISE model with experimental results for the three indentations
with hardening-softening effect. The solid curves are obtained from TRISE model and the
dashed curves are obtained from nano-indentation experiments.
Figure 4.14 Comparison of hardness curves from TRISE model and nanoindentation experiments
at various distances between the indenter and the grain boundary. Solid curves are predicted by
the TRISE model.

56
The comparison shows that the TRISE model is firstly able to predict the indentation size
effect as the hardness decreases with the increasing at small depths. The TRISE model is also
able to predict the size effect related to the grain boundary, as for both specimens, the hardening
becomes greater with the decreasing distance r between the indenter tip and the grain boundary.
The models for bicrystal aluminum and copper show a good agreement with the experimental
results. It also shows that the indentation depth in which the hardening starts becomes greater as
the indentation moves away from the grain boundary. This is because when the distance r is
greater, it requires greater indentation depth for the plastic zone to expand and reach the grain
boundary.
The material parameters in the expressions of hardness and length scales are determined from
curve fitting while comparing the model and the experiments. The length scale as a function of
the equivalent plastic strain is determined for aluminum (Figure 4.15) and copper (Figure 4.16),
respectively. The material parameters are presented in Table 4.1 for aluminum and for copper. It
shows in both figures that the length scale decrease with the increasing equivalent plastic strain
and approaches to zero when the strain is large. The indentation size effect is addressed by the
length scales determined as there is higher strain gradient in small deformation, which requires a
smaller length scale. It also follows the intrinsic property of the length scale that there is no
gradient for large deformation and therefore the length scale is equal to zero. The length scale
decreases as the distance r becomes smaller. The smaller length scale indicates a higher strain
gradient, which leads to the increase in the material hardness.
Figure 4.15 Material length scales versus equivalent plastic strain with different distances to the
grain boundary for bicrystalline aluminum using the physically based model. Higher stain
gradient can be observed for indentation closer to the grain boundary.

57
Figure 4.16 Material length scales versus equivalent plastic strain with different distances
between the indenter and the grain boundary.
Table 4.1 Material parameters for bicrystal aluminum and copper.
Model Parameters aluminum copper
ℎ1 (nm) 10 42
𝛿1 1.9 2.0
𝛿2 135 3.0
𝛿3 0.01 0.01
𝛿4 1.61 × 10⁻⁶ 2.44 × 10⁻⁷
𝛿5 0.75 0.4
4.7 Rate Dependency of the Length Scale
The rate dependency of the length scale is investigated by incorporating a strain rate
parameter in the expression in the length scale. As the hardness expression using the TRISE
model is derived through the length scale, which means the hardness is rate dependent.
Nanoindentation experiments are performed near the grain boundary of the copper bicrystal at
different strain rates of 0.05 𝑠−1, 0.08 𝑠−1 and 0.10 𝑠−1 as shown in Figure 4.17. It shows from
the experimental results that the hardness increases with the increasing strain rate.

58
Figure 4.17 Hardness versus indentation depth curves from nanoindentation experiments for
indentations with different strain rates but with the same 𝑟.
In order to determine the length scale, the equivalent plastic strain as a function of the
indentation depth is required and it is usually determined using finite element simulation. The
equivalent plastic strain during nanoindentation is also rate dependent. Therefore, there must be a
rate dependent constitutive relation used during the simulation using ABAQUS. This is achieved
by implementing a user material subroutine VUMAT during the simulation of indentation
problems. After the simulation, the equivalent plastic strain is determined as a function of the
indentation at different strain rates.
Comparing the hardness predicted by the TRISE model and the experimental results as
shown in Figure 4.18, length scales for copper bicrystal at different strain rates are determined as
shown in Figure 4.19. The comparison shows that the TRISE model predicts the rate dependency
of hardness during nanoindentation very well. The hardness increases with higher value of the
strain rate is used. The length scales show that the length scale decreases with the increasing,
which causes the greater hardness at higher strain rates. It should be noted that the increase in
hardness at different strain rates is due to the rate sensitivity. This sensitivity exists along the
entire indentation depth. Therefore, as the strain rate increases, the hardness in the entire
indentation depth increases. The amount of hardening is similar between the curves from
different strain rates. This is because the distance between the indenter tip and the grain
boundary is the same.

59
Figure 4.18 Comparison of hardness curves from TRISE model and nanoindentation experiments
at various distances between the indenter and the grain boundary. Solid curves are predicted by
the TRISE model.
Figure 4.19 Material length scales versus equivalent plastic strain with different distances
between the indenter and the grain boundary using Equation (21).

60
4.8 Conclusion
In this work, the contribution of the grain boundary to the hardening-softening phenomenon
is investigated. The hardness increases with the decreasing grain size, which indicates that
distance between the indenter and the grain boundary is an important factor related to the
hardening-softening phenomenon. In order to isolate the grain boundary effect, bicrystal samples
are used and nanoindentation experiments are performed near the grain boundary at different
distances. The experimental results show that as the distance between the indenter tip and the
grain boundary decreases, there is a higher hardening effect in the hardness curve from
experiments.
In order to determine the length scale that is able to address the grain boundary effect, the
TRISE model is modified for bicrystal samples. The distance r between the indenter tip and the
grain boundary replaced the grain size factor because the grain size in bicrystals is in
macroscopic scale. From the TRISE model and the experimental results, the length scale is
determined in order to characterize both the indentation size effect and the grain boundary effect.
The length scale becomes smaller when the distance r is smaller, indicating a higher strain
gradient that leads to a greater hardness.
The rate dependency of bicrystals in nanoindentation is investigated. Nanoindentation
experiments are performed at different strain rate with the same distance to the grain boundary.
The equivalent plastic strain is determined using ABAQUS with VUMAT that provides the rate
dependent constitutive relation. The TRISE model shows that the hardness increases with the
increasing strain rates by giving different strain rate values into the hardness expression. Length
scales at different strain rates are determined from the TRISE model and the experimental
results. It shows that the length scale is rate dependent and it decreases with the increasing strain
rate.

61
CHAPTER 5
NONLOCAL GRADIENT PLASTICITY THEORY
5.1 Introduction
It has been observed in the experiments of materials with microstructures that an initial
evolution of defects is induced in the original material state in the form of localized zones during
the process of cold-working, machining and forming, etc. The localized defects lead to a non-
uniform material behavior. The defect may accumulate and interact with each other in the
localized zones, which causes that the failure of materials is initiated in those localized zones due
to further loadings.
As the localizations take place in small volumes in materials, the governing characteristic
length scale of defects and their interactions is much lower than the local state variables used in
the continuum theory. This leads to the loss of the statistical homogeneity in the representative
volume element (RVE). Strong size effects are induced so that all the macroscopic functions
used are sensitive to the properties within the RVE. The material behaviors are governed by
mechanisms at different scales. The classical continuum theory does not contain the material
intrinsic length scale, which leads to the numerical stability problems such as mesh size and
mesh alignment sensitivities (Bammann et al., 1999; Glema, et al., 2000; Li et al., 2002;
Voyiadjis et al. 2001; Voyiadjis and Abu Al-Rub, 2003; Voyiadjis and Abed, 2005; Voyiadjis
and Dorgan, 2001). Nonlocal theory, which introduces the material intrinsic length scale in the
constitutive equations, can be used in order to describe the long-range microstructural behaviors
at a material point to be dependent not only on the state of the point itself but also the state of its
neighboring space.
The integral models of nonlocal theory was reported by Kroner (1967) and Eringen and
Edelen (1972) by incorporating the nonlocal terms through the integral equations of elasticity.
The nonlocal anisotropic formulations based on the nonlocal tensorial variables were addressed
by Bazant and Ozbolt (1990). A global averaging procedure is required in the integration using
nonlocal models. However, this procedure cannot be easily linearized, which makes the integral
models computationally inefficient.
Using Taylor series expansion, the integral models can be approximated to the gradient
theories. Gradient theories include the higher-order gradients with coefficients that represent
length scales associated with the nonlocal theories in the terms of the constitutive equations.
Bammann and Aifantis (1982) and Aifantis (1984) incorporated a nonlocal terms through a
gradient approach in order to describe the plastic deformation such as dislocation patterns and
shear bands. Muhlhaus and Aifantis (1991) introduced the nonlocal behavior into the plasticity
model through gradient terms in the yield function. Voyiadjis et al. (2001) and Voyiadjis and
Dorgan (2001) proposed a multiscale model for plasticity and damage by incorporating the
internal variables and the corresponding gradients in the potential functions as well as the yield
and damage criteria. Dorgan and Voyiadjis (2003) proposed a formulation at the macroscale in
62
the plasticity potential function using nonlocal plasticity theory and gave the microstructural
basis through the dislocation theory.
Size effects have shown their great importance in many engineering applications. Fleck et al.
(1994) and Stolken and Evans (1998) reported the micro-torsion tests of thin wires and micro-
bending tests of thin beams respectively and showed that the mechanical response increased with
the decreasing diameter of the wire and the decreasing thickness of the beam. Size effect in
nanoindentation experiments was reported by many researchers that the indentation hardness
increased with the decreasing indentation depth or the decreasing indenter size (Stelmashenko et
al., 1993; DeGuzman e al., 1993; Ma and Clarke, 1995; McElhaney et al., 1998; Swadener et al.,
2002a, 2002b; Voyiadjis and Peters 2010). Huber et al. (2002) showed that the indentation of
thin films showed an increase in the yield strength as the film thickness decreased. It has also
been found that in nanoindentation experiments of polycrystalline materials, the hardness
increased with the decreasing grain size (Yang and Vehoff, 2007) and that in nanoindentation
experiments of bicrystalline materials near the grain boundary, the hardness increased as the
distance between the indenter and the grain boundary decreased (Voyiadjis and Zhang, 2015;
Zhang and Voyiadjis, 2016). These experiments presented the increase in strength with
decreasing size in the micro and nano scales. Therefore, the mechanical responses are size
dependent. In order to characterize this size dependency, a material length scale is required. The
classical continuum plasticity theory (Hill, 1998) does not contain a length scale parameter and
therefore, it is not able to predict the size effect encountered in experiments. Atomistic
simulations, on the other hand, are not computational possible in predicting the size effect in the
micro and mesoscale. Therefore, the classical theory needs to be enhanced with the gradient
theory that incorporates the length scale parameter in the constitutive equations in order to bridge
the gap between the macro-scale and the micro/nano-scale. In the last two decades, researchers
have related the size dependency of mechanical properties to the strain gradients in a localized
volume that leads to geometrically necessary dislocations (GNDs) (Fleck et al., 1994; Arsenlis
and Parks, 1999; Busso et al., 2000; Nix and Gao, 1998; Abu Al-Rub and Voyiadjis, 2004;
Voyiadjis and Abu Al-Rub, 2005; Voyiadjis et al., 2011; Voyiadjis and Zhang, 2015). Fleck and
Hutchinson (1997) applied the phenomenological method to simplify the integral format of
nonlocal theory through the couple stress theory. The plastic strain at a given point is dependent
on its local counterpart and the strain gradient due to the non-uniform deformation in the small
volume. The proposed relation verified the experimental observations by Fleck and Hutchinson
(1993). Abu Al-Rub and Voyiadjis (2004) and Voyiadjis and Abu Al-Rub (2005) proposed a
more general formulation of the coupling between the local plastic strain and the strain gradient.
In order to determine the length scale, the nonlocal model with length scale needs to be
compared with the experimental results. Nanoindentation experiments have been found to be the
most effective way to determine the length scale. In the macro-scale, the nonlocal theory
provides the constitutive relation through the properties at a local point and the strain gradient
together with a length scale parameter. In the micro-scale, Taylor hardening law was adapted and
developed through the GNDs and statistically stored dislocations (SSDs) (Nix and Gao, 1998;

63
Gao and Huang, 2003; Abu Al-Rub and Voyiadjis 2004; Voyiadjis and Abu Al-Rub, 2005;
Voyiadjis and Almasri, 2009). The hardness expression was given through Tabor’s relation
(Tabor, 1951) between hardness and flow stress (Voyiadjis and Peters, 2010). Therefore, with
the length scale to be determined, the mechanical responses at different scales can be
characterized. At the beginning, the length scales were determined as constant values in the scale
of a few micrometers (Nix and Gao, 1998; McElhaney et al., 1998; Yuan and Chen, 2001).
However, it has been shown that for different problems, it may require different values for the
length scales (Begley and Hutchinson, 1998). Abu Al-Rub and Voyiadjis (2004) and Voyiadjis
and Abu Al-Rub (2005) proposed an expression of length scale that is proportional with the
mean free path of SSDs. As the mean free path of SSDs changes with the indentation procedure,
the length scale is not a fixed value but a variable length scale.
In this chapter, the formulation of nonlocal gradient theory is given starting from the integral
format in order to support the equations used in Chapters 3 and 4. The nonlocal theory is
presented in both macro-scale and micro-scale. The gradient formulation is given through a
thermodynamic consistent framework. Isotropic hardening and kinematic hardening are
presented in the micro-scale basis. Shear band problem is taken as an example for the mesh
refinement in finite element simulations.
5.2 Weak Form of the Nonlocal Formulation
The mechanical responses of a material at a given point depend not only on the local
counterparts but also on the state in the neighboring space through a nonlocal gradient term. The
classical continuum theory is thus enhanced with the gradient theory in order to characterize the
long-range microstructural interactions. Taking plastic strain for an example, at a given material
point x, the nonlocal measurement of plastic strain 𝑝 is expressed through the weighted average
of its local counterpart p over the surrounding volume V at a small distance |𝑑| ≤ 𝐿𝑐 from x as
follows:
𝒑 =1
𝑉∫ 𝒘(𝑑)𝒑(𝑥 + 𝑑)
𝑉
𝑑𝑉 (5.1)
where 𝐿𝑐 is an internal characteristic length; 𝒘(𝑑) is a weight function that decays smoothly
with distance d. 𝒘(𝑑) is given by
𝒘(𝑑) = 𝑰𝑤(𝑑) (5.2)
where I is an identity tensor that may be replaced by another tensor in order to induce anisotropic
behaviors of materials.
The local tensor 𝒑 in Equation (5.1) can be approximated using a Taylor series expansion at
d=0 (Muhlhaus and Aifantis, 1991; Vardoulakis and Aifantis, 1991) such that

64
𝒑(𝑥 + 𝑑) = 𝒑(𝑥) + ∇𝒑(𝑥)𝑑 +1
2!∇2𝒑(𝑥)𝑑2 +
1
3!∇3𝒑(𝑥)𝑑3 + ⋯ (5.3)
where ∇i denotes the ith order of the gradient operator. If only isotropic behavior is considered,
the integrals of the odd terms in Equation (5.3) vanish. By truncating the Taylor series after the
quadratic term, and combining Equations (5.1) and (5.3) yields
𝒑 =1
𝑉∫ 𝑤(𝑑)𝒑(𝑥)
𝑉
𝑑𝑉 +1
2! 𝑉∫ 𝑤(𝑑)∇2𝒑(𝑥)𝑑2
𝑉
𝑑𝑉 (5.4)
Equation (5.4) can be rewritten as a partial differential equation as follows
𝒑 = 𝒑 + (1
2! 𝑉∫ 𝑤(𝑑)𝑑2
𝑉
𝑑𝑉) ∇2𝒑 (5.5)
with
1
𝑉∫ 𝑤(𝑑)
𝑉
𝑑𝑉 = 1 (5.6)
Therefore, Equation (5.5) can be simplified as follows
𝒑 = 𝒑 + 𝑙2∇2𝒑 (5.6)
In Equation (5.6), the gradient term 𝑙2∇2𝒑 is taken as an approximation of the nonlocal strain
gradient in the neighboring space of the material point at x. l is the length scale that weighs the
gradient term.
Fleck and Hutchinson (1993) developed a phenomenological theory of strain gradient
plasticity based on gradients of rotation, which fits with the framework of the couple stress
theory. By assuming that the strain energy density is only dependent on second von Mises
invariant of strain, Fleck and Hutchinson (1997) further simplified the expression based on that
the strain energy density depends only on the overall effective strain as follows:
𝑝 = √𝑝2 + 𝑙2𝜂2 (5.7)
where 𝑝 is the total plastic strain; p is the local counterpart of the plastic strain; 𝜂 is the strain
gradient due to the non-uniform deformation in a small volume; l is the length scale that
characterizes the influence of the strain gradient.
Abu Al-Rub and Voyiadjis (2004) and Voyiadjis and Abu Al-Rub (2005) developed a more
general expression of Equation (5.7) such that
𝑝 = [𝑝𝛾 + (𝑙𝜂)𝛾]1/𝛾 (5.8)

65
where 𝛾 is the fitting parameter. Therefore, Equation (5.7) that was proposed by Fleck and
Hutchinson (1997) assumes 𝛾 = 2. The gradient term is expressed as follows
𝑙𝜂 = 𝑐1𝜂𝑖𝑖𝑘𝜂𝑗𝑗𝑘 + 𝑐2𝜂𝑖𝑗𝑘𝜂𝑖𝑗𝑘 + 𝑐3𝜂𝑖𝑗𝑘𝜂𝑘𝑗𝑖 (5.9)
where 𝑐1, 𝑐2 and 𝑐3 are material coefficients of length square dimension.
Aifantis and his co-workers (Aifantis, 1984, 1987; Zbib and Aifantis, 1988; Muhlhaus and
Aifantis, 1991) proposed the coupling between the local strain and the strain gradient as 𝛾 = 1.
The gradient term is expressed as follows
𝑙𝜂 = 𝑙‖∇𝑝‖ = 𝑙√∇𝑝 ∙ ∇𝑝 (5.10)
de Borst and his co-workers (de Borst and Muhlhaus, 1992; de Borst et al., 1993; de Borst and
Pamin, 1996) proposed the gradient term as follows
𝑙𝜂 = 𝑎2∇2𝑝 (5.11)
with 𝑙 = √𝑎.
Gao and co-workers proposed the mechanism based strain gradient theory and the Taylor
based nonlocal theory of plasticity (Nix and Gao, 1998; Gao et al., 1999a, 1999b; Huang et al.,
2000; Gao and Huang, 2001, 2003). They gave different values of 𝛾 such that
𝑝 = √𝑝2 + 𝑙𝜂 (5.12)
This type of equation has been applied by many authors to solve the size effect problems at small
scales such as micro-bending, micro-torsion, particle reinforced composites, micro-electro-
mechanical systems (MEMS), indentations, crack tips and void growth (Begley and Hutchinson,
1998; Stolken and Evans, 1998; Saha et al., 2001; Gao et al., 1999, 2000; Guo et al., 2001; Xue
et al., 2002a, 2002b, 2002c; Wang et al., 2003).
5.3 Thermodynamically Consistent Gradient Formulation
In order to describe the isotropic hardening and kinematic hardening, the thermodynamic
framework uses the Helmholtz free energy that depends on the internal state variables such that:
𝛹 = 𝛹(휀𝑖𝑗𝑒 , 𝑇, 𝑘𝑖𝑗 , 𝛻2𝑘𝑖𝑗 , 𝑝, 𝛻2𝑝) (5.13)
where 휀𝑖𝑗𝑒 is the elastic strain; T is the temperature in Kelvin; 𝑘𝑖𝑗 and 𝑝 are the local measure of
the kinematic and isotropic hardening; ∇2𝑘𝑖𝑗 and ∇2𝑝 are the gradients of kinematic and

66
isotropic hardening, respectively. It needs to be mentioned that the nonlocal expressions of
isotropic and kinematic hardening are given as follows (Dorgan and Voyiadjis, 2003)
𝑝 = 𝑝 + 𝐴∇2𝑝 (5.14)
𝑘𝑖𝑗 = 𝑘𝑖𝑗2 + 𝐵∇2𝑘𝑖𝑗 (5.15)
The internal variables for kinematic hardening and isotropic hardening are assumed to be
independent of each other in order to identify the two properties separately. It is quite common to
treat quantities to be independent even though they are related (Dorgan and Voyiadjis, 2003).
Based on the above assumption, Equation (5.13) can be rewritten as the quadratic form in
terms of its internal state variables as follows
𝜌𝛹 =1
2(휀𝑖𝑗 − 휀𝑖𝑗
𝑝 )𝑬𝑖𝑗𝑘𝑙(휀𝑘𝑙 − 휀𝑘𝑙𝑝 ) +
1
2𝑎1𝑝2 +
1
2𝑎2(𝛻2𝑝)2 +
1
2𝑏1𝑘𝑖𝑗𝑘𝑖𝑗
+1
2𝑏2𝛻2𝑘𝑖𝑗𝛻2𝑘𝑖𝑗
(5.16)
where the matrix 𝑬𝑖𝑗𝑘𝑙 is the fourth order elastic stiffness tensor; 휀𝑖𝑗 is the total strain; 휀𝑖𝑗𝑝
is the
plastic strain; 𝑎1, 𝑎2, 𝑏1 and 𝑏2 are coefficients that are dependent on material and geometrical
properties. By taking the time derivative of Equation (5.13), one can obtain the following
expression
�̇� =𝜕𝛹
𝜕휀𝑖𝑗𝑒 휀�̇�𝑗
𝑒 +𝜕𝛹
𝜕𝑇�̇� +
𝜕𝛹
𝜕𝑘𝑖𝑗�̇�𝑖𝑗 +
𝜕𝛹
𝜕𝛻2𝑘𝑖𝑗𝛻2�̇�𝑖𝑗 +
𝜕𝛹
𝜕𝑝�̇� +
𝜕𝛹
𝜕𝛻2𝑝𝛻2�̇� (5.17)
Substitution of Equation (5.17) into the Clausus-Duhem inequality gives the following equation
(𝜎𝑖𝑗 − 𝜌𝜕𝛹
𝜕휀𝑖𝑗𝑒 ) 휀�̇�𝑗
𝑒 − 𝜌 (𝜕𝛹
𝜕𝑇+ 𝑠) �̇� + 𝜎𝑖𝑗휀�̇�𝑗
𝑝 −𝑞
𝑇∙ 𝛻𝑇 − 𝜌
𝜕𝛹
𝜕𝛻2𝑘𝑖𝑗𝛻2�̇�𝑖𝑗 − 𝜌
𝜕𝛹
𝜕𝑘𝑖𝑗�̇�𝑖𝑗
− 𝜌𝜕𝛹
𝜕𝑝�̇� −
𝜕𝛹
𝜕𝛻2𝑝𝛻2�̇� ≥ 0
(5.18)
From Equation (5.18) the thermodynamic state laws can be determined as follows:
𝜎𝑖𝑗 = 𝜌𝜕𝛹
𝜕휀𝑖𝑗𝑒 (5.19)
𝑠 = −𝜕𝛹
𝜕𝑇 (5.20)
𝐶 = 𝜌𝜕𝛹
𝜕𝑝 (5.21)
𝛻2𝐶 =𝜕𝛹
𝜕𝛻2𝑝 (5.22)
67
𝐷𝑖𝑗 = 𝜌𝜕𝛹
𝜕𝑘𝑖𝑗 (5.23)
𝛻2𝐷𝑖𝑗 = 𝜌𝜕𝛹
𝜕𝛻2𝑘𝑖𝑗 (5.24)
where 𝐶 and 𝐷𝑖𝑗 are defined as the thermodynamic conjugate terms corresponding to the
nonlocal internal state variables. Compare Equations (5.21) through (5.24) with Equation (5.16),
one can derive the local conjugate terms as follows
𝐶 = 𝑎1𝑝 (5.25)
∇2𝐶 = 𝑎2∇2𝑝 (5.26)
𝐷𝑖𝑗 = 𝑏1𝑘𝑖𝑗 (5.27)
∇2𝐷𝑖𝑗 = 𝑏2∇2𝑘𝑖𝑗 (5.28)
By assuming 𝑎1 = 𝑎2 = 𝑎 and 𝑏1 = 𝑏2 = 𝑏, the conjugate terms can be written as follows
𝐶 = 𝑎𝑝 (5.29)
∇2𝐶 = 𝑎∇2𝑝 (5.30)
𝐷𝑖𝑗 = 𝑏𝑘𝑖𝑗 (5.31)
∇2𝐷𝑖𝑗 = 𝑏∇2𝑘𝑖𝑗 (5.32)
Therefore, the nonlocal measure of the conjugate terms can be written as the same format shown
in Equations (5.14) and (5.15) as follows
𝐶 = 𝑎𝑝 = 𝐶 + 𝐴∇2𝑝 (5.33)
𝐷𝑖𝑗 = 𝑏𝑘𝑖𝑗 = 𝐷𝑖𝑗 + 𝐵∇2𝑘𝑖𝑗 (5.34)
The value of the thermodynamic conjugate forces can be obtained through the evolution
relations of the internal state variables, which are obtained by assuming the physical existence of
the dissipation potential at the macro-scale (Dorgan and Voyiadjis, 2003). The dissipation
processes are given from the thermodynamic conjugate forces and the respective flux variables
as follows
𝛱 = 𝜎𝑖𝑗휀�̇�𝑗𝑝 − 𝐶�̇� − ∇2𝐶∇2�̇� − 𝐷𝑖𝑗�̇�𝑖𝑗 − ∇2𝐷𝑖𝑗∇2�̇�𝑖𝑗 (5.35)
The evolution equations of the macro-scale internal state variables can be obtained through
the generalized normality rule of thermodynamics. In this regard, the macro-scale dissipation
potential is defined in terms of the gradient dependent internal state variables as a continuous and
convex scalar valued function of the flux variables (Voyiadjis and Deliktas, 2000, 2001) as
follows

68
𝛩 = 𝛩(휀�̇�𝑗𝑝
, 𝑇, �̇�, 𝛻2�̇�, �̇�𝑖𝑗 , 𝛻2�̇�𝑖𝑗) (5.36)
By using the Legendre-Fenchel transformation of the dissipation potential, one can obtain
complementary laws in the form of the evolution laws of flux variables as function of the dual
variables as follows
𝛩′ = 𝛩′(𝜎𝑖𝑗, 𝐶, 𝛻2𝐶, 𝐷𝑖𝑗 , 𝛻2𝐷𝑖𝑗) = 𝐹(𝜎𝑖𝑗, 𝐶, 𝛻2𝐶, 𝐷𝑖𝑗 , 𝛻2𝐷𝑖𝑗) (5.37)
The objective function is constructed using the Lagrange multiplier in the following form:
𝛺 = 𝛱 − �̇�𝐹 (5.38)
In order to obtain the plastic strain rate, the objective function is extremized by taking
derivative over 𝜎𝑖𝑗 as follows:
𝜕𝛺
𝜕𝜎𝑖𝑗= 0 (5.39)
The evolution equation of the plastic strain can be obtained as follows:
휀�̇�𝑗𝑝 = �̇�
𝜕𝐹
𝜕𝜎𝑖𝑗 (5.40)
The plastic potential function F is defined as follows
𝐹 = 𝑓 +𝑤1
2𝐶
2+
𝑤2
2𝐷𝑖𝑗𝐷𝑖𝑗 = 𝑓 +
𝑤1
2[𝐶2 + 2𝐴𝐶∇2𝐶 + 𝐴2(∇2𝐶)2]
+𝑤2
2(𝐷𝑖𝑗𝐷𝑖𝑗 + 2𝐵𝐷𝑖𝑗∇2𝐷𝑖𝑗 + 𝐵2∇2𝐷𝑖𝑗∇2𝐷𝑖𝑗)
(5.41)
where 𝑤1 and 𝑤2 are constants that adjust the units of the equation; f is a yield function of von
Mises type and is defined as follows
𝑓 = {3
2(𝑠𝑖𝑗 − 𝐷𝑖𝑗)(𝑠𝑖𝑗 − 𝐷𝑖𝑗)}
1/2
− 𝜎𝑦𝑝 − 𝐶 ≡ 0 (5.42)
where 𝑠𝑖𝑗 is the deviatoric component of the stress tensor which can be given as follows
𝑠𝑖𝑗 = 𝜎𝑖𝑗 −1
3𝜎𝑚𝑚𝛿𝑖𝑗 (5.43)

69
The gradient dependent evolution equation of the isotropic hardening flux variable can be
obtained using the generalized normality rule of thermodynamics:
�̇� = −�̇�𝜕𝐹
𝜕𝐶= −�̇�(𝑤1𝐶 − 1) (5.44)
∇2�̇� = −�̇�𝜕𝐹
𝜕∇2𝐶= −�̇�𝑤1𝐴𝐶 (5.45)
The evolution of the conjugate forces and the gradient can be obtained by taking time
derivative of Equations (5.29) and (5.30) such that:
�̇� = 𝑎�̇� = 𝑎�̇�(1 − 𝑤1𝐶) (5.46)
∇2�̇� = 𝑎∇2�̇� = −𝑎𝑤1𝐴�̇�𝐶 (5.47)
For kinematic hardening, the gradient dependent evolution equation are obtained through the
generalized normality rule as well as for the isotropic hardening as follows
�̇�𝑖𝑗 = −�̇�𝜕𝐹
𝜕𝐷𝑖𝑗= −�̇� (
𝜕𝑓
𝜕𝐷𝑖𝑗+ 𝑤2𝐷𝑖𝑗) (5.48)
∇2�̇�𝑖𝑗 = −�̇�𝜕𝐹
𝜕∇2𝐷𝑖𝑗= −�̇�𝑤2𝐵𝐷𝑖𝑗 (5.49)
It can be derived from Equations (5.41) and (5.42) that
−𝜕𝑓
𝜕𝐷𝑖𝑗=
𝜕𝑓
𝜕𝑠𝑖𝑗=
𝜕𝑓
𝜕𝜎𝑖𝑗=
𝜕𝐹
𝜕𝜎𝑖𝑗 (5.50)
Using Equations (5.46) and (5.48), the Frederick-Armstrong equation can be modified so that
the evolution of the kinematic hardening component shows a nonlocal behavior through the
gradient term as follows
�̇�𝑖𝑗 = 휀�̇�𝑗𝑝 − �̇�𝑤2𝐷𝑖𝑗 − �̇�𝑤2𝐵∇2𝐷𝑖𝑗 (5.51)
The evolution of the thermodynamic conjugate forces and gradient can be obtained by taking
time derivative of Equations (5.31) and (5.32) such that
�̇�𝑖𝑗 = 𝑏�̇�𝑖𝑗 = 𝑏(휀�̇�𝑗𝑝 − �̇�𝑤2𝐷𝑖𝑗) (5.52)
∇2�̇�𝑖𝑗 = 𝑏∇2�̇�𝑖𝑗 = −𝑏𝑤2𝐵�̇�𝐷𝑖𝑗 (5.53)
The Lagrange multiplier can be determined through the consistency condition for plasticity
(𝑓̇ ≡ 0) as follows

70
�̇� ≡𝜕𝑓
𝜕𝜎𝑖𝑗: �̇�𝑖𝑗 +
𝜕𝑓
𝜕𝐶: �̇� +
𝜕𝑓
𝜕𝐷𝑖𝑗: 𝐷𝑖𝑗 = 0 (5.54)
From the assumption of associative plasticity and additive decomposition of the elastic strain,
Equation (5.54) can be rewritten as follows
𝑓̇ =𝜕𝑓
𝜕𝜎𝑖𝑗[𝐸𝑖𝑗𝑘𝑙 (휀�̇�𝑙 − �̇�
𝜕𝑓
𝜕𝜎𝑘𝑙) − 𝑏�̇�
𝜕𝑓
𝜕𝜎𝑖𝑗+ 𝑏𝑤2�̇�𝐷𝑖𝑗] − 𝑎�̇�(1 − 𝑤1𝐶) = 0 (5.55)
The Lagrange multiplier can then be solved as follows
�̇� =1
ℎ
𝜕𝑓
𝜕𝜎𝑖𝑗𝐸𝑖𝑗𝑘𝑙휀�̇�𝑙 (5.56)
where h is the hardening modulus and is defined as follows
ℎ =𝜕𝑓
𝜕𝜎𝑖𝑗𝐸𝑖𝑗𝑘𝑙
𝜕𝑓
𝜕𝜎𝑘𝑙+ 𝑎(1 − 𝑤1𝐶) + (
𝜕𝑓
𝜕𝜎𝑖𝑗) (
𝜕𝑓
𝜕𝜎𝑖𝑗) 𝑏 − 𝑏𝑤2
𝜕𝑓
𝜕𝜎𝑖𝑗𝐷𝑖𝑗 (5.57)
The constitutive equation of this model is defined through the Hookean stress-strain relation
as follows
�̇�𝑖𝑗 = 𝐸𝑖𝑗𝑘𝑙휀�̇�𝑙𝑒 = 𝐸𝑖𝑗𝑘𝑙 (휀�̇�𝑙 − �̇�
𝜕𝑓
𝜕𝜎𝑘𝑙) (5.58)
Plugging the multiplier determined in Equation (5.56) into Equation (5.58) yields the
constitutive law as follows:
�̇�𝑖𝑗 = 𝐺𝑖𝑗𝑘𝑙휀�̇�𝑙𝑒 (5.59)
where the modulus 𝐺𝑖𝑗𝑘𝑙 is defined as follows
𝐷𝑖𝑗𝑘𝑙 = 𝐸𝑖𝑗𝑘𝑙 −1
ℎ𝐸𝑖𝑗𝑚𝑛
𝜕𝑓
𝜕𝜎𝑚𝑛
𝜕𝑓
𝜕𝜎𝑝𝑞𝐸𝑝𝑞𝑘𝑙 (5.60)
5.4 Nonlocal Theory in the Microstructural Basis
Dislocation theory is widely used in order to provide a micro-mechanical justification for the
thermodynamic consistent model. Dislocation density has been used in order to bridge the

71
macro- and micro-scale (Bammann and Aifantis, 1982; Fleck and Hutchinson, 1993; Menzel and
Steinmann, 2000; Voyiadjis and Abu Al-Rub, 2005).
The shear plastic strain is dependent on the mobile dislocation density and can be defined as
follows (Conrad et al., 1985)
𝛾𝑝 = 𝜌𝑚𝑏𝑙 (5.61)
where b is the magnitude of the Burgers vector; l is the internal length scale parameter which is
assumed to be the free path of trapped dislocations. The plastic strain in the macro-scale can be
derived using Schmid orientation tensor as follows
휀𝑖𝑗𝑝 = 𝛾𝑝𝑀𝑖𝑗 (5.62)
where 𝑀𝑖𝑗 is the symmetric Schmid orientation tensor.
The evolution of the plastic strain can then be found by taking the time derivative of
Equation (5.62) and by plugging in Equation (5.61) as follows
휀�̇�𝑗𝑝 = 𝑀𝑖𝑗(�̇�𝑚𝑏𝑙 + 𝜌𝑚𝑏𝑙)̇ (5.63)
where 𝑙 ̇is the average dislocation glide velocity.
Walgraef and Aifantis (1985, 1988) proposed the reaction-diffusion equations in order to
express the evolution of the immobile and mobile dislocations as follows
�̇�𝑖 = 𝐽𝑖∇2𝜌𝑖 + 𝑔(𝜌𝑖) − 𝑓(𝜌𝑖 , 𝜌𝑚) (5.64)
�̇�𝑚 = 𝐽𝑚∇2𝜌𝑚 + 𝑓(𝜌𝑖 , 𝜌𝑚) (5.65)
where 𝐽𝑖 and 𝐽𝑚 are diffusion-like coefficients for the immobile and mobile dislocations and can
be approximated as follows (Aifantis, 1987; Walgraef and Aifantis, 1988; Aifantis, 1999a,
1999b):
𝐽𝑖 ≈𝜌𝑚𝑙�̇�𝑑
3
4 (5.66)
𝐽𝑚 ≈𝑙2̇
2𝜉𝜌0𝑖 2 (5.67)
where 𝜉 is the pinning rate of mobile dislocations by immobile diploes; 𝜌0𝑖 is a reference
homogeneous solution of the immobile dislocation density; 𝑦𝑑 is the mean height of immobile
diploles; 𝑔(�̇�𝑖) is the production/annihilation of immobile dislocations which can be expressed
as follows

72
𝑔(𝜌𝑖) = 𝛼(𝜌0𝑖 − 𝜌𝑖) (5.68)
𝑓(𝜌𝑖 , 𝜌𝑚) indicates the interaction between immobile and mobile dislocations that can be
defined as follows
𝑓(𝜌𝑖 , 𝜌𝑚) = 𝛽𝜌𝑖 − 𝜉𝜌𝑚𝜌𝑖 2 (5.69)
where 𝛽 is the freeing rate of immobile dislocations for increasing stress.
Therefore, the evolution for the immobile and mobile dislocations are defined as follows
�̇�𝑖 =𝜌𝑚𝑙�̇�𝑑
3
4∇2𝜌𝑖 + 𝛼(𝜌0
𝑖 − 𝜌𝑖) − (𝛽𝜌𝑖 − 𝜉𝜌𝑚𝜌𝑖 2) (5.70)
�̇�𝑚 =𝑙2̇
2𝜉𝜌0𝑖 2 ∇2𝜌𝑚 + (𝛽𝜌𝑖 − 𝜉𝜌𝑚𝜌𝑖2
) (5.71)
The evolution of the scalar isotropic hardening variable is normally expressed in terms of the
second order plastic strain rate tensor. Therefore, the evolution of the isotropic hardening is
defined through the equivalent plastic strain rate as follows
�̇� = 휀�̇�𝑞𝑝 = √
2
3휀�̇�𝑗
𝑝 휀�̇�𝑗𝑝
(5.72)
Using Equation (5.63) and (5.65), the isotropic hardening in the macro-scale can be
expressed in terms of dislocation densities as follows
�̇� = 휀�̇�𝑞𝑝 = [𝑏𝑙̇ (𝜌𝑚 +
𝑙
𝑙̇𝐽𝑚∇2𝜌𝑚) + 𝑏𝑙𝑓(𝜌𝑖 , 𝜌𝑚)] √
2
3𝑀𝑖𝑗𝑀𝑖𝑗 (5.73)
Comparing Equation (5.73) with the evolution of the isotropic hardening defined in Equation
(5.44), the following relations can be derived as
�̇� = 𝑏𝑙𝑓(𝜌𝑖 , 𝜌𝑚)√2
3𝑀𝑖𝑗𝑀𝑖𝑗 − �̇�𝑤1𝑎(𝑝 + 𝐴∇2𝑝) = 𝑏𝑙̇ (𝜌𝑚 +
𝑙
𝑙̇𝐽𝑚∇2𝜌𝑚) √
2
3𝑀𝑖𝑗𝑀𝑖𝑗 (5.74)
From the above equation, the coefficients in the gradient theory can be defined on a
microstructural basis as follows
𝑤1 = 𝑙−1 (5.75)

73
𝑎 =−𝑙̇
𝑓(𝜌𝑖, 𝜌𝑚) (5.76)
𝐴 =𝑙
𝑙̇𝐽𝑚 (5.77)
The kinematic hardening variable is the cumulative effect from the flux related backstresses.
Bammann and Aifantis (1982) defined the backstress through immobile and mobile dislocation
density as follows
𝐷𝑖𝑗𝑖 = −𝜋𝑖𝜌𝑖𝑀𝑖𝑗 (5.78)
𝐷𝑖𝑗𝑚 = −𝜋𝑚𝜌𝑚𝑀𝑖𝑗 (5.79)
where 𝜋𝑖 and 𝜋𝑚 are constants and 𝑀𝑖𝑗 is the symmetric macroscopic Schmid orientation tensor.
The total backstress is obtained as the sum of the components from the immobile dislocations
and the mobile dislocations such that
𝐷𝑖𝑗 = 𝐷𝑖𝑗𝑖 + 𝐷𝑖𝑗
𝑚 = −(𝜋𝑖𝜌𝑖 + 𝜋𝑚𝜌𝑚)𝑀𝑖𝑗 (5.80)
Assuming that the slip system remains unchanged along with time, the evolution of the
backstress can be obtained by taking time derivative of Equation (5.80) as follows
�̇�𝑖𝑗 = −(𝜋𝑖�̇�𝑖 + 𝜋𝑚�̇�𝑚)𝑀𝑖𝑗 (5.81)
The evolution of the backstress can be obtained from Equations (5.64) and (5.65) in terms of
the dislocation densities and the dislocation density gradients as follows
�̇�𝑖𝑗 = −[𝜋𝑖𝐽𝑖∇2𝜌𝑖 + 𝜋𝑖𝑔(𝜌𝑖) + (𝜋𝑚 − 𝜋𝑖)𝑓(𝜌𝑖 , 𝜌𝑚) + 𝜋𝑚𝐽𝑚∇2𝜌𝑚]𝑀𝑖𝑗 (5.82)
In order to relate the above equation with Equation (5.52), the Laplacian of the kinematic
hardening is defined through the use of Equation (5.80) as follows by assuming that the
Laplacian of the constants 𝜋𝑖 and 𝜋𝑚 are zero and that ∇2𝑀𝑖𝑗 can be neglected
∇2𝐷𝑖𝑗 = −(𝜋𝑖∇2𝜌𝑖 + 𝜋𝑚∇2𝜌𝑚)𝑀𝑖𝑗 (5.83)
Substituting Equations (5.80) and (5.83) into Equation (5.34) gives the nonlocal form of the
backstress in terms of dislocation densities and the Laplacian of dislocation densities as follows
𝐷𝑖𝑗 = −(𝜋𝑖𝜌𝑖 + 𝜋𝑖𝐵∇2𝜌𝑖 + 𝜋𝑚𝜌𝑚 + 𝜋𝑚𝐵∇2𝜌𝑚)𝑀𝑖𝑗 (5.84)
It can be seen from Equation (5.84) that the nonlocal kinematic hardening backstress can be
decomposed into the components due to immobile and mobile dislocations.

74
Using Equations (5.52), (5.63), (5.74) and (5.84), the following relation can be determined as
�̇�𝑖𝑗 = 𝑎𝑏𝑀𝑖𝑗 {𝑤2𝑙𝑓(𝜌𝑖 , 𝜌𝑚)√2
3𝑀𝑝𝑞𝑀𝑝𝑞[𝜋𝑖(𝜌𝑖 + 𝐵∇2𝜌𝑖) + 𝜋𝑚(𝜌𝑚 + 𝐵∇2𝜌𝑚)]
+ �̇�𝑚𝑙 + 𝜌𝑚𝑙}̇
(5.85)
Substituting Equations (5.64) and (5.65) into Equation (5.85) gives the following equation as
�̇�𝑖𝑗 = 𝑎𝑏𝑙𝑓(𝜌𝑖 , 𝜌𝑚)𝑀𝑖𝑗 + 𝑎𝑏𝑙𝑤2𝜌𝑖𝑓(𝜌𝑖 , 𝜌𝑚)𝜋𝑚𝑀𝑖𝑗√2
3𝑀𝑝𝑞𝑀𝑝𝑞
+ 𝑏𝜌𝑚 [𝑎𝑙̇ + 𝑤2𝑎𝑙𝑓(𝜌𝑖 , 𝜌𝑚)𝜋𝑚√2
3𝑀𝑝𝑞𝑀𝑝𝑞] 𝑀𝑖𝑗
+ 𝑏∇2𝜌𝑖 [𝐵𝑎𝑙𝑤2𝜋𝑖𝑓(𝜌𝑖 , 𝜌𝑚)√2
3𝑀𝑝𝑞𝑀𝑝𝑞] 𝑀𝑖𝑗
+ b∇2𝜌𝑚 [𝐽𝑚𝑎𝑙 + 𝑤2𝑎𝑙𝑓(𝜌𝑖 , 𝜌𝑚)𝐵𝜋𝑚√2
3𝑀𝑝𝑞𝑀𝑝𝑞] 𝑀𝑖𝑗
(5.86)
Comparing Equation (5.82) with Equation (5.86) gives the following relations as
−𝜋𝑖𝐽𝑖 = 𝑎𝑏𝑤2𝑙𝑓(𝜌𝑖 , 𝜌𝑚)𝐵𝜋𝑖√2
3𝑀𝑝𝑞𝑀𝑝𝑞 (5.87)
−𝜋𝑚𝐽𝑚 = 𝑎𝑏𝑙𝐽𝑚 + 𝑎𝑏𝑙𝑤2𝑓(𝜌𝑖 , 𝜌𝑚)𝐵𝜋𝑚𝑎𝑤2𝑙𝑓(𝜌𝑖 , 𝜌𝑚)𝐴𝜋𝑖√2
3𝑀𝑝𝑞𝑀𝑝𝑞 (5.88)
(𝜋𝑚 − 𝜋𝑖)𝑓(𝜌𝑖 , 𝜌𝑚) − 𝜋𝑖𝑔(𝜌𝑖)
= 𝑏 {𝜌𝑖 [𝑎𝑙𝑤2𝑓(𝜌𝑖 , 𝜌𝑚)𝜋𝑚𝑎𝑤2𝑙𝑓(𝜌𝑖 , 𝜌𝑚)𝐴𝜋𝑖√2
3𝑀𝑝𝑞𝑀𝑝𝑞]
+ 𝑎𝑙𝑓(𝜌𝑖 , 𝜌𝑚) + 𝜌𝑚 [𝑎𝑙̇ + 𝑎𝑙𝑤2𝑓(𝜌𝑖 , 𝜌𝑚)𝜋𝑚√2
3𝑀𝑝𝑞𝑀𝑝𝑞]}
(5.89)
The following ratio can be determined from Equations (5.87) and (5.88) such that

75
𝜋𝑖𝐽𝑖
𝑎𝑙𝑤2𝑓(𝜌𝑖, 𝜌𝑚)𝐵𝜋𝑖√23 𝑀𝑝𝑞𝑀𝑝𝑞
=𝜋𝑚𝐽𝑚
𝐽𝑚𝑎𝑙 + 𝑎𝑙𝑤2𝑓(𝜌𝑖, 𝜌𝑚)𝐵𝜋𝑚√23 𝑀𝑝𝑞𝑀𝑝𝑞
(5.90)
The constant 𝑤2 can be expressed in terms of the coefficient B as follows
𝑤2 = [𝐵𝜋𝑚(𝐽𝑚 − 𝐽𝑖)
𝐽𝑖𝐽𝑚𝑓(𝜌𝑖 , 𝜌𝑚)√
2
3𝑀𝑝𝑞𝑀𝑝𝑞]
−𝟏
(5.91)
The coefficient b can then be expressed as follows
𝑏 =𝜋𝑚
𝑎𝑙(
𝐽𝑖
𝐽𝑚− 1) (5.92)
The coefficient B can be defined as follows
𝐵 = [𝜋𝑖𝐽𝑚𝑔(𝜌𝑖) + (𝜋𝑚𝐽𝑖 − 𝜋𝑖𝐽𝑚)𝑓(𝜌𝑖 , 𝜌𝑚)] × [𝜋𝑚𝐽𝑖𝐽𝑚(𝜌𝑖 + 𝜌𝑚)]−𝟏
(5.93)
Substituting Equation (5.93) into Equation (5.92) gives the expression of 𝑤2 as follows
𝑤2 = [(𝐽𝑖𝐽𝑚)
2
𝐽𝑚 − 𝐽𝑖𝑓(𝜌𝑖 , 𝜌𝑚)]
× {𝑓(𝜌𝑖 , 𝜌𝑚)√2
3𝑀𝑝𝑞𝑀𝑝𝑞 [(𝜋𝑚𝐽𝑖 − 𝜋𝑖𝐽𝑚)𝑓(𝜌𝑖 , 𝜌𝑚) + 𝜋𝑖𝐽𝑚𝑔(𝜌𝑖)
+ 𝜌𝑚(𝜋𝑚𝐽𝑖 − 𝜋𝑚𝐽𝑚)𝑙̇
𝑙]}
(5.94)
From the isotropic hardening and kinematic hardening problems, it can be seen that the
coefficients are not constants but vary with the dislocation glide velocity and the immobile and
mobile dislocation densities as well as with the functions 𝑔(𝜌𝑖) and 𝑓(𝜌𝑖 , 𝜌𝑚).
5.5 Shear Band Problem
Shear band, or more generally, strain localization, is a narrow zone of intense plastic shear
strain due to the non-uniform deformation, developing severe deformation of ductile materials.
Shear band precedes failure as extreme deformation within the shear band leads to intense
damage and fracture. The width and direction of the shear bands depend on the material
parameters, geometry, boundary conditions, loading distribution and loading rates. The

76
conditions for bifurcation into a shear band have been given by Hill (1962), Rudnicki and Rice
(1975) and Rice (1976) about the discussions of several aspects of shear band localization for
various material models.
Shear band is an example of a material instability, corresponding to an abrupt loss of
homogeneity of deformation occurring in a solid sample subject to a loading path compatible
with continued uniform deformation. The finite element simulations of material instability
problems converge to meaningful results upon further refinement of the finite element mesh. The
width of the shear band is governed by the intrinsic length scale of a material. However, the
classical continuum theory is not able to address this problem as it does not incorporate a length
scale parameter in the constitutive equation. Using classical continuum theory, the width of the
shear band is introduced through the mesh size and the simulations show that the results are
mesh-sensitive. Therefore, in order to remedy the spurious mesh sensitivity of numerical results,
an internal length scale is incorporated in the continuum theory. Biaxial compression and a strip
in tension are taken as two examples. Both problems are simulated using finite element software
ABAQUS. Comparisons are made between the simulations using continuum theory with
different mesh sizes and the simulations using nonlocal theory with internal length scales. The
simulations using the classical continuum theory are performed by ABAQUS Standard package,
while the simulations using nonlocal theory are performed by ABAQUS Standard package with
a UMAT user-subroutine which provides the nonlocal constitutive equation with the length
scale.
The biaxial compression problem is shown in Figure 5.1 (Abu Al-Rub and Voyiadjis, 2005).
The specimen is placed on a smooth rigid plane and the upper edge is constrained to remain
horizontal. A vertical deformation is applied to represent a compressive force. The central point
of the bottom plate is fixed to avoid rigid body displacement. The forces are set to zero on both
sides of the specimen and the horizontal displacements are assumed to be zero along the
boundaries as well. The yield strength at the lower-left corner of the specimen is set to be slightly
lower than the rest part (10% reduction).
Figure 5.1 Biaxial compression test configuration with an imperfection in the bottom left
corner (Abu Al-Rub and Voyiadjis, 2005).

77
The biaxial compression problem was firstly simulated using the standard plasticity model
where the length scale l is set to be zero (Abu Al-Rub and Voyiadjis, 2005). Three different
meshes with 15×30, 30×60 and 45×90 integrated eight-noded elements with 3×3 integration
points are analyzed. The contour plots of the effective plastic strain are shown in Figure 5.2 for
the different meshes respectively. It shows in Figure 5.2 that the width of the strain localization
zone (shear band) is dependent on the mesh size, which is not physically sound.
(a) (b) (c)
Figure 5.2 Contour plots of effective plastic strain from different meshes: (a) 15×30, (b) 30×60
and (c) 45×90 with l=0. (Abu Al-Rub and Voyiadjis, 2005)
The simulations were repeated through the nonlocal model with the length scale parameter to
be 2.5 mm. The results in Figure 5.3 show that the width of the shear band is dependent on the
length scale parameter but not the mesh size.
(a) (b) (c)
Figure 5.3 Contour plots of effective plastic strain from different meshes: (a) 15×30, (b) 30×60
and (c) 45×90 with l=2.5 mm. (Abu Al-Rub and Voyiadjis, 2005)
Another example of strip tension problem was solved through the finite element from the
standard plasticity model and the nonlocal gradient model. The specimen is shown in Figure 5.4

78
(Abu Al-Rub and Voyiadjis, 2005). The strip is constrained at the bottom and a displacement is
imposed at the top. Two meshes with 10×20 and 20×40 were used with a four-noded
quadrilateral plane-strain element. The width of the specimen towards the top was increased
slightly in order to avoid a homogenous solution. Therefore, the shear band was initiated at the
bottom-left corner with an inclination of 45°.
Figure 5.4 Strip in tension problem description (Abu Al-Rub and Voyiadjis, 2005).
The results with l=0 is presented in Figure 5.5 (Abu Al-Rub and Voyiadjis, 2005). It shows
that the width of the shear band decreases with the mesh size, which is not realistic. If an internal
length scale of 2.5 mm is assigned in the nonlocal gradient model, it shows in Figure 5.6 (Abu
Al-Rub and Voyiadjis, 2005) that the effective plastic strain is localized in the shear band with a
width that is independent on the mesh size, which is realistic.
(a) (b)
Figure 5.5 Contour plots of effective plastic strain from different meshes: (a) 10×20 and (b)
20×40 with length scale l=0 (Abu Al-Rub and Voyiadjis, 2005).

79
(a) (b)
Figure 5.6 Contour plots of effective plastic strain from different meshes: (a) 10×20 and (b)
20×40 with length scale l=2.5 mm (Abu Al-Rub and Voyiadjis, 2005).
From the two examples above, it can be seen that when solving strain localization problem
numerically, a length scale parameter is necessary the size of the localization zone is intrinsic
and can be represented by the length scale. The classical continuum theory does not introduce a
length scale parameter and therefore, it is not capable in predicting the strain localization
problem. Nonlocal theory which incorporates the length scale parameter in the constitutive
equation is required and by giving a certain value to the length scale, the simulations will be
physically based consistent.
5.6 Conclusion
The nonlocal theory is given in this chapter beginning with the integral format. Taylor series
expansion is used in order to approximate the nonlocal measurement in order to reduce the
computational cost. Considering various approach of the coupling between the local plastic strain
and the strain gradient, a general form of the coupling is obtained in Equation (5.8), which is the
starting equation in determining the physically based length scale in Chapters 3 and 4. The
nonlocal theory is given from the macro-scale through the thermodynamic consistent model and
the micro-scale through the dislocation mechanism.
Shear band problem is given as an example of the importance of the nonlocal theory. Finite
element simulation results are compared from simulations using the local plasticity theory and
simulations using the nonlocal gradient model. It shows in the results that the simulations are
mesh-dependent from the classical continuum theory without a length scale parameter. It also

80
shows that by assigning a length scale, the simulation results become intrinsic and related to the
value of the length scale. Therefore, the finite element simulations with nonlocal model that
incorporates the length scale parameter are able to provide more realistic mesh independent
results.

81
CHAPTER 6
SUMMARY, CONCLUSION AND FUTURE PERSPECTIVE
The summary of researches in this dissertation is presented in this Chapter. In addition, the
conclusions from this work are deduced. Suggestions and future perspectives based on this
researched are also presented.
6.1 Summary
Size effects in metal have been found in many micro-/nano-mechanical tests at small length
scales. In nanoindentation tests, instead of the constant hardness shown in macro-hardness tests,
the hardness increases at smaller indentation depths. This observation is termed as the
indentation size effect (ISE). In order to capture the ISE, the classical continuum mechanics
theory is not sufficient as it only predicts the macro-hardness. Strain gradient plasticity theory
needs to be enhanced into the classical continuum theory, as strain gradients are presented when
the plastic deformation is small. The plastic strain at a local point is not only dependent on the
strain at this point but also on the strain gradient in the neighboring space. The strain gradient
plasticity theory incorporates a length scale parameter in the constitutive equation in order to
characterize the effect of strain gradients on the mechanical behavior of materials.
Nanoindentation is widely employed in order to explore the mechanical behavior in the
micro-/nano-scales. It is also frequently applied in order to determine the length scale for the
ISE. The determination of the length scale relies on the results from the nanoindentation
experiments. Therefore, the accurate testing results are required. The nanoindentation technique
measures the material hardness through the load that forces the indenter to penetrate and the
projected area of the indenter at certain indentation depth. The projected area is determined not
from the direct imaging of the impression but from an area function depending on the indentation
depth. The accuracy of the area function thus becomes very important. The area function varies
with the geometry of the tip and geometry of the tip may change slightly after frequent uses. In
order to determine the correct area function, tip calibration is applied on the fused silica sample.
The fused silica sample has an elastic modulus of 72 𝐺𝑃𝑎 and does not change along with time
as it is very stable. The elastic modulus does not change due to the indentation size effect. The
accurate measurement of nanoindentation gives a constant elastic modulus for the fused silica in
the entire indentation depth. The calibration procedure followed so that the load-indentation
depth data is used to calculate the desired elastic modulus of fused silica. The area function can
be determined from curving fitting.
Nanoindentation is very sensitive to the surface conditions, such as surface roughness and
strain hardening layer on the surface. The indentation depth is usually in the submicron and
nanometers and the ISE is captured even in the smaller indentation depths about tens of
nanometers. Therefore, the sample must be prepared carefully for a low surface roughness and
deformation-free surface. Mechanical polishing is always applied in order to decrease the surface

82
roughness by using the polishing particles with decreasing sizes. However, mechanical polishing
induces plastic deformation on the surface and even in the material underneath the surface. The
deformation is observed by scratches on the surface and the scratches become smaller with the
decreasing size of the polishing particles. The smallest size of the polishing particles is 0.05 𝜇𝑚.
Even with this size, the thickness of the deformation layer still can affect the observation of the
ISE. Electro-polishing can be applied to remove the deformation without inducing new
deformation and to create a deformation-free surface. However, there are many limitations for
the electro-polishing such as the choice of the voltage, current and electrolyte. A chemical-
mechanical polishing in a vibratory polished can be used instead the electro-polishing to remove
the deformation layer.
Instead of the ISE, it has been shown in recent experiments that there is a hardening-
softening region in the hardness-indentation depth curve. This phenomenon is attributed to the
interaction between dislocations and the grain boundary. Experiments on samples with different
grain sizes show that the hardness increases with the decreasing grain size. It is also shown from
experiments on single crystals that there is no hardening-softening observed since there is no
grain boundary. In order to isolate the influence of the grain boundary, bicrystal samples are used
as there is only one grain boundary. Nanoindentation experiments in close proximity of the grain
boundary are performed on bicrystals with different distances from the grain boundary. Length
scales are determined and vary with the different distances.
In order to investigate the rate dependent of the length scale, a model based on the
temperature and rate indentation size effect (TRISE) is developed. The TRISE model is able to
predict the classical ISE and the hardening-softening phenomenon. Strain rate is one of the
parameters in the TRISE model. By giving different strain rates, the length scale with different
strain rates can be determined. The TRISE model is modified for the application in bicrystals by
replacing the grain size parameter for polycrystalline materials with the distance between the
indenter tip and the grain boundary for bicrystal samples. Nanoindentation experiments are
performed on bicrystals near the grain boundary with different distances. From the modified
TRISE model and the experimental results, the length scales at different distances are
determined, proving a new type of size effect.
6.2 Conclusions
The following conclusions are drawn from the work of this dissertation:
1. The TRISE model is able to predict the indentation size effect. The length scale
determined from the model and nanoindentation experiments shows that it decreases with the
increase of equivalent plastic strain. This characterizes the fact that the strain gradient becomes
greater when the deformation is smaller.
2. The length scale approaches to zero when the strain is large. This is true because for large
deformation, there is no strain gradient and thus the length scale is equal to zero.

83
3. The hardening-softening phenomenon can be captured by the TRISE model for
polycrystalline materials by incorporating a grain size parameter. The hardness increases with
the decreasing grain size. The length scale with different grain sizes is determined and shows that
it decreases as the grain size decreases, resulting in a greater hardness.
4. The rate dependency during nanoindentation can be captured by the TRISE model. It
shows from the model that the hardness increases with the increasing strain rate, which matches
with the experimental observation. The length scale at different strain rates is determined and it
shows that the length scale decreases with the increasing strain rate.
5. In order to isolate the grain boundary effect, bicrystal samples are used for nanoindentation
experiments near the grain boundary at different distances. The experimental results show that
the hardening effect becomes greater when the distance between the indenter tip and the grain
boundary becomes smaller. The TRISE model is modified for bicrystal samples and is able to
predict the size effect induced by the proximity of the grain boundary. The length scale at
different distances is determined from the modified TRISE model and the nanoindentation
experiments on bicrystal samples. It shows that the length scale decreases when the distance is
smaller.
6.3 Suggestions and future perspectives
The modified TRISE model for bicrystal shows that it is able to predict the behaviors in
bicrystal face-centered cubic (FCC) metals from the research on bicrystal copper and aluminum.
The compatibility to body-centered cubic (BCC) metals is suggested to be investigated.
The hardening-softening phenomenon is believed to be the interaction between the grain
boundary and the dislocations. In this research, the dislocation density is calculated based on the
work of Nix and Gao (1998) and Yang and Vehoff (2007). The experimental observation of the
dislocation density is not shown. Electron backscatter diffraction (EBSD) shows from the
measure of the lattice parameters, the dislocation density can be determined. The in-situ
dislocation density can be obtained through the EBSD in combination with FIB.
The transmission of dislocations across the grain boundary depends on the misorientation
from two grains. With different misorientations, the energy required for a transfer is different.
This may lead to the difference in the dislocation accumulation, resulting in the change of
hardness in the hardening effect. Crystal plasticity needs to be used to characterize the difference
between different misorientations.

84
BIBLIOGRAPHY
Part I: by the Author
Voyiadjis, George Z., Danial Faghihi, and Cheng Zhang. "Analytical and experimental
determination of rate-and temperature-dependent length scales using nanoindentation
experiments." Journal of Nanomechanics and Micromechanics 1, no. 1 (2011): 24-40.
Voyiadjis, George Z., and Cheng Zhang. "The mechanical behavior during nanoindentation near
the grain boundary in a bicrystal FCC metal." Materials Science and Engineering: A 621
(2015): 218-228.
Zhang, Cheng, and George Z. Voyiadjis. "Rate-dependent size effects and material length scales
in nanoindentation near the grain boundary for a bicrystal FCC metal." Materials Science
and Engineering: A 659 (2016): 55-62.

85
Part II: by Other Authors
Abed, Farid H., and George Z. Voyiadjis. "A consistent modified Zerilli-Armstrong flow stress
model for BCC and FCC metals for elevated temperatures." Acta Mechanica 175, no. 1-4
(2005): 1-18.
Abed, Farid H., and George Z. Voyiadjis. "Adiabatic shear band localizations in BCC metals at
high strain rates and various initial temperatures." International Journal for Multiscale
Computational Engineering 5, no. 3-4 (2007a).
Abed, Farid H., and George Z. Voyiadjis. "Thermodynamic consistent formulations of
viscoplastic deformations in FCC metals." Journal of engineering mechanics 133, no. 1
(2007b): 76-86.
Abu Al-Rub, Rashid K., and George Z. Voyiadjis. "A direct finite element implementation of the
gradient-dependent theory." International Journal for Numerical Methods in Engineering
63, no. 4 (2005): 603-629.
Al-Rub, Rashid K. Abu, and George Z. Voyiadjis. "Analytical and experimental determination of
the material intrinsic length scale of strain gradient plasticity theory from micro-and
nano-indentation experiments." International Journal of Plasticity 20, no. 6 (2004): 1139-
1182.
Al-Rub, Rashid K. Abu, and George Z. Voyiadjis. "Determination of the material intrinsic length
scale of gradient plasticity theory." International Journal for Multiscale Computational
Engineering 2, no. 3 (2004).
Aifantis, Elias C. "On the microstructural origin of certain inelastic models." Journal of
Engineering Materials and technology 106, no. 4 (1984): 326-330.
Aifantis, Elias C. "The physics of plastic deformation." International Journal of Plasticity 3, no. 3
(1987): 211-247.
Aifantis, Elias C. "On the role of gradients in the localization of deformation and fracture."
International Journal of Engineering Science 30, no. 10 (1992): 1279-1299.
Aifantis, Elias C. "Gradient deformation models at nano, micro, and macro scales." Journal of
Engineering Materials and Technology 121, no. 2 (1999a): 189-202.
Aifantis, Elias C. "Strain gradient interpretation of size effects." International Journal of Fracture
95, no. 1-4 (1999b): 299-314.

86
Aifantis, K. E., W. A. Soer, J. Th M. De Hosson, and J. R. Willis. "Interfaces within strain
gradient plasticity: theory and experiments." Acta Materialia 54, no. 19 (2006): 5077-
5085.
Almasri, Amin H., and George Z. Voyiadjis. "Effect of strain rate on the dynamic hardness in
metals." Journal of Engineering Materials and Technology 129, no. 4 (2007): 505-512.
Almasri, Amin H., and George Z. Voyiadjis. "Nano-indentation in FCC metals: experimental
study." Acta Mechanica 209, no. 1-2 (2010): 1-9.
Almasri, Amin H., and George Z. Voyiadjis. "Physically based constitutive model for body
centered cubic metals with applications to iron." Journal of engineering mechanics 134,
no. 7 (2008): 521-529.
Andrews, E. W., A. E. Giannakopoulos, E. Plisson, and S. Suresh. "Analysis of the impact of a
sharp indenter." International journal of solids and structures 39, no. 2 (2002): 281-295.
Anton, Richard J., and Ghatu Subhash. "Dynamic Vickers indentation of brittle materials." Wear
239, no. 1 (2000): 27-35.
Arsenlis, A., and D. M. Parks. "Crystallographic aspects of geometrically-necessary and
statistically-stored dislocation density." Acta Materialia 47, no. 5 (1999): 1597-1611.
Arzt, El. "Size effects in materials due to microstructural and dimensional constraints: a
comparative review." Acta materialia 46, no. 16 (1998): 5611-5626.
Aust, K. T., R. E. Hanneman, P. Niessen, and J. H. Westbrook. "Solute induced hardening near
grain boundaries in zone refined metals." Acta Metallurgica 16, no. 3 (1968): 291-302.
Bammann, D. J., and E. C. Aifantis. "A model for finite-deformation plasticity." Acta Mechanica
69, no. 1-4 (1987): 97-117.
Bammann, D. J., D. Mosher, D. A. Hughes, N. R. Moody, and P. R. Dawson. Using spatial
gradients to model localization phenomena. No. SAND99-8588. Sandia National Labs.,
Albuquerque, NM (US); Sandia National Labs., Livermore, CA (US), 1999.
Bammann, Douglas J. "A model of crystal plasticity containing a natural length scale." Materials
Science and Engineering: A 309 (2001): 406-410.
Bammann, Douglas John, and E. C. Aifantis. "On a proposal for a continuum with
microstructure." Acta Mechanica 45, no. 1-2 (1982): 91-121.

87
Barlat, F., R. C. Becker, Y. Hayashida, Y. Maeda, M. Yanagawa, K. Chung, J. C. Brem et al.
"Yielding description for solution strengthened aluminum alloys." International Journal
of Plasticity 13, no. 4 (1997a): 385-401.
Barlat, F., Y. Maeda, K. Chung, M. Yanagawa, J. C. Brem, Y. Hayashida, D. J. Lege et al.
"Yield function development for aluminum alloy sheets." Journal of the Mechanics and
Physics of Solids 45, no. 11 (1997b): 1727-1763.
Bazant, Zdenek P., and Joško Ozbolt. "Nonlocal microplane model for fracture, damage, and size
effect in structures." Journal of Engineering Mechanics 116, no. 11 (1990): 2485-2505.
Begley, Matthew R., and John W. Hutchinson. "The mechanics of size-dependent indentation."
Journal of the Mechanics and Physics of Solids 46, no. 10 (1998): 2049-2068.
Bishop, J. F. W., and Rodney Hill. "CXXVIII. A theoretical derivation of the plastic properties
of a polycrystalline face-centred metal." The London, Edinburgh, and Dublin
Philosophical Magazine and Journal of Science 42, no. 334 (1951): 1298-1307.
Busso, E. P., F. T. Meissonnier, and N. P. O'dowd. "Gradient-dependent deformation of two-
phase single crystals." Journal of the Mechanics and Physics of Solids 48, no. 11 (2000):
2333-2361.
Chen, S. H., and T. C. Wang. "Interface crack problems with strain gradient effects."
International journal of fracture 117, no. 1 (2002): 25-37.
Chen, Xi, Nagahisa Ogasawara, Manhong Zhao, and Norimasa Chiba. "On the uniqueness of
measuring elastoplastic properties from indentation: the indistinguishable mystical
materials." Journal of the Mechanics and Physics of Solids 55, no. 8 (2007): 1618-1660.
Chong, Arthur CM, and David CC Lam. "Strain gradient plasticity effect in indentation hardness
of polymers." Journal of Materials Research 14, no. 10 (1999): 4103-4110.
Conrad, H., A. F. Sprecher, S. L. Mannan, E. C. Aifantis, and J. P. Hirth. "The Mechanics of
Dislocations." ASM (1985): 225.
De Borst, Rene, and Jerzy Pamin. "Some novel developments in finite element procedures for
gradient-dependent plasticity." International Journal for Numerical Methods in
Engineering 39, no. 14 (1996): 2477-2505.
De Borst, René, and Hans-Bernd Mühlhaus. "Gradient‐ dependent plasticity: Formulation and
algorithmic aspects." International Journal for Numerical Methods in Engineering 35, no.
3 (1992): 521-539.
88
De Borst, R., L. J. Sluys, H-B. Muhlhaus, and Jerzy Pamin. "Fundamental issues in finite
element analyses of localization of deformation." Engineering computations 10, no. 2
(1993): 99-121.
De Guzman, Melissa Shell, Gabi Neubauer, Paul Flinn, and William D. Nix. "The role of
indentation depth on the measured hardness of materials." In MRS proceedings, vol. 308,
p. 613. Cambridge University Press, 1993.
Delincé, Marc, P. J. Jacques, and Thomas Pardoen. "Separation of size-dependent strengthening
contributions in fine-grained Dual Phase steels by nanoindentation." Acta materialia 54,
no. 12 (2006): 3395-3404.
Dieter, G. E., and D. Bacon. "Mechanical Metallurgy, vol. 3McGraw-Hill." New York (1986).
Dorgan, Robert J., and George Z. Voyiadjis. "Nonlocal dislocation based plasticity incorporating
gradients of hardening." Mechanics of materials 35, no. 8 (2003): 721-732.
Dowling, Norman E. Mechanical behavior of materials: engineering methods for deformation,
fracture, and fatigue. Prentice hall, 1993.
Elmustafa, A. A., and D. S. Stone. "Indentation size effect in polycrystalline FCC metals." Acta
Materialia 50, no. 14 (2002): 3641-3650.
Faghihi, D., and G. Z. Voyiadjis. "Size effects and length scales in nanoindentation for body-
centred cubic materials with application to iron." Proceedings of the Institution of
Mechanical Engineers, Part N: Journal of Nanoengineering and Nanosystems 224, no. 1-
2 (2010): 5-18.
Faghihi, Danial, and George Z. Voyiadjis. "Determination of nanoindentation size effects and
variable material intrinsic length scale for body-centered cubic metals." Mechanics of
Materials 44 (2012): 189-211.
Fleck, N. A., and J. W. Hutchinson. "A phenomenological theory for strain gradient effects in
plasticity." Journal of the Mechanics and Physics of Solids 41, no. 12 (1993): 1825-1857.
Fleck, N. A., and J. W. Hutchinson. "Strain gradient plasticity." Advances in applied mechanics
33 (1997): 296-361.
Fleck, N. A., G. M. Muller, M. F. Ashby, and J. W. Hutchinson. "Strain gradient plasticity:
theory and experiment." Acta Metallurgica et Materialia 42, no. 2 (1994): 475-487.

89
Follansbee, P_S, G. Regazzoni, and U. F. Kocks. "The transition to drag-controlled deformation
in copper at high strain rates." Mechanical Properties at High Rates of Strain, 1984
(1984): 71-80.
Gao, H., Y. Huang, and W. D. Nix. "Modeling plasticity at the micrometer scale."
Naturwissenschaften 86, no. 11 (1999a): 507-515.
Gao, H., Y. Huang, W. D. Nix, and J. W. Hutchinson. "Mechanism-based strain gradient
plasticity—I. Theory." Journal of the Mechanics and Physics of Solids 47, no. 6 (1999b):
1239-1263.
Gao, Huajian, and Yonggang Huang. "Geometrically necessary dislocation and size-dependent
plasticity." Scripta Materialia 48, no. 2 (2003): 113-118.
Gao, Huajian, and Yonggang Huang. "Taylor-based nonlocal theory of plasticity." International
Journal of Solids and Structures 38, no. 15 (2001): 2615-2637.
Gilman, J. J., and W. G. Johnston. "Dislocations and mechanical properties of crystals." Fisher,
J., Johnston, W., Thomson, R., Vreeland, T.(eds.) (1957): 116.
Glema, Adam, Tomasz Łodygowski, and Piotr Perzyna. "Interaction of deformation waves and
localization phenomena in inelastic solids." Computer Methods in Applied Mechanics
and Engineering 183, no. 1 (2000): 123-140.
Gracio, J. J. "The double effect of grain size on the work hardening behaviour of polycrystalline
copper." Scripta metallurgica et materialia 31, no. 4 (1994): 487-489.
Guo, Y., Y. Huang, H. Gao, Z. Zhuang, and K. C. Hwang. "Taylor-based nonlocal theory of
plasticity: numerical studies of the micro-indentation experiments and crack tip fields."
International Journal of Solids and Structures 38, no. 42 (2001): 7447-7460.
Haque, M. A., and M. T. A. Saif. "A review of MEMS-based microscale and nanoscale tensile
and bending testing." Experimental mechanics 43, no. 3 (2003): 248-255.
Hill, Rodney. "Acceleration waves in solids." Journal of the Mechanics and Physics of Solids 10,
no. 1 (1962): 1-16.
Hill, Rodney. The mathematical theory of plasticity. Vol. 11. Oxford university press, 1998.
Huang, Y., Z. Xue, H. Gao, W. D. Nix, and Z. C. Xia. "A study of microindentation hardness
tests by mechanism-based strain gradient plasticity." Journal of Materials Research 15,
no. 08 (2000): 1786-1796.

90
Huber, N., W. D. Nix, and H. Gao. "Identification of elastic-plastic material parameters from
pyramidal indentation of thin films." In Proceedings of the Royal Society of London A:
Mathematical, Physical and Engineering Sciences, vol. 458, no. 2023, pp. 1593-1620.
The Royal Society, 2002.
Hwang, K. C., H. Jiang, Y. Huang, and H. Gao. "Finite deformation analysis of mechanism-
based strain gradient plasticity: torsion and crack tip field." International Journal of
Plasticity 19, no. 2 (2003): 235-251.
Joslin, D. L., and W. C. Oliver. "A new method for analyzing data from continuous depth-
sensing microindentation tests." Journal of Materials Research 5, no. 1 (1990): 123-126.
Kocks, U. F. "The relation between polycrystal deformation and single-crystal deformation."
Metallurgical and Materials Transactions 1, no. 5 (1970): 1121-1143.
Koeppel, B. J., and G. Subhash. "Characteristics of residual plastic zone under static and
dynamic Vickers indentations." Wear 224, no. 1 (1999): 56-67.
Krieg, R. D., and D. B. Krieg. "Accuracies of numerical solution methods for the elastic-
perfectly plastic model." Journal of Pressure Vessel Technology 99, no. 4 (1977): 510-
515.
Kröner, E. "Elasticity theory of materials with long range cohesive forces." International Journal
of Solids and Structures 3, no. 5 (1967): 731-742.
Kumar, A., and R. Gg Kumble. "Viscous drag on dislocations at high strain rates in copper."
Journal of Applied Physics 40, no. 9 (1969): 3475-3480.
Li, Shaofan, Wing Kam Liu, Ares J. Rosakis, Ted Belytschko, and Wei Hao. "Mesh-free
Galerkin simulations of dynamic shear band propagation and failure mode transition."
International Journal of solids and structures 39, no. 5 (2002): 1213-1240.
Lim, Yong Yee, Andrew J. Bushby, and M. Munawar Chaudhri. "Nano and macro indentation
studies of polycrystalline copper using spherical indenters." In MRS Proceedings, vol.
522, p. 145. Cambridge University Press, 1998.
Lim, Yong Yee, and M. Munawar Chaudhri. "The effect of the indenter load on the
nanohardness of ductile metals: an experimental study on polycrystalline work-hardened
and annealed oxygen-free copper." Philosophical Magazine A 79, no. 12 (1999): 2979-
3000.

91
Lu, Jun, Subra Suresh, and Guruswami Ravichandran. "Dynamic indentation for determining the
strain rate sensitivity of metals." Journal of the Mechanics and Physics of Solids 51, no.
11 (2003): 1923-1938.
Ma, Qing, and David R. Clarke. "Size dependent hardness of silver single crystals." Journal of
Materials Research 10, no. 04 (1995): 853-863.
McElhaney, K. W., J. J. Vlassak, and W. D. Nix. "Determination of indenter tip geometry and
indentation contact area for depth-sensing indentation experiments." Journal of Materials
Research 13, no. 05 (1998): 1300-1306.
Menzel, A., and P. Steinmann. "On the continuum formulation of higher gradient plasticity for
single and polycrystals." Journal of the Mechanics and Physics of Solids 48, no. 8 (2000):
1777-1796.
Miyahara, Kensuke, Saburo Matsuoka, and Nobuo Nagashima. "Nanoindentation Measurement
for a Tungsten (001) Single Crystal." JSME International Journal Series A Solid
Mechanics and Material Engineering 41, no. 4 (1998): 562-568.
Moon, D. W., and T. Vreeland Jr. "Dislocation Velocity in Single and Polycrystalline Silicon‐
Iron." Journal of applied physics 39, no. 3 (1968): 1766-1770.
Muhlhaus, H. B., and E. C. Aifantis. "The influence of microstructure-induced gradients on the
localization of deformation in viscoplastic materials." Acta mechanica 89, no. 1-4 (1991):
217-231.
Nemat-Nasser, Sia, and Yulong Li. "Flow stress of fcc polycrystals with application to OFHC
Cu." Acta Materialia 46, no. 2 (1998): 565-577.
Nix, William D., and Huajian Gao. "Indentation size effects in crystalline materials: a law for
strain gradient plasticity." Journal of the Mechanics and Physics of Solids 46, no. 3
(1998): 411-425.
Nye, J. F. "Some geometrical relations in dislocated crystals." Acta metallurgica 1, no. 2 (1953):
153-162.
Oliver, Warren Carl, and George Mathews Pharr. "An improved technique for determining
hardness and elastic modulus using load and displacement sensing indentation
experiments." Journal of materials research 7, no. 06 (1992): 1564-1583.
Orowan, E. "Mechanical strength properties and real structure of crystals." Z. Kristallogr 89, no.
3/4 (1934): 327-343.

92
Ortiz, M., and J. C. Simo. "An analysis of a new class of integration algorithms for elastoplastic
constitutive relations." International Journal for Numerical Methods in Engineering 23,
no. 3 (1986): 353-366.
Rice, James R. The localization of plastic deformation. Division of Engineering, Brown
University, 1976.
Rudnicki, John Walter, and J. R. Rice. "Conditions for the localization of deformation in
pressure-sensitive dilatant materials." Journal of the Mechanics and Physics of Solids 23,
no. 6 (1975): 371-394.
Saha, Ranjana, Zhenyu Xue, Young Huang, and William D. Nix. "Indentation of a soft metal
film on a hard substrate: strain gradient hardening effects." Journal of the Mechanics and
Physics of Solids 49, no. 9 (2001): 1997-2014.
Schmid, Erich, and Walter Boas. "Plasticity of crystals." (1950).
Senseny, P. E., J. Duffy, and R. H. Hawley. "Experiments on strain rate history and temperature
effects during the plastic deformation of close-packed metals." Journal of Applied
Mechanics 45, no. 1 (1978): 60-66.
Shioiri, J., and K. Satoh. "An ultrasonic study of the rate controlling mechanism of dislocation
motion at high rates of strain." Le Journal de Physique Colloques 46, no. C5 (1985): C5-
3.
Simo, J. C., and T. J. R. Hughes. "On the variational foundations of assumed strain methods."
Journal of Applied Mechanics 53, no. 1 (1986): 51-54.
Soer, W. A., K. E. Aifantis, and J. Th M. De Hosson. "Incipient plasticity during nanoindentation
at grain boundaries in body-centered cubic metals." Acta Materialia 53, no. 17 (2005):
4665-4676.
Soer, W. A., and J. Th M. De Hosson. "Detection of grain-boundary resistance to slip transfer
using nanoindentation." Materials Letters 59, no. 24 (2005): 3192-3195.
Soifer, Ya M., A. Verdyan, M. Kazakevich, and E. Rabkin. "Nanohardness of copper in the
vicinity of grain boundaries." Scripta materialia 47, no. 12 (2002): 799-804.
Staker, M. R., and D. L. Holt. "The dislocation cell size and dislocation density in copper
deformed at temperatures between 25 and 700 C." Acta Metallurgica 20, no. 4 (1972):
569-579.

93
Stelmashenko, N. A., M. G. Walls, L. M. Brown, and Yu V. Milman. "Microindentations on W
and Mo oriented single crystals: an STM study." Acta Metallurgica et Materialia 41, no.
10 (1993): 2855-2865.
Stölken, J. S., and A. G. Evans. "A microbend test method for measuring the plasticity length
scale." Acta Materialia 46, no. 14 (1998): 5109-5115.
Swadener, J. G., E. P. George, and G. M. Pharr. "The correlation of the indentation size effect
measured with indenters of various shapes." Journal of the Mechanics and Physics of
Solids 50, no. 4 (2002a): 681-694.
Swadener, J. G., A. Misra, R. G. Hoagland, and M. Nastasi. "A mechanistic description of
combined hardening and size effects." Scripta materialia 47, no. 5 (2002b): 343-348.
Tabor, D. "The hardness and strength of metals." Journal of the Institute of Metals 79, no. 1
(1951): 1-18.
Tanner, Albert B., Robert D. McGinty, and David L. McDowell. "Modeling temperature and
strain rate history effects in OFHC Cu." International Journal of Plasticity 15, no. 6
(1999): 575-603.
Vardoulakis, I., and E. C. Aifantis. "A gradient flow theory of plasticity for granular materials."
Acta Mechanica 87, no. 3-4 (1991): 197-217.
Voyiadjis, G. Z., and I. N. Basuroychowdhury. "A plasticity model for multiaxial cyclic loading
and ratchetting." Acta Mechanica 126, no. 1-4 (1998): 19-35.
Voyiadjis, G. Z., and R. J. Dorgan. "Gradient formulation in coupled damage-plasticity."
Archives of Mechanics 53, no. 4-5 (2001): 565-597.
Voyiadjis, George Z., and Farid H. Abed. "Effect of dislocation density evolution on the
thermomechanical response of metals with different crystal structures at low and high
strain rates and temperatures." Archives of Mechanics 57, no. 4 (2005a): 299-343.
Voyiadjis, George Z., and Farid H. Abed. "Implicit algorithm for finite deformation hypoelastic–
viscoplasticity in fcc metals." International journal for numerical methods in engineering
67, no. 7 (2006): 933-959.
Voyiadjis, George Z., and Farid H. Abed. "Microstructural based models for bcc and fcc metals
with temperature and strain rate dependency." Mechanics of Materials 37, no. 2 (2005b):
355-378.

94
Voyiadjis, George Z., and Amin H. Almasri. "A physically based constitutive model for fcc
metals with applications to dynamic hardness." Mechanics of Materials 40, no. 6 (2008):
549-563.
Voyiadjis, George Z., and Amin H. Almasri. "Variable material length scale associated with
nanoindentation experiments." Journal of engineering mechanics 135, no. 3 (2009): 139-
148.
Voyiadjis, George Z., Amin H. Almasri, and Taehyo Park. "Experimental nanoindentation of
BCC metals." Mechanics Research Communications 37, no. 3 (2010): 307-314.
Voyiadjis, George Z., and Rashid K. Abu Al-Rub. "Gradient plasticity theory with a variable
length scale parameter." International Journal of Solids and Structures 42, no. 14 (2005):
3998-4029.
Voyiadjis, George Z., and Rashid K. Abu Al-Rub. "Thermodynamic based model for the
evolution equation of the backstress in cyclic plasticity." International Journal of
Plasticity 19, no. 12 (2003): 2121-2147.
Voyiadjis, George Z., and N. Ellis Buckner. "Indentation of a half‐ space with a rigid indentor."
International journal for numerical methods in engineering 19, no. 10 (1983): 1555-1578.
Voyiadjis, George Z., and Babur Deliktas. "Multi-scale analysis of multiple damage mechanisms
coupled with inelastic behavior of composite materials." Mechanics research
communications 27, no. 3 (2000): 295-300.
Voyiadjis, George Z., Babur Deliktas, and Elias C. Aifantis. "Multiscale analysis of multiple
damage mechanisms coupled with inelastic behavior of composite materials." Journal of
Engineering Mechanics 127, no. 7 (2001): 636-645.
Voyiadjis, George Z., Babur Deliktas, Danial Faghihi, and Adam Lodygowski. "Friction
coefficient evaluation using physically based viscoplasticity model at the contact region
during high velocity sliding." Acta mechanica 213, no. 1-2 (2010): 39-52.
Voyiadjis, George Z., and Danial Faghihi. "Variable (intrinsic) material length scale for face-
centred cubic metals using nano-indentation." Proceedings of the Institution of
Mechanical Engineers, Part N: Journal of Nanoengineering and Nanosystems 224, no. 3
(2010): 123-147.
Voyiadjis, George Z., and Rick Peters. "Size effects in nanoindentation: an experimental and
analytical study." Acta Mechanica 211, no. 1-2 (2010): 131-153.

95
Voyiadjis, George Z., Andrew A. Poe, and Panos D. Kiousis. "Finite-strain, elasto-plastic
solution for contact problems." Journal of Engineering Mechanics 112, no. 3 (1986): 273-
292.
Vukelic, S., I. C. Noyan, J. W. Kysar, and Y. L. Yao. "Characterization of Heterogeneous
Response of Al Bicrystal Subject to Micro Scale Laser Shock Peening." Experimental
Mechanics 51, no. 5 (2011): 793-796.
Vukelic, Sinisa, Youneng Wang, Jeffrey W. Kysar, and Y. Lawrence Yao. "Dynamic material
response of aluminum single crystal under microscale laser shock peening." Journal of
Manufacturing Science and Engineering 131, no. 3 (2009): 031015.
Walgraef, Daniel, and Elias C. Aifantis. "On the formation and stability of dislocation patterns—
III: Three-dimensional considerations." International journal of engineering science 23,
no. 12 (1985): 1365-1372.
Walgraef, Daniel, and Elias Aifantis. "Plastic instabilities, dislocation patterns and
nonequilibrium phenomena." Res mechanica 23, no. 2-3 (1988): 161-195.
Wang, M. G., and A. H. W. Ngan. "Indentation strain burst phenomenon induced by grain
boundaries in niobium." Journal of materials research 19, no. 08 (2004): 2478-2486.
Wang, W., Y. Huang, K. J. Hsia, K. X. Hu, and A. Chandra. "A study of microbend test by strain
gradient plasticity." International Journal of Plasticity 19, no. 3 (2003): 365-382.
Wang, Zhigang, Hongbin Bei, Easo P. George, and George M. Pharr. "Influences of surface
preparation on nanoindentation pop-in in single-crystal Mo." Scripta Materialia 65, no. 6
(2011): 469-472.
Westbrook, J. H., and K. T. Aust. "Solute hardening at interfaces in high-purity lead—I Grain
and twin boundaries." Acta Metallurgica 11, no. 10 (1963): 1151-1163.
Xiang, Y., and J. J. Vlassak. "Bauschinger effect in thin metal films." Scripta Materialia 53, no. 2
(2005): 177-182.
Xue, Z., Y. Huang, K. C. Hwang, and M. Li. "The influence of indenter tip radius on the micro-
indentation hardness." Journal of Engineering Materials and Technology 124, no. 3
(2002a): 371-379.
Xue, Z., Y. Huang, and M. Li. "Particle size effect in metallic materials: a study by the theory of
mechanism-based strain gradient plasticity." Acta Materialia 50, no. 1 (2002b): 149-160.
96
Xue, Zhenyu, M. Saif, and Yonggang Huang. "The strain gradient effect in
microelectromechanical systems (MEMS)." Microelectromechanical Systems, Journal of
11, no. 1 (2002c): 27-35.
Yang, B., and H. Vehoff. "Dependence of nanohardness upon indentation size and grain size–a
local examination of the interaction between dislocations and grain boundaries." Acta
Materialia 55, no. 3 (2007): 849-856.
Yuan, Huang, and Jian Chen. "Identification of the intrinsic material length in gradient plasticity
theory from micro-indentation tests." International journal of solids and structures 38, no.
46 (2001): 8171-8187.
Zbib, H. M., and E. C. Aifantis. "On the gradient-dependent theory of plasticity and shear
banding." Acta mechanica 92, no. 1-4 (1992): 209-225.
Zbib, H. M., and E. C. Aifantis. "On the localization and postlocalization behavior of plastic
deformation. I: On the initiation of shear bands." Res Mechanica 23, no. 2-3 (1988): 261-
277.

97
APPENDIX
ELSEVIER LICENSES
1. Elsevier License Number One
1.1 Confirmation Letter
Copyright Clearance Center <[email protected]>
Fri 3/18/2016 11:35 AM
To: Cheng Zhang <[email protected]>;
Dear Mr. Cheng Zhang,
Thank you for placing your order through Copyright Clearance Center's RightsLink service.
Elsevier has partnered with RightsLink to license its content. This notice is a confirmation that
your order was successful.
Your order details and publisher terms and conditions are available by clicking the link below:
http://s100.copyright.com/CustomerAdmin/PLF.jsp?ref=59a83541-b146-4653-ab2e-
3018aaf8659d
Order Details
Licensee: Cheng Zhang
License Date: Mar 18, 2016
License Number: 3832010596485
Publication: Materials Science and Engineering: A
Title: Rate-dependent size effects and material length scales in nanoindentation near the grain
boundary for a bicrystal FCC metal
Type of Use: reuse in a thesis/dissertation
Total: 0.00 USD
To access your account, please visit https://myaccount.copyright.com.
Please note: Online payments are charged immediately after order confirmation; invoices are
issued daily and are payable immediately upon receipt.
To ensure that we are continuously improving our services, please take a moment to complete
our customer satisfaction survey.
B.1:v4.2

98
1.2 Order Details
The following is the license issued with more details. Please note that the portion to be allowed
for reuse is “full article”.
Supplier Elsevier Limited
The Boulevard, Langford Lane
Kidlington, Oxford, OX5 1GB, UK
Registered Company Number 1982084
Customer Name Cheng Zhang
Customer Address 4606 Y A Tittle Ave Apt 20
Baton Rouge, LA 70820
License Number 3832010596485
License Date Mar 18, 2016
Licensed Content Publisher Elsevier
Licensed Content Publication Materials Science and Engineering: A
Licensed Content Title Rate-dependent size effects and material
length scales in nanoindentation near the
grain boundary for a bicrystal FCC metal
Licensed Content Author Cheng Zhang, George Z. Voyiadjis
Licensed Content Date 6 April 2016
Licensed Content Volume Number 659
Licensed Content Issue Number n/a
Number of Pages 8
Start Page 55
End Page 62
Type of Use reuse in a thesis/dissertation
Portion full article
Format both print and electronic
Are you the author of this Elsevier article? Yes
Will you be translating? No
Title of Your Thesis/Dissertation Constitutive Modeling and Experiments for
the Micro and Nano Behaviors in Metals
Expected Completion Date May 2016
Estimated Size (Number of Pages) 100
Elsevier VAT Number GB 494 6272 12

99
2. Elsevier License Number Two
2.1 Confirmation Letter
Copyright Clearance Center <[email protected]>
Fri 3/18/2016 11:37 AM
To: Cheng Zhang <[email protected]>;
Dear Mr. Cheng Zhang,
Thank you for placing your order through Copyright Clearance Center's RightsLink service.
Elsevier has partnered with RightsLink to license its content. This notice is a confirmation that
your order was successful.
Your order details and publisher terms and conditions are available by clicking the link below:
http://s100.copyright.com/CustomerAdmin/PLF.jsp?ref=f45073a1-565e-4b91-af70-
577f2b40e615
Order Details
Licensee: Cheng Zhang
License Date: Mar 18, 2016
License Number: 3832010667499
Publication: Materials Science and Engineering: A
Title: The mechanical behavior during nanoindentation near the grain boundary in a bicrystal
FCC metal
Type of Use: reuse in a thesis/dissertation
Total: 0.00 USD
To access your account, please visit https://myaccount.copyright.com.
Please note: Online payments are charged immediately after order confirmation; invoices are
issued daily and are payable immediately upon receipt.
To ensure that we are continuously improving our services, please take a moment to complete
our customer satisfaction survey.
B.1:v4.2

100
2.2 Order Details
The following is the license issued with more details. Please note that the portion to be allowed
for reuse is “full article”.
Supplier Elsevier Limited
The Boulevard, Langford Lane
Kidlington, Oxford, OX5 1GB, UK
Registered Company Number 1982084
Customer Name Cheng Zhang
Customer Address 4606 Y A Tittle Ave Apt 20
Baton Rouge, LA 70820
License Number 3832010667499
License Date Mar 18, 2016
Licensed Content Publisher Elsevier
Licensed Content Publication Materials Science and Engineering: A
Licensed Content Title Rate-dependent size effects and material
length scales in nanoindentation near the
grain boundary for a bicrystal FCC metal
Licensed Content Author George Z. Voyiadjis, Cheng Zhang
Licensed Content Date 5 January 2015
Licensed Content Volume Number 621
Licensed Content Issue Number n/a
Number of Pages 11
Start Page 218
End Page 228
Type of Use reuse in a thesis/dissertation
Portion full article
Format both print and electronic
Are you the author of this Elsevier article? Yes
Will you be translating? No
Title of Your Thesis/Dissertation Constitutive Modeling and Experiments for
the Micro and Nano Behaviors in Metals
Expected Completion Date May 2016
Estimated Size (Number of Pages) 100
Elsevier VAT Number GB 494 6272 12

101
VITA
Cheng Zhang was born in 1985 in the city of Anshan, Liaoning Province, China. Cheng
received his primary and high school in Anshan, China. Cheng entered the University of Science
and Technology of China in the city of Hefei, Anhui Province, China in August 2004. Cheng
graduated with a bachelor’s degree in Macromolecular Materials and Engineering in July 2008.
Shortly after receiving his bachelor’s degree, Cheng jointed the doctoral program under the
supervision of Boyd Professor George Z. Voyiadjis in Engineering Science at Louisiana State
University in August 2008. The completed research work is presented in this dissertation. Cheng
Zhang has been involved in researches in several areas, such as the constitutive modeling of
mechanical behaviors in metals in the submicron scales, nanoindentation experiments, sample
preparations and multiscale simulations of solid materials. His future plans involve continued
research on materials characterization with the aid of submicron scale testing, microscopy
techniques and multi-scale modeling.