Consolidated Financial Results Presentation for the … close up stores, hollowing out community...
26
Copyright (C) Seven & i Holdings Co., Ltd. All Rights Reserved. January 11, 2018 Seven & i Holdings Co., Ltd. 1 Consolidated Financial Results Presentation for the Third Quarter of FY2018
-
Upload
phamkhuong -
Category
Documents
-
view
214 -
download
1
Transcript of Consolidated Financial Results Presentation for the … close up stores, hollowing out community...

Copyright (C) Seven & i Holdings Co., Ltd. All Rights Reserved.
January 11, 2018
Seven & i Holdings Co., Ltd.
1
Consolidated Financial ResultsPresentation for the Third Quarterof FY2018

Copyright (C) Seven & i Holdings Co., Ltd. All Rights Reserved.
FY2018 Q3 cumulative
2
Results YOY YOY Change
Budgetachieved
Group’s total sales ¥8,265.4 bn 104.5% +¥356.1 bn Not
Achieved
Revenuesfrom operations
¥4,479.7 bn 104.4% +¥190.7 bn NotAchieved
Operatingincome ¥295.7 bn 108.0% +¥21.7 bn Achieved
Net income attributableto ownersof parent
¥149.2 bn 197.6% +¥73.7 bn Achieved
◆Consolidated results
Achieved operating income target despite adverse weather conditions in the summer, and in the months of September and October(However, the mainstay segments of domestic CVS operations, as well as superstore operations, fell short of their respective targets)
◆Operating income by segment
Results YOY YOY Change
Budgetachieved
DomesticCVS ¥188.4bn 100.6% +¥1.0 bn Not
Achieved
OverseasCVS ¥63.9 bn 120.4% +¥10.8 bn Achieved
Superstore ¥9.0 bn 91.3% ¥(0.87) bn NotAchieved
Departmentstore ¥0.28 bn - +¥3.2 bn Achieved
FinancialServices ¥39.4 bn 101.4% +¥0.54 bn Achieved
Specialtystore ¥0.69 bn - +¥6.7 bn Achieved
Others ¥3.4 bn 114.1% +¥0.42 bn Achieved
Copyright (C) Seven & i Holdings Co., Ltd. All Rights Reserved.
RetailBusiness
Environmental changes surrounding retail business
◆Emergence of EC/IT Companies
➢ Amazon/GoogleReal stores acquisition and allianceSpread of AI speakerCapturing customers and accumulate customer information
➢ AlibabaInvestment in major supermarket
◆Diversity of Payments➢Further expansion of mobile payment
Particularly in China➢Development of cashless society
Emergence of self checkout and unstaffed stores
➢ Expansion of virtual currencyExtension of Bitcoin transaction
◆Reasons for changes in Japan and overseas
➢Human resources shortageFurther expansion of gaps between industries
➢Declining population, fewer childrenand aging society
➢Decrease in the number of people per household, more working women
➢Retailers close up stores, hollowing out community life
◆Reasons for changes intheretail business
➢ Reduction barrier between industriesDrugstores expand food sales
➢ Price competition heats up➢ Salary increase request by government➢ Actualized rising logistics cost
3
Aiming to achieve sustainable growth through “Human resources development”, “Sales area reform”, “enhancement of product and service quality” while implementing PDCA cycles

Copyright (C) Seven & i Holdings Co., Ltd. All Rights Reserved.
Seven-Eleven JapanSEJ
4
Copyright (C) Seven & i Holdings Co., Ltd. All Rights Reserved.
38
40
42
44
46
48
50
52
88
90
92
94
96
98
100
102
104
106
SEJ's sales share
Existing store sales YOY
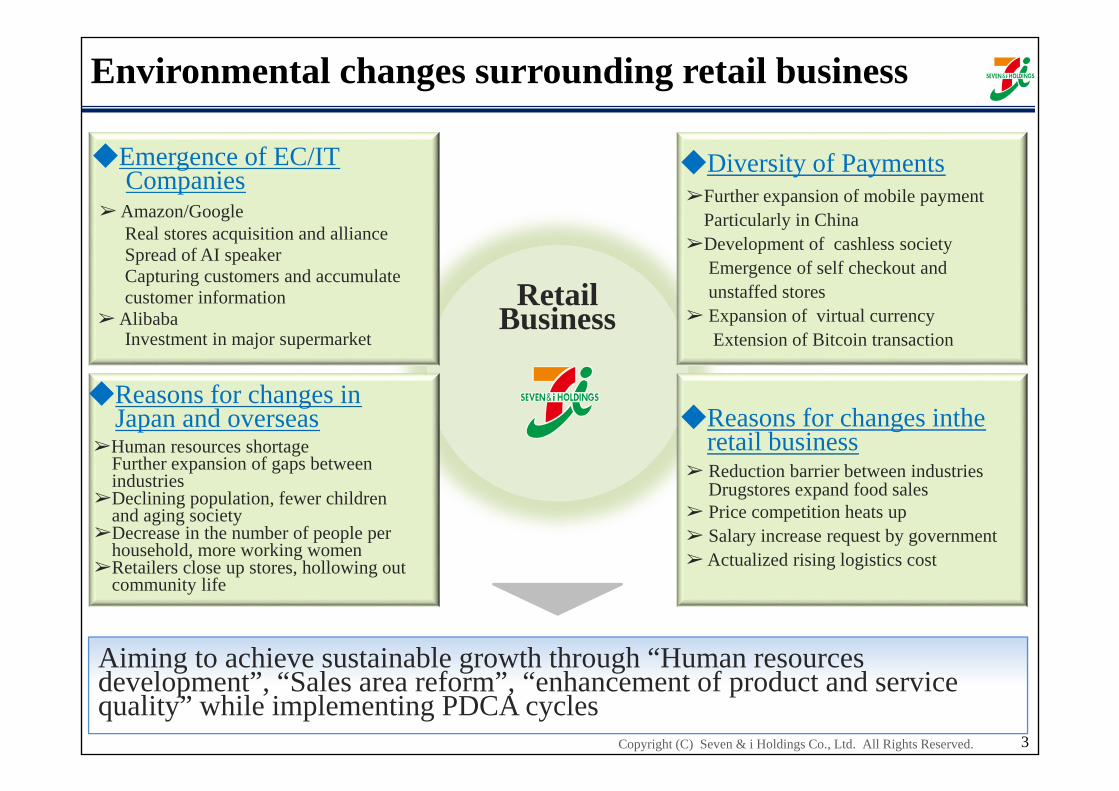
Sales in categories which have been a long-standing priority for reinforcement continued to expand, although existing store sales struggled to grow in Q3, due partly to inclement weather
Continue to strengthen initiatives centered on the take-home meal category, thereby paving the way for sustained growth
%
62 months of continuous YOY growth in existing store sales achieved in the previous year
5
SEJ’s Existing Store Sales YOY and Sales Market Share
Existing store sales YOYdecline for the first time in 63 months
◆Sales growth rank by MDSE categoryfor Q3 (/day/ store)
Rank YOYdifference
1 Fryer foods +¥1,240
2 Noodles +¥810
3 SEVEN CAFÉ +¥680
4 Processed foods +¥670
5 Cigarettes +¥630
FY2013 FY2014 FY2015 FY2016 FY2017 FY2018
44.1%
39.1%40.4%
41.3%42.1%
43.0%
%
YOYSales
growth Market share

Copyright (C) Seven & i Holdings Co., Ltd. All Rights Reserved. 6
CVS: Trend of Sales and Store Count
38,274
39,80940,644
41,114 41,340
42,64343,087 43,228
44,39145,006
45,769
47,593
50,206
52,902
55,774
57,05257,818
30,000
35,000
40,000
45,000
50,000
55,000
60,000
0
20,000
40,000
60,000
80,000
100,000
120,000
2001 2002 2003 2004 2005 2006 2007 2008 2009 2010 2011 2012 2013 2014 2015 2016 2017
Sales of Others
SEJ's Sales
Total Store Count in Japan
(Billionsof yen)
(FY)
(Stores)
10.83Size of CVS Market in Japan (trillions of yen)
10.4910.13
9.61
9.389.03
8.488.118.06
7.567.437.317.197.157.45
7.016.98
+4,954 stores +¥0.58tn.
+12,812 stores +¥2.72tn.
7 years
7 years
12,000
10,000
8,000
6,000
4,000
2,000
Further growth is possible by continuing to address social issues (customer needs)
Stagnation due to the homogenization of stores
Source: Japan Franchise Association convenience store survey
Copyright (C) Seven & i Holdings Co., Ltd. All Rights Reserved. 7
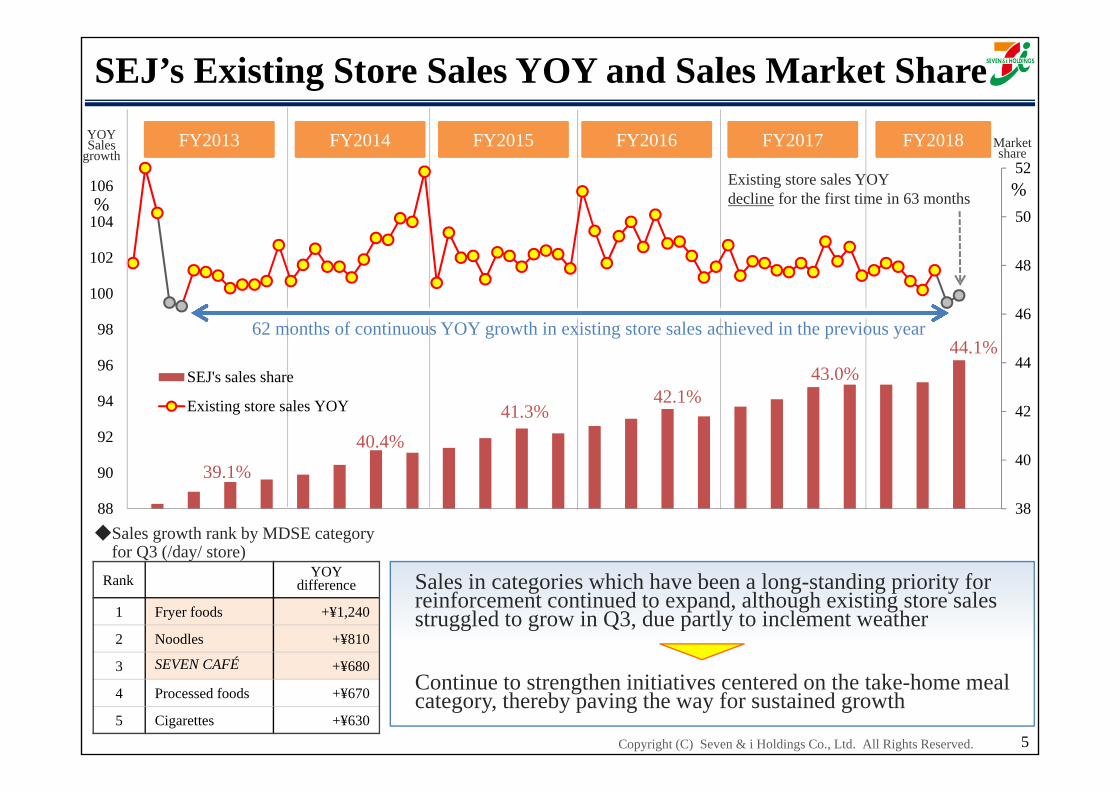
Changes in Highest ranking Categories with Growing Sales from 2009 to 2016
Sales amount(versus FY2010)
Gross profit(versus FY2010)
Frozen foods (excl. ice cubes) 330% 374%Counter products(incl. Oden Japanese stew, SEVEN CAFÉ and fryer foods) 187% 222%Daily products 117% 118%Cigarettes 111% 120%Ice cream 110% 114%Bread and pastries 104% 108%Processed foods(incl. Seasonings & dried foods, rice, coffee & tea, and
delicacies, etc.)101% 105%
◆ Highest ranking categories with growing sales
Delivered sustained growth by enhancing quality and product lineups in response to a shift in consumer needs to food service and home meal replacement amid changes in the social structure

Copyright (C) Seven & i Holdings Co., Ltd. All Rights Reserved.
Rank CategoryVersus other stores in the sameregional unit
1 Pocket snacks and western confectionery +¥2,000
2 Noodles and other +¥1,900
3 Snacks +¥1,500
4 Frozen foods +¥1,300
5 Delicatessen +¥1,100
6 Daily foods +¥1,100
7 SEVEN CAFÉ +¥1,100
8 Fast food and other +¥900
9 Pastries +¥900
10 Oden (Japanese stew) +¥700
Installation of the new layout(for stores with floor space of 199 sqm)
◆Progress on introducing the new layoutat stores
・Installation of the new layout was completed at 250 existing stores as of the end of NovemberPositive impact on daily sales of approx. ¥15 thousand (69 stores renovated in June)
・New layout installed at 600 new stores as of the end of November
Main categories with growing sales
Bolster new items in the growing counter products category andnew product categories
Continuously implement tests (plans call for expanding the layoutto more stores after verifying the impact)
Sales grew in categories that were strengthened as a result of the new layout. Efforts will be made to further expand sales by closely coordinating these categories with product development
8
Aiming to Achieve Growth Over the Next 10 Years by Avoiding the Homogenization of Stores
Expand counterIncrease rice products and chilled cases
Entrance
Walk-in refrigerator
Magazines and comics
Expand frozen foods reach-in

Copyright (C) Seven & i Holdings Co., Ltd. All Rights Reserved.
Expand in stages by developing comfortable work environments and by starting trial tests from December 7, 2017.
◇Electricity charges reduction approx. 28%◇Working time reduction approx. 5.5 hour / day
9
Reduce energy consumption and CO2 emissions using cutting-edge technologies with a view to further increasing the number of stores, thereby helping to mitigate global warming and shape a sustainable society
*1
*2
*1: In case installing at standard store (versus FY2014)*2: Comparing with case that carried out in a predetermined procedure
Initiatives to Realize the “People- and Environment-Friendly Store” Concept
<Examples of Technologies>・Road surface solar panels
(French technology, 1st. use in Asia)・Use of pure hydrogen fuel cells for
power generation(1st. use in the CVS industry)
<Examples of Technologies>・New type of walk-in refrigerator
(1st. use in the CVS industry)⇒Designed to operate without the circulation
of cold air within the walk-in refrigerator, thereby improving the ease of work and reducing the physical burden on employees
・Adoption of sliding shelves for freezerand refrigerator facilities(freezer: 1st. mass production modelused in the CVS industry)
<Examples of Technologies>・Air conditioning unit⇒Achieve a comfortable interior environment
through “nanoe X” indoor air purification
・Comfortable toilet areas⇒using floor, wall and ceiling materials with
strong anti-bacterial and odor-eliminating features, etc.
Aiming to Achieve Growth Over the Next 10 Years by Avoiding the Homogenization of Stores
Build comfortable store environments: 10 technologies
Enhance work conditions:26 technologies
Reduce environmental impact:22 technologies
Copyright (C) Seven & i Holdings Co., Ltd. All Rights Reserved. 10
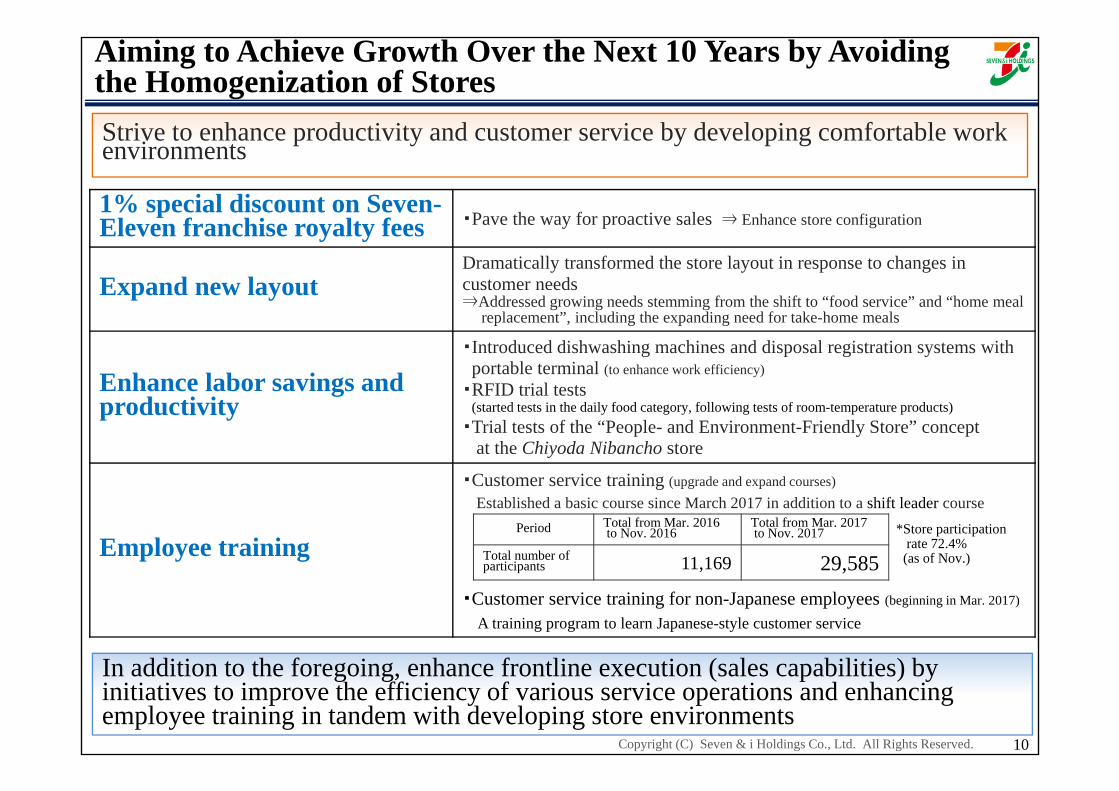
In addition to the foregoing, enhance frontline execution (sales capabilities) by initiatives to improve the efficiency of various service operations and enhancing employee training in tandem with developing store environments
Strive to enhance productivity and customer service by developing comfortable work environments
1% special discount on Seven-Eleven franchise royalty fees ・Pave the way for proactive sales ⇒ Enhance store configuration
Expand new layoutDramatically transformed the store layout in response to changes incustomer needs⇒Addressed growing needs stemming from the shift to “food service” and “home meal
replacement”, including the expanding need for take-home meals
Enhance labor savings andproductivity
・Introduced dishwashing machines and disposal registration systems with portable terminal (to enhance work efficiency)
・RFID trial tests(started tests in the daily food category, following tests of room-temperature products)
・Trial tests of the “People- and Environment-Friendly Store” conceptat the Chiyoda Nibancho store
Employee training
・Customer service training (upgrade and expand courses)Established a basic course since March 2017 in addition to a shift leader course
・Customer service training for non-Japanese employees (beginning in Mar. 2017)
A training program to learn Japanese-style customer service
Aiming to Achieve Growth Over the Next 10 Years by Avoiding the Homogenization of Stores
Period Total from Mar. 2016 to Nov. 2016
Total from Mar. 2017 to Nov. 2017
Total number of participants 11,169 29,585
*Store participationrate 72.4% (as of Nov.)

Copyright (C) Seven & i Holdings Co., Ltd. All Rights Reserved.
7-Eleven, Inc.SEI
11

Copyright (C) Seven & i Holdings Co., Ltd. All Rights Reserved.
(1.6)%
+0.1% +0.3%
+1.6%
+4.9%
+2.6%
+0.1%
+2.2% +2.0%+2.4%
+1.2%
(2.0)
0.0
2.0
4.0
6.0
Jan. Feb. Mar. Apr. May Jun. Jul. Aug. Sep. Oct. Nov.
MDSE sales growth YOY at existingstores
Trends in Merchandise Sales Growth at Existing Stores and Operating Income
12
(%)
Q1 Operating income declined, reflecting the impact of lower existing store sales, mainly due to inclement weather and special factors.
Q2 Operating income rose significantly due to stable weather conditions and solid existing store sales.
Q3 Operating income rose significantly due to firm sales of merchandise and gasoline, despite the impact of hurricanes and other factors.
Q1 Q2 Q3 YTD
OP ¥10.0 bn ¥29.3 bn 33.3 bn 72.7 bnYOY Change ¥(2.1) bn +¥4.9 bn +¥10.5 +13.3 bn

Copyright (C) Seven & i Holdings Co., Ltd. All Rights Reserved. 13
Achieved higher income as growth in primarily gasoline sales and its gross profit absorbed decline in merchandise gross profit and increase in SG & A expenses.
M&A results for FY2016 Jul. 2016: CST Brands (79 stores) Sep. 2016: Imperial Oil (148 stores)
Results Details
Sales +$112 mn
・U.S. merchandise sales increase at existing stores
+1.5%Increase in fresh foods and cigarettes sales, etc.
・Gasoline +25.8%M&A effectIncrease in retail price
Grossprofit
Merchandise$(27) mn
Gasoline+$104 mn
・Merchandise GPMYOY change (0.3)%
[excl. cigarettes impact +0.3%]
・Gasoline cents per gallonYOY change +¢2.65
SG & Aexpenses $(86) mn
・Depreciation and amortization +$24 mn
Higher income
+$103 mnFY2016 Q3OP
$547mn
Sales+$112mn
GasolineGP
+$104mn
Factors in YOY Change of Operating Income
MDSEGP
$(27) mn
SG&Aexpenses$(86)mn
FY2017 Q3OP
$650mn

Copyright (C) Seven & i Holdings Co., Ltd. All Rights Reserved.
(4) Connect and Transact Digitally (5) Improve the Store Base (6) Simplify Store Operations
・Implement loyalty program “7Rewards”・No. of customer approx. +2% growth YOY
(result for Dec. in Canadian zone)⇒ CRM Strategy and utilization of big
data
・Open high-quality stores and close unprofitable stores
・Acquisition of Part of the Business of Sunoco LP⇒ Advance the market concentration
strategy
・Improve operations(product inspection with mobile terminal,
semi-automatic ordering system, dataanalysis system)
・Gross Profit Margin Improvement through Productivity Enhancement
(1) Grow Food and Beverage (2) Expand the Assortment Regional and Local Products (3) Build Private Brands
・Strengthen sales test and expand test area・Strengthen initiatives with Warabeya
Nichiyo Holdings Co., Ltd.(full-scale operations expected to start from
FY2018)
・Increasing approx. 300 SKUs by adding more product shelves
・Implement 2,090 stores in FY2017(YTD 8,030 stores)・Implemented stores boost store sales by
approx. 1%
・Average yearly growth rate for the past 4 years :+23%
・GPM change for PB products: +0.7%(boost SEI’s total GPM by approx. 0.1%)
14
Growth Strategy: 6 Point PlanTo achieve sustainable growth, the following 6 actions are considered as priority measures, and these initiatives are promoted
Copyright (C) Seven & i Holdings Co., Ltd. All Rights Reserved. 15
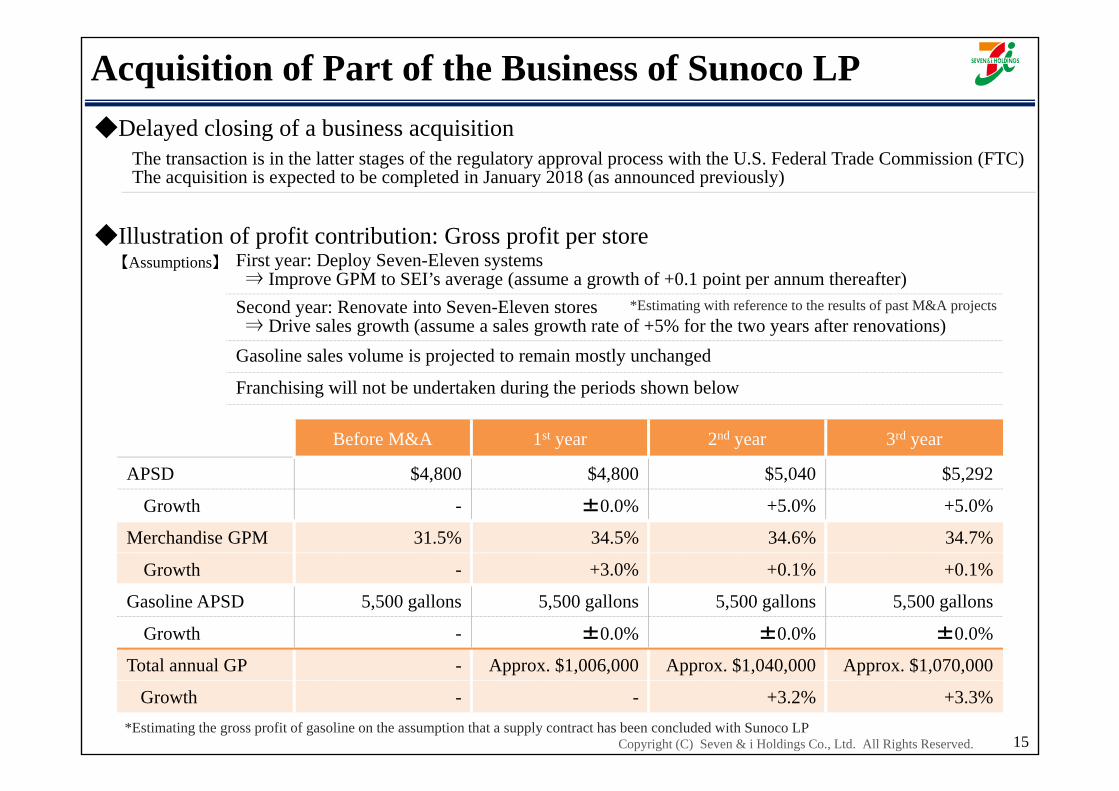
Acquisition of Part of the Business of Sunoco LP ◆Delayed closing of a business acquisition
The transaction is in the latter stages of the regulatory approval process with the U.S. Federal Trade Commission (FTC)The acquisition is expected to be completed in January 2018 (as announced previously)
◆Illustration of profit contribution: Gross profit per store【Assumptions】 First year: Deploy Seven-Eleven systems
⇒ Improve GPM to SEI’s average (assume a growth of +0.1 point per annum thereafter)Second year: Renovate into Seven-Eleven stores⇒ Drive sales growth (assume a sales growth rate of +5% for the two years after renovations)
Gasoline sales volume is projected to remain mostly unchanged
Franchising will not be undertaken during the periods shown below
Before M&A 1st year 2nd year 3rd year
APSD $4,800 $4,800 $5,040 $5,292
Growth - ±0.0% +5.0% +5.0%
Merchandise GPM 31.5% 34.5% 34.6% 34.7%
Growth - +3.0% +0.1% +0.1%
Gasoline APSD 5,500 gallons 5,500 gallons 5,500 gallons 5,500 gallons
Growth - ±0.0% ±0.0% ±0.0%
Total annual GP - Approx. $1,006,000 Approx. $1,040,000 Approx. $1,070,000
Growth - - +3.2% +3.3%*Estimating the gross profit of gasoline on the assumption that a supply contract has been concluded with Sunoco LP
*Estimating with reference to the results of past M&A projects
Copyright (C) Seven & i Holdings Co., Ltd. All Rights Reserved.
Progress on Structural Reforms
Ito-Yokado (IY)Sogo & Seibu (SS)
16

Copyright (C) Seven & i Holdings Co., Ltd. All Rights Reserved.
IY: Progress on Structural Reforms
17
Store structural reforms are proceeding as planned
(1) Downsize the sales floor space for apparel, household goods and strive to convert sales areas to tenant space
Renovate 26 stores from FY2017 to FY2018
(2) Strengthen food Renovate the food sales areas of 10 stores to new formats in 2H FY2018
(3) Close 40 stores from FY2017 to FY2021 Close 24 stores from FY2017 to FY2018
(4) Consider redeveloping stores that have been in business for 30 years or more
Plans call for redeveloping four stores in FY2020, followed by the successive redevelopment of stores thereafter
* The number of stores in FY2018 includes projections for Q4

Copyright (C) Seven & i Holdings Co., Ltd. All Rights Reserved.
96.7%
94.8%
92
94
96
98
100
102
Sep. Oct. Nov. Dec Jan Feb Mar Apr May Jun Jul Aug Sep Oct Nov Dec
Food Merchandise total
18
◆Existing store sales YOY
Existing store sales are on a recovery path, owing to measures to strengthen food, in tandem with striving to reduce directly operated sales areas and convert them into tenant spaces
YOY
FY2017 FY2018
59.2%
58.3% 58.2% 58.0%
96.6%
97.9%
98.8%99.2%
56.0
58.0
60.0
62.0
64.0
66.0
92.0
94.0
96.0
98.0
100.0
102.0
FY2017 Q1 Q2 Q3
Ratio of directly operated sales areaExistin store sales YOY (including tenants)
(%)(%) (%)
◆Ratio of directly operated sales area and existing store sales YOY (including tenants)
Results for Dec. are preliminary figures
YOY
IY: Progress on Structural Reforms
FY2018 FY2018 FY2018

Copyright (C) Seven & i Holdings Co., Ltd. All Rights Reserved.
IY: Revision of Sales Area Formats to Strengthen Foods
19
40.0%
24.0%
60.0%
76.0%
0% 50% 100%
Delica-tessen Others
◆Comparison of the size of food sales areas
New
layout
◆New layouts of food sales areas (Sales floor area: 2,975 sqm to 3,306 sqm)
Delica-tessen
Others
Existing layout
Delicatessen zone
(Delicatessen, Daily foods)
Marchézone
(Fresh meat, Vegetables & fruits,
Seafood)
Grocery product zone
(Processed foods)
Cooking support(Menu proposal)
Eat-in area
Eat-in area
Cashier
Sales arearatio 【Delicatessen sales area】 Increase from 24% ⇒ 40%Renovationkey point
Created separate zones for delicatessen, fresh food and grocery productsNotably, a dining space was installed adjacent to the delicatessen products zone, and the sales area and product lineups were enhanced significantly.
Positiveimpact
Eight renovated stores were reopened on December 8 (Result for Dec. 8 – Dec. 31)
Number of customer at above 8 stores:107% YOY (all IY stores:101%)Food sales:109% YOY (all IY stores:102%)*
*Food sales of renovated 8 stores boost IY’s total food sales by 0.8%

Copyright (C) Seven & i Holdings Co., Ltd. All Rights Reserved.
Zone Renovation detailsResults for Dec. 8 to 31
Sales Growth YOY
DelicatessenIntroduce specialty eateries focused on handmade karaage fried chicken, rice balls and other dishes, and also buffet-style dining services where items are sold by weight
113%
Marché Create an event-oriented space featuring generous portions centered on displays of fish, fresh meat, and fruits and vegetables adjacent to one another 111%
Grocery products
Upgrade and expand product lineups according to market needs (Japanese seasonings, health beverages, snacks and confectionery, etc.) 105%
IY: Store Structure Reform ExampleExample of Omiya-Miyahara store (reopened after renovation on December 8, 2017)
The positive effect of food contributed to growth in the number of customers and an improvement in the sales of the entire store
◆Result after renovation (Results for Dec. 8 to 31)
20
◆Details
No. of customer Sales
Store total Store total Food Apparel Householdgoods
Omiya-Miyahara 107% 107% 110% 108% 102%
All IY stores 101% 102% 102% 101% 101%

Copyright (C) Seven & i Holdings Co., Ltd. All Rights Reserved.
The repeat rate is trending upward
The satisfaction level receives an certain evaluation
IY: Progress on IY Fresh◆Overview of trial test
Commenced pilot test in Shinjuku and Bunkyo wards from November 28, 2017
Merchandise lineups: fresh foods and meal kits approx. 5,000 SKUsDelivery fees: ¥350 (Free delivery on purchase of ¥4,500 or more)
◆Customers feedback *Conducted customer survey in December, 2017
Introduce top-selling items from IY’s Net supermarket Flyer, displaying posters at major railway stations
Set menu proposal Guidance offered from the website top page of LOHACO
Free delivery campaign with purchase of ¥4,500 or more(till February 28, 2018) Distribute email newsletter to LOHACO customers
◆Issues
MD
SE
Expand grocery product line up
Expand meal kits lineups
◆CountermeasuresD
elivery
Expand delivery time (early morning, night time)
Reduction in condition for free delivery (¥4,500)
Issue with new customer acquisition
Customer awareness mustbe increased
Address customer needs and pave the way for expand delivery areas by implementing PDCA cycles
21

Copyright (C) Seven & i Holdings Co., Ltd. All Rights Reserved.
+0.1% ±0.0%
(2.7)%
(0.6)%
+0.3%+0.9%+6.5% +3.7%
(5.7)%
(9.2)%(12.1)% (12.3)%
(16.0)
(8.0)
0.0
8.0
(4.0)
(2.0)
0.0
2.0Sales growth YOY in existing store (left)advertising & decoration expense growth YOY (right)
SS:Accomplishments of Operation Structural Reforms
Reexamine need for customer attraction and sales expansion strategies to rely on point sales Plus Point Fair: Reduced 101 days YOY
(%)
22
◆Trends in sales growth YOY in existing store, advertising & decoration expense growth YOY, Merchandise GPM and operating income
Existing store sales increased, even while advertising and decoration expenses were being curtailed, leading to higher operating income
(%, millions of yen) FY2015 FY2016 FY2017 FY2018 Q1 FY2018 Q2 FY2018 Q3 FY2018 YTD
MDSE GPM 24.6 24.3 23.9 24.5 23.5 24.8 24.3
YOY Change (0.2) (0.3) (0.4) (0.1) (0.3) +0.4 ±0.0
OP 10,226 7,411 4,341 380 246 (769) (142)
YOY Change +85 (2,815) (3,070) +366 +216 +1,036 +1,619
Holding events and projects at the discretion of individual storesEnhance sales and gross profit by harnessing the capacity to reshape sales areas
(%)
Copyright (C) Seven & i Holdings Co., Ltd. All Rights Reserved.
113
100
107
85
90
95
100
105
110
115
FY2013 Q3 FY2014 Q3 FY2015 Q3 FY2016 Q3 FY2017 Q3 FY2018 Q3
sales per square meter sales per employee
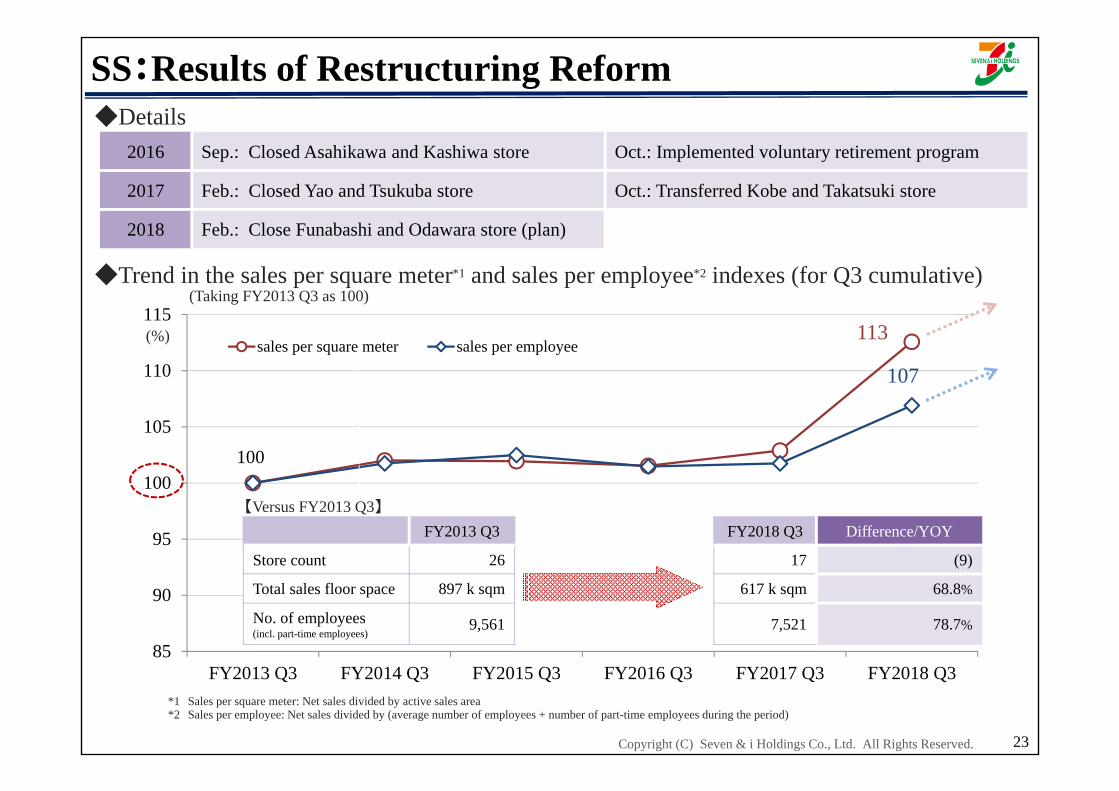
SS:Results of Restructuring Reform
(%)
23
◆Trend in the sales per square meter*1 and sales per employee*2 indexes (for Q3 cumulative)
*1 Sales per square meter: Net sales divided by active sales area *2 Sales per employee: Net sales divided by (average number of employees + number of part-time employees during the period)
◆Details2016 Sep.: Closed Asahikawa and Kashiwa store Oct.: Implemented voluntary retirement program
2017 Feb.: Closed Yao and Tsukuba store Oct.: Transferred Kobe and Takatsuki store
2018 Feb.: Close Funabashi and Odawara store (plan)
FY2013 Q3 FY2018 Q3 Difference/YOY
Store count 26 17 (9)
Total sales floor space 897 k sqm 617 k sqm 68.8%
No. of employees (incl. part-time employees)
9,561 7,521 78.7%
【Versus FY2013 Q3】
(Taking FY2013 Q3 as 100)

Copyright (C) Seven & i Holdings Co., Ltd. All Rights Reserved.
Group Strategy
24
Copyright (C) Seven & i Holdings Co., Ltd. All Rights Reserved.
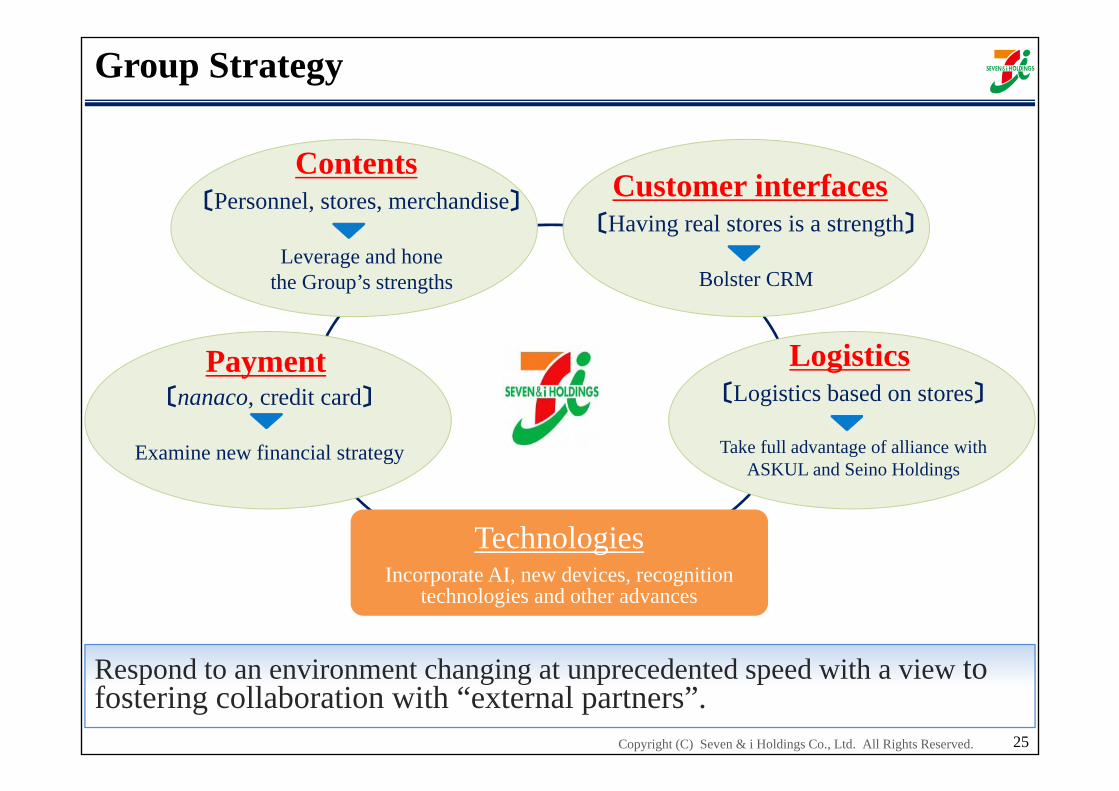
Group Strategy
25
Customer interfaces〔Having real stores is a strength〕
Bolster CRM
Contents〔Personnel, stores, merchandise〕
Leverage and hone the Group’s strengths
Logistics〔Logistics based on stores〕
Take full advantage of alliance with ASKUL and Seino Holdings
TechnologiesIncorporate AI, new devices, recognition
technologies and other advances
Payment〔nanaco, credit card〕
Examine new financial strategy
Respond to an environment changing at unprecedented speed with a view to fostering collaboration with “external partners”.

Copyright (C) Seven & i Holdings Co., Ltd. All Rights Reserved.
This document contains certain statements based on the Company’s current plans, estimates,strategies, and beliefs; all statements that are not historical fact are forward-lookingstatements. These statements represent the judgments and hypotheses of the Company’smanagement based on currently available information. It is possible that the Company’sfuture performance will differ from the contents of these forward-looking statements.Accordingly, there is no assurance that the forward-looking statements in this document willprove to be accurate.