Conservation Sustainability Climate Change One in Five ...
33
Conservation Sustainability Climate Change One in Five Challenge Annual Report 2010/11 2010/11 UK ANNUAL REPORT
Transcript of Conservation Sustainability Climate Change One in Five ...

Conservation Sustainability Climate Change
One in Five ChallengeAnnual Report 2010/11
2010/11UK
ANNUALREPORT


CONTENTS
WWF’S ONE IN FIVE CHALLENGE: INSPIRING POSITIVE CHANGE ........................................... 3 EXECUTIVE SUMMARY ...................................................................................................................... 4
Achievements of the Challengers ................................................................................................. 4 Year 2 performance review ........................................................................................................... 4 Year 3 performance review ............................................................................................................ 5
INTRODUCTION .................................................................................................................................. 6 WWF’s One in Five Challenge ...................................................................................................... 6 Annual report ............................................................................................................................... 6
SECTION 1: THE CHALLENGE MEMBERS ......................................................................................... 7 Employees participating in the Challenge .................................................................................... 7 Flight information ......................................................................................................................... 7 Strategy and benefits of the One in Five Challenge .................................................................... 10
SECTION 2: YEAR 2 PERFORMANCE REVIEW ............................................................................... 12 Employees participating in the Challenge .................................................................................. 12 Flight information ....................................................................................................................... 12 The strategy and achievements of the Challenge members ....................................................... 19
SECTION 3: YEAR 3 PERFORMANCE REVIEW ............................................................................... 21 Employees participating in the Challenge .................................................................................. 21 Flight information ....................................................................................................................... 21 Challenger strategy and achievements ........................................................................................ 27
CONCLUSIONS .....................................................................................................................................30
TABLES AND FIGURES
Table 2.1 Flight expenditure by flight type .......................................................................................... 13 Table 2.2 Number of flights by flight type ........................................................................................... 15 Table 2.3 Flight distance by flight type (km) ....................................................................................... 16 Table 2.4 Flight emissions by flight type (tonnes of CO2) ................................................................... 18 Table 3.1 Flight expenditure by flight type ......................................................................................... 22 Table 3.2 Number of flights by flight type .......................................................................................... 24 Table 3.3 Flight distance by flight type ................................................................................................ 25 Table 3.4 Flight emissions by flight type (tonnes of CO2) ................................................................... 27 Figure 1.1 Challenge members’ flight expenditure ................................................................................ 7 Figure 1.2 Number of flights by Challenge members ........................................................................... 8 Figure 1.3 Flight distance by Challenge members (million km) .......................................................... 9Figure 1.4 Challenge members’ flight emissions (‘000 tonnes of CO 2) ................................................ 9Figure 1.5 Measures the members planned to take in the first year of the scheme ............................ 10Figure 1.6 Benefits expected by the Challenge members .................................................................... 11Figure 2.1 Number of employees participating in the Challenge ........................................................ 12Figure 2.2 Flight expenditure of nine members in the Baseline Year and Year 2 .............................. 13Figure 2.3 Flight expenditure among members by flight type ............................................................ 14Figure 2.4 Number of flights taken by nine members in the first year of the Challenge .................... 14Figure 2.5 Members’ number of flights by flight type ......................................................................... 15Figure 2.6 Distance flown by nine members in the Baseline Year and Year 2 (million km) .............. 16Figure 2.7 Flight distance by flight type (million km) ......................................................................... 17Figure 2.8 Flight emissions of nine members in Baseline Year compared to Year 2 (tonnes of CO2) 17Figure 2.9 Flight emissions by flight type of nine members (tonnes of CO2) ..................................... 18Figure 2.10 Expected versus actual measures taken to meet the Challenge ....................................... 19Figure 2.11 Expected versus actual benefits of participating in the Challenge .................................. 20

2
Figure 3.1 Number of employees participating in the Challenge ........................................................ 21 Figure 3.2 Flight expenditure of five members in the Baseline Year, Year 2 and Year 3 .................. 22 Figure 3.3 Flight expenditure among members by flight type ........................................................... 23 Figure 3.4 Number of flights taken by five members in the Baseline Year, Year 2 and Year 3 ......... 23 Figure 3.5 Members’ number of flights by flight type ........................................................................ 24 Figure 3.6 Distance flown by five members in the Baseline Year, Year 2 and Year 3 (million km) ... 25 Figure 3.7 Flight distance by flight type (million km) ........................................................................ 26 Figure 3.8 Flight emissions of five members in Baseline, Year 2 and Year 3 (tonnes of CO2) .......... 26 Figure 3.9 Flight emissions by flight type of five members (tonnes of CO2) ...................................... 27 Figure 3.10 Expected versus actual measures taken to meet the Challenge ...................................... 28 Figure 3.11 Expected versus actual benefits of participating in the Challenge .................................. 29

3
WWF’s One in Five Challenge: inspiring positive change WWF has a vision for green growth that’s led by progressive companies that can see the many commercial and environmental advantages of lower-carbon business practices. This includes a fundamental rethink of how companies meet and travel in order to do business. In our vision for the future, companies can make the most of expert project teams based around the globe – or, closer to home, across Europe – who are able to work more efficiently and collaboratively, and get products to market faster. But they won’t have to board a plane to do so.
Flying is the most carbon-intensive form of travel, and it’s likely to remain so. But the good news is that, with the growth of excellent high-speed rail networks in Europe and higher-quality conferencing technologies available, companies no longer need to be so heavily reliant on flying to make the connections that help them stay profitable and competitive.
The One in Five Challenge is all about helping business and government to make this transition. By taking the Challenge of cutting their flights by 20% within five years, they have to experiment with new ways of working and staying connected. I’m pleased that these experiments have been successful, as the results of our second annual report so abundantly show.
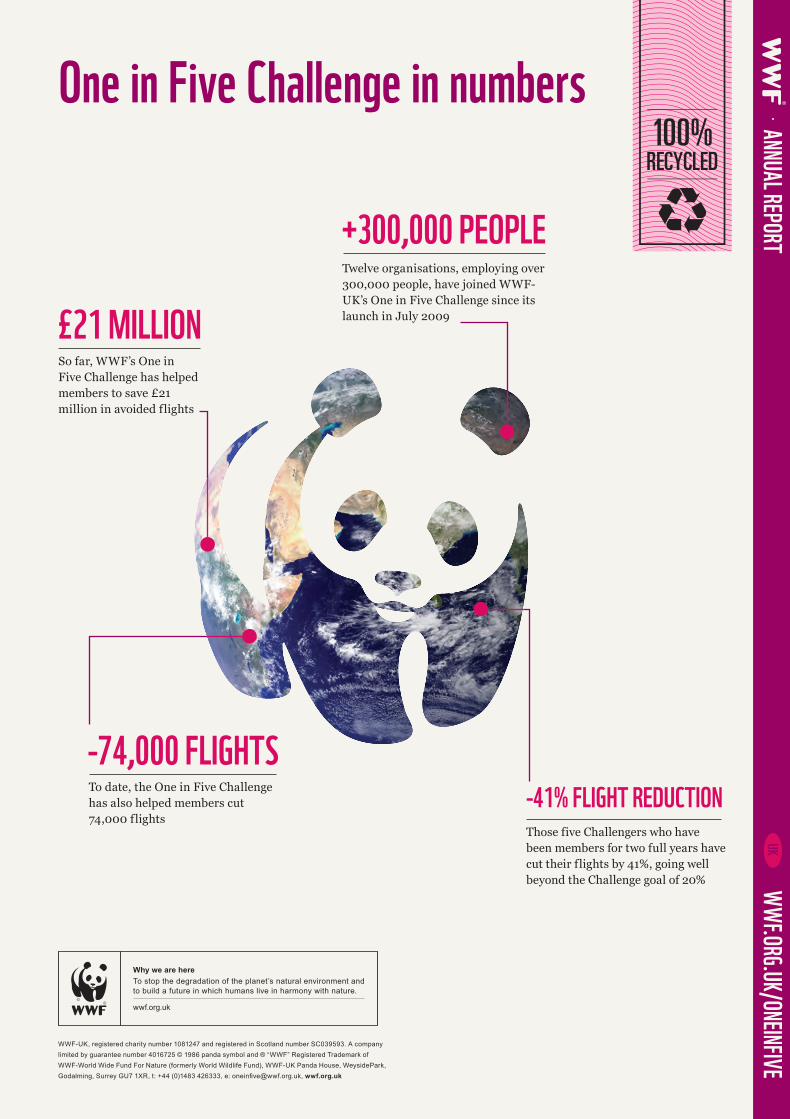
The 12 member organisations that make up the One in Five Challenge include some of the UK’s best-known, leading companies, which are committed to low-carbon leadership. Together they account for over 300,000 employees, and they took over half a million flights a year before they started the Challenge. As this report shows, they now fly significantly less.
One notable success of the year has been Lloyds TSB’s achievement of the One in Five Challenge, reducing its flights by 26% in a single year of membership. It’s pleasing to see that the majority of our members have now met the Challenge and continue to be members in order to reduce their flying further.
Other significant events of the year were our annual workshop, which focused on staff engagement and behaviour change, and the One in Five Challenge’s involvement in the Anywhere Working initiative, launched by the Department for Transport in November 2011 to encourage flexible working and lower-carbon business travel. Case studies from members Vodafone and Scottish Environmental Protection Agency were featured in this initiative and WWF was able to use the lessons from the Challenge to inspire others to reduce their carbon footprint from business travel.
This year’s results show that members are now reducing their long-haul flights significantly, as well as (often easier to cut) domestic and short-haul flights. They’re doing this by increasing their use of video-conferencing more than they expected, as well as using other conferencing technologies. Not only is this resulting in significant cost and carbon savings, but other benefits being reported are faster decision-making and productivity gains due to less time spent out of the office. This means that less flying and more virtual meetings are actually helping companies to work better, faster and more efficiently. And, of course, members are using rail to replace domestic and short-haul flights to many European destinations, helping to cut both flights and corporate carbon emissions.
At a time when there are loud voices telling us that we need more airport expansion in order to fuel economic growth, the experience of the One in Five Challengers tells a different story – one that relies on flying less, not more, in order to be successful. Our two-year members have been able to cut their flights by an astounding 41%. It should be possible for many other companies to achieve these kinds of results. All it takes is commitment to make the change. As our members show, the benefits are well worth it.
David Nussbaum, Chief Executive, WWF-UK

4
E x e c u t i v e s u m m a r y Twelve companies and organisations have joined WWF-UK’s One in Five Challenge since its launch in July 2009. We’re delighted to welcome Balfour Beatty and Lloyds TSB to the Challenge this year, joining the Challenge community of BSkyB, BT, Capgemini, Marks & Spencer, Microsoft, Scottish Environmental Protection Agency, Scottish Government, Skanska, Vodafone UK and WWF-UK. The Challenge community has committed to cut 20% of its business flights within five years and achieve a reduction in emissions.
This is our second One in Five Challenge annual report. It provides information on:
• Challenge members’ Baseline Year flight data; how the members are planning to achieve flights reductions; and the business benefits they expect to realise;
• year-on-year performance of organisations that have had their Baseline Year and Year 2 annual survey (first-year results) audited and approved by JMP Consultants Ltd;
• year-on-year performance of organisations that have had their Baseline Year and Year 3 annual survey (second-year results) audited and approved by JMP Consultants Ltd; and
• cumulative results achieved so far over two years, as a result of taking the Challenge.
Please note that there are more Challengers included in Year 2 than in Year 3 results. This is because member organisations have started the Challenge at different times and not all organisations have yet had two full years on the programme. A few organisations have not yet submitted their Year 2 results.
Achievements of the Challengers
In the Baseline Year (the starting point for the One in Five Challenge, which can be backdated by up to three years), the 12 members of the Challenge, representing over 335,000 employees, spent £98 million on business flights and took 521,000 flights, with emissions of 152,000 tonnes of CO2.
The Challenge community expected to achieve a number of benefits from participating in the Challenge. The most common of these were reduced travel expenditure, a better work-life balance for employees, a reduction in their organisation’s carbon footprint, the ability to question the need for travel, and raised awareness of carbon emissions from flights.
Year 2 performance review
Nine organisations have now submitted their Baseline and Year 2 annual surveys. These nine:
• Spent £83 million on flights in their Baseline Year. In their first year of submitting flight data, these nine Challengers reduced expenditure by £14 million, a decrease of 17%. That’s an average of £1.5 million saved for each Challenger.
• Reported a total of 221,000 flights in the Baseline Year. Year 2 data shows a decrease in flights of 41,000 (19%) to 179,000 flights, an average decrease of 4,500 flights for each Challenger.
• Flew 484 million km in the Baseline Year. In Year 2 they had reduced the distance flown by 41 million km (8%) to 443 million km. On average that’s a reduction of 4.5 million km per Challenger.
• Reported CO2 emissions of 131,000 tonnes in the Baseline Year. In Year 2 they had reduced emissions by 14,000 tonnes (10%) to 118,000 tonnes, an average decrease of 1,500 tonnes each.

5
Year 2 Challengers had predicted that by participating in the Challenge they would reduce their expenditure on travel, reduce their organisation’s carbon footprint and achieve a better work-life balance for employees. As well as realising these business benefits, Year 2 Challengers experienced greater than expected benefits including increased collaboration and faster decision-making.
Year 3 performance review
Five organisations submitted their Baseline, Year 2 and Year 3 annual surveys. These five:
• Spent £28 million on flights in their Baseline Year. After two years of the Challenge, these five Challengers reduced expenditure by £12 million, a decrease of 43%. That’s an average of £2.4 million saved for each Challenger.
• Reported a total of 141,000 flights in the Baseline Year. In Year 3 they had decreased flights by 58,000 (41%) to 83,000 flights, an average decrease of 11,600 flights each.
• Flew 184 million km in the Baseline Year. In Year 3 they had reduced the distance flown by 70 million km (38%) to 114 million km. On average that’s a reduction of 14 million km per Challenger.
• Reported CO2 emissions of 47,000 tonnes in the Baseline Year. After two years they had reduced emissions by 18,000 tonnes (38%) to 29,000 tonnes, an average decrease of 3,600 tonnes for each Challenger.
Year 3 Challengers had predicted that by participating in the Challenge they would reduce expenditure on travel, reduce their organisation’s carbon footprint and improve work-life balance for employees. By Year 3 of the Challenge, the five organisations had experienced these expected benefits as well as several greater than expected benefits: less time spent out of the office, faster decision-making, productivity gains, and increased collaboration with colleagues, clients and suppliers.
Cumulatively, over the past two years, the results show that WWF’s One in Five Challenge has so far helped companies to:
• cut 73,848 flights
• save £21 million in avoided flights
• fly 92 million fewer kilometres
• reduce their emissions by 26,455 tonnes of CO2.
These are impressive achievements. They show that businesses are achieving substantial commercial and environmental benefits from belonging to the Challenge. These results also demonstrate that it’s possible to change business travel behaviour and find new ways of working to stay connected that will reduce reliance on business flights and make organisations more resilient in a carbon-constrained future.

6
I n t r o d u c t i o n WWF’s One in Five Challenge
The One in Five Challenge is WWF-UK’s guided programme and award scheme which suggests practical ways that companies and organisations can reduce the number of business flights they take, and lower-carbon ways of staying connected.
Members commit to cut 20% of their business flights within five years. They must also achieve a reduction in their carbon emissions from flying. Companies and organisations that successfully meet the Challenge receive a specially-designed Panda logo and WWF-UK’s public recognition.
Annual report
This is our second One in Five Challenge annual report. It’s divided into three main sections:
• Section 1 provides an update on the members of the One in Five Challenge. It includes the number of employees participating in the Challenge, and information on flight expenditure, number of flights, distance flown and emissions. It also explores the flight reduction measures that Challengers were planning to introduce and the expected business benefits of reducing numbers of flights.
• Section 2 reviews the performance of the nine Challengers that have had their Baseline survey and Year 2 annual survey audited and approved by JMP Consultants Ltd. The section presents a review of members’ business flight data and provides an overview of the measures that they’ve adopted in order to reduce flights and the business benefits that have been realised as a result.
• Section 3 reviews the performance of the five Challengers that have had their Baseline survey, Year 2 and Year 3 annual surveys audited and approved by JMP Consultants Ltd.
To preserve the data anonymity for the One in Five Challengers, all data has been reported in aggregate rather than by organisation.1
1 Challengers have calculated emissions from flights using a number of methodologies. To measure performance on a like-for-like basis we have applied a control metric. The control metric is based on the Department of Environment, Food and Rural Affairs (Defra)’s ‘Guidelines to Defra’s Greenhouse Gas Conversion Factors’, Annexes updated in June 2008. For further information, please visit www.defra.gov.uk/environment/business/reporting/older-ghg-conversion-factors.htm The control metric has been applied to flight distance information supplied by Challengers and uses average UK domestic, short-haul and long-haul emissions factors. It includes an additional kilometre uplift of 9% to account for non-direct flight routes and delays or circling during landing, and a multiplier of 1.9 to account for the non-CO2 global warming effects of aviation emissions.

7
S e c t i o n 1 : T h e C h a l l e n g e m e m b e r s This section presents a summary of the Baseline Year surveys for the members of the One in Five Challenge.
Employees participating in the Challenge
There are over 335,000 employees from 12 companies and organisations participating in the One in Five Challenge.
Flight information
The members provided information on flight numbers, expenditure, distance travelled and carbon emissions. This was broken down by the type of flight (i.e. whether the flight was domestic, short-haul or long-haul2).
The Challenge members spent £98 million on business flights in the Baseline Year. As shown in Figure 1.1, this may be split into the following costs by flight type:
• £43.6 million on domestic flights
• £39.8 million on long-haul flights
• £14.8 million on short-haul flights.
Figure 1.1 Challenge members’ flight expenditure
2 Domestic flights are between UK airports; short-haul international flights are typically to Europe (up to 3,700km distance); and long-haul international flights are typically to non-European destinations (or all other international flights over 3,700km distance) – Guidelines to Defra/DECC’s Greenhouse Gas Conversion Factors for Company Reporting (2008).

8
Participants reported a total of 521,000 flights in the Baseline Year. As shown in Figure 1.2, this may be split into the following number of flights by flight type:
• 385,000 domestic flights
• 47,000 long-haul flights
• 89,000 short-haul flights.
Figure 1.2 Number of flights by Challenge members
Members reported a total flying distance of 566 million km in the Baseline Year. Figure 1.3 shows this may be split into the following distances by flight type:
• 183 million km on domestic flights
• 290 million km on long-haul flights
• 92 million km on short-haul flights.

9
Figure 1.3 Flight distance by Challenge members (million km)
The members reported 152,000 tonnes of CO2 in the Baseline Year. Figure 1.4 shows this split into the following figures by flight type:
• 66,000 tonnes for domestic flights
• 66,000 tonnes for long-haul flights
• 19,000 tonnes for short-haul flights.
Figure 1.4 Challenge members’ flight emissions (tonnes of CO2)
Figure 1.4 Challenge members’ flight emissions (‘000 tonnes of CO2)
Figure 2.6 Distance flown by nine members in the Baseline Year and Year 2 (million
km)

10
Strategy and benefits of the One in Five Challenge
This section describes the measures identified by the Challenge members and the benefits they expect to realise from flying less on business.
Meeting the Challenge
Challenge members expected to implement a number of measures to reduce their business flights. Figure 1.5 shows the measures they planned to take to reduce their dependence on business flights.
The most common measures include “questioning the need for travel” and “raising awareness of carbon emissions from flights”. Other common measures include “identifying staff travel profiles”, “setting targets”, “including flights in corporate carbon reporting” and “increasing the use of video-conferencing”.
Figure 1.5 Measures the members planned to take in the first year of the scheme
Benefits of the Challenge
We asked the Challenge members to explain what business benefits they expected to realise from reducing their business flights. Figure 1.6 shows their responses.
The most common expected benefits included “reduced travel expenditure”, “reduction of [their] organisation’s carbon footprint” and “better work-life balance for employees”.

11
Figure 1.6 Benefits expected by the Challenge members

12
Section 2: Year 2 performance review
As of May 2012, nine members have had their Baseline and Year 2 annual surveys audited and approved by JMP Consultants Ltd. This section provides an overview of the collective performance of these nine organisations.
Employees participating in the Challenge
The nine organisations employed 233,000 people in the Baseline Year. Figure 2.1 below shows the number of staff participating in the Challenge among these nine members has decreased slightly (by 4%) between the Baseline and Year 2, owing to staff changes.
Figure 2.1 Number of employees participating in the Challenge
Flight information
The nine organisations spent £83 million on flights in their Baseline Year. After a year of participating in the Challenge they had reduced expenditure by £14 million, a cut of 17%. This is shown in Figure 2.2.

13
Figure 2.2 Flight expenditure of nine members in the Baseline Year and Year 2
Table 2.1 and Figure 2.3 show how the organisations’ expenditure on flights fell between the Baseline Year and Year 2, by flight type. Expenditure on domestic flights fell the most.
Table 2.1 Flight expenditure by flight type
Baseline Year Year 2 Percentage change
Domestic £39,611,265 £31,778,660 -20%
Long-haul £30,512,915 £26,600,135 -13%
Short-haul £12,995,305 £10,516,470 -19%
Total £83,119,485 £68,895,265 -17%

14
Figure 2.3 Flight expenditure among members by flight type
Number of flights
The nine organisations reported a total of 221,000 flights in the Baseline Year. Year 2 data shows a decrease in flights of 41,000 (19%) to 179,000 flights. This is shown in Figure 2.4 below.
Figure 2.4 Number of flights taken by nine members in the first year of the Challenge

15
Table 2.2 and Figure 2.5 show how the nine organisations reduced the number of flights they took, between the Baseline and Year 2, by flight type. Members take more domestic flights than any other type of flight, and have cut these more in terms of numbers. However, they’ve cut long-haul flights by a higher percentage.
Table 2.2 Number of flights by flight type
Baseline Year Year 2 Percentage change
Domestic 105,597 85,805 -19%
Long-haul 34,441 27,197 -21%
Short-haul 80,789 66,426 -18%
Total 220,827 179,428 -19%
Figure 2.5 Members’ number of flights by flight type

16
Flight distance
The nine organisations flew 484 million km in the Baseline Year. In Year 2 they had reduced this distance by 41 million km to 443 million km. This is shown in Figure 2.6 below.
Figure 2.6 Distance flown by nine members in the Baseline Year and Year 2 (million km)
Table 2.3 and Figure 2.7 provide a breakdown of the reductions the members made in flight distances between the Baseline and Year 2, by flight type. They show that members have reduced domestic and short-haul distances, while long-haul distances increased slightly.
Table 2.3 Flight distance by flight type (km)
Baseline Year Year 2 Percentage change
Domestic 168,417,752 133,593,105 -21%
Long-haul 234,031,741 241,285,951 +3%
Short-haul 81,658,139 68,125,699 -17%
Total 484,107,632 443,004,755 -8%

17
Figure 2.7 Flight distance by flight type (million km)
Flight emissions
The nine organisations reported a cut in emissions from flying of 14,000 tonnes of CO2 between the Baseline and Year 2. That’s a 10% reduction – from 131,000 tonnes to 118,000 tonnes.
Figure 2.8 Flight emissions of nine members in Baseline compared to Year 2 (tonnes of CO2)

18
Table 2.4 and Figure 2.9 provide a breakdown of the cuts in flights emissions achieved by the nine organisations between the Baseline and Year 2, by flight type. Both domestic and short-haul emissions were substantially reduced, whereas long-haul emissions increased slightly.
Table 2.4 Flight emissions by flight type (tonnes of CO2)
Baseline Year Year 2 Percentage change
Domestic 61,143 48,500 -21%
Long-haul 53,606 55,267 +3%
Short-haul 16,624 13,869 -17%
Total 131,373 117,637 -10%
Figure 2.9 Flight emissions by flight type of nine members (tonnes of CO2)
Summary
The nine organisations saved £14 million in avoided flights in the first year of the Challenge. They cut their number of flights by 19%, with the greatest reduction being in the number of domestic flights. They reduced the total distance flown by 41 million km (8%), and their carbon emissions from flying by 14,000 tonnes (10%).

19
The strategy and achievements of the Challenge members
We asked the nine organisations to provide information on the measures they’d introduced to reduce their use of business flights. This section describes these measures, and the benefits that the nine have experienced from flying less on business.
Meeting the Challenge
The nine Challengers planned to take a number of approaches to reducing their dependence on business flying. Figure 2.10 shows the measures that they expected to implement a ‘great deal’ in order the meet their flight reduction targets.
The chart shows the most common measures reported in the Baseline were “raising awareness of emissions from flights”, “questioning the need for travel”, and “setting targets”.
In Year 2, the chart shows the most common measures actually taken were “setting targets”, “replacing flights with rail travel”, “questioning the need for travel” and “including flights in corporate carbon reporting”. Companies have used rail travel to replace flights far more than they expected to, in order to meet the Challenge. They’ve also done far less to raise awareness of carbon emissions from flights than they expected to.
Figure 2.10 Expected versus actual measures taken to meet the Challenge

20
Benefits of the Challenge
The nine Challengers were asked in the Baseline to explain what business benefits they were expecting from flying less.
The most common expected benefit was “reduced travel expenditure”. Other common expected benefits included “reduction of the organisation’s carbon footprint” and “better work-life balance for employees”. Figure 2.11 shows the Challenger’s responses.
Some of the less common expected benefits included “enhanced image and reputation”, “reduced accommodation and associated expenditure”, “less time spent out of the office”, “increased collaboration with colleagues, clients and suppliers”, and “improved staff safety”. Challengers did not expect to benefit from “faster decision-making” or “productivity gains”.
In Year 2, Challengers were asked if these benefits had been realised. As predicted, the most common benefit experienced was “reduced travel expenditure” and the other realised benefits generally mirrored those that Challengers expected. More Challengers, however, benefited from “increased collaboration with colleagues, clients and suppliers” than they had initially predicted. One Challenger benefited from “faster decision-making”, which had not been predicted in the Baseline.
Figure 2.11 Expected versus actual benefits of participating in the Challenge

21
Section 3: Year 3 performance review As of May 2012, five members have had their Baseline, Year 2 and Year 3 annual surveys audited and approved by JMP Consultants Ltd. This section provides an overview of the collective performance of these five organisations.
Employees participating in the Challenge
The five organisations employed 116,000 people in the Baseline Year (Year 1). Figure 3.1 below shows that the number of staff participating in the Challenge among these five members has decreased by 10% between the Baseline and Year 3, owing to staff changes.
Figure 3.12 Number of employees participating in the Challenge
Flight information
The five organisations spent £28 million on flights in their Baseline Year. After two years of participating in the Challenge they’d reduced this expenditure by £12 million, a cut of 43%. This is shown in Figure 3.2.

22
Figure 3.2 Flight expenditure of five members in the Baseline Year, Year 2 and Year 3
Table 3.1 and Figure 3.3 show how the organisations’ expenditure on flights fell between the Baseline Year and Year 3, by flight type. Expenditure on long-haul flights has fallen the most in absolute terms, but short-haul expenditure has fallen more in percentage terms.
Table 3.1 Flight expenditure by flight type
Baseline Year Year 2 Year 3 Percentage change
Domestic £11,906,465 £10,709,412 £8,185,352 -31%
Long-haul £11,434,054 £8,900,798 £5,774,875 -49%
Short-haul £5,114,906 £3,751,792 £2,391,316 -53%
Total £28,455,425 £23,362,002 £16,351,543 -43%

23
Figure 3.3 Flight expenditure among members by flight type
Number of flights
The five organisations reported a total of 141,000 flights in the Baseline Year. Year 3 data shows a decrease in flights of 58,000 (41%) to 83,000 flights. This is shown in Figure 3.4 below.
Figure 3.4 Number of flights taken by five members in the Baseline Year, Year 2 and Year 3

24
Table 3.2 and Figure 3.5 show how the five organisations reduced the number of flights they took, between the Baseline and Year 3, by flight type. Members are still cutting the number of domestic flights more than any other type, but second-year results also show significant reductions in long-haul flights in percentage terms.
Table 3.2 Number of flights by flight type
Baseline Year Year 2 Year 3 Percentage change
Domestic 90,452 74,250 53,013 -41%
Long-haul 15,332 13,229 10,679 -30%
Short-haul 35,230 27,829 19,167 -46%
Total 141,014 115,308 82,859 -41%
Figure 3.5 Members’ number of flights by flight type
Flight distance
The five organisations flew 184 million km in the Baseline Year. By Year 3 they’d reduced this distance by 70 million km to 114 million km. This is shown in Figure 3.6.

25
Figure 3.6 Distance flown by five members in the Baseline Year, Year 2 and Year 3 (million km)
Table 3.3 and Figure 3.7 provide a breakdown of the reductions the members made in flight distances between the Baseline and Year 3, by flight type. Members have been able to reduce the distance flown from long-haul flights the most, though there is a higher percentage change for short-haul flights.
Table 3.3 Flight distance by flight type (km)
Baseline Year Year 2 Year 3 Percentage change
Domestic 44,434,743 35,388,194 25,418,185 - 43%
Long-haul 103,546,610 102,506,178 71,868,347 - 31%
Short-haul 35,999,590 26,902,672 16,677,677 - 54%
Total 183,980,943 164,797,044 113,964,209 - 38%

26
Figure 3.7 Flight distance by flight type (million km)
Flight emissions
The five organisations reported a cut in emissions from flying of 18,000 tonnes of CO2 between the Baseline and Year 3. That’s a 38% reduction – from 47,000 tonnes to 29,000 tonnes.
Figure 3.8 Flight emissions of five members in Baseline, Year 2 and Year 3 (tonnes CO2)

27
Table 3.4 and Figure 3.9 provide a breakdown of the cuts in flights emissions achieved by the five organisations between the Baseline and Year 3, by flight type. Members have saved more carbon from avoided long-haul flights than other types, even though short-haul flights show the highest percentage reduction.
Table 3.4 Flight emissions by flight type (tonnes of CO2)
Baseline Year Year 2 Year 3 Percentage change
Domestic 16,132 12,848 9,228 - 43%
Long-haul 23,718 23,479 16,462 - 31%
Short-haul 7,329 5,477 3,395 - 54%
Total 47,178 41,804 29,085 - 38%
Figure 3.9 Flight emissions by flight type of five members (tonnes of CO2)
Summary
The five organisations saved £12 million in avoided flights in the second year of the Challenge. They cut their number of flights by 41%, with the greatest reduction continuing to be on domestic flights. However, they also significantly reduced long-haul flying. They reduced the total distance flown by 70 million km (38%), and their carbon emissions from flying by 18,000 tonnes (38%).
Challenger strategy and achievements
We asked the five organisations to provide information on the measures they’d introduced to reduce their use of business flights. This section describes these measures, and the benefits that the five have experienced from flying less on business.

28
Meeting the Challenge
The five Challengers planned to take a number of approaches to reducing their dependence on business flying. Figure 3.10 shows the measures that they expected to implement a ‘great deal’ in order to meet their flight reduction targets each year.
The chart shows that the most common measures they expected to implement (as reported in the Baseline Year) were “setting targets”, “questioning the need for travel”, and “raising awareness of emissions from flights”. Other common measures included “including flights in corporate carbon reporting”, “increasing the use of video-conferencing”, “targeting particular travel routes”, and “identifying staff travel profiles”.
In Year 2, the chart shows the most common measures actually used to be “setting targets”, “including flights in corporate carbon reporting” and “questioning the need for travel”. In addition, “raising awareness of carbon emissions from flights” was a common measure taken despite fewer Challengers having actually done so than initially expected.
In Year 3, actual measures taken were more evenly spread. Common measures included “setting targets”, “questioning the need for travel”, “raising awareness of carbon emissions from flights”, “including flights in corporate carbon reporting”, “increasing the use of video-conferencing”, “replacing flights with rail travel”, and “increasing the use of audio-conferencing”.
More Challengers than originally expected have replaced flights with rail travel and increased their use of audio-conferencing in Year 3.
Figure 3.10 Expected versus actual measures taken to meet the Challenge

29
Benefits of the Challenge
The five Challengers were asked in the Baseline Year to explain what business benefits they were expecting from flying less.
The most common expected benefit was “reduced travel expenditure”. Other common expected benefits included “reduction of the organisation’s carbon footprint” and “better work-life balance for employees”. Figure 3.11 shows the Challengers’ responses.
In Year 2, Challengers were asked if these benefits had been realised. As predicted, the most common benefits experienced were “reduced travel expenditure” and “reduction of the organisation’s carbon footprint”. More Challengers, however, benefited from “enhanced image and reputation” than they’d initially predicted.
In Year 3, Challengers were again asked what benefits had been realised. “Less time spent out of the office” was seen as the greatest benefit in Year 3 – far more than expected. A wide range of other benefits were experienced, including “reduced travel expenditure”, “reduction of the organisation’s carbon footprint”, and “better work-life balance for employees”, although fewer members mentioned these benefits than originally expected. “Faster decision-making” and “enhanced image and reputation of the organisation” were greater than originally expected benefits and, for the first time, “productivity gains” and “increased collaboration with colleagues, clients and suppliers” were noted.
Figure 3.11 Expected versus actual benefits of participating in the Challenge

30
C o n c l u s i o n s The One in Five Challenge now represents over 335,000 employees from 12 organisations, committed to cutting 20% of their business flights within five years.
Members are continuing to take steps to meet the Challenge, including questioning the need to travel, setting flight reduction targets, raising awareness of carbon emissions from flying, replacing flights with rail travel, and including flights in corporate carbon reporting. Those members completing their second year of the Challenge (Year 3) are implementing a wider range of measures to help achieve a 20% reduction in business flights, including a substantial reduction in long-haul flights, by increasing the use of video- and audio-conferencing.
Challengers that have completed their first year (Year 2) have saved on average £1.5 million while, overall, reducing their flights by 19%. Challengers that have now completed the second year (Year 3) have saved on average £2.4 million, while reducing their total flights by 41%. These figures show the Challenge continues to yield significant cost savings from a reduction in flying.
Cumulatively, over the past two years, the Challenge has so far resulted in companies cutting a total of 73,848 flights, saving £21 million in avoided flights, flying 92 million fewer kilometres and reducing their emissions by 26,455 tonnes of CO2.
Challenge members have also realised a number of other benefits from flying less. In last year’s annual report, we noted that Challengers had benefited from improvements in work-life balance for their employees and benefits to their image and reputation. This year’s annual report sees a continuation of these and other benefits, with Challengers completing their second full year in the scheme also noting (for the first time) productivity gains and increased collaboration with colleagues, clients and suppliers.
We’ll continue to issue an annual report to record the achievements of challenge members for each of the five years WWF-UK is running the Challenge. The One in Five Challenge continues to be open to new members. For further information about joining the Challenge, please contact [email protected]
+300,000 PEOPLE
£21 MILLION
-74,000 FLIGHTS-41% FLIGHT REDUCTION
One in Five Challenge in numbersWWF.ORG.UK/ONEINFIVE
• ANNUAL REPORT UK
Why we are here
wwf.org.uk
To stop the degradation of the planet’s natural environment andto build a future in which humans live in harmony with nature.
100%RECYCLED