Consequences of Voluntary
43
Copyright © 2008 by Karl A. Muller, III, Edward J. Riedl, and Thorsten Sellhorn Working papers are in draft form. This working paper is distributed for purposes of comment and discussion only. It may not be reproduced without permission of the copyright holder. Copies of working papers are available from the author. Consequences of Voluntary and Mandatory Fair Value Accounting: Evidence Surrounding IFRS Adoption in the EU Real Estate Industry Karl A. Muller, III Edward J. Riedl Thorsten Sellhorn Working Paper 09-033
-
Upload
muammar-prawira-siregar -
Category
Documents
-
view
10 -
download
0
description
Consequences of Voluntary
Transcript of Consequences of Voluntary

Copyright © 2008 by Karl A. Muller, III, Edward J. Riedl, and Thorsten Sellhorn
Working papers are in draft form. This working paper is distributed for purposes of comment and discussion only. It may not be reproduced without permission of the copyright holder. Copies of working papers are available from the author.
Consequences of Voluntary and Mandatory Fair Value Accounting: Evidence Surrounding IFRS Adoption in the EU Real Estate Industry Karl A. Muller, III Edward J. Riedl Thorsten Sellhorn
Working Paper
09-033

Consequences of Voluntary and Mandatory Fair Value Accounting: Evidence Surrounding IFRS Adoption in the EU Real Estate Industry
Karl A. Muller, III Pennsylvania State University
Edward J. Riedl
Harvard Business School*
Thorsten Sellhorn Ruhr-Universität Bochum
ABSTRACT: We examine the causes and consequences of European real estate firms’ decisions to provide investment property fair values prior to the required disclosure of this information under International Financial Reporting Standards (IFRS). We find evidence that investor demand for fair value information—reflected in more dispersed ownership—and a firm’s commitment to transparency increase the likelihood of providing fair values prior to their required provision under International Accounting Standard 40 – Investment Property. We also find that firms not providing these fair values face higher information asymmetry. However, we fail to find that the relatively higher information asymmetry was reduced following mandatory adoption of IFRS. Rather, we find that differences in information asymmetry largely remain. Taken together, this evidence suggests that common adoption of fair value accounting due to the mandatory adoption of IFRS does not necessarily level the informational playing field. Key Terms: Fair value, disclosure, IFRS, information asymmetry Data availability: The data used in this study are available from commercial providers (Thomson Financial Datastream and Worldscope) as well as public sources. Current Date: August 2008 Acknowledgements: We appreciate useful discussion and data assistance from the following persons and their affiliated institutions: Hans Grönloh and Laurens te Beek of EPRA; Simon Mallinson of IPD; and Michael Grupe and George Yungmann of NAREIT. We also thank Francois Brochet, Fabrizio Ferri, Christopher Hossfeld, Erlend Kvaal, Christopher Nobes, Bill Rees, Holly Skaife, and seminar participants at Boston College, Boston University, ESCP-EAP Berlin, Harvard Business School, Ruhr-Universität Bochum, Universität Göttingen, Universität Osnabrück, WHU – Otto Beisheim School of Management, the AAA 2008 Annual Meetings in Anaheim, and the EAA Annual Congress 2008 in Rotterdam for helpful comments. Finally, we thank Susanna Kim and Erika Richardson for research assistance, and James Zeitler for data assistance. Muller acknowledges financial support from the Smeal Faculty Fellowship for 2007-2008. Sellhorn acknowledges financial support from the German Research Foundation (Deutsche Forschungsgemeinschaft—DFG) for 2007. * Corresponding author: Harvard Business School, Morgan Hall 365, Boston, MA 02163 Phone: 617.495.6368, Fax: 617.496.7363, Email: [email protected]

Consequences of Voluntary and Mandatory Fair Value Accounting: Evidence Surrounding IFRS Adoption in the EU Real Estate Industry
ABSTRACT: We examine the causes and consequences of European real estate firms’ decisions to provide investment property fair values prior to the required disclosure of this information under International Financial Reporting Standards (IFRS). We find evidence that investor demand for fair value information—reflected in more dispersed ownership—and a firm’s commitment to transparency increase the likelihood of providing fair values prior to their required provision under International Accounting Standard 40 – Investment Property. We also find that firms not providing these fair values face higher information asymmetry. However, we fail to find that the relatively higher information asymmetry was reduced following mandatory adoption of IFRS. Rather, we find that differences in information asymmetry largely remain. Taken together, this evidence suggests that common adoption of fair value accounting due to the mandatory adoption of IFRS does not necessarily level the informational playing field. Key Terms: Fair value, disclosure, IFRS, information asymmetry

I. INTRODUCTION
The required adoption of International Financial Reporting Standards (IFRS) in the
European Union (EU) effective January 1, 2005 resulted in a number of significant changes in
how firms report their financial results. Mandatory IFRS adoption has been criticized for both
the flexibility afforded under the standards and the encroachment of the fair value paradigm.
Specifically, common accounting standards alone may not be sufficient to provide the benefits of
common accounting practices. The convergence of accounting practices requires effective
implementation and enforcement of accounting standards (e.g., Ball 1995, 2006; Ball et al. 2003;
Burgstahler et al. 2006; Daske et al. 2007a, 2007b).
This study investigates whether diversity in the choice of fair value information in the
European investment property industry prior to the mandatory adoption of International
Accounting Standard 40 – Investment Property (IAS 40) resulted in information asymmetry
differences across firms, and whether mandatory adoption of IAS 40 mitigated such differences.
Prior to the mandatory adoption of IAS 40, investment property firms varied considerably in
their reporting of this asset, from fair value recognition on the balance sheet, to historical cost on
the balance sheet with fair value disclosure in the footnotes, to non-disclosure of fair values.
Upon adoption of IAS 40, public firms in the EU ceased application of domestic accounting
standards in their consolidated accounts, and instead were required to recognize or disclose the
fair value of their investment property.
The setting represents a rare opportunity to investigate the information asymmetry effects
surrounding the voluntary and mandatory adoption of fair value information for firms whose
primary operating asset is involved.1 As the voluntary adoption of accounting standards arises
1 On average, investment property represents over 78% of our sample firms’ assets.

2
endogenously, we investigate if EU investment property firms voluntarily provide fair value
information when the demand for such information is greatest. We also investigate if the
reporting of these fair values results in relatively lower information asymmetry, as indicated by
firms’ bid-ask spreads. In addition, we investigate if the mandatory adoption of fair value
reporting under IFRS by firms not previously reporting fair values results in lower information
asymmetry, or whether previously found differences in information asymmetry persist because
of implementation and enforcement differences.
Using a sample of continental-European investment property firms in the period prior to
mandatory IFRS adoption, we find that firms not disclosing fair value information come from
countries with weaker legal protection, weaker enforcement and higher corruption.2 We then
examine the determinants of firms’ choices to provide fair value information in the period prior
to mandatory IFRS adoption, finding that firms with concentrated ownership are less likely to
provide investment property fair values prior to IFRS. This evidence is consistent with such
firms enjoying relatively fewer benefits through the reporting of fair value information. In
addition, firms exhibiting other commitments to reporting transparency (such as membership in a
lead industry group that endorses fair value reporting) are more likely to provide fair values prior
to IFRS.
Our last set of tests examines information asymmetry differences across firms providing
and not providing fair value information. In the period prior to IAS 40, we find that firms
providing investment property fair values have relatively lower information asymmetry, as
indicated by relatively lower bid-ask spreads. This evidence is consistent with the provision of
fair values for this asset reducing information asymmetry, and thus lowering firms’ cost of
2 Given the vast differences in the size and development of the UK property market and the sophistication of the
UK appraisal profession relative to other EU countries, we focus our analysis on continental-European investment property firms.
3
capital. During the time period surrounding the switch to the mandated IFRS regime, we fail to
find evidence of reduced information asymmetry for firms previously not providing investment
property fair values. Rather, we find evidence that the shift to IAS 40 did not eliminate
previously documented differences in information asymmetry, as firms which did not provide
investment property fair values prior to IFRS continue to have higher bid-ask spreads in the post-
IFRS adoption period. This is consistent with investors having concerns regarding the
implementation of IAS 40 and the reported fair values even after IFRS is adopted.
We note that our results may be subject to a number of limitations. First, while the
importance of fair value information in this industry appears of importance to market
participants, the number of firms in our analyses is small given our focus on one industry. In
addition, given that we examine one type of long-lived tangible asset, our findings may not
generalize to other fair value settings. Finally, as we examine the year following the mandatory
adoption of IFRS, information differences observed in the post period may not persist in the
long-term, especially as countries and firms improve their implementation and enforcement of
accounting standards.
Our paper adds to the literature in several ways. First, we contribute to the literature on
accounting choice (e.g., Fields et al. 2001) by documenting determinants of firms’ decisions
related to fair value reporting for their primary asset class. Second, we build on the literature
examining fair values (e.g., Easton et al. 1993) and the consequences of disclosure (e.g., Healy
and Palepu 2001) by documenting that firms voluntarily providing fair values are perceived to
have lower information asymmetry. Finally, we contribute to the literature on the mandatory
adoption of IFRS (e.g., Daske et al. 2007b) by documenting that required provision of fair values
under mandated IFRS adoption is not sufficient to overcome prior informational differences

4
associated with non-disclosure of these values; rather, these informational differences persist,
suggesting investors perceive differences in IFRS implementation. Overall, our results may help
standard-setters and practitioners understand the characteristics and circumstances affecting
firms’ decisions involving fair value measures. In addition, our results contribute both to the
general debate on fair value accounting (e.g., Watts 2006), as well as the specific debate on
converging U.S. standards with international standards, particularly within the real estate
industry (NAREIT 2008), by revealing the occurrence, causes, and consequences of variation in
firms’ reporting choices.3
The remainder of this paper is organized as follows. Section 2 provides background
information and hypothesis development. Section 3 presents our sample selection and
descriptive statistics. Section 4 presents our research design and empirical results. Section 5
presents sensitivity analyses. Section 6 concludes.
II. BACKGROUND
The European Investment Property Industry
The investment property industry in Europe comprises approximately 180 publicly-traded
firms, with an aggregate equity market value of over €150 billion at December 31, 2005. While
most European countries have publicly-traded investment property companies, the three largest
economies (France, Germany, and the UK) are home to more than half of investment property
firms. Further, the UK has the largest number of firms, likely reflecting both the greater
emphasis on equity markets in the UK relative to continental-European countries, as well as the
3 US real estate investment trusts (or REITs), which are analogous to the investment property firms we examine,
currently are required to report using historical cost under US generally accepted accounting principles (GAAP), with few voluntarily disclosing fair values of real estate assets. However, convergence activities between US and international standard setters indicate that the US requirement for historical cost will have to be merged with the international requirement to recognize or disclose investment property fair values (see Phase Two of the Fair Value Option project: FASB 2007, http://www.fasb.org/project/fv_option.shtml).
5
relatively advanced institutional features of the UK property market (e.g., Dietrich et al. 2001;
Muller and Riedl 2002; Riedl 2005).
The business model of our sample firms involves obtaining (either through purchase,
lease, or development), managing, and selling real estate in order to generate profits through
rentals and/or capital appreciation. Typically, these firms either acquire legal ownership of the
property through a purchase, or hold the property under a finance lease. While a firm may invest
in any country, the majority maintains holdings concentrated within the firm’s country of
domicile. Finally, many investment property firms voluntarily belong to the European Public
Real Estate Association (EPRA), the lead industry group established to provide a forum for,
among other things, best practices for financial reporting in the real estate industry.
Accounting for Investment Property
Domestic GAAP Prior to IFRS Adoption
Prior to the adoption of IFRS in Europe in 2005, investment property assets were
accounted for under the domestic accounting standards applied within the firm’s country of
domicile. The treatment varied considerably across the European countries that are the focus of
this study (see Table 2), but broadly may be categorized into two models: cost and revaluation.
The domestic standards of some countries (e.g., Italy) explicitly require that investment property
be accounted for under the cost model. Domestic standards in several other countries de facto
require this treatment (e.g., France, Germany), as they do not separately address this particular
tangible asset,4 which is consequently treated under the cost model as are other tangible long-
lived assets: they are depreciated over some estimate of the asset’s useful life, with depreciation
4 While France technically allowed revaluations of investment properties, such revaluations are taxable under the
French tax code. Consequently, no French firms (at least within our sample) chose to perform property revaluations, and industry practice was to apply the cost model.

6
expense reported on the income statement, and some requirement for impairment testing. Of
note, however, some firms using this reporting model voluntarily disclose property fair values.
Domestic accounting standards in other countries, notably the UK, require that
investment properties be accounted for using the revaluation model. Under this model, these
assets are presented on the balance sheet at fair value.5 Changes in fair value do not, however,
flow through the income statement; rather, these changes are recognized directly in equity (e.g.,
in an account such as “revaluation reserve”). No depreciation is reported. Finally, the domestic
accounting standards for several countries (e.g., Belgium, Netherlands) allow firms the flexibility
to choose either the cost or revaluation model. None of our sample countries have domestic
accounting standards allowing or requiring the fair value model (under which fair value changes
flow through income) for this asset class.
In all countries, investment properties fall under the purview of auditor examination,
whether reported under the cost or revaluation model. However, those countries requiring the
revaluation model also tend to have a more developed institutional structure incorporating
additional external monitoring of provided fair values. This role is performed by appraisers,
either external (that is, independent appraisal firms hired by the investment property firm) or
internal (that is, qualified individuals within the investment property firm). The UK is
noteworthy, wherein domestic standards require that property fair values be reviewed by an
external appraiser at least once every five years, and use of external appraisers is common.6
5 Under the applicable UK standard (Statement of Standard Accounting Practice 19, Accounting for Investment
Properties), real estate assets are reported at “open market value.” This is defined similarly to “fair value” under IAS 40. Both focus on prices obtained in a market setting with informed buyers – that is, an “exit price” notion.
6 In the U.K., the Royal Institute of Chartered Surveyors has established specific guidelines on the process of property valuation. Other countries, particularly those wherein the domestic GAAP require the revaluation model, rely on standards promulgated by the International Valuation Standards Committee.

7
IFRS and IAS 40
In June 2002 the Council of Ministers of the EU approved the so-called “IAS
Regulation,” which required publicly-traded companies on European regulated markets to use
IFRS as the basis for presenting their consolidated financial statements for fiscal years beginning
on or after January 1, 2005.7 Within the investment property industry, one of the primary effects
relates to the application of IAS 40 – Investment Property, which defines investment property as
property (land or a building – or part of a building – or both) held (by the owner or by the lessee under a finance lease) to earn rentals or for capital appreciation or both, rather than for: (a) use in the production or supply of goods or services or for administrative purposes; or (b) sale in the ordinary course of business. (IAS 40.5)
Subsequent to initial recognition at cost, IAS 40.30 requires firms to choose between the cost and
fair value models and apply the chosen policy to all of their investment property.8
Under the cost model, firms apply the requirements of IAS 16 – Property, Plant and
Equipment (IAS 40.56) pertaining to this method, with investment property carried at its cost less
any accumulated depreciation and impairment losses (IAS 16.30). Notably, however, IAS 40
still requires these firms to disclose fair value in the footnotes, except where, under exceptional
circumstances, fair value cannot be determined reliably (IAS 40.79 (e)).
Under the fair value model, investment property is carried on the balance sheet at fair
value (IAS 40.33), with all changes in fair value recognized in the income statement (IAS 40.35).
Fair value is determined under a fair value hierarchy described in IAS 40.45-47, where the best
evidence of fair value is given by current prices in an active market for similar property in the
same location and condition and subject to similar lease and other contracts. Firms are 7 See Regulation (EC) No 1606/2002 of the European Parliament and of the Council of July 19, 2002. Firms with
a December 31 fiscal-year end must apply IFRS for fiscal years ending December 31, 2005. Firms with non-December 31 year-ends must apply IFRS for fiscal years ending in 2006 (e.g., for a March 31 fiscal-year end, for financial statements ending March 31, 2006).
8 IAS 40 allows two exceptions, both quite restrictive, by which firms may report part of their property portfolio under the cost model, and part under the fair value model. However, as a practical matter most firms, including all within our sample, apply either the cost or fair value models to their full portfolio of investment properties.

8
encouraged, but not required, to enlist independent valuers (i.e., appraisers) with relevant
qualification and experience when determining investment property fair values (IAS 40.32).
IAS 40 is significant as it marks the first time the International Accounting Standards
Board (IASB) introduced a fair value accounting model for non-financial assets. Further, all
firms must provide fair values for their real estate assets – either directly on the balance sheet
under the fair value model or within the footnotes under the cost model. However, since only the
fair value model results in unrealized fair value gains or losses flowing through income, the
choice between the two models affects reported income and net asset value volatility.
Interestingly, IAS 40 allows firms to switch from the cost to the fair value model to achieve
fairer presentation, but effectively prohibits switching from the fair value to the cost model (IAS
40.31). Finally, it is noteworthy that EPRA’s best practice policy recommendations recommend
that firms reporting under IAS 40 use the fair value model (EPRA 2006).
Related Literature
This paper builds on four primary streams of literature. First, we build on the prior
international research examining the implementation of accounting standards. Several papers
provide evidence that substantial reporting differences remain after convergence efforts that
preceded the mandated 2005 adoption of IFRS within the EU (e.g., Tay and Parker 1990; Joos
and Lang 1994). Recent papers also provide evidence of potential (e.g., Ball 1995, 2006;
Jermakowicz and Gornik-Tomaszewski 2006; Sellhorn and Gornik-Tomaszewski 2006), actual
(e.g., Ball et al. 2003; Beuselinck et al. 2007; Zeff 2007), and perceived (e.g., Daske et al. 2007a)
variation in IFRS implementation.
Second, we build on the literature examining attributes of fair value estimates for non-
financial assets. Easton et al. (1993) and Barth and Clinch (1998) both find that voluntary

9
tangible asset revaluations for Australian firms are associated with equity prices reflecting
sufficient reliability for incorporation into share prices. Other papers document concerns over
fair value estimates. Danbolt and Rees (2008) provides evidence that fair values are biased
where valuation is ambiguous (tangible assets) and are more reliable where they are
unambiguous (financial assets). Ramanna and Watts (2007) provides evidence that the
unverifiable nature of goodwill impairments, which are based on fair value estimation, gives
firms discretion to manage impairments. In addition, two studies are particularly germane to the
current paper, as both focus on the UK real estate industry. Dietrich et al. (2001) provides
evidence that fair value estimates by UK property firms employing external appraisers are less
biased and more accurate than those reported by firms employing internal appraisers. Muller and
Riedl (2002) extends these findings, providing evidence that the market perceives these fair
value estimates as more reliable when external as opposed to internal appraisers are employed,
reflected in lower bid-ask spreads for firms employing external appraisers.
Third, we build on the literature examining the determinants of firms’ choice of
accounting policies (see Fields et al. 2001 for a review), some of which have focused on the
decision to voluntarily report fair values of non-financial assets. Muller (1999) examines UK
firms’ voluntary decision to capitalize current value estimates of brand names acquired in a
business combination, providing evidence that this decision reflects attempts to minimize the
cost of obtaining shareholder approval for future acquisitions or disposals. Lemke and Page
(1992) investigates UK firms’ compliance with a domestic standard requiring firms to
supplement the historical-cost based income statements and balance sheets with current cost-
based ones, concluding that the major motivation for compliance was the ability to report lower
income.
10
Finally, our study contributes evidence to the literature on the consequences of
disclosure. Using a sample of German firms, Leuz and Verrecchia (2000) shows that firms
committing to increased disclosure by voluntarily adopting IFRS or US GAAP experience lower
information asymmetry than firms reporting under domestic GAAP. Daske et al. (2007b) partly
corroborates this effect for a large, international sample of firms subject to mandatory IFRS
adoption, which was intended to enhance firms’ disclosure environments.
Hypotheses Development
As discussed above, domestic reporting standards and practices for real estate assets
varied considerably among our sample firms prior to mandatory IFRS adoption and
implementation of IAS 40, with some firms providing investment property fair values, and some
firms not providing this information. Because accounting practices arise endogenously as
efficient responses to the demand for accounting information (Ball et al. 2000), we hypothesize
that firms will provide these fair values where demand for this information is greatest, reflected
in characteristics such as the ownership structure of the firm. We also expect that firms
providing fair value information are more likely to have exercised other reporting choices in a
way consistent with a commitment to increased financial reporting transparency. This leads to
the following hypothesis on the cause of firms providing investment property fair values (all
hypotheses stated in alternative form):
H1: European real estate firms providing investment property fair values exhibit characteristics reflecting greater demand for this information as well as a commitment to increased financial reporting transparency.
We also examine financial statement users’ perception of investment property fair values.
Investors may perceive these fair values as informative, as they provide timely information
reflecting current values of the firm’s primary assets (EPRA 2006). However, investors may

11
perceive reported fair values as uninformative, due to measurement error (e.g., arising from
varying levels of liquidity within local property markets, or diverse accounting standards for
these estimates) and/or bias (e.g., arising from managers’ incentives to distort these estimates,
and variation in the monitoring to reduce such distortions). This leads to our second hypothesis:
H2: European real estate firms not voluntarily disclosing or recognizing investment property fair values have greater information asymmetry.
The adoption of IFRS was broadly intended to mitigate differences in information quality
across firms, thus facilitating improved comparisons and flows of capital (e.g., Armstrong et al.
2008). Within the real estate industry, investment properties are the primary asset, suggesting
adoption of IAS 40 should play a critical role in “leveling the playing field” by requiring
provision of previously unknown fair values of these core assets for a subset of firms. This leads
to the following hypothesis:
H3A: European real estate firms not previously disclosing or recognizing investment property fair values experience decreased information asymmetry following adoption of IAS 40.
However, prior research suggests that adoption is not sufficient for either improving
information quality or achieving comparable information across firms. Variation in
implementation, both at the country and firm level, can result in continuing variation in
information quality (e.g., Ball 1995, 2006; Ball et al. 2003; Burgstahler et al. 2006; Daske et al.
2007a, 2007b). In the current setting, variations in the liquidity and institutional structure of
local property markets, and in the discretion firms apply in implementing IAS 40, can lead to
differences in the quality of provided investment property fair values. In this case, investors can
view adoption of IAS 40 as insufficient to eliminate previous information quality differences, if
they perceive implementation is not uniform even under a commonly applied reporting standard.
This leads to the final hypothesis, related to H3A above:

12
H3B: European real estate firms not previously disclosing or recognizing investment property fair values have higher information asymmetry even after adoption of IAS 40 requiring the provision of this information.
III. SAMPLE SELECTION AND DESCRIPTIVE STATISTICS
Table 1 presents the sample selection. From active firms as of December 15, 2006, we
exclude firms having various conditions (e.g., not reporting under IFRS, being subsidiaries, or
having less than ten percent of total assets as investment property) and lacking certain data (e.g.,
the cost versus fair value model decision under IAS 40, or variables used in our equations),
leading to a final sample of 77 firms. We focus on continental-European investment property
firms due the UK investment property being substantially larger and more developed (e.g., the
UK property market value was estimated by Investment Property Databank to be €241 billion at
the end of 2005, versus €327 billion for the other EU countries combined), as well as the greater
sophistication of the UK appraisal profession (e.g., the UK Royal Institute of Chartered
Surveyors is the only such country-specific actuarial association within the EU).9
Panel A of Table 2 provides a breakdown of our sample by country, revealing that France
and Germany have the highest representation, with 34 percent of the total sample. The table also
presents firms’ provision of investment property fair values in the pre-IFRS period, with 18 (59)
not providing (providing) this information. Finally, the table presents the IAS 40 model choice,
with 19 (58) sample firms choosing the cost model with required footnote disclosure of fair
values (fair value model). Closer examination indicates that both the provision of fair values in 9 We also focus on continental-European firms due differences in market microstructures. UK investment
property firms’ trades are typically processed by market makers; whereas continental-European investment property firms’ trades are handled on an order-driven basis. Prior research indicates that quoted spreads in dealer markets are typically higher than in order-driven markets (see Pagano 1998 for a review). In untabulated analysis, we reestimated our spread analyses including UK investment property firms, and allowing a separate dummy variable for UK investment property firms. Consistent with prior research investigating dealer markets relative to order-driven markets, we found that the dummy variable was significantly positive. In addition, our inferences (reported later) remained unchanged to this alternative specification, except that the dummy variable NO_FV_PRE in Table 5 was significant at a slightly lower level (one-sided p-value = 0.07).

13
pre-IFRS reporting, as well as selection of the fair value model under IAS 40, occur
predominantly within several Scandinavian countries, with continental-European countries
(particularly France and Germany) exhibiting substantial variation.
Panel B of Table 2 provides a more detailed examination of firm-specific and country
characteristics across the firms providing and not providing fair value information. The table
presents little evidence of firm specific differences. Firms providing and not providing fair value
information have similar amounts of total assets being comprised of investment property and
similar use of Big 4 auditors and external appraisers (all assessed in the mandatory IFRS
adoption year). However, the table provides evidence of significant country differences. Firms
not providing fair value information tend to be domiciled in countries with less efficient judicial
systems, less tradition for law and order, and higher levels of corruption.
IV. EMPIRICAL RESULTS
In this section, we provide the results of our empirical tests. In the first analysis, we
examine the causes of European real estate firms’ decisions to provide versus not provide
investment property fair values prior to IAS 40. We then investigate whether this decision leads
to greater information asymmetry among market participants. Finally, we examine whether the
mandatory adoption of IAS 40 resulted in a reduction in information asymmetry, consistent with
IAS 40 leveling the informational playing field.
Causes of Providing versus Not Providing Investment Property Fair Values Prior to IFRS
We begin by exploring the causes of European real estate firms’ decisions to provide
versus not provide investment property fair values prior to IFRS and IAS 40.10 We argue that the
10 We acknowledge that this may not be a strictly firm level decision, as there appear to be some country level
reporting requirements and/or norms in the disclosure of investment property fair values (e.g., see Table 2).

14
demand for this information and the firm’s commitment to transparency are the main drivers of
this choice.11 Thus, we estimate the following logistic regression model:
FV_PREi = α0 + α1LIQ_COUNTRY + α2CLOSEHELDi + α3VOL_ADOPTi
+ α4EPRAi + α5SIZEi + α6DEBT_MCAPi + α7CFO_MCAPi + ε i (1)
The dependent variable, FV_PRE, is an indicator variable equal to 1 if firm i provides investment
property fair values in the financial statements or annual report of the year preceding mandatory
IFRS adoption, and 0 otherwise. The experimental variables are: LIQ_COUNTRY, the
percentage turnover of investment property for the entire property market of firm i’s country of
domicile;12 CLOSEHELD, the percentage of firm i’s stock held by insiders; VOL_ADOPT, an
indicator variable equal to 1 if firm i voluntarily adopts IFRS prior to mandatory adoption, and 0
otherwise; and EPRA, an indicator variable equal to 1 if firm i is a member of EPRA at the end
of 2004, and 0 otherwise. We include LIQ_COUNTRY to capture a country-level measure of
investment property market liquidity. If higher liquidity reflects a countries’ propensity to
mandate or allow fair value accounting for investment property, the predicted sign on α1 is
positive. However, if low liquidity enables managers to opportunistically report key
performance measures, such as these fair values, then the predicted sign on α1 is negative. We
include CLOSEHELD to reflect the perceived demand for fair value information in the financial
statements. If insiders obtain information (such as fair values of the firm’s investment
properties) through non-financial statement channels, management’s incentives to provide this
Nonetheless, our intent is to capture characteristics likely to result in either firm or country level provision of these fair values; thus, we attempt to capture both firm and country level determinants within the regression.
11 Among other firm characteristics, we also examine whether property portfolios (i.e, commercial, retail, industrial, or other) differ across this choice. No significant differences are observed.
12 This is measured using turnover from the Investment Property Databank, which compiles property transactions and values from member firms, and is generally considered among the most comprehensive sources of property data for Europe. Firms voluntarily join and supply this information; the primary benefit is to obtain detailed assessments of various property market conditions.

15
information through public disclosure is reduced (e.g., Ball et al. 2000); thus, we predict a
negative sign for α2. We include VOL_ADOPT and EPRA because we assume that voluntary
adoption of IFRS and EPRA membership signal, among other things, commitments to
transparency (e.g., Daske et al. 2007a). Thus, we predict α3 and α4 to be positive. We use α2, α3
and α4 to test H1.
Finally, we include three control variables. First, we include SIZE, measured as the log
of firm i’s market capitalization, to control for the effects of the information environment
(among other factors) on this reporting decision. We also include DEBT_MCAP, measured as
firm i’s total debt divided by market capitalization, to control for the effects of leverage. Finally,
we include CFO_MCAP, firm i’s reported cash flow from operations divided by market
capitalization, to control for the firm’s performance.13 All three variables are measured at the
end of the fiscal year preceding mandatory IFRS adoption. Because the predicted effects of
these variables are unclear, we do not predict the signs on α5, α6, or α7.
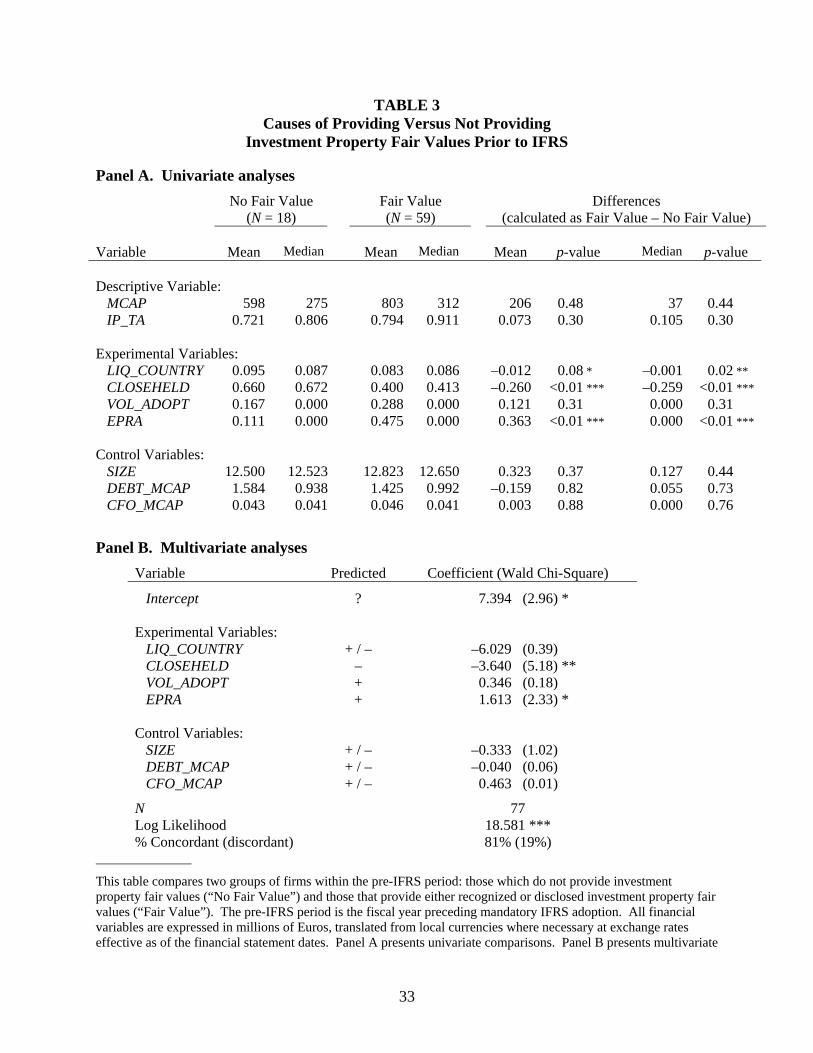
Table 3 presents univariate and multivariate results related to the estimation of Eq. (1).
The univariate tests reported in Panel A reveal that “Fair Value” firms (i.e., those providing this
information) have significantly less investment property market liquidity (mean of 8.3%
compared to “No Fair Value” firms’ 9.5%), a significantly lower proportion of closely held
shares (mean of 40.0% compared to “No Fair Value” firms’ 66.0%), and are significantly more
likely to be EPRA members (mean of 47.5% compared to “No Fair Value” firms’ 11.1%).
Differences across the remaining variables are insignificant.
The logistic regression results are presented in Panel B, and corroborate the univariate
findings—with the exception of the LIQ_COUNTRY variable. Specifically, we observe that
13 Alternative scalars, such as sales or total reported assets, do not change our inferences.
16
firms are more likely to provide investment property fair values when ownership is dispersed
(CLOSEHELD coefficient = –3.640, Wald statistic = 5.18) and if they reveal a commitment to
transparent reporting (EPRA coefficient = 1.613, Wald statistic = 2.33). LIQ_COUNTRY is
insignificant, as are the control variables. Overall, these results provide support for H1 that firms
providing investment property fair values prior to mandatory IFRS adoption exhibit
characteristics reflecting greater demand for this information as well as a greater commitment to
financial reporting transparency.
Consequences of Providing versus Not Providing Investment Property Fair Values Prior to IFRS
We now explore the consequences of European real estate firms’ decisions to provide
versus not provide investment property fair values under pre-IFRS domestic accounting
standards—specifically, if the omission leads to relatively higher bid-ask spreads.14 We examine
this possibility through the following regression model:
LogBID_ASKPRE,i = β0 + β1LogPRICEPRE,i + β2LogVOLUMEPRE,i + β3LogSTD_RETPRE,i
+ β4LogFFPRE,i + β5LogANALYSTPRE,i
+ β6IMRPRE,i + β7NO_FV_PREi + θi (2)
The dependent variable, LogBID_ASK, is the log of firm i’s mean daily percentage bid-ask
spread measured over the pre-IFRS period (denoted by the “PRE” suffix). The pre-IFRS period
is measured as the one-month period beginning three months following the fiscal year end of the
year preceding mandatory IFRS adoption (see Figure 1).15 Corresponding to our setting prior to
14 We focus only on bid-ask spreads, due to their more precise development in terms of both theoretical
determinants and ability to isolate the component attributable to information asymmetry (which is the focus of our analysis). Other measures, such as turnover and trading volume, do not permit unambiguous inferences.
15 We begin the measurement period three months following the fiscal year end to coincide with the required release of annual reports within our sample countries. We assess the bid-ask spread over a one-month window to allow a sufficient but focused measurement period. Alternative window lengths (e.g., three-month or six-month) and starting points (e.g., four or six months after fiscal year end) do not change our inferences.
17
IFRS adoption, all variables in this specification are measured over the pre-IFRS or at the end of
the fiscal year preceding mandatory IFRS adoption. Further, we adopt the log-linear form for the
dependent and control variables to accommodate the multiplicative relationships proposed by
theoretical research on the determinants of bid-ask spreads (e.g., Stoll 1978).
We then include several variables to control for other determinants of our information
asymmetry proxy, the bid-ask spread (e.g., Lee et al. 1993; Leuz and Verrecchia 2000). We
include LogPRICEPRE, the log of firm i’s closing share price, to control for market-makers’ order
processing costs, which become proportionately smaller for higher priced stocks; the predicted
sign for β1 is negative. We include LogVOLUMEPRE, the log of firm i's trading volume
(expressed in thousands of Euros) and LogSTD_RETPRE, the log of firm i's standard deviation of
stock returns, to control for market-makers’ inventory holding costs, with predicted signs of
negative for β2 and positive for β3. We include LogFFPRE, the log of firm i’s percentage of free
float shares, measured at the end of the pre-IFRS period, to control for differences in the
availability of tradeable shares. If information asymmetry among market participants is lower in
firms with a higher proportion of tradeable shares, we predict β4 to be negative. Finally, we
include LogANALYSTPRE, the log of firm i's analyst following (calculated as the log of one plus
the number of analysts covering the firm), to control for the firms’ information environment. As
greater analyst following should reduce information asymmetries, we predict a negative sign for
β5. We also include the inverse Mills ratio (IMRPRE), computed from the first-stage logistic
regression Eq. (1), to control for any self-selection bias. This enables us to capture the marginal
effect of our experimental variable on our information asymmetry proxy, given other
determinants of information asymmetry.

18
Our primary experimental variable is NO_FV_PRE, measured as an indicator variable
equal to 1 if firm i provides no fair value information in the pre-IFRS period, and 0 otherwise. If
investors perceive fair values as useful, non-provision should increase information asymmetry
and reduce the informational efficiency of share prices; hence, β7 is predicted positive and used
to test H2.16
Table 4 presents univariate and multivariate results related to the estimation of Eq. (2).
Panel A presents univariate results comparing bid-ask spreads across the “No Fair Value” (N =
18) and “Fair Value” (N = 59) groups. Results are consistent with expectations, with “No Fair
Value” firms having significantly higher bid-ask spreads (BID_ASK mean difference = 2.231, p-
value = 0.011).
Panel B presents the multivariate results. In the first column, the control variables
volume (LogVOLUMEPRE) and analyst following (LogANALYSTPRE) are significant in the
predicted direction; however, the variables price (LogPRICEPRE), risk (LogSTD_RETPRE), free
float (LogFFPRE), the inverse Mills ratio (IMRPRE) are insignificant. In the second column, the
coefficient on NO_PRE_FV is positive and significant (coefficient = 0.443, t-statistic = 2.00),
when the inverse Mills ratio is included. The coefficient on the inverse Mills ratio is
insignificant, again indicating that self-selection does not appear problematic; significance for
the other control variables remains unchanged. In the third column, the coefficient on
NO_PRE_FV is again positive and significant (coefficient = 0.474, t-statistic = 2.23), when the
inverse Mills ratio is excluded (e.g., Francis and Lennox 2008). Thus, our results are consistent 16 To control for potential differences in market microstructure across our sample countries that may be correlated
with our experimental variable (NO_FV_PRE), we examine several alternative specifications of Eq. (1). First, we add an indicator variable that equals one for Scandinavian countries (that is, Denmark, Finland, Norway, and Sweden), as these countries appear more likely to disclose investment property fair values under domestic reporting standards. Results are slightly stronger than those reported. Second, we include an indicator variable that equals one for countries in which all firms provide investment property fair values prior to IFRS (that is, Belgium, Denmark, Finland, the Netherlands, Sweden, and Switzerland). Results are unchanged from those reported.
19
with investors perceiving that the omission of fair values leads to higher information asymmetry,
and provides support for H2. In the next section, we examine whether the requirement of IAS 40
to provide (i.e., recognize or disclose) fair value information led to these differences in
information asymmetry across European real estate firms being mitigated.
Does Required Provision of Investment Property Fair Values Under IAS 40 Eliminate Perceived Differences Across Firms?
We assess whether mandated fair value reporting under IAS 40 has ‘leveled the playing
field’ in terms of information asymmetry between firms that provide versus those that do not
provide investment property fair values in the pre-IFRS period, or whether differences between
the two groups remain, using the following regression model, which parallels Eq. (2):
LogBID_ASKPOST,i = δ0 + δ1LogPRICEPOST,i + δ2LogVOLUMEPOST,i + δ3LogSTD_RETPOST,i
+ δ4LogFFPOST,i + δ5LogANALYSTPOST,i + δ6NO_FV_PREi + τi (3)
The dependent variable, LogBID_ASKPOST, is now measured over the post-IFRS period to assess
whether information asymmetry continues to differ between the fair-value and no-fair value
groups. The post-IFRS period is measured as the one-month period beginning three months after
the fiscal year end of mandatory IFRS adoption. Paralleling the measurement of our dependent
variable, all variables in Eq. (3) are measured either over the post-IFRS period, or as of the end
of the mandatory IFRS adoption fiscal year. The control variables and associated predictions in
Eq. (3) mirror those discussed for Eq. (2). We do not include the inverse Mills ratio for the post
IAS 40 analysis, as the firms can no longer choose to not disclose fair value information.
Our experimental variable remains NO_FV_PRE, an indicator variable equal to 1 if firm i
does not provide investment property fair value in the pre-IFRS period, and 0 otherwise. If IAS
40 is unable to eliminate the source of information asymmetry between the two groups (e.g., due
to investors concerns over implementation or estimation), the coefficient for NO_FV_PRE (δ6)

20
will be positive. Alternatively, if IAS 40 reduces or eliminates this information asymmetry
through its required provision of fair value estimates, then δ6 should be insignificant.
Table 5 presents univariate and multivariate results related to the estimation of Eq. (3).
Panel A presents univariate comparisons across the two groups, which indicate that information
asymmetry differences, while somewhat reduced, largely remain, as the “No Fair Value” firms
continue to have higher bid-ask spreads (mean difference = 1.480; p-value = 0.021) than the
“Fair Value” firms.
Panel B presents the multivariate results. In the first column the control variables volume
(LogVOLUMEPOST) and analyst following (LogANALYSTPOST) are significant in the predicted
direction; however, the variables price (LogPRICEPOST), risk (LogSTD_RETPOST), and
concentrated ownership (LogFFPOST) are insignificant. In the second column, the coefficient on
NO_FV_PRE is positive and significant (coefficient = 0.362, t-statistic = 1.66).
We more formally test for changes in information asymmetry from the pre-IFRS to the
post-IFRS periods in Table 6. Panel A presents univariate results, comparing the “No Fair
Value” and “Fair Value” groups for changes in information asymmetry. Consistent with our
earlier findings, we fail to find evidence that the relative information asymmetry changed with
the implementation of IAS 40. Specifically, while Panel A documents a marginally significant
decrease in the bid-ask-spread both for firms providing and not providing investment property
fair values prior to mandatory IFRS adoption, the differences across these two groups are
insignificant. Panel B presents tests of equality of coefficients across Eqs. (2) and (3)—i.e.,
whether the coefficients differ in the post versus pre periods. Again, consistent with our earlier
findings, we fail to find evidence of a change in information asymmetry for the firms not

21
previously disclosing fair value information (coefficient for NO_FV_PREPOST – NO_FV_PREPRE
= –0.112; t-statistic = –0.36).
In summary, we find evidence that the move to mandated fair value disclosure under IAS
40 does not fully eliminate previously documented differences in information asymmetry across
the “No Fair Value” and “Fair Value” groups. Rather, differences in information asymmetry
remain, providing support for H3B. We fail to find evidence that required provision of fair values
under mandatory IFRS adoption reduces information asymmetry for those firms that did not
previously provide fair values, and thus fail to support H3A. This evidence is consistent with
market participants perceiving heterogeneity in the quality of fair value disclosures, even when
these amounts are required under a uniform standard (i.e., IAS 40).
V. SENSITIVITY ANALYSIS – DISCLOSURE VERSUS RECOGNITION UNDER IAS 40
We also examine the causes and consequences of disclosing investment property fair
values (as occurs for firms choosing the cost model under IAS 40) versus recognizing them (as
occurs for firms choosing the fair value model under IAS 40). This provides some insights into
whether continuing differences in information asymmetry arise primarily due to the disclosure
versus recognition choice afforded under IAS 40.
Descriptive statistics reveal that 19 (58) of our sample firms choose the cost model (fair
value model) under IAS 40.17 We then estimate a logistic regression similar to Eq. (1), with the
dependent variable now the decision to adopt the fair value model (i.e., recognition of fair
values) versus cost model (i.e., disclosure of fair values) under IAS 40. Untabulated results
17 The mapping of firms occurs as follows. Of the 18 firms not providing fair values in the pre-IFRS period, 13 (5)
choose the cost model (fair value model). Of the 59 firms providing fair values in the pre-IFRS period, 6 (53) choose the cost model (fair value model).

22
reveal that similar determinants of the decision to provide investment property fair values in the
pre-IFRS period (see Table 3) also affect the decision to adopt the fair value model under IAS
40. To maintain consistency with our dependent variable, we measure these determinants during
the IFRS adoption year, versus the year prior to adoption in the Table 3 analysis. We find that
the demand for fair value information also affects this decision, as firms with more dispersed
ownership are significantly more likely (p-value = 0.004) to choose the fair value model. We
also find that firms choosing the fair value model are significantly more likely to have
membership in EPRA (p-value = 0.091), consistent with exhibiting a greater commitment to
reporting transparency.
We then examine whether investors perceive differences in the recognition versus
disclosure of investment property fair values. Untabulated univariate differences in bid-ask
spreads are consistent with investors perceiving that firms disclosing these fair values have
similar information asymmetry as firms recognizing these fair values; differences across these
groupings are insignificant (p-value = 0.753). In addition, multivariate analyses examining bid-
ask spreads, similar in form to Eq. (3), also fail to provide evidence that investors perceive
differences across these groupings. Thus, we fail to find evidence that continuing differences in
perceived information asymmetry under IAS 40 (e.g., Table 5) are strictly attributable to the
disclosure versus recognition of investment property fair values under this standard.
VI. CONCLUSION AND IMPLICATIONS
This paper examines the causes and consequences of different forms of fair value
disclosures for tangible long-lived assets. For our sample firms, which operate in the real estate
industry, the primary asset is investment property, suggesting the reporting for this asset is a
23
first-order reporting choice. We exploit the setting of IFRS adoption within the EU. Under
domestic reporting standards prior to IFRS, some firms provide investment property fair values
(either through balance sheet recognition under the revaluation model, or through footnote
disclosure), while some do not provide this information. However, upon adoption of IFRS and
application of the relevant standard, IAS 40 – Investment Property, all firms must provide these
fair values either through recognition in the primary financial statements (under the fair value
model option) or through required footnote disclosure (under the cost model option).
Regarding causes, we examine European real estate firms’ choices to provide versus not
provide investment property fair values prior to IFRS. We provide evidence that the decision
reflects the demand for these fair values and other signals from the firm of commitment to
reporting transparency. Specifically, we find that firms with more dispersed ownership are more
likely to provide fair values prior to IFRS, consistent with firms that have concentrated
ownership relying less on reporting fair values through the financial statements to mitigate
information asymmetry. In addition, firms exhibiting other commitments to reporting
transparency (such as membership in a lead industry group advocating best reporting practice –
see Baik et al. 2008) are more likely to provide fair values prior to IFRS.
Regarding consequences, we use the pre-IFRS period to examine the import of providing
versus not providing investment property fair values. We report evidence that firms providing
investment property fair values have lower information asymmetry than those not providing
these fair values, reflected in lower bid-ask spreads. This is consistent with the provision of fair
values for this asset lowering information asymmetry, and thus firm’s cost of capital. We then
examine whether the adoption of IFRS reduces or eliminates these previously documented
differences in information asymmetry, owing to the now mandatory provision of investment
24
property fair values under IAS 40. Empirical results reveal that IAS 40 does not fully eliminate
previously documented differences in information asymmetry. Rather, we find evidence that
firms, which did not provide investment property fair values prior to IFRS, continue to have
higher bid-ask spreads even after mandatory adoption of IFRS.
While we cannot fully identify why these information asymmetry differences remain,
several observations are relevant. First, it is possible that some cause unrelated to the provision
of investment property fair values leads to observed differences in information asymmetry across
those firms providing versus not providing these fair value estimates – both before and after
adoption of IFRS. However, given that investment properties represent over three-quarters of
total assets for these firms, it is unclear what a larger source of information asymmetry would be.
Second, that IFRS does not eliminate these differences is consistent with investors’ perceiving
differences in the quality of fair values provided, even under a uniform standard. This could
reflect concerns over implementation of IAS 40 at the firm level (e.g., managers have substantial
discretion in the derivation of these fair value estimates), the industry level (e.g., the appraisal
institutional structure is not uniformly developed at the time of IFRS adoption), or country level
(e.g., owing to observed differences in judicial systems, corruption, etc.). While we cannot
isolate the cause of the perceived difference, these appear likely candidates.18
Overall, we contribute to the literatures on accounting for non-financial assets and
consequences of disclosure by documenting that investors perceive investment property fair
values to be reliable enough to warrant significantly lower cost of capital for those firms
providing them. We contribute to the literature on accounting choice by documenting that the
18 We also note that while strong institutions can lead to a supply of “high quality” reporting standards, alternatively
“better” reporting standards can lead to both the demand for and evolution of stronger institutions to ensure high quality implementation of these standards. Whether the latter occurs can be re-examined as IFRS and IAS 40 continue to be applied within this industry over the coming years.

25
demand for fair value information (reflected in a firm’s ownership structure) and the firm’s
commitment to reporting transparency is associated with the decision to provide fair values.
Finally, we contribute to the literature on international differences in the implementation of
accounting standards by documenting variation in how property firms across EU countries
implement a standard on fair values, and by providing evidence that adoption of this standard
under IFRS, in and of itself, is insufficient to fully overcome previous perceived reporting
differences across these firms.
These insights may assist standard setters and users in understanding the factors
influencing firms’ current and future accounting choices, and that allowing flexibility in these
financial reporting decisions may result in systematically divergent choices by firms. These
insights are likely also of interest to US standard setters and managers of the almost 250 publicly
traded US real estate firms (with a market capitalization of over $300 billion at December 31,
2007), which must consider how the required historical cost basis applied under US GAAP (and
general non-disclosure of investment property fair values in the US) will be converged with the
IFRS requirement to recognize or disclose these fair values in the near future (NAREIT 2008).

26
REFERENCES Armstrong, C., M. Barth, A. Jagolinzer, and E. Riedl. 2008. Market Reaction to the Adoption of
IFRS in Europe. Working paper, University of Pennsylvania, Stanford University, and Harvard Business School.
Baik, B., B. Billings, and R. Morton. 2008. Reliability and Transparency of Non-GAAP
Disclosures by Real Estate Investment Trusts (REITs). The Accounting Review 83 (2): 271-301.
Ball, R. 1995. Making Accounting More International, How, and How Far Will It Go? Journal
of Applied Corporate Finance 8 (3): 19-29. Ball, R., S.P. Kothari, and A. Robin. 2000. The Effect of International Institutional Factors on
Properties of Accounting Earnings. Journal of Accounting and Economics 29: 1-51. Ball, R., A. Robin, and J. Wu. 2003. Incentives versus Standards: Properties of Accounting
Income in Four East Asian Countries. Journal of Accounting and Economics 36: 235-270.
Ball, R. 2006. International Financial Reporting Standards: Pros and Cons for Investors.
Accounting and Business Research 36 (Special Issue: International Accounting Policy Forum): 5-27.
Barth, M., and G. Clinch. 1998. Revalued Financial, Tangible, and Intangible Assets:
Associations with Share Prices and Non-Market Based Value Estimates. Journal of Accounting Research 36 (Supplement): 199-233.
Beuselinck, C., Ph. Joos, and S. Van der Meulen. 2007. International Earnings Comparability.
Working paper, Tilburg University. Burgstahler, D.C., L. Hail, and C. Leuz. 2006. The Importance of Reporting Incentives:
Earnings Management in European Private and Public Firms. The Accounting Review 81 (5): 983-1016.
Danbolt, J., and W. Rees. 2008. An Experiment in Fair Value Accounting: UK Investment
Vehicles. European Accounting Review 17 (2): 271-303. Daske, H., L. Hail, C. Leuz, and R. Verdi. 2007a. Adopting a Label: Heterogeneity in the
Economic Consequences of IFRS Adoptions. Working paper, University of Frankfurt, University of Pennsylvania, University of Chicago, and MIT.
Daske, H., L. Hail, C. Leuz, and R. Verdi. 2007b. Mandatory IFRS Reporting Around the
World: Early Evidence on the Economic Consequences. Working paper, University of Chicago.

27
Dietrich, D., M. Harris, and K. Muller. 2001. The Reliability of Investment Property Fair Value Estimates. Journal of Accounting and Economics 30 (2): 125-158.
Easton, P., P. Eddey, and T. Harris. 1993. An Investigation of Revaluations of Tangible Long-
Lived Assets. Journal of Accounting Research 31 (Supplement): 1-38. European Public Real Estate Association (EPRA). 2006. Best Practices Policy
Recommendations (November). Amsterdam, the Netherlands: EPRA. Fields, T., T. Lys, and L. Vincent. 2001. Empirical Research on Accounting Choice. Journal of
Accounting and Economics 31: 255-307. Francis, J., and C. Lennox. 2008. Selection Models in Accounting Research. Working paper,
University of Missouri-Columbia, and Hong Kong University of Science and Technology.
Healy, P. M., and K. G. Palepu. 2001. Information asymmetry, corporate disclosure, and the
capital markets: A review of the empirical disclosure literature. Journal of Accounting and Economics 31: 405-440.
International Accounting Standards Board (IASB). 2003. International Accounting Standard 16,
Property, Plant, and Equipment. London, U.K.: IASC Foundation. __________. 2003. International Accounting Standard 40, Investment Property. London,
U.K.: IASC Foundation. Jermakowicz, E., and S. Gornik-Tomaszewski. 2006. Implementing IFRS from the Perspective
of EU Publicly Traded Companies. Journal of International Accounting, Auditing, and Taxation 15 (2): 170-196.
Joos, P. and M. Lang. 1994. The Effects of Accounting Diversity: Evidence from the European
Union. Journal of Accounting Research 32 (Supplement): 141-168. La Porta, R., F. Lopez-de-Silanes, A. Shleifer, and R. Vishny. 1998. Law and Finance. Journal
of Political Economy: 1113-1155. Lee, C., Mucklow, B., and M. Ready. 1993. Spreads, Depths, and the Impact of Earnings
Information: An Intraday Analysis. Review of Financial Studies 6 (2): 345-374. Lemke, K., and M. Page. 1992. Economic Determinants of Accounting Policy Choice. Journal
of Accounting and Economics 15 (1): 87-114. Leuz, C., and R. Verrecchia. 2000. The Economic Consequences of Increased Disclosure.
Journal of Accounting Research 38 (Supplement): 91-124.

28
Muller, K. 1999. An Examination of the Voluntary Recognition of Acquired Brand Names in the United Kingdom. Journal of Accounting and Economics 26: 179-191.
Muller, K. and E. Riedl. 2002. External Monitoring of Property Appraisal Estimates and
Information Asymmetry. Journal of Accounting Research 40 (3): 865-881. National Association of Real Estate Investment Trusts (NAREIT). 2008. NAREIT Meeting
with FASB, January 25, 2008. Washington, D.C.: NAREIT. Pagano, M. 1998. The Changing Microstructure of European Equity Markets. Published in The
European Securites Markets: The Investment Services Directive and Beyond, Edited by Guido Ferrarini. Leiden, The Netherlands: Kluwer Law International.
Ramanna, K., and R. Watts. 2008. Evidence from Goodwill Non-Impairments on the Effects of
Unverifiable Fair-Value Accounting. Working paper, Harvard Business School and MIT. Riedl, E. 2005. Land Securities Group: Choosing Cost or Fair Value on Adoption of IFRS.
Harvard Business School Case (105014) and Teaching Note (105015). Sellhorn, T., and S. Gornik-Tomaszewski. 2006. Implications of the ‘IAS Regulation’ for
research into the international differences in accounting systems. Accounting in Europe 3: 187-217.
Stoll, H. 1978. The Pricing of Security Dealer Services: An Empirical Study of NASDAQ
Stocks. The Journal of Finance 33 (4): 1153-1172. Tay, J., and R. Parker. 1990. Measuring International Harmonization and Standardization.
ABACUS 26 (1): 71-88. Watts, R. 2006. What Has the Invisible Hand Achieved? Working paper, Massachusetts
Institute of Technology. Zeff, S. A. 2007. Some obstacles to global financial reporting comparability and convergence at
a high level of quality. The British Accounting Review 39: 290-302.

29
FIGURE 1 Definition of Pre-IFRS and Post-IFRS Periods
Example Dates (assuming 12/31 year end): 4/1/2005 - 4/30/2005 4/1/2006 - 4/30/2006
Mandatory IFRS
12/31/200612/31/2004 12/31/2005
Pre-IFRSPeriod
Post-IFRSPre-IFRSPeriodAdoption Year-End Adoption Year-End
This figure illustrates the windows used to calculate the bid-ask spreads used in our analyses. We employ bid-ask spreads for two periods: “Pre-IFRS Period,” and “Post-IFRS Period.” The “Pre-IFRS” period is defined as the one-month period starting three months after the end of the fiscal year preceding mandatory IFRS adoption. The “Post-IFRS” period is defined as the one month period starting three months after the end of the fiscal year of mandatory IFRS adoption.

30
TABLE 1 Sample Selection
Less RemainingFirms traded on European Economic Area (EEA) stock exchanges that are classified as real estate firms in Thomson Financial Worldscope and active as of December 15, 2006
417
Less firms: not reporting under IFRS in “IFRS year” (2005 or 2005/2006) –160 257 not operating in the investment property business –55 202 that are subsidiaries –9 193 for which no annual reports were found –4 189 for which the cost versus fair value model decision for the “IFRS year” (2005 or 2005/2006) could not be obtained –3 186
for which the fair value of investment property in the “IFRS year” (2005 or 2005/2006) could not be obtained –8 178
for which the fair value of investment property in the “IFRS year” (2005 or 2005/2006) is less than 10% of total assets –21 157
for which data necessary to estimate causes or consequences analyses is unavailable –50 107
domiciled in the UK –30 77
Final Sample 77
This table presents the sample selection process. We begin with all publicly-traded real estate firms within the European Economic Area, active as of December 15, 2006. We exclude firms that do not report under IFRS in 2005 or 2006; that are not within the investment property business; that are subsidiaries; for which annual reports are unavailable; for which the choice of cost or fair value models could not be determined; for which the fair value of investment property (a required disclosure per IAS 40 under either model choice) could not be obtained; for which the fair value of investment properties reported in the IFRS year is less than 10% of total assets; and for which data necessary to estimate our multivariate analyses is unavailable. We also exclude firms domiciled in the UK due to the substantially larger property market and more developed institutional features within this country, leading to our final sample (N = 77).

31
TABLE 2 Descriptive Statistics
Panel A. Distribution by Country Pre-IFRS
Reporting Model choice under IAS 40 Pre-IFRS domestic GAAP treatment of investment property:
Country Firms No FV FV Cost FV Cost Model
Reval Model
Treated as PP&E Notes
Austria 6 2 4 1 5 X X Belgium 8 0 8 0 8 X X X Revaluations are allowed under
certain circumstances. Denmark 3 0 3 0 3 X Revaluation is required if investment
property is the firm’s main activity. Finland 4 0 4 0 4 X France 14 7 7 8 6 X X Revaluation is permitted, but rare in
practice, as surpluses are taxed. Germany 12 5 7 5 7 X X Italy 3 1 2 2 1 X While depreciation is not mandatory;
fair value is prohibited. Netherlands 7 0 7 1 6 X X Disclosure of fair value is required. Norway 2 2 0 0 2 X X Poland 1 0 1 0 1 X X X Spain 3 1 2 2 1 X X Sweden 9 0 9 0 9 X X Disclosure of fair value is required. Switzerland 5 0 5 0 5 X X X Total 77 18 59 19 58

32
Panel B. Comparison of Firm and Country Characteristics Variable
No Fair Value (N = 18)
Fair Value (N = 59)
Difference
Difference t-statistic
IP_TA 0.721 0.794 –0.073 –1.04 Big4 0.556 0.712 0.156 1.24 Ext 0.813 0.860 0.047 0.46 Ext% 0.800 0.795 –0.005 –0.04 Judiciary 8.500 9.280 0.780 2.87 *** Rule of Law 9.174 9.634 0.460 2.78 *** Corruption 8.814 9.250 0.436 1.80 * Expropriation 9.726 9.733 0.007 0.16 This table presents descriptive data for our sample. Panel A presents the distribution by country. In this panel, we present sample firms’ provision of investment property fair values in the pre-IFRS period, where “No FV” (“FV”) indicates the firm does not provide (provides) either recognized or disclosed fair values. Next, we present sample firms’ choice of the cost model with required fair value disclosure (“Cost”) or the fair value model (“FV”) under IAS 40 on adoption of IFRS. Finally, we present the pre-IFRS domestic accounting treatment for investment property assets, indicating whether domestic GAAP required the cost model (“Cost Model”), revaluation model (“Reval Model”), or allowed a choice (i.e., indicated with an “X” under both the cost and revaluation models). We also indicate whether domestic GAAP treated investment property as a part of property, plant, and equipment (“Treated as PP&E”), that is, did not have a specific accounting standard addressing this asset class. Panel B presents firm and country characteristics for the sample. IP_TA is the percentage of reported total assets that consist of investment properties, assessed at the end of the mandatory IFRS adoption year. Big4 is an indicator variable equal to 1 if the firm employs a Big Four auditing firm in the mandatory IFRS adoption year, and 0 otherwise. Ext is an indicator variable equal to 1 if the firm employs an external appraiser to value its investment property in the mandatory IFRS adoption year, and 0 otherwise. Ext% is the percentage of the firm’s investment property that is valued by an external appraiser in the mandatory IFRS adoption year. Judiciary, Rule of Law, Corruption, and Expropriation are country level characteristics for the country in which the firm is domiciled, obtained from La Porta et al. (1998). Judiciary is the efficiency of the judicial system (rated 0-10), where lower values indicate a less efficient judicial system. Rule of Law is the assessment of the law and order tradition (rated 0-10), where lower scores indicate less tradition for law and order. Corruption is the assessment of the corruption of the government (rated 0-10), where lower scores indicate higher levels of corruption. Expropriation is the risk of outright confiscation or forced nationalization (rated 0-10), where lower scores indicate a higher risk of confiscation. *, **, *** indicate significance at the less than 10%, 5%, and 1% levels, for two-tailed tests.
33
TABLE 3 Causes of Providing Versus Not Providing
Investment Property Fair Values Prior to IFRS Panel A. Univariate analyses
No Fair Value (N = 18)
Fair Value (N = 59)
Differences (calculated as Fair Value – No Fair Value)
Variable Mean Median Mean Median Mean p-value Median p-value Descriptive Variable: MCAP 598 275 803 312 206 0.48 37 0.44 IP_TA 0.721 0.806 0.794 0.911 0.073 0.30 0.105 0.30 Experimental Variables: LIQ_COUNTRY 0.095 0.087 0.083 0.086 –0.012 0.08 * –0.001 0.02 ** CLOSEHELD 0.660 0.672 0.400 0.413 –0.260 <0.01 *** –0.259 <0.01 *** VOL_ADOPT 0.167 0.000 0.288 0.000 0.121 0.31 0.000 0.31 EPRA 0.111 0.000 0.475 0.000 0.363 <0.01 *** 0.000 <0.01 *** Control Variables: SIZE 12.500 12.523 12.823 12.650 0.323 0.37 0.127 0.44 DEBT_MCAP 1.584 0.938 1.425 0.992 –0.159 0.82 0.055 0.73 CFO_MCAP 0.043 0.041 0.046 0.041 0.003 0.88 0.000 0.76
Panel B. Multivariate analyses
Variable Predicted Coefficient (Wald Chi-Square)
Intercept ? 7.394 (2.96) * Experimental Variables: LIQ_COUNTRY + / – –6.029 (0.39) CLOSEHELD – –3.640 (5.18) ** VOL_ADOPT + 0.346 (0.18) EPRA + 1.613 (2.33) * Control Variables: SIZE + / – –0.333 (1.02) DEBT_MCAP + / – –0.040 (0.06) CFO_MCAP + / – 0.463 (0.01)
N 77 Log Likelihood 18.581 *** % Concordant (discordant) 81% (19%)
This table compares two groups of firms within the pre-IFRS period: those which do not provide investment property fair values (“No Fair Value”) and those that provide either recognized or disclosed investment property fair values (“Fair Value”). The pre-IFRS period is the fiscal year preceding mandatory IFRS adoption. All financial variables are expressed in millions of Euros, translated from local currencies where necessary at exchange rates effective as of the financial statement dates. Panel A presents univariate comparisons. Panel B presents multivariate

34
results from a logistic regression, wherein the dependent variable (FV_PRE) is equal to 1 if the firm provides either disclosed or recognized investment property fair values, and 0 otherwise. We present coefficient estimates, with Wald Chi-square statistics shown in parentheses. *, **, *** indicate significance at the less than 10%, 5%, and 1% levels, for two-tailed tests in Panel A, and for one or two-tailed tests as indicated in Panel B. The variables are defined as:
MCAP firm i’s market capitalization (in millions of Euros) at the end of the fiscal year preceding IFRS adoption; obtained from Worldscope;
IP_TA firm i’s investment property divided by reported total assets at the end of the fiscal year preceding IFRS adoption; investment property is based on reported historical cost (fair values) for those firms in the column labeled “No Fair Value” (“Fair Value”); obtained from hand-collection;
LIQ_COUNTRY the percentage turnover of investment property for the entire property market of the country in which firm i is domiciled for the calendar year preceding mandatory IFRS adoption; obtained from Investment Property Databank;
CLOSEHELD the percentage of firm i’s shares outstanding that are closely held at the end of the fiscal year preceding mandatory IFRS adoption; obtained from Worldscope and hand-collection;
VOL_ADOPT an indicator variable equal to 1 if firm i voluntarily adopts IFRS prior to mandatory adoption, and 0 otherwise; obtained from Worldscope;
EPRA an indicator variable equal to 1 if firm i is a member of EPRA (the European Public Real Estate Association) as of 2004, and 0 otherwise; obtained from hand-collection;
SIZE the log of firm i’s market capitalization (adjusted to Euros) at the end of the fiscal year preceding mandatory IFRS adoption; obtained from Worldscope;
DEBT_MCAP firm i’s reported short-term plus long-term debt, divided by the firm’s market capitalization, both measured at the end of the fiscal year preceding mandatory IFRS adoption; obtained from Worldscope;
CFO_MCAP firm i’s reported cash flows from operations, divided by the firm’s market capitalization, both measured at the end of the fiscal year preceding mandatory IFRS adoption; obtained from Worldscope.

35
TABLE 4 Consequences of Providing Versus Not Providing Investment Property Fair Values Prior to IFRS
Panel A. Univariate analysis
Variable is BID_ASKPRE Mean Median No Fair Value (N = 18) 3.448 3.193
Fair Value (N = 59) 1.217 0.703
Difference 2.231 2.490
p-value 0.011 ** 0.001 ***
Panel B. Multivariate analysis (dependent variable is LogBID_ASKPRE) Variable Predicted Coefficient (t-statistic)
Intercept ? 2.047
(2.83) ***1.707
(2.34) ** 1.894
(2.95) *** LogPRICEPRE – 0.025
(0.41) 0.036
(0.59) 0.039
(0.64) LogVOLUMEPRE – –0.173
(–3.14) ***–0.156
(–2.85) ***–0.159
(–2.93) *** LogSTD_RETPRE + 0.010
(0.09) 0.041
(0.38) 0.059
(0.57) LogFFPRE – 0.071
(0.49) 0.102
(0.72) 0.059
(0.51) LogANALYSTPRE
– –0.530 (–3.44) ***
–0.550 (–3.64) ***
–0.562 (–3.78) ***
IMRPRE + / – –0.096 (1.08)
–0.050 (–0.55)
NO_FV_PRE + 0.443 (2.00) **
0.474 (2.23) **
N 77 77 77 Adj-R2 58.92% 60.64% 61.03%
This table presents analyses of the economic consequences of firms providing versus not providing investment property fair values in the pre-IFRS period. The pre-IFRS period is measured as the one month beginning three months following the fiscal year end preceding mandatory IFRS adoption. Panel A presents univariate comparisons of bid-ask spreads across two groups of firms: those not providing investment property fair values in the pre-IFRS period (“No Fair Value”), and those providing either recognized or disclosed investment property fair values in the pre-IFRS period (“Fair Value”). Panel B presents multivariate results, where the dependent variable is LogBID_ASKPRE. We present coefficient estimates, with t-statistics indicated in parentheses. *, **, *** indicate significance at the less than 10%, 5%, and 1% levels, respectively.
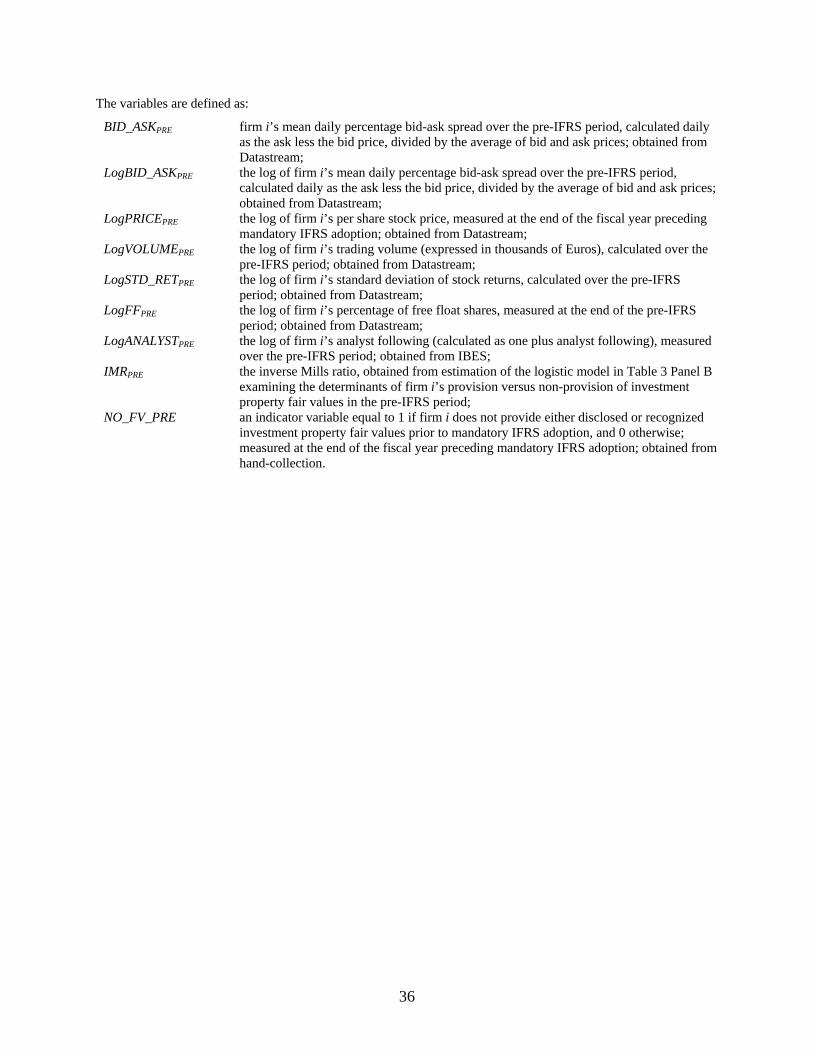
36
The variables are defined as:
BID_ASKPRE firm i’s mean daily percentage bid-ask spread over the pre-IFRS period, calculated daily as the ask less the bid price, divided by the average of bid and ask prices; obtained from Datastream;
LogBID_ASKPRE the log of firm i’s mean daily percentage bid-ask spread over the pre-IFRS period, calculated daily as the ask less the bid price, divided by the average of bid and ask prices; obtained from Datastream;
LogPRICEPRE the log of firm i’s per share stock price, measured at the end of the fiscal year preceding mandatory IFRS adoption; obtained from Datastream;
LogVOLUMEPRE the log of firm i’s trading volume (expressed in thousands of Euros), calculated over the pre-IFRS period; obtained from Datastream;
LogSTD_RETPRE the log of firm i’s standard deviation of stock returns, calculated over the pre-IFRS period; obtained from Datastream;
LogFFPRE the log of firm i’s percentage of free float shares, measured at the end of the pre-IFRS period; obtained from Datastream;
LogANALYSTPRE the log of firm i’s analyst following (calculated as one plus analyst following), measured over the pre-IFRS period; obtained from IBES;
IMRPRE the inverse Mills ratio, obtained from estimation of the logistic model in Table 3 Panel B examining the determinants of firm i’s provision versus non-provision of investment property fair values in the pre-IFRS period;
NO_FV_PRE an indicator variable equal to 1 if firm i does not provide either disclosed or recognized investment property fair values prior to mandatory IFRS adoption, and 0 otherwise; measured at the end of the fiscal year preceding mandatory IFRS adoption; obtained from hand-collection.

37
TABLE 5 Does Required Provision of Investment Property Fair Values Under IAS 40
Eliminate Perceived Differences Across Firms?
Panel A. Univariate analysis
Variable is BID_ASKPOST Mean Median No Fair Value (N = 18) 2.485 2.048
Fair Value (N = 59) 1.005 0.714
Difference 1.480 1.334
p-value 0.021 ** 0.004 ***
Panel B. Multivariate analysis (dependent variable is LogBID_ASKPOST) Variable Predicted Coefficient (t-statistic)
Intercept ? 2.570
(3.90) ***2.294
(3.42) ***LogPRICEPOST – 0.036
(0.58) 0.042
(0.69) LogVOLUMEPOST – –0.206
(–4.37) ***–0.204
(–4.37) ***LogSTD_RETPOST + 0.159
(1.28) 0.195
(1.57) * LogFFPOST – 0.076
(0.64) 0.144
(1.16) LogANALYSTPOST
– –0.332 (–2.44) ***
–0.298 (–2.19) **
NO_FV_PRE + 0.362 (1.66) **
N 77 77 Adj-R2 49.66% 50.85%
This table presents results from analyses examining how firms were affected by required provision of investment property fair values under IAS 40 on mandatory adoption of IFRS. Panel A provides univariate comparisons of bid-ask spreads measured within the post-IFRS period across two groups of firms: those which do not provide investment property fair value prior to mandatory IFRS adoption (“No Fair Value”), and those that provide either recognized or disclosed investment property fair value prior to mandatory IFRS adoption (“Fair Value”). The post-IFRS period is measured as the one month beginning three months following the first fiscal year end of mandatory IFRS adoption. Panel B presents multivariate analyses, where the dependent variable is LogBID_ASKPOST. We present coefficient estimates, with t-statistics indicated in parentheses. *, **, *** indicate significance at the less than 10%, 5%, and 1% levels, respectively.

38
The variables are defined as: BID_ASKPOST firm i’s mean daily percentage bid-ask spread over the post-IFRS period, calculated daily
as the ask less the bid price, divided by the average of bid and ask prices; obtained from Datastream;
LogBID_ASKPOST the log of firm i’s mean daily percentage bid-ask spread over the post-IFRS period, calculated daily as the ask price less the bid price, divided by the average of bid and ask prices; obtained from Datastream;
LogPRICEPOST the log of firm i’s per share stock price, measured at the end of the fiscal year of mandatory IFRS adoption; obtained from Datastream;
LogVOLUMEPOST the log of firm i’s trading volume (expressed in thousands of Euros), calculated over the post-IFRS period; obtained from Datastream;
LogSTD_RETPOST the log of firm i’s standard deviation of stock returns, calculated over the post-IFRS period; obtained from Datastream;
LogFFPOST the log of firm i’s percentage of free float shares, measured at the end of the post-IFRS period; obtained from Datastream;
LogANALYSTPOST the log of firm i’s analyst following (calculated as one plus analyst following), measured over the post-IFRS period; obtained from IBES;
NO_FV_PRE an indicator variable equal to 1 if firm i does not provide either disclosed or recognized investment property fair values prior to mandatory IFRS adoption, and 0 otherwise; obtained from hand-collection.
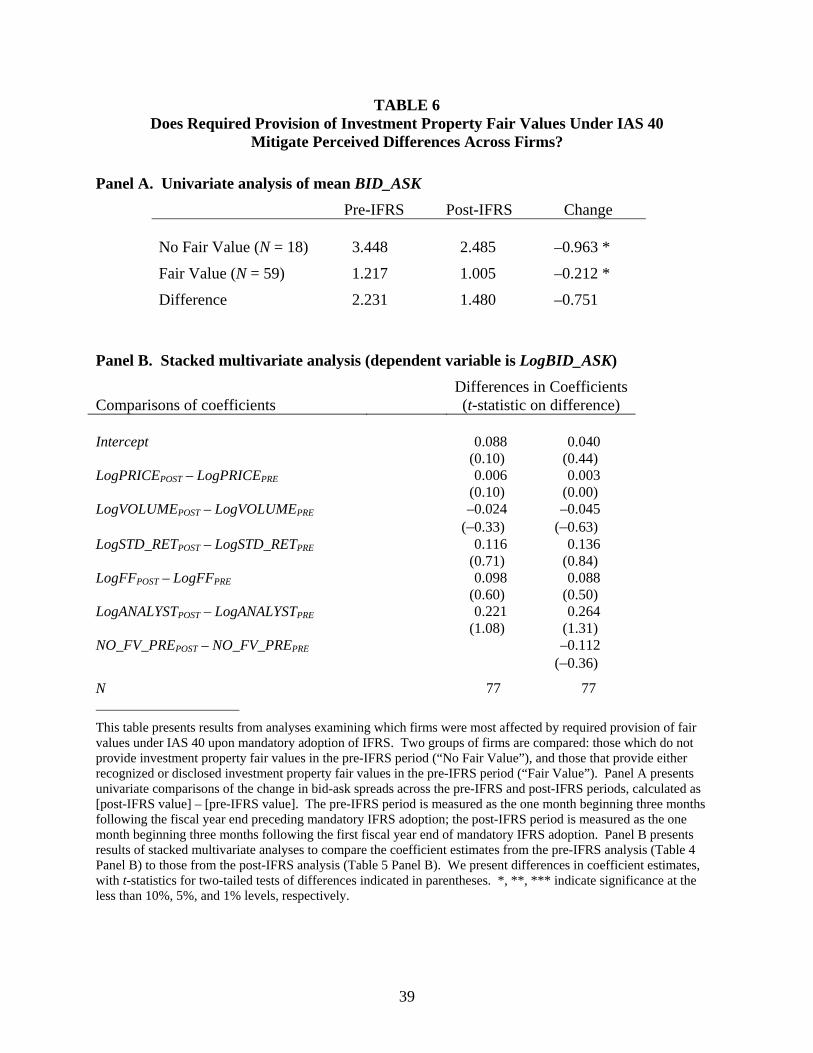
39
TABLE 6 Does Required Provision of Investment Property Fair Values Under IAS 40
Mitigate Perceived Differences Across Firms?
Panel A. Univariate analysis of mean BID_ASK
Pre-IFRS Post-IFRS Change No Fair Value (N = 18) 3.448 2.485 –0.963 *
Fair Value (N = 59) 1.217 1.005 –0.212 *
Difference 2.231 1.480 –0.751
Panel B. Stacked multivariate analysis (dependent variable is LogBID_ASK) Comparisons of coefficients
Differences in Coefficients (t-statistic on difference)
Intercept 0.088
(0.10) 0.040
(0.44) LogPRICEPOST – LogPRICEPRE 0.006
(0.10) 0.003
(0.00) LogVOLUMEPOST – LogVOLUMEPRE –0.024
(–0.33) –0.045
(–0.63) LogSTD_RETPOST – LogSTD_RETPRE 0.116
(0.71) 0.136
(0.84) LogFFPOST – LogFFPRE 0.098
(0.60) 0.088
(0.50) LogANALYSTPOST – LogANALYSTPRE
0.221 (1.08)
0.264 (1.31)
NO_FV_PREPOST – NO_FV_PREPRE
–0.112 (–0.36)
N 77 77
This table presents results from analyses examining which firms were most affected by required provision of fair values under IAS 40 upon mandatory adoption of IFRS. Two groups of firms are compared: those which do not provide investment property fair values in the pre-IFRS period (“No Fair Value”), and those that provide either recognized or disclosed investment property fair values in the pre-IFRS period (“Fair Value”). Panel A presents univariate comparisons of the change in bid-ask spreads across the pre-IFRS and post-IFRS periods, calculated as [post-IFRS value] – [pre-IFRS value]. The pre-IFRS period is measured as the one month beginning three months following the fiscal year end preceding mandatory IFRS adoption; the post-IFRS period is measured as the one month beginning three months following the first fiscal year end of mandatory IFRS adoption. Panel B presents results of stacked multivariate analyses to compare the coefficient estimates from the pre-IFRS analysis (Table 4 Panel B) to those from the post-IFRS analysis (Table 5 Panel B). We present differences in coefficient estimates, with t-statistics for two-tailed tests of differences indicated in parentheses. *, **, *** indicate significance at the less than 10%, 5%, and 1% levels, respectively.

40
The variables are defined as: BID_ASK firm i’s mean percentage bid-ask spread measured either over the pre-IFRS or post-IFRS
period; calculated daily as the ask less the bid price, divided by the average of bid and ask prices; obtained from Datastream;
LogBID_ASK the log of firm i’s mean percentage bid-ask spread, measured either over the pre-IFRS or post-IFRS period; calculated daily as the ask less the bid price, divided by the average of bid and ask prices; obtained from Datastream;
LogPRICE the log of firm i’s per share stock price, measured either in the pre-IFRS period (at the end of the fiscal year preceding mandatory IFRS adoption) or post-IFRS period (at the end of the fiscal year of mandatory IFRS adoption); obtained from Datastream;
LogVOLUME the log of firm i’s trading volume (expressed in thousands of Euros), measured either over the pre-IFRS or post-IFRS period; obtained from Datastream;
LogSTD_RET the log of firm i’s standard deviation of stock returns, measured either over the pre-IFRS or post-IFRS period; obtained from Datastream;
LogFF the log of firm i’s percentage of closely held shares, measured either over the pre-IFRS or post-IFRS period; obtained from Datastream;
LogANALYST the log of firm i’s analyst following (measured as one plus analyst following), measured either over the pre-IFRS or post-IFRS period; obtained from Datastream;
NO_FV_PRE an indicator variable equal to 1 if firm i does not provide investment property fair values in the pre-IFRS period, and 0 otherwise; obtained from hand-collection.