Consensual Poverty in Britain, Sweden and Bangladesh: A ...bangladeshsociology.org/Consensual...
22
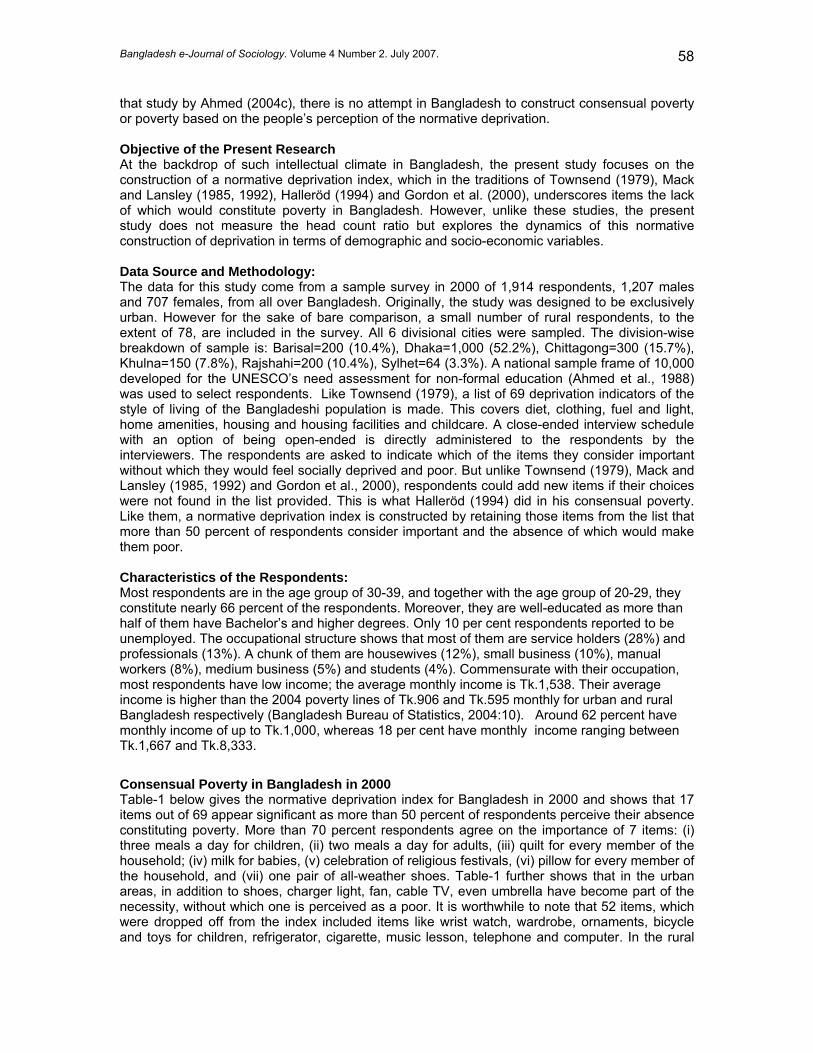
Bangladesh e-Journal of Sociology. Volume 4 Number 2. July 2007. 56 Consensual Poverty in Britain, Sweden and Bangladesh: A Comparative Study A. I. Mahbub Uddin Ahmed • Abstract The study focuses on the construction of a normative deprivation index for Bangladesh, which in the traditions of Townsend (1979), Mack and Lansley (1985, 1992), Halleröd (1994) and Gordon et al. (2000), underscores items the lack of which would constitute poverty. However, unlike these studies, the present study does not measure the head count ratio but explores the dynamics of this normative construction of deprivation in terms of demographic and socio- economic variables. The data for this study come from a sample survey of 1,914 respondents, 1,207 males and 707 females, from all over Bangladesh in 2000. The normative deprivation index for Bangladesh in 2000 shows that 17 items out of 69 appear significant at the level of α=.01 in inter-item total correlation and more than 50 percent of respondents perceive their absence as constituting poverty. More than 70 percent respondents agree on the importance of 7 items: (i) three meals a day for children, (ii) two meals a day for adults, (iii) quilt for every member of the household; (iv) milk for babies, (v) celebration of religious festivals, (vi) pillow for every member of the household, and (vii) one pair of all-weather shoes. The British society during 1960s was more concerned with cooked breakfast, children’s birthday party and a week’s holiday, whereas during 1980s and 1990s, it was more preoccupied with heating, toilet, bath, beds and damp free home. However, during late 1990s, there was a shift of trend towards hospital visit and two meals a day. The Swedish society had more medical priorities than others and viewed glasses, vacuum cleaner and telephone as more necessary than bed, heating, toilet and bath as perceived by the British. In terms of correlates, the Bangladesh deprivation index is found significantly related to occupation, education and age followed by residence, income and gender. Thus the experience of poverty is specific to time and space; it is society-subjective and normative. Introduction Most research on poverty focus on the measurement of poverty and the construction of income poverty line for the purpose of determining the extent of poverty. This is evident in the early studies of poverty in England (Mayhew, 1861; Booth, 1889, 1902; Rowntree, 1901). i Based on subsistence, the poverty line for a ‘moderate family’ of man and wife and 3 children in 1898-99 was constructed as less than 21s. per week in London (Booth, 1902-3) and 17s. 8d. per week at York (Rowntree, 1901). ii This subsistence model has influenced nearly all subsequent studies in England (Bell, 1912, Davies, 1909, Reeves, 1914, Bowley and Burneet-Hurst, 1915, Bowley and Hogg, 1925, Soutar, Wilkins and Florence, 1942). iii An adaptation of the Rowntree method was used by the US Department of Agriculture in its Social Security Administration Poverty Index in 1959 (Orshansky, 1965, 1967). iv The 1964 report of the Council of Economic Advisers set out the $3000 poverty level for the United States, and was subsequently refined to form the official poverty line. v Such an official poverty line, however, is non-existent in Britain. This resulted in the researchers’ dependence on other statistical indicators like benefit provisions and income benefit. Thus a poor was defined as anyone having an income at or below the level of supplementary benefit vi or below 60 per cent of median income. vii Nonetheless, surveys by Townsend (1979), Mack and Lansley (1985, 1992) and Gordon et al. (2000) initiated a new trend in poverty discourse in Britain. This was labeled as consensual poverty in which respondents were asked to name items the lack of which would constitute poverty according to them. The United Nations Development Programme (UNDP, 2005) interrelates human poverty with human development, and uses three composite indexes viii to define and measure poverty, Human Development Index (HDI), Human Poverty Index (HPI-1) and Gender-Related Development Index (GDI). The Organisation for Economic Co-operation and Development (OECD) views poverty as multidimensional deprivation (OECD, 2001:37) and moves away from the notion of absolute • Professor of Sociology University of Dhaka. Email: [email protected]
Transcript of Consensual Poverty in Britain, Sweden and Bangladesh: A ...bangladeshsociology.org/Consensual...
Bangladesh e-Journal of Sociology. Volume 4 Number 2. July 2007. 56
Consensual Poverty in Britain, Sweden and Bangladesh: A Comparative Study
A. I. Mahbub Uddin Ahmed•
Abstract The study focuses on the construction of a normative deprivation index for Bangladesh, which in the traditions of Townsend (1979), Mack and Lansley (1985, 1992), Halleröd (1994) and Gordon et al. (2000), underscores items the lack of which would constitute poverty. However, unlike these studies, the present study does not measure the head count ratio but explores the dynamics of this normative construction of deprivation in terms of demographic and socio-economic variables. The data for this study come from a sample survey of 1,914 respondents, 1,207 males and 707 females, from all over Bangladesh in 2000. The normative deprivation index for Bangladesh in 2000 shows that 17 items out of 69 appear significant at the level of α=.01 in inter-item total correlation and more than 50 percent of respondents perceive their absence as constituting poverty. More than 70 percent respondents agree on the importance of 7 items: (i) three meals a day for children, (ii) two meals a day for adults, (iii) quilt for every member of the household; (iv) milk for babies, (v) celebration of religious festivals, (vi) pillow for every member of the household, and (vii) one pair of all-weather shoes. The British society during 1960s was more concerned with cooked breakfast, children’s birthday party and a week’s holiday, whereas during 1980s and 1990s, it was more preoccupied with heating, toilet, bath, beds and damp free home. However, during late 1990s, there was a shift of trend towards hospital visit and two meals a day. The Swedish society had more medical priorities than others and viewed glasses, vacuum cleaner and telephone as more necessary than bed, heating, toilet and bath as perceived by the British. In terms of correlates, the Bangladesh deprivation index is found significantly related to occupation, education and age followed by residence, income and gender. Thus the experience of poverty is specific to time and space; it is society-subjective and normative.
Introduction Most research on poverty focus on the measurement of poverty and the construction of income poverty line for the purpose of determining the extent of poverty. This is evident in the early studies of poverty in England (Mayhew, 1861; Booth, 1889, 1902; Rowntree, 1901).i Based on subsistence, the poverty line for a ‘moderate family’ of man and wife and 3 children in 1898-99 was constructed as less than 21s. per week in London (Booth, 1902-3) and 17s. 8d. per week at York (Rowntree, 1901).ii This subsistence model has influenced nearly all subsequent studies in England (Bell, 1912, Davies, 1909, Reeves, 1914, Bowley and Burneet-Hurst, 1915, Bowley and Hogg, 1925, Soutar, Wilkins and Florence, 1942).iii An adaptation of the Rowntree method was used by the US Department of Agriculture in its Social Security Administration Poverty Index in 1959 (Orshansky, 1965, 1967).iv The 1964 report of the Council of Economic Advisers set out the $3000 poverty level for the United States, and was subsequently refined to form the official poverty line.v Such an official poverty line, however, is non-existent in Britain. This resulted in the researchers’ dependence on other statistical indicators like benefit provisions and income benefit. Thus a poor was defined as anyone having an income at or below the level of supplementary benefitvi or below 60 per cent of median income.vii Nonetheless, surveys by Townsend (1979), Mack and Lansley (1985, 1992) and Gordon et al. (2000) initiated a new trend in poverty discourse in Britain. This was labeled as consensual poverty in which respondents were asked to name items the lack of which would constitute poverty according to them. The United Nations Development Programme (UNDP, 2005) interrelates human poverty with human development, and uses three composite indexesviii to define and measure poverty, Human Development Index (HDI), Human Poverty Index (HPI-1) and Gender-Related Development Index (GDI). The Organisation for Economic Co-operation and Development (OECD) views poverty as multidimensional deprivation (OECD, 2001:37) and moves away from the notion of absolute • Professor of Sociology University of Dhaka. Email: [email protected]

Bangladesh e-Journal of Sociology. Volume 4 Number 2. July 2007. 57
poverty to capacity poverty:ix The World Bank defines poverty as unacceptable human deprivation in terms of economic opportunity, education, health and nutrition, as well as lack of empowerment and security. x In the Western and the Third World poverty discourses, there are five broad indicators of poverty definition and measurement (Gordon et al., 2000:72-75). They are summarized in Figure-1 below:
Poverty measurement Major representative work 1. Consensual indicators: Townsend (1979); Mack and Lansley (1985); Gordon and Pantazis (1997) 2. Social exclusion: Levitas (1999); Silver (1994); Gore and Figueiredo (1996); Room (1995) 3. Subjective measures: a. Income proxy:
Viet-Wilson (1987)
b. Consensual poverty lines Walker (1987), Halleröd (1995a) c. Sociovital Minimum Income Level
Callan et al. (1989); Townsend and Gordon (1991); Townsend et al. (1996, 1997); Saunders and Matheson (1992); Brodbury (1989); Callan and Nolan (1991)
4. Income thresholds: Abel-Smith and Townsend (1965) 5. Budget standards: Rowntree (1901, 1941, 1951); Beveridge (1942); Bradshaw (1993); Orshansky (1965) Source: Gordon et al. (2000:72-75).
Figure-1 Poverty Discourses in the Western and the Third World In Bangladesh, poverty studies follow budget standards approach and mainly concentrate on the measurement of poverty and the estimation of its magnitude. The other approaches of poverty measurement have been neglected. Bangladesh Institute of Development Studies (BIDS) has monopolized this type of research on poverty and due to its academic background, it only produced poverty monologue, construction of income poverty line. For this purpose, two official methods-- (a) direct caloric intake (DCI) and (b) cost-of basic needs (CBN)-- are used to estimate poverty line in Household Expenditure Survey, 1995-96 (Bangladesh Bureau of Statistics,1998) and Household Income and Expenditure Survey, 2000 (Bangladesh Bureau of Statistics, 2001:55).xi Whereas other surveys like the Poverty Monitoring Survey of 1994, Poverty Monitoring Survey of 1999 and Poverty Monitoring Survey of 2004 have used Food Energy Intake (FEI) method. In 2004, this measure yields two separate income poverty lines for urban and rural areas of Tk.906 and Tk.595 respectively (Bangladesh Bureau of Statistics, 2004:10).xii Such mainstream poverty research has been recently criticized by Sen and Hulme (2004) in their measurement of chronic poverty. Ahmed’s (2004a) analysis of UNDP survey on Tanore and Gaibandha was a departure from the economic tradition, and was probably the only empirical survey on different types of poverty in rural Bangladesh. In the urban context, Ahmed (2004d) also used non-economic notion of poverty.xiii Though most recently some studies have introduced few questions to capture people’s perception regarding poverty status, these are not explored rigorously. The context of poverty studies clearly demonstrates that the concept of poverty is a political one (Alcock, 1993:3). Since the concept is politically charged, its measurements are also tailored to suit the political agenda (Ahmed, 2004b). The controversy between Rowntree and Townsend as mentioned earlier is a clear proof. In addition to that, each measure of poverty has developed in a given spime or space and time (Rahnema, 1993). This results in difficulties and frustrations for cross-cultural poverty researchers. The different poverty assumptions are called "discourses of poverty" (Veit-Wilson, 2000: 141-164).xiv It is argued that in the U.S., the economistic and behavioral discourses are dominant while the structural discourse is dominant among the British social scientists (Veit-Wilson, 1 9 9 8 a : 4 1 -48 and 92-100). The need for a sociological conceptualization of poverty is felt in the academic arena of Bangladesh. Led by Bangladesh Sociological Society, a 2004 seminar on Exploring the Sociological Perspective of Poverty, underscored the need for challenging the concept of income poverty (Islam, 2004; Khan, 2004). It also emphasized the importance of empirical survey on Bangladesh poverty and alternate subjective measurement of poverty (Ahmed, 2004c). Except for
Bangladesh e-Journal of Sociology. Volume 4 Number 2. July 2007. 58
that study by Ahmed (2004c), there is no attempt in Bangladesh to construct consensual poverty or poverty based on the people’s perception of the normative deprivation. Objective of the Present Research At the backdrop of such intellectual climate in Bangladesh, the present study focuses on the construction of a normative deprivation index, which in the traditions of Townsend (1979), Mack and Lansley (1985, 1992), Halleröd (1994) and Gordon et al. (2000), underscores items the lack of which would constitute poverty in Bangladesh. However, unlike these studies, the present study does not measure the head count ratio but explores the dynamics of this normative construction of deprivation in terms of demographic and socio-economic variables. Data Source and Methodology: The data for this study come from a sample survey in 2000 of 1,914 respondents, 1,207 males and 707 females, from all over Bangladesh. Originally, the study was designed to be exclusively urban. However for the sake of bare comparison, a small number of rural respondents, to the extent of 78, are included in the survey. All 6 divisional cities were sampled. The division-wise breakdown of sample is: Barisal=200 (10.4%), Dhaka=1,000 (52.2%), Chittagong=300 (15.7%), Khulna=150 (7.8%), Rajshahi=200 (10.4%), Sylhet=64 (3.3%). A national sample frame of 10,000 developed for the UNESCO’s need assessment for non-formal education (Ahmed et al., 1988) was used to select respondents. Like Townsend (1979), a list of 69 deprivation indicators of the style of living of the Bangladeshi population is made. This covers diet, clothing, fuel and light, home amenities, housing and housing facilities and childcare. A close-ended interview schedule with an option of being open-ended is directly administered to the respondents by the interviewers. The respondents are asked to indicate which of the items they consider important without which they would feel socially deprived and poor. But unlike Townsend (1979), Mack and Lansley (1985, 1992) and Gordon et al., 2000), respondents could add new items if their choices were not found in the list provided. This is what Halleröd (1994) did in his consensual poverty. Like them, a normative deprivation index is constructed by retaining those items from the list that more than 50 percent of respondents consider important and the absence of which would make them poor. Characteristics of the Respondents: Most respondents are in the age group of 30-39, and together with the age group of 20-29, they constitute nearly 66 percent of the respondents. Moreover, they are well-educated as more than half of them have Bachelor’s and higher degrees. Only 10 per cent respondents reported to be unemployed. The occupational structure shows that most of them are service holders (28%) and professionals (13%). A chunk of them are housewives (12%), small business (10%), manual workers (8%), medium business (5%) and students (4%). Commensurate with their occupation, most respondents have low income; the average monthly income is Tk.1,538. Their average income is higher than the 2004 poverty lines of Tk.906 and Tk.595 monthly for urban and rural Bangladesh respectively (Bangladesh Bureau of Statistics, 2004:10). Around 62 percent have monthly income of up to Tk.1,000, whereas 18 per cent have monthly income ranging between Tk.1,667 and Tk.8,333.
Consensual Poverty in Bangladesh in 2000 Table-1 below gives the normative deprivation index for Bangladesh in 2000 and shows that 17 items out of 69 appear significant as more than 50 percent of respondents perceive their absence constituting poverty. More than 70 percent respondents agree on the importance of 7 items: (i) three meals a day for children, (ii) two meals a day for adults, (iii) quilt for every member of the household; (iv) milk for babies, (v) celebration of religious festivals, (vi) pillow for every member of the household, and (vii) one pair of all-weather shoes. Table-1 further shows that in the urban areas, in addition to shoes, charger light, fan, cable TV, even umbrella have become part of the necessity, without which one is perceived as a poor. It is worthwhile to note that 52 items, which were dropped off from the index included items like wrist watch, wardrobe, ornaments, bicycle and toys for children, refrigerator, cigarette, music lesson, telephone and computer. In the rural
Bangladesh e-Journal of Sociology. Volume 4 Number 2. July 2007. 59
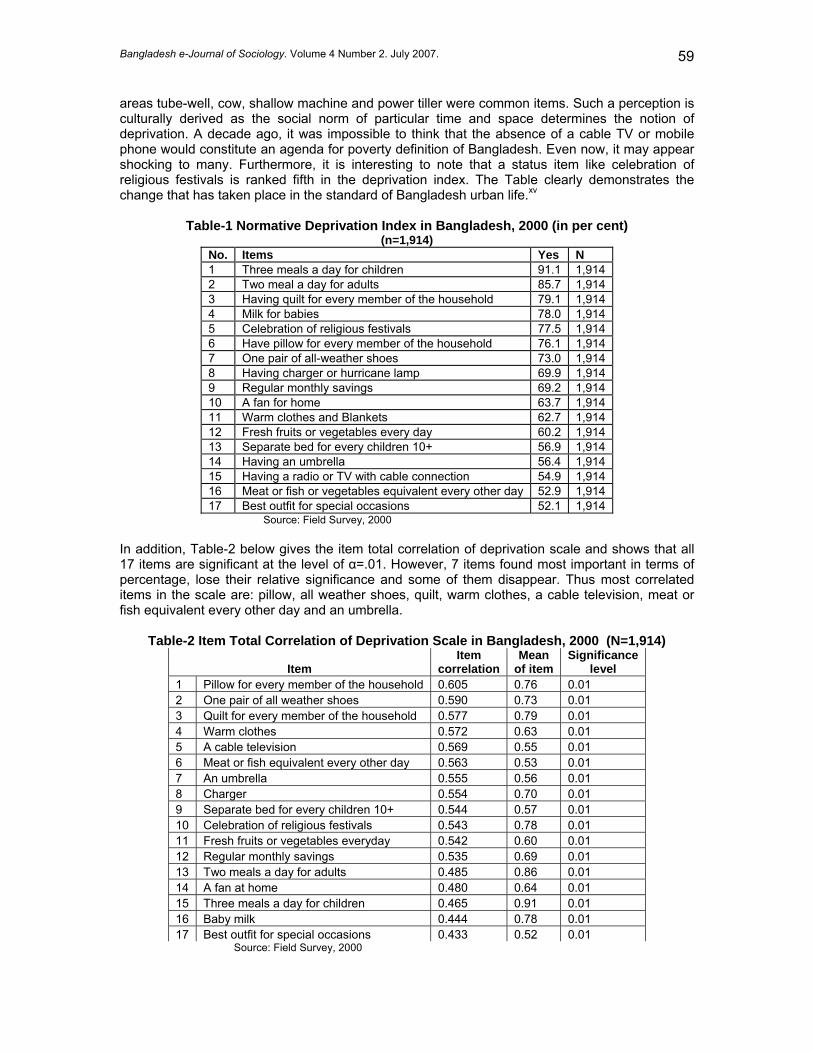
areas tube-well, cow, shallow machine and power tiller were common items. Such a perception is culturally derived as the social norm of particular time and space determines the notion of deprivation. A decade ago, it was impossible to think that the absence of a cable TV or mobile phone would constitute an agenda for poverty definition of Bangladesh. Even now, it may appear shocking to many. Furthermore, it is interesting to note that a status item like celebration of religious festivals is ranked fifth in the deprivation index. The Table clearly demonstrates the change that has taken place in the standard of Bangladesh urban life.xv
Table-1 Normative Deprivation Index in Bangladesh, 2000 (in per cent) (n=1,914)
No. Items Yes N 1 Three meals a day for children 91.1 1,914 2 Two meal a day for adults 85.7 1,914 3 Having quilt for every member of the household 79.1 1,914 4 Milk for babies 78.0 1,914 5 Celebration of religious festivals 77.5 1,914 6 Have pillow for every member of the household 76.1 1,914 7 One pair of all-weather shoes 73.0 1,914 8 Having charger or hurricane lamp 69.9 1,914 9 Regular monthly savings 69.2 1,914 10 A fan for home 63.7 1,914 11 Warm clothes and Blankets 62.7 1,914 12 Fresh fruits or vegetables every day 60.2 1,914 13 Separate bed for every children 10+ 56.9 1,914 14 Having an umbrella 56.4 1,914 15 Having a radio or TV with cable connection 54.9 1,914 16 Meat or fish or vegetables equivalent every other day 52.9 1,914 17 Best outfit for special occasions 52.1 1,914
Source: Field Survey, 2000 In addition, Table-2 below gives the item total correlation of deprivation scale and shows that all 17 items are significant at the level of α=.01. However, 7 items found most important in terms of percentage, lose their relative significance and some of them disappear. Thus most correlated items in the scale are: pillow, all weather shoes, quilt, warm clothes, a cable television, meat or fish equivalent every other day and an umbrella.
Table-2 Item Total Correlation of Deprivation Scale in Bangladesh, 2000 (N=1,914)
Item Item
correlation Mean
of item Significance
level 1 Pillow for every member of the household 0.605 0.76 0.01 2 One pair of all weather shoes 0.590 0.73 0.01 3 Quilt for every member of the household 0.577 0.79 0.01 4 Warm clothes 0.572 0.63 0.01 5 A cable television 0.569 0.55 0.01 6 Meat or fish equivalent every other day 0.563 0.53 0.01 7 An umbrella 0.555 0.56 0.01 8 Charger 0.554 0.70 0.01 9 Separate bed for every children 10+ 0.544 0.57 0.01 10 Celebration of religious festivals 0.543 0.78 0.01 11 Fresh fruits or vegetables everyday 0.542 0.60 0.01 12 Regular monthly savings 0.535 0.69 0.01 13 Two meals a day for adults 0.485 0.86 0.01 14 A fan at home 0.480 0.64 0.01 15 Three meals a day for children 0.465 0.91 0.01 16 Baby milk 0.444 0.78 0.01 17 Best outfit for special occasions 0.433 0.52 0.01
Source: Field Survey, 2000
Bangladesh e-Journal of Sociology. Volume 4 Number 2. July 2007. 60
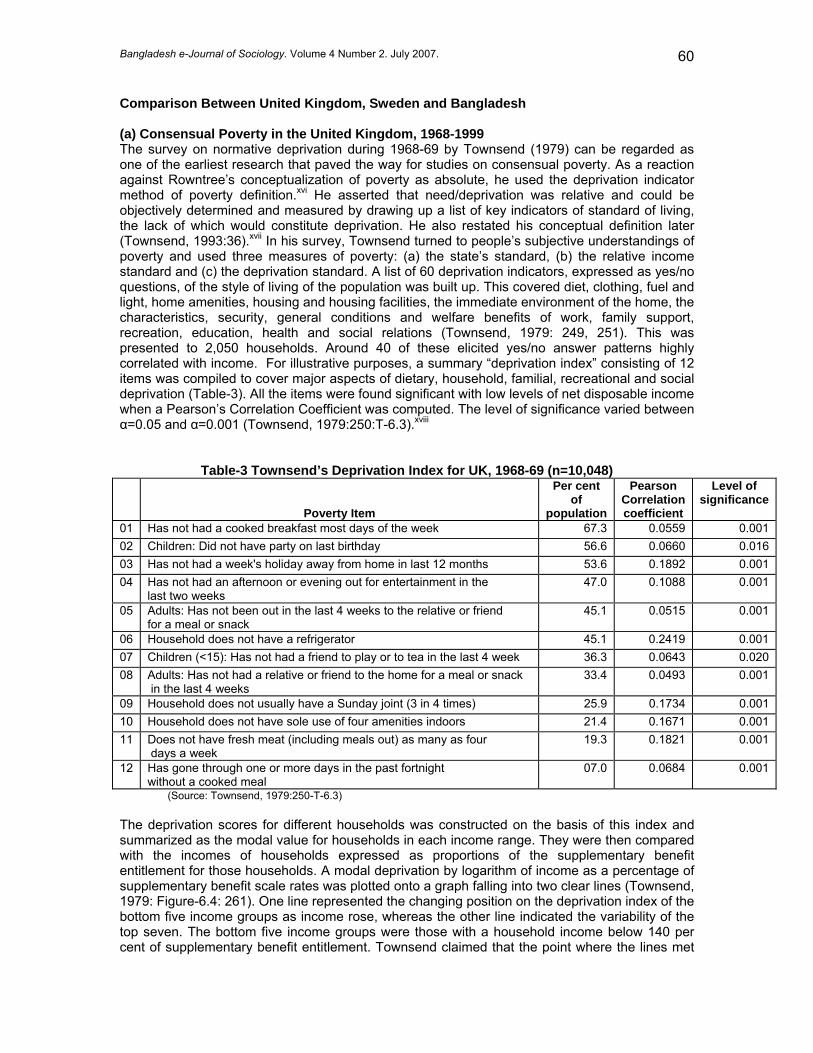
Comparison Between United Kingdom, Sweden and Bangladesh (a) Consensual Poverty in the United Kingdom, 1968-1999 The survey on normative deprivation during 1968-69 by Townsend (1979) can be regarded as one of the earliest research that paved the way for studies on consensual poverty. As a reaction against Rowntree’s conceptualization of poverty as absolute, he used the deprivation indicator method of poverty definition.xvi He asserted that need/deprivation was relative and could be objectively determined and measured by drawing up a list of key indicators of standard of living, the lack of which would constitute deprivation. He also restated his conceptual definition later (Townsend, 1993:36).xvii In his survey, Townsend turned to people’s subjective understandings of poverty and used three measures of poverty: (a) the state’s standard, (b) the relative income standard and (c) the deprivation standard. A list of 60 deprivation indicators, expressed as yes/no questions, of the style of living of the population was built up. This covered diet, clothing, fuel and light, home amenities, housing and housing facilities, the immediate environment of the home, the characteristics, security, general conditions and welfare benefits of work, family support, recreation, education, health and social relations (Townsend, 1979: 249, 251). This was presented to 2,050 households. Around 40 of these elicited yes/no answer patterns highly correlated with income. For illustrative purposes, a summary “deprivation index” consisting of 12 items was compiled to cover major aspects of dietary, household, familial, recreational and social deprivation (Table-3). All the items were found significant with low levels of net disposable income when a Pearson’s Correlation Coefficient was computed. The level of significance varied between α=0.05 and α=0.001 (Townsend, 1979:250:T-6.3).xviii
Table-3 Townsend’s Deprivation Index for UK, 1968-69 (n=10,048)
Poverty Item
Per cent of
population
Pearson Correlation coefficient
Level of significance
01 Has not had a cooked breakfast most days of the week 67.3 0.0559 0.00102 Children: Did not have party on last birthday 56.6 0.0660 0.01603 Has not had a week's holiday away from home in last 12 months 53.6 0.1892 0.00104 Has not had an afternoon or evening out for entertainment in the
last two weeks 47.0 0.1088 0.001
05 Adults: Has not been out in the last 4 weeks to the relative or friend for a meal or snack
45.1 0.0515 0.001
06 Household does not have a refrigerator 45.1 0.2419 0.00107 Children (<15): Has not had a friend to play or to tea in the last 4 week 36.3 0.0643 0.02008 Adults: Has not had a relative or friend to the home for a meal or snack
in the last 4 weeks 33.4 0.0493 0.001
09 Household does not usually have a Sunday joint (3 in 4 times) 25.9 0.1734 0.00110 Household does not have sole use of four amenities indoors 21.4 0.1671 0.00111 Does not have fresh meat (including meals out) as many as four
days a week 19.3 0.1821 0.001
12 Has gone through one or more days in the past fortnight without a cooked meal
07.0 0.0684 0.001
(Source: Townsend, 1979:250-T-6.3) The deprivation scores for different households was constructed on the basis of this index and summarized as the modal value for households in each income range. They were then compared with the incomes of households expressed as proportions of the supplementary benefit entitlement for those households. A modal deprivation by logarithm of income as a percentage of supplementary benefit scale rates was plotted onto a graph falling into two clear lines (Townsend, 1979: Figure-6.4: 261). One line represented the changing position on the deprivation index of the bottom five income groups as income rose, whereas the other line indicated the variability of the top seven. The bottom five income groups were those with a household income below 140 per cent of supplementary benefit entitlement. Townsend claimed that the point where the lines met
Bangladesh e-Journal of Sociology. Volume 4 Number 2. July 2007. 61
constituted a “threshold of deprivation.”xix This could be treated as an objective definition of relative poverty, the poverty line being 140 per cent of supplementary benefit entitlement. Thus he found approximately 23 per cent household as poor (Townsend, 1979: 271). Table-3 above gives a list of items the lack of which constituted poverty for the United Kingdom in 1960. Only three items-- no cooked breakfast most days of the week, no birthday party for children in last year and no week’s holiday away from home in last 12 months— constituted poverty items, which were agreed by more than 50 per cent of the population. However, all twelve items listed in the Table were found to be statistically significant and together, constituted the deprivation index.xx
Using the deprivation indicator method of Townsend to define poverty and poverty line, two studies in 1983 and 1990 were conducted in Britain by Mack and Lansley (1985; 1992). In 1983 an opinion poll for a television program called ‘Breadline Britain’ was conducted to determine people’s perception of the normative deprivation. They defined poverty as “an enforced lack of socially perceived necessities. This means that the ‘necessities’ of life are identified by public opinion and not by, on the one hand, the views of experts or, on the other hand, the norms of behaviour per se.” (Mack and Lansley, 1985:39). Thus, similar to Townsend, they included both personal consumption items and social activities in their definition of necessities.xxi On the basis of their findings, they created a list of 21 basic necessities that more than 50 per cent of respondents considered important for a normal life. More than 90 per cent of respondents agreed on the importance of a further 5 necessities: heating, an indoor toilet and bath, a bed for each member of the household, and a home free from damp. The respondents were also asked whether or not they thought each potential indicator was necessary to avoid hardship. Then they were asked whether they lacked those indicators and whether this lack was due to the lack of resources to purchase them.xxii Poverty was thus defined as a lack of 3 or more of the 26 necessities, and severe poverty was defined as a lack of 7 or more necessities. Thus, according to these 26 necessities and their presence or absence among British households, they measured poverty levels in 1983 (Mack and Lansley, 1985) and in 1990 (Mack and Lansley, 1992). In terms of poverty threshold-- a lack of 3 or more items-- they found around 21 per cent of the UK population as poor in 1990 (Mack and Lansley, 1992) as against around 14 per cent in 1983 (Mack and Lansley, 1985:89), a rise of 7 per cent in 7 years or a percent each year. As their approach is grounded in socially defined need,xxiii it is labeled as “consensual deprivation indicator” (Fisher, 2001).xxiv
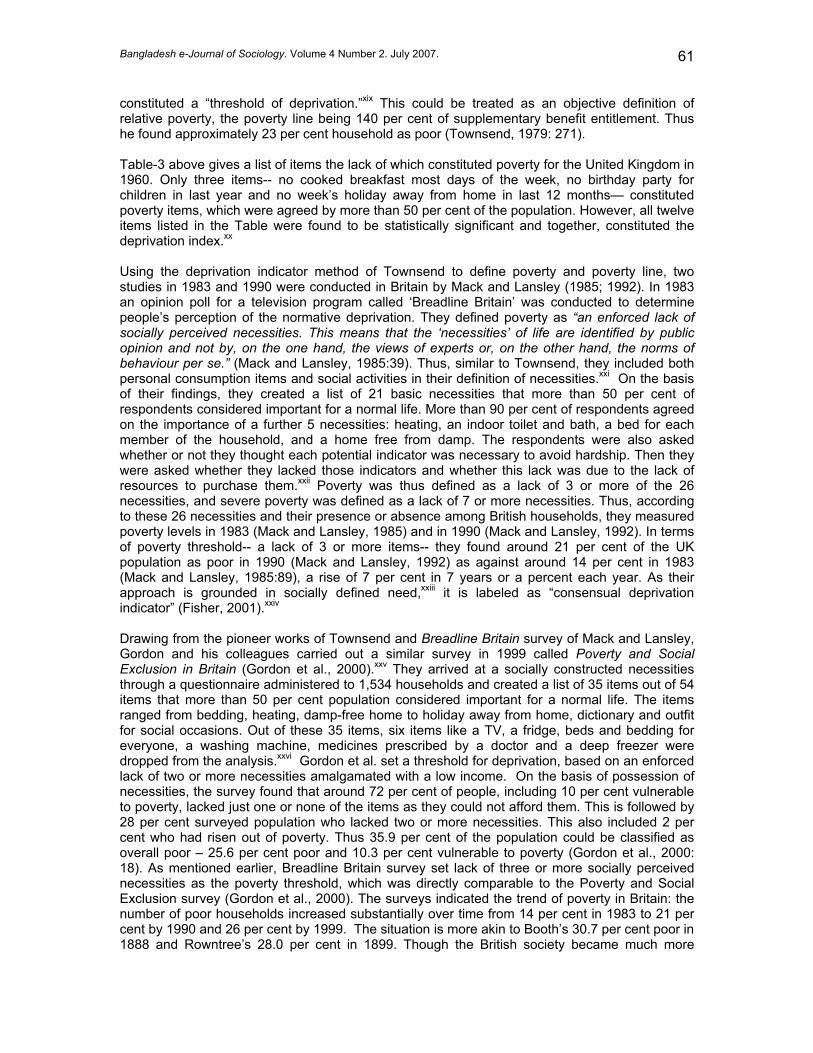
Drawing from the pioneer works of Townsend and Breadline Britain survey of Mack and Lansley, Gordon and his colleagues carried out a similar survey in 1999 called Poverty and Social Exclusion in Britain (Gordon et al., 2000).xxv They arrived at a socially constructed necessities through a questionnaire administered to 1,534 households and created a list of 35 items out of 54 items that more than 50 per cent population considered important for a normal life. The items ranged from bedding, heating, damp-free home to holiday away from home, dictionary and outfit for social occasions. Out of these 35 items, six items like a TV, a fridge, beds and bedding for everyone, a washing machine, medicines prescribed by a doctor and a deep freezer were dropped from the analysis.xxvi Gordon et al. set a threshold for deprivation, based on an enforced lack of two or more necessities amalgamated with a low income. On the basis of possession of necessities, the survey found that around 72 per cent of people, including 10 per cent vulnerable to poverty, lacked just one or none of the items as they could not afford them. This is followed by 28 per cent surveyed population who lacked two or more necessities. This also included 2 per cent who had risen out of poverty. Thus 35.9 per cent of the population could be classified as overall poor – 25.6 per cent poor and 10.3 per cent vulnerable to poverty (Gordon et al., 2000: 18). As mentioned earlier, Breadline Britain survey set lack of three or more socially perceived necessities as the poverty threshold, which was directly comparable to the Poverty and Social Exclusion survey (Gordon et al., 2000). The surveys indicated the trend of poverty in Britain: the number of poor households increased substantially over time from 14 per cent in 1983 to 21 per cent by 1990 and 26 per cent by 1999. The situation is more akin to Booth’s 30.7 per cent poor in 1888 and Rowntree’s 28.0 per cent in 1899. Though the British society became much more
Bangladesh e-Journal of Sociology. Volume 4 Number 2. July 2007. 62
affluent since the early 1980s, in terms of enforced lack of necessities, there has been a dramatic rise of poverty by 2000 for the low income group.
Table-4 Deprivation Index for Britain, 1999 (in Per Cent) (n=1,534)
Items
Considered Necessary Don't have,
Don’t want
Don't have, Can’t afford Variation
1 Beds and bedding for everyone 95 0.2 1.0 -80.0 2 Heating to warm living areas of the home 94 0.4 1.0 -60.0 3 Damp-free home 93 3.0 6.0 -50.0 4 Visiting friends or family in hospital 92 8.0 3.0 166.7 5 Two meals a day 91 3.0 1.0 200.0 6 Medicines prescribed by doctor 90 5.0 1.0 400.0 7 Refrigerator 89 1.0 0.1 900.0 8 Fresh fruit and vegetables daily 86 7.0 4.0 75.0 9 Warm, waterproof coat 85 2.0 4.0 -50.0
10 Replace or repair broken electrical goods 85 6.0 12.0 -50.0 11 Visits to friends or family 84 3.0 2.0 50.0 12 Celebrations on special occasions such as Christmas 83 2.0 2.0 0.0 13 Money to keep home in a decent state of decoration 82 2.0 14.0 -85.7 14 Visit to school, e.g. sports day 81 33.0 2.0 1550.0 15 Attending weddings, funerals 80 3.0 3.0 0.0 16 Meat, fish or vegetarian equivalent every other day 79 4.0 3.0 33.3 17 Insurance of contents of dwelling 79 5.0 8.0 -37.5 18 Hobby or leisure activity 78 12.0 7.0 71.4 19 Washing machine 76 3.0 1.0 200.0 20 Collect children from school 75 36.0 2.0 1700.0 21 Telephone 71 1.0 1.0 0.0 22 Appropriate clothes for job interviews 69 13.0 4.0 225.0 23 Deep freezer/fridge freezer 68 3.0 2.0 50.0 24 Carpets in living rooms and bedrooms 67 2.0 3.0 -33.3 25 Regular savings ( of ₤10 per month) for rainy days or retirement 66 7.0 25.0 -72.0 26 Two pairs of all-weather shoes 64 4.0 5.0 -20.0 27 Friends or family round for a meal 64 10.0 6.0 66.7 28 A small amount of money to spend on self weekly not on family 59 3.0 13.0 -76.9 29 Television 56 1.0 1.0 0.0 30 Roast joint/vegetarian equivalent once a week 56 11.0 3.0 266.7 31 Presents for friends/ family once a year 56 1.0 3.0 -66.7 32 A holiday away from home once a year not with relatives 55 14.0 18.0 -22.2 33 Replace worn-out furniture 54 6.0 12.0 -50.0 34 Dictionary 53 6.0 5.0 20.0 35 An outfit for social occasions 51 4.0 4.0 0.0
(Source: Gordon et al, 2000: 14-15 T-1) (b) Consensual Poverty in Sweden, 1992 In response to the British survey by Mack and Lansley (1985,1992), Björn Halleröd (1994a, 1994b) developed the Proportional Deprivation Index (PDI), a modified version of Mack and Lansley's approach, using 1992 Swedish data set. Instead of including only items from the preliminary list which more than 50 percent of the population identified as necessities, the PDI
Bangladesh e-Journal of Sociology. Volume 4 Number 2. July 2007. 63
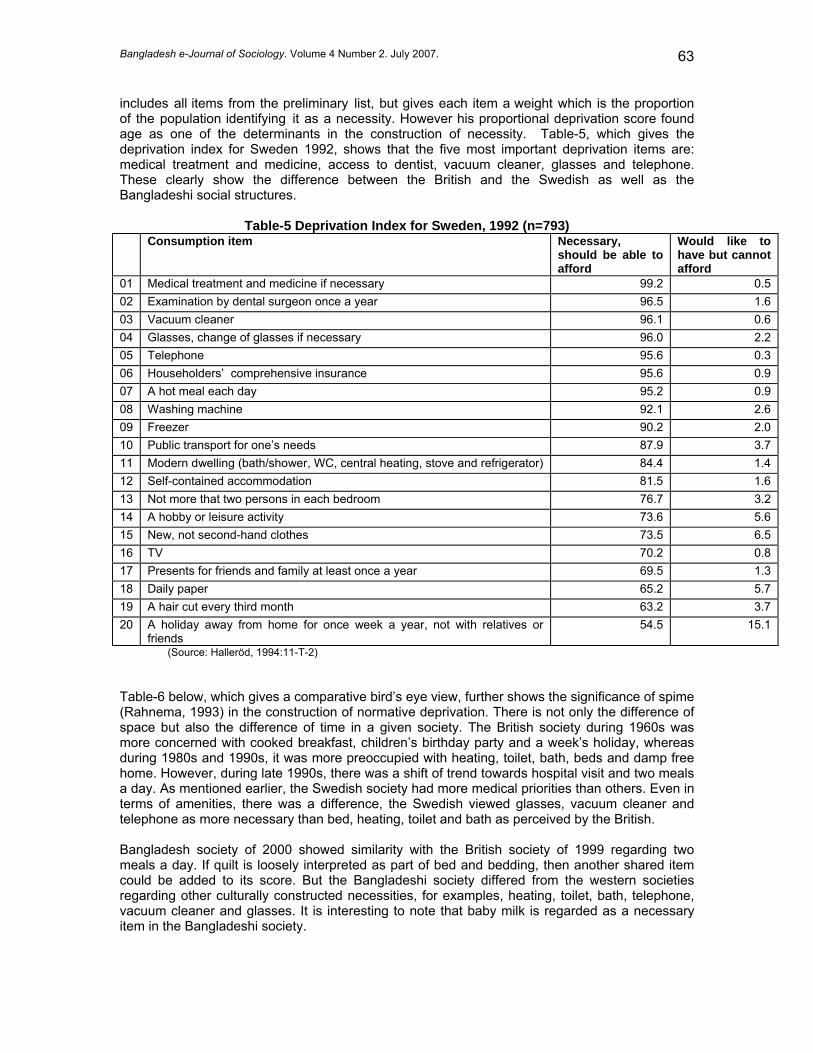
includes all items from the preliminary list, but gives each item a weight which is the proportion of the population identifying it as a necessity. However his proportional deprivation score found age as one of the determinants in the construction of necessity. Table-5, which gives the deprivation index for Sweden 1992, shows that the five most important deprivation items are: medical treatment and medicine, access to dentist, vacuum cleaner, glasses and telephone. These clearly show the difference between the British and the Swedish as well as the Bangladeshi social structures.
Table-5 Deprivation Index for Sweden, 1992 (n=793) Consumption item Necessary,
should be able to afford
Would like to have but cannot afford
01 Medical treatment and medicine if necessary 99.2 0.5 02 Examination by dental surgeon once a year 96.5 1.6 03 Vacuum cleaner 96.1 0.6 04 Glasses, change of glasses if necessary 96.0 2.2 05 Telephone 95.6 0.3 06 Householders’ comprehensive insurance 95.6 0.9 07 A hot meal each day 95.2 0.9 08 Washing machine 92.1 2.6 09 Freezer 90.2 2.0 10 Public transport for one’s needs 87.9 3.7 11 Modern dwelling (bath/shower, WC, central heating, stove and refrigerator) 84.4 1.4 12 Self-contained accommodation 81.5 1.6 13 Not more that two persons in each bedroom 76.7 3.2 14 A hobby or leisure activity 73.6 5.6 15 New, not second-hand clothes 73.5 6.5 16 TV 70.2 0.8 17 Presents for friends and family at least once a year 69.5 1.3 18 Daily paper 65.2 5.7 19 A hair cut every third month 63.2 3.7 20 A holiday away from home for once week a year, not with relatives or
friends 54.5 15.1
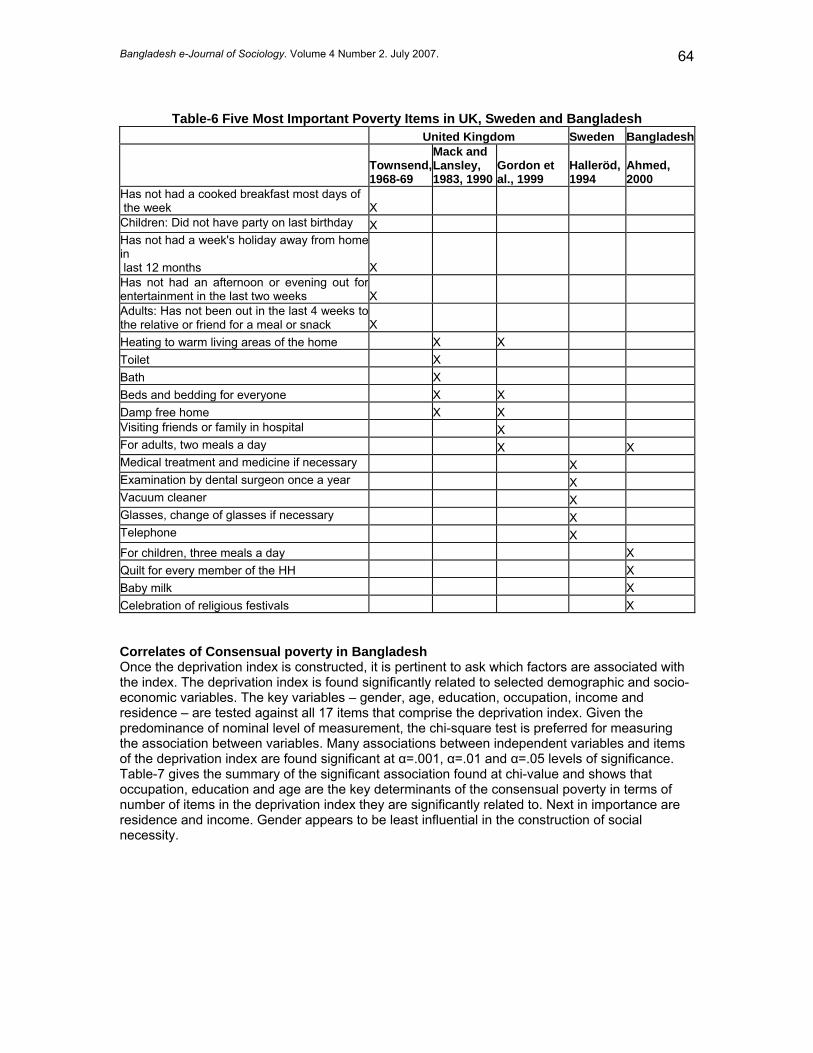
(Source: Halleröd, 1994:11-T-2) Table-6 below, which gives a comparative bird’s eye view, further shows the significance of spime (Rahnema, 1993) in the construction of normative deprivation. There is not only the difference of space but also the difference of time in a given society. The British society during 1960s was more concerned with cooked breakfast, children’s birthday party and a week’s holiday, whereas during 1980s and 1990s, it was more preoccupied with heating, toilet, bath, beds and damp free home. However, during late 1990s, there was a shift of trend towards hospital visit and two meals a day. As mentioned earlier, the Swedish society had more medical priorities than others. Even in terms of amenities, there was a difference, the Swedish viewed glasses, vacuum cleaner and telephone as more necessary than bed, heating, toilet and bath as perceived by the British. Bangladesh society of 2000 showed similarity with the British society of 1999 regarding two meals a day. If quilt is loosely interpreted as part of bed and bedding, then another shared item could be added to its score. But the Bangladeshi society differed from the western societies regarding other culturally constructed necessities, for examples, heating, toilet, bath, telephone, vacuum cleaner and glasses. It is interesting to note that baby milk is regarded as a necessary item in the Bangladeshi society.
Bangladesh e-Journal of Sociology. Volume 4 Number 2. July 2007. 64
Table-6 Five Most Important Poverty Items in UK, Sweden and Bangladesh
United Kingdom Sweden Bangladesh
Townsend,1968-69
Mack and Lansley, 1983, 1990
Gordon et al., 1999
Halleröd, 1994
Ahmed, 2000
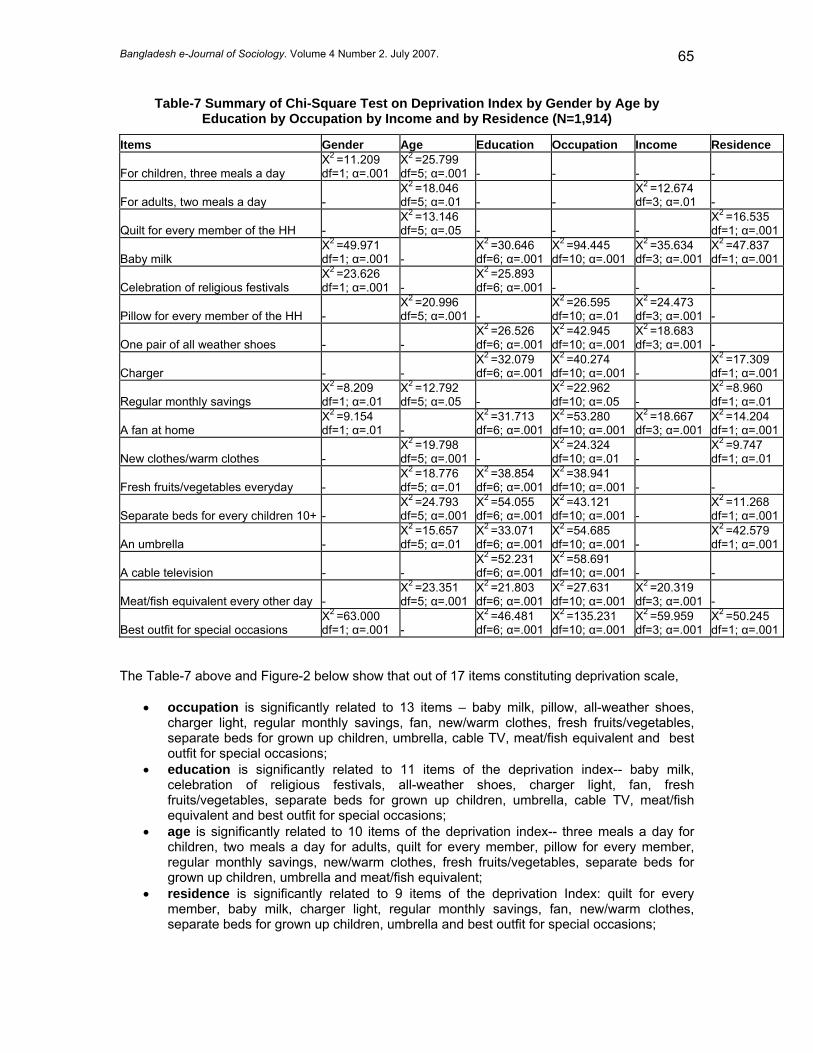
Has not had a cooked breakfast most days of the week X Children: Did not have party on last birthday X Has not had a week's holiday away from homein last 12 months X Has not had an afternoon or evening out forentertainment in the last two weeks X Adults: Has not been out in the last 4 weeks tothe relative or friend for a meal or snack X Heating to warm living areas of the home X X Toilet X Bath X Beds and bedding for everyone X X Damp free home X X Visiting friends or family in hospital X For adults, two meals a day X X Medical treatment and medicine if necessary X Examination by dental surgeon once a year X Vacuum cleaner X Glasses, change of glasses if necessary X Telephone X For children, three meals a day X Quilt for every member of the HH X Baby milk X Celebration of religious festivals X Correlates of Consensual poverty in Bangladesh Once the deprivation index is constructed, it is pertinent to ask which factors are associated with the index. The deprivation index is found significantly related to selected demographic and socio-economic variables. The key variables – gender, age, education, occupation, income and residence – are tested against all 17 items that comprise the deprivation index. Given the predominance of nominal level of measurement, the chi-square test is preferred for measuring the association between variables. Many associations between independent variables and items of the deprivation index are found significant at α=.001, α=.01 and α=.05 levels of significance. Table-7 gives the summary of the significant association found at chi-value and shows that occupation, education and age are the key determinants of the consensual poverty in terms of number of items in the deprivation index they are significantly related to. Next in importance are residence and income. Gender appears to be least influential in the construction of social necessity.
Bangladesh e-Journal of Sociology. Volume 4 Number 2. July 2007. 65
Table-7 Summary of Chi-Square Test on Deprivation Index by Gender by Age by Education by Occupation by Income and by Residence (N=1,914)
Items Gender Age Education Occupation Income Residence
For children, three meals a day Χ2 =11.209 df=1; α=.001
Χ2 =25.799 df=5; α=.001 - - - -
For adults, two meals a day - Χ2 =18.046 df=5; α=.01 - -
Χ2 =12.674 df=3; α=.01 -
Quilt for every member of the HH - Χ2 =13.146 df=5; α=.05 - - -
Χ2 =16.535 df=1; α=.001
Baby milk Χ2 =49.971 df=1; α=.001 -
Χ2 =30.646 df=6; α=.001
Χ2 =94.445 df=10; α=.001
Χ2 =35.634 df=3; α=.001
Χ2 =47.837 df=1; α=.001
Celebration of religious festivals Χ2 =23.626 df=1; α=.001 -
Χ2 =25.893 df=6; α=.001 - - -
Pillow for every member of the HH - Χ2 =20.996 df=5; α=.001 -
Χ2 =26.595 df=10; α=.01
Χ2 =24.473 df=3; α=.001 -
One pair of all weather shoes - - Χ2 =26.526 df=6; α=.001
Χ2 =42.945 df=10; α=.001
Χ2 =18.683 df=3; α=.001 -
Charger - - Χ2 =32.079 df=6; α=.001
Χ2 =40.274 df=10; α=.001 -
Χ2 =17.309 df=1; α=.001
Regular monthly savings Χ2 =8.209 df=1; α=.01
Χ2 =12.792 df=5; α=.05 -
Χ2 =22.962 df=10; α=.05 -
Χ2 =8.960 df=1; α=.01
A fan at home Χ2 =9.154 df=1; α=.01 -
Χ2 =31.713 df=6; α=.001
Χ2 =53.280 df=10; α=.001
Χ2 =18.667 df=3; α=.001
Χ2 =14.204 df=1; α=.001
New clothes/warm clothes - Χ2 =19.798 df=5; α=.001 -
Χ2 =24.324 df=10; α=.01 -
Χ2 =9.747 df=1; α=.01
Fresh fruits/vegetables everyday - Χ2 =18.776 df=5; α=.01
Χ2 =38.854 df=6; α=.001
Χ2 =38.941 df=10; α=.001 - -
Separate beds for every children 10+ - Χ2 =24.793 df=5; α=.001
Χ2 =54.055 df=6; α=.001
Χ2 =43.121 df=10; α=.001 -
Χ2 =11.268 df=1; α=.001
An umbrella - Χ2 =15.657 df=5; α=.01
Χ2 =33.071 df=6; α=.001
Χ2 =54.685 df=10; α=.001 -
Χ2 =42.579 df=1; α=.001
A cable television - - Χ2 =52.231 df=6; α=.001
Χ2 =58.691 df=10; α=.001 - -
Meat/fish equivalent every other day - Χ2 =23.351 df=5; α=.001
Χ2 =21.803 df=6; α=.001
Χ2 =27.631 df=10; α=.001
Χ2 =20.319 df=3; α=.001 -
Best outfit for special occasions Χ2 =63.000 df=1; α=.001 -
Χ2 =46.481 df=6; α=.001
Χ2 =135.231 df=10; α=.001
Χ2 =59.959 df=3; α=.001
Χ2 =50.245 df=1; α=.001
The Table-7 above and Figure-2 below show that out of 17 items constituting deprivation scale,
• occupation is significantly related to 13 items – baby milk, pillow, all-weather shoes, charger light, regular monthly savings, fan, new/warm clothes, fresh fruits/vegetables, separate beds for grown up children, umbrella, cable TV, meat/fish equivalent and best outfit for special occasions;
• education is significantly related to 11 items of the deprivation index-- baby milk, celebration of religious festivals, all-weather shoes, charger light, fan, fresh fruits/vegetables, separate beds for grown up children, umbrella, cable TV, meat/fish equivalent and best outfit for special occasions;
• age is significantly related to 10 items of the deprivation index-- three meals a day for children, two meals a day for adults, quilt for every member, pillow for every member, regular monthly savings, new/warm clothes, fresh fruits/vegetables, separate beds for grown up children, umbrella and meat/fish equivalent;
• residence is significantly related to 9 items of the deprivation Index: quilt for every member, baby milk, charger light, regular monthly savings, fan, new/warm clothes, separate beds for grown up children, umbrella and best outfit for special occasions;
Bangladesh e-Journal of Sociology. Volume 4 Number 2. July 2007. 66
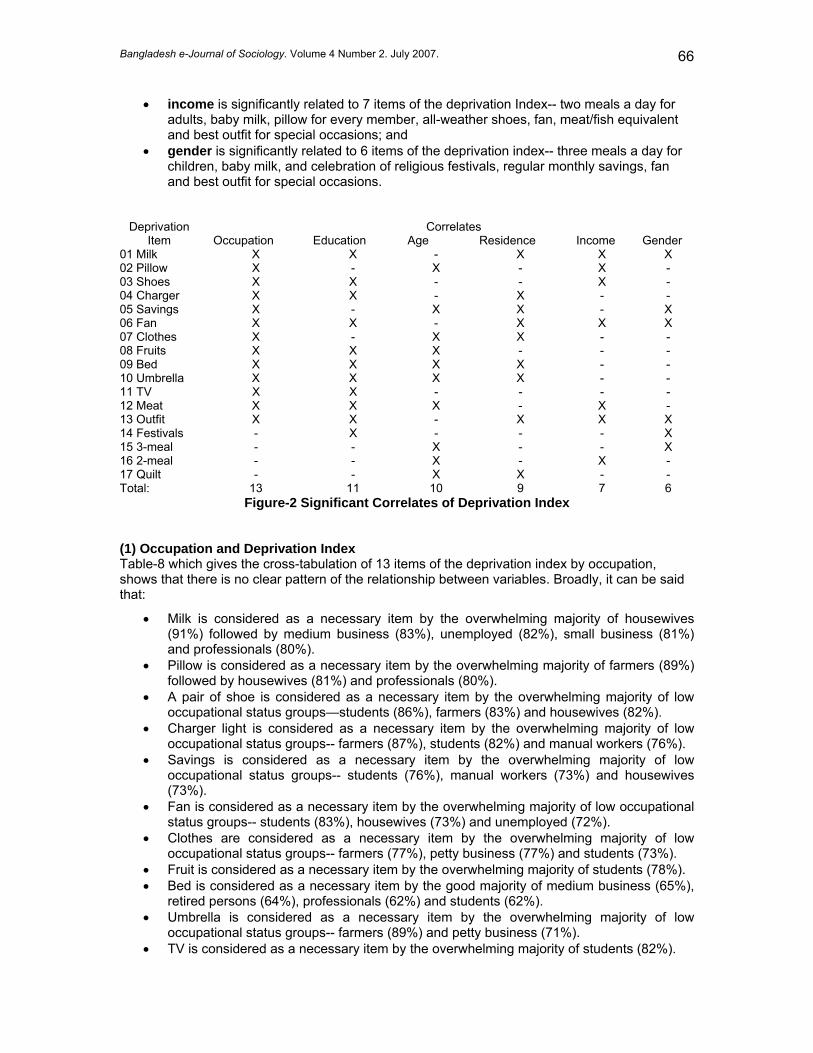
• income is significantly related to 7 items of the deprivation Index-- two meals a day for adults, baby milk, pillow for every member, all-weather shoes, fan, meat/fish equivalent and best outfit for special occasions; and
• gender is significantly related to 6 items of the deprivation index-- three meals a day for children, baby milk, and celebration of religious festivals, regular monthly savings, fan and best outfit for special occasions.
Correlates Deprivation Item Occupation Education Age Residence Income Gender
01 Milk X X - X X X 02 Pillow X - X - X - 03 Shoes X X - - X - 04 Charger X X - X - - 05 Savings X - X X - X 06 Fan X X - X X X 07 Clothes X - X X - - 08 Fruits X X X - - - 09 Bed X X X X - - 10 Umbrella X X X X - - 11 TV X X - - - - 12 Meat X X X - X - 13 Outfit X X - X X X 14 Festivals - X - - - X 15 3-meal - - X - - X 16 2-meal - - X - X - 17 Quilt - - X X - - Total: 13 11 10 9 7 6
Figure-2 Significant Correlates of Deprivation Index (1) Occupation and Deprivation Index Table-8 which gives the cross-tabulation of 13 items of the deprivation index by occupation, shows that there is no clear pattern of the relationship between variables. Broadly, it can be said that:
• Milk is considered as a necessary item by the overwhelming majority of housewives (91%) followed by medium business (83%), unemployed (82%), small business (81%) and professionals (80%).
• Pillow is considered as a necessary item by the overwhelming majority of farmers (89%) followed by housewives (81%) and professionals (80%).
• A pair of shoe is considered as a necessary item by the overwhelming majority of low occupational status groups—students (86%), farmers (83%) and housewives (82%).
• Charger light is considered as a necessary item by the overwhelming majority of low occupational status groups-- farmers (87%), students (82%) and manual workers (76%).
• Savings is considered as a necessary item by the overwhelming majority of low occupational status groups-- students (76%), manual workers (73%) and housewives (73%).
• Fan is considered as a necessary item by the overwhelming majority of low occupational status groups-- students (83%), housewives (73%) and unemployed (72%).
• Clothes are considered as a necessary item by the overwhelming majority of low occupational status groups-- farmers (77%), petty business (77%) and students (73%).
• Fruit is considered as a necessary item by the overwhelming majority of students (78%). • Bed is considered as a necessary item by the good majority of medium business (65%),
retired persons (64%), professionals (62%) and students (62%). • Umbrella is considered as a necessary item by the overwhelming majority of low
occupational status groups-- farmers (89%) and petty business (71%). • TV is considered as a necessary item by the overwhelming majority of students (82%).
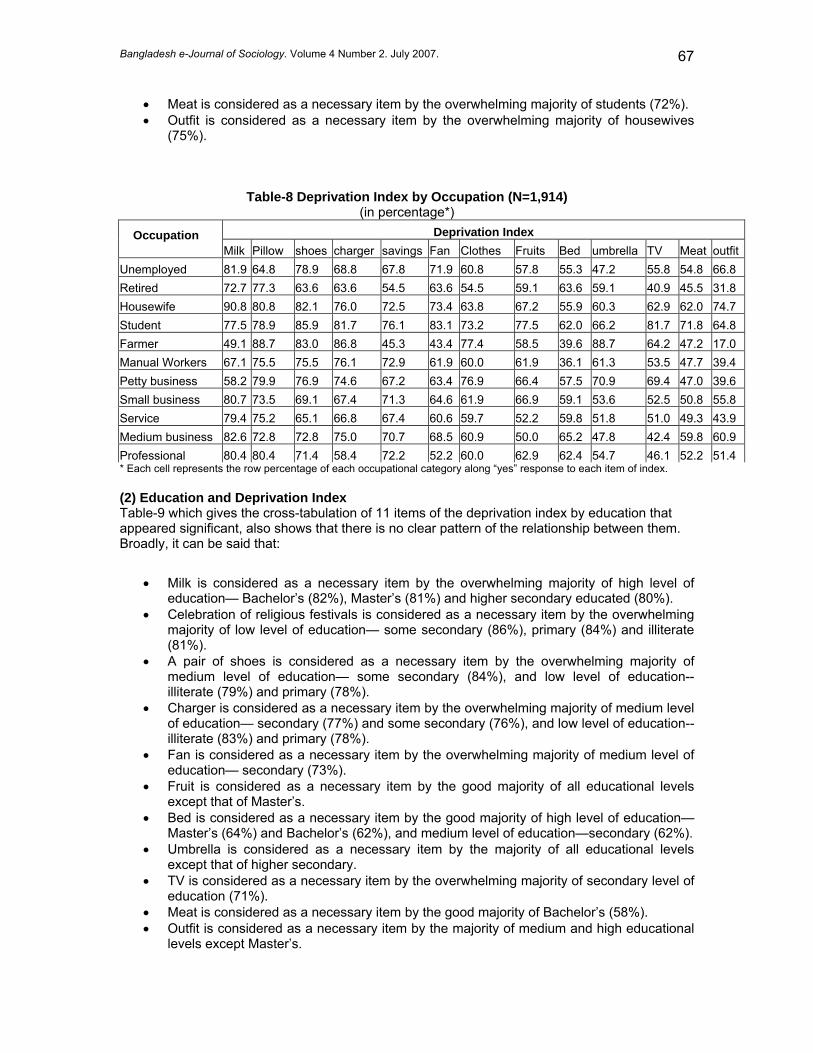
Bangladesh e-Journal of Sociology. Volume 4 Number 2. July 2007. 67
• Meat is considered as a necessary item by the overwhelming majority of students (72%). • Outfit is considered as a necessary item by the overwhelming majority of housewives
(75%).
Table-8 Deprivation Index by Occupation (N=1,914)
(in percentage*) Deprivation Index Occupation
Milk Pillow shoes charger savings Fan Clothes Fruits Bed umbrella TV Meat outfitUnemployed 81.9 64.8 78.9 68.8 67.8 71.9 60.8 57.8 55.3 47.2 55.8 54.8 66.8 Retired 72.7 77.3 63.6 63.6 54.5 63.6 54.5 59.1 63.6 59.1 40.9 45.5 31.8 Housewife 90.8 80.8 82.1 76.0 72.5 73.4 63.8 67.2 55.9 60.3 62.9 62.0 74.7 Student 77.5 78.9 85.9 81.7 76.1 83.1 73.2 77.5 62.0 66.2 81.7 71.8 64.8 Farmer 49.1 88.7 83.0 86.8 45.3 43.4 77.4 58.5 39.6 88.7 64.2 47.2 17.0 Manual Workers 67.1 75.5 75.5 76.1 72.9 61.9 60.0 61.9 36.1 61.3 53.5 47.7 39.4 Petty business 58.2 79.9 76.9 74.6 67.2 63.4 76.9 66.4 57.5 70.9 69.4 47.0 39.6 Small business 80.7 73.5 69.1 67.4 71.3 64.6 61.9 66.9 59.1 53.6 52.5 50.8 55.8 Service 79.4 75.2 65.1 66.8 67.4 60.6 59.7 52.2 59.8 51.8 51.0 49.3 43.9 Medium business 82.6 72.8 72.8 75.0 70.7 68.5 60.9 50.0 65.2 47.8 42.4 59.8 60.9 Professional 80.4 80.4 71.4 58.4 72.2 52.2 60.0 62.9 62.4 54.7 46.1 52.2 51.4 * Each cell represents the row percentage of each occupational category along “yes” response to each item of index. (2) Education and Deprivation Index Table-9 which gives the cross-tabulation of 11 items of the deprivation index by education that appeared significant, also shows that there is no clear pattern of the relationship between them. Broadly, it can be said that:
• Milk is considered as a necessary item by the overwhelming majority of high level of
education— Bachelor’s (82%), Master’s (81%) and higher secondary educated (80%). • Celebration of religious festivals is considered as a necessary item by the overwhelming
majority of low level of education— some secondary (86%), primary (84%) and illiterate (81%).
• A pair of shoes is considered as a necessary item by the overwhelming majority of medium level of education— some secondary (84%), and low level of education-- illiterate (79%) and primary (78%).
• Charger is considered as a necessary item by the overwhelming majority of medium level of education— secondary (77%) and some secondary (76%), and low level of education-- illiterate (83%) and primary (78%).
• Fan is considered as a necessary item by the overwhelming majority of medium level of education— secondary (73%).
• Fruit is considered as a necessary item by the good majority of all educational levels except that of Master’s.
• Bed is considered as a necessary item by the good majority of high level of education—Master’s (64%) and Bachelor’s (62%), and medium level of education—secondary (62%).
• Umbrella is considered as a necessary item by the majority of all educational levels except that of higher secondary.
• TV is considered as a necessary item by the overwhelming majority of secondary level of education (71%).
• Meat is considered as a necessary item by the good majority of Bachelor’s (58%). • Outfit is considered as a necessary item by the majority of medium and high educational
levels except Master’s.
Bangladesh e-Journal of Sociology. Volume 4 Number 2. July 2007. 68
Table-9 Deprivation Index by Level of Education (N=1,914) (in percentage*)
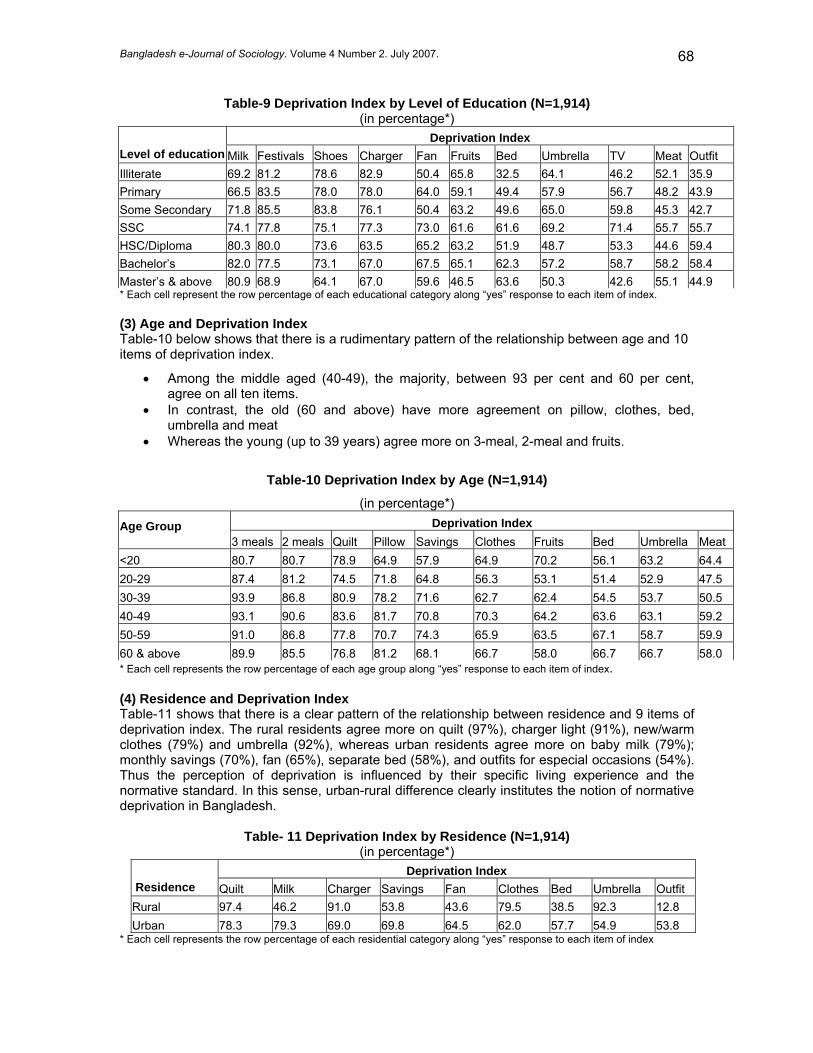
Deprivation Index Level of education Milk Festivals Shoes Charger Fan Fruits Bed Umbrella TV Meat Outfit Illiterate 69.2 81.2 78.6 82.9 50.4 65.8 32.5 64.1 46.2 52.1 35.9 Primary 66.5 83.5 78.0 78.0 64.0 59.1 49.4 57.9 56.7 48.2 43.9 Some Secondary 71.8 85.5 83.8 76.1 50.4 63.2 49.6 65.0 59.8 45.3 42.7 SSC 74.1 77.8 75.1 77.3 73.0 61.6 61.6 69.2 71.4 55.7 55.7 HSC/Diploma 80.3 80.0 73.6 63.5 65.2 63.2 51.9 48.7 53.3 44.6 59.4 Bachelor’s 82.0 77.5 73.1 67.0 67.5 65.1 62.3 57.2 58.7 58.2 58.4 Master’s & above 80.9 68.9 64.1 67.0 59.6 46.5 63.6 50.3 42.6 55.1 44.9 * Each cell represent the row percentage of each educational category along “yes” response to each item of index. (3) Age and Deprivation Index Table-10 below shows that there is a rudimentary pattern of the relationship between age and 10 items of deprivation index.
• Among the middle aged (40-49), the majority, between 93 per cent and 60 per cent, agree on all ten items.
• In contrast, the old (60 and above) have more agreement on pillow, clothes, bed, umbrella and meat
• Whereas the young (up to 39 years) agree more on 3-meal, 2-meal and fruits.
Table-10 Deprivation Index by Age (N=1,914)
(in percentage*) Deprivation Index Age Group
3 meals 2 meals Quilt Pillow Savings Clothes Fruits Bed Umbrella Meat <20 80.7 80.7 78.9 64.9 57.9 64.9 70.2 56.1 63.2 64.4 20-29 87.4 81.2 74.5 71.8 64.8 56.3 53.1 51.4 52.9 47.5 30-39 93.9 86.8 80.9 78.2 71.6 62.7 62.4 54.5 53.7 50.5 40-49 93.1 90.6 83.6 81.7 70.8 70.3 64.2 63.6 63.1 59.2 50-59 91.0 86.8 77.8 70.7 74.3 65.9 63.5 67.1 58.7 59.9 60 & above 89.9 85.5 76.8 81.2 68.1 66.7 58.0 66.7 66.7 58.0 * Each cell represents the row percentage of each age group along “yes” response to each item of index. (4) Residence and Deprivation Index Table-11 shows that there is a clear pattern of the relationship between residence and 9 items of deprivation index. The rural residents agree more on quilt (97%), charger light (91%), new/warm clothes (79%) and umbrella (92%), whereas urban residents agree more on baby milk (79%); monthly savings (70%), fan (65%), separate bed (58%), and outfits for especial occasions (54%). Thus the perception of deprivation is influenced by their specific living experience and the normative standard. In this sense, urban-rural difference clearly institutes the notion of normative deprivation in Bangladesh.
Table- 11 Deprivation Index by Residence (N=1,914)
(in percentage*) Deprivation Index
Residence Quilt Milk Charger Savings Fan Clothes Bed Umbrella Outfit Rural 97.4 46.2 91.0 53.8 43.6 79.5 38.5 92.3 12.8 Urban 78.3 79.3 69.0 69.8 64.5 62.0 57.7 54.9 53.8
* Each cell represents the row percentage of each residential category along “yes” response to each item of index
Bangladesh e-Journal of Sociology. Volume 4 Number 2. July 2007. 69
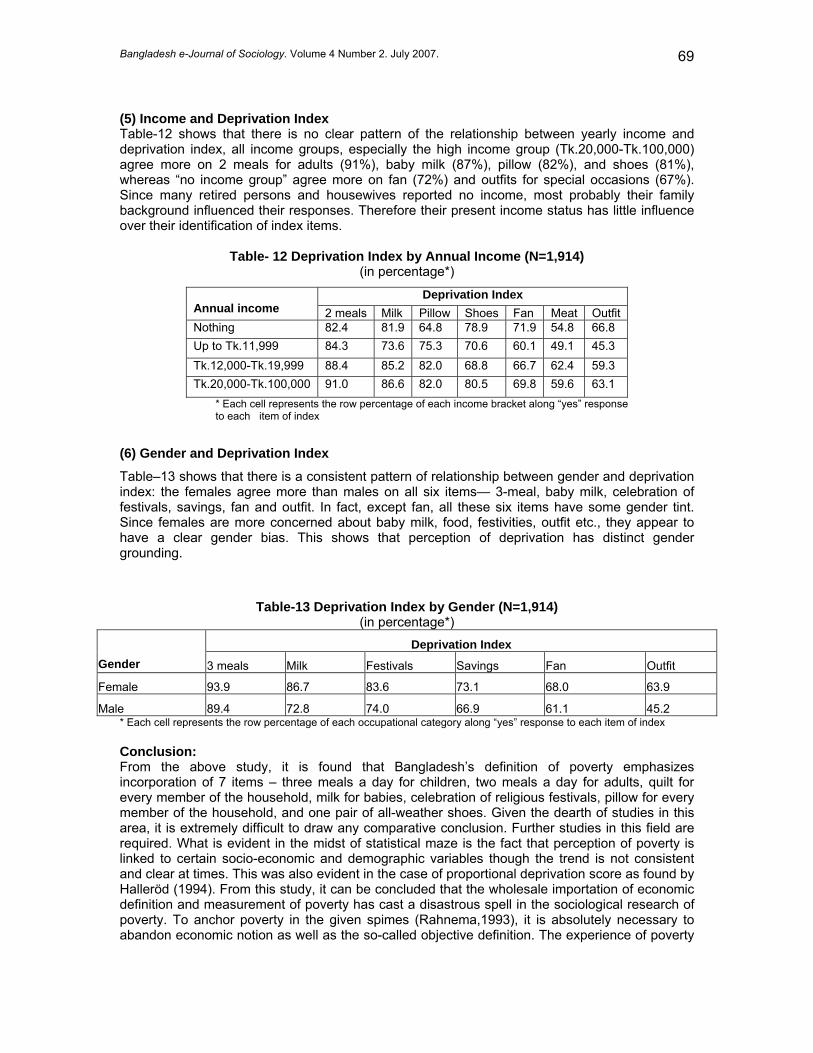
(5) Income and Deprivation Index Table-12 shows that there is no clear pattern of the relationship between yearly income and deprivation index, all income groups, especially the high income group (Tk.20,000-Tk.100,000) agree more on 2 meals for adults (91%), baby milk (87%), pillow (82%), and shoes (81%), whereas “no income group” agree more on fan (72%) and outfits for special occasions (67%). Since many retired persons and housewives reported no income, most probably their family background influenced their responses. Therefore their present income status has little influence over their identification of index items.
Table- 12 Deprivation Index by Annual Income (N=1,914) (in percentage*)
Deprivation Index Annual income 2 meals Milk Pillow Shoes Fan Meat Outfit Nothing 82.4 81.9 64.8 78.9 71.9 54.8 66.8 Up to Tk.11,999 84.3 73.6 75.3 70.6 60.1 49.1 45.3 Tk.12,000-Tk.19,999 88.4 85.2 82.0 68.8 66.7 62.4 59.3 Tk.20,000-Tk.100,000 91.0 86.6 82.0 80.5 69.8 59.6 63.1
* Each cell represents the row percentage of each income bracket along “yes” response to each item of index
(6) Gender and Deprivation Index
Table–13 shows that there is a consistent pattern of relationship between gender and deprivation index: the females agree more than males on all six items— 3-meal, baby milk, celebration of festivals, savings, fan and outfit. In fact, except fan, all these six items have some gender tint. Since females are more concerned about baby milk, food, festivities, outfit etc., they appear to have a clear gender bias. This shows that perception of deprivation has distinct gender grounding.
Table-13 Deprivation Index by Gender (N=1,914) (in percentage*)
Deprivation Index Gender 3 meals Milk Festivals Savings Fan Outfit
Female 93.9 86.7 83.6 73.1 68.0 63.9
Male 89.4 72.8 74.0 66.9 61.1 45.2 * Each cell represents the row percentage of each occupational category along “yes” response to each item of index Conclusion: From the above study, it is found that Bangladesh’s definition of poverty emphasizes incorporation of 7 items – three meals a day for children, two meals a day for adults, quilt for every member of the household, milk for babies, celebration of religious festivals, pillow for every member of the household, and one pair of all-weather shoes. Given the dearth of studies in this area, it is extremely difficult to draw any comparative conclusion. Further studies in this field are required. What is evident in the midst of statistical maze is the fact that perception of poverty is linked to certain socio-economic and demographic variables though the trend is not consistent and clear at times. This was also evident in the case of proportional deprivation score as found by Halleröd (1994). From this study, it can be concluded that the wholesale importation of economic definition and measurement of poverty has cast a disastrous spell in the sociological research of poverty. To anchor poverty in the given spimes (Rahnema,1993), it is absolutely necessary to abandon economic notion as well as the so-called objective definition. The experience of poverty
Bangladesh e-Journal of Sociology. Volume 4 Number 2. July 2007. 70
is specific to time and space, therefore it is society-subjective and in this sense, normative. A proper sociological definition of poverty and its measurement should begin with normative deprivation, preferably consensual one rather than with universalistic ideal-type. ENDNOTES i In England, the interest on the estimate of the household ratio or extent of poverty is linked with political agenda. This is why King and other investigators were interested in the number of paupers. Thus the scientific study of poverty dates from the investigations of Booth (1889) and Rowntree (1901) at the end of the 19th century. It was Booth's Life and Labour (1892-7) survey of London, started in the East End in the 1880s, that combined the elements of first-hand observation with a systematic attempt to measure the extent of poverty. He drew up a map of poverty in London based on the street as his unit of analysis. The early account of Eden, The State of the Poor published in 3 volumes in 1797contained data from over 100 parishes and details of family budgets. In the style of the time, the full title of the book is a catalogue of its contents: "The State of the Poor: or a history of the labouring classes in England, from the Conquest to the present period; in which are particularly considered, their domestic economy, with respect to diet, dress, fuel, and habitation; and the various plans which, from time to time, have been proposed and adopted for the relief of the poor: together with parochial reports relative to the administration of work-houses, and houses of industry; the state of the Friendly Societies, and other public institutions; in several agricultural, commercial and manufacturing, districts. With a large appendix; containing a comparative and chronological table of the prices of labour, of provisions, and of other commodities; an account of the poor in Scotland; and many original documents on subjects of national importance." Engels (1892) and Mayhew (1861) provided insight into the condition of the poor in urban England. Recently, the social effects of early industrialization is well documented in From Artisans to Paupers: Economic Change and Poverty in London, 1790-1870 by Green (1995) and in Poverty, Inequality and Health in Britain, 1800-2000: A Reader edited by Smith, Darling and Shaw (2001).
ii Rowntree (1901) intended to compare the situation in York as a typical provincial town with that found by Booth (1889) in London. His method represented a significant departure in that it was concerned with individual family incomes. He also developed a poverty standard based on estimates of nutritional and other requirements, rent and sundries. iii Bowley pioneered the development of sample survey methods in his survey of the working-class households in Reading during 1912-13 (Bowley ,1913) and Five Towns survey in 1915 (Bowley and Burnett-Hurst, 1915). Following these, a many local studies were subsequently conducted. Rowntree himself repeated his survey of York in 1936 (Rowntree, 1942) and 1950 (Rowntree and Lavers, 1951), which demonstrated the effectiveness of the post-1948 British welfare state on the elimination of poverty by the combination of full employment and the new social benefits. Doubt was cast to such survey findings and using secondary analysis of a national survey, Townsend and Abel-Smith (1965) showed that in 1960 about two million people fell below the social security safety net level. This led Townsend (1979) to undertake his massive survey of UK during 1960s and conceptualize poverty as the relative deprivation and asserted that poverty in Britain did not decline as claimed by Rowntree and other subsequent surveys. iv Townsend (1979:46-49) criticizes the U.S. notion of poverty as static and proposes a concept of relative poverty
grounded in the idea of deprivation, which are of three kinds: (a) objective, (b) normative and (c) subjective.
v In the United States, poverty line developed by Hunter in 1904 was used in a series of studies to produce 'minimum comfort' and other budgets for New York City. In 1949 the Joint Committee on the Economic Report published on low income families. During the 1960s the problem of poverty received systematic study,. However previous work of Galbraith (1958), Lampman (1959) and Harnngton (1962) aroused the attention of the public, politicians and academics. vi Supplementary benefit is a means-tested cash benefit paid by the state to people whose income did not reach a level deemed appropriate by Parliament for subsistence. vii In 1988 supplementary benefit was replaced by income support. This is also commonly practiced in most European countries. This measure has dramatically increased the head count ratio of poverty throughout 1980s before falling from the mid-1990s onwards and reached its peak in 2004 to 16 per cent compared to 6.5 per cent in 1979 (Flaherty et al., 2004:43). viii The three composite indexes are measured as follows: (i) Human Development Index (HDI): The HDI is a summary measure of human development in three basic dimensions, (a) a long and healthy life, (b) knowledge as measured by the adult literacy rate (with ⅔ weight) and combined primary, secondary and tertiary gross enrolment ratio (with ⅓ weight) and (c) a decent standard of living, as measured by GDP per capita PPP US$1 for low-income countries like Bangladesh. Once the dimension indices have been calculated, HDI is estimated as a simple average of the three dimension indices (Anand and Sen, 1994): HDI= ⅓ (life expectancy index) + ⅓ (education index) + ⅓ (GDP index) (ii) Human Poverty Index (HPI-1) for the low income countries: HPI-1 measures deprivation in the three basic dimensions of human development captured in the HDI, (a) a long and healthy life as measured by the probability at birth
Bangladesh e-Journal of Sociology. Volume 4 Number 2. July 2007. 71
of not surviving to age 40, (b) knowledge as measured by the adult literacy rate and (c) a decent standard of living as measured by the percentage of the population not using improved water sources and the percentage of children under five who are underweight (Anand and Sen, 1997). HPI-1= [⅓ (probability at birth of not surviving to age 40 x 1003 + adult literacy rate3 + unweighted average of population not using improved water sources and underweight children under age five3)] ⅓ (iii) Gender-Related Development Index (GDI): GDI is an adjusted HDI to reflect the inequalities between men and women. It is calculated from the unweighted average of three component indices, (a) equally distributed life expectancy index, (b) equally distributed education index and (c) equally distributed income index (Anand and Sen, 1995). GDI= ⅓ (life expectancy index) + ⅓ (education index) + ⅓ (income index) ix “An adequate concept of poverty should include all the most important areas in which people of either gender are deprived and perceived as incapacitated in different societies and local contexts” (OECD, 2001:38). Thus it includes five dimensional capability deprivations as an index of poverty. They are: 1. Economic capabilities: ability to earn an income, to consume and to have assets, which are all key to food security, material well-being and social status. 2. Human capabilities: health, education, nutrition, cleans water and shelter. These are crucial means to improving livelihoods. 3. Political capabilities: human rights, a voice and some influence over public policies and political priorities. Deprivation of basic political freedoms is a major aspect of poverty. 4. Socio-cultural capabilities: participation as a valued member of a community. They refer to social status, dignity and other cultural conditions for belonging to a society. 5. Protective capabilities: ability to withstand economic and external shocks. They are important for preventing poverty. Insecurity and vulnerability are crucial dimensions of poverty with strong links to all other dimensions. x World Bank’s Poverty Reduction Strategy Papers (PRSPs) Sourcebook sets out 5 interrelated dimensions of poverty, (a) income/consumption, (b) health, (c) education, (d) security and (e) empowerment. Generally speaking, urban poverty and vulnerability can be related to three distinctive characteristics of urban life: (i) commoditization or reliance on the cash economy, (ii) environmental hazard stemming from density and hazardous location of settlements, and exposure to multiple pollutants, and (iii) social fragmentation or lack of community and inter-household mechanisms for social security, relative to those in rural areas. Lack of tenure security is considered as a specific dimension of urban poverty and vulnerability (Moser, Gatehouse and Garcia, 1996). xi Under DCI method, two types of poor are distinguished, (i) hardcore poor and (ii) absolute poor. Hardcore poor refers to having less than 1,805 k.cal per person per day, whereas absolute poor means having less than 2,122 k.cal per person per day (Bangladesh Bureau of Statistics, 2004: 9). The CBN method constructs poverty line, which represent the level of per capita expenditure at which the members of households can be expected to meet their basic needs, food and non-food. The functional form of the model is:
1ny= a + bx + e Where y=per capita monthly expenditure, food and non-food
x=per capita per day calorie intake e=disturbance term
Using a price index, cost of living is estimated for a base year (1991-92), and then updated for 1995-96 and 2000. Making comparisons of poverty rates over time requires that the basic-needs bundles used to estimate poverty lines in different years are of constant value in real terms. The allowance for non-food consumption yields two poverty lines, (i) lower: which incorporates a minimal allowance for non-food good for those who could just afford the food requirement, and (ii) upper: which makes a generous allowance for non-food spending for those who just attained the food requirement (Bangladesh Bureau of Statistics, 2001:55-56). xii In the study by the Asian Development Bank (1997), urban absolute and hardcore income poverty lines are determined at Tk. 3500 (US $88 equivalent) and Tk. 2500 (US $63 equivalent) per household per month respectively. Thus the concept of poverty and its measurement has remained heavily economic, and all poverty measurement ultimately boils down to income poverty. Even Human Development Index (HDI) and Gender-Related Development Index (GDI) have an income component. xiii To capture the dynamic of urban property, both slum and non-slum poor have been studied by Ahmed (2004d) using AV Framework of Moser et. al. (1996). In addition, the notion of capacity poor by Sen (1983) has also been used to locate the poverty gap and to construct a scenario of the heterogeneity of urban poor. xiv A discourse of poverty is a package of assumptions—often unspoken or taken for granted--about the nature of poverty, the nature of the people whose poverty is being discussed, and the nature of the knowledge that is relevant to dealing with poverty. xv The construction of poverty definition can become meaningful only when it is anchored in the spimes or socio-cultural space-times (Rahnema, 1993:159).
Bangladesh e-Journal of Sociology. Volume 4 Number 2. July 2007. 72
xvi Rowntree’s third study of poverty in York (Rowntree and Lavers, 1951) showed much lower levels of poverty than his earlier studies. It confirmed the impact of welfare state in reducing poverty. Townsend’s approach is drawn from the relativist critiques of the postwar complacency based on Rowntree’s work mentioned above. His definition of consensual poverty follows: “Poverty can be defined objectively and applied consistently only in terms of the concept of relative deprivation. … The term is understood objectively rather than subjectively. Individuals, families and groups in the population can be said to be in poverty when they lack the resources to obtain the types of diet, participate in the activities and have the living conditions and amenities which are customary, or are at least widely encouraged or approved, in the societies to which they belong. Their resources are so seriously below those commanded by the average individual or family that they are, in effect, excluded from ordinary living patterns, customs and activities ... I have suggested that an alternative, and more objective, conception [of poverty] might be founded on 'relative deprivation' -- by which I mean the absence or inadequacy of those diets, amenities, standards, services and activities which are common or customary in society. People are deprived of the conditions of life which ordinarily define membership of society. If they lack or are denied resources to obtain access to these conditions of life and so fulfil membership of society, they are in poverty” (Townsend, 1979: 31, 915).a xvii “People are relatively deprived if they cannot obtain, at all or sufficiently, the conditions of life - that is, the diets, amenities, standards and services - which allow them to play the roles, participate in the relationships and follow the customary behaviour which is expected of them by virtue of their membership of society. If they lack or are denied resources to obtain access to these conditions of life and so fulfill membership of society they may be said to be in poverty” (Townsend, 1993:36). xviii Townsend selected 12 items which were relevant to the whole population rather than to particular groups. He gave each household a score on a deprivation index. The higher score meant more deprivation. He compared the deprivation score to their total income. However, he did not find any single item by itself or pair of items by themselves, to be “symptomatic of general deprivation” (Townsend, 1979: 252). Thus he concludes: “People are idiosyncratic and will indulge in certain luxuries and apply certain prohibitions, for religious, moral, educational and other reasons, whether they are rich or poor. Families in certain situations are not necessarily deprived if they do not have a week’s holiday; or if they do not have an afternoon or evening outside the home; or if they do not have a Sunday joint, because they may have other compensating activities or customs” (Townsend, 1979: 252). xix He defines it as “a point in descending the income scale below which deprivation increased disproportionately to the fall in income” (Townsend, 1979: 271). Townsend described these households as suffering from poverty. They constituted nearly 23 per cent of the population. According to him the government rates for means-tested benefits were more than 50 per cent too low, falling short of the minimum need. As income falls, families withdrew from ordinary family-type things resulting in social exclusion. xx Townsend’s formulation is considered as “ground-breaking” step in the pursuit of a relative definition of poverty (Alcock, 1993:71). However, his list of deprivation indicators was criticized as it did not take into account of taste as an explanation of the lack of particular indicators (Piachaud, 1981; 1987) and the statistical technique which produced the threshold by the use of modal value (Piachaud, 1981; Desai, 1986). A reanalysis of Townsend’s data by Desai (1986) produced the same threshold confirming the validity of Townsend’s overall approach. It is argued that Townsend’s approach and the threshold are a behavioral and not a consensual definition of poverty line as they involve the judgment of experts in the determination of acceptable indicators of deprivation (Alcock, 1993:71). These deficiencies were taken into account in later studies. xxi But Mack and Lansley (1 9 8 5 : 41-43, 45, and 47) differed from Townsend in two important ways. First, they chose indicators of deprivation from series of items classified as necessities or non-necessities by respondents of a national survey. Second, those reporting lack of a specific item, a further question was asked whether this was because they did not want it, or it was something they wanted, but could not afford (Fisher, 2001). If the respondents answered that it was a matter of choice, then they were not classified as being deprived of that item. Thus they avoided the criticism that Piachaud and others had directed against Townsend. xxii Mack and Lansley did not confine themselves to one segment of human needs. They viewed potential human needs "not only in terms of personal 'consumption' but also...in terms of social activities" (Mack and Lansley, 1985: 44). In their instructions to Market and Opinion Research International (MORI) for designing the Breadline Britain survey, they noted that the socially acceptable m inimum standard of living that they wanted to explore "may cover not only the basic essentials for survival (such as food) but also access, or otherwise, to participating in society and being able to play a social role” (Mack and Lansley, 1985:50). Their work is referred to as "the whole enterprise" which consists of the television series, a booklet, and the book. It is praised as "a fine model for social investigation in the eighties” (MacGregor, 1985:575). xxiii This approach has subsequently been used in surveys conducted in other European countries. For example, using indicators drawn from Mack and Lansley’s, the work of Irish researchers examines households that experience basic deprivation (Callahan, Nolan, and Whelan, 1993). This approach was subsequently used by Joanna Mack, Stewart Lansley, David Gordon, Christina Pantazis, and colleagues in the 1990 Breadline Britain survey, conducted by MORI for the LWT series Breadline Britain in the 1990s, with additional funding from the Joseph Rowntree Foundation for analysis of the data (Gordon and Pantazis, 1997b). Moreover, the tradition was also further carried by Gordon, Pantazis, Townsend, and colleagues in the 1999 Poverty and Social Exclusion Survey of Britain, funded by the Joseph Rowntree Foundation and conducted by the Office for National Statistics (Gordon et al., 2000). xxiv Veit-Wilson (1987:200) argues that it is a majoritarian rather than a consensual approach to poverty as it ignores important cultural differences in living standards within the British society. However, it initiated a theoretical debate on the decision to designate as necessities those items identified as such by 50 percent--rather than some other percent--of the population.
Bangladesh e-Journal of Sociology. Volume 4 Number 2. July 2007. 73
xxv "It is to the credit of London Weekend Television (LWT) and the Joseph Rowntree Foundation that they have funded the kind of detailed study of deprivation in Britain that the government and the academic research councils have not been prepared to finance" (Gordon and Pantazis, 1997b: 1). Similar appreciation also came from Harold Frayman (1991). xxvi Because these six items did not add to the validity to the definition of deprivation of necessities as they did not distinguish between rich and poor. REFERENCES Ahmed, A. I. Mahbub Uddin 2004a "Socio-demographic Correlates of Rural Poverty in Bangladesh: A Case Study of Gaibandha Sadar and Tanore Upazilas".
Bangladesh e-Journal of Sociology 1(2) July. 2004b “Poverty-Focused Research: Some Methodological Issues.” Paper presented in a seminar on Poverty and Population: In-
Country Symposium 2004 organized by the Department of Population Sciences, University of Dhaka during March 30-31. 2004c “Dynamics in the Perception of Poverty.” Paper presented in a seminar on Exploring the Sociological Perspective of
Poverty organized by the Bangladesh Sociological Society at the University of Dhaka on May 7. 2004d Generic Picture of the Urban Poor in Bangladesh. Research Report for the University of Southampton, England with
financial assistance from DFIED in a project on Linkages of Water, Sanitation, Gender and Urban Poverty. (September) Ahmed, A. I. Mahbub Uddin et al. 1988 Non-Formal Educational Needs Assessment in Bangladesh: A Survey of 10,000 Urban and Rural Population. (Dhaka:
UNESCO and Prakaushali Sangsad) Alcock, Pete 1993 Understanding Poverty. (London: Macmillan) Anand, Sudhir and Amartya Sen 1994 Human Development Index: Methodology and Measurement. Occasional Paper 12. (New York: United Nations
Development programme, Human Development Report Office) 1995 General Inequality in Human Development: Theories and Measurement. Occasional Paper 19. (New York: United Nations
Development programme, Human Development Report Office) 1997 “Concepts of human development and poverty: a multi-dimensional perspective.” in UNDP, Human Development Report
1997. (New York: United Nations Development programme, Human Development Report Office) Andreß, H.J. (Ed.) 1998 Empirical Poverty Research in a Comparative Perspective. (Ashgate: Aldershot) Asian Development Bank 1997 Addressing the Urban Poverty Agenda in Bangladesh. (Manila: Asian Development Bank) Atkinson, A. B. 1998 Poverty in Europe. (Oxford: Blackwell) Atkinson, A. B., L. Rainwater and T. Smeeding 1995 “Income distribution in OECD countries.” Social Policy Studies 18, Paris: OECD Bangladesh Bureau of Statistics 1998 Household Expenditure Survey, 1995-96. (Dhaka: Bangladesh Bureau of Statistics, Planning Division, Ministry of
Planning) 2001 Preliminary Report of Household Income and Expenditure Survey 2000. (Dhaka: Bangladesh Bureau of Statistics, Planning
Division, Ministry of Planning) 2004 Report of the Poverty Monitoring Survey 2004. (Dhaka: Bangladesh Bureau of Statistics, Planning Division, Ministry of
Planning) Bell, Lady F 1912 At the Works. (London, Nelson) Booth, Charles 1889 Life and Labour of the People in London. (London: Macmillan) Vol.1: East London. Descriptive Map of East End Poverty.
2 vols. 1902 Life and Labour of the People in London. (London: Macmillan) 17 vols. Map Descriptive of London Poverty, 1898-9. Bowley, Arthur Lyon 1913 “Working class households in Reading.” Journal of the Royal Statistical Society 76, (June): 672-701. Bowley, Arthur Lyon and Alexander R. Burnett-Hurst 1915 Livelihood and Poverty, A Study in the Economic and Social Conditions of Working Class Households in Northampton,
Warrington, Stanley, Reading and Bolton. (London: P. S. King & Son Ltd.) Bowley, Arthur Lyon and Margaret H. Hogg 1925 Has Poverty Diminished? A Sequel to “Livelihood and Poverty” (London: P. S. King & Son Ltd.) Bradshaw, Jonathan (ed.) 1993 Budget Standards for the United Kingdom. (Aldershot: Avebury) Bradshaw, Jonathan and H. Holmes 1989 Living on the Edge: A Study of the Living Standards of Families on Benefit in Tyne and
wear. (Tyneside: CPAG)
Bangladesh e-Journal of Sociology. Volume 4 Number 2. July 2007. 74
Bradshaw, Jonathan and J. Morgan 1987 Budgeting on Benefit: the Consumption of Families on Social Security. (London: Family Policy Studies Centre) Bradshaw, Jonathan et al. 1998 Perceptions of Poverty and Social Exclusion 1998: Report on Preparatory Research. (Bristol: Townsend Centre for
International Poverty Research) Bradshaw, Jonathan and Roy Sainsbury (eds.) 2000 Researching Poverty. (Aldershot: Avebury) Bridgwood, A. et al. 2000 Living in Britain: Results from the 1998 General Household Survey. (London: The
Stationery Office Callan, Tim and Brian Nolan 1991 “Concepts of poverty and the poverty line.” Journal of Economic Surveys 5 (3):
243-61 Callan, Tim, and Brian Nolan and Christopher T. Whelan 1993 “Resources, deprivation and the measurement of poverty.” Journal of Social Policy 22 (2): 141-172 Callan, Tim et al. 1989 Poverty, Income and Welfare in Ireland. (Dublin: Economic and Social Research
Institute) Citro, C.F. and Michael, R.T. (eds) 1995 Measuring Poverty: A New Approach. (Washington, D.C.: National Academy Press) Colasanto, D., A. Kapteyn and J. van der Gaag 1984 “Two subjective definitions of poverty: Results from the Wisconsin basic needs study.” Journal of Human Resources 19
(1): 127-38 Cohen, R., J. Coxall, G. Craig, and A. Sadiq-Sangster 1992 Hardship Britain: Being Poor in the 1990s. (London: CPAG) Davies, M 1909 Life in an English Village. (London) Davis, Peter 1997 Social Exclusion in Bangladesh: New Problematic or Eurocentric Imposition? MSc dissertation, School of Social
Sciences. (Bath: University of Bath) 2006 “Poverty in time: exploring poverty dynamics from life history interviews in Bangladesh.” Paper presented at workshop on
Concepts and Methods for Analysing Poverty Dynamics and Chronic Poverty held in University of Manchester during 23-25 October 2006.
Desai, M. 1986 “Drawing the line: on defining the poverty threshold.” P. Golding (ed.), Excluding the Poor. (London:CPAG) Engels, Frederick 1892 The Condition of the Working-Class in England in 1844. Tr. Florence Kelley Wischnewetzky. (London: George Allen and
Unwin, 1950) Evason, E 1980 Ends that Wont Meet. (London: CPAG) Fisher, Gordon M 2001 “Enough for a family to live on? – Questions from member of the American public and new perspectives from British
social scientists.” Paper presented at the Twenty-third Annual Research Conference of the Association of Public Policy Analysis and Management. Washington, D.C.
Frayman, Harold 1991 Breadline Britain - 1990s: The Findings of the Television Series. (London, Domino Films and London Weekend
Television) Goedhart, Theo et al. 1977 “The poverty line: concept and measurement’, Journal of Human Resources 12 (4): 503-20 Gordon, David 1995 “Census Based Deprivation Indices: Their Weighting and Validation.” Journal of Epidemiology and Community Health. 49
(Suppl 2): S39-S44 2000 “Inequalities in income, wealth and standard of living.” in C. Pantazis and D. Gordon (eds.) Tackling Inequalities: Where
Are We Now and What Can be Done? (Bristol: The Policy Press) 2002 “Measuring poverty and social exclusion in Britain.” Paper presented at the Conference Central European University on
the Dynamics of Poverty: Social Omnibus or Underclass Wagon? Budapest, May 24-25 Gordon, David and Christina Pantazis 1997a "Measuring poverty: Breadline Britain in the 1990s," in Gordon, David and Christina Pantazis (eds.) Breadline Britain in
the 1990s. (Aldershot: Ashgate): 5-47 Gordon, David and Christina Pantazis (eds.) 1997b Breadline Britain in the 1990s. (Aldershot: Ashgate) Gordon, David and Paul Spicker. (eds.) 1998 The International Poverty Glossary. (London, New York: Zed Books) Gordon, David, Christina Pantazis and PeterTownsend 2000 “Absolute and overall poverty: a European history and proposal for measurement.” In Gordon, David and Peter Townsend
(eds.) Breadline Europe: the Measurement of Poverty. (Bristol: Policy Press): 79-106. Gordon, David and PeterTownsend (eds.)
Bangladesh e-Journal of Sociology. Volume 4 Number 2. July 2007. 75
1990 “Measuring the poverty line.” Radical Statistics. 47: 5-12 2000 Breadline Europe: the Measurement of Poverty. (Bristol: Policy Press) Gordon, David, Ruth Levitas, Christina Pantazis, Demi Patsios, Sarah Payne, Peter Townsend, Laura Adelman, Karl Ashworth, Sue Middleton, Jonathan Bradshaw and Julie Williams 2000 Poverty and Social Exclusion in Britain. (York: Joseph Rowntree Foundation) Halleröd, Björn 1994a A New Approach to the Direct Consensual Measurement of Poverty. (Social Policy Research Center, University of New
South Wales) Discussion paper 50. 1994b Poverty in Sweden: A New Approach to Direct Measurement of Consensual Poverty. Umeå Studies in Sociology, No. 106,
University of Umeå. 1995a “Perceptions of poverty in Sweden.” Scandinavian Journal of Social Welfare 4(3):
174-89 1995b “The truly poor: indirect and direct measurement of consensual poverty in Sweden.” In Journal of European Social Policy,
5(2), 111-29. 1998 “Poor Swedes, poor Britons: a comparative analysis of relative deprivation.” In Andreß, H.J. (Ed.) Empirical Poverty
Research in a Comparative Perspective. (Ashgate: Aldershot) Halleröd, Björn and Jonathan Bradshaw, and Hilary Holmes 1997 "Adapting the consensual definition of poverty." In Gordon, David and Christina Pantazis (eds.) Breadline Britain in the
1990s. (Aldershot: Ashgate): 213-234 Harrison, P 1983 Inside the Inner City. (Harmondsworth: Penguin) Howarth, Catherine et al. 1999 Monitoring Poverty and Social Exclusion 1999. (York: Joseph Rowntree Foundation) Islam, S. Aminul 2004 “Sociology of poverty: Quest for a New Horizon.” Paper presented in a seminar on Exploring the Sociological Perspective
of Poverty organized by the Bangladesh Sociological Society at the University of Dhaka on May 7. Jensen, J et al. 2002 Direct Measurement of Living Standards: The New Zealand ELSI Scale. (Wellington, New Zealand: Ministry of Social
Development) Kangas, O. and V.M. Ritakallio 1998 “Different methods . different results? Approaches to multidimensional poverty.” In Andreß, H. J. (Ed.) Empirical
Poverty Research in a Comparative Perspective. (Ashgate: Aldershot) Khan, Monirul I. 2004 “Challenge in Constructing the Sociological Concept of Poverty.” Paper presented in a seminar on Exploring the
Sociological Perspective of Poverty organized by the Bangladesh Sociological Society at the University of Dhaka on May 7.
Krishnan, V., J. Jensenand and S. Ballantyne 2002 New Zealand Living Standards 2000. (Wellington, New Zealand: Ministry of Social Development) Mack, Joanna and Stewart Lansley, 1985 Poor Britain. (London: George Allen and Unwin) 1992 Breadline Britain 1990s: The Findings of the Television Series. (London: London Weekend Television) 1998 Breadline Britain in the 1990s. (London: Domino Films) Martin, J. and A. White 1988 The Financial Circumstances of Adults Living in Private Households, Report-2. (London: Her Majesty’s Stationary
Office) Mayhew, Henry 1861 London Labour and the London Poor. (London: Charles Griffin & Co.) 4 vols. McClelland, J. (ed.) 1982 A Little Pride and Dignity: the Importance of Child Benefit. (London: CPAG) Moser, Caroline, M. Gatehouse and H. Garcia 1996 Urban Poverty Research Sourcebook Module II: Indicators of Urban Poverty. (Washington, D.C.: UNDP/UNCHS
(Habitat)/World Bank) Urban Management Working Paper Series #5 Muffels, R. et al. 1990 Poverty in the Netherlands: Report on the Dutch Contribution to an International Comparative Study on Poverty and the
Financial Efficacy of the Social Security System. (The Hague: VUGA) Nolan, Brian and Christopher T. Whelan 1996a Resources, Deprivation and Poverty. (Oxford: Clarendon Press) 1996b "Measuring Poverty Using Income and Deprivation Indicators: Alternative Approaches," Journal of European Social
Policy 6 (3): 225-240 Nunnally, J. C. 1981 Psychometric theory. (New Delhi: Tate McGraw-Hill Publishing Company Ltd) Organization for Economic Cooperation and Development (OECD) 2001 The DAC Guidelines: Poverty Reduction. (Paris: OECD) Orshansky, Mollie 1965 “Counting the poor: another look at the poverty profile.” Social Security Bulletin 28 (June): 3-29
Bangladesh e-Journal of Sociology. Volume 4 Number 2. July 2007. 76
1967 Who Was Poor in 1966? Research and Statistics Note. (Washington, D.C.: US Department of Health and Education and
Welfare) 6 December. 1969 “Perspectives on poverty 2: how poverty is measured.” Monthly Labor Review (Feb): 37-43 Piachaud, David 1981 “Peter Townsend and the Holy Grail.” New Society September 10 1987 “Problems in the Definition and Measurement of Poverty.” Journal of Social Policy 16(2) Piachaud, David and H. Sutherland 2002 Changing Poverty Post-1997. (London: Centre for Analysis of Social Exclusion, London School of Economics) Rahnema, Majid 1991 “Global Poverty: a Papuperizing Myth.” Interculture 24(2) Spring: 4-51 1993 “Poverty.” Wolfgang Sachs (ed.), The Development Dictionary: A Guide to Knowledge as Power. (Johannesburg:
Witwaterstrand University Press and London: Zed Books Ltd): 158-76 Ramprakash, D 1994 “Poverty in the countries of the European Union: a synthesis of Eurostat’s research on poverty”. Journal of European
Social Policy, 4(2), 117-128. Reeves, Maud William Pember 1914 Round About a Pound a Week. (London: Virago Press) Ringen, S. 1987 The Possibility of Politics. (Oxford: Clarendon Press) 1988 “Direct and indirect measures of poverty.” Journal of Social Policy, 17 (3): 351-65. 1995 “Well-being, measurement and preferences.” Acta Sociologica, 38: 3-15. Rowntree, B. Seebohm 1901 Poverty: A Study of Town Life. (London: Macmillan) 1942 Poverty and Progress: A Second Social Survey of York. (London: Longmans, Green & Co) Rowntree, B. Seebohm and G. R. Lavers 1951 Poverty and the Welfare State: A Third Social Survey of York Dealing only
with Economic Questions. (London: Longmans, Green & Co.) Saunders, Peter 1999 "Budget Standards and the Poverty Line." Australian Economic Review 32 (1): 43-61 Saunders, Peter and Bruce Bradbury 1991 "Some Australian Evidence on the Consensual Approach to Poverty Measurement." Economic Analysis & Policy 21(1):
47-78 Saunders, P. and G. Matheson 1992 Perceptions of Poverty, Income Adequacy and Living Standards in Australia. (Sydney: Social Policy Research Centre,
University of New South Wales) Reports and Proceedings No. 99 Seabrook, J. 1984 Landscapes of Poverty. (Oxford: Blackwell) Sen, Amartya 1976 “Poverty: an ordinal approach to measurement.” Econometrica 44(2) March: 219-31 1983 “Poor, Relatively Speaking.” Oxford Economic Papers 35.1 Sen, Binayek and David Hulme 2004 Chronic poverty in Bangladesh: Tales of Ascent, Descent, Marginality and Persistence. (Dhaka: Bangladesh Institute of
Development Studies and Manchester: Chronic Poverty Research Centre, University of Manchester) Smith, George Davey, Daniel Dorling and Mary Shaw (eds.) 2001 Poverty, Inequality and Health in Britain, 1800-2000: A Reader. (Bristol: The Policy Press) Soutar, Mary Stewart, Edgar Henry Wilkins and Philip Sargant Florence 1942 Nutrition and Size of Family: Report on a New Housing Estate. (London: George Allen & Unwin Ltd.) Stitt, Sean and Diane Grant 1993 Poverty: Rowntree Revisited. (Aldershot: Avebury) Townsend, Peter 1962 “The meaning of poverty.” British Journal of Sociology 13 (3): 210-27 1979 Poverty in the United Kingdom. (Harmondsworth: Penguin) 1987 “Deprivation.” Journal of Social Policy 16 (2): 125-146. 1993 The International Analysis of Poverty. (Hemel Hempstead: Harvester Wheatsheaf) Townsend, Peter (ed.) 1970 The concept of poverty. (London: Heinemann) Townsend, Peter et al. 1987 Poverty and Labour in London. (London: Low Pay Unit) 1996 The Poverty Line in Britain Today: What the Population Themselves Say. (Bristol: Statistical Monitoring Unit, University
of Bristol) Report No. 7, 1997 Absolute and Overall Poverty in Britain in 1997: What the Population Themselves Say: Bristol Poverty Line Survey--
Report of the Second MORI Survey. (Bristol: Bristol Statistical Monitoring Unit, School for Policy Studies, University of Bristol)
United Nations (UN) 1995 The Copenhagen Declaration and Programme of Action: World Summit for Social Development 6-12 March 1995. (New
York: United Nations Department of Publications) United Nations Development Program (UNDP)
Bangladesh e-Journal of Sociology. Volume 4 Number 2. July 2007. 77
1998 Poverty in transition. (New York: Regional Bureau for Europe and the CIS, UNDP) 2005 Human Development Report 2005: International cooperation at a crossroads: Aid, trade and security in an unequal world.
(New York: Oxford University Press) Van den Bosch, K. 1998 “Perceptions of the minimum standard of living in Belgium: Is there a consensus?” In Andreß, H.J. (Ed.) Empirical
Poverty Research in a Comparative Perspective. (Ashgate: Aldershot) Veit-Wilson, J. H. 1987 “Consensual approaches to poverty lines and social security”. Journal of Social Policy 16(2): 183-211. Vogel, J. 1997 Living Conditions and Inequality in the European Union 1997. Eurostat Working Papers: (Luxembourg: Eurostat,
Population and Social Conditions E/1997-3) Walker, R. 1987 “Consensual approaches to the definition of poverty: Towards an alternative methodology.” Journal of Social Policy 16
(2): 213-26 Wood, Geoffrey 2003 “Staying secure, staying poor: the ‘Faustian Bargain’.” World Development 31:455-71 World Bank 1990 World Development Report 1990: Poverty. ( Washington, D.C.: World Bank) Zarb, G. and L. Maher 1997 The Financial Circumstances of Disabled People in Northern Ireland. (Belfast: NISRA) PPRU Surveys of Disability
Report No. 6