Connectivity in the
72
ITUPublications Connectivity in the Least Developed Countries Status report 2021 International Telecommunication Union Development Sector
Transcript of Connectivity in the

ITUPublications
Connectivity in the Least Developed Countries Status report 2021
International Telecommunication UnionDevelopment Sector

Connectivity in the Least Developed Countries:
Status report 2021
© ITU 2021
Some rights reserved. This work is licensed to the public through a Creative Commons Attribution-Non-Commercial-Share Alike 3.0 IGO license (CC BY-NC-SA 3.0 IGO).
Under the terms of this licence, you may copy, redistribute and adapt the work for non-commercial purposes, provided the work is appropriately cited. In any use of this work, there should be no suggestion that ITU endorse any specific organization, products or services. The unauthorized use of the ITU names or logos is not permitted. If you adapt the work, then you must license your work under the same or equivalent Creative Commons licence. If you create a translation of this work, you should add the following disclaimer along with the suggested citation: “This translation was not created by the International Telecommunication Union (ITU). ITU is not responsible for the content or accuracy of this translation. The original English edition shall be the binding and authentic edition”. For more information, please visit https://creativecommons.org/licenses/by-nc-sa/3.0/igo/
Please consider the environment before printing this report.
Disclaimer:
The designations employed and the presentation of the material in this publication do not imply the expression of any opinion whatsoever on the part of ITU and of the Secretariat of ITU concerning the legal status of any country, territory, city or area or of its authorities, or concerning the delimitation of its frontiers or boundaries.
The mention of specific companies or of certain manufacturers’ products does not imply that they are endorsed or recommended by ITU in preference to others of a similar nature that are not mentioned. Errors and omissions excepted, the names of proprietary products are distinguished by initial capital letters.
All reasonable precautions have been taken by ITU to verify the information contained in this publication. However, the published material is being distributed without warranty of any kind, either expressed or implied. The responsibility for the interpretation and use of the material lies with the reader.
The opinions, findings and conclusions expressed in this publication do not necessarily reflect the views of ITU or membership.
ISBN:
978-92-61-35001-7 (Electronic version) 978-92-61-35011-6 (EPUB version) 978-92-61-35021-5 (Mobi version)

iii
Acknowledgements
The present report was prepared by ITU expert Michael Minges, under the direction of the ICT Data and Analytics Division of the ITU Telecommunication Development Bureau (BDT), in cooperation with the United Nations Office of the High Representative for the Least Developed Countries, Landlocked Developing Countries and Small Island Developing States (UN-OHRLLS).

iv
Foreword
The Connectivity in the Least Developed Countries: Status report 2021 comes at a time when connectivity is universally acknowledged as a critical determinant of every country’s future growth and prosperity.
This year’s report assesses the state of digital connectivity in the 46 UN-designated Least Developed Countries (LDCs), showcases practical solutions to improve digital access, and formulates concrete policy recommendations to accelerate progress towards universal and affordable connectivity.
Three years have passed since our last assessment, and we find ourselves in a new world dramatically re-shaped by the COVID-19 pandemic. For LDCs, the promises of connectivity remain unfulfilled. Only two LDCs have met Target 9.c of the Sustainable Development Goal (SDG) related to universality and affordability – a target all LDCs were supposed to have reached by 2020. Several others are edging closer, and will likely meet the target by 2025, but 26 – more than half of all LDCs – remain far off.
However, this report also shows that even meeting Target 9.c will not be enough. Right now, the LDC ‘usage gap’ – by which we mean people who have access to connectivity, but who are not in a position to use it – is cavernous. While three quarters of people in the LDCs are covered by a mobile broadband network, only a quarter is connected. The possibility of connecting is simply not translating into actual usage of the Internet, for a host of reasons. This report explores those reasons, which include the price of services and devices, lack of awareness of the Internet and its benefits, and lack of digital skills. In addition to taking stock of the challenges, the report also showcases many good practices in LDCs to replicate and scale up.
Information and communication technologies (ICTs) can help countries leapfrog chronic development impediments in areas from education and health, to government services and trade. ICT services make business more efficient and productive, opening the door to innovative services and applications that can fuel growth and trigger new business opportunities.
The 2030 Agenda for Sustainable Development recognizes that “the spread of information and communications technology and global interconnectedness has great potential to accelerate human progress, to bridge the digital divide and to develop knowledge societies”. The Istanbul Programme of Action for the Least Developed Countries for the decade 2011-2020 also recognizes ICT networks as an infrastructure priority on a par with water, electricity, and transport. For the development community, the past decade concluded on a sobering note: progress on all SDGs had stalled. This admission led the United Nations to launch the Decade of Action in 2019, to re-affirm the importance of the 2030 Agenda and to step up efforts to deliver on the 17 SDGs. While connectivity was widely recognized as a catalyst for meeting all SDGs before the COVID-19 pandemic, during the global health crisis it has become a lifeline, sustaining families, communities and businesses through online working, e-learning, e-commerce, online health services and much more.

v
The outcomes of both the 5th United Nations Conference on the Least Developed Countries (LDC5), to be hosted by UN-OHRLLS in January 2022, and the World Telecommunication Development Conference, which will be hosted by ITU in June of that same year, will together direct much-needed attention towards the imperative of rapidly and dramatically improving connectivity in LDCs. It is our hope that they will galvanize national and international efforts, showcase solutions, secure pledges, and solidify commitments to the global sustainable development agenda – by aptly placing the catalysing role of connectivity at its core.
Our two organizations, and our partners, will spare no effort to connect communities, including through the Partner2Connect Digital Coalition. The coalitions is a multi-stakeholder alliance to foster meaningful connectivity and digital transformation in hardest-to-connect communities, including those in LDCs, LLDCs and SIDS.
The overarching ambition of the 2030 Agenda is to Leave No One Behind. In a world that is increasingly digital, that means, more than ever, leaving no one offline.
Courtenay Rattray United Nations Under-Secretary-General and High Representative for the Least Developed Countries, Landlocked Developing Countries
and Small Island Developing States
Doreen Bogdan-Martin Director
Telecommunication Development Bureau International Telecommunication Union

vi
Acknowledgements �����������������������������������������������������������������������������������������������������������������������iii
Foreword �����������������������������������������������������������������������������������������������������������������������������������������iv
List of figures, tables and boxes ��������������������������������������������������������������������������������������������������vii
Abbreviations ����������������������������������������������������������������������������������������������������������������������������������ix
1 Introduction ���������������������������������������������������������������������������������������������������������������������������� 1
2 The Least Developed Countries ������������������������������������������������������������������������������������������ 2
3 The benefits of narrowband, the promises of broadband ����������������������������������������������� 7
3.1 Narrowband ................................................................................................................. 7
3.2 Broadband ................................................................................................................... 9
4 Assessing progress towards universal and affordable connectivity in Least Developed Countries ������������������������������������������������������������������������������������������������������������������� 17
4.1 Sustainable Development Goal Target 9.c ............................................................ 17
4.2 Skills ............................................................................................................................ 22
4.3 National data infrastructure ..................................................................................... 28
5 E-commerce challenges������������������������������������������������������������������������������������������������������ 31
6 The role of the private sector in boosting connectivity �������������������������������������������������� 37
7 Conclusions �������������������������������������������������������������������������������������������������������������������������� 45
Annex ��������������������������������������������������������������������������������������������������������������������������������������������� 48
References ������������������������������������������������������������������������������������������������������������������������������������� 54
Table of contents

List of figures, tables and boxes
Figures
Figure 3.1: Mobile telephone use in LDCs .............................................................................. 8
Figure 3.2: Broadband penetration ........................................................................................ 10
Figure 4.1: Data usage in selected LDCs ............................................................................... 18
Figure 4.2: Universality and affordability trends ................................................................... 19
Figure 4.3: Status of SDG Target 9.c in LDCs, 2020 ............................................................ 20
Figure 4.4: LDCs achieving ITU Connect 2030 target for Internet use ............................. 21
Figure 4.5: Coverage and usage gaps in the LDCs ............................................................. 22
Figure 4.6: Percentage of households with a computer .................................................... 25
Figure 4.7: Reach of transmission networks in LDCs ........................................................... 28
Figure 4.8: Data centres penetration ..................................................................................... 30
Figure 5.1: Online shopping habits ........................................................................................ 32
Figure 5.2: Awareness of platforms for buying/selling ........................................................ 33
Figure 6.1: Telecommunication operators and mobile subscriptions in LDCs ............... 38
Figure 7.1: LDCs at different stages of digital development .............................................. 45
Tables
Table 2.1: LDCs by ITU region, 2021 ....................................................................................... 4
Table 2.2: Basic indicators, LDCs .............................................................................................. 5
Table 3.1: Percentage of households with a mobile telephone ........................................ 14
Table 3.2: Proportion of individuals who own a mobile phone (SDG 5.b) ....................... 16
Table 4.1: Main reason for not using the Internet, % of respondents, 2017-2018 .......... 23
Table 4.2: Smartphone prices in LDCs, 2020 ....................................................................... 24
Table 4.3: Internet use and digital skills (% of surveyed population) ................................ 25
Table 4.4: Stage of LDC IXPs, 2021 ........................................................................................ 30
Table 5.1: Prevalence of online shopping in LDCs .............................................................. 36
Table 6.1: Publicly listed global telecommunication companies in LDCs, 2020 ............. 39
Table 6.2: Telecom operators with public listing in LDC stock markets ........................... 39
Table 6.3: Axiata’s economic impact in three Asian LDCs, 2020 ....................................... 42
Box Table 6.1: Burkina Faso telecommunication market statistics, 4th quarter 2020 .... 43
Box Table 6.2: Selected indicators for Bangladesh and Ethiopia, 2020 ........................... 44
Annex Table 1: Monitoring SDG Target 9.c .......................................................................... 48
Annex Table 2: Proportion of individuals using the Internet (SDG 17.8) .......................... 50
Annex Table 3: Population within reach of transmission networks (%), 2020 .................. 51
Annex Table 4: Number of data centres, April 2021 ........................................................... 53
vii

viii
Boxes
Box 2.1: United Nations Technology Bank .............................................................................. 4
Box 3.1: Mobile phones and rapid COVID-19 surveys .......................................................... 8
Box 3.2: Fixed broadband in the LDCs .................................................................................. 10
Box 3.3: Broadband roll-out in LDCs: Lessons from a study of four countries ................ 12
Box 4.1: Measuring Internet use in LDCs ............................................................................... 21
Box 4.2: EQUALS: The Global Partnership for Gender Equality in the Digital Age ........ 27
Box 5.1: Senegal’s e-commerce sector helps country cope with COVID-19 ................... 35
Box 6.1: The demise of Rwandatel ......................................................................................... 41
Box 6.2: Burkina Faso's excellent telecommunication sector statistics ............................. 43
Box 6.3: The liberalization of the Ethiopian telecommunication market .......................... 44
ix
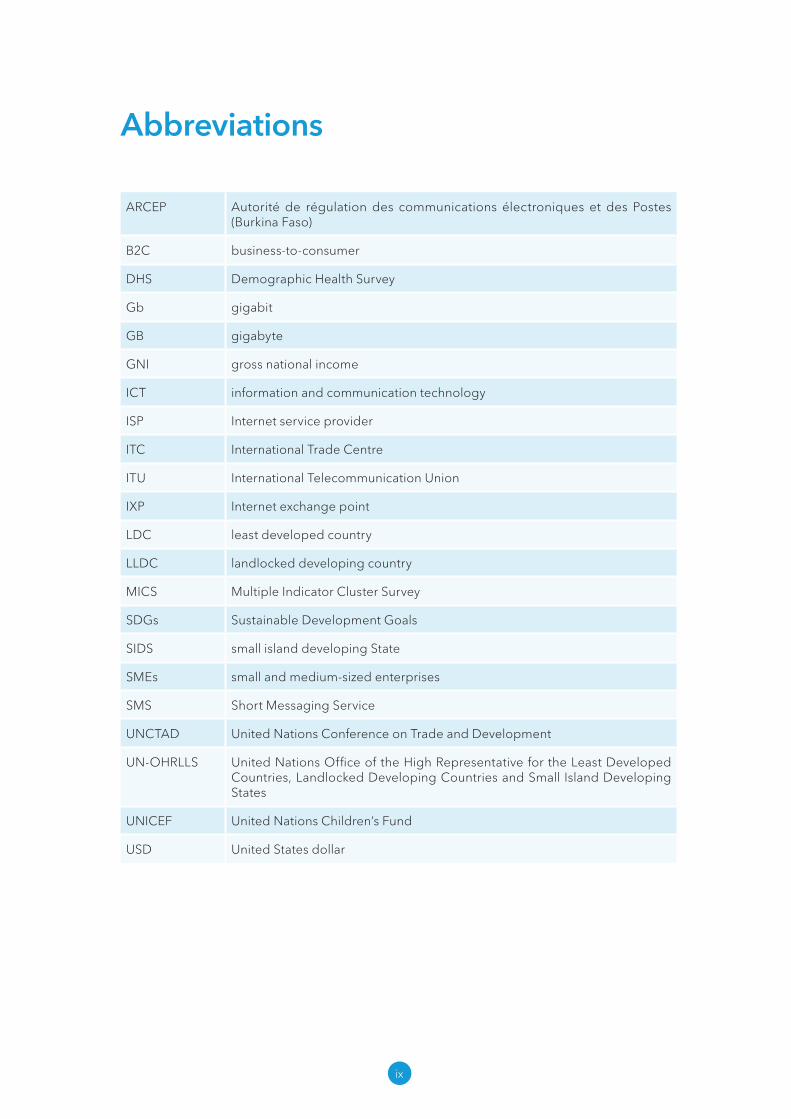
Abbreviations
ARCEP Autorité de régulation des communications électroniques et des Postes (Burkina Faso)
B2C business-to-consumer
DHS Demographic Health Survey
Gb gigabit
GB gigabyte
GNI gross national income
ICT information and communication technology
ISP Internet service provider
ITC International Trade Centre
ITU International Telecommunication Union
IXP Internet exchange point
LDC least developed country
LLDC landlocked developing country
MICS Multiple Indicator Cluster Survey
SDGs Sustainable Development Goals
SIDS small island developing State
SMEs small and medium-sized enterprises
SMS Short Messaging Service
UNCTAD United Nations Conference on Trade and Development
UN-OHRLLS United Nations Office of the High Representative for the Least Developed Countries, Landlocked Developing Countries and Small Island Developing States
UNICEF United Nations Children’s Fund
USD United States dollar


Connectivity in the Least Developed Countries: Status report 2021
1
1 Introduction
The COVID-19 pandemic has underscored how poorly prepared Least Developed Countries (LDCs) are for a digital world. Uneven connectivity within the group has meant that many people and businesses in LDCs could not avail themselves of high-speed networks for remote learning, access to e-government services and online shopping.
This report provides an update of digital connectivity developments in LDCs since the 2018 publication ICTs, LDCs and the SDGs: Achieving universal and affordable Internet in the Least Developed Countries (ITU and UN-OHRLLS, 2018). This publication gauges progress towards achieving Sustainable Development Goal (SDG) Target 9.c, aimed specifically at digital connectivity in the LDCs.
The target calls on States to “significantly increase access to information and communications technology and strive to provide universal and affordable access to the Internet in Least Developed Countries”. While 2020 was the deadline, only two LDCs, Bangladesh and Bhutan, accomplished the universality and affordability aspects of the target. Some others are on track to reach it before the end of the decade. However, more than two dozen LDCs have not met and are not close to meeting either target. At the same time, while Internet coverage and pricing are gradually improving for some LDCs, Internet use is not keeping pace. There is a growing number of people in the LDCs theoretically able to access the Internet but not using it. While this is partly related to the cost of Internet-enabled devices, the larger cause is a lack of awareness and digital skills.
In 2020, the 46 LDCs had a combined population of 1.06 billion people and are highly vulnerable, with low levels of human development. And yet, geography, population size and income vary within the group, and these different conditions affect digital development.
National data infrastructure is an essential component for a digital economy, as it comprises the facilities for transporting, exchanging and storing data. There are significant gaps in national transmission networks, Internet exchange points (IXPs) and data centres. Coverage and density of national transmission networks are lagging in the LDCs. This has ramifications for Internet access and the quality of service. IXPs play a major role in lowering the cost of Internet access as well as reducing data exchange delay, yet 19 LDCs lack them. Furthermore, in those LDCs with IXPs, many of the facilities are not having the impact they should. Data centres, facilities to store data, are in short supply in the LDCs. There are less than 100 in the group, of which over a quarter are in Bangladesh. Eighteen LDCs do not have Internet-connected data centres.
Quarantine measures during the COVID-19 pandemic resulted in people around the world turning to online shopping. However, this was not possible for many in the LDCs, due to a lack of online shops, as well as demand-side constraints, such as awareness, distrust and payment methods. An encouraging initiative is the United Nations Conference on Trade and Development (UNCTAD) diagnostics and concrete recommendations for enhancing e-commerce in many LDCs.
The private sector is essential for boosting digital connectivity in the LDCs. Telecommunications in the LDCs are mainly operated by private companies, a reverse of the situation three decades ago. Yet most policy reports make scarce mention of the companies building the connectivity infrastructure in LDCs. Companies operating in the LDCs are identified, and implications of their
Connectivity in the Least Developed Countries: Status report 2021
2
typology (such as publicly listed, private unlisted and full government ownership) for network deployment and transparency are discussed.
Note that some of the statistical information in the report draws on demand side surveys. The surveys are generally not conducted annually, so the latest available from 2016 to 2020 is used. As the surveys are from different sources that do not always use the same methodologies (such as different age groups), they are not strictly comparable. The surveys cover over 90 per cent of the population living in LDCs.
2 The Least Developed Countries
The LDCs are comprised of 46 low- and lower-middle-income countries that suffer from severe structural impediments to sustainable development. They are highly vulnerable to economic and environmental shocks, and have low levels of human development.1 In 2020, the LDCs had a combined population of 1.06 billion people, representing 14 per cent of the world’s inhabitants. According to the ITU regional classification used in this report, 28 of the LDCs are located in Africa, 11 are in Asia and the Pacific, 6 are in the Arab States and 1 is in the Americas (Table 2.1).2
Countries with LDC status benefit from special support and assistance measures. The United Nations has mainstreamed the needs of LDCs in its activities and programmes, and UN-OHRLLS provides special support to them.
South Sudan was the most recent country to join the group of LDCs, in 2012. Equatorial Guinea graduated from the LDCs category in June 2017. It was the fifth country to graduate since the inception of the category in 1971, following Botswana (1994), Cabo Verde (2007), Maldives (2011) and Samoa (2014). Vanuatu graduated in December 2020, but is included in this report, since the data cover up to the year 2020.
There is global recognition of the importance of information and communication technologies (ICTs) in LDCs. The Programme of Action for the Least Developed Countries for the Decade 2011–2020 (Istanbul Programme of Action), adopted by the Fourth United Nations Conference on the Least Developed Countries in 2011, recognizes ICT as an infrastructure priority on par with water, electricity and transport.3 The Istanbul Programme of Action includes a call to “significantly increase access to telecommunication services and strive to provide 100 per cent access to the Internet by 2020” (United Nations, 2011). In addition, the membership of ITU recognized the importance of ICTs for LDCs by the adoption of specific targets in its Connect 2030 Agenda. Target 2, on inclusiveness, calls for 30 per cent of the population in the LDCs to be using the Internet by 2023.4
1 For more on the specific criteria used to identify LDCs, see https:// www .un .org/ development/ desa/ dpad/ least -developed -country -category/ ldc -criteria .html.
2 For the UN-OHRLLS geographical classification of LDCs, see http:// unohrlls .org/ about -ldcs/ .3 For information and progress on the implementation of the Istanbul Programme of Action, see United Nations
(2020).4 “Connect 2030 – An agenda to connect all to a better world”, available at https:// www .itu .int/ en/ mediacentre/
backgrounders/ Pages/ connect -2030 -agenda .aspx.
Connectivity in the Least Developed Countries: Status report 2021
3
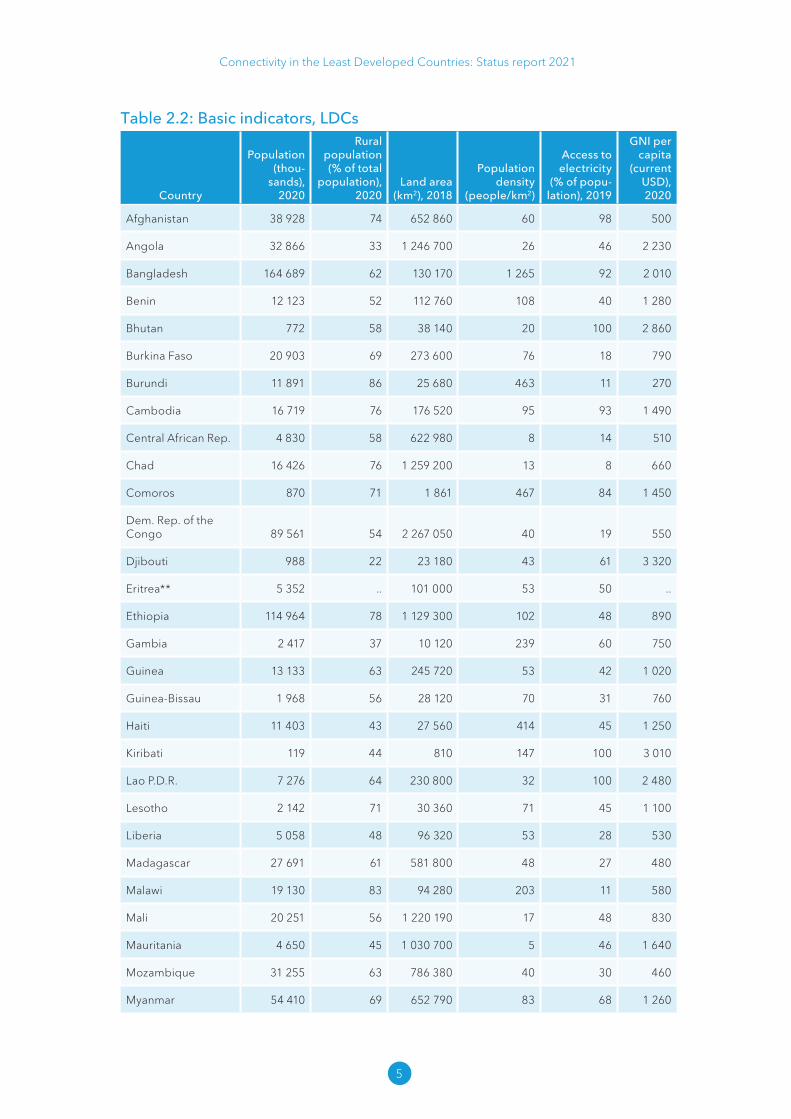
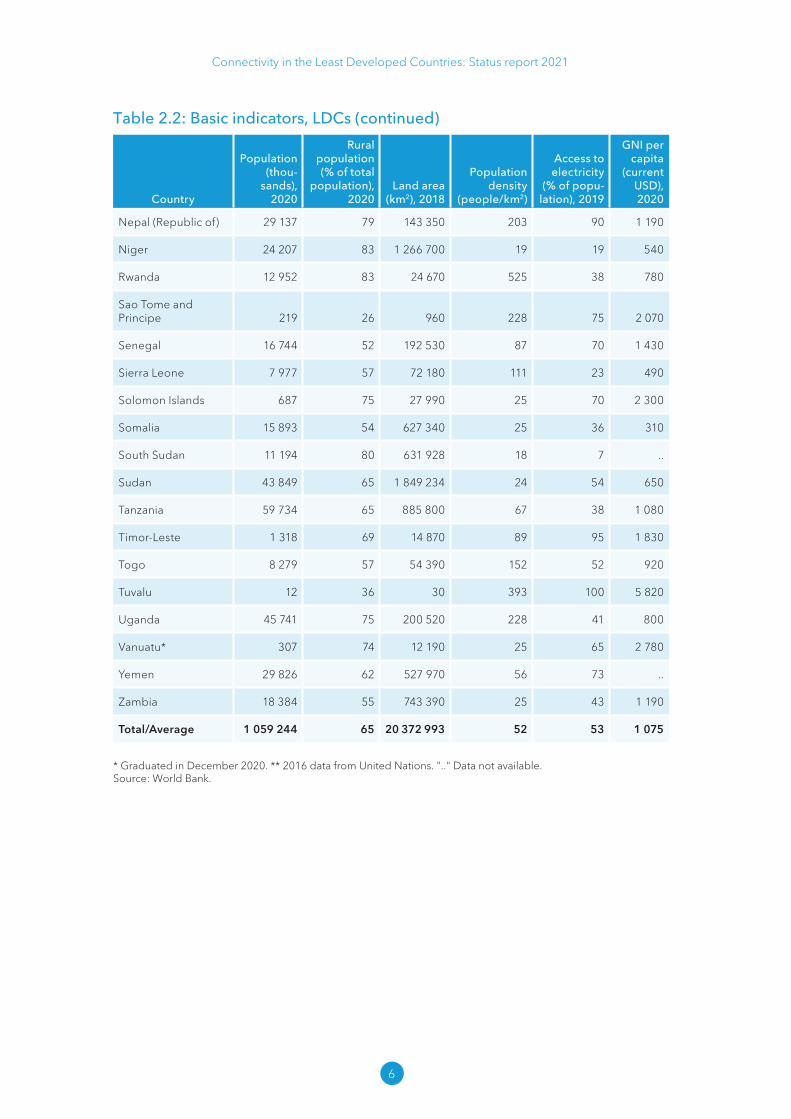
Although the 46 LDCs share many similarities and face related development challenges, there are major differences within the group, in particular in terms of their population, geography and economic development (Table 2.1). Population size has an important impact on digital development, since very small markets lack economies of scale, resulting in higher costs for network deployment. In respect to geography, 17 LDCs are landlocked developing countries (LLDCs), and 9 are small island developing States (SIDS). While LLDCs lack direct access to the sea, which often makes international connectivity more expensive, many SIDS have numerous islands, and some are very small with few inhabitants. Some LDCs are very rural, and others have large, sparsely populated land areas, which makes the roll-out of terrestrial communication infrastructure more difficult.
Gross national income (GNI) per capita is a consideration for inclusion in the LDCs.5 Nevertheless, there are notable income differences in the group. While 25 are classified as low-income, 21 are classified as lower-middle-income, where GNI per capita can be almost four times higher. The differences in income among the LDCs has implications for Internet affordability. For instance, while a smartphone costs roughly the same in Lesotho and Mozambique, the price is 16 per cent of average monthly income in Lesotho, compared with 51 per cent in Mozambique. Similarly, while 1.5 GB per month of data costs around USD 5 in both the Lao People’s Democratic Republic and Gambia, as a percentage of GNI per capita, it is 2.4 per cent in the former, compared with over 8 per cent in the latter. Higher levels of income also affect the skills to use the Internet, since they are often associated with higher levels of education.
Apart from socio-economic characteristics, governance and conflict situations also vary across the LDCs. This has implications for creating an enabling environment for investment in digital infrastructure, as well as analysis of the ICT sector.
Heterogeneity across the LDCs in respect to income levels, geography and governance suggests that there are few common approaches for digital connectivity across the group. This is further reinforced given different levels of digital development among the LDCs, where a particular challenge in one area (e.g. coverage) may not be relevant for every country in the group.
5 The LDC criteria go beyond income and include economic and environmental vulnerability. See https:// www .un .org/ development/ desa/ dpad/ least -developed -country -category/ evi -indicators -ldc .html.

Connectivity in the Least Developed Countries: Status report 2021
4
Table 2�1: LDCs by ITU region, 2021
Africa The Americas Arab States Asia and the
Pacific
Non-LLDC or SIDS
Angola* Benin*
Dem. Rep. of the Congo Eritrea
Gambia Guinea Liberia
Madagascar Mozambique
Senegal* Sierra Leone
Togo Tanzania*
Djibouti* Mauritania*
Somalia Sudan Yemen
Bangladesh* Cambodia* Myanmar*
LLDCs
Burkina Faso Burundi
Central African Rep. Chad
Ethiopia Lesotho* Malawi
Mali Niger
Rwanda South Sudan
Uganda Zambia*
Afghanistan Bhutan*
Lao P.D.R.* Nepal (Republic
of)*
SIDSGuinea-Bissau Sao Tome and
Principe*Haiti Comoros*
Kiribati* Solomon Islands*
Timor-Leste* Tuvalu**
Number of countries
28 1 6 11
Note: All low-income countries except * lower-middle-income ** upper-middle-income.Source: Adapted from UN-OHRLLS and World Bank.
Box 2�1: United Nations Technology Bank
The 2011 Istanbul Programme of Action called for the creation of a Technology Bank, which was reaffirmed in the Sustainable Development Goals (SDGs, Target 17.8).1 The Technology Bank for the LDCs was officially established on 23 December 2016, through the adoption of United Nations General Assembly Resolution 71/L.52. It became operational in 2018, with headquarters in Turkey.
The United Nations Technology Bank engages with national, regional and international partners to strengthen science, technology and innovation capacity in LDCs. The Technology Bank can play an important role catalysing action within the LDCs (Chibuye and Zampetti, 2018). Efforts to enhance the utilization of knowledge as a global public good for the development of the LDCs hold the promise to spur and support initiatives directed at advancing science, technology and innovation in the group.
1 See https:// www .un .org/ technologybank/ .
Connectivity in the Least Developed Countries: Status report 2021
5
Table 2�2: Basic indicators, LDCs
Country
Population (thou-
sands), 2020
Rural population (% of total
population), 2020
Land area (km2), 2018
Population density
(people/km2)
Access to electricity
(% of popu-lation), 2019
GNI per capita
(current USD), 2020
Afghanistan 38 928 74 652 860 60 98 500
Angola 32 866 33 1 246 700 26 46 2 230
Bangladesh 164 689 62 130 170 1 265 92 2 010
Benin 12 123 52 112 760 108 40 1 280
Bhutan 772 58 38 140 20 100 2 860
Burkina Faso 20 903 69 273 600 76 18 790
Burundi 11 891 86 25 680 463 11 270
Cambodia 16 719 76 176 520 95 93 1 490
Central African Rep. 4 830 58 622 980 8 14 510
Chad 16 426 76 1 259 200 13 8 660
Comoros 870 71 1 861 467 84 1 450
Dem. Rep. of the Congo 89 561 54 2 267 050 40 19 550
Djibouti 988 22 23 180 43 61 3 320
Eritrea** 5 352 .. 101 000 53 50 ..
Ethiopia 114 964 78 1 129 300 102 48 890
Gambia 2 417 37 10 120 239 60 750
Guinea 13 133 63 245 720 53 42 1 020
Guinea-Bissau 1 968 56 28 120 70 31 760
Haiti 11 403 43 27 560 414 45 1 250
Kiribati 119 44 810 147 100 3 010
Lao P.D.R. 7 276 64 230 800 32 100 2 480
Lesotho 2 142 71 30 360 71 45 1 100
Liberia 5 058 48 96 320 53 28 530
Madagascar 27 691 61 581 800 48 27 480
Malawi 19 130 83 94 280 203 11 580
Mali 20 251 56 1 220 190 17 48 830
Mauritania 4 650 45 1 030 700 5 46 1 640
Mozambique 31 255 63 786 380 40 30 460
Myanmar 54 410 69 652 790 83 68 1 260
Connectivity in the Least Developed Countries: Status report 2021
6
Country
Population (thou-
sands), 2020
Rural population (% of total
population), 2020
Land area (km2), 2018
Population density
(people/km2)
Access to electricity
(% of popu-lation), 2019
GNI per capita
(current USD), 2020
Nepal (Republic of) 29 137 79 143 350 203 90 1 190
Niger 24 207 83 1 266 700 19 19 540
Rwanda 12 952 83 24 670 525 38 780
Sao Tome and Principe 219 26 960 228 75 2 070
Senegal 16 744 52 192 530 87 70 1 430
Sierra Leone 7 977 57 72 180 111 23 490
Solomon Islands 687 75 27 990 25 70 2 300
Somalia 15 893 54 627 340 25 36 310
South Sudan 11 194 80 631 928 18 7 ..
Sudan 43 849 65 1 849 234 24 54 650
Tanzania 59 734 65 885 800 67 38 1 080
Timor-Leste 1 318 69 14 870 89 95 1 830
Togo 8 279 57 54 390 152 52 920
Tuvalu 12 36 30 393 100 5 820
Uganda 45 741 75 200 520 228 41 800
Vanuatu* 307 74 12 190 25 65 2 780
Yemen 29 826 62 527 970 56 73 ..
Zambia 18 384 55 743 390 25 43 1 190
Total/Average 1 059 244 65 20 372 993 52 53 1 075
* Graduated in December 2020. ** 2016 data from United Nations. ".." Data not available.Source: World Bank.
Table 2�2: Basic indicators, LDCs (continued)

Connectivity in the Least Developed Countries: Status report 2021
7
3 The benefits of narrowband, the promises of broadband
More people in LDCs use basic mobile services such as voice and text, rather than the Internet. One reason is that devices are cheaper, and a lower level of skills is needed. Much can be accomplished with plain cellphones operating over low-speed or narrowband mobile networks. Apart from voice calls, text messages can be sent, and are used for a variety of livelihood- and life-enhancing services, such as accessing agricultural or health information. Mobile money also operates over low-speed networks and plain cellphones, helping to widen financial inclusion in the LDCs. Though slow, the Internet can also be accessed using basic mobile technology.
This chapter outlines some of the ways LDCs have and continue to benefit from plain mobile technology. It then discusses how broadband could have much greater social and economic impact, particularly in the context of COVID-19.
3.1 Narrowband
The world’s most vulnerable countries have witnessed impressive growth in terms of Second Generation (2G) mobile cellular network deployment, services and uptake. As of 2020, 2G mobile telephony covered around 90 per cent of people living in the LDCs, and subscriptions stood at a little over 70 per 100 persons. However, given that subscriptions can include multiple accounts by the same user, it is not an accurate metric of use. Traditionally, household ownership of a telephone has been used to measure the level of universal service (ITU, 1998). On this metric, there is a relatively high level of basic mobile phone penetration, with a country average of 78 per cent of households possessing a mobile phone (Table 3.1).6 Ten countries report over 90 per cent of households having at least one family member with a mobile phone. This group consists of Bangladesh, Bhutan, Burkina Faso, Cambodia, Gambia, Guinea-Bissau, the Lao People’s Democratic Republic, Lesotho, the Republic of Nepal and Senegal).
Households in urban areas of LDCs have achieved a high level of mobile phone ownership, reaching a country average of 91 per cent. However, there is a significant gap with rural areas, where the average is 70 per cent (Figure 3.1, left). The divide is particularly acute in some LDCs, where the urban penetration is twice that of rural areas. Similarly, there is a gender mobile phone gap. Among the 23 LDCs where statistics on gender disaggregated mobile phone ownership are available (SDG 5.b.1), ownership among women is 13 per cent less than that of men (Figure 3.1, right). There are four LDCs where women’s cellphone ownership rates are equal to or higher than those of men (Cambodia, Kiribati, Lesotho, and Sao Tome and Principe). Despite these gaps, in some LDCs, mobile phone ownership is considered high enough that telephone instead of face-to-face surveys can be carried out. This is critical during the COVID-19 pandemic, to protect the safety of interviewer and interviewee (Box 3.1).
6 Surveys on households possessing a mobile phone are available for 37 LDCs, including a breakdown by location.

Connectivity in the Least Developed Countries: Status report 2021
8
Figure 3�1: Mobile telephone use in LDCs
% of households possessing a mobile telephone, latest available survey
0
50
100
National Rural Urban
7870
91
% of individuals owning a mobile telephone, latest available survey
National Women Men
0
50
100
6154
67
Note: Averages are unweighted country averages, based on surveys carried out between 2016 and 2020.Source: Demographic Health Survey (DHS), Multiple Indicator Cluster Survey (MICS) and national surveys.
Box 3�1: Mobile phones and rapid COVID-19 surveys
National household surveys in most LDCs are generally carried out face-to-face. COVID-19 has had a major impact on household and individual surveys, due to the need to socially distance and self-quarantine. Many development partners want to know about the impact of COVID-19 and the kinds of emergency interventions that might be needed. Most developed countries use telephone surveys, due to the prevalence of mobile phones. This has now spread to developing nations, given that many have reached a high level of cellphone ownership. Rapid surveys using calls to respondents with mobile telephones have emerged to meet this need. Rapid surveys have been carried out in LDCs such as Afghanistan1 and Myanmar (World Bank, 2020). A roster of mobile telephone numbers in the country is used, with random calls made to a subset of the numbers. One drawback is that, while mobile telephone ownership may be high, it is not universal, and therefore some people will be left out. These are likely the most vulnerable, lacking the income to own and pay for mobile services, or out of 2G coverage range. However, the rapid surveys do not adjust for this or indicate what proportion of the population they believe they are covering.
1 Available at https:// asiafoundation .org/ where -we -work/ afghanistan/ survey/ .
Basic mobile networks have enhanced economic and social welfare in LDCs in many areas, particularly banking, agriculture and health. Mobile money reduces transaction costs, increases privacy and reduces the risk of theft, among other benefits (Hamdan, 2019). Financial inclusion has expanded among many LDCs, due to mobile money. According to the World Bank’s Financial Inclusion (Findex) survey, the LDC country average of those 15 years of age and older with a mobile money account almost tripled between 2011 and 2017 (the last available

Connectivity in the Least Developed Countries: Status report 2021
9
survey), from 7 per cent to 19 per cent. Mobile money transactions have expanded rapidly due to COVID-19. For instance, in Rwanda, mobile money transactions increased by 85 per cent in 2020, due to measures taken to encourage digital payments and slow down progression of the COVID-19 pandemic (MTN Rwanda, 2021). Mobile money services have additionally opened up innovative ways to transfer cash and pay for products. Development agencies can make conditional cash transfers to mobile money accounts, saving costs and increasing security (Aker and others, 2016). Mobile money is also facilitating the deployment of off-grid solar energy, by allowing users to make micropayments for repaying the solar panel (McKibben, 2017).
In agriculture, mobile phones have had an impact in LDCs by reducing information asymmetries. For instance, in Niger, grain traders use them to check price information, improving consumer and trader welfare (Aker, 2010). An SMS alert system in Bangladesh has reduced diseases among poultry farmers (FAO, 2017).
Health is another area where mobile services have had a significant development impact, notably during the COVID-19 pandemic, where many telecom operators have waived fees for access to health information, and health officials have used mobile networks to spread safety messages (WHO, 2020). Mobile networks are also being used to remind people to take medication, such as in Senegal, where people with diabetes are sent text messages (Wargny and others, 2018). Mobile call records can be aggregated to estimate the spread of diseases and identify population movement after natural disasters such as earthquakes. This helps with relief efforts and distribution of cash to affected populations. Call records have been used in Haiti and the Republic of Nepal to follow population movement during earthquakes, and in Sierra Leone during the Ebola outbreak (Maxmen, 2019).
What the most successful mobile services and applications have in common is that they are basic, often using voice or SMS services, affordable, easy to use, require little bandwidth, and work with feature phones and over the 2G network. Although the Internet can be accessed over 2G networks, it is at narrowband speeds (less than 256 kbps). It also requires an Internet-enabled phone. However – given the relatively high coverage of 2G networks and fairly widespread diffusion of basic mobile phones, combined with useful services, ranging from mobile money to health – many people in LDCs may not feel a critical need to move to broadband services.
3.2 Broadband
The previous section found that basic mobile technology has brought LDCs notable benefits for tackling development challenges, such as financial inclusion, poverty reduction and improved health. Broadband – defined as high-speed, always-on Internet connectivity – could have a much larger impact for LDCs. While this section focuses on wireless broadband, given that it is easier and often cheaper to deploy in LDCs, Box 3.2 explains why this technology is not a perfect substitute for fixed broadband.
First, broadband can provide LDCs opportunities to overcome development challenges that cannot be adequately addressed with basic mobile technologies. A lack of teachers can be addressed through videoconferencing and online educational content. Similarly in health, broadband can help overcome shortages of physicians through remote consultations. With agriculture accounting for 20 per cent of gross domestic product in LDCs in 2020,7 the use of digital technologies in the sector is particularly relevant (UN-OHRLLS, 2021). Frontier
7 See https:// data .worldbank .org/ indicator/ NV .AGR .TOTL .ZS.

Connectivity in the Least Developed Countries: Status report 2021
10
technologies such as drones, sensors and blockchain are increasingly being deployed in agriculture to raise productivity (World Bank, 2019; Schroeder and others, 2021). Broadband also unleashes the power of smartphones, providing users with a friendly interface and greater functionality for payment and online public service apps.
Second, the COVID-19 pandemic has validated the broadband approach, by demonstrating that those with high-speed access can continue to work, learn and shop remotely. In the area of health, COVID-19 has accelerated the use of remote consultations (Richardson and others, 2020) and smartphones for contact tracing, digital testing and vaccination certificates. It is likely that a more elevated level of online access to key services is here to stay.
Third, broadband has a greater economic impact than basic mobile technology. Econometric analysis finds that the economic contribution of broadband is highest among different digital technologies (Qiang and others, 2009). One study found that a 10-percentage point increase in 3G penetration increases gross domestic product per capita growth by 0.15 percentage points (Deloitte, 2012). Despite the benefits of broadband, its use is lagging in LDCs (Box 3.3).
Box 3�2: Fixed broadband in the LDCs
It is estimated that the LDCs had 351 million mobile broadband subscriptions in 2020, or 26 times more than fixed broadband. Mobile broadband per 100 people was 33 in the LDCs in 2020, compared with just 1 for fixed, a figure that has not budged for the last five years (Figure 3.2). Although fixed broadband connections are often shared by several people, these are nonetheless large gaps.
Figure 3�2: Broadband penetration
Broadband subscriptions per 100 people, 2020
0
50
150
100
World Developed Developing
75
125
34
6512
33
LDCs
15
1
Active mobile Fixed
Fixed broadband subscriptions per 100 people
DevelopedDevelopingWorld LDCs
2016 2017 2018 2019 2020
1214 14 15 15
1 1 1 1 1
3032 32 33 34
10 10 11 12
9
0
40
20
Note: Figures for 2020 are estimates.Source: ITU 2020b.
Connectivity in the Least Developed Countries: Status report 2021
11
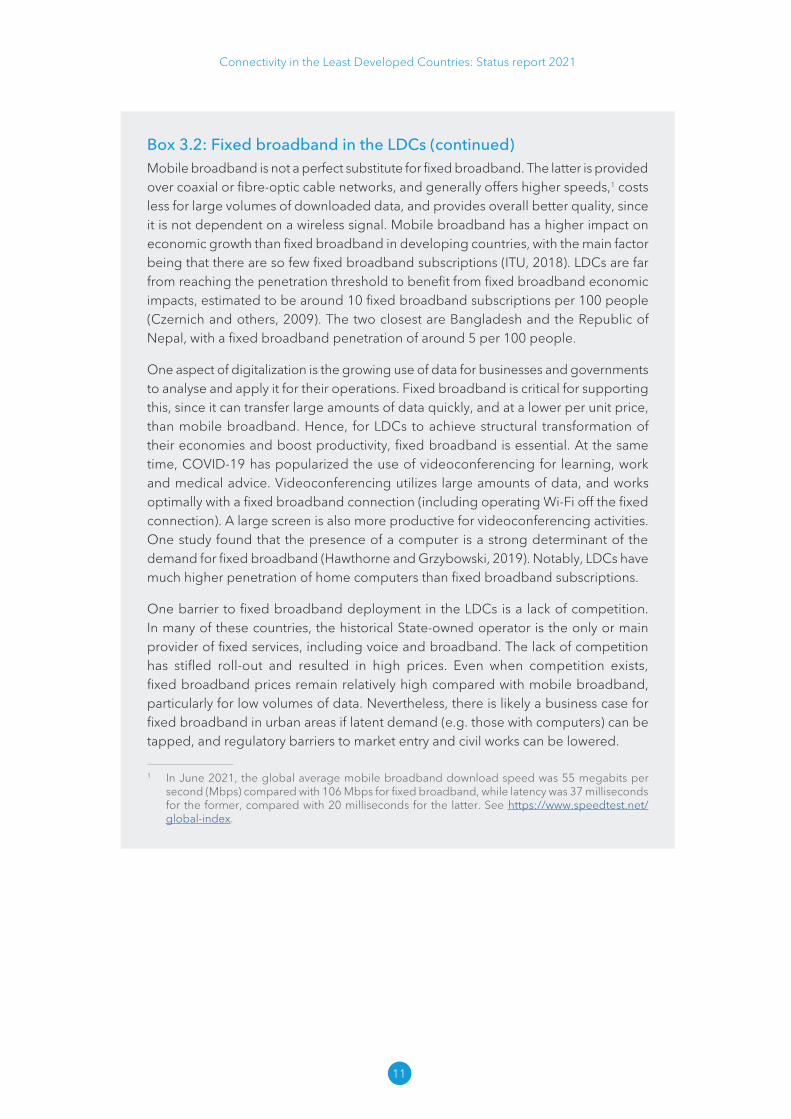
Box 3�2: Fixed broadband in the LDCs (continued)Mobile broadband is not a perfect substitute for fixed broadband. The latter is provided over coaxial or fibre-optic cable networks, and generally offers higher speeds,1 costs less for large volumes of downloaded data, and provides overall better quality, since it is not dependent on a wireless signal. Mobile broadband has a higher impact on economic growth than fixed broadband in developing countries, with the main factor being that there are so few fixed broadband subscriptions (ITU, 2018). LDCs are far from reaching the penetration threshold to benefit from fixed broadband economic impacts, estimated to be around 10 fixed broadband subscriptions per 100 people (Czernich and others, 2009). The two closest are Bangladesh and the Republic of Nepal, with a fixed broadband penetration of around 5 per 100 people.
One aspect of digitalization is the growing use of data for businesses and governments to analyse and apply it for their operations. Fixed broadband is critical for supporting this, since it can transfer large amounts of data quickly, and at a lower per unit price, than mobile broadband. Hence, for LDCs to achieve structural transformation of their economies and boost productivity, fixed broadband is essential. At the same time, COVID-19 has popularized the use of videoconferencing for learning, work and medical advice. Videoconferencing utilizes large amounts of data, and works optimally with a fixed broadband connection (including operating Wi-Fi off the fixed connection). A large screen is also more productive for videoconferencing activities. One study found that the presence of a computer is a strong determinant of the demand for fixed broadband (Hawthorne and Grzybowski, 2019). Notably, LDCs have much higher penetration of home computers than fixed broadband subscriptions.
One barrier to fixed broadband deployment in the LDCs is a lack of competition. In many of these countries, the historical State-owned operator is the only or main provider of fixed services, including voice and broadband. The lack of competition has stifled roll-out and resulted in high prices. Even when competition exists, fixed broadband prices remain relatively high compared with mobile broadband, particularly for low volumes of data. Nevertheless, there is likely a business case for fixed broadband in urban areas if latent demand (e.g. those with computers) can be tapped, and regulatory barriers to market entry and civil works can be lowered.
1 In June 2021, the global average mobile broadband download speed was 55 megabits per second (Mbps) compared with 106 Mbps for fixed broadband, while latency was 37 milliseconds for the former, compared with 20 milliseconds for the latter. See https:// www .speedtest .net/ global -index.
Connectivity in the Least Developed Countries: Status report 2021
12
Box 3�3: Broadband roll-out in LDCs: Lessons from a study of four countries
UN-OHRLLS produced a report on broadband use in four LDCs from different regions (Africa, Asia and the Pacific) and geographies (sea-facing, landlocked and SIDS): Cambodia, Rwanda, Senegal and Vanuatu (UN-OHRLLS, 2018). The report found that the four LDCs have made considerable progress in expanding broadband infrastructure and making it affordable. Broadband investment has been predominantly private sector-driven, operating in competitive market environments.
Important nuances among the four are apparent in approaches to broadband deployment. For example, Cambodia has one of the most competitive broadband markets in the world, with attractive features for investors, such as 100 per cent foreign ownership and limited regulatory fees. This has resulted in some of the cheapest mobile broadband prices in the world. Broadband is a top priority in Rwanda, and the Government has partnered with the private sector to build the world’s first and only single wholesale 4G wireless broadband network that covers 95 per cent of the population. Vanuatu aims to achieve a high level of broadband coverage supported by its universal access policy. In Senegal, the incumbent telecommunication operator has made significant investments in backbone and local access network infrastructure to expand broadband coverage.
Yet demand for and productive use of broadband in these countries have not matched growing infrastructure supply. Causes include weak digital literacy, unaffordability of smartphones, lack of relevant local content and applications, and limited capacity among policy-makers to leverage broadband across different sectors of the economy. Productive use of broadband also relates to the development of local businesses, which is hindered by shortcomings in supporting local entrepreneurship, access to capital, and facilitating laws and business services.
Broadband is a general purpose technology, whose adoption and impact take time to grasp and diffuse. Broadband is relatively recent in these study countries, and has not quite reached a tipping point. There is some evidence of leveraging broadband in different sectors. All four study countries have progressed in connecting government institutions and digitizing back office administrative processes. However, with the exception of Rwanda, online public services aimed at businesses and citizens are not well developed. There are also examples of innovative broadband interventions in health, such as the online exchange of medical images and use of drones for dispatching blood and vaccines to remote areas. In education, multimedia teaching material has been developed, and online learning is available at tertiary institutions. Closed-circuit television and drones are being utilized in Vanuatu for disaster monitoring. Most of these interventions are pilots, driven by development partners and yet to reach wide scale.
Connectivity in the Least Developed Countries: Status report 2021
13
Box 3�3: Broadband roll-out in LDCs: Lessons from a study of four countries (continued)There are lessons from the four case studies informing steps needed to accelerate broadband impacts:
• Digital awareness and training need to be magnified among governments, citizens and businesses: Governments need a better understanding of the cross-cutting nature and benefits of broadband. Too often, high-speed Internet is seen as an infrastructure issue. Consequently, there is a narrow focus on broadband as infrastructure, rather than the services it enables. A holistic vision is required that identifies how broadband can be applied across different sectors in an integrated manner. This should include a prioritization of broadband services that are likely to achieve sustainability. Quick-win public e-services such as online tax payment, business registration and vital records should be rapidly deployed to build momentum, acceptance and awareness of broadband applications.
• Governments need to create enabling legislation that builds trust in the digital economy: This includes laws governing electronic transactions, consumer protection, data privacy and information security. This will promote greater confidence among consumers and businesses in using and developing online services.
• There needs to be better coordination among the government, private sector, educational institutions and development partners to enhance broadband use: Dialogue among these institutions is essential for understanding skills requirements, in order to plan necessary training. Governments should also make greater use of the private sector to help develop public broadband applications, including the leveraging of emerging start-up communities. Micro, small and medium-sized enterprises should be provided with the necessary assistance to adopt broadband technology for their businesses. This would help accelerate the economic impacts of broadband. Interventions for development of broadband applications and services should be coordinated between governments and development partners to maximize widespread impact and sustainability.
• Better systems are needed to monitor and evaluate broadband impacts: The ability of national statistical systems in the four countries to collect, compile and disseminate statistics about the evolution of the digital economy is weak. There is scarce economic and employment data about the key industries that comprise the digital sector, and there are no ongoing surveys about broadband Internet use by the public and business. This makes it difficult to construct meaningful strategies or adapt them to changing market conditions. Improving this situation will require resources for carrying out business and household surveys, and training officials to interpret the data and make the necessary policy adjustments.

Connectivity in the Least Developed Countries: Status report 2021
14
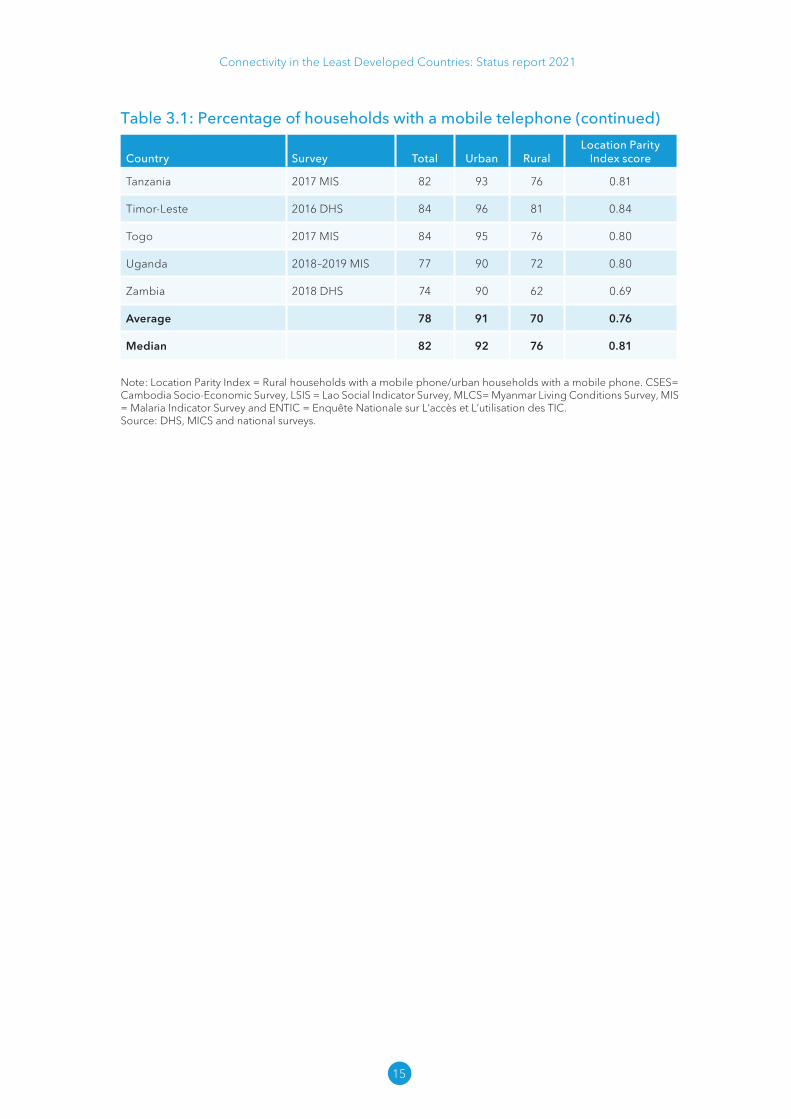
Table 3�1: Percentage of households with a mobile telephone
Country Survey Total Urban RuralLocation Parity
Index score
Afghanistan 2015 DHS 87 94 85 0.91
Angola 2015–2016 DHS 63 83 31 0.38
Bangladesh 2017–2018 DHS 94 97 94 0.97
Benin 2017–2018 DHS 84 89 80 0.90
Bhutan 2017 Census 97
Burkina Faso 2017–2018 MIS 94 99 92 0.93
Burundi 2016–2017 DHS 47 83 43 0.51
Cambodia 2019–2020 CSES 93 95 91 0.96
Central African Rep. 2019 MICS 36 74 18 0.24
Chad 2019 MICS 71 89 67 0.75
Dem. Rep. of the Congo 2018 MICS 52 84 30 0.35
Ethiopia 2019 DHS 68 87 59 0.68
Gambia 2018 MICS 98 99 97 0.97
Guinea 2018 DHS 89 97 85 0.87
Guinea-Bissau 2018–2019 MICS 94 98 92 0.94
Haiti 2016–2017 DHS 76 90 67 0.74
Kiribati 2021 MICS 73 85 62 0.73
Lao P.D.R. 2017 LSIS 92 98 89 0.91
Lesotho 2018 MICS 92 97 88 0.90
Liberia 2019–2020 DHS 70 84 50 0.59
Madagascar 2016 MIS 34 73 29 0.40
Malawi 2017 DHS 51 84 44 0.52
Mali 2018 DHS 89 96 87 0.90
Mozambique 2018 MIS 63 84 53 0.63
Myanmar 2017 MLCS 82 93 77 0.82
Nepal (Republic of) 2020 MICS 96 97 94 0.97
Niger 2018 ENTIC 79
Rwanda 2017 MIS 63 88 56 0.64
Sao Tome and Principe 2019 MICS 87 89 83 0.93
Senegal 2019 DHS 97 99 95 0.96
Sierra Leone 2019 DHS 73 93 58 0.62
Connectivity in the Least Developed Countries: Status report 2021
15
Country Survey Total Urban RuralLocation Parity
Index score
Tanzania 2017 MIS 82 93 76 0.81
Timor-Leste 2016 DHS 84 96 81 0.84
Togo 2017 MIS 84 95 76 0.80
Uganda 2018–2019 MIS 77 90 72 0.80
Zambia 2018 DHS 74 90 62 0.69
Average 78 91 70 0.76
Median 82 92 76 0.81
Note: Location Parity Index = Rural households with a mobile phone/urban households with a mobile phone. CSES= Cambodia Socio-Economic Survey, LSIS = Lao Social Indicator Survey, MLCS= Myanmar Living Conditions Survey, MIS = Malaria Indicator Survey and ENTIC = Enquête Nationale sur L’accès et L’utilisation des TIC.Source: DHS, MICS and national surveys.
Table 3�1: Percentage of households with a mobile telephone (continued)

Connectivity in the Least Developed Countries: Status report 2021
16
Table 3�2: Proportion of individuals who own a mobile phone (SDG 5�b)
Country Survey Year Total Female MaleGender
Parity Index
Burundi DHS 2017 36 24 48 0.50
Cambodia ITU 2020 93 94 93 1.00
Central African Rep. MICS 2019 29 21 37 0.56
Chad MICS 2019 51 32 71 0.45
Dem. Rep. of the Congo MICS 2018 43 33 53 0.63
Djibouti EDAM 2017 56 52 61 0.84
Gambia MICS 2018 80 74 85 0.87
Guinea MICS 2018 77 69 86 0.80
Guinea-Bissau MICS 2019 74 61 87 0.70
Kiribati MICS 2019 53 53 53 0.99
Lao P.D.R. MICS 2017 79 73 84 0.87
Lesotho MICS 2018 85 87 84 1.04
Madagascar MICS 2018 37 32 42 0.76
Mozambique ITU 2017 31 26 37 0.72
Myanmar MLCS 2017 72 69 73 0.95
Nepal (Republic of) MICS 2019 85 79 91 0.87
Niger INS 2017 65 55 77 0.72
Sao Tome and Principe MICS 2019 63 67 60 1.13
Sierra Leone MICS 2017 55 45 65 0.70
Tanzania ITU 2016 61 52 69 0.75
Togo MICS 2017 67 57 78 0.72
Zambia ZICTA 2018 45 41 49 0.84
Average 61 54 67 0.79
Note: Gender Parity Index = Females with a mobile phone/males with a mobile phone. EDAM= Enquête Djiboutienne Auprès des Ménages, MLCS= Myanmar Living Conditions Survey, INS = Institut National de la Statistique, ZICTA = Zambia Information and Communications Technology Authority.

Connectivity in the Least Developed Countries: Status report 2021
17
4 Assessing progress towards universal and affordable connectivity in Least Developed Countries
This chapter reviews progress in the LDCs since the last report towards achievement of SDG Target 9.c regarding universality and affordability of broadband. The chapter also looks at other factors related to achievement of the target, such as lack of awareness and skills to use the Internet, which are often cited as leading causes of low Internet use. It also highlights the status of “middle-mile” infrastructure, which affects the affordability and quality of Internet access. To complement the analysis, the Annex provides detailed statistics for all LDCs on relevant connectivity indicators.
4.1 Sustainable Development Goal Target 9.c
SDG 9 includes Target 9.c, which aims to “significantly increase access to information and communications technology and strive to provide universal and affordable access to the Internet in Least Developed Countries by 2020”. Target 9.c is notable for being the only connectivity target that directly refers to LDCs. It states that the access should be universal and affordable. This implies that all citizens should have access to the infrastructure for using the Internet, and the cost should be within their economic means. Third, it explicitly identifies the Internet as the ICT of interest, and calls for achievement by 2020.
The official tracking indicator selected to track SDG Target 9.c is the “proportion of the population covered by a mobile network, by technology”. The indicator, which refers to “the percentage of inhabitants living within range of a mobile-cellular signal, irrespective of whether or not they are mobile phone subscribers or users” (ITU, 2020a), reflects the infrastructure availability aspect of the target, since it measures the possibility to subscribe and use mobile cellular services. By including the breakdown “by technology”, the indicator is flexible in terms of technological development. It can apply to basic narrowband mobile networks (2G) as well as mobile broadband networks (3G and 4G) and emerging 5G networks. The 3G mobile broadband is selected as the technology of analysis for this report, with a target of 93 per cent population coverage (the world average in 2020).
The affordability indicator selected is the monthly price of mobile broadband as a percentage of GNI per capita. One challenge is that prepaid is the predominant payment method in LDCs. The price of mobile broadband is dependent on the volume of data included. ITU had been using 500 MB for the common benchmark up to 2018, when it was changed to 1.5 GB. Research on the volume of data needed for basic welfare-enhancing activities calculated an amount of 660 MB per month (Chen and Minges, 2021). If common recreational online activities – particularly social media use – is included, it is estimated that an additional 5.2 GB per month is needed, for a total of approximately 6 GB per month. It is relevant to contrast these amounts with current monthly data usage in LDCs, where median usage was 2.1 GB per month in 2020 for the countries where this statistic is available (Figure 4.1). The service affordability indicator uses the Broadband Commission for Sustainable Development target that the price should be less than 2 per cent of GNI per capita by 2025 (previously this had been set at 5 per cent).8
8 See Broadband Commission for Sustainable Development’s 2025 Targets: “Connecting the Other Half”, available at https:// broadbandcommission .org/ Documents/ publications/ wef2018 .pdf.

Connectivity in the Least Developed Countries: Status report 2021
18
Figure 4�1: Data usage in selected LDCsAverage monthly usage, GB per user, 2020
0.2 1.1 1.2 1.4
Yem
en
Sout
hSu
dan
Uga
nda
Gui
nea
Gui
nea-
Biss
au
Libe
ria
Nep
al(R
epub
lic o
f)
Zam
bia
Rwan
da
Beni
n
Bang
lade
sh
Afgh
anis
tan
Suda
n
Cam
bodi
a
1.5
18
MB /Active user ITU basket
4.62.92.92.22.121.81.7
3
0
10
20
Note: Operator-based.Sources: Axiata and MTN reports.
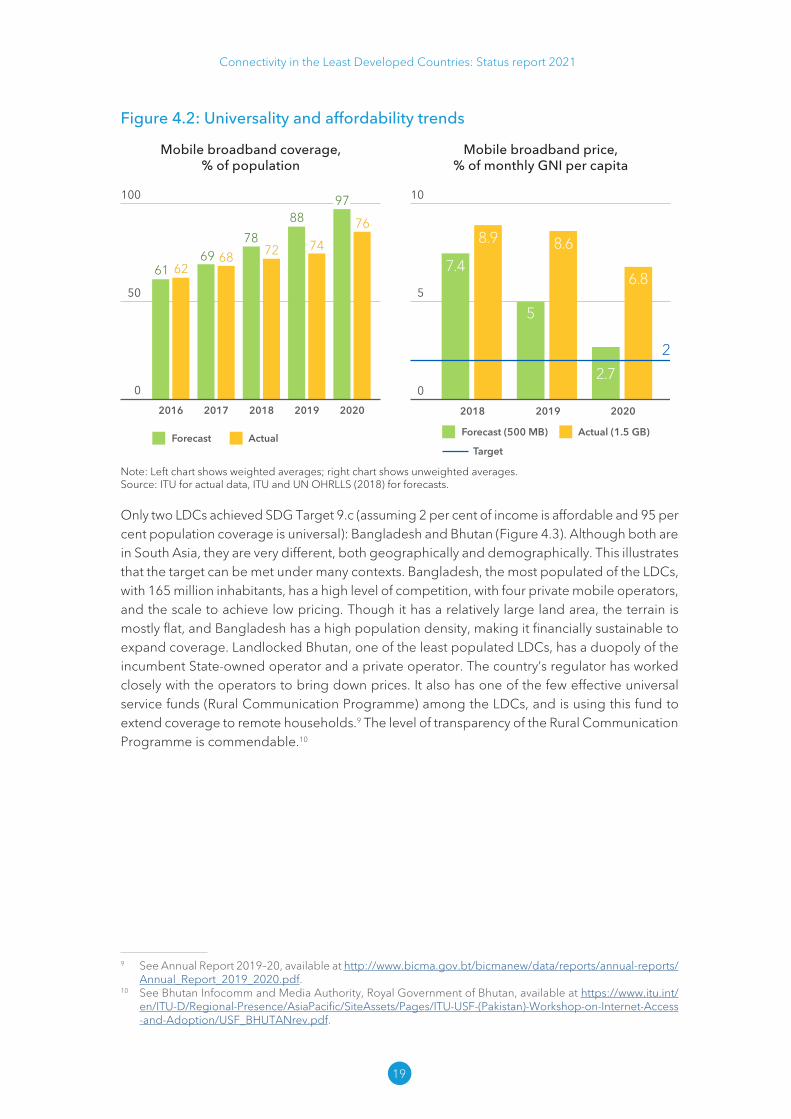
The 2018 edition of this report forecast that mobile broadband coverage in the LDCs would reach 97 per cent of the population by 2020 (ITU and UNOHRLLS 2018). However, this was not achieved, with an estimated level of 76 per cent coverage of the population at end 2020 (Figure 4.2, left). The slowdown in rolling out mobile broadband networks is due to a number of factors: constrained competition, perceived limited demand, spectrum constraints and lack of infrastructure sharing. Nevertheless, there was a notable increase in broadband coverage of five percentage points in 2020, possibly due to the impact of COVID-19. The pandemic may have facilitated civil works construction, due to quarantine measures, and demand may have increased for online services. Another trend has been the accelerated roll-out of 4G networks, resulting in some LDCs having higher 4G than 3G penetration.
It is more difficult to assess the affordability indicator since, as mentioned, the measure was changed from 500 MB to 1.5 GB monthly usage. Mobile broadband service charges were an average 6.8 per cent of GNI per capita in 2020, above both the previous target of 5 per cent as well as the revised 2 per cent (Figure 4.2, right).
Connectivity in the Least Developed Countries: Status report 2021
19
Figure 4�2: Universality and affordability trends
Mobile broadband coverage, % of population
0
50
100
6169
7888
6268 72 74
76
97
2016 2017 2018 2019 2020
Forecast Actual
Mobile broadband price, % of monthly GNI per capita
0
10
5
Forecast (500 MB) Actual (1.5 GB)
Target
2018 2019 2020
8.9 8.67.4
5
2.7
6.8
2
Note: Left chart shows weighted averages; right chart shows unweighted averages.Source: ITU for actual data, ITU and UN OHRLLS (2018) for forecasts.
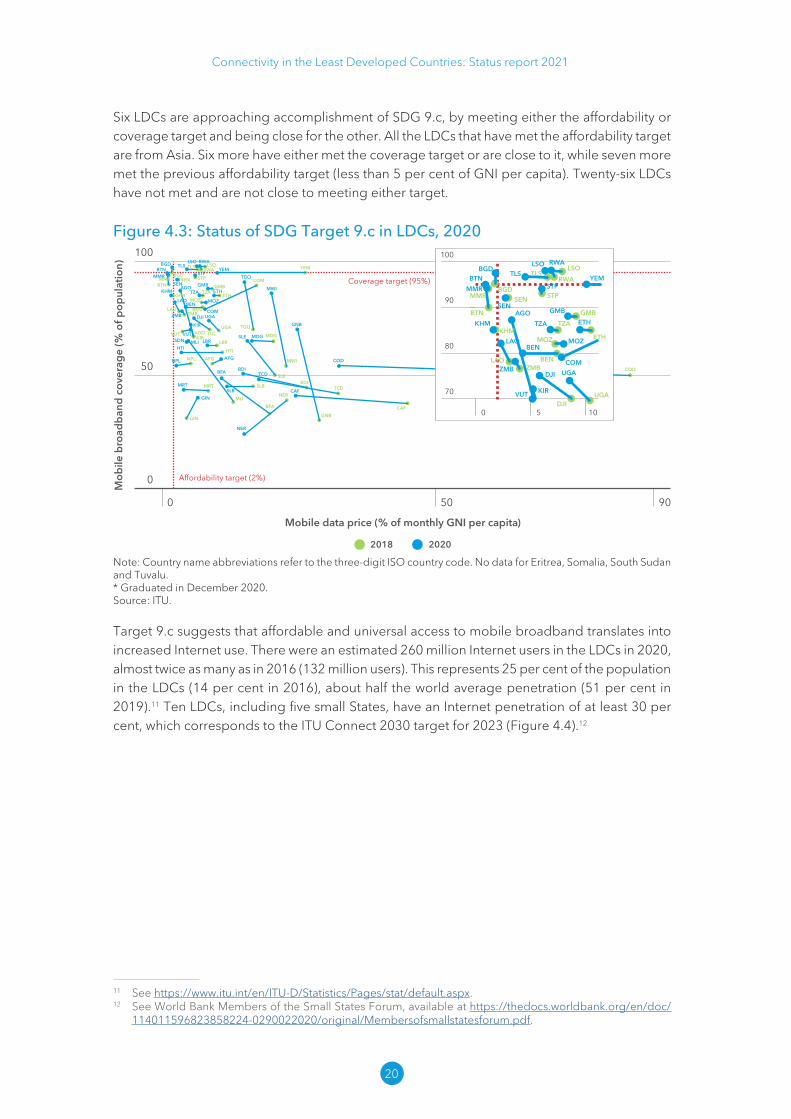
Only two LDCs achieved SDG Target 9.c (assuming 2 per cent of income is affordable and 95 per cent population coverage is universal): Bangladesh and Bhutan (Figure 4.3). Although both are in South Asia, they are very different, both geographically and demographically. This illustrates that the target can be met under many contexts. Bangladesh, the most populated of the LDCs, with 165 million inhabitants, has a high level of competition, with four private mobile operators, and the scale to achieve low pricing. Though it has a relatively large land area, the terrain is mostly flat, and Bangladesh has a high population density, making it financially sustainable to expand coverage. Landlocked Bhutan, one of the least populated LDCs, has a duopoly of the incumbent State-owned operator and a private operator. The country’s regulator has worked closely with the operators to bring down prices. It also has one of the few effective universal service funds (Rural Communication Programme) among the LDCs, and is using this fund to extend coverage to remote households.9 The level of transparency of the Rural Communication Programme is commendable.10
9 See Annual Report 2019–20, available at http:// www .bicma .gov .bt/ bicmanew/ data/ reports/ annual -reports/ Annual _Report _2019 _2020 .pdf.
10 See Bhutan Infocomm and Media Authority, Royal Government of Bhutan, available at https:// www .itu .int/ en/ ITU -D/ Regional -Presence/ AsiaPacific/ SiteAssets/ Pages/ ITU -USF -(Pakistan) -Workshop -on -Internet -Access -and -Adoption/ USF _BHUTANrev .pdf.
Connectivity in the Least Developed Countries: Status report 2021
20
Six LDCs are approaching accomplishment of SDG 9.c, by meeting either the affordability or coverage target and being close for the other. All the LDCs that have met the affordability target are from Asia. Six more have either met the coverage target or are close to it, while seven more met the previous affordability target (less than 5 per cent of GNI per capita). Twenty-six LDCs have not met and are not close to meeting either target.
Figure 4�3: Status of SDG Target 9�c in LDCs, 2020
Mob
ile b
road
band
cov
erag
e (%
of p
opul
atio
n)
Mobile data price (% of monthly GNI per capita)
2018 2020
Coverage target (95%)
Affordability target (2%)
50
100
0
0 50 90
DJIUGA
VUTLBR
NPL
NER
LAO
HTI
MDG
MWI
SLE
SLB
MLI
MRT
GIN GNB
ETH
TGO
TZAGMB
YEMLSO
STP
BENZMB
BGDRWA
SEN
TLS
MOZ
BTN
AFG
BFA
BDI
CAF
TCD
COD
AGO
COM
KIR
AGO
AFG
BEN
BFA BDI
KHM
CAF
TCD
COM
GIN
HTI
KIR
LSO
MWI
MLI
MRT
MMR
NPL
NER
RWA
SEN
SLESDN
TGO
UGA
VUT
ZMB
COD
BTNBGD
DJI
LAO
SLB
TLS
ETH
GNB
TZA
MOZ
GMB
LBRMDG
STPYEM
MMR
KHM
70
80
90
100
0 5 10
AGO
BEN
KHM
COM
KIR
MMR
RWA
SEN
UGA
VUT
ZMB
BTNBGD
DJI
LAO
TLS
ETHTZA
MOZ
GMB
STPYEM
LSO
DJIUGA
LAO
ETH
TZAGMB
LSO
STP
BENZMB
BGDRWA
SEN
TLS
MOZ
BTN
MMR
KHM
Note: Country name abbreviations refer to the three-digit ISO country code. No data for Eritrea, Somalia, South Sudan and Tuvalu. * Graduated in December 2020.Source: ITU.
Target 9.c suggests that affordable and universal access to mobile broadband translates into increased Internet use. There were an estimated 260 million Internet users in the LDCs in 2020, almost twice as many as in 2016 (132 million users). This represents 25 per cent of the population in the LDCs (14 per cent in 2016), about half the world average penetration (51 per cent in 2019).11 Ten LDCs, including five small States, have an Internet penetration of at least 30 per cent, which corresponds to the ITU Connect 2030 target for 2023 (Figure 4.4).12
11 See https:// www .itu .int/ en/ ITU -D/ Statistics/ Pages/ stat/ default .aspx.12 See World Bank Members of the Small States Forum, available at https:// thedocs .worldbank .org/ en/ doc/
114011596823858224 -0290022020/ original/ Membe rsofsmalls tatesforum .pdf.

Connectivity in the Least Developed Countries: Status report 2021
21
Figure 4�4: LDCs achieving ITU Connect 2030 target for Internet use% of population using the Internet, 2020
0
Cam
bodi
a
Djib
outi
Leso
tho
Sene
gal
Kirib
ati
Nep
al(R
epub
lic o
f)
Gam
bia
Ango
la
Mya
nmar
Haï
ti
79
38 38 37 36 35 35
Lao
P.D
.R.
34
59
43 43 30
ITU Connect 2030 target
Source: Preliminary ITU estimates. Analysis carried out for the report based on national and international surveys and estimated growth from the last survey.
Box 4�1: Measuring Internet use in LDCs
Measurement of Internet use in the LDCs is challenging. For years, there was scarce survey-based information for most LDCs. Now there are an increasing number of surveys carried out by national governments (often in partnership with the United Nations Children’s Fund (UNICEF) and DHS) as well as others, such as the World Bank, After Access, Pew and Afrobarometer. A growing problem is that surveys for the same country often differ, sometimes substantially, even though the surveys are based on nationally representative samples. While this is sometimes related to the age scope in the survey, it is more likely caused by widespread social media use in the LDCs. Some survey respondents reply that they do not use the Internet, even when they use social media (Silver and Smith, 2019). It is also important to bear in mind that, while surveys asking about Internet use are collected for several LDCs, there are still some with no recent surveys. Unsurveyed LDCs tend to be either relatively low-populated countries (for example, the World Bank largely did not survey countries with populations of less than 1 million in its Findex survey) or conflict-afflicted LDCs, where the security situation makes it difficult to carry out surveys.
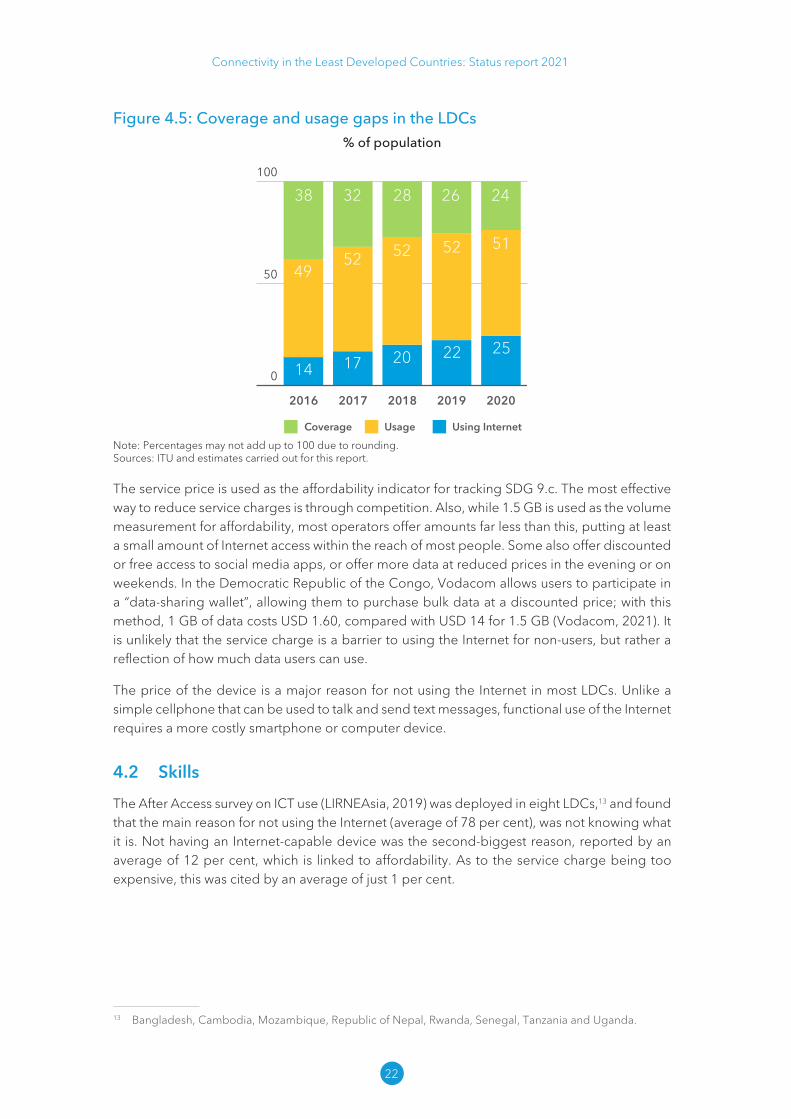
Internet use can be combined with coverage to highlight gaps (Figure 4.5). There are two types of gaps. One is the coverage gap, where the population does not have access to mobile broadband (not covered by a mobile broadband signal). The second is the usage gap, where people are covered but not using the Internet. This usage gap is a far bigger challenge than the coverage gap in LDCs where over half the population is covered by a mobile broadband signal but not using the Internet.
Connectivity in the Least Developed Countries: Status report 2021
22
Figure 4�5: Coverage and usage gaps in the LDCs% of population
0
50
100
Coverage Usage Using Internet
24
4952 52 52 51
38 32 2628
14 17 20 22 25
2016 2017 2018 2019 2020
Note: Percentages may not add up to 100 due to rounding.Sources: ITU and estimates carried out for this report.
The service price is used as the affordability indicator for tracking SDG 9.c. The most effective way to reduce service charges is through competition. Also, while 1.5 GB is used as the volume measurement for affordability, most operators offer amounts far less than this, putting at least a small amount of Internet access within the reach of most people. Some also offer discounted or free access to social media apps, or offer more data at reduced prices in the evening or on weekends. In the Democratic Republic of the Congo, Vodacom allows users to participate in a “data-sharing wallet”, allowing them to purchase bulk data at a discounted price; with this method, 1 GB of data costs USD 1.60, compared with USD 14 for 1.5 GB (Vodacom, 2021). It is unlikely that the service charge is a barrier to using the Internet for non-users, but rather a reflection of how much data users can use.
The price of the device is a major reason for not using the Internet in most LDCs. Unlike a simple cellphone that can be used to talk and send text messages, functional use of the Internet requires a more costly smartphone or computer device.
4.2 Skills
The After Access survey on ICT use (LIRNEAsia, 2019) was deployed in eight LDCs,13 and found that the main reason for not using the Internet (average of 78 per cent), was not knowing what it is. Not having an Internet-capable device was the second-biggest reason, reported by an average of 12 per cent, which is linked to affordability. As to the service charge being too expensive, this was cited by an average of just 1 per cent.
13 Bangladesh, Cambodia, Mozambique, Republic of Nepal, Rwanda, Senegal, Tanzania and Uganda.

Connectivity in the Least Developed Countries: Status report 2021
23
Table 4�1: Main reason for not using the Internet, % of respondents, 2017-2018I don't
know what the Internet
is
No access to device
No inter-est/not useful
I don't know how
to use it
No time, too busy
Too expen-
siveOther
Bangladesh 79 5 13 2 1
Cambodia 97 1 1 1
Mozambique 65 26 1 5 1 2
Nepal (Republic of) 79 7 8 3 1 1 1
Rwanda 86 7 1 1 5
Senegal 71 12 4 7 3 1 2
Tanzania 62 25 6 4 1 1 1
Uganda 81 10 2 5 1 1
Average 78 12 5 4 1 2 1
Median 79 10 4 4 1 1 1
Note: Reasons are sorted according to average percentage.Source: LIRNEAsia (2019).
Smartphone prices remain high in the LDCs, hampering Internet take-up. According to a survey of smartphone prices in 70 countries, in Africa they were least affordable, at 63 per cent of average monthly income, compared with 12 per cent in the Americas and 16 per cent in Asia and the Pacific (excluding India) (A4AI, 2020). Among the LDCs included in the survey, the average smartphone price was USD 52, or 95 per cent of average monthly income (Table 4.2). There are wide differences among the LDCs, with a smartphone costing 16 per cent of average monthly income in Lesotho, compared with over 600 per cent in Sierra Leone. Income differences among the LDCs also affect relative affordability. While a smartphone costs roughly the same in Lesotho (USD 18) as in Mozambique (USD 19), as a proportion of average monthly income, the phone is more than three times as expensive in Mozambique.
Apart from the 539 million people who are covered but not using the Internet, many who are using it have only rudimentary digital skills, and are prone to misinformation, online harms and other negative impacts. LDCs face an immense challenge of how to scale digital literacy training to reach the millions of their populations that are using the Internet with low skills, as well as those who do not use the Internet because they do not know how.
Many people in the LDCs start out on the Internet using social media with no formal training, and instead learn the minimum from family or friends. This is also due to the prevalence of unmetered data plans for social media offered by many telecom operators in the LDCs. Social media usage grows rapidly as soon as applications are available in local languages, and are relevant to people – to the point that social media is often equated to the Internet. Equally, video streaming in local languages is successful even among the poorest and less-educated populations, because it is local content they can understand. Individuals are also drawn to using the Internet when family members or friends are using it, particularly social media. Social media

Connectivity in the Least Developed Countries: Status report 2021
24
is the most popular use of the Internet, and when a person knows others who are using it, it is a strong incentive to use it themselves.
As a result, many users in LDCs stay within a walled social media bubble, and use is often not very productive. Misinformation is a challenge, with users not able to discern between real and fake news. The United Nations Human Rights Council found that, in Myanmar, where for many users Facebook is the Internet, the platform was used to spread hate speech during the Rohingya conflict, with serious consequences.14 Studies show how violent conflicts are shaped or affected by online platforms and social media (Asia Foundation, 2020). Further, the lack of understanding regarding security leaves users vulnerable to their personal information being used against their knowledge. National legislation that specifically protects users’ data privacy, requires companies to report breaches and imposes fines for violations is lacking in most LDCs. In cases where such legislation exists, it is often poorly enforced, exacerbating the problem.
The level of skills allowing users to make productive use of the Internet (for example, learning skills that can generate income, improve health and expand knowledge) and protect themselves online is low in the LDCs. Recent UNICEF surveys have started to include digital skills based on
14 “The role of social media is significant. Facebook has been a useful instrument for those seeking to spread hate, in a context where, for most users, Facebook is the Internet. Although improved in recent months, the response of Facebook has been slow and ineffective. The extent to which Facebook posts and messages have led to real-world discrimination and violence must be independently and thoroughly examined. The mission regrets that Facebook is unable to provide country-specific data about the spread of hate speech on its platform, which is imperative to assess the adequacy of its response” (United Nations Human Rights Council, 2018).
Table 4�2: Smartphone prices in LDCs, 2020Country Price Affordability* Country Price Affordability*
Bangladesh USD 34 23% Madagascar USD 32 87%
Benin USD 59 81% Mali USD 25 37%
Burkina Faso USD 53 97% Mozambique USD 19 51%
Burundi USD 52 222% Niger USD 60 189%
Cambodia USD 60 52% Sierra Leone USD 265 636%
Central African Rep. USD 49 122%Solomon Islands
USD 35 21%
Comoros USD 67 61% Tanzania USD 29 34%
Dem. Rep. of the Congo USD 34 83% Timor-Leste USD 99 65%
Guinea USD 21 30% Uganda USD 42 81%
Guinea-Bissau USD 38 61% Zambia USD 28 23%
Haiti USD 56 84%
Lesotho USD 18 16% Average USD 52 95%
Liberia USD 20 40% Median USD 38 61%
Note: Affordability is calculated as the smartphone price divided by average monthly income.Source: A4AI (2020).
Connectivity in the Least Developed Countries: Status report 2021
25
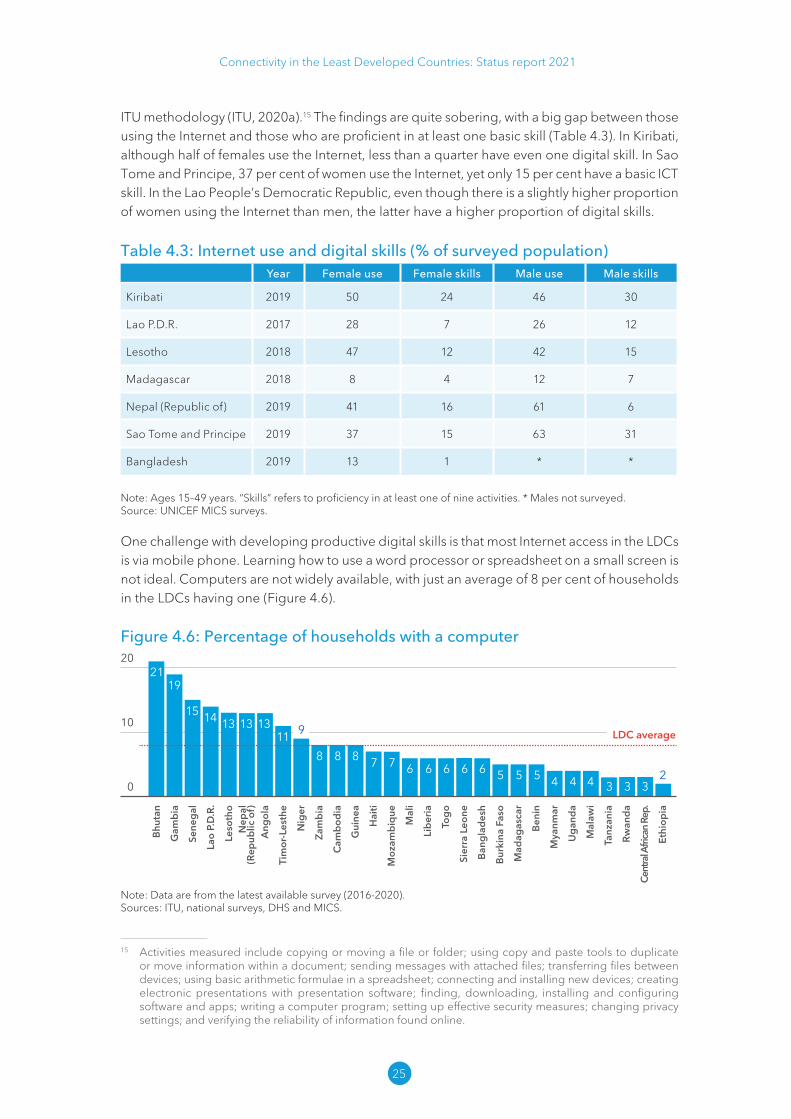
ITU methodology (ITU, 2020a).15 The findings are quite sobering, with a big gap between those using the Internet and those who are proficient in at least one basic skill (Table 4.3). In Kiribati, although half of females use the Internet, less than a quarter have even one digital skill. In Sao Tome and Principe, 37 per cent of women use the Internet, yet only 15 per cent have a basic ICT skill. In the Lao People’s Democratic Republic, even though there is a slightly higher proportion of women using the Internet than men, the latter have a higher proportion of digital skills.
Table 4�3: Internet use and digital skills (% of surveyed population)Year Female use Female skills Male use Male skills
Kiribati 2019 50 24 46 30
Lao P.D.R. 2017 28 7 26 12
Lesotho 2018 47 12 42 15
Madagascar 2018 8 4 12 7
Nepal (Republic of) 2019 41 16 61 6
Sao Tome and Principe 2019 37 15 63 31
Bangladesh 2019 13 1 * *
Note: Ages 15–49 years. “Skills” refers to proficiency in at least one of nine activities. * Males not surveyed.Source: UNICEF MICS surveys.
One challenge with developing productive digital skills is that most Internet access in the LDCs is via mobile phone. Learning how to use a word processor or spreadsheet on a small screen is not ideal. Computers are not widely available, with just an average of 8 per cent of households in the LDCs having one (Figure 4.6).
Figure 4�6: Percentage of households with a computer
Nep
al(R
epub
lic o
f)An
gola
Tim
or-L
esth
e
Nig
er
Zam
bia
Gui
nea
Hai
ti
Moz
ambi
que
Mal
i
Libe
ria
Togo
Sier
ra L
eone
Bang
lade
sh
Burk
ina
Faso
Mad
agas
car
Beni
n
Mya
nmar
Uga
nda
Mal
awi
Tanz
ania
Rwan
da
Cent
ral A
frica
n Rep
.
Ethi
opia
Bhut
an
Gam
bia
Sene
gal
Lao
P.D
.R.
Leso
tho
Cam
bodi
a
0
10
20
LDC average
2119
15 14 13 13 1311
78 8 8 7 6 6 6 6 6 5 5 5 4 4 4 3 3 32
9
Note: Data are from the latest available survey (2016-2020).Sources: ITU, national surveys, DHS and MICS.
15 Activities measured include copying or moving a file or folder; using copy and paste tools to duplicate or move information within a document; sending messages with attached files; transferring files between devices; using basic arithmetic formulae in a spreadsheet; connecting and installing new devices; creating electronic presentations with presentation software; finding, downloading, installing and configuring software and apps; writing a computer program; setting up effective security measures; changing privacy settings; and verifying the reliability of information found online.

Connectivity in the Least Developed Countries: Status report 2021
26
Boosting digital literacy will require a partnership between governments, the private sector and development partners to identify successful initiatives, and fund and scale them up. Various initiatives are underway to teach basic digital skills in LDCs. Mobile industry association GSMA has developed a Mobile Internet Skills Training Toolkit (MISTT).16 It revolves around a “train the trainers” approach, whereby staff from mobile operators train sales agents, who then go out to the field to teach customers. The Toolkit has been piloted in Bangladesh, where 3 200 agents trained some 117 000 customers over three months. Results included a 228 per cent increase in mobile Internet usage among the group, compared with 59 per cent overall. Some 19 per cent of those trained went on to become regular mobile data users (GSMA, 2019b). MISTT was also piloted in Rwanda, with the evaluation finding that, after social media, the most requested service for help was regarding how to use the government online service “Irembo” (GSMA, 2017b). There was a similar finding in the proof of concept evaluation of the Government of Rwanda’s Digital Ambassador Program, where 5 000 youths will be trained to provide digital skills training to 5 million Rwandans over a four-year period. The evaluation of the Digital Ambassador Program looked at the experience of 50 Rwandans trained to become Digital Ambassadors, and was deployed to five districts, where they delivered training to over 17 000 citizens (Digital Opportunity Trust, 2019). It found that there was an exponential increase in e-government use, due to the ability to save time and resources instead of going to a service centre.
Several training initiatives exist to remedy the large gender imbalance in digital skills. In Bangladesh, mobile operator Axiata uses specially equipped buses featuring computers and Internet access to provide digital literacy training to women and girls in remote areas. As of December 2019, over 63 000 girls and women had received training.17 (ITU, along with UN Women and others, is partnering to close the gender skills gap through EQUALS (Box 4.2).
16 Available at https:// www .gsma .com/ m obileforde velopment/ connected -society/ mistt/ .17 Case for Change, “The bus that is driving female empowerment”, available at https:// www .caseforchange
.com/ case -studies/ the -bus -that -is -driving -female -empowerment.

Connectivity in the Least Developed Countries: Status report 2021
27
Box 4�2: EQUALS: The Global Partnership for Gender Equality in the Digital Age
Co-founded by ITU, UN Women, the International Trade Centre (ITC), GSMA and United Nations University, EQUALS is a global partnership of United Nations agencies, industry, government, research institutions and civil society, working together to close the gender digital divide and achieve gender digital equality by 2030. Five years after its founding, EQUALS has attracted more than 100 committed partners from government, the private sector and civil society, across 115 countries. Working together, it has delivered digital skills training and mentoring to over 52 000 women and girls, and has supported 146 research projects aimed at understanding the barriers to closing the gender digital divide and identifying potential solutions. Several LDCs – including Rwanda, Burundi, Ethiopia, Haiti, Somalia, Afghanistan and the Republic of Nepal – are active in and benefiting from the partnerships.
Her Digital Skills, powered by EQUALS: One example that started in 2021 is a programme created and supported by the EQUALS Skills Coalition partners EY, GSMA and others, offering girls and young women in underserved areas free-of-charge access to a high-quality, highly recognized digital skills training and certification programme, through a combination of online training and, where possible, hands-on workshops. The goal is to facilitate girls’ and women’s access to employment and entrepreneurial opportunities in the tech sector, and also to encourage some participants to study technology and embrace a career in this sector. The Republic of Nepal and Ethiopia are two of the five countries where this programme will be rolled out.
Tech as a driver of women’s economic opportunity: ITU partnered with the Enhanced Integrated Framework to maximize the positive impact of technology for women. The project aims at leveraging the power of technology to drive economic advancement for women workers and entrepreneurs in LDCs, through strengthening their digital skills, and by connecting them to digital and professional networking platforms. The target cohort will be digitally empowered to seek out new job opportunities for women, increase their income, and improve their long-term employment prospects. As part of this project, at least 800 women across Burundi, Haiti and Ethiopia, spanning a range of important business sectors and value chains, will be reached. This project combines the need to “upskill” women with the need to integrate a gender perspective into broader national digital policy development with policy-makers.
For those without computers, access could be provided at public access points. This was a popular strategy a decade ago, but lost traction, due to the rapid proliferation of mobile broadband coverage and smartphones in developing countries (Sey and others, 2013). Public access points such as libraries, community centres and schools could be leveraged to provide broadband access and computers, and digital skills training, including how to use productive online applications for benefitting livelihoods. Giga – a partnership between UNICEF, ITU and the private sector – has the goal of connecting every school to the Internet. Its analysis shows that schools can be “anchor tenants” in a community to extend access and digital skills training to those living close by. In Sierra Leone, some 5.1 million people live within a kilometre of a

Connectivity in the Least Developed Countries: Status report 2021
28
school. If all of the country’s approximately 11 000 schools were provided with broadband access, it would cover around 65 per cent of the population.18
4.3 National data infrastructure
National data infrastructure transports, exchanges and stores data. It is an important part of the telecommunication supply chain, with strong influence over the affordability and quality of Internet services. Backbone transmission networks carry data around the country. If they are not sufficiently dispersed, people in rural areas can lack access; and if they do not have enough capacity, quality will suffer. Backbone networks are also critical for landlocked countries, since they provide connectivity up to the border, where data traverse neighbours for delivery to undersea cable networks. Internet exchange points (IXPs) exchange data traffic within the country. This can lower costs and improve performance, since data do not need to be sent overseas for exchange. Data centres are a key part of a digital economy infrastructure, allowing businesses and governments to store a growing amount of data in a secure manner.
National backbones vary in their diffusion across the LDCs. One measure of backbone deployment is the distance people live from a backbone (Figure 4.7). The further away, the poorer the quality. Less than a third of the population in the LDCs lives within 10 km of a national backbone, while almost 15 per cent live more than 100 km away, likely with no access to telecom networks. Progress in densifying transmission networks has been slow, with the percentage of people living in LDCs within 10 km of a backbone network rising just 6 percentage points between 2016 and 2020. Only half a dozen LDCs have at least half their population living within 10 km of a backbone network. These LDCs have small land areas or have a high population density (Comoros, Gambia, Djibouti, Bangladesh, Cambodia and Rwanda).
Figure 4�7: Reach of transmission networks in LDCs
% of population within reach of transmission networks, by distance, 2020
0
50
100
10 km 25 km 50 km 100 km
28
54
7386
% of population within 10 km of a transmission network
0
15
30
2016 2017 2018 2019 2020
28 28
232222
Source: ITU.
There are a number of steps LDCs can take to increase investment in backbone networks. One is greater private sector involvement. In some countries, incumbent State-owned telecom
18 See https:// gigaconnect .org/ sierra -leone/ .

Connectivity in the Least Developed Countries: Status report 2021
29
operators are the main or only provider of backbone services, which can result in lower investment, high costs and slow roll-out (World Bank, 2018). Infrastructure sharing can also boost backbone deployment. One strategy is where operators share their infrastructure with other operators on a cost basis and with open access. Rather than duplicating costly infrastructure, operators can build different segments of the backbone. This requires careful planning and coordination to ensure that the backbone will reach all parts of the country. A second strategy is to leverage existing or planned utility and transport infrastructure. Telecommunication networks can utilize the towers and ducts already built for energy, railway and road networks to lower costs. Greenfield projects can be optimized upfront, so that new energy or transport networks include fibre-optic cable that can be used by telecommunication networks.
IXPs are locations where Internet service providers (ISPs) and content providers come together to swap data traffic. This results in lower costs, since the data do not need to be sent overseas only to return to the country. Performance is also improved, with the data getting to its destination more rapidly, critical in applications such as finance, gaming and sensor-based monitoring. When IXPs are located in neutral, collocation data centres,19 they facilitate participation and can lower costs to cloud-based services.
Despite the benefits, 19 LDCs do not have IXPs (Table 4.4). These are mainly small States or those with monopolies. At the same time, not all IXPs have the same impact. IXPs pass through a series of stages as they grow and increase their capacity, resulting in greater data usage and lower prices for consumers (Srinivasan and others, 2021). This includes allowing a variety of participants, disseminating information about who the participants are, the traffic processed by the exchange, and being located on a neutral collocation data centre. Many IXPs in LDCs are at the early stages, hampered by an inability to attract all ISPs to the exchange, regulations preventing content providers from participating, and unsustainable business models. No LDC IXP is at the highest stage.
IXPs do not require massive investment. Instead, many are not functioning effectively in LDCs, largely due to governance and regulatory issues. Key steps include loosening restrictions to allow content providers to participate. Encouraging cooperation among all ISPs in the market to participate is another key step. In some cases, the largest ISPs do not participate or reluctantly participate in the IXP, reducing its potential impact. A third step is moving the IXP to a neutral collocation data centre that is professionally managed, and can seamlessly scale to handle increases in participants and traffic. IXPs should also adopt a governance model where participants guide decision-making and ensure that the facility is sustainable through appropriate pricing for participation.
Data centres are a critical component of the digital economy infrastructure. They provide the infrastructure required to maintain and securely operate servers where data is stored (including the local hosting of domestic content). Availability of data centres is also a gauge of the digitalization of the economy, reflecting demand not only by the ICT sector, but also other industries that have a high demand for digital services, such as finance, transportation, legal, accounting, research and development, advertising and the public sector.
19 A neutral collocated data centre is not operated by telecommunication operators providing participants with the freedom to choose any operator, resulting in greater flexibility and lower costs. “Collocated” refers to the fact that the data centre accepts any company that wants to store its data and/or network equipment in the location.

Connectivity in the Least Developed Countries: Status report 2021
30
Globally, there were over 4 000 data centres connected to the Internet in April 2021. Huge gaps are apparent in data centre penetration, particularly between high-income nations and the rest of the world. While these disparities are related to income and demand for large-scale data storage and use, they are also caused by policies that have inhibited private investment in data centres, or lack of complementary infrastructure, particularly energy. The LDCs had fewer than 100 data centres translating into a penetration of 0.11 centre per million people (Figure 4.8). This is mainly due to Bangladesh, a lower-middle-income country, which accounts for over a quarter of all data centres in the LDCs. Eighteen LDCs do not have data centres connected to the Internet.
Figure 4�8: Data centres penetrationCount per million people, 2021
Low-income LDC Lower-middle-income
Upper-middle-income
High-income World
0
1
2
3
0.06 0.11 0.11 0.24
2.51
0.57
Source: PeeringDB (https:// www .peeringdb .com/ apidocs/ ).
Private sector investment in world class data centres has been negligible in most LDCs. This is often attributed to a lack of demand, as well as aversion to the country’s risk – perceived
Table 4�4: Stage of LDC IXPs, 2021Stage 0 Stage 0�5 Stage 1 Stage 2 Stage 2�5 Stage 3
Central African Rep.
Chad
Comoros
Djibouti
Eritrea
Ethiopia
Guinea-Bissau
Kiribati
Lao P.D.R.
Lesotho
Mauritania
Niger
Sao Tome and Principe
Sierra Leone
Solomon Islands
Somalia
South Sudan
Timor-Leste
Yemen
Benin
Haiti
Liberia
Madagascar
Somalia
Sudan
Vanuatu*
Zambia
Afghanistan
Burundi
Dem. Rep. of the Congo
Gambia
Guinea
Malawi
Mali
Senegal
Togo
Angola
Bangladesh
Bhutan
Cambodia
Djibouti
Mozambique
Nepal (Republic of)
Tanzania
Myanmar
Rwanda
Uganda
Note: Stage 0 = No IXP for exchanging traffic among local ISPs. Other stages defined by adding points for each of the following factors: website reachable; publishes information on number of participants; publishes data on traffic; allows non-ISPs to participate; and located in a neutral, colocation data centre.* Graduated in December 2020.Sources: Based on analysis of data from Packet Clearing House, PeeringDB and IXP websites.
Connectivity in the Least Developed Countries: Status report 2021
31
or real – of an unpredictable political environment, and factors such as energy supply and the higher cost of doing business. A global survey of data centre investors in 37 countries found that per capita income had the lowest influence on whether to invest (Cushman and Wakefield, 2016). The main factor was the likelihood of natural disasters, followed by political stability. Energy security rather than its cost was also highly ranked, along with the ease of doing business. Governments can enhance data centre investment through credible energy policies and facilitating the business environment with stable and predictable regulations.
5 E-commerce challenges
E-commerce has boomed during the COVID-19 pandemic, due to shopping restrictions and self-quarantine measures. Apart from the benefits of e-commerce during emergencies such as COVID-19, it can also create new economic opportunities for LDCs. ESCAP (2018) argues that, while the agricultural and service sectors are the largest employers in LDCs in Asia and the Pacific, they offer limited formal employment opportunities, and have not generated high value-added activities. Instead, e-commerce is among the few sectors with the potential to add value to LDCs in the region, while helping them to diversify their economies and graduate from the group. This is echoed by a World Bank study of e-commerce in China, where the experiences could be applied to other developing countries to create jobs and improve people’s lives (World Bank, 2019).
The level of e-commerce in the LDCs is the lowest in the world. According to the World Bank’s Findex survey, almost a quarter of the world shopped online in 2017 (latest year available). Yet only 10 million people – or 2 per cent of the population aged 15 years and older – shopped online in the LDCs. And only 10 per cent of Internet users in the LDCs shopped online, compared with the world average of 50 per cent, illustrating the huge gap between those with the potential to purchase products over the Internet in the LDCs and those who actually do. This shows that access to the Internet is not the only challenge in encouraging more e-commerce in LDCs. Only three LDCs had an online shopping rate of 5 per cent or more of the population: the Lao People’s Democratic Republic (the highest at 6 per cent), Tanzania (5 per cent) and Uganda (5 per cent).
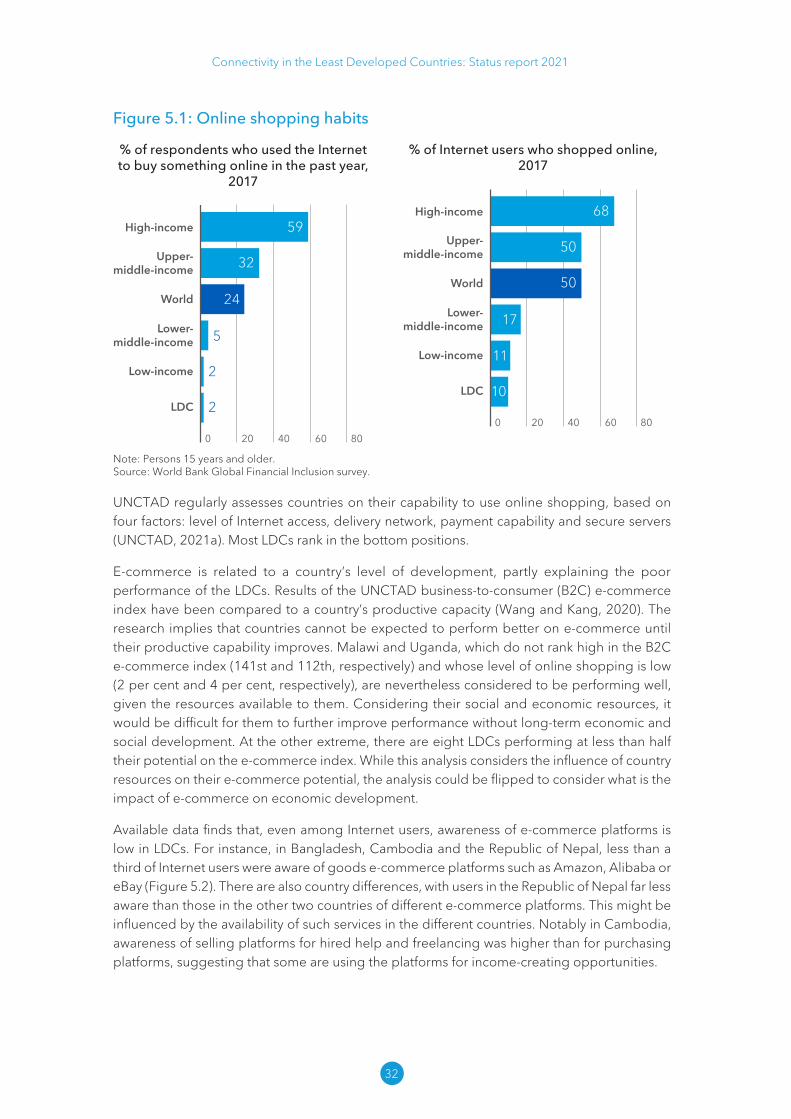
Connectivity in the Least Developed Countries: Status report 2021
32
Figure 5�1: Online shopping habits
% of respondents who used the Internet to buy something online in the past year,
2017
0
High-income
5
2
2
Upper-middle-income
World
Lower-middle-income
Low-income
LDC
40 8020 60
32
24
59
% of Internet users who shopped online, 2017
0
High-income
Upper-middle-income
World
Lower-middle-income
Low-income
LDC
40 8020 60
50
50
11
10
17
68
Note: Persons 15 years and older.Source: World Bank Global Financial Inclusion survey.
UNCTAD regularly assesses countries on their capability to use online shopping, based on four factors: level of Internet access, delivery network, payment capability and secure servers (UNCTAD, 2021a). Most LDCs rank in the bottom positions.
E-commerce is related to a country’s level of development, partly explaining the poor performance of the LDCs. Results of the UNCTAD business-to-consumer (B2C) e-commerce index have been compared to a country’s productive capacity (Wang and Kang, 2020). The research implies that countries cannot be expected to perform better on e-commerce until their productive capability improves. Malawi and Uganda, which do not rank high in the B2C e-commerce index (141st and 112th, respectively) and whose level of online shopping is low (2 per cent and 4 per cent, respectively), are nevertheless considered to be performing well, given the resources available to them. Considering their social and economic resources, it would be difficult for them to further improve performance without long-term economic and social development. At the other extreme, there are eight LDCs performing at less than half their potential on the e-commerce index. While this analysis considers the influence of country resources on their e-commerce potential, the analysis could be flipped to consider what is the impact of e-commerce on economic development.
Available data finds that, even among Internet users, awareness of e-commerce platforms is low in LDCs. For instance, in Bangladesh, Cambodia and the Republic of Nepal, less than a third of Internet users were aware of goods e-commerce platforms such as Amazon, Alibaba or eBay (Figure 5.2). There are also country differences, with users in the Republic of Nepal far less aware than those in the other two countries of different e-commerce platforms. This might be influenced by the availability of such services in the different countries. Notably in Cambodia, awareness of selling platforms for hired help and freelancing was higher than for purchasing platforms, suggesting that some are using the platforms for income-creating opportunities.

Connectivity in the Least Developed Countries: Status report 2021
33
Figure 5�2: Awareness of platforms for buying/selling% of Internet users, 2017
0
50
25Accommodation (Airbnb, Booking.com etc.)Hired helpMicrowork/freelance (Upwork, Fiverr etc.)
Bangladesh Cambodia Republic of Nepal
16
3432
73
13
42
110 7
29
4 7
Goods/products (Amazon, AliExpress, eBay etc.)Transport/taxi services (Uber, Grab etc.)Tickets and appointments (movie/railway/doctor appointments etc.)24 23
19 2123
Note: Data refer to population aged 15–65 years, with surveys carried out in 2017 in Bangladesh and Cambodia, and 2018 in the Republic of Nepal. Hired help refers to a person offering their services for work. Microwork refers to a person carrying out online services for payment.Source: LIRNEasia (2019).
In addition to individuals, online trading is also important for merchants. Studies highlight how e-commerce reduces costs for merchants and expands the market for their goods (Lendle and others, 2012; eBay, 2016). A study of Asian LDCs found that online sellers had more diversified international markets than offline traders, and sold more high-value goods (ITC, 2018). Not having a web shop can impact businesses during emergencies, illustrated by retail shop closures due to COVID-19, which badly affected merchants without online sales options (UNCTAD, 2021b). At the same time, some LDCs were better prepared than others, especially those with national e-commerce strategies, policies for encouraging digital payments, and initiatives for raising awareness and skills training for businesses (Box 5.1) (UNCTAD, 2020b).
Electronic ordering of goods boosts employment in the delivery sector. Meituan, China’s largest food delivery company, found that 257,000 of its riders came from poor households in 2019.
Of these, 98 per cent had boosted their incomes enough to lift them out of poverty.
One challenge LDCs face in e-commerce development is a lack of online shops. Buyers miss out on the convenience of shopping online, merchants have no online marketplace to sell goods, and lower-skilled people cannot gain employment in delivery services, which can be a route out of poverty. Internationally recognized e-commerce brands can help to reduce the trust constraint, but few have invested in the LDCs. This limits options for merchants to sell online, and employment potential in logistics and other e-commerce-related occupations. There are only four global e-commerce companies with a ground presence in the LDCs:
• Grab is a Singaporean ride-hailing and food delivery company operating in eight South-east Asian countries, including two LDCs (Cambodia and Myanmar). In 2020, it had 5 million drivers, 2 million merchants and 25 million monthly users on its platform.20 Grab also has a smartphone payment app to reduce the need for cash payments.
• Daraz, an online marketplace, was founded in 2012 and operates in five South Asian nations, including three LDCs (Bangladesh, Myanmar and the Republic of Nepal). It has 30,000 sellers and 500 brands on its platform, with 2 million products available to its 5 million customers. In some of its operations, Daraz offers a payment app and also handles logistics. Daraz was purchased by Chinese e-commerce giant Alibaba in 2018 (Alizila, 2018).
• Jumia is an online marketplace with operational headquarters in Nigeria, and is available in 11 African countries, including two LDCs (Senegal and Uganda). It was also in Rwanda and Tanzania, but closed those operations because they were unprofitable. Jumia had
20 See https:// assets .grab .com/ wp -content/ uploads/ media/ ir/ Infographic .pdf.

Connectivity in the Least Developed Countries: Status report 2021
34
almost 8 million customers and 110,000 merchants in 2020. In order to get around delivery and payment constraints in the region, Jumia has its own logistics service and smartphone payment app.
• Foodpanda, a subsidiary of the German company Delivery Hero, operates food delivery services, including four LDCs in Asia (Bangladesh, Cambodia, the Lao People’s Democratic Republic and Myanmar). Transactions grew rapidly in 2020 because of restaurant closures due to COVID-19.
Despite the low penetration of formal e-commerce use in LDCs, many utilize aspects of e-commerce in a way that is appropriate to their situation.21 There is anecdotal evidence to suggest “offline” e-commerce in the LDCs is high.22 While the official definition of e-commerce calls for making an order online, people in LDCs are likely using social media to search for products, then messaging the seller about payment and delivery. Many Internet users in the LDCs are more familiar with social media than with the wider Internet. There is a higher degree of trust when ordering through social media, since sellers are part of shopping groups or have been recommended by friends or family members who had positive experiences. In the vast majority of cases, cash on delivery is still the preferred mode of payment. This helps to partially overcome the lack of trust towards e-commerce in the LDCs, but it does not contribute to creating a level playing field and robust e-commerce ecosystem for both businesses and consumers.
UNCTAD’s eTrade Readiness Assessments are a spin-off of the eTrade for All Partnership established in 2017, meant to foster a holistic approach that places e-commerce development in LDCs at the intersection of key policy areas (UNCTAD, 2019). Out of the 27 assessments carried out as of June 2021, 24 cover LDCs.23 While specific recommendations are formulated in each country assessment, overall recommendations include, among others, that countries should:
• deepen cooperation between development partners, governments and the private sector to better deal with the cross-cutting aspects of e-commerce and digitalization;
• mainstream e-commerce in national development plans and develop a national strategy to accelerate e-commerce development and chart the future course;
• encourage e-banking innovations and enable interbank money transfers and payments to facilitate e-commerce transactions and interoperability;
• create an enabling regulatory environment to encourage investment and ensure secured payments through innovative solutions for local consumers and businesses;
• adopt consumer protection, data and privacy protection, and cybersecurity laws and regulations.
21 Organisation for Economic Co-operation and Development, Glossary of Statistical Terms, available at https:// stats .oecd .org/ glossary/ detail .asp ?ID = 4721.
22 For example, social media platforms such as Instagram account for one-third to one-half of all e-commerce transactions in Thailand. See https:// www .smartbrief .com/ original/ 2020/ 08/ future -e -commerce -social -media.
23 Including recently graduated Vanuatu (2020), still an LDC at the time of the assessment, and Samoa (graduated in 2014). Individual country assessments and relevant follow-up analysis can be accessed at https:// unctad .org/ topic/ ecommerce -and -digital -economy/ etrade -readiness -assessments -of -LDCs.
Connectivity in the Least Developed Countries: Status report 2021
35
Box 5�1: Senegal’s e-commerce sector helps country cope with COVID-19
In Senegal, the COVID-19 pandemic has prompted several brick-and-mortar businesses to move online to continue operating. The Government is facilitating this transition and the delivery of essential supplies by fast-tracking the implementation of e-commerce policies and reforms. The Ministry of Trade has created an e-commerce platform that provides easy access to websites of small and medium-sized enterprises (SMEs) that sell essential goods. The platform facilitates the distribution of necessary food, hygiene and health products; federates the SMEs; and encourages more traditional businesses to go online.
The e-commerce platform created by the Government of Senegal has attracted a wide range of operators. So far, about 60 businesses have either joined or shown an interest in joining the platform. They range from firms providing e-commerce, logistics and payment solutions, to those helping entrepreneurs set up e-commerce operations. The platform now serves as an information portal, with contact details of various e-commerce operators, but it’s aimed at pooling and optimizing goods distribution by creating a national consortium of e-commerce operators, open to all producers and merchants. Besides the e-commerce platform, the Ministry of Trade has launched a second platform to support its market monitoring activities through online mapping of available stocks of essential foodstuff across the country.
UNCTAD’s eTrade readiness assessment of Senegal conducted in 2018 recommended, among other measures, getting e-commerce businesses actively engaged in a public–private dialogue, especially in the development of national and regional e-commerce strategies. In response, the Government of Senegal launched a national e-commerce development strategy in December 2019, supported by the Enhanced Integrated Framework. It also created the National Council for Digitalization, which guided the development of the strategy, in collaboration with an e-commerce working group that handles the country’s participation at the World Trade Organization. The work enhanced policy coordination. The Government’s implementation of other recommendations of the assessment has resulted in improved Internet connectivity and affordability, thanks to reforms and more open markets, as well as private investments by telecom operators and Internet service providers. Further, Senegal is revising its legal framework, and has drafted a personal data protection bill for parliamentary review. It’s also rolling out new e-government initiatives such as Smart Senegal, a quest to use digital technology to enhance socio-economic development.
Source: UNCTAD, at https:// unctad .org/ news/ senegals -e -commerce -sector -helps -country -cope -covid -19.
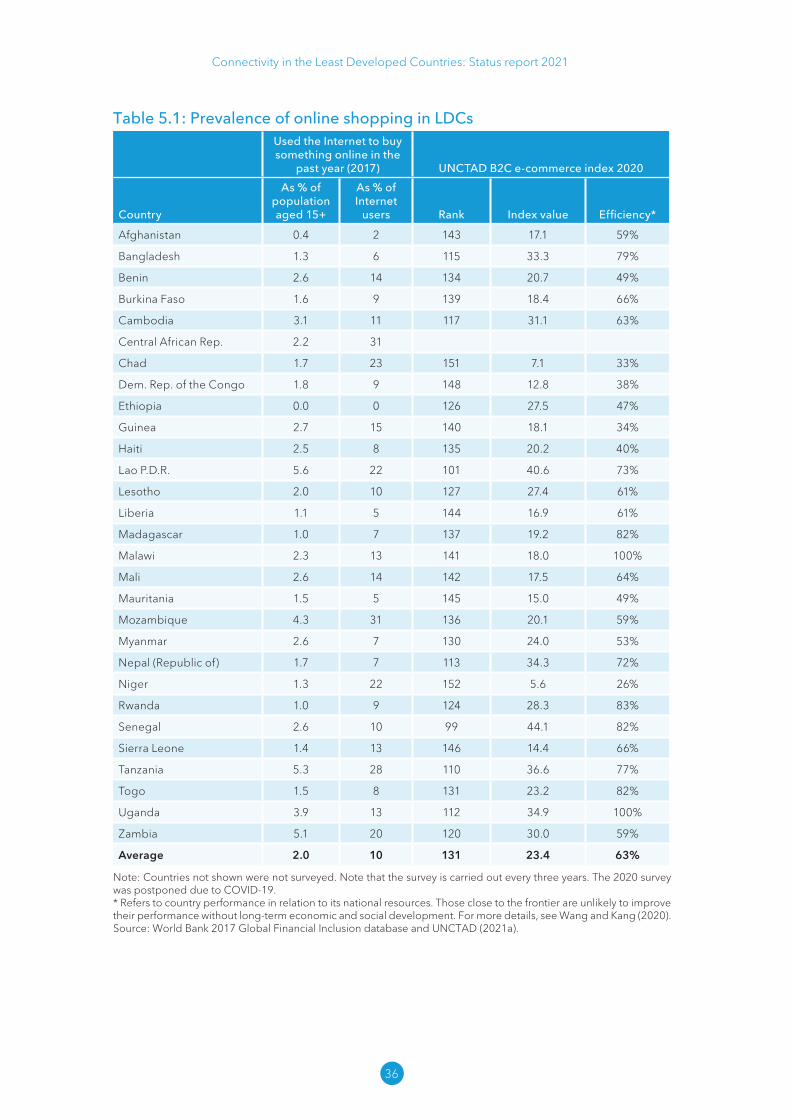
Connectivity in the Least Developed Countries: Status report 2021
36
Table 5�1: Prevalence of online shopping in LDCsUsed the Internet to buy something online in the
past year (2017) UNCTAD B2C e-commerce index 2020
Country
As % of population aged 15+
As % of Internet
users Rank Index value Efficiency*
Afghanistan 0.4 2 143 17.1 59%
Bangladesh 1.3 6 115 33.3 79%
Benin 2.6 14 134 20.7 49%
Burkina Faso 1.6 9 139 18.4 66%
Cambodia 3.1 11 117 31.1 63%
Central African Rep. 2.2 31
Chad 1.7 23 151 7.1 33%
Dem. Rep. of the Congo 1.8 9 148 12.8 38%
Ethiopia 0.0 0 126 27.5 47%
Guinea 2.7 15 140 18.1 34%
Haiti 2.5 8 135 20.2 40%
Lao P.D.R. 5.6 22 101 40.6 73%
Lesotho 2.0 10 127 27.4 61%
Liberia 1.1 5 144 16.9 61%
Madagascar 1.0 7 137 19.2 82%
Malawi 2.3 13 141 18.0 100%
Mali 2.6 14 142 17.5 64%
Mauritania 1.5 5 145 15.0 49%
Mozambique 4.3 31 136 20.1 59%
Myanmar 2.6 7 130 24.0 53%
Nepal (Republic of) 1.7 7 113 34.3 72%
Niger 1.3 22 152 5.6 26%
Rwanda 1.0 9 124 28.3 83%
Senegal 2.6 10 99 44.1 82%
Sierra Leone 1.4 13 146 14.4 66%
Tanzania 5.3 28 110 36.6 77%
Togo 1.5 8 131 23.2 82%
Uganda 3.9 13 112 34.9 100%
Zambia 5.1 20 120 30.0 59%
Average 2.0 10 131 23.4 63%
Note: Countries not shown were not surveyed. Note that the survey is carried out every three years. The 2020 survey was postponed due to COVID-19.* Refers to country performance in relation to its national resources. Those close to the frontier are unlikely to improve their performance without long-term economic and social development. For more details, see Wang and Kang (2020).Source: World Bank 2017 Global Financial Inclusion database and UNCTAD (2021a).

Connectivity in the Least Developed Countries: Status report 2021
37
6 The role of the private sector in boosting connectivity
The private sector is indispensable for providing digital connectivity in the LDCs. Private companies bring essential capital and expertise essential for constructing networks and transferring knowledge. The majority of telecommunication networks are today privately operated in the LDCs. This was not always the case. The inaugural ITU report on telecommunications in the LDCs, published in 1995, found that almost 90 per cent of telecom operators were government-owned, and only 15 LDCs had private participation in their telecom sector (ITU, 1995). Since then, the ownership structure of the telecommunication sector has changed substantially, driven by new mobile operators and opening markets to competition, which is now the norm rather than the exception. Today, only a handful of LDCs allow no competition, and networks fully owned and operated by the State are all in the Horn of Africa (Djibouti, Eritrea and Ethiopia (Box 6.3)).
The choice of who owns and operates a country’s telecom infrastructure is critical for successful private sector participation. Companies must have sufficient resources to fund infrastructure deployment and abide by licensing terms and obligations. Economic and environmental sustainability of the telecommunication sector should be monitored, and its impacts understood. Disruption from sales or bankruptcies of telecommunication operators should be minimized, and mechanisms put in place to ensure they do not negatively impact competition. At the same time, governments need to guard against market dominance, which can result in high prices for consumers and impact development of the digital economy. Governments also need to create a favourable investment environment that allows foreign operators, with clear and enforceable regulatory rules and procedures.
Ownership of telecommunication operators in the LDCs can be characterized in three ways:
1) Publicly listed companies operating in multiple countries with controlling ownership: As publicly listed companies, transparency is high, epitomized by regular financial and environment, social and governance reports.
2) Unlisted private companies: These can be global, regional or national. As they are not publicly listed, they tend to be more opaque, although a few do occasionally publish annual reports (though generally not according to international accounting standards) or one-off reports for regulatory reasons.
3) Government-owned operators: These tend to be opaque, with limited publicly disclosed information about operations. This category also includes State-owned operators with global operations.
Across the LDCs, the private sector (publicly listed and unlisted private) owned, fully or with majority control, 80 per cent of all telecommunication operators. They provided service to 83 per cent of all mobile subscribers. Of the private sector type, the publicly listed dominates in both the number of operators and subscribers. Of the private sector type, the publicly listed dominates in both the number of operators and subscribers (Figure 6.1).
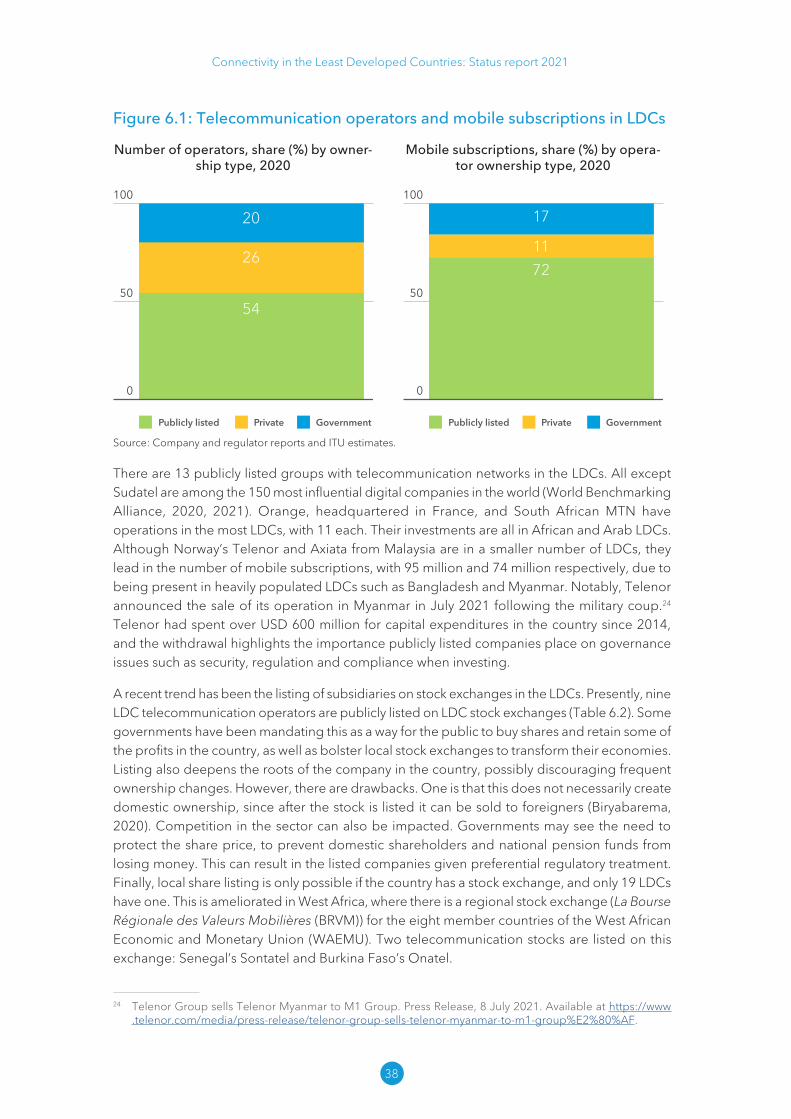
Connectivity in the Least Developed Countries: Status report 2021
38
Figure 6�1: Telecommunication operators and mobile subscriptions in LDCs
Number of operators, share (%) by owner-ship type, 2020
0
50
100
Publicly listed Private Government
54
26
20
Mobile subscriptions, share (%) by opera-tor ownership type, 2020
0
50
100
Publicly listed Private Government
7211
17
Source: Company and regulator reports and ITU estimates.
There are 13 publicly listed groups with telecommunication networks in the LDCs. All except Sudatel are among the 150 most influential digital companies in the world (World Benchmarking Alliance, 2020, 2021). Orange, headquartered in France, and South African MTN have operations in the most LDCs, with 11 each. Their investments are all in African and Arab LDCs. Although Norway’s Telenor and Axiata from Malaysia are in a smaller number of LDCs, they lead in the number of mobile subscriptions, with 95 million and 74 million respectively, due to being present in heavily populated LDCs such as Bangladesh and Myanmar. Notably, Telenor announced the sale of its operation in Myanmar in July 2021 following the military coup.24 Telenor had spent over USD 600 million for capital expenditures in the country since 2014, and the withdrawal highlights the importance publicly listed companies place on governance issues such as security, regulation and compliance when investing.
A recent trend has been the listing of subsidiaries on stock exchanges in the LDCs. Presently, nine LDC telecommunication operators are publicly listed on LDC stock exchanges (Table 6.2). Some governments have been mandating this as a way for the public to buy shares and retain some of the profits in the country, as well as bolster local stock exchanges to transform their economies. Listing also deepens the roots of the company in the country, possibly discouraging frequent ownership changes. However, there are drawbacks. One is that this does not necessarily create domestic ownership, since after the stock is listed it can be sold to foreigners (Biryabarema, 2020). Competition in the sector can also be impacted. Governments may see the need to protect the share price, to prevent domestic shareholders and national pension funds from losing money. This can result in the listed companies given preferential regulatory treatment. Finally, local share listing is only possible if the country has a stock exchange, and only 19 LDCs have one. This is ameliorated in West Africa, where there is a regional stock exchange (La Bourse Régionale des Valeurs Mobilières (BRVM)) for the eight member countries of the West African Economic and Monetary Union (WAEMU). Two telecommunication stocks are listed on this exchange: Senegal’s Sontatel and Burkina Faso’s Onatel.
24 Telenor Group sells Telenor Myanmar to M1 Group. Press Release, 8 July 2021. Available at https:// www .telenor .com/ media/ press -release/ telenor -group -sells -telenor -myanmar -to -m1 -group %E2 %80 %AF.

Connectivity in the Least Developed Countries: Status report 2021
39
Foreign investors generally retain a controlling stake in the ownership. One option is to take on a local company as a second shareholder, with the remaining shares for the public. In this way, the technological expertise of the group company is leveraged, while transferring knowledge to the local shareholder and employees over time. The international shareholder brings technological and business management expertise, while the local shareholder provides deeper understanding of the country’s economy and regulatory system. This is the model Telenor has followed in Bangladesh, where Grameen Telecom is the local shareholding company.
Table 6�2: Telecom operators with public listing in LDC stock markets
Company Country Year listed
Stock exchange
% public Other shareholders
Sonatel Senegal 1998 BRVM 23 Orange (42%), Government (27%), employees (8%)
Sudatel Sudan 2003 Khartoum Stock Exchange
43 Government (57%)
Telekom Networks Malawi
Malawi 2008 Malawi Stock Exchange
59 Press corporation (41%)
Onatel Burkina Faso 2009 BRVM 23 Maroc Telecom (61%), Government (16%)
Table 6�1: Publicly listed global telecommunication companies in LDCs, 2020Countries with
operations Subscriptions in LDCs (millions)
Group Headquarters Total of which LDCs
Orange France 24 11 63
MTN South Africa 21 11 63
Airtel India 16 9 43
Etisalat United Arab Emirates 15 8 45
Vodafone United Kingdom 23 4 37
Axiata Malaysia 6 3 74
Telenor Norway 9 2 95
Zain Kuwait 8 2 18
Sudatel Sudan 2 2 4
ATH Fiji 7 2 0.1
Veon Netherlands 10 1 35
Ooredoo Qatar 10 1 15
Telkom Indonesia Indonesia 2 1 0.4
Total 138 57 492
Source: Company reports, World Benchmarking Alliance.

Connectivity in the Least Developed Countries: Status report 2021
40
Company Country Year listed
Stock exchange
% public Other shareholders
Grameen-phone
Bangladesh 2009 Dhaka and Chatto-gram
10 Telenor (56%), Grameen Telecom (34%)
Vodacom Tanzania
Tanzania 2017 D a r e s Salaam Stock Exchange
25 Vodacom (75%)
Airtel Malawi Malawi 2020 Malawi Stock Exchange
20 Bharti Airtel (80%)
Robi Axiata Bangladesh 2020 Dhaka and Chatto-gram
20 Axiata (62%), Bharti Airtel (28%)
MTN Rwandacell
Rwanda 2021 Rwanda Stock Exchange
20 MTN (80%)
Source: Company reports.
The second category of operator in the LDCs is unlisted private companies. These can include international groups, which operate in different countries. For instance, Digicel, headquartered in Jamaica, focuses on island States, with operations in over 30 of them, including the LDCs Kiribati and Vanuatu. Slated for an initial public offering in 2015, it later pulled out. This category also includes private companies with a specific focus on certain regions. Axian owns the incumbent operator in its headquarters country, Madagascar, and has recently been active in Africa, either entering as a new greenfield operator (Comoros) or buying existing operations (Senegal, Togo and Tanzania). Finally, this category includes national private operators that own telecom networks in their home countries.
The final category is operators that are majority or fully owned by governments. In 16 LDCs, there are 100 per cent State-owned companies providing mobile services. Four operate in a monopoly market, while among the remaining 12, half are competitive, while the remainder have very low market shares. Of note is that Viettel, 100 per cent owned by the Government of Viet Nam, is active in 10 countries, including 8 LDCs. Market entry for the company is sometimes as a greenfield operation (such as in Burundi and Myanmar), while in other cases it has purchased ailing operators, including Haiti’s incumbent. LDC governments also have minority stakes in a number of telecommunication operators, mainly resulting from privatization initiatives.
Operator sales are prevalent in LDCs, and can result in disruption. In Rwanda, the incumbent was sold and repurchased by the Government twice. In the Pacific, uncertainty regarding the sale of Vanuatu’s incumbent operator hampered investment and competition. In Africa, Millicom made a strategic decision to pull out of the region, selling all of its subsidiaries. Sometimes divestures have created situations where the same group owns more than one operator in a country, with negative consequences for competition. It is important for governments to properly vet operators to ensure that they are financially sustainable and that they will commit to the country for the long term.
Table 6�2: Telecom operators with public listing in LDC stock markets (continued)
Connectivity in the Least Developed Countries: Status report 2021
41
Box 6�1: The demise of Rwandatel
Incumbent phone companies in most developing countries have often been viewed as symbols of national pride, and were typically government-owned. In the wake of the introduction of mobile communications, many struggled, hindered by unregulated interconnection rates that discouraged fixed telephone line use and, in some countries, the inability to obtain permission to provide mobile services.1 While some incumbents are financially sustainable, many are struggling, but nonetheless continue to exert pressure on regulators, often resulting in market dominance in national and international backbone markets, to the detriment of the ICT sector.
Founded in 1993, Rwandatel was the historic telecom operator in Rwanda. The Government privatized 99 per cent of Rwandatel for USD 20 million to a United States entrepreneur in 2005 (Nixon, 2007). Though Rwandatel was also allowed to provide mobile services, it selected CDMA technology that proved unpopular compared with the GSM network offered by MTN, which had a wide assortment of handsets. Following a failure to meet license obligations, the Government repurchased Rwandatel in 2007 for USD 12 million (RURA, 2007). The same year, it sold 80 per cent to Libya's LAP Green for five times more than its previous price, USD 100 million (TeleGeography, 2007). In 2011, Rwandatel’s assets were frozen due to United Nations sanctions against Libya (Rwanda News Agency, 2011). Its assets were sold to Liquid Telecom in 2013 for USD 4 million and the name was not retained (Mugisha, 2013). Thus, the incumbent operator has ceased to exist, and it may be not be a bad thing, since it cannot exert pressure on the Government, as is the case in other countries, to the detriment of a sustainable ICT sector. The privatization of Rwandatel put distance between it and the Government, providing freedom to adopt forward-looking policies without being encumbered by the influence of the incumbent operator.
Source: UN-OHRLLS, available at https:// www .un .org/ ohrlls/ news/ leveraging -investments -broadband -national -development -case -rwanda -and -senegal -2017.
1 One study noted the erosion of African incumbent telephone operators as far back as 2005: “Revenue sharing and competitive positions favorable to mobile operators as fixed incumbent operators retain no significant market power in many countries” (Bezzina, 2005).
There is evidence suggesting that countries with at least one of the publicly listed global companies tend to do better. Among the LDCs with a mobile household penetration above 90 per cent, seven have at least one global publicly listed company. Furthermore, these companies have the funding for making large-scale investments. They are also transparent in their reporting, including not only subscription figures but also the number of employees they have, their capital expenditure, the taxes they pay in each country they operate in, as well as their environmental performance. Some calculate their economic impacts, such as Axiata for the three Asian LDCs in which it operates (Table 6.3). Strong governance measures are in place in these companies, covering areas such as corruption and ethical behaviour.
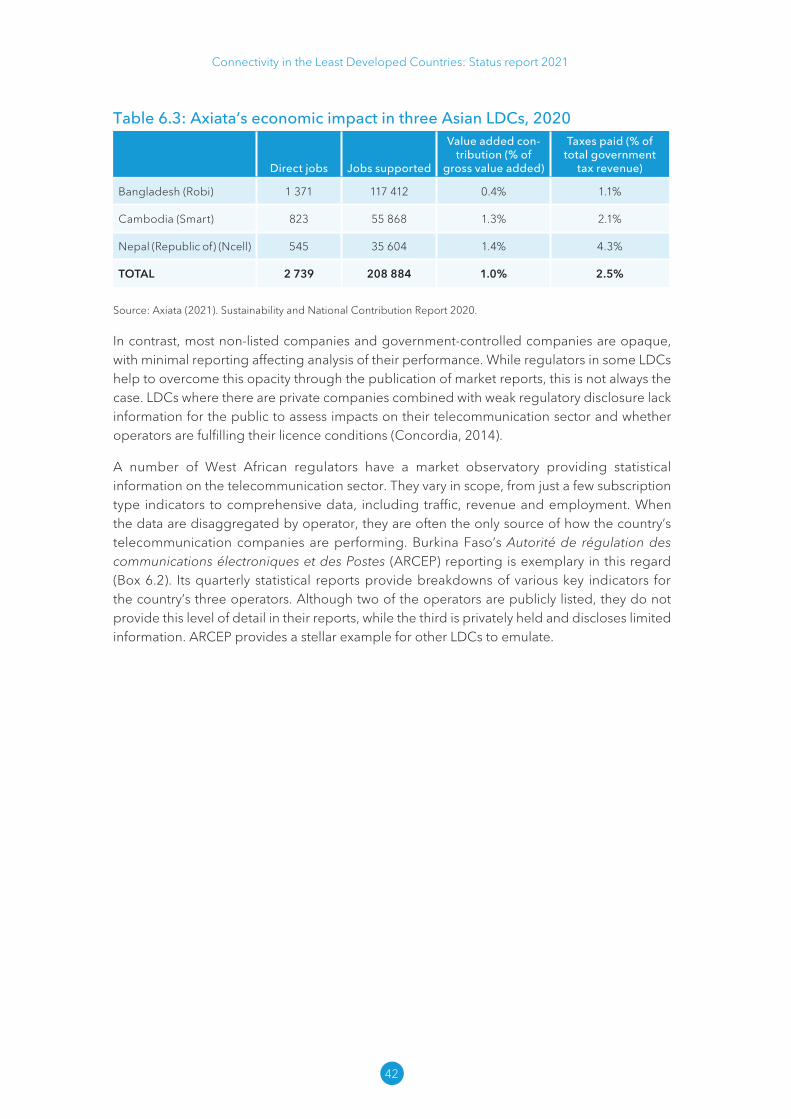
Connectivity in the Least Developed Countries: Status report 2021
42
Table 6�3: Axiata’s economic impact in three Asian LDCs, 2020
Direct jobs Jobs supported
Value added con-tribution (% of
gross value added)
Taxes paid (% of total government
tax revenue)
Bangladesh (Robi) 1 371 117 412 0.4% 1.1%
Cambodia (Smart) 823 55 868 1.3% 2.1%
Nepal (Republic of) (Ncell) 545 35 604 1.4% 4.3%
TOTAL 2 739 208 884 1.0% 2.5%
Source: Axiata (2021). Sustainability and National Contribution Report 2020.
In contrast, most non-listed companies and government-controlled companies are opaque, with minimal reporting affecting analysis of their performance. While regulators in some LDCs help to overcome this opacity through the publication of market reports, this is not always the case. LDCs where there are private companies combined with weak regulatory disclosure lack information for the public to assess impacts on their telecommunication sector and whether operators are fulfilling their licence conditions (Concordia, 2014).
A number of West African regulators have a market observatory providing statistical information on the telecommunication sector. They vary in scope, from just a few subscription type indicators to comprehensive data, including traffic, revenue and employment. When the data are disaggregated by operator, they are often the only source of how the country’s telecommunication companies are performing. Burkina Faso’s Autorité de régulation des communications électroniques et des Postes (ARCEP) reporting is exemplary in this regard (Box 6.2). Its quarterly statistical reports provide breakdowns of various key indicators for the country’s three operators. Although two of the operators are publicly listed, they do not provide this level of detail in their reports, while the third is privately held and discloses limited information. ARCEP provides a stellar example for other LDCs to emulate.

Connectivity in the Least Developed Countries: Status report 2021
43
Box 6�2: Burkina Faso's excellent telecommunication sector statistics
A number of West African regulators have a market observatory providing statistical information on the telecommunication sector. They vary in scope, from just a few subscription type indicators to comprehensive details including traffic, revenue and employment. When these include market share information, they are often the only source of how the country’s telecommunication operators are performing. ARCEP, Burkina Faso’s telecommunication regulator, leads the LDCs in the breadth and scope of reporting on the sector. ARCEP’s quarterly reports provide breakdowns of various key indicators for the country’s three operators, including subscriptions, data traffic, revenue and employment. For instance, the report reveals that revenue per 1 GB of data is much lower than the published tariff for 1 GB. This is because many users buy less frequent lower price packages, instead of the 30-day 1 GB package. Thus, price comparisons based on a standard amount of data should be used with caution. It is also interesting that the average amount of data use varies across operators. Although two of the operators are publicly listed, even they do not provide this level of detail in their reports, while the third is privately held and discloses limited information. ARCEP provides an exemplary example for other LDCs to emulate.
Box Table 6�1: Burkina Faso telecommunication market statistics, 4th quarter 2020
ONATEL TELECEL ORANGE TOTAL
Mobile subscriptions 9 387 859 3 135 518 9 593 841 22 117 218
Internet traffic (GB) 9 795 494 2 762 067 14 829 758 27 387 319
- per subscriber per month (GB) 0.6 1.2 0.8 0.9
Price of 1 GB per month (USD) USD 6.95 USD 3.47 USD 4.34 USD 5.33
Revenue per 1 GB (USD) USD 1.34 USD 1.98 USD 1.83 USD 1.72
International bandwidth (Gb/s) 35 5 20 60
Net revenue (millions of USD) USD 58 USD 20 USD 80 USD 158
Average revenue/subscriber (USD) USD 2.05 USD 2.18 USD 2.78 USD 2.39
Taxes (millions of USD) USD 15 USD 6 USD 23 USD 44
Direct employment 345 212 296 853
Note: Converted to USD using the annual average exchange rate.Source: ARCEP (2021a and 2021b).

Connectivity in the Least Developed Countries: Status report 2021
44
Box 6�3: The liberalization of the Ethiopian telecommunication market
With a population of 115 million, Ethiopia ranks 12th in the world, and is the sec-ond-most-populated LDC after Bangladesh (as well as second largest African country by population). It has been the world’s most populated country without competition and private sector involvement in its telecommunication sector. The results of a State-owned monopoly on universality and affordability of services are sharp. Bangladesh, with four mobile operators (three of which are publicly listed), outperforms Ethiopia in reach, use and pricing of telecommunication services. Bangladesh’s 3G coverage is 12 percentage points higher than Ethiopia’s, pricing for 1 GB of data is some five times cheaper, and over a quarter more households have mobile phones.
Ethiopia opened its telecommunication market in May 2021, when a licence was awarded to an international consortium called the Global Partnership for Ethiopia, led by Kenya’s Safaricom, and consisting of United Kingdom-headquartered Vodafone and its South African subsidiary Vodacom, Japan’s Sumitomo, and the United Kingdom’s develop-ment finance agency CDC (Safaricom, 2021). The consortium paid USD 850 million for the licence. It plans to invest up to USD 8.5 billion (the largest foreign direct investment ever in Ethiopia) and create downstream employment for over 1 million people after it launches in 2022 (Endeshaw, 2021). Notably, the consortium will launch with a 4G network, leapfrogging earlier generations of mobile technology.
Ethiopia plans to issue a second licence, as well as partially privatize Ethio Telecom, the incumbent creating a competitive private sector-led market. One sticking point is that Ethiopia Telecom will be the only company initially allowed to provide mobile money services (Dion, 2021).
Box Table 6�2: Selected indicators for Bangladesh and Ethiopia, 2020
Bangladesh Ethiopia
Population (millions) 165 115
Number of telecommunication operators
4 1
Monthly broadband price (% of GNI per capita)
1.9 9.5
3G coverage 97 85 (2018)
Households with mobile phone 94 (2018) 68 (2019)
Source: World Bank, ITU and DHS.
This section has largely focused on telecommunication services companies. However, there are other ICT companies that have an impact on digital connectivity, yet very few are present in LDCs. Apart from e-commerce companies discussed earlier, there are no leading tech multinationals operating data centres or providing cloud services in the LDCs. Nor do major equipment vendors have manufacturing plants in the LDCs, leading ICT-enabled services companies are absent, and no leading tech multinational has research and development operations in LDCs. This gap needs to be addressed for the private sector to play a greater role in the LDCs, in order for them to develop their digital economies.
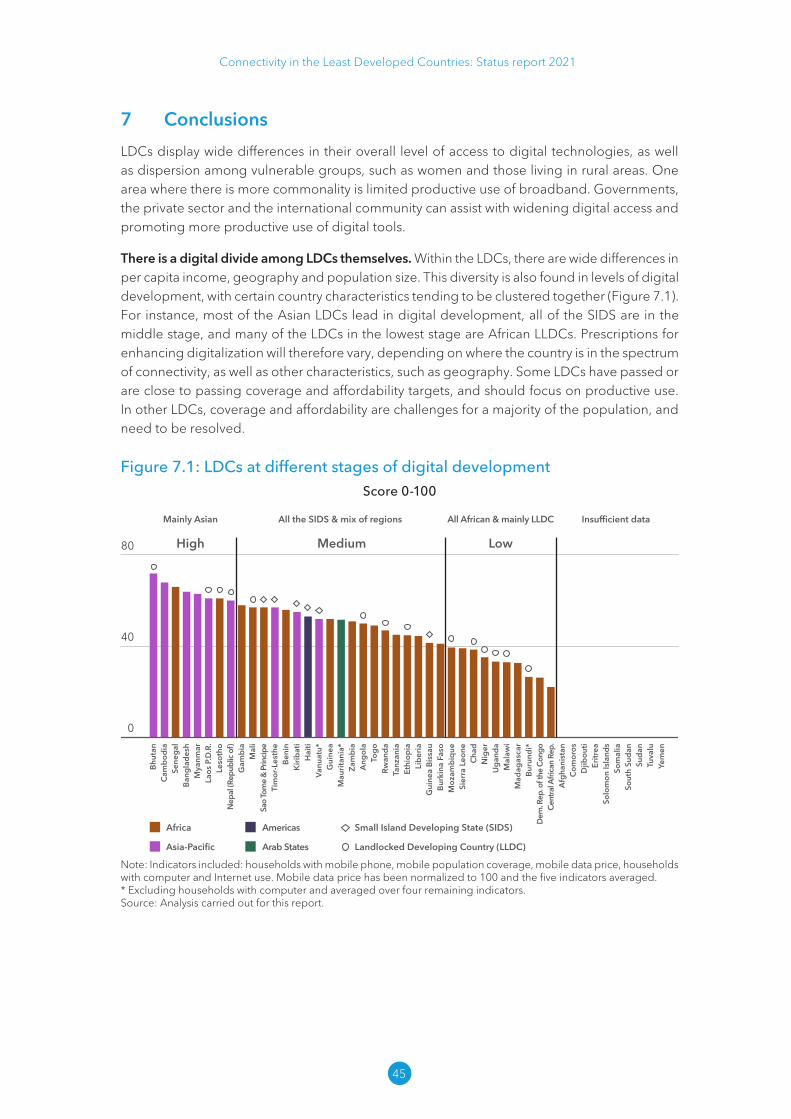
Connectivity in the Least Developed Countries: Status report 2021
45
7 Conclusions
LDCs display wide differences in their overall level of access to digital technologies, as well as dispersion among vulnerable groups, such as women and those living in rural areas. One area where there is more commonality is limited productive use of broadband. Governments, the private sector and the international community can assist with widening digital access and promoting more productive use of digital tools.
There is a digital divide among LDCs themselves. Within the LDCs, there are wide differences in per capita income, geography and population size. This diversity is also found in levels of digital development, with certain country characteristics tending to be clustered together (Figure 7.1). For instance, most of the Asian LDCs lead in digital development, all of the SIDS are in the middle stage, and many of the LDCs in the lowest stage are African LLDCs. Prescriptions for enhancing digitalization will therefore vary, depending on where the country is in the spectrum of connectivity, as well as other characteristics, such as geography. Some LDCs have passed or are close to passing coverage and affordability targets, and should focus on productive use. In other LDCs, coverage and affordability are challenges for a majority of the population, and need to be resolved.
Figure 7�1: LDCs at different stages of digital developmentScore 0-100
Nep
al (R
epub
lic o
f)
Ango
la
Tim
or-L
esth
e
Moz
ambi
que
Mal
i
Bang
lade
sh
Mad
agas
car
Uga
nda
Rwan
da
Ethi
opia
Bhut
an
Sene
gal
Mya
nmar
Leso
tho
Gam
bia
Sao
Tom
e &
Prin
cipe
Beni
n
Hai
tiKi
ribat
i
Gui
nea
Vanu
atu*
Zam
bia
Mau
ritan
ia*
Togo
Tanz
ania
Libe
riaG
uine
a Bi
ssau
Burk
ina
Faso
Sier
ra L
eone
Chad
Nig
er
Mal
awi
Buru
ndi*
Cent
ral A
frica
n Re
p.D
em. R
ep. o
f the
Con
go
Afgh
anis
tan
Com
oros
Djib
outi
Eritr
eaSo
lom
on Is
land
sSo
mal
iaSo
uth
Suda
nSu
dan
Tuva
luYe
men
Laos
P.D
.R.
Cam
bodi
a
High Medium Low
Mainly Asian Insufficient dataAll the SIDS & mix of regions All African & mainly LLDC
Africa
Asia-Pacific
Small Island Developing State (SIDS)
Landlocked Developing Country (LLDC)
Americas
Arab States
0
80
40
Note: Indicators included: households with mobile phone, mobile population coverage, mobile data price, households with computer and Internet use. Mobile data price has been normalized to 100 and the five indicators averaged. * Excluding households with computer and averaged over four remaining indicators.Source: Analysis carried out for this report.
Connectivity in the Least Developed Countries: Status report 2021
46
Only two LDCs have met SDG Target 9.c regarding universality and affordability, a goal that was supposed to be reached by the LDCs in 2020. Others are close but the vast majority of countries remain far off.
One significant obstacle the LDCs face is enticing people to move from 2G activities to broadband services. Millions of people in the LDCs are using plain mobile phones for calling, texting and payments. Other than social media, they see few compelling reasons to move to a smartphone and mobile broadband, particularly given the higher costs of the device and usage charges. Compelling use cases are needed, showing how broadband technologies can improve people’s lives and livelihoods.
Internet use remains low among LDCs. While 76 per cent of the population of LDCs is covered by a mobile broadband signal, only 25 per cent are using the Internet. That is, two thirds of the population who could use the Internet do not use it. This wide ‘usage gap’ shows that having access is a necessary, but not sufficient condition for getting online.
Universal service funds have been largely ineffective in expanding rural coverage (ITU, 2018). Given that it is the operators themselves that would have to expand their coverage in rural areas, taking money from them only to give it back again is highly inefficient. It would be far more transparent and productive to include coverage conditions in licences. Where licences without coverage obligations still have some time left before expiry, taxes and regulatory fees could be reduced in exchange for expanding broadband coverage. If universal service funds are to continue to exist, it would be more effective to use them for training aimed at reducing the large gender and location digital skills divides in the LDCs.
Digital skills training is a huge challenge. Millions are not online in LDCs in part because they are not aware of the Internet, or do not know how to use it. Equally challenging is the large number of people online but enclosed in a social media bubble. Not only is productive use limited, but there are also growing risks, as many of these users are not able to distinguish between real and fake news or protect their personal data. While there are a number of digital skills training initiatives in LDCs, none has reached the scale needed. LDC governments lack the resources to provide digital learning at scale, and are reluctant to borrow funds for this. Development partners do offer grants, but not at the level required for mass training. While the private sector is involved in some training initiatives through corporate social responsibility efforts, it is questionable how much they would be willing to provide to scale this up. Partnership of the three is one way forward, where resources and expertise can be pooled to achieve higher impact.
The service charge is not necessarily a major constraint to Internet take-up, it can be a constraint for the amount of data that can be consumed. COVID-19 has popularized use of broadband videoconferencing for work, school and health, yet few in the LDCs could afford the data that these applications require. Additionally, these activities should be carried out on a big screen to maximize the benefit and convenience, yet when someone has a device in the LDCs, it is most likely a cellphone and not a computer (tablet, laptop or desktop). So even though data could be made more affordable through public Wi-Fi or subsidized data for low-income users, it does not solve the problem of the big screen for key videoconferencing activities. For those without computers, access could be provided at public access points such as libraries, community centres and schools.

Connectivity in the Least Developed Countries: Status report 2021
47
LDCs are largely not making productive use of broadband technologies. For many LDC Internet users, the primary applications are social media or entertainment related, such as video streaming and gaming. Policy-makers have also been focused on universal access rather than what broadband is used for. Now that the vast majority of people in LDCs are covered by mobile broadband, focus needs to shift from infrastructure deployment to productive use (Foster and others, 2021). For individuals, this includes how to use online commerce, finance, education, health and government services. For SMEs, this includes how to use online services to generate income.
E-commerce take-up is low in LDCs. The consequences of this were magnified in the wake of COVID-19, when many people in LDCs were left with few options for purchasing necessities, and retailers had no online outlet. The low level of awareness and trust needs to be overcome and an enabling environment created to attract investment to remedy the obstacles faced by LDCs. UNCTAD has outlined tailored recommendations for more than two dozen LDCs to improve their ecosystem, and prepares e-commerce strategies to assist countries in e-commerce development. At the same time, there remains a shortage of data, particularly regarding businesses-to-business e-commerce in the LDCs, that limits analysis.
The digital economy is more than telecommunications. Yet many sector regulators remain focused on spectrum or licensing rather than enabling a digital economy. Sometimes responsibility for the digital economy falls under a ministry, resulting in fragmentation. There is also a mentality that the digital economy is just the concern of ICT regulators or ministries, impacting productive use, since other sectors lack awareness and fall behind. Reform of legal frameworks has also not followed the exponential evolution of digital technologies.
The private sector provides digital connectivity in almost all LDCs. The private sector makes the investment to expand the reach and quality of telecommunication networks. Yet too often governments see private operators as a financing mechanism for the public sector, through a multitude of different taxes and various regulatory fees. At the same time, governments want the private sector to provide inexpensive and universal services. This relationship is unsustainable, particularly if rural areas are to be connected. At the same time, LDCs have found it difficult to attract the private sector, particularly international companies, into investing in “middle-mile” infrastructure, such as data centres and cloud services, as well as hardware assembly and manufacturing.
Good digital governance will attract the investment for LDCs to develop their digital economy. This is epitomized by an enabling telecommunication sector regulatory environment; creation of an e-commerce strategy, including laws for data privacy and consumer protection; and a favourable investment climate. These preconditions, along with predictability and stability, are often cited by major companies in the digital sector as influencing investment.
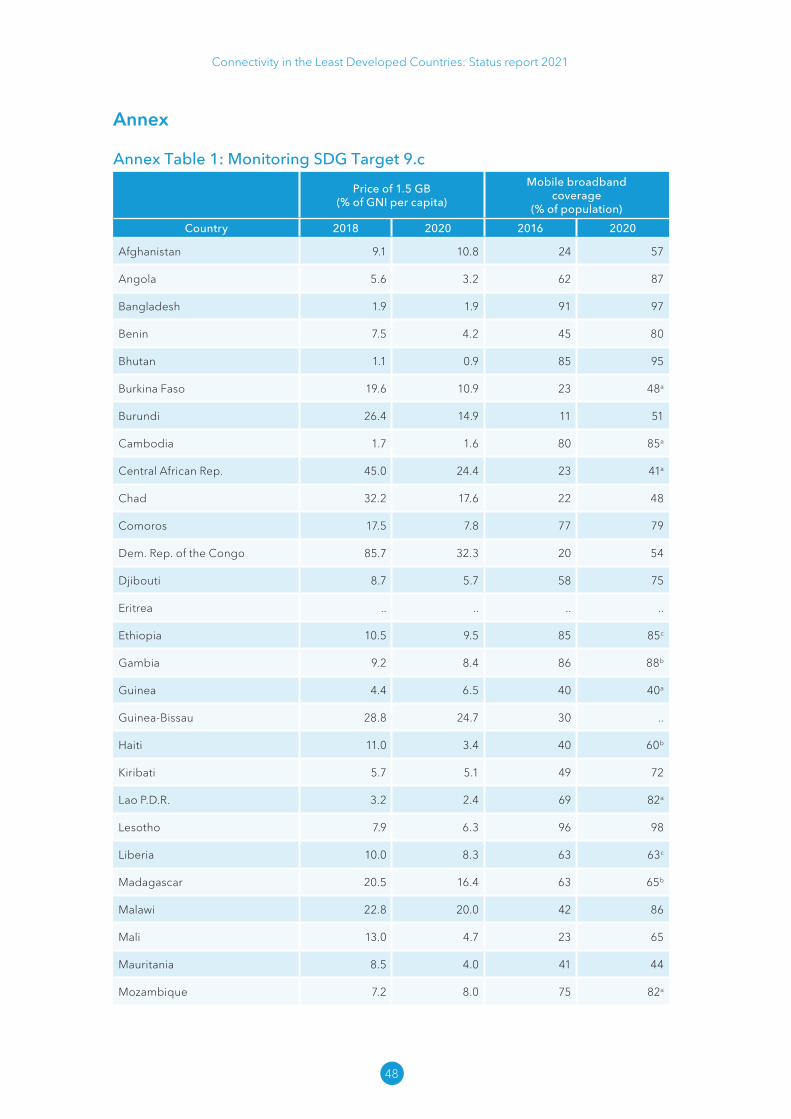
Connectivity in the Least Developed Countries: Status report 2021
48
Annex
Annex Table 1: Monitoring SDG Target 9�c
Price of 1�5 GB (% of GNI per capita)
Mobile broadband coverage
(% of population)
Country 2018 2020 2016 2020
Afghanistan 9.1 10.8 24 57
Angola 5.6 3.2 62 87
Bangladesh 1.9 1.9 91 97
Benin 7.5 4.2 45 80
Bhutan 1.1 0.9 85 95
Burkina Faso 19.6 10.9 23 48a
Burundi 26.4 14.9 11 51
Cambodia 1.7 1.6 80 85a
Central African Rep. 45.0 24.4 23 41a
Chad 32.2 17.6 22 48
Comoros 17.5 7.8 77 79
Dem. Rep. of the Congo 85.7 32.3 20 54
Djibouti 8.7 5.7 58 75
Eritrea .. .. .. ..
Ethiopia 10.5 9.5 85 85c
Gambia 9.2 8.4 86 88b
Guinea 4.4 6.5 40 40a
Guinea-Bissau 28.8 24.7 30 ..
Haiti 11.0 3.4 40 60b
Kiribati 5.7 5.1 49 72
Lao P.D.R. 3.2 2.4 69 82a
Lesotho 7.9 6.3 96 98
Liberia 10.0 8.3 63 63c
Madagascar 20.5 16.4 63 65b
Malawi 22.8 20.0 42 86
Mali 13.0 4.7 23 65
Mauritania 8.5 4.0 41 44
Mozambique 7.2 8.0 75 82a

Connectivity in the Least Developed Countries: Status report 2021
49
Price of 1�5 GB (% of GNI per capita)
Mobile broadband coverage
(% of population)
Country 2018 2020 2016 2020
Myanmar 1.2 1.0 90 94b
Nepal (Republic of) 5.2 2.6 54 54c
Niger 22.7 15.0 22 24c
Rwanda 7.2 6.9 92 98
Sao Tome and Principe 6.1 6.1 70 94
Senegal 3.1 2.8 50 92a
Sierra Leone 20.6 15.6 40 65
Solomon Islands 16.6 12.0 19 45b
Somalia .. .. 39 66c
South Sudan .. .. 15 15b
Sudan .. 4.5 46 65
Tanzania 7.8 6.8 85 85
Timor-Leste 6.6 4.4 97 97
Togo 16.6 15.1 45 91
Tuvalu .. .. 20 48c
Uganda 10.4 8.5 64 74
Vanuatu* 3.7 5.1 .. 70
Yemen 26.2 10.1 89 95c
Zambia 4.0 3.7 53 78
Weighted average 8.5 6.1 62 76
Median 8.9 6.8 52 74
Note: Pricing for LDCs is the country average, whereas the broadband coverage is weighted by population.".." Data not available. * Graduated in December 2020. Broadband coverage data refers to: a) 2019; b) 2018; c) 2017.Source: ITU.
Annex Table 1: Monitoring SDG Target 9�c (continued)

Connectivity in the Least Developed Countries: Status report 2021
50
Annex Table 2: Proportion of individuals using the Internet (SDG 17�8) 2016 2020 2016 2020
Afghanistan 11.2 18.4 Mali 14 27.4
Angola 23.2 36 Mauritania 29.1 (2017) ..
Bangladesh 18 24.8 Mozambique 7 16.5
Benin 14.5 25.8 Myanmar 16 35.1
Bhutan .. .. Nepal (Republic of) 20.7 37.7
Burkina Faso 12 22 Niger 10.2 (2017) ...
Burundi 2.2 9.5 Rwanda .. ..
Cambodia 32.4 78.8Sao Tome and Principe
.. ..
Central African Rep. 3.1 10.4 Senegal 25.7 42.6
Chad 5.8 10.4 Sierra Leone .. ..
Comoros .. .. Solomon Islands .. ..
Dem. Rep. of the Congo .. .. Somalia .. ..
Djibouti 30.8 59 South Sudan 3.5 6.5
Eritrea .. .. Sudan 14.1 28.4
Ethiopia 15.4 24 Tanzania 13.5 22
Gambia 21.4 36.5 Timor-Leste 21.2 29.1
Guinea 13.1 .. Togo 11.3 24
Guinea-Bissau 13.8 22.9 Tuvalu 31 ..
Haiti 22.8 34.5 Uganda 6 19.9
Kiribati 18.7 38 Vanuatu* .. ..
Lao P.D.R. 21.9 33.8 Yemen .. ..
Lesotho 32 43 Zambia 10.3 19.8
Liberia 15.7 25.6
Madagascar 5 .. Weighted average 13.7 24.6
Malawi 6.3 .. Median 14.1 24.9
Note: Median and weighted averages based on estimates including unpublished estimates for the full set of LDCs. * Graduated in December 2020. ".." Data not availableSource: Preliminary ITU estimates. Analysis carried out for the report based on national surveys and estimated growth from the last survey.

Connectivity in the Least Developed Countries: Status report 2021
51
Annex Table 3: Population within reach of transmission networks (%), 2020Country 10 km 25 km 50 km 100 km
Afghanistan 28 56 80 94
Angola 13 24 31 50
Bangladesh 59 97 100 100
Benin 48 75 91 100
Bhutan 33 82 99 100
Burkina Faso 13 28 48 77
Burundi 38 95 100 100
Cambodia 54 92 100 100
Central African Rep. .. .. .. ..
Chad 15 21 37 46
Comoros 99 100 100 100
Dem. Rep. of the Congo 12 23 33 54
Djibouti 75 84 94 99
Eritrea .. .. .. ..
Ethiopia 15 43 82 97
Gambia 75 97 100 100
Guinea 4 14 15 22
Guinea-Bissau 24 31 59 93
Haiti 36 78 97 100
Kiribati .. .. .. ..
Lao P.D.R. 26 66 96 100
Lesotho 2 20 59 100
Liberia 9 12 18 36
Madagascar 17 43 79 96
Malawi 19 46 91 100
Mali 15 29 51 88
Mauritania 12 29 48 59
Mozambique 22 46 77 98
Myanmar 30 79 99 100
Nepal (Republic of) 48 81 93 99
Niger 15 28 57 57
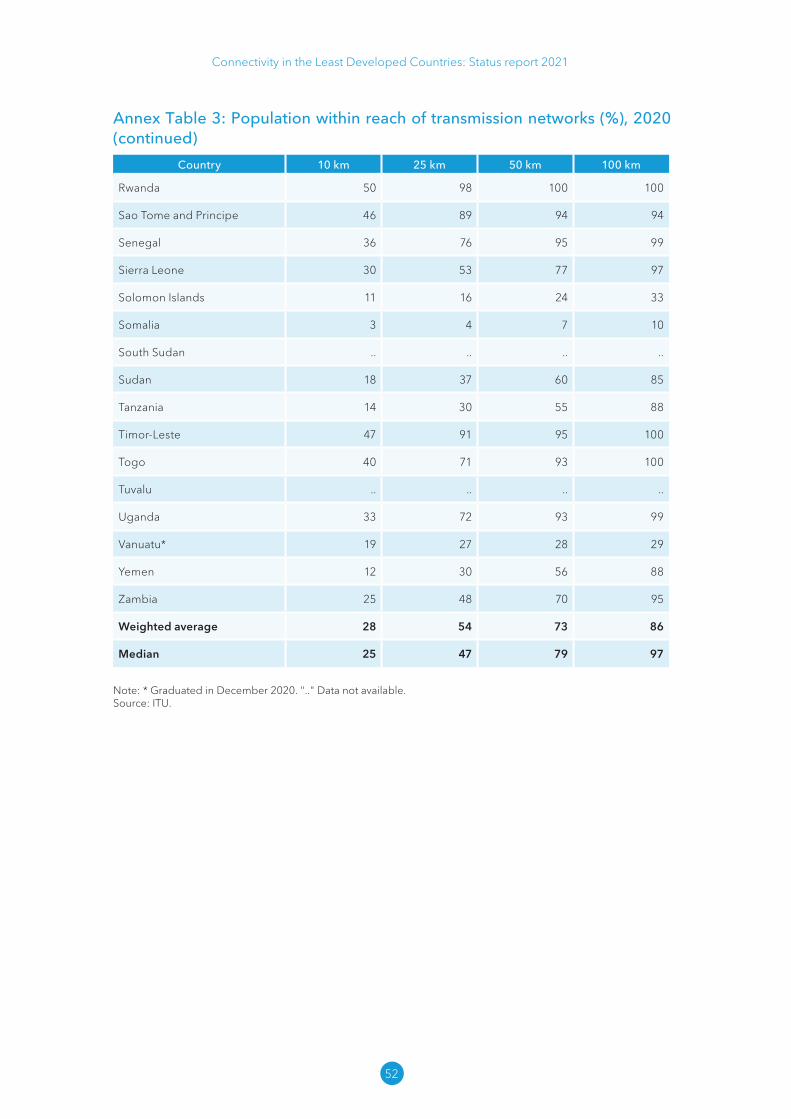
Connectivity in the Least Developed Countries: Status report 2021
52
Country 10 km 25 km 50 km 100 km
Rwanda 50 98 100 100
Sao Tome and Principe 46 89 94 94
Senegal 36 76 95 99
Sierra Leone 30 53 77 97
Solomon Islands 11 16 24 33
Somalia 3 4 7 10
South Sudan .. .. .. ..
Sudan 18 37 60 85
Tanzania 14 30 55 88
Timor-Leste 47 91 95 100
Togo 40 71 93 100
Tuvalu .. .. .. ..
Uganda 33 72 93 99
Vanuatu* 19 27 28 29
Yemen 12 30 56 88
Zambia 25 48 70 95
Weighted average 28 54 73 86
Median 25 47 79 97
Note: * Graduated in December 2020. ".." Data not available.Source: ITU.
Annex Table 3: Population within reach of transmission networks (%), 2020 (continued)

Connectivity in the Least Developed Countries: Status report 2021
53
Annex Table 4: Number of data centres, April 2021Country Number of data centres Per 1 million people
Afghanistan 1 0.03
Angola 6 0.19
Bangladesh 23 0.14
Benin 1 0.08
Bhutan 3 3.93
Burkina Faso 3 0.15
Burundi 2 0.17
Cambodia 6 0.36
Dem. Rep. of the Congo 3 0.03
Djibouti 1 1.03
Gambia 1 0.43
Guinea 1 0.08
Lao P.D.R. 2 0.28
Madagascar 1 0.04
Malawi 1 0.05
Mali 1 0.05
Mozambique 6 0.2
Myanmar 4 0.07
Nepal (Republic of) 4 0.14
Rwanda 1 0.08
Solomon Islands 1 1.49
South Sudan 1 0.09
Sudan 1 0.02
Tanzania 6 0.1
Uganda 2 0.05
Vanuatu* 1 3.33
Yemen 1 0.03
Zambia 4 0.22
Total 88 0.11
Note: Data centres connected to the Internet. * Graduated in December 2020.Source: PeeringDB, available at https:// www .peeringdb .com.
Connectivity in the Least Developed Countries: Status report 2021
54
References
Aker, Jenny C. (2010). Information from Markets Near and Far: Mobile Phones and Agricultural Markets in Niger. American Economic Journal, vol. 2, No. 3 (July), pp. 46–49. Available at https:// doi .org/ 10 .1257/ app .2 .3 .46.
Aker, Jenny C., Rachid Boumnijel, Amanda McClelland, and Niall Tierney (2016). Payment Mechanisms and Antipoverty Programs: Evidence from a Mobile Money Cash Transfer Experiment in Niger. Economic Development and Cultural Change, vol. 65, No. 1, pp. 1–37. doi: 10 .1086/ 687578.
Alizila (2018). Alibaba Acquires South Asia E-Commerce Platform Daraz. 8 May. Available at https:// www .alizila .com/ alibaba -acquires -south -asia -e -commerce -platform -daraz/ .
Alliance for Affordable Internet (A4AI) (2020). From Luxury to Lifeline: Reducing the Cost of Mobile Devices to Reach Universal Internet Access. Available at https:// a4ai .org/ research/ from -luxury -to -lifeline -reducing -the -cost -of -mobile -devices -to -reach -universal -internet -access/ .
Asia Foundation (2020). Violent Conflict, Tech Companies, and Social Media in Southeast Asia. Available at https:// asiafoundation .org/ publication/ violent -conflict -tech -companies -and -social -media -in -southeast -asia/ .
Autorité de Régulation des Communications Électroniques et des Postes (ARCEP) (2021a). Données du Marche National de L’internet et des Locations de Capacités. Available at http:// www .arcep .bf/ internet/
(2021b). Données du Marche National de la Téléphonie Mobile. Available at http:// www .arcep .bf/ le -mobile.
Bezzina, Jérôme (2005). Interconnection Challenges in a Converging Environment: Policy Implications for African Telecommunications Regulators. Available at http:// documents .worldbank .org/ curated/ en/ 962421468211775594/ Interconnection -challenges -in -a -converging -environment -Policy -implications -for -African -telecommunications -regulators.
Biryabarema, Elias (2020). MTN Uganda says forcing foreign telcos to list locally may not boost Ugandan ownership. Reuters. 30 January. Available at https:// www .reuters .com/ article/ uganda -telecoms/ mtn -uganda -says -forcing -foreign -telcos -to -list -locally -may -not -boost -ugandan -ownership -idINKBN1ZT1B2.
Chen, Rong, and Michael Minges (2021). Minimum Data Consumption: How Much Is Needed to Support Online Activities, and Is It Affordable? Washington, D.C.: World Bank. 27 January 2021. Available at https:// www .worldbank .org/ en/ topic/ digitaldevelopment/ brief/ minimum -data -consumption -how -much -is -needed -to -support -online -activities -and -is -it -affordable.
Chibuye, Miniva, and Americo B. Zampetti (2018). Enhancing STI in Africa Through the Technology Bank for the LDCs. Occasional Policy Papers Series on the Least Developed Countries. Available at http:// unohrlls .org/ custom -content/ uploads/ 2018/ 11/ Enhancing -STI -in -Africa -through -the -Technology -Bank -5 -July .pdf.

Connectivity in the Least Developed Countries: Status report 2021
55
Concordia (2014). Modernization Through Public–Private Partnership: An Analysis Of Haiti’s Natcom. Available at https:// uploads .concordia .net/ 2014/ 12/ Haiti _Case _Study .pdf.
Cushman and Wakefield (2016). Data Centre Risk Index. Available at https:// verne -global -lackey .s3 .amazonaws .com/ uploads %2F2017 %2F1 %2Fb5e0a0da -5ad2 -01b3 -1eb8 -8f782f22a534 %2FC %26W _Data _Centre+ Risk _Index _Report _2016 .pdf.
Czernich, Nina, Oliver Falck, Tobias Kretschmer, and Ludger Woessmann (2009). Broadband Infrastructure and Economic Growth. SSRN Scholarly Paper No. 2861. 3 December. Rochester, NY: Social Science Research Network. Available at http:// papers .ssrn .com/ abstract = 1516232.
Deloitte (2012). What is the impact of mobile telephony on economic growth? GSM Association. Available at https:// www .gsma .com/ publicpolicy/ wp -content/ uploads/ 2012/ 11/ gsma -deloitte -impact -mobile -telephony -economic -growth .pdf.
Digital Opportunity Trust (2019). Digital Ambassador Program Proof of Concept: Final Evaluation. Available at https:// www .dotrust .org/ media/ 2019/ 06/ 2019 -01 -04 -DAP -Proof -of -Concept -Final -Evaluation -Executive -Summary .pdf.
Dion, Ousmane (2021). Why Ethiopia needs to open its telecom market. Washington, D.C.: World Bank. Available at https:// blogs .worldbank .org/ africacan/ why -ethiopia -needs -open -its -telecom -market ?cid = SHR _BlogSiteShare _EN _EXT.
eBay (2012). Enabling Traders to Enter and Grow on the Global Stage. Available at https:// www .wto .org/ english/ tratop _e/ serv _e/ wkshop _june13 _e/ enabling _traders _e .pdf
(2016). Small Online Business Growth Report: Towards an Inclusive Global Economy. Available at https:// static .ebayinc .com/ static/ assets/ Uploads/ PressRoom/ Local/ Imported/ Small %20Online %20Business %20Growth %20Report .pdf
Endeshaw, Dawit (2021). Consortium led by Safaricom wins Ethiopian operating licence. Reuters. 22 May. Available at https:// www .reuters .com/ article/ ethiopia -telecoms -idCNL2N2N906C.
Food and Agriculture Organization of the United Nations (FAO) (2017). SMS Gateway: Improving animal health through Information and Communication Technologies. Information factsheet. News. 5 April. Available at http:// www .fao .org/ e -agriculture/ news/ sms -gateway -improving -animal -health -through -information -and -communication -technologies.
Foster, Vivien, Niccolò Comini, and Sharada Srinivasan (2021). Improving data infrastructure helps ensure equitable access for poor people in poor countries. 6 May. Washington, D.C.: World Bank. Available at https:// blogs .worldbank .org/ opendata/ improving -data -infrastructure -helps -ensure -equitable -access -poor -people -poor -countries.
GSMA (2017a). Accelerating affordable smartphone ownership in emerging markets. Available at https:// www .gsma .com/ m obileforde velopment/ wp -content/ uploads/ 2018/ 08/ Accelerating -affordable -smartphone -ownership -in -emerging -markets -2017 _we .pdf.
(2017b). Mobile Internet Skills Training Toolkit: Tigo Rwanda Pilot Evaluation. Available at https:// www .gsma .com/ m obileforde velopment/ wp -content/ uploads/ 2018/ 01/ GSMA _mistt -report _R _Web _Public _Spreads .pdf.
Connectivity in the Least Developed Countries: Status report 2021
56
(2019a). Rethinking mobile taxation to improve connectivity. Available at https:// www .gsma .com/ publicpolicy/ wp -content/ uploads/ 2019/ 02/ Rethinking -mobile -taxation -to -improve -connectivity _Feb19 .pdf.
(2019b). Mobile Internet Skills Training Toolkit: Banglalink pilot evaluation. 12 June. Available at https:// www .gsma .com/ m obileforde velopment/ resources/ mobile -internet -skills -training -toolkit -banglalink -pilot -evaluation/ .
Hamdan, Jana (2019). The Impact of Mobile Money in Developing Countries. DIW Roundup, No. 131. Available at https:// www .diw .de/ documents/ publikationen/ 73/ diw _01 .c .669402 .de/ DIW _Roundup _131 _en .pdf.
Hawthorne, Ryan, and Lukasz Grzybowski (2019). Mobile access won’t fix the digital divide. Fixed-line is needed too. The Conversation. 19 November. Available at https:// theconversation .com/ mobile -access -wont -fix -the -digital -divide -fixed -line -is -needed -too -126801.
International Telecommunication Union (ITU) (1995). Telecommunication Indicators for the Least Developed Countries.
(1998). World Telecommunication Development Report: Universal Access. Available at https:// www .itu .int/ ITU -D/ ict/ publications/ wtdr _98/ index .html.
(2018). The economic contribution of broadband, digitization and ICT regulation. Available at https:// www .itu .int/ en/ ITU -D/ Regulatory -Market/ Documents/ FINAL _1d _18 -00513 _Broadband -and -Digital -Transformation -E .pdf.
(2020a). Manual for measuring ICT access and use by households and individuals. Available at https:// www .itu .int/ en/ ITU -D/ Statistics/ Pages/ publications/ manual .aspx.
(2020b). Measuring Digital Development: Facts and figure 2020. Available at https:// www .itu .int/ en/ ITU -D/ Statistics/ Dashboards/ Pages/ IFF .aspx
International Telecommunication Union (ITU) and United Nations Office of the High Representative for the Least Developed Countries, Landlocked Developing Countries and Small Island Developing States (UN-OHRLLS) (2018). ICTs, LDCs and the SDGs: Achieving universal and affordable Internet in the least developed countries. Available at https:// www .itu .int/ en/ ITU -D/ LDCs/ Pages/ ICTs -for -SDGs -in -LDCs -Report .aspx.
International Trade Centre (ITC) (2018). What Sells in E-commerce: New Evidence from Asian LDCs. Available at https:// www .intracen .org/ uploadedFiles/ intracenorg/ Content/ Publications/ AssetImages/ What %20sells %20in %20ecommerce _final _ %20Hi -res .pdf.
Lendle, Andreas, Marcelo Olarreaga, Simon Schropp, and Pierre-Louis Vézina (2012). There Goes Gravity: How eBay Reduces Trade Costs. World Bank Policy Research Working Paper No. 6253. Available at https:// www .researchgate .net/ publication/ 254400967 _There _Goes _Gravity _How _eBay _Reduces _Trade _Costs.
LIRNEasia (2019). AfterAccess: ICT Access and Use in Asia and the Global South. Available at https:// lirneasia .net/ wp -content/ uploads/ 2019/ 05/ LIRNEasia -AfterAccess -Asia -3 .0 -update -28 .05 .2019 .pdf.
Marsh, Jenni (2018). The Chinese phone giant that beat Apple to Africa. CNN. 11 October. Available at https:// edition .cnn .com/ 2018/ 10/ 10/ tech/ tecno -phones -africa/ index .html.

Connectivity in the Least Developed Countries: Status report 2021
57
Maxmen, Amy (2019). Can Tracking People through Phone-Call Data Improve Lives? 29 May 2019. Nature, vol. 569, No. 7758, pp. 614–617. Available at https:// doi .org/ 10 .1038/ d41586 -019 -01679 -5.
McKibben, Bill (2017). The Race to Solar-Power Africa. The New Yorker. 19 June. Available at http:// www .newyorker .com/ magazine/ 2017/ 06/ 26/ the -race -to -solar -power -africa.
MTN Rwanda (2021). Investor Presentation. Available at https:// www .mtn .com/ wp -content/ uploads/ 2021/ 04/ MTN -Rwanda -Investor -presentation .pdf.
Mugisha, Ivan R. (2013). Liquid Telecom acquires Rwandatel assets. The New Times Rwanda. 3 June. Available at http:// www .newtimes .co .rw/ section/ article/ 2013 -06 -03/ 66372/ .
Nixon, Ron (2007). Africa, Offline: Waiting for the Web. The New York Times. 22 July. Available at http:// www .nytimes .com/ 2007/ 07/ 22/ business/ yourmoney/ 22rwanda .html.
Qiang, Christine Zhen-Wei, Carlo Rossotto, and Kaoru Kimura (2009). Economic Impacts of Broadband. In Information and Communications for Development. Washington, D.C.: World Bank. Available at https:// openknowledge .worldbank .org/ handle/ 10986/ 2636
Research ICT Africa (2019). After Access 2018: A demand-side view of mobile Internet from 10 African countries. Available at https:// researchictafrica .net/ 2019 _after -access _africa -comparative -report/ .
Richardson, Erica, Dalhia Aissat, Gemma A. Williams, and Nick Fahy (2020). Keeping What Works: Remote Consultations During the COVID-19 Pandemic. Eurohealth. Available at https:// apps .who .int/ iris/ bitstream/ handle/ 10665/ 336301/ Eurohealth -26 -2 -73 -76 -eng .pdf.
RURA (2007). The Sales and Purchase of 100% shares of TERRACOM sarl and its 99% shares in Rwandatel S.A. 1 August. Available at http:// www .rura .rw/ fileadmin/ docs/ The _Sales _and _Purchase _of _100 .pdf.
Safaricom (2021). Global Partnership for Ethiopia welcomes licence award to operate telecom services in Ethiopia. 24 May. Available at https:// www .safaricom .co .ke/ about/ media -center/ publications/ press -releases/ release/ 1050.
Schroeder, Kateryna, Julian Lampietti, and Ghada Elabed (2021). What's Cooking: Digital Transformation of the Agrifood System. Washington, D.C.: World Bank. Available at https:// openknowledge .worldbank .org/ handle/ 10986/ 35216.
Sey, A., C. Coward, F. Bar, G. Sciadas, C. Rothschild, and L. Koepke (2013). Connecting people for development: Why public access ICTs matter. Available at https:// tascha .uw .edu/ publications/ connecting -people -for -development/ .
Silver, Laura, and Aaron Smith (2019). In some countries, many use the internet without realizing it. Pew Research Center. 2 May. Available at https:// www .pewresearch .org/ fact -tank/ 2019/ 05/ 02/ in -some -countries -many -use -the -internet -without -realizing -it/ .
Srinivasan, Sharada, Niccolo Comini, and Michael Minges (2021). The Importance of National Data Infrastructure in Low- and Middle-income Countries. Policy Research Conference on Communications, Information and the Internet (TPRC49).

Connectivity in the Least Developed Countries: Status report 2021
58
TeleGeography (2007). LapGreen to buy Rwandatel stake for USD 100 million. COMMSUPDATE. 15 October. Available at https:// www .telegeography .com/ products/ commsupdate/ articles/ 2007/ 10/ 15/ lapgreen -to -buy -rwandatel -stake -for -usd100 -million/ .
United Nations (2011). Programme of Action for the Least Developed Countries for the Decade 2011–2020. In Fourth United Nations Conference on the Least Developed Countries. Istanbul. Available at https:// documents -dds -ny .un .org/ doc/ UNDOC/ GEN/ N11/ 376/ 42/ PDF/ N1137642 .pdf ?OpenElement.
(2020). Implementation of the Programme of Action for the Least Developed Countries for the Decade 2011–2020. Available at http:// unohrlls .org/ custom -content/ uploads/ 2020/ 04/ English _SG -report .pdf.
(2021). State Of The Least Developed Countries 2021: Building back better in response to COVID-19. Available at https:// www .un .org/ ldc5/ stateLDC _2021.
United Nations Conference on Trade and Development (UNCTAD) (2019). Rapid ETrade Readiness Assessments of Least Developed Countries: Policy Impact and Way Forward. Available at https:// unctad .org/ system/ files/ official -document/ dtlstict2019d7 _en .pdf.
(2020a). The Least Developed Countries Report: Productive Capacities for the New Decade. Available at https:// unctad .org/ webflyer/ least -developed -countries -report -2020.
(2020b). COVID-19 and e-commerce: impact on businesses and policy responses. https:// unctad .org/ webflyer/ covid -19 -and -e -commerce -impact -businesses -and -policy -responses.
(2021a). UNCTAD B2C E-Commerce Index 2020: Spotlight on Latin America and the Caribbean. Available at https:// unctad .org/ webflyer/ unctad -b2c -e -commerce -index -2020 -spotlight -latin -america -and -caribbean.
(2021b). COVID-19 and E-commerce: A Global Review. Available at https:// unctad .org/ system/ files/ official -document/ dtlstict2020d13 _en .pdf.
United Nations Economic and Social Commission for Asia and the Pacific (ESCAP) (2018). Leveraging E-Commerce for Graduation of Least Developed Countries. Available at https:// www .unescap .org/ sites/ default/ files/ CTI _4 _item %205 %20 - %20Leveraging %20e -commerce _E .pdf.
United Nations Human Rights Council (2018). Report of the independent international fact-finding mission on Myanmar. A/HRC/39/64. 12 September. Available at https:// www .ohchr .org/ Documents/ HRBodies/ HRCouncil/ FFM -Myanmar/ A _HRC _39 _64 .pdf.
United Nations Office of the High Representative for the Least Developed Countries, Landlocked Developing Countries and Small Island Developing States (UN-OHRLLS) (2018). Broadband for National Development in Four LDCs: Cambodia, Rwanda, Senegal, Vanuatu. Available at https:// www .un .org/ ohrlls/ news/ broadband -national -development -four -ldcs -cambodia -rwanda -senegal -vanuatu -2018.
Vodacom (2021). Vodacom’s contribution to the United Nations Sustainable Development Goals 2020. Available at https:// www .vodacom .com/ e -books/ vodacom -un -sdgs -report/ 2/ .
Wang, Tengfei, and Jong Woo Kang (2020). An integrated approach for assessing national e-commerce performance. Trade, Investment and Innovation Working Paper Series, No.
Connectivity in the Least Developed Countries: Status report 2021
59
01/20. ESCAP Trade, Investment and Innovation Division. January. Available at https:// www .unescap .org/ publications/ integrated -approach -assessing -national -e -commerce -performance.
Wargny, M., L. Kleinebreil, S.N. Diop, and others (2018). SMS-based intervention in type 2 diabetes: clinical trial in Senegal. BMJ Innovations, No. 4, pp. 142–146. Available at https:// innovations .bmj .com/ content/ 4/ 3/ 142.
World Bank (2018). Innovative Business Models for Expanding Fiber-Optic Networks and Closing the Access Gaps. Washington, D.C.: World Bank. Available at https:// documents1 .worldbank .org/ curated/ en/ 142601581916862980/ pdf/ Overview .pdf.
(2019). Future of Food: Harnessing Digital Technologies to Improve Food System Outcomes. Washington, D.C.: World Bank. Available at https:// openknowledge .worldbank .org/ handle/ 10986/ 31565.
(2020). Rapid Information from Household High-Frequency Monitoring: Summary of Results from Round 2. Myanmar COVID-19 Monitoring, No. 4. Washington, D.C.: World Bank. Available at https:// openknowledge .worldbank .org/ handle/ 10986/ 34547.
World Bank, and Alibaba Group (2019). E-Commerce Development: Experience from China. Available at https:// www .worldbank .org/ en/ news/ press -release/ 2019/ 11/ 23/ e -commerce -can -boost -job -creation -and -inclusive -growth -in -developing -countries.
World Benchmarking Alliance (2020). Digital Inclusion Benchmark Synthesis Report. Available at https:// www .world benchmarki ngalliance .org/ research/ synthesis -report -digital -inclusion -benchmark -2020/ .
(2021). 50 more tech companies to be ranked in Digital Inclusion Benchmark. 27 April. Available at https:// www .world benchmarki ngalliance .org/ news/ 50 -more -tech -companies -to -be -ranked -in -digital -inclusion -benchmark/ .
World Health Organization (WHO) (2020). ITU-WHO Joint Statement: Unleashing information technology to defeat COVID-19. Available at https:// www .who .int/ news/ item/ 20 -04 -2020 -itu -who -joint -statement -unleashing -information -technology -to -defeat -covid -19.
Office of the Director International Telecommunication Union (ITU) Telecommunication Development Bureau (BDT) Place des Nations CH-1211 Geneva 20 Switzerland
Office of Deputy Director and Regional Presence Field Operations Coordination Department (DDR) Place des Nations CH-1211 Geneva 20 Switzerland
Email: [email protected] Email: [email protected] Tel.: +41 22 730 5035/5435 Tel.: +41 22 730 5131 Fax: +41 22 730 5484 Fax: +41 22 730 5484 Digital Networks and Society (DNS) Digital Knowledge Hub Department
(DKH) Partnerships for Digital Development Department (PDD)
Email: [email protected] Email: [email protected] Email: [email protected] Tel.: +41 22 730 5421 Tel.: +41 22 730 5900 Tel.: +41 22 730 5447 Fax: +41 22 730 5484 Fax: +41 22 730 5484 Fax: +41 22 730 5484 Africa
Ethiopia Cameroon Senegal Zimbabwe International Telecommunication Union (ITU) Regional Office Gambia Road Leghar Ethio Telecom Bldg. 3rd floor P.O. Box 60 005 Addis Ababa Ethiopia
Union internationale des télécommunications (UIT) Bureau de zone Immeuble CAMPOST, 3e étage Boulevard du 20 mai Boîte postale 11017 Yaoundé Cameroon
Union internationale des télécommunications (UIT) Bureau de zone 8, Route des Almadies Immeuble Rokhaya, 3e étage Boîte postale 29471 Dakar - Yoff Senegal
International Telecommunication Union (ITU) Area Office TelOne Centre for Learning Corner Samora Machel and Hampton Road P.O. Box BE 792 Belvedere Harare Zimbabwe
Email: [email protected] Email: [email protected] Email: [email protected] Email: [email protected] Tel.: +251 11 551 4977 Tel.: + 237 22 22 9292 Tel.: +221 33 859 7010 Tel.: +263 4 77 5939 Tel.: +251 11 551 4855 Tel.: + 237 22 22 9291 Tel.: +221 33 859 7021 Tel.: +263 4 77 5941 Tel.: +251 11 551 8328 Fax: + 237 22 22 9297 Fax: +221 33 868 6386 Fax: +263 4 77 1257 Fax: +251 11 551 7299 Americas
Brazil Barbados Chile Honduras União Internacional de Telecomunicações (UIT) Escritório Regional SAUS Quadra 6 Ed. Luis Eduardo Magalhães, Bloco “E”, 10º andar, Ala Sul (Anatel) CEP 70070-940 Brasilia - DF Brazil
International Telecommunication Union (ITU) Area Office United Nations House Marine Gardens Hastings, Christ Church P.O. Box 1047 Bridgetown Barbados
Unión Internacional de Telecomunicaciones (UIT) Oficina de Representación de Área Merced 753, Piso 4 Santiago de Chile Chile
Unión Internacional de Telecomunicaciones (UIT) Oficina de Representación de Área Colonia Altos de Miramontes Calle principal, Edificio No. 1583 Frente a Santos y Cía Apartado Postal 976 Tegucigalpa Honduras
Email: [email protected] Email: [email protected] Email: [email protected] Email: [email protected] Tel.: +55 61 2312 2730-1 Tel.: +1 246 431 0343 Tel.: +56 2 632 6134/6147 Tel.: +504 2235 5470 Tel.: +55 61 2312 2733-5 Fax: +1 246 437 7403 Fax: +56 2 632 6154 Fax: +504 2235 5471 Fax: +55 61 2312 2738 Arab States Asia-Pacific CIS Egypt Thailand Indonesia Russian Federation International Telecommunication Union (ITU) Regional Office Smart Village, Building B 147, 3rd floor Km 28 Cairo Alexandria Desert Road Giza Governorate Cairo Egypt
International Telecommunication Union (ITU) Regional Office Thailand Post Training Center 5th floor 111 Chaengwattana Road Laksi Bangkok 10210 Thailand Mailing address: P.O. Box 178, Laksi Post Office Laksi, Bangkok 10210, Thailand
International Telecommunication Union (ITU) Area Office Sapta Pesona Building 13th floor JI. Merdan Merdeka Barat No. 17 Jakarta 10110 Indonesia Mailing address: c/o UNDP – P.O. Box 2338 Jakarta 10110, Indonesia
International Telecommunication Union (ITU) Regional Office 4, Building 1 Sergiy Radonezhsky Str. Moscow 105120 Russian Federation
Email: [email protected] Email: [email protected] Email: [email protected] Email: [email protected] Tel.: +202 3537 1777 Tel.: +66 2 575 0055 Tel.: +62 21 381 3572 Tel.: +7 495 926 6070 Fax: +202 3537 1888 Fax: +66 2 575 3507 Tel.: +62 21 380 2322/2324 Fax: +62 21 389 5521 Europe
Switzerland International Telecommunication Union (ITU) Office for Europe Place des Nations CH-1211 Geneva 20 Switzerland
Email: [email protected] Tel.: +41 22 730 5467 Fax: +41 22 730 5484

International Telecommunication
UnionPlace des Nations
CH-1211 Geneva 20Switzerland
Published in SwitzerlandGeneva, 2021
Photo credits: Shutterstock
ISBN: 978-92-61-35001-7
9 7 8 9 2 6 1 3 5 0 0 1 7