
Connecting Water and Energy -...
20
9/12/2006 11:49 AM metis\Roadshow Presentation\07 Roadshow Secondary Follow On Nalco.ppt 1 William J. Roe Executive Vice President and Chief Operating Officer President, Industrial and Institutional Services Division September 2006 Connecting Water and Energy
Transcript of Connecting Water and Energy -...

9/12/2006 11:49 AM metis\Roadshow Presentation\07 Roadshow Secondary Follow On
Nalco.ppt
1
William J. RoeExecutive Vice President and Chief Operating Officer
President, Industrial and Institutional Services Division
September 2006
Connecting Water and Energy

2
This presentation includes “forward-looking statements” within the meaning of Section 27A of the Securities Act of 1933 and Section 21E of the Securities Exchange Act of 1934. These forward-looking statements include statements concerning our plans, objectives, goals, strategies, future events, future revenue or performance, capital expenditures, financing needs, plans or intentions relating to acquisitions, business trends and other information that is not historical information. When used in this presentation, the words “estimates,” “expects,” “anticipates,” “projects,” “plans,” “intends,” “believes,” “forecasts,” or future or conditional verbs, such as “will,” “should,” “could” or “may,” and variations of such words or similar expressions are intended to identify forward-looking statements. All forward-looking statements, including, without limitation, management’s examination of historical operating trends and data are based upon our current expectations and various assumptions. Our expectations, beliefs and projections are expressed in good faith and we believe there is a reasonable basis for them. However, there can be no assurance that management’s expectations, beliefs and projections will be achieved.
There are a number of risks and uncertainties that could cause our actual results to differ materially from the forward-looking statements contained in this presentation. Important factors that could cause our actual results to differ materially from the forward-looking statements we make in this presentation. Such risks, uncertainties and other important factors include, among others: our substantial leverage; limitations on flexibility in operating our business contained in our debt agreements; increases in interest rates as a result of our variable rate indebtedness; pricing pressure from our customers; technological change and innovation; risks associated with our non-U.S. operations; fluctuations in currency exchange rates; high competition in the markets in which we operate; adverse changes to environmental, health and safety regulations; operating hazards in our production facilities; inability to achieve expected cost savings; difficulties in securing the raw materials we use; our significant pension benefit obligations and the current underfunding of our pension plans; our ability to realize the full value of our intangible assets; our ability to attract and retain skilled employees, particularly research scientists, technical sales professionals and engineers; our ability to protect our intellectual property rights; and the possibility that our owners’ interests will conflict with ours. There may be other factors that may cause our actual results to differ materially from the forward-looking statements.
All forward-looking statements attributable to us or persons acting on our behalf apply only as of the date of this presentation and are expressly qualified in their entirety by the cautionary statements included in this presentation. We undertake no obligation to update or revise forward-looking statements which may be made to reflect events or circumstances that arise after the date made or to reflect the occurrence of unanticipated events.
Non-GAAP measures may be discussed in today’s presentation. Management believes that discussion of these measures provides investors with additional insight into the ongoing operations of Nalco Holding Company. Non-GAAP measures are reconciled to the closest GAAP measure in schedules attached to our earnings releases, which may be found at www.nalco.com. Adjusted EBITDA is a non-GAAP measure used to determine compliance with the Company’s debt covenants. Free Cash Flow is defined as Cash from Operations less Capital Expenditures and Minority Interest charges. In addition, Nalco discusses sales growth in terms of nominal (actual), organic (nominal less foreign currency and acquisition/divestiture/merger/joint venture impacts), and real (organic growth less that portion of the growth which consists of price increases that simply pass along higher raw and purchased material costs). The non-GAAP measures should not be viewed as an alternative to GAAP measures of performance. Furthermore, these measures may not be consistent with similar measures provided by other companies.
Forward-Looking Statements and Regulation G

3
Industrial Water TreatmentSpace Remains Competitive
• Market expands from $15.2 billion in 2003 to $17.7 billion in 2005
– Cost-based pricing plays key role• Modest share expansion• Consolidation remains key 2006
water treatment trend– Water treatment chemicals &
services• Kemira -- Cytec (July)• Ashland -- Degussa (May) and
Eurocal SAS (June)– Paper chemicals and services
• Kemira – Lanxess (April)– Equipment providers also continue
acquisitions*• Dow Water Solutions -- Zhejiang
Omex (July)• ITT -- F.B. Leopold Co. (June)• GE Water -- ZENON (June)• Siemens -- Monosep (January)
Nalco
GE Water
Hercules
Ciba
Baker Petrolite
Kemira
All Other
Buckman
Kurita
EKAChampion
Drew (Ashland)
BASFChemtreat
* Equipment sales and some process industries are excluded from Nalco’s market size and share analysis. See 10-K reports and stock offeringprospecti for additional information on market sizing and share analysis

4
Nalco’s water treatment expertise enables industrial and institutional customers to
significantly improve the energy efficiency of their operations . . . while enabling energy
producers to more efficiently develop current and new sources of energy
5
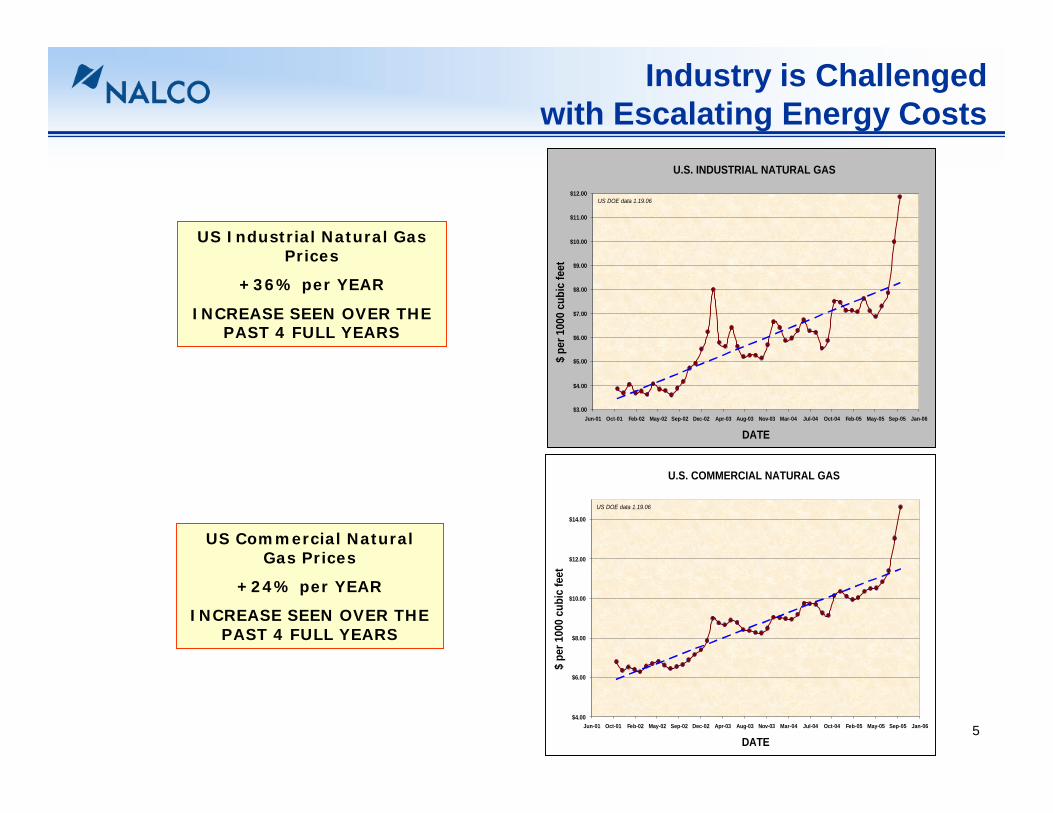
U.S. COMMERCIAL NATURAL GAS
$4.00
$6.00
$8.00
$10.00
$12.00
$14.00
Jun-01 Oct-01 Feb-02 May-02 Sep-02 Dec-02 Apr-03 Aug-03 Nov-03 Mar-04 Jul-04 Oct-04 Feb-05 May-05 Sep-05 Jan-06
DATE
$ pe
r 100
0 cu
bic
feet
US DOE data 1.19.06
U.S. INDUSTRIAL NATURAL GAS
$3.00
$4.00
$5.00
$6.00
$7.00
$8.00
$9.00
$10.00
$11.00
$12.00
Jun-01 Oct-01 Feb-02 May-02 Sep-02 Dec-02 Apr-03 Aug-03 Nov-03 Mar-04 Jul-04 Oct-04 Feb-05 May-05 Sep-05 Jan-06
DATE
$ pe
r 100
0 cu
bic
feet
US DOE data 1.19.06
US Industrial Natural Gas Prices
+36% per YEAR
INCREASE SEEN OVER THE PAST 4 FULL YEARS
US Commercial Natural Gas Prices
+24% per YEAR
INCREASE SEEN OVER THE PAST 4 FULL YEARS
Industry is Challengedwith Escalating Energy Costs
6
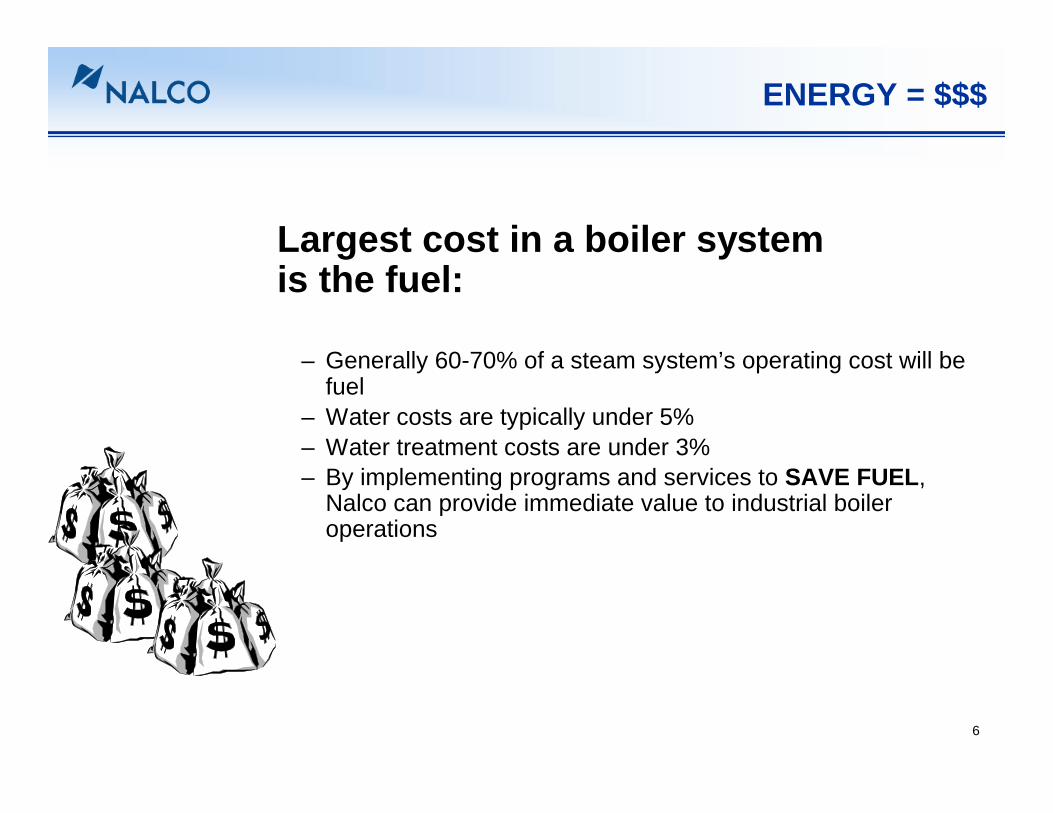
– Generally 60-70% of a steam system’s operating cost will be fuel
– Water costs are typically under 5%– Water treatment costs are under 3%– By implementing programs and services to SAVE FUEL,
Nalco can provide immediate value to industrial boiler operations
Largest cost in a boiler systemis the fuel:
ENERGY = $$$
7
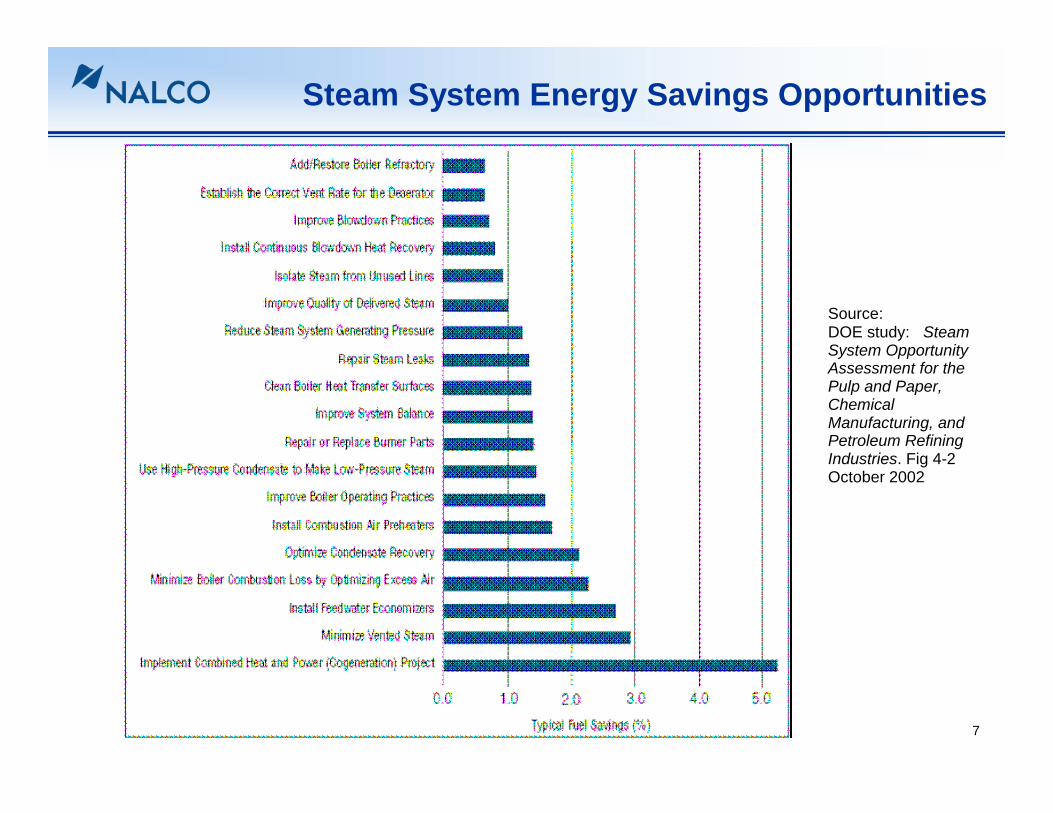
Source:DOE study: Steam System Opportunity Assessment for the Pulp and Paper, Chemical Manufacturing, and Petroleum Refining Industries. Fig 4-2October 2002
Steam System Energy Savings Opportunities

8
Steam Generation Systems
0.00.51.01.52.02.53.03.5
Effe
ctiv
eS
team
Tra
pM
aint
enan
ce
Opt
imiz
eE
xces
s A
irto
Min
imiz
eS
tack
Los
s
Impr
oved
Con
dens
ate
Rec
over
y
Impr
ove
Wat
erTr
eatm
ent
Mai
ntai
nC
lean
Fire
side
Tub
eS
urfa
ces
Rep
air
Ste
am L
eaks
Impr
ove
Ste
amQ
ualit
y
Impr
ove
Blo
wdo
wn
Pra
ctic
es
Inst
all
Blo
wdo
wn
Hea
tR
ecov
ery
Opt
imiz
eD
eaer
ator
Ven
ting
Pote
ntia
l Fue
ls S
avin
gs %
Source: Department of Energy study: Steam System Opportunity Assessment for the Pulp and Paper, Chemical Manufacturing, and Petroleum Refining Industries, October 2002
Corrosion Control
Boiler Treatment
Best Practices & Automation
Corrosion Control
Fireside Treatment
Fireside Treatment
Boiler Treatment
Best Practices & Automation
Advanced Monitoring & Control
Nalco Impacts Energy Savings Opportunities
9
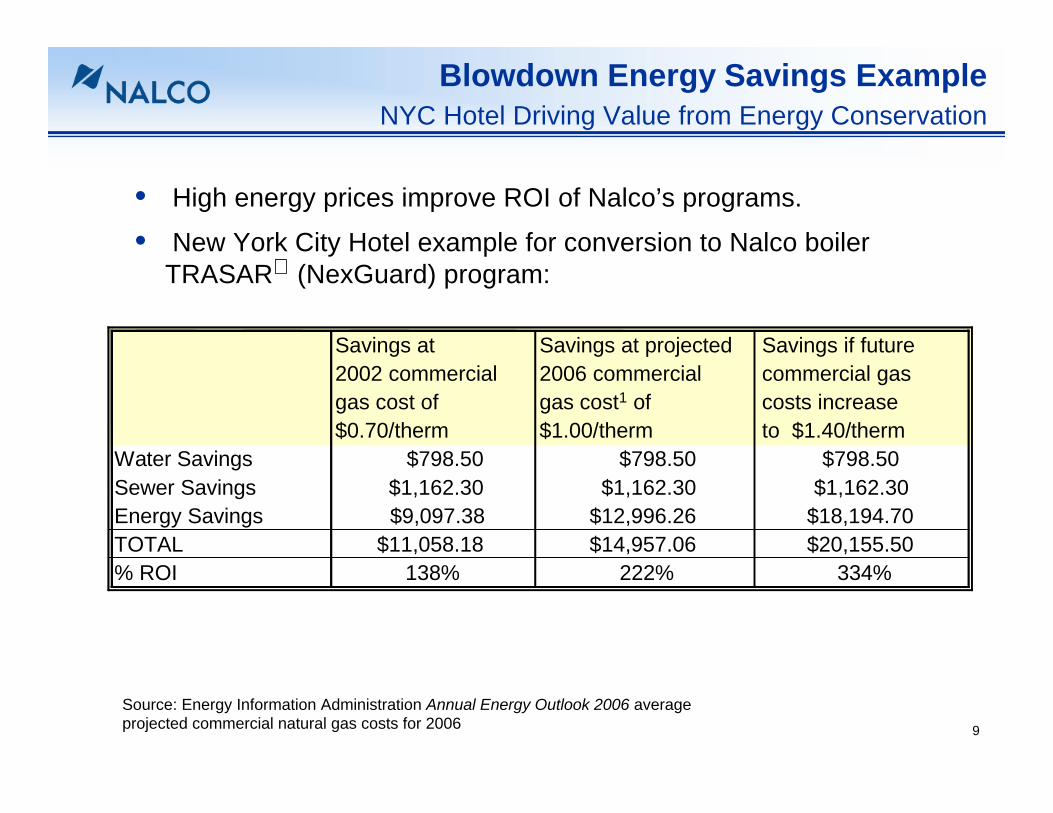
• High energy prices improve ROI of Nalco’s programs.
• New York City Hotel example for conversion to Nalco boiler TRASAR (NexGuard) program:
Savings at 2002 commercial gas cost of $0.70/therm
Savings at projected 2006 commercial gas cost1 of $1.00/therm
Savings if future commercial gascosts increase to $1.40/therm
Water Savings $798.50 $798.50 $798.50Sewer Savings $1,162.30 $1,162.30 $1,162.30Energy Savings $9,097.38 $12,996.26 $18,194.70TOTAL $11,058.18 $14,957.06 $20,155.50% ROI 138% 222% 334%
Blowdown Energy Savings ExampleNYC Hotel Driving Value from Energy Conservation
Source: Energy Information Administration Annual Energy Outlook 2006 average projected commercial natural gas costs for 2006

10
Mineral Scale Corrosion
Microbial Fouling
When stress on a cooling system is too high, operational problems result.
Cooling System StressesCause Operating Problems
• High Stress Causes:– Scale– Corrosion– Fouling
• Low Stress Causes– High water costs– High chemical costs

11
Maintenance and Electricity
-
0.2
0.4
0.6
0.8
1.0
1.2
1.4
1.6
1.8
CaCO3 CaSO4 Ca3(PO4)2 Fe2 Biofilm
Ther
mal
Con
duct
ivity
(BTU
/hr f
t)
Biofilms increase
electrical costs and contribute to corrosion: a
very serious combination.

12
KNOWLEDGE
Corrosion
ScaleMicrobio
variability24/7 performance
Reduced Total Cost of
Operation
Nalco’s 3D TRASAR
cooling water stress management program enables companies to use significantly less energy to cool their systems, using automated monitoring and control to reduce performance variability.
Leading-edge automated control

13
3D TRASAR Progress
•As of the end of June, more than 2,500 units have been installed around the world.
•About 20% of the installations are new Nalco customers.
•Conversions of existing customers to 3D TRASAR technology result in higher customer satisfaction levels.
•Relatively small portion of the current Nalco customer base has converted – much more opportunity.

14
Next Step: Boiler Automation
• Global sold market for Boiler Water Treatment is approximately $1.25 Billion.
• Strong market share.
• Technology scope: New chemistry, performance sensors, control software, and wireless communication to enable complete automation of boiler treatment.
• Customer benefits: -Improved boiler reliability-Safer boiler operation-Reduced operating costs
15
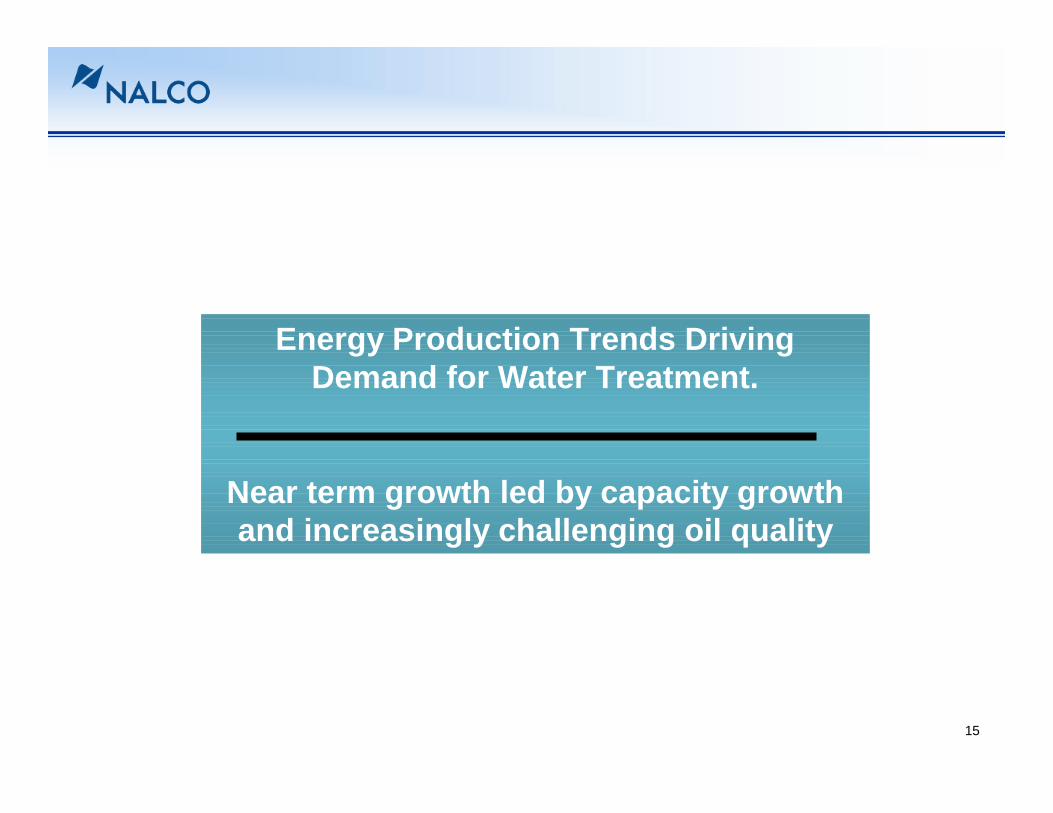
Energy Production Trends Driving Demand for Water Treatment.
Near term growth led by capacity growth and increasingly challenging oil quality

16
Energy Demand Growth - Refining
• Capacity growth historically less than demand
• From 2006 capacity additions will outstrip demand
• All regions will benefit• NA by expansion of existing
capacity• Greenfield sites in AP, LA
and EAME
30,000
40,000
50,000
60,000
70,000
80,000
90,000
1965 1969 1973 1977 1981 1985 1989 1993 1997 2001 2005E
Consumption World Refining CapacityWorld
Crude Oil Production
Excess Refining CapacityBPD
(1,000)
78
80
82
84
86
88
90
92
94
96
2005 2006 2007 2008 2009 2010 2011
Mill
ion
BO
PD
0
0.5
1
1.5
2
2.5
% In
crea
se
BOPD % Increase
Oil Demand Increase
Sources: Energy Information Administration and other industry data

17
Oil and gas demandMillions of barrels of oil equivalent a day
0
ExistingProduction
New
40
80
120
160
1980 1990 2000 2010
ExistingProduction
NewProduction
“The easiest way to grow is to show up where growth is going to happen.”
Ultimate Reserves
Middle East
Russia
Heavy Oil
Gas
Deepwater
Caspian
875M$
“New Oil” Often More Difficult to Treat
392M$
2006
2010
Ultimate Reserves
Middle East
RussiaHeavy OilCaspian
Deepwater
Gas
98 00 02 04 06 08 10Deepwater
Caspian
Heavy Oil
Gas
Russia
Growth Step Out Projects“Focus à Critical Mass à Execution”
Source: Exxon Mobil Corporation and management estimates

18
Energy Water Nexus – DOE National Lab View
• Many newer energy technologies will be more water intensive
• Biofuels and hydrogen require significantly more water than fossil transportation fuels.
• 2-10 gallons of water used per gallon of ethanol refined
• Constraints will grow for power plant siting because of water for cooling needs, advanced scrubbing and CO2removal.
• Final report to Congress expected this month
Gallons/MMBTUth
1 10 100 1000 10000
Natural gasprocessing
Coalmining
Hydrogenreforming
Biodieselprocessing
Oilrefining
Ethanolprocessing
Oilsands
Enhancedoil recovery
Source: Department of Energy “Energy-Water Science & Technology Research Roadmap” presentation Expected water use

19
Conclusion
• Futures of water and energy are inextricably linked.
• Ability to re-use industrial and energy production water for other purposes becoming of increasing importance in many areas of the United States and many regions of the world.
• Energy industries expected to lead expansion in water treatment demand at least through the end of the decade.
• Overlapping water and energy expertise offers the best opportunity to improve efficient use of these valuable natural resources.

9/12/2006 11:49 AM metis\Roadshow Presentation\07 Roadshow Secondary Follow On
Nalco.ppt
20


