Condition of Children Birth to Age Five and Status of Early Childhood Services in California Full
219
Condition of Children Birth to Age Five and Status of Early Childhood Services in California Synthesis of Recent Research AUGUST 2012 Prepared for Prepared by California Department of Education American Institutes for Research Child Development Division
Transcript of Condition of Children Birth to Age Five and Status of Early Childhood Services in California Full

Condition of Children Birth to Age Five and Status of Early Childhood Services in California
Synthesis of Recent Research
AuguSt 2012
Prepared for Prepared by
California Department of Education American Institutes for Research Child Development Division

Condition of Children Birth to Age Five and Status of Early Childhood Services in California
Contents 1 Purpose of Report
1 Background
1 Achievement gap
1 Early Roots of Achievement gap
2 Promise of Early Learning Services in Reducing gap
3 Organization of Report
4 Section I: Overview of Conditions for Children Birth to Age Five in California
4 Population of Young Children
5 Family Risk Factors
7 Other Family Risk Factors
9 Dual Language Learners
11 Community Risk Factors
13 Health and Special Needs Factors
15 Multiple Risk Factors
16 Risks and Opportunities
17 Section II: Recent Findings and Recommendations on Early Learning and Care Services
17 How We Selected the Research and Policy Analyses
18 Access to Early Learning and Care
25 Program Quality Assessment
33 Family Engagement
37 Early Childhood Workforce Development
46 Dual Language Learners
49 Developmental Screening
50 Assistance to Children with Special Needs
50 Key Findings
51 Early Childhood Mental Health/Behavioral Health Services
53 Child Assessment to Support School Readiness
54 Effective Practices for Child Data
55 Recommendations
57 Facilities
59 Food and Nutrition
63 Kindergarten transition
65 Finance, governance, and Other Systems Issues
68 Summary of Research Findings and Recommendations on Early Learning and Care
71 Section III: Research Summary Tables by Topic
202 References

1 American Institutes for Research
Condition of Children Birth to Age Five and Status of Early Childhood Services in California
Purpose of Report the federal Head Start Act requires California to maintain a State Advisory Council on Early Childhood Education and Care (42 u.S.C. §9837b). the Act identifies numerous responsibilities for the Council, including conducting a periodic statewide needs assessment; identifying opportunities for collaboration; recommending strategies for increasing the overall participation of children in early education and care, including underrepresented and special populations; assessing the capacity of higher education to support the development of early childhood educators; and developing recommendations regarding professional development and career advancement, statewide early learning standards, and the establishment of a unified data system. the u.S. Department of Health and Human Services (HHS) allocated $10.8M in startup funds to California to support its work on these recommendations and other related projects. to fulfill its federal obligation—and to seek greater coherence in a system with many different parts— California is developing a comprehensive statewide plan for an integrated early learning system, the “California Comprehensive Early Learning Plan” (CCELP), that includes strategies for coordinating early care and education programs with health services. this report, by the American Institutes for Research (AIR), analyzes existing research on the condition of California’s young children and the status of the state’s early childhood services, thereby providing a baseline to help inform the
state’s development of the CCELP.
Background Interest in the development of a comprehensive early learning plan in California is grounded in three realities: California’s school children are falling behind on many educational standards; the roots of the achievement gap start long before children enter kindergarten; and quality early learning programs have been found to reduce the achievement gap.
Achievement gap
More than half of the third graders in California do not meet state educational standards in English language arts, and almost one child in three does not meet standards in mathematics (CDE, 2011). Although a substantial percentage of all children fall short on these standards, some groups of students fall short by much wider margins. For example, 70 percent of English learners and students whose parents did not graduate from high school do not meet state English/language arts standards in second grade; the proportions for black, Hispanic, and economically disadvantaged students are similarly high (Cannon & Karoly, 2007).
Early Roots of Achievement gap
the achievement gaps do not suddenly materialize as children continue through school (California Early Learning Quality System Advisory Committee, 2010). Rather, disparities in early vocabulary growth between children from low socioeconomic status (SES) and high SES families can manifest themselves in children as early as 16 months of age (Hart & Risley, 1995) (see Exhibit 1). Differences in language, social, and pre-mathematics skills are already apparent when children

2 American Institutes for Research
Condition of Children Birth to Age Five and Status of Early Childhood Services in California
enter kindergarten, and the children who start behind tend to stay behind (Cannon & Karoly, 2007). this early achievement gap is a critical issue for educators, as language proficiency and early literacy development are strong indicators for later school success.
Promise of Early Learning Services in Reducing gap
For children at risk of falling behind in school, attending a quality early learning and care program for preschool-age children has been found to help improve their readiness for school and for school success through higher test scores, better attendance, and reduced grade-level retention (Karoly & Bigelow, 2005; Reynolds et al., 2007). Other lasting benefits include higher rates of high school completion, greater likelihood of attending college, and greater lifetime earnings (Karoly, Kilburn, & Cannon, 2005; Reynolds & Ou, 2011). By reducing grade retention, use of special education and welfare, and involvement in crime, these quality programs are estimated to save from $4 to $17 for every dollar invested (Karoly & Bigelow, 2005; Reynolds et al., 2007; Schweinhart, 2004).
the benefits of attending a high quality early learning program are not limited to preschool-age children: High quality, center-based care with a substantial parent engagement component has been shown to benefit infants and toddlers, particularly those at high risk because of maternal depression, low birth weight, or low parental income and education (Campbell, Ramey, Pungello, Sparling, & Miller-Johnson, 2002; Honig, 2004; Lally, Mangione, & Honig, 1988). Educare, a high quality program financed by a private-public partnership, offers full-day, full-year services to children from very-low-income families from six weeks old to kindergarten. A recent study of the program, which is scheduled to soon offer centers in 10 locations across the nation (including two in California), showed that the children who entered the program between birth and two years old exceeded the national average on measures of school readiness (Yazejian & Bryan, 2009).
Exhibit 1. Roots of the Achievement Gap
¡ Roots of the achievement gap start long before children
enter kindergarten.
¡ A major indicator for later school success is language
and early literacy development, and disparities in early
vocabulary growth between children from low socioeconomic
status (SES) and high SES families can manifest themselves
in children as early as 16 months of age.
¡ Differences in language, social, and pre-mathematics skills
are apparent when children enter kindergarten, and the
children who start school behind tend to stay behind
(Cannon & Karoly, 2007).
Disparities in Early Vocabulary Growth, by Socioeconomic Status
Source: Center on the Developing Child at Harvard University (2007). A Science-Based Framework for Early Childhood Policy: Using Evidence to Improve Outcomes in Learning, Behavior, and Health for Vulnerable Children.

3 American Institutes for Research
Condition of Children Birth to Age Five and Status of Early Childhood Services in California
Organization of Report
We have divided this report into three sections.
Section I provides an overview of conditions for all children birth to age five1 in California, based
on existing publicly available data and analyses, with a special focus on several “subgroups”
under federal education law—particularly those whose K–12 performance is below the state
average. this section includes population projections through 2020, and highlights the extraordinary
diversity of California’s population, the large number of children whose home language is not
English, the high rate of poverty, and a range of child health and welfare factors that may put
children at risk of poor academic performance. to supplement statewide findings on the condition
of California’s young children, an appendix provides county-by-county profiles on key demographic
and risk factors.
Section II provides an overview of key issues, findings, and recommendations from recent research
and policy analyses on the status of early childhood services in California for infants, toddlers,
and preschool-age children. the focus is broad, including access and quality, family engagement,
workforce development, dual language learners, developmental screening, services to children
with special needs, early childhood mental health/behavioral health, child assessment to support
school readiness, effective data practices, status of facilities, food and nutrition, kindergarten
transition practices, and systems and governance issues. Overall, the section is based on a review
of 81 California-based reports and studies since 2000, and draws on additional studies from other
states relevant to finance, governance, and other systems issues.
Section III offers more detailed summaries of specific findings and recommendations from the
above 81 California-based reports and studies on the above elements of early learning and care.
For each study, we describe the methodology used in the research or policy analysis, and list the
authors and, where applicable, the sponsoring agency.
Note that the first section of this report summarizes data from multiple sources for different age groups of children. Wherever possible, we present statistics for children under age five, but in some cases, data are only available for a subset of children under five, or for a larger group of children.
1

American Institutes for Research
Condition of Children Birth to Age Five and Status of Early Childhood Services in California
Section I: Overview of Conditions for Children Birth to Age Five in California In this section, we summarize what is known about the condition of children in California, including
the size of the current and projected population, and the number and percentage of children who
have various risk factors for poor school performance, including (1) family risk factors, the greatest
of which is poverty; (2) community academic risk factors; and (3) health and special needs factors.
Population of Young Children
the first step in developing a comprehensive early learning plan for California is to consider the
current size of the population of young children and the projected population growth. In 2010,
California was home to approximately 2.77 million children aged birth to five in California (California
Department of Finance, 2007). California’s population has grown quickly for many decades; however,
according to the Public Policy Institute of Ca lifornia, over the past 20 years, California experienced
its slowest rates of growth ever recorded, as many families migrated to other states. From 2000
to 2010, California’s population grew by 10 percent, which, while low for the state, was still higher
than the national average (9.7 percent). According to California’s Department of Finance (DoF), the
state’s population is projected to grow from 39.1 million people in 2010 to 44.1 million in 2020.
the number of children under the age of 5, according to DoF, is projected to grow from 2.77 million
in 2010 to 3.24 million in 2020, an increase of 17 percent. Even if the rate of growth declines
somewhat, California is likely to remain home to more young children than any other state—
roughly 13 percent of the children in the united States (State of California, 2011). the sheer
number of young children in California underscores the importance of their wellbeing to the future
of the state and the nation.
Exhibit 2. Number of Children 0-4, 2010 and 2020 (Projected), California Department of Finance
4,000,000
3,000,000 3,240,000
2,770,000 17% increase 2,000,000
1,000,000
0 2010 2020
Nationally, almost 64 percent of mothers with children under six were in the labor force in 2011
(Bureau of Labor Statistics, 2011). In California, approximately 34.3 percent of children under six
live in families where both parents work (or, in single parent families, where that parent works).
this percentage is slightly higher for preschoolers (35.3 percent) and slightly lower for infants
and toddlers (33.6 percent) (AIR analysis of American Community Survey data, u.S. Census).
Many of California’s children have family or health characteristics that put them at risk of poor
4

5 American Institutes for Research
Condition of Children Birth to Age Five and Status of Early Childhood Services in California
school performance; many of the state’s children live in communities that present an overall risk
to their academic achievement, and many children face more than one of these family, health, and
community risk factors, compounding their educational disadvantage. Below we discuss these
three categories of risk factors.
Family Risk Factors
Poverty
the primary family risk factor, often overlapping with community risk and health factors, is living in
poverty. Children living in poverty are more likely to have a developmental delay, lack social skills
appropriate for the classroom, perform poorly on standardized tests, repeat a grade in school,
and drop out of high school (Jensen, 2009; Brooks-gunn & Duncan, 1997).
the official federal poverty level set by the u.S. Census Bureau is fixed throughout the continental
united States; in 2010, this threshold was $22,314 for a family of four. In reality, an adequate
living standard requires far more than this income. An Economic Policy Institute (2005) study of
family budgets determined that up to three times more families fall below the standards to secure
a “safe and decent-yet-modest living standard” as fall below the official poverty line. the level
at which families can attain such a standard also varies across states. According to a Census
Bureau study (Renwick, 2009), the cost of living is more than four times higher in metropolitan
areas of California than it is in Iowa. Even so, one-fifth of all children living below the official
poverty level nationwide are in California.
Perhaps in recognition of California’s high cost of living, until 2011, children were eligible for
the California State Preschool (CSPP) and title 5 Child Development programs if their family
earned less than 75 percent of the State Median Income (SMI). In 2010, this translated to
$57,291 annually for a family of four; 1.67 million children under age five were eligible
(AIR analysis of American Community Survey data, u.S. Census, 2012), or approximately
62 percent of the age group.2
In 2011, given the state’s budget constraints, the threshold for CSPP and title V participation was
lowered to 70 percent of the SMI, or $53,472 for a family of four, for which 1.64 million children,
or almost 61 percent of those under five in the state, would have qualified.3
In 2012 governor Brown proposed, though the Legislature rejected, further reducing the income
eligibility to 200 percent of the federal poverty level, or about $44,200 for a family of four.4 At this
threshold, 1.2 million children under five statewide (49 percent) would have qualified in 2010.
According to the state’s Early Learning Challenge grant application, there were an estimated
274,442 infants under age one in families at this income level, almost 271,000 toddlers
between ages one and 2, and almost 533,000 preschoolers (three- and four-year-olds) (State
2 A previous estimate of 53 percent published by the RAND Corporation (http://www.rand.org/content/dam/rand/pubs/ occasional_papers/2012/RAND_OP356.pdf) was based on a parent survey. this slightly higher estimate is based on analysis of Census data for 2010 that were released after RAND’s study was published.
3 the estimate of the percentage qualifying at 70 percent of SMI is based on 2010 Census data. 4 the estimated dollar value of family income is based on 2010 Census data.

6 American Institutes for Research
Condition of Children Birth to Age Five and Status of Early Childhood Services in California
of California, 2011). Exhibit 3 shows the number of children who would have met the income
guidelines for CSPP and been eligible for CSPP and title 5 Child Development programs using
the three different criteria for defining poverty.
Exhibit 3. Child Poverty, 2010
1,800,000 1,670,000 1,640,000
1,600,000 1,400,000
1,200,000 1,200,000 1,000,000
800,000 600,000 400,000 200,000
0 Number of children Number of children Number of children under 5 in families under 5 in families under 5 in families earning less than 75% earning less than 70% earning less than 200% of the State Median Income of the State Median Income of the Federal Poverty Level
It is important to note that poverty is not evenly distributed across the state. Many rural counties
have high poverty rates, and large populous counties, with lower overall rates of poverty, are home
to large numbers of poor children. the graphs below show the number of children living in families
below 200 percent of the federal poverty line in California’s five most populous counties (Exhibit
4), and the percentage of children living in such families in the counties with the highest rates of
poverty (Exhibit 5).
Exhibit 4. Number of Children Under 5 Living in Families Earning Under 200% of the Federal Poverty Level in California’s Most Populous Counties, 2010
400,000
336,779
300,000
200,000
100,000 87,728 86,721 84,510 71,854
0 Los Angeles San Diego San Bernardino Riverside Orange

American Institutes for Research
Condition of Children Birth to Age Five and Status of Early Childhood Services in California
Exhibit 5. Percentage of Children Under 5 Living in Families Earning Under 200% of the Federal Poverty Level, Highest Poverty Counties, 2010
100%
80% 73.24% 73.24% 72.68% 66.69% 66.64%
60%
40%
n=2,641 n=3,588 n=29,062 n=14,433 n=8,209
20%
0 Lake Mendocino Tulare Merced Kings
Data by county for poverty and other risk factors and for program participation are presented in
the accompanying appendix to this report.
Other Family Risk Factors
Parent education levels are also related to children’s academic achievement, at least in part because
of family norms and variation in parents’ abilities to help children with challenging academic work.
Statewide, 21 percent of parents of K–12 students have less than a high school education
(CDE API growth Files, 2011), although educational status varies geographically; in two California
counties (Kern and Madera), over a third of parents have less than a high school education, which
might be driven in part by the large numbers of migrant families in these areas. In comparison,
12.9 percent of adults nationwide had less than a high school education in 2010 (Chapman,
Laird, Ifill, & KewalRamani, 2011).
7
Exhibit 6. Percentage of Parents in California Exhibit 7. Percentage of Adults in the United States With Less Than a High School Education, 2011 With Less Than a High School Education, 2010
Less than a high Less than a high school education school education
21% 12%
79% 88%
High school diploma High school diploma or greater or greater

8 American Institutes for Research
Condition of Children Birth to Age Five and Status of Early Childhood Services in California
Family structure is also related to academic achievement. Children living in homes without a father present may be at risk of poor school achievement. these children are less likely to graduate from high school, to attend college, and to perform well on standardized tests than children from homes with a father present (Sigle-Rushton & McLanahan, 2004; Bain, Boersma, & Chapman, 1983). California is comparable to the nation in this domain: 33 percent of all California children lived in single-parent families in 2010, compared with 34 percent nationwide (Kids Count, n.d.).
Exhibit 8. Percentage of Children Living in Single Parent Families
100%
80%
60%
40% 33% 34%
20%
0 California United States
Child abuse can also adversely affect children’s development and school performance. Researchers have found a strong relationship between child abuse and neglect and poor academic achievement (gilbert et al., 2009; Mills, 2004; Veltman & Browne, 2001). For infants and toddlers, early abuse and neglect can impair the development of the brain, negatively affecting not only social and emotional but also cognitive development, especially speech and language development (National Research Council and Institute of Medicine, 2000; Wolfe, 1999). In the 2010 calendar year, there was at least one child abuse allegation for more than 171,000 children birth to five statewide —7 percent of all children in this age group in the state.
Many children in foster care also show poor educational outcomes: Large proportions of foster children, according to a study by the Center for Social Services Research at the university of California at Berkeley (2001), perform poorly on academic tests (Sawyer & Dubowitz, 1994; Stein, 1997), fail to graduate from high school while in foster care (Blome, 1997), repeat grades (Benedict, Zuravin, & Stallings, 1996), perform below grade level (English, Kouidou-giles, & Plocke, 1994; Fanshel & Shinn, 1978; Fox & Arcuri, 1980; Iglehart, 1994), and require special education services (Berrick et al., 1994; English et al., 1994; goerge, Van Voorhis, grant, Casey, & Robinson, 1992). As of August 2011, more than 64,000 California children under age five were in foster care (Needell et al., 2012); these children may need early intervention to strengthen their academic readiness.
Children who are homeless often demonstrate significant developmental delays in early childhood, which can contribute to later behavioral and emotional problems and poor performance in school. Children born into homelessness are also more likely to have low birth weights, to be exposed to environmental factors that can endanger their health, and to lack essential immunizations, all of which represent health risk factors, as described below. In 2005–06, more than 292,000 children

American Institutes for Research
Condition of Children Birth to Age Five and Status of Early Childhood Services in California
in California were homeless, according to data collected by the federal McKinney-Vento program to support homeless students. Nearly 123,000 of these children were under six years old. the number of homeless children increased from 2006 to 2009, but dropped in 2010 (National Center on Family Homelessness, 2010). However, the risk of homelessness in California relative to other states remains high. According to the National Center on Family Homelessness (2010), California ranks poorly (38th out of 50, where 50th is the worst) in comparison with other states in risk of family homelessness: many homeowners are near foreclosure, and 28 percent of households pay more than 50 percent of their income in rent.
Exhibit 9. Other Family Risk Factors, Children 0–5 171,000 180,000
160,000
140,000 123,000 120,000
100,000
80,000 64,000
60,000
40,000
20,000
0 Number of children Number of children Number of allegations of child abuse in foster care homeless children (2010) (2011) (2006)
Finally, migrant children are also at risk of entering kindergarten with poor readiness skills;
children who are in migrant families are likely to not have continuity of care in attending quality
early childhood programs. 15,550 children from birth to kindergarten entry—almost 1 percent
of that population—were classified as migrant in 2010 (State of California, 2011).
Dual Language Learners
Dual language learners are at risk in some ways, but at an advantage in others. though being
bilingual has clear economic and cognitive advantages (Bialystok & Martin-Rhee, 2004; Fradd
& Boswell, 1996), achievement gaps between native English speakers and English learners (ELs)
are well documented.5 this achievement gap is especially important to note in California, where
ELs make up a large portion of the population of students. the population of mainly immigrant
families that speak a language other than English at home is also more likely than the general
population to have low education levels and/or to be living in poverty (National task Force on Early
Childhood Education for Hispanics, 2007)—both significant risk factors for children. Indeed, in
2007, it was estimated that 85 percent of English learners in elementary and secondary schools
were also economically disadvantaged (Payán & Nettles, n.d.). Much of the achievement gap can
5 u.S. Department of Education, National Center for Education Statistics, National Assessment of Educational Progress (NAEP), 2009 Reading Assessment, retrieved April 13, 2010, from the Main NAEP Data Explorer (http://nces.ed.gov/ nationsreportcard/naepdata/). (this table was prepared April 2010.)
9

American Institutes for Research
Condition of Children Birth to Age Five and Status of Early Childhood Services in California
be explained by these overlapping risk factors. Still, because of these achievement gaps, preschool
dual language learners (DLLs, or children still developing their first language skills while also
learning English) may be a target group for early education programs that build on their existing
home language skills.
California has and will continue to become increasingly ethnically and linguistically diverse. the
Census Bureau projects that in 2050 only 53 percent of the united States population will be
non-Hispanic white. In California, the minority percentage has already become a majority and
is likely to continue to grow (u.S. Census Bureau, 2012), and California educates an estimated
one-third of the nation’s EL students (EtS, n.d.). California’s English learners (ELs) in elementary
and secondary schools speak more than 50 different languages, although the vast majority speak
Spanish (EdSource, n.d.). In 2009–10, 36 percent of California kindergartners were classified
as ELs (State of California, 2011), suggesting that an equal or larger number of preschoolers are
dual language learners when they enter early care and education programs. By comparison, in
2005, 10.5 percent of students (K–12) nationwide were English learners (EtS, n.d.). Several
California counties have particularly large populations of ELs in kindergarten; both Colusa and
Monterey Counties show percentages over 50 percent.
Exhibit 10. Percentage of Kindergarteners in California Classified as English Learners, 2009–10
36% English Learners
English Proficient 64%
As with poverty, the numbers and proportions of English learners are not evenly distributed around
the state. Many counties with large rural areas and agricultural economies have high proportions
of English learners, but more populous counties are still home to larger total numbers of these
children. the two graphs below show the number of children identified as English learners in
kindergarten in the state’s five most populous counties (Exhibit 11), and the percentage of EL
kindergartners in the counties with the highest proportions of ELs (Exhibit 12).
10

Exhibit 11. Number of Kindergartners Designated as English Learners in California’s Most Populous Counties, 2010
50,000 46,652
40,000
30,000
20,000 16,738
12,760 10,025 9,754 10,000
0 Los Angeles San Diego San Bernardino Riverside Orange
Exhibit 12. Percentage of Kindergartners Designated as English Learners, Highest EL Counties, 2010
100%
80%
58% 60% 51% 49% 48% 47%
40%
n=208
20% n=1,342 n=3,017 n=2,146 n=1,537
0 Colusa Imperial Monterey Merced Santa Cruz
11 American Institutes for Research
Condition of Children Birth to Age Five and Status of Early Childhood Services in California
Community Risk Factors
Living in a Low Academic Performance Index Neighborhood
Some policy analyses have recommended targeting early education services based on place-based
or community risk factors, such as living in neighborhoods scoring low on the Academic Performance
Index (API), as opposed to targeting based strictly on individual family income. Such an approach
may minimize the administrative cost of determining eligibility (Karoly, 2009) and be less stigmatizing
to the children and families involved (Zigler, gilliam, & Jones, 2006). Focusing early education
programs in these areas may help schools improve by ensuring that children are ready for
kindergarten, and by engaging families in their children’s education early. In 2010, more than
282,000 three- and four-year-olds (27 percent) lived in attendance areas of elementary schools
in the bottom three deciles of the Academic Performance Index (API 1–3). An additional 180,000
lived in attendance areas of elementary schools in the fourth or fifth decile (API 4–5).

American Institutes for Research
Condition of Children Birth to Age Five and Status of Early Childhood Services in California
Exhibit 13. Percentage of Children Under 5 in California Living in Attendance Areas of Low API Elementary Schools
27% API 1–3
API 6–10 56%
17% API 4–5
High School Dropout Rates and College Entrance
High school dropout rates and college-going rates in children’s communities are likely to be strong
determinants in setting social and educational expectations for children. Research has found that
among neighborhood factors (and controlling for household characteristics), community average
education level is a factor most strongly associated with children’s standardized test scores
(Baker, Mcgee, Mitchell, & Stiff, 2000). It may therefore be a risk to a child to live in a neighborhood
where high school graduation and college-going rates are low. the average proportion of adults who
had attended a California community college, California State university, or university of California
campus statewide in 2009 was 41 percent, including full-time, part-time, credit, and non-credit
students (California Postsecondary Education Commission). More broadly, the college-going rate in
California to degree-granting institutions in 2008 was 65.4 percent, compared with 63.3 percent
nationwide (National Center for Education Statistics, 2011). While the college-going rate is slightly
higher in California than in the nation as a whole, the high school graduation rate is lower; in
2008–09, the average cohort graduation rate among public school students was 71.1 percent
in California, and 75.5 percent nationwide (National Center for Education Statistics, 2011).
12
Exhibit 14. Educational Attainment, California and Nationwide, 2008
100%
80% 76% 71%
65% 63% 60%
40%
20%
0 High school cohort graduation rate College-going rate
California United States

13 American Institutes for Research
Condition of Children Birth to Age Five and Status of Early Childhood Services in California
Other Special Populations
Because federal guidance on the Race to the top Early Learning Challenge grant required a focus
on Native American children and because of their higher-than-average poverty rates (u.S. Census
Bureau, 2010), California’s application (State of California, 2011) also identifies children residing
on Indian lands as a high-risk population, as these students graduate from high school at lower
rates than their peers (Freeman & Fox, 2005). In 2010, 4,273 children in California from birth to
kindergarten entry lived on Indian lands (State of California, 2011).
Health and Special Needs Factors
Several health risk factors also put children at risk for delayed cognitive development, placing
them at risk for poor school outcomes later in life.
Children with special needs such as autism and developmental delays can have intensive
learning and behavioral challenges. In 2005–06, 5 percent of children under 18 in California
were diagnosed with autism. this figure has been growing; the autism rate in California
increased by over 90 percent between 2003–04 and 2007–08 (Lipscomb, 2009). Overall,
80,226 children in California participate in Part C of the Individuals with Disabilities Education
Act (IDEA) in California (State of California, 2011). According to First 5 California,6 more than
10 percent of children under age five in California have a disability or special need that ‘may
impact their ability to play and learn” (First 5 California, n.d.).
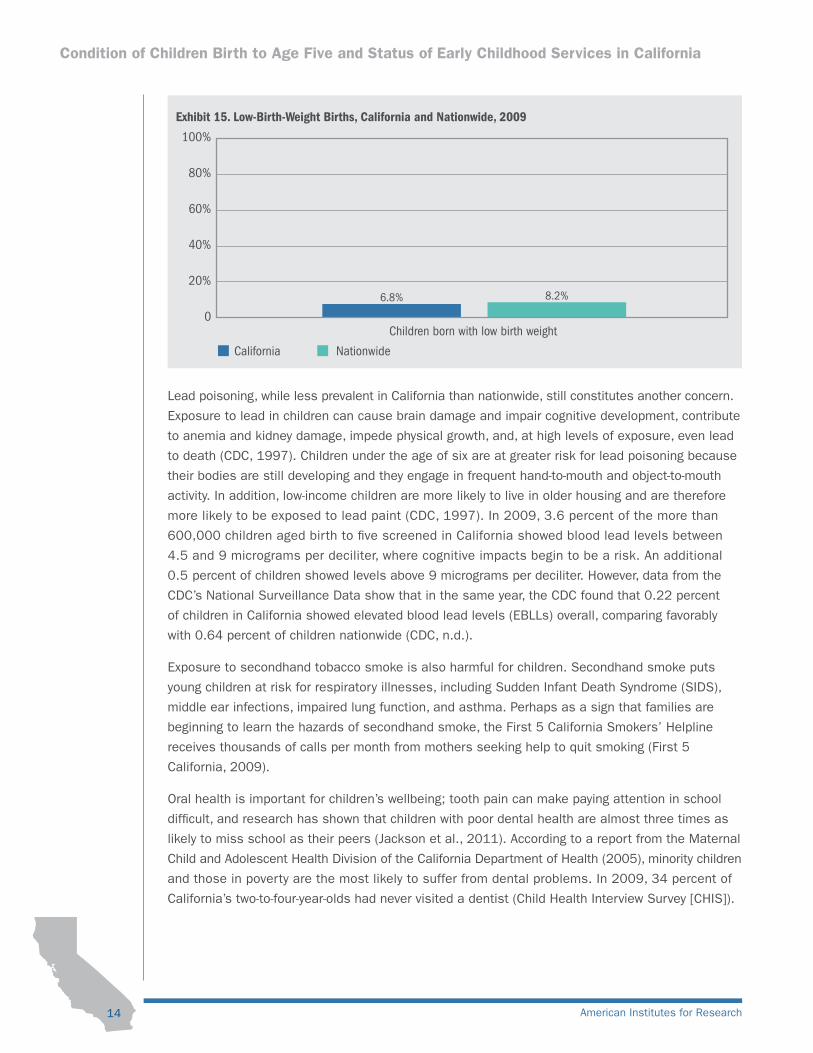
From the outset of life, for example, babies with low birth weight have a greater chance of developing
learning disabilities and chronic health conditions such as asthma that can lead to increased school
absences (Kirkegaard, Obel, Hedegaard, & Henriksen, 2006). In 2009, 7 percent of children born in
California were born with low birth weight, compared with 8.2 percent in the united States (the
National Vital Signs Statistics Systems, n.d.). this proportion does not vary notably by county; all
California counties reported 5 percent to 7 percent of all children being born with low birth weight.
In addition to actual weight at birth, recent research also highlights differences in children based
on whether they are born premature or not, and suggests that there are even differences between
children born full-term and those born just a few weeks early; Noble et al. (2012) found that more
children born at 37 or 38 weeks did poorly on third-grade math and reading tests than their peers
who were born even one or two weeks later. (Of course, babies born prematurely are more likely
than full-term babies to be born at a low birth weight.) As with low birth weight, California may be
at a relative advantage on this health factor; in 2009, 6.8 percent of births in California were after
fewer than 37 weeks of gestation, compared with 8.2 percent nationwide (Kids Count, n.d.).
In 1998 voters passed Proposition 10, adding a 50-cent tax to each pack of cigarettes sold, to create First 5 California, also known as the California Children and Families Commission. First 5 California distributes funds to local communities through the state’s 58 individual counties, all of which have created their own local First 5 County Commissions, to provide a comprehensive system of education, health services, childcare, and other programs for children birth to five and their families. the amount of funding provided to each First 5 County Commission is based upon the area’s birth rate.
6
14 American Institutes for Research
Condition of Children Birth to Age Five and Status of Early Childhood Services in California
Exhibit 15. Low-Birth-Weight Births, California and Nationwide, 2009
100%
80%
60%
40%
20% 6.8% 8.2%
0 Children born with low birth weight
California Nationwide
Lead poisoning, while less prevalent in California than nationwide, still constitutes another concern.
Exposure to lead in children can cause brain damage and impair cognitive development, contribute
to anemia and kidney damage, impede physical growth, and, at high levels of exposure, even lead
to death (CDC, 1997). Children under the age of six are at greater risk for lead poisoning because
their bodies are still developing and they engage in frequent hand-to-mouth and object-to-mouth
activity. In addition, low-income children are more likely to live in older housing and are therefore
more likely to be exposed to lead paint (CDC, 1997). In 2009, 3.6 percent of the more than
600,000 children aged birth to five screened in California showed blood lead levels between
4.5 and 9 micrograms per deciliter, where cognitive impacts begin to be a risk. An additional
0.5 percent of children showed levels above 9 micrograms per deciliter. However, data from the
CDC’s National Surveillance Data show that in the same year, the CDC found that 0.22 percent
of children in California showed elevated blood lead levels (EBLLs) overall, comparing favorably
with 0.64 percent of children nationwide (CDC, n.d.).
Exposure to secondhand tobacco smoke is also harmful for children. Secondhand smoke puts
young children at risk for respiratory illnesses, including Sudden Infant Death Syndrome (SIDS),
middle ear infections, impaired lung function, and asthma. Perhaps as a sign that families are
beginning to learn the hazards of secondhand smoke, the First 5 California Smokers’ Helpline
receives thousands of calls per month from mothers seeking help to quit smoking (First 5
California, 2009).
Oral health is important for children’s wellbeing; tooth pain can make paying attention in school
difficult, and research has shown that children with poor dental health are almost three times as
likely to miss school as their peers (Jackson et al., 2011). According to a report from the Maternal
Child and Adolescent Health Division of the California Department of Health (2005), minority children
and those in poverty are the most likely to suffer from dental problems. In 2009, 34 percent of
California’s two-to-four-year-olds had never visited a dentist (Child Health Interview Survey [CHIS]).

15 American Institutes for Research
Condition of Children Birth to Age Five and Status of Early Childhood Services in California
Overall, 27 percent of children between birth and five have never been to the dentist (CHIS, n.d.b).
And by third grade, more than 70 percent of children have a history of tooth decay, with more than
25 percent of these children untreated. It is estimated that students in California miss a total of
874,000 days of school each year due to dental problems (Children Now, 2011).
Obesity is a major and growing concern in California and nationwide (California Endowment, n.d.).
In California, 10 percent of children under five were identified as overweight for their age in 2007
(CHIS, n.d.a), and 17.2 percent are now classified as obese (Borland E, Smith, Polhamus, &
grummer-Strawn, 2012).
Children without health insurance are less likely to get the medical care they need (Feld, Matlock,
& Sandman, 1998) to identify and treat conditions related to the above risk factors; they are
also less likely to be screened for developmental difficulties that might affect school performance
(Families uSA, n.d.). In 2001, there were nearly 1 million uninsured children under age 19 in
California; 355,000 of these children were eligible for the Medi-Cal program (but remained
uninsured). However, over the last decade, California has been increasing children’s access
to health insurance. the number of uninsured children dropped from an estimated 778,000 in
2003 to 683,000 in 2007, a 12 percent decline (California Health Care Foundation, 2009). the
percentage of California children birth to age six receiving preventive care under public insurance
plans (Medi-Cal, Healthy Families, and Healthy Kids) exceeds national averages, including those for
private insurers (California Health Care Foundation, 2009). Still, children with foreign-born parents
and parents with limited English proficiency are less likely to be enrolled in Medi-Cal programs for
which they are eligible (Kincheloe & Brown, 2005).
Young children’s healthy social and emotional development is also critical to school readiness and
future well-being (Pitcl & Provance, 2006). No estimates are available of the number of children
under five who suffer from mental, emotional, or behavioral (MEB) disorders, because such disorders
are difficult to diagnose at an early age. However, the Institute of Medicine suggests that signs
of MEB disorders often do manifest themselves at early ages, often through parent and teacher
concerns about behavior (the National Academies, 2009). though no statistics on the number
of children at risk of MEB are available for the state of California, Brauner and Stephens (2006)
estimate that between 9.5 and 14.2 percent of children nationwide under five experience social,
emotional, and behavioral problems that negatively impact their development.
Multiple Risk Factors
National surveys indicate that about one-third of u.S. young children have two or more risk factors
for poor health and development, including low maternal education, family poverty, and others. the
likelihood of having poorer health and/or poorer developmental outcomes increases with each risk
factor; Stevens (2006) found that one risk factor yielded nearly twice the risk as no risk factors,
two risk factors more than three times the risk, three risk factors nearly five times the risk, and

16 American Institutes for Research
Condition of Children Birth to Age Five and Status of Early Childhood Services in California
four risk factors 14 times the risk for being in poor health or having a developmental delay. Multiple
risk factors are also important to consider in educational outcomes; research has found that
children exposed to multiple social and family risk factors in early childhood show lower cognitive
and language scores (Burchinal, Roberts, Hooper, & Zeisel, 2000).
In California, the various risk factors for poor school performance often overlap; children who live
in API 1–3 school neighborhoods also frequently live in poverty and are dual language learners.
these children are also more likely than others to be in poor health. Because of this overlap, it is
difficult to estimate precisely the total number of children who might most benefit from access to
early learning and care programs of sufficient quality to help prepare them for school. Still, given
the number of low-income children alone (1.2 million in families below 200 percent of the federal
poverty line), it is safe to estimate that there are at least that many children at risk for poor school
performance who would benefit from early intervention efforts.
Risks and Opportunities
Many of the risk factors described above are clear risk factors, but others are unclear, or depend
upon context. As discussed above, dual language learners are at risk in some ways, but at an
advantage in others. though being bilingual has clear economic and cognitive advantages
(Bialystok & Martin-Rhee, 2004; Fradd & Boswell, 1996), achievement gaps between native
English speakers and ELs are well documented. these achievement gaps may be partly because
lack of English skills limits access to content in elementary school, but they can also be largely
explained by correlations with other risk factors such as poverty and low education levels.
Similarly, having a working parent may have both risks and benefits for children. For many years,
having a mother in the labor force was considered a risk factor for young children. More recently,
the greatest concern is for infants who have mothers in the workforce. Several studies have found
that children on average fare better if their mothers do not work full-time in the first year of life
(Han, Waldfogel, & Brooks-gunn, 2001; Ruhm, 2004; Waldfogel, 2006). A more recent study by
some of the same researchers, however, found that although early maternal employment has
some risks, it also offers some advantages, such as increasing mothers’ income and the likelihood
that their children attend high quality child care (Brooks-gunn, Han, & Waldfogel, 2010). When all
factors, such as income and quality of parenting and child care, have been taken into account, the
net effect of maternal employment in the first year of life has been found to be neutral.
the next section of the report summarizes what recent research shows about access to, and the
quality of, programs for children in California, and presents key recommendations for moving forward.

17 American Institutes for Research
Condition of Children Birth to Age Five and Status of Early Childhood Services in California
Section II: Recent Findings and Recommendations on Early Learning and Care Services Based on the conditions of California’s children ages birth to 5, what early learning and care
services do they need to help promote school readiness and success in school and life? We know
that at least one million young children—more than one-third of the age group—are at risk of not
entering kindergarten as prepared as they might be. this section of the report provides an overview
of the key findings and recommendations from recent research and policy analyses on the status
of early childhood services in California for infants, toddlers, and preschool-age children.
How We Selected the Research and Policy Analyses
AIR staff identified 81 research and policy analyses for inclusion in this synthesis. All of the
reports selected, with the exception of those addressing finance, governance, and systems
issues, focus on California-based early childhood services or contain a major section specifically
examining services within the state. In addition, all of the work selected is relatively recent (with
the vast majority published since 2000). the research and policy reports employ a wide variety of
methodological approaches, including analysis of newly collected data, extant and administrative
data, classroom observations, direct child assessments, interviews and surveys, and literature
and document review. For the finance, governance, and systems issues, we expand our coverage
of reports to include research about these issues in other states, in order to incorporate lessons
already learned.
In selecting the work included in this synthesis, we looked for research and policy analyses that
spanned a broad range of issues that are integral to the development of an early learning and
care system. Some research and reports addressed one topic in depth; others covered multiple
issues. While it was not possible in this scope of work to fully address child health issues, such
as efforts to promote child health insurance coverage, we do explore the literature on developmental
screening, assistance to children with special needs, early childhood mental health services, and
food and nutrition programs. the following is a list of the major elements of early learning and
care services covered:
¡ Access to early learning and care
¡ Program quality assessment
¡ the extent of family engagement in early childhood programs
¡ Progress toward development of an early childhood workforce
¡ Approaches to dual language learners and linguistically isolated children
¡ Developmental screening
¡ Assistance to children with special needs
¡ Early childhood mental health/behavioral health services
¡ Child assessment to support school readiness
¡ Effective practices for child data

18 American Institutes for Research
Condition of Children Birth to Age Five and Status of Early Childhood Services in California
¡ Number and quality of facilities
¡ Attention to food and nutrition
¡ Kindergarten transition practices
¡ Finance, governance, and systems issues
Key findings for each of the above areas are outlined below, organized by policy question, followed
by the most commonly emerging recommendations made by the authors of the summarized
reports. For more detail on the findings and recommendations in each area, and a description
of the methodology used in each of these 81 studies reviewed, see Section III.
Access to Early Learning and Care
Large numbers of children in California, age birth to five, spend many hours in non-parental
care. There is consensus that access to quality early learning and care is uneven, varying
by the age of the child and by multiple family characteristics, such as family income, the
mother’s education level, and the degree of linguistic isolation. Licensed care for infants
and toddlers is in particularly short supply, and federal and state funding is consistently
lowest for this age group. For all children, researchers agree that programs should be first
made available to disadvantaged children—such those with risk factors as outlined in the
first section of the report. Though there are two sometimes conflicting motivations for
providing publicly subsidized care to preschool-age children—school readiness, and
affordable child care for children of working families—quality programs are critical for
positive outcomes for all children. Some researchers see linking formal and informal
arrangements for this age group to home visiting programs as one strategy to improve
access to early learning and care for this age group.
Key Findings
While we review research on access to early learning and care for all children, the major focus,
as required by the ARRA funds supporting this work, is on those “subgroups” under federal law
whose K–12 performance is below state average. Key findings regarding access to early learning
and care are outlined below, organized by policy question.
1. What proportion of children age birth to five receive some non-parental early learning and
care service; how does the utilization of formal and informal, center-based and home-based
arrangements vary by the age of the child; and to what extent do utilization patterns reflect
family choice?
¡ At least three quarters of preschool-age children, and just under half of infants and
toddlers, are cared for by someone other than their parents on a regular basis (Karoly,
2012a). While attendance at center-based programs is the norm for preschool-age
children, it is the exception for infants and toddlers. At most, 4 percent of the state’s
infants and toddlers attend licensed center-based programs, and another 8 percent
are in licensed family child care homes (Anthony & Muenchow, 2010).

19 American Institutes for Research
Condition of Children Birth to Age Five and Status of Early Childhood Services in California
¡ If the definition of “early learning and care” is expanded to include informal care by
family, friends, and neighbors, as many as 42 percent of two-year-olds are in non-parental
care for at least 10 hours a week, along with somewhat smaller proportions of infants
and younger toddlers (uCLA Center for Health Policy Research, California Health Interview
Survey, 2007, as cited in Anthony & Muenchow, 2010).
¡ Not all early learning and care services for this age group take the form of non-
parental care.
� As many as 40,000 families in California with infants and toddlers receive home
visiting services, and home visits linked to formal or informal non-parental care have
been shown to be an effective model to promote early learning (gomby, 2005, as
cited in Anthony & Muenchow, AIR, 2010; Love, 2001).
� About one third of the families with infants born in California receive a period of publicly
supported7 part-paid leave from work to focus on bonding with their newborn child
(Anthony & Muenchow, 2010). For participating families, the leave policy has extended
the length of breastfeeding, and has given families more time to look for appropriate
child care arrangements, but many families do not know about the leave benefit
(Appelbaum & Milkman, 2011).
¡ the unmet need for infant and toddler care is evidenced by the fact that the largest
number of requests to child care resource and referral agencies is for formal care
for children under the age of 2, according to the 2011 Child Care Portfolio (California
Child Care Resource and Referral Network, 2011). California is the nation’s fifth least
affordable state for center-based infant care, with the cost representing more than
40 percent of the median income for a single-parent household, based on an analysis
by the National Association of Child Care Resource and Referral Agencies (2011),
cited by Children Now (2012).
¡ Center-based infant care with staff-child ratios and group sizes that facilitate sufficient
attention for very young children is expensive to provide, and the high cost deters
many families from using this form of care (California Child Care Resource and Referral
Network, 2011; Children Now, 2012). Most of the center-based care for this age group
consists of Early Head Start or state-contracted programs that are publicly subsidized
(Anthony & Muenchow, 2010).
¡ there are also indications that some families prefer family, friend, and neighbor care,
especially for very young children, because the hours of care more easily accommodate
parents’ work schedules, and because families may feel more comfortable having friends
or family members who share their culture and language care for their youngest children
(Anthony & Muenchow, 2010). For preschool-age children, working parents often combine
a part-day, center-based experience with home-based family, friend, or neighbor care for
the remainder of the day (Karoly, 2012a).
Publicly supported leave refers to leave supported by taxpayers (payroll taxes), not by private employers. 7

20 American Institutes for Research
Condition of Children Birth to Age Five and Status of Early Childhood Services in California
2. What are the major purposes of publicly supported early learning and care, and to
what extent do families have access to early learning and care services that address
these purposes?
¡ there are two sometimes conflicting motivations for providing publicly subsidized care
to preschool-age children: to promote healthy child development and school readiness,
and to provide affordable child care for children of low-income working families (Karoly,
Reardon, & Cho, 2007; CAEL QIS Advisory Committee, 2010).
¡ Most of the infants and toddlers in center-based care are in programs with a
developmental focus, but very few are in center-based or licensed care of any type
(Anthony & Muenchow, 2010).
¡ In 2006, 81 percent of preschool-age children in subsidized care were in settings with a
child development focus (i.e., Head Start, title 1, or a state-contracted title 5 program).
Another 9 percent were in programs that, at a minimum, met less stringent title 22
regulations, and most of the rest were in license-exempt care. However, programs with
a developmental focus are not funded sufficiently to serve all eligible children. In 2006,
the gap between eligibility and enrollment was approximately 77,000 four-year-olds and
156,000 three-year-olds (Karoly, Reardon, & Cho, 2007).
¡ Many of the programs with a developmental focus, particularly those serving preschool-
age children, operate on a part-day basis, which does not easily accommodate the
work schedules of working parents. Of the parents calling local child care resource and
referral agencies to request assistance finding child care, 86 percent requested full-day
arrangements, and 70 percent cited their work as the primary reason for their need for
child care (California Child Care Resource and Referral Network, 2011).
3. How good is the quality of early learning and care, and does access to quality programs
vary by ethnicity, income, and other child and family characteristics? What are the major
barriers to enhancing the quality?
¡ Based on measures of teacher-child interaction and the instructional quality in the
program, only 13 percent of children from low-income families are enrolled in early
learning programs of sufficient quality to promote the kind of thinking skills that make
the most difference in school readiness and performance (Karoly, 2009). Investing tax
dollars in programs that are not of sufficient quality to prepare children for school can
be seen as an inefficient use of public funds.
¡ California’s title 5 State Preschool Program sets higher standards for program quality
than does the state’s title 22 licensing system. However, the program is rated as
meeting just 4 of 10 benchmarks established by the National Institute for Early
Education Research for high quality preschool programs (Barnett et al., 2010; NIEER,
2010; CAEL QIS Advisory Committee, 2010). Current reimbursement rates for publicly
funded programs provide little incentive to improve quality. Programs required to meet
higher title 5 standards frequently receive lower reimbursement rates than programs
held only to minimum licensing standards (Children Now, 2008: Karoly, Reardon, & Cho,
2007; Lam & Muenchow, 2009b).

21 American Institutes for Research
Condition of Children Birth to Age Five and Status of Early Childhood Services in California
¡ Reimbursement levels based on the market rate are now more than half a decade old, and they do not cover the cost of providing quality care to infants (Water Cooler Policy Report, 2012).
¡ First 5 Power of Preschool (PoP)8 and the new Child Signature Program (CSP) standards are similar to those recommended nationally by the National Association for the Education of Young Children and the National Institute for Early Education Research (CAEL QIS Advisory Committee, 2010; Evaluation Matters with First 5 California Staff, 2009). PoP programs also serve a high proportion of the children found to benefit most from high quality programs, such as dual language learners, and 10 percent of children in these programs have special needs or disabilities (Franke, Espinosa, & Hanzlicek, 2011).
¡ First 5 PoP Demonstration Projects finance the program’s higher standards by using a tiered reimbursement system that explicitly rewards programs that move beyond the title 5 requirements for teacher qualifications with a higher rate of reimbursement (Evaluation Matters with First 5 California Staff, 2009; Karoly, Reardon, & Cho, 2007; Muenchow & Lam, 2009).
¡ California has far less stringent requirements for publicly subsidized license-exempt care than many other states, with no requirements for participation in training and no provisions for even an initial site visit to assess the health and safety of the arrangement (Anthony & Muenchow, 2010). For example, in New York and Oregon, only providers who complete training receive enhanced rates; in Nevada, exempt programs have an initial site visit within 45 days of registration, followed by periodic visits every six months. Oklahoma does not subsidize exempt care; the state limits the use of public funds to licensed arrangements.
4. What proportion of the children eligible for publicly subsidized programs is served, how
have budget reductions over the last 3–5 years affected access to programs, and could
existing resources be used more effectively to reach the children who would most benefit
from high quality early care and education?
¡ Based on an analysis of the 2005 National Household Education Survey and the 2007 RAND California Preschool Study, subsidized programs of all types served about one third of eligible three-year-olds, about two thirds of eligible four-year-olds, and just 8 percent of infants and toddlers from income-eligible families (Karoly, 2012a).
¡ From 2007 to 2010, enrollment in several early learning and care programs increased:
� the number of children participating in First 5 Power of Preschool programs nearly doubled, from 14,239 to 24,389.
� Consolidation of existing State Preschool, Prekindergarten Family Literacy, and general Child Care and Development programs enabled more than 19,000 additional children to be part of the California State Preschool Program (State of California, 2011).
the Power of Preschool (PoP) project, funded by First 5 California, is a demonstration project in nine California counties to increase the number of high quality preschool spaces in California. Many PoP sites are Head Start or California State Preschool programs that have received additional funding from PoP to increase program quality. Other PoP programs are fully funded by First 5.
8

22 American Institutes for Research
Condition of Children Birth to Age Five and Status of Early Childhood Services in California
� the number of children with high needs enrolled in State Preschool in California
increased from 87,706 in 2007 to 101,414 in 2010, and the number in title 1
preschool increased from 23,726 in 2007 to 26,580 in 2009 (State of California,
2011).
� In addition, the transitional Kindergarten Program, enacted in 2011, is anticipated
to ultimately serve 120,000 children.
¡ At the same time, in response to the budget crisis, access to subsidized care was
reduced in other ways:
� Eligibility for State Preschool and title 5 programs was reduced from 75 percent to
70 percent of the State Median Income (SMI).
� the number of children served in programs funded by the Child Care and Development
Fund in programs such as the Alternative Payment Program and CalWORKS declined
from 131,679 in 2007 to 125,899 in 2010.
� the number of children birth to five served in programs funded by the Individuals with
Disabilities Education Act (IDEA) Part C and Part B declined from 83,484 in 2007 to
81,621 in 2010 (State Of California, 2011).
¡ In June 2012, the governor made the following line-item reductions to publicly funded
early learning and care:
� $30 million from State Preschool, leading to an approximate reduction of 12,500 slots
� $20 million from the Alternative Payment Program, resulting in an approximate
reduction of 3,400 slots on top of the 14,000-slot reduction made earlier by the
Legislature (Child Development Policy Institute, 2012).
¡ Over the last decade, analysts have identified a number of inefficiencies in the way
publicly subsidized programs are administered:
� Families were placed on the Centralized Eligibility List (CEL) without a formal
determination of eligibility, making it difficult for agencies in some counties to fully
expend their CDE contract funds by the required time (Children Now, 2008).
� Several organizations have made recommendations for reducing this underearning
and improving efficiencies (California Department of Education, 2007; Karoly,
Reardon, & Cho, 2007; Kidango, 2007).
� Mechanisms for allocating funding to providers, whether through contracts or vouchers,
made it difficult to spend all of the funding allocated to the program in a given year,
further reducing the number of children served.
¡ Access to and utilization of programs is uneven. use of center-based early learning and
care is lowest amongst children who are most likely to benefit.

23 American Institutes for Research
Condition of Children Birth to Age Five and Status of Early Childhood Services in California
� While nearly three quarters of preschool children with mothers with a bachelor’s
degree attend preschool, only 45 percent of preschool children whose mothers
have less than a high school diploma attend (CAEL QIS Advisory Committee, 2010;
Karoly, 2009).
� Latino children are much less likely than white children to attend center-based
programs in the year prior to kin¬dergarten (38 percent versus 58 percent). Latino
children who do attend center-based programs enter one year later than white children,
on average (Bridges, Fuller, Rumberger, & tran, 2004; Lopez & de Cos, 2004). Even
when Latino children do attend preschool, they participate for fewer hours (Children
Now, 2012; Love, Atkins-Burnet, & Vogel, 2009).
� About half of preschool-age children in California are children of immigrants, and
about 20 percent are linguistically isolated. Only 15 percent of linguistically isolated
children attend center-based programs (Cannon, Jacknowitz, & Karoly, 2012).
¡ While roughly 85 percent of the brain’s core structures are formed by age three, only
about 6 cents out of every dollar that California invests in education and development
services for children from birth to age 18 goes to support infants and toddlers (Water
Cooler Policy Report, 2012; Children Now, 2012). Recent cuts to child care, Early Start,
and early childhood quality improvement efforts have further reduced this funding.
Recommendations
to move forward with increasing access to high quality early learning and care, the following major
recommendations emerged from these reports:
1. To expand access to quality early learning and care for children birth to age 5:
¡ Include early learning and care in a comprehensive P-to-12 education and reform
package with an equitable and adequate financing system (Children Now, 2012;
Superintendent’s P–16 Council, 2008).
¡ Expand title 1 funding for preschool (CAEL QIS Advisory Committee, 2010; Karoly,
2009; AIR, 2004).
¡ Advocate for and establish a “set-aside” or guaranteed minimum percentage for
infant-toddler programs in state and federal funds, such as title 1, Rtt-ELC grants,
and Child Care and Development Fund (Water Cooler Policy Report, 2012). Create
a new state revenue source that supports early learning birth to five, and within this
stream, set aside at least 30 percent for infants and toddlers.
¡ Consider targeting linguistically isolated children, although targeting children from low-
income families accomplishes much the same goal (Cannon, Jacknowitz, & Karoly, 2012).
¡ For infants and toddlers, until there is adequate funding to benefit all programs and
children, target any expansion to children at high risk, e.g., children meeting Early Head
Start eligibility criteria in high poverty communities (Water Cooler Policy Report, 2012).

24 American Institutes for Research
Condition of Children Birth to Age Five and Status of Early Childhood Services in California
¡ Within existing resources for preschool programs, continue to target four-year-olds and
three-year-olds from currently income-eligible families. If additional resources permit
extending access to a larger share of the population, consider combining place-based
targeting with income targeting so that all children in targeted communities are able to
participate, even if they are not otherwise eligible (Karoly, 2009). this approach would
reduce the stigma and bureaucracy associated with checking family income. In addition,
many children slightly above the income eligibility requirements are still at risk by virtue
of living in poor communities with low-performing schools.
¡ Within existing resources for children birth to age 5, consider centralizing the process
for eligibility determination at the county level or lower.
¡ Modify the contract mechanism for title 5 programs and alternative payment programs
to reduce the extent of unused funds, possibly by shifting from contracts that reimburse
child-days to grants with minimum enrollment and /or attendance requirements
(Karoly, 2009).
¡ Support the implementation of the federal home visitation program and coordinate and
link with early learning programs, including license-exempt as well as licensed providers
(Water Cooler Policy Report, 2012; Children Now, 2012; Anthony & Muenchow, 2010).
Expand 0–3 home visitation services, giving highest priority to the most vulnerable
children (Water Cooler Project, 2012).
¡ Publicize California’s Paid Family Leave program and its relevance for the care of
newborn infants.
2. To address the dual goals of early learning and care programs:
¡ Identify strategies that would allow greater efficiency in improving child development,
without necessarily detracting from the goal of supporting working parents’ newborn or
newly adopted children (Anthony & Muenchow, 2010; Appelbaum & Milkman, 2011).
¡ As models, look to other states—such as New York, Oregon, and Nevada— with more
stringent monitoring requirements for publicly funded exempt providers (Anthony &
Muenchow, 2010).
¡ Policymakers may need to make choices about system reforms that involve tradeoffs
between these two policy goals (Karoly, Reardon, & Cho, 2007).
¡ Determine eligibility for part-day developmental programs at the time of application,
and maintain eligibility even if family circumstances (such as employment) change.
Determine eligibility for subsidized full-day programs conditionally, and finalize eligibility
when the program begins. Structure the enrollment process to coincide with the program
year (Karoly, 2009).
¡ Recognize that the major barrier to expanding full-day programs is cost, and carefully
consider the differential costs of three-hour, six-hour, and nine-hour-a-day programs and
of school-calendar versus full-year programs (Lam & Muenchow, 2009).

25 American Institutes for Research
Condition of Children Birth to Age Five and Status of Early Childhood Services in California
3. To improve the quality of early learning and care programs:
¡ Recognize that quality, particularly the recruitment and retention of qualified teachers,
costs more (Whitebook, Bellm, Lee, & Sakai, 2005; uCLA Center for Healthier Children,
Families, and Communities, 2011).
¡ Restructure the child care reimbursement system for publicly funded infant-toddler
programs so that providers are reimbursed for the true cost of providing quality care.
Provide higher reimbursement rates in a tiered system for programs meeting standards
at the higher levels of a Quality Rating and Improvement System (Water Cooler Policy
Report, 2012).
¡ Increase reimbursement rates for title 5 programs to be at least equivalent to those for
voucher programs, which are held to lower quality standards than title 5. this will make
it more possible for title 5 programs, one of the state’s higher quality programs, to
remain in operation (CAEL QIS Advisory Committee, 2010; Karoly, 2009; Karoly,
Reardon, & Cho, 2007).
¡ Provide financial and non-financial incentives to support continuous quality improvement
(CAEL QIS, 2010). Estimate the cost of various incentives as part of a pilot (CAEL QIS,
2010; Legislative Analyst’s Office, 2007).
¡ Raise quality through a multi-pronged approach that includes quality measurements and
monitoring, financial incentives and supports, and accountability through evaluating
child outcomes (Karoly, 2009).
Program Quality Assessment
Multiple California-based studies highlight the need to provide more information on the
quality of early learning and care programs to families, and to explain why a licensing
system focused exclusively on health and safety requirements is not adequate to assess
the quality of the early learning environment. Instead, Environmental Rating Scales (ERS)
such as the Early Childhood Environment Rating Scale (ECERS) and measures of
teacher-child interactions such as the Classroom Assessment Scoring System (CLASS)
are recommended to assess program quality. Measuring the quality of teacher-child
interactions is particularly critical, as these have been linked to children’s gains on
receptive and expressive language assessments (Howes, Burchinal, Pianta, Bryant, Early,
Clifford, & Barbarin, 2008). There is also substantial agreement on the merits of linking
state payment rates for publicly subsidized programs to the quality of the early learning
and care program. Reports stress the importance of standardized program environmental
assessments conducted by trained assessors external to the programs, and the need
for relatively frequent assessments to ensure fairness to providers. At the same time,
researchers note that the frequency of the assessments must be balanced with cost
considerations. Virtually all studies on the topic recommend piloting a Quality Rating
and Improvement System (QRIS) before implementing it statewide.

26 American Institutes for Research
Condition of Children Birth to Age Five and Status of Early Childhood Services in California
Key Findings
1. What statewide systems are currently in place to assess the safety and quality of
early learning and care services in California? Does the public currently have adequate
information about the safety and quality of early learning and care services in California?
How might a QRIS improve accountability?
¡ California currently has three early learning and care “systems”—title 22 licensure,
title 5 state-contracted, and Head Start—as well as a publicly funded “non-system”
of unregulated, license-exempt care (CAEL QIS Advisory Committee, 2010; Children
Now, 2012).
� Only two of these “systems”—title 5 and the federally administered Head Start—
have standards designed to promote child development and school readiness (CAEL
QIS Advisory Committee, 2010).
� the Desired Results system requires title 5 providers to conduct program
self-assessments using the Early Childhood Environment Rating Scale (ECERS)
and periodic progress reviews. (Note: Although Desired Results also includes
observational assessments of children, in this section we focus only on program
quality assessment.)
� Head Start requires programs to be assessed using the Classroom Assessment
Scoring System (CLASS). Measuring the quality of teacher-child interactions is
particularly critical, as these have been linked to children’s gains on receptive and
expressive language assessments (Howes, Burchinal, Pianta, Bryant, Early, Clifford,
& Barbarin, 2008 as cited in Manship, Fain, & Madsen, 2011).
� California’s title 22 licensure systems ranks 46th (the lowest) in the nation.
� Its licensing standards allow considerably larger-than-recommended staff-child
ratios, do not require staff to complete any annual training, and do not require
any post-secondary degree for lead teachers (National Association of Child Care
Resource and Referral Agencies [NACCRRA], 2011).
� Child care centers in the state are routinely inspected once every five years. In a
majority of states, visits are conducted, on average, once a year (NACCRRA, 2011).
� the caseloads of licensing inspectors are three to five times heavier than the
nationally recommended caseload of 1:50 (NACCRRA, 2011; Children Now, 2012).
¡ Comprehensive, publicly available information about child care providers has been lacking.
� the state has not made inspection reports readily available to the public (Legislative
Analyst’s Office, 2007; Karoly, 2009).
� the title 22 licensing system only measures whether the center or family child care
home meets health and safety standards, and, as a result, it cannot be used to
evaluate other components of care, such as the quality of the learning environment, the
qualifications of the teachers, or staff-to-child ratios (Legislative Analyst’s Office, 2007).

27 American Institutes for Research
Condition of Children Birth to Age Five and Status of Early Childhood Services in California
� the state funds child care resource and referral programs in every county to provide
information to parents on the range of services that are available and tips on how to
look for quality programs, but there is no objective rating system on which to base
the information and referrals (CAEL QIS Advisory Committee, 2010).
¡ to help parents identify quality settings for infants and toddlers, a QRIS could be an
extremely useful consumer protection tool (Anthony & Muenchow, 2010).
¡ Disseminating information about the quality of programs could influence the overall
quality of the provider market and could help policymakers target resources where they
are needed (Legislative Analyst’s Office, 2007; Karoly, 2009).
¡ A QRIS has the potential to truly focus on early learning and care programs for infants
and toddlers as well as preschool-age children (Water Cooler Policy Report, 2012).
¡ California’s 1,729 local educational agencies and more than 50,000 early learning
providers span a far wider spectrum of size, infrastructure, and readiness for change
than exists in any other state, and a one-size-fits-all approach will not work (State of
California, 2011).
¡ Standards help to promote accountability: Early learning and care programs that already
have standards in place through licensure, or that have title 5 or Head Start standards,
currently score highest on quality elements (Karoly, 2012b).
2. What are the most reliable tools for assessing the quality of teaching and learning in an
early childhood program? To ensure accuracy and fairness, how frequently should programs
be assessed, and by whom?
the Environmental Rating Scales (ERS), first published in 1980, have demonstrated
reliability and validity. they are currently used to measure the quality of the First 5
Power of Preschool Programs, and are used in most other states that have QRISs
(CAEL QIS Advisory Committee, 2010; uCLA Center for Healthier Children, Families and
Communities, 2011; Evaluation Matters with First 5 California Staff, 2009).
¡ the Classroom Assessment Scoring System (CLASS), now required by the federal
government to evaluate the quality of Head Start programs, is an assessment tool with
demonstrated reliability and validity that is particularly noted for its capacity to assess
the quality of teacher instruction for preschool children (CAEL QIS Advisory Committee,
2010; AIR, 2007). Measuring the quality of teacher-child interactions is particularly
critical, as these have been linked to children’s gains on receptive and expressive
language assessments (Howes, Burchinal, Pianta, Bryant, Early, Clifford, & Barbarin,
2008 as cited in Manship, Fain, & Madsen, 2011).
¡ the Program Assessment Rating Scale (PARS) measures the early educator’s
responsiveness to children birth to three (CAEL QIS Advisory Committee, 2010).

28 American Institutes for Research
Condition of Children Birth to Age Five and Status of Early Childhood Services in California
¡ Alignment with the State of California’s Infant/toddler and Preschool Foundations and
Frameworks can serve as a proxy for curriculum, child assessment, developmental and
health screenings with appropriate referrals, inclusion of children with special needs,
and cultural and language competence. the Foundations and Frameworks contain these
(and other) program quality criteria and are aligned with kindergarten and California
Common Core standards.
¡ Attention must be paid to the validity of the ratings, the frequency of the ratings, and
the cost of the ratings. In other states with QRISs, the frequency of ratings varies from
every other year in Colorado to once every three years in North Carolina (CAEL QIS
Advisory Committee, 2010, citing Zellman & Perlman, 2008).
¡ third-party assessments by trained assessors are important to ensure the validity of
the ratings, although self-assessments can be useful to providers in the initial tiers of
the system (CAEL QIS, 2010, citing Zellman & Perlman, 2008).
¡ It may be challenging to generate meaningful ratings where there is variation across
classrooms or where different age groups are served (Karoly, 2012b).
¡ Programs are most likely to need technical assistance in improving relevant ratings on
the Environmental Rating Scales, and, if used, the Classroom Assessment Scoring
System (Karoly, 2012b).
3. What local models for a quality rating system already exist in California, and how are they
affecting program quality?
¡ First 5 Power of Preschool programs require external assessments using the
Environmental Rating Scales (ECERS- R, FCCERS-R, or ItERS-R). Classroom
environmental assessment ratings for Power of Preschool programs range from
“good” to “excellent” (uCLA Center for Healthier Children, Families and Communities,
2011; Evaluation Matters with First 5 California Staff, 2009; American Institutes for
Research, 2007).
¡ Some First 5 PoP evaluations have also used the CLASS. While PoP scores on
instructional quality show room for improvement, they compare favorably with those
reported in other states (AIR, 2007; CAEL QIS, 2010; Karoly, ghosh-Dastidar, Zellman,
Perlman, & Fernyhough, 2008, Love, Atkins-Burnett, & Vogel, 2009). PoP CLASS scores
were also higher than those of the Oklahoma universal Preschool Program, which
demonstrated gains in school readiness for participating children (Phillips, gormley,
& Lowenstein, 2007).
4. What is the typical structure of a QRIS, and what features of quality should be measured?
¡ Of the 23 states with a QRIS in 2010, 12 states use the block system, 5 use a point
system, and the rest use a combination of these two systems or alternative approaches
(CAEL QIS, 2010, citing tout, 2010). In a block system, all of the quality criteria in that
tier must be accomplished to obtain that rating (and the criteria build on those in

29 American Institutes for Research
Condition of Children Birth to Age Five and Status of Early Childhood Services in California
previous blocks). A block system promotes more consistency in the meaning of ratings
than a point system, which allows providers to meet some but not all of the criteria for
a particular tier to obtain that rating.
¡ Based on syntheses of more than 40 years of research (Jacobson, 2004; Peisner-
Feinberg et al., 2000; Zigler, gilliam, & Jones, 2006; and other studies as cited in CAEL
QIS, 2010), key features of quality programs that should be measured include:
� Intensive education (e.g., low child-to-staff ratios, small groups, regular attendance)
� teachers interacting responsively with children
� Family involvement in a culturally and linguistically responsive manner
� A “curriculum” or plan of activities
� Adequate numbers of well trained, qualified staff
� Program directors that understand child development and provide leadership
¡ A QRIS—as defined by the federal Administration for Children Office for Child Care’s
National Child Care Information and technical Assistance Center—is a systematic
approach to assessing, improving, and communicating the level of quality in early- and
school-age care and education providers. In general, a QRIS assigns quality ratings to
early learning and care providers based on the extent to which the providers meet a set
of defined program standards. A QRIS is typically composed of five common elements,
which include:
� Standards
� Accountability measures
� Provider support
� Financial incentives
� Parent and consumer education efforts
5. How would programs rate under the QRIS proposed by the California Early Learning Quality
Improvement System Advisory Committee?
¡ Based on a “virtual” pilot of the proposed five-tier QRIS (Karoly & Zellman, 2012):
� About 80 percent of centers would reach tiers 3 to 5 on the quality elements of ratio
and group size, and about half would reach tiers 4 to 5 on staff education levels.
� Only one in four centers would reach tiers 4 or 5 based on the ECERS-R, FCCERS-R,
ItERS-R, or the CLASS, if the latter is included in the QRIS.

30 American Institutes for Research
Condition of Children Birth to Age Five and Status of Early Childhood Services in California
� Overall, fewer than 10 percent of centers would reach tier 5.
� More publicly funded programs would reach tier 4 than would a statewide
representative sample of all licensed programs. Even among publicly subsidized
programs, however, few would reach tier 5.
� Based on ERS ratings, infant/toddlers programs would rate somewhat lower than
those serving preschool-age children, and family child care homes would rate lower
than center-based programs.
� However, it is important to note that this pilot was often based on one classroom
in a program rather than the whole program.
6. To ensure accountability to the public and fairness to providers, how should a QRIS
be implemented?
¡ Among the 23 states that had implemented QRISs by 2010, many strongly
recommended a field test or pilot prior to implementing the system statewide
(CAEL QIS Advisory Committee, 2010, citing Zellman & Perlman, 2008).
¡ Experience in other states also underlines the importance of:
� Minimizing the use of self-reported data
� Ideally, integrating licensing into the system
� Incorporating both self-assessments and independent assessments at different
levels of the QRIS
� Not including the use of “accreditation” (such as by the National Association for the
Education of Young Children [NAEYC] or the National Association for Family Child Care
Accreditation [NAFCC]) as a mandatory system component
� Separate raters and quality improvement support personnel to ensure objectivity
� Evaluating whether the QRIS meets its intended goals (CAEL QIS Advisory Committee,
2010, citing Zellman & Perlman, 2008)
Recommendations
to move forward on program quality assessment, the following major recommendations emerged
from these reports:
1. To improve information and accountability to the public and policymakers about the quality
of early learning and care programs:
¡ Establish a quality rating structure that integrates the current multiple sets of
program standards into one coherent, evidence-based system (CAEL QIS Advisory
Committee, 2010).

31 American Institutes for Research
Condition of Children Birth to Age Five and Status of Early Childhood Services in California
� to obtain the entry-level rating, a program or provider would need to meet the basic
title 22 licensure standards.
� to advance to the mid-level rating, a program or provider would need to meet standards
similar to the more stringent title 5 contract standards.
� to advance to the top level rating, a program or provider would need to meet
requirements that incorporate nationally recommended quality standards, such as
the National Association for the Education of Young Children (NAEYC) standards.
¡ Establish a five-tier block system that assesses five quality elements. A program would
need to meet all the standards within each tier before advancing to the next tier (CAEL
QIS Advisory Committee, 2010). the five quality elements are:
� Ratios and group size
� teaching and learning
� Family involvement
� Staff education and training
� Program leadership
¡ Increase the routine inspection rate for child care centers and family child care homes
and make inspection reports publicly available on the Internet (Karoly, 2009; CAEL QIS
Advisory Committee, 2010).
¡ Base QRIS ratings on a few simple criteria, such as staff-to-child ratios, group size, and
staff qualifications, using data already collected through the licensing process and state
monitoring information about participating providers collected through document review
and verification, coupled with an audit mechanism (Legislative Analyst’s Office, 2007).
¡ Support State Advisory Council on Early Childhood Education and Care and advance a
statewide Quality Rating System for children ages birth to five (Water Cooler Policy
Report, 2012).
¡ Adopt a locally based approach to the development of a QRIS with regional consortia in
15 counties that have made a commitment to strengthen their local QRIS and mentor
other communities who wish to do the same (State of California, 2011). While tier levels
and benchmarks will be developed locally, all early learning and development programs
participating in the QRIS will have plans in place to support the following targets:
� 75 percent of children in participating programs are assessed using validated
observational assessment tools.
� 75 percent of lead or master teachers employed in participating programs will develop
individual professional growth plans based on teacher effectiveness rating scores.

32 American Institutes for Research
Condition of Children Birth to Age Five and Status of Early Childhood Services in California
� 75 percent of participating programs will be assessed using the appropriate Environment Rating Scale, with 90 percent of them showing improvement over the term of the grant funding.
2. To provide fair and reliable assessments of the quality of teaching and learning:
¡ Pilot a rating process that would employ environmental rating assessments every two to three years and, at higher tiers, would measure teacher-child interactions for preschoolers with the Classroom Assessment Scoring System and for infant/toddlers with the Program Assessment Rating Scale (CAEL QIS Advisory Committee, 2010).
¡ use the CLASS in a random sample of classrooms on a periodic basis. this would provide valuable information to supplement the ECERS-R data, particularly given the growing body of research that demonstrates the importance of quality adult-child interactions for children’s learning and development (AIR, 2007).
¡ Do not require the use of extensive on-site observational assessments. After the QRIS is in place, the Legislature could consider streamlined use of direct observational assessments, along with technical and financial assistance to help providers improve their ratings (Legislative Analyst’s Office, 2007).
¡ Establish five tiers, recognizing that it might take too long to move from one tier to the next in a three-tier system (CAEL QIS Advisory Committee, 2010).
Note: For discussion of recommendations on benchmarks for other dimensions of quality, such as family engagement, staff education and training, and program leadership, see the sections on family engagement and workforce development below.
3. To ensure that a QRIS is implemented successfully and fairly:
¡ Conduct a pilot of the QRIS:
� Implement recommendations from the Early Learning Advisory Council (ELAC) to pilot a state Quality Rating and Improvement System (Children Now, 2012).
� Launch an early pilot effort to measure the elements of family engagement and program leadership, and to assess the implications of including them in the QRIS system. Estimate the effects of voluntary implementation and/or targeting participation to publicly subsidized programs (Karoly, 2012b).
� Pilot test and phase in over five years. Launch a three-year pilot that includes sufficient time for planning and evaluation (CAEL QIS Advisory Committee, 2010).
� the system will initially be voluntary. After piloting, the QRIS can be required for publicly funded programs, and eventually for all licensed early learning and care programs.
� Explore options for a combination of state and local oversight, with QRIS reviews done at the county or regional level and the CDE providing oversight and assurance of consistency.

33 American Institutes for Research
Condition of Children Birth to Age Five and Status of Early Childhood Services in California
� Provide voluntary technical assistance to help programs improve, using a client-
based, data-based coaching model (CAEL QIS Advisory Committee, 2010).
� Develop and pilot the QRIS and tiered reimbursement system as part of the state’s
larger effort to create an Early Learning Quality Improvement System (Karoly, 2009).
� use a phased approach to implement the QRIS (Legislative Analyst’s Office, 2007):
1. Begin with posting existing licensing information on the Internet
2. Distill existing licensing records with a rating or grade
3. Pilot the system
4. the Legislature might then consider some additional features, such as streamlined
use of observational assessments, along with technical and financial assistance
to help providers improve their ratings.
¡ Build a strong network composed of 16 of the most rigorous communities that have
already established a QRIS. this locally based approach to the development of a QRIS
is better than a one-size-fits-all approach and will avoid new spending commitments
(State of California, 2011).
Family Engagement
There is a common theme in California-based studies of early learning and care: Families
are the major change agent affecting children’s school readiness and achievement. As a
result, there is widespread agreement that it is vital to engage families in their children’s
early learning and care programs and to increase parents’ understanding of the elements
that contribute to school readiness. Furthermore, many researchers stress the need for
special outreach to engage families whose home language is not English through their
children’s early learning and care settings. Outreach is especially needed when linguistic
isolation is combined with other risk factors, such as poverty and low parental education.
Finally, many studies underline the barriers to family engagement and suggest that
combining home visiting with early learning and care programs, especially for infants
and toddlers, may be an effective model.
Key Findings
1. Why is family engagement in early learning and care programs important? How does
family engagement affect children’s school achievement?
¡ Interaction between the child’s family and the child’s early learning and care setting
promotes the best child outcomes, improves school readiness, and contributes to
greater family involvement in children’s elementary school years (CAEL QIS Advisory
Committee, 2010, citing Meidel & Reynolds, 1999; Cannon, Jacknowitz, & Karoly,
2012).
¡ Research has shown that, regardless of family or cultural background, children whose
parents are involved in their education have better school attendance, higher test

34 American Institutes for Research
Condition of Children Birth to Age Five and Status of Early Childhood Services in California
scores, better social skills, and can adapt better to the school environment (CAEL QIS
Advisory Committee, 2010, citing Coughlan et al., 2009; Henderson & Mapp, 2002).
¡ Family engagement supports maintenance of home language and culture and promotes
high expectations, which in turn contributes to school achievement (Children Now, 2004,
citing Nieto, 1992).
2. How does family participation in early learning programs and home-based early learning
activities vary by income, race, and ethnicity?
¡ Parents of Spanish-speaking children reported that their children spent fewer hours
attending preschool per week relative to other groups, and reported lower frequency
of reading to their children and having fewer books at home (Love, Atkins-Burnett, &
Vogel, 2009).
¡ A majority of Latino, African-American, and Asian parents interviewed believe it is
important for their children to attend a program before the age of 5, but less than
30 percent actually do (New American Media, 2006). Half of Latino parents, a third
of African-American parents, and a quarter of Asian parents interviewed said that there
were no quality child care centers in their neighborhood or town that they could afford
(New American Media, 2006).
¡ Latino and African-American parents strongly supported bilingual preschool programs.
Asian parents were more divided on the issue (New American Media, 2006).
3. What are the best practices for family engagement in early learning and care programs,
and what are the chief barriers or challenges?
¡ the First 5 Power of Preschool counties have implemented various strategies to
engage families, and most report challenges in working with an immigrant population
(Evaluation Matters with First 5 California Staff, 2009; AIR, 2011).
¡ Almost every county requires parents of children in state-subsidized programs to
complete the Desired Results Developmental Profile (DRDP) parent survey, but, aside
from this, there is no uniformity for evaluating parent engagement activities (uCLA
Center for Healthier Children, Families and Communities, 2011).
¡ Early Head Start programs that utilized both center- and home-based approaches showed
better family outcomes (Mathematica, 2001).
¡ Lopez (2010, as cited in CAEL QIS, 2010) has identified three essential components to
effectively partnering with families: 1) strengthen the family-child bond and acknowledge
the primary role of the family in child development, 2) seek to understand cultural
differences in childrearing values and practices, and 3) build trust by sharing knowledge
between families and teachers about child development.
¡ Low-income mothers who have little education benefit from assistance in learning how
to read to their children – e.g., not just focusing on the literal meaning of words and
pictures, but asking children to predict and evaluate story events (AIR, 2011).

35 American Institutes for Research
Condition of Children Birth to Age Five and Status of Early Childhood Services in California
¡ Power of Preschool (PoP) programs have successfully used several family engagement
strategies. For example, Los Angeles universal Preschool (LAuP) used a Parent
Ambassador program, in which parents go to training on a monthly basis on topics
such as child development and community activities. Food is provided to attract
parents. LAuP also has a Parent Engagement Specialist on staff to communicate
with parents and provide trainings for providers. First 5 San Mateo and the San Mateo
County Office of Education have adopted the Virtual Pre-K program, which is a low-cost
series of lesson plan supports that link activities in the classroom to what parents can
do at home with their children, including activities in the local community (AIR, 2011)
¡ WestEd’s Family Partnership Initiative (FPI) trains staff in state-funded, center-based
programs and family child care homes to enhance partnerships between families and
staff. the training focuses on strategies to support children’s learning, highlight the
strengths each member brings to the partnership, and explore ways to nurture the
family-staff partnerships (WestEd, n.d.).
4. How can a QRIS inform families about the quality of services in early learning and
care programs?
¡ Studies show that although parents value high quality child care, they often do not identify
shortfalls. On key elements such as health, safety, and staff-child interaction, parents
rate centers almost twice as highly as trained observers. A system to inform parents
about the quality of services would be helpful (CAEL QIS, 2010, citing Helburn, 1995;
Barraclough & Smith, 1996; Wolfe & Scrivner, 2004; Cryer, tietze, & Wessels, 2002).
¡ to establish a “brand” for program quality rating scores, some states and localities
within California use stars or keys as icons to indicate levels of quality in early learning
and care programs (CAEL QIS Advisory Committee, 2010).
¡ It is important to have a public information campaign about the QRIS (Zellman and
Perlman, 2008 as cited in CAEL QIS Advisory Committee, 2010).
Recommendations
to move forward with family engagement, the following major recommendations emerged from
these reports:
1. To promote best practices in family engagement:
¡ Require programs to submit plans for how they will partner with families and meet their
cultural and linguistic needs, and how they will recruit and retain staff members who
reflect the community (Children Now, 2004).
¡ Make title 22 licensing requirements for both family child care providers and centers
include the provision of written information and orientation for families at the time of
enrollment (CAEL QIS Family Involvement and Stakeholder Engagement and Advocacy
Subcommittee Recommendations Paper, 2010).

36 American Institutes for Research
Condition of Children Birth to Age Five and Status of Early Childhood Services in California
¡ Consider funding programs in conjunction with other evidence-based strategies for
disadvantaged children, such as home visiting or programs that combine parent
education with center-based education (Karoly, 2012a; Cannon, Jacknowitz, & Karoly,
2012; Water Cooler Policy Report, 2012).
¡ Provide training for teachers on building partnerships with families (CAEL QIS, 2010).
¡ Support family engagement in developmental and early learning services for infants and
toddlers from the earliest points of their entry into the programs (Water Cooler Policy
Report, 2012).
¡ Provide Power of Preschool counties with more rigorous guidelines about how their local
evaluations should measure parent engagement practices (uCLA Center for Healthier
Families and Communities, 2011).
¡ Consider more direct training for parents in dialogic and interactive reading skills
(AIR, 2011).
2. To measure the level of family engagement in programs and to inform parents about the
quality of family engagement in a program:
¡ use the Environmental Rating Scale subscale for “Parents and Staff” to measurer
family involvement as well as the title 22 licensing requirements related to family
engagement as proxies for the family engagement element of the rating scale (CAEL
QIS Advisory Committee, 2010; Anthony & Muenchow, 2010).
¡ While the CAEL QIS committee recommended use of the Environmental Rating Scale
measure for family involvement, experts in family engagement responded by asking
for a more specific measureable menu of best practices for engaging families to be
included in the QRIS tiers. the California Early Childhood Educator Competencies (CDE,
2011) includes three competency areas that might serve as a springboard: Culture,
Diversity, and Equity (pp. 19–26), Family and Community Engagement (pp. 35– 42),
and Dual-Language Development (p. 48).
¡ Establish a brand for the QRIS that informs and promotes quality early learning and
care programs (CAEL QIS Advisory Committee, 2010).
¡ Engage state, county, and local agencies that are currently working with families to
assist with disseminating information to families, stakeholders, and the community.
Develop an outreach campaign supported by corporate and agency sponsors, and engage
spokespeople who speak the families’ language (CAEL QIS Advisory Committee, 2010).

37 American Institutes for Research
Condition of Children Birth to Age Five and Status of Early Childhood Services in California
Early Childhood Workforce Development
Researchers agree that early childhood educators who understand child development and
engage in effective interaction with young children are central to the effectiveness of early
learning and care programs in improving child outcomes. The early learning and care
programs that have been found to achieve dramatic improvements in child outcomes all
have highly qualified, well-compensated teachers with strong supervision. Recent studies
suggest, however, that degrees alone are not sufficient. Studies indicate that early childhood
higher education itself needs reform, with more focus on the desired child outcomes.
Researchers recommend that degree-bearing courses include more observation of early
educators in the settings where they work with infants, toddlers, and/or preschool-age
children, and that there be ample time for feedback on their effectiveness in interacting
with young children. Several studies also stress the importance of more systematic data
collection and the development of an early childhood workforce registry linked to K–12
workforce data. Without better data, these researchers say, California will not know
whether its considerable investment in early childhood workforce development is having
its intended effect.
Key Findings
1. How do teacher education qualifications affect the quality of early learning and care
programs, and how do they affect child outcomes? Do degrees—and particularly degrees
in child development and/or early childhood education—make a difference?
¡ A substantial body of research indicates that early educators with higher levels of
education and specialized training in early childhood education generally provide higher
quality classroom environments that have been shown to support child outcomes
more than teachers without such backgrounds. National and California-based studies
underlining the link between teacher education and program quality include: Barnett,
2004; Bowman, Donovan, & Burns, 2001; Bowman, Donovan, & Burns, 2001; Bueno,
Darling-Hammond, & gonzalez, 2010; Burchinal, Cryer, Clifford, & Howes, 2002;
Burchinal et al., 2000; Whitebook, 2003, as cited in CAEL QIS Advisory Committee,
2010; Center for the Study of Child Care Employment, 2003; Early et al., 2006, as
cited in Karoly, 2012b; Howes, Whitebook, & Phillips, 1992; Loeb, Fuller, Kagan, &
Carrol, 2004; National Institute of Child Health and Human Development (NICHD)
Early Child Care Research Network, 2002; NICHD ECCRN & Duncan, 2003; and
Phillipsen et al., 1997.
¡ teachers with B.A. degrees and specialized training in child development expose
children to larger vocabulary and provide richer language and cognitive experiences
(Bueno et al., 2010; Ackerman, 2005, as cited in CAEL QIS Advisory Committee, 2010);
have a better sense of how to do lesson plans; and are warmer, more sensitive, and
more engaging in their interactions with children (Ackerman, 2005; Zigler, gilliam, &
Jones, 2006, as cited in CAEL QIS Advisory Committee, 2010). this relationship has
been found for both center-based and family child care homes.

38 American Institutes for Research
Condition of Children Birth to Age Five and Status of Early Childhood Services in California
¡ teachers in preschool programs that demonstrate long-term benefits in children’s
achievement (including the Abecedarian program, Chicago Child-Parent Centers, and
others) have all held at least B.A. degrees and have had compensation similar to that
of public school teachers (Campbell, Ramey, Pungello, Sparling, & Miller-Johnson, 2002;
Cannon & Karoly, 2007a; Pianta, Barnett, Burchinal, & thornburg, 2009, as cited in
CAEL QIS Advisory Committee, 2010; Whitebook, gomby, Bellm, Saki, & Kipnis, 2009).
¡ However, several large-scale observational studies have recently questioned the
strength of the relationship between teacher education level or degree field and
classroom quality and child outcomes. Early et al. (2007) and Howes et al. (2008) did
not find a consistent, positive, and statistically significant relationship between teacher
education or degree field and classroom quality measures and child outcomes. Possible
explanations for the inconsistent findings include variations in the quality of the degree
programs themselves, in the level of support in the work environment, and in the level
of compensation. In addition, the expansion of early education programs in the last
decade may have attracted the most effective teachers without post-secondary
degrees to early education while the more successful teachers with B.A. degrees
moved into the early elementary grades (Karoly, 2012b).
¡ Overall, conclusions about the relationship between teacher education attainment
and child outcomes are limited because current research fails to examine how other
contextual factors play a role (Whitebook, 2003).
2. How much is known about the role of non-degree-related training on teacher effectiveness?
¡ Research on the contribution of training, other than degree programs, to teacher
effectiveness is less prevalent, has focused primarily on infant and toddler caregivers,
and has shown mixed results.
� Kreader, Ferguson, and Lawrence (2005, as cited in CAEL QIS Advisory Committee,
2010) found that in addition to formal education, specialized training in early care
and education is also associated with higher quality programs for infants and toddlers.
� there is some evidence that the Program for Infant toddler Care (PItC) has a positive
impact on the quality of care (Program for Infant toddler Care as cited in Anthony &
Muenchow, 2010). However, an independent study found that this model of caregiver
training combined with on-site coaching did not have a statistically significant effect
on overall measures of program quality, staff-child interactions, or children’s cognitive,
language, or behavior scores (Weinstock et al., 2012).
3. What are the current educational qualifications and non-degree training experience of the
early care and education workforce in California?
¡ Many members of the child care workforce have low educational levels, and teachers in
ECE typically work for much lower wages than teachers in grades K-12, and formal pay
scales are rare (Whitebook, gomby, Bellm, Sakai, & Kipnis, 2009).

39 American Institutes for Research
Condition of Children Birth to Age Five and Status of Early Childhood Services in California
¡ Recent studies suggest that many members of California’s early care and education (ECE) workforce do not have the desired skills and knowledge to be effective in their work with young children (Karoly, 2012b).
¡ Specifically, most early educators lack academic training in child development (Whitebook, gomby, Bellm, Sakai, & Kipnis, 2009). According to the 2004 California Early Care and Education Workforce Study (Whitebook, Sakai, Kipnis, Lee, Bellm, Speiglman, Almaraz, Stubbs, & tran, 2006), while 55 percent of directors in licensed centers reported having a bachelor’s degree, only 25 percent of lead teachers and 7 percent of assistant teachers had such qualifications.
¡ the workforce serving infants and toddlers is less likely to hold college degrees or credits than preschool providers (Whitebook et al., 2006). Infant-toddler providers, especially in home-based settings such as family child care, are more likely to speak English as a second language and to face barriers in attending college to meet professional development requirements
¡ Early childhood educators in California are not currently required to have any training in mathematics education (Stipek & Schoenfeld, 2012).
¡ In addition, early educators lack training in teaching dual language learners (WestEd, 2008) and students with special needs (Pew Center on the States, 2010). Based on some local Classroom Assessment Scoring System (CLASS) observations, many are also not fully effective in promoting children’s higher order thinking skills (AIR, 2009; Love, Atkins-Burnett, & Vogel, 2009).
4. What is the status of California’s higher education programs in the field of early education?
¡ As of 2005, approximately half of California’s colleges and universities offered courses to prepare ECE teachers. About three-quarters of these were at the community college level (Whitebook, Bellm, Lee, & Sakai, 2005).
¡ there is great variation in admission standards for higher education programs for early childhood educators, in expected student outcomes, and in the rigor with which higher education programs assess student learning (Whitebook, Austin, Ryan, Kipnis, Almaraz, & Sakai, 2012).
¡ California has recently taken a number of steps to build an ECE workforce professional development system (PDS), including (among others) publishing early childhood educator competencies; working to address past concerns regarding alignment and articulation within and across the state’s two- and four-year colleges and universities that offer ECE-related courses and degrees; and providing financial incentives through grants and stipends for those who seek additional education and training (Karoly, 2012b).
¡ According to California’s Early Learning Challenge grant application (State of California, 2011), there have been several recent state actions to strengthen workforce development:
� In 2006, a core curriculum of eight evidence-based courses was established for ECE preparation at California community colleges. this has been adopted by 102 of the

40 American Institutes for Research
Condition of Children Birth to Age Five and Status of Early Childhood Services in California
state’s 105 community colleges offering ECE programs. Alignment with the California State university’s four-year curriculum has also begun.
� With support from First 5 California and local First 5 commissions, the Child
Development Staff Retention Programs—Comparative Approaches to Raising
Educational Standards (CARES) and CARES Plus—have invested $450 million since
2001 in professional development and support for the early learning workforce.
these systems also provide robust data collection on the early learning workforce.
� the Early Childhood Educator Competencies were released in 2011, and this
represents a major step toward creating a well-designed, coordinated plan to
prepare early childhood educators in California.
� the CARES Plus database, hosted and funded by First 5 California, provides data
on the workforce, including both CARES Plus and AB 212 participants.
� Los Angeles and San Francisco counties are jointly developing a workforce registry
pilot that is aligned with common data elements in their local QRIS.
¡ California promotes teacher training in statewide tools such as the Desired Results
Assessment System, the Preschool and infant toddler Learning Foundations and
Curriculum Frameworks, the Program for Infant toddler Caregiving, and the California
Center for Social and Emotional Foundations for Early Learning (CSEFEL) Project by
strategically funding the California Preschool Instructional Network, WestEd, and other
organizations to provide statewide training. It has also promoted teachers’ ability to
attain higher child development permit levels and degrees through AB 212 Child
Development Staff training and Retention funding, the Child Development training
Consortium, and the California Early Childhood Mentor Program. these efforts need
to be integrated further into a coherent statewide system.
¡ Community colleges and state universities are making a concerted effort to improve
articulation and alignment of courses, but as of December 2010, only 19 colleges
had programs that were aligned, 20 were finalizing their alignment, and an additional
53 were working toward submitting their alignment. Eleven colleges had not yet agreed
to participate (CAEL QIS Advisory Committee, 2010).
¡ Although there have been important efforts to subsidize the attainment of early learning
and care degrees, the rules for access have been inconsistent across counties, and
funds to finance tuition assistance have been reduced or eliminated (CAEL QIS Advisory
Committee, 2010).
¡ though students studying early childhood education are of diverse backgrounds, many
faculty members in these programs are not; in 2005, nearly half of the higher education
programs had a 100-percent white, non-Hispanic full-time faculty (Whitebook, Bellm,
Lee, & Sakai, 2005).

41 American Institutes for Research
Condition of Children Birth to Age Five and Status of Early Childhood Services in California
¡ Several other key elements are not yet in place, including alignment of the state’s ECE
credentialing system with other components of the Professional Development System,
consistent quality of ECE higher education programs, and a workforce registry, and there
is only limited training available for working with dual language learners (Karoly, 2012b).
5. What are the major barriers to increasing the teacher education qualifications for the early
care and education workforce in California?
¡ California does not have the data systems to track the ECE workforce in terms of
enrollment in education and training programs and, as a result, little is known about
how well existing PDS resources are being used. Existing data do not allow accurate
counts of the number and mix of individuals who participate in publicly funded workforce
investment programs, and even less is known about the benefits of the myriad local
informal training opportunities that are available (Karoly, 2012b).
¡ Compensation in early childhood education is low (even for teachers who have B.A.
degrees), particularly in non-state-contracted centers receiving vouchers, and turnover is
high compared to that of better compensated K–12 teachers (Phillips, 2010, as cited in
CAEL QIS Advisory Committee, 2010; Whitebook, Bellm, Lee, & Sakai, 2005; Whitebook
et al., 2006; u.S. Department of Labor, 2009). Raising the educational qualifications
without providing equitable compensation may make it difficult to hire and retain the
best teachers (Pew Center for the States, 2010; Pianta, Barnett, Burchinal, &
thornburg, 2009, as cited in CAEL QIS Advisory Committee, 2010).
¡ Most early childhood education students are non-traditional college students, are
low-income women of color, and/or may have linguistic and cultural barriers to higher
education (CAEL QIS Advisory Committee, 2010; Pew Center on the States, 2010;
Whitebook, Bellm, Lee, & Sakai, 2005).
¡ Mentoring can work well as a strategy to address some of these barriers. In a case
study of two cohort programs (Whitebook et al., 2012), students in a program supervised
by a mentor were much more likely to report that they had received the guidance and
supervision they needed than students who had been supervised only by an instructor
or faculty member, or by staff at the clinical site.
6. What factors promote retention of qualified early educators in the workforce, and how
successful have programs such as Comprehensive Approaches to Raising Educational
Standards (CARES) been in promoting retention?
¡ Professional development can increase teachers’ job satisfaction. Feedback from staff
participating in the Preschool for All (PFA) program in San Mateo County, for example,
reflected a strong level of satisfaction with PFA-supported professional development
and indicated that PFA’s support of workforce development was one of its most
significant contributions to the provider community in San Mateo County (AIR, 2009).
¡ Participants in the Comprehensive Approaches to Raising Educational Standards
(CARES) program indicated that they were most satisfied with the incentive portion of
the program and least satisfied with the academic counseling. they were most likely to

42 American Institutes for Research
Condition of Children Birth to Age Five and Status of Early Childhood Services in California
strongly agree that their participation in the CARES program increased their desire to
stay in the early childhood education field, and they felt their participation in the program
provided some contribution to advancing their careers (Harder & Company, 2008).
7. What are the educational qualifications in the locally based QRIS systems in California, and
how successful have the systems been in promoting workforce development? Where there
has been success, what have been the keys to effectiveness?
¡ Some locally based QRIS systems have focused on increasing the education levels of
their staff.
� teachers in First 5 Power of Preschool (PoP) programs, for example, have high
qualifications (uCLA Center for Healthier Children, Families and Communities, 2011).
Among PoP master or lead teachers, almost 58 percent have at least a bachelor’s
degree, and an additional 30 percent have an associate’s degree.
� In the Los Angeles universal Preschool (LAuP) Program, 99 percent of the children’s
teachers had taken six or more classes in early childhood education or child
development; 88 percent of lead teachers held at least an associate’s degree; and
61 percent had a bachelor’s or higher degree (Love, Atkins-Burnett, & Vogel, 2009).
¡ Providing networking for agency leaders to discuss best practices may be one of the
keys to an effective system. In San Mateo County, all of the PFA classroom contractors
and representatives from partner agencies that support the preschool community in
the county noted the value of PFA as a forum through which key stakeholders could
network, share information, and generate solutions to problems (AIR, 2009).
8. How does the QRIS design proposed by the CAEL QIS Advisory Committee compare with
nationally recommended teacher qualifications for early learning and care programs?
¡ Staff education requirements proposed for lead teachers and program directors at the
top tier of the QRIS by the CAEL QIS Advisory Committee are generally well aligned with
standards recommended by the National Association for the Education of Young Children
(NAEYC, 1987) and the National Institute for Early Education Research (NIEER, 2010).
Recommendations
to move forward with efforts to develop the ECE workforce in California, the following major
recommendations emerged from these reports:
1. To motivate existing and potential early childhood educators to obtain appropriate
additional education and training:
¡ Implement a QRIS that advances teacher qualification requirements by tier (CAEL QIS
Advisory Committee, 2010; Children Now, 2012).
¡ Set higher compensation levels for ECE teachers if ECE teacher educational standards
are to be set higher to improve recruitment and retention (Harder and Company, 2008;
Whitebook, Sakai, Kipnis, Lee, Bellm, Speiglman, Almaraz, Stubbs, & tran, 2006;
Whitebook, 2003).

43 American Institutes for Research
Condition of Children Birth to Age Five and Status of Early Childhood Services in California
2. To improve the quality of higher education for early learning and care:
¡ Focus degree programs and ongoing training on particular areas where research
suggests teachers are not yet strong, such as dual language learners, children with
special needs, and adult-child interactions that support children’s cognitive and
language development (AIR, 2009; Love, Atkins-Burnett, & Vogel, 2009; Karoly, 2012b;
Whitebook et al., 2006).
¡ Require a course in math teaching for an associate’s or bachelor’s degree in early
childhood education, and requiring a focus on math instruction in the context of courses
for the Child Development teacher permit (Stipek & Schoenfeld, 2012).
¡ Pay attention to the content and quality of the degree program and the context of the
ECE work environment (which can support or hinder effective practice), rather than
focusing on attainment of particular degrees or credentials in isolation (Karoly, 2012b).
¡ Continue to address gaps in higher education program capacity, course offerings,
opportunities for field placements/practicums, and faculty quality and diversity (Karoly,
2012b).
¡ By 2012, develop the Early Childhood Educator Competencies—which include the
Foundations—into a common and comprehensive course of study that is reflected in
courses for associate’s and bachelor’s degrees and is delivered statewide. Require
credit-bearing courses for degrees.
3. To ensure that the state makes the most of its investment in workforce development of the
ECE workforce:
¡ Implement an ECE workforce registry, inclusive of all members of the workforce, to
identify who is in the field, their demographic characteristics, their educational and
professional development experiences and credentials, and their employment history
(Karoly, 2012b; Whitebook et al., 2012).
� Ensure that this workforce data system is compatible with K–12 workforce data
(Whitebook, gomby, Bellm, Sakai, & Kipnis, 2009).
� track infant-toddler provider participation in high quality workforce development that
is aligned with the ECE Competencies, the Foundations, and other standards (Water
Cooler Policy Report, 2012).
� Evaluate the effectiveness of higher education programs in promoting required ECE
competencies. Institute a more rigorous program of evaluation for funded programs,
including measurement of effects on participant competencies, quality of care
provided, retention in the ECE field, and child developmental outcomes, and how
those impacts are mediated by the work environment. A workforce registry could be
used to track program participants and outcomes (Karoly, 2012b); the Center for the
Study of Child Care Employment at uC Berkeley has begun to do this by recently

44 American Institutes for Research
Condition of Children Birth to Age Five and Status of Early Childhood Services in California
introducing the Early Childhood Higher Education Inventory, a system to help
policymakers and other stakeholders to track and coordinate professional
development for early care and education workforce (Whitebook et al., 2012).
4. To help students complete the required coursework and to address the challenges faced by
many early childhood education students:
¡ Develop a well-defined ECE career pathway and associated credentials that are aligned
with the Early Childhood Educator Competencies, the postsecondary education and
training programs, and the potential or actual QRIS (Karoly, 2012b).
¡ Continue the process of alignment and articulation of the ECE curriculum within and
across the California Community Colleges and the California State university system
(Karoly, 2012b).
¡ Ensure broad availability of college courses and professional development opportunities
for infant-toddler caregivers, and provide the additional supports for college readiness
that are needed by infant-toddler caregivers to help them satisfy course requirements
(e.g., foreign transcript review, English-language skill development, scholarships and
stipends) (Water Cooler Policy Report, 2012).
¡ Establish clear timelines with systemic support for an articulation and transfer process
within and among colleges and universities, building on community colleges’ efforts to
align courses with state university courses to create a pathway toward two- and four-year
degrees, but without creating dead ends for the early learning and care workforce (CAEL
QIS Advisory Committee, 2010).
� Implement a statewide common and comprehensive course of study based on the
Early Childhood Educator Competencies, with a clear timeline (CAEL QIS Advisory
Committee, 2010).
� Align the ECE workforce professional development system with California’s K–12
system, including the new transitional Kindergarten program established by the 2010
Kindergarten Readiness Act. Consider the reintroduction of a preschool-grade three
teaching credential (Karoly, 2012b; Stipek & Schoenfeld, 2012).
� Ensure that the Competencies adequately prepare infant-toddler professionals,
especially on issues important to the birth-to-3 years, such as reflective practice,
emergent language, and family engagement (Water Cooler Policy Report, 2012).
¡ Address the need for financial supports for practitioners to pursue additional education
and professional development, either through the workforce investment programs or
the QRIS, if one is implemented (Karoly, 2012b; CAEL QIS Advisory Committee, 2010;
Whitebook et al., 2006).
¡ Strengthen efforts to expand higher education offerings to more remote communities
without college campuses, to utilize distance learning and web-based training resources,
and to engage community agencies in offering credit-bearing training. Make classes

45 American Institutes for Research
Condition of Children Birth to Age Five and Status of Early Childhood Services in California
available in the community and after hours (CAEL QIS Advisory Committee, 2010;
Karoly, 2012b; State of California, 2011; Whitebook et al., 2006).
¡ Phase in specialized accreditation for ECE A.A. and B.A. programs (Karoly, 2012b).
5. To improve knowledge in terms of the relationships between characteristics of higher
education programs, professional development, and child outcomes:
¡ Conduct research to refine hypotheses about the relationship of practice and child
outcomes with the intensity of professional development activities, the timing and
sequencing of training and practice components, and the practitioner’s level of formal
education, in both home- and center-based settings and with diverse groups of children
(Karoly, 2012b; Whitebook, gomby, Bellm, Sakai, & Kipnis, 2009).
¡ Additional research is also needed on the efficacy of various approaches to teacher
preparation (Whitebook, Austin, Ryan, Kipnis, Almaraz, & Sakai, 2012; Whitebook,
gomby, Bellm, Sakai, & Kipnis, 2009).
� Make more finely developed data elements about faculty background the norm
of ECE teacher preparation research.
� Maintain up-to-date information on both the capacity and content of higher
education programs.
� Require institutions to report changes in their offerings to a central information
repository, whether in response to state policies, funding, or other institutional
dynamics.
� egularly update data about faculty members and maintain in a data system, such
as an early childhood workforce registry.
¡ Research should identify the characteristics of child care providers who are more likely
to stay in the field in order to help policymakers develop strategies and programs to
support stabilizing and strengthening the child care workforce (Harder & Company, 2008).
¡ Because current educational requirements for early care and education providers in
different settings differ (e.g., license-exempt care, compared to title 5 programs,
compared to Head Start), research on ECE teacher effectiveness should include
examinations of the influence of factors in the teaching work environment and the
role of ECE center directors on teacher practice (Whitebook, gomby, Bellm, Sakai,
& Kipnis, 2009).

46 American Institutes for Research
Condition of Children Birth to Age Five and Status of Early Childhood Services in California
Dual Language Learners
Researchers agree that dual language learners (DLLs) are at some educational risk,
based on well-documented achievement gaps between English learner and non-English
learner students in elementary and secondary school, but this risk is also largely because
language-isolated dual language learners in California typically have other risk factors as
well, such as poverty and low maternal education. Several studies have found that center-
based care for this group of children in the year before kindergarten is especially effective
in improving children’s early reading skills. But at least a third of language-isolated DLL
children do not attend, and those who do tend to participate for fewer hours than children
from other backgrounds. Researchers therefore focus on outreach to language-isolated
DLLs and their families as part of the solution to the achievement gap.
Key Findings
1. How effective are early learning and care programs in helping to prepare dual language
learners (DLLs) who have other risk factors, such as poverty and parents with little education,
for kindergarten and success in school? Which educational strategies work best?
¡ A California study found that English learners (ELs) were behind their peers on measures
of school readiness at kindergarten entry, and that the gaps were still seen through
third grade (Cannon & Karoly, 2007). Among EL children, it is the linguistically isolated
children—where at least one parent is an immigrant, the primary home language is not
English, and parents do not speak English very well or do not speak English at all—who
are at greatest risk (Cannon, Jacknowitz & Karoly, 2012). Such children are also likely
to have other characteristics that put them at risk of poor performance: three quarters
of these children have mothers with less than a high school education, for example, and
41 percent come from families with a household income below the federal poverty level.
¡ Researchers have found evidence, with large effect sizes, supporting center-based
care participation in the year before kindergarten entry as a means to improve early
reading skills for language-isolated children. Similar gains have not been found in early
mathematics skills, however (Cannon, Jacknowitz, & Karoly, 2012; Karoly, 2012a).
¡ From fall 2007 to spring 2008, 45 percent of the children in the LAuP program who
took the battery of child assessments in Spanish in the fall showed sufficient proficiency
to be tested in English in the spring; this suggests that progress is being made in
preparing children for an English-only public school enrollment (Love, Atkins-Burnett,
& Vogel, 2009). At the same time, however, performance of Spanish-only and primarily
Spanish-speaking children on an early writing test was in a range that suggests possible
educational risk, as was performance on expressive language.
¡ Children who participated in the Family Literacy Initiative in the Los Angeles unified
School District had significantly higher attendance rates and standardized test scores
in mathematics and English language arts, but had English language development scores
in elementary school that were similar to those of children who did not participate in the
program (AIR, 2011).

47 American Institutes for Research
Condition of Children Birth to Age Five and Status of Early Childhood Services in California
¡ the language development pathways of ELs are complex and varied, and there is the
potential for cultural and linguistic bias with each different purpose and approach to
early childhood assessment (Espinosa & López, 2007).
2. To what extent are dual language learners participating in early learning and care programs
in California?
¡ A third of language-isolated children do not participate in any center-based care in the
year before they enter kindergarten (Cannon, Jacknowitiz, & Karoly, 2012).
¡ Linguistically isolated infants and toddlers in non-parental care are primarily in license-
exempt home-based arrangements, where the caregivers may have little background in
English and find it difficult to access any training in child development (Water Cooler
Policy Report, 2012).
¡ Among Latino and Asian children, preschool child enrollment rates were lower for
children in households where someone over the age of 14 did not speak English
fluently (35 percent), compared to children in households with older members who
spoke English fluently (50 percent) (Lopez & de Cos, 2004).
3. What are the most promising practices for increasing DLL enrollment and working with DLLs?
¡ In the First 5 Power of Preschool programs, teachers and administrators were provided
with courses and trainings to assist them in supporting dual language learners. Counties
also reported recruiting PoP sites and staff based on their knowledge and experience
with DLLs, using parent volunteers, requiring parent participation, organizing cultural
celebrations, and promoting acceptance through diversity in daily routines (uCLA
Center for Healthier Children, Families and Communities, 2009).
¡ Home languages are critical to second-language development. the English Learners,
Language, and Literacy in the Early Years (ELLEY) training program promotes preschool
English language instruction that uses children’s first-language skills as a foundation for
speaking, listening, and reading in their second language (WestEd, 2008).
¡ Preschool centers serving isolated DLLs may be missing an opportunity to improve
children’s mathematics skills (Cannon, Jacknowitiz, & Karoly, 2012; Stipek &
Schoenfeld, 2012).
Recommendations
CDE has taken recent action to provide tools and strategies to share best practices for working
with DLLs:
¡ the Preschool Learning Foundations and Curriculum Frameworks include English
Language Development as a distinct and critical domain, apart from the Language and
Literacy domain. the two documents provide the research case and explicit direction in
how to support young dual language learners and allow them to grow in their home
language and English in preschool settings.

48 American Institutes for Research
Condition of Children Birth to Age Five and Status of Early Childhood Services in California
¡ the Preschool English Learner guide (CDE, 2007), combined with training DVDs and
in-person training by the California Preschool Instructional Network, strive to instill best
practices in state-funded child development programs.
¡ Finally, the California Early Childhood Educator Competencies (CDE, 2011) includes
several competency areas that are particularly critical to working with young DLLs:
Dual Language Development; Culture, Diversity and Equity; and Family and Community
Engagement. the Competency Integration Project underway aims to integrate best
practices into ECE teacher preparation courses in the state over time.
to move forward in assisting dual language learners, the following major recommendations
emerged from these reports:
1. To promote enrollment of dual language learners in early learning and care:
¡ State policymakers might consider targeting the subgroup of children with non-English
speaking parents for enrollment in preschool to help improve school-entry reading skills
among California’s English learners (Karoly, 2012a).
¡ Outreach to parents of Spanish-speaking-only and primarily-Spanish-speaking children
to encourage better attendance may be part of a solution to the language achievement
gap (Love, Atkins-Burnett, & Vogel, 2009).
2. To increase the effectiveness of early learning and care for dual language learners:
¡ Focus on incorporating research-based strategies to teach dual language learners,
which would include incorporating more Spanish-language support (AIR, 2011).
¡ Move toward thinking of educating English learners as a systemic issue, something
relevant to all teachers instead of just EL specialists. Provide training on dual language
learner strategies to all teachers (WestEd, 2008).
¡ Expand training opportunities for infant-toddler providers in supporting the needs of
dual language learners, including increasing access to evidence-based professional
development programs for providers who are themselves English language learners
(Water Cooler Policy Report, 2012).
¡ Instructional and assessment approaches should consider the various language
development pathways and diversity within the EL population, and should be able to
identify issues specifically related to being an EL versus other factors (National Early
Childhood Accountability task Force & First 5 LA, 2007).
¡ In the classroom, give DLL students the opportunity to use oral language for varied
purposes, forge connections between material that is already familiar to them and
new material to be learned, and provide students with visual clues to help with
understanding (WestEd, 2008).

49 American Institutes for Research
Condition of Children Birth to Age Five and Status of Early Childhood Services in California
Developmental Screening
Developmental screening in early learning and care programs using a validated tool is
increasing, but often is not conducted early enough in the program year to refer children
to effective intervention and services. Research suggests that best practices for improving
the screening rate include building relationships with families.
Key Findings
1. How effective are early learning programs in California in implementing developmental
screening?
¡ All counties participating in the Power of Preschool program reported that some or
all of their providers use the Ages and Stages Questionnaire (ASQ) for developmental
screening. Some used additional mental health screening tools (uCLA Center for
Healthier Children, Families and Communities, 2011).
� However, finding time for teachers to complete ASQs and other screening instruments
was a challenge for some PoP counties (AIR, 2011).
¡ Among the children in the LAuP study (2009) whose teachers reported screening,
34 percent were screened with the Ages and Stages Questionnaires.
� However, one third of children were in classes where the teachers reported that they
did not screen children for health or developmental problems.
¡ Special Needs Project (SNP) sites were successful at screening all children at young
ages (First 5 California & WestEd, 2010).
� Methods for successfully screening large numbers of children included building
relationships with families, collaborating with partner agencies, home visits, and
having well-trained screeners who conducted one-on-one screenings with families.
Recommendations
to move forward in improving developmental screening, the following major recommendations
emerged from these reports:
1. Steps should be taken to ensure that screening for developmental and health problems
is conducted for all children, in all classrooms, early in the program year to determine if
children may be eligible for IDEA services (Love, Atkins-Burnett, & Vogel, 2009).
2. Standardization of screening tools would facilitate revising assessment results and making
consistent decisions across classrooms and groups of children (Love, Atkins-Burnett, &
Vogel, 2009).

50 American Institutes for Research
Condition of Children Birth to Age Five and Status of Early Childhood Services in California
Assistance to Children with Special Needs
Families with children with disabilities often have difficulty finding high quality child
care for their children. Enrollment of children with special needs in the First 5 Power of
Preschool program varies considerably across counties. Overall, counties participating in
the Power of Preschool program reported a strong push for the inclusion and integration
of children with special needs into mainstream classrooms. Outreach to families and
teacher training in this area should be improved.
Key Findings
1. To what extent are high quality early learning and care programs serving children with
special needs or disabilities?
¡ the 10 School Readiness programs that connected with First 5 California Special
Needs Project (SNP) sites (through 2005) provided more services and supports for
children with special needs than School Readiness programs that do not connect to
SNP sites.
2. To what extent are publicly supported programs encouraging a greater number of children
with special needs to participate?
¡ Children with special needs accounted for 5.3 percent of the children enrolled in the
First 5 Power of Preschool program, with more than 10 percent of the children in Los
Angeles and San Joaquin Counties having special needs. Every participating county
reported using strategies to enroll children with special needs (uCLA Center for
Healthier Children, Families and Communities, 2011).
¡ In the 2009 Power of Preschool Evaluation (Evaluation Matters with First 5 California
Staff, 2009), most PoP counties did not report specific outreach strategies to reach
children with special needs. San Diego, however, conducted outreach meetings and
waived residency criteria to encourage a greater number of children with special needs
to participate.
3. To what extent are children with special needs participating in programs that include
typically developing children?
¡ Families with children with disabilities often have difficulty finding high quality child care
for their children (Neas & Mezey, 2003).
¡ Counties participating in the Power of Preschool program reported a strong push for the
inclusion and integration of children with special needs into mainstream classrooms
(uCLA Center for Healthier Children, Families and Communities, 2011).
¡ the 10 Special Needs Project sites reported successfully including children with special
needs in regular settings (First 5 California, 2010).

51 American Institutes for Research
Condition of Children Birth to Age Five and Status of Early Childhood Services in California
Recommendations
to move forward in improving assistance to children with special needs, the following major
recommendations emerged from these reports:
1. Outreach to children with special needs should be improved (Evaluation Matters with First
5 California Staff with First 5 California Staff, 2009).
2. Teacher preparation should include training on working with children with special needs.
Resources for teachers are available on both the Child Care Law Center (www.childcarelaw.
org) and First 5 California (www.cccf.ca.gov) websites.
Early Childhood Mental Health/Behavioral Health Services
Social-emotional and behavioral health in young children is an important component of
school readiness. Early childhood mental health consultation consists of mental health
professionals partnering with early care and education professionals to promote the social
and emotional well-being of children. These services, along with training provided through
the Center for Social and Emotional Foundations for Early Learning (CSEFEL), should be
expanded in ECE settings throughout the state.
Key Findings
1. How is early childhood mental health related to school readiness?
¡ It is well documented in the literature that healthy social and emotional development
for infants depends on their relationships with caregivers (see, for example, Pitcl
& Provance, 2006).
¡ Persistent conduct problems are associated with poor academic performance, delinquency,
and substance abuse in later childhood (McCabe & Frede, 2007, as cited in Alameda
County Early Childhood Mental Health Systems group, 2009). When preschool teachers
fail to handle social-emotional problems well, they perpetuate unregulated behaviors in
children (Arnold, McWilliams, & Arnold, 1998, as cited in Alameda County Early Childhood
Mental Health Systems group, 2009).
2. How effective are early learning programs in California in implementing early childhood
mental health services?
¡ though many young children have shown a need for mental health services, intervention
for children under five has been rare until recently, because mental health service delivery
for these young children has required modifications from traditional practice in terms of
family engagement, assessment, diagnosis, treatment models, and location of service
delivery (Finello, Hampton, & Paulsen, 2011). One model that is becoming more prevalent
is early childhood mental health consultation (Alameda County Early Childhood Mental
Health Services group, 2009).

52 American Institutes for Research
Condition of Children Birth to Age Five and Status of Early Childhood Services in California
¡ Early childhood mental health consultation consists of mental health professionals
partnering with early care and education professionals to promote the social and
emotional well-being of children. Services can include general consultation with teachers
about child development and classroom environments, child-specific consultation to staff
or families, program consultation, or direct mental health services (Pitcl & Provance, 2006;
Alameda County Early Childhood Mental Health Systems group, 2009). the results of
an evaluation of a 17-month mental health consultation program in seven ECE programs
in Alameda County showed significant improvements in teacher ratings of children’s
social competence and of children’s levels of aggression and withdrawn social behavior
(Alameda County Early Childhood Mental Health Systems group, 2009).
¡ Education, practice, and time are required for clinicians and agencies to become
proficient with newly introduced mental health practices.
¡ the Center on the Social and Emotional Foundations for Early Learning (CSEFEL) aims
to foster professional development of the ECE workforce in order to enhance its skill in
supporting the social emotional development of children under 5. CSEFEL’s model has
been implemented in several California communities, which have experienced positive
changes for supporting children’s social-emotional development and children with
challenging behaviors.
Recommendations
to continue to improve the availability and quality of early childhood mental health services in
California, the following major recommendations emerged from these reports:
1. Establish a common, cohesive, effective approach for social-emotional development across
the state by using the CSEFEL model, which aligns with California’s social-emotional
Preschool Learning Foundations (California CSEFEL Project, 2011).
2. Increase Early Childhood Mental Health Consultation in family child care programs
(Alameda County Early Childhood Mental Health Systems Group, 2009).
3. Professionals providing treatment and interventions should have basic knowledge in
key areas such as those outlined in the California Training Guidelines and Personnel
Competencies for Infant-Family and Early Childhood Mental Health, Revised (Finello,
Hampton, & Poulsen, 2011).
4. Clinical judgment, combined with parent voice, is needed to set priorities, choose, and
adapt programs in ECE settings (Finello, Hampton, & Poulsen, 2011).
5. The mental health system, policymakers, and funders must commit to creating and
sustaining a trained workforce in mental health (Finello, Hampton, & Poulsen, 2011).
6. All agencies implementing evidence-based practices for children birth to five should be
required to engage in ongoing reflective practice supervision and evaluation efforts
(Finello, Hampton, & Poulsen, 2011).

53 American Institutes for Research
Condition of Children Birth to Age Five and Status of Early Childhood Services in California
7. Continue to fund research on the short- and long-term effectiveness of early childhood
mental health services (Alameda County Early Childhood Mental Health Systems Group,
2009; Finello, Hampton, & Poulsen, 2011).
Child Assessment to Support School Readiness
Researchers support the use of child observational assessments to improve program
quality, and improve instruction to children, and generally provide information on whether
the status of children’s readiness is improving. They also support the use of a battery of
child assessments by outside trained evaluators on a sample of children to evaluate the
effectiveness of a program. But leading researchers question the validity, practicality, and
cost of using child observational assessments by teachers for high-stakes purposes, such
as serving as a component in a rating scale linked to provider payment levels.
Key Findings
1. What are the purposes of child observational assessments in supporting school readiness?
¡ Child assessments can be used to inform ECE practices, improve program quality,
determine effectiveness of interventions, or validate QRIS ratings (Karoly, 2012b).
¡ However, using child assessments as a QRIS rating component is risky; the methodology
is complex, is not sufficiently developed for high-stakes purposes, and is costly to
implement for uncertain gain (Karoly, 2012b).
2. Is California’s Desired Results Developmental Profile – School Readiness (DRDP-SR) an
appropriate tool for assessing school readiness? How is it currently being administered?
¡ the DRDP-SR has been developed as an observational assessment for kindergarten
entry, and is aligned with the Foundations and the Common Core standards (State of
California, 2011).
¡ A pilot is in progress to determine the validity and reliability of the instrument (State
of California, 2011).
¡ Numerous counties have used kindergarten readiness observation assessments
effectively (Children Now, 2012).
3. Is it legitimate and feasible to use the results of child observational assessments to
evaluate the effects of a program on developmental outcomes? What alternative
approaches are available?
¡ Feedback on the DRDP-R was generally positive from the First 5 Power of Preschool
counties, while two counties said that while it was helpful for monitoring progress and
informing instruction, it was not appropriate for evaluation purposes (uCLA Center for
Healthier Children, Families and Communities, 2011).

54 American Institutes for Research
Condition of Children Birth to Age Five and Status of Early Childhood Services in California
¡ there appears to be inconsistency in the way schools and teachers collect DRDP-R data
(Evaluation Matters with First 5 California Staff, 2009). In order for First 5 California to
draw solid conclusions about the effectiveness of the Power of Preschool program,
reporting of DRDP data and any other child-level assessment that may be requested at
the individual child level is critical for accurate analysis of data (uCLA Center of
Healthier Children, Families and Communities, 2011).
Recommendations
CDE is planning to link the DRDP-SR data to the CALPADS system in the 2013–14 school year
(California Department of Education Child Development Division, 2012). to move forward on
appropriate and effective use of child assessments, the following major recommendations
emerged from these reports:
1. Invest in training and technical assistance to counties on how to report DRDP results on an
individual basis while de-identifying data securely. Ensure that this child-level data can be
linked to other data at the classroom and teacher level (UCLA Center for Healthier Children,
Families and Communities, 2011).
2. Identify and address children’s needs earlier in their lives through ongoing, developmentally
appropriate assessments, including the adoption of a statewide kindergarten assessment
observation instrument (Children Now, 2011).
3. Promote the use of child assessments by ECE caregivers and teachers to improve practice.
Provide professional development to support effective use by teachers (Karoly, 2012b).
4. Implement a statewide evaluation of specific ECE programs or the broader ECE system,
using independent assessors to measure child functioning to evaluate effects of specific
ECE program or groups of programs on child development outcomes.
5. Proceed with caution if considering a QRIS rating component that is based on estimates
of a program’s effect on child outcomes (Karoly, 2012b). The methodology is insufficiently
developed for high-stakes purposes.
Effective Practices for Child Data
Multiple studies and policy reports recommend the establishment of a statewide data
system in which all children in early care settings are assigned a unique identifier to
follow them into the K–12 system. The use of a child identifier would allow linking across
program data sets, to determine the extent to which children are served in more than one
setting, help to measure school readiness, establish more efficient program management
and administrative functions, and improve teacher and provider effectiveness, and,
ultimately, provide trend data regarding whether enrollment in high quality early learning
and care programs is associated with improved child outcomes in elementary school.
Currently several counties in California collect comprehensive data on children in early
learning and care settings, assigning them a unique child identifier so that outcomes
may be tracked over time.

55 American Institutes for Research
Condition of Children Birth to Age Five and Status of Early Childhood Services in California
Key Findings
1. What role do data practices play in an integrated early learning system? What are the
components of an effective early educational data system, and how should early
educational data relate to K–12 data?
¡ the CAEL QIS Advisory Committee identified nine key principles for an early learning
and care data system (CAEL QIS, 2010):
� Confidential
� useable and practical
� Accessible and inter-operable
� Respects current databases and builds on them
� transparent
� Includes and connects child, family, teacher and provider, and program data
� Provider-friendly
� Easily adaptable and can grow and change over time
� Dynamic
2. What are the chief barriers to such a data system?
¡ Implementation of the K–12 data system (CALPADS and CALtIDES) has been slow, and
efforts to integrate preschool data into the system have only just begun (Karoly et al.,
2009). the only data available statewide is DRDP Access assessment data on
children receiving IDEA Part B services, captured in the California Longitudinal Pupil
A Achievement Data System (CALPADS) with a unique identifier for each child (State
f California, 2011).
¡ However, some California counties already use some form of unique student identifier
(ELCg, 2012; uCLA Center for Healthier Children, Families and Communities, 2011).
Recommendations
1. To implement an effective longitudinal data system statewide:
¡ Fund the implementation of a P–16 longitudinal data system, including a unique child
identifier (CAEL QIS, 2010; Children Now, 2012; RAND, 2009).
¡ Include infants and toddlers in the data system as well (Anthony & Muenchow, 2010;
Water Cooler Policy Report, 2012).

56 American Institutes for Research
Condition of Children Birth to Age Five and Status of Early Childhood Services in California
¡ the use of a child identifier would allow linking across program data sets, to determine
the extent to which children are served in more than one setting, and, ultimately, whether
enrollment in high quality early learning and care programs is associated with improved
child outcomes in elementary school (Anthony & Muenchow, 2010). Additionally, such
a system could help to measure school readiness, establish more efficient program
management and administrative functions, and ultimately improve teacher and provider
effectiveness (CAEL QIS, 2010).
¡ to get an accurate count of which children are being served, enrollment data for all
publicly subsidized programs should be collected by zip code of the child’s residence,
age cohort, and type of program (e.g., licensed, voucher, and exempt care) (Anthony
& Muenchow, 2010).
¡ Leverage existing data systems to eliminate duplicative reporting and collection and
improve data quality.
¡ Consider using a child’s birth certificate registration number as a unique identifier,
which would facilitate including infants and toddlers as well as preschool children
in the data system (CAEL QIS, 2010).
¡ Develop a system that connects early learning and education with juvenile justice, child
welfare, and other data in order to better track and address the educational outcomes
and well-being of children throughout their lives (Children Now, 2012).
2. To pilot an effective data system:
¡ Strategically sample a few hundred children throughout PoP counties and track them
longitudinally. San Mateo County Preschool for All has done so in partnership with the
Redwood City unified School District, following participating children through grade three
(Mallonee, Sanchez, & London, 2011).
¡ Participating Regional Leadership Consortia should use the National Data Quality
Campaign guidelines to support uniformity of data fields and terms (as approved in
the Early Learning Challenge grant application).
¡ In 2013–14, use Rtt-ELC grant funds to provide incentive for Regional Leadership
Consortia districts to report their transitional Kindergarten and kindergarten DRDP
results into CALPADS. CALPADS should be fully functional to receive DRDP-SR data
on a voluntary basis starting in 2014–15 (as approved in the Early Learning Challenge
grant application).

57 American Institutes for Research
Condition of Children Birth to Age Five and Status of Early Childhood Services in California
Facilities
Among the studies conducted, there is agreement that there is a shortage of early learning
and care facilities, especially in low-income neighborhoods. Barriers to expansion include
lack of public and private financial resources, land use barriers, outdoor space requirements
and other restrictions, and provider inexperience with facilities development and financing.
Major recommendations include improving facilities financing through inclusion of child
care facilities in city/county plans and/or school bond issues, and advocating for child-
friendly land-use policies.
Key Findings
1. Is there a shortage of facilities to house early learning and care programs in California?
¡ California lacks suitable space for preschool programs, whether universal or targeted
towards specific child populations—such as children living in poverty, children whose
parent(s) did not graduate from high school, and children of color (Advancement
Project, 2007).
2. How safe and inviting are the facilities that exist?
¡ In addition to the quality of teacher-child interactions, the space children learn in is also
important; inadequate or poorly designed space can reduce the effectiveness of the
program — even when the other factors are very high quality (LISC, 2004).
¡ California child care licensing regulations require child care centers to maintain a fire
clearance approved by the fire department, clean drinking water, a disaster plan, and an
appropriate, safe number of children for the space (California Department of Health and
Human Services, 1998).
¡ However, children are also likely to be exposed to pesticides, arsenic-treated lumber,
lead, and common asthma triggers in some home- and center-based child care settings
(Community Environmental Council, 2004).
3. What are the major barriers to expanding facilities?
¡ Only a few localities in California include child care as an element in their city and
county plans. Presently, in communities without such language, early care and education
centers do not clearly belong in commercial or residential zones but must be considered
as unique situations.
¡ A lack of local public and private financial resources and land use barriers (e.g., excessive
permit fees and conflicting regulatory requirements) were identified as the greatest
concerns amongst child care intermediaries (Low Income Investment Fund l, 2010).
¡ In addition, local development standards, procedures, and planning processes prohibit
the development of larger child care facilities (the BCC Project, 2007).

58 American Institutes for Research
Condition of Children Birth to Age Five and Status of Early Childhood Services in California
¡ Outdoor play space requirements pose barriers for the development of child care
facilities in urban areas (the BCC Project, 2007).
¡ Child care operators lack the proper services and resources to guide them through
all stages of facilities development and financing (Low Income Investment Fund, 2010;
Building Child Care Collaborative, 2007).
Recommendations
1. To improve facilities financing:
¡ Include child care in city/county general Plans (Advancement Project, 2007).
¡ Expand facilities development and financing models, such as ABCD Constructing Connections, to interested communities (Low Income Investment Fund, 2010).
¡ Increase local facility financing by identifying potential public sources of capital, and engaging local businesses in existing early care and education efforts to help advocate for increased public capital and to promote local fund development efforts (Low Income Investment Fund, 2010).
¡ Make preschool facilities part of the next statewide education facilities bond, with the largest bond amount that is feasible (Advancement Project, 2007).
¡ Standardize permit processes and fees across jurisdictions so they are clearer and reasonable (Building Child Care Collaborative, 2007).
¡ Distribute bond funds as a grant, as is done with funds for school districts, county offices of education, and charter schools. A match should not be required because there are no local funding sources of matching dollars for preschool facilities to which all entities have equal access. Funds should be distributed to local education agencies because they already have the expertise and ability to rapidly construct educational facilities (Advancement Project, 2007).
¡ Focus funds where the need is greatest: where more than 80 four-year-olds lack preschool space, and either (1) the API score of the local schools is a 1, 2, or 3, or (2) the local elementary school is in the top 25 percent of the schools in the state that receive free and reduced-price lunches (Advancement Project, 2007).
2. To remove land use barriers:
¡ Advocate for child care–friendly land use policies and procedures that encourage child care facility development (e.g., reducing permit fees, reducing/eliminating traffic impact fees, increasing the number of areas zoned for child care).
¡ Play space requirements should be adjusted to allow exceptions for urban areas (the BCC Project, 2007).
¡ Local education agencies should use the land they currently have on their K–5 campuses for early learning centers, especially on campuses that are experiencing declining enrollment (Advancement Project, 2007).

59 American Institutes for Research
Condition of Children Birth to Age Five and Status of Early Childhood Services in California
3. To help providers establish and renovate facilities:
¡ Provide training and technical assistance to ECE operators and providers on all phases
of facility development (Low Income Investment Fund, 2010).
¡ Provide child care providers with information and training about how to protect children
from exposure to health hazards (Community Environmental Council, 2004).
Food and Nutrition
Obesity and oral health are both recent concerns among young children. Nutrition
programs located in early care and education settings can help to address both of these
concerns, as well as provide sufficient food for children in low-income families. Though
California has the highest number of children participating in the Child and Adult Care
Food Program, fewer than half of eligible providers participate in this program. The Child
Care Nutrition Environment Advisory Group has issued specific recommendations to
strengthen this program. Other major recommendations include establishing nutrition
and physical activity requirements for child care programs, coordinating messaging to
families regarding nutrition and physical activity, and supporting policies to encourage
the consumption of nutritious foods.
Key Findings
1. To what extent are obesity and dental disease a problem among children birth to five
in California?
¡ Obesity
� As described in Section I, 10 percent of children between birth and five are
overweight (CHIS, n.d.a).
� the Children of LAuP study (2009) found that 20 percent of the children participating
in the Los Angeles universal Preschool program were obese.
� Children Now gave California a grade of “C-” for its relatively high rate of
childhood obesity.
¡ Oral Health
� 54 percent of kindergartners have a history of tooth decay (Dental Health
Foundation, 2006).
� As described in Section I, 27 percent of children between birth and five have never
been to the dentist (CHIS, n.d.b).
� Children Now graded the state of children’s oral health in California as a “D.”
� California is in the bottom three states for children’s oral health (Children Now, 2011).

60 American Institutes for Research
Condition of Children Birth to Age Five and Status of Early Childhood Services in California
2. How many children participate in the federal Child and Adult Care Food Program (CACFP),
and what are the major challenges to improving the program?
¡ In the 2009–10 school year, over 430,000 children in California were enrolled in
the CACFP located at child care centers and day care homes, with an average daily
participation of 199,833 in child care centers and 120,732 in day care homes
(CDE, 2011).
¡ Although California has the highest number of children participating in the CACFP than
any other state (uSDA, 2012), less than half of eligible California child care providers
actually participate in the program (CDE, 2011).
¡ this is unfortunate, because participation in the CACFP can help improve children’s
diets (Bruening, gilbride, Passannante, & McClowry, 1999) and meals and snacks from
the CACFP are the main source of nutrition for many children in low-income families
(Parker, 2000).
¡ Challenges to improving the quality of the CACFP include the following:
� Little change has been made to the CACFP’s meal pattern requirements in the last
40 years, although scientific evidence has improved our knowledge on nutrition and
physical activity.
� CACFP physical activity standards for children in child care do not exist.
� CACFP sites and sponsors indicated that the excessive amounts of work required for
compliance and accountability reporting were barriers to participating in the program
(CDE, 2010).
� Participation in the CACFP remains low, especially in family day care homes.
� In June 2012, governor Brown vetoed the $10 million in supplemental state funding
for the Child Care and Adult Food Program; if these centers and family child care
homes do not find another sponsor, as many as 150,000 children could lose access
to free and reduced-price meals (Child Development Policy Institute, 2012).
3. What are the major challenges to improving nutrition and physical activity in child
care settings?
¡ the various types of child care settings in California, the different practices and resources
used by each setting, and the different rules, regulations, and agencies that govern
these settings may make it difficult to improve nutrition and physical activity in child
care settings (CDE & CHHS, 2010).
¡ Child care providers reported lack of knowledge as a barrier to improved child nutrition
in child care centers (Heinig & Nutrition Services Division, California Department of
Education, 2010).

61 American Institutes for Research
Condition of Children Birth to Age Five and Status of Early Childhood Services in California
¡ the different standards required of child care providers, depending on whether they
participate in the CACFP and/or receive state funding, may be a source of confusion
and conflict for some providers.
¡ Currently, there is no ongoing mechanism to collect and report key nutrition and physical
activity outcomes for children in child care.
¡ A large majority of child care staff receive their training and education at community
colleges (Whitebook et al., 2006), but only a small percentage of colleges offer courses
related to nutrition and physical activity (uC Davis Center Human Lactation Center, 2007).
Recommendations
the latest volumes of the Preschool Learning Foundations and Curriculum Frameworks now
include the domains of Physical Development and Health (2011). As with the previous domains,
the California Preschool Instructional Network, CPIN, is conducting training around the state in
these critical areas. to continue to move forward in integrating healthy practices for young children,
recent reports have made the following recommendations:
1. To improve the consumption of nutritious foods:
¡ Reduce the consumption of sweetened beverages by implementing a state tax
(Children Now, 2011, 2012).
¡ Develop policies to ensure consumption of five fruits and vegetables each day
(Children Now, 2011)
¡ Encourage greater participation in CalFresh by reducing burdensome reporting
requirements (Children Now, 2012)
¡ Encourage dietary counseling by health care providers (Children Now, 2011).
¡ Child care providers should strengthen their relationships with various public health
programs to improve children’s nutrition (Mathematica Policy Research Inc., 2009;
Ritchie, James, & Fredericks, 2011).
2. Change the nutrition and physical activity environments of children in child care (Strategic
Assessment of the Child Care Nutrition Environment Advisory Group, CDE & CHHS, 2010)
by doing the following:
¡ Strengthen the Child and Adult Care Food Program (CACFP)
� Establish California nutrition and physical activity standards based on current
scientific evidence.
� Collaborate with the federal government to modify the federal CACFP meal pattern
requirements to align with standards developed in the previous recommendation.
� Streamline the CACFP compliance requirements to increase participation.

62 American Institutes for Research
Condition of Children Birth to Age Five and Status of Early Childhood Services in California
� Facilitate collaboration between relevant state agencies to develop a CACFP marketing
plan aimed at increasing participation in the program.
� Include evaluations of nutrition and physical activity as part of the CACFP monitoring-
visit requirements.
� Require state-funded care child programs to participate in the CACFP.
¡ Establish nutrition and physical activity requirements for child care programs.
� All licensed care providers should be required to comply with the nutrition and
physical activity standards recommended above—even providers not participating
in the CACFP.
� Evidence-based nutrition, physical activity, and wellness education training should
be required for initial child care licensure.
� Nutrition, physical activity, and wellness education training should also be required
for maintaining child care licensure.
� State and federal agencies should align child care nutrition and physical activity
standards.
� Child care agencies should be required to publicly report key child nutrition and
physical activity outcomes.
¡ Provide consistent messaging to children, families, and providers related to improving
nutrition and physical activity in child care environments.
� Relevant state agencies should collaborate on developing and delivering consistent
messaging through social marketing and health education campaigns.
� Nutrition foundations should be established for preschool.
� Nutrition and physical activity criteria should be included in California’s QRIS.
¡ Expand nutrition and physical activity training in child care programs.
� Include nutrition and physical activity in child care information in all child
care–related curricula.
� Provide the latest nutrition and physical activity information with continuing
child care training programs.
� Provide the nutrition and physical activity information with caregiver and
parent education.
¡ Focus some activities in early care and education settings around the California
Preschool Learning Foundations’ Physical Development domain

63 American Institutes for Research
Condition of Children Birth to Age Five and Status of Early Childhood Services in California
Kindergarten transition
One of the primary goals of early education programs is to prepare children for school,
but children show varying degrees of readiness based on normal developmental variances
and also on family resources. Activities to help children make the transition to kindergarten
are critical. Power of Preschool (PoP) demonstration programs have implemented several
activities to focus on this transition, including sharing assessment information with
kindergarten teachers and aligning curricula. Beginning in 2012–13, California school
districts will be implementing a Transitional Kindergarten (TK) program, but districts
are at different stages of developing content guidelines for this new program. Major
recommendations regarding TK include providing more guidance on standards, frameworks,
curriculum and instruction, and assessment strategies; and focusing on offering
opportunities for early educational experiences and preparing schools to meet children’s
developmental, social, and educational needs, rather than on children’s chronological age.
Key Findings
1. For California’s new Kindergarten Transition (TK) Program, to what extent have districts
developed standards for program content and curriculum? How do these compare with
preschool standards and curricula?
¡ Of the nine districts interviewed for the Preschool California Study on transitional
Kindergarten (California Early Learning Advisory Council, 2011), five had developed
working content standards for the tK or for a program designed for young five-year-olds.
¡ Of the 10 programs interviewed for the Preschool California Study on transitional
Kindergarten (2011):
� All programs had some focus on mathematics and early literacy and language skills.
� Many programs used parts of curricula or modified curricula developed for other
populations.
� Five programs had a written parent/family engagement policy.
� Programs varied in whether they conducted assessments to determine enrollment
in the program, show progress, or determine kindergarten readiness.
2. What educational qualifications are school districts setting for TK teachers, and what are
the anticipated classroom staffing patterns?
¡ Of the districts interviewed for the Preschool California Studies on transitional
Kindergarten and programs for five-year-olds (2011):
� teachers typically hold a multiple subject credential.
� Professional development is not standard or specifically focused on tK, so districts
piece together their own professional development or use the same professional
development used for kindergarten teachers.

64 American Institutes for Research
Condition of Children Birth to Age Five and Status of Early Childhood Services in California
� Most classrooms have only one teacher and do not have teacher aides or special
training for teacher aides.
¡ Small schools tended to be more concerned about being able to finance tK in separate
classrooms (California County Superintendents of Education Services Association, 2001).
3. More generally, what practices are in place to facilitate children’s transition from preschool
to kindergarten? What are the promising practices for promoting a successful transition?
¡ In the 2008 PoP evaluation, children in the PoP program showed that they were prepared
for school on the DRDP (First 5 California, 2008). the PoP program utilized the following
preschool-to-kindergarten transition activities:
� Family visits to kindergarten classrooms
� Meetings between preschool and kindergarten teachers
� Sharing preschool child assessments and/or portfolios with kindergarten teachers
� Aligning preschool and kindergarten curriculum
� transition teams attended parent meetings and/or community forums
� group preschool classroom visits
¡ Research does not suggest that there is a particular age at which children are more
prepared to enter kindergarten, but children with early education experiences may show
greater cognitive gains (Social Policy Report, 2002).
¡ Children from low-income families who delay kindergarten entry may be at a greater
disadvantage, because these children start kindergarten with lower academic skills and
are less able to afford an extra year of preschool or high quality child care.
Recommendations
California will implement a transitional Kindergarten program in all elementary and unified school
districts beginning in 2012–13. to continue to move forward in facilitating the transition to
kindergarten, recent reports have made the following recommendations:
1. To work toward the implementation of a successful TK program:
¡ More guidance should be provided to districts on tK standards, frameworks, curriculum
and instruction, assessment strategies, and tools and planning (California County
Superintendents of Education Services Association, 2001; California Early Learning
Advisory Council, 2011).
¡ Districts should be provided with support on how to provide high quality tK and
kindergarten combination classes (California County Superintendents of Education
Services Association, 2001).

65 American Institutes for Research
Condition of Children Birth to Age Five and Status of Early Childhood Services in California
2. To promote smoother transitions from preschool to kindergarten:
¡ California should explore how to use PoP program transition strategies as models to
replicate throughout the state (First 5 California, 2008).
¡ School entry policies should focus on offering opportunities for early educational
experiences and preparing schools to meet children’s developmental, social, and
educational needs, rather than on children’s appropriate age, especially among children
from low-income families (Chang & Romero, 2008; Social Policy Report, 2002).
¡ School districts should devote time and resources to examining the levels of chronic
early absence in their schools in order to identify at-risk children and to provide
necessary support (Chang & Romero, 2008).
¡ Kindergarten transition activities should include the following (Evaluation Matters with
First 5 California Staff, 2009; First 5 California, 2008):
� Encouraging preschool and kindergarten teachers to visit each other’s classrooms,
to attend common workshops and professional development sessions, and to
collaborate with each other on continuity in teaching strategies and methods.
� Holding a kindergarten transition conference at the beginning of the year, and
facilitating visits by preschool children to their new school before starting kindergarten.
Finance, governance, and Other Systems Issues
Researchers and policy analysts consistently point out two major flaws in California’s
publicly funded early learning and care programs: the level of payments is not linked
to the standards of quality to which the programs are held, leading to disincentives for
quality improvement; and there are barriers to blending and braiding funds to cover the
true cost of quality. Several studies point to the First 5 Power of Preschool program as
a model for a tiered reimbursement system that rewards quality improvements, and
which has succeeded in improving the quality of early learning and care programs.
On a broader level, multiple studies point out that California has three “systems” (Title 22
licensing, Title 5 Child Development programs, and the federal Head Start program) for
overseeing early learning and care, and suggest that the establishment of a Quality Rating
and Improvement System offers a way to integrate standards into one coherent system
without necessarily consolidating all responsibilities in a single agency at the state level.
Key Findings
1. Beyond the budget crisis, which has reduced funding for programs, what are the additional
financial systems issues that make it difficult to improve the quality of early learning and
care in California?
¡ California’s early learning and development system is a web of state and local programs
financed through a combination of federal, state, and local sources. Many programs

66 American Institutes for Research
Condition of Children Birth to Age Five and Status of Early Childhood Services in California
have distinct eligibility and reporting requirements that make it difficult to blend and
braid funds to cover the true cost of quality (Children Now, 2012; CAEL QIS Advisory
Committee, 2010).
¡ As indicated in the section on Access to Quality Early Learning and Care, the Standard
Reimbursement Rate (SRR) for title 5 State Preschool or general Child Care—for which
quality standards are higher than title 22 licensing requirements—is lower in many
counties than the Regional Market Rate (for which only title 22 standards must be
met), and this creates a disincentive for program quality improvement (CAEL QIS, 2010;
Children Now, 2012; Karoly, 2009; Muenchow, Lam, & Wang, 2009).
¡ the current state reimbursement rate for state-contracted title 5 full-day early learning
and care is particularly low.
� Program staff often do not have the necessary experience with the relevant accounting
and reporting requirements to braid funds from various funding sources, and the
rules and instructions on reporting third-party funding have not always been clear
(Miller, 2008).
� Providers who choose to operate a general Child Care or full-day State Preschool
Program are at a financial disadvantage compared to those who administer a
part-day State Preschool Program, with a full-day program receiving an hourly rate
that is less than half the hourly rate for a program operating part-day (Muenchow,
Lam, & Wang, 2009).
¡ unlike most state- and federally funded early care and education programs, the First 5
California Power of Preschool structure is not restricted to a single annual per child
amount. Instead, First 5 commissions reimburse local participating agencies based
on the quality of the preschool space, and the rate structure is designed to increase
incrementally with teacher qualifications and improvements in program scores on the
Early Childhood Environmental Rating Scale (ECERS). In these eight PoP counties,
therefore, the PoP dollars provide the extra amount above the SRR that is necessary
to support a quality program (Muenchow, Lam, & Wang, 2009).
2. What are the pros and cons of placing the governance of early learning and care programs
in a single agency versus multiple agencies?
¡ Multiple agencies in California have responsibilities for various aspects of early learning
and care licensing, regulation, finance, and delivery. governance models in other states
include consolidation of various public programs into a single agency, or retaining the
existing agency structure but establishing a new high level, multi-agency, coordinating
body. there is little research evidence to provide guidance on which governance models
work best, and what works in one state may not work in another (Karoly, 2009).
¡ In Florida, after 10 years of placing early care and education services under the Agency
for Workforce Innovation, the Legislature transferred all early care and education
services to a self-contained unit within the Department of Education. the transfer of

67 American Institutes for Research
Condition of Children Birth to Age Five and Status of Early Childhood Services in California
early care and education services to the Department of Education, with a director
appointed by the governor, has the potential to raise the profile of the programs.
However, improvement is not guaranteed without proper procedures in place (State
of Florida, Auditor general, 2011).
¡ An integrated approach to early education management (e.g., one office, department,
or agency in charge) indicates that state government leaders have attached a relatively
higher value to the policymaking, funding, and regulation of early childhood than when
the approach is more fragmented (the BuILD Initiative, 2010).
3. How has devolution of policy-setting on publicly subsidized child care worked in other states?
¡ While the devolution of child care policy to local workforce boards in texas was designed
to increase local autonomy in designing solutions to problems, this autonomy was
limited by unchanged regulations at the state and federal level (Lein, Beausoleil, &
tang, 2007). As a result of the complexity of child care policies, many local boards
needed considerable technical assistance from the texas Workforce Commission
(Lein, Beausoleil, trott, Schexnayder, Schroeder, tang, & Randazzo, 2003).
¡ Eligibility requirements for the Colorado Child Care Assistance Program vary significantly
across counties. As a result, families are eligible for services in some counties but not
in others (Office of the State Auditor, Colorado, 2008).
¡ Families that are similarly situated financially pay notably different proportions of their
annual income for child care in different parts of New York State, and there are other
inequities in determining eligibility for child care subsidies (Empire Justice Center, 2010).
¡ In Florida, the Office of Early Learning under the Agency for Workforce Innovation did not
implement a legislatively required QRIS. Instead, some local school readiness coalitions
implemented QRIS systems of their own (Auditor general, State of Florida, 2011).
Recommendations
1. To improve the financial incentives for quality:
¡ Raise the Standard Reimbursement Rate for state-contracted programs meeting title 5
standards so that they are above the rate for programs of similar duration that are only
required to meet title 22 standards (CAEL QIS Advisory Committee, 2010; Children
Now, 2008; Karoly, 2009; Muenchow, Lam, & Wang, 2009).
¡ Explore establishing an hourly as opposed to daily rate to compensate programs for
the number of hours of service they actually provide (Muenchow, Lam, & Wang, 2009).
¡ Consider the First 5 Power of Preschool Demonstration Project reimbursement
structure as a model for developing a tiered reimbursement system (Muenchow,
Lam, & Wang, 2009).
¡ Provide a rate differential to programs that participate in the QRIS (Empire Justice
Center, 2010).

68 American Institutes for Research
Condition of Children Birth to Age Five and Status of Early Childhood Services in California
¡ Carefully evaluate use of measures that were originally developed for low-stakes
purposes and that may not be valid in high-stakes contexts (Zellman & Perlman, 2008).
¡ Support efforts to create a more consistent approach to counting third-party funding
(Children Now, 2008).
2. To improve governance of early learning and care programs:
¡ Coordinate so that children and families experience a system that is not siloed and
fragmented (the Build Initiative, 2010).
¡ Establish a statewide QRIS system rather than devolving responsibility to local school
readiness coalitions (Auditory general, State of Florida, 2011).
¡ Establish and regularly convene regional consortia composed of leaders of local
existing QRIS systems together for the purpose of strengthening their local systems,
developing common goals where feasible, and mentoring other communities to develop
QRISs as well (State of California, 2011).
¡ Carefully validate Quality Rating and Improvement Systems in the context in which they
occur (Zellman & Perlman, 2008).
¡ Evaluate options for alternative governance structures, and change the structure if
greater efficiency and effectiveness can be obtained (Karoly, 2009).
¡ Establish a Children’s Cabinet composed of the heads of each agency and department
that serve children’s well-being and the Superintendent of Public Instruction. the
cabinet should be charged with promoting and implementing information sharing,
collaboration, increased efficiency, and improved service delivery among and within
the state’s child-serving agencies and organizations (Children Now, 2012).
Summary of Research Findings and Recommendations on Early Learning and Care
there is general consensus in the literature that access to quality early learning and care is
uneven, varying by the age of the child and by multiple family characteristics, such as family
income, the mother’s education level, and the degree of linguistic isolation. Several studies have
found that center-based care in the year before kindergarten for dual language learners in
particular is especially effective in improving children’s early reading skills.
Researchers and policy analysts consistently point out two major flaws in California’s publicly
funded early learning and care programs: the level of payments is not linked to the standards
of quality to which the programs are held, leading to disincentives for quality improvement; and
there are barriers to blending and braiding funds to cover the true cost of quality. Recent reports
recommend, at minimum, restoring prior levels of funding to early care and education programs in
California, with additional investments in quality as new funds become available. A Quality Rating
and Improvement System (QRIS) can help the state monitor and encourage improvements in

69 American Institutes for Research
Condition of Children Birth to Age Five and Status of Early Childhood Services in California
quality. Multiple studies point out that California has three “systems” (title 22 licensing, title 5
Child Development programs, and the federal Head Start program) for overseeing early learning
and care, and suggest that the establishment of a Quality Rating and Improvement System
offers a way to integrate standards into one coherent system without necessarily consolidating
all responsibilities in a single agency at the state level. Several studies point to the First 5
Power of Preschool program as a model for a tiered reimbursement system that rewards quality
improvements, Measures of teacher-child interactions such as the Classroom Assessment Scoring
System (CLASS) are recommended to assess program quality, as the quality of these interactions
is the basis for children’s learning and has been linked to positive child outcomes. Virtually all
studies reviewed on the topic recommend piloting a Quality Rating and Improvement System
before implementing it statewide.
there is also widespread agreement that it is vital to engage families in their children’s early
learning and care programs and to increase parents’ understanding of the elements that contribute
to school readiness. Furthermore, many researchers stress the need for special outreach to engage
families whose home language is not English.
Researchers agree that early childhood educators who understand child development and engage
in effective interaction with young children are central to the effectiveness of early learning and
care programs in improving child outcomes. the early learning and care programs that have
been found to achieve dramatic improvements in child outcomes all have highly qualified, well-
compensated teachers with strong supervision. Recent studies suggest, however, that degrees
alone are not sufficient, and researchers disagree on what degree level is most appropriate.
Studies indicate that early childhood higher education itself needs reform, with more focus on the
desired child outcomes. teacher training in the areas of dual language learners and children with
special needs should be improved, in particular. Several studies also stress the importance of
more systematic data collection and the development of an early childhood workforce registry
linked to K–12 workforce data.
Families with children with disabilities often have difficulty finding high quality child care for their
children. Outreach to families and teacher training in this area should be improved. Developmental
screening in early learning and care programs using a validated tool is increasing, but often is not
conducted early enough in the program year to refer children to effective intervention and services.
Research suggests that best practices for improving the screening rate include building relationships
with families. It is recommended that early childhood mental health services, along with training
provided through the Center for Social and Emotional Foundations for Early Learning (CSEFEL),
be expanded in ECE settings throughout the state.
Among the studies conducted, there is agreement that there is a shortage of early learning and
care facilities, especially in low-income neighborhoods. Barriers to expansion include lack of public
and private financial resources, land use barriers, outdoor space requirements and other restrictions,
and provider inexperience with facilities development and financing. Major recommendations include
improving facilities financing through inclusion of child care facilities in city/county plans and/or
school bond issues, and advocating for child-friendly land-use policies.

70 American Institutes for Research
Condition of Children Birth to Age Five and Status of Early Childhood Services in California
Activities to help children make the transition to kindergarten are critical. Beginning in 2012–13,
California school districts will be implementing a transitional Kindergarten (tK) program, but
districts are at different stages of developing content guidelines for this new program. Major
recommendations regarding tK include providing more guidance on standards, frameworks,
curriculum and instruction, and assessment strategies; and focusing on offering opportunities
for early educational experiences and preparing schools to meet children’s developmental, social,
and educational needs, rather than on children’s chronological age. Multiple studies and policy
reports recommend the establishment of a statewide data system in which all children in early
care settings are assigned a unique identifier that follows them into the K–12 system, so that
children’s outcomes following early childhood investments can be better understood.

71
Condition of Children Birth to Age Five and Status of Early Childhood Services in California
Section III: Research Summary Tables by Topic 72 Access to Quality Early Learning and Care
90 Quality Assessment of Early Learning and Care Programs
106 Family Engagement
116 Workforce Development: Knowledge and Competency Framework and Supporting Early
Childhood Workforce Development
139 Dual Language Learners
148 Developmental Screening of Children
150 Assistance to Children with Special Needs
151 Early Childhood Mental Health/Behavioral Health Services
155 Child Assessment to Support School Readiness
160 Effective Data Practices
165 Facilities
172 Food and Nutrition
176 Kindergarten Transition
184 Finance, Governance, and Other Systems Issues
American Institutes for Research

Access to Quality Early Learning and Care
Report Recommendations Key Findings/Rationale The Use of Early Care and Education • This analysis, disseminated in a RAND “Occasional Paper,” • 75 to 80% of preschool age by California Families (2012) did not include any recommendations. children, and just under half of infants and toddlers, are cared for Karoly by someone other than their RAND Corporation parents on a regular basis. Study Approach: • Center-based is the modal form for
preschool age, and home-based for Analysis of administrative data and infants and toddlers. data from 2005 National Household Education Survey and the 2007 RAND California Preschool Study
• Families often combine a part-day, center-based preschool program with home-based care for the
•
•
remainder of the day.
Given funding levels as of 2008– 2009, the existing subsidized programs were not able to serve the approximately 53% of children ages 0 to 5 who would have qualified on the basis of family income.
Based on analysis of the 2005 National Household Education Survey and the 2007 RAND California Preschool Study, subsidized programs served 34% of eligible 3-year-olds and 65% of eligible 4-year-olds, and just 8% of the eligible infants and toddlers.
72

Access to Quality Early Learning and Care
Report Recommendations Key Findings/Rationale California Infant and Toddler Early • Reform child care licensing regulations. • Reimbursement levels based on the Learning Policy Recommendations market rate are now more than half • Rebuild state investment in early childhood quality (2012) a decade old, and they do not cover initiatives. the cost of providing quality care for Water Cooler Infant-Toddler • Fund Early Start (early intervention) services at a level that infants. Workgroup ensures access for eligible children ages 0–3.
• California does not perform well in • Restructure the child care reimbursement system for terms of quality regulations and Study Approach: publicly funded infant-toddler programs so that providers monitoring; the National Association The Water Cooler Infant-Toddler are reimbursed for the true cost of providing high quality of Child Care Resource and Referral Workgroup convened more than 130 care. Agencies (NACCRRA) ranks individuals representing 95 • Provide higher reimbursement rates in a tiered system for California 50th out of 52 states and organizations to develop territories in terms of the quality of programs meeting high quality standards such as Early recommendations to address the regulations and the degree of Head Start standards or higher QRIS level criteria. This policy problems facing early care and monitoring for most programs. could be a short-term priority as the state restructures the education services for infants and reimbursement rates. • There has been a steady decline in toddlers in California. Over the course of five meetings, the workgroup • Create a new state revenue source that supports early California’s commitment to quality
funding over the past decade. The formulated, discussed, and ranked learning from age 0 to 5. Within this new revenue stream, withdrawal of federal child care policy recommendations in the areas at least 30% of funds should be set aside for infants and
of funding, access to quality services, toddlers. quality funds from the American Recovery and Reinvestment Act workforce development, and the • Until there is adequate funding to benefit all programs and (ARRA) of 2009 led to a $16.3 building of a comprehensive system children, expanded funding should be targeted first to million reduction in investments in for infant and toddler care and children at high risk, such as those meeting Early Head child care quality in FY2012. education in California. Start eligibility criteria in high-poverty communities.
• While roughly 85% of the brain’s • Focus on a comprehensive approach to service delivery for core structures are formed by age
infants and toddlers. 3, only about six cents of every • Expand 0–3 home visitation services that support school dollar that California invests in
readiness, with priority given to vulnerable children. education and development services for children 0–18 goes to support infants and toddlers.
73

Access to Quality Early Learning and Care
Report Recommendations Key Findings/Rationale California Report Card 2011–12: • This report recommended including early learning and care • Less than 4% of public investments Setting the Agenda for Children in a comprehensive P-to-12 education and reform package in education and development are (2012) with an equitable and adequate financing system, which targeted at children from birth to could be viewed as a strategy to expand access to early age 4. Children Now learning and care programs. • $600 million cut from public Study Approach: • Restore funding from cuts to ensure that more children
have access to quality programs, and support more investments in early learning and care in 2010.
Analysis of administrative data and extensive literature review •
flexibility in use of federal child care funds.
Fully support the implementation of the federal home visitation program and coordinate with early learning
• California is the nation’s fifth least affordable state for center-based infant care, with the cost
programs.
•
representing more than 40% of the median income for a single-parent household, based on an analysis by the National Association of Child Care Resource and Referral Agencies.
Latino children are less likely than other racial/ethnic groups to attend preschool. Only 42% of Latino children in California attend preschool, compared with 60% of white, 56% of Asian, and 53% of African-American children, based on Population Reference Bureau analysis of the U.S. Census Bureau, American Community Survey, 2001, and 2008, in 2010.
74

Access to Quality Early Learning and Care
Report Recommendations Key Findings/Rationale Race to the Top Early Learning • Application proposed 16 Early Learning Challenge Grant • Number of children participating in Challenge Grant Application (2012) Regional Leadership Consortia located in the most First 5 Power of Preschool programs populous counties that will initially impact the quality of increased from 14,239 in 2007 to State of California services for 76,000 young children and ultimately as many 24,389 in 2010–11. Study Approach:
• as 1.8 million.
The end goal that unites the Consortia is to “ensure that • Consolidation of existing State
Preschool, Prekindergarten Family Application citing administrative data children in California have access to high quality programs Literacy, and General Child Care from multiple state agencies and so that they thrive in their early learning settings and and Development programs reports to federal agencies succeed in kindergarten and beyond.” enabled more than 19,000
• Given the state’s fiscal outlook, the application does not suggest increased spending to expand access, and focuses on one-time investments as well as local capacity-building activities involving the Regional Leadership Consortia.
additional children to be part of the California State Preschool Program and expanded access to full-day services that better meet the needs of working parents.
• 85% of the $50 million in Challenge Grant funds will go directly to Regional Leadership Consortia • The number of children with high
needs enrolled in state-funded
At thbud
preschool increased steadily by 14% from 87,706 in 2007 to 101,414 in 2010; in Title 1 preschool grew from 23,776 in 2007 to 26,580 in 2009; and in Early Head Start increased by 5,729 due to infusion of ARRA funds.
• Passage of the Transitional Kindergarten program anticipated to ultimately serve 120,000 children.
e same time, in response to the state
get crisis:
• Eligibility for State Preschool and Title 5 programs was reduced from 75% of State Median Income to 70% of the SMI;
• Children served in CCDF-funded programs declined from 131,679 in
75

Access to Quality Early Learning and Care
Report Recommendations Key Findings/Rationale
• 2007 to 125,899 in 2010; and
The number of children served in programs funded by IDEA Part C and Part B, section 619, declined from 83,484 in 2007 to 81,621 in 2010.
Preschool and School Readiness: • Efforts should be made to increase the enrollment of low- • Children from disadvantaged Experiences of Children with Non- income and linguistically isolated children in center-based backgrounds begin kindergarten English-Speaking Parents (2012) preschool. academically unprepared. Cannon, Jacknowitz, & Karoly Public Policy Institute of California
• Preschool programs should be better targeted to the needs of linguistically isolated children to improve their school readiness.
• Linguistically isolated children are also likely to be from low-income families and have mothers with low
Study Approach: education levels.
The results for this study are based on data from the RAND California Preschool Study and the Early Childhood Longitudinal Study, Birth Cohort (ECLS-B).
• Linguistically isolated children often qualify for publically funded preschool; however, this group utilizes non-parental care arrangements at a lower rate compared with native children
•
•
•
(79.5% vs. 84.1%).
Among the relatively small number of linguistically isolated children in California utilizing non-parental care, the majority participate in center-based care (91.1%), a finding that contradicts prior research (Espinosa, 2007; Karoly & Gonzalez, 2011).
Parents of linguistically isolated children were more likely to report a need for nontraditional hours of care and the cost of child care as important factors.
Linguistically isolated children who utilize center-based care show better improvements in early
76

Access to Quality Early Learning and Care
Report Recommendations Key Findings/Rationale
•
reading skills in kindergarten, compared to children utilizing non-center-based care.
Native children who utilize center care also show si milar improvements in early reading skill in kindergarten, suggesting linguistically isolated children may need additional supports in order to narrow the achievement gap.
2011 Child Care Portfolio (2011) • None given • The number of infant slots increased 1% from 40,083 in 2008 California Child Care Resource and to 40,337 in 2010 Referral Network
• The number of preschool slots Study Approach: increased 3% f rom 499,510 to
514,570 during same timeframe Summary of child care supply and demand based on information collected by local Child Care Resources and Referral (CCR&R)
• The largest number of requests to CCR&R agencies for child care were for children under age 2
agencies in California in 2011. •
•
Licensed child care slots were available for only 25% of children 0–12 with parents in labor force
187,516 children were on California’s Centralized Eligibility List in April-June 2 010 For a family at the State Median Income of $59,147 in 2010, care for one infant/toddler in a family child care home and one preschooler in a center would absorb one-fourth of their annual income.
77

Access to Quality Early Learning and Care
Report Recommendations Key Findings/Rationale Power of Preschool (PoP) Program Recommendations from PoP Counties: • 25,246 children were served in Evaluation Report (2011) Franke, Espinosa, & Hanzlicek UCLA Center for Healthier Children,
• Implicit: Recognize that it is difficult to balance the goals of expanding access while improving quality without more funds.
First 5 Power of Preschool programs across the 8 counties of San Diego, Yolo, Ventura, Los Angeles, San Francisco, Santa Clara, Merced,
Families and Communities for First 5 • Half of the 8 counties called for greater recognition that and San Joaquin in FY 2010–11. California Study Approach:
providing high quality programs is costly, and that the PoP program is more costly to deliver than other preschool programs.
• PoP programs are serving an ethnically diverse population of children, many of whom are dual
Review of local First 5 PoP reports for • 3 of the 8 counties applauded the flexibility granted by First language learners. More than 10% 2009–10, annual data submitted by 5 California in deciding on priority areas for investment and have special needs or disabilities. counties for 2010–11, and interviews with First 5 staff
allocation of funds. •
•
5 of the 8 counties have expanded their programs to serve infants and toddlers.
PoP sites include publicly funded programs (Head Start, State Preschool, or General Child Care), private centers, and family child care homes/networks.
78

Access to Quality Early Learning and Care
Report Recommendations Key Findings/Rationale Dream Big for Our Youngest Children: While the legislative charge did not explicitly address access, some • Access and utilization of programs Final Report (2010) of the Council’s recommendations indirectly address it: is uneven. Use of center-based California Early Learning Quality Improvement System (CAEL QIS) Advisory Committee Study Approach:
• To help increase utilization of quality programs conduct outreach and communication to families, include messengers who speak the families’ language and who are trusted sources of information, and put QRIS information into First 5 “Kit for New Parents.”
early learning and care is lowest among the children most likely to benefit. 73% of preschool children with mothers with bachelor’s degrees attend preschool, but only 45% of those whose mothers have
2 years of CAEL QIS Advisory Committee and subcommittee meetings; input from early learning and care program staff, child care
• To provide incentives to increase program quality, provide financial and non-financial incentives to support continuous quality improvement. Estimate the cost of various incentives as part of a pilot. •
less than a high school diploma (Karoly, 2009).
Current reimbursement rates for publicly funded programs provide
licensing officials, county • Correct the current financial disincentives in publicly little incentive to improve quality. superintendents of education, local funded early learning programs, thereby making it more Programs required to meet higher child care council and child care possible for state-contracted Title 5 p rograms, one of the Title 5 standards receive lower resource and referral leaders, First 5 state’s highest quality programs, to remain in operation. rates in 22 counties than do California and county commission programs held to minimum staff, and nationally known experts on licensing standards (Karoly, quality rating and improvement Reardon, & Cho, 2007). systems.
California Infant/Toddler Early • Conduct a comprehensive study on the supply and quality • While attendance at center-based Learning and Care Needs of infant/toddler care similar to Cost, Quality and Child programs is the norm for preschool-Assessment: A Policy Brief (2010) Outcomes (1995). Include not only center care but also age children, it is the exception for family child care and exempt care. infants and toddlers. Anthony & Muenchow American Institutes for Research • Implicit: Given the high cost of center-based care,
expanding publicly contracted programs held to quality • At most 12% of the state’s 1.7
million infants and toddlers are in Study Approach: standards is the only way to make such programs
accessible to the infants and toddlers with high needs. licensed center-based or family child care. Most of the center-based
Analysis based on analyses of extant data from CDE, Early Head Start Program Information Reports, Department of Social Services, and the California Child Care Resource and Referral Network as well as review of related research.
•
•
Given indications of family preference of home-based care for this age group, take the “early learning” to the settings where the children are. Consider innovative ways to maximize federal funds for home visiting expansion, and to link home visiting programs to family, friend, and neighbor care.
Look to other states with more stringent monitoring requirements for publicly funded exempt providers. At a minimum, require providers, in order to qualify for an
•
care for this age group consists of Early Head Start or state-contracted programs that are publicly subsidized.
If the definition of “early learning and care” is expanded to include informal care by family, friends, and neighbors, then according to the California Health Interview Survey,
79

Access to Quality Early Learning and Care
Report Recommendations Key Findings/Rationale
•
enhanced rate, to participate in training visited by an inspector.
Publicize California’s Paid Family Leave
and agree
Program.
to be
•
•
•
•
42 % of 2-year-olds, 38% of 1-year-olds, and 25% of children below age 1 are in some type of informal, non-parental care for at least 10 hours per week.
There is evidence that the high cost of licensed center-based care for infants deters families from using it; however, there are also reasons why some parents prefer informal home-based arrangements for this age group.
California only requires a child abuse check and fingerprinting for informal providers receiving public subsidies—far less stringent requirements than those set by many other states.
As many as 40,000 families in California with infants or toddlers receive home visits as part of a formal program, and home visits linked to formal or informal non-parental care have been shown to be an effective model to promote early learning.
About 1/3 of the families with infants born each year in California receive a period of publicly supported part-paid leave from work to focus on bonding with their newborn or newly adopted children, but many families do not know about the program.
80

Access to Quality Early Learning and Care
Report Recommendations Key Findings/Rationale Preschool Adequacy and Efficiency in Preschool-Age Children • Only 13% of low-income children California: Issues, Policy Options, and are enrolled in high quality early Recommendations (2009) Short-Term learning programs that promote Karoly RAND Corporation
• Modify the process of eligibility determination to ensure that children who can benefit most are served first and that there is stability in enrollment within a program year and
• higher-order thinking skills
Less than 40% of low-income 3- and 4-year-old children attend
Study Approach: across years for those who enroll at age 3. publicly funded early learning
Based on integration of results from 3 earlier studies on gaps in school readiness and achievement in early grades, the use of ECE services and the quality of those experiences, and the system of publicly funded ECE programs.
• Consider centralizing the process at the county level or lower. Determine eligibility for part-day developmental programs at time of application, and maintain eligibility even if circumstances change. Determine eligibility for subsidized full-day programs conditionally and finalize at time program begins. Structure the enrollment process to coincide with program year.
•
•
programs.
Families are placed on the Centralized Eligibility List without a formal determination of eligibility. This places a burden on providers in terms of screening and time.
Current mechanisms for allocating • Modify the contract mechanism for Title 5 programs and
alternative payment programs to reduce the extent of unused funds and other inefficiencies; possibly shifting from contracts that reimburse child-days to grants with minimum enrollment and/or attendance requirements.
• Standardize reimbursement structures across subsidized ECE programs, retaining elements in some part of the system such as reimbursement rates that vary by geography.
• Make greater use of Title I funds for preschool programs. Longer-Term
• As access is extended, continue to target larger share of currently eligible 4-year-olds and 3-year-olds in poverty.
• As access is extended to a larger share of the population, implement place-based targeting with income targeting so that all children in targeted communities are able to participate even if they are not otherwise eligible.
• Raise preschool quality, especially for program features important to child development, through a multi-pronged approach that includes quality measurements and monitoring, financial incentives and supports, and
•
funding to providers, whether through contracts, grants, or vouchers, make it difficult to spend all of the funding allocated to a program in a given year, thereby further diminishing the number of children served.
In the absence of new state funds to support preschool, allocating Title 1 funds represents a possible funding source. Several counties, with support from county First 5 commissions, have adopted this approach.
81

Access to Quality Early Learning and Care
Report Recommendations Key Findings/Rationale
• accountability through evaluating child outcomes.
Improve infrastructure in areas such as workforce development and facilities.
Power of Preschool Program Evaluation Report (2009) Prayaga, Sormano, Hobart, Neville-Morgan, Smith, Balakshin, Padilla, Bupara, & Syphax Evaluation Matters and First 5 California Staff Study Approach: Review of county self-reported data as well as information in annual PoP local evaluation and statewide reports
• Employ strong outreach using multiple strategies to reach a wide range of populations, particularly EL children and children with special needs, and to ensure that there are no inequities in access to the program.
• First 5 PoP programs reported that on average 45% of children served were dual language learners and that 7% were children with special needs
Closing the Achievement Gap: Report of Superintendent Jack O’Connell’s California P-16 Council, (2008) California Department of Education, Sacramento
• High quality prekindergarten should be students, especially underrepresented
available students.
to all •
•
Students do not enter kindergarten well prepared.
High quality prekindergarten programs prepare children to succeed in school.
• Children underrepresented in prekindergarten most often lack access to quality prekindergarten programs.
82

Access to Quality Early Learning and Care
Report Recommendations Key Findings/Rationale Report on the Issue of Returned Child • Title 5 Center reimbursement rates for all age groups • Reasons for returned funds from Development Contract Funds in should be based on the county market rates, or the child development services California (2007) standard reimbursement rate, whichever is higher, plus the contractors to the state are costs of meeting state quality and fiscal standards. complex, and include the way the Martin Kidango Study Approach: Position paper regarding reasons for the prevalence of returned funds to the state and recommendations
•
•
CDE should provide training through experienced program directors and fiscal managers who understand the Fiscal Green Book to agencies needing assistance. Consider using the School Age Consortium model of approved peer consultants.
School Districts should be required to provide space to programs as a priority and at rate that cover the District’s direct costs. Child Development programs should have the
Legislature distributes funds and the nature of funding streams, rules imposed by CDE and the Legislature, lack of training or skill on the part of program operators in navigating these rules, and consequences that come from economic and demographic shifts.
•
•
same status as Adult School for school facilities.
Programs should be able to meet local program needs by providing part- or full-day services without regard to the name of the funding stream.
Resource and Referral and Alternative payment Programs should provide educational information on the value of preschool for children, particularly for four-year-olds prior to entering kindergarten.
83

Access to Quality Early Learning and Care
Report Recommendations Key Findings/Rationale Early Care and Education in the • Identify strategies that would allow greater efficiency with • California devotes substantial Golden State: Publicly Funded respect to the goal of improving child development, without resources to subsidizing the care of Programs Serving California’s necessarily detracting from the goal of supporting working preschool-age children, but the Preschool Age Children (2007) parents. dollars are not closely tied to the Karoly, Reardon, & Cho RAND Corporation
• In other cases, policymakers may need to make choices about system reform that involve tradeoffs between these 2 policy goals.
quality or stability of the care. This can be viewed as inefficiency from the perspective of child development.
Study Approach: • There are 2 sometimes conflicting
Analysis of administrative data from motivations for providing publicly Head Start, Title I, the California State subsidized care to preschool-age Preschool Program, the General Child children: to promote health, child Care and Development Program, the development, and school readiness, Migrant Child Care and Development and to provide affordable child care Program, the Alternative Payment for children of low-income working Program, CalWORKS, and state and families. county First 5 co mmissions. • In 2006, 81% of preschool-age
children in subsidized care in
•
•
California were in settings with a child development focus (i.e., Head Start, Title I, or a state-administered Title 5 program). Another 9% w ere in programs that at a minimum must meet the less stringent Title 22 regulations, and the remainder was in license-exempt care.
There is an access gap: Programs with a developmental focus are not funded to serve all eligible children. The gap between eligibility and enrollment is approximately 77,000 4-year-olds and 156,000 3-year-olds.
There is also a quality gap: Even the program standards associated with programs with a child development focus do not guarantee the level of
84

Access to Quality Early Learning and Care
Report Recommendations Key Findings/Rationale quality that is associated with effective preschool programs.
• Funding mechanisms provide little incentive for raising quality; the Standard Reimbursement Rate for programs required to meet Title 5 standards is higher than the Regional Market Rate for programs only required to meet Title 22 regulations in 22 of the most populous California counties.
• In light of these issues, First 5 Power of Preschool Demonstration projects are using a tiered reimbursement system that explicitly rewards programs that move beyond the Title 5 requirements for teacher qualifications, with a higher rate of reimbursement.
• Analysis of fiscal data for the set of subsidized ECE programs serving preschool-age children did not identify any major sources of inefficiencies that could generate substantial savings to redirect toward program services. Several analyses, including our own, show that a range of 5 to 10 percent of contract funds for ECE programs are not spent in a given year. These unspent contract funds are a potential source of dollars that could allow m ore children to be served, although the gains from more effective resource allocation are likely to be modest.
85

Access to Quality Early Learning and Care
Report Recommendations Key Findings/Rationale Report on Unspent Child Care • The state should provide budget authority to: • The majority of the unspent funds Funding: Executive Summary (2007) California Department of Education
• Hire additional staff to support the fund application process and provision of focused technical assistance to marginal agencies
problem is based on a relatively few number of agencies that experience difficulty and time delays while developing facilities to house
Study Approach: • Reassign contract funds when relinquishment and children’s services. Analysis of earnings data and report termination situations arise mid-year
• Many agencies “underearn” by a on agency experiences in funds • Establish a process to adjust contracts mid-year small margin. distribution •
•
•
•
without penalty
Initiate, improve, and update CDE systems for tracking, monitoring, and accepting reports and funding applications online
Apply the cost of living adjustment (COLA) on an ongoing, regular basis to increase the reimbursement rate for program contracts
Change the definition of migrant agricultural worker eligibility to accommodate those workers who continue to work in the agricultural settings, but do not move their families
Reinstate the 2 percent cap on center-based reserve to allow unspent funds to be redirected to agencies that can use additional funding.
•
•
•
•
Program costs have increased while the rate of reimbursement has not kept pace.
CDE contractors are not able to respond with flexibility and speed to emerging community needs.
The ability to fully expend all allocated funds within the authorized time limits is hampered by the current request for application and budget change processes.
An external factor that impacts CDE’s ability to disburse funds is the lack of timely response from agencies.
86

Access to Quality Early Learning and Care
Report Recommendations Key Findings/Rationale Preschool for California's Children: • Access to high quality center-based care programs should • 62% of all children in California Promising Benefits, Unequal Access be expanded to all children, but especially low-income, participate in a center-based (2004) Latino, and African American children in order to narrow the program the year before entering achievement gap. preschool. Bridges, Fuller, Rumberger, & Tran Policy Analysis for California Education (PACE)
• However, these participation rates vary by race/ethnicity: African American (59%), white (58%), Asian
Study Approach: American (47%), and Latino (38%), and by socioeconomic status:
The findings from this study are upper-middle class (80%) and low based on a representative sample of income (49%). 2,314 children entering kindergarten drawn from the Early Childhood Longitudinal Study-Kindergarten Sample (ECLS-K) data set.
• There is also variation in the average number of hours children spend at center-based programs: Black (20), white (14), Asian American (14), and Latino (7).
•
•
•
•
Latino children tend to enter center-based programs one year later than white children.
Low-income, Latino, and African American children show lower proficiency levels before entering kindergarten.
Children who participate in center-based programs show greater achievement gains compared to children who do not attend center-based programs.
Gains are larger for Latino children and children in low-income families, especially if the child enters the center before age 4.
87

Access to Quality Early Learning and Care
Report Recommendations Key Findings/Rationale Preschool and Child Care Enrollment in California (2004) Lopez & de Cos California Research Bureau Study Approach: Data from the 2000 Census Public Use Microdata Sample for 59,424 3-to-5 year olds not yet enrolled in kindergarten were utilized for this study.
• Efforts are needed to increase Latino in preschool/child care programs.
children’s enrollment •
•
•
•
•
Although Latino children composed 46% of all children ages 3 to 5 not yet in kindergarten in California, they only composed 36% of children enrolled in a preschool/child care program (public and private)—but they did compose a larger proportion of enrollment of public preschool/child care programs at 51%.
37% of Latino children were enrolled in a preschool/child care program, compared with 58% of white children, 50% of Asian American children, and 56% of African American children.
Differences of the age of the child, or the composition of the child’s household, do not explain racial/ethnic group differences on enrollment rates.
Family income may explain some of the differences in enrollment rates, with children from higher income families more likely to be enrolled in preschool/child care.
However, Latino enrollment remained low across all income levels, while rates remained high for African American children across all income levels.
88

Report Recommendations Key Findings/Rationale New Lives for Poor Families? Mothers and Young Children Move through Welfare Reform (2002) Fuller, Kagan, & Loeb Stanford Center for Education Policy Analysis Study Approach: The project team followed a sample of 948 mothers and preschool-age children for 2–4 years after the women entered new welfare programs in California, Connecticut, and Florida. Mothers were interviewed, children were assessed, and homes and child care settings were visited.
• None related to child care are provided. • Many children moved into new child care centers and preschools. Lower-performing children who entered center-based programs displayed significantly stronger gains in cognitive skills and school readiness, moving about 3 months ahead of the children who remained in home-based settings. This positive relationship was stronger for children who attended higher-quality centers.
Access to Quality Early Learning and Care
89

Quality Assessment of Early Learning and Care Programs
Report Recommendations Key Findings/Rationale California Infant and Toddler Early Learning Policy Recommendations (2012) Water Cooler Infant-Toddler Workgroup
•
•
Support the State Advisory Council on Early Learning and Care and advance a statewide Quality Rating System for children ages 0–5.
Fund home visiting services in addition to early care and education programs.
• A QRIS system has the potential to truly focus on early learning and care programs for infants and toddlers as well as preschool-age children.
Study Approach: The Water Cooler Infant-Toddler Workgroup convened over 130 individuals representing 95 organizations to develop recommendations to address the policy problems facing early care and education services for infants and toddlers in California. Over the course of five meetings, the workgroup formulated, discussed, and ranked policy recommendations in the areas of funding, access to quality services, workforce development, and the building of a comprehensive system for infant and toddler care and education in California.
• Advance a Quality Rating and Improvement System for early learning and care serving children ages 0–5.
90

Quality Assessment of Early Learning and Care Programs
Report Recommendations Key Findings/Rationale How Would Programs Rate Under Overall implications and recommendations: • About 80% of centers would reach Tier California’s Proposed Quality Rating and Improvement System? Evidence From S tatewide and County Data on Early Care and Education Programs (2012)
• The study findings point to the value of standards: programs currently score highest on those quality elements where standards are already in place through licensure or program standards.
•
3 to 5 on the quality elements of ratio and group size.
About half would reach Tier 4 or 5 for staff education levels.
• Programs are most likely to need technical assistance • Only one in 4 would reach Tier 4 or 5 Karoly & Zellman in improving relevant ERS ratings (ECERS-R, FCCERS- based on ECERS-R, FCCERS-R, ITERS-R, RAND Corporation R, ITERS-R, and CLASS, if included). or the CLASS, if the latter is included in • It may be challenging to generate meaningful ratings the Q RIS. Study Approach: where there is variation across classrooms, or where • Overall, fewer than 10% would reach Virtual “pilot” consisting of data from an different age groups are served. Tier 5. earlier RAND study of 200 centers across the state serving preschool-age children and a set of centers and family child care homes participating in San Francisco County’s Gateway to Quality Initiative.
•
•
There is value in using existing surveys or data sets to estimate the range of ratings in advance of pursuing more costly pilots.
It would be useful to launch an early pilot effort to measure the elements of family engagement and program leadership, and to assess the implications of including them in the QRIS system.
• More publicly funded programs, such as State Preschool Title 5, or Head Start, would reach Tier 4 than would a statewide representative sample of all licensed programs. But even among publicly subsidized programs, few would reach Tier 5.
• The study recommends estimating the effects of voluntary implementation and/or targeting participation to publicly subsidized programs
•
•
Based on ERS ratings, infant/toddler programs would rate somewhat lower than those serving preschool-age children, and family child care would score lower than center-based programs.
The study did not rate programs on the quality elements of program leadership or family engagement.
91

Quality Assessment of Early Learning and Care Programs
Report Recommendations Key Findings/Rationale Race to the Top Early Learning • The application proposes a locally based approach to • A one-size-fits-all QRIS would not be the Challenge Grant Application (2012) the development of a QRIS and avoids new spending way for California to build a high quality commitments. The application, more than making system. California’s 1,729 local State of California recommendations, amounts to a set of state educational agencies and more than commitments, as summarized below. 50,000 early learning providers span a Study Approach: Application citing administrative data from multiple state agencies and
• California’s successful ($50 million) Early Learning Challenge Grant application commits the state to building a strong network composed of 16 of the
far wider spectrum of size, infrastructure, and readiness for change than exists in any other state.
reports to federal agencies most rigorous communities that have already • Defining rigid quality tiers at the state established a QRIS; together these participating
communities in 15 co unties stand to improve the lives of nearly 1.8 million children.
• The network will provide a research-based Quality Continuum Framework that helps local QRISs: 1) assess child development and school readiness; 2)
level will not work for California, and nor will it work to rate and reward early childhood programs on standardized metrics established in Sacramento. What makes sense in San Francisco is unlikely to work in rural communities.
improve teacher effectiveness; and 3) improve the quality and safety of learning environments.
• The regional Consortia have made a commitment to strengthen their local QRIS and mentor other communities that wish to do the same.
• Another primary rationale for California’s locally based approach is the state’s dire fiscal situation. The priority is to set the state on a new path to economic stability for future generations.
Specifically, all early learning and development programs participating in the QRIS will have plans in place to support the following targets:
• 75% of children in participating programs are assessed using validated observational assessment tools;
• 75% of lead or master teachers employed in participating programs will develop individual professional growth plans based on teacher effectiveness rating scores, with 50% of QRIS program teachers showing improved teacher effectiveness over the term of this grant funding;
• 75% of participating programs will be assessed using the appropriate Environment Rating Scale, with 90% of them showing improvement over the term of this
92

Quality Assessment of Early Learning and Care Programs
Report Recommendations grant funding.
Key Findings/Rationale
Consortia will:
• Implement a QRIS that incorporates evidence-based common elements and tools in the Quality Continuum Framework;
• Utilize a rating system for their local QRIS that implements a set of common assessment tools included in the Framework;
• Establish benchmarks and tiers of quality in the local QRIS, and use those to set goals; and
• Develop an Action Plan that includes program participation baseline and target data, alignment and incorporation of the common elements and tools in the Framework (in addition to any local elements or tools), locally set benchmarks and tiers, a quality improvement process, key personnel, resources, and a timeline. In addition, the plan will explain how RTT-ELC funds will support capacity-building activities, and how existing resources will be redirected in support of the goals.
93

Quality Assessment of Early Learning and Care Programs
Report Recommendations Key Findings/Rationale We Can Do Better: NACCRA’s Ranking • Require every child care center and family child care • California’s Title 22 licensing system of the State Child Care Regulations and home caring for one unrelated child or more for pay ranks 46th least stringent in the nation. Oversight (2011) to be licensed. • Each inspector has an average National Association for Child Care Resource and Referral Agencies (NACCRRA)
•
•
Increase frequency of inspections of child care centers.
Require center directors to have a bachelor's degree
caseload of 169 se ttings, far more than the nationally recommended ratio of 1:50.
or higher in early childhood education or a related • The center requirements do not require Study Approach: field. staff to complete any annual training,
State child care administrators provided written documents about their state
• Increase the education requirements for lead teachers to a CDA credential or an associate degree
and do not require a post-secondary degree for lead teachers.
child care licensing regulations. Based in early childhood education. • The child care workforce is comprised on these documents, states were scored and ranked on the following: child care oversight, child care center
• Establish the requirement for 24 hours of annual training for all staff members.
of many individuals with a relatively low level of education; thus, training is critical to promote an environment
regulations, and an overall rank • Require programs to address all six of the where children learn. combing the above two factors.
• •
•
•
developmental domains in offering activities.
Require a check of the sex offender registry.
Require parent involvement and daily/frequent communication with parents.
Make both inspection and complaint reports available online.
Reduce the caseload for licensing inspectors.
California Report Card 2011–12: • Implement recommendations from the Early Learning • Child care centers in the state are Setting the Agenda for Children (2012) Advisory Council to pilot a state Quality Rating and routinely inspected once every five Improvement System. years, unlike those in a majority of Children Now
• Evaluate the current structure of the Community Care states, where visits are conducted on Study Approach: Analysis of administrative data and extensive literature review
• Licensing Division.
Expand the existing state licensing website so that parents and providers have access to licensing information online.
• average once a year.
One likely cause of the infrequent inspections is that the ratio of centers to licensing staff is 229:1.
• Streamline the process for obtaining licenses, including the possibility of allowing local agencies to conduct licensing reviews and site visits to support the state system.
94

Quality Assessment of Early Learning and Care Programs
Report Recommendations Key Findings/Rationale Power of Preschool Program Evaluation • Provide training and technical assistance to • First 5 Power of Preschool (PoP) Report (2011) encourage blending/braiding of funding streams to preschool and infant/toddler support the higher cost of the PoP level of quality classrooms are of high quality: Franke, Espinosa, & Hanzlicek UCLA Center for Healthier Children, Families and Communities for First 5
• Provide opportunities for PoP counties and programs to share knowledge and engage in improvement work
Classroom environmental assessment ratings for preschool classrooms averaged 5.5 out of a possible score of
California 7; infant/toddler programs scored an average of 5.3 out of 7. Study Approach: Review of county self-reported data as well as information in annual PoP local evaluation and statewide reports
Dream Big for Our Youngest Children: Purpose of Quality Rating and Improvement System • The state has three early learning and Final Report (2010) California Early Learning Quality Improvement System (QRIS) Advisory
• Establish a quality rating structure that integrates the current multiple sets of standards into one coherent, evidence-based system.
care “systems”—Title 22 licensure, Title 5 state-contracted, and Head Start, as well as a publicly funded “non-system” of license-exempt care. Only 2 of these
Committee Develop a system for standardized assessments to “systems” (Title 5 and H ead S tart) have rate the early learning and care settings and make standards that are designed to promote Study Approach: the ratings available to families in a clear, easy-to- child development and school 2 years of CAEL QIS Advisory Committee and subcommittee meetings; input from early learning and care program staff, child care licensing officials, county superintendents of education, local
understand format.
Proposed Design of Quality Rating Structure Establish a 5-tier block system that assesses 5 quality elements:
• readiness.
California’s Title 22 licensing system ranks 46th (lowest) in the nation, and its licensing standards are lenient in several important areas, allowing
child care council and child care • Ratios and group size considerably larger-than-recommended resource and referral leaders, First 5 California and county commission staff, • Teaching and learning staff-child ratios, not requiring staff to
complete any annual training, and not and nationally known experts on quality • Family involvement requiring any post-secondary degree for rating and improvement systems.
• Staff education and training
• Program leadership
Within each tier, a program must meet all the standards before it can advance to a higher tier.
• Under the QRIS, a program or provider would have to meet the basic licensing standards to obtain the
•
lead teachers (NACCRRA, 2009). The standards are designed to protect health and safety, but not to promote children’s readiness for school.
Title 5 standards for state-contracted child development programs come much closer to meeting nationally recommended standards.
95

Quality Assessment of Early Learning and Care Programs
Report Recommendations Key Findings/Rationale entry-level rating. • Publicly supported license-exempt care
• To advance to the mid-level rating, a program or provider would meet standards similar to the more
is not subject to any monitoring or even initial inspection in California.
stringent Title 5 st ate-contract standards for early • Studies show parents value high quality childhood programs. child care, but often do not spot
• At the top level, a program or provider would meet requirements that incorporate nationally recommended quality standards, such as the National Association for the Education of Young Children standards.
Inform families and public policy through:
shortfalls (Barraclough & S mith, 1996; Wolfe & Scrivner, 2004; Cryer, Tietze, & Wessels, 2002). Families rated centers nearly twice as high as did trained assessors on such key elements as health, safety, and staff-child interaction (Helburn, 1995). These findings highlight a need for easily
• Standardized assessments to measure the quality of accessible, objective ratings about the teaching and learning. safety, health, and quality of early
• Higher ratings for programs and providers that learning taking place in these settings, actively engage and partner with families. where children spend up to 11 hours
• Higher ratings for well-qualified educators and per day.
directors trained in early childhood education, • Since 2000, 23 states have including ongoing professional development. implemented QRIS systems, and, as of
• Higher ratings for education plans, sufficient staffing, and small group size.
•
2010, 20 more were in some stage of planning them (Tout et al, 2010).
Of the 23 states with QRIS systems in Ratios and Group Size Requirements Proposed for QRIS: 2010, 12 use the block system, 5 use a
• For Tiers 1 and 2, establish essentially the same requirements as for Title 22.
point system, and the remainder use a combination or alternative approaches.
• For Tiers 3 and 4, establish essentially the same requirements as for Title 5, except allowing a ratio of 10:1, assuming there is a group size of 20.
• In a block system, all the quality criteria in each tier need to be accomplished to obtain that rating, and the criteria included build on those in previous
• For Tier 5, require the same as for Tiers 3 and 4, blocks. Unlike a point system, where except that the ratio for infants in centers is 3:1 and providers may meet some but not all group size is 9. criteria for a particular tier, a block
• For family child care homes, use current Title 22 licensing criteria for ratio and group size.
system structure promotes more consistency in the meaning of the ratings and makes it easier for families
Teaching and Learning Rating Requirements Proposed for
96

Quality Assessment of Early Learning and Care Programs
Report Recommendations Key Findings/Rationale QRIS: to understand and compare ratings. To rate programs or providers, use standardized assessment tools to help families identify quality programs, guide programs in making improvements, and give policymakers a basis for designing technical assistance and other quality program initiatives.
Based on syntheses of more than 40 years of research (Zigler, Gilliam, & Jones, 2006; Jacobson, 2004; Peisner-Feinberg et al., 2000; Jorde-Bloom, 1988), key features of high quality programs include:
• For Tier 1, require facilitated self-assessment with Environment Rating Scales (ECERS-R, ITERS-R, or FCCERS-R).
• Intensive education (e.g., small classes, low ratios, regular attendance)
• For Tier 2, require facilitated peer assessment with Environment Rating Scales (ERS).
• Teachers interacting responsively with children
• For Tier 3, require independent assessment with Environment Rating Scales with an overall score of
• Family involvement in a culturally and linguistically responsive manner
4.0; and self-assessment with the Classroom • A “curriculum” or plan of activities Assessment Scoring System (CLASS), pre-K version, or the Program Assessment Rating Scale (PARS) (infant/toddler) to measure teacher-child interactions
• Adequate numbers of well-trained, qualified staff
in alternate rating periods. • Program directors who understand
• For Tier 4, require subscales; set same rating requirements as for Tier 3, except require overall ERS
child development and provide leadership
scale of 5.0 a nd independent assessment with The state funds child care resource and referral CLASS or PARS. programs in every county to provide information
• For Tier 5, set same rating requirements as for Tiers to parents on the range of services available 3 and 4, except require overall ERS score of 6.0 and and tips on how to look for quality programs, but independent assessment with CLASS or PARS. there is no objective rating system on which to
base the information and referrals. Base part of the QRIS rating for Teaching and Learning on • Providing sufficient individual attention alignment with Early Learning Foundations and Frameworks: to young children is a key quality
• For Tier 1, program must have a copy of and receive indicator, and a relatively high ratio of orientation on the above and have an education plan adults to children may be especially with a philosophy statement. important for infants and toddlers
• For Tier 2, must explore integrating the Foundations (Shonkoff & Phillips, 2000).
and Frameworks, and have an education plan with a • The number of children in a group is developmentally, culturally, linguistically appropriate often considered to be as important as (DCLA) curriculum. staff-child ratios to the overall quality of
97

Quality Assessment of Early Learning and Care Programs
Report Recommendations Key Findings/Rationale
• For Tiers 3 and 4, must develop competency in integrating Foundations and Frameworks, have an education plan with all domains linked to DCLA child assessments, and professional development plan for Foundations and Frameworks.
• the program.
The ERS, first published in 1980, have demonstrated reliability and validity, and they are used in most other states that have QRISs.
• For Tier 5, same requirements as for Tiers 3 and 4, except must include all domains of learning in an integrated fashion in lesson plans linked to DCLA child assessment
Family Involvement Requirements Proposed for QRIS: See section on Family and Community Engagement below. Staff Education and Training Requirements and Program Leadership Requirements Proposed for QRIS: See section on Workforce Knowledge and Competency Framework below. Proposed Pilot Testing of QRIS:
• Pilot test and phase in over 5 or more years.
• Launch a 3-year pilot that includes sufficient time for planning and evaluation.
• The system will initially be voluntary; after piloting, the QRIS can then be required for publicly funded programs, and eventually for all licensed early learning and care programs.
• Pilot test a rating process involving the ERS every 2 to 3 years, and at higher tiers, measure teacher-child interactions for preschoolers with the CLASS and for infants/toddlers with the PARS.
• Explore options for combination of local and state oversight, with QRIS reviews done at the county or regional level and the CDE providing oversight and assurance of consistency.
•
•
•
•
•
The CLASS is an assessment tool with demonstrated reliability and validity that is particularly noted for its capacity to assess the quality of teacher instruction for preschool children. It is now being required by the federal government to evaluate the quality of Head Start programs.
The Program Assessment Rating Scale (PARS) measures the early educator’s responsiveness to children ages birth to three.
Alignment with the Foundations and Frameworks serves as a proxy for curriculum, child assessment, developmental and health screenings with appropriate referrals, inclusion of children with special needs, and cultural and language competence. The Foundations and Frameworks contain these (and other) p rogram quality criteria and are aligned with kindergarten standards.
Among the 23 states that have already implemented QRIS systems by 2010, many strongly recommended a field test or pilot prior to implementing the system statewide.
Based on a study of QRIS systems in 5 pioneer states, Zellman and Perlman (2008) recommended conducting pilot
98

Quality Assessment of Early Learning and Care Programs
Report Recommendations Key Findings/Rationale Proposed Systems to Support Quality Improvement: work and, if possible, revising the
• Voluntary technical assistance to help programs system before it is adopted statewide.
improve, using a client-driven, data-based coaching • Pilot projects provide an opportunity to model, and build on California’s early learning explore the efficacy of various methods resources, including the Foundations, the for recruiting early learning and care Frameworks, and the child assessment tools that providers to volunteer to participate in provide research-based, effective practices that link the rating process, investigating phase-to kindergarten and elementary education. in timelines, and studying the length of
• See also recommendations below for Supporting Early Childhood Workforce Development, Family and
time programs stay on or move up tiers given the standards for each tier.
Community Engagement, Effective Data Systems to track progress, and Finance, Governance, and Systems Issues below.
Preschool Adequacy and Efficiency in • Increase the routine inspection rate for child care • Minimal regulation of some subsidized California: Issues, Policy Options, and centers and family child care homes and make providers and weak standards on key Recommendations (2009) inspection reports publicly available on the Internet. program elements for more highly Karoly RAND Corporation
• Develop and pilot a QRIS and tiered reimbursement system, as part of state’s larger effort to create an Early Learning Quality Improvement System.
regulated programs do little to promote high quality services in publicly funded programs.
Study Approach: Based on integration of results from 3 earlier studies on gaps in school readiness and achievement in early grades, the use of ECE services and the quality of those experiences, and the system of publicly funded ECE programs
• Use a multi-pronged strategy—with an emphasis on measurement and monitoring, financial incentives and supports, and accountability—to promote higher quality preschool experiences in subsidized programs.
•
•
By statute, California requires routine inspections every 5 years, but with funding fluctuations in recent years, the inspection rate has ranged from 10 to 30 percent.
In addition, California does not make inspection reports readily available to the public.
•
•
Current reimbursement system provides no financial incentive to improve quality.
QRSs/QRISs have several advantages: Can include a broad set of program structure measures; multiple rankings provide room for and recognition of improvements, and summary ranking measures are easy for parents and the
99

Quality Assessment of Early Learning and Care Programs
Report Recommendations Key Findings/Rationale
•
•
public to understand.
At the same time, attention must be paid to the validity of the ratings, the frequency of the ratings, and the cost of the ratings.
Experience with QRISs in other states underlines the importance of piloting before implementing statewide, minimizing use of self-reported data (though self-assessment with ERS can be useful at some levels of the system), and integrating licensing into the system. The use of accreditation as a quality component has proved to be problematic, and it is also important to evaluate whether the QRIS meets its intended goals (Zellman & Perlman, 2008).
We Can Do Better: NACCRA’s Ranking • Inspect child care centers more often than once every • California’s Title 22 licensing system of the State Child Care Regulations and 5 years. ranked 40th least stringent in the Oversight (2009)
• Require annual training (preferably 24 hours of nation in 2010, and 47th in 2011. National Association for Child Care Resource and Referral Agencies Study Approach:
• center staff each year instead of none).
Require centers to offer language, social, emotional, and cognitive development activities as part of their daily program.
• Each inspector has an average caseload of 169 se ttings, far more than the nationally recommended ratio of 1:50.
State child care administrators provided written documents about their state child care licensing regulations. Based on these documents, states were scored and ranked on the following: child care oversight, child care center regulations, and an overall rank
•
•
Require providers to put babies to bed on their backs (to prevent SIDS) unless directed otherwise by a medical authority.
Require centers to involve parents in their child’s program and to communicate with them about the care of their child or children.
• The center requirements allow considerably larger-than-recommended staff-child ratios, do not require staff to complete any annual training, and do not require a post-secondary degree for lead teachers.
combing the above two factors.
100

Quality Assessment of Early Learning and Care Programs
Report Recommendations Key Findings/Rationale Power of Preschool Program Ev aluation Based on the meta-analysis of PoP demonstration programs, • The average global ECERS-R scores Report (2009) researchers developed 11 recommended criteria for a high ranged from 5.0 to 6.1 across all 9 PoP quality preschool program. Of these, the following pertain counties – i.e., “good” to “excellent.” Fitzgerald, Sormano, Ramirez, Mathur, Benitez, Reynolds, Provance, Cowles, Livingston, & Hayes Evaluation Matters with First 5 California Staff
specifically to program quality:
• Well-trained, well-paid (by local standards) teachers, and teachers who receive coaching and professional development
• PoP counties met or exceeded most of the quality benchmarks established by the National Institute for Early Education Research (NIEER).
• Attention to structural quality and ratios and class Study Approach: sizes as specific by National Institute for Early
Review of county self-reported data as well as information in annual PoP local evaluation and statewide reports
Education Research (NIEER), National Association for the Education of Young Children (NAEYC), and First 5 California
• Emphasize process quality and high levels of interaction to develop social and emotional skills
The Children of LAUP: Executive • A 2-pronged approach in which teacher qualifications • The overall quality of the LAUP Summary of the First 5 Universal are enhanced and, where possible, class size programs, as measured by the Preschool Child Outcomes Study (2009) reductions could result in improved quality. Classroom Assessment Scoring System
Love, Atkins-Burnett, & Vogel, Mathematica Policy Research Inc.
• LAUP coaches might enhance program quality by focusing on aspects of what the CLASS refers to as Instructional Support.
(CLASS), compared favorably with the quality levels reported in other studies of preschool programs, but was generally still less than ideal for
Study Approach: supporting children’s school readiness. Descriptive study of 97 programs • Instructional support was the weakest serving 1,555 4 -year-old children, a of the 3 CLASS domains, especially in representative sample of LAUP the area of Concept Development and programs. Study included class Quality of Feedback by teachers. observations using the CLASS, analysis of STAR ratings, and direct child • LAUP programs located in schools assessments. scored higher than non-school-based
classrooms on both Emotional Support and Instructional Support on the CLASS.
101

Quality Assessment of Early Learning and Care Programs
Report Recommendations Key Findings/Rationale Evaluation of Preschool for All in San • Use the CLASS in conjunction with the ECERS-R to • Despite the fact that providers Mateo and San Francisco Counties assess program quality. expressed anxiety regarding the ECERS-(2009)
American Institutes for Research
Study Approach: Results from Year 3 are based on a
• The use of the CLASS in a random sample of classrooms on a periodic basis would provide valuable information to supplement the ECERS-R data, particularly given the growing body of research demonstrating the importance of quality adult-child interactions for children’s learning and development.
R process, the external assessment process (coupled with funding for classroom enhancements) resulted in a major improvement in quality among preschool settings in San Mateo County.
teacher survey and a random sample of • Observations of PFA classrooms using classroom observation using CLASS and the CLASS indicate that PFA programs the Language Interaction Snapshot. in San Mateo County typically offered Results from Year 4 are based on warm and emotionally supportive interviews with a random sample of 29 teacher-child interactions, and teachers Preschool for All providers. implemented effective behavior and
instructional management strategies.
• However, some PFA teachers appeared to be less effective in promoting children’s higher-order thinking skills and cognition and providing feedback to expand learning and understanding.
102

Quality Assessment of Early Learning and Care Programs
Report Recommendations Key Findings/Rationale Issues and Options: Developing Safety The LAO identified 4 options for improving information and • Comprehensive, publicly available and Quality Ratings for Child Care assessing the quality of child care: information about child care providers (2007) • Option 1: Post licensing on the Internet (Ongoing Cost is lacking.
Nackman & Eiler-White Legislative Analyst’s Office
= $0.4 million)
• Option 2: Create ratings that consolidate and communicate licensing information, rate facilities
• Public communication of information about licensed care is important for parents, providers, and policymakers.
Study Approach: based on compliance, and post rating information on • Because the license only measures
LAO considered pros and cons of 3 different options to providing quality ratings of child care programs.
Internet (one-time cost of $2.0–11.5 million and ongoing cost of $0.4 million).
• Option 3 Basic: Expand Option 2 to include quality criteria, develop ratings for licensing elements that are associated with quality (e.g., ratios, group size, staff qualifications), and post on Internet (one-time
whether or not a provider meets the licensing standards, it cannot be used to evaluate other components of care, such as the quality of the learning environment, the qualifications of the teachers, and staff-to-child ratios.
cost of $2.0–11.5 million, and ongoing cost of $2.5– 12 million)
• Option 3 Plus: Expand the Option 3 Basic ratings to include additional quality criteria, including direct observational assessments; develop new rating scale to incorporate additional quality criteria; rate facilities
• Disseminating this information could influence the overall quality of the provider market as well as help policymakers target resources where they are needed and reward providers who excel in providing high quality
according to their performance on the criteria; and post ratings on Internet (one-time cost of $2.5–12 million and ongoing cost of $13 million).
The LAO concluded that “Option 3 Basic strikes the right balance between cost and the relative value of the information that is provided to the public.”
• Option 3 Basic would base ratings on a few simple criteria such as staff-to-child ratios, group size and staff qualifications, building on data already collected through the licensing process, with the state monitoring information about participating providers through document review and verification coupled with an audit mechanism.
• Option 3 Basic would not require the use of extensive on-site observational assessments.
The LAO further recommended that the Legislature use a
programs.
• Local models for QRIS already exist. Tiered standards for staff qualifications, staff-to-child ratios, and group size were determined by the initial QRS efforts in Los Angeles and San Francisco.
• Tiered reimbursement would create added incentives for providers to achieve and maintain quality programs. It would also help to rationalize the current child care reimbursement system, which in some cases pays higher reimbursement rates for a lower quality of care. However, if providers’ ratings are linked with financial incentives, the state will face an added layer of responsibility for ensuring that the ratings are consistently fair and
103

Quality Assessment of Early Learning and Care Programs
Report Recommendations Key Findings/Rationale phased approach if it chose to implement this type of child care information system, beginning with posting existing licensing information on the Internet, then distilling existing licensing records with a rating or grade, and then piloting the system.
Once Option 3 Basic was in place, the Legislature could consider some additional features, such as streamlined use of direct observational assessments along with technical and financial assistance to help providers improve their ratings.
reliable.
Child Care in Poor Communities: Early • The strong positive effects stemming from center • The study found a strong, significant, Learning Effects of Type, Quality, and care (relative to kith and kin arrangements), as well and positive effect of participation in Stability (2004) as form quality and stability, suggest that as
government invests more resources in child care, center-based programs on almost all cognitive outcomes, relative to children
Loeb, Fuller, Kagan, & Carrol greater attention should be paid to the quality of care who remained with individual kith or kin Published in Child Development and ensuring center-based options for more families. providers.
Study Approach: • The center effects remained positive and significant after controlling for
Data collected from maternal mother’s education, children’s baseline interviews, child assessments, and cognitive outcomes, site effects, age of observations of center care and home- the children, and mother’s cognitive based care settings for 451 families proficiency. residing in San Francisco or San Jose, California, or Tampa, Florida • Effects of child care type on social
development were less consistent, but children participating in family child care homes exhibited more behavioral problems than those in other types of care.
• Child care quality, as measured by the ECERS, also affected children’s cognitive and language development.
104

Quality Assessment of Early Learning and Care Programs
Report Recommendations Key Findings/Rationale The Relation of Preschool Child-Care Quality to Children’s Cognitive and Social Developmental Trajectories through Second Grade (2001)
Peisner-Feinberg, Burchinal, Clifford, Culkin, Howes, Kagan, & Yazejian Published in Child Development
• Policies should promote better quality child care • High quality child care positively affects children's cognitive and social skills through the second grade, according to a major national study by researchers at four universities.
• Children who attended quality preschool programs scored better on math, language, and social skills
Study Approach: Child care quality data and language, cognitive, and socio-emotional functioning assessment data were collected from 733 children from pre-school to second grade in 4 U.S. regions, including Los Angeles County. The results from this study involved controlling for family selection factors related to child-care quality and development.
development through the early elementary years than children in poor-quality programs.
The Cost, Quality and Child Outcomes in Child Care Centers: Technical Report (1995)
Helburn Department of Economics, Center for Research in Economic and Social Policy,
• There is a need for greater monitoring of centers and for trained, objective observers to assess the quality of programs.
• There is a need for better tools to allow parents to identify good quality child care and pay for high quality child care.
• Only about half of the infant classrooms met the “good” benchmark, and nearly half of infant and toddler programs provided poor quality care.
• Parents ranked centers nearly twice as high as did trained assessors.
University of Colorado at Denver
Study Approach: Classroom assessments using the ECERS and ITERS in 401 centers in 4 states—California, Colorado, Connecticut and North Carolina—serving infants, toddlers, and/or preschool age children in 1993.
105

Family and Community Engagement
Report Recommendations Key Findings/Rationale Preschool and School Readiness: Experiences of Children with Non-English-Speaking Parents (2012)
Cannon, Jacknowitz, & Karoly RAND Corporation
Study Approach: Using data from the RAND California Preschool Study and the Early Childhood Longitudinal Study, Birth Cohort (ECLS-B), this study examines the early care and education experiences of four-year old children of immigrant parents who do not speak English well.
• Policymakers should consider funding preschool in conjunction with other evidence-based early intervention strategies for disadvantaged children, such as home visiting or programs that combine parent education with preschool education.
• Preschool is not a panacea for closing school readiness and achievement gaps.
California Infant and Toddler Early Learning Policy Recommendations (2012)
Water Cooler Infant-Toddler Workgroup
• Maintain child care and case management services for the infants and toddlers of teen parents.
• Support family engagement from the earliest points of entry into developmental and early learning services.
• Most children 0–3 are not in licensed care.
Study Approach: The Water Cooler Infant-Toddler Workgroup convened more than 130 individuals representing 95 organizations to develop recommendations to address the policy problems facing early care and education services for infants and toddlers in California. Over the course of five meetings, the workgroup formulated, discussed, and ranked policy recommendations in the areas of funding, access to quality services, workforce development, and
106

Family Engagement
Report Recommendations Key Findings/Rationale the building of a comprehensive system for infant and toddler care and education in California.
Power of Preschool Program Evaluation Report (2011)
Franke, Espinosa, & Hanzlicek UCLA Center for Healthier Children, Families and Communities for First 5 California
Study Approach: Review of county self-reported data as well as information in annual PoP local evaluation and statewide reports.
• In order for First 5 California to obtain evaluation reports with more consistency and uniformity, it is important to provide the participating counties with more rigorous guidelines as to what should be included in the evaluation and how evaluations should be conducted. Written guidance and establishing a common set of tools would enable comparability of data.
• Almost every PoP county requires parents to complete the DRDP parent survey. However, aside from the survey, there is no uniformity for evaluating parent engagement activities.
Power of Preschool (PoP) Table of Best Practices from Counties (2011)
American Institutes for Research
Study Approach: This study interviewed First 5 Executive Directors and/or designated staff most closely associated with the administration of the program to understand what was working well for them in each of several areas.
• None given • Counties reported varying levels of focus on family engagement. Los Angeles Universal Preschool (LAUP) reported hiring a Parent Engagement Specialist and having success with their Parent Ambassador program, where parents come to a training once per month, and food is served. Trainings cover topics such as child development and community activities. First 5 San Mateo and the San Mateo County Office of Education have adopted the Virtual Pre-K program, which is a series of lesson plan supports linking activities in the classroom to what parents can do at home and in the community.
107
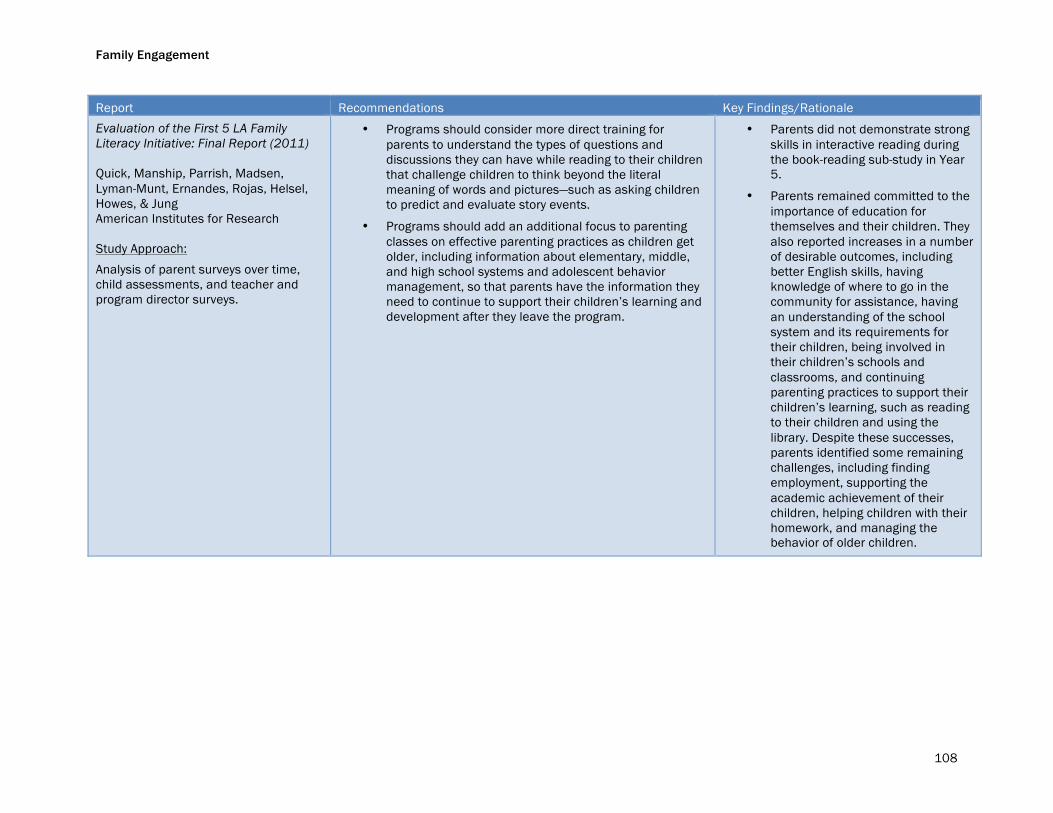
Family Engagement
Report Recommendations Key Findings/Rationale Evaluation of the First 5 LA Family • Programs should consider more direct training for • Parents did not demonstrate strong Literacy Initiative: Final Report (2011) parents to understand the types of questions and
discussions they can have while reading to their children skills in interactive reading during the book-reading sub-study in Year
Quick, Manship, Parrish, Madsen, that challenge children to think beyond the literal 5. Lyman-Munt, Ernandes, Rojas, Helsel, Howes, & Jung American Institutes for Research
meaning of words and pictures—such as asking children to predict and evaluate story events.
• Programs should add an additional focus to parenting
• Parents remained committed to the importance of education for themselves and their children. They
Study Approach: classes on effective parenting practices as children get older, including information about elementary, middle,
also reported increases in a number of desirable outcomes, including
Analysis of parent surveys over time, and high school systems and adolescent behavior better English skills, having child assessments, and teacher and management, so that parents have the information they knowledge of where to go in the program director surveys. need to continue to support their children’s learning and
development after they leave the program. community for assistance, having an understanding of the school system and its requirements for their children, being involved in their children’s schools and classrooms, and continuing parenting practices to support their children’s learning, such as reading to their children and using the library. Despite these successes, parents identified some remaining challenges, including finding employment, supporting the academic achievement of their children, helping children with their homework, and managing the behavior of older children.
108

Family Engagement
Report Recommendations Key Findings/Rationale Dream Big for Our Youngest Children: Family and Community Engagement Requirements Proposed for • It is the interaction between the Final Report (2010) QRIS: child’s family and early learning and
California Early Learning Quality Improvement System (QRIS) Advisory
Use the ERS measure for family involvement and the Title 22 licensing requirements related to family engagement as proxies for the family engagement element of the rating scale.
care setting, whether a center or family child care home, that promotes the best developmental
Committee • For Tier 1, communicate with parents (measured by
and child outcomes.
Study Approach: 2 years of CAEL QIS Advisory Committee and subcommittee meetings; input from early learning and care program staff,
facilitated ERS self-assessment; if subscale item is less than 3, an improvement plan is developed; compliance with Title 22 center requirements, or comparable Title 22 FCCH requirements).
• The Chicago Child-Parent Centers found that family engagement is not only an essential component of a high quality early learning program, but also a key factor associated
child care licensing officials, county • For Tier 2, educate parents and receive information with more positive student superintendents of education, local (measured by facilitated ERS peer-assessment; if outcomes and greater family child care council and child care subscale item is less than 3, an improvement plan is involvement in the elementary resource and referral leaders, First 5 developed. Topics offered in support of subscale, school years (Miedel & Reynolds, California and county commission staff, provisions for parents, and indicators for family 1999). and nationally known experts on quality rating and improvement systems.
information may include how children learn at home and in early learning and care; developmental levels and brain development; physical activities and nutrition).
• Research has demonstrated that, regardless of family income or
• For Tier 3, involve parents (measured by independent ERS assessment; when subscale item is less than 4, a quality improvement plan will be developed). Provider has a written transition plan that is activated when a child moves into another child care setting or into kindergarten.
• For Tier 4, engage parents (same measure as for Tier 3 except if subscale item less than 5, a quality improvement plan will be developed).
cultural background, children whose parents are involved in their education are more likely to achieve higher grades and test scores, have more consistent school attendance, demonstrate better social skills and self-esteem, show improved behavior, and adapt well to the school environment (Coghlan et al., 2009; Henderson & Mapp, 2002).
• For Tier 5 partner and advocate with parents. Same measures as for Title 4 except that if subscale item is less than 6, a quality improvement plan will be developed.
Advisory Committee’s Engagement Subcommittee’s draft plan recommends:
• Establish a brand for the QRIS that informs and promotes quality early learning and care programs.
• To establish a brand for the QRIS, some states use keys or stars.
• Most teachers enter the early childhood profession because they enjoy being with children. They do not necessarily have an interest in children’s families, nor are they always prepared to work with them. The professional culture in child
109

Family Engagement
Report Recommendations Key Findings/Rationale
• Ask state, county, and local agencies and organizations development has promoted this currently working with families to assist with mindset, emphasizing the child and disseminating information to families, stakeholders, and paying less attention to family and the community. Include/train spokespeople who speak community roles. the families’ language and are trusted sources of information.
• Lopez (2010) identifies three essential components to effectively
• Seek corporate and agency sponsors and secure expert partnering with families: assistance to develop branding, templates, and a public strengthening the family-child bond outreach campaign. and acknowledging the primacy of
• Teachers need training and technical assistance to ensure that whatever activities are implemented, they are done with the intent of building partnerships with families.
the family in child development by engaging parents in making choices about their children, addressing diversity and understanding cultural and socio-economic variations in childrearing practices and values, and building trust with families by sharing knowledge about child rearing and other topics.
California Infant/Toddler Early Learning and Care Needs Assessment: A Policy Brief (2010)
Anthony & Muenchow American Institutes for Research
Study Approach: Analysis of extant data from CDE, Early Head Start Program Information Reports, Department of Social Services, and the California Child Care Resource and Referral Network as well as review of related research.
• To help parents identify quality settings for infants and toddlers, a QRS could be an extremely useful consumer protection tool, with the family as the purchaser of services and the ultimate” consumer” defined as the infant.
• Compared to trained assessors, parents rate centers nearly twice as high on the ECERS/ITERS assessment items for Health, Safety, and Staff-Child Interactions compared to trained assessors (Helburn, 1995)
110

Family Engagement
Report Recommendations Key Findings/Rationale The Children of LAUP: Executive • Strengthen strategies to encourage parents of Spanish- • Findings by family risk factors and Summary of the First 5 Universal speaking children to increase the length of time the home language indicate that Preschool Child Outcomes Study (2009) children attend the program. children with more than 3 risk
Love, Atkins-Burnett, & Vogel Mathematica Policy Research Inc.
• Work with parents to increase their program involvement participation in home activities.
factors (such as having a mother who has not completed high school, is not married, or does not read to the child at least 3 days a week)
Study Approach: and those who live in homes where Descriptive study of 97 programs only Spanish is spoken have a serving 1,555 4-year-old children, a greater need for the instructional representative sample of LAUP support preschool can provide. programs. Study included class • Parents of Spanish-speaking observations using the CLASS, analysis children compared to other of STAR ratings, and direct child language groups reported lower assessments. frequency of reading to their
children and having fewer children’s books in the home.
• Parents of Spanish-speaking children reported their children spent fewer hours attending preschool per week relative to the other groups. For example, 22% of parents in the Spanish-only group reported their child attended the LAUP program 12 or fewer hours per week, as compared to 7% of the English- and 8% of the other-language groups.
111

Family Engagement
Report Recommendations Key Findings/Rationale Power of Preschool Evaluation Report (2009)
Prayaga, Sormano, Hobart, Neville-Morgan, Smith, Balakshin, Padilla, Bupara, & Syphax Evaluation Matters with First 5 California Staff
Study Approach: Review of county self-reported data as well as information in annual PoP local evaluation and statewide reports
• There is a need for greater parent engagement, and, implicitly, more evaluation of what strategies work with which populations.
• The First 5 PoP counties have implemented various outreach and involvement strategies to more effectively engage families.
• Most report challenges with working with a large immigrant population.
• Every county reported an increase in parenting skills and knowledge as well as parent behaviors relating to home educational activities, but these findings were largely based on parent self-reports and surveys.
112

Family Engagement
Report Recommendations Key Findings/Rationale Great Expectations: Multilingual Poll of Latino, Asian, and African Parents Reveals High Educational Aspirations for Their Children and Strong Support for Early Education (2006)
New American Media
Study Approach: 602 Latino, African American, and Asian parents in California were interviewed about educational issues.
• None given • Two-thirds of African American parents responding to the poll indicated that their child under the age of five attends a preschool program, compared to less than half of Asian parents and just a quarter of Latino parents indicating that their child is in such a program.
• The majority of parents interviewed believed that their children need to attend an educational program before the age of 5 to prepare them for kindergarten; however, less than 30 percent of the parents enrolled their children in such a program.
• Half of Latino parents, a third of African American parents, and a quarter of Asian parents say there are no quality child care centers in their neighborhood or town that they can afford.
• Latino and African American parents strongly supported pre-school bilingual programs, while Asian parents were more divided on this issue.
113

Family Engagement
Report Recommendations Key Findings/Rationale The Importance of Family Engagement: • As part of their application for funding, programs should • Family engagement is associated English Language Learners, Immigrant submit written plans that describe how they will partner with greater child, family and Children, and Preschool for All: Issue with families and meet their cultural and linguistic needs. program benefits. Brief (2004)
• Programs should aim for ongoing communication with • Using a variety of family
Naughton Children Now
families in appropriate languages and should use bilingual staff or interpreter services if needed.
• Programs should aim to recruit and retain staff members
engagement strategies helps programs successfully involve more families in meaningful ways.
Study Approach: who reflect the community. • Family engagement may support
Summary and analysis of existing research
• Programs should provide ongoing multilingual technical assistance.
maintenance of home language, maintenance of culture, and high expectations, which in turn contribute to school achievement (Nieto, 1992)
The New Wave of Evidence: The Impact of School, Family, and Community Connections (2002)
Henderson & Mapp
• Programs should engage families to have positive effects on student academic achievement and other outcomes.
• Build strong relationships with parents and community organizations.
• Programs and interventions that engage families in supporting their children’s learning at home are linked to higher student achievement.
Southwest Educational Development Laboratory
Study Approach: A review of 51 studies, all but two of which were published between 1995 and 2002
114

Family Engagement
Report Recommendations Key Findings/Rationale Building Their Futures: How Early Head • More infant-toddler studies are needed that replicate the As part of the Early Head Start program, Start Programs Are Enhancing the Lives Early Head Start program. parents are encouraged to develop close of Infants and Toddlers in Low-Income and supportive relationships with their Families (2001) infants/toddlers and to become healthier
and economically self-sufficient. Parents Love, Kisker, Ross, Schochet, Brooks- who participated in the Early Head Start Gunn, Boller, et al. program showed the following: Mathematica Policy Research, Inc., and Center for Children and Families at Teachers College, Columbia University
• More supportive environments for their children
• More knowledge about their child’s Study Approach: development
17 Early Head Start programs consisting • Less parental stress and family of 3,000 children throughout the U.S. conflict (including California) were purposefully selected and randomly assigned into a treatment group. Results from this
• Greater enrollment in education or job training programs
evaluation are based on parent • Early Head Start programs that had interviews, child assessments, and fully implemented key components videotaped parent-child interactions. of the program earlier facilitated
participation and had a larger positive impact on child and parent outcomes
• Home-based programs, which provided more direct and intensive contact with the provider, were related to greater impact on parent outcomes.
115

Workforce Development: Knowledge and Competency Framework and Supporting Early Childhood Workforce Development
Report Recommendations Key Findings/Rationale California Infant and Toddler Early • Ensure broad availability of college courses and • Those in the workforce serving Learning Policy Recommendations professional development opportunities for infant-toddler infants and toddlers are less likely (2012) caregivers—especially training to help providers meet
higher quality standards. to hold college degrees or credits than preschool providers. Infant-
Water Cooler Infant-Toddler Workgroup
Study Approach: The Water Cooler Infant-Toddler Workgroup convened more than 130 individuals representing 95 organizations to develop recommendations to address the policy problems facing early care
• Ensure caregivers have training on identification of and early intervention for children at risk and with special needs.
• Expand training opportunities for infant-toddler providers in supporting the needs of dual-language learners, including increasing access to evidence-based professional development programs for infant-toddler providers who are themselves English learners.
toddler providers, especially in home-based settings, are more likely to speak English as a second language and to face barriers in attending college.
and education services for infants and toddlers in California. Over the course of five meetings, the workgroup formulated, discussed, and ranked policy recommendations in the areas of funding, access to quality services, workforce development, and the building of a comprehensive system for infant and toddler care and education in California. This report outlines the group’s recommendations.
116

Workforce Development: Knowledge and Competency Framework and Supporting Early Childhood Workforce Development
Report Recommendations Key Findings/Rationale A Golden Opportunity: Advancing the • Pay attention to the content and quality of the degree • Numerous observational studies Professional Development System for program and the context of the ECE environment that show that specific dimensions of California's Early Care and Education can support hinder effective practice, not just attainment care quality and child Workforce (2012) of particular degrees or credentials in isolation. developmental outcomes are
Karoly RAND Corporation
Study Approach: Analysis drawing on administrative reports, other publicly available data, and research evidence regarding effective professional development systems, including examples from other states.
• Ongoing research is needed to refine hypotheses about the relationship of practice and child outcomes with the intensity of professional development activities, the timing and sequencing of training and practice components, and the practitioner’s level of formal education.
• Ongoing research is also needed re: effective approaches to professional development with providers in home-based settings, as well as those providers serving infants and toddlers and culturally and linguistically diverse groups of children.
positively linked with teachers who have more education and training as well as specialized preparation in early childhood education (Howes, Whitebook, and Phillips, 1992; Howes, 1997; Phillipsen et al., 1997; Burchinal et al., 2002; National Institute of Child Health and Human Development (NICHD) Early Child Care Research Network, 2002; Bowman, Donovan, & Burns, 2001; Burchinal et al., 2000;
ECE Workforce:
• Implement an ECE workforce registry, inclusive of all members of the workforce, to identify who is in the field, their demographic characteristics, their educational and professional development experiences and credentials, and their employment history; support linking registry to a database of ECE programs to identify the context in which people are working.
NICHD ECCRN and Duncan, 2003; and Early et al., 2006).
• This relationship has been found for both center-based and family child care homes.
• Proven early childhood programs that have demonstrated shorter-and longer-term benefits for participating children—e.g.,
• Develop a well-defined ECE career pathway (career ladder) and associated credentials aligned with the Early Childhood Educator Competencies, the postsecondary education and training programs, and potential or actual QRIS (including the potential reintroduction of a preschoool-to-grade-3 teaching credential) Drawing on proven models, address need for financial supports for practitioners to pursue additional education and professional development either through the workforce investment programs or the QRIS if one is implemented.
Abecedarian program, Chicago Child-Parent Center program, High Scope Perry Preschool, and Oklahoma universal preschool—all employ lead teachers with a bachelor’s degree or higher and specialized training (Cannon & Karoly, 2007a).
• More recently, several large-scale observational studies have questioned the strength of the relationship between teacher education level or degree field and
117

Workforce Development: Knowledge and Competency Framework and Supporting Early Childhood Workforce Development
Report Recommendations Key Findings/Rationale Education and Training Providers: classroom quality and child
• Continue the process of alignment and articulation of the ECE curriculum within and across the CCCs and the CSU system, as well as alignment with the Early Childhood Educator Competencies and career ladder; evaluate the effectiveness of higher education programs in promoting required ECE competencies.
outcomes. Early, Maxwell, Burchinal, et al. (2007) and Howes, Burchinal et al. (2008) did not find a consistent, positive and statistically significant relationship between teacher education or degree field and classroom quality
• Continue to address gaps in higher education program measures and child outcomes. capacity, course offerings, opportunities for practicums, and faculty quality and diversity. • Possible explanations for the
inconsistent findings include • Phase in specialized accreditation for ECE AA and BA variations in the quality of the
programs. degree programs themselves, in the • Implement approaches to better serve the diverse needs level of support in the work
of the current and potential ECE workforce seeking to environment, and in the level of advance their professional development; draw on proven compensation. The very rapid models, including the use of cohort models, dedicated expansion of early education counseling, and technology-mediated professional programs in the last decade may development. have attracted the most effective
teachers without post-secondary
Workforce Investment Dollars: degrees whereas the more successful teachers with B.A.
• Collect the required information through the workforce degrees moved into the early registry to track the workforce investment program elementary grades. participants and their outcomes (e.g., retention) • Research on the contribution of
• Institute a more rigorous program of evaluation for training, apart from degree funded programs, including measurement of effects on programs, to teacher effectiveness participant competencies, quality of care provided, is less prevalent. Several recent retention in the ECE field, and child developmental randomized trials have been outcomes, and how those impacts are mediated by the conducted on relationship-based work environment. professional development, including
• Streamline and align the set of programs in light of evidence of program effectiveness and other system changes (e.g., ECE competencies, career ladder and credentialing, potential QRIS).
mentoring, coaching, consultation, technical assistance, and apprenticeships. Given that these studies have often been conducted with well-educated teachers in center-based settings, the results
Other: are not generalizable to other early
118

Workforce Development: Knowledge and Competency Framework and Supporting Early Childhood Workforce Development
Report Recommendations Key Findings/Rationale As the system improves, attention should be paid to aligning the learning and care settings. ECE workforce professional development system with California’s K-12 system, including the new Transitional Kindergarten program established by the 2010 Kindergarten Readiness Act.
• Recent studies suggest that many members of California’s early care and education (ECE) workforce do not have the desired skills and knowledge to be effective in their work with young children.
California has taken a number of steps to build an ECE workforce professional development system (PDS):
• Publishing early childhood educator competencies
• Working to address past concerns regarding alignment and articulation within and across the state’s 2- and 4-year colleges and universities that offer ECE-related courses and degrees
• Employing approaches to promote further education and training for diverse members of the ECE workforce
• Employing approaches to promote further education and training the diverse members of the ECE workforce
• Providing financial incentives through grants and stipends for those who seek additional education and training
But key elements are not yet in place, and many concerns remain:
• Need to align the state’s ECE credentialing system with other
119

Workforce Development: Knowledge and Competency Framework and Supporting Early Childhood Workforce Development
Report Recommendations Key Findings/Rationale components of the PDS
• Need to address the quality of ECE higher education programs
• Need to more systematically evaluate the workforce investment activities that receive approximately $70 million in federal, state, and local funding annually
• Lack of key infrastructure component that many other states have: a workforce registry.
• Weaknesses in the ability of center-based classroom teachers to provide instructional support for the age-appropriate language development and reasoning skills linked to later success in school
• Limited training in working with dual language learners
Data gaps mean that little is known about how well existing PDS resources are being used.
• California does not have the data systems to track the ECE workforce in terms of enrollment in education and training programs
• Existing data do not allow accurate counts of number and mix of individuals who participate in publicly funded workforce investment programs, and even less is known about the benefits of the myriad local informal training opportunities available
120

Workforce Development: Knowledge and Competency Framework and Supporting Early Childhood Workforce Development
Report Recommendations Key Findings/Rationale Early Math in California (2012)
Stipek & Schoenfeld
Study Approach: Summary of recommendations emerging from a meeting on early math instruction sponsored by the Heising-Simons Foundation
• Improve pre-service training by requiring a course in math teaching for an associate or bachelor’s degree in early childhood education, and requiring a focus on math instruction in the context of courses for the Child Development Teacher permit. Develop model course syllabi, lesson plans, and videos to facilitate the implementation of course content focused on the teaching of mathematics to young children.
• Explore the creation and implementation of an age 3–8 teaching credential.
• There is no requirement for early childhood educators to receive training in the teaching of mathematics.
121

Workforce Development: Knowledge and Competency Framework and Supporting Early Childhood Workforce Development
Report Recommendations Key Findings/Rationale By Default or By Design? Variations in • Make more finely developed data elements about faculty • There is great variation in Higher Education Programs for Early background the norm for ECE teacher preparation admission standards for higher Care and Education Teachers and Their research (e.g., ask individual faculty members questions education programs for early Implications for Research Methodology, such as, “How recently have you worked directly with childhood educators, expected Policy, and Practice (2012) young children?” and “What, if any, direct work
experience do you have with infants and toddlers and/or student outcomes, and rigor with which higher education programs
Whitebook, Austin, Ryan, Kipnis, with preschoolers?”) assess student learning. Almaraz, and Sakai Center for the Study of Child Care Employment
• Regularly update data about faculty members and maintain in a data system such as an early childhood workforce registry.
• Research about higher education for ECE has typically focused only on the topics included in the course
Study Approach: • Maintain up-to-date information on both the capacity and of study, not the depth of coverage.
Case study of 2 B.A. completion cohort programs in 4-year public (C.S.U.) campuses designed for students employed in settings for children primarily birth to age 5. Methods included phone interviews with higher education program
content of higher education programs.
• Require institutions to report changes in their offerings, whether in response to state policies, funding, or other institutional dynamics.
• Measure the efficacy of various approaches to teacher preparation.
• Research has typically asked whether or not a given program requires students to complete a clinical experience, without distinguishing the type of experience, such as “practicum,” “fieldwork,” or “student teaching.”
representatives; document review • Research also often does not (course descriptions, objectives, and address the ratio of fulltime to select syllabi); and student surveys. adjunct faculty, the availability of
student supports, and the stability of program resources.
• Research conducted without such nuanced information has led to blanket condemnations of higher education for the early childhood profession, without differentiating among the types of early childhood-related programs that are more or less successful in preparing ECE teachers.
• Only when distinctions can be clearly drawn among varying approaches to the preparation of ECE teachers will researchers become able to delineate best
122

Workforce Development: Knowledge and Competency Framework and Supporting Early Childhood Workforce Development
Report Recommendations Key Findings/Rationale practices and to determine the contribution of higher education to teacher effectiveness.
• In this case study of 2 cohort programs, students in the program supervised by a mentor were much more likely to report that they had received the guidance and supervision they needed than students who had been supervised only by an instructor/faculty member or by staff at the clinical site.
Evaluation of Program for • More research on the PITC and other training • Information is lacking on the Infant/Toddler Care (PITC): An On-Site interventions is needed for fuller examination of both effectiveness of training strategies Training of Caregivers: Final Report implementation and impacts. for child care providers. (2012) • The PITC was not found to have a
Weinstock, Bos, Tseng, Rosenthal, Ortiz, Dowsett, et al. National Center for Education Evaluation and Regional Assistance, Institute of Education Sciences (IES)
statistically significant effect on a composite measure of children’s cognitive/language scores, measured approximately 6 months (on average) after it ended.
• The PITC did not have a statistically Study Approach: significant effect on children’s
An experimental study was conducted to evaluate the impact of the on-site caregiver training component of the Program for Infant/Toddler Care (PITC). The study sample consisted of 251 child care programs and 936 children located in Southern California and Arizona. The
composite behavior scores, measured at 6 months after it ended. Sensitivity analyses, conducted with two alternative approaches to missing data treatment, had results consistent with these findings.
PITC training is research- based; • The PITC did not have a statistically includes practices that facilitate healthy significant effect on global program development and sensitivity to quality, as measured by trained children’s home communities, cultures, observers administering the ITERS-and languages; provides program policy R and the FCCERS-R. recommendations; and addresses
123

Workforce Development: Knowledge and Competency Framework and Supporting Early Childhood Workforce Development
Report Recommendations Key Findings/Rationale program operation and environmental arrangements.
• The PITC did not have a statistically significant effect on staff-child interactions, a composite measure incorporating interactions items from the environment rating scales and from the PITC-PARS. Results of sensitivity analyses were consistent with these findings.
• However, the intervention was not fully implemented or was not implemented with full participation in many child care programs; thus additional research is recommended.
124

Workforce Development: Knowledge and Competency Framework and Supporting Early Childhood Workforce Development
Report Recommendations Key Findings/Rationale Race to the Top Early Learning Proposed Activities (which were approved by the federal The following describes the estimated Challenge Grant Application (2012) government grant award): qualifications of California’s ECE workforce:
State of California • Early Learning core curricula at California Community
Colleges will be expanded to include aligned coursework • 26% of estimated 4,000 Program
Directors have the Child
Study Approach: on infants and toddlers, children with special needs, and program administration.
Development Program Director credential
Application citing administrative data from multiple state agencies and reports to federal agencies
• Web-based training resources for early learning educators will be created to facilitate wider distribution.
• Train-the-trainer instruction will be provided to center Director Mentors on the Program Administration Scale
• 44% of estimated 8,000 Site Supervisors have the Child Development Site Supervisor Credential
and to Family Child Care Mentors on the Business Administration Scale.
• Learning community (cohort) support will be provided to ECE professionals.
• Integrate Early Childhood Educator Competencies into higher education coursework.
• 3% of estimated 30,000 Master Teachers have the Child Development Master Teacher credential
• 5% of estimated 75,000 teachers have the Child Development credential
• 16% of estimated 40,000 Associate Teachers have the Child Development Associate Teacher credential
• 23% of estimated 19,000 Assistant Teachers have the Child Development Assistant Teacher credential.
The following describes the status of activities to strengthen workforce development:
• In 2006, a core curriculum of 8 evidence-based courses was established for ECE preparation at California community colleges. It has been adopted by 102 of the state’s 105 community colleges offering ECE programs; alignment
125

Workforce Development: Knowledge and Competency Framework and Supporting Early Childhood Workforce Development
Report Recommendations Key Findings/Rationale with the California State University 4-year curriculum has also begun.
• The Child Development Staff Retention Programs, CARES, and CARES Plus have invested $450 million since 2001 in professional development and support for the early learning workforce; these systems also provide for robust data collection on the early learning workforce.
• The Early Childhood Educator Competencies were released in 2011 and represent a major step toward creating a well-designed, coordinated plan to prepare early childhood educators in California.
• The CARES Plus database, hosted and funded by First 5 California, provide data on the workforce, including both CARES Plus and AB 212 participants.
• Los Angeles and San Francisco Counties are jointly developing a workforce Registry pilot, aligned with common data elements in their local QRIS.
Power of Preschool Program Evaluation Report (2011)
Franke, Espinosa, & Hanzlicek UCLA Center for Healthier Children, Families and Communities for First 5 California
Study Approach:
• Provide ongoing training and technical assistance to programs and teachers around best reaching practices, and around administering and understanding results from various classroom, program, and child level assessments.
• The PoP teacher salaries are based on the attainment of child development teacher permits, experience, completion of applicable college credit coursework, and/or attainment of an advanced degree, and are categorized into the following: “Entry”, “Advancing,” or “First 5 Quality,” with First 5 Quality
126

Workforce Development: Knowledge and Competency Framework and Supporting Early Childhood Workforce Development
Report Recommendations Key Findings/Rationale Review of local First 5 PoP reports for signifying the highest achievement 2009–10, annual data submitted by level. counties for 2010–11, and interviews with First 5 staff
• Among PoP Master Teachers” o Almost 58% have at least a
bachelor’s degree o Over 30% have an associate’s
degree o 43% are at the “Advancing”
level o Over 50% are at the “First 5
Quality” level, with a minimum of 24 college credits in Early Childhood Education
o The percentage of Master Teachers at the “First 5 Quality” level increased from 45% to X50%from 2008–09 to 2010– 11 .
• Among PoP Assistant Teachers o Over 31% have earned an
associate’s degree o More than 16% hold a
bachelor’s degree o Over 36% are at the
“Advancing” level o Almost 45% are at the “First 5
Quality” level
127

Workforce Development: Knowledge and Competency Framework and Supporting Early Childhood Workforce Development
Report Recommendations Key Findings/Rationale Dream Big for Our Youngest Children: California needs to build on innovative projects and commit to • Most early educators lack sufficient Final Report (2010) statewide access to an articulated pathway through higher
education based on early educator competencies, equitable professional development and academic training in child
California Early Learning Quality compensation and environments, and research- and data-driven development (Whitebook, Gomby, Improvement System (QRIS) Advisory professional development practices that link effective teaching Bellm, Sakai, & Kipnis, 2009). Committee and learning relationships to child outcomes.
• Early childhood educators are
Study Approach: • Set up a support system for an already experienced workforce coming from very diverse educational
diverse in ethnicity, much like the population they serve.
The workforce section of the CAEL QIS report synthesizes findings and recommendations from more than 25 separate workforce studies, as well as dozens of presentations from expert consultants over a 2-year period. The CAEL QIS Workforce and Professional Development and Incentives
backgrounds, with classes available in the community and after hours.
• Establish clear timelines with systemic support for an articulation and transfer process within and among colleges and universities, system-wide and college-cohort data, and policies and funding that support student success to improve degree completion.
• Many early educators cannot attend college during normal business hours because they already work full-time.
• In an efficient system, courses would count for multiple purposes, such as toward certification and
Subcommittee was chaired by Dave • Build on the efforts of community colleges to align satisfying staff education Gordon, Superintendent of the courses and link them with state university courses to requirements related to Title 5 or Sacramento County Office of Education. create a pathway toward 2- and 4-year degrees, without
creating dead ends for the early learning and care workforce.
• By 2012, develop the Early Childhood Educator Competencies—which include the Foundations—into a common and comprehensive course of study that is reflected in courses for associate's and bachelor's degrees and delivered statewide. Require credit-bearing courses for degrees.
• Using the statewide common and comprehensive course of study based on the Early Childhood Educator Competencies: o By 2013, all California community colleges that offer
early learning and care programs incorporate the “core 8” classes and additional courses to reflect the designated lower division Competencies into their degree programs.
o By 2014, all California State University, University of California, and private higher education institutions
Title 22 licensing standards.
• Half of the community colleges and public universities in a survey conducted by Whitebook et al. in 2005 reported problems with transfer of credits and articulation of courses.
• Community colleges and state universities are making a concerted effort to improve articulation and alignment of courses, but as of December 2010, only 19 colleges had programs that were aligned, 20 more were finalizing their alignment, and an additional 53 are working toward submitting their alignment. Eleven colleges had not yet agreed to participate.
• California invests in many pre-
128

Workforce Development: Knowledge and Competency Framework and Supporting Early Childhood Workforce Development
Report Recommendations Key Findings/Rationale that offer early childhood education programs align these courses to a common and comprehensive course of study across the 2- and 4-year degree system.
By 2015, a clear and accessible system of demonstrating the Early Childhood Educator Competencies equivalency for courses will be developed and publicized, including clear criteria and deliverables. This system includes courses taken from out-of-state, foreign, and non-regionally accredited institutions, as well as competences developed through professional practice.
Staff Education and Training Requirements for lead teacher proposed for QRIS:
• For Tier 1, Center, 12 units of ECE; for FCCH, 15 hours of health and safety. For Title 22 teacher, 6 months experience; 21 hours of professional development annually.
• For Tier 2, Center, 24 unites of ECE (core8); for FCCH, 12 units of ECE (core 8); one year of experience and 21 hours of professional development annually.
• For Tier 3, 24 units of ECE (core 8) and 16 units of General Education (same as Title 5 and current Child Development Teacher permit); 2 years of experience, and 21 hours of professional development annually.
• For Tier 4, associate’s degree in ECE or 60 degree-applicable units, including 24 units of ECE or associate’s degree in any field plus 24 units of ECE (similar to Master Teacher in Title 5 programs or new October 2011 Head Start requirements). Also, 2 years of experience and 21 hours of professional development annually.
• For Tier 5, bachelor’s degree in ECE (or closely related field) with 48+ units of ECE OR master’s degree in ECE; 2 years of experience, and 21 hours of professional development annually.
Program Leadership Requirements proposed for QRIS:
service and in-service professional development activities, such as “cohort” bachelor’s degree completion programs, the Program for Infant/Toddler Care, the California Preschool Instructional Network, the Child Development Training Consortium, the California Early Childhood Mentor Program, and the Child Care Initiative Project. However, the projects need to be integrated into a coherent statewide system.
• Although there have been important efforts to subsidize the attainment of early learning and care degrees, the rules for access have been inconsistent across counties, and funds to finance tuition assistance have been reduced or eliminated.
• Early educators in preschool settings typically earn about half of what kindergarten teachers earn (U.S. Department of Labor, 2009), and turnover is high, hovering around 30 percent per year (Phillips, 2010).
• Compensation is low even for teachers who have bachelor’s degrees, especially in non-state-contracted centers receiving vouchers, and turnover is high compared to that of better compensated K-12 teachers (Whitebook et al., 2006).
• Raising the educational qualifications without providing
129

Workforce Development: Knowledge and Competency Framework and Supporting Early Childhood Workforce Development
Report Recommendations Key Findings/Rationale
• For Tier 1, 12 units core ECE (early childhood education, equitable compensation may make child development, family/consumer studies, or related it difficult to hire and retain the best field), 3 units administration, 4 years experience. teachers (Pianta et al., 2009). Introduction to PAS or BAS. • A substantial body of research
• For Tier 2, 24 units core ECE, 16 units General indicates that early educators with Education, 3 units administration, 1 year management or higher levels of education and supervisory experience. Self-study with PAS or BAS. specialized training in early
• For Tier 3, associate’s degree with 24 units core ECE, 6 units administration, 2 units supervision, 2 years management or supervisory experience. Continuous improvement through a PAS or BAS action plan.
childhood education are generally more effective than those without such backgrounds (Barnett, 2004; Bowman, Donovan, & Burns, 2001; Bueno, Darling-Hammond, &
• For Tier 4, bachelor’s degree with 24 units core ECE, 15 Gonzalez, 2010; Burchinal, Cryer, units management, 3 years management or supervisory Clifford & Howes 2002; Whitebook, experience. Continuous improvement through a PAS or 2003). BAS action plan. • Teachers in preschool programs
• For Tier 5, master’s degree with 30 units core ECE demonstrating long-term benefits in including specialized courses, 21 units management, or children’s achievements have all Administrative Credential. Continuous improvement held at least bachelor’s degrees through a PAS or BAS action plan. and had compensation similar to
that of public school teachers California needs to build on innovative projects and commit to (Whitebook, Gomby, Bellm, Sakai, & statewide access to an articulated pathway through higher Kipnis, 2009; Campbell, Ramey, education based on early educator competencies, equitable Pungello, Sparling, & Miller-compensation and environments, and research- and data-driven Johnson, 2002; Pianta, Barnett, professional development practices. Burchinal, & Thornburg, 2009).
Financial and non-financial incentives are needed as part of a system to motivate child development center teachers, assistant teachers, directors, and other staff members to seek professional development to improve outcomes for children, and expand skills.
• Specialized training in early care and education is also associated with higher quality programs for infants and toddlers (Kreader, Ferguson, & Lawrence, 2005).
• Research has shown that teachers with bachelor’s degrees and specialized training in child development expose children to larger vocabulary and provide richer language and cognitive experiences
130

Workforce Development: Knowledge and Competency Framework and Supporting Early Childhood Workforce Development
Report Recommendations Key Findings/Rationale (Bueno, Darling-Hammond, & Gonzalez, 2010; Ackerman, 2005); have a better sense of how to do lesson plans; and are warmer, more sensitive, and more engaging in their interactions with children (Ackerman, 2005; Zigler, Gilliam & Jones, 2006).
• At the same time, several recent studies question the link between caregiver education and program quality and child outcomes (Early et al., 2007; Pianta et al., 2005).
• Higher education needs to include more observation of teachers in the classroom, and more feedback on their effectiveness in interacting with young children (Pianta, Barnett, Burchinal, & Thornburg, 2009).
• Raising the educational qualifications without providing equitable compensation may make it difficult to hire and retain the best teachers (Pianta et al., 2009).
131

Workforce Development: Knowledge and Competency Framework and Supporting Early Childhood Workforce Development
Report Recommendations Key Findings/Rationale A Matter of Degrees: Preparing • States should require early childhood education teachers • Training or certification in early Teachers for the Pre-K Classroom to possess a bachelor’s degree and specialized training childhood education is the (2010) in early education. minimum educational requirement
Bueno, Darling-Hammond, & Gonzalez The PEW Center on the States: Education Reform Series
Study Approach: This study reviews the research on pre-K
• Investments in the higher education infrastructure are needed to allow for comprehensive and high quality pre-K training programs.
• States should establish policies and systems to accommodate and support the challenges faced by many early childhood education students.
for state-funded pre-K lead teachers in California.
• Studies show that students of early childhood teachers with both a bachelor’s degree and specialized training in early education demonstrate the best gains in
teacher preparation, children’s learning, • More should be done to ensure early childhood social, emotional, early literacy, and and program quality. It explores the education teachers are trained to communicate and math and language skills. potential costs and benefits of professionalizing the pre-K workforce, the likely challenges associated with broad increases in preparation standards for early childhood educators, and the strategies some states and localities have used to address those challenges.
interact effectively with the diverse population of children in their classrooms. • Requirements for more rigorous
levels of early childhood education preparation could support higher compensation and easier recruitment of well-qualified staff, which could reduce staff turnover and improve program equality.
• Higher education suffers from shortages in course offerings and degree-granting, early childhood development programs.
• Most early childhood education students are non-traditional college students, are low-income women of color, and/or may have linguistic and cultural barriers.
• The early education workforce lacks sufficient training in and experience with teaching English language learners and students with special needs.
132

Workforce Development: Knowledge and Competency Framework and Supporting Early Childhood Workforce Development
Report Recommendations Key Findings/Rationale The Children of LAUP: Executive Summary of the First 5 Universal Preschool Child Outcomes Study (2009)
Love, Atkins-Burnett, & Vogel Mathematica Policy Research Inc.
Study Approach: Descriptive study of 97 programs serving 1,555 4-year-old children, a representative sample of LAUP programs. Study included class observations using the CLASS, analysis of STAR ratings, and direct child assessments.
• The relatively well-educated LAUP teacher workforce provides a solid foundation on which to make many of the improvements suggested in this report.
• LAUP coaches might enhance program quality by focusing on what the CLASS refers to as Instructional Support.
• Teachers need to learn better strategies to promote expressive language/vocabulary.
• 99% of the children’s teachers had taken 6 or more classes in early childhood education or child development; 88 % of lead teachers held at least an associate’s degree; and 61% had a bachelor’s or higher degree.
• About half of LAUP children had teachers who reported speaking both English and Spanish at home.
133

Workforce Development: Knowledge and Competency Framework and Supporting Early Childhood Workforce Development
Report Recommendations Key Findings/Rationale Evaluation of Preschool for All in San • Invest in professional development and technical • Feedback from staff reflected a Mateo and San Francisco Counties assistance for preschool staff. strong level of satisfaction with PFA-(2009)
American Institutes for Research
• Focus training and technical assistance to promote quality adult-child interactions.
supported professional development and the services provided by the San Mateo County
• Provide a structured forum for preschool providers and Office of Education (SMCOE) Study Approach: partner agencies. Technical Assistance Coordinator. Results from Year 3 are based on a Program directors indicated that teacher survey and a random sample of PFA’s support of workforce classroom observation using CLASS and development was one of its most the Language Interaction Snapshot. significant contributions to the Results from Year 4 are based in provider community in San Mateo interviews with a random sample of 29 County. Preschool for All providers. • Observations using the CLASS
indicated that PFA programs typically offered warm and emotionally supportive teacher-child interactions, but some teachers appeared to be less effective in promoting children’s higher-order thinking skills and cognition and providing feedback to expand learning and understanding.
• All of the PFA classroom contractors and representatives from partner agencies that support the preschool community in the county noted the value of PFA as a forum through which key stakeholders could network, share information, and generate solutions to problems.
134

Workforce Development: Knowledge and Competency Framework and Supporting Early Childhood Workforce Development
Report Recommendations Key Findings/Rationale Preparing Teachers of Young Children: • The ECE and K-12 workforces should not be viewed as • The ECE workforce lacks many of The State of Current Knowledge and a two different worlds, but should share common the minimum educational and Blueprint for the Future, Parts I and II terminology and research agendas, background requirements and (2009)
Whitebook, Gomby, Bellm, Sakai, &
• A national ECE workforce data system that is compatible with K-12 workforce data should be developed.
accountability and reporting required of the K-12 workforce , resulting in lower quality and
Kipnis • Research on ECE teacher effectiveness should include quantity ECE workforce data. Center for the Study of Child Care Employment
Study Approach:
examinations of the influence of factors in the teaching work environment and the role of ECE center directors on teacher practice.
• Federal leadership should increase investment in higher
• Factors such as adult-child ratios, compensation, unionization, teacher retention, and turnover in administrative leadership can
Examines the early care and education education ECE degree programs and ongoing impact teacher practice and and K-12 research literature in depth to professional development. effectiveness. assess the current state of knowledge about the effective preparation of excellent teachers, and charts a research and policy agenda for the future.
• There is a need for research on which professional development approaches best influence teacher practice and student learning.
• There is a need for research on how ECE teacher
• The ECE workforce has limited opportunities to obtain a higher education degree and high quality professional development.
preparation program content and delivery influence teacher effectiveness.
• Teachers in ECE typically work for much lower wages than teachers in grades K-12, and formal pay scales are rare.
135

Workforce Development: Knowledge and Competency Framework and Supporting Early Childhood Workforce Development
Report Recommendations Key Findings/Rationale CARES Statewide Retention Study Final • Policymakers should identify the characteristics of child • CARES Program participant Report (2008) care providers that make them more likely to stay in the
field in order to develop strategies and programs to respondents indicated that they were most satisfied with the
Harder & Company for First 5 California support stabilizing and strengthening of the child care workforce.
incentive portion of the program and least satisfied with the
Study Approach: • Wage increases and benefits for the child care workforce academic counseling.
987 current and former participants in are needed to increase retention. • Respondents were most likely to the Comprehensive Approaches to strongly agree that their Raising Educational Standards (CARES) participation in the CARES program Program, which awards matching funds increased their desire to stay in the to California county commissions that early childhood education field. offer incentives to Early Care and Education staff who stay in the field and obtain further training and education, were surveyed to determine whether the program has affected agency or field retention.
• Respondents felt their participation in the CARES program provided some contribution to advancing their careers, such as earning their first child development permit and moving up the child development matrix.
• Respondents reported that incentives or stipends encouraged them to stay in the child care field and at their child care agency more than support services, such as advising.
136

Workforce Development: Knowledge and Competency Framework and Supporting Early Childhood Workforce Development
Report Recommendations Key Findings/Rationale California Early Care and Education • Disparities in ECE workforce educational attainment • The study estimated that in 2004 Workforce Study: Licensed Child Care should be addressed by expanding and strengthening the state had an estimated 7,000 Centers (2006) efforts to expand higher education offerings to more
remote communities without college campuses, to utilize directors, 45,000 teachers, and 23,000 assistant teachers in
California Early Care and Education distance learning, and to engage community agencies in licensed-center-based programs, Workforce Study: Licensed Family Child offering credit-bearing training. and another 37,000 licensed family Care Providers (2006)
Whitebook, Sakai, Kipnis, Lee, Bellm, Almaraz, & Tran Center for the Study of Child Care Employment
• In order to maintain and expand a diverse ECE workforce and improve the workforce’s competencies across all ECE workforce positions, investments should be made to ensure people from diverse cultural, educational, and financial backgrounds have access to professional development opportunities.
child care home providers plus the 16,000 to 21,000 assistants they employ.
• Of these 130,000 individuals, educational qualifications varied greatly” while 55 percent of
Study Approach: A statewide random sample of directors in 1,800 licensed centers were
• Recruitment strategies for college graduates to ECE teaching positions should be improved—including improved compensation.
directors in licensed centers reported having a bachelor’s degree, only 25 percent of lead teachers and 7 percent of assistant
interviewed. • More advanced training and coursework should be offered related to dual language learning and children with special needs
• Options to improve licensed settings using public dollars as a way to close the achievement gap between low- and high-income families should be explored.
teachers had such backgrounds. B.A. degrees were much less prevalent among centers serving infants than among those serving preschool children, and among family child care providers.
Child Care in Poor Communities: Early • No specific recommendations offered relative to • The provider’s education level was Learning Effects of Type, Quality, and workforce development, but study concludes that as consistently and strongly related to Stability (2004) government invests more resources in child care, greater
attention should be paid to the quality of care. higher scores of children on a composite of school readiness
Loeb, Fuller, Kagan, & Carrol assessments. Published in Child Development • The effect appeared to stem from
Study Approach: the character of social interaction between the caregiver and the child
Data collected from maternal in both center and home-based interviews, child assessments, and arrangements. observations of center care and home-based care settings for 451 families residing in San Francisco or San Jose, California, or Tampa, Florida.
137

Workforce Development: Knowledge and Competency Framework and Supporting Early Childhood Workforce Development
Report Recommendations Key Findings/Rationale Early Education Quality: Higher Teacher • More research is needed about effective alternative • The evidence to date suggests that Qualifications for Better Learning pathways to teacher preparation, particularly to ensure optimal teacher behavior in center-Environments –A Review of the linguistic and cultural diversity in preschool programs. based settings, and the skill and Literature (2003)
Whitebook Center for the Study of Child Care Employment
Study Approach:
• Public will and resources should be focused on ensuring that preschool programs can live up to the quality expectations placed on them. In addition to setting preschool teacher standards at the BA level, we must also make educational opportunities available to current and prospective teachers, clarify the optimal characteristics of preschool teacher training, and
knowledge upon which it rests, are best achieved through a four-year college degree, which includes some specialized content in early childhood education or child development.
• But while the research points to the Literature review focusing on 8 large compensate teachers sufficiently to retain them in the importance of the bachelor’s scale child care quality studies. field. degree, and the vast majority of
studies find that more education and training is better than less, we do not yet understand precisely what we gain from the BA over the AA degree.
Early Childhood Higher Education • None given • The Early Childhood Higher Inventory (2012) Education Inventory, administered
by the Center for the Study of Child Memo from Center for the Study of Child Care Employment at UC Berkeley, Care Employment can help policymakers and other
stakeholders develop a more coordinated and comprehensive professional development system for the ECE workforce. It allows users to create baseline descriptions of higher education course offerings for ECE practitioners, identify gaps and opportunities in these offerings, assess variation in programs, and track changes in the capacity of higher education programs over time.
138

Dual Language Learners
Report Recommendations Key Findings/Rationale Preschool and School Readiness, • State policymakers might consider targeting for • Found evidence, with large effect Experiences of Children with Non- enrollment in preschool the subgroup of children with sizes, supporting center-based care English-Speaking Parents (2012) non-English-speaking parents to help improve school-
entry reading skills among California’s English learners. participation in the year before kindergarten entry as a means to
Cannon, Jacknowitz, & Karoly improve early reading skills for RAND Corporation isolated children.
Study Approach: • Preschool centers serving isolated children may be missing an
Focuses on the early care and opportunity to improve education experiences and kindergarten mathematics skills, which are also readiness skills of four-year-old children key predictors of later achievement. in both California and the United States as a whole. • Despite high enrollment, a third of
isolated children are not participating in any center-based care in the year before they enter kindergarten.
Power of Preschool Program Evaluation • None given • Teachers and administrators were Report (2011) provided with courses and trainings
to help them support dual Franke, Espinosa, & Hanzlicek Language learners. UCLA Center for Healthier Children, Families and Communities for First 5 California
• At the program level, counties reported the use of parent volunteers to support EL students,
Study Approach: required parent participation, cultural celebrations, and the
Review of local First 5 PoP reports for promotion of acceptance through 2009–10, annual data submitted by diversity in daily routines and counties for 2010–11, and interviews activities as ways to support dual with First 5 staff language learners.
• Counties also reported recruiting PoP sites and staff based on their knowledge and experience with dual language learners.
139

Dual Language Learners
Report Recommendations Key Findings/Rationale Evaluation of the First 5 LA Family Literacy Initiative: Final Report (2011)
Quick, Manship, Parrish, Madsen, Lyman-Munt, Ernandes, Rojas, Helsel, Howes, & Jung American Institutes for Research
Study Approach: Evaluation of the First 5 LA Family Literacy Initiative included analysis of parent surveys over time, child assessments, and teacher and program director surveys.
• ECE classrooms should focus on incorporating research-based strategies to teach dual language learners, which would include incorporating more Spanish language support.
• English is being used frequently in many ECE classrooms with primarily Spanish-speaking children.
Children’s Elementary School Outcomes after Participating in Family Literacy Programs: Research Brief (2011)
Parrish, Quick, & Manship American Institutes for Research for the First 5 Family Literacy Initiative Evaluation
Study Approach: Students in the Los Angeles Unified School District who participated in the Family Literacy Initiative were compared on English language development, school achievement, and attendance to students who participated in a less intensive school readiness program.
• Policy makers and program developers should invest in comprehensive parent-and-child program models that promote language and literacy development.
• Children who participated in the Family Literacy Initiative had significantly higher attendance rates and standardized test scores in math and English language arts, but similar English language development scores in elementary school compared to children who did not participate in the program.
140

Dual Language Learners
Report Recommendations Key Findings/Rationale Los Angeles Universal Preschool • LAUP teachers and other staff may need to find ways to • From fall to spring, children nearly Programs, Children Served, and strengthen their teaching strategies for Spanish-speaking doubled their score on a letter-Children’s Progress in the Preschool children, increasing the length of time the children naming task; Spanish-speaking Year: Final Report of the First 5 LA attend, and working with parents to increase their children scored somewhat lower but Universal Preschool Child Outcomes program involvement and participation in home activities made the greatest gains during Study (2009) with their children. their year in the program.
Love, Atkins-Burnett, Vogel, Aikens, Xue, Mabutas, Carlson, Martin, Paxton, Caspe, Sprachman, & Sonnenfeld Mathematica Policy Research Inc.
• Outreach to parents of Spanish-only and primarily Spanish-speaking children to encourage better attendance may be part of a solution to the language achievement gap.
• Overall, 45% of the children who took the assessments in Spanish in the fall showed sufficient proficiency to be tested in English in the spring. This in itself suggests
Study Approach: progress in preparing children for an English-only public school
Descriptive study of 97 programs enrollment. serving 1,555 4-year-old children, a representative sample of LAUP programs. Study included class observations using the CLASS, analysis of STAR ratings, and direct child assessments.
• At the same time, performance of Spanish-only and primarily Spanish-speaking children on the early writing test was in a range that might suggest possible educational risk, as was the performance on expressive language.
• Parents of Spanish-only and primarily Spanish-speaking children reported (compared with other language groups) much lower average numbers of hours per week in preschool.
141

Dual Language Learners
Report Recommendations Key Findings/Rationale R&D Alert: Issue Focus: English Learners (2008)
WestEd
Study Approach: Description of WestEd professional development program and summary of research
• Move towards thinking of educating English learners as a systemic issue—something relevant to all teachers, not just EL specialists. Provide training to all teachers.
• In the classroom, give DLL students the opportunity to use oral language for varied purposes, forge connections between material that is already familiar to them and new material to be learned, and provide students with visual cues to clarify vocabulary and concepts.
• Support teachers to be consciously aware of which language they are supporting, to what degree, and through which strategies.
• The English Learners, Language, and Literacy in the Early Years (ELLLEY) professional development program promotes preschool English language instruction that uses children’s first-language skills as a foundation for speaking, listening, and reading in their second language.
• Home languages are critical to second-language development.
• Many of the preschool teachers and assistant teachers participating in ELLLEY training have never had formal instruction in language development, let alone in second-language development.
142

Dual Language Learners
Report Recommendations Key Findings/Rationale Assessment Considerations for Young • Assessors need to understand the process and stages of • EL children’s linguistic and cultural English Language Learners across acquiring a second language so they can accurately differences, and differences in Different Levels of Accountability (2007) interpret the language proficiency of an emergent
bilingual child. learning needs and abilities, must be considered throughout all
Espinosa & Lopez National Early Childhood Accountability Task Force and First 5 LA
• The child’s early language experiences, with particular attention to home language learning opportunities, must be considered when assessing oral language proficiency.
phases of a comprehensive and integrated EL assessment system.
• Because assessment frequently
Study Approach: Summary and analysis of existing
• The child must be assessed in the home language as well as English.
drives instruction, the more complete and accurate the assessments, the better the
research • Parents and other family members must be included in the assessment process.
• It is recommended that all children who speak a language other than English in the home receive an Individualized Language Plan (ILP).
• Assessment information should be frequently collected and reviewed by all teaching staff to monitor changes in language and overall development.
• Classroom assessment activities should be frequent, include multiple procedures, and reflect the goals of the program’s curriculum.
Recommendations regarding assessment for referral and identification of special needs:
• Great caution must be used when administering standardized tests to young ELs.
• An assessment team must be used that includes at least one other person who speaks the child’s home language and is familiar with the child’s culture.
• All procedures and results should be reviewed for cultural bias and accuracy by a person from that cultural group, and if possible by a bilingual educator.
• The selection of specific assessments for EL children should be based on a careful review of the respective manuals describing their technical aspects.
instruction will be.
• The more comprehensive and valid a program’s accountability and evaluation efforts are, the more effective the program will be in improving the lives of the EL children served.
143

Dual Language Learners
Report Recommendations Key Findings/Rationale Time to Revamp and Expand: Early • Expand lower-division programs in early childhood • Approximately half of the state’s Childhood Teacher Preparation studies, and increase opportunities for supervised colleges and universities have programs Programs in California’s Institutions of practicum experiences. preparing teachers to work with children Higher Education (2005)
Whitebook, Bellm, Lee, & Sakai Center for the Study of Child Care Employment
• Develop more upper-division and graduate programs in early childhood studies and teacher preparation.
• Hire more full-time early childhood faculty members.
• Develop targeted programs to attract and retain a more
under 5. Approximately three-quarters of these are at community colleges.
• The state’s higher education system is still mostly geared to entry-level work in ECE. Most students in the field are
Study Approach: Interviews with early childhood department chairs, program directors, or coordinators at 98.5% of all early childhood higher education programs (certificate through PhD) in the state.
culturally and linguistically diverse faculty.
• Secure more upper-division faculty with experience working with young children.
• Update and revamp the courses of study based on new knowledge and competencies that teachers need.
• Create opportunities for early childhood faculty to update
working towards a Child Development Permit.
• California’s population of early childhood education college students are very diverse in terms of ethnicity and language. Many speak a language other than English and approximately 1
and renew their knowledge and skills based on emerging research and changes in the field.
• Serve a diverse and rising early childhood student population to preserve and strengthen the diversity of the workforce.
• Create new incentives to encourage students to pursue degrees in early childhood/child development and to remain in the field.
• Create a blueprint for a well-articulated higher education system, with greater ease of transfer between community college, upper division, and graduate programs.
• Develop a comprehensive set of ECE teacher skills and competencies based on the latest research.
• Design a relevant early childhood teacher certification system.
• Promote improved teacher compensation in ECE in order to attract students.
• Create incentives and guidelines for institutions of higher education across the state to increase their program
in 5 face significant challenges in completing coursework in English. Only about one-fourth of programs offer language support for students learning English as a second language.
• Most of California’s early childhood students are working full-time.
• The faculty in early childhood teacher preparation programs are much less diverse than their students; nearly half of the programs have a 100% white, non-Hispanic full-time faculty.
• Most faculty members have earned a master’s degree or higher, but community colleges are more likely to have faculty with degrees in early childhood specifically and direct experience working with young children.
• About two-thirds of faculty members are part-time. On average, these programs employ fewer full-time faculty members
144

Dual Language Learners
Report Recommendations Key Findings/Rationale offerings in early childhood studies. than other programs at their
• Build public awareness of the knowledge and skills institutions.
required to work effectively with young children, why • Most of California’s ECE teacher prep advanced education is appropriate, and why programs do not offer courses in dual compensation must be raised. language learning and bilingualism.
• Coordinate efforts at all ECE teacher preparation • Some challenges faced by students programs to track current students and career pathways include lack of financial aid, competing once they leave. family responsibilities, lack of academic
• Support further research on best practices for producing effective early care and education teachers, including high quality practicum experiences, and on best practices for preparing teachers to work with young
preparation or skill, a shortage of practicum opportunities, and rising demand for courses and supports in non-English languages.
children who are dual language learners. • Many programs have difficulty attracting and retaining a diverse faculty.
• Many programs cannot serve all students who want to enroll, have difficulty transferring credits, and experience a lack of institutional support for the program.
• The persistence of low wages in the ECE field remains the greatest challenge for the ECE community.
145

Dual Language Learners
Report Recommendations Key Findings/Rationale The Importance of Family Engagement: Preschool programs in California that serve ELs and their • There is significant cultural, language English Language Learners, Immigrant families should contain the following: and economical variation among EL Children, and Preschool for All: Issue Brief (2004)
• Written plans describing how they will partner with families and meet their cultural and linguistic needs.
families.
• Some Latin and Asian cultures view
Naughton Children Now
• Ongoing communication with families in the appropriate language.
teachers as experts and feel they should be respectful of the educational program.
Study Approach: Summary and analysis of existing research
• Culturally competent staff who reflect the cultures and language of the children in the program.
• Staff professional development on how to meet the needs of EL children and their families.
• Mexican American families tend to view school readiness as children reaching the legal age for school.
• Cultural and linguistic differences may • Adjustments to serving children with special needs based
on cultural and community beliefs.
• Partnerships with community members and parenting networks already involved in ELs’ lives.
• Extra funding for programs working with families of ELs. Partnerships with families to support children’s development and learning.
• A parent advisory group representative of the children in the program.
be barriers to family involvement.
• Families respond more positively to a program staff that reflects their cultural and linguistic background.
146

Dual Language Learners
Report Recommendations Key Findings/Rationale Preschool and Child Care Enrollment in California (2004)
Lopez & de Cos California Research Bureau
Study Approach: Data from the 2000 Census Public Use Microdata Sample for 3 to 5 year olds and children not yet enrolled in kindergarten were analyzed for this study.
• None given • 31% of Latino and Asian children ages 3 to 5 were in households with members over the age of 14 that do not speak English fluently.
• Among Latino and Asian children, preschool and child care enrollment rates were lower for children ages 3 to 5 in households where someone over the age of 14 does not speak English fluently (35%) compared to children in households with older members who speak English fluently (50%).
• The percentage of children enrolled in preschool or child care increases only slightly if the members of the household over 14 speak English fluently (from 32% to 39%), but remains at 50% for Asian children.
147

Developmental Screening of Children
Report Recommendations Key Findings/Rationale Power of Preschool Program Evaluation • None given • All counties reported that some or Report (2011) all of their providers use the Ages
and Stages Questionnaire for Franke, Espinosa, & Hanzlicek developmental screening. UCLA Center for Healthier Children, Families and Communities for First 5 California
• Every county reported strategies to enroll children with special needs, and there is a strong push for the
Study Approach: inclusion and integration of special needs children into mainstream
Review of local First 5 PoP reports for classrooms. 2009–10, annual data submitted by counties for 2010–11, and interviews with First 5 staff
Power of Preschool (PoP) Table of Best Practices from Counties (2011)
American Institutes for Research
Study Approach: Interviewed First 5 Executive Directors and/or designated staff most closely associated with the administration of the program to understand what was working well for them in each of several areas.
• None given • Most counties reported using the ASQ or the PEDS for developmental screening. In at least one county, finding time for teachers to complete the screenings was reported to be a challenge.
148

Developmental Screening of Children
Report Recommendations Key Findings/Rationale The Children of LAUP: Executive • Steps should be taken to ensure that screening for • One-third of the children were in Summary of the First 5 Universal developmental and health problems is conducted for all classes where the teachers Preschool Child Outcomes Study (2009) children in all classrooms early in the program year.
Some of the children in the lowest quartile may be reported that they did not screen children for health or
Love, Atkins-Burnett, & Vogel eligible for IDEA services, and screening is the first step developmental problems. Mathematica Policy Research Inc. toward identifying and accessing services for children. • Among the children whose teachers
Study Approach: • Standardization of screening tools would facilitate revising their results and making consistent decisions
reported screening, 34% were screened with the Ages and Stages
Descriptive study of 97 programs across classrooms and groups of children. Questionnaires. serving 1,555 4-year-old children, a representative sample of LAUP programs. Study included class
• Across LAUP classrooms, a variety of screening tools were in use.
observations using the CLASS, analysis of STAR ratings, and direct child assessments.
Evaluation of Preschool for All in San Mateo and San Francisco Counties (2009)
American Institutes for Research
Study Approach: Results from Year 3 are based on a teacher survey and a random sample of classroom observation using CLASS and the Language Interaction Snapshot. Results from Year 4 are based in interviews with a random sample of 29 Preschool for All providers.
• Focus attention and professional development regarding identifying, referring, and serving children with special needs—both at the program level and at the systems level (e.g., closer coordination with agencies that provide special education services).
• The use of the ASQ and ASQ-SE in San Mateo County PFA classrooms provided staff with a structured mechanism to partner with families and identify children who were in need of further assessment. A formal follow-up strategy is critical.
149

Assistance to Children with Special Needs
Report Recommendations Key Findings/Rationale Special Needs Project (SNP) Final • None given • SNP sites were successful at Evaluation Report (2010) screening all children populations
at young ages. Fitzgerald, Sormano, Ramirez, Mathur, Benitez, Reynolds, Provance, Cowles, Livingston, & Hayes First 5 California, WestEd Center for Prevention and Early Intervention, and Institute for Social Research at California State University, Sacramento
• Methods for successfully screening large numbers of children included building relationships with families, collaborating with partner agencies, home visits, and having well trained screeners who conducted one-on-one screenings with families.
Study Approach: • School Readiness programs that
This evaluation included analyses of quantitative data, surveys of School Readiness Program staff and participating families, and interviews with Special Needs Projects staff.
connected with SNP sites provided more services and supports for children with special needs than School Readiness programs that do not connect to SNP sites.
• SNP sites did not report successfully including children in regular settings.
Power of Preschool Evaluation Report (2009)
Prayaga, Sormano, Hobart, Neville-Morgan, Smith, Balakshin, Padilla, Bupara, & Syphax Evaluation Matters with First 5 California Staff
Study Approach: Review of county self-reported data as well as information in annual PoP local evaluation and statewide reports
• Improve outreach to children with special needs. • Most PoP counties have not reported specific outreach strategies to reach children with special needs. San Diego conducted outreach meetings and waived residency criteria to encourage a greater number of children with special needs to participate.
150

Early Childhood Mental Health/Behavioral Health Services
Report Recommendations Key Findings/Rationale Mental Health consultation and Early • Increase capacity to implement Early Childhood Mental • Early childhood mental health Care and Education (2009) Health Consultation in family child care programs. consultation consists of mental
Alameda County Early Childhood Mental Health Systems Group
• Continue research into the effectiveness of mental health consultation to child care centers.
health professionals partnering with early care and education professionals to promote the social
• Increase funding for mental health consultation services. and emotional well-being of Study Approach: • Collaborate statewide with agencies to develop children. Services can include Position paper on mental health consistent standards of practice. general consultation with teachers consultation to child care • Collaborate with universities to conduct local longitudinal
research on the benefits of early childhood mental health consultation.
about child development and classroom set-up, child-specific consultation to staff or families, program consultation, or direct mental health services such as play therapy.
• One in every 133 prekindergarten children enrolled in State Preschool in California is expelled due to behavioral problems (Gilliam, 2005).
• Persistent conduct problems are associated with poor academic performance, delinquency, and substance abuse in later childhood (McCabe & Frede, 2007).
• When preschool teachers fail to handle social-emotional problems well, they perpetuate unregulated behaviors in their young pupils (Arnold, McWilliams, & Arnold, 1998).
• Early childhood teachers are struggling with growing numbers of children who need specific support to develop self-regulation at the
151

Early Childhood Mental Health/Behavioral Health Services
Report Recommendations Key Findings/Rationale same time that they feel themselves under pressure to meet national standards in purely academic areas (Yoshikawa & Knitzer, 1997).
• The results of an evaluation of a 17-month mental health consultation program in 7 ECE programs in Alameda County showed significant improvements in teacher ratings of children’s social competence and of children’s aggression and withdrawn social behavior.
152

Early Childhood Mental Health/Behavioral Health Services
Report Recommendations Key Findings/Rationale Challenges in the Implementation of • Professionals providing treatment and interventions • Acknowledgement of the need for Evidence-Based Mental Health should have basic knowledge in key areas such as those mental health services for children Practices for Birth-to-Five Year Olds and outlined in the California Training Guidelines and under age five is relatively recent. Their Families (2011)
Finello, Hampton, & Poulsen California Center for Infant-Family and Early Childhood Mental Health
Personnel Competencies for Infant-Family and Early Childhood Mental Health, Revised.
• Successful implementation of early childhood mental health services should include targeted parent involvement, practitioner selection, training, coaching,
• Mental health problems can occur in early infancy, and these problems demand community infant-family and early childhood mental health services and supports (New
Study Approach: performance evaluation, program evaluation, administrative supports, resource allocation, and policy.
Freedom Commission on Mental Health, 2003).
Report from a day-long “Think Tank” meeting of Project ABC, an early childhood system of care funded by the U.S. Department of Health and Human Services, in Long Beach, California, on
• Clinical judgment, combined with a parent voice, is needed to set priorities, choose and adapt the evidence-based program, and identify ancillary services and supports.
• Education, practice, and time are required for clinicians and agencies to become proficient and at ease with any new practice.
February 2, 2011. • The mental health system, policymakers, and funders must commit to creating and sustaining a trained workforce in mental health.
• Early childhood mental health professionals should be involved in implementation of new collaborations and systems made available through the Affordable Care Act.
• The incorporation of research must not be in lieu of clinical expertise and consumer values and choices (institute of Medicine, 2001; American Psychological Association, 2005). California has developed infant-family mental health training
• All agencies implementing evidence-based practices for children birth to five should be required to provide ongoing reflective practice supervision and should be evaluated in terms of efficacy.
• Funders should encourage and provide funding to study the changes that organizations make to adapt infant-family and early childhood evidence-based practices to local needs.
• There must be more funding for longitudinal research to continue to evaluate evidence-based practices in early childhood mental health. More efforts should be made to evaluate promising practices for children under age three.
guidelines and an endorsement process that ensure that the underlying expertise needed to give context to any particular evidence-based program.
• Clinicians need to have baseline skills and it is not realistic to attempt to teach multiple evidence-based practices at a pre-service level (Bauser, 2007).
153

Early Childhood Mental Health/Behavioral Health Services
Report Recommendations Key Findings/Rationale California CSEFEL Project Fact Sheet • Continue to support the work of the California • CSEFEL aims to foster professional (2011) Collaborative (the state’s CSEFEL project) and its development of the early care and
potential collaboration with CSEFEL to train professionals education workforce in order to Center on the Social and Emotional in the CSEFEL model, work with implementation sites, enhance knowledge and skills, Foundations for Early Learning (CSEFEL) and assist in strengthening inter-agency collaboration. support the implementation and
Study Approach: Fact sheet
• Establish a common vision for social-emotional development across all state-wide training efforts by using the CSEFEL model to create a cohesive and effective approach to addressing the needs of young children with challenging behaviors and special needs that aligns with California’s social-emotional
sustainability of evidence-based practices in social and emotional development, and increase the size of the workforce skilled in supporting the social emotional development of children under 5.
Foundations. • CSEFEL’s Pyramid Model has been implemented in a few California communities; these communities have experienced positive changes in being able to support children’s social-emotional development and children with challenging behaviors.
Social and Emotional Well-Being: The • Early mental health delivery systems must provide time • Recent research has confirmed that Foundation for School Readiness for intensive and rigorous staff training and ongoing the optimal development of an (2006) reflective supervision for those who work with infants
and their parents. infant’s social and emotional health hinges on the responses of (and
Pitcl & Provance WestEd Center for Prevention and Early Intervention
Study Approach: Research summary and description of
• Services should focus on the promotion of mental health through prevention and early intervention.
• Strengths-based services promote and affirm assets in the child, in the family, and in the early care and education program.
relationships with) their caregivers.
• The period of life from birth to 3 is a sensitive period of development for the formation of character and personality. The greatest period of brain development occurs from the
early childhood mental health practices • It is critical to recruit mental health staff members who last trimester of pregnancy as they are evolving in California. speak the home language of the families in the program.
Appropriate mental health services acknowledge and address the diversity among children, teachers, families, and mental health providers.
throughout the first 18 months of life.
154

Child Assessment to Support School Readiness
Report Recommendations Key Findings/Rationale Moving to Outcomes: Approaches to • Different approaches (e.g., “QRIS-Required • Five strategies identified that vary Incorporating Child Assessments into Caregiver/Teacher Assessments to Improve Practice”) in how they incorporate child State Early Childhood Quality Rating are recommended based on whether or not a QRIS exists assessments into state QI efforts and Improvement Systems (2012) and whether the QRIS is still being piloted or is and in several cases into a QRIS.
Zellman & Karoly RAND Corporation
implemented at scale.
• Promote the use of child assessments by ECE caregivers and teachers to improve practice either as part of a QRIS
• The five strategies approach child assessments with different objectives:
Study Approach: A review of the literature and current state practices regarding child assessments, organizes current and potential approaches into five categories
or through other mechanisms. This does require professional development supports to ensure that assessments are used effectively by teachers.
• Implement a QRIS validation study, with independent measurement of child outcomes, to determine if higher QRIS ratings are associated with better child developmental outcomes. Implement this approach
o Two use child assessments to inform and shape classroom practices and to support program improvements.
o The remaining three approaches use child assessments to measure the
when piloting a QRIS and periodically once the QRIS is implemented at scale (especially following major QRIS revisions).
• Implement a statewide evaluation of specific ECE programs or the broader ECE system, using independent assessors to measure child functioning to evaluate causal effects of specific ECE programs or groups of programs on child developmental outcomes at the state level. Implement this approach regardless of whether a QRIS exists.
• Proceed with caution if considering a QRIS rating component that is based on estimates of a program’s effect on child developmental outcomes. Methodology is complex and not sufficiently developed for high-stakes use; it is costly to implement for uncertain gain. Feasibility and value for cost could be tested on a pilot basis.
effects of participating in a given classroom, program, or ECE system on child functioning.
o Each approach may be implemented on its own or in combination with one or more other approaches.
• QRIS designers have several feasible and complementary approaches available for getting to the outcome of interest: child cognitive, social, emotional, and physical functioning.
155

Child Assessment to Support School Readiness
Report Recommendations Key Findings/Rationale Race to the Top Early Learning Proposed Activities (now approved): • The Desired Results Developmental Challenge Grant Application (2011) • The state will expand the school readiness assessment Profile-School Readiness (DRDP-SR)
State of California tool, the DRDP-SR, to include additional developmental domains.
has been developed as an observational assessment for kindergarten entry, and is directly
Study Approach: • Early adopters within the Regional Leadership Consortia aligned with the Foundations, as Application citing administrative data from multiple state agencies and
will be trained and will demonstrate the use of the DRDP-SR as early adopters in 2013–14.
well as the state’s kindergarten standards and common core
reports to federal agencies • CALPADS will be adapted to enable LEAs to voluntarily submit school readiness data directly into the system.
• LEAs in the Regional Leadership Consortia will mentor other LEAs on the use of the DRDP-SR, which will be made available on a statewide voluntary basis in 2014– 15, along with the means for collecting data from all programs.
standards.
• The DRDP-SR includes 4 of the 5 domains essential to school readiness—language and literacy, cognition and general knowledge (including early mathematics and early scientific development), approaches toward learning, and social and emotional development. Physical well-being and motor development are not included but are under consideration.
• A pilot is in progress to determine the validity and reliability of the instrument, including validity for dual language learners and children with disabilities.
• CDE will train early adopters within the Regional Leadership Consortia to use the DRDP-SR during the 2012–13 school year.
• Also, DRDP Access assessment data on children receiving IDEA Part B services is captured in the California Longitudinal Pupil Achievement Data System (CALPADS), with a unique identifier for each child.
156

Child Assessment to Support School Readiness
Report Recommendations Key Findings/Rationale California Report Card 2011–12: • Identify and address children’s needs earlier in their lives • Numerous local counties have used Setting the Agenda for Children (2012) through ongoing, developmentally appropriate
assessments in early learning settings and kindergarten, kindergarten readiness observation assessments effectively.
Children Now
Study Approach:
including the adoption of a statewide kindergarten readiness assessment observation instrument. • Readiness data gathered through
assessments that look at multiple domains can help parents and
Analysis of administrative data and teachers of preschool children, and extensive literature review also facilitate the transition to
kindergarten.
Power of Preschool Program Evaluation • Invest in training and technical assistance to counties on • Feedback on the DRDP was Report (2011) how to report DRDP results on an individual basis while
de-identifying data securely. generally positive from the PoP counties. 2 other counties said that
Franke, Espinosa, & Hanzlicek UCLA Center for Healthier Children, Families and Communities for First 5
• Ensure that this child-level data can be linked to other data at the classroom and teacher level.
while the DRDP was helpful for monitoring progress and informing improvement, it was not helpful for
California evaluation purposes.
Study Approach: • While counties reported aggregate DRDP results for PoP enrollees,
Review of local First 5 PoP reports for counties used various calculations 2009–10, annual data submitted by of the data at an aggregate level. counties for 2010–11, and interviews with First 5 staff • In order for First 5 California to
draw solid conclusions about the effectiveness of the program, reporting of DRDP data and any other child-level assessment that may be requested of counties at the individual child level is critical for accurate analysis of data.
157

Child Assessment to Support School Readiness
Report Recommendations Key Findings/Rationale The Children of LAUP: Executive • All children need to be screened early in the year using a • Based on a battery of assessment Summary of the First 5 Universal standardized screening process; ongoing observation of measures administered by an Preschool Child Outcomes Study (2009) children’s progress by teachers would help to tailor the
instruction to the needs of the children. independent team of evaluators, children’s performance was
Love, Atkins-Burnett, & Vogel Mathematica Policy Research Inc.
Study Approach: Descriptive study of 97 programs
• Implicit: while the study recommended health and developmental screening by teachers, it did not recommend administering the battery of extensive assessments used by the independent team of researchers, as this would require outside trained
average or above average in early literacy, social-emotional development, and approaches to learning, but lower in expressive language/vocabulary.
serving 1,555 4-year-old children, a observers and would be expensive to administer to more • From fall to spring, children nearly representative sample of LAUP than a sample of program participants. doubled their score on a letter-programs. Study included class observations using the CLASS, analysis • Implicit: Measuring performance of DLL is tricky. naming task; Spanish-speaking
children scored somewhat lower but of STAR ratings, and direct child made the greatest gains during assessments. their year in the program.
• Children’s performance was lower on expressive language/vocabulary. It is important to consider the high proportion of DLL children in the sample, 45% of whom increased enough in their English language skills to be assessed in English. However, the words they learned may have been for concepts or objects they already knew in their first language, as opposed to words for entirely new concepts or objects.
158

Child Assessment to Support School Readiness
Report Recommendations Key Findings/Rationale Power of Preschool Evaluation Report • Improve DRDP-R* reporting. Future evaluations might • There appears to inconsistency in (2009) focus on the appropriate use of the DRDP-R as well as
customized training on its proper use in the PoP context. the way schools and teachers collect DRDP-R data.
Prayaga, Sormano, Hobart, Neville-Morgan, Smith, Balakshin, Padilla, Bupara, & Syphax Evaluation Matters with First 5
*The DRDP-2010 has now replaced the DRDP-R. • Careful interpretation of the DRDP-R data is essential.
• Teachers repeatedly mention the need for more time to complete the DRDP-R.
California Staff • Several counties experienced challenges administering the DRDP-
Study Approach: R, and some questioned whether its
Review of county self-reported data as use was appropriate.
well as information in annual PoP local evaluation and statewide reports
Assessment Considerations for Young English Language Learners across Different Levels of Accountability (2007)
Espinosa. & López National Early Childhood Accountability Task Force and First 5 LA
Study Approach: Summary and analysis of existing research
• Assessment approaches for the EL population should be responsive to the within-group culture, language and literacy development, social, and economic variability among this group.
• There is substantial variability across the factors that predict differences in children’s language development within the EL population.
159

Effective Data Practices
Report Recommendations Key Findings/Rationale Race to the Top Early Learning Proposed Activities (now approved): • According to the Early Learning Challenge Grant Application (2012)
State of California
• Participating Consortia have committed to using the National Data Quality Campaign guidelines to support uniformity of data fields and terms.
Challenge Grant application, of the 16 counties participating in the Regional Leadership Consortia, 10 utilize the Unique Child Identifier,
Study Approach: • For 2013–14, RTT-ELC grant funds will be used to 11 utilize the Unique Early Application citing administrative data from multiple state agencies and reports to federal agencies.
incentivize Regional Leadership Consortia districts to report their Transitional Kindergarten and kindergarten DRDP-results into CALPADS. CALPADS will be fully functional to receive DRDP-SR data on a voluntary basis
Childhood Educator Identifier, 11 utilize the Unique Program Site Identifier, 11 utilize the Child and Family Demographic information,
starting 2014–15. 12 utilize the Early Childhood Educator Demographic information, 12 utilize the Data on Program Structure and Quality, and 9 utilize the Child-Level Program Participation and Attendance.
• DRDP Access assessment data on children receiving IDEA Part B services is captured in the California Longitudinal Pupil Achievement Data System (CALPADS), with a unique identifier for each child.
California Report Card 2011–12: • Include statewide early childhood data that tracks school • Several counties have collected Setting the Agenda for Children (2012) readiness indicators from birth to kindergarten entry,
connects to California’s K-12 data system, and enables kindergarten readiness data so that parents, teachers, and
Children Now the evaluation of quality improvement and workforce development efforts.
administrators can better address the needs of children as they enter
Study Approach: Analysis of administrative data and
• Establish a comprehensive, longitudinal data system that connects early learning and development through higher
school and move through the early grades.
extensive literature review education, health, juvenile justice, child welfare, and other data in order to better track and address the educational outcomes and well-being of children throughout their lives.
160

Effective Data Practices
Report Recommendations Key Findings/Rationale California Infant and Toddler Early Learning Policy Recommendations (2012)
Water Cooler Infant-Toddler Workgroup
• Create a unique identifier that can allow data tracking of children from birth and across systems.
• Track infant-toddler provider participation in high quality workforce development.
• Data systems are critical for planning high quality services.
Study Approach: The Water Cooler Infant-Toddler Workgroup convened over 130 individuals representing 95 organizations to develop recommendations to address the policy problems facing early care and education services for infants and toddlers in California. Over the course of five meetings, the workgroup formulated, discussed, and ranked policy recommendations in the areas of funding, access to quality services, workforce development, and the building of a comprehensive system for infant and toddler care and education in California. This report outlines the group’s recommendations.
161

Effective Data Practices
Report Recommendations Key Findings/Rationale Power of Preschool Program Evaluation • Track children’s outcomes into their entry in kindergarten • In the evaluation, there was notable Report (2011) and beyond into third grade, using third grade test
results. variation in the levels of specificity and overall content of the county
Franke, Espinosa, & Hanzlicek UCLA Center for Healthier Children, Families and Communities for First 5
• Encourage assignment of individual child-level district identification.
reports. Due to data reporting inconsistencies across counties, accurate interpretation of the DRDP
California • In order to reduce data burden, it is suggested that strategic sampling of a few hundred children throughout
2010 results for FY 2010–11 was difficult.
Study Approach: Review of local First 5 PoP reports for
PoP counties that could be tracked longitudinally would be sufficient. • Some counties reported that
commissions value assessment 2009–10, annual data submitted by data, stating that commissions rely counties for 2010–11, and interviews on the data and use it to “inform with First 5 staff. the planning of programs that are
going to be better for the children" or to “align and better integrate county services.”
• In order for First 5 California to draw solid conclusions about the effectiveness and impact of their Child Signature Program on children, reporting of DRDP data and any other child-level assessments that may be requested of counties at the individual child level is critical to analysis of accurate data.
162

Effective Data Practices
Report Recommendations Key Findings/Rationale Dream Big for Our Youngest Children: Place major focus on leveraging existing data systems to The Advisory Committee identified 9 key Final Report (2010) eliminate duplicative reporting and collection and improve data
quality to: principles for an early learning and care data system:
California Early Learning Quality Improvement System (QRIS) Advisory
• Measure school readiness. • Confidential;
Committee • Establish more efficient program management and administrative functions.
• Useable and practical;
• Accessible and inter-operable; Study Approach: 2 years of CAEL QIS Advisory Committee and subcommittee meetings; input from
• Improve teacher and provider effectiveness.
Begin by developing a unique child identifier and assessing
• Respects current databases and builds on them;
early learning and care program staff, current data collection processes serving young children. The • Transparent; child care licensing officials, county superintendents of education, local child care council and child care resource and referral leaders, First 5 California and county commission staff,
Advisory Committee approved a method that would use the birth certificate’s registration number to provide a unique student identifier for children in early learning and care programs. This low technology solution would also enable providers to go back to the common source to identify a child. Almost all children have
• Includes and connects child, family, teacher and provider, and program data;
• Provider-friendly; and nationally known experts on quality birth certificates with a unique number, including children born • Easily adaptable and can grow and rating and improvement systems outside of the U.S., so very few children would need an alternate
number. change over time; and Dynamic.
California Infant/Toddler Early Learning • For a more comprehensive needs assessment on infant • To estimate the number of infants and Care Needs Assessment: A Policy and toddler care in California, a unique child identifier is and toddlers in California and the Brief (2010) needed. First, the use of a child identifier would allow
linking across program data sets, to determine the extent number enrolled in ECE programs, AIR compiled data from CDE, the
Muenchow & Anthony to which children are served in more than one setting, National Head Start Association, the American Institutes for Research and, ultimately, whether enrollment in high quality early
learning and care programs is associated with improved Department of Social Services, and the California Child Care Resource
Study Approach: child outcomes in elementary school. & Referral Network. Analysis based on analyses of extant • To get an accurate count of which children are being • Data gaps and the lack of a central data from CDE, Early Head Start served, enrollment data for all publicly subsidized repository of information limit the Program Information Reports, programs should be collected by zip code of the child’s current assessment of the supply Department of Social Services, and the residence, age cohort, and type of program (e.g., and demand of infant/toddler care. California Child Care Resource and licensed, voucher, and exempt care). Referral Network, as well as review of related research
163

Effective Data Practices
Report Recommendations Key Findings/Rationale Power of Preschool Evaluation Report (2009)
Prayaga, Sormano, Hobart, Neville-Morgan, Smith, Balakshin, Padilla, Bupara, & Syphax Evaluation Matters with First 5 California Staff
Study Approach: Review of county self-reported data as well as information in annual PoP local evaluation and statewide reports
• See report recommendations on DRDP-R under Child Assessment to Support School Readiness above.
• See report findings on DRDP-R under Child Assessment to Support School Readiness above.
Preschool Adequacy and Efficiency in California: Issues, Policy Options, and Recommendations (2009)
Karoly RAND Corporation
Study Approach: Based on integration of results from 3 earlier studies on gaps school readiness and achievement in early grades, the use of ECE services and the quality of those experiences, and the system of publicly funded ECE programs
• Fund the implementation of a P-16 longitudinal data system envisioned under SB 1298.
• California lags behind other states in development and implementation of education data systems that link student- and teacher-level data over time and support informed decision-making (Hansen, 2007).
• Implementation of the K-12 data system (CALPADS and CALTIDES) has been slow, and efforts to integrate preschool data into the system have only just begun.
164

Facilities
Report Recommendations Key Findings/Rationale Child Care Facilities Development: A 1. Expand facilities development and financing model availability, • Child care intermediaries are Report on California’s Readiness (2010) such as ABCD Constructing Connections, to interested
communities. unaware if facilities development is addressed in Preschool for All (PFA)
Low Income Investment Fund 2. Increase local facilities financing:
or School Readiness Initiatives (SRI). 67% responded that their
Study Approach: • Identify potential public sources of capital (e.g. county’s PFA/SRI did not Survey of statewide child care Community Development Block Grant, US Department of specifically address facilities or they Intermediaries to identify local issues Agriculture Rural Housing Service, First 5, redevelopment were unsure whether the initiative related to facility development and funds) and advocate making child care an eligible use or included a plan to address facilities. financing priority.
• Engage local businesses in existing early care and education efforts to help advocate for increased public capital and to promote local fund development efforts.
• Engage local Community Reinvestment Act officers around funding and resource possibilities for child care facility development.
• Lack of local public and private financial resources and land use barriers (e.g., excessive permit fees and conflicting regulatory requirements) were identified as the greatest concerns among child care intermediates.
3. Remove land use barriers: • Learn the process/steps it takes to develop a child care
facility in a particular jurisdiction.
• Conduct a child care land use assessment to see what the entitlement process and fee structure is for each jurisdiction in the county.
• Most of the services and resources child care intermediaries provide to ECE operators for facilities development and financing are in the early planning phase of development only, and not in the later, more difficult and costly phases of development.
• Identify some child care centers that recently received or were denied a conditional use permit. Interview them to identify challenges, successes, and lessons.
• The Southern region (58%) showed a greater awareness of agencies that provide local technical
• Advocate for child care–friendly land use policies and procedures that encourage child care facility development (e.g., reducing permit fees, reducing/eliminating traffic impact fees, increasing the number of areas zoned for child care).
4. Technical assistance services: • Seek training on facility development and financing to
assistance services in the three specific areas (accessing funding for facilities, business development, and identifying a development team) identified by the other regions as most lacking. The strong presence of Constructing Connections in the Southern region
165

Facilities
Report Recommendations Key Findings/Rationale enhance existing services to ECE operators.
• Identify and engage existing public/private community partners that have expertise and resources in a particular area (e.g., business planning, market analysis, financial analysis, real estate development, etc.), and coordinate efforts to assist operators through all phases of facility development.
• Develop partnerships with local Small Business Development Centers and other business/economic development agencies to assist operators in developing a business plan and budget, marketing plan, and access to private capital.
may also account for this finding.
• Child care intermediaries requested additional training and support to address facility and financing barriers, specifically for facility development and financing to better support ECE operators.
Low Income Investment Fund (LIIF) • The QRIS should ensure that child care programs at all • A complete QRIS includes supports Letter to the California Early Learning tier levels have sources of public and private capital, and for the maintenance, improvement, Quality Improvement System Advisory technical support to access and utilize capital and for and expansion of facilities. Committee Regarding Facilities Recommendations (2010)
facilities related issues.
• The following enhancements should be made to the Title • Title 22 regulations do not explicitly
include many facilities issues.
Edward Condon 22 regulations: • Budget cuts have reduced licensing Managing Director, National Child o Conduct licensing inspections at least once a year staff and inspections. Development Programs, Low Income Investment Fund
o Align inspection criteria with facilities standards in QRIS
• High quality child care facilities can have a positive impact on children’s
Study Approach: o Include observation and notation of conditions that to not comply with Title 22 building code standards
development and parent and child care staff satisfaction.
Letter to the California Early Learning Quality Improvement System Advisory Committee
in licensing inspections o Licensing staff should provide child care programs
with referrals to technical assistance and financial
• The Community Care Licensing standards do not adequately address child care facility issues.
resources o Ensure sufficient levels of licensing staff
• The following should be included in the QRIS: o Established protocols and adequate ERS training to
ensure trainers are able to identify facilities issues and physical design elements
o The creation and piloting of a facilities tool/checklist based an existing validated tools and Low Income
• Some states have successfully included facility standards as part of their QRIS.
166

Facilities
Report Recommendations Key Findings/Rationale Investment Fund’s field experience.
o Administrative policies for maintaining quality learning facilities
o Size and quality child care program space that support the programs’ early learning goals
o The use of healthy, sustainable materials and products promoting positive outcomes for children and cost savings for programs
o Include program administrative scales in the QRIS and support for improving scale scores to ensure sustainable facility practices.
• California should modify their current CAEL QIS plan to increase facilities goals in the upper tiers (tiers 3–5), while providing child care facilities with sufficient resources to meet the high standards.
• California should consider the following facilities assessment tools when modifying their CAEL QIS plan for a QRIS: o The Program Administration Scale (PAS) Facilities
Management plan, which includes a checklist, safety procedures and maintenance contracts.
o Massachusetts’ facilities assessment tool. o The “Go Green Rating Scale for Early Childhood
Settings.”
• The Local Initiatives Support Corporation’s (LISC) “Child Care Facilities Design checklist,” which includes the following benchmarks: o Offer a warm, homelike environment (e.g.. wood
floors, functioning kitchen, parent lounge resembling living room);
o Support teacher effectiveness (child size sinks, counters, adult work surfaces, sinks, phones, and seating and meeting space);
o Create enough space (go beyond minimum
167

Facilities
Report Recommendations Key Findings/Rationale Community Care Licensing standards);
o Welcome families; build community; and think beyond the classroom (office, kitchen, playground, storage).
Strategies for Increasing Child Care Facilities Development and Financing in California (2007)
The Building Child Care (BCC) Collaborative Project
Study Approach: 72 child care intermediaries, sampled from the Bay Area, and the Central, Northern, and Southern regions in California were surveyed
• Child care provider fees and codes should be standardized so that they are reasonable.
• Child care should be included in city/county General Plans.
• Play space requirements should be adjusted to allow exceptions for urban areas.
• The business skills of child care providers should be increased.
• Private investment in child care facilities should be incentivized and existing public investment in child care facilities should be enhanced so more providers can access capital.
• The child care reimbursement rate should be adjusted to reflect the true cost of high quality child care.
• Long term publicly funded child care contracts should be created to help attract and secure private funding.
• Local development standards, procedures, and planning processes prohibit the development of larger child care facilities.
• Outdoor play space requirements pose barriers for the development of child care facilities in urban areas.
• Many child care providers are reluctant to take on debt.
• Child care operators need more training in business and finance.
• Child care operators face challenges using debt financing to support the sustainability and expansion of quality child care.
168

Facilities
Report Recommendations Key Findings/Rationale Policy Recommendations on • Preschool facilities should be made part of the next • California lacks suitable space for Facilities for Preschool and Early statewide education facilities bond, with the largest bond about one in five four-year-olds, Education (2007) amount that is feasible. including both universal preschool
Munger, English, Dow, & Brownson Advancement Project
Study Approach:
• The funds should be provided as a grant, as occurs for K-12 facilities, and should include school districts, county offices of education, and charter schools. A match should not be required because there are no local funding sources of matching dollars for preschool
space and preschool targeted just towards children likely to attend low achieving schools and/or children living in poverty.
• The lack of preschool space is more Discussion of issues arising at the facilities to which all entities have equal access. Funds common for children living in Getting From Facts to Policy Education should be distributed to local education agencies poverty, children whose parent(s) Policy Convening in Sacramento, 2007 because they already have the expertise and ability to
rapidly construct educational facilities.
• Local education agencies should use the land they currently have on their K-5 campuses and early learning centers, especially on campuses that are experiencing declining enrollment.
• Focus funds where the need is greatest: where more than 80 4-year-olds lack preschool space, and either (1) the API score of the local schools is a 1, 2, or 3, or (2) the local elementary school is in the highest 25% of the state’s schools in number of students qualified for free and reduced-price lunches.
• Preschool facilities should be open at least from 6 a.m. to 6 p.m. to encourage working parents to send their children to preschool and so that wrap-around child care services can be provided at the site.
• Respect local differences with regard to how preschool dovetails with child care, so long as the children are safe and receive at least a half-day high quality preschool component that gives them a fair chance at school.
did not graduate from high school, and children of color.
169

Facilities
Report Recommendations Key Findings/Rationale Building Early Childhood Facilities: What • Facilities development policies need to address issues • The quality of child care facilities States Can Do to Create Supply and related to financial barriers, design and real estate can impact program quality, child Promote Quality (2007) development, and the policy and regulatory environment. development, family engagement,
Carl Sussman & Amy Gillman National Institute for Early Education Research (NIEER) and LISC
Study Approach:
• Capital subsidies must be available in order for child care programs to substantially renovate or construct a state-of-the art facility.
• If providers use debt to raise capital, it must be affordable to preschool programs with limited means.
and staff satisfaction.
• Child care program income is typically meager, especially when compared with the full cost of delivering quality early education services.
Exploration of common facility issues in early care and education, and outline of strategies for policymakers to address early care and education facility needs.
• Technical capacity needs to be developed— organizational, real estate development, and architectural to build early education facilities.
• Facility standards that address program quality, in
• The cost of constructing facilities designed specifically for young children is relatively high when compared with standard
addition to health and safety, need to be in place.
• A reliable system and supportive policy and regulatory environment are needed to enable the early education field to meet its physical capital needs.
commercial space.
• Few centers have the experience or personnel to handle the complexities of real estate development tasks.
Measuring Environmental Hazards in • Information and training about how to protect children • Children are likely exposed to the Childcare Industry: Pesticides, Lead from exposure to health hazards should be delivered to pesticides, arsenic-treated lumber, and Indoor Air Quality: Survey Brief meet the needs of childcare providers. lead, and common asthma triggers (2004) in child care settings.
Boise, Smith, & Carey Community Environmental Council
• Less than 3% of child care providers have received formal training in pesticide, lead, or indoor air quality
Study Approach: management.
Child care providers in 457 licensed home-based childcare programs and 291 licensed center-based programs in
• 80% of providers are interested in more information about managing exposure to health hazards.
San Luis Obispo, Santa Barbara, and • No comprehensive program in Ventura counties were surveyed California exists to address
exposure to health hazards in child care settings, and no single entity is charged with the responsibility.
170

Facilities
Report Recommendations Key Findings/Rationale Child Care Facilities: Quality by Design • In designing child care facilities, create a warm, home- • Researchers observing adult-child (2004) like environment. interaction during children’s free
Proscio, Sussman, & Gillman Local Initiatives Support Corporation
Study Approach: Research summary and position paper
• Design child care centers to support and ease the work of caregivers. Certain features—such as bathrooms adjacent to the classroom, accessible cubbies, and child-sized sinks, counters, and other furnishings and fixtures—increase children’s autonomy and competence. At the same time, adult staff need classroom work surfaces, storage, sinks, phones, and seating for their
play activities found, to their surprise, that a change in the center’s spatial arrangements led, by itself, to a seven-fold increase in the percentage of time children spent interacting with adults—a key indicator of program quality.
use, as well as areas where they can comfortably meet, relax, or work away from the children.
• Allow at least 45 square feet of space per child, after cubbies and other furniture have been taken into account.
• Create space for information for parents, and for parents to spend time with their children.
• Build community by including windows between classrooms and building common spaces.
• Early childhood education requires more than classrooms. A well-functioning program needs administrative offices, a kitchen, a welcoming and secure reception area, a spacious playground, and plenty of storage.
171

Food and Nutrition
Report Recommendations Key Findings/Rationale California Report Card 2011–12: • Prioritize the factors contributing to childhood obesity in • California’s current policies to Setting the Agenda for Children (2012) order to allow policy-makers to direct their focus. combat childhood obesity are too
Children Now • Support a state tax on sweetened beverages. fragmented and lack clear prioritization.
Study Approach: • Change the CalFresh reporting schedule from quarterly
to semi-annual. • A tax on sweetened beverages will reduce consumption and create
Analysis of administrative data and • Adopt policies to require that at least 50% of physical revenue to benefit children. extensive literature review education class is spent engaged in moderate to
vigorous physical activity.
• Adopt the health curriculum framework in public schools.
• Provide incentives for redevelopment projects to incorporate health concerns into planning by conducting health impact assessments and involving affected residents.
• Only 50% of eligible families participate in the CalFresh program because of the burdensome reporting requirements.
• California does not have a state mandate for counties to incorporate health aspects in al redevelopment projects.
• California received a “D” grade in children’s oral health.
• California received a “C-” grade in childhood obesity.
172

Food and Nutrition
Report Recommendations Key Findings/Rationale Childhood Obesity and Dental Disease: Common Causes, Common Solutions (2011)
Children Now
Study Approach: Policy brief summarizes the current childhood obesity and dental issues and offers recommendations to improve conditions for both issues
• Better coordinate and improve existing and new strategies that address both childhood obesity and dental disease.
• Leverage federal grant and policy opportunities to improve childhood obesity and oral health.
• Policies should include the following strategies to reduce childhood obesity: o Increase physical activity to at least one hour each
day o Limit screen time to less than two hours a day o Increase body mass index testing
• Policies should include the following strategies to reduce childhood dental disease: o Establish a dental home by the time a child is a year
old o Provide topical fluoride and fluoridated water o Provide regular oral health screenings and hygiene
instruction
• Policies should include the following overlapping strategies to reduce both childhood dental disease and obesity: o Ensure consumption of 5 fruits and vegetables per
day o Encourage and support breast feeding o Encourage dietary counseling by appropriate health
care providers o Reduce consumption of sweetened beverages
• K-12 programs should connect with child care programs to target unhealthy behaviors early.
• Include prevention, education, and community-based wellness efforts.
• Being at risk for either obesity or dental disease also puts children at risk for the other.
• California is in the bottom three states for children’s oral health status.
• Poor oral health is associated with obesity among children.
• The following factors put children at greater risk for both dental disease and obesity: o Lack of breastfeeding o Lack of access to healthy foods o Sugar-sweetened beverages o Living in poverty
173

Food and Nutrition
Report Recommendations Key Findings/Rationale Keeping Children Healthy in California’s • Strengthen the Child and Adult Care Food Program • The various types of child care Child Care Environments: (CACFP). settings in California and the Recommendations to Improve Nutrition and Increase Physical Activity (2010) • Establish California nutrition and physical activity
standards based on current scientific evidence.
different practices and resources used by each setting and the different rules, regulations, and
California Department of Education and • Collaborate with the federal government to modify the agencies that govern these settings California Health and Human Services federal CACFP meal pattern requirements to align with may make it difficult to improve Agency standards developed in the previous recommendation. nutrition and physical activity in
Study Approach: • Streamline the CACFP compliance requirements to
increase participation. child care settings.
• Less than half of eligible California This report summarizes the findings and recommendations discussed during the Strategic Assessment of the Child Care Nutrition Environment advisory group meetings
• Facilitate collaboration between relevant state agencies to develop a CACFP marketing plan aimed at increasing participation in the program.
• Include evaluations of nutrition and physical activity as part of the CACGP monitoring-visit requirements.
child care providers participate in the Child and Adult Care Food Program.
• Participation in the CACFP can help improve children’s diets (Bruening,
• Require state-funded care child programs to participate in the CACFP.
• Establish nutrition and physical activity requirements for child care programs.
• All licensed care providers should be required to comply with the nutrition and physical activity standards recommended above—even providers not participating in the CACFP.
• Evidence-based nutrition, physical activity, and wellness education training should be required for initial child care licensure.
• Nutrition, physical activity, and wellness education training should also be required for maintaining child care licensure.
• State and federal agencies should align child care nutrition and physical activity standards.
• Child care agencies should be required to publicly report key child nutrition and physical activity outcomes.
• Provide consistent messaging to children, families, and
Gilbride, Passannante, & McClowry 1999).
• Meals from the CACFP are the main source of nutrition for many children in low-income families (Parker, 2000).
• The CACFP has made few updates to their meal pattern in the last 40 years.
• The CACFP’s accountability and compliance requirements have increased throughout the years, requiring more work of providers and sponsors of the program.
174

Food and Nutrition
Report Recommendations Key Findings/Rationale providers related to improving nutrition and physical activity in child care environments.
• Relevant state agencies should collaborate on developing and delivering consistent messaging through social marketing and health education campaigns.
• Nutrition and physical activity foundations should be established for preschool.
• Nutrition and physical activity criteria should be included in California’s QRIS.
• Expand nutrition and physical activity training in child care programs.
• Include nutrition and physical activity in child care information in all child care related curricula.
• Provide the latest nutrition and physical activity information with continuing child care training programs.
• Provide the nutrition and physical activity information with caregiver and parent education.
The Children of LAUP: Executive Summary of the First 5 Universal Preschool Child Outcomes Study (2009)
Love, Atkins-Burnett, & Vogel, Mathematica Policy Research Inc.
• The finding that 20 percent of the children were obese suggests a need for programmatic interventions (perhaps involving parents) aimed at improving children's diets and increasing opportunities for physical exercise.
• It may be helpful to build or strengthen relationships with existing nutrition and public health programs such as
• 20 percent of the children were obese.
Study Approach: Descriptive study of 97 programs serving 1,555 4-year-old children, a representative sample of LAUP programs. Study included class observations using the CLASS, analysis of STAR ratings, and direct child assessments.
WIC and the Los Angeles County Department of Public Health to identify ways to reduce the obesity rate among children in LAUP programs.
175

Kindergarten Transition
Report Recommendations Key Findings/Rationale Power of Preschool Program Evaluation • None given • On average, PoP programs scored Report (2011) “good” to excellent” in most ECERS-
R and ITERS-R program quality Franke, Espinosa, & Hanzlicek areas. UCLA Center for Healthier Children, Families and Communities for First 5 California
• PoP programs scored the lowest in the “Personal Care Routines” and “Parent and Staff” ECERS-R and
Study Approach: ITERS-R program quality areas.
Annual data, evaluation results, relevant reports, and interviews with at least one key staff member from each of the 58 counties in California were used in this evaluation.
• The 5 PoP counties serving infants and toddlers scored an average on 5.3 out of 7 on the ITERS-R, demonstrating that these programs are high quality.
Transitional Kindergarten: Findings from • Provide more guidance to districts on TK standards, • 5 of the 9 districts interviewed have the Field (2011) frameworks, curriculum and instruction, assessment
strategies, and tools and planning. developed working content standards for TK or for a program
California Early Learning Advisory designed for young 5-year-olds. Council
• 3 of the 9 districts interviewed have
Study Approach: well-developed content guidelines for TK or for young 5-year-olds.
District and county leaders from 9 of the 12 districts currently implementing a Transitional Kindergarten program were
• TK teachers typically hold a multiple-subject credential.
surveyed. • Professional development is not standard or specifically focused on TK, so local agencies piece together their own professional development.
• Most TK classrooms do not have teacher aides or special training for teacher aides.
176

Kindergarten Transition
Report Recommendations Key Findings/Rationale Summary of Preschool California Research: Programs Serving Young Five Year Olds in California (2011)
Preschool California
Study Approach: Teachers and schools and district administrators were interviewed and site visits were conducted at 10 programs currently serving young 5-year-olds.
• None given • 8 programs reported enrolling more boys than girls.
• Most classrooms in the program have only one teacher with a multiple-subject credential.
• Some programs use the same professional development used for kindergarten teachers.
• All programs have some focus on math and early literacy and language skills.
• Many programs use parts of curricula or modified curricula developed for other populations.
• 5 programs have a written parent/family engagement policy.
• Programs varied in whether they conducted assessments to determine enrollment in the program, show progress, or determine kindergarten readiness.
• 9 programs relied on Average Daily Attendance to pay for operating costs.
• Most programs reported that their costs were comparable to the cost of kindergarten, with some additional start-up costs.
177

Kindergarten Transition
Report Recommendations Key Findings/Rationale Transitional Kindergarten: School • District should clarify in the names of their programs • 8% of districts had already begun to District Survey (2011) whether these programs meet the TK requirements as
indicated in SB 1381 or just contain some of the pilot a TK program, 20.1% of districts planned to pilot a TK
Joyce Wright elements. program in the 2011–12 school California County Superintendents of Education Services Association, Curriculum and Instruction Steering Committee
• Districts should be provided with support on how to provide high quality TK and kindergarten combination classes.
year, 41.5% planned to phase in a TK program in 2012–13 (as required in SB 1381), and 29.9% of districts had not decided whether
• Districts should be provided with knowledge about how they would begin to phase-in a TK Study Approach: California Preschool Foundations and Common Core program. 325 school districts located in 46 Standards can help with instruction and curricula issues.
• Districts rated the following 4 counties that offer kindergarten supports and/or information about programs were surveyed. SB 1381 and TK as most important:
TK classroom models (83%), guidelines for appropriate curricula (80%), potential program models (76%), and sample funding examples (75%).
• Small schools tended to be more concerned about being able to finance TK in separate classrooms.
178

Kindergarten Transition
Report Recommendations Key Findings/Rationale Evaluation of Stretch to Kindergarten • Consider collaborations between kindergarten transition • Recent studies have found a Program (2011) programs and school districts for joint professional relationship between program
development for teachers around CLASS principles. quality, as measured by the Manship, Fain, & Madsen American Institutes for Research for the Heising-Simons Foundation
Study Approach:
• Kindergarten transition program activities should focus on both early literacy and math skills, aligning as much as possible to the content taught and tested in kindergarten classrooms in the local district.
CLASS—and in particular Instructional Support—and children’s gains on receptive and expressive language assessments (Howes, Burchinal, Pianta, Bryant,
Program evaluation including CLASS Early, Clifford, & Barbarin, 2008). observations, a pre/post parent survey, • CLASS results indicate that Stretch and a comparison of elementary school to Kindergarten (STK) classrooms outcomes of STK participants to their offer warm and emotionally peers supportive teacher-child
interactions. Additionally, STK teachers consistently implement effective behavior and instructional management strategies to maximize learning opportunities for children, although CLASS scores indicate room for growth in this area for teachers.
• Analyses of elementary school outcomes suggest that the Stretch to Kindergarten program may help to give children a head start on the academic skills taught in kindergarten. Stretch to Kindergarten participants performed better than their demographically similar peers on several English language proficiency tests and district language arts assessments. However, no relationship was detected between STK participation and math scores in first grade, when math skills are first tested.
179

Kindergarten Transition
Report Recommendations Key Findings/Rationale Power of Preschool Evaluation Report (2009)
Prayaga, Sormano, Hobart, Neville-Morgan, Smith, Balakshin, Padilla, Bupara, & Syphax Evaluation Matters with First 5 California Staff
Study Approach: Review of county self-reported data as well as information in annual PoP local evaluation and statewide reports.
• There is a need for more focus on kindergarten transition activities.
• Specific transition activities could include encouraging preschool and kindergarten teachers to visit each other’s classrooms, to attend common workshops and professional development sessions, and to collaborate with each other on continuity in teaching strategies and methods. Other suggestions include holding a kindergarten transition conference at the beginning of the year, and facilitating visits by preschool children to their new school before starting kindergarten.
• The PoP counties have implemented various outreach and involvement strategies to more effectively engage families.
• Every county reported an increase in parenting skills and knowledge as well as parent behaviors relating to home educational activities.
• Many PoP sites and parents identified kindergarten transition as an area that needed further attention. Very few preschool teachers attended meetings with kindergarten teachers.
• Many PoP sites and parents identified kindergarten transition as an area that needed further attention. Very few preschool teachers attended meetings with kindergarten teachers.
180

Kindergarten Transition
Report Recommendations Key Findings/Rationale Power of Preschool Demonstration Program: Progress Report, Fiscal Years 2005–06 through 2007–08 (2008)
First 5 California
Study Approach: Analysis of multi-dimensional progress assessment data provided to First 5 California from 9 PoP counties.
• California should explore how to use these transition strategies as models to replicate throughout the state.
Transition to preschool activities included:
• Child and family visit preschool classroom
• Parent/family-teacher-child meetings
• Home visits
• Preschool open houses
• Program information (e.g., brochures)
Preschool to kindergarten transition activities included:
• Family visits to kindergarten classrooms
• Meetings between preschool and kindergarten teachers
• Sharing preschool child assessments and/or portfolios with kindergarten teachers
• Aligning of preschool and kindergarten curriculum
• Transition teams attended parent meetings and/or community forums
• Group preschool classroom visits
Results from the Desired Results Developmental Profile – Revised data showed that PoP children were prepared to be successful in school.
181

Kindergarten Transition
Report Recommendations Key Findings/Rationale Present, Engaged and Accounted For: • School districts should devote time and resources to • The U.S. does not provide schools The Critical Importance of Addressing examining the levels of chronic early absence in their with a system to monitor and report Chronic Absence in Early Grades (2008) schools. on levels of chronic early absence.
Chang & Romero National Center For Children in Poverty
• School districts should collect qualitative and quantitative information to help them understand the factors related to chronic early absence.
• 11% of kindergarteners, 9% of first graders, and 6% of third graders are chronically absent.
Study Approach: • Schools should build partnerships with community • Rates of chronic early absence vary
The findings from this report are based on data from the Early Childhood
agencies and families to develop appropriate responses to chronic early absence.
widely across schools in the same district and across districts.
Longitudinal Study, Kindergarten Cohort • Children should receive high quality early care and • Chronic early absence in (ECLS-K), a literature review, data from education experience to help them prepare for the kindergarten is correlated with 9 school districts, and interview and transition into school. lower academic performance in first email exchanges with practitioners and researchers in the chronic early absence field.
• Make education programs high quality and responsive to the needs of diverse families.
grade among all children, especially for Latino first graders.
• Chronic early absence is correlated with the lowest 5th grade academic achievement for children living in poverty.
• Strong school-family relationships can reduce chronic absence for all types of families
• Rates of chronic early absence are higher among children living in poverty and non-white children, except Asian children.
• Rates of chronic early absence are higher among children who spend the year before kindergarten in a center-based program or non-relative care compared to children cared for by family members.
• Low levels of chronic absence are related to family and child economic and social challenges; however, high levels are associated
182

Kindergarten Transition
Report Recommendations Key Findings/Rationale with systematic school or community issues.
At What Age Should Children Enter • Policy should not increase the age for kindergarten entry, • The current emphasis on school Kindergarten? See What the Research but should reduce the age. accountability based on students’ Shows (2002)
Stipek Social Policy Report
• School entry policy should focus on preparing schools to meet children’s developmental, social, and educational needs rather than on children’s’ appropriate age.
test scores and the assumption that older children are more academically competent may influence legislation and polices to
• There should b e a focus on providing young low-income raise the age of kindergarten entry. Study Approach: Studies published after 1980 that
children with opportunities for early educational experiences. • Conclusions cannot be made about
children who enter kindergarten utilized the following 4 methodologies after a delay because these were summarized: children do not represent a random
• Comparing outcomes form sample. children who have delayed entry by a year with children who entered school when they were eligible.
• Older children perform better than younger children in the same grade during the first few years of school; however these differences become
• Comparing children in the same smaller or disappear over time. grade who have different birth dates; and • Evidence does not suggest that
there is a particular age at which • Comparing children who are the children are more prepared to enter
same age but in different kindergarten, but children with early grades, as well as children who education experiences may show are a year apart in ages but in greater cognitive gains. the same grade.
• Low-income children who delay kindergarten entry may be at a greater disadvantage because these children start kindergarten with lower academic skills and are less able to afford an extra year of preschool or high quality child care.
183

Finance, Governance, and Other Systems Issues
Report Recommendations Key Findings/Rationale California Reports: Create new opportunities to fund 0–3 supports and services
by: • Young children and their families
need access to services that California Infant and Toddler Early Learning Policy Recommendations (2012)
• Restructuring early childhood funding to provide efficient funding for children 0–3 within 0–5 resources
• Developing new funding streams
support their various needs, including physical and behavioral health services in addition to high quality and affordable early care
Water Cooler Infant-Toddler Workgroup • Expanding current opportunities for 0–3 funding and education. California has made
Study Approach: The Water Cooler Infant-Toddler
• Prioritizing funding towards high-impact investments and high-needs populations
strides in comprehensive early childhood system development in the past decade, led by First 5
Workgroup convened over 130 • Supporting connections and better integration between organizations. Increased efforts individuals representing 95 systems that provide services to children age 0–3 and have also fostered cross-sector organizations to develop their families collaboration between the early recommendations to address the policy problems facing early care and education services for infants and
• Engaging in comprehensive early childhood system planning for the State of California
care and education, health, early childhood mental health, and early intervention systems.
toddlers in California. Over the course of five meetings, the workgroup
• Developing a comprehensive 0–5 data system for the State of California • The new infusion of federal funds
for evidence-based home visitation formulated, discussed, and ranked • Preserving the California Early Learning Advisory Council models provides one opportunity to policy recommendations in the create horizontal system areas of funding, access to quality connections. services, workforce development, and the building of a comprehensive system for infant and toddler care and education in California. This report outlines the group’s recommendations.
184

Finance, Governance, and Other Systems Issues
Report Recommendations Key Findings/Rationale California Report Card 2011–12: • Adopt a comprehensive P-to-12 education revenue and • California’s early learning and Setting the Agenda for Children (2012) reform package that establishes an equitable and
adequate finance system, ensures transparency, enables development system is a web of state and local programs financed
Children Now greater local decision-making flexibility, and strengthens human capital and accountability.
through a combination of federal, state, and local funding sources.
Study Approach: • Better coordinate and streamline the state’s delivery of • Many programs have distinct Analysis of administrative data and children’s services; establish a children’s cabinet. eligibility and reporting extensive literature review
• Allow more flexibility in the use of federal dollars, which are the major source of funds for early learning and care programs.
requirements, making it difficult to blend and braid available funds to cover the true cost of quality programs.
• Three state agencies oversee approximately 26 early learning programs, with CDE as the primary state agency responsible for program administration, and California’s Department of Social Services and Department of Developmental Services also playing a role.
185

Finance, Governance, and Other Systems Issues
Report Recommendations Key Findings/Rationale Economic Impacts of Early Care and • To continue economic benefits to the state, support an • The early care and education Education in California (2011) infrastructure of reliable, affordable child care, even
during periods of recession; a child care shortage can industry benefits the California economy by facilitating parents’
MacGillvary & Lucia impede economic recovery. ability to participate in the paid Center for Labor Research and workforce. Education University of California, Berkeley • The ECE industry also creates jobs;
it brings in gross receipts of at least
Study Approach: $5.6 billion annually and supports nearly 200,000 jobs.
This report incorporates analysis of extant administrative data, a literature review, and economic modeling.
• Every dollar spent on the ECE industry produces two dollars in economic output for the California economy.
• The benefits of high quality ECE programs have been estimated to be between $2.69 and $7.16 for every dollar invested.
Strategies for Advancing Preschool • Modify the contract mechanism for Title 5 and • In the short term, California can Adequacy and Efficiency in California Alternative Payment programs to reduce the extent of allocate existing resources more (2009) unused funds and other inefficiencies. efficiently and provide
Karoly RAND Corporation
Study Approach: Examination of data regarding the size of achievement shortfalls overall in the
• Implement a common reimbursement structure within a system with mixed delivery and diverse funding streams.
• Evaluate options for alternative governance structures in terms of the agencies that regulate and administer ECE programs, and change the structure if greater efficiency and effectiveness can be obtained.
infrastructure supports for raising quality in the future.
• In the longer term, new resources should be used to expand access to, and raise the quality of, preschool programs for those who can benefit most.
early elementary grades, gaps in school • Make greater use of the option to allocate Title I funds performance between groups, rates of for preschool programs. access to high quality early learning programs among California’s children, the structure of publicly-funded early care and education programs, and how ECE funds are being spent.
186

Finance, Governance, and Other Systems Issues
Report Recommendations Key Findings/Rationale Financing a Full-Day, Full-Year • Develop common criteria for a reimbursement structure • When four-year-olds in a low-income Preschool Program in California: across publicly funded full-day programs serving school district were randomly Strategies and Recommendations preschool-age children that take into account the cost of assigned to programs of different (2009) the quality components required. Raise the Standard durations, the children in 8-hour,
Reimbursement Rate for full-day programs meeting Title 45-week classes made greater Lam, Muenchow 5 standards above that for programs of similar duration gains in vocabulary and math skills American Institutes for Research that are only required to meet Title 22 licensing than did their peers assigned to a
standards. 2.5-to-3 hour, 41-week program. Study Approach: AIR estimated the cost of full-day preschool using several different methodologies and sets of assumptions.
• Explore establishing a common hourly rate for programs meeting similar quality standards. Too often, when rates are set for early childhood programs, the cost of quality components is not taken into account. In addition, the rate-setting process rarely takes into consideration the per-child cost per hour. As a result, there can be wide disparities in the hourly reimbursement rates for two
Moreover, as the study authors explain (Robin, Frede, & Barnett, 2006), many of the children would not have been able to participate in the preschool program at all had the schedule not accommodated the family’s work hours.
programs—General Child Care and State Preschool—that • Because Power of Preschool (PoP) are by law held to the same Title 5 standards. Even programs in California have the within the same General Child Care Program, providers highest quality standards, one way receive the same payment for a 6.5-hour program as to estimate the amount of funding they do for a 10.5-hour program. Setting rates on the needed to finance a high quality cost per hour would seem to meet a higher standard of full-day program is to extend the fairness. PoP hourly reimbursement rates
• Build on recent legislation (AB 2759) to address disincentives to offering full-day programs. This legislation offers an important opportunity to address some of the current barriers and disincentives to offering full-day programs. Policies allowing providers to earn more from serving two groups of children for 3 hours per day as opposed to one group for 6 hours merit re-examination. In addition, it now seems possible to allow programs to combine a portion of the General Child Care funding with the State Preschool Funding to create a better-financed full day, full-year program.
(averaged across the nine counties) over a longer program day (e.g., 6 or 9 hours versus 3 hours) and full year as opposed to school calendar year.* Across the nine counties with PoP demonstration programs, the maximum reimbursable amount per child enrolled in a part-day high quality preschool space ranges from $4,610 to $6,410 for 175 days, with an average yearly rate of $5,356.* To extend a part-day
• Consider a contracted preschool program operating six program to a full-day program, the hours a day with additional hours financed by parent maximum reimbursable amount for fees or vouchers. The study’s cost models suggest that a a 6-hour and a 9-hour program six-hour, school-calendar-length day may be a model would need to be increased to worth consideration as an alternative to a part-day
187

Finance, Governance, and Other Systems Issues
Report Recommendations Key Findings/Rationale program, especially for a program targeted at disadvantaged children. A program of this duration, while still not fully accommodating the work schedules of many families, would likely better help prepare disadvantaged children for school. In addition, it would leave fewer wrap-around hours for families to cover with their own fees or other publicly subsidized programs.
$10,710 and $16,065, respectively, for a 175-day program, and $15,300 and $22,950 for a full-year, or 250-day program (2009 dollars).
• Providers who choose to operate a General Child Care or full-day State
• Consider the First 5 Power of Preschool Demonstration Project reimbursement structure as a model for developing reimbursement policies for other state-funded early childhood programs and for the development of tiered reimbursement structures generally.
Preschool program are at a financial disadvantage compared to those who administer a part-day State Preschool program. California’s Standard Reimbursement Rate currently specifies an amount of $21.22 per day (or $7.07/hour) for a part-day State Preschool program, or $3,714 per year based on a 175-day/school year program. Providers who choose to offer two half-day preschool sessions may receive a total of up to $42.44 a day (or $10,610 per year) for two children, each served part-day. On the other hand, the maximum daily Standard Reimbursement Rate for full-day State Preschool and General Child Care and Development Programs is only $34.38 per child per day, or $8,595 per year. This translates into $8,595 per year or $5.29 per hour for a program that operates 6.5 hours a day, and $3.27 per hour for a program that operates 10.5 hours per day.
• In seven out of nine counties participating in the PoP Demonstration Program, full-day providers reimbursed through the
188

Finance, Governance, and Other Systems Issues
Report Recommendations Key Findings/Rationale SRR receive a lower level of funding per child than providers reimbursed through the RMR. However, centers participating in the Alternative Payment program receiving the RMR are only required to meet Title 22 regulations, which are less stringent than the Title 5 regulations required of the General Child Care centers under contract with CDE. Still, RMR rates, while significantly higher in most cases than the SRR rates, are still not sufficient to provide a full-day, full-year high quality program, such as one meeting PoP standards for every hour of the day.
* For a more detailed discussion on the PoP county reimbursement rates, readers can refer AIR’s policy brief, First 5 Power of Preschool: Lessons from an Experiment in Tiered Reimbursement.
First 5 Power of Preschool: Lessons • Develop a common reimbursement structure across • Unlike most state-funded and from an Experiment in Tiered programs serving preschool children, and explore federally funded early care and Reimbursement (2009) establishing a common hourly rate for programs meeting
similar quality standards. Raise the Standard education programs, the First 5 California reimbursement structure
Lam & Muenchow Reimbursement Rate for programs meeting Title 5 is not restricted to a single annual American Institutes for Research standards above that for programs of similar duration
that are only required to meet Title 22 licensing per child amount (First 5 California, 2008). Instead, First 5 California
Study Approach: standards. reimburses local participating Analysis of the PoP reimbursement structure in the nine counties participating in the PoP demonstration program
• Allow for regional variations in the reimbursement rate based on geographical differences in the cost of teacher compensation, teacher recruitment/retention, and the cost of living.
commissions based on the quality of the preschool spaces; the rate structure is designed to increase incrementally with teacher qualifications and improvements in
• Consider a factor in the reimbursement structure for family involvement and other comprehensive services.
program scores on the Early Childhood Environmental Rating
189

Finance, Governance, and Other Systems Issues
Report Recommendations Key Findings/Rationale
• Provide tools to help programs rise from entry level to a higher level.
• Anticipate and provide for increases in teacher experience and the maturation of the preschool program.
Scale (ECERS). The reimbursement rate also takes into account whether the space receives other private or public subsidies, such as from Head Start or the State
• Anticipate and provide for increases in teacher experience and the maturation of the preschool program.
Preschool Program (First 5 California, 2008).
• All nine California PoP counties (Los Angeles, Merced, San Diego, San Francisco, San Joaquin, San Mateo, Santa Clara, Ventura, and Yolo) have implemented a system of tiered reimbursement rates that ties funding amounts to quality levels and new or improved spaces.
• These reimbursement rates vary by county. The variation in rates appears to relate most strongly to teacher compensation—both the level of elementary teacher compensation in the county and the extent to which the county program is attempting to reach parity with elementary teacher compensation. There also appears to be a relationship (though less than might be expected) between the PoP reimbursement rates and regional variations in cost of living. Underlying differences in the prior expenditures for publicly funded programs, such as Head Start, may also explain variations in the reimbursement rates, especially for improved or enhanced spaces. Finally, differences in approaches to implementing a tiered reimbursement system (such as
190

Finance, Governance, and Other Systems Issues
Report Recommendations Key Findings/Rationale staffing pattern choices) may also influence PoP reimbursement rates.
• In every county, the State Reimbursement Rate for State Preschool programs meeting Title 5 requirements is lower (by from one-third to nearly one-half) than the Regional Market Rate for programs only required to meet Title 22 regulations. However, PoP reimbursement ceilings (ranging from $4,610-$6,470) are substantially higher than the Standard Reimbursement Rates for State Preschool ($3,714-$4,326). Tier 1 PoP reimbursement rates are similar to other estimates of the cost of high quality preschool by AIR and RAND.
• California currently has a complex and often confusing set of early care and education reimbursement mechanisms, and providers often have to integrate and coordinate funding streams to provide high quality programs.
191

Finance, Governance, and Other Systems Issues
Report Recommendations Key Findings/Rationale Increasing Access to Preschool: • Increase the daily Standard Reimbursement Rate (SRR) • The current state reimbursement Recommendations for Reducing for all early care and education programs, part-day and rate for early care and education is Barriers to Providing Full-Day, Full-Year full-day, with particular focus on raising the rate for full- prohibitively low; most agencies Programs (2008) day, full-year care. cannot afford to improve the quality
Miller Children Now
• Monitor and support administrative and legislative efforts to consolidate and streamline existing CDE early care and education programs.
of their programs or expand to full-day or full-year.
• Providers often administer a
Study Approach: Summary of research and recommendations
• Increase comprehensive training and technical assistance services for accounting and program staff in early care and education agencies.
number of different public and private contracts, braiding and blending funding sources. The administrative work associated with
• Support efforts by the CDE and the California Child Development Administrator’s Association (CCDAA) to create a more consistent approach to unrestricted and restricted third-party funding.
• Improve the capacity of the Centralized Eligibility List (CEL) to support early care and education programs and ensure that it is not a barrier to implementation of full-day, full-year services.
• Conduct a legislative interim hearing to identify remaining regulatory and legislative barriers to braiding and blending funding and increasing access to full-day, full-year opportunities.
taking on additional contracts in order to provide more full-day services may discourage providers from doing so.
• Some accounting staff working for early care providers do not fully comprehend the distinct programmatic intent and fiscal complexity of each separate early care and education funding stream in California, nor have experience with the accounting and reporting requirements.
• CDE has at times appeared to treat third-party restricted income (such as First 5 monies or private grants) as revenue to pay for CDE-contracted expenses. In these cases, third-party funds have essentially supplanted CDE dollars rather than expanding or enhancing program services as they were intended, with the end result that an agency’s total reimbursement from the state was lowered. This practice has discouraged some providers from seeking outside
192

Finance, Governance, and Other Systems Issues
Report Recommendations Key Findings/Rationale funding or coordinating CDE funds with other funding streams that may be considered third-party restricted income.
Other State or National Reports/Studies:
Mending the Patchwork: A Report Examining County-by-County Inequities in Child Care Subsidy Administration in New York State (2010)
Akhtar & Antos Empire Justice Center
Study Approach: The Empire Justice Center reviewed the 2007–09 Consolidated Services Plans and the 2008–09 Annual Plan Updates from each of New York’s 58 social service districts for information about program administration beyond the state regulations.
• Implement a co-pay structure that is based on a family’s ability to pay, without geographic distinctions.
• Pay child care providers for when a child is absent and for program closures for holidays and weather emergencies when providers charge private pay parents for these days. s.
• Programs that participate in the QRIS system should receive a rate differential.
• Systems should recognize and accommodate parents who need care during non-traditional hours, including overnight, and who are enrolled in post-secondary education rather than working.
• Eligibility structures should not penalize parents who have working older children.
• If systems remain local, each local district should provide all applicants and recipients for child care services with a one-page handout summarizing its eligibility rules.
• Provide child care subsidies for parents looking for work.
• Families similarly situated financially in different parts of New York state pay notably different proportions of their annual income for child care.
• More counties now provide care subsidies to parents who work nights.
• Different counties had different policies regarding counting the income of older children (18, 19, and 20 year olds) in determining child care subsidies, resulting in inequities across counties.
• Despite a statewide unemployment rate of 8.9%, 18 of New York’s social service districts did not authorize child care for parents looking for work.
193

Finance, Governance, and Other Systems Issues
Report Recommendations Key Findings/Rationale Early Learning Programs and Related Delivery Systems (2011)
State of Florida, Auditor General
Study Approach: An audit of the state of Florida’s early learning programs.
• The transfer of early care and education services to the Department of Education, with a director appointed by the Governor and approved by the Legislature, has “the potential” to raise the profile of the program. However, improvement is not guaranteed without proper procedures in place.
• The Auditor General in Florida (the nation’s fourth largest state, with 67 counties) recommends a statewide QRIS system rather than devolving responsibility to local coalitions.
• After 10 years of being under the Agency for Workforce Innovation, a welfare and training agency, the Legislature transferred all early care and education services to a self-contained unit in the Department of Education (in 2011).
• According to the Auditor General, the Office of Early Learning under the Agency for Workforce Innovation had not implemented a statewide QRIS; instead, some local coalitions implemented QRIS systems of their own.
Investments in Early Childhood in Michigan: A Summary of Programs and Funding Trends Report (2011)
Voices for Michigan’s Children
Study Approach: Analysis of publicly available data on trends in state spending on, and enrollment in, children’s programs in Michigan, with policy recommendations.
• Reform the early childhood education system to move away from an array of disconnected programs to an early childhood system that is accountable, easy to access, and of high quality.
• Because Michigan has over 80 different federally and state-funded early childhood programs, many of which have experienced reductions in recent years, and that are based on different and sometimes confusing eligibility standards, many children slip through the cracks.
• In May of 2009, the State Board of Education adopted new eligibility and prioritization guidelines for Michigan’s Great Start School Readiness Program (GSRP). Now, at least three-quarters of the children enrolled the GSRP must be from families with incomes below 300 percent of poverty. Children who are extremely low income, below 200 percent of poverty, qualify if they are not eligible for Head Start. Children in families with incomes between 200 and 300 percent of
194

Finance, Governance, and Other Systems Issues
Report Recommendations Key Findings/Rationale poverty must have risk factors in addition to income to qualify for the program. Risk factors include diagnosed disabilities or developmental delays, severe or challenging behaviors, a primary home language other than English, parents with low education levels, a history of abuse or neglect, homelessness, or having been born to a single or teen parent.
A Look at Governance Structures for Early Childhood in Six States (2010)
The BUILD Initiative
Study Approach: Review of governance structures for early care and education in six states
• No recommendations provided. • Of the six states profiled, four early childhood entities are public agencies, one is a quasi-governmental agency, and one is a public-private partnership.
• Three states focus their early learning agency on children 0–5, one focuses on children 0–6, another focuses on prenatal through grade 3, and the sixth focuses on children 0–14.
• In four states, legislation was the catalyst for the formation of the early learning agencies; in another, it was administrative action by the governor; and in a final state, it was a ballot initiative.
195

Finance, Governance, and Other Systems Issues
Report Recommendations Key Findings/Rationale Early Childhood System Governance: • Early childhood programs should be governed in a • An integrated approach to early Lessons from State Experiences (2010) coordinated way—collaboration so that what happens in
one part of the system is known by and has meaning for education management (e.g., one office, department, or agency in
Coffman, J., Glazer, K., Hibbard, S., & another (at the policy and practice level). Coordinate so charge) indicates a relatively higher Wiggins, K. that children and families experience a system that is not value given by the state government The BUILD Initiative siloed and fragmented, but instead is comprehensive
and cooperative. leaders to policymaking, funding, and regulation of early childhood
Study Approach: Summary of state approaches to early childhood program governance
• Align early childhood systems so that what the system does for infants and toddlers aligns with what it does for preschool-aged children, which aligns with kindergarten and elementary school. This alignment must happen at
than when the approach is more fragmented and the responsibility for young children is governmentally diffuse.
different levels, including policy, professional development, data collection, standards development, and assessment. Governance structure can play a significant role in ensuring alignment.
• Address policy conflicts that eliminate barriers and enhance the quality and duration of early learning and development services and supports to children at risk and their families.
• Ensure that the system is efficient, making the best use of its resources, and reducing duplication and identifying ways to cut costs while minimizing negative impacts to the system and its participants.
• Establish two-way accountability, where the governance structure is accountable to the early childhood system and to those who are affected by its decisions, and the system and its performance are accountable to the governance structure. In doing so, pay close attention to issues of equity, quality, and communication of results.
196

Finance, Governance, and Other Systems Issues
Report Recommendations Key Findings/Rationale Child Care Quality Rating and • Obtain adequate funding in advance and decide how it • Many of the QRSs in place are Improvement Systems in Five Pioneer will be spent. based on measures originally States: Implementation Issues and Lessons Learned (2008)
Zellman & Perlman RAND Corporation
Study Approach:
• Garner maximum political support for a QRIS. • Conduct pilot work and make revisions to the system
before it is adopted statewide. • Limit changes to the system after it is implemented. • Minimize self-reported data. • Integrate licensing into the system. One way to do this is
developed for low-stakes purposes and may not be valid in high-stakes contexts.
• In pioneer programs, little evidence is yet available on correlation between ratings and process quality variables or child outcomes.
In-depth interviews were conducted with to assign all licensed providers the lowest QRIS rating key stakeholders in each of five states unless they volunteer for a rating and are rated higher. implementing a QRIS system, focused on identifying major implementation issues and lessons learned.
• Use ERSs flexibly by incorporating both self-assessments and independent assessments at different levels of the QRS.
• Do not include accreditation as a mandatory system component.
• The rating system should have multiple levels.
• Create a robust QI process.
• Separate raters and other QI personnel.
• Public awareness campaigns are important, but should start after the system is in place; these campaigns need to be ongoing.
• Support research on systems and system components.
• There is a need to carefully validate QRS systems in the settings in which they occur.
197

Finance, Governance, and Other Systems Issues
Report Recommendations Key Findings/Rationale Report of the State Auditor: Colorado Child Care Assistance Program, Department of Human Services: Performance Audit (2008)
State of Colorado, Office of the State Auditor
Study Approach: Audit of the Child Care Assistance Program
• Standardize child care assistance program eligibility requirements by setting statewide or regional income eligibility limits.
• Eligibility requirements for the Colorado Child Care Assistance Program vary significantly across counties, resulting in families being eligible for services in some counties but not others.
198

Finance, Governance, and Other Systems Issues
Report Recommendations Key Findings/Rationale The Process of Devolution: Perceptions • No recommendations noted. • While the devolution of social policy form Local Boards; A Product of the to local workforce boards was Study of Child Care Devolution in Texas designed to increase local (2007) autonomy in designing solutions to
problems, this autonomy can be Lein, Beausoleil, & Tang limited by unchanged regulations at Center for Social Work Research and the state and federal level. the Ray Marshall Center, University of Texas at Austin • Some local boards had difficulty
responding both to local child care
Study Approach: needs on one hand and state and federal requirements on the other.
An analysis of the relationships between subsidized child care management policies, and the supply, usage, and quality of subsidized child care for low-income families based on (a) interviews with local staff working at each of the Local Workforce
• Local areas with fewer resources and higher proportions of children in poverty may face considerable difficulty in meeting federal and state requirements while providing adequate care for children in need.
Development Boards (LWDB) and (b) • Local entities also wrestled with more detailed studies of three cases balancing the two different motives which draw on the perspectives of for subsidized child care: allowing multiple local actors. parents to work, and supporting
school readiness for children.
• The Texas devolution of child care policy occurred in the context of the transfer of child care policy from a human resources agency to one oriented towards workplace issues; over the period of this study, state government requirements regarding local quality initiatives changed, and this impacted local boards.
Preliminary Findings from Interviews • No recommendations noted. • Program managers described how a with Child Care Program Managers: A series of reorganizations at Texas Product of the Study of Devolution of Workforce Commission (TWC) have Subsidized Child Care in Texas (2003) made their working relationships
with the state agency somewhat Lein, Beausoleil, Trott, Schexnayder,
199

Finance, Governance, and Other Systems Issues
Report Recommendations Key Findings/Rationale Schroeder, Tang, & Randazzo harder to maintain and have, on Center for Social Work Research and occasion, undermined the quality of Ray Marshall Center, University of Texas the support the boards receive. at Austin • TWC requirements aim to ensure
Study Approach: wide representation on local boards, including a balance by
In order to document the transition gender, race, and ethnicity, as well processes and the variations in both as the representation of various process and policy outcomes among organizations. Interviewees local workforce development boards, confirmed the boards’ compliance the research team engaged in semi- with these state directives, but structured qualitative telephone some commented on the difficulty interviews with the child care in finding voluntary members with management staff for each board. The the required characteristics. report includes the preliminary findings of the first round of 28 interviews conducted during 2001–2002, the first year of the project.
• Interviewees tended not to use the term “devolution.” Rather, they explained that the state maintains substantial control over child care policies, and only some responsibilities are transferred to the local boards.
• Because of the complexity of the child care system, many local boards needed considerable technical assistance from TWC in the conduct of their operations.
• Most local board staff described the transition from state to local control as gradual and progressive, with a steep learning curve. Respondents mentioned some factors that facilitated the transition: board staff expertise, intense work on the part of the board and its staff, and the structure of the transition were key elements. Transition problems included: the complexity of the
200

Finance, Governance, and Other Systems Issues
Report Recommendations Key Findings/Rationale system (including confusion over the roles of the various actors, boards, and TWC), lack of information and preparation on the side of the board, TWC’s own internal reorganizations, and some resistance on the part of the boards to take ownership of the child care program (because other programs were requiring competing attention, time, and effort).
• Voluntary boards and their staff experienced increased pressure from the community as they managed the new aspects of the program, often receiving contradictory feedback from different stakeholders.
• Many boards took initiative in the area of quality improvement. 27 boards worked on training/mentoring for child care providers, and 22 worked on funds and equipment for child care facilities.
• Views on fluctuations in funding vary among the interviewees, which suggest that funding changes are affecting the boards differently; some boards received large funding increases while others received limited increases. Respondents reported that difficult choices had to be made between the amount of direct care and its quality.
201

202 American Institutes for Research
Condition of Children Birth to Age Five and Status of Early Childhood Services in California
References Ackerman, D. J. (2005). getting teachers from here to there: Examining issues related to an early
care and education teacher policy. Early Childhood Research and Practice, 7(1).
Akhtar, S., & Antos, S. (2010). Mending the patchwork: A report examining county-by-county inequities in child care subsidy administration in New York State. Albany, NY: Empire Justice Center. Retrieved from http://onlineresources.wnylc.net/EJC/Reports/MendingPatchwork.pdf
Alameda County Early Childhood Mental Health Systems group. (2009). Mental health consultation and early care and education. Alameda, CA: Author. Retrieved from http://www.acgov.org/ childcare/documents/ECMH_Position_Paper.pdf
Allegretto, S. (2005). Basic family budgets: Working families’ income often fail to meet living expenses around the U.S.: Briefing paper. Washington, DC: Economic Policy Institute. Retrieved from http://www.epi.org/page/-/old/briefingpapers/165/bp165.pdf
American Institutes for Research. (2012). Combined table of Power of Preschool practices. San Mateo, CA: Author. Retrieved from http://www.earlylearningsystems.org/index.php?q=system/ files/Combined%20table%20of%20POP%20Practices%20%282%29.pdf
American Institutes for Research. (2004). Preschool for All toolkit. Washington, DC: Author.
American Institutes for Research. (2008). Evaluation of Preschool for All in San Mateo and San Francisco Counties: Year 3 report. Palo Alto, CA: American Institutes for Research.
American Institutes for Research. (2009). Evaluation of Preschool for All in San Mateo and San Francisco Counties: Year 4 report. Palo Alto, CA: American Institutes for Research. Retrieved from http://www.earlylearningsystems.org/index.php?q=system/files/Year%204%20SF%20 PFA%20Evaluation%20Report.pdf
American Institutes for Research analysis of American Community Survey (ACS) Public use Microdata. (2011). 2010 ACS 1-year Public Use Microdata Samples (PUMS) [Data file]. Available at http://factfinder2.census.gov/faces/nav/jsf/pages/searchresults.xhtml?refresh=t
Anthony, J. J., & Muenchow, S. (2010). California infant/toddler early learning and care needs assessment: A policy brief. Sacramento, CA: American Institutes for Research as a partner in the California Comprehensive Center at WestEd.
Appelbaum, E., & Milkman, R. (2011). Leaves that pay: Employer and worker experiences with paid family leave in California. Washington, DC: Center for Economic and Policy Research & uCLA/ CuNY.
Bain, H., Boersma, F., & Chapman, J. (1983). Academic achievement and locus of control in father-absent elementary school children. School Psychology International, 4, 69–78
Baker, S., Mcgee, Z., Mitchell, W., & Stiff, H. (2000). Structural effects of academic achievement on adolescents. ERIC Reproduction Service (ED No. 448 890).
Barnett, W. S. (2004). Better teachers, better preschools: Student achievement linked to teacher qualifications. Preschool Policy Matters, Policy Brief, Issue 2. New Brunswick, NJ: National Institute for Early Education Research, Rutgers university.
Barnett, W. S., Epstein D. J., Carolan, M. E., Fitzgerald, J., Ackerman, D. J., & Friedman, A. H. (2010). The State of Preschool 2010: State Preschool Yearbook. New Brunswick, NJ: National Institute for Early Education Research. As of December 15, 2011: http://nieer.org/yearbook/

203 American Institutes for Research
Condition of Children Birth to Age Five and Status of Early Childhood Services in California
Barraclough, S. J., & Smith, A. B. (1996). Do parents choose and value quality care in New Zealand? International Journal of Early Years Education, 4(1), 5–26.
Benedict, M. I., Zuravin, S., & Stallings, R. Y. (1996). Adult functioning of children who lived in kin versus non-relative family foster homes. Child Welfare, 75(5), 529–549.
Berrick, J. D., Barth, R. P., & Needell, B. (1994). A comparison of kinship foster homes and foster family homes: Implications for kinship foster care as family preservation. Children and Youth Services Review, 16(1/2), 35–63.
Bialystok, E., Martin, M. M. (2004). Attention and inhibition in bilingual children: evidence from the dimensional change card sort task. Dev Sci., 7(3), 325–39.
Blome, W. W. (1997). What happened for foster kids: Educational experiences of a random sample of foster care youth and a matched group of non-foster care youth. Child and Adolescent Social Work Journal, 14(1), 41–53.
Boise, P., Smith, E. R. A. N., Carey, J. (2004). Measuring environmental hazards in the childcare industry: Pesticides, lead, and indoor air quality: Survey brief. Santa Barbara, CA: Community Environmental Council.
Bowman, B. t., Donovan, M. S., & Burns, M. S. (Eds.). (2001). Eager to learn: Educating our preschoolers. Washington, DC: National Academy Press.
Brauner, C. B., & Stephens, B. (2006). Estimating the prevalence of early childhood serious emotional/behavioral disorder: Challenges and recommendations. Public Health Reports, 121, 303–310. Retrieved from http://www.ncbi.nlm.nih.gov/pmc/articles/PMC1525276/
Bridges, M., Fuller, B., Rumberger, R., & tran, L. (2004). Preschool for California’ s children: Promising benefits, unequal access. Policy Brief. Berkeley, CA: Policy Analysis for California Education, uC Berkeley.
Brooks-gunn, J., & Duncan, g.J. (1997). the effects of poverty on children. Future of Children, 7, 55–71.
Brooks-gunn, J., Han, W., Waldfogel, J (2010). First-year maternal employment and child development in the first 7 years: III. What distinguishes women who work full-time, part-time, or not at all in the 1st year? Monographs of the Society for Research in Child Development, 75(2), 35–49.
Brown, E. R., Ponce, N., Rice, t., & Lavarreda, S. A. (2002). The state of health insurance in California: Findings from the 2007 California Health Interview Survey. Los Angeles: uCLA Center for Health Policy Research.
Bruening, K., gilbride, J., Passannante, M., & McClowry, S. (1999). Dietary intake and health outcomes among young children attending 2 urban day-care centers.” J Am Diet Assoc 99(12), 1529–35.
Bueno, M., Darling-Hammond, L., & gonzalez, D. (2010). A matter of degrees: Preparing teachers for the pre-k classroom. Washington, DC: Pre-K Now. the Pew Center on the States.
the BuILD Initiative. (2010). A Look at governance structures for early childhood in six states. Denver, CO: Author.

204 American Institutes for Research
Condition of Children Birth to Age Five and Status of Early Childhood Services in California
Building Child Care Collaborative. (2007). Strategies for increasing child care facilities development and financing in California: Executive summary. Oakland, CA: Author. Retrieved from http:// www.buildingchildcare.net/uploads/pdfs/bcc-strategies-exec-summary.pdf
Burchinal, M. R., Cryer, D., Clifford, R. M., & Howes, C. (2002). Caregiver training and classroom quality in child care centers. Applied Developmental Science, 6(1), 2–11.
Burchinal, M. R., Roberts, J. E., Hooper, S., & Zeisel, S. A. (2000). Social risk and developmental patterns during the first four years. Developmental Psychology, 36, 793–807.
Bureau of Labor Statistics, united States Department of Labor. (n.d). Marital and family labor force statistics from the Current Population Survey [Data table]. Washington, DC: Author. Available from http://data.bls.gov/cgi-bin/dsrv?fmCAEL QIS Advisory Committee. (2010). Dream big for our youngest children: Final report. Sacramento, California: California Department of Education. Retrieved from http://www.cde.ca.gov/sp/cd/re/documents/fnlrpt2010.pdf
CAEL QIS. (2010). Family engagement in early childhood Quality Improvement Systems: Recommendations for CAEL QIS.
California Child Care Resource & Referral Network. (2011). 2011 California child care portfolio. San Francisco, CA: California Child Care Resource and Referral Network. Available from http://www. rrnetwork.org/rr-research-in-action/2011-california-child-care.html
California Department of Education. (2007). Unspent child care funding - Legislative report. Sacramento, CA: Author. Retrieved from http://www.cde.ca.gov/sp/cd/re/ unspntfnd07execsum.asp
California Department of Education, Academic Accountability and Awards Division. (September 16, 2011). 2011 Growth API [Data file]. Available from http://www.cde.ca.gov/ta/ac/ ap/ apidatafiles.asp
California Department of Education, Assessment and Accountability Division, DataQuest. 2011 STAR Test Results [Data table]. Accessed at http://dq.cde.ca.gov/dataquest/ on June 15, 2012.
California Department of Education, Child Development Division. (2012). Desired Results Developmental Profile: School Readiness (DRDP-SR). Sacramento, CA: Author. Retrieved from http://drdpsr.org/docs/DRDP-SR%207-2012v4.pdf
California Department of Education and California Health and Human Services Agency. (2010). Keeping children healthy in California’s child care environments: Recommendations to improve nutrition and increase physical activity. Sacramento, CA: California Department of Education. Retrieved from http://www.cde.ca.gov/ls/nu/he/documents/keepchildhealexecsumm.pdf
California Department of Education, Nutrition Services Division. (May 3, 2011). Federal FY 200910 County Profile for California Child and Adult Care Food Program - Child Care and Adult Care Components [Data file]. Available from http://www.cde.ca.gov/ds/sh/sn/.
California Department of Education and First 5 California. (2011). California Early Childhood Educator Competencies. Sacramento, CA: California Department of Education. Retrieved from http://www.cde.ca.gov/sp/cd/re/documents/ececompetencies2011.pdf
California Department of Education, Nutrition Services Division. (n.d.). Retrieved from http://www. cde.ca.gov/ls/nu

205 American Institutes for Research
Condition of Children Birth to Age Five and Status of Early Childhood Services in California
California Early Learning Advisory Council. (2011). Transitional kindergarten: Findings from the field. Sacramento, CA: Retrieved from http://kern.org/cia/wp-content/uploads/sites/25/2013/10/ReportFindingsFromtheField.pdf
California Endowment. (n.d.). Fighting California’s childhood obesity epidemic.
California Legislative Analyst’s Office. (2007). Issues and options: Developing safety and quality ratings for child care. Sacramento, CA: Author.
California HealthCare Foundation. (2009). California Health Care Almanac. Retrieved from http://www.chcf.org/~/media/MEDIA%20LIBRARY%20Files/PDF/PDF%20C/PDF%20ChildrensHealthCoverageFactsFigures2009.pdf
California Health Interview Survey, AskCHIS. (n.d.a). Overweight for age 2009 [table].
California Health Interview Survey (CHIS), AskCHIS. (n.d.b).
California Postsecondary Education Commission. (n.d.). 2009 College-going rates to public colleges and universities [Data table].
Campbell, F. A., Ramey, C. t., Pungello, E. P., Sparling, J., & Miller-Johnson, S. (2002). Early childhood education: Young adult outcomes from the Abecedarian project. Applied Developmental Science, 6 (1), 42–57.
Cannon, J. S., Jacknowitz, A., & Karoly, L. A. (2012). Preschool and School Readiness: Experiences of Children with Non-English Speaking Parents. San Francisco, CA: Public Policy Institute of California.
Cannon, J. S., & Karoly, L. A. (2007). The promise of preschool for narrowing readiness and achievement gaps among California children. Santa Monica, CA: RAND Corporation. Available from http://www.rand.org/pubs/research_briefs/RB9306/index1.html
Cannon, J. S., & Karoly, L. A. (2007). Who is ahead and who is behind? Gaps in school readiness and student achievement in the early grades for California’s children. Santa Monica, CA: RAND Corporation.
Center for the Study of Child Care Employment. (2006). California Early Care and Education Workforce Study. Berkeley, CA: university of California at Berkeley Institute of Industrial Relations
Center on the Developing Child at Harvard university. (2007). A science-based framework for early childhood policy: Using evidence to improve outcomes in learning, behavior, and health for vulnerable children. Cambridge, MA: Author. Retrieved from http://www.developingchild. harvard.edu
Center on the Social and Emotional Foundations for Early Learning (CSEFEL). (2011). California CSEFEL Project Fact Sheet. Nashville, tN: Author. Retrieved from http://csefel.vanderbilt.edu/ resources/states/ca_factsheet.pdf
Centers for Disease Control and Prevention (CDC). (1997). Screening young children for lead poisoning: Guidance for state and local public health officials. Atlanta, gA: Author. Retrieved from http://www.cdc.gov/nceh/lead/publications/screening.htm
Centers for Disease Control and Prevention. (n.d). Number of children tested and confirmed EBLLs by state, year, and BLL group, children < 72 months old. National Surveillance Data. Atlanta, gA: Author. Retrieved from http://www.cdc.gov/nceh/lead/data/StateConfirmed_ ByYear_1997_2010.htm

206 American Institutes for Research
Condition of Children Birth to Age Five and Status of Early Childhood Services in California
Chang, H. N., & Romero, M. (2008). Present, engaged & accounted for: The critical importance of addressing chronic absence in the early grades. New York, NY: National Center for Children in Poverty: http://www.nccp.org/publications/pub_837.html
Chapman, C., Laird, J., Ifill, N., & KewalRamani, A. (2011). Trends in high school dropout and completion rates in the United States: 1972–2009. (NCES 2012-006). u.S. Department of Education. Washington, DC: National Center for Education Statistics. Retrieved from http:// nces.ed.gov/pubsearch
Children Now. (2008). Increasing access to preschool: recommendations for reducing barriers to providing full-day, full-year programs. Oakland, CA: Children Now.
Children Now. (2011). Oral health: Integral to well-being. Children Now. (2012). 2011–12 California Report Card: Setting the agenda for children. Oakland, CA: Author.
Coffman, J., glazer, K., Hibbard, S., & Wiggins, K. (2010). Early childhood system governance: Lessons from state experiences. Denver, CO: the BuILD Initiative.
Coghlan, M., Bergeron, C., White, K., Sharp, C., Morris, M., & Rutt. S. (2009). Narrowing the gap in outcomes for young children through effective practices in the early years. London: Centre for Excellence and Outcomes in children and Young People’s Services.
Cryer, D., tietze, W., & Wessels, H. (2002). Parents’ perceptions of their children’s child care: A cross-national comparison. Early Childhood Research Quarterly, 17(2), 259–277.
Dalenius, K., Borland, E., Smith, B., Polhamus, B., & grummer-Strawn, L. (2012). Pediatric Nutrition Surveillance 2010 Report. Atlanta, gA: u.S. Department of Health and Human Services, Centers for Disease Control and Prevention.
Dental Health Foundation. (2006). “Mommy, it hurts to chew.” The California smile survey: An oral health assessment of California’s kindergarten and third grade children.
Early, D., Bryant, D. M., Pianta, R. C., Clifford, R. M., Burchnal, M. R., Ritchie, S., Howes, C., & Barbarin, O. (2006). Are teachers’ education, major, and credentials related to classroom quality and children’s academic gains in pre-kindergarten? Early Childhood Research Quarterly, 21(2), 174–195.
Early, D., Maxwell, K., Burchinal, M., Alva, S., Bender, R. H., Bryant, D., et al. (2007). teachers’ education, classroom quality, and young children’s academic skills: Results from seven studies of preschool programs. Child Development, 78(2), 558–580.
EdSource. (n.d.). California’s students. R
English, D. J., Kouidou-giles, S., & Plocke, M. (1994). Readiness for independence: A study of youth in foster care. Children and Youth Services Review, 16(3/4), 147–158.
Espinosa, L. (2007). English-language learners as they enter school. In R. Pianta, M. Cox, & K. Snow (Eds.), School readiness and the transition to kindergarten in the era of accountability (pp.175–196). Baltimore, MD: Paul H. Brookes.
Espinosa, L., & López, M. L. (2007). Assessment considerations for young english language learners across different levels of accountability. Commissioned paper for First 5 Los Angeles and the Pew Charitable trusts’ Early Childhood Accountability Project.

207 American Institutes for Research
Condition of Children Birth to Age Five and Status of Early Childhood Services in California
Fantuzzo, J., McWayne, C., Perry, M. A., & Childs, S. (2004). Multiple dimensions of family involvement and their relations to behavioral and learning competencies for urban, low-income children. School Psychology Review, 33(4), 467–480.
Fanshel, D., & Shinn, E. B. (1978). Children in foster care: A longitudinal study. New York: Columbia university Press.
Feld, P., Matlock, C., & Sandman, D. (1998). Insuring the children of New York City’s low income families. Focus group findings on barriers to enrollment in Medicaid and Child Health Plus. New York: the Commonwealth Fund.
Finello, K. M., Hampton, P., & Poulsen, M. K. (2011). Challenges in the implementation of evidence-based mental health practices for birth-to-five year olds and their families. Long Beach, CA: California Center for Infant-Family and Early Childhood Mental Health. Retrieved from http:// cacenter-ecmh.org/wp/wp-content/uploads/2012/03/think-tank-brief.pdf
First 5 California. (n.d.). Helping parents quit smoking. Sacramento, CA: Author.
First 5 California. (2008). Power of preschool demonstration program: Progress report, fiscal years 2005–06 through 2007–08. Sacramento, CA: Author.
First 5 California. (n.d). Child with special needs. Sacramento, CA: Author.
First 5 California Children and Families Commission. (2010, November). Personal communication from gretchen Williams. Sacramento, CA.
Fitzgerald, t., Sormana, S., Ramirez, C., Mathur, M., Benitez, D., Reynolds, V., Provance, E., Cowles, E., Livingston, B., & Hayes, J. (2010). Special Needs Project: Final Program Evaluation Report. Sacramento, CA: First 5 California.
Fox, M., & Arcuri, K. (1980). Cognitive and academic functioning in foster children. Child Welfare, 59, 491-496.
Fradd, S. H., & Boswell, t. D. (1996). Spanish as an economic resource in Metropolitan Miami. Bilingual Research Journal, 20, 283-338.
Franke, t., Espinosa, L., & Hanzlicek, L. (2011). Power of Preschool Program evaluation report. Sacramento, CA: uCLA Center for Healthier Children, Families and Communities for First 5 California.
Fuller, B., Kagan, S. F., & Loeb, S. (2002). New lives for poor families: Mothers and young children move through welfare reform. The Growing Up in Poverty Wave 2 Findings: California, Connecticut, and Florida. Berkeley, CA: university of California. Retrieved from http://www.eric. ed.gov/PDFS/ED473890.pdf
gilbert, R., Spatz Widom, C., Browne, K., Fergusson, D., Webb, E., & Janson, J. (2009). Burden and consequences of child maltreatment in high-income countries. The Lancet, 373, 68–81.
gillman, A., Raynor, D., & Young, M. (2008). Facilities for early care and education programs. Philadelphia, PA: Author. Retrieved from http://www.nextamericanopportunity.org/ncfs/ecep/

208 American Institutes for Research
Condition of Children Birth to Age Five and Status of Early Childhood Services in California
goerge, R. M., Van Voorhis, J., grant, S., Casey, K., & Robinson, M. (1992). Special- education experiences of foster children: An empirical study. Child Welfare, 71, 419–437.
Han, W., Waldfogel, J., & Brooks-gunn, J. (2001). the effects of early maternal employment on later cognitive and behavioral outcomes. Journal of Marriage and the Family, 63, 336–354. (339)
Hansen, J. S. (2006). Education Data in California: Availability and Transparency, paper prepared for getting Down to Facts: A Research Project Examining California’s School governance and Finance Systems, Palo Alto, CA: Institute for Research on Education Policy and Practice, Stanford university.
Harder & Company for First 5 California. (2008). CARES Statewide Retention Study Final Report, Sacramento. CA: First 5 California.
Hart, B., & Risley, R. t. (1995). Meaningful differences in the everyday experience of young American children. Baltimore: Paul H. Brookes.
Heinig, J., & Nutrition Services Division, California Department of Education. (2010). Keeping children healthy in California’s child care environments: Recommendations to improve nutrition and increase physical activity. California Department of Education. Retrieved from http://www. cde.ca.gov/ls/nu/he/documents/keepchildhealth.pdf
Helburn, S. W. (1995). Cost, quality, and child outcomes in child care centers. Technical report. Denver, CO: Denver Department of Economics, Center for Research in Economic and Social Policy, university of Colorado at Denver.
Henderson, A., & Mapp, K. A. (2002). New wave of evidence: The impact of school, family, and community connections on student achievement. Austin, tX: Southwest Educational Development Laboratory.
Honig, M. I. (2004). Where’s the ‘up’ in bottom-up reform. Educational Policy, 18(4), 527–561.
Howes, C. (1997). Children’s experiences in center-based child care as a function of caregiver background and adult:child ratio. Merrill-Palmer Quarterly, 43, 404–425.
Howes, C., Burchinal, M., Pianta, R., Bryant, D., Early, D., Clifford, R., & Barbarin, O. (2008). Ready to learn? Children’s pre-academic achievement in pre-kindergarten programs. Early Childhood Research Quarterly, 23, 27–50.
Howes, C., Whitebook, M., & Phillips, D. (1992). teacher characteristics and effective teaching in child care: Findings from the National Child Care Staffing Study. Child and Youth Care Forum, 21(6), 399–414.
Iglehart, A. P. (1994). Kinship foster care: Placement, service, and outcome issues. Children and Youth Services Review, 16(1/2), 107–122.
Institute of Medicine. (2001). Crossing the quality chasm: A new health system for the 21st century. Washington, DC: National Academic Press. Institute of Medicine (2009).
Jacobson, L. (2004). Early childhood education: States moving toward universal coverage. Education Reform. Washington, DC: Education Writers Association.
Jackson, S. L., Vann, F., Kotch, J., Pahel, t., & Lee, J. (February 17, 2011). Impact of poor oral health on children’s school attendance and performance. American Journal of Public Health Published on-line February 17, 2011.

209 American Institutes for Research
Condition of Children Birth to Age Five and Status of Early Childhood Services in California
Jaffee, S. R., Harrington, H., Cohen, P., and Moffitt, t.E. (2005). Cumulative prevalence of psychiatric disorder in youths. Journal of the American Academy of Child and Adolescent Psychiatry, 44(5), 406–407.
Jensen, B. (2009). A Nordic approach to early childhood education (ECE) and socially endangered children. European Early Childhood Education Research Journal, 17(1), 7–21.
Jorde-Bloom, P. (1988). Child care center directors’ training and qualifications. ERIC Digest ED301363. urbana, Illinois: ERIC Clearinghouse on Elementary and Early Childhood Education.
Karoly, L. A. (2009). Preschool adequacy and efficiency in California: Issues, policy options, and recommendations. Santa Monica, CA: RAND Corporation.
Karoly, L. A. (2012a). The use of early care and education by California families. Santa Monica, CA: RAND Corporation.
Karoly, L. A. (2012b). A golden opportunity: Advancing California’s early care and education workforce professional development system. Santa Monica, CA: RAND Corporation.
Karoly, L. A., & Bigelow, J. H. (2005). The economics of investing in universal preschool education in California. Santa Monica, CA: RAND Corporation.
Karoly, L. A., ghosh-Dastidar, B., Zellman, g. L., Perlman, M., & Fernyhough, L. (2008). Prepared to learn: The nature and quality of early care and education for preschool-age children in California. Santa Monica, CA: RAND Corporation.
Karoly, L. A., & gonzalez, g. (2011). Early learning environments: Child care and preschool arrangements for children in immigrant families.” Future of Children 211: 71–101.
Karoly, L. A., Kilburn, M. R., & Cannon, J. S. (2005) Early childhood interventions: Proven results, future promise. Santa Monica, CA: RAND Corporation.
Karoly, L. A., Reardon, E., & Cho, M. (2007). Early care and education in the golden state: publicly funded programs serving California’s preschool-age children. Santa Monica, CA: RAND Corporation.
Karoly, L. A., & Zellman, g. L. (2012). How would programs rate under California’s proposed Quality Rating and Improvement System? Evidence from statewide and county data on early care and education program quality. Santa Monica, CA: RAND Corporation.
KIDS COuNt, the Annie E. Casey Foundation, KIDS COuNt Data Center. (n.d.). Data across states, rankings, maps, or trends by topic, children in single-parent families by race (Percent) – 2010 [Data table].
Kidsdata.org. (2010). Cited from Children with Special health care needs: A profile of key issues in California, Lucile Packard Foundation for Children’s Health. Palo Alto, CA, October 2012.
Kincheloe, J. R., Brown, E. R. (2005). Who signs up? Family participation in Medi-Cal and Healthy Families. Los Angeles, CA: uCLA Center for Health Policy Research.
Kirkegaard, I., Obel, C., Hedegaard, M., & Henriksen, t. B. (2006). gestational age and birth weight in relation to school performance of 10-year-old children: A follow-up study of children born after 32 completed weeks. Pediatrics (118)4 1600–1606.

210 American Institutes for Research
Condition of Children Birth to Age Five and Status of Early Childhood Services in California
Kreader, J. L., Ferguson, D., & Lawrence, S. (2005). Infant and toddler child care quality. Child Care & Early Education Research Connections, Research-to-Policy Connections, No. 2.
Lally, J. R., Mangione, P. L., & Honig, A. S. (1988). the Syracuse university Family Development Research Program: Long-range impact on an early intervention with low-income children and their families. In D. R. Powell and I. E. Sigel (eds.), Parent Education as Early Childhood Intervention: Emerging Direction in Theory, Research, and Practice. Annual Advances in Applied Developmental Psychology, Volume 3. Norwood, NJ: Ablex Publishing Corporation.
Lam, I., & Muenchow, S. (2009a). Financing a full-day, full-year preschool program in California: Strategies and recommendations. Washington, DC: American Institutes for Research. Retrieved from http://www.earlylearningsystems.org/files/upload/Full-Day_Preschool052009.doc
First 5 Power of Preschool: Lessons from an experiment in tiered reimbursement: Policy briefLein, L., Beausoleil, J., trott, S., Schexnayder, D., Schroeder, D., tang, Y., & Randazzo, M. (2003). Preliminary findings from interviews with child care program managers: A product of the Study of Devolution of Subsidized Child Care in Texas. Lein, L., Beausoleil, J., & tang, Y. (2007). The Process of Devolution: Perceptions form local boards; A product of the Study of Child Care Devolution in Texas. Austin, tX: Center for Social Work Research and the Ray Marshall Center, university of texas at Austin.
Lipscomb, S. (2009). Students with disabilities and California’s special education program. San Francisco, CA: Public Policy Institute of California, Retrieved from http://www.ppic.org/ content/pubs/report/R_109SLR.pdf
Loeb, S., Fuller, B., Kagan, S. L., & Carrol, B. (2004). Child care in poor communities: Early learning effects of type, quality, and stability. Child Development, 75(1), 47-65.
Lopez, E. S., & de Cos, P. L. (2004). Preschool and childcare enrollment in California. Sacramento, CA: California Research Bureau.
Love, J. M., Atkins-Burnett, S., & Vogel, C. (2009). The children of LAUP: Executive summary of the First 5 LA Universal Preschool Child Outcomes Study. Princeton, NJ: Mathematica Policy Research Inc. Retrieved from http://www.first5la.org/files/upcos-final-exec-sumrept_07-6-09.pdf
Love, J. M., Atkins-Burnett, S., Vogel, C., Aikens, N., Xue, Y., Mabutas, M., Carlson, B.L., Martin, S.E., Paxton, N., Caspe, M., Sprachman, S., & Sonnenfeld, K. (2009). Los Angeles universal preschool programs, children served, and children’s progress in the preschool year: Final report of the First 5 LA universal preschool child outcomes study. Princeton, NJ: Mathematica Policy Research, Inc. Retrieved from http://first5la.org/files/uPCOS-Final-Report.pdf
Love, J. M., Kisker, E., Ross, C., Schochet, P., Brooks-gunn, J., Boller, K., et al. (2001). Building their futures: How Early Head Start Programs are enhancing the lives of infants and toddlers in low-income families. Princeton, NJ: Mathematica Policy Research Inc. Retrieved from http://www.acf.hhs.gov/sites/default/files/opre/bldg_vol1.pdf
Low Income Investment Fund (LIIF). (2010, March). Personal communication from Edward Condon, San Francisco, CA.
Low Income Investment Fund. (2010). Child care facilities development: A report on California’s Readiness. San Francisco, CA: Author. Retrieved from http://www.liifund.org/wp-content/ uploads/2011/03/CA-Child-Care-Facilities-Survey-Report-02-10-FINAL.pdf
Mallonee, N., Sanchez, M., & London, R. A. (2011). Pre-k to elementary experiences and outcomes among preschool for all students in San Mateo County, CA. Palo Alto, CA: Stanford university. Retrieved from http://citeseerx.ist.psu.edu/viewdoc/download?doi=10.1.1.390.9642&rep=rep1&type=pdf

211 American Institutes for Research
Condition of Children Birth to Age Five and Status of Early Childhood Services in California
Manship, K., Fain, g., & Madsen, S. (2011). Evaluation of Stretch to Kindergarten program: 2011 findings. San Mateo, CA: American Institutes for Research.
Martin, M. (2007). Report on the issue of returned child development contract funds in California. Fremont, CA: Kidango.
Maternal Child and Adolescent Health Division, California Department of Health. (2005). California five year needs assessment report. Retrieved from http://www.cdph.ca.gov/programs/mcah/ Documents/MO-titleV-NeedsAssessment.pdf
Miedel, W. t., & Reynolds, A. J. (1999). Parent involvement in early intervention for disadvantaged children: Does it matter? Journal of School Psychology, 37(4), 379–402. EJ607658.
Mills, C. (2004). Problems at home, problems at school: The effects of maltreatment in the home on children’s functioning at school. An overview of recent research. London: National Society for the Prevention of Cruelty to Children.
Miller, K. (2011). Childhood obesity and dental disease: Common causes, common solutions. Oakland, CA: Author. Retrieved from http://www.childrennow.org/uploads/documents/oral_ health_brief_022011.pdf
Macgillvary, J., & Lucia, L. (2011). Economic impacts of early care and education in California. Berkeley, CA: university of California, Berkeley, Center for labor and Education.
Mission Analytics group. (n.d.). San Mateo County Individualized Child Care Subsidy Pilot Project 2010/2011. San Francisco, CA: Author.
Muenchow, S., & Anthony, J. J. (2009). Infant/toddler early learning needs assessment: Draft scope of work for CDE/CDD early learning quality improvement system advisory committee. San Mateo, CA: American Institutes for Research. Retrieved from http://www.cde.ca.gov/sp/ cd/re/sb1629committee.asp
Munger, M., English, S., Dow, S. S., & Brownson, K. P. (2007). Policy Recommendations on facilities for preschool and early education. Washington, DC: Advancement Project.
Nackman, L., & Eiler-White, M. (2007). Issues and options: Developing safety and quality ratings for child care. Sacramento, CA: Legislative Analyst’s Office. Retrieved from http://www.lao. ca.gov/2007/childcare/childcare.pdf
the National Academies. (2009). Preventing mental, emotional, and behavioral disorders among young people: Progress and possibilities. Report brief for policymakers.
National Association of Child Care Resource & Referral Agencies. (2009). We can do better: 2009 update: NACCRRA’s ranking of state child care center regulation and oversight. Washington, DC: Author. Retrieved from http://issuu.com/naccrra/docs/we-can-do-better-2009-update
We can do better: 2011 update: NACCRRA’s ranking of state child care center regulation and oversightNational Association for the Education of Young Children (NAEYC). (1987). NAEYC position statement on licensing and other forms of regulation of early childhood programs in centers and family day care. Washington, DC: Author.
National Center for Education Statistics (NCES). (2011). Table 212. Estimated rate of 2007–08 high school graduates attending degree-granting institutions, by state: 2008. Retrieved from http://nces.ed.gov/programs/digest/d11/tables/dt11_212.asp

212 American Institutes for Research
Condition of Children Birth to Age Five and Status of Early Childhood Services in California
National Center on Family Homelessness. (2010). State report card on child homelessness: America’s youngest outcasts, 2010.
National Institute of Child Health and Human Development (NICHD) Early Child Care Research Network. (2002). Child care structure>process>outcome: Direct and indirect effects of caregiving quality on young children’s development. Psychological Science, 13 (3), 199–206.
National Institute of Child Health and Human Development (NICHD), Early Child Care Research Network, & Duncan, g. (2003). Modeling the impacts of child care quality on children’s preschool cognitive development. Child Development, 74, 1454–1475.
National Research Council and Institute of Medicine. (2000). From neurons to neighborhoods: The science of early childhood development. Committee on Integrating the Science of Early Childhood Development. Jack P. Shonkoff and Deborah A. Williams, eds. Board on Children, Youth, and Families, Commission on Behavioral and Social Sciences and Education. Washington, DC: National Academy Press.
National task Force on Early Childhood Education for Hispanics. (2007). Expanding and improving early education for Hispanics.
National Vital Statistics System, National Center for Health Statistics, Health Data Interactive. (n.d.). Low birthweight: Country/State/County - 2009 [table]. Available from www.cdc.gov/ nchs/hdi.htm (accessed on April 12, 2012).
Naughton, S. (2004). The importance of family engagement: English language learners, immigrant children, and Preschool for All: Issue Brief. Oakland, CA: Children Now. Retrieved from http:// www.eric.ed.gov/PDFS/ED486411.pdf
Neas, K. B., & Mezey, J. (2003). Addressing child care challenges for children with disabilities: proposals for CCDBG and IDEA reauthorizations. Washington, DC: Center for Law and Social Policy. Retrieved from http://www.clasp.org/admin/site/publications_archive/files/0122.pdf
Needell, B., Webster, D., Armijo, M., Lee, S., Dawson, W., Magruder, J., Exel, M., Cuccaro-Alamin, S., Putnam-Hornstein, E., Williams, D., Simon, V., Hamilton, D., Lou, C., Peng, C., Moore, M., King, B., Henry, C., & Nuttbrock, A. (2012). Child Welfare Services reports for California: Children with entries to foster care 2011 [table]. Available from http://cssr. berkeley.edu/ucb_childwelfare
New America Media. (2006). Great expectations: Multilingual poll of Latino, Asian and African American parents reveals high educational aspirations for their children and strong support for early education. San Francisco, CA: Author.
Nieto, S. (1992). Affirming Diversity: The Sociopolitical Context of Multicultural Education. White Plains, NY: Longman.
Noble, K. g., Fifer, W. P., Rauh, V. A., Nomura, Y., & Andrews, H .F. (2012). Academic achievement varies with gestational age among children born at term. Pediatrics. (Epub ahead of print).
P-16 Council. (2008). Closing the Achievement Gap: Report of Superintendent Jack O’Connell’s California P-16 Council. Sacramento, CA: California Department of Education.
Parker, L. (2000). the federal nutrition programs: A safety net for very young children,” Zero to Three, 21(1), 29–36.

213 American Institutes for Research
Condition of Children Birth to Age Five and Status of Early Childhood Services in California
Parrish, D., Quick, H., & Manship, K. (2011). Children’s elementary school outcomes after participating in family literacy programs: Research brief. Los Angeles, CA: First 5 Los Angeles. Retrieved from http://www.air.org/files/F5LA_researchbrief_AIR_single_page.pdf
Payán, R., & Nettles, M. (n.d.). Current state of English-language learners in the U.S. K-12 student population. Retrieved from http://www.ets.org/Media/Conferences_and_Events/pdf/ ELLsympsium/ELL_factsheet.pdf
Peisner-Feinberg, E. S., Burchinal, M. R., Clifford, R. M., Culkin, M. L., Howes, C., Kagan, S. L., & Yazejian, N. (2001). the relation of preschool quality to children’s cognitive and social developmental trajectories through second grade. Child Development, 72(5), 1534–1553.
Peisner-Feinberg, E. S., Burchinal, M. R., Clifford, R. M., Culkin, M. L., Howes, C., Kagan, S. L., Yazejian, N., Byler, P., Rustici, J., & Zelazo, J. (2000). The children of the cost, quality, and child outcomes study go to school: Technical report. Chapel Hill: university North Carolina at Chapel Hill, Frank Porter graham Child Development Center.
Phillips, D. (2010). 10 years post-Neurons to Neighborhoods: What’s at stake and what matters in child care? Keynote address at the celebration of the 20th anniversary of the Child Care and Development Block grant. Washington, D.C.
Phillips, D., gormley, W., & Lowenstein, A. (March 2007). Classroom quality and time allocation in Tulsa’s early childhood programs. Paper presented at the Biennial Meeting of the Society for Research in Child Development: Boston, MA.
Phillipsen, L. C., Burchinal, M. R., Howes, C., & Cryer, D. (1997). the prediction of process quality from structural features of child care. Early Childhood Research Quarterly, 12(3), 281–303.
Pianta, R. C., Barnett, W. S., Burchinal, M., & thornburg, K. R. (2009). the effects of preschool education: What we know, how public policy is or is not aligned with the evidence base, and what we need to know. Psychological Science, 10(2), 49–88.
Pianta, R. C., Howes, C., Burchinal, M., Bryant, D., Clifford, R., Early, C., & Barbarin, O. (2005). Features of prekindergarten programs, classrooms, and teachers: Do they predict observed classroom quality and childteacher interactions? Applied Developmental Science, 9, 144–159.
Pitcl, J., Provance, E., & Kerslake, C. A. (2006). Social and emotional well-being: The foundation for school readiness. San Francisco, CA: WestEd. Retrieved from https://www.wested.org/online_pubs/cpei/social-emotional.pdf
Prayaga, R. B., Sormano, S., Hobart, C., Neville-Morgan, S., Smith, C. A., Balakshin, M., Padilla, C., Bupara, E., & Syphax, V. (2009). Power of Preschool program evaluation repot. Sacramento, CA: First 5 California.
Preschool California. (2011). Studies on transitional kindergarten and programs for 5-year-olds. Oakland, CA: Author. Retrieved from http://www.earlyedgecalifornia.org/resources/resource-files/transitional-kindergarten.pdf
Proscio, t., Sussman, C., & gillman, A. (2004). Child care facilities: quality by design. New York, NY: Local Initiatives Support Corporation. Retrieved from http://www.lisc.org/media/filer_public/28/68/2868a2eb-5d68-4f45-b442-b8eb4bdfc799/2004_cick_quality_by_design.pdf
Quick, H., Manship, K., Parrish, D., Madsen, S., Lyman-Munt, E., Ernandes, J., Rojas, D., Helsel, F., Howes, C., & Jung, Y. (2011). Evaluation of the First 5 LA Family Literacy Initiative: Final Report. San Mateo, CA: American Institutes for Research. Retrieved from http://www.first5la.org/ files/07096_FL_Final_Comprehensive_Evaluation_Report_final_011211.pdf

214 American Institutes for Research
Condition of Children Birth to Age Five and Status of Early Childhood Services in California
Renwick, t. (2009). Alternative Geographic Adjustments of U.S. Poverty Thresholds: Impact on State Poverty Rates. Paper presented at the Joint Statistical Meetings, Washington, D.C. Available from Census Bureau working papers.
Reynolds, A. J., & Ou, S. (2011). Paths of effects from preschool to adult well-being: A confirmatory analysis of the Child-Parent Center Program. Child Development, 82(2), 555–582.
Reynolds, A. J., temple, J. A., Ou, S., Robertson, D. L., Mersky, J. P., topitzes, J. W., & Niles, M. D. (2007). Effects of a school-based early childhood intervention on adult health and well-being: A 19-year follow-up of low-income families. Archives of Pediatric and Adolescent Medicine, 161(8), 730–739.
Ritchie, James, & Fredericks. (2011). Child care sector assessment. the California Child Care Food Program Roundtable. Retrieved from http://cwh.berkeley.edu/sites/default/files/primary_ pdfs/Child_Care_Sector_Assessment_10.11.pdf
Robin, K. B., Frede, E. C., & Barnett W. S. (2006). Is more better? The effects of full-day vs. half-day preschool on early school achievement. NIEER Working Paper. Available at: http://nieer.org/ resources/research/IsMoreBetter.pdf
Ruhm, C. J. 2004. Parental Employment and Child Cognitive Development. Journal of Human Resources, 39(1), 155–192.
Sawyer, R. J., & Dubowitz, H. (1994). School performance of children in kinship care. Child Abuse and Neglect, 18, 587–597.
Schweinhart, L. J. (2004). The High/Scope Perry Preschool study through age 40: Summary, conclusions, and frequently asked questions. Ypsilanti, MI: High/Scope Educational Research Foundation.
Shonkoff, J. P., & Phillips, D. A. (Eds.). (2000). From neurons to neighborhoods: The science of early child development. Washington, DC: National Academy Press. http://www.nap.edu/ catalog/9824.html.
Sigle-Rushton, W., & McLanahan, S. (2004). Father absence and child wellbeing: a critical review. In: D. P. Moynihan, L. Rainwater, & t. Smeeding (Eds.), The future of the family (pp.116–155). New York: Russell Sage Foundation.
State of California. (2011). State of California—Race to the Top Early Learning Challenge Grant (RTT/ELCG) Application. Retrieved from http://cwh.berkeley.edu/sites/default/files/primary_ pdfs/Child_Care_Sector_Assessment_10.11.pdf
State of California, Department of Finance. (July 2007). Projected population growth: race/ethnic population with age and sex detail, 2000–2050 [Data file].
State of California, Health and Human Services Agency, Department of Social Services. (2008). Manual of policies and procedures: General licensing requirements, Title 22, Division 6, Chapter 1. Sacramento, CA: Author.
State of Colorado, Office of the State Auditor. (2008). Report of the State Auditor: Colorado Child Care Assistance Program Department of Human Services: Performance Audit. Denver: CO: Author. Retrieved from http://www.leg.state.co.us/osa/coauditor1.nsf/All/8B87ED8F4A51F6 3687257516007C98D8/$FILE/1909%20CCAP%20Perf%20Nov%202008.pdf
State of Florida, Auditor general. (2011). Early learning programs and related delivery systems: Audit performed pursuant to chapter 2011-142, Laws of Florida. tallahassee, FL: Author. Retrieved from http://www.myflorida.com/audgen/pages/pdf_files/2012-061.pdf

215 American Institutes for Research
Condition of Children Birth to Age Five and Status of Early Childhood Services in California
Stein, E. (1997). teacher’s assessments of children in foster care. Developmental Disabilities bulletin, 25(2), 1–17.
Stevens, g. D. (2006). gradients in the health status and developmental risks of young children: the combined influences of multiple social risk factors. Maternal and Child Health Journal, 10(2), 187–199.
Starkey, P., & Klein, A. (2000). Fostering parental support for children’s mathematical development: An intervention with Head Start families. Early Education and Development, 11(5), 659–680. EJ618579.
Stipek, D. (2002). At what age should children enter kindergarten? A question for policy makers and parents. Social policy report: Giving child and youth development knowledge away, 16(2).
Stipek, D., & Schoenfeld, A. (2012). Early math in California. Palo Alto, CA: Heising-Simons Foundation.
Sussman, C., & gillman, A. (2007). Building Early Childhood Facilities: What States Can Do to Create Supply and Promote Quality. New Brunswick, NJ: National Institute for Early Education Research. Retrieved from http://nieer.org/resources/research/Facilities.pdf
tout, K. Starr, R., Soli, M., Moodie, S., Kirby, g., & Boller, K. (2010). Compendium of quality rating systems and evaluations. Washington, DC: Child trends and Mathematica Policy Research.
united States Census Bureau. (2010). Poverty status in the past 12 months. 2010 American Community Survey one-year estimates. [Data file]. Retrieved from http://factfinder.census.gov/faces/tableservices/jsf/pages/productview.xhtml?src=bkmkS1701&prodType=table
united States Department of Labor. (2009). Occupational employment and wages. Retrieved from http://www.bls.gov/oes/current/oes399011.htm.
united States Department of Agriculture (uSDA), Food and Nutrition Service. (2012). Child and adult care food program data as cited by CDE and CHHS in Keeping children healthy in California’s child care environments: Recommendations to improve nutrition and increase physical activity.
Veltman, M., & Browne, K. (2001). three decades of child maltreatment research: Implications for the school years. Trauma, Violence & Abuse, 2(3), 215–239.
Voices for Michigan’s Children. (2011). Investments in early childhood in Michigan: A summary of programs and funding trends. Lansing, MI: Author.
Waldfogel, J. (2006). What do children need? Public Policy Research, 13(1), 26–34.
Weinstock, P., Bos, J., tseng, F., Rosenthal, E., Ortiz, L., Dowsett, C., et al. (2012). Evaluation of the Program for Infant/Toddler Care: An on-site training of caregivers (NCEE 2012-4003). Washington, DC: National Center for Education Evaluation and Regional Assistance, Institute of Education Sciences, u.S. Department of Education.

216 American Institutes for Research
Condition of Children Birth to Age Five and Status of Early Childhood Services in California
WestEd. (2008). R&D Alert: Issue Focus: English Learners. San Francisco, CA: Author. Retrieved from http://www.wested.org/online_pubs/RD-08-02.pdf
Whitebook, M. (2003). Early education quality: Higher teacher qualifications for better learning environments – A review of the literature. Berkeley, CA: Center for the Study of Child Care Employment, university of California, Berkeley.
Whitebook, M., Austin, L. J. E., Ryan, S., Kipnis, F., Almaraz, M., & Sakai, L. (2012). By default or by design? Variations in higher education programs for early care and teachers and their implications for research methodology, policy, and practice. Berkeley, CA: Center for the Study of Child Care Employment, university of California, Berkeley.
Whitebook, M., Bellm, D., Lee, Y., & Sakai, L. (2005) Time to revamp and expand: Early childhood teacher preparation programs in California’s institutions of higher education. Berkeley, CA: Center for the Study of Child Care Employment.
Whitebook, M., gomby, D., Bellm, D., Saki, L., & Kipnis, F. (2009). Preparing teachers of young children: The current state of knowledge, and a blueprint for the future. Part 2: Effective teacher preparation in early care and education: Toward a comprehensive research agenda. Policy report. Berkeley, CA: Center for the Study of Child Care Employment, university of California, Berkeley.
Whitebook, M., Sakai, L., Kipnis, F., Lee, Y., Bellm, D., Almaraz, M., & tran, P. (2006). California early care and education workforce study: Licensed child care centers, statewide 2006. Berkeley, CA: Center for the Study of Child Care Employment, university of California, Berkeley. and California Child Care Resource and Referral Network.
Whitebook, M., Sakai, L., Kipnis, F., Lee, Y., Bellm, D., Almaraz, M., & tran, P. (2006). California early care and education workforce study: Licensed family child care providers, statewide 2006. Berkeley, CA: Center for the Study of Child Care Employment, university of California, Berkeley and California Child Care Resource and Referral Network. Retrieved from http://www.irle. berkeley.edu/cscce/wp-content/uploads/2006/01/statewide_providers.pdf
Wolfe, B., & Scrivner, S. (2004). Child care use and parental desire to switch care type among a low-income population. Journal of Family and Economic Issues 25(2): 139–162.
Wolfe, D. A. (1999). Child abuse: Implications for child development and psychopathology (2nd ed.). thousand Oaks, CA: Sage.
Wright, J. (2011). Spring 2011 Transitional kindergarten: school district survey: Summary of results. Sacramento, CA: Sacramento County Office of Education.
Yazejian, N., & Bryant, D. M. (2009). Promising early returns: Educare implementation study data, March 2009. Chapel Hill, NC: FPg Child Development Institute, university of North Carolina.
Zellman, g. L., & Perlman, M. (2008). Child-care quality rating and improvement systems in five pioneer states: Implementation issues and lessons learned. Santa Monica, CA: RAND Corporation.
Zigler, E., gilliam, W. S., & Jones, S. M. (2006). A vision for universal preschool education. Cambridge, MA: Cambridge university Press.

2800 Campus Drive Suite 200 San Mateo, CA 94403
Corporate Headquarters 1000 Thomas Jefferson Street NW Washington, DC 20007-3835 202.403.5000 | TTY: 877.334.3499
www.air.org
2069B_8/12